Welcome message from author
This document is posted to help you gain knowledge. Please leave a comment to let me know what you think about it! Share it to your friends and learn new things together.
Transcript

Can. J. Fish. Aquat. Sci. Downloaded from www.nrcresearchpress.com by Fisheries and Oceans on 01/15/14For personal use only.

plateau and we& subtidal currents (except in the Labrador Cur- rent around its perimeter) (e. g . Petrie and Anderson 1983; Loder et al. 1988). Therefore, retention of early life stages might be expected to be a common feature on the Bank.
In this paper we report the distributions sf the early life stages of three flatfish species on the southern Grand Bank, as observed in ichthyoplankton surveys conducted in September of 1986, 1987, and 1988. The species examined are American plaice, yellowtail flounder (Limanh ferruginea) , and witch flounder (Giyptocephalus cynogkossus). There is limited infor- mation on the distribution of larvae and juveniles of these spe- cies in the area. However, extensive sampling sf older juveniles (ages 1 and older), conducted since 1985, indicates that the southern Bank may be a juvenile nursery area for yellowtail
and plaice (Walsh l 99 1). We describe the distributions of lar- vae and 0-group juveniles in relation to the temperature field and use current measurements derived from moored instru- ments to estimate their movement and probable spawning sites, assuming that the dominant influence is water drift. We use the results of these analyses to assess the hypothesis that passive drift from spawning areas can account for the observed larval distributions.
Materials and Methods
Study Area The study area (Fig. I ) was the Southeast Shoal
(approximate centre 44"301N, 50°W) sf the Grand Bank, its
FIG. I . Location map for the southern Grand Bank with the 1986-88 current meter mooring sites (see Table 1 for times and depths). A , 1986; a, 1987; 0, 1988.
Cmz. J . Fish. Aqwt. Sci., V01. 49, 1992
Can
. J. F
ish.
Aqu
at. S
ci. D
ownl
oade
d fr
om w
ww
.nrc
rese
arch
pres
s.co
m b
y Fi
sher
ies
and
Oce
ans
on 0
1/15
/14
For
pers
onal
use
onl
y.
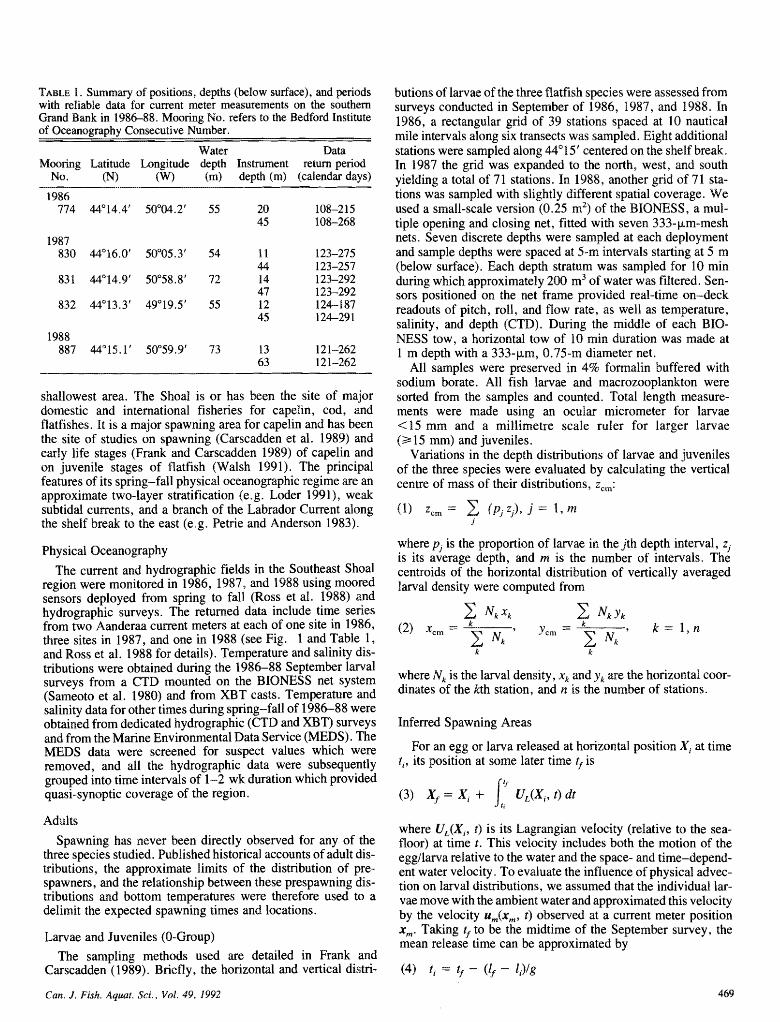
TABLE 1 . Summary of positions, depths (below surface), and periods with reliable data for cumwt meter measurements on the southern Grand Bank in 198688. Mooring No. refers to the Bedford Institute of Oceanography Consecutive Number.
Water Data NImring Latitude Longitude depth Instrument return period
No. Po (W) (m) depth (m) (calendar days)
shallowest area. The Shoal is or has been the site of major domestic and international fisheries for capelin, cod, and flatfishes. It is a major spawning area for capelin and has been the site of studies on spawning (Carscadden et al. 1989) and early life stages (Frank and Carscadden 1989) of capelin and on juvenile stages of flatfish (Walsh 1991). The principal features of its spring-fall physical oceanographic regime are an approximate two-layer stratification (e.g. Loder 199 I), weak subtidal currents, and a branch of the Labrador Current along the shelf break to the east (e.g. Petrie and Anderson 1983).
Physical Oceanography
The current and hydrographic fields in the Southeast Shoal region were monitored in 1986, 1987, and 1988 using moored sensors deployed from spring to fall (Ross et al. 1988) and hydrographic surveys. The returned data include time series from two Aanderaa current meters at each of one site in 1986, three sites in 1987, and one in 1988 (see Fig. 1 and Table 1, and Ross et al. 1988 for details). Temperature and salinity dis- tributions were obtained during the 1986-88 September larval surveys from a CTD mounted on the BIONESS net system (Sarneoto et al. 1980) and from XBT casts. Temperature and salinity data for other times during spring-fall of 1986-88 were obtained from dedicated hydrographic (CTD and XBT) surveys and from the Marine Environmental Data Service (MEDS). The MEDS data were screened for suspect values which were removed, and d l the hydrographic data were subsequently grouped into time intervals of 1-2 wk duration which provided quasi-synoptic coverage of the region.
Adults
Spawning has never been directly observed for any of the three species studied. Published historical accounts of adult dis- tributions, the approximate limits of the distribution of pre- spawners, and the relationship between these prespawning dis- tributions and bottom temperatures were therefore used to a delimit the expected spawning times and locations.
Larvae and Juveniles (0-Group) The sampling methods used are detailed in Frank and
Carscadden (1989). Briefly, the horizontal and vertical distri-
butions of larvae of the three flatfish species were assessed from surveys conducted in September of 1986, 1987, and 1988. In 1986, a rectangular grid of 39 stations spaced at 10 nautical mile intervals along six transects was sampled. Eight additional stations were sampled along 44" 15 ' centered on the shelf break. In I987 the grid was expanded to the north, west, md south yielding a total of 7 1 stations. In 1988, another grid of '7 1 sta- tions was sampled with slightly different spatial coverage. We used a srnall-scale version (0.25 m" of the BHONESS, a mul- tiple opening and closing net, fitted with seven 333-pm-mesh nets. Seven discrete depths were sampled at each deployment and sample depths were spaced at 5-m intervals starting at 5 m (below surface). Each depth stratum was sampled for 10 min during which approximately 200 m3 of water was filtered. Sen- sors positioned on the net frame provided real-time on-deck readouts of pitch, roll, and flow rate, as well as temperature, salinity, and depth (CTD). During the middle of each BIO- NESS tow, a horizontal tow of 10 min duration was made at 1 m depth with a 333-pm, 0.75-111 diameter net.
All samples were preserved in 4% fomalin buffered with sodium borate. All fish larvae and macrozooplankton were sorted from the samples and counted. Total length measure- ments were made using an ocular micrometer for larvae < I5 mm and a millimetre scale ruler for larger larvae (3 15 mm) and juveniles.
Variations in the depth distributions of larvae and juveniles of the three species were evaluated by calculating the vertical centre of mass of their distributions, z,,:
(1) z,, = 2 (pjzj), j = l , m
where p, is the proportion of larvae in the jth depth interval, z, is its average depth, and rn is the number of intervals. The centroids of the horizontal distribution of vertically averaged Bawal density were computed from
where Wr, is the larval density, xk and y, are the horizontal coor- dinates of the kth station, and n is the number of stations.
Inferred Spawning Areas
For an egg or larva released at horizontal position Xi at time ti, its position at some later time $-is
where UL(Xi, t ) is its Lagrangian velocity (relative to the sea- floor) at time t . This velocity includes both the motion of the egg/larva relative to the water and the space- and time-depend- ent water velocity. To evaluate the influence of physical advec- tion on larval distributions, we assumed that the individual Bar- vae move with the ambient water and approximated this velocity by the velocity u,(xm, 9 ) observed at a current meter position x,. Taking t, to be the midtime of the September survey, the mean release time can be approximated by
Can. .I. Fish. A ~ U Q Q . Sci., Vol. 49, 1992 469
Can
. J. F
ish.
Aqu
at. S
ci. D
ownl
oade
d fr
om w
ww
.nrc
rese
arch
pres
s.co
m b
y Fi
sher
ies
and
Oce
ans
on 0
1/15
/14
For
pers
onal
use
onl
y.

where l, is the larval length from the September survey, I , the length at release, and g its average growth rate. 'Thus , the release position can be estimated from
( 5 ) Xi = - urn&,,, 8) dt
with Xf, $, and if specified from the September survey data, u,(t) from the mmred current measurements, and li and g from literature values. The use of current observations from a single position assumes that there is limited horizontal structure in the subtidal currents which dominate long tern drift on the South- east Shoal. Cross-spectral analysis of the I987 moored obser- vations indicates that the spatial scale of the subtidal currents over the Shoal is of the order 50-100 km, although around the Shoal's perimeter, there is substantial structure associated with the Labrador Current and the steep bathymetry. Hence, the accuracy of Xi estimated from (5) will generally decrease for earlier release times (older larvae) if positions are considerable distances from the mooring site.
In the analysis presented here, the length at release was t&en as the hatching length md the growth rate chosen to be appro- priate to post-hatching . Strict1 y speaking, the inferred release times and positions are therefore appropriate to hatching. How- ever, because the egg phase is short relative to the l m a l drift time, they also approximate the spawning times and positions.
Results Physical Oceanography
The temperature distributions observed along 44" 15 W Nuring the September survey in each year (Fig. 2) indicate a
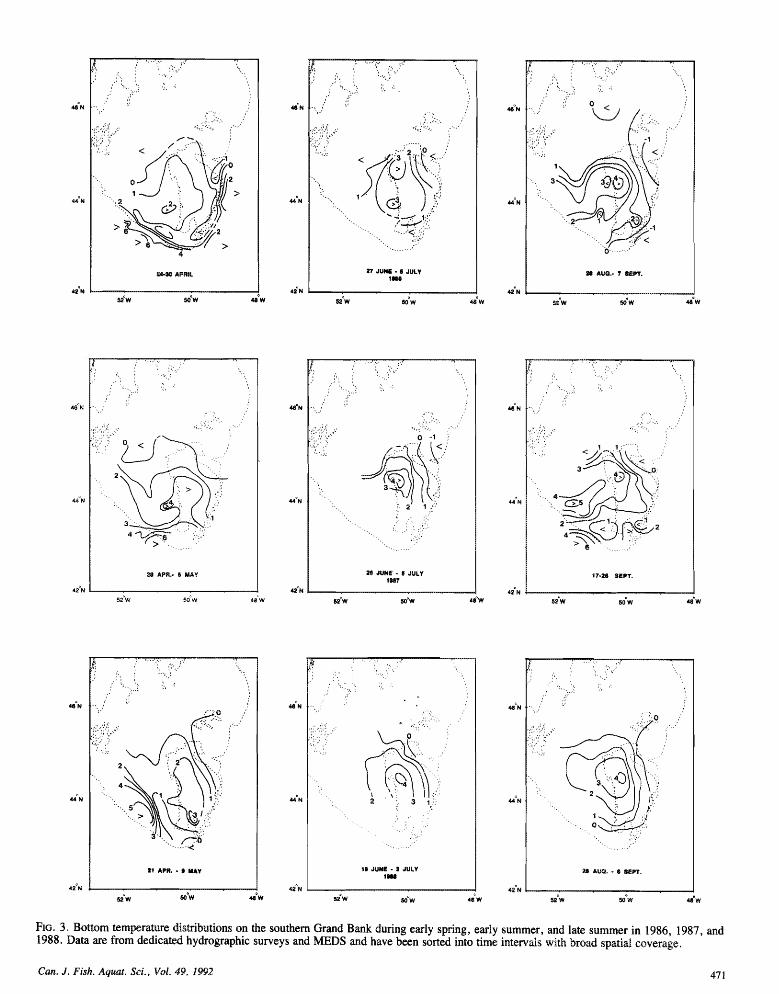
pronounced vertical stratification with a sharp themocline near 20 m, consistent with historical observations (Loder 199 1). Some intermnual variability is apparent, including cooler temperatures and a less pronounced thermocline in 1986, and wanner near-surface waters and a slightly deeper themocline in 1988. The vertical sections also show elevated near-bottom temperatures in the vicinity of the Shoal in each year9 again consistent with historical observations (Lde r 199 18, md subzero temperatures along the Bank's eastern edge consistent with the presence of the cold intermediate layer associated with the Labrador Current (Petrie et al. 1988). Areal distributions of bottom temperature (Fig. 3) during early spring, early summer, and late summer (from the MEDS and hydrographic survey data) confirm the persistence of these features during spring a d summer of each yea , although with some variability in spatial structure and temperature from year to year (also see Carscadden et al. 1989).
The current measurements derived from the moored instruments revealed that, although the subtidal currents are important to long-term drift on the southern Grand Bank (Loder et al. 1988), they are generally we&. The mean currents have magnitudes of up to 0.84 d s , while the standad deviations of the low-frequency current components are typically 0.02- 0.05 d s (ROSS et d. 1988). The expected particle drifts resulting from the measured cumaats are illustrated in Fig. 4 which presents progressive vector plots for the central and eastern sites (Fig. 1) in 1987. Typical of the central and western sites in the other years, the central-site drift is generally westward md significantly stronger at the upper meter. In
FIG. 2. West-east vertical sections of temperature along 44"15'N from the CTB mounted on the BIO- NESS during the September larval surveys of (a) 1986, (b) 1987, and (c) 1988.
Can. J. Fish. Aquut. Sci.. Vob. 48, 6992
Can
. J. F
ish.
Aqu
at. S
ci. D
ownl
oade
d fr
om w
ww
.nrc
rese
arch
pres
s.co
m b
y Fi
sher
ies
and
Oce
ans
on 0
1/15
/14
For
pers
onal
use
onl
y.
I , , _ _ _ ';.. ..:- I , I . '
I / , , ,\ I ._ I . . 8 . 8 , t ,
. :: ,: a . \ \ I I ..'. , ,.
sdw sd'w 4
FIG. 3. Bottom temperature distributions on the southern Grand Bank during early spring, early summer, and late summer in 1986, 1987, 1988. Data are from dedicated hydrographic surveys and MEDS and have been sorted into time intervals with broad spatial coverage.
and
em. J . Fish. Aqua. Sci., Vol. 49, 1992 47 1
Can
. J. F
ish.
Aqu
at. S
ci. D
ownl
oade
d fr
om w
ww
.nrc
rese
arch
pres
s.co
m b
y Fi
sher
ies
and
Oce
ans
on 0
1/15
/14
For
pers
onal
use
onl
y.

MOOWIWC 830 AT 11M. SOUTHEAST SHOAL 1989
81
MOOR% WC 830 AT 44M. SOUTHEAST SHOAL 1987
+ C
-met 4' 2m.D
- a 0
MOORING 832 AT 12M. -3QbBB
SOUTHEAST SHOAL 1989
b)
FIG. 4. Progressive vector plots from current meters at the (a, c ) central (mooring 830) and (b, d ) eastern (mooring 832) sites in 1987. Crosses denote 5-Q intewzls, labelled every 20 or 40 d.
contrast, the eastem-site drift is generally southward. These drifts are consistent with barotropic numerical model predictions (Creenberg and Petrie 1988; Hukuda et al. 1989) of a strong southward Labrador Current along the Bank's eastern edge and a weak west to northwestward drift across the Bank. The mean currents (Fig. 5) confirm the interannual persistence and large space scales of the characteristic drifts, but also indicate quantitative variations.
The moored measurements at the central site also revealed a large decrease in temperature over much of the water column in August 1986. This was associated with both vertical mixing and the displacement of Labrador Current water onto the Shoal during the passage of a tropical s tom (Eoder and Ross 1988; Frank and Carscadden 1989) and contributed to the relatively cool 1986 September temperatures (Fig. 2).
lowest and warmest portions of the Bank. In fact, in this area, yellowtail is at the northern limit of its commercial range. As a result, temperature appears to be an important regulator of its distribution. In the early 1960's yellowtail abundance on the Bank increased coincident with a decrease in haddock abun- dance and an upward trend in bottom temperature (Pitt 1970). During the 1950's and 19609s9 the greatest concentrations of yellowtail occurred at depths of 57-64 m, coincident with bot- tom temperatures of 3.1-4.8"C (Pitt 1970). Research trawl sur- veys conducted during the 1970's and 1980's revealed the larg- est concentration of yellowtail to be at depths less than 100 m where water temperatures exceeded 1°C (Wells et al. 1988). Fitzpatrick and Miller (1979) used research trawl data to delimit the distribution (Fig. 6) of ripe fish between 1952 and 1968. During this interval, peak spawning occurred during the latter half of June in areas where bottom temperatures exceeded 2°C
Adults (Pitt 1970). Since the warmest summckime bottom tempera- tures on the Grand Bank occur over the Southeast Shoal (Loder
Commercial abundances of American plaice, yellowtail 199 1 ; Fig. 31, the Shoal is probably the most important spawn- flounder, and witch flounder are common on the Grand Bank. ing area for yellswtail on the Bank. As a result, their seasonal distributions and those of prespawn- In contrast with yellowtail, plaice occurs in deeper waters ers are documented. Of the three, yellowtail inhabits the shal- and is considered a cold-water species. It is reported to wcur
472 Can. J . Fish. Aquar. Sd., Val. 49, 1992
Can
. J. F
ish.
Aqu
at. S
ci. D
ownl
oade
d fr
om w
ww
.nrc
rese
arch
pres
s.co
m b
y Fi
sher
ies
and
Oce
ans
on 0
1/15
/14
For
pers
onal
use
onl
y.

FIG. 5. Record-mean currents from moored measurements on the southern Grmd Bank in 1986-88. Solid vectors are for upper instm- ments; broken vectors are for lower meters.
at depths ranging from 98 to 250 m and at temperatures from just below 0 to 1 .5"C (Scott and Scott 1988; Wells et al. 1988). Plaice appears to spawn in most areas where the influence of the cold Labrador Current is apparent (Fig. 6). There is, how- ever, some dispute concerning the relative importance of dif-
ferent areas. Pitt (1966) reported that the northern and eastern slopes of the Bank supported the greatest spawning activity. Nevinsky and Serebryakov (1973) also noted the importance of the northern Grand Bank but reported that spawning on the eastern, southwestern, and southern slopes was less intense. They concluded that spawning occurs from April to mid-May at bottom temperatures ranging from - 1.3 to 3.5"C, with spawning k i n g most intense at 8-2°C. Pitt (1966) reported that average spawning temperatures ranged from - 1.3 to 2.8"C on the northern, southeastern, and southwestern areas of the Bank.
Witch is generally considered to be a deepwater species, residing in gullies where the bottom is clay and mud rather than on sand and gravel bottom typical of the banks and the inshore (McKenzie 1955). In the Grand Bank area, research trawl sur- veys conducted during 1958-74 have revealed that the greatest numbers of witch occurred at depths of 185-366 m and at bot- tom temperatures of 2-6" (Bowering 1976). On the basis of the relative frequencies of ripening and recently spent fish from research surveys, Bowering (1 9Wa) concluded that spawning occurs during April-June (Fig. 6) on the southern Grand Bank at depths ranging between 108 and 2W m and temperatures between 2 and 3°C.
None of the three flatfish species discussed is reported to undergo extensive migrations, although yellowtail and plaice migrate seasonally, moving into shallow water in the spring and into deeper water during the winter (Scott and Scott 1988; Walsh 1991).
Larval Distributions and Size Composition
Yellowtail flounder The depth of the centre of mass of yellowtail larvae and juve-
niles occurred at 24.2, 28.0, and 26.7 m during the day and 18.6, 23.9, and 25.1 m during the night in 1986, 1987, and 1988, respectively (Fig. 7). This die1 pattern of depth distri- bution is similar to that described by Smith et al. (1978), but the day-night change in depth in the mid-Atlantic Bight was greater, exceeding 25 m. En view of the limited day-night change observed on the southern Grand Bank, we combined the centre of mass depths for day and night when estimating the direction and magnitude of larval drift (Table 2).
FIG. 6 . Composite picture of spawning distributions of yellowtail and plaice (after Fitzpatrick and Miller 1979) and witch (after Bowering 1990a) in the Grand Banks region for April-July.
Can. J . Fish. Aquat. Sci., Val. 49, 1992 473
Can
. J. F
ish.
Aqu
at. S
ci. D
ownl
oade
d fr
om w
ww
.nrc
rese
arch
pres
s.co
m b
y Fi
sher
ies
and
Oce
ans
on 0
1/15
/14
For
pers
onal
use
onl
y.

FIG. 7 . Percentage of Imae in various depth intervals for yellowtail in (a) 1986, (Is) 1987, and (6) 1988, plaice in (d) 1986 and (e) 1987, and (0 witch in 1988. Distributions are shown for both day (open bars) and night (shaded bas) stations.
Furthermore, peak ec~ncentrations sf yellowtail were thermal regime principally experienced by the larvae and observed at depths near or below the thermocline (Fig. 8). In juveniles. 1986 a d 1987, a majority of the yellowtail (>60%) were In 1986 the highest concentrations of yellowtail occurred over below the themscline, Given the two-layer stratification, bot- the western half of the survey area where bottom temperature tom temperature was taken as an index of the (lower-layer) generally exceeded 2°C (Fig. 9a, 9g, Boa). No yellowtail were
474 Can. /. Fish. Aquar. Sci., Vol. 49, 1992
Can
. J. F
ish.
Aqu
at. S
ci. D
ownl
oade
d fr
om w
ww
.nrc
rese
arch
pres
s.co
m b
y Fi
sher
ies
and
Oce
ans
on 0
1/15
/14
For
pers
onal
use
onl
y.

TABLE 2. S u m a n ~ of midtimes (t,) of surveys, observed mean vertical positions (r,) andlarval lengths ($I, assum& hatching lengths (13 and growth rates (g), a d calculated ages (post-hatching) and spawning dates (ti) for the larval cohorts observed in September of each yew.
ff zcm kp 'i 8 Age ti Cohort (d) (m) (man) (man) (mdd) (dl (d)
Yellowtail 1986
1987
1988
Plaice 1986
1987
Witch 1988
found on the eastern portion of the Bank where temperature was generally less than 2°C. The highest yellowtail concentra- tions occurred west of the peak temperatures, but the westward limits of the distribution were not resolved.
The 1987 yellowtail distribution (Fig. 9b) exhibited some similarity with that of 1986, although the average density was substantially lower. Maximum densities occurred on the north- western portion of the Shoal. Very few individuals were col- lected in the eastern, southern, or southeastern sections of the grid. As in 1986, the highest catches were generally obtained at stations where bottom temperature (Fig. 9h, lob) exceeded 2°C. However, the yellowtail and temperature maxima were again offset, with peak yellowtail densities to the north of the temperature peak. The northwestwad limit of the yellowtail distribution was not resolved.
The average density of yellowtail in 1988 (Fig. 9c) was sim- ilar to that observed in 1986. Peak abundances were again coin- cident with bottom temperatures above 2°C (Fig. 9i, 10c), with densities declining from west to east. Unlike 1986 and 1987, the extent of the yellowtail patch was better defined and the patch coincided with the temperature maximum. There was also bimodality in the yellowtail-temperature relation, with highest densities occurring at temperatures between 0 and 1°C and above 2°C (Fig. 10c). The observations from all three yeas support a relation between the horizontal distributions of yel- lowtail and lower-layer temperature, although it is unclear whether or not there is a direct influence.
The lengths (If) of yellowtail collected in September 1986 raged from 10 to 33 rnm with a mean of 23 mm (Fig. 1 la; Table 2). Literature values for l m a l growth rate (g) range from an average of 0.11 m d d for larvae collected over the Grand Bank duling June-August 5980 (Bonnyman 1983) to 0.25 m d d for larvae reared in the labratory at 18°C (Smigielski 1979). Hatching length ( I , ) is approximately 3.5 nrun (Fahay 1983). Assuming that the growth rates were similar in all aeas, as
individuals as small as 5 mm were captured. In September 1988, yellowtail sizes ranged from 4 to 33 mm (Fig. 1 l c), with a mean of 19 mm (Table 2). For the above growth rates and hatching length, the mean ages of larvae sampled in 1987 and 1988 were in the ranges sf 90-205 and 61-138 d, respec- tively (Table 2). While the uncertainty in the growth rate results in a wide mean age range, the historical data on spawning times (e.g . Fitzpatrick and Miller 1979) suggest that the lower ages are more probable. The wide range of sizes (and ages) csin- cident in time and space in each of the three yeas also suggests that there is some retention of the ealy life stages (larvae and pelagic juveniles) of yellowtail on the Southeast Shoal.
American plaice There was little evidence sf vertical migration by plaice lar-
vae and juveniles in the 1986-88 observations. The average centres of mass for day and night generally occurred at depths exceeding 20 m (Fig. 78, 7e). Since there are no other pub- lished data on the depth distribution of the early stages of plaice, we used the mean depth for the day and night observations combined to estimate drift (Table 2). Peak plaice concentra- tions were located near the thermocline, with greater than 70% of the larvae and iuveniles below the thermocline in 1986 and 1987 (Fig. 8d, ge). As with yellowtail, bottom temperature was used as an index of the lower-layer thermal regime in our evaluation of the horizontal distributions of plaice.
The horizontal distribution of plaice in September 1986 was inversely related to that of yellowtail (Fig. 9a, 9d ). Plaice densities increased from west to east across the Shoal and peaked along its eastern flank where bottom temperatures were befow 1°C (Fig. 9g, 1M). Only a few plaice were found in the western and central parts of the grid where temperatures exceeded 2°C (Fig. 9d, 9g).
The 1987 and 1988 plaice densities were approximately two orders of magnitude lower than those from 1986. However, the distributions were similar in all three years. In each of 1987 (Fig, 9e) and 1988 (not shown), plaice were captured at only 8 sf 7 1 stations. These were located primarily along the eastern half sf the grid where bottom temperatures were near or below 0°C. There were also some occurrences of plaice at stations with higher temperatures (Fig. Be, 9h. IQe).
The ranges in length of plaice collected during the September surveys were 16-38 mm (Fig. I ld ), 25-35 mm (Fig. 1 le), and 10-38 mm (not shown) for 1986, 1987, and 1988, respec- tively. The mean lengths in 1986 and 1987 were 28 and 30 mm (Table 2). Growth rates of plaice larvae on the Grand Banks average 0.16 m d d during May-September (Bonnyman 1983), while rates average 0.25 m d d over the first 80 d in the Wad- den Sea (Zijlstra et al. 1982). For these growth rates and a hatching length of 4.0 mm (Fahay 1983), the mean age of the 1986 and 1987 plaice cohorts was estimated to be in the ranges of 95-149 and 104-163 8, respectively (Table 2). Given the limited occurrence of plaice over the Southeast Shoal, we sug- gest that their distribution is primarily influenced by Labrador Current advection along the Bank edge to the northeast of the study region. The occurrence of plaice on the eastern Shoal may result from leakage of the Current onto the Bank followed by a weak westward drift.
well as &fore and dter metam~fphosis, we estimate from (4) Witch flounder that the mean age (p~st-hatch) of yellowtail captured in 1986 The depth of the centre of mass of witch larvae and juveniles was in the range of 78-178 d (Table 2). In September 1987, in 1988 was 21 m at night, 26 m during the day, and 23 m for the mearm length of yellowtail was 26 mm (Table 2), with most both combined (Fig. 7f; Table 2). Peak concentrations were individuals lying between 22 and 34 mm (Fig. 1 1 b), although in the thermocline (Fig. 88). However, the larvae were broadly
Can. J . Fish. Aqucat. Sci., VoE. 49, I992 475
Can
. J. F
ish.
Aqu
at. S
ci. D
ownl
oade
d fr
om w
ww
.nrc
rese
arch
pres
s.co
m b
y Fi
sher
ies
and
Oce
ans
on 0
1/15
/14
For
pers
onal
use
onl
y.

Can
. J. F
ish.
Aqu
at. S
ci. D
ownl
oade
d fr
om w
ww
.nrc
rese
arch
pres
s.co
m b
y Fi
sher
ies
and
Oce
ans
on 0
1/15
/14
For
pers
onal
use
onl
y.

FIG. 9. Distributions of depth-averaged larval density and bottom temperature (g, h, i) from surveys during (a, d, g) 13-1 8 !kptember 1986 (days 256-261), (b, e, h) 17-26 September 1987 (days 268-269), and (c, f, i) 17-23 September 1988 (days 261-267). Larval distributions are shown for yellowtail in (a) 1986, (b) 1987, and (c) 1988, pldce in (d ) 1986 and (e) 1987, and (f) witch in 1988. Keys to the expanding symbols: (a, b, c) 1: none, 2: 0.85-0.13, 3: 0.13-0.31, 4: 0.31-0.78, 5: 878-2.0, and6: >2.0; (d, e, f) 1: none, 2: 0.05-0.1, 3: 0.1-0.2, 4: 8.2-0.4, 5: 0.4-0.8, and 6: >0.8,where all densities are numbers per 108 m3. Centroid positions and second mmenks of the l m a l distributions are also shown. The capital letters (A, B, C, D) indicate the infened spawning locations presented in Table 3.
Can. 9. Fish. Aguaf. Sci., Vol. 49, 199% 477
Can
. J. F
ish.
Aqu
at. S
ci. D
ownl
oade
d fr
om w
ww
.nrc
rese
arch
pres
s.co
m b
y Fi
sher
ies
and
Oce
ans
on 0
1/15
/14
For
pers
onal
use
onl
y.

0.4
0.2
0
-2 0 2 4
Temperature, 'C
0 2 4
Temperature, 'C
FIB. 10. Scatterplots of larval abundance versus bottom temperature for yellowtail (e) 1983, md (0 witch in 1988.
in (a) 1986, (b) 1983, and (c) 1988, plaice in (d) 1986 and
distributed over the water column, with roughly equal propor- Witch occurred as single individuals at only 2 of 47 stations tions occurring above and below the thermocline. As with the in September 1986 m d 3 sf 7 1 stations in 1987. They were other species, we used bottom temperature as an index of the abundant during the 1988 survey (Fig. 9 0 when their average lower-layer thermal regime in examining the horizontd distri- density equalled that of yellowtail. In 1988, witch larvae and bution of witch. pelagic juveniles were most abundant over the central, western,
478 Can. J . FFh. Aqust. Sei., Vok. 49, 1992
Can
. J. F
ish.
Aqu
at. S
ci. D
ownl
oade
d fr
om w
ww
.nrc
rese
arch
pres
s.co
m b
y Fi
sher
ies
and
Oce
ans
on 0
1/15
/14
For
pers
onal
use
onl
y.

3 6 9 12 IS 18 21 24 27 30 34 36 >39
Length, mm
ma. % 1 . Length frequency distributisns sf yellowtail in (a) 1986, (b) 1987, and (c) 1988, plaice in (dl ) 1986 and (e) 1987, and (f) witch in 1988.
Can. 9. Fish. Aquat, Sci., VoI. 49, 1992
Can
. J. F
ish.
Aqu
at. S
ci. D
ownl
oade
d fr
om w
ww
.nrc
rese
arch
pres
s.co
m b
y Fi
sher
ies
and
Oce
ans
on 0
1/15
/14
For
pers
onal
use
onl
y.

a d northwestern portions of the survey area, particularly where bottom temperatures exceeded 2°C (Pig. 9f, 9i, 100. They were absent from the eastern edge of the survey where tem- peratures were near 8°C. The witch distributions were thus sim- ilar to those of yellowtail, with maximum densities occurring
bottom waters (Pig. 9). The length of witch collected in 1988 ranged from 5 to
50 mm, with a mean of 19 mm (Fig. 1 10. The only published estimate of growth rate for witch (0.09 m d d ) is based on monthly collections from the southern Grand Bank (Bonnyman 9983). We assumed an upper limit growth rate of 0.25 m d d consistent with that of the other two species. Given a hatching length of 4.5 mm and the above growth rates, we estimated a mean age for witch in our samples ranging from 55 to 153 d (Table 2).
Inferred Spawning Positions
To examine whether the larval distributions and the esti- mated ages at capture are consistent with passive advection from sites with historical distributions of prespawning fishes, we used (5) to estimate the spawning (hatching) sites by species a d year for a range of input values. Examination of (4) and (5) indicates that there will be uncertainty in the inferred sites associated with uncertainties in $> Ii, g, %f, and the horizontal and vertical stnac- ture of a, (taking passive advection as a given). However, con-
sideration of the available infomation suggests that the largest contributors to this uncertainty are the growth rates, the depth of the larvae during the drift period, and horizontal structure in the currents new the Bank edge. To provide approximate bounds on the likely sites, we show in Table 3 the expected larval displacements (Xr - Xi) for four cases (A, B, @, D) for each species and year. These are estimates based on the two different mean ages (or spawning dates) shown in Table 2 and estimates for currents typical of the upper (A, C) and lower (B, D) water columns (current meters). For yellowtail and witch, current measurements from the respective years are used, while the 1987 measurements from the eastern mooring site are used for plaice in both 1986 and 198'7. The estimated spawning posi- tions for the different cases are indicated in Pig. 9.
For most sf the cases considered, the inferred spawning posi- tions are off the Bank in areas which are represented poorly by the moored measurements. The specific positions in those cases have limited meaning, but the prediction of remote spawning sites under the assumed conditions should nevertheless be valid. In particular, the moored measurements of upper-layer currents strongly suggest that, if l m a e occupy these surface waters through the summer and are transps~ed passively, spawning must occur well away from the Southeast Shoal (cases A, C). In contrast, passive advection by lower-layer currents does allow for spawning sites in the vicinity of the Shoal, particularly if growth rates approximate 0.25 m d d (case D).
TABLE 3. Estimated displacements of spawning positions (xi, y,) from September observation positions (xP yf) for various species and years. Results are shown for four cases for each species/year: two different spawning dates (growth rates) taken from Table 2 and drifts as measured at the upper (cases A, C) and lower (cases B, D) current meters. A positive x-displacement denotes a spawning site to the east of the September larval position, and a positive y-displacement denotes a spawning psition to the north of the September position. Where current measurements are available for the entire drift period, they are used; otherwise the record-mean currents are used. See Fig. 9 for estimated spawning positions.
Spawning Drift xi - .xf yi - yJ. Current source: Cohort Case date (d) depth (m) (km) (km) period and mooring No.
Yellowtail 1986
1987
1988
Plaice 1984
1987
Witch 1988
Record mean @A 774
Bays 18G-258 @ 774 Record mean @ 830
Days 174-244 @ 830 Record mean @ 830 Days 126-262 @ 887
Days 203-262 @; 887
Record mean @ 832
Days 160-264 @ 832
Record mean (@ 887
Bays 209-262 @ 887
Can. J . Fish. Aquas. Sci., Vol. 49, 6982
Can
. J. F
ish.
Aqu
at. S
ci. D
ownl
oade
d fr
om w
ww
.nrc
rese
arch
pres
s.co
m b
y Fi
sher
ies
and
Oce
ans
on 0
1/15
/14
For
pers
onal
use
onl
y.
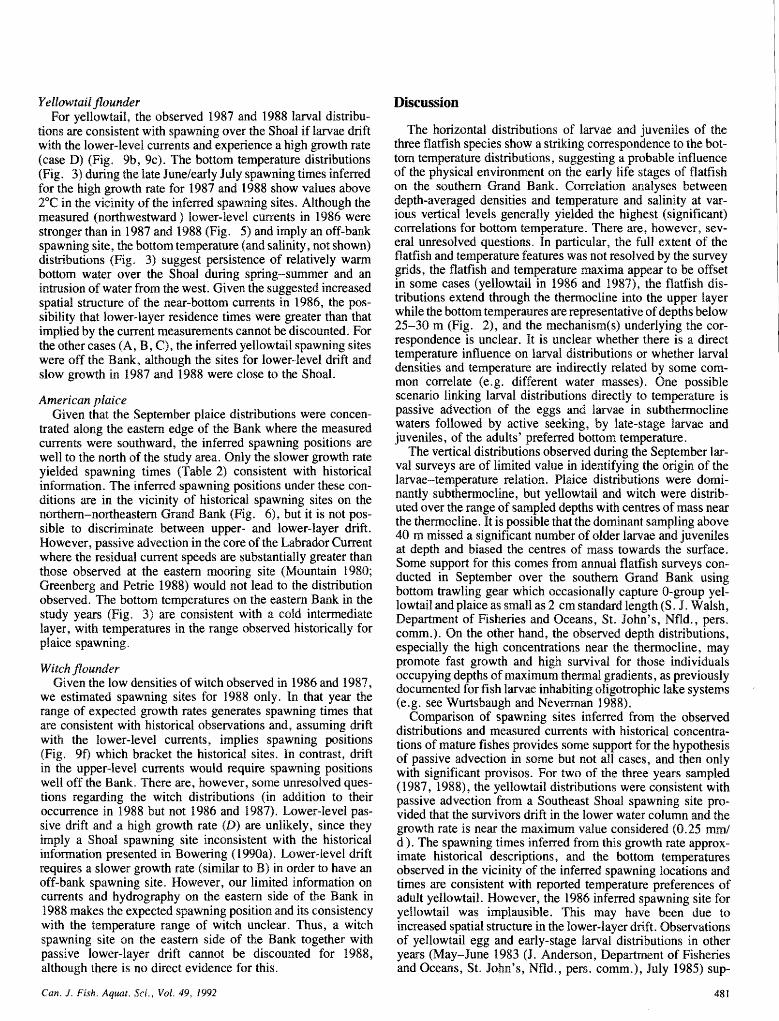
k'eblowtail flounder For yellowtail, the observed 1987 and 1988 larval distribu-
tions are consistent with spawning over the Shoal if larvae drift with the lower-level currents and experience a high growth rate (case B) (Fig. 9b, 9c). The bottom temperature distributions (Fig. 4) during the late Junelealy July spawning times inferred for the high growth rate for 1987 and 1988 show values above 2°C in the vicinity of the inferred spawning sites. Although the measured (northwestward ) lower-level currents in 1986 were stronger than in 1987 and 1988 (Fig. 5) and imply an off-bank spawning site, the bottom temperature (and salinity, not shown) distributions (Fig. 3) suggest persistence of relatively warm bottom water over the Shoal during spring-summer and an intrusion of water from the west. Given the suggested increased spatial structure sf the near-bottom currents in 1986, the pos- sibility that lower-layer residence times were greater than that implied by the current measurements cannot be discounted. For the other cases (A, B, C), the inferred yellowtail spawning sites were off the Bank, although the sites for lower-level drift and slow growth in 1987 and 1988 were close to the Shoal.
American plaice Given that the September plaice distributions were ccsncen-
trated along the eastern edge of the Bank where the measured currents were southward, the inferred spawning positions are well to the north of the study area. Only the slower growth rate yielded spawning times (Table 2) consistent with historical information. The inferred spawning positions under these con- ditions are in the vicinity of historical spawning sites on the northern-northeastern Grmd Bank (Fig. 6). but it is not pos- sible to discriminate between upper- and lower-layer drift. However, passive advection in the core of the Labrador Current where the residual current speeds are substantially greater than those observed at the eastern mooring site (Mountain 1980; Greenberg and Petrie 1988) would not lead to the distribution observed. The bottom temperatures on the eastern Bank in the study years (Fig. 3) are consistent with a cold intermediate layer, with temperatures in the range observed historically for plaice spawning.
Witch flounder Given the low densities of witch observed in 1986 and 1987,
we estimated spawning sites for I988 only. In that year the range of expected growth rates generates spawning times that are consistent with historical sbservations and, assuming drift with the lower-level currents, implies spawning positions (Fig. 9 0 which bracket the historical sites. In contrast, drift in the upper-level currents would require spawning positions well off the Bank. There are, however, some unresolved ques- tions regarding the witch distributions (in addition to their occurrence in 1988 but not 1986 and 1987). Lower-level pas- sive drift and a high growth rate (B) are unlikely, since they imply a Shoal spawning site inconsistent with the historical information presented in Bowering (2998a). Lower-level drift requires a slower growth rate (similar to B) in order to have an off-bank spawning site. However, our limited information on currents and hydrography on the eastern side of the Bank in 1988 makes the expected spawning position and its consistency with the temperature range of witch unclear. Thus, a witch spawning site on the eastern side of the Bank together with passive Iower-layer drift cannot be discounted for 1988, although there is no direct evidence for this.
Discussion
The horizontal distributions of larvae and juveniles of the three flatfish species show a striking correspondence to the bot- tom temperature distributions, suggesting a probable influence of the physical environment on the early life stages of flatfish on the southern Grand Bank. Comelation analyses between depth-averaged densities and temperature and salinity at var- ious vertical levels generally yielded the highest (significant) correlations for bottom temperature. There are, however, sev- eral unresolved questions. In particular, the full extent of the flatfish and temperature features was not resolved by the survey grids, the flatfish and temperature maxima appear to be offset in some cases (yellowtail in I986 and 198'7), the flatfish dis- tributions extend through the themocline into the upper layer while the bottom temperaures are representative of depths below 25-30 m (Fig. 2), and the mechanism(s) underlying the cor- respondence is unclear. It is unclear whether there is a direct temperature influence on larval distributions or whether larval densities and temperature are indirectly related by some com- mon correlate (e.g. different water masses). One possible scenario liding larval distributions directly to temperature is passive advection of the eggs and larvae in subthemocline waters followed by active seeking, by late-stage I w a e and juveniles, of the adults' preferred bottom temperature.
The vertical distributions observed during the September l a - val surveys are of limited value in identifying the origin of the larvae-temperature relation. Plaice distributions were domi- nantly subthemocline, but yellowtail and witch were distrib- uted over the range of san~pled depths with centres sf mass near the themocline. It is possible that the dominant sampling above 48 m missed a significant number of older larvae and juveniles at depth and biased the centres of mass towards the surface. Some support for this comes from annual flatfish surveys con- ducted in September over the southern Grand Bank using bottom trawling gear which occasionally capture O-group yel- lowtail and plaice as small as 2 cm standard length (S. J. Walsh, Department of Fisheries and Oceans, St. John's, Nfld., pers. comm.). On the other hmd, the observed depth distributions, especially the high concentrations near the themsclirae, may promote fast growth and high survival for those individuals occupying depths of maximum thermal gradients, as previously documented for fish larvae inhabiting oligotrophic lake systems (e.g . see Wnartsbaugh and Neveman 1988).
Comparison of spawning sites inferred from the observed distributions and measured currents with historical concentra- tions of mature fishes provides some support for the hypothesis of passive advection in some but not all cases, and then only with significant provisos. For two of the three years sampled (1987, 1988), the yellowtail distributions were consistent with passive advection from a Southeast Shoal spawning site pro- vided that the survivors drift in the lower water column md the growth rate is near the maximum value considered (0.25 rnd d). The spawning times inferred from this growth rate approx- imate historical descriptions, and the bottom temperatures observed in the vicinity of the inferred spawning locations and times are consistent with reported temperature preferences of adult yellowtail. However, the 1986 infemd spawning site for yellowtail was implausible. This may have been due to increased spatial structure in the lower-layer drift. Observations of yellowtail egg and early-stage larval distributions in other years (May-June 1983 (4. Anderson, Department of Fisheries and Oceans, St. John's, Nfld., pers. comm.), July 1985) sup-
Can. I . Fish. Aquat. Sci., Vol. 49, 6992
Can
. J. F
ish.
Aqu
at. S
ci. D
ownl
oade
d fr
om w
ww
.nrc
rese
arch
pres
s.co
m b
y Fi
sher
ies
and
Oce
ans
on 0
1/15
/14
For
pers
onal
use
onl
y.
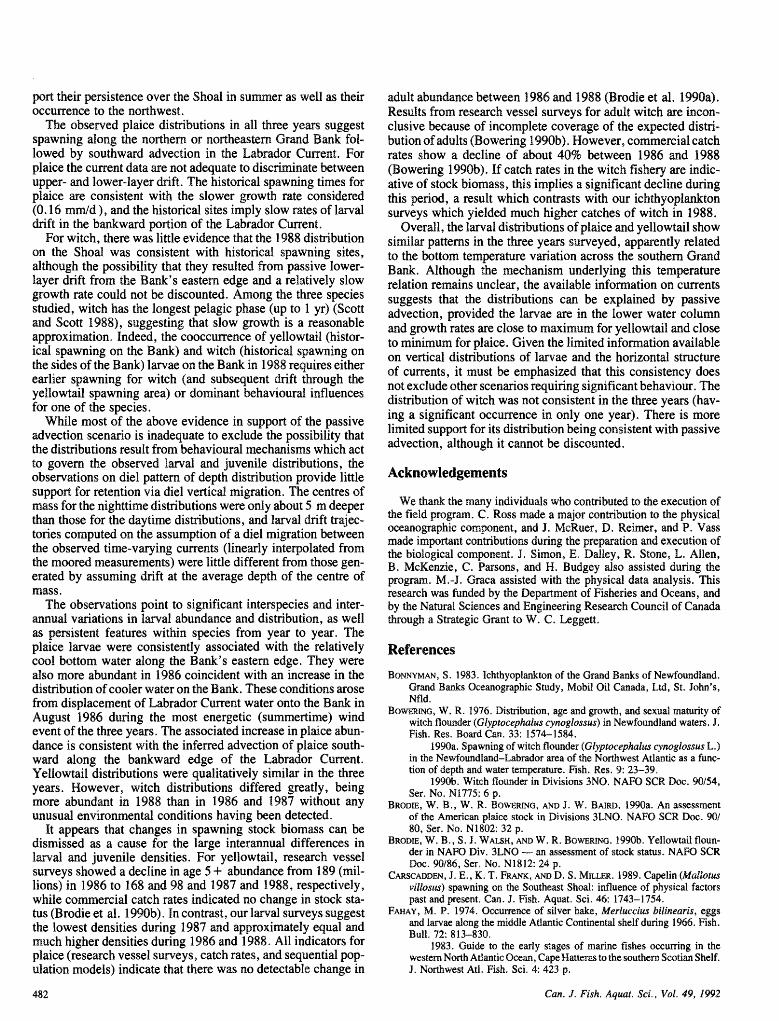
port their persistence over the Shoal in summer as well as their occurrence to the northwest.
The observed plaice distributions in all three years suggest spawning along the northern or northeastern Grmd Bank fol- lowed by southward advection in the Labrador Current. For plaice the current data are not adequate to discriminate between upper- and lower-layer drift. The historical spawning times for plaice are consistent with the slower growth rate considered (0.16 m d d ), and the historical sites imply slow rates of larval drift in the b d w a r d portion of the Labrador Current.
For witch, there was little evidence that the 1988 distribution on the Shoal was consistent with historical spawning sites, although the possibility that they resulted from passive lower- layer drift from the Bank's eastern edge and a relatively slow growth rate could not k discounted. Among the three species studied, witch has the longest pelagic phase (up to 1 yr) (Scott and Scott 1988), suggesting that slow growth is a reasonable approximation. Indeed, the cooccumnce of yellowtail (histor- ical spawning on the Bank) and witch (historical spawning on the sides of the Bank) larvae on the Bank in 1988 requires either earlier spawning for witch (and subsequent drift through the yellowtail spawning area) or dominant khavioural influences for one of the species.
While most sf the above evidence in support of the passive advection scenario is inadequate to exclude the possibility that the distributions result from behavisural mechanisms which act to govern the observed larval and juvenile distributions, the observations on diel pattern of depth distribution provide little support for retention via diel vertical migration. The centres of m s s for the nighttime distributions were only about 5 m deeper than those for the daytime distributions, and larval drift trajec- tories computed on the assumption of a diel migration between the observed time-varying currents (linearly interpolated from the moored measurements) were little different from those gen- erated by assuming drift at the average depth of the centre of mass.
The observations point to significant intenpecies and inter- annual variations in larval abundance and distribution, as well as persistent features within species from year to year* The plaice larvae were consistently associated with the relatively cool bottom water along the Bank's eastern edge. They were dso more abundant in 1986 coincident with an increase in the distribution of cooler water on the Bank. These conditions arose from displacement of Labrador Current water onto the Bank in August 1986 during the most energetic (summertime) wind event of the three yeas. The associated increase in plaice abm- dance is consistent with the inferred advection of plaice south- ward along the bankward edge of the Labrador Current. Yellowtail distributions were qualitatively similar in the three years. However, witch distributions differed greatly, being more abundant in 1988 than in 1986 and 198'7 without any unusual environmental conditions having k e n detected.
It appears that changes in spawning stock biomass can be dismissed as a cause for the large interannual differences in larval and juvenile densities. For yellowtail, research vessel surveys showed a decline in age 5 f abundance from 189 (mil- lions) in 1986 to 168 and 98 and 198'7 and 1988, respectively, while commercial catch rates indicated no change in stock sta- tus (Brodie et al. 1990b). In contrast, our larval surveys suggest the lowest densities during 198'7 and approximately equal and much higher densities during 1986 and 1988. All indicators for plaice (research vessel surveys, catch rates, and sequential pop- ulation models) indicate that there was no detectable change in
adult abundance between 1986 and 1988 (Brodie et d* 1990a). Results from research vessel surveys for adult witch are incon- clusive because of incomplete coverage of the expected distri- bution of adults (Bowering 1990b). However, commercial catch rates show a decline of about 40% between 1986 and 1988 (Bowering 1990b). If catch rates in the witch fishery are indic- ative of stock biomass, this implies a significant decline during this period, a result which contrasts with our i ck thyop l~ ton surveys which yielded much higher catches of witch in 1988.
Overall, the I m a l distributions of plaice and yellowtail show similar patterns in the three years surveyed, apparently related to the bottom temperature variation across the southern Grand Bank. Although the mechanism underlying this temperature relation remains unclear, the available information on currents suggests that the distributions can be explained by passive advection, provided the larvae are in the lower water column and growth rates are close to maximum for yellowtail and close to minimum for plaice. Given the limited information available on vertical distributions of larvae and the horizontal structure of currents, it must be emphasized that this consistency does not exclude other scenarios requiring significant behaviour. The distribution of witch was not consistent in the thee years (hav- ing a significant occurrence in only one year). There is more limited support for its distribution being consistent with passive advection, although it cannot be discounted.
Acknowledgements
We thank the maray individuals who contributed to the execution of the field program. C. Ross made a major c~~ntribution to the physical oceanographic component, and J . McRuer, D. Reimer, and P. Vass made important contributions during the preparation and execution of the biological component. 5. Simon, E. Dalley , R. Stone, L. Allen, B. McKenzie, C. Parsons, and H. Budgey also assisted during the program. M.-5. Graca assisted with the physical data analysis. This research was funded by the Department of Fisheries md Oceans, and by the Natural Sciences and Engineering Research Council of Canada through a Strategic Grant to w. C. keggett.
References
BONNYMAN, S. 1983. Ichthyoplmkton of the Grand Banks of Newfoundland. Grmd Banks Oceanographic Study, Mobil Oil Canada, Etd, St. John's, Nfld.
B o w ~ ~ w c , W. R. 1936. Distribution, age and growth, and sexual maturity of witch flounder (Glyptscephhs qnsglossus) in Newfoundland waters. 9. Fish. Wes. Board Can. 33: 1574-1584.
199Qa. Spawning of witch flounder (Gbypfocephalets cynoglossus L.) in the Newfoundland-Labrador area of the Northwest Atlantic as a func- tion of depth and water temperature. Fish. Res. 9: 23-39.
199Qb. Witch flounder in Divisions 3NO. NAFO SCR Doe. 93/54, Ser. No. N1775: 6 p.
BRODIE, W. B., W. R. BOBZMNG, AND J. W. BAIRD. 1990a. An assessment of the American plaice stock in Divisions 3LNO. NAFB SCR Doc. 90/ 80, Ser. No. N18Q2: 32 p.
BWME, W. B., S. J. WALSH, AND W. R. BOWRING. 1990b. Yellowtail floun- der in NAW Div. 3LN6 - an assessment of stock status. NAFB SCR Doc. 90/86, Ser. No. N1812: 24 p.
CARSCABDEN, J . E., K. T. FRANK, AND D. S. MLLER. 1989. Capelin (Mcmlbfus villosas) spawning on the Southeast Shoal: influence of physical factors pest and present. Can. 9. Fish. Aqanat. Sci. 46: 1743-1754.
FAHAY, M. P. 1974. Occupre~16e of silver hake, Merkuccius biliroearis, eggs and larvae dong the middle Atlantic Continental shelf during 1966. Fish. Bull. 72: 813-830.
1983. Guide to the early stages of marine fishes occurring in the western North Atlantic Ocean, Cape Hatteras to the southern Scotim Shelf. J. Northwest Atl. Fish. Sci. 4: 423 p.
Can. J . Fish. Aquaf. Sci., Vol. 49, 1992
Can
. J. F
ish.
Aqu
at. S
ci. D
ownl
oade
d fr
om w
ww
.nrc
rese
arch
pres
s.co
m b
y Fi
sher
ies
and
Oce
ans
on 0
1/15
/14
For
pers
onal
use
onl
y.

PFPEPATRICK, C., AND R. J. MILLER. 1979. Review of spawning times and locations for some commercial finfish on the Newfoundland and Labrador coasts. Fish. Mar. Sen. Tech. Rep. 985: v + 14 p.
FRANK, K. T., AND J. E. CARSCADDEN. 1989. Factors affecting recruitment variability of capelin (dallorus vilbsus) in the Northwest Atlantic. J. Cons. Int. Bxplor. Mer 45: 146-164.
GREENBERG, B. A., AND B. PETRIE. 1988. The mean bit%otPspic circulation on the Newfoundland shelf and slope. J. Geophys. Res. 93: 15541-15558.
HUKUDA, H., R. J. GREATBATCH, AND A. B. HAY. 1989. A simple three- dimensional model of the circulation off Newfoundland. J. Geophys. Res. 94: 12607-12418.
L o D ~ , J. W. 1991. Summertime bottom temperatures on the Southeast Shoal of the Grmd Bank, and implications for exchange rates. Can. J. Fish. Aquat. Sci. 48: 1316-1325.
LODER, J. W., AND C. K. ROSS 1988. Moored current amd hydrographic meas- urements on the Southeast Shoal of the Grand Bank in 1986 imd 1987. NAFO SCR Doc. 88/61, Ser. No. N1520: 21 p.
LODEW, J. W., C. K. Ross, AND P. C. SMITH. 1988. A space- and time-scale characterization of circulation and mixing over submarine bamks, with application to the northwestern Atlantic shelf. Can. J. Fish. Aquat. Sci. 45: 1860-1885.
MCKENZIE, R. A. 1955. Candian Atlantic flounder fishery. Fish. Res. Board Cim. MS Rep. 594.
MOUWAEN, D. 1980. Direct measurements in the Labrador Current. J. Geo- phys. Res. 85: 4097-4 100.
MYERS, R. A., AND K. F. DRINKWATER. 1988. Ekman transport and larval fish survival. Biol. Oceanogr. 6: 45-64.
NEVINSKY, M. M., AND V. P. SEREBRYAKOV. 1973. American plaice, Hippo- glossoides platessoies Fabr., spawning in the Northwest Atlantic area. Int. Comm. Northwest Atl. Fish. Res. Bull. 10: 23-36.
PETRE, B., S. AKENHEAD, J. LAZIER, AND J. LODBR. 1988. The cold inter- mediate layer on the Labrador and Northeast Newfoundland shelves, 1978-1 986. NAFB Sci. Counc. Stud. 12: 57-69.
PETRIB, B. , AND C. ANDERSON. 1983. Circulation on the Newfoundland con- tinental shelf. Atmos. -Ocean 2 1 : 207-226.
Rm, T. K. 1%6. Sexual maturity and spawning of the American plaice, Hip- poglossoides pbtessoMes (Fabficius), from Newfoundland and Grand Bank areas. J . Fish. Res. Board Can. 23: 65 1-672.
1976). Distribution, abundance, and spawning of yellowtail flounder, Limandaferrugineha, in the Newfoundland area of the Northwest Atlantic. J. Fish. Res. Board Can. 27: 2261-2271.
Ross, C. K., J . W. ~ D E R , AND M.-J. Gw@A. 1988. Moored current and hydrographic measurements on the Southeast Shoal of the Grand Bank, 1986 and 1987. Can. Data Rep. Wydrogr. Ocean Sci. 71: 132 p.
SAMEOTO, D. D., L. O. JAROSZYNSKI, AND W. B. FRASER. 1980. BIONESS, a new design in multiple net zooplankton samplers. Can. J. Fish. Aquat. Sci. 37: 722-724.
Scorn, W. B., AND M. G . Scorn. 1988. Atlantic fishes of Canda. Can. Bull. Fish. Aquat. Sci. 219: 731 p.
SINCLAHR, M. 1988. Maine populations: an essay on population regulation and speciation. University of Washington Press, Seattle, WA. 252 p.
SINCLAIR, M., AND T. B. IEES. 1988. Population richness of marine fish spe- cies. Aquat. Living Resour. % : 7 1-83.
S M G I ~ S K H , A. S. 1979. Induced spawning and larval rearing of the yellowtail flounder, Limandaferruginea. Fish. Bull. 76: 931-936.
SMITH, W. 6., J. K). SEBUNKA, AND A. WELLS. 1978. Die1 movements of larval yellowtail flounder, [email protected]$a'ne~, determined from discrete depth samplng. Fish. Bull. 76: 167-178.
WALSH, S. J. 1991. Commercjlai fishing practices on offshore juvenile flatfish nursery grounds on the Grand Banks of Newfoundland. Neth. J. Sea Res. 27: 423-432.
WELLS, R., W. B. BRODIE, C. A. Bnsm~P, ANDJ. W. BAIRD. 1988. Dishbution and abundance of three fish species on the Grand Bank in relation to depth and temperature of the water. NARI SCR Doc. 88/94, Ser. No. 1546: 26 p.
WURTSBAUGH, W. A., AND D. NEVERMAN. 1988. Post-feeding themotaxis and daily vertical migration in a 1wa l fish. Nature (Lsnd.) 333: 846-848.
Z ~ S T R A , J. J., R. DAPPER, AND J. W B ~ E . 1982. Settlement, gmwth and mor- tality of post-lwd plaice (Pleursnectes platessa) in the western Wadden Sea. Neth. J . Sea Res. 15: 250-272.
Can. S. Fish. Aquat. Sci., Vol. 49, I992
Can
. J. F
ish.
Aqu
at. S
ci. D
ownl
oade
d fr
om w
ww
.nrc
rese
arch
pres
s.co
m b
y Fi
sher
ies
and
Oce
ans
on 0
1/15
/14
For
pers
onal
use
onl
y.
Related Documents