Larson/Farber Ch. 3 Chapter 3: Probability http://www.ocw.cn/OcwWeb/Sloan-School-of-Management/15-075A pplied-StatisticsSpring2003/CourseHome/index.htm

Larson/Farber Ch. 3 Chapter 3: Probability StatisticsSpring2003/CourseHome/index.htm.
Dec 22, 2015
Welcome message from author
This document is posted to help you gain knowledge. Please leave a comment to let me know what you think about it! Share it to your friends and learn new things together.
Transcript

Larson/Farber Ch. 3
Chapter 3: Probability
http://www.ocw.cn/OcwWeb/Sloan-School-of-Management/15-075Applied-StatisticsSpring2003/CourseHome/index.htm

Larson/Farber Ch. 3
Useful videos/websites:
Video on terminology (outcome, event, experiment, sample space):http://screencast.com/t/ODVlNzM2M2
Video on 3 types of probability:http://screencast.com/t/N2VkOTFlMz
Website with good presentation on probability:http://www.zweigmedia.com/RealWorld/tutorialsf15e/frames6_1.html
Math Goodies:http://www.mathgoodies.com/lessons/vol6/intro_probability.html
http://www.mathgoodies.com/lessons/vol6/independent_events.html
http://www.mathgoodies.com/lessons/vol6/conditional.htmlhttp://www.mathgoodies.com/lessons/vol6/complement.html
Larson/Farber Ch. 3
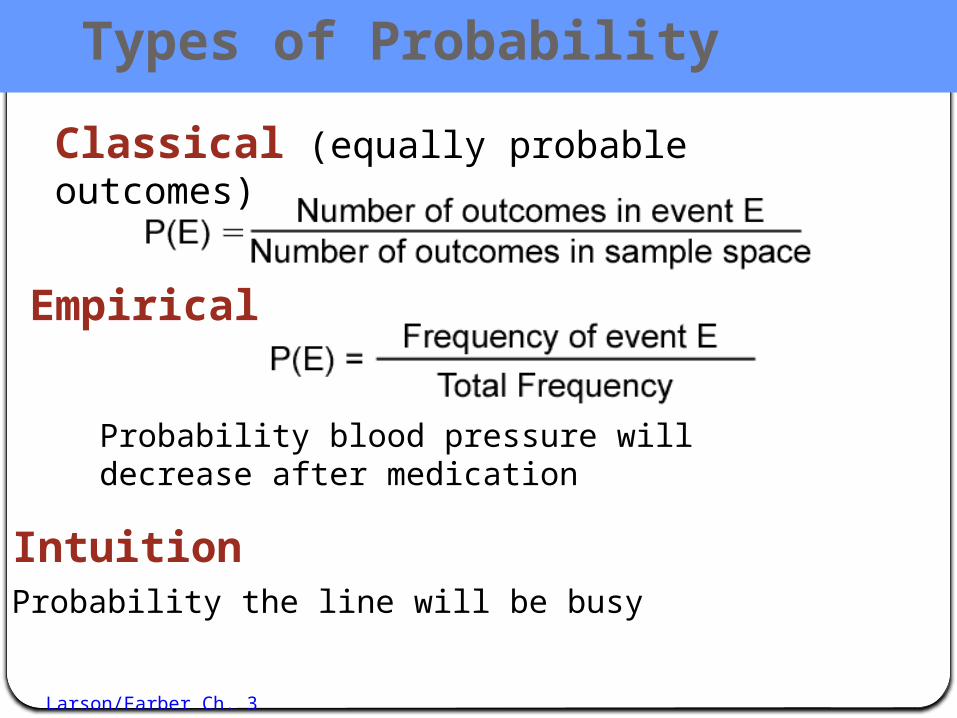
Classical (equally probable outcomes)
Probability blood pressure will decrease after medication
Probability the line will be busy
Empirical
Intuition
Types of Probability

Larson/Farber Ch. 3
Probability experiment:
An action through which counts, measurements or responses are obtained
Sample space:
The set of all possible outcomes
Event:
A subset of the sample space.
Outcome:
Important Terms
The result of a single trial

Larson/Farber Ch. 3
Experiment: Flip a Coin and Roll a Die
Tree diagram:
H1 H2 H3 H4 H5 H6
T1 T2 T3 T4 T5 T6
The sample space has 12 outcomes:{H1, H2, H3, H4, H5, H6, T1, T2, T3, T4,
T5, T6}
Larson/Farber Ch. 3
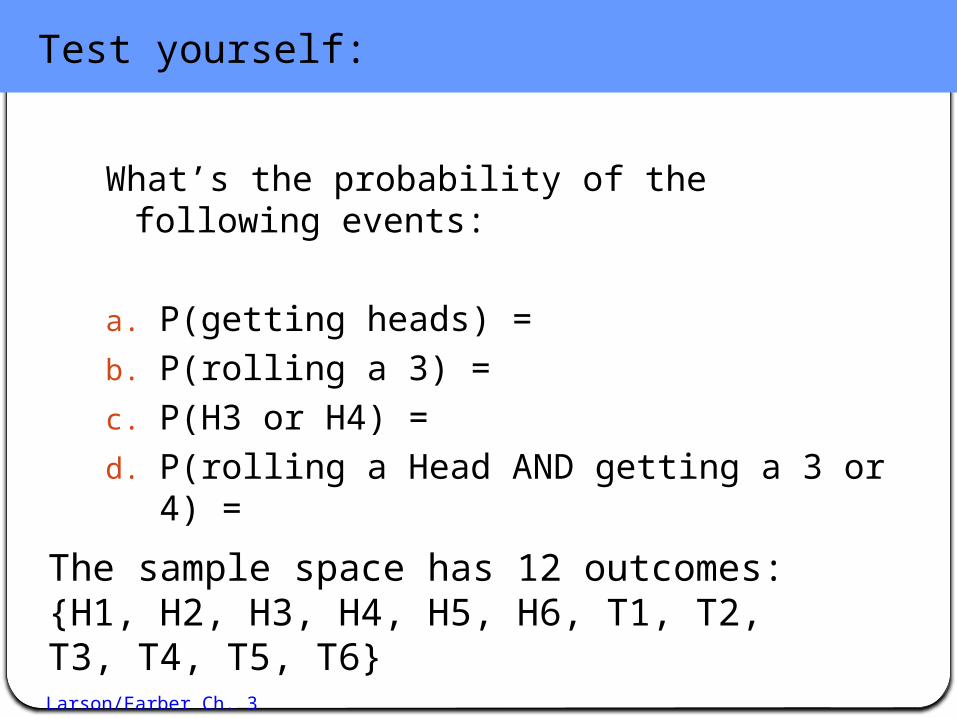
What’s the probability of the following events:
a. P(getting heads) = b. P(rolling a 3) = c. P(H3 or H4) = d. P(rolling a Head AND getting a 3 or 4) =
Test yourself:
The sample space has 12 outcomes:{H1, H2, H3, H4, H5, H6, T1, T2, T3, T4, T5, T6}
Larson/Farber Ch. 3
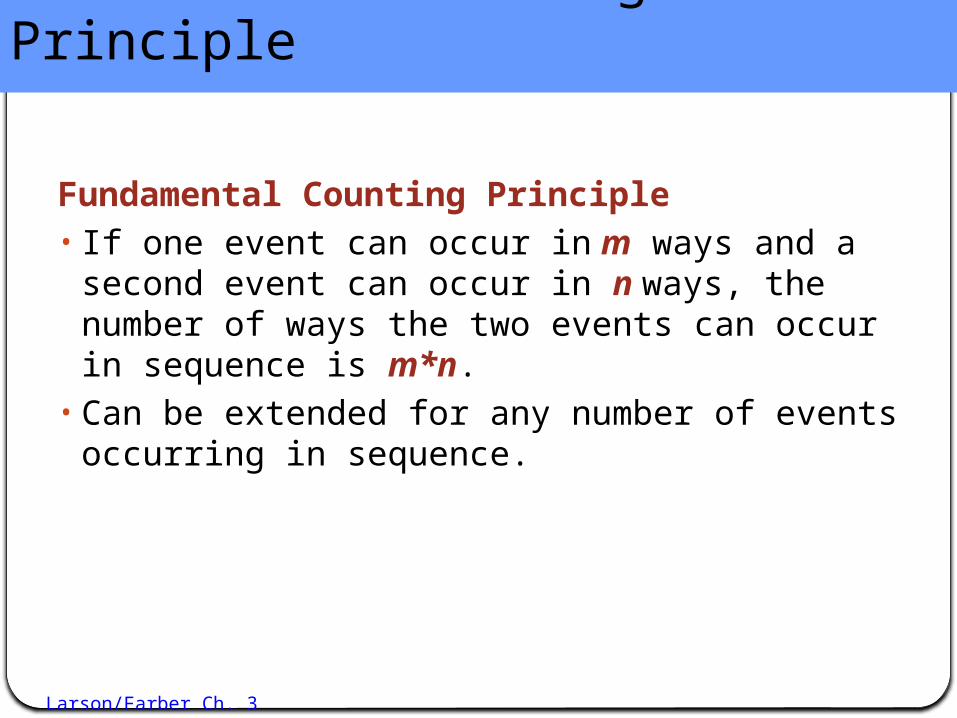
Fundamental Counting Principle
Fundamental Counting Principle• If one event can occur in m ways and a
second event can occur in n ways, the number of ways the two events can occur in sequence is m*n.
• Can be extended for any number of events occurring in sequence.

Larson/Farber Ch. 3
Example
How many license plates can you make if a license number consists of four alphabetic characters followed by two numbers?
__ __ __ __ __ __
Larson/Farber Ch. 3
Example
How many license plates can you make if a license number consists of four unique alphabetic characters followed by two unique digits?
__ __ __ __ __ __
Larson/Farber Ch. 3
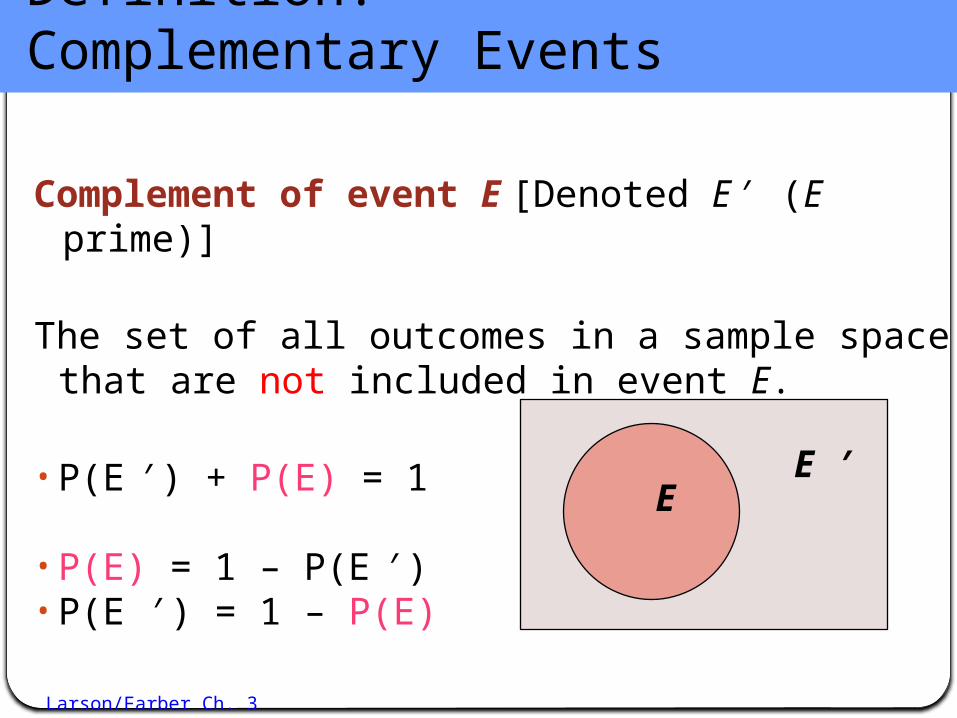
Definition: Complementary Events
Complement of event E [Denoted E ′ (E prime)]
The set of all outcomes in a sample space that are not included in event E.
• P(E ′) + P(E) = 1
• P(E) = 1 – P(E ′)• P(E ′) = 1 – P(E)
E ′E

Larson/Farber Ch. 3
Example
Larson/Farber 4th ed 11
You survey a sample of 1000 employees at a company and record the age of each. Find the probability of randomly choosing an employee who is not between 25 and 34 years old.
Employee ages
Frequency, f
15 to 24 54
25 to 34 366
35 to 44 233
45 to 54 180
55 to 64 125
65 and over 42
Σf = 1000

Larson/Farber Ch. 3
Solution – Complementary Events
Larson/Farber 4th ed 12
Event A = Age is between 25 and 34 Event A’ = Age is NOT between 25 and 34
Employee ages
Frequency, f
15 to 24 54
25 to 34 366
35 to 44 233
45 to 54 180
55 to 64 125
65 and over 42
Σf = 1000
366( 25 34) 0.366
1000
fP age to
n
366( 25 34) 1
1000634
0.6341000
P age is not to
Larson/Farber Ch. 3
Section 3.2
Conditional Probability
and the Multiplication
Rule
Larson/Farber Ch. 3
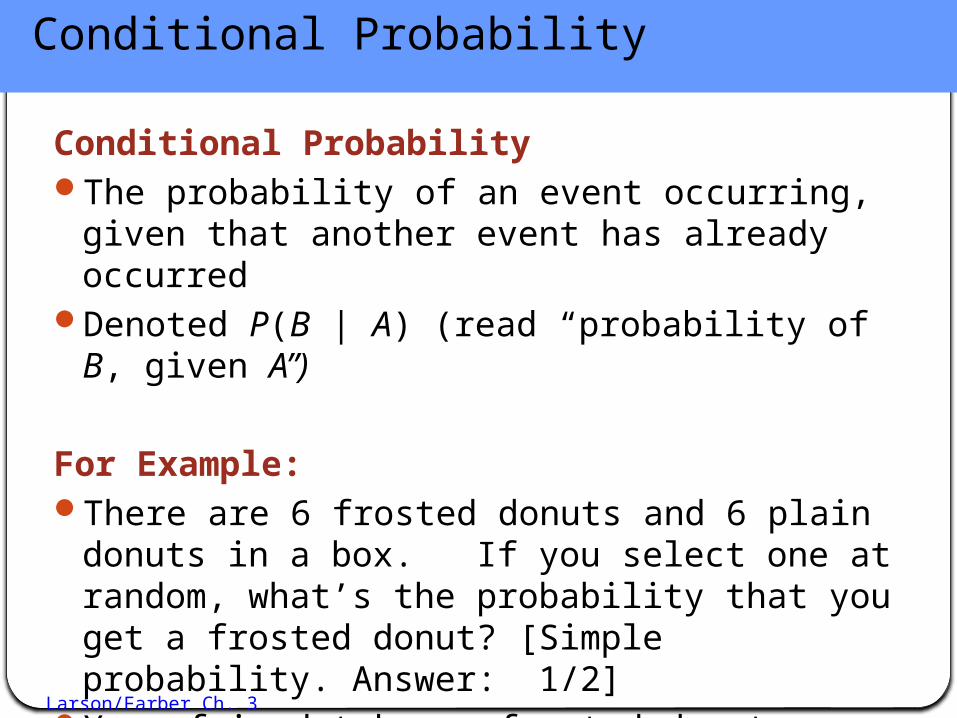
Conditional Probability
Conditional ProbabilityThe probability of an event occurring, given
that another event has already occurredDenoted P(B | A) (read “probability of B, given
A”)
For Example:There are 6 frosted donuts and 6 plain donuts
in a box. If you select one at random, what’s the probability that you get a frosted donut? [Simple probability. Answer: 1/2]
Your friend takes a frosted donut, now what’s the probability that you get a frosted donut? [Conditional probability. Answer: 5/11]
Larson/Farber Ch. 3
15
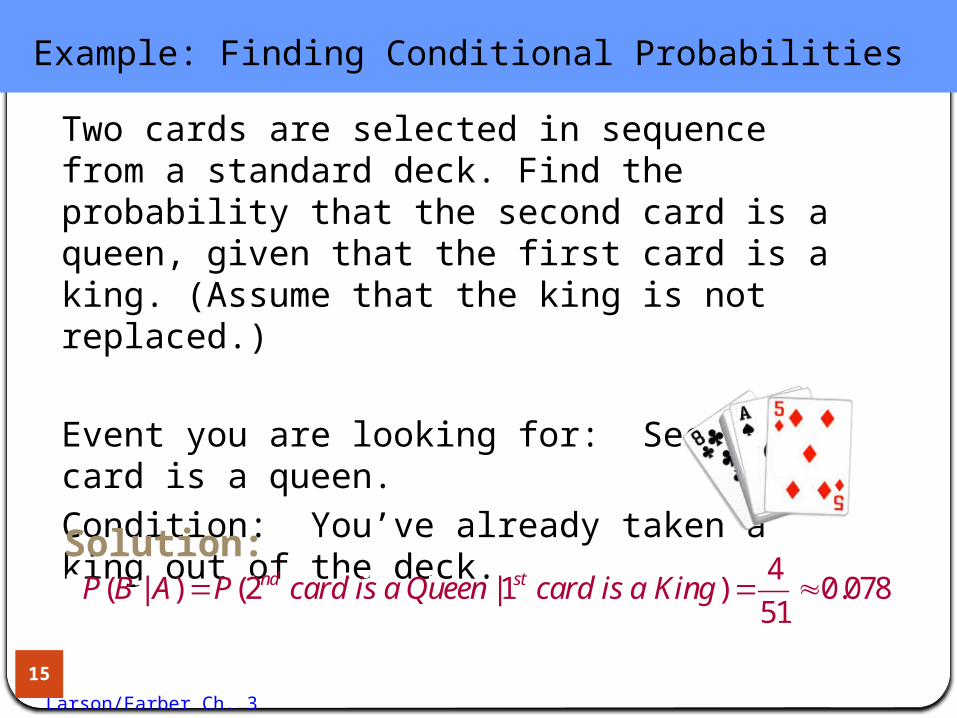
Example: Finding Conditional Probabilities
Two cards are selected in sequence from a standard deck. Find the probability that the second card is a queen, given that the first card is a king. (Assume that the king is not replaced.)
Event you are looking for: Second card is a queen.Condition: You’ve already taken a king out of the deck. Solution:Because the first card is a king and is not replaced, the remaining deck has 51 cards, 4 of which are queens.
4( | ) (2 |1 ) 0.078
51nd stP B A P card is a Queen card is a King

Larson/Farber Ch. 3
Larson/Farber 4th ed16
The table shows the results of a study in which researchers examined a child’s IQ and the presence of a specific gene in the child. Find the probability that a child has a high IQ, given that the child has the gene.
Gene Present
Gene not present Total
High IQ 33 19 52
Normal IQ
39 11 50
Total 72 30 102
Example: Finding Conditional Probabilities

Larson/Farber Ch. 3
17
Solution: Finding Conditional Probabilities
There are 72 children who have the gene. So, the sample space consists of these 72 children.
33( | ) ( | ) 0.458
72P B A P high IQ gene present
Of these, 33 have a high IQ.
Gene Present
Gene not present Total
High IQ 33 19 52
Normal IQ
39 11 50
Total 72 30 102

Larson/Farber Ch. 3
Independent and Dependent Events
Independent eventsThe occurrence of one of the events does
not affect the probability of the occurrence of the other event
P(B | A) = P(B) or P(A | B) = P(A)Events that are not independent are
dependent
Larson/Farber 4th ed18
Larson/Farber Ch. 3
Two events A and B are independent if the probability of the occurrence of event B is not affected by the occurrence (or non-occurrence) of event A.
A = Being femaleB = Having type O blood
A = 1st child is a boyB = 2nd child is a boy
Independent Events
For example:

Larson/Farber Ch. 3
Two events that are not independent are dependent.
Dependent Events
A = Living in HoustonB = Living in Texas
A = Selecting a red ball from (3 red, 3 blue)B = Selecting a red ball, then a blue ball
For example:

Larson/Farber Ch. 3
The results of responses when a sample of adults in 3 cities was asked if they liked a new juice is:
1. P(Yes)
2. P(Seattle)
3. P(Miami)
4. P(No | Miami) = probability the answer is “no” given that
adult is a resident of Miami
Omaha Seattle Miami TotalYes 100 150 150 400No 125 130 95 350Undecided 75 170 5 250
Total 300 450 250 1000
One of the responses is selected at random. Find:
Contingency Table

Larson/Farber Ch. 3
1. P(Yes)
2. P(Seattle)
3. P(Miami)
4. P(No, given Miami)
100 150 150125 130 95 350 75 170 5 250
Omaha Seattle Miami TotalYesNoUndecidedTotal 300 450 250
400
1000
= 95 / 250 = 0.38
= 250 / 1000 = 0.25
Answers: 1) 0.4 2) 0.45 3) 0.25 4) 0.38
= 450 / 1000 = 0.45
Solutions
= 400 / 1000 = 0.4
Larson/Farber Ch. 3
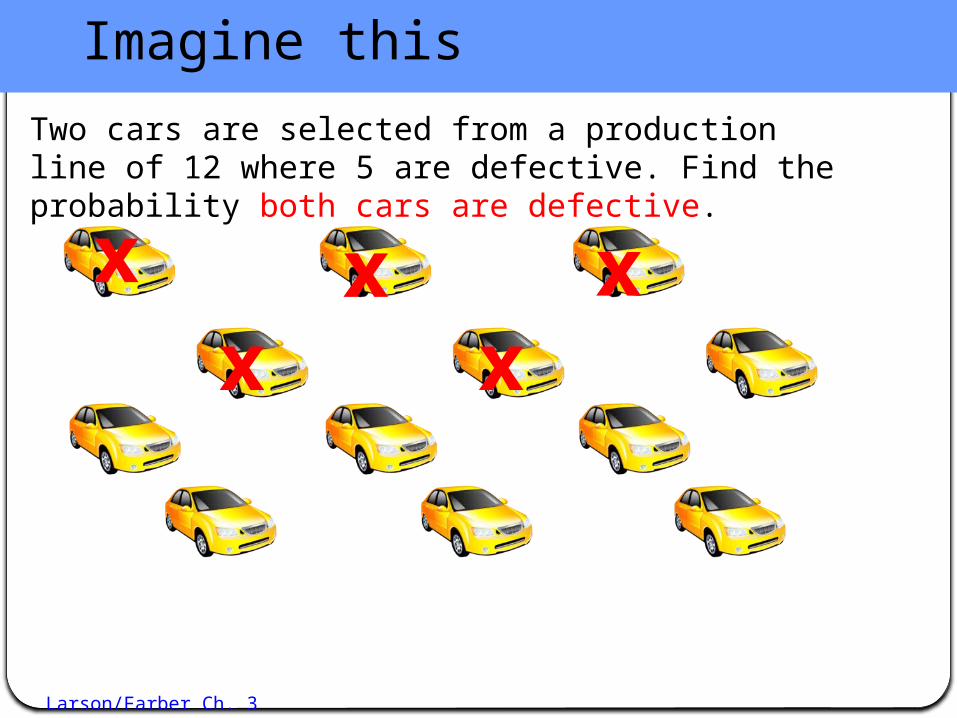
Imagine this
x x xx x
Two cars are selected from a production line of 12 where 5 are defective. Find the probability both cars are defective.
Larson/Farber Ch. 3
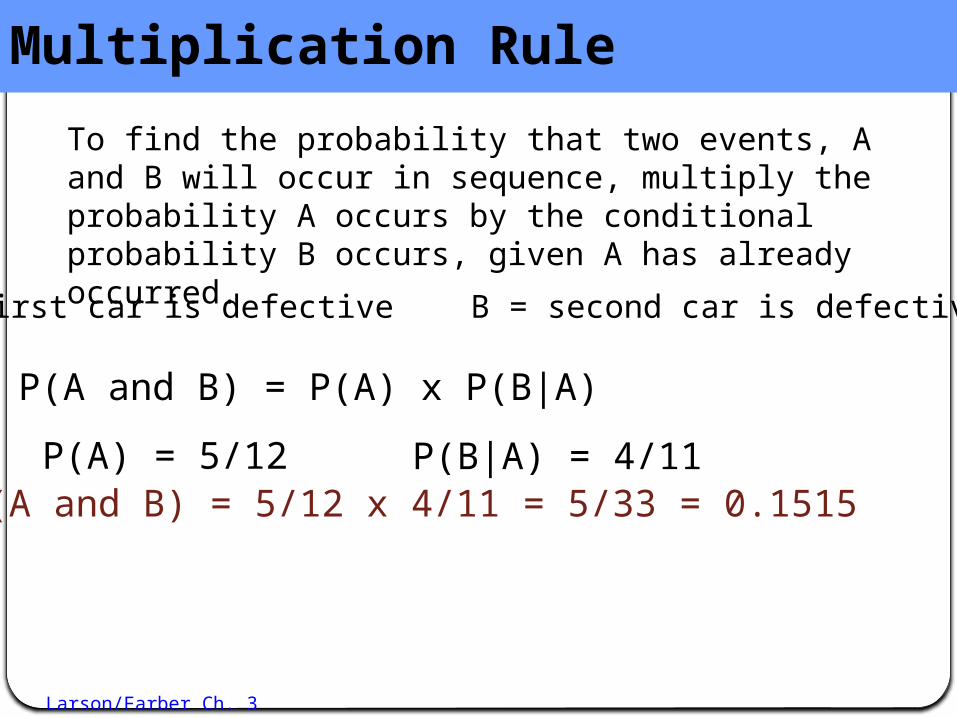
To find the probability that two events, A and B will occur in sequence, multiply the probability A occurs by the conditional probability B occurs, given A has already occurred.
P(A and B) = P(A) x P(B|A)
A = first car is defective B = second car is defective.
P(A) = 5/12 P(B|A) = 4/11P(A and B) = 5/12 x 4/11 = 5/33 = 0.1515
Multiplication Rule

Larson/Farber Ch. 3
Two dice are rolled. Find the probability both are 4’s.
A = first die is a 4 and B = second die is a 4.
P(A) = 1/6 P(B|A) = 1/6
P(A and B) = 1/6 x 1/6 = 1/36 = 0.028
When two events A and B are independent, then P (A and B) = P(A) x P(B)
(because for independent events P(B) = P(B|A) ).
Multiplication Rule

Larson/Farber Ch. 3
Section 3.3
The Addition Rule

Larson/Farber Ch. 3
Compare “A and B” to “A or B”
The compound event “A and B” means that A and B both occur in the same trial. Use the multiplication rule to find P(A and B).
The compound event “A or B” means either A can occur without B, B can occur without A or both A and B can occur. Use the addition rule to find P(A or B).
A B
A or BA and B
A B

Larson/Farber Ch. 3
Mutually Exclusive Events
Two events, A and B, are mutually exclusive if they cannot occur in the same trial.
A = A person is under 21 years old B = A person is running for the U.S. Senate
A = A person was born in PhiladelphiaB = A person was born in Houston
A B Mutually exclusiveP(A and B) = 0
When event A occurs it excludes event B in the same trial.

Larson/Farber Ch. 3
Non-Mutually Exclusive Events
If two events can occur in the same trial, they are NOT mutually exclusive.
A = A person is under 25 years oldB = A person is a lawyer
A = A person was born in PhiladelphiaB = A person watches “Jeopardy” on TV
A BNon-mutually exclusiveP(A and B) ≠ 0
A and B

Larson/Farber Ch. 3
The Addition Rule
The probability that one or the other of two events will occur is: P(A) + P(B) – P(A and B)
A card is drawn from a deck. Find the probability it is a king or it is red.

Larson/Farber Ch. 3
The Addition Rule
The probability that one or the other of two events will occur is: P(A) + P(B) – P(A and B)A card is drawn from a deck. Find the probability it is a king or it is red.
A = the card is a king B = the card is red.
P(A) = 4/52 and P(B) = 26/52 but P(A and B) = 2/52
P(A or B) = 4/52 + 26/52 – 2/52 = 28/52 = 0.538

Larson/Farber Ch. 3
Example: Using the Addition Rule
A blood bank catalogs the types of blood given by donors during the last five days. A donor is selected at random. Find the probability the donor has type O or type A blood.
Larson/Farber 4th ed32
Type O Type A Type B Type AB
Total
Rh-Positive 156 139 37 12 344
Rh-Negative
28 25 8 4 65
Total 184 164 45 16 409

Larson/Farber Ch. 3
Solution: Using the Addition Rule
33
The events are mutually exclusive (a donor cannot have type O blood and type A blood)
Type O Type A Type B Type AB
Total
Rh-Positive 156 139 37 12 344
Rh-Negative
28 25 8 4 65
Total 184 164 45 16 409( ) ( ) ( )
184 164
409 409348
0.851409
P type O or type A P type O P type A
Larson/Farber Ch. 3
Example: Using the Addition Rule
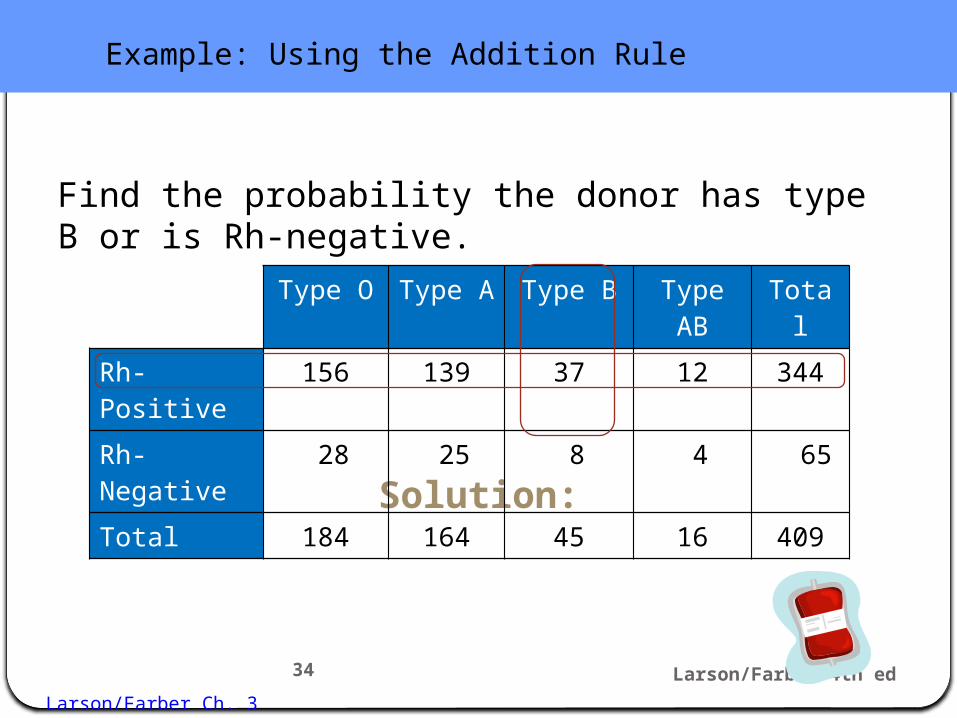
Find the probability the donor has type B or is Rh-negative.
Larson/Farber 4th ed34
Solution:
The events are not mutually exclusive (a donor can have type B blood and be Rh-negative)
Type O Type A Type B Type AB
Total
Rh-Positive 156 139 37 12 344
Rh-Negative
28 25 8 4 65
Total 184 164 45 16 409

Larson/Farber Ch. 3
Solution: Using the Addition Rule
Larson/Farber 4th ed35
Type O Type A Type B Type AB
Total
Rh-Positive 156 139 37 12 344
Rh-Negative
28 25 8 4 65
Total 184 164 45 16 409( )
( ) ( ) ( )
45 65 8 1020.249
409 409 409 409
P type B or Rh neg
P type B P Rh neg P type B and Rh neg

Larson/Farber Ch. 3
Section 3.4
Counting Principles
Larson/Farber Ch. 3
Permutations
Larson/Farber 4th ed37
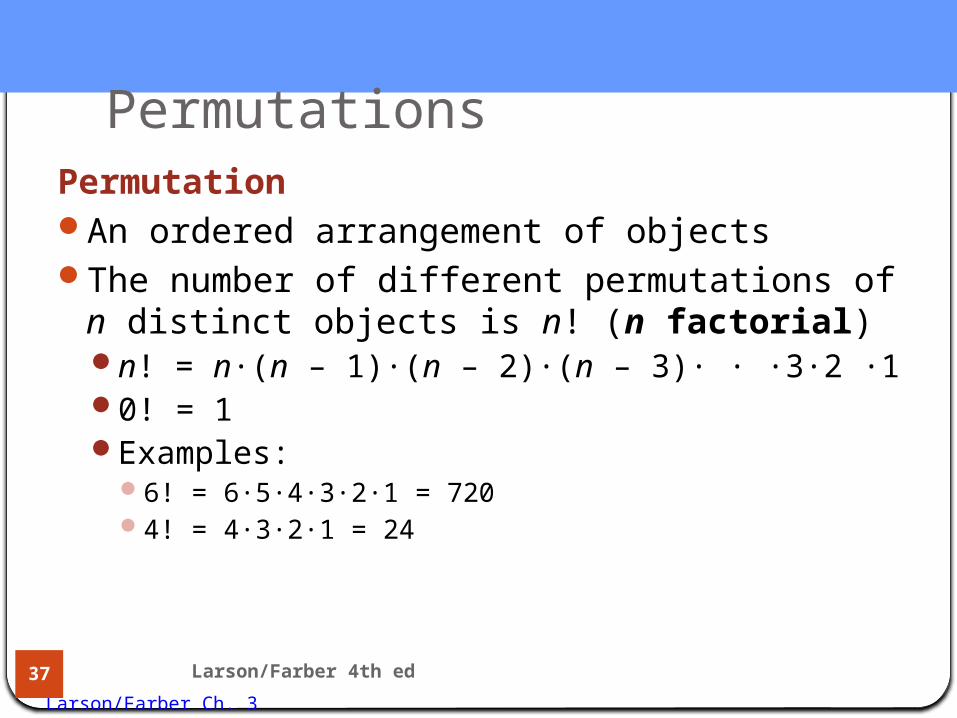
PermutationAn ordered arrangement of objectsThe number of different permutations of n
distinct objects is n! (n factorial)n! = n∙(n – 1)∙(n – 2)∙(n – 3)∙ ∙ ∙3∙2 ∙10! = 1Examples:
6! = 6∙5∙4∙3∙2∙1 = 7204! = 4∙3∙2∙1 = 24
Larson/Farber Ch. 3
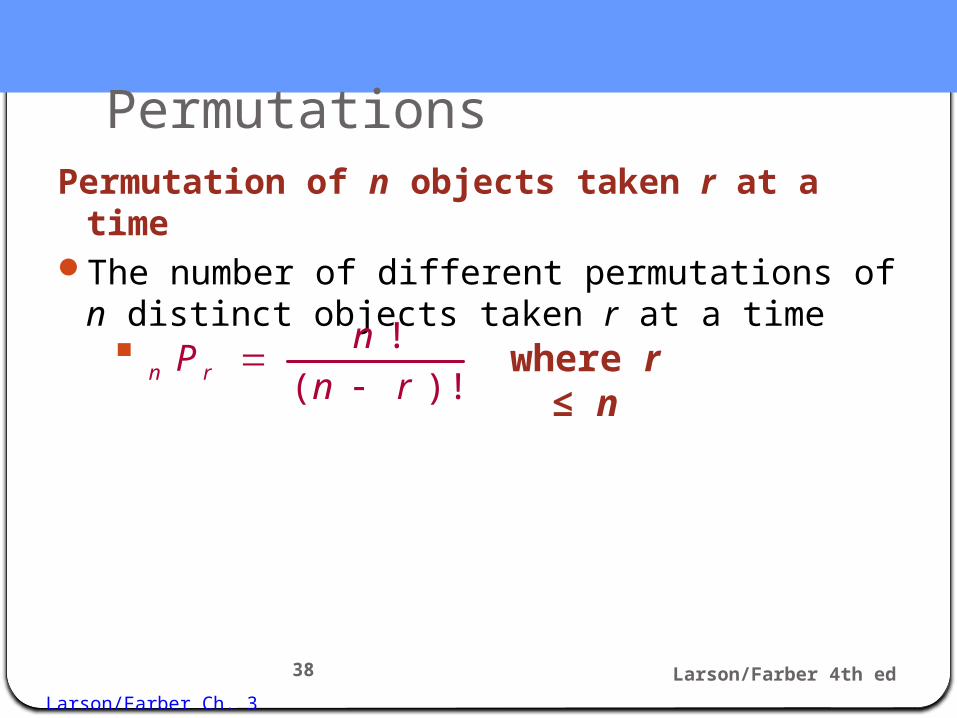
PermutationsPermutation of n objects taken r at a timeThe number of different permutations of n
distinct objects taken r at a time
Larson/Farber 4th ed38
!
( )!n r
nP
n r
■ where r
≤ n

Larson/Farber Ch. 3
Example: Finding nPr
Find the number of ways of forming three-digit codes in which no digit is repeated.
Larson/Farber 4th ed39
Solution:You need select 3 digits from a group of 10
n = 10, r = 3
10 3
10! 10!
(10 3)! 7!
10 9 8 7 6 5 4 3 2 1
7 6 5 4 3 2 1
720 ways
P

Larson/Farber Ch. 3
Combinations
Combination of n objects taken r at a timeA selection of r objects from a group of n
objects without regard to order
Larson/Farber 4th ed40
!
( )! !n r
nC
n r r
■

Larson/Farber Ch. 3
Example: Combinations
A state’s department of transportation plans to develop a new section of interstate highway and receives 16 bids for the project. The state plans to hire four of the bidding companies. How many different combinations of four companies can be selected from the 16 bidding companies?
Larson/Farber 4th ed41
Method:• You need to select 4 companies from a group of 16• n = 16, r = 4• Order is not important
Larson/Farber Ch. 3
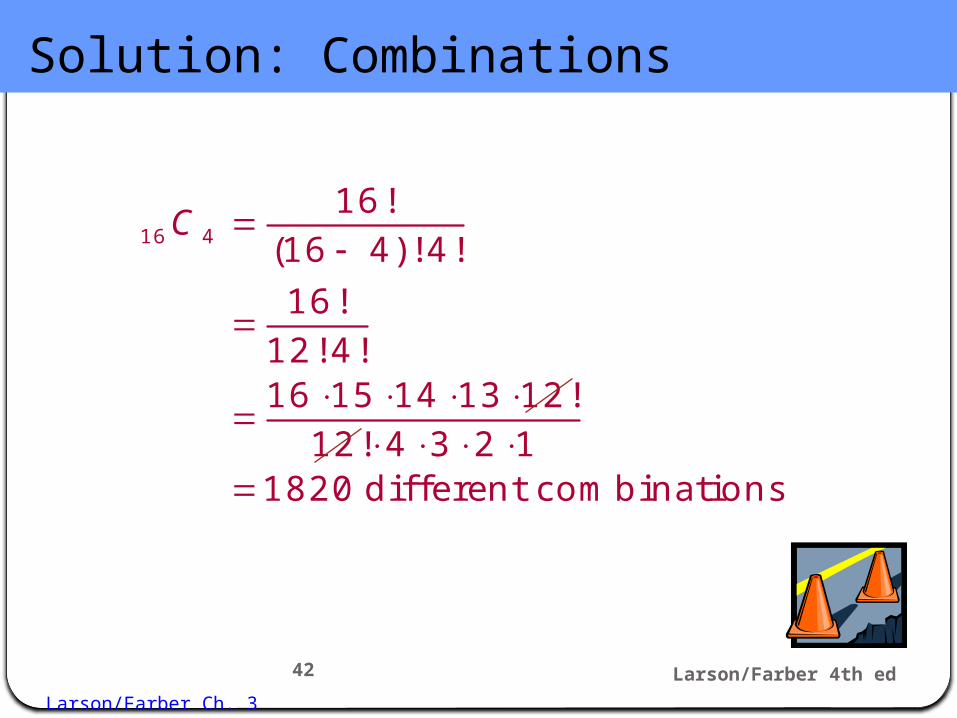
Solution: Combinations
Larson/Farber 4th ed42
16 4
16!
(16 4)!4!
16!
12!4!16 15 14 13 12!
12! 4 3 2 11820 different combinations
C

Larson/Farber Ch. 3

Larson/Farber Ch. 3
1. Two cars are selected from a production line of 12 cars where 5 are defective. What is the probability the 2nd car is defective, given the first car was defective?

Larson/Farber Ch. 3
The results of responses when a sample of adults in 3 cities was asked if they liked a new juice is:
Contingency Table
3. P(Miami or Yes)
4. P(Miami or Seattle)
Omaha Seattle Miami TotalYes 100 150 150 400No 125 130 95 350Undecided 75 170 5 250Total 300 450 250 1000
One of the responses is selected at random. Find:
1. P(Miami and Yes)
2. P(Miami and Seattle)

Larson/Farber Ch. 3
3. One card is selected at random from a standard deck, then replaced, and a second card is drawn. Find the probability of selecting two face cards.
A. 0.050
B. 0.053
C. 0.038
D. 0.462

Larson/Farber Ch. 3
Copyright © 2007 Pearson Education, Inc. Publishing as Pearson Addison-Wesley
4. The table shows the favorite pizza topping for a sample of students. One of these students is selected at random. Find the probability the student is female or prefers sausage.
A. 0.458
B. 0.583
C. 0.125
D. 0.556
Slide 3- 47
Cheese
Pepperoni
Sausage
Total
Male 8 5 2 15
Female
2 4 3 9
Total 10 9 5 24

Larson/Farber Ch. 3
Answers
1. Given a defective car has been selected, the conditional sample space has 4 defective out of 11. P(B|A) = 4/11
2. P(Miami and Yes) = 0.15P(Miami and Seattle) = 0P(Miami or Yes) = 250/1000 + 400/1000 – 150/1000 = 0.5P(Miami or Seattle ) = 250/1000 + 450/1000 = 0.7
3. (B) 0.053
4. (A) .458
Related Documents