INVESTIGATING THE RELATIVE SALIENCE OF RACE, SEX, AND FACIAL EXPRESSIONS OF EMOTION AMONG PRESCHOOLERS: INTRODUCING A NEW FACIAL CATEGORIZATION TASK A Thesis presented to The Faculty of the Graduate School At the University of Missouri In Partial Fulfillment Of the Requirements for the Degree Master of Science By JAMES A. LARSEN Dr. Louis Manfra, Thesis Supervisor MAY 2018

Welcome message from author
This document is posted to help you gain knowledge. Please leave a comment to let me know what you think about it! Share it to your friends and learn new things together.
Transcript

INVESTIGATING THE RELATIVE SALIENCE OF RACE, SEX, AND FACIAL
EXPRESSIONS OF EMOTION AMONG PRESCHOOLERS: INTRODUCING A NEW
FACIAL CATEGORIZATION TASK
A Thesis presented to
The Faculty of the Graduate School
At the University of Missouri
In Partial Fulfillment
Of the Requirements for the Degree
Master of Science
By
JAMES A. LARSEN
Dr. Louis Manfra, Thesis Supervisor
MAY 2018

APPROVAL
The undersigned, appointed by the dean of the Graduate School, have examined the thesis entitled
INVESTIGATING THE RELATIVE SALIENCE OF RACE, SEX, AND FACIAL EXPRESSIONS OF EMOTION AMONG PRESCHOOLERS: INTRODUCING A NEW
FACIAL CATEGORIZATION TASK
presented by James A. Larsen,
a candidate for the degree of master of science,
and hereby certify that, in their opinion, it is worthy of acceptance.
Professor Louis Manfra
Professor Tashel Bordere
Professor Laura Scherer

ii
ACKNOWLEDGEMENTS
I would like to extend my deepest gratitude to my thesis supervisor, Dr. Louis
Manfra, for the guidance and support he provided throughout the processes of developing
and completing my thesis. Dr. Manfra’s mentorship has helped me grow as a writer and
scholar and his impact on my professional development cannot be overstated. I would
also like to thank my thesis committee members, Drs. Tashel Bordere and Laura Scherer,
for the invaluable feedback they provided over the course of my project. Much of my
success in carrying out this project can be attributed to the thoughtful discussions I shared
with my esteemed committee.
iii
TABLE OF CONTENTS
ACKNOWLEDGEMENTS.................................................................................................. ii
LIST OF ILLUSTRATIONS ...............................................................................................v
ABSTRACT ....................................................................................................................... vi
CHAPTER 1: INTRODUCTION ........................................................................................1
CHAPTER 2: LITERATURE REVIEW .............................................................................4
Social Categorization During Preschool ...........................................................................4
Towards a Competing Facial Stimuli Task .......................................................................8
The Current Study ...........................................................................................................11
Research Questions ......................................................................................................11
Hypotheses ...................................................................................................................12
CHAPTER 3: METHODOLOGY .....................................................................................13
Method ............................................................................................................................13
Sampling and Participants ............................................................................................13
Procedure and Measures ..............................................................................................14
Overview ...................................................................................................................14
Choose-A-Picture Task .............................................................................................14
Demographic Information .........................................................................................16
Outcome Measures ....................................................................................................17
iv
CHAPTER 4: RESULTS ...................................................................................................18
Data Analysis Overview .................................................................................................18
Random and Non-Random Selection ..............................................................................18
Assessing Relative Salience ............................................................................................20
Predictors of Stimuli Preferences ....................................................................................22
CHAPTER 5: DISCUSSION .............................................................................................24
REFERENCES ..................................................................................................................29

v
LIST OF ILLISTRATUIONS
Table Page
1. Table 1. Proportion of Non-Random Selection Patterns by Condition and
Instruction Type………………………………………………………………….33
2. Table 2. Number and Percentage of Participants Selecting Pictures Based on
Emotion Expression, Sex, Race, and “Other”…………………………………...34
3. Table 3. Predictors’ Contributions in the Multinominal Logistic Regression by
Condition………………………………………………………………………...35
Figure Page
1. Figure 1. Example Items for Each Condition ……….…………………………..36
vi
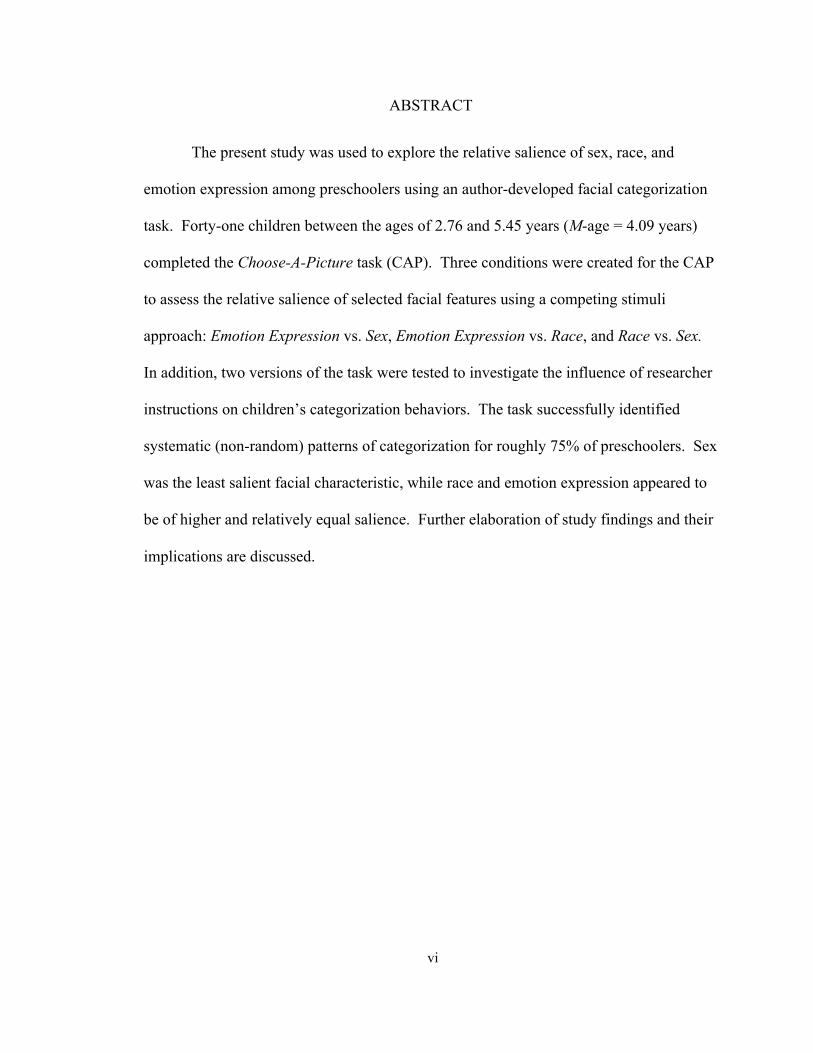
ABSTRACT
The present study was used to explore the relative salience of sex, race, and
emotion expression among preschoolers using an author-developed facial categorization
task. Forty-one children between the ages of 2.76 and 5.45 years (M-age = 4.09 years)
completed the Choose-A-Picture task (CAP). Three conditions were created for the CAP
to assess the relative salience of selected facial features using a competing stimuli
approach: Emotion Expression vs. Sex, Emotion Expression vs. Race, and Race vs. Sex.
In addition, two versions of the task were tested to investigate the influence of researcher
instructions on children’s categorization behaviors. The task successfully identified
systematic (non-random) patterns of categorization for roughly 75% of preschoolers. Sex
was the least salient facial characteristic, while race and emotion expression appeared to
be of higher and relatively equal salience. Further elaboration of study findings and their
implications are discussed.

1
CHAPTER 1: INTRODUCTION
Social categorization is the learned process of classifying people into groups
based on perceptually-distinct features (Hogg, 2001). It is through this process that
people are able to understand and make meaning of the social world. While it is well
documented that, from a young age, children develop a number of patterned social
categorization tendencies (Caron, Caron, & Myers, 1985; Chael & Rutherford, 2011;
Widen & Russell, 2008), empirical research has focused primarily on single-
characteristic (e.g., facial emotion expressions) differentiation, such as distinguishing
between happy and sad faces. While this area of research has illuminated important
dimensions of early childhood categorization, it provides a fragmented understanding of
the overall process in context. Children’s real-world social categorization does not take
place in a one-dimensional setting; the people they see are characterized by several
features that vary from person to person (e.g., happy/sad, boy/girl, Black/White,
young/old). Research designed to explore social categorization in the presence of
competing stimuli (e.g., sex vs. race) will provide further understanding of the overall
process in context for at least two reasons.
First, the competing stimuli approach will provide a situation in which the relative
salience of social features across contexts can be assessed. When facial features are
studied in isolation, it is difficult to make reliable claims about the importance of specific
social characteristics in the categorization process. It is possible that young children
develop unique patterns of categorization across various facial features. In other words,
young children might focus on one salient facial feature across situations or develop
context-specific categorization behaviors for several facial features. For example,
2
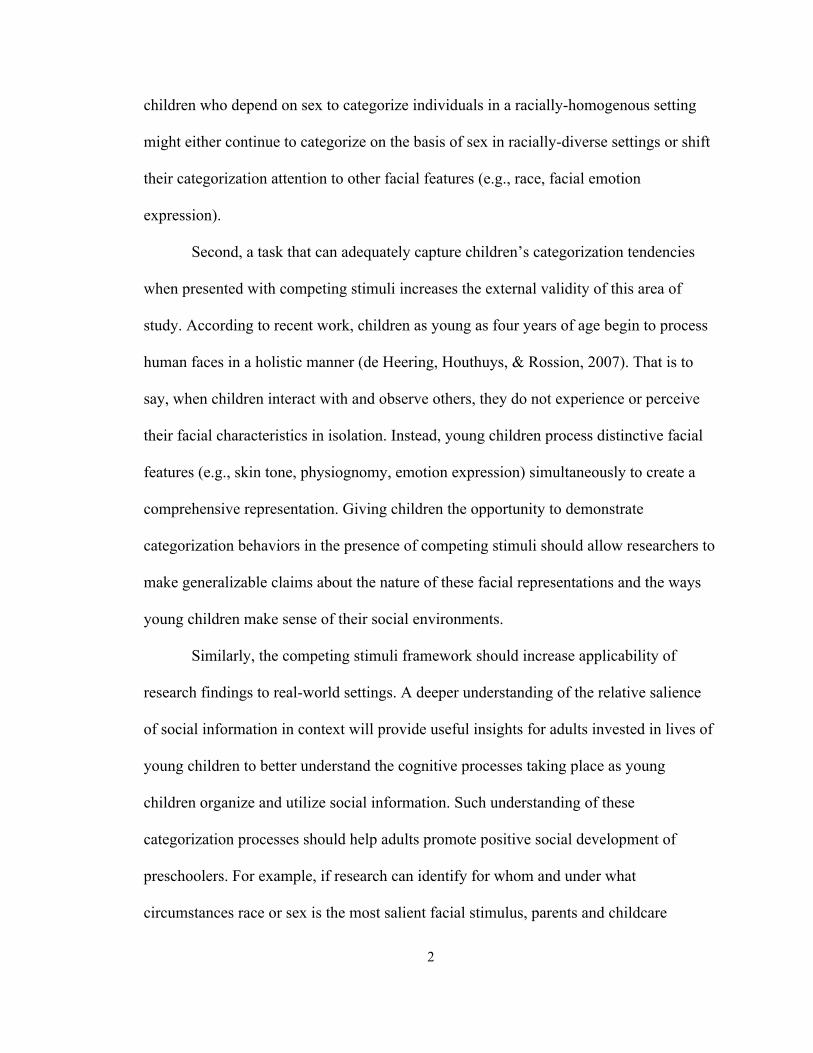
children who depend on sex to categorize individuals in a racially-homogenous setting
might either continue to categorize on the basis of sex in racially-diverse settings or shift
their categorization attention to other facial features (e.g., race, facial emotion
expression).
Second, a task that can adequately capture children’s categorization tendencies
when presented with competing stimuli increases the external validity of this area of
study. According to recent work, children as young as four years of age begin to process
human faces in a holistic manner (de Heering, Houthuys, & Rossion, 2007). That is to
say, when children interact with and observe others, they do not experience or perceive
their facial characteristics in isolation. Instead, young children process distinctive facial
features (e.g., skin tone, physiognomy, emotion expression) simultaneously to create a
comprehensive representation. Giving children the opportunity to demonstrate
categorization behaviors in the presence of competing stimuli should allow researchers to
make generalizable claims about the nature of these facial representations and the ways
young children make sense of their social environments.
Similarly, the competing stimuli framework should increase applicability of
research findings to real-world settings. A deeper understanding of the relative salience
of social information in context will provide useful insights for adults invested in lives of
young children to better understand the cognitive processes taking place as young
children organize and utilize social information. Such understanding of these
categorization processes should help adults promote positive social development of
preschoolers. For example, if research can identify for whom and under what
circumstances race or sex is the most salient facial stimulus, parents and childcare
3
professionals can maximize the positive impact of environments, interactions, and
experiences intended to promote positive associations towards people of various social
groups.
The current study used an author-developed task to explore the relative salience of
social categories during the preschool years by having children select one of three
pictures of real children’s faces characterized by three competing stimuli: sex (boy, girl),
facial emotion expression (happy, sad), and race (Black, White). Further, the current
study was used to investigate how child-level characteristics (i.e., age, sex, race/ethnicity)
and situational factors (i.e., spontaneous categorization vs. externally imposed
categorization) relate to early social categorization behaviors. Detailed justification for
the competing stimuli approach and the specific social characteristics chosen for this
exploratory study is presented in the following sections.
4
CHAPTER 2: LITERATURE REVIEW
A human face contains an incredible amount of social information. From the earliest
moments of life, people seem particularly drawn to faces above and beyond other salient
visual stimuli (Valenza, Simion, Cassia, & Carlo, 1996). Infant research has identified
facial preferences on the basis of familiarity (Bartrip & Morton, 2001), attractiveness
(Slater, Von der Schulenburg, Brown, Badenoch, Butterworth, Parsons, & Samuels,
1998), emotion expression (LaBarbera, Izard, Vietze, & Parisi, 1976), sex (Quinn, Yahr,
Kuhn, Slater, & Pascalis, 2002), race (Kelly, Quinn, Slater, Lee, Ge, & Pascalis, 2007),
and other physical characteristics. These early preferences are evidence of rudimentary
forms of facial categorization that serve as a foundation for later development. These
findings are included to briefly highlight that as children transition into preschool they
already possess a number of social categorization competencies.
Social Categorization During Preschool
During the preschool years, children continue to use information extracted from
faces as a means for social categorization. Among the most commonly studied facial
characteristics used in children’s categorization is emotion expression (Calder, Young,
Perrett, Etcoff, & Rowland, 1996; Chael & Rutherford, 2011; Pollak & Kistler, 2002;
Widen & Russell, 2008). Chael and Rutherford (2011) designed a study to explore
whether 3.5-year-olds were more likely to detect within- or between-category differences
in facial emotion expression. The researchers used a set of computer-generated faces to
create a continuum of happy and sad facial expressions varying in terms of emotional
intensity. Participants were shown two pictures at a time and were asked to explain if the
faces “felt the same” or “felt different.” The study findings indicated 3.5-year-olds tended

5
to state within-category faces (e.g., two faces with varying intensities of sad) “felt the
same” and that between-category faces (e.g., one happy face, one sad face) “felt
different.”
This finding suggests young children focus more on between- as opposed to
within-category differences during the categorization of facial emotion expressions.
However, it is possible the verbal criteria (i.e., “same” or “different”) guided children’s
categorizations in a way that is not representative of spontaneous categorization (i.e.,
categorization without direct instruction indicating how to categorize). Another option is
to simply present facial stimuli and observe if and how children categorize them without
explicitly instructing them to do so. In this spontaneous categorization approach,
experimenters might capture a unique and more authentic form of social categorization.
The current study addresses this consideration by including two versions of the task to
examine spontaneous and externally imposed categorization.
Children’s use of sex as a criterion for facial categorization is also well
documented. Children as young as two years old can successfully classify pictures using
common gender labels such as “girl” and “boy” (Weinraub et al., 1984) and by three
years old, children can consistently identify their own sex and the sex of others
(Thompson, 1975). While some research suggests young children rely heavily on cultural
cues (e.g., hair length) to accurately categorize on the basis of sex (Thompson & Bentler,
1971), others argue humans can perform these categorizations without such cues by their
first birthday (Leinbach & Fagot, 1993). Further, Wild et al. (2000) demonstrated
children as young as seven years old can detect structural differences between faces of
men and women. Collectively, it seems apparent that young children are remarkably

6
perceptive of sex categories, which some argue are among the most salient characteristics
gleaned from faces (McGraw, Durm, & Durnam, 1988).
Marsha Weinraub and her colleagues (1984) explored gender labeling in a sample
of 71 children between the ages of 24 and 38 months. Two types of gender labeling tasks
were used: one verbal and one non-verbal. In the non-verbal task, children were asked to
sort eight (presumably real, though not overtly stated in the report) pictures of adult men,
adult women, boys, and girls (two of each) into one of two boxes. The experimenter
placed one exemplar picture of a girl/woman on one box and one exemplar picture of a
boy/man on the other box. S/he then explained to the participant one was “for men and
boys” and the other was “for ladies and girls.” The experimenter showed the children one
of eight pictures at a time and instructed them to “put it in the box where it goes.”
In the verbal task, children were shown the same eight pictures and were asked
“Who is this? What type of person is this?” Any common gender label (e.g., “girl” or
“mom”) was considered an acceptable response. Children were scored as successful in
each task if seven out of eight pictures were sorted/labeled correctly. Three age groups
were compared in the analyses: 24 to 27.5 months, 29 to 33 months, and 34 to 38 months.
The majority of children could successfully assign verbal labels to pictures irrespective of
age. Interestingly, while some children in each age group could categorize pictures non-
verbally, the oldest group was the only one in which the majority of children accurately
sorted pictures non-verbally. This finding suggests an increase in non-verbal sex
categorization skills over the third and fourth years of life.
In addition to facial emotion expression and sex, race is also an important social
characteristic used in children’s categorizations during the early childhood years.

7
Preschool-age children develop a heightened awareness of race categories (Aboud, 1988).
Some research has shown young children rely heavily on physiognomy (e.g., hair texture)
in the formation of race categories (Sorce, 1979), while others believe skin color is of
particular importance in children’s understanding of race (Balas, Peissig, & Moulson,
2015; Dunham, Stepanova, Dotsch, & Todorov, 2015). In both cases, children can clearly
perceive visually-distinct racial features and use them in their categorizations of others.
For example, Dunham et al. (2015) conducted a study with 76 children between 4
and 9 years old (M = 6.9 years) and 54 adults to explore the relative importance of skin
color and physiognomy in children’s and adults’ racial categorizations. For this review, I
will focus only on the child version of the task. Fifty computer-generated pictures of
faces were used, which were representative of two continua: one characterized by equal
interval changes in skin color (from light to dark) and the other characterized by
comparable alterations in physiognomy (from prototypically Eurocentric to prototypically
Afrocentric features). One prototypical White face and one prototypical Black face were
displayed on either side of a computer screen as reference points. Participants were
shown one of fifty pictures at a time and instructed to place the pictures “where they
belong” on a line from one reference picture to the other.
Prior to completing the task, children were coached on where to place pictures on
the basis of how close they were to “perfect matches” with one of the two reference
pictures. The authors found children used skin color as a sorting criterion far more than
physiognomy with only slightly higher use of physiognomy among older children. The
use of Eurocentric and Afrocentric features to categorize faces was virtually absent
among children who had not yet entered elementary school (i.e., preschoolers; Dunham et

8
al., 2015). Although this distinction is not the topic of inquiry in the current study, it is
interesting to note preschoolers will categorize faces within a fairly wide range of skin
colors as belonging to the same group, regardless of structural differences.
Towards a Competing Facial Stimuli Task
Much of the reviewed childhood categorization literature has at least two things in
common. First, there is a tendency to explore young children’s capacity to categorize
faces by isolating specific facial characteristics (e.g., emotion expressions) while
controlling for all others (e.g., sex, race, age). This body of literature has provided
invaluable insights as to when children can categorize by the given characteristic, but it
says little about how they cognitively organize these characteristics and use them in
ecologically-valid contexts. It seems the next logical step in expanding this literature is to
develop studies to explore how children use multiple facial characteristics simultaneously
presented (i.e., on a single face) in their categorizations (Pauker, Williams, & Steele,
2016). One of the primary goals of the current study is to introduce a new measurement
tool that assesses facial categorization of simultaneously competing characteristics.
Second, there is a tendency in this literature to use computer-generated or cartoon
faces, although there are exceptions (Thompson, 1975; McGraw et al., 1988). The
rationale for artificial faces is to minimize the risk of incidental differences between faces
having unintentional influences on children’s categorizations. However, while there are
clear advantages to this methodological choice, there are also disadvantages. Children are
capable of differentiating animate and inanimate objects from a very young age (Gelman
& Spelke, 1983) and recent research has shown that typically-developing children do not
process cartoon faces and pictures of real faces in the same manner (Rosset et al., 2010).

9
Further, artificial pictures often accentuate categorical differences beyond what children
are likely to experience in their day-to-day lives (Dunham et al., 2015), which in and of
itself may invalidate their use for the same reason they are often used (i.e., children may
select features because of the emphasis in the artificial face, which would invalidate the
findings). Because of these things, it should not be assumed the ways children distinguish
artificial faces are the same ways they distinguish real faces.
It is not unreasonable to suspect that pictures of real faces might have too much
incidental variation potentially influencing children’s categorization behaviors. For
example, the use of real pictures makes it difficult to account for subtle differences in
characteristics with clear continua, such as skin color (light brown, dark brown, darker
brown) or facial emotion expression (very sad, sad, somewhat sad). That said, there are
theoretical bases and empirical evidence from the field of categorical perception to
suggest these differences might be inconsequential. Research in the field of categorical
perception provides a useful model for understanding the cognitive processes involved in
sorting information from the world based on the interaction between advanced conceptual
knowledge and the inborn human perceptual system (Goldstone & Hendrickson, 2010).
Categorical perception explains why people tend to process information more
efficiently when stimuli are conceptually distinct (e.g., happy facial expression vs. sad
facial expression) compared to stimuli characterized by perceptually subtle within-
category differences (e.g., varying gradients of happy facial expressions). Indeed, there is
considerable evidence to suggest people learn to collapse minute, within-category
differences into a single category, while conceptually separating between-category
differences (Harnad, 2003). The categorical perception phenomenon has been observed in

10
studies exploring facial expressions of emotion (Calder et al., 1996; Chael & Rutherford,
2011; Etkoff & Magee, 1992; Pollak & Kistler, 2002), race (Levin & Angelone, 2002),
and sex (Bülthoff & Newell, 2004), among other social characteristics. Altogether, these
findings in addition to the clear ecological benefits resulted in the decision to use pictures
of real faces in the current study.
To the best of my knowledge, there has been only one peer-reviewed publication
in the last thirty years that has attempted to explore the relative saliency of various facial
features among preschoolers using pictures of real faces. McGraw, Durm, and Durnam
(1988) conducted a study with 69 children between the ages of 2.83 and 6.78 years (M =
4.62 years) to explore the ways young children described photographs that varied on age
(young, old), sex (male, female), race (Black, White), and the presence or absence of
glasses. To assess the relative salience of these four characteristics, the researchers
presented pairs of “maximally contrasted” (p. 253) photographs to children. For example,
a picture of a young White girl with glasses would be paired with an old Black man
without glasses. For every picture pair, one of the photographs was denoted by a star and
children were asked “Which picture has the star?”
The authors found significant evidence in support of a “salience hierarchy” (p.
263) with sex as most salient followed by race, age, and finally glass wearing. While a
compelling finding, it is possible the methodology used in the study highlights only one
dimension of categorization behavior. That is, by asking children to use a verbal label to
describe the photographs, the authors may have unintentionally restricted the responses
children were able to provide. It is plausible that young children are more familiar with
the verbal labels for sex groups compared to other features. For example, while
11
preschoolers frequently and accurately use sex labels (Zosuls et al., 2009), they may not
have readily available access to verbal labels for facial emotion expressions and therefore
may not freely produce these labels (Widen & Russell, 2003). To avoid this limitation,
children in the current study will not be required to articulate category labels verbally.
Instead, they will be asked to select a response by pointing to a picture.
The Current Study
The current study builds upon early childhood categorization literature by
investigating the relative salience of facial stimuli and examining how preschool children
respond to facial categorization features when presented simultaneously and in
competition. Additionally, I explored the influence of adult instruction to "choose the one
that's most different" on changes in how children select pictures based on facial features
of real faces compared to spontaneous selection of pictures (i.e., "choose one”).
Research Questions
An author-created task was developed (See Method for more details) in order to
address the three central questions of this study: (a) Can a computerized picture selection
task using photographs of real faces identify non-random, category-based selection
patterns? (b) If so, what is the relative salience of race, sex, and emotion expression as
categories used in preschoolers’ processing of faces? (c) Are there individual and
situational factors that help explain and predict the relative salience of these facial
features? The following hypotheses are suggested to provide a framework for interpreting
findings.

12
Hypotheses
The first research question highlights two of this study's unique characteristics.
First, pictures of real faces are utilized in the task. Although this decision may be a point
of contention for some (see previous discussion in Literature Review), detection of
salient social categories using real photographs has been reliably achieved in previous
work (Thompson, 1975; McGraw et al., 1988). Second, the author-created task used in
this study requires only that children select pictures of faces, rather than physically
sorting them or manipulating them in some other manner. This methodological decision
was purposefully made to increase usability of the task by minimizing verbal instruction
and comprehension by the young participants. I hypothesize that through this task
children will reveal non-random patterns of picture selections by selecting pictures
within-condition based primarily (i.e., at a rate above chance) on competing stimuli.
To address the second and third research questions, two competing hypotheses are
offered: (a) a generalized salience hierarchy (GSH) hypothesis and (b) a multiple salience
hierarchy (MSH) hypothesis. The GSH hypothesis suggests the existence of an invariant,
universal rank order of facial stimuli salience among preschoolers. Support for this
hypothesis will come from data indicating the same clear and discernable rank order of
social stimuli across children (i.e., all participants show the same rank order of stimuli)
regardless of instructions given by the experimenter. The MSH hypothesis suggests there
may be several distinct hierarchies attributable to sample demographics that will differ by
task demands (i.e., type of adult instruction). Support for this hypothesis will come from
data revealing distinct hierarchies for sub-groups of the sample (e.g., boys vs. girls) or
between the two versions of adult instruction.

13
CHAPTER 3: METHODOLOGY
Method
Sampling and Participants
A convenience sample of 44 preschoolers (46% female) between the ages of 2.76
and 5.45 years (M-age = 4.09 years) was recruited from three mixed-aged preschool
classrooms in a university-affiliated childcare provider located in the Midwest. Parent
consent forms were distributed through children’s classroom folders with permission
from the childcare provider’s director. No more than two attempts were made to receive
parent consent.
Three children for whom consent was received were unable or unwilling to
complete the task. One child was non-English speaking and a second had language
development delays. These two children did not communicate (verbally or non-verbally)
a desire or willingness to participate on the three separate occasions they were asked. The
third child was asked to participate on three separate occasions and declined each request.
This child was newly enrolled in the childcare center and was described as shy and timid
by classroom teachers. No more than three attempts were made per University IRB
guidelines. The final sample consisted of 41 children. Twenty-three children were
identified as White, eleven were identified as Asian, five were identified as Hispanic, and
two were identified as African American. All participating children received a small toy
after completing the task.

14
Procedure and Measures
Overview. All data were collected in one of two on-site assessment rooms located
in the childcare provider. Both rooms were furnished with a child-sized table and chairs.
The surrounding walls were draped with black curtains to minimize distractions. Data
were collected during two sessions for all participants. The first and second sessions of
data collection were separated by a 2 to 3 week period. The Choose-A-Picture task,
which is described fully below, was completed on a touch-screen convertible laptop
(ASUS Tai Chi 21-DH71 11-Inch) to control task delivery and to automatize data
collection. The device was folded to ensure children only had access to the touch-screen.
Children were seated in a chair adjacent to the experimenter and positioned
approximately 16-inches from the touch-screen device. The experimenter placed one
hand on the back of the device to ensure it stayed in an upright position for the duration
of the task. The task lasted no longer than 12 minutes.
Choose-A-Picture task. The Choose-A-Picture (CAP) task was developed by the
author to explore the relative salience of race (Black, White), emotion expression (happy,
sad), and sex (boy, girl) using pictures of 168 different children’s faces. As previously
noted, the decision to use pictures of real children's faces, rather than cartoon or
computer-generated faces, was made for ecological validity. Compared to pictures of
cartoon or computer generated faces, pictures of real children's faces are used by children
during their daily lives to extract and understand features that discriminate between
people.
All pictures of children's faces used in the task were acquired through publically
available databases. Photo-editing software was used to isolate just the faces (with hair)

15
and crop out all other parts of the original photographs. Pictures were then adjusted to
have identical dimensions (1.3 inch width by 1.5 inch height) and resolutions (300 pixels
per inch) to minimize unintentional differences between faces. Finally, the cropped faces
were placed on a white background to match the color of the screen. Each of the two
versions of the task consisted of 24 computer-generated items (eight per three conditions)
containing three pictures arranged horizontally on the screen and centered vertically and
horizontally.
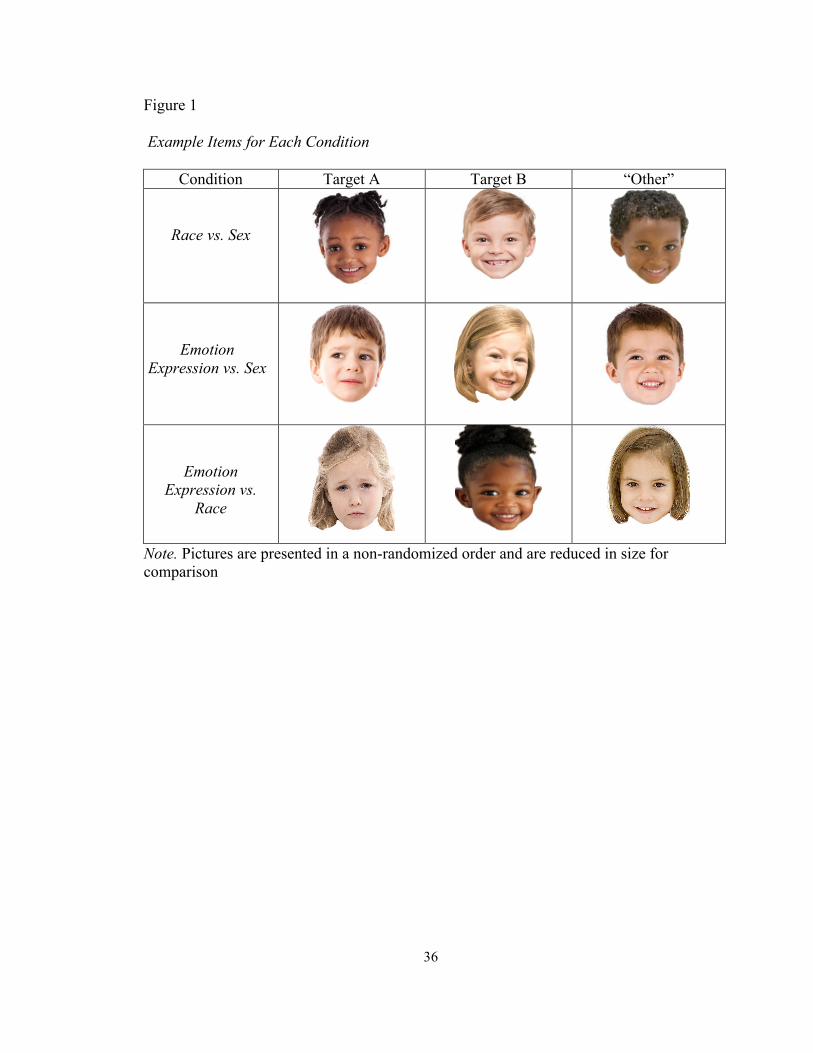
Three conditions of competing stimuli were created for the task: (a) sex vs. race,
(b) sex vs. emotion expression, and (c) race vs. emotion expression. Each condition
consisted of eight of the 24 task items. As depicted in Figure 1, the characteristic not
competing for each item was held constant; that is, for sex vs. race items, emotion
expression was held constant; for sex vs. emotion expression items, race was held
constant; and for race vs. emotion expression items, sex was held constant.
Additionally, of the three pictures displayed for any given item, one picture shares
exactly one salient feature with the other two pictures. For example, an item for race vs.
sex condition might consist of two pictures of boys' faces and one picture of a girl's face,
all of whom have the same emotion expression (i.e., all happy and smiling or all sad and
frowning). In this example item, which is depicted in the first row of Figure 1, the two
boys differed in race (i.e., one Black boy, one White boy), while the girl is highly similar
to one of the boys' race (i.e., Black girl). For this example item, selection of the White
boy would suggest race is more salient than sex, selection of the Black girl would suggest
sex is more salient than race, and selection of the Black boy would suggest the participant
selected based on some other unobvious criteria, such as another feature of the pictures
16
(e.g., hair style, similarity to a friend) or a non-picture-based criteria, such as location on
the screen (e.g., selecting all pictures on the left).
Two versions of the task were created for the current study. In the first version,
children were instructed to “Look at all three faces and then choose one.” In the second
version, the instruction was slightly altered to “Look at all three faces and then choose the
one that is most different.” Both versions were included in the present study to explore
whether or not providing categorization criteria (i.e., “most different”) would influence
selection behaviors. In both versions of the task, the experimenter demonstrated that to
“choose one” children must touch the picture on the screen with their fingers. The
instruction was delivered before the pre-trial item, again before the first test trial item,
and repeated every four subsequent items for a total of seven times during each version.
Only one version was completed during each session. Version order was
randomly selected for the first data collection session. The version not completed during
session one was completed during session two. For each item, condition (sex vs. emotion
expression, sex vs. race, emotion expression vs. race), picture selection (from available
pictures not previously displayed), and picture order on screen (left, center, right) were all
randomized by the computer as each participant completed the task. One pre-trial item
with unrelated pictures was used to help children learn how to complete the task.
Demographic information. Children’s age, sex, race/ethnicity, and classroom
were included as independent variables in the current study. Age was treated as a
continuous variable and was calculated as the amount of time elapsed between date of
birth and date of first data collection session. Sex was coded as boy or girl. Due to the
small sample size, teacher-reported race/ethnicity was coded as white or racial/ethnic

17
minority based on the race/ethnicity variance in the current sample. Finally, a 3-level
nominal classroom variable was created to indicate the classroom to which participants
were enrolled.
Outcome measures. The software developed for the task was designed to capture
response times at the item level. Unique timestamps were created at the exact moment a
new item appeared on the screen and again when a picture was selected. Item-level
response times were calculated by subtracting the picture selection timestamp from the
item display timestamp. Six mean response times were created for each participant by
taking the average response time for every condition (3) by version (2) pairing.
Next, participants’ picture selection patterns were classified as either random or
non-random. As previously described, each condition consisted of eight items.
Participants’ selection patterns were coded as non-random if four or more pictures (at
least 50%) were selected on the basis of one of the two target stimuli or the third “other”
stimulus in a given condition. Any 3-3-2-selection pattern was coded as random. For
example, if a participant selected three pictures based on race, three based on sex, and
two based on “other” in the race vs. sex condition, the pattern (3-3-2) would indicate
behavior as close to chance as the task allows.
Finally, participants whose scores were coded as non-random for a given
condition were then classified into one of three preference categories based on the
stimulus most commonly used for picture selections (i.e., target stimulus A, target
stimulus B, or “other”). A fourth “split preference” was considered for the possibility of a
4-4-0 pattern (e.g., four sex, four race, zero other) but this pattern did not exist in the
current study.

18
CHAPTER 4: RESULTS
Data Analysis Overview
Data analyses are organized into three sections. The first set of analyses explored
the random and non-random selection during the task. The second set of analyses
explored picture selection tendencies by comparing conditions to identify the relative
salience of sex, emotion expression, and race. The third set of analyses explored if child-
level (e.g., age) and task-related (e.g., instruction type) variables were related to stimulus
preferences (e.g., tendency to select race in the sex vs. race condition).
Random and Non-Random Selection
The first goal was to explore the random and non-random selection during the
task before attempting to analyze and report participants’ behaviors. Random picture
selection is likely to indicate disengagement with the task (e.g., selecting without looking
at pictures), while non-random picture selection is likely to indicate engagement in the
task (e.g., selecting based on a given criteria). Basic descriptive statistics of stimuli
preference variables for each condition of each instruction type (version) are reported in
Table 1. As shown, similar proportions of non-random selection patterns were found
across condition and instruction types.
For the version of the task with the instruction to “Look at all three faces and then
choose one,” 32 of 41 participants (78.1%) demonstrated non-random selection patterns
for the emotion expression vs. race and emotion expression vs. sex conditions. Further,
28 of 41 participants (68.3%) produced non-random selection patterns for the race vs. sex
condition in the same version. For the version of the task with the instruction to “Look at
all three faces and then choose the one that is most different,” 30 of 41 participants

19
(73.2%) demonstrated non-random selections in the emotion expression vs. race
condition, and 32 of 41 participants (78.1%) selected pictures non-randomly in both the
emotion expression vs. sex and face vs. sex conditions. These results provide support for
the first hypothesis. Well over 50% of participants were identified as using non-random
selection patterns in each condition.
Follow-up analyses were conducted to test two potential explanations for random
selection patterns. First, it was reasoned that children who appeared to select pictures
randomly might be identified by markedly faster reaction times. This explanation
followed the logic that some children might have been selecting faces too quickly to
complete the task with purposeful engagement. Second, it was reasoned that children
were selecting pictures on the basis of location (e.g., all left) rather than using facial
information. To explore this explanation, a binary selected location (random, non-
random) variable was calculated using the same formula as the stimuli preference
computations.
A series of binary logistic regression models were used to explore if reaction time
or selected picture location predicted participants’ classification as random or non-
random picture selectors for each condition within each version. Interestingly, reaction
time and selected location were not significant predictors of participant randomness
indicating that neither hypothesis explaining these random selections was supported.
Other possible explanations for why children used random selection are offered in the
discussion section. Unfortunately, these other possible explanations cannot be explored
using the collected data.

20
Because children who selected pictures at random did not focus on the salient
features of the task, exploration of their selection patterns for preference of target features
is impossible. Therefore, subsequent analyses will only include participants with non-
random selection patterns.
Assessing Relative Salience
After identifying children who used non-random selection patterns, the next step
was to address the second research question: What is the relative salience of race, sex,
and emotion expression as categories used in preschoolers’ processing of faces? The
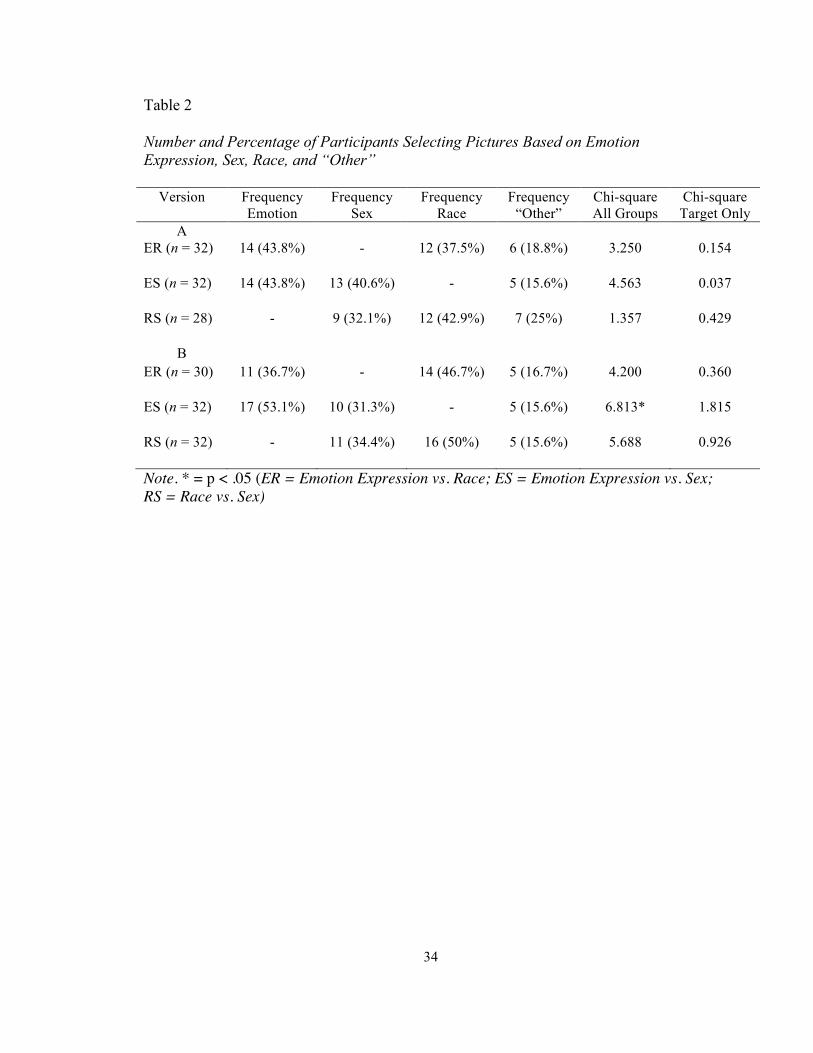
frequencies of non-random picture selection patterns within conditions and across
versions are reported in Table 2. Chi-square statistics are also reported for all preference
groups (i.e., target A, target B, and “other”) and for competing stimuli preferences (i.e.,
target A or target B) for each condition and version.
Only the emotion expression vs. sex condition for the version with instruction to
“choose the one that is most different” yielded a significant chi-square statistic, x2 (2, N=
32) = 6.813, p < 0.05. This finding indicates significant differences in the number
children with patterns selected on the basis of emotion expression, sex, and the non-target
stimulus. However, when assessing only differences between the two target variables
(emotion expression, sex), there was no significant finding, x2 (1, N =27) = 0.178, p =
0.178.
Despite limited statistical support, visual inspections of the data indicate version-
specific patterns as well as some tentative information about relative salience. For
instance, in the first version of the task (“choose one"), there was a relatively even
distribution of selection patterns across the two target variables in each condition. That is

21
to say, there did not appear to be an apparent salience hierarchy, only that the systematic
selection of target variables was far more common than systematic selection of the non-
target variable in each condition. However, in the second version (“choose the one that is
most different”), the percent spread in target variable selections became more pronounced
for every condition and especially the emotion expression vs. sex condition.
In the emotion expression vs. race condition, the percent-spread in target selection
patterns in the second version (10%) was higher than the first version (6.3%) by a modest
margin of 3.7%. Similarly, the percent-spread was 4.8% greater in the second version
(15.6%) of the race vs. sex condition compared to the first version (10.8%). Interestingly,
there is a noticeably wide margin in the percent-spread of target selection patterns in the
emotion expression vs. sex condition. Although the rank order was identical across
conditions, emotion expression was the basis for 21.8% more patterned selections than
sex in second version, while in first version, this percent difference was only 3.2%. This
finding, in particular, suggests using the word “different” in the task instructions (second
version) can result in noticeable changes in children’s picture selection processes.
In terms of sheer numbers, patterns based on sex were the least common of the
target variables across both versions and relevant conditions. In all but one instance
(Emotion Expression vs. Race - Version B), emotion expression was the basis for the
greatest number of selection patterns. Inversely, race was responsible for the majority of
selection patterns in every relevant condition with the exception of Emotion Expression
vs. Race - Version A. Together, these findings seem to indicate sex is the least salient of
the three target stimuli, while the relative salience of race and emotion expression
depends on the nature of the categorization task at hand. This finding provides

22
preliminary support for the multiple salience hierarchy hypothesis, but it is important to
note these findings should be interpreted tentatively. Finally, although not the subject of
the current study, it is interesting to note that some children (for whom systematic
patterns were identified) based their picture selections on the non-target variable. Possible
explanations for this finding are included in the discussion.
Predictors of Stimuli Preferences
The final set of analyses was used to answer the third research question: Are there
individual and situational factors that help explain and predict the relative salience of
race, sex, and emotion expression? Due to the unexpected finding that some children
systematically selected faces characterized by the non-target variable across conditions,
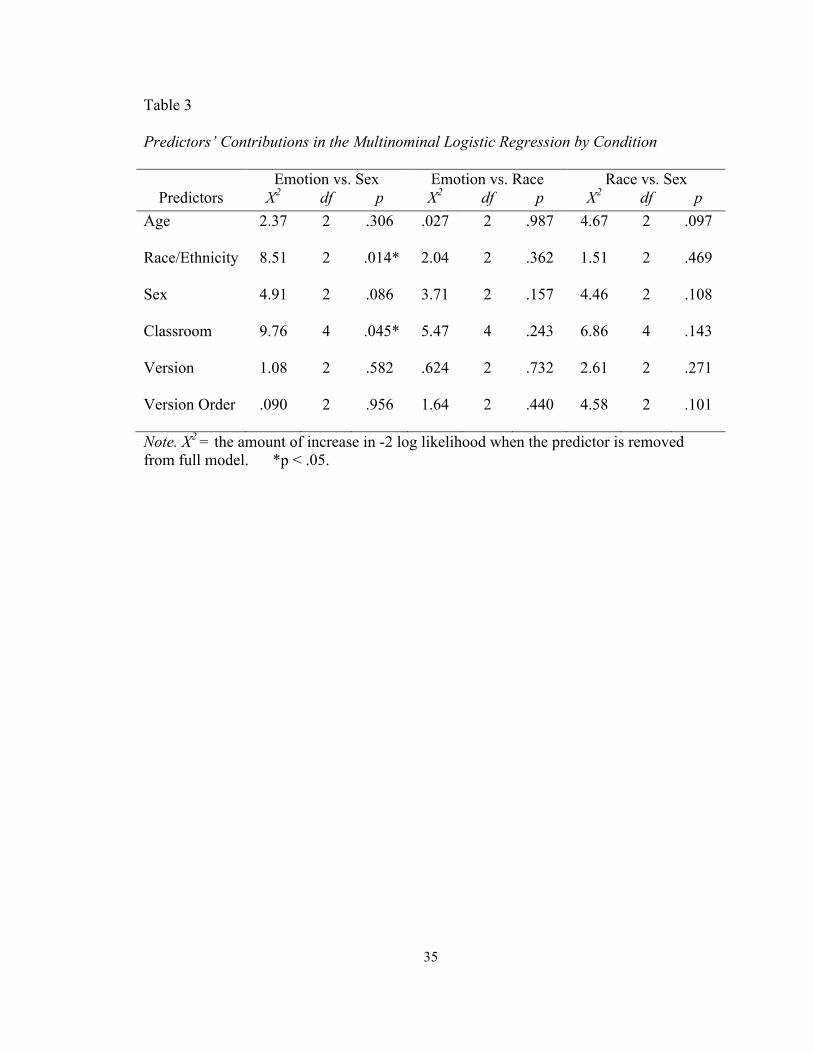
“other” was included as a third preference group for each condition. Multinominal
logistic regression models were used to identify predictors of stimulus preference groups
for each condition. Version (A or B), task order (i.e., which version children completed
first) and participant age, sex, race/ethnicity, and classroom were included in each model.
Results for likelihood ratio tests are presented in Table 3.
The emotion expression vs. sex condition was the only instance in which
predictor variables were statistically significant, however, the overall model did not fit
the data better than the model including only the intercept, x2 (14, N = 64) = 21.728, p =
0.084. To improve fit, the model was reduced to exclude version and version order as
these two variables contributed the least to the overall model. The final model included
only age, race/ethnicity, sex, and classroom, resulting in significantly improved fit to the
data, x2 (10, N = 64) = 20.596, Nagelkerke R2 = 0.317, p = 0.024. Hosmer-Lemeshow

23
tests were conducted to assess goodness of fit of the final model and were not statistically
significant, indicating good fit between predictors in the final model and the data.
The group of children with an emotion expression preference were used as the
reference group for comparing parameter estimates. Only the race/ethnicity parameter
estimate was significant. Interestingly, White participants were 20.62 times more likely to
belong in the "other" preference group than the emotion expression preference group,
compared to non-White children.
Additional models were conducted for both the emotion expression vs. race and
race vs. sex conditions. While no combination of predictors resulted in statistical
significance for the emotion expression vs. race models, dropping race/ethnicity from the
race vs. sex condition model resulted in significant predictors and improved model fit.
The best-fitting model for race vs. sex condition included version, version order, age, sex,
and classroom, and the model including predictors was better fit to the data than the
model including only the intercept, x2 (12, N = 60) = 22.688, Nagelkerke R2 = 0.359, p =
0.030. Similarly to the emotion expression vs. sex condition model, Hosmer-Lemeshow
tests were not significant.
Children with a race preference were used as the comparison group in the final
model. Age was the only predictor with a statistically significant parameter estimate. For
each standard deviation increase in age (0.646 years), the odds of being in the sex
preference group increased multiplicatively by 4.077. In other words, the likelihood of
sex being a more salient facial feature than race increases as children get older.

24
CHAPTER 5: DISCUSSION
The purpose of the current study was to test a new competing facial stimuli
categorization task, to explore the relative salience of sex, race, and emotion expression
categories among preschoolers, and to examine how child characteristics and adult
instructions relate to preschoolers’ categorization patterns. Previous work in the field of
childhood facial categorization provides a strong foundation for identifying social
categories that are meaningful to young children. The current study builds upon previous
literature by integrating several important social categories identified by other studies
into a single task by presenting these characteristics simultaneously as competing stimuli.
One important contribution of the current task was the use of the competing
stimuli approach because it provides a comprehensive and generalizable understanding
for how preschoolers process facial stimuli in real-world situations. That is, it is more
likely for children to encounter individuals with multiple characteristic differences (e.g.,
happy boy, sad girl) rather than only a single, one characteristic difference (e.g., happy
boy, happy girl). Although a discernable stimuli salience hierarchy was not revealed in
the current study, findings from the task did highlight at least one additional benefit of
using a competing stimuli approach: young children continue to use sex, race, and
emotion expression categories above and beyond “other” facial stimuli (e.g., eye size or
color), even when presented in various combinations (e.g., sex and race or race and
emotion expression in a single item).
For the majority of trials, a clear systematic pattern of selection was attributable to
target facial features (i.e., sex, race, emotion expression). This finding affirmed the
decision to use real (rather than artificial) faces. Target facial features remained salient to
25
children despite uncontrolled "other" differences, such as hair style, skin tone, eye color,
or smile intensity. These preliminary findings suggest that children do indeed group
other children based on broad categories rather than subtle differences as suggested by
the categorical perception literature (Calder et al., 1996; Chael & Rutherford, 2011).
A second noteworthy contribution of the current study was the inclusion of both
the spontaneous (choose one) and externally imposed (choose the one that’s most
different) versions of the task. Many of the studies in the child categorization literature
explore how children categorize faces in response to the conditions imposed upon them
by adults. This externally imposed approach likely influences how children perform
categorization tasks and does not necessarily represent how children process facial
stimuli in a more spontaneous and natural settings. For example, in Chael and
Rutherford’s (1988) facial emotion categorization task, 3.5-year-olds were instructed to
describe if pictures “felt the same” or “felt different.” While this instruction might appear
simple to adults, it might be a relatively sophisticated and cognitively demanding task for
young children because it requires them to understand and process several pieces of
information simultaneously (i.e., two pictures of faces and the words “felt,” “same,” and
“different).
Although the findings were not statistically significant, there is some evidence to
suggest the simple addition of the word “different” in the instructions changed the way
some children completed the task. This externally imposed version of the task seemed to
produce a greater divide in the stimuli children selected compared to the spontaneous
version. In the spontaneous task, the number of children who selected pictures based on
one of the two target variables was virtually identical and never exceeded a three

26
participant difference. In contrast, when instructed to use the word “different” as a
categorization criteria, there was as high as a seven participant (21.8%) difference in
stimuli preferences. This finding can help inform future work with young children within
and beyond the field of categorization.
In a more applied sense, subtle changes in the way adults instruct children to
perform a task may cause children to approach social stimuli in a markedly different way
than they do spontaneously. Although categorization, to adults, might tacitly imply
noticing differences between stimuli, it is possible children do not approach social
categorization with this mindset. Instead, there could be other unobvious criteria young
children use (implicitly and/or intentionally) to categorize objects in their environment, or
in this case, faces of people. Adults who interact with young children should be mindful
of the language they use around young children, as it likely shapes the ways they perceive
their social world. Future work with the Choose A Picture task will include new
categorization criteria (e.g., “choose the picture you like most”) to explore how various
adult instructions shape the ways children think and behave.
One unanticipated finding of the current study was the presence of a small
number of children who systematically selected the "other" (non-target) variable in each
condition. There are at least two explanations for this finding. First, it is possible these
patterns represent a mere coincidence. The working definition for “non-random” in the
current study was the presence of a target, or in this case non-target, stimulus being
selected in at least 50% of the trials in a given condition. It is possible these children (and
potentially others) were selecting pictures on the basis of some unknown feature or
simply at random, and happened to choose four or more of the "other" stimulus.

27
However, it is also possible some or all of these children represent a subset of the sample
that is demonstrating highly sophisticated categorizations. In other words, these children
may be noticing the two target stimuli and intentionally choosing "other" because it
shares one category with each of the other two. Future work implementing this task with
larger and more diverse samples will attempt to further explain this phenomenon.
There were several limitations of the current study. First, a small and relatively
homogenous convenience sample was used. As such, the findings of the study should
only be tentatively generalized to other populations of preschoolers. The decision to use a
convenience sample was made because it was unknown whether or not the task would be
an effective tool worth implementing at a larger scale. With only 41 participants, the
statistical analyses conducted in the current study were likely underpowered and
therefore unable to identify potential effects. The task does, however, appear to function
well and will be used to conduct more rigorous studies in the future.
A second limitation was the inability to explain (statically) why the task did not
work as intended for some of the participants, both in terms of non-systematic (i.e.,
random) picture selection, and systematic selection of non-target stimuli. Neither
reaction times (indicative of hasty picture selection) nor selected location (e.g.,
systematically choosing left) explained random picture selections. These null findings are
likely explained by a combination of small sample size and the fact that these were not
always the same participants. As previously described, systematic selection of “other”
might represent a unique (or coincidental) pattern of selection, and future research should
consider this population of children a priori.

28
Finally, the current study did not identify a salience hierarchy as hoped and,
consequentially, it was difficult to find predictors that provided meaningful explanations
for the relative salience of the sex, race, and emotion expression of faces. Indeed, the
current study was only used to examine two dimensions of context (i.e., competing
stimuli and spontaneous- vs. externally imposed) and the roles of other contextual factors,
such as previous social experiences, interactions, and environments, should be given
more rigorous thought and attention (Pauker et al., 2015). Future research with this task
will benefit from a more thorough investigation of environmental influences (e.g.,
neighborhood characteristics, home and school environments) that might explain and
predict the relative salience of facial stimuli. Nevertheless, the current study did identify
systematic patterns explained by sex, race, and emotion expression categories using a
relatively small sample of children and only requiring them to select pictures of faces.
The simplicity of the task, its ease of implementation, and its overall effectiveness
warrant its continued use (with these and other stimuli) with larger and more diverse
samples.

29
References
Aboud, F. E. (1988). Children and Prejudice. New York: Basil Blackwell
Balas, B., Peissig, J., & Moulson, M. (2015). Children (but not adults) judge similarity in
own-and other-race faces by the color of their skin. Journal of Experimental Child
Psychology, 130, 56-66.
Bartrip, J., Morton, J., & Schonen, S. (2001). Responses to mother's face in 3-week to
month-old infants. British Journal of Developmental Psychology, 19(2), 219-232.
Bülthoff, I., & Newell, F. (2004). Categorical perception of sex occurs in familiar but not
unfamiliar faces. Visual Cognition, 11(7), 823-855.
Calder, A. J., Young, A. W., Perrett, D. I., Etcoff, N. L., & Rowland, D. (1996).
Categorical perception of morphed facial expressions. Visual Cognition, 3(2), 81-
118.
Caron, R. F., Caron, A. J., & Myers, R. S. (1985). Do infants see emotional expressions
in static faces?. Child Development, 1552-1560.
Chael, J. L., & Rutherford, M.D. (2011). Categorical perception of emotional facial
expressions in preschoolers. Journal of Experimental Child Psychology, 110(3),
434-443.
de Heering, A., Houthuys, S., & Rossion, B. (2007). Holistic face processing is mature at
4 years of age: Evidence from the composite face effect. Journal of Experimental
Child Psychology, 96(1), 57-70.
Dunham, Y., Stepanova, E. V., Dotsch, R., ^ Todorov, A. (2015) The development of
race-based perceptual categorization: Skin color dominates early category
judgments. Development Science, 18(3), 469-483.
30
Etcoff, N. L., & Magee, J. J. (1992). Categorical perception of facial expressions.
Cognition, 44(3), 227-240.
Gelman, R., Spelke, E. S., & Meck, E. (1983). What preschoolers know about animate
and inanimate objects. In The acquisition of symbolic skills (pp. 297-326).
Springer US.
Goldstone, R. L., & Hendrickson, A. T. (2010). Categorical perception. Wiley
Interdisciplinary Reviews: Cognitive Science, 1(1), 69-78.
Harnad, S. (2003) Categorical Perception. Encyclopedia of Cognitive Science. Nature
Publishing Group/Macmillan.
Hogg, M. A. (2001). Social categorization, depersonalization, and group
behavior. Blackwell handbook of social psychology: Group processes, 4, 56-85.
Kelly, D. J., Quinn, P. C., Slater, A. M., Lee, K., Ge, L., & Pascalis, O. (2007). The
other-race effect develops during infancy evidence of perceptual narrowing.
Psychological Science, 18(12), 1084-1089.
LaBarbera, J. D., Izard, C. E., Vietze, P., & Parisi, S. A. (1976). Four-and six-month-old
infants' visual responses to joy, anger, and neutral expressions. Child
Development, 535-538.
Leinbach, M. D., & Fagot, B. I. (1993). Categorical habituation to male and female faces:
Gender schematic processing in infancy. Infant Behavior and Development, 16(3),
317-332.
Levin, D. T., & Angelone, B. L. (2002). Categorical perception of race, Perception,
31(5), 567-578.
McGraw, K. O., Durm, M. W., & Durnam, M. R. (1988). The relative salience of sex,

31
race, age, and glasses in children’s social perception. Journal of Genetic
Psychology, 150(3), 251-267.
Pauker, K., Williams, A., & Steele, J. R. (2016). Children’s Racial Categorization in
Context. Child Development Perspectives, 10(1), 33–38.
Pollak, S. D., & Kistler, D. J. (2002). Early experience is associated with the
development of categorical representations for facial expressions of
emotion. Proceedings of the National Academy of Sciences, 99(13), 9072-9076.
Quinn, P. C., Yahr, J., Kuhn, A., Slater, A. M., & Pascalis, O. (2002). Representation of
the gender of human faces by infants: A preference for female. Perception, 31(9),
1109-1121.
Rosset, D. B., Santos, A., Da Fonseca, D., Poinso, F., O'Connor, K., & Deruelle, C.
(2010). Do children perceive features of real and cartoon faces in the same way?
Evidence from typical development and autism. Journal of Clinical and
Experimental Neuropsychology, 32(2), 212-218.
Slater, A., Von der Schulenburg, C., Brown, E., Badenoch, M., Butterworth, G., Parsons,
S., & Samuels, C. (1998). Newborn infants prefer attractive faces. Infant Behavior
and Development, 21(2), 345-354.
Sorce, J. F. (1979). The role of physiognomy in the development of racial awareness. The
Journal of Genetic Psychology, 134(1), 33-41.
Thompson, S. K. (1975). Gender labels and early sex role development. Child
Development, 339-347.
Thompson, S. K., & Bentler, P. M. (1971). The priority of cues in sex discrimination by
children and adults. Developmental Psychology, 5(2), 181.

32
Valenza, E., Simion, F., Cassia, V. M., & Umiltà, C. (1996). Face preference at
birth. Journal of Experimental Psychology: Human Perception and
Performance, 22(4), 892.
Weinraub, M., Clemens, L. P., Sockloff, A., Ethridge, T., Gracely, E., & Myers, B.
(1984). The development of sex role stereotypes in the third year: relationships to
gender labeling, gender identity, sex-types toy preference, and family
characteristics. Child Development, 1493-1503.
Widen, S. C., & Russell, J. A. (2003). A closer look at preschoolers’ freely produced
labels for facial emotions. Developmental Psychology, 39, 114-128.
Wild, H. A., Barrett, S. E., Spence, M. J., O'Toole, A. J., Cheng, Y. D., & Brooke, J.
(2000). Recognition and sex categorization of adults' and children's faces:
Examining performance in the absence of sex-stereotyped cues. Journal of
Experimental Child Psychology, 77(4), 269-291.
Zosuls, K. M., Ruble, D. N., Tamis-LeMonda, C. S., Shrout, P. E., Bornstein, M. H., &
Greulich, F. K. (2009). The acquisition of gender labels in infancy: Implications
for gender-typed play. Developmental Psychology, 45(3), 688.

33
Table 1 Proportion of Non-Random Selection Patterns by Condition and Instruction Type
Condition Version A Version B Emotion Expression vs. Race
0.781 (0.419) n = 32 0.732 (0.449) n = 30
Emotion Expression vs. Sex
0.781 (0.419) n = 32 0.781 (0.419) n = 32
Race vs. Sex 0.683 (0.471) n = 28 0.781 (0.419) n = 32 Note. Standard deviations are reported in parentheses.
34
Table 2 Number and Percentage of Participants Selecting Pictures Based on Emotion Expression, Sex, Race, and “Other”
Version
Frequency Emotion
Frequency Sex
Frequency Race
Frequency “Other”
Chi-square All Groups
Chi-square Target Only
A ER (n = 32) 14 (43.8%) - 12 (37.5%) 6 (18.8%) 3.250 0.154
ES (n = 32) 14 (43.8%) 13 (40.6%) - 5 (15.6%) 4.563 0.037
RS (n = 28) - 9 (32.1%) 12 (42.9%) 7 (25%) 1.357 0.429
B
ER (n = 30) 11 (36.7%) - 14 (46.7%) 5 (16.7%) 4.200 0.360
ES (n = 32) 17 (53.1%) 10 (31.3%) - 5 (15.6%) 6.813* 1.815
RS (n = 32) - 11 (34.4%) 16 (50%) 5 (15.6%) 5.688 0.926
Note. * = p < .05 (ER = Emotion Expression vs. Race; ES = Emotion Expression vs. Sex; RS = Race vs. Sex)
35
Table 3 Predictors’ Contributions in the Multinominal Logistic Regression by Condition Emotion vs. Sex Emotion vs. Race Race vs. Sex
Predictors X2 df p X2 df p X2 df p Age
2.37 2 .306 .027 2 .987 4.67 2 .097
Race/Ethnicity
8.51 2 .014* 2.04 2 .362 1.51 2 .469
Sex
4.91 2 .086 3.71 2 .157 4.46 2 .108
Classroom
9.76 4 .045* 5.47 4 .243 6.86 4 .143
Version
1.08 2 .582 .624 2 .732 2.61 2 .271
Version Order
.090 2 .956 1.64 2 .440 4.58 2 .101
Note. X2 = the amount of increase in -2 log likelihood when the predictor is removed from full model. *p < .05.
36
Figure 1
Example Items for Each Condition
Condition Target A Target B “Other”
Race vs. Sex
Emotion Expression vs. Sex
Emotion Expression vs.
Race
Note. Pictures are presented in a non-randomized order and are reduced in size for comparison
Related Documents