Large trends in French topsoil characteristics are revealed by spatially constrained multivariate analysis Dominique Arrouays a, ⁎, Nicolas P.A. Saby a , Jean Thioulouse b , Claudy Jolivet a , Line Boulonne a , Céline Ratié a a INRA Orléans, InfoSol Unit, US 1106, CS 40001 Ardon, 45075, Orléans cedex 2, France b Université de Lyon CNRS ; Université Lyon 1 ; CNRS UMR 5558, Biométrie et Biologie Evolutive, F-69622, Villeurbanne cedex, France abstract article info Article history: Received 12 February 2010 Received in revised form 29 October 2010 Accepted 3 December 2010 Available online 3 February 2011 Keywords: Topsoil Mapping Multivariate analysis Geostatistics France Spatially constrained multivariate analysis methods (MULTISPATI-PCA) and classical principal component analysis are applied for the entire country of France to study the main soil characteristics of topsoil and to assess if their multivariate spatial pattern can provide insight on their extent and origin. The results of the MULTSPATI-PCA provided evidence of strong spatial structures attributed to different natural processes. The first axis was interpreted as an axis of global soil richness in clay content. Axis 2 reflected the influence of some parent materials on the geochemical content of K and Al. Axis 3 showed a very large gradient of relative content in coarse silt. Axis 4 was driven by gradients of maritime influence. We show that MULTISPATI-PCA allows better than classical PCA to detect and map large regional trends in the distribution of topsoil characteristics. The two first axes were expected and the maps obtained by both methods were consistent. Interestingly, the other gradients were not expected and were better shown by MULTISPATI-PCA than by classical PCA. © 2010 Elsevier B.V. All rights reserved. 1. Introduction Topsoil characteristics in temperate Western Europe mainly depend on parent material composition, geomorphology, and past and present climatic conditions. The dominant soil processes are weathering, leaching, illuviation, and, more locally, podzolisation. Among the parent materials, loess deposits are widespread in northern France, where they are locally very thick (Antoine et al., 1998; Jamagne et al., 1981; Lautridou et al., 1986; Lebret and Lautridou, 1991). The map of the quaternary superficial formations of northwest France was updated in 1998 (Antoine et al., 1998), but it still unclear to what extent the silty aeolian sediments may have spatially influenced topsoil characteristics. In a recent study, Saby et al. (2009) showed that the distribution of some trace elements in French topsoil is strongly dependent on the geographical distribution of some specific parent materials. We assume that this dependence is also the case for some major elements. France has about 5500 km of coastline along the Mediterranean Sea, the Atlantic Ocean, and the Channel. Although atmospheric deposition in maritime environments is known to affect terrestrial ecosystems (Farrell, 1995) and soil (Zhang, 2003), to our present knowledge, no national systematic inventory has explored to what extent the coastal sea salt spray may have influenced the topsoil chemistry. The existence of a systematic sampling grid over the entire French metropolitan territory (Arrouays et al., 2002; Arrouays et al., 2003; Jolivet et al., 2006; Saby et al., 2006) offers an opportunity to tackle these general issues. We study the topsoil characteristics (particle-size distribution, total major elements, organic C and N, Ca, C, N, P, K, cation exchange capacity and exchangeable cations, and pH) to assess if their spatial distribution and correlation can provide any insight into their extent and origin. There are several statistical methods available to study the spatial covariation of variables. One is based on multivariate geostatistics (Webster and Oliver, 2007), where the joint spatial variation and covariation of two variables is expressed as a co-variogram and can be modelled with the linear model of coregionalization (LMCR). This method has been for example successfully used to determine the correlations between yield of wheat and soil nutrients (Bourennane et al., 2003; Webster et al., 1994), in exploratory analysis of trace metal concentrations in soil (Atteia et al., 1994), and to study the distribution of nematodes in soil (Webster and Boag, 1992). Unfortunately, it is strongly dependant on the goodness-of-fit (in least square sense) of the linear model of co-regionalization. Another approach consists in performing in a first step multivariate analysis like Principal Component Analysis (PCA) and to interpret the structures observed on the first few axes. A second step can be achieved by mapping the scores in geographical space or by using geostatistical tools (e.g. (Boruvka et al., 2007; Odlare et al., 2005; Oliver et al., 1997; Satapathy et al., 2009). However, standard PCA does not directly take into account spatial relations and was not specifically designed to identify spatial structures. Therefore, we use here a spatially Geoderma 161 (2011) 107–114 ⁎ Corresponding author. Tel.: +33 238414802; fax: +33 238417869. E-mail address: [email protected] (D. Arrouays). 0016-7061/$ – see front matter © 2010 Elsevier B.V. All rights reserved. doi:10.1016/j.geoderma.2010.12.002 Contents lists available at ScienceDirect Geoderma journal homepage: www.elsevier.com/locate/geoderma

Welcome message from author
This document is posted to help you gain knowledge. Please leave a comment to let me know what you think about it! Share it to your friends and learn new things together.
Transcript
Geoderma 161 (2011) 107–114
Contents lists available at ScienceDirect
Geoderma
j ourna l homepage: www.e lsev ie r.com/ locate /geoderma
Large trends in French topsoil characteristics are revealed by spatially constrainedmultivariate analysis
Dominique Arrouays a,⁎, Nicolas P.A. Saby a, Jean Thioulouse b, Claudy Jolivet a, Line Boulonne a, Céline Ratié a
a INRA Orléans, InfoSol Unit, US 1106, CS 40001 Ardon, 45075, Orléans cedex 2, Franceb Université de Lyon CNRS ; Université Lyon 1; CNRS UMR 5558, Biométrie et Biologie Evolutive, F-69622, Villeurbanne cedex, France
⁎ Corresponding author. Tel.: +33 238414802; fax: +E-mail address: [email protected]
0016-7061/$ – see front matter © 2010 Elsevier B.V. Aldoi:10.1016/j.geoderma.2010.12.002
a b s t r a c t
a r t i c l e i n f oArticle history:Received 12 February 2010Received in revised form 29 October 2010Accepted 3 December 2010Available online 3 February 2011
Keywords:TopsoilMappingMultivariate analysisGeostatisticsFrance
Spatially constrained multivariate analysis methods (MULTISPATI-PCA) and classical principal componentanalysis are applied for the entire country of France to study the main soil characteristics of topsoil and toassess if their multivariate spatial pattern can provide insight on their extent and origin. The results of theMULTSPATI-PCA provided evidence of strong spatial structures attributed to different natural processes. Thefirst axis was interpreted as an axis of global soil richness in clay content. Axis 2 reflected the influence ofsome parent materials on the geochemical content of K and Al. Axis 3 showed a very large gradient of relativecontent in coarse silt. Axis 4 was driven by gradients of maritime influence. We show that MULTISPATI-PCAallows better than classical PCA to detect and map large regional trends in the distribution of topsoilcharacteristics. The two first axes were expected and the maps obtained by both methods were consistent.Interestingly, the other gradients were not expected and were better shown by MULTISPATI-PCA than byclassical PCA.
33 238417869.(D. Arrouays).
l rights reserved.
© 2010 Elsevier B.V. All rights reserved.
1. Introduction
Topsoil characteristics in temperate Western Europe mainlydepend on parent material composition, geomorphology, and pastand present climatic conditions. The dominant soil processes areweathering, leaching, illuviation, and, more locally, podzolisation.Among the parent materials, loess deposits are widespread innorthern France, where they are locally very thick (Antoine et al.,1998; Jamagne et al., 1981; Lautridou et al., 1986; Lebret andLautridou, 1991). The map of the quaternary superficial formationsof northwest France was updated in 1998 (Antoine et al., 1998), but itstill unclear to what extent the silty aeolian sediments may havespatially influenced topsoil characteristics. In a recent study, Sabyet al. (2009) showed that the distribution of some trace elements inFrench topsoil is strongly dependent on the geographical distributionof some specific parent materials. We assume that this dependence isalso the case for some major elements. France has about 5500 km ofcoastline along the Mediterranean Sea, the Atlantic Ocean, and theChannel. Although atmospheric deposition in maritime environmentsis known to affect terrestrial ecosystems (Farrell, 1995) and soil(Zhang, 2003), to our present knowledge, no national systematicinventory has explored to what extent the coastal sea salt spray mayhave influenced the topsoil chemistry.
The existence of a systematic sampling grid over the entireFrench metropolitan territory (Arrouays et al., 2002; Arrouays et al.,2003; Jolivet et al., 2006; Saby et al., 2006) offers an opportunity totackle these general issues. We study the topsoil characteristics(particle-size distribution, total major elements, organic C and N, Ca,C, N, P, K, cation exchange capacity and exchangeable cations, andpH) to assess if their spatial distribution and correlation can provideany insight into their extent and origin. There are several statisticalmethods available to study the spatial covariation of variables. One isbased on multivariate geostatistics (Webster and Oliver, 2007),where the joint spatial variation and covariation of two variables isexpressed as a co-variogram and can be modelled with the linearmodel of coregionalization (LMCR). This method has been forexample successfully used to determine the correlations betweenyield of wheat and soil nutrients (Bourennane et al., 2003; Websteret al., 1994), in exploratory analysis of trace metal concentrations insoil (Atteia et al., 1994), and to study the distribution of nematodesin soil (Webster and Boag, 1992). Unfortunately, it is stronglydependant on the goodness-of-fit (in least square sense) of thelinear model of co-regionalization. Another approach consists inperforming in a first step multivariate analysis like PrincipalComponent Analysis (PCA) and to interpret the structures observedon the first few axes. A second step can be achieved by mapping thescores in geographical space or by using geostatistical tools (e.g.(Boruvka et al., 2007; Odlare et al., 2005; Oliver et al., 1997;Satapathy et al., 2009). However, standard PCA does not directly takeinto account spatial relations and was not specifically designed toidentify spatial structures. Therefore, we use here a spatially
108 D. Arrouays et al. / Geoderma 161 (2011) 107–114
constrained multivariate analysis method (MULTISPATI-PCA, (Drayet al., 2008), which is a generalisation of Wartenberg's (1985)Multivariate Spatial Correlation Analysis (MSCA). This technique is apurely descriptive method, based solely on linear algebra and ongeometrical properties and implies a compromise between therelationships among many variables (multivariate analysis) andtheir spatial structure (autocorrelation).
In this paper, we applied MULTISPATI-PCA to a set of topsoilcharacteristics and we compare the results to classical PCA.
2. Material and methods
2.1. Study area
The French National Soil Quality Monitoring Network, “Réseau deMesures de la Qualité des Sols” (Jolivet et al., 2006; Saby et al., 2006),consists of soil property observations on a 16-km regular gridcovering the French metropolitan territory (550,000 km²). Thisnetwork was designed to monitor soil evolutions and to identifydiffuse contamination due to either atmospheric deposition of traceelements on soils or agricultural practices (e.g., fertilisers, sludgeamendments, and inorganic pesticides). The complete inventoryconsists of around 2200 sites, but in this study, we use measurementsfrom the 2117 sites analysed at present.
The sites were selected at the centre of each 16×16 km cell. In thecase of soil being unavailable at the centre of the cell (i.e., urban area,road, river, etc.), an alternative location was selected as close aspossible to the centre of the cell, within a 1 km radius, to find a natural(undisturbed or cultivated) soil. However, it was not always possibleto find an alternative location. All land cover types were present in thedataset, except industrial sites, which were not sampled. At each site,25 individual core samples were taken from the topsoil (0–30 cm)layer, using a stratified random sampling design within a 20×20 marea. Core samples were bulked to obtain a composite sample for eachsite. Soil samples were air-dried and sieved to 2 mm before analysis(AFNOR, 1994). The topsoil was sampled from 0 to 30 cm because itcorresponds to the maximal depths affected by ploughing and is aconventional thickness often reported in France (e.g., (Arrouays et al.,2001; Arrouays et al., 2008).
The following soil characteristics were retained: (i) the totalorganic carbon content (TOC) measured by dry combustion, (ii) theparticle-size distribution using five classes [(clay (0–2 μm), fine silt
Table 1Descriptive statistics of the soil properties.
Soil properties (unit) Shortname
Mean Median 10%percentile
90%percentil
Clay (g kg−1) Clay 244.11 209.50 106.00 437.90Fine silt (g kg−1) – 227.15 230.00 103.10 352.00Coarse silt (g kg−1) coarse.silt 176.30 144.00 60.00 358.00Fine sand (g kg−1) fine.sand 134.15 115.00 40.00 244.00Coarse Sand (g kg−1) coarse.sand 218.29 145.00 16.00 521.90Organic carbon (g kg−1) carbon 25.58 19.50 9.49 48.29Total nitrogen (g kg−1) tot.N 2.14 1.72 0.85 3.85total calcium carbonate (g kg−1) tot.calc 54.03 0.97 0.60 218.90pH water pH water 6.41 6.20 4.60 8.20Available phosphorus (g kg−1) available.P 0.05 0.03 0.00 0.12CEC (Cmol+ kg−1) Cec 14.04 10.20 3.81 29.99Exchangeable Ca (Cmol+ kg−1) exc.Ca 12.41 8.66 0.71 28.69Exchangeable Mg (Cmol+ kg−1) exc.Mg 1.07 0.70 0.23 1.89Exchangeable K (Cmol+ kg−1) exc.K 0.38 0.32 0.11 0.69Exchangeable Na (Cmol+ kg−1) exc.Na 0.12 0.05 0.02 0.11Exchangeable Al (Cmol+ kg−1) exc.Al 0.61 0.09 0.02 2.10Total Al (g.100g−1) tot.Al 4.86 4.70 2.25 7.66Total Ca (g.100g−1) tot.Ca 2.56 0.44 0.12 9.02Total Fe (g.100g−1) tot.Fe 2.54 2.28 0.94 4.39Total K (g.100g−1) tot.K 1.61 1.45 0.64 2.85Total Mg (g.100g−1) tot.Mg 0.54 0.36 0.12 0.96
(2–20 μm), coarse silt (20–50 μm), fine sand (50–200 μm) and coarsesand (200–2000 μm)] using wet sieving and the pipettemethod (NF X31–107), (iii) cation exchange capacity and exchangeable cations(cobaltihexamin method), (iv) total K, Ca, Mg, Fe and Al determinedby ICP-MS after dissolution with hydrofluoric and perchloric acids, (v)pH in water (1 to 5 soil to water ratio), and (vi) extractable P (Olsenmethod).
Analyses were performed by the Soil Analysis Laboratory of INRAin Arras, France, which is accredited for soil and sludge analysis.
Table 1 shows that the boxcox transformation has removed mostof the skewness of the raw data although log transform performsworst. This table shows also that the parameters in the datasetcovered a very wide range. The Table 2 shows the linear correlationsbetween the soil parameters. Most of these correlations wereexpected, such as those between particle-size fractions, or thoseobserved between cation exchange capacity and exchangeablecations. The correlation between clay and C content globally confirmsthe effect of the fine particle fractions on C stabilisation in soil(Arrouays et al., 2006).
2.2. MULTISPATI-PCA
In this paper we used both classical PCA andMULTISPATI-PCA. Theformer is a classical analysis. The latter has been fully described byDray et al. (2008). This paper does not give the full detail of the twoprocedures that have been already published but we present anoutline below.
2.2.1. General analysis of a statistical tripletMultivariate analysis methods can be described in terms of duality
diagram and of their associated statistical triplet (Holmes, 2006; Drayand Dufour, 2007).
Let X be an (n×p) matrix (soil parameters). The p variables (incolumns) have been centered by substracting the overall mean for then samples (in rows), and scaled to unit norm by dividing by thestandard deviation.
Let Dn be a scalar product of Rn and let Dp be a scalar product of Rp.The analysis of the statistical triplet (X,Dp,Dn) is obtained by theeigenanalysis of matrix S:
S = XΤDnXDp ð1Þ
eKurtosis Skewness Kurtosis
log(x)Skewnesslog(x)
t (BoxCoxparameter)
Kurtosis(boxcox)
Skewness(boxcox)
0.786 0.957 4.406 −1.325 0.441 0.226 0.031−0252 −0.028 13.979 −3.051 0.929 1.254 0.0290.292 0.990 5.866 −1.627 0.406 −0.004 0.0155.179 1.804 1.472 −0.807 0.296 0.452 0.0270.961 1.226 −0.018 −0.744 0.255 −0.833 −0.100
17.777 3.163 0.596 0.214 −0.088 0.919 −0.01511.953 2.644 2.106 −0.318 0.099 1.254 0.02910.117 3.121 −0.080 1.234 −0.494 −1.116 0.681−1.283 0.019 −1.098 −0.230 0.673 −1.240 −0.05856.689 4.323 −0.453 −0.610 0.220 −0.601 −0.0721.955 1.422 0.076 −0.283 0.122 −0.345 −0.0101.683 1.350 1.284 −1.175 0.324 −0.565 −0.108
32.909 4.907 1.237 0.024 −0.006 1.238 −0.002291.788 11.361 1.089 −0.524 0.181 1.132 0.040
1047.680 29.968 10.680 1.792 1.000 9.401 1.5519.967 2.993 −0.584 0.690 1.000 −0.584 0.690
−0.463 0.129 4.917 −1.753 0.825 −0.387 −0.0809.877 3.065 −0.175 0.714 −0.197 −0.185 0.0455.143 1.548 6.261 −1.839 0.476 0.992 0.0830.574 0.864 3.468 −1.142 0.447 0.053 0.009
104.641 8.227 2.077 −0.480 0.096 2.039 0.059
Table2
Line
arco
rrelationmatrixof
thebo
xcox
tran
sformed
data.B
oldprintindicatessign
ificant
linea
rco
rrelationco
efficien
tsat
1%leve
l.Fine
siltha
sbe
enremov
eddu
eto
additive
logratiotran
sformation.
fine
.san
dco
arse.san
dph
.wate
available
Clay
coarse.silt*
**
carbon
tot.N
tot.c
alc
r.P
cec
exc.Ca
exc.Mg
exc.K
exc.Na
exc.Al
tot.A
ltot.C
atot.F
etot.K
tot.M
g
Clay
1.00
00.08
5−
0.43
7−
0.59
90.40
60.57
30.46
40.49
60.01
00.83
50.75
70.55
50.50
80.30
6−
0.24
50.45
20.55
40.65
00.07
30.54
9co
arse.silt
0.08
51.00
0−
0.01
8−
0.66
2−
0.13
9−
0.00
7−
0.04
80.13
40.29
70.11
30.12
60.06
30.18
40.03
7−
0.21
9−
0.06
70.05
30.10
0−
0.06
20.06
2fine
.san
d−
0.43
7−
0.01
81.00
00.29
8−
0.25
4−
0.29
2−
0.11
4−
0.09
9−
0.03
3−
0.32
1−
0.27
4−
0.15
0−
0.17
0−
0.16
00.02
2−
0.25
0−
0.14
3−
0.23
0−
0.06
4−
0.12
5co
arse.san
d−
0.59
9−
0.66
20.29
81.00
0−
0.09
5−
0.25
3−
0.24
4−
0.38
7−
0.11
6−
0.54
7−
0.53
2−
0.33
0−
0.33
1−
0.23
30.31
2−
0.12
8−
0.32
5−
0.37
90.10
2−
0.30
4carbon
0.40
6−
0.13
9−
0.25
4−
0.09
51.00
00.90
90.07
3−
0.13
5−
0.16
70.38
90.21
20.21
90.06
50.21
80.33
60.39
80.14
60.40
40.11
70.34
4tot.N
0.57
3−
0.00
7−
0.29
2−
0.25
30.90
91.00
00.18
30.08
60.05
70.56
20.43
00.38
10.26
70.27
50.09
40.51
10.33
10.56
50.19
10.50
3tot.c
alc
0.46
4−
0.04
8−
0.11
4−
0.24
40.07
30.18
31.00
00.80
10.04
90.61
90.65
60.19
00.37
90.04
2−
0.42
2−
0.06
70.80
10.13
4−
0.18
70.30
0ph
.water
0.49
60.13
4−
0.09
9−
0.38
7−
0.13
50.08
60.80
11.00
00.27
50.71
40.82
20.38
80.52
60.12
4−
0.78
5−
0.00
80.82
90.22
3−
0.12
20.36
2av
ailable.P
0.01
00.29
7−
0.03
3−
0.11
6−
0.16
70.05
70.04
90.27
51.00
00.10
60.19
20.10
60.51
30.00
4−
0.40
10.02
50.18
10.03
10.13
10.03
5cec
0.83
50.11
3−
0.32
1−
0.54
70.38
90.56
20.61
90.71
40.10
61.00
00.93
70.62
80.55
20.28
6−
0.48
50.30
10.73
90.55
6−
0.02
30.55
9ex
c.Ca
0.75
70.12
6−
0.27
4−
0.53
20.21
20.43
00.65
60.82
20.19
20.93
71.00
00.59
80.54
80.24
5−
0.65
00.20
50.77
90.46
3−
0.07
50.47
5ex
c.Mg
0.55
50.06
3−
0.15
0−
0.33
00.21
90.38
10.19
00.38
80.10
60.62
80.59
81.00
00.51
70.50
9−
0.37
20.42
60.45
10.54
90.18
70.67
1ex
c.K
0.50
80.18
4−
0.17
0−
0.33
10.06
50.26
70.37
90.52
60.51
30.55
20.54
80.51
71.00
00.19
9−
0.41
30.25
00.51
30.36
50.17
50.41
3ex
c.Na
0.30
60.03
7−
0.16
0−
0.23
30.21
80.27
50.04
20.12
40.00
40.28
60.24
50.50
90.19
91.00
0−
0.07
80.30
80.20
30.31
90.10
00.30
3ex
c.Al
−0.24
5−
0.21
90.02
20.31
20.33
60.09
4−
0.42
2−
0.78
5−
0.40
1−
0.48
5−
0.65
0−
0.37
2−
0.41
3−
0.07
81.00
00.11
2−
0.54
5−
0.11
20.14
4−
0.15
9tot.A
l0.45
2−
0.06
7−
0.25
0−
0.12
80.39
80.51
1−
0.06
7−
0.00
80.02
50.30
10.20
50.42
60.25
00.30
80.11
21.00
00.13
80.73
70.71
20.67
2tot.C
a0.55
40.05
3−
0.14
3−
0.32
50.14
60.33
10.80
10.82
90.18
10.73
90.77
90.45
10.51
30.20
3−
0.54
50.13
81.00
00.34
8−
0.08
00.54
9tot.F
e0.65
00.10
0−
0.23
0−
0.37
90.40
40.56
50.13
40.22
30.03
10.55
60.46
30.54
90.36
50.31
9−
0.11
20.73
70.34
81.00
00.26
20.74
4tot.K
0.07
3−
0.06
2−
0.06
40.10
20.11
70.19
1−
0.18
7−
0.12
20.13
1−
0.02
3−
0.07
50.18
70.17
50.10
00.14
40.71
2−
0.08
00.26
21.00
00.38
2tot.M
g0.54
90.06
2−
0.12
5−
0.30
40.34
40.50
30.30
00.36
20.03
50.55
90.47
50.67
10.41
30.30
3−
0.15
90.67
20.54
90.74
40.38
21.00
0
109D. Arrouays et al. / Geoderma 161 (2011) 107–114
whereXΤ is the transpose ofX. This eigenanalysis leads to the diagonalmatrix of eigenvalues Λ and to eigenvectors U. The row scores R aregiven by:
R = XDpU ð2Þ
and the variable loadings L, by:
L = UΛ1=2 ð3Þ
2.2.2. The case of simple PCAIfDn=1/nIn andDp=Ip, the analysis of the statistical triplet (X,Dp,Dn)
is the classical PCA ofX. This leads to the eigenanalysis ofmatrixXΤX andto usual row scores and variable loadings. The advantage of the generaltriplet notation is that it can be used to define many other multivariateanalyses, like for example Principal Coordinate Analysis, CorrespondenceAnalysis or Multiple Correspondence Analysis.
The ade4 package for the R statistical software (Chessel et al.,2004) is based on the duality diagram and on the analysis of statisticaltriplets. For the analysis of one-table data sets alone, it offers 10different methods.
2.2.3. The MULTISPATI-PCA analysisThe aim of the MULTISPATI analysis is to take into account the
spatial location of samples in the analysis of the data table. Thisinformation is introduced by the way of a spatial weighting matrixC=[cij] that indicates the strength of the relationship between units iand j. This matrix can take many forms, for example a binaryconnectivity matrix B (bij=1 if units i and j are neighbours, elsebij=0). Here, This matrix B is transformed into a row-standardizedspatial weight matrixW (weight equal to the inverse of the number ofneighbours) as:
W = cij.∑n
j=1cijh i
ð5Þ
UsingW has several advantages, mainly allowing a decompositionof Moran's I into the product of a spatial smoothing and the Pearsoncorrelation between the variable and its spatial lag (Dray et al., 2008).Another advantage is that, in the case of a correlation matrix PCA of X,the MULTISPATI-PCA analysis is equivalent to Wartenberg's Multi-variate Spatial Correlation Analysis (Wartenberg, 1985).
The MULTISPATI-PCA analysis is a fully matched coinertia analysis(Torre and Chessel, 1994) of the data table X and the «lag vector»WX.It corresponds to the statistical triplet (XΤDnWX,Dp,Dp) , and aftersome transformation, it leads to the eigenanalysis of matrixHwhich issymmetric:
H = 1=2ð Þ XΤ WΤDn + DnW� �
XDp
� �ð6Þ
The row scores of this analysis maximize the scalar productbetween a linear combination of the original variables and a linearcombination of the lagged variables. It is therefore a compromisebetween the simple PCA of the pedological variables and the maximalspatial autocorrelation obtained by computing the mean of eachvariable over the neighbours of each point («lagged variables»).
The advantage of MULTISPATI-PCA over PCA is that MULTISPATI-PCA sample scores maximise the spatial autocorrelation betweensites, while conventional PCA scores maximise the inertia (i.e., thesum of variances). MULTISPATI-PCA scores are, therefore, “smooth”and show strong spatial structures on the first few axes, while PCAscores can be rough, smooth, ormixed and can show spatial structureson any axis (even distant ones). Moreover, the advantage of MULTI-SPATI-PCA over Wartenberg's classical MSCA is that MULTISPATI-PCAis not restricted to the case of quantitative normalised variables but
110 D. Arrouays et al. / Geoderma 161 (2011) 107–114
can be applied to any type of variable and any type of analysis (forexample, binary variables, counts, or qualitative variables andprincipal component analysis, correspondence analysis, or multiplecorrespondence analysis).
Finally, a Monte Carlo test was used to check the statisticalsignificance of the observed structures. This test is a multivariatepermutation test against a random distribution of the values of thetopsoil characteristics over the sampling sites. The test does not relyon statistical distribution hypotheses.
Computations were conducted with the “ade4” (Chessel et al.,2004) and “spdep” packages (Bivand et al., 2008) for the R statisticalsoftware package (R Development Core Team, 20084). MULTISPATI-PCA is a purely descriptive method, based solely on linear algebra andon geometrical properties. The method does not rely on any modelfitting.
2.3. Additive log ratio transformation
Component analysis of particle-size distribution involves problemin that the components have a constant sum, 100%, with distributionsthat are curtailed at the limits of 0 and 100%. Aitchison (1986) drewattention to the matter and described how to deal with the situationusing the additive log-ratio (adlr).We therefore transform the particlesize data using adlr method before performing the multivariateanalysis.
3. Results
3.1. MULTISPATI-PCA Axes
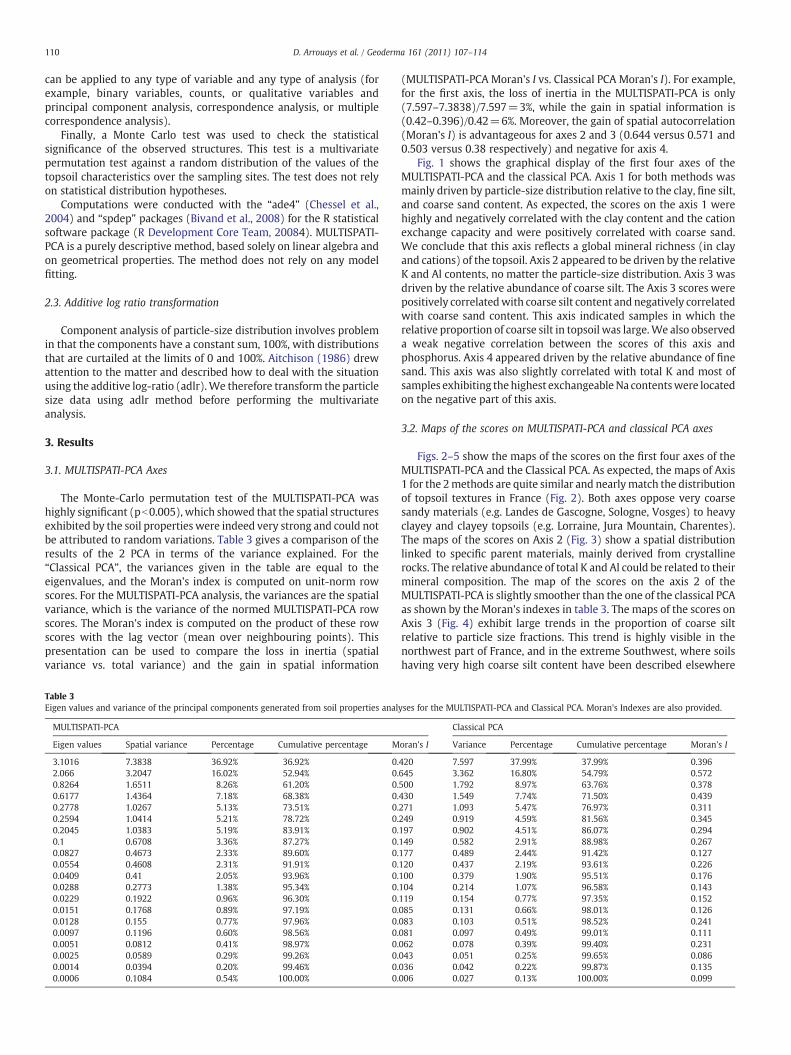
The Monte-Carlo permutation test of the MULTISPATI-PCA washighly significant (pb0.005), which showed that the spatial structuresexhibited by the soil properties were indeed very strong and could notbe attributed to random variations. Table 3 gives a comparison of theresults of the 2 PCA in terms of the variance explained. For the“Classical PCA”, the variances given in the table are equal to theeigenvalues, and the Moran's index is computed on unit-norm rowscores. For the MULTISPATI-PCA analysis, the variances are the spatialvariance, which is the variance of the normed MULTISPATI-PCA rowscores. The Moran's index is computed on the product of these rowscores with the lag vector (mean over neighbouring points). Thispresentation can be used to compare the loss in inertia (spatialvariance vs. total variance) and the gain in spatial information
Table 3Eigen values and variance of the principal components generated from soil properties anal
MULTISPATI-PCA
Eigen values Spatial variance Percentage Cumulative percentage M
3.1016 7.3838 36.92% 36.92% 0.2.066 3.2047 16.02% 52.94% 0.0.8264 1.6511 8.26% 61.20% 0.0.6177 1.4364 7.18% 68.38% 0.0.2778 1.0267 5.13% 73.51% 0.0.2594 1.0414 5.21% 78.72% 0.0.2045 1.0383 5.19% 83.91% 0.0.1 0.6708 3.36% 87.27% 0.0.0827 0.4673 2.33% 89.60% 0.0.0554 0.4608 2.31% 91.91% 0.0.0409 0.41 2.05% 93.96% 0.0.0288 0.2773 1.38% 95.34% 0.0.0229 0.1922 0.96% 96.30% 0.0.0151 0.1768 0.89% 97.19% 0.0.0128 0.155 0.77% 97.96% 0.0.0097 0.1196 0.60% 98.56% 0.0.0051 0.0812 0.41% 98.97% 0.0.0025 0.0589 0.29% 99.26% 0.0.0014 0.0394 0.20% 99.46% 0.0.0006 0.1084 0.54% 100.00% 0.
(MULTISPATI-PCA Moran's I vs. Classical PCA Moran's I). For example,for the first axis, the loss of inertia in the MULTISPATI-PCA is only(7.597–7.3838)/7.597=3%, while the gain in spatial information is(0.42–0.396)/0.42=6%. Moreover, the gain of spatial autocorrelation(Moran's I) is advantageous for axes 2 and 3 (0.644 versus 0.571 and0.503 versus 0.38 respectively) and negative for axis 4.
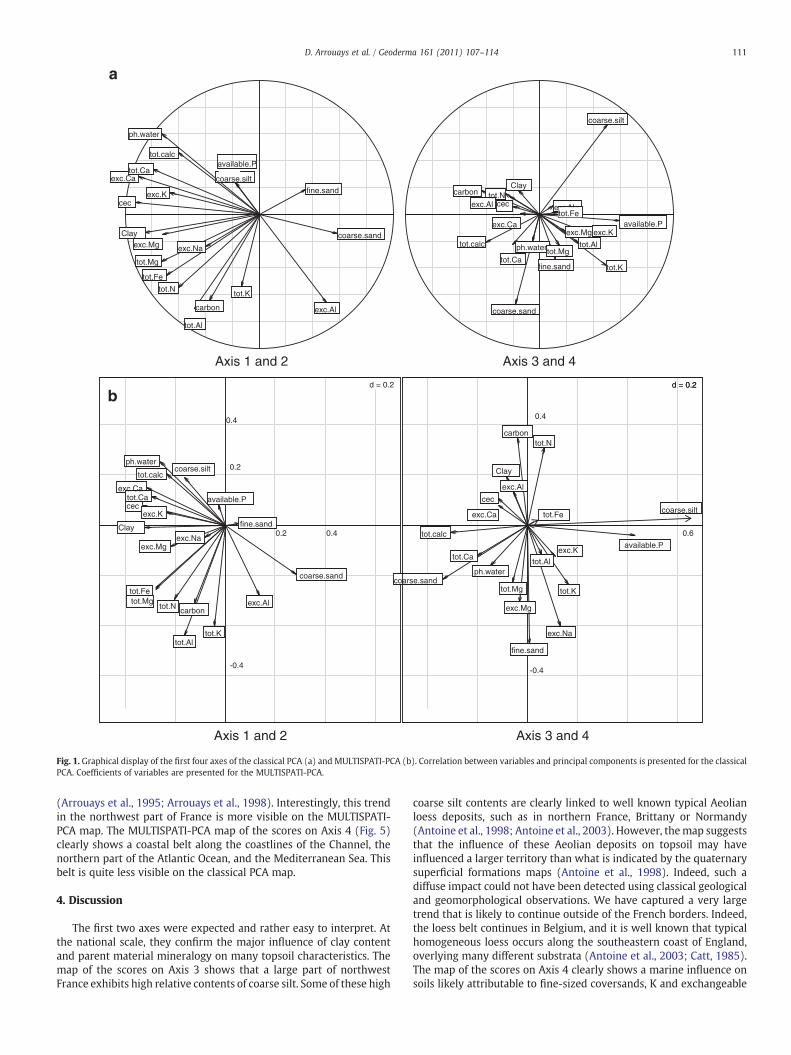
Fig. 1 shows the graphical display of the first four axes of theMULTISPATI-PCA and the classical PCA. Axis 1 for both methods wasmainly driven by particle-size distribution relative to the clay, fine silt,and coarse sand content. As expected, the scores on the axis 1 werehighly and negatively correlated with the clay content and the cationexchange capacity and were positively correlated with coarse sand.We conclude that this axis reflects a global mineral richness (in clayand cations) of the topsoil. Axis 2 appeared to be driven by the relativeK and Al contents, no matter the particle-size distribution. Axis 3 wasdriven by the relative abundance of coarse silt. The Axis 3 scores werepositively correlatedwith coarse silt content and negatively correlatedwith coarse sand content. This axis indicated samples in which therelative proportion of coarse silt in topsoil was large.We also observeda weak negative correlation between the scores of this axis andphosphorus. Axis 4 appeared driven by the relative abundance of finesand. This axis was also slightly correlated with total K and most ofsamples exhibiting the highest exchangeableNa contentswere locatedon the negative part of this axis.
3.2. Maps of the scores on MULTISPATI-PCA and classical PCA axes
Figs. 2–5 show the maps of the scores on the first four axes of theMULTISPATI-PCA and the Classical PCA. As expected, the maps of Axis1 for the 2methods are quite similar and nearlymatch the distributionof topsoil textures in France (Fig. 2). Both axes oppose very coarsesandy materials (e.g. Landes de Gascogne, Sologne, Vosges) to heavyclayey and clayey topsoils (e.g. Lorraine, Jura Mountain, Charentes).The maps of the scores on Axis 2 (Fig. 3) show a spatial distributionlinked to specific parent materials, mainly derived from crystallinerocks. The relative abundance of total K and Al could be related to theirmineral composition. The map of the scores on the axis 2 of theMULTISPATI-PCA is slightly smoother than the one of the classical PCAas shown by the Moran's indexes in table 3. The maps of the scores onAxis 3 (Fig. 4) exhibit large trends in the proportion of coarse siltrelative to particle size fractions. This trend is highly visible in thenorthwest part of France, and in the extreme Southwest, where soilshaving very high coarse silt content have been described elsewhere
yses for the MULTISPATI-PCA and Classical PCA. Moran's Indexes are also provided.
Classical PCA
oran's I Variance Percentage Cumulative percentage Moran's I
420 7.597 37.99% 37.99% 0.396645 3.362 16.80% 54.79% 0.572500 1.792 8.97% 63.76% 0.378430 1.549 7.74% 71.50% 0.439271 1.093 5.47% 76.97% 0.311249 0.919 4.59% 81.56% 0.345197 0.902 4.51% 86.07% 0.294149 0.582 2.91% 88.98% 0.267177 0.489 2.44% 91.42% 0.127120 0.437 2.19% 93.61% 0.226100 0.379 1.90% 95.51% 0.176104 0.214 1.07% 96.58% 0.143119 0.154 0.77% 97.35% 0.152085 0.131 0.66% 98.01% 0.126083 0.103 0.51% 98.52% 0.241081 0.097 0.49% 99.01% 0.111062 0.078 0.39% 99.40% 0.231043 0.051 0.25% 99.65% 0.086036 0.042 0.22% 99.87% 0.135006 0.027 0.13% 100.00% 0.099
Clay
coarse.silt
fine.sand
coarse.sand
carbon
tot.N
tot.calc
ph.water
available.P
cec
exc.Ca
exc.Mg
exc.K
exc.Na
exc.Al
tot.Al
tot.Ca
tot.Fe
tot.K
tot.Mg
Clay
coarse.silt
fine.sand
coarse.sand
carbon tot.N
tot.calc ph.water
available.P
cec
exc.Ca exc.Mg exc.K
exc.Na exc.Al
tot.Al
tot.Ca tot.K
tot.Mg
Axis 1 and 2 Axis 3 and 4
d = 0.2
Clay
coarse.silt
fine.sand
coarse.sand
carbon tot.N
tot.calc
ph.water
available.Pcec
exc.Ca
exc.Mg
exc.K
exc.Na
exc.Al
tot.Al
tot.Ca
tot.Fe
tot.K
tot.Mg
d = 0.2 d = 0.2
Clay
coarse.silt
fine.sand
coarse.sand
carbon tot.N
tot.calc
ph.water
available.P
cec
exc.Ca
exc.Mg
exc.K
exc.Na
exc.Al
tot.Al tot.Ca
tot.Fe
tot.K tot.Mg
0.2 0.4
0.4
0.2
-0.4-0.4
0.4
0.6
b
Axis 1 and 2 Axis 3 and 4
tot.Fe
a
Fig. 1. Graphical display of the first four axes of the classical PCA (a) and MULTISPATI-PCA (b). Correlation between variables and principal components is presented for the classicalPCA. Coefficients of variables are presented for the MULTISPATI-PCA.
111D. Arrouays et al. / Geoderma 161 (2011) 107–114
(Arrouays et al., 1995; Arrouays et al., 1998). Interestingly, this trendin the northwest part of France is more visible on the MULTISPATI-PCA map. The MULTISPATI-PCA map of the scores on Axis 4 (Fig. 5)clearly shows a coastal belt along the coastlines of the Channel, thenorthern part of the Atlantic Ocean, and the Mediterranean Sea. Thisbelt is quite less visible on the classical PCA map.
4. Discussion
The first two axes were expected and rather easy to interpret. Atthe national scale, they confirm the major influence of clay contentand parent material mineralogy on many topsoil characteristics. Themap of the scores on Axis 3 shows that a large part of northwestFrance exhibits high relative contents of coarse silt. Some of these high
coarse silt contents are clearly linked to well known typical Aeolianloess deposits, such as in northern France, Brittany or Normandy(Antoine et al., 1998; Antoine et al., 2003). However, themap suggeststhat the influence of these Aeolian deposits on topsoil may haveinfluenced a larger territory than what is indicated by the quaternarysuperficial formations maps (Antoine et al., 1998). Indeed, such adiffuse impact could not have been detected using classical geologicaland geomorphological observations. We have captured a very largetrend that is likely to continue outside of the French borders. Indeed,the loess belt continues in Belgium, and it is well known that typicalhomogeneous loess occurs along the southeastern coast of England,overlying many different substrata (Antoine et al., 2003; Catt, 1985).The map of the scores on Axis 4 clearly shows a marine influence onsoils likely attributable to fine-sized coversands, K and exchangeable
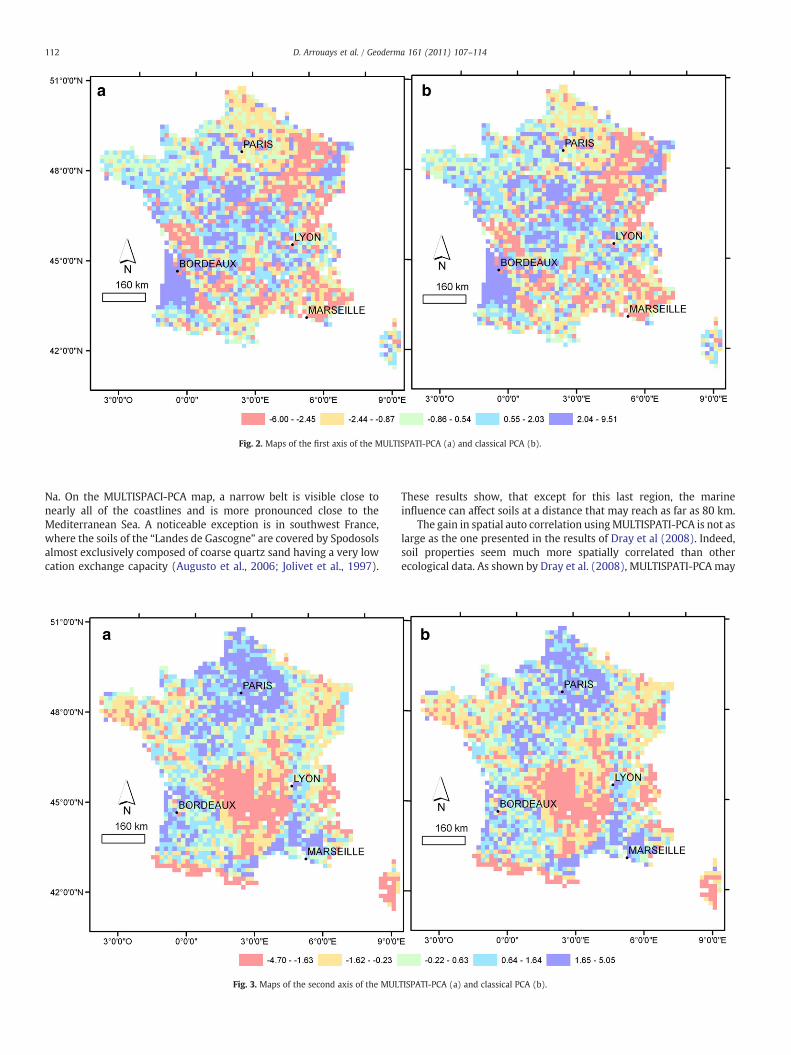
Fig. 2. Maps of the first axis of the MULTISPATI-PCA (a) and classical PCA (b).
112 D. Arrouays et al. / Geoderma 161 (2011) 107–114
Na. On the MULTISPACI-PCA map, a narrow belt is visible close tonearly all of the coastlines and is more pronounced close to theMediterranean Sea. A noticeable exception is in southwest France,where the soils of the “Landes de Gascogne” are covered by Spodosolsalmost exclusively composed of coarse quartz sand having a very lowcation exchange capacity (Augusto et al., 2006; Jolivet et al., 1997).
Fig. 3. Maps of the second axis of the MUL
These results show, that except for this last region, the marineinfluence can affect soils at a distance that may reach as far as 80 km.
The gain in spatial auto correlation usingMULTISPATI-PCA is not aslarge as the one presented in the results of Dray et al (2008). Indeed,soil properties seem much more spatially correlated than otherecological data. As shown by Dray et al. (2008), MULTISPATI-PCA may
TISPATI-PCA (a) and classical PCA (b).
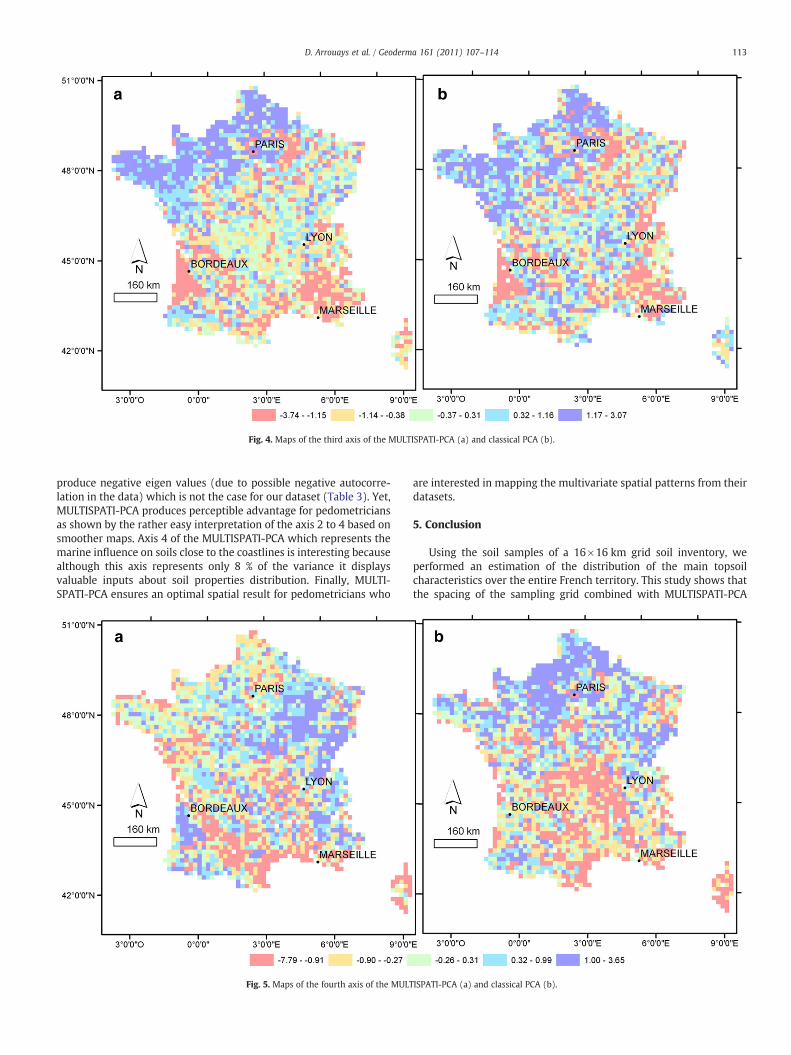
Fig. 4. Maps of the third axis of the MULTISPATI-PCA (a) and classical PCA (b).
113D. Arrouays et al. / Geoderma 161 (2011) 107–114
produce negative eigen values (due to possible negative autocorre-lation in the data) which is not the case for our dataset (Table 3). Yet,MULTISPATI-PCA produces perceptible advantage for pedometriciansas shown by the rather easy interpretation of the axis 2 to 4 based onsmoother maps. Axis 4 of the MULTISPATI-PCA which represents themarine influence on soils close to the coastlines is interesting becausealthough this axis represents only 8 % of the variance it displaysvaluable inputs about soil properties distribution. Finally, MULTI-SPATI-PCA ensures an optimal spatial result for pedometricians who
Fig. 5. Maps of the fourth axis of the MULT
are interested in mapping the multivariate spatial patterns from theirdatasets.
5. Conclusion
Using the soil samples of a 16×16 km grid soil inventory, weperformed an estimation of the distribution of the main topsoilcharacteristics over the entire French territory. This study shows thatthe spacing of the sampling grid combined with MULTISPATI-PCA
ISPATI-PCA (a) and classical PCA (b).
114 D. Arrouays et al. / Geoderma 161 (2011) 107–114
allows us to detect andmap large regional trends in the distribution oftopsoil characteristics. Interestingly, the gradients were more visibleand pronounced when using MULTISPACI-PCA rather than classicalPCA. Some of the gradients that we mapped were expected and couldhave been drawn without using these techniques. However, the mostinteresting findings were the large extent of the coarse silt gradient innorthwest France and the assessment of the marine influence on soilsclose to the coastlines.
Acknowledgements
This study was supported by a French Scientific Group of Intereston Soils: the “GIS Sol”, involving the French Ministry for Ecology andSustainable Development, the French Ministry of Agriculture, theFrench Agency for Energy and Environment (ADEME) , the NationalInstitute for Agronomic Research (INRA), the Institute for Researchand Development (IRD) and the National Forest Inventory (IFN). Wethank all of the soil surveyors and technical assistants involved insampling the sites. We are grateful to two anonymous referees and anassociate editor of the journal for helpful and stimulating commentson this paper.
References
AFNOR, 1994. NF ISO 11464. Qualité du sol. Prétraitement des échantillons pouranalyses physico-chimiques.
Aitchison, J., 1986. The Statistical Analysis of Compositional Data. Chapman & Hall.Chapman & Hall, London.
Antoine, P., Lautridou, J.P., Sommé, J., Auguste, P., Auffret, J.P., Baize, S., Clet-Pellerin, M.,Coutard, J.P., Dewolf, Y., Dugué, O., Joly, F., Laignel, B., Laurent, M., Lavollé, M.,Levret, P., Lecolle, F., Lefebvre, D., Limondin-Lozouet, N., Locht, J.L., Munaut, A.V.,Paris, P., Petit, C., Rousseau, D.D., 1998. Le Quaternaire de la France au Nord-Ouest:limites et corrélations. Quaternaire. Quatern. 9 (3), 227–241.
Antoine, P., Catt, J., Lautridou, J.P., Sommé, J., 2003. The loess and coversands of northernFrance and southern England. J. Quatern. Sci. 18 (3–4), 309–3118.
Arrouays, D., Vion, I., Kicin, J.L., 1995. Spatial analysis and modeling of topsoil carbonstorage in temperate forest humic loamy soil of France. Soil Sci. 159 (3).
Arrouays, D., Daroussin, J., Kicin, J.L., Hassika, P., 1998. Improving topsoil carbon storageprediction using a digital elevation model in temperature forest soils of France. SoilSci. 163 (2).
Arrouays, D., Deslais, W., Badeau, V., 2001. The carbon content of topsoil and itsgeographical distribution in France. Soil Use Manag 17 (1), 7–11.
Arrouays, D., Jolivet, C., Boulonne, L., Bodineau, G., Saby, N., Grolleau, E., 2002. A newinitiative in France: a multi-institutional soil quality monitoring network. C R AcadAgric Fr 88 (5), 93–105.
Arrouays, D., Jolivet, C., Boulonne, L., Bodineau, G., Saby, N., Grolleau, E., 2003. Le Réseaude Mesures de la Qualité des Sols (RMQS) de France. Etude Gestion Sols 10 (4),241–250.
Arrouays, D., Saby, N., Walter, C., Lemercier, B., Schvartz, C., 2006. Relationshipsbetween particle-size distribution and organic carbon in French arable topsoils. SoilUse Manag 22, 48–51.
Arrouays, D., Morvan, X., Saby, N.P.A., Richer de Forges, A., Le Bas, C., Bellamy, P.H.,Berengi Uveges, J., Freudenschuss, A., Jones, R.J.A., Kibblewhite, M.G., Simota, C.,Verdoodt, A., Verheijen, F.G.A., 2008. Environmental Assessment of Soil forMonitoring: Volume IIa Inventory & Monitoring. EUR 23490 EN/2A, Office for theOfficial Publications of the European Communities, Luxembourg.
Atteia, O., Dubois, J., Webster, R., 1994. Geostatistical analysis of soil contamination inthe Swiss Jura. Environ. Environ Pollut 86 (3), 315–327.
Augusto, L., Badeau, V., Arrouays, D., Trichet, P., Flot, J.L., Jolivet, C., Merzeau, D., 2006.Caractérisation physico-chimique des sols à l'échelle d'une région naturelle à partird'une compilation de données, exemple des sols du massif forestier landais. EtudeGestion Sols 13 (1), 7–22.
Bivand, R., Anselin, L., Assunçaõ, R., Berke, O., Bernat, A., Carvalho, M., Chun, Y.,Dormann, C., Dray, S., Halbersma, R., Krainski, E., Lewin-Koh, N., Li, H., Ma, J., Millo,G., Mueller, W., Ono, H., Peres-Neto, P., Reder, M., Tiefelsdorf, M., Yu, D., 2008.spdep: Spatial dependence: weighting schemes, statistics and models. R packageversion 0.4-29. http://cran.at.r-project.org/web/packages/spdep.
Boruvka, L., Mládková, L., Penízek, V., Drábek, O., Vasát, R., 2007. Forest soil acidificationassessment using principal component analysis and geostatistics. Geoderma 140 (4),374.
Bourennane, H., Salvador-Blanes, S., Cornu, S., King, D., 2003. Scale of spatialdependence between chemical properties of topsoil and subsoil over a geologicallycontrasted area (Massif central, France). Geoderma 112 (3–4), 235–251.
Catt, J.A., 1985. Soil particle size distribution and mineralogy as indicators of pedogenicand geomorphic history: examples from the loessial soils of England andWales. In:Richard, K., Arnett, R., Ellis, S. (Eds.), Geomorphology and Soils. G. Allen and Unwin,London.
Chessel, D., Dufour, A.B., Thioulouse, J., 2004. The ade4 package — I: one-table methods.R news 4 (1), 5–10.
Dray, S., Dufour, A.B., 2007. The ade4 package: implementing the duality diagram forecologists. J. Stat. Softw. 22 (4), 1–20.
Dray, S., Said, S., Debias, F., 2008. Spatial ordination of vegetation data using ageneralization of Wartenberg's multivariate spatial correlation. J. Veg. Sci. 19,45–56.
Farrell, E.P., 1995. Atmospheric deposition in maritime environments and its impact onterrestrial ecosystems. Water Air Soil Pollut. 85, 123–130.
Holmes, S., 2006. Multivariate analysis: The French way. In: Nolan, D., Speed, T. (Eds.),Festschrift for David Freedman. IMS, Beachwood, OH, pp. 1–14.
Jamagne, M., Lautridou, J.P., Sommé, J., 1981. Préliminaire à une synthèse sur lesvariations sédimentologiques des loess de la France du Nord-Ouest dans leur cadregéographique et paléogéographique. Bull. Soc. Geol. Fr. (7), 143–147 XXIII.
Jolivet, C., Arrouays, D., Andreux, F., Leveque, J., 1997. Soil organic carbon dynamics incleared temperate forest Spodosols converted tomaize cropping. Plant Soil 191 (2),225–231.
Jolivet, C., Arrouays, D., Boulonne, L., Ratie, C., Saby, N., 2006. Le Réseau deMesures de laQualité des Sols de France (RMQS), Etat d'avancement et premiers résultats. EtudeGestion Sols 13 (3), 149–164.
Lautridou, J.P., Monnier, J.L., Morzadec-Kerfourn, M.T., Sommé, J., Tuffreau, A., 1986. ThePleistocene of Northern France. Quatern. Sci. Rev. 387–393.
Lebret, P., Lautridou, J.P., 1991. The loess of West Europe. Geo J. 24 (2), 151–186.Odlare, M., Svensson, K., Pell, M., 2005. Near infrared reflectance spectroscopy for
assessment of spatial soil variation in an agricultural field. Geoderma 126 (3–4),193–202.
Oliver, M.A., Webster, R., Edwards, K.J., Whittington, G., 1997. Multivariate, autocor-relation and spectral analyses of a pollen profile from Scotland and evidence forperiodicity. Rev. Of Palaeobot. And Palynol. 96 (1–2), 121–144.
R Development Core Team, 2008. R: a language and environment for statisticalcomputing. R Foundation for Statistical Computing, Vienna, Austria.
Saby, N., Arrouays, D., Boulonne, L., Jolivet, C., Pochot, A., 2006. Geostatisticalassessment of pb in soil around Paris, France. Sci. Total Environ. 367 (1), 212–221.
Saby, N.P.A., Thioulouse, J., Jolivet, C.C., Ratié, C., Boulonne, L., Bispo, A., Arrouays, D.,2009. Multivariate analysis of the spatial patterns of 8 trace elements using theFrench soil monitoring network data. Sci. Total Environ. 407 (21), 5644–5652.
Satapathy, D.R., Salve, P.R., Katpatal, Y.B., 2009. Spatial distribution of metals in ground/surface waters in the Chandrapur district (Central India) and their plausiblesources. Environ. Geol. 56 (7), 1323–1352.
Torre, F., Chessel, D., 1994. Co-structure de deux tableaux totalement appariés. Rev.Statistique Appl. 43, 109–121.
Wartenberg, D., 1985. Multivariate spatial correlation: a method for exploratorygeographical analysis. Geogr. Anal. 17, 263–283.
Webster, R., Boag, B., 1992. Geostatistical analysis of cyst nematodes in the soil. J. SoilSci. 43, 583–595.
Webster, R., Oliver, M., 2007. Geostatistics for environmental scientists, 2nd Edition.Geostatistics for environmental scientists, 2nd Edition. John Wiley & Sons Ltd,Chichester UK.
Webster, R., Atteia, O., Dubois, J.P., 1994. Coregionalization of trace metals in the soil inthe Swiss Jura. Eur. J. Soil Sci. 45 (2), 205–218.
Zhang, Z.H., 2003. Impact of seasalt deposition on acid soils in maritime regions.Pedosphere 13, 375–380.
Related Documents