ORIGINAL ARTICLE Large Scale Electrical Resistivity Tomography Survey Correlated to Hydrogeological Data for Mapping Groundwater Salinization: A Case Study from a Multilayered Coastal Aquifer in Rhodope, Northeastern Greece Evangelos C. Galazoulas & Yannis C. Mertzanides & Christos P. Petalas & Evangelos K. Kargiotis Received: 7 November 2014 / Accepted: 19 January 2015 / Published online: 7 February 2015 # Springer International Publishing Switzerland 2015 Abstract A large scale two dimensional electrical resistivity survey was carried out to investigate groundwater salinization phenomena of a multilayered coastal aquifer in south Rhodope area, northeastern Greece. The electrical resistivity tomography (ERT) profiles, calibrated with lithological, physicochemical and geophysical log data, were used to demarcate the geometry of the aquifer system and characterize the extent of the interface between saline and freshwater in a coastal groundwater system, which has been subject to overexploitation for the last 35 years. In total, 12 deep high resolution ERT profile lines, covering a distance of approximately 15 km were carried out at key locations across the downgraded part of the aquifer system. The resistivity sections were calibrated using a reference dataset of 45 information wells incorporating 28 lithological logs, 31 groundwater quality samples from a variety of screen placements and five gamma ray logs. Results revealed the presence of four major resistivity zones ranging in values between 0.1 and 150 Ωm at various depths and locations. A very low resistivity zone (0.1–5 Ωm) correlated with saline water saturated layers, a medium resistivity zone (5–15 Ωm) attributed to clays and silts, and two high resistivity zones generally representing freshwater saturated sediments of coarse grain size (15–40 Ωm) or alterations of thin marl and fine sand layers (40–150 Ωm). It is demonstrated that extensive use of high resolution deep geoelectrical sections, calibrated with a large number of hydrogeological data can successfully delineate aquifer geometry dimensions, identify hydrau- lic boundaries and clarify ambiguous field measurements, thus allowing the development of a thorough hydrogeological conceptual model. Environ. Process. (2015) 2:19–35 DOI 10.1007/s40710-015-0061-y E. C. Galazoulas (*) : C. P. Petalas Laboratory of Ecological Engineering and Technology, Department of Environmental Engineering, Democritus University of Thrace, Xanthi, GR 67 100, Greece e-mail: [email protected] Y. C. Mertzanides : E. K. Kargiotis Hephaestus Laboratory, Department of Petroleum and Mechanical Engineering, Eastern Macedonia and Thrace Institute of Technology, Kavala, GR 65404, Greece

Welcome message from author
This document is posted to help you gain knowledge. Please leave a comment to let me know what you think about it! Share it to your friends and learn new things together.
Transcript
ORIGINAL ARTICLE
Large Scale Electrical Resistivity Tomography SurveyCorrelated to Hydrogeological Data for MappingGroundwater Salinization: A Case Studyfrom a Multilayered Coastal Aquifer in Rhodope,Northeastern Greece
Evangelos C. Galazoulas & Yannis C. Mertzanides &Christos P. Petalas & Evangelos K. Kargiotis
Received: 7 November 2014 /Accepted: 19 January 2015 /Published online: 7 February 2015# Springer International Publishing Switzerland 2015
Abstract A large scale two dimensional electrical resistivity survey was carried out toinvestigate groundwater salinization phenomena of a multilayered coastal aquifer in southRhodope area, northeastern Greece. The electrical resistivity tomography (ERT) profiles,calibrated with lithological, physicochemical and geophysical log data, were used to demarcatethe geometry of the aquifer system and characterize the extent of the interface between salineand freshwater in a coastal groundwater system, which has been subject to overexploitation forthe last 35 years. In total, 12 deep high resolution ERT profile lines, covering a distance ofapproximately 15 km were carried out at key locations across the downgraded part of theaquifer system. The resistivity sections were calibrated using a reference dataset of 45information wells incorporating 28 lithological logs, 31 groundwater quality samples from avariety of screen placements and five gamma ray logs. Results revealed the presence of fourmajor resistivity zones ranging in values between 0.1 and 150 Ωm at various depths andlocations. A very low resistivity zone (0.1–5 Ωm) correlated with saline water saturated layers,a medium resistivity zone (5–15 Ωm) attributed to clays and silts, and two high resistivityzones generally representing freshwater saturated sediments of coarse grain size (15–40 Ωm)or alterations of thin marl and fine sand layers (40–150 Ωm). It is demonstrated that extensiveuse of high resolution deep geoelectrical sections, calibrated with a large number ofhydrogeological data can successfully delineate aquifer geometry dimensions, identify hydrau-lic boundaries and clarify ambiguous field measurements, thus allowing the development of athorough hydrogeological conceptual model.
Environ. Process. (2015) 2:19–35DOI 10.1007/s40710-015-0061-y
E. C. Galazoulas (*) : C. P. PetalasLaboratory of Ecological Engineering and Technology, Department of Environmental Engineering,Democritus University of Thrace, Xanthi, GR 67 100, Greecee-mail: [email protected]
Y. C. Mertzanides : E. K. KargiotisHephaestus Laboratory, Department of Petroleum and Mechanical Engineering, Eastern Macedonia andThrace Institute of Technology, Kavala, GR 65404, Greece

Keywords Electrical resistivity tomography (ERT) . Geophysical mapping . Groundwatersalinization .Multilayered coastal aquifer
1 Introduction
The overexploitation of groundwater resources in coastal aquifers, along with the subsequentsaltwater intrusion, result to the degradation of the natural ecosystems (Ranjan et al., 2006),with severe socioeconomic effects on local communities, through the decline in freshwateravailability and the reduction of agricultural productivity (Beltran, 1999; Tuong et al., 2003;Pisinaras et al., 2010). Therefore, the need for a thorough aquifer system description andcontinuous quality monitoring is crucial in every coastal zone, in order to construct asustainable groundwater management scheme and to implement appropriate regulatory poli-cies. According to Bear et al. (1999), there are two fundamental sources of information ingroundwater saline intrusion investigations, the hydrochemical and the geophysical methods.Data acquired with these techniques separately, or ideally coupled together, can successfullydelineate the freshwater/saltwater interfacial configuration in a coastal aquifer system. Amongthem, the geophysical methods present significant advantages over the geochemical ones,since they involve lower cost and less time in their application (Maillet et al., 2005). Anothercritical advantage is that they are non-destructive and that they incorporate the ability toproduce continuous datasets over large areas, while geochemical analyses are limited only topoints of interest where boreholes exist (Martínez et al., 2009).
The last 15 years, geophysicists and hydrologists worked hand-in-hand in order to identifysubsurface structures and understand flow processes inside aquifer systems. This interdisci-plinary approach offered new tools and advanced knowledge to hydrological studies and hasdeveloped a unique subdiscipline called «Hydrogeophysics» (Rubin and Hubbard, 2005). Outof the variety of surface geophysical methods applied in groundwater studies, direct currentelectrical methods consist one of the primarily preferred in saline environments due to theirinherent ability to detect formation resistivity variations based on pore water salinity (Barker,1990; Abdul Nassir et al., 2000; ASTM, 2011). Geoelectrical methods are executed bymeasuring the electrical potential arising from an artificially injected current, with the purposeof achieving information about the near surface underground resistivity distribution (Telfordet al., 1990). Recent developments in this field, both in data acquisition as well as in inversemodeling techniques, have allowed the transition from the limited, one dimensional form ofVertical Electrical Soundings (VES) to the more complex and pretentious two or threedimensional Electrical Resistivity Tomography (ERT) technique (Dahlin, 2001). Variousresearchers are found in the literature, exploiting direct current geoelectrical methods compe-tence in groundwater salinization investigations around the world. Examples of one dimen-sional soundings include: Urish and Frohlich (1990); Frohlich et al. (1994); Ebraheem et al.(1997); Nowroozi et al. (1999); Choudhury et al. (2001); Edet and Okereke (2001); Sherifet al. (2006); and Adepelumi et al. (2009). In all the aforementioned studies, the authors wereable to successfully distinguish between freshwater and saltwater domains in various geolog-ical environments, by combining the results of numerous Vertical Electrical Soundings (VES)across coastal zones.
Over the last decades, due to the rapid development of computer processing speed and dataacquisition systems, the ERT technique has evolved rapidly and numerous applications arepresent in saline environments. In certain occasions (Wilson et al., 2006), the ERT techniquewas used in order to supplement and clarify the results of initially executed one dimensionalVES in the same region. The efficiency of the ERT technique in a variety of inshore geological
20 E.C. Galazoulas et al.

settings is demonstrated by various researchers, including coastal alluvial aquifers (AbdulNassir et al., 2000; Morrow et al., 2010; Ebraheem et al., 2012; Mas-Pla et al., 2012), coastaldeltaic deposits (Maillet et al., 2005; Martínez et al., 2009; Gurunadha Rao et al., 2011), orinland saline environments, e.g., in the Okavango Delta, Botswana (Bauer et al., 2006), in theDead Sea, Jordan aquifer (Batayneh, 2006), and in Querenca–Silves, south Portugal (Leitãoet al., 2014). These authors have utilized various array configurations and electrode spacingintervals, and showed that the method is able to provide a good correlation between specificresistivity values and hydrogeological properties, and thus, to calculate formation factors(Archie, 1942) for the separate aquifer units, by combining groundwater electrical resistivitymeasurements and bulk formation resistivity distribution. This way, it was made possible tosuccessfully demarcate saltwater/freshwater interface and to identify aquifer dimensions (base-ment depth and lateral extent) for a diversity of geological settings.
More recent ERT applications comprise time-lapse measurements in monitoringsalinization phenomena. de Franco et al. (2009) monitored seawater intrusion inVenice lagoon, Italy and managed to correlate the resistivity alterations with variousenvironmental variables (e.g., rainfall, groundwater recharge and tidal regime), whileOgilvy et al. (2009) used a similar setting in the Andarax River, Spain to map andmonitor saltwater intrusion with greater confidence and efficiency, compared totraditional methods. Additionally, Zarroca et al. (2011) compared the results of pre-existing VES with modern ERT traverses to characterize saline intrusion progress inthe Alt Emporda region, Spain. Finally, the efficiency of the method is highlighted byits extensive use in saline tracer monitoring examples (Singha and Gorelick, 2005;Cassiani et al., 2006; Hermans et al., 2012; Perri et al., 2012) where the two-dimensional direct current geoelectrical method was used to monitor the evolutionof an artificially injected plume through time and space.
In this study, a large scale ERT survey was carried out, in a multilayered coastal aquiferlocated in the southeastern Rhodope province, northeastern Greece, to supplement thehydrogeological investigation of the area (Petalas, 1997). The potential of the geophysicalmethod used, was evaluated in a complex multilayered aquifer system for whichhydrogeological information has been acquired over the last 25 years. The aim of this paperis to present the results of the geophysical survey mentioned above, to evaluate the ERTtechnique as an imaging tool in salinization phenomena over multilayered coastal aquifers, andto emphasize the importance of interdisciplinary approach on the study of such complexhydrogeological problems.
2 Materials and Methods
2.1 Study Area Description
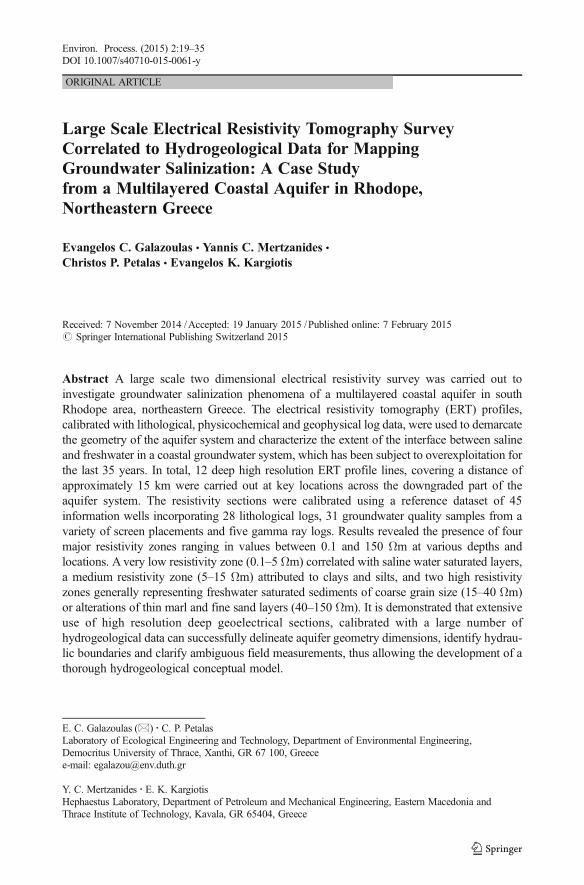
The study area is located in the south part of the Eastern Macedonia and Thrace Region inNorth Greece, and consists part of a broader aquifer system deployed in the Rhodope RegionalDivision coastal zone (Fig. 1a). Over-exploitation of local groundwater resources due to anextensive agricultural use, has led to a remarkable groundwater drawdown and saltwaterintrusion (Petalas, 1997). Geographical limits, delineated with dotted line in Fig. 1a, werechosen based on hydrogeological and hydrochemical criteria in order to enclose the salineintruded portion of the aquifer and to represent natural or artificial groundwater flow bound-aries. Significant surface hydrological features include the numerous lagoons dominating thecoastal zone and two rivers, Kompsatos and Aspropotamos, located at the North discharging
Electrical Resistivity Tomography for Mapping Groundwater Salinization 21
into Vistonis lagoon. The main economic activity of the local settlements is agriculture andlivestock farming.
2.2 Geological and Hydrogeological Setting
The geological structure and hydrogeological conditions were investigated in the past by:Petalas (1997); Petalas and Diamantis (1999); Petalas and Lambrakis (2006); Petalas et al.(2009). A normal fault sited along the Glykoneri–Palladio axis separates the Plio-Pleistocenealluvial fan of Kompsatos river sediments at the northeast and the Upper Miocene continentaldeposits at the southwest. The latter consist of coarse alluvial unconsolidated sediments (sands,gravels and cobbles) deposited in a braided-river environment and fine lacustrine sediments(clays and silts). A continuous thick layer of green plastic clay, deposited at the base of thissequence marks the transition to older age formations consisting mainly of clays, silts and thinsand layers. Two main aquifers can be identified in the Upper Miocene deposits. A shallowsemi-confined aquifer depicting an average thickness of 35 m along with limited hydraulicproperties, and a thicker (50–100 m) confined aquifer which holds the major local groundwaterreserves. Additionally, below the thick green clay unit, sand lenses interbedded between clays,marls and silts form a discontinuous isolated confined aquifer system.
Figure 2a shows the hydraulic head distribution and groundwater flow directions for theconfined aquifer, using a monitoring network of 25 observation wells during April 2012. Thepiezometric surface is well below mean sea level, with higher values across the fault line andlower at the east. It appears that groundwater from the adjacent alluvial fan of Kompsatos riveraquifer system laterally recharges the confined aquifer along two major axes, one close to theNea Kallisti village and one south of Glykoneri. Groundwater flow lines converge to Porpivillage where a cone of depression is formed. The low hydraulic gradient east of Mesi denoteseither the existence of higher hydraulic conductivity sediments (Todd, 1980) or the location ofa vertical recharge zone, which prevents piezometric drawdown. In Fig. 2b, the spatialdistribution of electrical conductivity for the confined aquifer is presented. It is apparent that
Fig. 1 a Study area location and position of ERT lines; b position of ERT lines calibration wells and mainstreams in the area
22 E.C. Galazoulas et al.

the previously identified recharge axis south of Glykoneri allows saline groundwater to enterthe system and progress eastward. The origin of the saltwater is from a phreatic aquifer locatedunderneath Vistonis lagoon and vertically recharged by it (Petalas, 1997). Electrical conduc-tivity measurements generally exceed 1 mS/cm at the largest portion of the study area,reaching a maximum of 45 mS/cm close to the inlet of Vistonis lagoon. Numerous wellsare drilled in the area, penetrating either the shallow semi-confined aquifer or the mainconfined aquifer or both, thus allowing groundwater transfer through well screens and mixingof different quality water masses. In the recent years, due to the rapid saltwater intrusionprogress and the depletion of freshwater resources (Petalas and Lambrakis, 2006; Petalas et al.,2009; Galazoulas and Petalas, 2014), various wells have been drilled at greater depths,penetrating the deep aquifer system located underneath the main confined aquifer.
2.3 Electrical Resistivity Tomography Survey
The electrical resistivity geophysical survey was designed according to the spatial distributionof borehole, physicochemical and piezometric data, and was carried out between December2011 and May 2013. The ERT lines locations are shown in Fig. 1b. The first lines wereselected either in well investigated locations with much hydrogeological information availableor at locations with absence of adequate data. The existing hydrogeological datasets consist of: (i)continuous piezometric and physicochemical measurements; (ii) a dense network of litholog-ical profiles from wells drilled in the area; (iii) a significant level of information derived fromgeophysical well loggings (gamma ray logs). The extreme salinization taking place over thelargest part of the area favors the selection of the geoelectric method, which is highly sensitivein high groundwater salinity contrasts. Although a large amount of data is available, there is a highdegree of uncertainty regarding the origin and distribution of saline facies, because of the complexityof the aquifer system. It is important to note that high salinity groundwater was pumped from
Fig. 2 a Piezometric map and flow paths for the confined aquifer during April 2012; b Distribution of electricalconductivity values for the confined aquifer during August 2012
Electrical Resistivity Tomography for Mapping Groundwater Salinization 23

inland wells even before the piezometric drawdown initiation, indicating the presence of salineconnate water masses trapped in the sediments. Aquifer system complexity is enhanced byhuman activities, such as improperly constructed wells and the lack of proper managing andsupervising policies implemented. Complete calibration of ERT profiles resulted in detailedmapping of underground structures and processes taking place in the system, likenatural recharge zones, freshwater/saltwater mixing and boundary conditions delineation. Forthis reason, in this study geophysical traverses are not focused solely on the freshwater/saltwater interface boundary but fully cover the downgraded part of the aquifer in thehorizontal and vertical axes, trying to capture all of the hydrogeological processestaking place in the complex coastal aquifer system.
Key planning parameters for the ERT lines placement were the confirmation of aquiferboundaries, the proximity to hydrogeological information points, the interference with surfacehydrological features, the clarification of lithological or hydrochemical anomalies identified inthe pre-existing datasets, the investigation of aquifer zoneswhere no reliable data exist, the delineationof the saltwater/freshwater interface, the coverage of the entire downgraded area, andfinally, the avoidance of uncrossable obstacles along the survey line (main roads,rivers, streams, lagoοns). Based on these criteria, lines 1, 2, 3, 4, 11 and 12 weredeployed perpendicularly to the aquifer western and southern limit to investigate thelateral recharge conditions and aquifer layer geometry. Maximum hydrogeologicalneighboring information was achieved in line 1, where 8 information wells incorpo-rating all the available sources were available close to the survey line. Additionally,lines 3, 11 and 12 were placed in areas where not sufficient calibration data exists.ERT lines 5, 6, 7 and 8 are located inland to cover the full area extent and to explainambiguous and confusing measurements in the pre-existing dataset. Finally, profiles9 and 10 were deployed at the eastern edge to investigate the saltwater/freshwaterinterface and to delineate the saltwater intrusion extent.
The resistivity data were acquired using the ABEM TERRAMETER LS instrument, a 4-channel system with the ability to handle 64 electrodes, a transmitter of 250 W, 2.5 A and600 V, and four cables of 21 take-outs that were used in the field work. The Dipole-Dipolearray was used, due to the adequate depth of investigation and sensitivity to horizontal changesin resistivity caused by the lateral saline intrusion (Reynolds, 2011). The apparent resistivityfor this array is given by the following Eq. (1):
ρα ¼ π⋅n⋅ nþ 1ð Þ⋅ nþ 2ð Þ⋅α⋅R ð1Þwhere:
α is the dipole length;n is the dipole separation factor; andR is the resistance value measured.
In this survey, the electrode spacing was 15 m and totally twelve high resolution deepelectrical resistivity profiles were conducted. The typical survey line was 1200 m long and theroll-along technique was used in order to extend the section covered up to 1800 m length. Thedatasets of the apparent resistivity measured in the field gave the resistivity pseudo-sections.The real resistivity sections resulted after the pseudo-sections were inverted and with somepre-inversion and post-inversion handling. The RES2DINV program, by GEOTOMOSOFTWARE, was used, following the standard least-squares smoothness–constrained inver-sion formulation, (L2-norm) and the complete Gauss-Newton optimization method (Loke andBarker, 1996).
24 E.C. Galazoulas et al.

3 Results and Discussion
3.1 ERT Data Analysis
Table 1 illustrates the characteristics of the ERT profile lines presented in this study. Pre–processing of the initial dataset resulted in the exclusion of unrealistic high or low apparentresistivity measurements from the inversion process. The excluded values consisted of lessthan 1 % of the total initial dataset for all the lines. The Root Mean Square (RMS) error valuesobtained during the minimization of the square difference between the observed and thecalculated apparent resistivity values, varied between 2.6 and 13.8 % over all ERT lines,indicating the good quality of measured data. The highest values of RMS errors werecalculated for the profiles measured on summer, when the soil was very dry, while the lowestduring the wet months. The highest RMS error was 13.8 % and came from a survey line of1800 m length, a dataset of 1641 measurements, conducted on 11th of August (the most drydays of the year). In total, 15,135 m of deep ERT profiles length were acquired and 16,737data points of apparent resistivity measurements were measured.
3.2 Resistivity Sections Interpretation
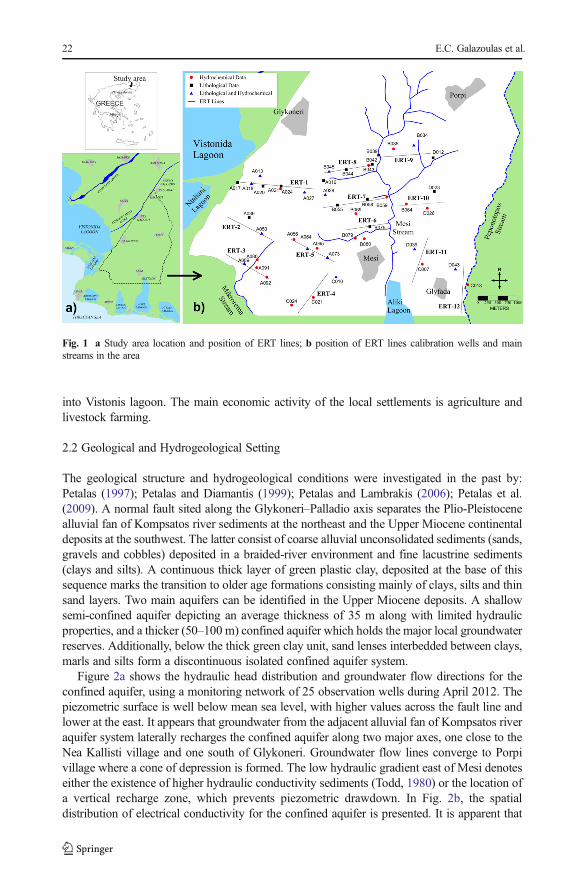
Figures 3, 4, 5 and 6 show the two-dimensional resistivity models produced by the inversion ofthe twelve resistivity pseudo-sections, along with the projection of all the availablehydrogeological data on top of the inverted sections. The ERT data were compared to drilling,well log and groundwater electrical conductivity data, in order to calibrate the 2D resistivitymodels and build a thorough conceptual model for the area of study. For every calibrationpoint, the distance between the reference well and the section is shown, in order to establish abetter level of calibration liability. For wells with unknown construction properties, a black arrowindicates only well location, while for every pumping well the range of electricalconductivity values measured during the irrigation period is shown. Finally, the main confinedaquifer top and bottom limits are shown along with the groundwater piezometric surface forthe main confined aquifer.
Table 1 Characteristics of the 12 ERT profile lines
Surveyline
Date ofmeasurement
Arrayconfiguration
Electrodespacing (m)
No ofelectrodes
Length (m) No ofdata points
No ofiterations
RMSerror
ERT-1 Aug-2012 Dip.-Dip. 15 121 1800 1641 5 13.8 %
ERT-2 Mar-2013 Dip.-Dip. 15 81 1200 1460 5 5.4 %
ERT-3 Apr-2013 Dip.-Dip. 15 81 1200 1469 5 3.9 %
ERT-4 Apr-2013 Dip.-Dip. 15 81 1200 1469 5 3.2 %
ERT-5 Mar-2013 Dip.-Dip. 15 80 1185 1423 5 2.6 %
ERT-6 Apr-2013 Dip.-Dip. 15 71 1050 1122 5 7.1 %
ERT-7 Apr-2013 Dip.-Dip. 15 101 1500 1763 5 4.7 %
ERT-8 Dec-2011 Dip.-Dip. 15 81 1200 1090 5 9.5 %
ERT-9 Feb-2013 Dip.-Dip. 15 81 1200 1349 5 5.2 %
ERT-10 Apr-2013 Dip.-Dip. 15 81 1200 1314 4 9.6 %
ERT-11 Apr-2013 Dip.-Dip. 15 81 1200 1332 5 5.2 %
ERT-12 May-2013 Dip.-Dip. 15 81 1200 1305 4 10.1 %
Electrical Resistivity Tomography for Mapping Groundwater Salinization 25
Fig. 3 Geoelectrical sections ERT1, ERT2 and ERT3
26 E.C. Galazoulas et al.
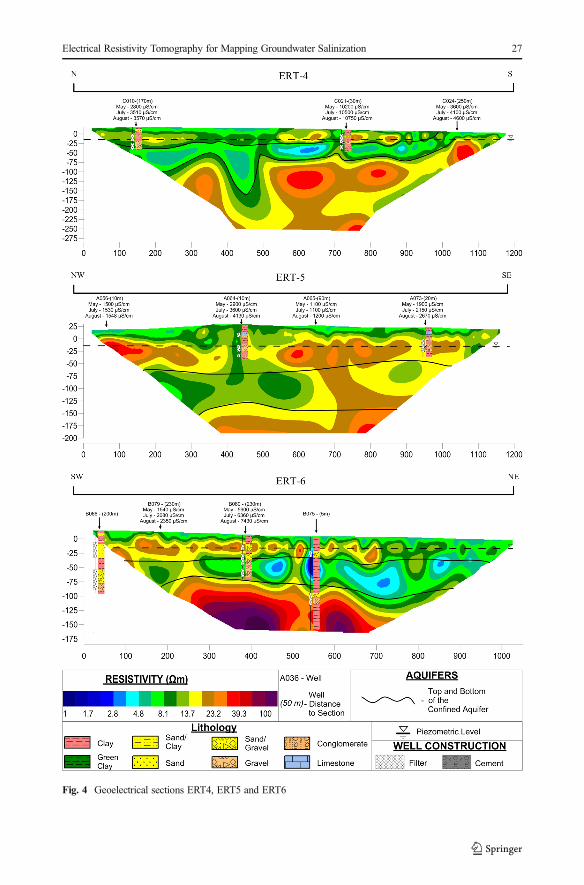
Fig. 4 Geoelectrical sections ERT4, ERT5 and ERT6
Electrical Resistivity Tomography for Mapping Groundwater Salinization 27
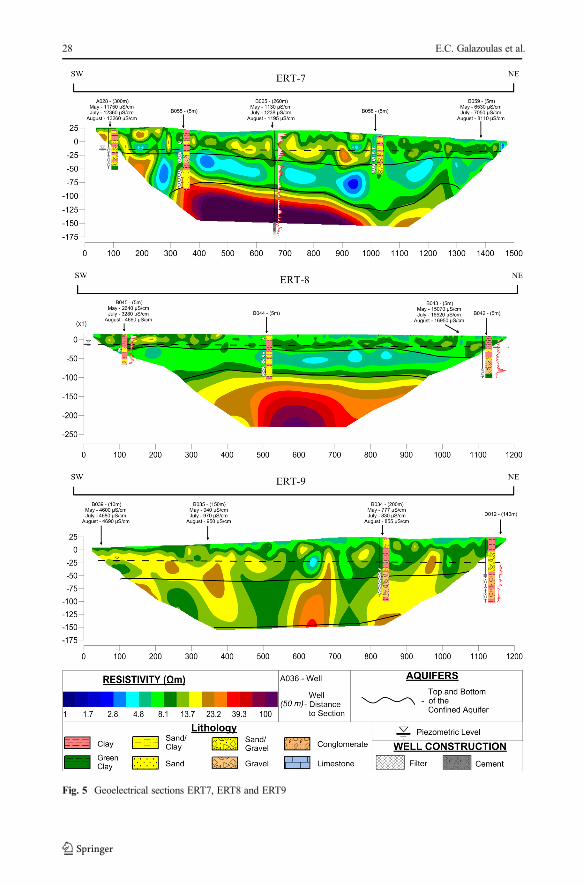
Fig. 5 Geoelectrical sections ERT7, ERT8 and ERT9
28 E.C. Galazoulas et al.

Fig. 6 Geoelectrical sections ERT10, ERT11 and ERT12
Electrical Resistivity Tomography for Mapping Groundwater Salinization 29

High resolution interpretation of the ERT sections with the integration of lithological,physicochemical and geophysical log data enables the accurate identification of characteristichydrogeological features, essential for the development of a detailed conceptual model. Thenatural saltwater ‘tracer’ causes abrupt resistivity changes between different groundwaterquality aquifers or water masses, permitting the delineation of the salinity distribution, aquiferboundaries and hydrological interactions. Results revealed the presence of four major resis-tivity zones ranging in values between 0.1 and 150 Ωm at various depths and locations. A verylow resistivity zone (0.1–5 Ωm) correlated with saline water saturated layers, a mediumresistivity zone (5–15 Ωm) was attributed to clays and silts, and two high resistivity zonesgenerally representing freshwater saturated sediments of coarse grain size (15–40 Ωm) oralterations of thin marl and fine sand layers (40–150 Ωm). Similar findings were identified inprevious studies exploiting resistivity geophysical methods in saline groundwater contaminatedareas (de Franco et al., 2009; Ogilvy et al., 2009; Zarroca et al., 2011; Ebraheem et al., 2012;Kafri et al., 2014). In all the aforementioned studies, saline water was correlated with very lowapparent resistivity values (between 0.1 and 5 Ωm) while slightly higher values were attributedto clays, and higher values (>15 Ωm) to freshwater saturated layers. Since resistivity mea-surements are dependent on both lithological properties of the aquifer and physicochemicalcharacteristics of groundwater data, calibration could only be made possible through thepresence of hydrogeological data. In the case of their absence, calibration can only be madethrough bibliographic references, while only a rough estimate of the aquifer system propertiescan be identified (e.g., number of aquifer layers, saline water distribution).
The 2D resistivity models show that resistivity values in the overall geophysically exploredarea range between 1 and 150 Ωm, and spread in three resistivity zones which are evident ineach ERT section. The uppermost zone consisting of low to medium resistivity values between7 and 40 Ωm, the intermediate zone consisting of very low resistivity values (<1 to 7 Ωm), andthe bottom zone with medium to high resistivity values ranging between 12 and 150 Ωm.Results show that in every modeled section, three discrete layers are evident based on theintense vertical resistivity contrast they present. This basic geoelectrical structure, althoughexhibits spatial variations on geometry and resistivity, is discrete in all 2D resistivity modelsand it is related to certain hydrogeological processes (saltwater intrusion, freshwater surfacerecharge) and the lithology of the aquifer system. Each layer corresponds to a separate aquiferunit, in accordance with the hydrogeological setting described. More specifically, the top layerrepresents the shallow semi-confined aquifer, the intermediate zone represents the mainconfined aquifer system, and the lower layer represents the deep confined aquifer.
Top layer resistivity profile can be separated into two large groups: the low resistivity group(<12 Ωm), representing mainly clay sediments with thin sand alterations, and the highresistivity group (12–40 Ωm), attributed to coarser sediments filled with freshwater. Spatialdistribution of the low resistivity group shows that it dominates the largest portion of the semi-confined aquifer, while high resistivity measurements usually form lenses sporadically spreadin the aquifer extent. Production wells drilled in these sediments (e.g., A018, A036) exhibitvery low discharge rates (5 to 10 m3/h) or even completely fail to discharge at the end of theirrigation period. A shift from this continuous pattern is shown at the eastern end of sectionERT1, full section ERT5 and at the western half of sections ERT6 and ERT7. At theseneighboring locations, high resistivity values dominate the shallow semi-confined aquiferindicating the presence of freshwater reserves. Unfortunately, although there are quite a fewwells screened between these intervals, there is limited knowledge regarding lithologicalcontent and hydraulic properties. Wells A056, A065 and A073 located in this aquifer portionexhibit intermediate discharge rates (20–30 m3/h) of low electrical conductivity groundwater.The presence of surface hydrological features (streams, lagoons), shown in Fig. 1b, does not
30 E.C. Galazoulas et al.

appear to significantly affect shallow aquifer recharge, as demonstrated by profiles ERT3crossing Mikrorema stream and ERT6 aligned parallel to a segment of Mesi stream. Resistivityprofile calibration shows that fine sediments (clays and silts) prevent surface water percolationto the shallow aquifer.
The intermediate layer corresponds to the main confined aquifer and exhibit extremely lowresistivity values (1–5 Ωm) in sections ERT1, ERT2 and ERT12 orientated perpendicular tothe study area hydraulic boundaries, attributed to hypersaline groundwater filled sediments ofvarious grain sizes. Slightly higher resistivity values are displayed in sections ERT5, ERT6,ERT7 and ERT8, located at the area center. Profile ERT9, which is the only section deployedin the entirely fresh part of the aquifer, shows the key role of the saltwater natural ‘tracer’ in theapplication of the geoelectrical method. The absence of extreme resistivity contrasts incom-modes stratigraphic interpretation and hydrogeological boundary delineation. Section ERT10on the other hand shows the freshwater/saltwater interface extent, as it ends in the freshwateraquifer zone. The higher resistivity values at the beginning of the section can be explainedthrough the small thickness of coarse sediments in this area prohibiting the wide electrodespacing tomography used in this study to capture aquifer pore salinity. Finally, sections ERT11and ERT12 show very small variability in resistivity range and probably represent thedominance of clays and silts along with thin layers of saltwater filled sediments.
The deep confined unit is shown in every modeled section with intermediate to highresistivity values ranging between 30 and 150 Ωm. Spatial distribution show that lower valuesare found closer to the study area edges, while higher measurements form a continuoushorizontal line along sections ERT6, ERT7 and ERT8 center. Wells A013 projected in sectionERT1 and B065 projected in section ERT7 are characteristic examples of well exploiting thisaquifer. Cement rings are utilized to isolate deep aquifer sediments from the overlyingdowngraded main confined aquifer, and to prevent saltwater percolation through the boreholewalls. Wells drilled at these depths generally exhibit low discharge rates of freshwater, whichtend to significantly decrease at the end of the irrigation period due to the very slow rechargeprocess.
3.3 Conceptual Model Formulation
In Fig. 7, the 2D ERT sections are projected on top of the study area background map, alongwith the main confined aquifer electrical conductivity spatial distribution. It is clearly shownthat saltwater intrudes along an axis close to the inlet ofVistonis lagoon (sectionsERT1andERT2) andproceeds eastward as shown in profiles ERT 6, 7 and 8. On the southwest, aquifer basementelevation uplift along with the presence of a vertical freshwater recharge zone block themovement of saltwater by creating a vertical hydraulic barrier. Limited saline intrusion takesplace across the south border except from the area close to Glyfada village, wherevery low resistivity values are measured (ERT12). Section ERT10 covers thelimit of the saltwater extend towards the freshwater reserves close to Porpi village. The lateralabrupt change in resistivity between continuous sections ERT8 and ERT9 show that a sharpinterface exists between saltwater and freshwater in the main confined aquifer. Deep aquifersediments are present in every section depicting the main confined aquifer bottom limit.Interference between the shallow semi-confined and the main confined system takes placeacross a north to south oriented axis between Glykoneri and Mesi.
Vertical recharge between the three aquifer systems is possible where the impermeable claylayers separating them weakens, allowing groundwater to flow according to hydraulic gradientdifference. Piezometric measurements have shown that water table elevation in the shallowsemi-confined aquifer is approximately 10 m higher compared to the main confined aquifer.
Electrical Resistivity Tomography for Mapping Groundwater Salinization 31

As a result, groundwater from the shallow semi-confined aquifer recharges the main confinedaquifer, a process clearly evident in the ERT sections (1-7-6 and 5) due to the groundwaterquality difference between the two aquifers. High resistivity clusters are elongated across thevertical axis and disturb the continuance of the low resistivity zones at various locationscausing mixing of different groundwater regimes. For example, well A016, although screenedand isolated with cement rings in the main confined aquifer, exhibits lower conductivity valuesat the beginning of the irrigation period, compared to neighboring wells, due to the verticalfreshwater recharge from the above aquifer. Another example is shown at section ERT5between 600 to 800 m, where a vertical high resistivity structure interrupts the low resistivityzone and unites the shallow semi-confined aquifer with the lower basement unit. The samefeature is shown at the beginning of ERT section 6.
Regional upconing takes place at the end of the irrigation period, increasing pumpinggroundwater electrical conductivity, due to the depletion of the shallow aquifer resources and theimproperly constructed wells. Well A018, although initially pumps at 2380 μS/cm at thebeginning of the irrigation period, it ends up with approximately 16,000 μS/cm at the end, dueto the depletion of fresh groundwater resources in the upper semi-confined aquifer, and theprevalence of the confined aquifer water masses in well quality characteristics.
Delineation of hydrogeological boundaries between the three aquifer systems is possiblefollowing the continuous line representing high resistivity contrast between them. Interruptionsto this pattern occur due to freshwater recharge between the shallow semi-confined and themain confined aquifer system. Aquifer thickness mainly depends on basement fluctuationssince the top boundary is almost flat. The basement is not shown as a continuous flat line but itforms fluctuations probably due to the presence of faults parallel to the known fault line, or
Fig. 7 2D ERT sections along with main confined aquifer electrical conductivity contours
32 E.C. Galazoulas et al.

because of the disturbed clay layer continuance through improperly constructed wells. In generalterms, the confined aquifer bottom is located between −100 and −150m (a.m.s.l.) with the higherdepths shown at section ERT2. In sections ERT3, ERT4 and ERT11, which are oriented closeto the south system boundary, the aquifer basement depth significantly decreases. Thisupmoving is attributed to a major fault line parallel to the south boundary area limit, stressingthe stratigraphic sequence upward. The vertical anomaly between 400 and 500 m in ERT4 canbe attributed to a fault interference allowing saline water to percolate through the sediments.These connate groundwater reserves are very important for the sustainable groundwatermanagement in the local area, since they represent the only sources of freshwater in acompletely contaminated part of the area. Unfortunately, due to the high demand for freshirrigation water and slow recharge rates, severe groundwater level drawdown is observed in thedeep aquifer, which should be exclusively exploited only during drought periods.
4 Conclusions
The salinization of a multilayered coastal aquifer in Rhodope (Thrace, northeastern Greece)was studied by combined geophysical and hydrogeological surveys. The investigated area of42 km2 exhibits gentle topography, is structured by Neogene–Quaternary alluvial formations,and is surrounded by Thracian sea, Vistonida lagoon, and other minor lagoons. Salinizationphenomena were outlined by physicochemical measurements and piezometry observationsover existing wells and a large scale ERT survey was designed in order to obtain a clear image.Twelve deep ERT profiles, 15 km of total length, with sufficient resolution were carried out.The inverted ERT data followed by low RMS error misfit, were compared to the physico-chemical, lithological and well bore log data, and a good correlation was noted, whichsignificantly reduced interpretation uncertainty. The 2D resistivity models revealed the pres-ence of three major resistivity zones: the uppermost, low to medium resistivity layer which iscorrelated to the semi-confined aquifer with adequate freshwater resources; the highlyconductive intermediate layer which corresponds to the main confined aquifer and thesaltwater body; and the medium to high resistivity bottom layer which is attributed to thedeep confined units. The geometry of the aquifer system, the hydraulic boundaries and theextent of the transition zone were estimated. The case study presented in this paper illuminatesthe mechanism of salinization of south Rhodope coastal aquifers, by combined use of largeERT and hydrogeological data sets. The proposed multidisciplinary approach seems to providereliable information to build a realistic conceptual model for water management issues,contributing towards a rational and sustainable management of groundwater resources inenvironmentally sensitive areas.
References
Abdul Nassir SS, Loke MH, Lee CY, Nawawi MNM (2000) Salt-water intrusion mapping by geoelectricalimaging surveys. Geophys Prospect 48:647–661. doi:10.1046/j.1365-2478.2000.00209.x
Adepelumi A, Ako B, Ajayi T, Afolabi O, Omotoso E (2009) Delineation of saltwater intrusion into thefreshwater aquifer of Lekki Peninsula, Lagos, Nigeria. Environ Geol 56:927–933. doi:10.1007/s00254-008-1194-3
Archie GE (1942) The electrical resistivity log as an aid in determining some reservoir characteristics. Pet TransAIME 146:54–62. doi:10.2118/942054-g
ASTM D6429-99 (2011) Standard Guide for selecting surface geophysical methods, ASTM International, WestConshohocken, PA, 2011, www.astm.org. doi: 10.1520/d6429 99r11e01
Electrical Resistivity Tomography for Mapping Groundwater Salinization 33

Barker RD (1990) Investigation of groundwater salinity by geophysical methods. In: Ward S (ed) Geotechnicaland Environmental Geophysics,vol 2. Society of Exploration Geophysicists, pp 201–212
Batayneh A (2006) Use of electrical resistivity methods for detecting subsurface fresh and saline water anddelineating their interfacial configuration: a case study of the eastern Dead Sea coastal aquifers, Jordan.Hydrogeol J 14:1277–1283. doi:10.1007/s10040-006-0034-3
Bauer P, Supper R, Zimmermann S, Kinzelbach W (2006) Geoelectrical imaging of groundwater salinization inthe Okavango Delta, Botswana. J Appl Geophys 60:126–141. doi:10.1016/j.jappgeo.2006.01.003
Bear J, Cheng AHD, Sorek S, Ouazar D, Herrera I (eds) (1999) Seawater intrusion in coastal aquifers - concepts,methods, and practices. (Theory and applications of transport in porous media, v. 14). Kluwer AcademicPublishers, Dordrecht/Boston/London
Beltran JM (1999) Irrigation with saline water: benefits and environmental impact. Agric Water Manag 40:183–194. doi:10.1016/S0378-3774(98)00120-6
Cassiani G, Bruno V, Villa A, Fusi N, Binley AM (2006) A saline trace test monitored via time-lapse surfaceelectrical resistivity tomography. J Appl Geophys 59:244–259. doi:10.1016/j.jappgeo.2005.10.007
Choudhury K, Saha DK, Chakraborty P (2001) Geophysical study for saline water intrusion in a coastal alluvialterrain. J Appl Geophys 46:189–200. doi:10.1016/s0926-9851(01)00038-6
Dahlin T (2001) The development of DC resistivity imaging techniques. Comput Geosci 27:1019–1029. doi:10.1016/s0098-3004(00)00160-6
de Franco R, Biella G, Tosi L, Teatini P, Lozej A, Chiozzotto B, Giada M, Rizzetto F, Claude C, Mayer A,Bassan V, Gasparetto-Stori G (2009) Monitoring the saltwater intrusion by time lapse electrical resistivitytomography: the Chioggia test site (Venice lagoon, Italy). J Appl Geophys 69:117–130. doi:10.1016/j.jappgeo.2009.08.004
Ebraheem A-AM, Senosy MM, Dahab KA (1997) Geoelectrical and hydrogeochemical studies for delineatingground-water contamination due to salt-water intrusion in the northern part of the Nile Delta, Egypt. GroundWater 35:216–222. doi:10.1111/j.1745-6584.1997.tb00077.x
Ebraheem AM, Sherif MM, Al Mulla MM, Akram SF, Shetty AV (2012) A geoelectrical and hydrogeologicalstudy for the assessment of groundwater resources in Wadi Al Bih, UAE. Environ Earth Sci 67:845–857.doi:10.1007/s12665-012-1527-0
Edet AE, Okereke CO (2001) A regional study of saltwater intrusion in southeastern Nigeria based on theanalysis of geoelectrical and hydrochemical data. Environ Geol 40:1278–1289. doi:10.1007/s002540100313
Frohlich RK, Urish DW, Fuller J, O'Reilly M (1994) Use of geoelectrical methods in groundwater pollutionsurveys in a coastal environment. J Appl Geophys 32:139–154. doi:10.1016/0926-9851(94)90016-7
Galazoulas CE, Petalas PC (2014) Application of multivariate statistical procedures on major ions and traceelements in a multilayered coastal aquifer: the case of the south Rhodope coastal aquifer. Environ Earth Sci72:4191–4205. doi:10.1007/s12665-014-3315-5
Gurunadha Rao VVS, Rao GT, Surinaidu L, Rajesh R, Mahesh J (2011) Geophysical and geochemical approachfor seawater intrusion assessment in the Godavari Delta Basin, A.P., India. Water Air Soil Pollut 217:503–514. doi:10.1007/s11270-010-0604-9
Hermans T, Vandenbohede A, Lebbe L, Martin R, Kemna A, Beaujean J, Nguyen F (2012) Imaging artificial saltwater infiltration using electrical resistivity tomography constrained by geostatistical data. J Hydrol 438–439:168–180. doi:10.1016/j.jhydrol.2012.03.021
Kafri U, Goldman M, Levi E, Wollman S (2014) Detection of saline groundwater bodies between the Dead Seaand the Mediterranean Sea, Israel, using the TDEM method and hydrochemical parameters EnvironProcess 1:21–41 doi:10.1007/s40710-014-0001-2
Leitão T, Mota R, Novo M, Lobo-Ferreira J (2014) Combined use of electrical resistivity tomography andhydrochemical data to assess anthropogenic impacts on water quality of a karstic region: a case study fromQuerença-Silves, South Portugal Environ Process 1:43–57. doi:10.1007/s40710-014-0002-1
Loke MH, Barker RD (1996) Rapid least square inversion of apparent resistivity pseudosections using quasi-Newton method. Geophys Prospect 44:131–152. doi:10.1111/j.1365-2478.1996.tb00142.x
Maillet GM, Rizzo E, Revil A, Vella C (2005) High resolution electrical resistivity tomography (ERT) in atransition zone environment: application for detailed internal architecture and infilling processes study of aRhône river paleo-channel. Mar Geophys Res 26:317–328. doi:10.1007/s11001-005-3726-5
Martínez J, Benavente J, García-Aróstegui JL, Hidalgo MC, Rey J (2009) Contribution of electrical resistivitytomography to the study of detrital aquifers affected by seawater intrusion–extrusion effects: the river Vélezdelta (Vélez-Málaga, southern Spain). Eng Geol 108:161–168. doi:10.1016/j.enggeo.2009.07.004
Mas-Pla J, Rodríguez-Florit A, Zamorano M, Roqué C, Menció A, Brusi D (2012) Anticipating the effects ofgroundwater withdrawal on seawater intrusion and soil settlement in urban coastal areas. Hydrol Process 27:2352–2366. doi:10.1002/hyp.9377
34 E.C. Galazoulas et al.

Morrow FJ, Ingham MR, McConchie JA (2010) Monitoring of tidal influences on the saline interface usingresistivity traversing and cross-borehole resistivity tomography. J Hydrol 389:69–77. doi:10.1016/j.jhydrol.2010.05.022
Nowroozi AA, Horrocks SB, Henderson P (1999) Saltwater intrusion into the freshwater aquifer in the easternshore of Virginia: a reconnaissance electrical resistivity survey. J Appl Geophys 42:1–22. doi:10.1016/s0926-9851(99)00004-x
Ogilvy RD, Meldrum PI, Kuras O, Wilkinson PB, Chambers JE, Sen M, Pulido-Bosch A, Gisbert J, Jorreto S,Frances I, Tsourlos P (2009) Automated monitoring of coastal aquifers with electrical resistivity tomography.Near Surf Geophys 7:367–375. doi:10.3997/1873-0604.2009027
Perri MT, Cassiani G, Gervasio I, Deiana R, Binley A (2012) A saline tracer test monitored via both surface andcross-borehole electrical resistivity tomography: comparison of time-lapse results. J Appl Geophys 79:6–16.doi:10.1016/j.jappgeo.2011.12.011
Petalas CP (1997) Analysis of aquifer systems in the heterogeneous coastal part of prefecture of Rhodope. PhDDissertation. Department of Civil Engineering, Democritus University of Thrace. (In Greek)
Petalas CP, Diamantis JV (1999) Origin and distribution of saline groundwaters in the upper Miocene aquifersystem, coastal Rhodope area, northeastern Greece. Hydrogeol J 7:305–316. doi:10.1007/s100400050204
Petalas C, Lambrakis N (2006) Simulation of intense salinization phenomena in coastal aquifers – the case of thecoastal aquifers of Thrace. J Hydrol 324:51–64. doi:10.1016/j.jhydrol.2005.09.031
Petalas C, Pisinaras V, Gemitzi A, Tsihrintzis VA, Ouzounis K (2009) Current conditions of saltwater intrusion inthe coastal Rhodope aquifer system, northeastern Greece. Desalination 237:22–41
Pisinaras V, Tsihrintzis V, Petalas C, Ouzounis K (2010) Soil salinization in the agricultural lands of RhodopeDistrict, northeastern Greece. Environ Monit Assess 166:79–94. doi:10.1007/s10661-009-0986-6
Ranjan SP, Kazama S, Sawamoto M (2006) Effects of climate and land use changes on groundwater resources incoastal aquifers. J Environ Manag 80:25–35. doi:10.1016/j.jenvman.2005.08.008
Reynolds JM (2011) An introduction to Applied Geophysics. (2nd Edition), Wiley-BlackwellRubin Y, Hubbard SS (2005) Hydrogeophysics. Springer, NetherlandsSherif M, Mahmoudi A, Garamoon H, Kacimov A, Akram S, Ebraheem A, Shetty A (2006) Geoelectrical and
hydrogeochemical studies for delineating seawater intrusion in the outlet of Wadi Ham, UAE. Environ Geol49:536–551. doi:10.1007/s00254-005-0081-4
Singha K, Gorelick SM (2005) Saline tracer visualized with three-dimensional electrical resistivity tomography:field-scale spatial moment analysis. Water Resour Res 41, W05023. doi:10.1029/2004wr003460
Telford WM, Geldart LP, Sheriff RE (1990) Applied Geophysics. Cambridge University PressTodd DK (1980) Groundwater Hydrology. John Wiley and Sons.Tuong TP, Kam SP, Hoanh CT, Dung LC, Khiem NT, Barr J, Ben DC (2003) Impact of seawater intrusion
control on the environment, land use and household incomes in a coastal area. Paddy Water Environ 1:65–73. doi:10.1007/s10333-003-0015-2
Urish DW, Frohlich RK (1990) Surface electrical resistivity in coastal groundwater exploration. Geoexploration26:267–289. doi:10.1016/0016-7142(90)90008-g
Wilson SR, Ingham M, McConchie JA (2006) The applicability of earth resistivity methods for saline interfacedefinition. J Hydrol 316:301–312. doi:10.1016/j.jhydrol.2005.05.004
Zarroca M, Bach J, Linares R, Pellicer XM (2011) Electrical methods (VES and ERT) for identifying, mappingand monitoring different saline domains in a coastal plain region (Alt Empordà, Northern Spain). J Hydrol409:407–422. doi:10.1016/j.jhydrol.2011.08.052
Electrical Resistivity Tomography for Mapping Groundwater Salinization 35
Related Documents