1 Giarrusso, Pugliese Carratelli and Spulsi Solution to Coastal Disasters Conference Track: Coastal Storms Area of Expertise: coastal flooding Large Scale Coastal Storm Hazard Mapping C.C. Giarrusso † , E.Pugliese Carratelli* & G. Spulsi ‡ † Department of Environmental and Civil Engineering, University of Catania (ITALY) currently at National University of Singapore, TMSI, [email protected]. * E.Pugliese Carratelli c/o Department of Civil Engineering, University of Salerno - [email protected] Fax +39-89-964045 * Corresponding author

Welcome message from author
This document is posted to help you gain knowledge. Please leave a comment to let me know what you think about it! Share it to your friends and learn new things together.
Transcript
1 Giarrusso, Pugliese Carratelli and Spulsi
Solution to Coastal Disasters Conference
Track: Coastal Storms
Area of Expertise: coastal flooding
Large Scale Coastal Storm Hazard Mapping
C.C. Giarrusso
†, E.Pugliese Carratelli* & G. Spulsi
‡
†
Department of Environmental and Civil Engineering, University of Catania (ITALY)
currently at National University of Singapore, TMSI, [email protected].
* E.Pugliese Carratelli c/o Department of Civil Engineering, University of Salerno -
[email protected] Fax +39-89-964045
* Corresponding author
2 Giarrusso, Pugliese Carratelli and Spulsi
‡ EtaBeta, Naples ITALY
Keywords: Coastal flooding, hazard identification, mapping and analysis
The paper will report on the experience gained by the Authors during the compilation of Civil
Protection Contingency Plans for Italian Local and Watershed Authorities, as well as on the
related research activities.
.
The main task carried out in connection with such work was the drawing up of hazard maps for
different time horizons (e.g. 3 and 10 years) and different damage levels; the problem
associated with both coastal erosion forecasting (which affects long term risks) and wave run-up
(which determines short term risks and hazard levels) will be quickly reviewed with a strong
emphasis on the operational application. Thus no discussion will be provided about the relative
efficiency of long-shore erosion models – about which a wealth of literature already exists –
while some information will be provided about the use of laser altimetry, ortophoto imagery and
conventional mapping techniques in providing data on the coastline position.
A special emphasis will be given on the techniques used to evaluate run up risk on low coasts,
by comparing results given by standard formulae with those obtained by making use of 2D
shallow water numerical models of waves; details on model calibration techniques will be given
and the connection between the model output and the potential damage to coastal infrastructure
will be discussed.
GOALS CONFERENCE GOALS CONFERENCE GOALS
Demonstrate and improve links between coastal research, engineering,
management and decision-making.
INTRODUCTION
The protection of coastal area and the planning of its development need a continuous
and reliable assessment of the risks deriving from waves and coastal erosion, not only in
the interest of public safety, but also in order to allow the recreational use of the coast
and the development of the relevant infrastructure.
This is dictated not only by common sense and economical necessity but often by
legal requirements; indeed, local and planning authorities often have to produce and
update hazard maps and storm scenarios for the whole length of the coast in order to
comply with legal requirements and economical necessities. In many Mediterranean
coasts the economic interest of the beaches and the evolution of coastal erosion have put
very densely populated coastal areas and infrastructure within easy reach of wave
action.
1
Research Fellow, Physical Oceanography Research Laboratory, TMSI, National University of
Singapore, Singapore, [email protected]
3 Giarrusso, Pugliese Carratelli and Spulsi
2 Professor of Maritime Hydraulics, Department of Civil Engineering, University of Salerno, 84084
Fisciano, Italy, [email protected]
3 Research Fellow, CUGRI, 84084 Fisciano, Italy
Research on wave action on coastal structures is of course very active and plenty of
results are available for the design of harbour and coastal protection structure such as
groynes and breakwater; these results must be extended, adapted and verified to the
special needs of risk assessment of large coastal areas. In the first place, the shape of
inhabited coasts is usually rather complex, and many of the structures and buildings
located near the shoreline are in a way “soft” targets, much more liable to wave damage
than purpose built coastal works; besides some infrastructures, mainly those related to
tourist industry, only operate during the summer, thus requiring a specific storm return
time analysis (Filianoti, 2001).
Finally, the physical dimension of the problem are often huge, as it may involve tens
of kilometers of coastline, and the results have to be frequently updated to account for
natural or man made changes of the areas: hence the need for efficient hazard
assessment procedures, including with this term not only formulas and software, but
also data collection and analysis techniques. Analysing the risk over large coastal areas
requires evaluating the run up for hundreds of similar – but not quite equal – complex
geometrical configurations; the procedures have to be as objective and standardised as
possible, and “first look” simplified techniques have to be provided for. A large
number of cross sections of the shore have to be surveyed in order to evaluate run up
and potential hazard for coastal dwellings and infrastructure during exceptional storms.
The authors, thanks to their experience in applied research work for Local Authorities
(Provincial, Town and Watershed Authorities,) have built a considerable know how on
the evaluation of erosion and run up wave risk (Giarrusso et al, 1999, Boccotti et al.
2001, Cocco et al., 2001).
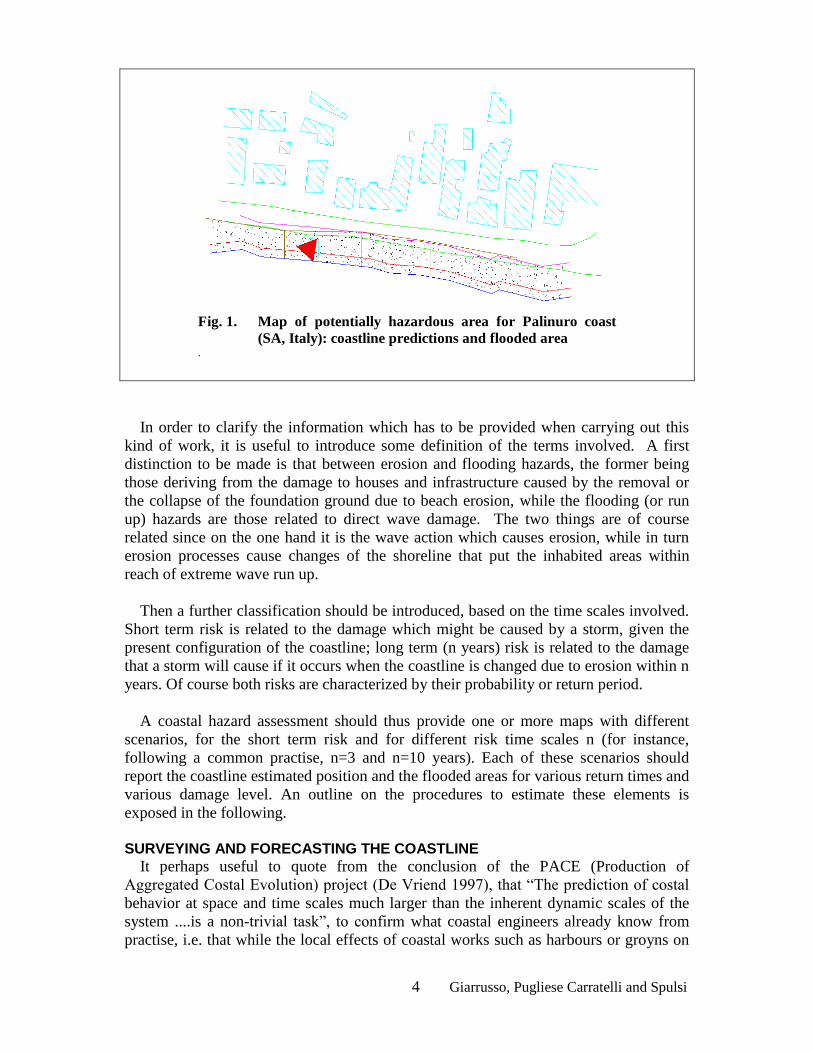
The final objective of these procedures is in any case the the production of hazard
maps or scenarios: Fig 1, taken from Boccotti et al, shows one of such products, where
a number of lines and areas are reported to mark different kinds and levels of risk.
4 Giarrusso, Pugliese Carratelli and Spulsi
In order to clarify the information which has to be provided when carrying out this
kind of work, it is useful to introduce some definition of the terms involved. A first
distinction to be made is that between erosion and flooding hazards, the former being
those deriving from the damage to houses and infrastructure caused by the removal or
the collapse of the foundation ground due to beach erosion, while the flooding (or run
up) hazards are those related to direct wave damage. The two things are of course
related since on the one hand it is the wave action which causes erosion, while in turn
erosion processes cause changes of the shoreline that put the inhabited areas within
reach of extreme wave run up.
Then a further classification should be introduced, based on the time scales involved.
Short term risk is related to the damage which might be caused by a storm, given the
present configuration of the coastline; long term (n years) risk is related to the damage
that a storm will cause if it occurs when the coastline is changed due to erosion within n
years. Of course both risks are characterized by their probability or return period.
A coastal hazard assessment should thus provide one or more maps with different
scenarios, for the short term risk and for different risk time scales n (for instance,
following a common practise, n=3 and n=10 years). Each of these scenarios should
report the coastline estimated position and the flooded areas for various return times and
various damage level. An outline on the procedures to estimate these elements is
exposed in the following.
SURVEYING AND FORECASTING THE COASTLINE
It perhaps useful to quote from the conclusion of the PACE (Production of
Aggregated Costal Evolution) project (De Vriend 1997), that “The prediction of costal
behavior at space and time scales much larger than the inherent dynamic scales of the
system ....is a non-trivial task”, to confirm what coastal engineers already know from
practise, i.e. that while the local effects of coastal works such as harbours or groyns on
Fig. 1. Map of potentially hazardous area for Palinuro coast
(SA, Italy): coastline predictions and flooded area .
5 Giarrusso, Pugliese Carratelli and Spulsi
the costaline can be predicted accurately enough, natural changes over great lengths are
much harder to forecast.
The only way to get something more than an educated guess of what the shoreline will
be in a few years, is to collect as much data as possible about the past behviour and use
of them to calibrate the models which are now easily available. This is easy enough
when the area is reasonably uniform in its geomorphological aspect, but may grossly
fail over complex and irregular coastlines.
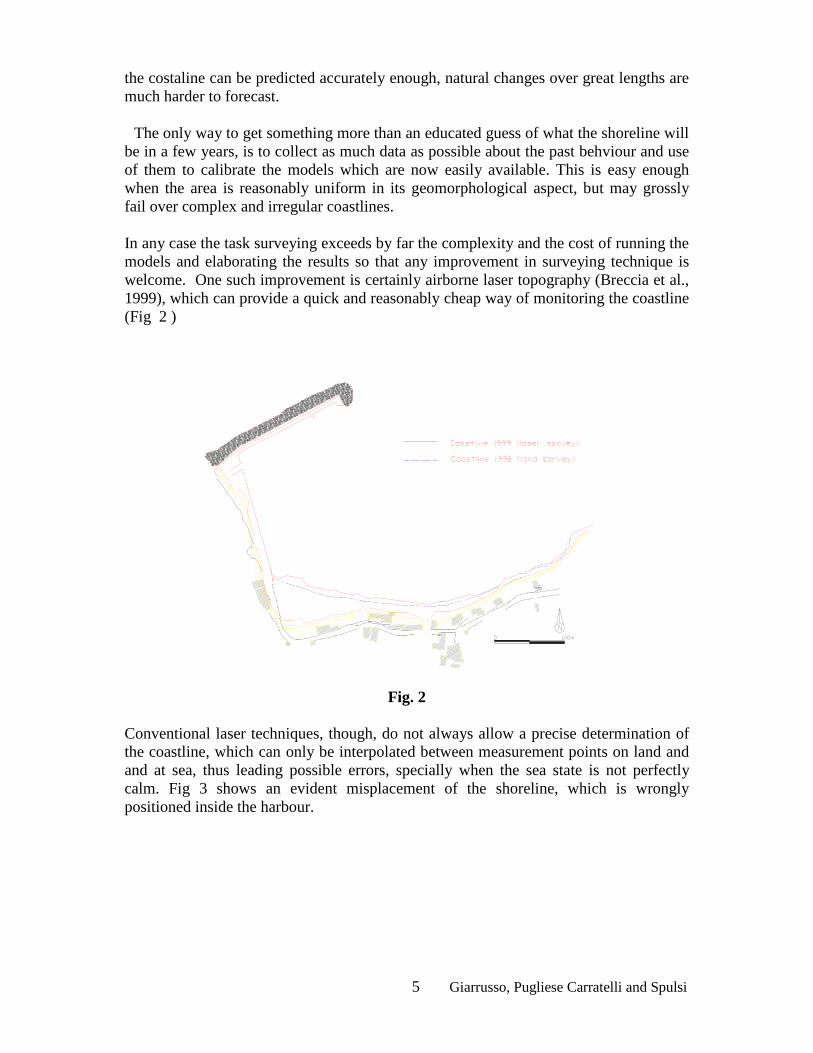
In any case the task surveying exceeds by far the complexity and the cost of running the
models and elaborating the results so that any improvement in surveying technique is
welcome. One such improvement is certainly airborne laser topography (Breccia et al.,
1999), which can provide a quick and reasonably cheap way of monitoring the coastline
(Fig 2 )
Fig. 2
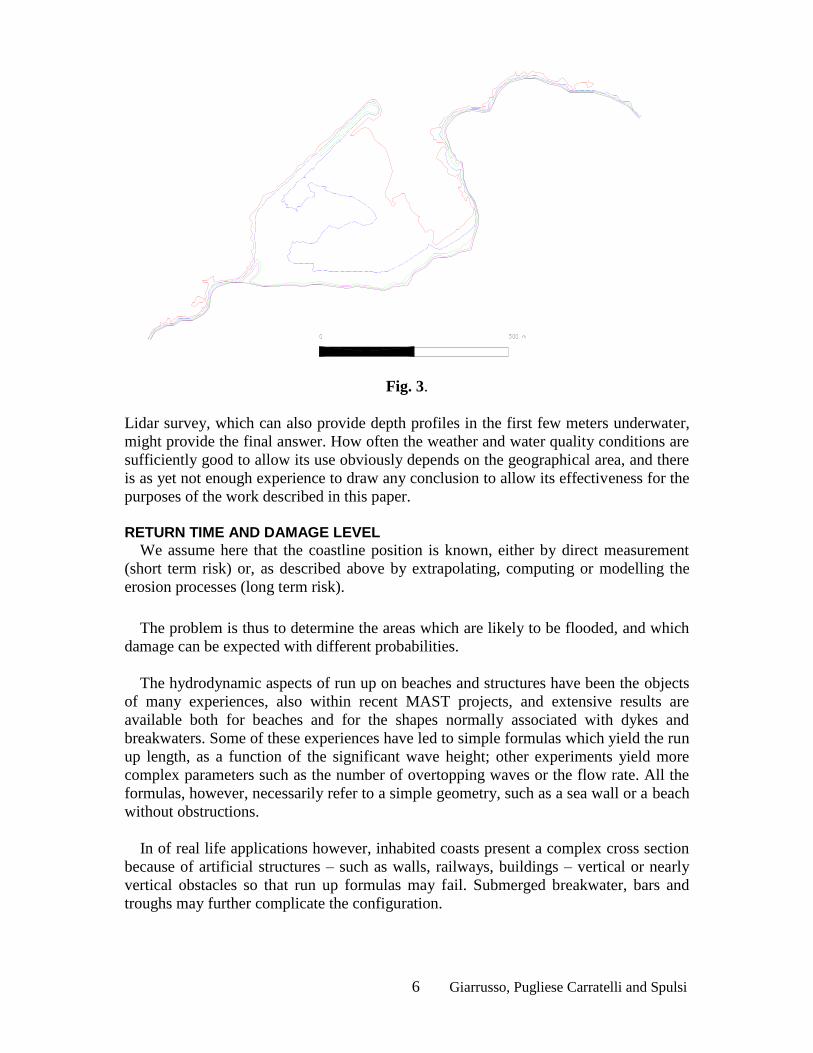
Conventional laser techniques, though, do not always allow a precise determination of
the coastline, which can only be interpolated between measurement points on land and
and at sea, thus leading possible errors, specially when the sea state is not perfectly
calm. Fig 3 shows an evident misplacement of the shoreline, which is wrongly
positioned inside the harbour.
6 Giarrusso, Pugliese Carratelli and Spulsi
Fig. 3.
Lidar survey, which can also provide depth profiles in the first few meters underwater,
might provide the final answer. How often the weather and water quality conditions are
sufficiently good to allow its use obviously depends on the geographical area, and there
is as yet not enough experience to draw any conclusion to allow its effectiveness for the
purposes of the work described in this paper.
RETURN TIME AND DAMAGE LEVEL
We assume here that the coastline position is known, either by direct measurement
(short term risk) or, as described above by extrapolating, computing or modelling the
erosion processes (long term risk).
The problem is thus to determine the areas which are likely to be flooded, and which
damage can be expected with different probabilities.
The hydrodynamic aspects of run up on beaches and structures have been the objects
of many experiences, also within recent MAST projects, and extensive results are
available both for beaches and for the shapes normally associated with dykes and
breakwaters. Some of these experiences have led to simple formulas which yield the run
up length, as a function of the significant wave height; other experiments yield more
complex parameters such as the number of overtopping waves or the flow rate. All the
formulas, however, necessarily refer to a simple geometry, such as a sea wall or a beach
without obstructions.
In of real life applications however, inhabited coasts present a complex cross section
because of artificial structures – such as walls, railways, buildings – vertical or nearly
vertical obstacles so that run up formulas may fail. Submerged breakwater, bars and
troughs may further complicate the configuration.
7 Giarrusso, Pugliese Carratelli and Spulsi
Recent research works (Dodd 1998, Giarrusso et al. 2000, Giarrusso et al. 2001, Hu
et al. 2000, Cavallaro et al. 2001) have shown that numerical models based on Non
Linear Shallow Water equations, possibly matched with Boussinesq equation to handle
wave transformation (Dodd and Giarrusso 2000, Giarrusso 1998), are a useful tool for
complex shapes. In particular, consistent results on typical beach-cross sections with
vertical or sub-vertical obstacles can be obtained, provided that the obstacle height h is
not too high compared with the wave significant height Hs, once the proper calibration
is carried out. Calibration coefficients, such for instance as friction factors or velocity
averaging coefficients are built in the software in various forms.
The input data for such models consists in a cross section of the coast, and a water
height time history. The former can be obtained either by a topographical and
bathymetric survey, or by analysing existing maps - if they exist and are reliable enough
- while the latter can be simulated, once the storm parameters such as the significant
wave height Hs and peak period Tp are known. The output will then be a time history
of water height and velocity in any given location along the section of the coast.
While determining the offshore storm parameters Hs and Tp as a function of their
return time is a classical problem of maritime engineering, and it presents no difficulty
once enough data are available, relating the time description of the run up to the
expected damage is a problem in itself. What are the tolerable limits for buildings,
roads, housing, etc, in terms of extreme wave runup height, peak flow, duration, etc?
There is some literature on the subject, but it is not always consistent, and it needs to be
at least critically reviewed, also in connection with legal requirements.
A possible way is suggested by a table reported by Franco et al. (1994) and Mc
Konnell (1998) which yields the maximum admissible average flow rate for different
structures or activities, such as buildings, pedestrian walking areas, car traffic, etc.
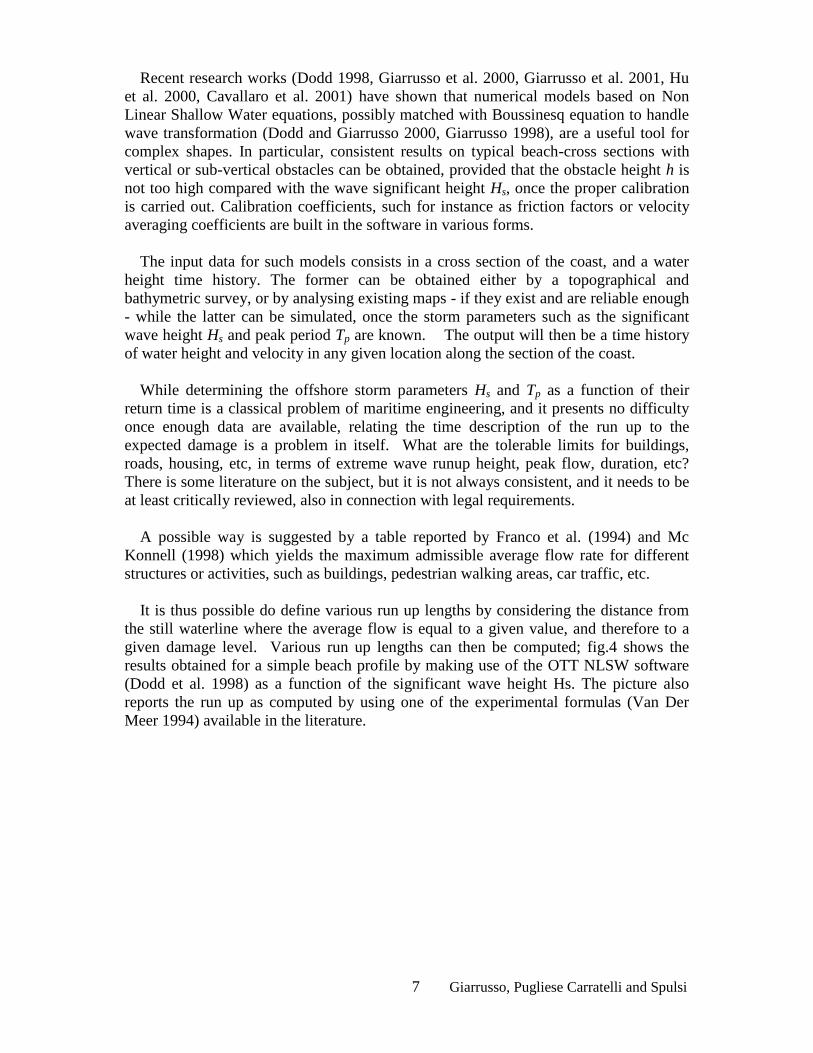
It is thus possible do define various run up lengths by considering the distance from
the still waterline where the average flow is equal to a given value, and therefore to a
given damage level. Various run up lengths can then be computed; fig.4 shows the
results obtained for a simple beach profile by making use of the OTT NLSW software
(Dodd et al. 1998) as a function of the significant wave height Hs. The picture also
reports the run up as computed by using one of the experimental formulas (Van Der
Meer 1994) available in the literature.
8 Giarrusso, Pugliese Carratelli and Spulsi
Run up length Vs Wave heights
Beach slope : over SWL 4% - under SWL 8.7%
10
20
30
40
50
60
70
80
90
5 6 7 8
Wave heights - (meters)
Ru
n u
p l
en
gth
- (
me
ters
)Van der Meer
flow 20 l/s
flow 50 l/s
flow 100 l/s
flow 200 l/s
Fig. 4.
It is worth noticing that the run up supplied by the simple formula follows very closely
the behaviour computed by the software; by properly scaling down its values, it is thus
possible to use that formula (or a similar one) for drawing up hazard maps, as long as
the coast profile is not too complex.
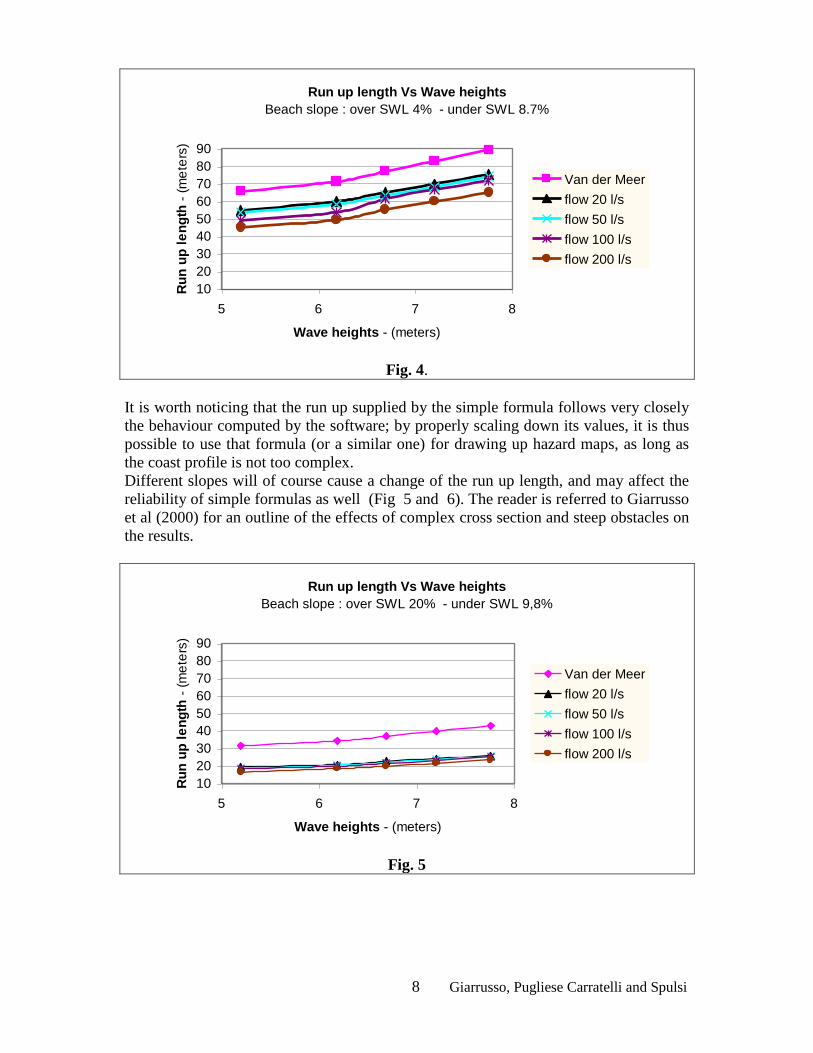
Different slopes will of course cause a change of the run up length, and may affect the
reliability of simple formulas as well (Fig 5 and 6). The reader is referred to Giarrusso
et al (2000) for an outline of the effects of complex cross section and steep obstacles on
the results.
Run up length Vs Wave heights
Beach slope : over SWL 20% - under SWL 9,8%
10
20
30
40
50
60
70
80
90
5 6 7 8
Wave heights - (meters)
Ru
n u
p l
en
gth
- (
me
ters
)
Van der Meer
flow 20 l/s
flow 50 l/s
flow 100 l/s
flow 200 l/s
Fig. 5
9 Giarrusso, Pugliese Carratelli and Spulsi
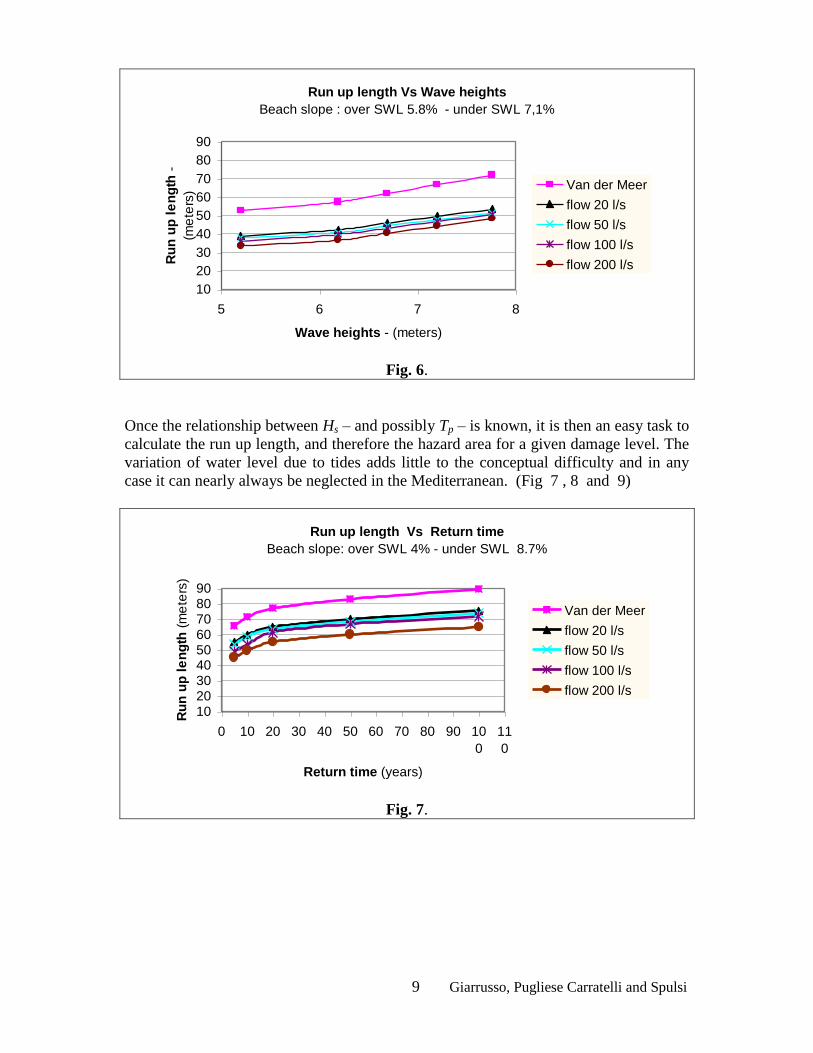
Run up length Vs Wave heights
Beach slope : over SWL 5.8% - under SWL 7,1%
10
20
30
40
50
60
70
80
90
5 6 7 8
Wave heights - (meters)
Ru
n u
p l
en
gth
-
(me
ters
) Van der Meer
flow 20 l/s
flow 50 l/s
flow 100 l/s
flow 200 l/s
Fig. 6.
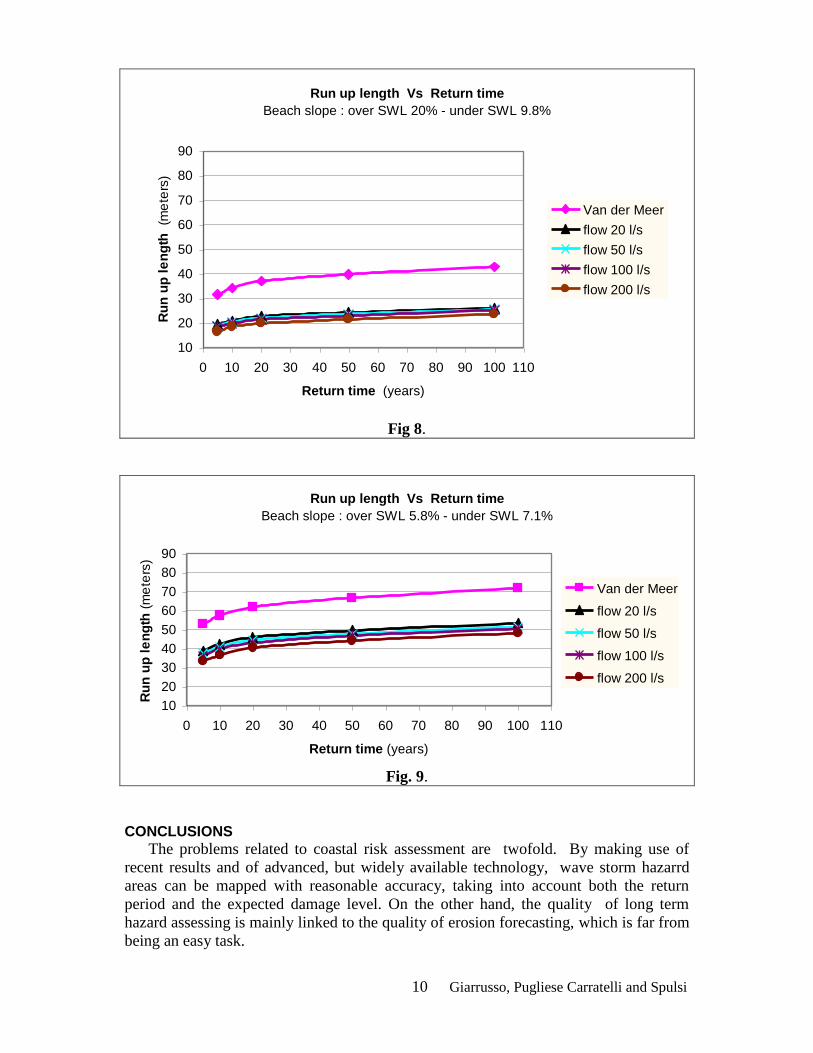
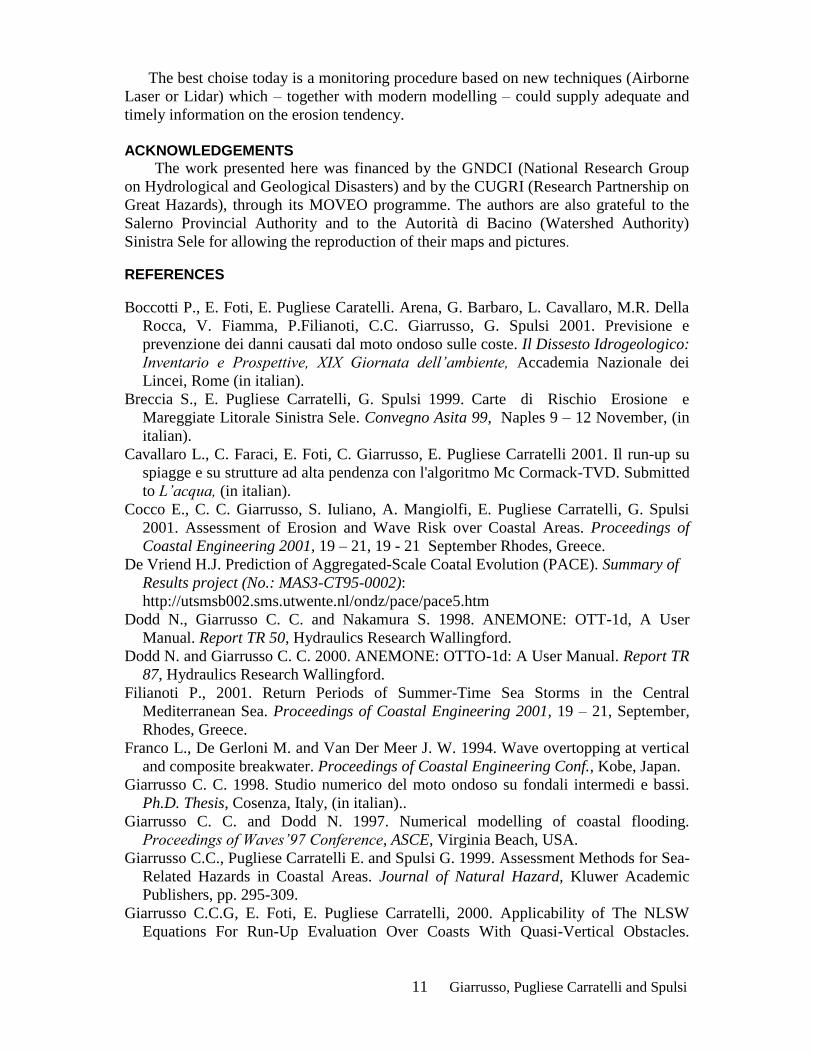
Once the relationship between Hs – and possibly Tp – is known, it is then an easy task to
calculate the run up length, and therefore the hazard area for a given damage level. The
variation of water level due to tides adds little to the conceptual difficulty and in any
case it can nearly always be neglected in the Mediterranean. (Fig 7 , 8 and 9)
Run up length Vs Return time
Beach slope: over SWL 4% - under SWL 8.7%
102030405060708090
0 10 20 30 40 50 60 70 80 90 10
0
11
0
Return time (years)
Ru
n u
p l
en
gth
(m
ete
rs)
Van der Meer
flow 20 l/s
flow 50 l/s
flow 100 l/s
flow 200 l/s
Fig. 7.
10 Giarrusso, Pugliese Carratelli and Spulsi
Run up length Vs Return time
Beach slope : over SWL 20% - under SWL 9.8%
10
20
30
40
50
60
70
80
90
0 10 20 30 40 50 60 70 80 90 100 110
Return time (years)
Ru
n u
p l
en
gth
(m
ete
rs)
Van der Meer
flow 20 l/s
flow 50 l/s
flow 100 l/s
flow 200 l/s
Fig 8.
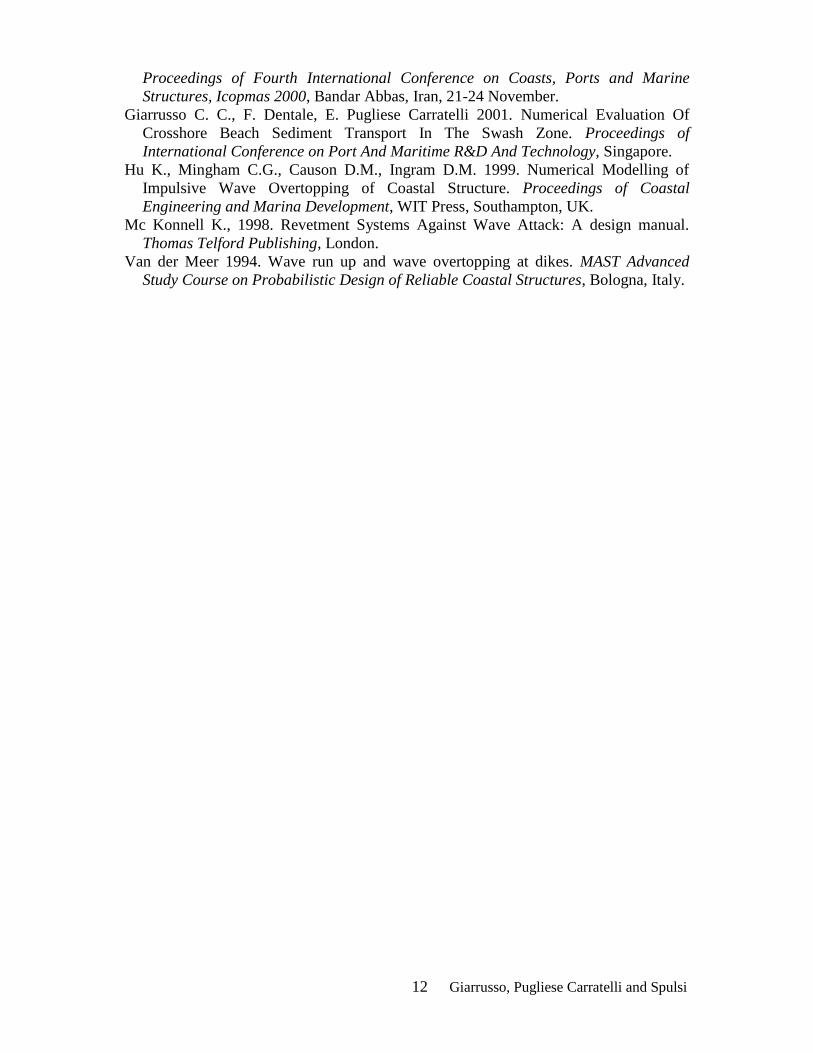
Run up length Vs Return time
Beach slope : over SWL 5.8% - under SWL 7.1%
10
20
30
40
50
60
70
80
90
0 10 20 30 40 50 60 70 80 90 100 110
Return time (years)
Ru
n u
p l
en
gth
(m
ete
rs)
Van der Meer
flow 20 l/s
flow 50 l/s
flow 100 l/s
flow 200 l/s
Fig. 9.
CONCLUSIONS
The problems related to coastal risk assessment are twofold. By making use of
recent results and of advanced, but widely available technology, wave storm hazarrd
areas can be mapped with reasonable accuracy, taking into account both the return
period and the expected damage level. On the other hand, the quality of long term
hazard assessing is mainly linked to the quality of erosion forecasting, which is far from
being an easy task.
11 Giarrusso, Pugliese Carratelli and Spulsi
The best choise today is a monitoring procedure based on new techniques (Airborne
Laser or Lidar) which – together with modern modelling – could supply adequate and
timely information on the erosion tendency.
ACKNOWLEDGEMENTS
The work presented here was financed by the GNDCI (National Research Group
on Hydrological and Geological Disasters) and by the CUGRI (Research Partnership on
Great Hazards), through its MOVEO programme. The authors are also grateful to the
Salerno Provincial Authority and to the Autorità di Bacino (Watershed Authority)
Sinistra Sele for allowing the reproduction of their maps and pictures.
REFERENCES
Boccotti P., E. Foti, E. Pugliese Caratelli. Arena, G. Barbaro, L. Cavallaro, M.R. Della
Rocca, V. Fiamma, P.Filianoti, C.C. Giarrusso, G. Spulsi 2001. Previsione e
prevenzione dei danni causati dal moto ondoso sulle coste. Il Dissesto Idrogeologico:
Inventario e Prospettive, XIX Giornata dell’ambiente, Accademia Nazionale dei
Lincei, Rome (in italian).
Breccia S., E. Pugliese Carratelli, G. Spulsi 1999. Carte di Rischio Erosione e
Mareggiate Litorale Sinistra Sele. Convegno Asita 99, Naples 9 – 12 November, (in
italian).
Cavallaro L., C. Faraci, E. Foti, C. Giarrusso, E. Pugliese Carratelli 2001. Il run-up su
spiagge e su strutture ad alta pendenza con l'algoritmo Mc Cormack-TVD. Submitted
to L’acqua, (in italian).
Cocco E., C. C. Giarrusso, S. Iuliano, A. Mangiolfi, E. Pugliese Carratelli, G. Spulsi
2001. Assessment of Erosion and Wave Risk over Coastal Areas. Proceedings of
Coastal Engineering 2001, 19 – 21, 19 - 21 September Rhodes, Greece.
De Vriend H.J. Prediction of Aggregated-Scale Coatal Evolution (PACE). Summary of
Results project (No.: MAS3-CT95-0002):
http://utsmsb002.sms.utwente.nl/ondz/pace/pace5.htm
Dodd N., Giarrusso C. C. and Nakamura S. 1998. ANEMONE: OTT-1d, A User
Manual. Report TR 50, Hydraulics Research Wallingford.
Dodd N. and Giarrusso C. C. 2000. ANEMONE: OTTO-1d: A User Manual. Report TR
87, Hydraulics Research Wallingford.
Filianoti P., 2001. Return Periods of Summer-Time Sea Storms in the Central
Mediterranean Sea. Proceedings of Coastal Engineering 2001, 19 – 21, September,
Rhodes, Greece.
Franco L., De Gerloni M. and Van Der Meer J. W. 1994. Wave overtopping at vertical
and composite breakwater. Proceedings of Coastal Engineering Conf., Kobe, Japan.
Giarrusso C. C. 1998. Studio numerico del moto ondoso su fondali intermedi e bassi.
Ph.D. Thesis, Cosenza, Italy, (in italian)..
Giarrusso C. C. and Dodd N. 1997. Numerical modelling of coastal flooding.
Proceedings of Waves’97 Conference, ASCE, Virginia Beach, USA.
Giarrusso C.C., Pugliese Carratelli E. and Spulsi G. 1999. Assessment Methods for Sea-
Related Hazards in Coastal Areas. Journal of Natural Hazard, Kluwer Academic
Publishers, pp. 295-309.
Giarrusso C.C.G, E. Foti, E. Pugliese Carratelli, 2000. Applicability of The NLSW
Equations For Run-Up Evaluation Over Coasts With Quasi-Vertical Obstacles.
12 Giarrusso, Pugliese Carratelli and Spulsi
Proceedings of Fourth International Conference on Coasts, Ports and Marine
Structures, Icopmas 2000, Bandar Abbas, Iran, 21-24 November.
Giarrusso C. C., F. Dentale, E. Pugliese Carratelli 2001. Numerical Evaluation Of
Crosshore Beach Sediment Transport In The Swash Zone. Proceedings of
International Conference on Port And Maritime R&D And Technology, Singapore.
Hu K., Mingham C.G., Causon D.M., Ingram D.M. 1999. Numerical Modelling of
Impulsive Wave Overtopping of Coastal Structure. Proceedings of Coastal
Engineering and Marina Development, WIT Press, Southampton, UK.
Mc Konnell K., 1998. Revetment Systems Against Wave Attack: A design manual.
Thomas Telford Publishing, London.
Van der Meer 1994. Wave run up and wave overtopping at dikes. MAST Advanced
Study Course on Probabilistic Design of Reliable Coastal Structures, Bologna, Italy.
Related Documents


