DNV KEMA Energy & Sustainability 1 LARGE SCALE BIOMETHANE INJECTION INTO THE GRID: IS CURRENT LEGAL FRAMEWORK AN ENABLER OR AN OBSTACLE? 1,2 ANNA BUTENKO 3 AND JOHAN HOLSTEIN 4 Keywords: biomethane, biogas, green gas, legal framework, grid injection, network, regulation 1 The current paper draws upon an earlier paper of the authors, see Butenko et al. (2012) 2 The current paper is produced within the framework of EDGaR project (http://www.edgar-program.com/) ‘The use of new energy resources: the role of law and the impact on networks’ ( http://www.edgar- program.com/projects/c7). The authors would like to thank Dr. Olivia Woolley of the University of Aberdeen, for stimulating their thinking on this topic with her deep and critical questions, as well as Dr. Maroeska Boots of DNV GL Energy Advisory, for her input and suggestions, as well review of the current paper. 3 Anna Butenko is Consultant Gas Markets, Policy and Strategy at DNV GL Energy Advisory, Energieweg 17, 9743 AN Groningen, the Netherlands, Phone: +31(0)507009733, E-mail: [email protected]. The contents of this paper reflect the authors’ personal views. 4 Johan Holstein is Consultant Green Gases, DNV GL Oil & Gas, Energieweg 17, 9743 AN Groningen, the Netherlands, Phone: +31(0)507009849, E-mail: [email protected]. The contents of this paper reflect the authors’ personal views. Abstract In this paper we analyse biomethane injection into the grid from the perspective of a degree of fit between the level of technology and the formal institutions (laws and regulations) supporting it. We conclude that there are situations in which biomethane produced cannot be injected into the grid due to capacity constraints and / or monopolization of the available capacity by other biomethane producers. We also illustrate a number of technical solutions for accommodating biomethane in the natural gas grid and analyse how these solutions are reflected in the legal framework. On the basis of this analysis we conclude that the degree of fit between the current legal framework (aimed at uni-lateral flows from upstream production to downstream consumption) and the current biomethane developments (translating into downstream production and sometimes upstream consumption) is not sufficient for the efficient functioning of the energy market (i.e. corresponding to the criteria of balanced cost-benefit distribution, market access and level-playing field). In this paper we propose a number of measures for reactive changes to the legal framework which could help increase the future degree of fit between the two.

Welcome message from author
This document is posted to help you gain knowledge. Please leave a comment to let me know what you think about it! Share it to your friends and learn new things together.
Transcript
DNV KEMA Energy & Sustainability
1
LARGE SCALE BIOMETHANE INJECTION INTO THE GRID: IS
CURRENT LEGAL FRAMEWORK AN ENABLER OR AN OBSTACLE?1,2
ANNA BUTENKO3 AND JOHAN HOLSTEIN
4
Keywords: biomethane, biogas, green gas, legal framework, grid injection, network, regulation
1 The current paper draws upon an earlier paper of the authors, see Butenko et al. (2012)
2 The current paper is produced within the framework of EDGaR project (http://www.edgar-program.com/) ‘The
use of new energy resources: the role of law and the impact on networks’ (http://www.edgar-
program.com/projects/c7). The authors would like to thank Dr. Olivia Woolley of the University of Aberdeen,
for stimulating their thinking on this topic with her deep and critical questions, as well as Dr. Maroeska Boots of
DNV GL Energy Advisory, for her input and suggestions, as well review of the current paper. 3 Anna Butenko is Consultant Gas Markets, Policy and Strategy at DNV GL Energy Advisory, Energieweg 17,
9743 AN Groningen, the Netherlands, Phone: +31(0)507009733, E-mail: [email protected]. The
contents of this paper reflect the authors’ personal views. 4 Johan Holstein is Consultant Green Gases, DNV GL Oil & Gas, Energieweg 17, 9743 AN Groningen, the
Netherlands, Phone: +31(0)507009849, E-mail: [email protected]. The contents of this paper reflect
the authors’ personal views.
Abstract
In this paper we analyse biomethane injection into the grid from the perspective of a degree
of fit between the level of technology and the formal institutions (laws and regulations)
supporting it. We conclude that there are situations in which biomethane produced cannot be
injected into the grid due to capacity constraints and / or monopolization of the available
capacity by other biomethane producers. We also illustrate a number of technical solutions
for accommodating biomethane in the natural gas grid and analyse how these solutions are
reflected in the legal framework. On the basis of this analysis we conclude that the degree of
fit between the current legal framework (aimed at uni-lateral flows from upstream
production to downstream consumption) and the current biomethane developments
(translating into downstream production and sometimes upstream consumption) is not
sufficient for the efficient functioning of the energy market (i.e. corresponding to the criteria
of balanced cost-benefit distribution, market access and level-playing field). In this paper we
propose a number of measures for reactive changes to the legal framework which could help
increase the future degree of fit between the two.
DNV KEMA Energy & Sustainability
2
1 INTRODUCTION
The decreasing gas reserves in Europe, along with the domestic gas demand which is recovering from
the economic crisis and is projected to further increase, create a growing dependence on the energy
imports from outside the EU and shape the security of supply concerns. In addition to the security of
supply, environmental concerns are gaining an increasingly prominent position in both public and
political discourse. Besides their positive effect on reducing the emissions, the renewable energy
sources (RES) produced in Europe can decrease the import dependence, thereby partially addressing
the security of supply issue.
An example of technological development which has evolved in response to both the security of
supply and environmental concerns is biomethane (biogas upgraded to the natural gas quality, which
could be injected into the natural gas pipelines). The production of biogas and biomethane has rapidly
increased in the Netherlands in the recent years and it is projected to continue at such a speed in the
future. The Dutch government is targeting a 10-fold increase of the amount of biomethane to be
injected into the natural gas grid by 2020 compared to the current volumes.5
At the moment the Dutch biomethane producers have the option to inject it either into the distribution
grid at the maximum pressure of 8 bar or into the transmission grid at the pressure of 40-80 bar. Most
biomethane producers choose to inject their gas into a DSO (Distribution System Operator) grid, as the
compression and network connection costs, which in the Netherlands are borne by the producer, are
significantly lower in this case. The volume of gas each producer can inject into the grid is situation-
specific and is decided upon by the DSO based on a number of conditions (e.g. grid capacity, gas
demand).
Due to the limited grid injection capacities in some parts of the grid (especially due to low gas demand
in warm summer months), many biomethane producers already face the situation when they produce
more gas than they can inject at the preferred location. When this indeed occurs, there are a number of
technical solutions available to the involved market parties to deal with the biomethane which cannot
be injected into the grid. However, it seems that such solutions, whereas technically and economically
feasible, are not always properly implemented on account of the limitations of the current legal
framework applicable to biomethane in the Netherlands.
5 It is estimated that at the moment biomethane injected into the natural grid is less than 1% of total national gas
demand (DNV KEMA analysis). Dutch government aims to replace around 8- 10% of total national gas demand
by biomethane by 2020. For more information, please see (in Dutch): http://groengas.nl/routekaart-groen-gas/,
last accessed on 21 November 2013.
DNV KEMA Energy & Sustainability
3
The Dutch environmental targets presumes that biomethane would be injected into the natural gas grid
at a much larger scale compared to the current situation, and such major up-scaling of the biomethane
injection into the grid could be problematic under the current legal framework. In other words,
increasing biomethane production would further aggravate the problem of insufficient injection
capacity due to low gas demand, should the legal network remain unchanged. This could represent a
potential obstacle in achieving the Dutch environmental targets.
Our working hypothesis is that a certain degree of ‘fit’ between the level of technology (biomethane)
and the formal institutions (legal framework applicable to biomethane injection) is necessary for the
satisfactory energy market functioning. Therefore, in the current paper we aspire to address the
coherence between the specific technological innovation (biomethane) and the formal institutions at
Dutch national level necessary for its large scale implementation (consistent with the Dutch
government’s goals) through the prism of institutional economics.
Paper Outline
We begin with the illustration of the used theoretical framework as applied to biomethane and of the
utilised methodology. We then provide a detailed description of the current situation regarding the
biomethane injection into the grid in the Netherlands. As the next step, we present several technical
solutions for biomethane producers for dealing with excess biomethane (which cannot be injected into
the grid due to technical limitations or due to the utilisation of the injection capacity by the incumbent
biomethane producers) and analyse how these solutions are reflected in the current legal framework (if
at all). This analysis is performed with the aim of identifying whether the degree of fit between the
level of technological innovation (the technical solutions for excess biomethane) and the
accompanying institutional reality (the relevant legal framework) is sufficient as to allow the large
scale technology market implementation (large scale biomethane injection, consistent with the Dutch
national goals). Finally, recommendations are provided on how the legal framework could be adapted,
or (re)designed as to allow this large scale implementation, in case a gap between the two is identified.
DNV KEMA Energy & Sustainability
4
2 TECHNICAL DEFINITIONS
In order to avoid misunderstanding, we assume the following definitions of biogas and biomethane:
Biogas is a natural gaseous product originating from the breakdown of organic material and is actively
produced from a variety of dry and wet organic sources (referred to as biomass).6 In the context of this
paper the focus will be on biogas produced by the means of anaerobic digestion.7 The produced biogas
which has not undergone any further treatments is referred to as raw biogas. The main components of
raw biogas are methane (CH4) and carbon dioxide (CO2). However, it still contains a number of trace
components (hydrogen sulphide (H2S), water (H20) etc.). Without further treatment, raw biogas can
be used as a fuel source for local electrical power and heat generation. The boilers and engine-
generator sets used are specifically designed or modified to operate with biogas of that particular
quality.
Alternatively, certain trace components can be removed from raw biogas (in order to increase its
methane content and make it possible to inject into the gas grid) and it can be upgraded to biomethane,
which is a high-quality methane fuel that is virtually indistinguishable from conventional natural
gases. In the Netherlands, biomethane is often referred to as ‘green gas.’ The specific upgrading steps
depend on the composition of raw biogas, the final form of the biomethane (e.g. low pressure gas,
compressed, liquefied), its intended use and/or the specific requirements of the transport and/or
distribution system operators.8 Biomethane can be injected in the natural gas grid in order to be further
used as an equivalent to natural gas, as well as being used as bio-CNG or bio-LNG in transport.9
6 Biomass can be derived from animal waste, municipal solid waste, sewage and agricultural wastes, as well as
dedicated energy crops (maize silage, perennial crops, etc.) and is produced in a process of anaerobic digestion
(wet biomass) or alternatively a process of gasification (dry biomass). For more information, please see Chen et
al. (2010) 7 Anaerobic digestion is a biochemical process whereby organic biomass sources are broken down by diverse
population of microorganisms in a low-oxygen environment, thus producing biogas as a natural by-product.
Since the micro-organisms are already present in all organic material (such as liquid animal manure), the process
is triggered once the biomass is placed in a low-oxygen environment, such as biomass digester. 8 Tempelman and Butenko (2013)
9 Ibid.
DNV KEMA Energy & Sustainability
5
3 THEORETIC FRAMEWORK
This paper focuses on the dynamic dimension of the markets and institutions and namely on the
interaction between technological innovation and law and regulation, by adopting the prism of
institutional economics.
We apply the definition of technology, proposed by Christensen: ‘the processes by which an
organisation transforms labor, capital, materials, and information into products and services of greater
value.’10
In this context, innovation refers to ‘a change in one of these technologies.’11
It is notable that
this definition of innovation is similar to the definition from Nedis and Byler (2009), adopted by the
EC Communication “Reviewing Community innovation policy in a changing world”:12
‘Innovation is
the ability to take new ideas and translate them into commercial outcomes by using new processes,
products or services in a way that is better and faster than the competition.’13,14
The same EC Communication states that ‘innovation is the precondition for the creation of a
knowledge-based, low-carbon economy.’15
We therefore assume that innovation is desirable, and that
the EU legislation has an objective of stimulating technological innovation (besides other objectives,
such as market access and the protection of environment.16
In this context we consider the formal
institutions of an economic system (i.e. legislation relevant to the energy market) as either the
constraints and incentives, or the barriers and drivers, for innovation.17
In other words, EU energy law
can either stimulate technological innovation in energy markets (allow its sufficient progress), or
represent a barrier for its development.
However, the relationship between energy law and innovation is not unilateral: technological
innovation also influences the law, as well as impacting social and political preferences in the market.
In other words, there is a continuous interaction between the system (energy market design) and its
10
Christensen (2011) 11
Ibid. 12
COM(2009)442 (2 September 2009) 13
Nedis and Byler (2009) 14
It is also similar to the definition of innovation in the famous “Oslo Manual” (Guidelines for Collecting and
Interpreting Innovation Data), compiled by the OECD and the European Commission (3rd ed., 2005): ‘the
implementation of a new or significantly improved product (good or service), or process, a new marketing
method, or a new organisational method in business practices, workplace organisation or external relations…
The minimum requirement for an innovation is that the product, process, marketing method or organisational
method must be new (or significantly improved) to the firm.’ 15
COM(2009)442 (2 September 2009) 16
Hancher and Larouche (2010) 17
Jonker (2008)
DNV KEMA Energy & Sustainability
6
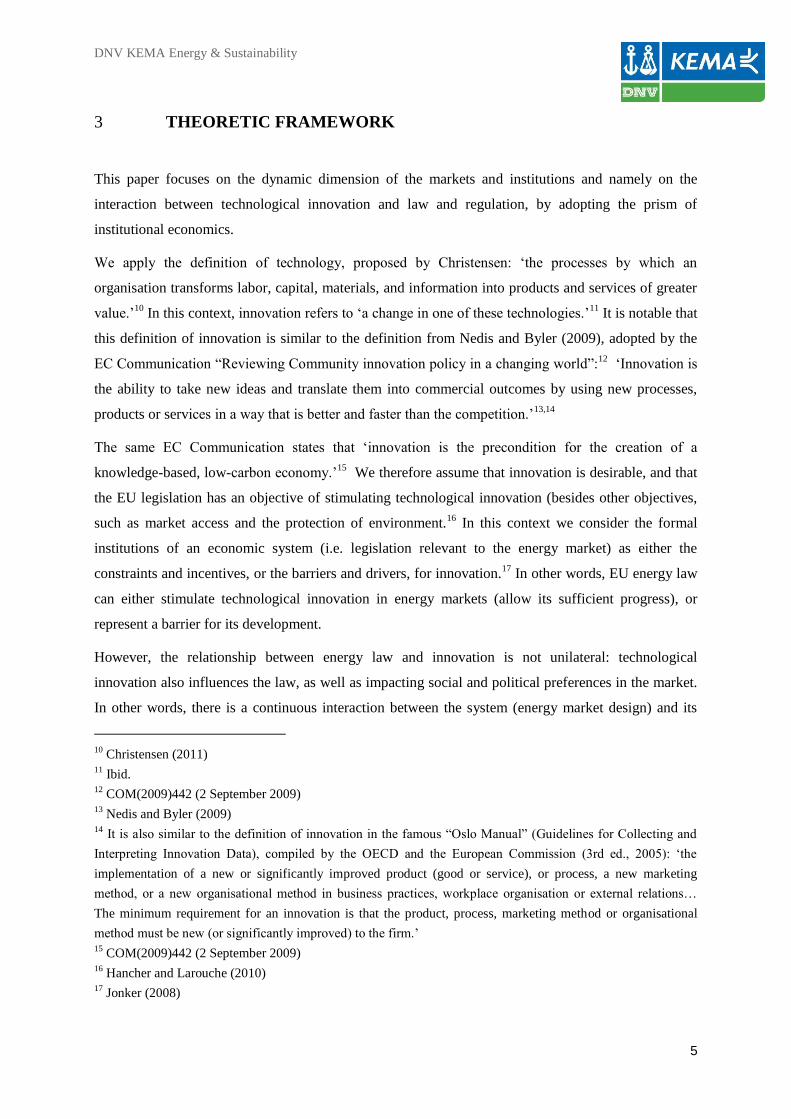
elements.18
This interaction between different elements of the European gas market is best illustrated
in a theoretical framework rooted in institutional economics, developed by Künneke and Groenewegen
(2012), and represented in the figure below:
Figure 1: Dynamic Model of Technological, Socioeconomic Systems (Künneke and Groenewegen (2012))
The above-illustrated model will be discussed in more detail in the sections below.
3.1 Social and Political Preferences
The European gas market is undoubtedly a dynamic environment, which undergoes continuous
changes at the moment.19
Two main concerns- those related to the security of supply and to the
climate change - largely define the current social and political preferences in Europe. These
preferences gradually translate into both technology (e.g. energy efficiency measures and renewable
energy sources) and institutions (e.g. Security of Supply Regulation20
and the Renewable Energy
Directive21
) supporting and promoting them.
18
Ilić and Jelinek (2009) 19
Glachant (2009) 20
Regulation 994/2010 concerning measures to safeguard security of gas supply and repealing Council Directive
2004/67/EC
2
Institutions
Technology Policy
Informal
institutions:
values, norms,
culture
Formal
institutions:
constitutions,
laws, regulations
Institutional
arrangements:
organizations,
contracts and
hybrids
Paradigms
Trajectories
Routines
Interactions by actors
with different
objectives, powers,
strategies, attitudes
and perceptions
DNV KEMA Energy & Sustainability
7
In our analysis we regard social and political preferences as factors influencing (and being influenced
by) both technology and institutions. However, these preferences are not the focus of our research and,
therefore, will not be analysed separately.
3.2 Technology
The model illustrated above distinguishes between different levels of technological practice
(paradigms, trajectories and routines). Technological paradigms refer to ‘the available technological
knowledge on how to approach and solve certain technical challenges’, and change rarely, once in
several decades or decennia.22
Technological trajectories apply ‘this available knowledge to specific
systems’, and can be changed as often as once or more every 10 years.23
The last technological level of
routines is applied on ‘the level of the firm and second order economising, i.e. the realisation of
economies of scale or scope’, and accordingly can be changed quite often.24
Social and political preferences (as well as institutions) have had an impact on the technological
progress and innovation in the energy market in the recent decades, arguably even more so than
previously, due to the changes having occurred in these preferences.25
Innovation responds to social
and political agenda, and namely to the security of supply and climate change concerns: in the recent
decades there have been significant efforts towards increasing the percentage of renewable energy
sources (RES) in the total European energy mix, ranging from improving the profitability of RES’
production to the accommodation of RES in existing infrastructure.
When applied to the technological progress of biogas and biomethane, the levels of technological
practice correspond to the following: whereas the introduction of RES into the energy mix is a new
paradigm, the injection of biomethane into the grid is an example of the application of the available
knowledge to the specific systems and, therefore, is a new trajectory. The technical peculiarities relate
to the routines, such as standard procedures and protocols applicable to biomethane grid injection.
21
Directive 2009/28/EC on the promotion of the use of energy from renewable sources and amending and
subsequently repealing Directives 2001/77/EC and 2003/30/EC 22
Künneke (2008) 23
Ibid. 24
Ibid. 25
Glachant (2009)
DNV KEMA Energy & Sustainability
8
3.3 Institutions
The model also differentiates between different institutional layers (informal, formal and institutional
arrangements). The main criteria for this differentiation are the purpose of the institutions and the
frequency of their change. Informal institutions are deeply rooted in society and refer to values, norms
and culture inherited through many generations.26
Formal institutions refer to ‘formal legal
arrangements like the constitution, law and regulations’.27
They can change within decades, whereas
the institutional arrangements can change more often, e.g. between one year and a decade.28
In the recent decades European gas market has evolved: it moved from monopolistic and vertically-
integrated business model, organised along the national borders, to a more open, liberalised, and
integrated market.29
Whereas it could be argued that a truly liquid and integrated European energy
market has not been achieved yet, it is undoubted that the progress is evident.30
Moreover, new and
changed cornerstones of the EU energy market design have emerged along with the competition, such
as environmental protection and climate change mitigation.31
These are also taking the role of the EU
energy legislation’s obvious objectives.32
The emergence of other objectives in the EU energy law
parallel to the objective of liberalisation illustrates a shift in norms and values, i.e. change in informal
institutions. This shift is also largely due to the changes in the social and political preferences
discussed above.
In further relating the proposed theoretical framework to the specific technological development –
biomethane - we note that the legal framework relevant to biomethane (e.g. the Renewable Energy
Sources Directive),33
represents formal institutions. Technical codes and standards related to the norms
and rules for e.g. the injection of biomethane into the natural gas grid qualify as an example of
institutional arrangements.
26
Künneke and Groenewegen (2009) 27
Ibid. 28
Ibid. 29
Tempelman and Butenko (2013) 30
Hancher and Larouche (2010) 31
Tempelman and Butenko (2013) 32
Hancher and Larouche (2010) 33
Directive 2009/28/EC on the promotion of the use of energy from renewable sources and amending and
subsequently repealing Directives 2001/77/EC and 2003/30/EC
DNV KEMA Energy & Sustainability
9
It is notable that the frequency of change of technological practice’s levels corresponds to that of the
institutional layers: e.g. both technologic trajectories and formal institutions necessary for the
implementation of such trajectories can change once or more every 10 years. Therefore, the legal
framework supporting the technological progress of biomethane can change/ alter within roughly the
same time frame, as needed for biomethane’s wide market adoption.
3.4 Potential gap between technology and institutions
At a certain moment in time, any given market design reflects a combination of existing technology
and institutional structure,34
which, in turn, are based on prior assumptions (about the development of
the technologies and institutional structures) and political and social preferences. Therefore, it is
logical that over time any configuration could become less suited to address the demands placed on it
by changing technology, institutions and/ or political and social preferences.35
In other words, when
one or more factors change and the other(s) remain constant, the degree of fit between them decreases,
thereby creating discrepancy which could lead to significant frictions in the functioning of the market
in question.36
For example, the introduction of an innovation, which is technologically and
economically feasible, as well as possible from the legal perspective, however not acceptable from the
perspective of the social and political preferences (e.g. of certain groups), could be problematic. One
could think of the social and political preferences on nuclear energy after Fukushima as an example of
such discrepancy. Another example of such frictions could be the quota requirement for the utilisation
of a certain energy source (for environmental or security of supply considerations, etc.) without regard
to the technical and/or economic implications. Such requirements could have potentially detrimental
consequences, as opposed to the gains initially envisaged by the policy makers (blackout because of a
technical failure, due to unproven technology, etc.).
We derive our working hypothesis from the argumentation above: a certain degree of ‘fit’ between the
level of technology, formal institutions and political and social preferences is necessary for the
satisfactory energy market functioning.37
As suggested by Künneke (2008), the discrepancy between
the technological innovation and laws and regulations could be eliminated in two ways:38
34
Künneke and Groenewegen (2009), Ilić and Jelinek (2009) 35
Ilić and Jelinek (2009) 36
Künneke (2008) 37
Ibid. 38
As previously mentioned, social and political preferences are not the focus of our research and will therefore
not be analysed separately.
DNV KEMA Energy & Sustainability
10
Reactive: technology develops first, and the institutions have to be adapted in order to adjust
to the technical conditions of the sector;
Proactive: institutional framework provides sufficient incentives for innovation in
technological practice.
In this paper we address the coherence between biomethane as technological innovation and the
formal institutions at Dutch national level necessary for its large scale implementation (consistent with
the Dutch government’s goals) through the prism of institutional economics. In the subsequent
sections we will present and analyse the current Dutch situation in respect to biomethane injection into
the natural gas grid. We will then assess whether the degree of fit between the two is sufficient as to
allow large scale biomethane injection, consistent with the Dutch national goals. We will proceed with
the recommendations on eliminating the established discrepancy between the technology level and the
political aspirations and the legal framework supporting it- reactive adapting of the institutions.
DNV KEMA Energy & Sustainability
11
4 BIOMETHANE INJECTION INTO THE GRID IN THE
NETHERLANDS: CURRENT SITUATION
The producers of raw biogas can choose to utilise the produced biogas (e.g. producing electricity
and/or heat for own consumption or for commercialisation), sell it to third parties, as well as to
upgrade raw biogas to biomethane.39
As previously noted, biomethane could be injected into the
natural gas grid, or alternatively used as bio-CNG or bio-LNG in transport.40
Below we will regard the
situation when biomethane is injected into the natural gas grid, to be used as equivalent to natural gas.
The biomethane in the Netherlands can be injected into both distribution networks at the maximum
pressure of 8 bars and into transmission networks at the pressure of maximum 40- 80 bar.41
Injecting
biomethane into the distribution grid is generally cheaper compared to injecting it into the
transmission grid: this is due to different pipeline connection specifications (transmission grid
operator’s requirements regarding the pipelines materials, diameter, length etc. necessitate a larger
investment in comparison to the requirements of the distribution grid operators), as well lowering
compression costs (from 0 to max. 8 bar for the distribution grid, compared to from 0 to 40 bar for the
transmission grid).42
As in the Netherlands the costs for the injection of biomethane into the grid are
borne by the injecting party (e.g. biomethane producer), these market players are inherently interested
to inject biomethane into the distribution grid, located as close to the production facility as possible (as
to reduce the length of the pipeline connecting this facility to the distribution grid and hence the
costs).43
According to current legislation, the network operators (both transmission and distribution) are
obliged to connect any biomethane producers willing to inject the gas into their system, at the costs of
the producers and subject to technical feasibility and safety.44
Generally speaking, safety requirements
refer to the physical properties of the gas to be injected, such as gas quality (including odorisation),
pressure, temperature, etc.45
Technical feasibility largely refers to the properties of the natural gas grid
(distribution or transmission) into which the biomethane is to be injected. Technical feasibility
determines how much biomethane can be injected into the grid at the preferred (by the producers)
39
Tempelman and Butenko (2013) 40
Ibid. 41
Butenko et al. (2012) 42
Ibid. 43
Ibid. 44
See specifically articles 10.6 and 12.b of the Dutch Gas Act (Gaswet, of 22 June 2000, last updated on 10
September 2013) 45
Tempelman and Butenko (2013)
DNV KEMA Energy & Sustainability
12
injection point, if at all, and under what conditions. In other words, whereas the system operators are
obliged to connect the biomethane producers to the grid, the volume that these parties can actually
inject is situation-specific.46
This volume would typically be specified in the individual connection
agreement (between the grid operator and the biomethane producer) and decided upon by the relevant
grid operator based on a number of conditions:47
Gas pressure and gas flow rate in the grid;
Maximum capacity of the grid section where the biomethane gas producer intends to inject;
Gas demand in the grid section where the producer intends to inject;
Number of biomethane producers in the area, willing to inject into the grid.
Below we discuss some of these conditions in more detail.48
In the following sections we focus upon
biomethane injection into the distribution grid, as this option is preferred by the biomethane injecting
parties in the Netherlands.
4.1 Maximum Capacity of the Grid Section Where the Biomethane Gas Producer
Intends to Inject
The distribution grids are generally designed on the demand-basis: the grids are configured for the
peak demand (on a cold winter day) of the end consumers in a specific area served by the Distribution
System Operator (DSO).49
Therefore, the technical capacity of a grid would largely be defined by the
demand in the area served by the DSO - the more populated the area is and the more industries it has
(and therefore the more customers), the more volume the grid can accommodate.50
Biomethane is produced in different locations throughout the country, depending on the biomass
availability.51
Therefore, the areas with large gas demand (and therefore the distribution grid with large
technical capacity, e.g. urban) are rarely the areas where the biomethane is produced.52
As previously
noted, the biomethane producers are responsible for the costs of the pipeline connecting biomethane
46
Butenko et al. (2012) 47
van Gorkum (2011), Butenko et al. (2012) 48
In the current paper we do not discuss the gas pressure and gas flow rate in the grid further, as it is not relevant
to our subsequent discussion. For more details on this aspect and its impact upon the available biomethane
injection capacity see Butenko et al. (2012) 49
Butenko et al. (2012) 50
Ibid. 51
Woolley (2013) 52
Ibid.
DNV KEMA Energy & Sustainability
13
production facility to the distribution grid and are, therefore, interested to minimise the length of such
pipeline by injecting into the grid located as close to the production facility as possible (e.g. in rural
area).
We witness a hypothetic discrepancy between the areas of the grid where the capacity is the largest
and the areas which are usually preferred by the biomethane producers as injection points. However, in
practice the maximum capacity of the DSO grid is not a limiting factor for the injection of the
biomethane: since the pipelines were designed decennia ago to accommodate peak demand, there is
almost always spare pipeline capacity which could accommodate biomethane, should other factors
allow for it.53
In this context it is important to distinguish between the concepts of total distribution
grid capacity (total capacity of the pipelines, designed for peak demand) and the biomethane injection
capacity (capacity available for the injection of biomethane, determined by a number of factors named
above).
4.2 Gas Demand in the Grid Section Where the Producer Intends to Inject
Traditionally, the distribution grids were designed to carry gas from the high pressure transmission
pipelines to the final customers.54
In this case, the distribution grids would be fed with gas at the
interconnection point with the transmission network: such points are referred to as ‘Gas Receiving
Stations (GRSs)’ in the Netherlands. At the GRSs the de-pressurisation of gas from 40 bar (the
pressure of the transmission network) to 8 bar (the pressure of the distribution network) takes place. In
other words, the traditional gas distribution infrastructure is designed to accommodate a limited
number of gas-feeding entry-points (GRSs) and a large number of gas-consumption exit-points
(customer locations).
However, with the increasing decentralised production of biomethane, the business-as-usual situation
for the distribution system operators changes dramatically: Since there is no legal requirement limiting
the biomethane injection to the dedicated points (e.g. GRSs), the biomethane producers have the right
to request an injection on virtually any point of the distribution network, which the DSOs are obliged
to provide, subject to technical feasibility. As a result, the DSOs have to accommodate a larger
number of the gas-feeding entry points, most of which are located ‘downstream’ of the GRSs. The
53
An exception could be a situation when very high volumes of biomethane are produced in the same region,
exceeding the technical maximum capacity of the DSO grid. This situation has not taken place in the
Netherlands yet. Moreover, in such hypothetic situation (when it might occur) injecting into the TSO grid is a
logical option. 54
Woolley (2013)
DNV KEMA Energy & Sustainability
14
chosen injection point has a large impact upon the biomethane injection capacity available to the
biomethane producers, and namely:
The biomethane injection capacity made available to the biomethane producers at any given moment
cannot exceed the actual demand capacity of gas consumed.55
In other words, the volume of
biomethane the producers can inject into the grid during a certain time (capacity of m3/hour or
m3/day) cannot be more than the gas volume consumed by the customers connected to the DSO grid
during the same time, in the current gas network configuration. In practice, this means that the
maximum volume which an individual biomethane producer is allowed by the DSO to inject will
depend on how high the demand in the DSO segment is at the point in which he wants to inject it.
Since the DSO systems were designed for rather passive unilateral flow from the GRS to the final
customers, it is not technically possible to distribute gas in multiple directions. Only distribution
towards more ‘downstream’ destination is possible, flowing from higher (max. 8 bar) to lower
pressure (min. 1.5 bar) and accordingly through the pipelines of larger diameter towards the pipelines
of smaller diameter. Therefore, the biomethane injected at a certain system level will be limited by the
end consumers’ demand exclusively at that system level. To be more specific: the biomethane
producers who chose to inject at the GRS level would have access to the whole area served by this
particular GRS,56
and, therefore, their injection capacity would be limited by the total demand in the
GRS area. When the producers choose to inject one level down (e.g. at ‘town level’, i.e. the area of the
DSO serving a particular town), their injection capacity would be limited by the demand in this
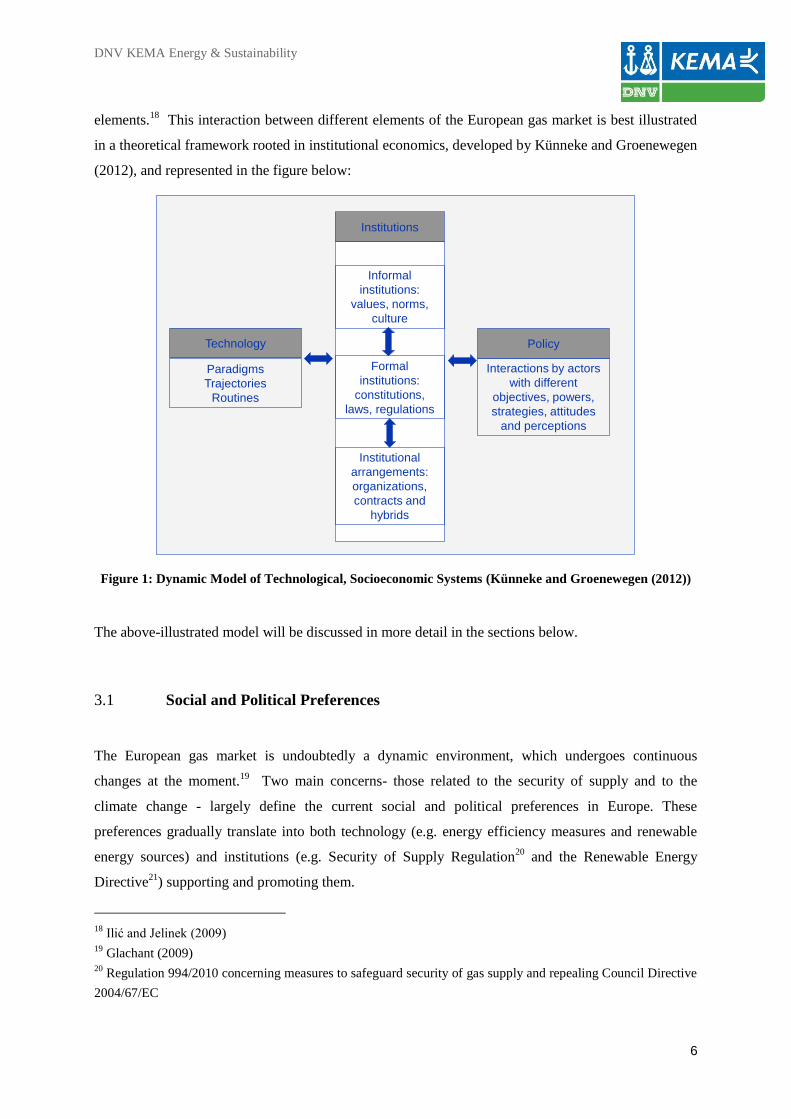
particular town. Similarly, when the biomethane producers inject into the DSO segment serving a
number of streets, they are dependent on the demand of the consumers on those streets. This is
illustrated in the figure below:
55
Butenko et al. (2012) 56
Depending on the DSO size and the area served, the system can be fed by one or more GRSs.
DNV KEMA Energy & Sustainability
15
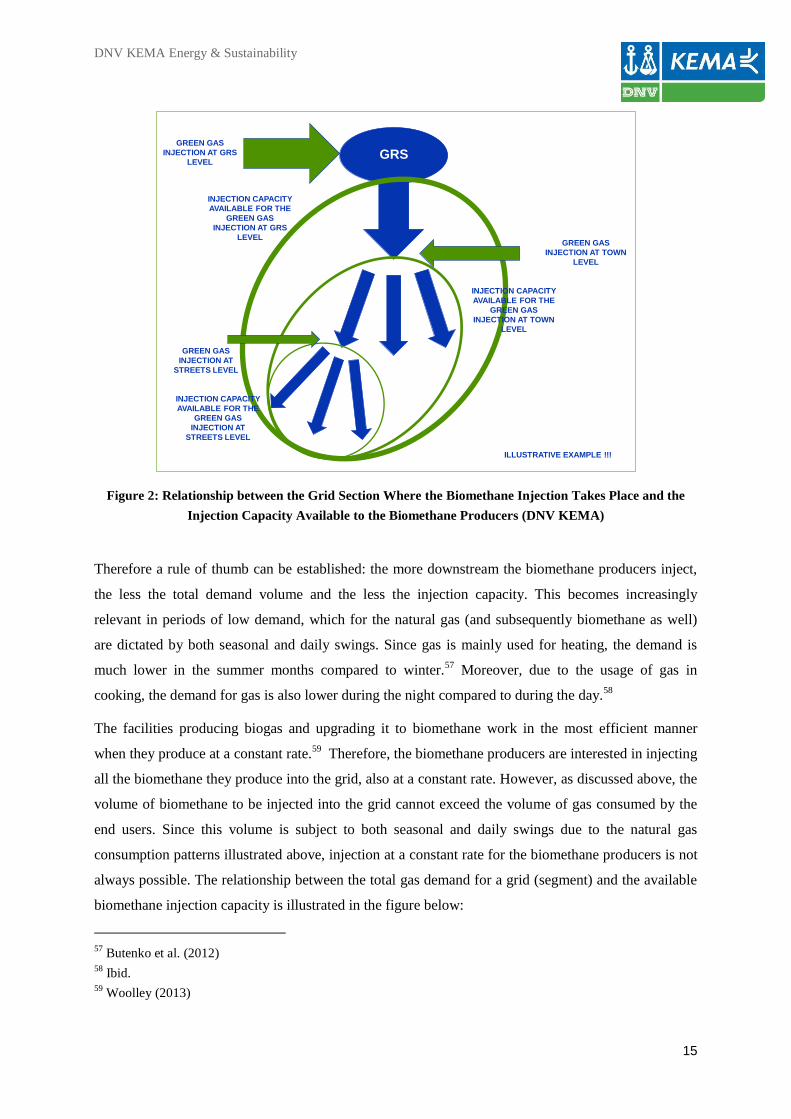
Figure 2: Relationship between the Grid Section Where the Biomethane Injection Takes Place and the
Injection Capacity Available to the Biomethane Producers (DNV KEMA)
Therefore a rule of thumb can be established: the more downstream the biomethane producers inject,
the less the total demand volume and the less the injection capacity. This becomes increasingly
relevant in periods of low demand, which for the natural gas (and subsequently biomethane as well)
are dictated by both seasonal and daily swings. Since gas is mainly used for heating, the demand is
much lower in the summer months compared to winter.57
Moreover, due to the usage of gas in
cooking, the demand for gas is also lower during the night compared to during the day.58
The facilities producing biogas and upgrading it to biomethane work in the most efficient manner
when they produce at a constant rate.59
Therefore, the biomethane producers are interested in injecting
all the biomethane they produce into the grid, also at a constant rate. However, as discussed above, the
volume of biomethane to be injected into the grid cannot exceed the volume of gas consumed by the
end users. Since this volume is subject to both seasonal and daily swings due to the natural gas
consumption patterns illustrated above, injection at a constant rate for the biomethane producers is not
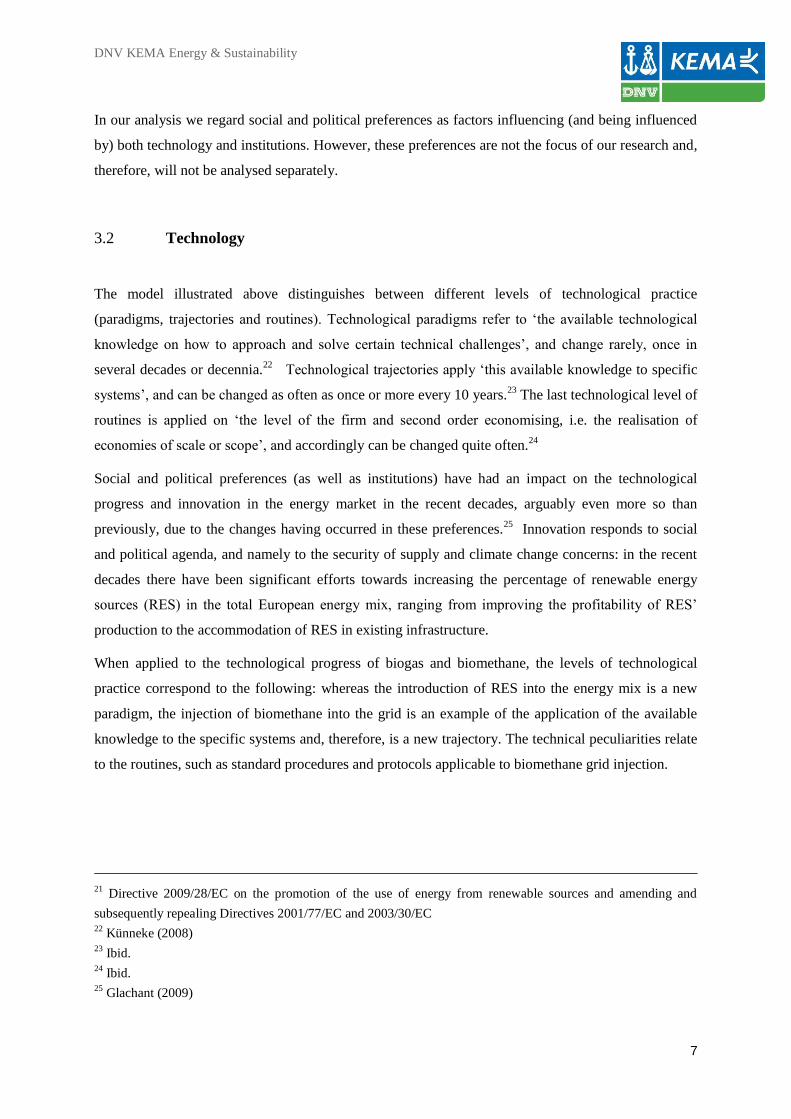
always possible. The relationship between the total gas demand for a grid (segment) and the available
biomethane injection capacity is illustrated in the figure below:
57
Butenko et al. (2012) 58
Ibid. 59
Woolley (2013)
3
GRSGREEN GAS
INJECTION AT GRS
LEVEL
INJECTION CAPACITY
AVAILABLE FOR THE
GREEN GAS
INJECTION AT GRS
LEVELGREEN GAS
INJECTION AT TOWN
LEVEL
INJECTION CAPACITY
AVAILABLE FOR THE
GREEN GAS
INJECTION AT TOWN
LEVEL
GREEN GAS
INJECTION AT
STREETS LEVEL
INJECTION CAPACITY
AVAILABLE FOR THE
GREEN GAS
INJECTION AT
STREETS LEVEL
ILLUSTRATIVE EXAMPLE !!!
DNV KEMA Energy & Sustainability
16
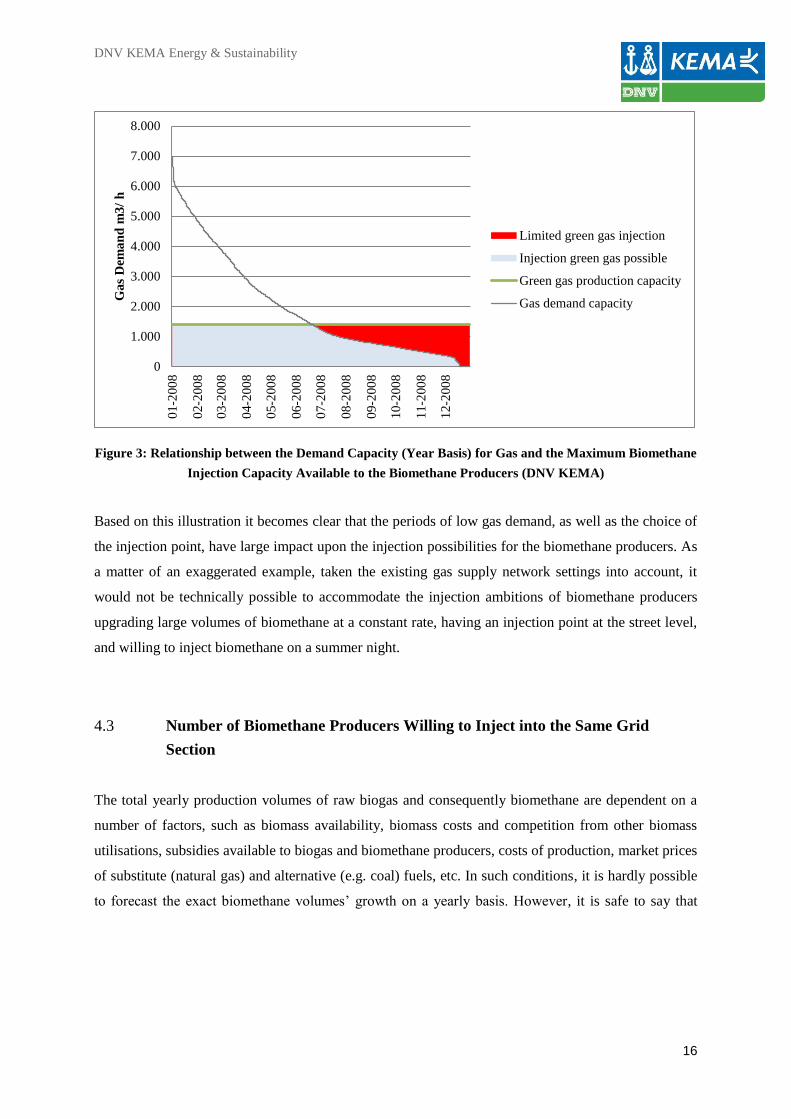
Figure 3: Relationship between the Demand Capacity (Year Basis) for Gas and the Maximum Biomethane
Injection Capacity Available to the Biomethane Producers (DNV KEMA)
Based on this illustration it becomes clear that the periods of low gas demand, as well as the choice of
the injection point, have large impact upon the injection possibilities for the biomethane producers. As
a matter of an exaggerated example, taken the existing gas supply network settings into account, it
would not be technically possible to accommodate the injection ambitions of biomethane producers
upgrading large volumes of biomethane at a constant rate, having an injection point at the street level,
and willing to inject biomethane on a summer night.
4.3 Number of Biomethane Producers Willing to Inject into the Same Grid
Section
The total yearly production volumes of raw biogas and consequently biomethane are dependent on a
number of factors, such as biomass availability, biomass costs and competition from other biomass
utilisations, subsidies available to biogas and biomethane producers, costs of production, market prices
of substitute (natural gas) and alternative (e.g. coal) fuels, etc. In such conditions, it is hardly possible
to forecast the exact biomethane volumes’ growth on a yearly basis. However, it is safe to say that
0
1.000
2.000
3.000
4.000
5.000
6.000
7.000
8.000
01-2
00
8
02-2
00
8
03-2
00
8
04-2
00
8
05-2
00
8
06-2
00
8
07-2
00
8
08-2
00
8
09-2
00
8
10-2
00
8
11-2
00
8
12-2
00
8
Ga
s D
ema
nd
m3
/ h
Limited green gas injection
Injection green gas possible
Green gas production capacity
Gas demand capacity
DNV KEMA Energy & Sustainability
17
biomethane production in the Netherlands has been steadily increasing in the past years and will
continue to do so in the future.60
It could be logical that a forecasted increase in biomethane production volume would automatically
mean an increase in the future number of biomethane producers. However, this is not necessarily the
case: both raw biogas and biomethane production are activities highly sensitive to the economies of
scale and, therefore, the aggregation of production provides significant benefits of cost reduction. In
light of these facts, in the Netherlands the producers’ collectives for biogas and/ or biomethane
production are taking shape.61
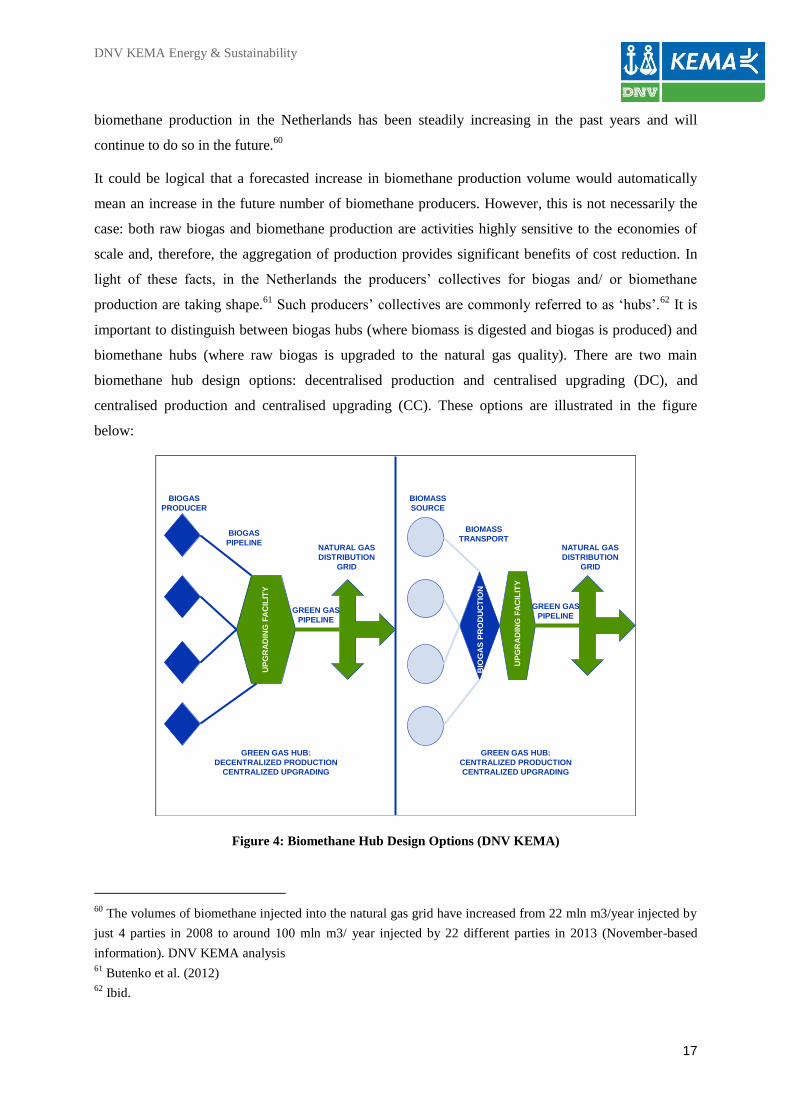
Such producers’ collectives are commonly referred to as ‘hubs’.62
It is
important to distinguish between biogas hubs (where biomass is digested and biogas is produced) and
biomethane hubs (where raw biogas is upgraded to the natural gas quality). There are two main
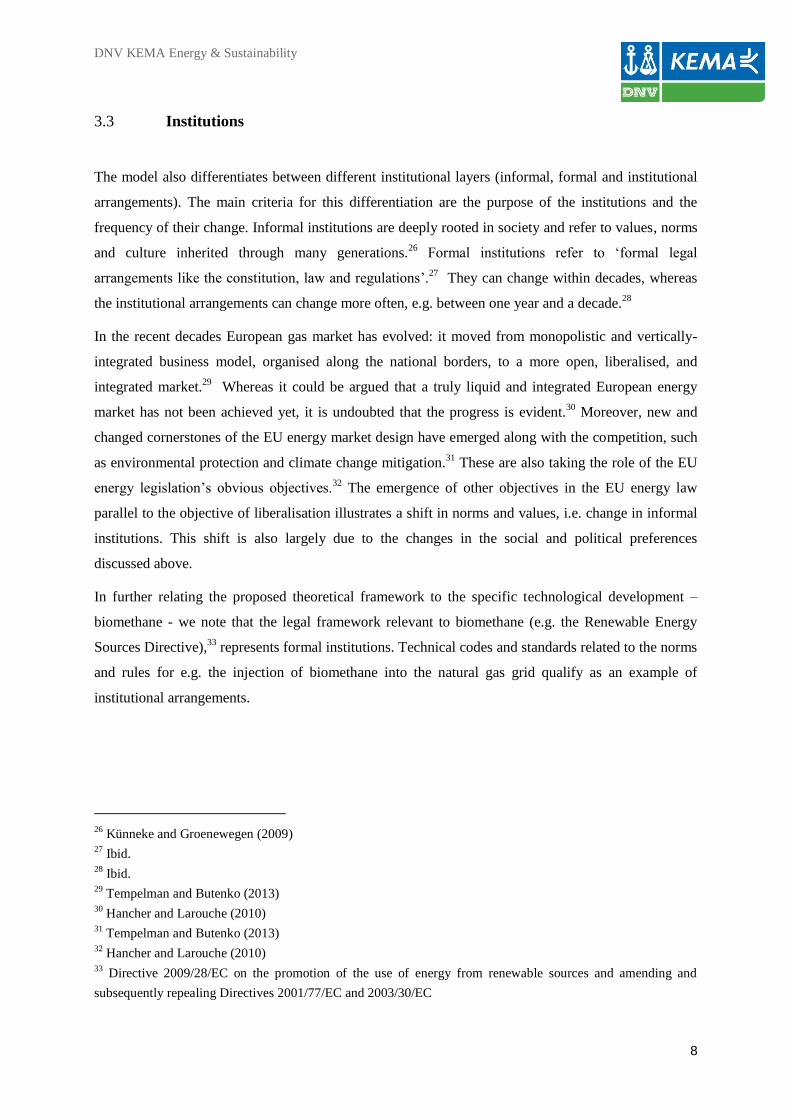
biomethane hub design options: decentralised production and centralised upgrading (DC), and
centralised production and centralised upgrading (CC). These options are illustrated in the figure
below:
Figure 4: Biomethane Hub Design Options (DNV KEMA)
60
The volumes of biomethane injected into the natural gas grid have increased from 22 mln m3/year injected by
just 4 parties in 2008 to around 100 mln m3/ year injected by 22 different parties in 2013 (November-based
information). DNV KEMA analysis 61
Butenko et al. (2012) 62
Ibid.
10
UPGRADING
FACILITY
BIOGAS
PRODUCER
BIOGAS
PIPELINE
GREEN GAS
PIPELINE
NATURAL GAS
DISTRIBUTION
GRID
BIOMASS
SOURCE
BIOMASS
TRANSPORT
GREEN GAS
PIPELINE
NATURAL GAS
DISTRIBUTION
GRID
UP
GR
AD
ING
FA
CIL
ITY
UP
GR
AD
ING
FA
CIL
ITY
BIO
GA
S P
RO
DU
CT
ION
GREEN GAS HUB:
DECENTRALIZED PRODUCTION
CENTRALIZED UPGRADING
GREEN GAS HUB:
CENTRALIZED PRODUCTION
CENTRALIZED UPGRADING
DNV KEMA Energy & Sustainability
18
Therefore, an increase in total biomethane production volumes in the Netherlands could mean an
increase in the ‘size’ of producers through hubs and/or an increase in the number of producers (e.g.
more individual producers each upgrading relatively low volumes of biomethane). It should also be
noted that these two developments are not mutually exclusive; it could very well be the case that, in
the future, both the number of hubs and the number of individual biomethane producers grows.
For each biomethane producer (regardless of its type), the total number of biomethane producers per
grid (section) and the volume of biomethane they produce have direct impact on the injection capacity
available to this biomethane producer. As previously noted, in the Netherlands the biomethane
injecting parties are responsible for the injection costs, meaning that such parties are inherently
interested to inject into the distribution grid located in closest possible proximity to them. However,
due to the technical restrictions, dictated both by the total capacity of the grid section for the injection
point preferred by the producers and by the gas demand in that particular section, the injection
capacity is limited. This limited injection capacity therefore has to be divided between the biomethane
producers wishing to inject biomethane in the grid section in question.
The system operators in the Netherlands treat the requests for the injection capacity placed by the
biomethane producers of the first-come-first-serve (FCFS) basis.63
FCFS principle means that the
available injection capacity can be claimed partially or totally by the first biomethane producer willing
to inject in the particular section of the grid. Therefore, there is significant risk that the incumbent
biomethane producers could monopolise the available injection capacity for biomethane, thereby
disadvantaging the new market entrants who would like to inject the produced biomethane in the same
distribution grid section as the incumbent. In practice this could mean that new market entrants willing
to inject biomethane would get less injection capacity then required by them, or not receive it at all.
This could result in the need for the new entrants to inject the produced biomethane in a different grid
section, or a different grid altogether, which would also translate in a longer pipeline and therefore
larger injection costs.
4.4 Results of Injection Capacity Constraints
As discussed in the sections above, gas pressure and gas flow rate in the grid, maximum capacity and
the gas demand in the grid section where the biomethane gas producer intends to inject, as well as the
number of biomethane producers willing to inject into the particular grid section, all influence the
injection capacity available to the biomethane producer. The combination of technical constraints
63
Butenko et al. (2012), Tempelman and Butenko (2013)
DNV KEMA Energy & Sustainability
19
associated with each of these factors create a situation when injection capacity is limited and in some
cases not available (e.g. to the aspiring biomethane producers).64
Quite naturally, the biomethane
producers are interested to have stability regarding the volumes they can inject into the grid, also
because of the flat production rate typical for the upgrading facilities.65
The availability and the costs
of the grid injection represent an essential part of the business case for the aspiring biomethane
producers, and once the injection point is built the producers benefit the most from injecting all the
produced biomethane into the grid.
Therefore, the limited or not available injection capacity can represent a significant obstacle for both
existing biomethane producers connected to the grid via an injection point and for the new market
entrants. When this indeed occurs, there is a number of technical solutions available to the biomethane
producers to deal with the ‘excess’ biomethane which cannot be injected at the preferred location
because of technical constraints. A number of these solutions will be illustrated below, and
consequently analysed from the perspective of their reflection in the current legal framework
applicable to biomethane on a European and Dutch level.
64
Butenko et al. (2012) 65
Woolley (2013)
DNV KEMA Energy & Sustainability
20
5 OVERVIEW OF TECHNICAL OPTIONS FOR ALLEVIATING THE
INJECTION CAPACITY CONSTRAINS
As outlined above, a number of parallel problems may arise due to technical capacity constraints:
Existing biomethane producers with a constant production level and connected to the DSO
network via an injection point Z for capacity injection X, are faced with technical constraints
and can inject X - Y volumes only. In this case Y volumes cannot be injected, and either
should be flared or an additional technical solution has to be found (initiated by the
biomethane producer);
New biomethane producers, taking the decision to inject biomethane into the grid, can produce
at a constant rate X and want to inject into the DSO network at the injection point Z. Due to
technical constraints and the presence of the existing biomethane producers at the same
injection point, they can only inject Y (Y < X) volumes at the desired injection point. In these
conditions new biomethane producers could choose to build a smaller upgrading installation
producing at constant rate Y and inject at Z, or they could choose to build an upgrading
installation producing at the maximum possible rate X: in this case the X - Y volumes cannot
be injected at Z and have either to be flared or an additional technical solution has to be found
(initiated by the biomethane producer).
In both cases (and the variations thereof) the producers are faced with biomethane that cannot be
injected into the grid- what we refer to as ‘excess’ biomethane. Below we will regard a number of
technical solutions applicable to such gas.66
In doing so, we will also evaluate how these solutions are
reflected in the current legal framework (if at all) and whether the latter is adequate in light of the
current and projected requirements of the biomethane injection.
For such adequacy evaluation strict and well-weighed criteria have to be applied. Since the market
access and the level playing field for all market players represent essential pre-conditions for the
efficient development of the energy market, we assume that the legal framework is adequate when the
following criteria are satisfied:67
66
It should be noted that the situation partially described above, when potential and new biomethane producers
chose to build an installation with lower upgrading capacity (or even not build it at all) as a response to injection
capacity limitations will not be further regarded in this paper. In such a situation, the producers are not faced
with excess biomethane, and it is difficult to establish the losses/foregone income in each individual case, as we
lack information on the decision-making process regarding the investment in the upgrading installations. 67
Hakvoort and Huygen (2012)

DNV KEMA Energy & Sustainability
21
Balanced cost-benefit allocation: the investment costs should be covered by the parties which
cause them (cost reflectivity), and the respective benefits should be attributed to the parties
which have made the investment. In the energy market context the cost-benefit allocation is
not always straight-forward, as it could refer to public goods, such as the security of supply,
lower emissions, stimulation of renewables production, etc.;
Market access: the access to the market (e.g. to the necessary infrastructure) should be
available for all market parties;
Level-playing field: new and small market entrants should be able to perform their activities
along with the incumbents, who are often larger, more established in the market and have a
wider portfolio.
5.1 Injection into Transmission Network
The transmission network with maximum pressure of 40-80 bar in the Netherlands represents an
alternative injection option for biomethane producers. This network, operated by the transmission
system operator (TSO), is characterised by multi-direction flows as opposed to single-direction flows
of the DSO. Moreover, the diameter of the pipelines is larger and pipeline system serves larger
territory than DSOs, with significantly larger demand.68
As a consequence, the injection capacity
available to biomethane producers in the transmission would be subject to much less restrictions
compared to that of the distribution systems, and it is almost always available.69
However, the injection into the TSO grid is around three times costlier compared to the injection into
the DSO grid on yearly costs basis.70
This is namely due to the fact that the requirements of the TSO
regarding the pipelines materials, diameter, length etc. necessitate a larger investment in comparison to
the requirements of the DSOs, as well as higher compression costs (from 0 to max. 40 bar for the TSO,
compared to from 0 to max. 8 bar for the DSO).71
Therefore, in case of injection into the TSO grid,
68
The Dutch national TSO Gas Transport Services serves the whole territory of the Netherlands. The TSO’s
network consists of two parts: high pressure grid (maximum 80 bar) connected to the regional transmission grid
(maximum pressure 40 bar). 69
Of course there could be situations when this capacity is restricted by the demand in the particular section of
the TSO grid, or when the available capacity is fully used by the incumbent biomethane producers. However,
due to the described properties of the TSO network, such as its size and multi-directionality of the flows, the
chances of such situation arising are quite low. 70
Butenko et al. (2012) 71
Ibid.
DNV KEMA Energy & Sustainability
22
the increased costs of injection have to be weighed in against the capacity gains in the transmission
system (compared to the distribution system).72
In the Netherlands the production of biomethane both by the individual producers and by hubs is
stimulated though the SDE+ subsidy. The main idea behind this subsidy is to compensate the
biomethane producers for the difference between the production costs of the renewable energy and its
market price, the latter being usually lower than the former.73
In relation to biomethane production,
the subsidy also extends to the injection into the grid, both for distribution and transmission.74
The
injection costs typically include a biomethane pipeline connecting the upgrading facility to the grid,
the injection and compression unit, and a gas quality meter.75
The SDE+ subsidy, however, only
extends to the injection and compression unit, and not to the biomethane pipeline. The costs for the
latter have to be covered by the injecting party, e.g. biomethane producer. Such a cost structure arises
on account of two factors: On the one hand, the SDE+ aims to enable the production of renewable
energy through sufficient subsidy amounts in general, however these amounts do not have to be all-
covering in each individual case.76
On the other hand, whereas the Gas Directive77
encourages the
Member States to take steps to promote renewable energy, ‘its substantive provisions on system
operator responsibilities do not impose any corresponding obligation on them to modify networks in
support of biomethane injection’,78
meaning that the biomethane pipeline connecting the upgrading
facility to the transmission network falls outside the responsibilities of the TSO, it is not regulated and
the investment into it cannot be recovered through the regulated tariffs.
The TSO network in the Netherlands is rather dense compared to other European countries, but,
nevertheless, the DSO pipelines are much more often situated in the close proximity to the upgrading
facilities compared to the TSO pipelines. Therefore the length of the pipeline will more often be
shorter for the DSO connection than for the TSO connection. Moreover, as noted earlier, the
specifications the TSO imposes on such pipeline are stricter (e.g. pipeline materials, minimal gas
metering intervals and, therefore, length) than those imposed by the DSOs and thus more costly. In
view of these facts, the biomethane injection into the closest DSO pipeline becomes the option of first
choice for the biomethane producers.
72
Woolley (2013) 73
ECN and DNV KEMA (2012) 74
Ibid. 75
Butenko et al. (2012) 76
ECN and DNV KEMA (2012) 77
Directive 2009/73/EC concerning common rules for the internal market in natural gas and repealing Directive
2003/55/EC, OJ 2009 L211/94 78
Woolley (2013)
DNV KEMA Energy & Sustainability
23
Being on one hand more expensive, but on the other hand much less subject to restrictions compared
to the distribution capacity, the transmission capacity could represent an alternative injection option
for the biomethane producers who produce large volumes of biomethane at a constant rate and who
cannot inject (all of) their volume in the closest by distribution network. Due to the fact that
biomethane is sensitive to the economies of scale, the costs associated with the injection into the
transmission grid might be more feasible for large producers and hubs than to individual producers
upgrading (relatively) low volumes of biomethane. Moreover, the biomethane producers injecting into
the TSO grid will not be able to benefit from the ‘cheap’ injection capacity into the DSO grid. The
producers who use the injection into TSO as an option to deal with the excess biomethane which
cannot be injected into the DSO network (meaning that these producers already have an injection point
on the DSO grid) are even worse off financially as they have to pay for both injection points.
Adopting the above-described criteria of balanced cost-benefit allocation, market access and the level-
playing field, we conclude that the option of injection into the transmission grid and the manner in
which it is addressed in the relevant European and Dutch legislation fall short of providing for all of
them in an adequate manner. Firstly, whereas the biomethane injection into the grid brings
environmental benefits, which could be seen as society-wide, the costs for the biomethane pipeline fall
on the producers and are not covered by the SDE+ subsidy. Arguably, this represents different degrees
of difficulty for the biomethane producers who produce large volumes and weigh in larger available
injection capacity against the necessary investment and for the (smaller) biomethane producers who
cannot inject into the nearby distribution grid of their preference due to the capacity constraints (e.g.
capacity being used by incumbent producers). Secondly, as already noted above, injection into the
transmission network may be much more feasible for the biomethane producers producing large
volumes of biomethane and/ or biomethane hubs, than for individual and smaller producers. Moreover,
it could occur that the injection into the transmission grid is the only option for the new biomethane
producers as all the available ‘cheap’ injection capacity at the distribution level has been used by the
incumbent producers. In such situations, it could hardly be argued that the market access is ensured for
all market parties and that all market parties are provided of a level-playing field.
Such concerns could be alleviated in a number of ways: Firstly, the facilitation of the biomethane
injection into the grid could be seen as a core task of the TSO. This would mean that the investment
for building a pipeline connecting the upgrading facility and the transmission grid injection point
would be performed by the TSO and would be recoverable through regulated tariffs. This would
ensure a better cost-benefit allocation in the light of the environmental benefits of the biomethane
production and injection being society-wide. Of course such connection should not be made
universally available to all aspiring biomethane producers: due to relatively low volumes produced
and injected into the grid by some producers, and also due to large distances to the grid (not often the
DNV KEMA Energy & Sustainability
24
case in the Netherlands though), building such a pipeline would not be economically feasible in many
cases. This could be solved by establishing a volume-related and a distance-related limit, which would
enable the biomethane producers with sufficient production and located within a certain maximum
distance to the transmission grid to inject their biomethane into the TSO network.79
Alternatively, the SDE+ subsidy could be altered in order to become more cost-reflective in terms of
the biomethane pipeline investments performed by the biomethane producers injecting into the
transmission grid (e.g. covering one third of total costs). A volume-related and a distance-related limit
are also of high importance here.
Thirdly, when the injection into the distribution grid is not available to small and new parties due to
injection capacity constraints and/ or the fact that the available capacity has been used by the
incumbent producers, other mechanisms could be utilised, such as congestion management (on the
DSO side) and/or demand side management (e.g. stimulating the gas consumption in the periods of
low demand in order to increase the available biomethane injection capacity).80
Moreover, other technical solutions, such as back-feeding from the DSO into the TSO grid and the
coupling of the DSOs could be evaluated for the biomethane producers not able to inject their (excess)
gas instead of the injection into the TSO directly. Such solutions allow the biomethane producers to
benefit from the relatively cheap distribution capacity, while available. These solutions are further
elaborated below.
5.2 Injection into an Alternative Distribution Grid and/ or Coupling of the
Distribution Grids81
In a situation when biomethane producers cannot inject biomethane at the injection point of their
preference in the DSO grid, injection at a different point (usually more ‘upstream’) of the same DSO
network is usually the default solution, as long as there is sufficient injection capacity in the DSO grid
as a whole. However, this is not always the case: in some situations it occurs that the injection capacity
available for biomethane producers in the whole area served by the DSO is too low, either as a result
of technical restrictions or being utilised by the incumbent biomethane producers.
79
It extends beyond the scope of the current paper to provide specific recommendation on the exact threshold of
the volumes and distances which could be possibly applicable to the biomethane producers aspiring to inject into
the TSO grid. 80
These solutions will be addressed in more detail in the subsequent sections of the current paper. 81
The analysis presented in this section builds on an earlier paper by the authors, see Butenko et al. (2012)
DNV KEMA Energy & Sustainability
25
One of the options available to biomethane producers in such situations is injecting into an alternative
(e.g. neighboring) DSO grid. Of course, the same conditionality applies to this grid as to the one
originally preferred by the producers: it is only possible when there is sufficient injection capacity.
The alternative grid is usually chosen on the ‘next-best’ basis, meaning that the biomethane producers
would weigh in the costs connected to the injection into such grid versus the capacity available. Even
though such solution is usually more expensive compared to the one originally preferred by the
producers (mainly due to the pipeline length), we note that it is still significantly cheaper compared to
the option of injection into the TSO grid. Furthermore, we note that this option is more attractive as an
alternative to the new biomethane producers compared to the ones who are already injecting into the
‘original’ DSO grid and for whom this option is a solution for the excess biomethane which cannot be
injected into the original grid. Such producers would have to bear double costs of connection pipelines
and injection points on both the original and alternative DSO networks. We note that the costs for such
an alternative injection point would fall under the responsibility of the biomethane producers.
Another option to increase the scarce biomethane injection capacity in a given DSO is the coupling of
the original DSO network to the alternative DSO grid, provided the latter has sufficient spare
biomethane injection capacity. Instead of two direct pipelines between the biomethane producer and
both the original and the alternative distribution grids, there is a coupling pipeline between the two
grids. This allows the biomethane producers to continue/perform injection into original DSO network,
while simultaneously benefiting from the available injection capacity of the alternative DSO grid,
without the necessity to build another pipeline for their (excess) gas.
As we have discussed earlier in the current paper, the location of the injection point (in the grid
topology) preferred by the biomethane producers has an impact on the injection capacity available to
them, largely due to the single-flow direction of the distribution grids. The solution of coupling the
DSO networks would in practice be most effective the biomethane producers injecting into the original
DSO network on the upper level of the GRS (Gas Receiving Station), where the DSO is fed with gas
from the TSO grid. This is due to the fact that biomethane injected at this level can be re-routed easier
compared to biomethane more downstream. As previously discussed, such producers already have
access to larger injection capacity (due to network characteristics) compared to those injecting at
town- and street-level, but the value added of such solution for them is nevertheless obvious. This
solution could also alleviate capacity constraints at more downstream levels.
The costs of such technical solution have varying consequences for different types of biomethane
producers: On the one hand, for the existing producers faced with excess biomethane such solution is
much less expensive compared to injecting into an alternative DSO, because of the absence of
additional injection point and pipeline costs. Besides the injection capacity gain, such producers are
DNV KEMA Energy & Sustainability
26
also much better-off financially. On the other hand, for new producers the costs would be lower
compared to the alternative DSO (depending on the distance to alternative DSO), however the
difference would be insignificant. The main gains for this type of producers are in available injection
capacity.
Such solution would necessitate the following investment: capital and operational costs for the
coupling pipeline, and operational and administrative costs necessary for the technical gearing and
coordination of both DSOs and eventually the producer. The total investment in such coupling
solution is less compared to the total investment in the alternative DSO’ injection, and significantly
lower compared to injection into the TSO network. However, this investment would not automatically
fall under the responsibility of the biomethane producers. The latter in the Netherlands are responsible
for the injection costs, as outlined earlier. Such costs, however, only refer to injecting into an existing
grid, and not to grid modifications or costs associated with them. At the same time, the system
operators (both DSO and TSO) are responsible for developing the gas network and for protecting the
environment. The costs incurred by the system operator for these purposes can be recovered through
the regulated tariffs. Building a DSO-coupling pipeline and the costs associated with operating it do
not qualify as either of these activities and, therefore, cannot be recovered. In such conditions it would
not be surprising if the DSOs were reluctant to perform the investment necessary for this technical
solution.
It can be concluded that whereas the solution of coupling the DSO networks is superior to previously
described options in terms of total costs, as well as benefits to the producers (who benefit both from a
cheaper connection and from increased capacity), its reflection in the currently applicable legal
framework is not optimal. In this case the principle of cost-benefit allocation is not ensured: the DSOs
would have to bear the costs which are not recoverable by the tariffs. There is no way for the DSOs to
transfer these costs to the cost-creating party (biomethane producers) though a payment, or to the
benefit-making party (society) through a tariff.
This issue could be alleviated by extending the legal responsibilities of a DSO to the facilitation of
renewable energy injection into the grid. This will enable the network operators to perform the
necessary investment and to recover it though the regulated tariffs. Obviously sufficient consideration
should be given to the technical constraints which could limit the possibilities of the DSOs’ coupling.
Such approach could contribute to a more balanced cost-benefit allocation between the parties
(consumers, biomethane producers, network operators, etc.).
However, we note that FCFS approach to the injection capacity requests placed by the biomethane
producers is potentially diminishing the effectiveness of such a solution, i.e. placing the responsibility
for biomethane accommodation into the grid on the DSOs. This approach will inevitably lead to
DNV KEMA Energy & Sustainability
27
inefficiencies: it is a ‘costly way of addressing systemic difficulties with accommodating biomethane,
and one that makes little sense when demands for grid entry are only likely to increase.’82
Besides,
such approach automatically benefits the incumbent biomethane producers in contrast to the new
entrants, the former being able to monopolised the available cheap injection capacity. In addition the
DSO currently have no mechanisms in place to take action against the biomethane producers who are
not using the procured biomethane capacity, but are also not releasing it to the market. This creates an
uneven level-playing field among the market parties, and does not ensure market access for all
biomethane producers. Therefore, the FCFS approach could, in our view, be replaced by an advance-
planning approach, similar to the Open Season (OS) procedures adopted by the TSO.83
In such
situations the DSOs would investigate the approximate biomethane production potential and
aspirations of the producers to actually produce it in e.g. next five years by the means of a
consultation. The DSO could then plan the network modifications, such as coupling with a
neighboring DSO, in a more efficient manner and, hence, at a lower total cost compared to eventual
grid modifications in response to individual requests. It is naturally difficult to correctly estimate the
biomethane production potential,84
and, therefore, an educated error margin should be taken into
account.85
5.3 Reversed Flows in the DSO Network and Back-Feeding from the DSO into
the TSO Network
As previously discussed, the distribution networks are characterised by single-direction flows, from
the Gas Receiving Stations (GRSs) to the end consumers. In contrast, the transmission networks are
characterized by multi-direction flows, which lead to less technical restrictions on the biomethane
injection capacity. Following this logic path, it is possible to decrease the technical limitations of the
DSO grids and thereby increase the available biomethane injection capacity by introducing multi-
direction flows on the distribution level as well. This could be done by installing the reversed flow
compressors in certain sections of the grid. However, implementing such solution on many sections of
82
Woolley (2013) 83
For more information see for example: http://www.energy-
regulators.eu/portal/page/portal/EER_HOME/EER_PUBLICATIONS/CEER_PAPERS/Gas/2007/ERGEG%20G
uidelines%20of%20Good%20Practice%20-%20Open%20Season%20Procedures%20(GGPOS), last accessed on
21 November 2013. 84
Woolley (2013) 85
We note that it is beyond the scope of the current paper to provide specific recommendations on the format of
such procedure.
DNV KEMA Energy & Sustainability
28
the DSO grid is costly, not only due to capital investment into the compressors and their installation on
the network, but also due to the operational costs (compressors consume energy) and their relatively
low operational time due the flexible character of both TSO and DSO networks. Therefore the value of
such solution for increasing the potential biomethane injection capacity versus the investment needed
is questionable.86
An alternative and somewhat similar solution is back-feeding the gas from DSO to TSO (inversed
situation from the business-as-usual, when DSO receives gas from TSO).87
This could be enabled by a
bi-lateral flow compressor installed at the GRS. This compressor would be able to compress the gas
from maximum 8 bar (the operating pressure of the DSO) to maximum 40 bar (the operating pressure
of the TSO)88
and feed it into the TSO network.
In this situation, the biomethane producers could benefit from an increased injection capacity at both
distribution and transmission levels, while continuing to inject at their preferred injection point on the
DSO network. Such back-feeding solution is most beneficial for the producers injecting their
biomethane at the GRS as the injection point (and therefore already benefiting from more injection
capacity compared to those injecting more downstream), since such biomethane can be rerouted easier
compared to that injected more downstream. However, back-feeding into the TSO network also
benefits the biomethane producers injecting downstream of GRS. Namely, the less of total injection
capacity is used at the GRS level, the more remains available at more downstream levels. Needless to
say, such a solution can only be applied when there are no injection capacity restrictions (e.g.
sufficient demand) on the side of the TSO.89
The total costs of back-feeding technical solution for excess biomethane are by a factor 2 more
expensive compared to the injection into the DSO network (yearly costs basis).90
As previously
discussed in the current paper, the total yearly costs of the biomethane injection into the transmission
network are by a factor 3 more expensive compared to the injection into the DSO network (yearly
costs basis).91
Therefore, where DSO injection is X, back-feeding is 2X and TSO injection is 3X.
Applying this simple reasoning, we come to the conclusion that for the situation when the biomethane
86
Whereas at this stage no exact calculation of the necessary investment is performed, the authors are of opinion
that the benefits gained in terms of capacity would in most cases not be able to offset such investments in
reversed flow when ensured for the whole DSO area. 87
Butenko et al. (2012) 88
We note that the TSO in the Netherlands operates at pressures ranging from 40 to maximum 80 bar. However,
as described earlier in this paper, the TSO network in fact consists of two networks: high pressure network (60-
80 bar) and regional network (40 bar). The DSOs are usually fed with the natural gas by the latter. 89
Butenko et al. (2012) 90
Holstein et al. (2011), Butenko et al. (2012) 91
Butenko et al. (2012)
DNV KEMA Energy & Sustainability
29
producers are already injecting into the DSO grid, the back-feeding solution (X+ 2X= 3X) is
preferable to the injection into the TSO grid (X+ 3X= 4X) from the perspective of the total yearly
costs. At the same time, for the situation when the biomethane producers are not connected to the grid,
the total yearly costs are identical for back-feeding (since these producers would have to be connected
to the DSO) and for injection into the TSO. We note, however, that the back-feeding solution at the
GRS level has potential to increase the biomethane injection capacity in the whole area served by this
GRS, and therefore the comparison above (based on total costs per producer) is not justified.
The total costs discussed above refer to the costs for all market parties involved. They do not fall
under the responsibility of the same market party, and namely: As previously discussed, the
biomethane producers are solely responsible for the connection costs, and therefore the investment
necessary for the back-feeding solution would fall outside their responsibility. Should such costs be
incurred, they would have to be covered by the network operators (it is not clear at the moment which
network operator exactly- DSO or TSO- would be responsible for such costs and in what measure).92
However, as noted earlier in the current paper, the network operators would not be able to recover
these investments through the regulated tariffs, as they do not fall under their legally prescribed
responsibilities.93
Also in this situation, comparably to the technical solution of the DSOs coupling, the
eventual reluctance of the network operators to perform such investments at essentially their own cost
could be well-justified.94
Therefore, the cost-benefit allocation in the case of back-feeding is not
optimal: the costs are attributed neither to the party causing them (biomethane producers) nor to the
party receiving the benefits (society, in form of emissions’ reduction).
The possible ways to resolve this issue are the same as in the case of the DSOs coupling: placing the
responsibility for accommodating biomethane injection upon the network operator, while
simultaneously allowing them to recoup the performed investments through the regulated tariffs. In
our view the responsibilities between the respective DSO and TSO should be well defined, as
cooperation between them is necessary for such technical solution.95
Also the replacement of the FCFS
approach by a more advance-planning one has an important role in this case.
92
Ibid. 93
Ibid. 94
It should be noted that at the moment Dutch TSO is looking into the possibility of a bi-directional GRS. For
more information see: http://www.gasunietransportservices.nl/en/about-gts/gasunie-and-bio-methane-green-
gas/bio-methane-pilot-projects, last accessed on 21 November 2013. 95
Butenko et al. (2012)
DNV KEMA Energy & Sustainability
30
5.4 Dynamic Management of the Distribution and Transmission Networks
Besides the network modifications, a number of proactive network management measures could be
applied in order to increase the biomethane injection capacity. Firstly, as the injection capacity is
mainly limited by the demand for natural gas, the management of demand (e.g. in order to stimulate it
in the periods of traditionally low demand, and respectively curtail it in the periods of high demand)
could offer significant benefits in this respect. This could be achieved among others by smart meters,
financial incentives (e.g. lower tariffs in periods of traditionally low demand) and raising the
awareness among the end users.
Secondly, in a situation when more users want to claim injection capacity at the same distribution
injection point, thereby causing capacity scarcity, congestion management techniques could be
applied. Such techniques could range from pro-rata allocation of the capacity among the claiming
biomethane producers, to mandatory capacity release by the biomethane producer who is not using it.96
Moreover, the distribution network could be managed more dynamically in order to increase the
possible biomethane injection capacity. The working pressure of a distribution grid is within the range
of 1.5 to 8 bar.97
When the pressure is lower than the acceptable range, it is impossible to deliver gas
to all the consumers. When the pressure is higher than the acceptable range, the pipelines would no
longer function effectively and safety could be compromised. In the business-as-usual situation in the
Netherlands, the distribution grid is operated at the high end of the allowed range.98
This has to do
with the fact that the DSOs are responsible for the depressurisation costs: the natural gas delivered
from the TSO network at 40 bar has to be depressurised at the GRS to the operating pressure of the
DSO. Hence, the larger the delta between the TSO pressure and the DSO pressure, the larger the costs.
Operating the DSO grid at a lower pressure within the acceptable range would increase the
depressurisation costs. However, it would also allow to increase the biomethane injection capacity.99
The latter could be achieved by storing the biomethane into the pipelines during the periods of low
demand during the night (daily buffer) and/ or during the summer (seasonal buffer): the biomethane
96
For more information on how congestion is approached on the transmission level, see Commission Decision
on amending Annex I to Regulation (EC) No 715/2009 on conditions for access to the natural gas transmission
networks [2012/490/EU, 24/08/2012], available at http://eur-
lex.europa.eu/LexUriServ/LexUriServ.do?uri=OJ:L:2012:231:0016:0020:EN:PDF, last accessed on 21
November 2013. 97
Butenko et al. (2012) 98
Ibid. 99
Based on the performed experiments, it occurs that lowering the working pressure of the distribution grid
could as much as triple the green gas injection capacity. For more information see van Eekelen (2012)
DNV KEMA Energy & Sustainability
31
would be injected into the pipelines with spare total capacity (of the pipelines) until the pressure level
of 8 bar is reached.100
The costs for such buffering are case-specific and depend on the configuration of the grid. It is
possible to change the pressure in the distribution manually: in this case the necessary costs would be
limited to the operational (e.g. compression, pressure adjustment) and administrative costs related to
the DSO efforts.101
It is also possible to automate the pressure adjustment, by installing specialised
equipment at the GRSs.102
The latter, however, are operated by the TSO, so a high degree of
coordination regarding the operational aspects, as well as the necessary investments, is necessary.
Comparably to the technical solutions for excess biomethane discussed earlier in the current paper, we
note that the costs for such dynamic management of the distribution network would not fall under the
legal responsibilities of the DSOs/ TSO and therefore would not be recoverable through the regulated
tariffs. Here again we do not witness a balanced cost-benefit allocation between the market parties.
Similarly to the other technical solutions, this balance could be restored by extending the
responsibilities of the network operators to the facilitation of biomethane injection and thereby
allowing them to recover the necessary investment though the tariffs.
100
Butenko et al. (2012) 101
Ibid. 102
Ibid.
DNV KEMA Energy & Sustainability
32
6 CONCLUDING REMARKS
In this paper we have analysed biomethane injection into the grid from the perspective of a degree of
fit between the level of technology and the formal institutions supporting it. We conclude that there
are situations in which biomethane produced cannot be injected into the grid due to capacity
constraints and / or monopolisation of the available capacity by other biomethane producers. The
problem is bound to aggravate in the future as the biomethane production capacities are forecasted to
increase.
We have illustrated a number of technical solutions accommodating biomethane in the natural gas grid
and analysed how these solutions are reflected in the legal framework. We have assumed the legal
framework to be optimal when safeguarding three main principles: of cost-benefit allocation, of
market access and of level-playing field. We conclude that the current legal framework related to
iomethane injection into the grid is not optimal, mainly due to two main problems:
The first-come-first-served principle allocating the injection capacity requests of biomethane
producers; and
The accommodation of biomethane into the grid falling outside the responsibility of the
network operators.
The FCFS principle may lead to monopolisation of available biomethane injection capacity at the
preferred (e.g. closest and cheapest) injection point by the incumbents. In such conditions new entrants
would not be able to benefit from access to the infrastructure necessary to market their biomethane.
Moreover, the network operators would make decisions based on single requests which could lead to
inefficiencies. These problems could be avoided by the introduction of an advance-planning approach
towards the network, as well as congestion management procedures at the bottleneck injection points.
The fact that the legal responsibilities of the network operators do not include the facilitation of
biomethane injection translates into their inability to recover the investments into the network made
for this purpose through the tariffs. This leads to inefficiencies, higher total costs of the solutions for
biomethane accommodation into the grid, and reluctance of the network operators to invest into such
solutions. These could be alleviated by placing such legal responsibility on the network operators,
albeit with some restrictions, e.g. volume- and distance-related threshold.
We therefore conclude that the degree of fit between the current legal framework (aimed at uni-lateral
flows from upstream production to downstream consumption) and the current biomethane
developments (translating into downstream production and sometimes upstream consumption) is not
sufficient for the efficient functioning of the energy market (i.e. corresponding to the criteria of
DNV KEMA Energy & Sustainability
33
balanced cost-benefit distribution, market access and level-playing field). Above we have proposed
measures for reactive changes to the legal framework, which could help increase the future degree of
fit between the two. However, whereas such measures will contribute to a more a balanced cost-
benefit allocation between the market parties, better market access and a more even level-playing
field, they are by no means a guarantee for large-scale biomethane production and injection in the
future. Since biomethane production is dependent on a large number of factors (e.g. biomass
availability, biomass costs and competition from other biomass utilisations, subsidies available to
biogas and biomethane producers, costs of production, market prices of substitute and alternative
fuels), guaranteeing sufficient access to infrastructure is just one of the measures to facilitate
biomethane’s role in the energy supply.
DNV KEMA Energy & Sustainability
34
7 REFERENCES
Butenko, A. et al. (2012), Injecting green gas into the grid, Dutch example, Paper in Proceedings of
the Annual Conference of the International Association of Energy Economists, Venice, 2012,
available online at: : http://www.edgar-program.com/uploads/fckconnector/045b29e3-d81a-4d90-
bfd0-e246a5002d21
Chen, P. et al. (2010), Economic Assessment of Biogas and Biomethane Production from Manure,
CALSTART, March 2010
Christensen, C. M. (2011), The innovator's dilemma: The Revolutionary Book That Will Change The
Way You Do Business, Harper Business, New York, 2000
ECN and DNV KEMA (2012), (in Dutch) Basisbedragen in de SDE+ 2013. Eindadvies, ECN,
September 2012, available online at: http://www.ecn.nl/docs/library/report/2012/e12038.pdf
Eekelen, R. van (2012), (in Dutch) Smart Green Gas Grid: Slimmer gasnet voor inpassing van Groen
Gas, Kiwa Technology, Presentation for Slimme Energie Infrastructuur, The Hague, 8 February 2012.
Glachant, J. M. (2009), Creating institutional arrangements that make markets work: the case of retail
markets in the electricity sector, in Künneke, R. W. et al. (eds) (2009), The governance of network
industries. Institutions, technology and policy in reregulated infrastructures, Cheltenham, UK and
Nothampton, MA, USA: Edward Elgar
Gorkum, K. van (2011), Green gas injection in practice from a regional grid operator point of view,
EDI Quaterly, Volume 3, No. 4, December 2011, Energy Delta Institute, available online at:
http://www.energydelta.org/mainmenu/energy-knowledge/quarterly-2/edi-quarterly-vol-3-issue-4
DNV KEMA Energy & Sustainability
35
Hakvoort, R., Huygen, A. (2012), (in Dutch) Sturen op het gebruik van locale energienetten, D-Cision
and TNO, 5 October 2012, available online at: http://www.rijksoverheid.nl/documenten-en-
publicaties/rapporten/2012/11/08/sturen-op-het-gebruik-van-lokale-energienetten.html
Hancher, L., Larouche, P. (2011), The coming of age of EU regulation of network industries and
services of general economic interest, in P. Craig & G. De Búrca (Eds.), The evolution of law, second
edition (pp. 743-782). Oxford: Oxford University Press.
Holstein, J. et al. (2011), (in Dutch) Overstort van het distributienet naar het landelijke transportnet:
Verkenning generiek raamwerk ontwikkeling van een overstortregeling ten behoeve van groengas
accommodatie, KEMA, 5 July 2011, available online at:
http://www.agentschapnl.nl/sites/default/files/bijlagen/Eindrapport%20Gasoverstort%20GCS.11.R.21
940.pdf
Ilić, M., Jelinek, M. (2009), Changing paradigms in electric energy systems, in Künneke, R. W. et al.
(eds) (2009), The governance of network industries. Institutions, technology and policy in reregulated
infrastructures, Cheltenham, UK and Nothampton, MA, USA: Edward Elgar
Jonker, M. (2008), Coherence of Institutions and Technology in the Innovation of Electricity
Networks, in Thissen, W., Weijnen, M. (Eds.), Proceedings of the International Conference on
Infrastructure Systems, Building Networks for a Brighter Future (pp. 1-6), Delft: Next Generation
Infrastructures Foundation.
Künneke, R. W. (2008), Institutional reform and technological practice: the case of electricity,
Industrial and Corporate Change, 17 (2): 233- 65
Künneke, R. W., Groenewegen, J. P. M. (2009), Challenges for readjusting the governance of network
industries, in Künneke, R. W. et al. (eds) (2009), The governance of network industries. Institutions,
technology and policy in reregulated infrastructures, Cheltenham, UK and Nothampton, MA, USA:
Edward Elgar
DNV KEMA Energy & Sustainability
36
Nedis, R., Byler, E. (2009), Creating a National Innovation Framework. Building a Public-Private
Support System to Encourage Innovation, Science Progress, April 2009, available online at:
http://www.scienceprogress.org/wp-content/uploads/2009/04/bendis_innovation.pdf
Tempelman, D., Butenko, A. (2013), What’s in a smell? Risks and Consequences of Inadequate
Odorisation of Biomethane, Renewable Energy Law and Policy Review 2/2013: pp. 105-119
Woolley, O. (2013), Reforming Gas Sector Governance to Promote Biomethane Injection, Renewable
Energy Law and Policy Review 3/2013: pp. 175-188
Related Documents