UNIVERSIDADE DE LISBOA FACULDADE DE CIÊNCIAS DA UNIVERSIDADE DE LISBOA UNIVERSIDAD POLITÉCNICA DE MADRID ESCUELA TÉCNICA SUPERIOR DE INGENIERÍA Y SISTEMAS DE TELECOMUNICACIÓN INSTITUTO DE ENERGÍA SOLAR LARGE POWER HYBRID PV PUMPING FOR IRRIGATION Rita Hogan Teves de Almeida PhD Supervisors: Luis Narvarte Fernández (IES, UPM) Miguel Centeno Brito (IDL, FCUL) 2019

Welcome message from author
This document is posted to help you gain knowledge. Please leave a comment to let me know what you think about it! Share it to your friends and learn new things together.
Transcript

UNIVERSIDADE DE LISBOA
FACULDADE DE CIÊNCIAS DA UNIVERSIDADE DE
LISBOA
UNIVERSIDAD POLITÉCNICA DE MADRID
ESCUELA TÉCNICA SUPERIOR DE INGENIERÍA Y
SISTEMAS DE TELECOMUNICACIÓN
INSTITUTO DE ENERGÍA SOLAR
LARGE POWER HYBRID PV PUMPING
FOR IRRIGATION
Rita Hogan Teves de Almeida
PhD Supervisors:
Luis Narvarte Fernández (IES, UPM)
Miguel Centeno Brito (IDL, FCUL)
2019

UNIVERSIDADE DE LISBOA
FACULDADE DE CIÊNCIAS DA UNIVERSIDADE DE
LISBOA
UNIVERSIDAD POLITÉCNICA DE MADRID
ESCUELA TÉCNICA SUPERIOR DE INGENIERÍA Y
SISTEMAS DE TELECOMUNICACIÓN
INSTITUTO DE ENERGÍA SOLAR
LARGE POWER HYBRID PV PUMPING
FOR IRRIGATION
Rita Hogan Teves de Almeida
Ingeniera en Energía y Medioambiente
Master en Ingeniería de la Energía y Medioambiente
PhD Supervisors:
Luis Narvarte Fernández (IES, UPM)
Doctor Ingeniero de Telecomunicación
Miguel Centeno Brito (IDL, FCUL)
Doctor en Física
2019


Tribunal nombrado por el Magnífico y Excelentísimo Sr. Rector de la Universidad Politécnica de Madrid
PRESIDENTE: EDUARDO LORENZO PIGUEIRAS Catedrático de la Universidad Politécnica de Madrid
VOCALES: MARIA CRISTINA FEDRIZZI Investigadora de la Universidade de São Paulo JUAN CARLOS CANASVERAS SÁNCHEZ Responsable de I+D de ELAIA JORGE AUGUSTO MENDES DE MAIA ALVES Professor Associado com Agregação de la Universidade de Lisboa
SECRETARIO: FRANCISCO MARTÍNEZ MORENO Profesor Ayudante Doctor de la Universidad Politécnica de Madrid
SUPLENTES: JOSÉ FERNÁNDEZ RAMOS Profesor Titular de la Universidad de Málaga LUIGI LEDDA Profesor Titular de la Universitá Degli Studi di Sassari
Este tribunal acuerda otorgar la calificación de:
EL PRESIDENTE LOS VOCALES
EL SECRETARIO
Realizado el acto de defensa y lectura de la Tesis
en Madrid, el día de de 2019


VII
To my grandfather Vasco.


IX
ACKNOWLEDGMENTS The story of this PhD starts well before the writing of this document. In fact, it starts a lot
before even thinking about studying PV Irrigation Systems.
It started in 2014, when I applied for the MIT scholarship. At that time, Professor Jorge Maia
Alves was very important to me. I want to thank your guidance and support. In fact, I started
the PhD because of you and what I miss the most about FCUL is the possibility of talking to
you and listening to your wise advices.
In 2015, the PhD got started and a lot of mixed feelings come to my mind. As always, a
journey has ups and downs and my PhD journey was not an exception.
I would like to express my gratitude to Miguel Brito for his great support during the first year
of my PhD, for the possibility he gave me to come to Spain and for his dangerous adventure
trying to get the agreement between both Universities finally signed.
I want to thank to all my open space colleagues in Portugal – Sara, Ivo, Mário, David, Pedro
Nunes, Pedro Sousa and Filipe – and the ones who were also in FCUL (although not in the
same physical space) – Rodrigo, Filipa, João, José and Nuno. Special thanks to Mário and
Ivo: “you were always there when I needed to make the biggest decisions”.
In the summer of 2015 I had the chance to work in an NGO in Cameroon. I wish to thank to
the IEEE Smart Village for the opportunity, particularly to Michael Wilson and Martin Niboh.
Also, I must thank all the people I met in Cameroon – Ernest, Etienne and Hancheal (the solar
team), Roger, David, Kennedy, Rhoda, Carine, Joyce, Hilda, Martin's family and little
Ashley. Special thanks to Ernest, Etienne and Hancheal: we passed through a lot of
adventurous and experiences together. I feel very proud of Ernest and Etienne for their
perseverance and I hope that they continue enjoying the fruits of their labor.
Finally, at the end of 2015/beginning of 2016 the story of PV irrigation systems appeared in
my life. Since then, I have two more groups of great people to be thankful – the one at PV
Systems Group (IES-UPM) and the MASLOWATEN one.
Let me start by the people at IES. Firstly and foremost, I am very grateful to Luis. I thank you
for giving me the opportunity to do my PhD and for sharing your knowledge with me. You
gave me not only the possibility to work on MASLOWATEN, but also to be present in all of
its stages. You also gave me the opportunity to work on a real project, to work on real

X
systems, to attend international meetings, to have contact with companies, to present our work
worldwide and to grow, both professionally and personally. To summarize, I really want to
thank you for your guidance and support. You were always there and I really appreciate that. I
also want to thank Eduardo for his useful advices, his great wisdom, his enlightens and his
useful help in what concerns the science of writing. I would also like to express my gratitude
to Pepe because he shared with me all his knowledge about frequency converters and
electronics in general and he taught me the importance of clearly think before starting to do
something.
I want to thank my open space colleagues in Spain – Isaac, Celena, Carlos, Luismi, Fran,
Imene, Estrella, Remedios, José, Aitor, Rodri, Alberto, José, Gilberto and Roberto. Some of
you are no longer with us (here in the workspace) but, somehow, you all positively contribute
to my time, work and life in Madrid. I am also thankful to Javier for our discussions and his
help with SISIFO. Estrella deserves a special and huge thank because she was there every
time I needed, for every reason and always with some word of advice – I think I have gained a
Spanish mother.
Thanks to MASLOWATEN I have had the opportunity not only to do this thesis, but also to
meet a lot of interesting people. I want to thank all of them for the pleasure and the great
opportunity it meant to me to work with all of you. I want to highlight the most involved
persons in my thesis. First of all, I really appreciate the support of Miguel Angel, Alberto and
Javi (from DOMUS) because they were my first “teachers” outside IES and shared a lot of
time and experience. I also want to thank the team at ELAIA, namely Julia, Guilherme, Paula,
Juan Carlos, Bennani, Morad and Isham since they were the ones who were actually using the
systems and without whose contribution my thesis would not be possible. I am also grateful to
David Berengué (from Prógres) and Lauro Antipodi (from Caprari) since they have a lot of
knowledge to share and were always available to do it. Finally, I am also thankful to David
(from EIC) for his useful help in getting data and information about the world of irrigation.
I also want to express my gratitude to my family and friends. Even if some of my friends are
still thinking that doing a PhD is a waste of time, I want to thank Rodrigo, Rui, Filipa, Vera,
Diana and Catarina. Furthermore, I want to thank to Joana for her support and enthusiasm
every time we met (we should do this more often).
My family was crucial to the success of this work and my life, specially my mother, my sister
Maria, my grandpa Vasco and my grandma Teresa. You are, and will always be, an essential

XI
part of my life. You are the ones who were always available for me. I really appreciate your
support, your guidance, your friendship, your advices, everything you give to me. I also want
to thank my uncles Jorge and Carmo, São, Isaac’s parents, my father, my sister Mariana, my
grandmother Elisa, my great-aunt Manuela and my godfather as well as his children and
grandchildren.
Finally, I am deeply thankful to Isaac: I really appreciate your support both at work and at
home; in the good moments and, the most important, in the bad ones. I thank you very much
for accompanying me throughout this work and in life, both on a daily basis. You know that
the end of this work would not be possible without you and you should also know that I want
to be with you forever.
The research presented in this thesis was only possible thanks to the MIT Portugal Program
on Sustainable Energy Systems and the Portuguese Science and Technology Foundation
(FCT), under the grant PD/BD/105851/2014; as well as the European Union´s Horizon 2020
research and innovation program MArket uptake of an innovative irrigation Solution based on
LOW WATer-ENergy consumption (MASLOWATEN), under grant agreement 640771.
Thank you for those who have made this journey unforgettable.

XIII
ABSTRACT The aim of this thesis is to develop technical solutions for the reliable and efficient
performance of large-power hybrid photovoltaic (PV) irrigation systems. These solutions
have been applied to the design and implementation of two real-scale large-power hybrid PV
drip irrigation demonstrators – a 140 kWp hybrid PV-diesel system in Alter do Chão,
Portugal, and a 120 kWp hybrid PV-grid system in Tamelalt, Morocco.
Both systems have been working since 2016 and include monitoring systems. In order to do a
technical and economic validation of the systems from these monitoring data, it has been
necessary to develop new performance indices because, unlike PV grid-connected systems,
the operation of this type of systems is affected by factors others than its quality. So, the
typical performance ratio (PR) has been factorized in 4 distinct indicators: PRPV (which
includes the losses strictly related with the PV system), URIP (which varies with the particular
crop and the irrigation period), URPVIS (which is intrinsic to the PVIS design), and UREF
(which gives an idea of the use of the system, it is influenced by the monthly irrigation
scheduling and the availability of water in the source).
The main technical solutions developed include first, an algorithm that allows the elimination
of the problems associated with PV-power intermittences caused, for example, by a passing
cloud; second, the match between PV production and irrigation needs through the use of a
North-South horizontal axis tracker (N-S); and third the integration of the PV system in the
pre-existing irrigation network through solutions which maximize the use of PV energy.
This thesis is structured in 2 different parts. The first one presents the results of the technical
and economic validation of the demonstrators. In Portugal, the PV share (PVS) during the
irrigation period is 0.49 (in 2017) and 0.36 (in 2018), and the PR is 0.16 (in 2017) and 0.22
(in 2018) extremely influenced by the use of the system (UREF of 0.29 and 0.44 respectively).
In Morocco, in 2017 and 2018, the PVS is 0.48 and 0.55, and the PR is 0.24 (with a UREF of
0.32) and 0.29 (UREF of 0.36) respectively. The economic results show an initial investment
cost of 1.2 €/Wp, a payback period of 8.8 years in Portugal and 7 in Morocco and, finally, a
Levelized Cost of Energy of 0.13 €/kWh in Portugal and 0.07 €/kWh in Morocco, which leads
to savings of 61% and 66% in Portugal and Morocco respectively.
In the second part of the thesis, three other novel contributions for the design of large-power
PV irrigation systems are made. The first one is a new type of PV generator structure, the
Delta structure, which has the objective to achieve constant in-plane irradiance profiles when

XIV
the end-users do not want to install trackers. It is worth noting that the peak power needed in
this structure to achieve the same water volume of the N-S tracker is lower than the one
needed with the typical static structure oriented to the Equator.
The second study evaluates the losses in a PV irrigation system depending on the number of
PV modules in series of a PV generator. It is possible to conclude that these losses are
irrelevant in most situations, casting doubts about the complex designs that are being offered
by the market to avoid them. In places with very high mean temperatures, in a stand-alone PV
system, these losses can be eliminated with the increase in the number of PV modules in
series. On the other hand, in a hybrid PV-grid system it is impossible to eliminate the losses,
but they can be minimized.
Finally, a new pump selection method for PV irrigation systems working at a variable
frequency is proposed. A simulation exercise carried out for three different places in the
Mediterranean zone shows that the water volume pumped by a PV irrigation system with a
pump selected with this new method is 7.3 to 20.5% higher than the one pumped with the
pump selected with the traditional method.

XV
RESUMEN El principal objetivo de esta tesis es el desarrollo de soluciones técnicas para el
funcionamiento fiable y eficiente de sistemas híbridos de riego fotovoltaico (FV) de alta
potencia. Estas soluciones técnicas se han aplicado al diseño e instalación de dos
demostradores de riego FV por goteo a escala real – uno de 140 kWp híbrido FV-diésel en
Alter do Chão, Portugal, y otro de 120 kWp híbrido FV-red en Tamelalt, Marruecos.
Los dos sistemas están en pleno funcionamiento desde el 2016 y ambos cuentan con sistemas
de monitorización. Para validar técnica y económicamente ambos demostradores a partir de
estos datos de monitorización, ha sido necesario desarrollar nuevos índices de calidad de su
operación ya que, a diferencia de los sistemas FV de conexión a red, el funcionamiento de
este tipo de sistemas se ven afectados por factores ajenos a su calidad. Así, el tradicional
performance ratio (PR) ha sido factorizado en 4 indicadores distintos: PRPV (que incluye las
pérdidas relacionadas con el sistema FV), URIP (que varía con el cultivo y su periodo de
riego), URPVIS (que depende del diseño del sistema de riego FV), y UREF (que cuantifica la
utilización real del sistema por el usuario).
Las principales soluciones técnicas desarrolladas incluyen, primero, un algoritmo que permite
eliminar los problemas asociados a la intermitencia de la potencia FV causada, por ejemplo, al
efecto del paso de nubes; segundo, el ajuste entre la producción FV y la demanda de agua a
través de la utilización de seguidores de eje norte-sur horizontal (N-S); y, tercero, la
integración de los sistemas FV en los sistemas de riego que ya existían en las fincas mediante
configuraciones de diseño que permiten maximizar el aprovechamiento de la energía solar.
La tesis se estructura en 2 partes. En la primera se presentan los resultados de la evaluación
técnica y económica de los dos demostradores. El de Portugal muestra penetraciones FV
durante el periodo de riego de 0.49 (en 2017) y 0.36 (en 2018), y PR de 0.16 (en 2017) y 0.22
(en 2018) fuertemente influenciados por la utilización del usuario (UREF de 0.29 y 0.44
respectivamente). En el caso de Marruecos la penetración FV, en 2017 y 2018, es de 0.48 y
0.55, y el PR de 0.24 y 0.29 (UREF de 0.32 y 0.36), respectivamente. A nivel económico, la
inversión inicial en ambos sistemas es 1.2 €/Wp, el período de retorno de la inversión es 8.8
años en Portugal y 7 en Marruecos y, finalmente, el Levelized Cost of Energy es 0.13 €/kWh
en Portugal y 0.07 €/kWh en Marruecos, llevando a ahorros del 61% y 66% en Portugal y
Marruecos, respectivamente.
XVI
En la segunda parte de la tesis, se realizan otras tres contribuciones novedosas para el diseño
de sistemas de riego FV de alta potencia. La primera es un nuevo tipo de estructura, llamada
Delta, que tiene por objetivo conseguir un perfil constante de irradiancia con una estructura
estática para los casos en que los usuarios no deseen instalar seguidores solares. Es interesante
subrayar que la potencia pico necesaria en esta estructura para llegar al mismo volumen de
agua del sistema con seguidor N-S es más pequeña que la necesaria con la típica estructura
estática orientada al ecuador.
El segundo estudio evalúa las pérdidas en un sistema de riego FV dependiendo del número de
módulos en serie del generador FV. Se puede concluir que en la mayor parte de los casos,
estas pérdidas no son significativas por lo que carecen de sentido los complejos diseños que
está ofreciendo el mercado para evitar estas pérdidas. En localizaciones con muy altas
temperaturas medias, en un sistema aislado estas pérdidas disminuyen con el aumento del
número de módulos en serie, mientras que en un sistema híbrido con la red eléctrica estas
pérdidas son inevitables independientemente del número de paneles, aunque se pueden
minimizar.
Finalmente, se propone un nuevo método de selección de bombas para sistemas de riego FV a
frecuencia variable. Un ejercicio de simulación hecho para 3 lugares distintos de la cuenca
mediterránea demuestra que el volumen de agua bombeada por un sistema de riego FV con
una bomba seleccionada por este nuevo método tiene incrementos entre el 7.3 y el 20.5%
cuando se compara con una bomba seleccionada con el método tradicional.

XVII
RESUMO O principal objetivo de esta tese é o desenvolvimento de soluções técnicas para o
funcionamento fiável e eficiente de sistemas híbridos de rega fotovoltaica (PV) de alta
potência. Estas soluções técnicas foram aplicadas ao desenho e instalação de dois
demonstradores híbridos PV para irrigação gota-a-gota em dois olivais reais da empresa
ELAIA – um sistema híbrido PV-diesel de 140 kWp em Alter do Chão, Portugal; e um
sistema híbrido PV-rede de 120 kWp em Tamelalt, Marrocos.
Os dois demonstradores estão em pleno funcionamento desde 2016 e ambos contam com
sistemas de monitorização. Para validar técnica e economicamente os dois demonstradores a
partir dos dados de monitorização foi necessário desenvolver novos índices de desempenho
uma vez que, ao contrário do que ocorre em sistemas PV de ligação à rede, o funcionamento
de sistemas de rega PV é influenciado por fatores externos à qualidade da sua instalação.
Assim, o tradicional performance ratio (PR) foi fatorizado em 4 indicadores: PRPV, URIP,
URPVIS, UREF. O primeiro, PRPV, contabiliza as perdas estritamente relacionadas com o
sistema fotovoltaico (e pode ser comparado ao PR de um sistema de ligação à rede). O URIP
depende do cultivo e indica as perdas associadas ao período de rega. O URPVIS está
relacionado com o desenho do sistema de irrigação PV (sendo influenciado, por exemplo,
pelo tipo de irrigação, pela relação entre a potência consumida e a instalada e pela estrutura do
gerador PV). O quarto e último indicador, UREF, indica a utilização real do sistema
(relacionando a irradiância utilizada com a útil num sistema de rega PV).
As principais soluções técnicas desenvolvidas incluem o desenvolvimento de um algoritmo
para eliminar os problemas associados à intermitência da potência PV causados, por exemplo,
por uma passagem de nuvens (este algoritmo foi patenteado); o ajuste entre a produção PV e
as necessidades de rega foi solucionado através da utilização de seguidores de eixo Norte-Sul
horizontal (N-S); e, finalmente, o sistema PV foi perfeitamente integrado no sistema de rega
pré-existente nas herdades mediante configurações de desenho que permitem maximizar o
aproveitamento da energia solar PV.
Esta tese está estruturada em duas partes. Na primeira são apresentados os dois
demonstradores em estudo. Para cada um deles é feita uma análise dos sistemas pré-existente
e atual. De seguida, simulações para dois cenários (um otimista e um pessimista) foram
desenvolvidas para estimar o desempenho dos novos sistemas híbridos. Finalmente, os dados

XVIII
de monitorização permitiram fazer uma análise detalhada do desempenho real dos sistemas
durante as campanhas de rega de 2017 e 2018.
No caso de estudo em Portugal, em 2017, a penetração PV foi 0.49, e o PR durante o período
de rega foi 0.16 (extremamente influenciado por um UREF de 0.29). Estes valores são
consequência da baixa utilização do sistema devido à sequia verificada ao longo do ano. De
facto, o sistema funcionou apenas 94 dias e maioritariamente durante a noite. Em 2018, o
desempenho no mês de agosto é particularmente interessante. O sistema funcionou, em
média, 16 horas por dia (quase 7h30 apenas com PV), a penetração PV foi de 0.53 e o PR de
0.56. Neste caso, o UREF é 0.99, o PRPV 0.83 e o URPVIS 0.68. Nos restantes meses do ano um
problema com o sistema de fertirrigação obrigou a uma elevada utilização do gerador diesel.
Ainda assim, durante o período de rega, a penetração PV é 0.36 e o PR 0.22. Neste último
caso, os valores de PRPV e URPVIS são semelhantes aos do mês de agosto (0.80 e 0.60
respetivamente), sendo a principal diferença o UREF que baixa de 0.99 a 0.44. No caso de
Marrocos, a penetração PV é 0.48 em 2017 e 0.55 em 2018 e o PR é 0.24 e 0.29
respetivamente. Este PR é influenciado, maioritariamente, pelos valores de UREF (0.32 em
2017 e 0.36 em 2018).
A nível económico, o investimento inicial é de 1.2 €/Wp nos dois sistemas, o tempo de
retorno do investimento é 8.8 anos em Portugal e 7 em Marrocos e, finalmente, o Levelized
Cost of Energy é 0.13 €/kWh no caso de Portugal e 0.07 €/kWh no caso de Marrocos, o que
significa poupanças de 61% e 66% em Portugal e Marrocos, respetivamente.
Adicionalmente, outros três estudos sobre sistemas de rega PV de alta potência são
apresentados: um novo tipo de estrutura estática chamada Delta, as perdas de energia
associadas ao número de módulos em série neste tipo de sistemas, e finalmente um novo
método de seleção de bombas para sistemas de irrigação PV de alta potência.
Relativamente à estrutura Delta, o principal objetivo era obter um perfil constante de
irradiância sem utilizar seguidores solares. Verificou-se que esta opção (que consiste em
instalar metade da potência pico do gerador PV orientada a Este e a outra metade a Oeste com
uma inclinação de 60º) é bastante interessante em sistemas de irrigação PV. A potência pico
necessária neste caso é inferior à necessária com a típica estrutura estática orientada ao
Equador. Se o objetivo é alcançar a mesma quantidade de água da estrutura com seguidor N-S
nos meses de rega, então a potência pico necessária na estrutura Delta é 1.75 vezes a
XIX
necessária no caso deste seguidor. Além disso, um índice para estudar quão constante é o
perfil foi utilizado e os resultados mostram que durante o período de rega alcança-se 0.99.
Relativamente ao estudo da influência do número de módulos em série, as perdas de energia
PV foram calculadas para um sistema PV autónomo que bombeia de um poço a um depósito e
para um sistema híbrido PV-rede a pressão e caudal de água constantes. Estas duas
configurações foram analisadas em dois locais com temperaturas ambiente médias distintas
(Villena, Espanha e Marraquexe, Marrocos) e para valores de tensão impostos pela bomba ou
pela rede elétrica distintos. De seguida, realizaram-se duas extrapolações dos resultados
obtidos. A primeira estabelece-se para permitir a seleção do número de módulos PV em série
dependendo da média anual da temperatura máxima e a segunda dependendo da tensão da
rede à qual o sistema vai ser ligado. Pode-se concluir que, na maioria dos casos, estas perdas
não são significativas e, nesse seguimento, não têm sentido as soluções complexas que o
mercado está a oferecer para eliminar estas perdas. Em locais com temperaturas médias muito
altas, no caso dos sistemas isolados, as perdas diminuem (e podem ser eliminadas) com o
aumento do número de módulos em série no gerador PV. Por outro lado, no caso dos sistemas
híbridos PV-rede estas perdas podem ser minimizadas, mas são inevitáveis
independentemente do número de módulos em série.
No que diz respeito ao método de seleção de bombas, um novo método é proposto uma vez
que o tradicional seleciona a bomba com base na máxima eficiência no ponto de trabalho (a
50 ou 60 Hz). Ora, num sistema PV, a bomba pode funcionar a frequências e pontos de
trabalho distintos e por isso o método de seleção deve ser adaptado a essas características.
Este novo método foi desenvolvido e o procedimento foi implementado no SISIFO (uma
ferramenta de simulação de sistemas PV desenvolvida no Instituto de Energia Solar da
Universidade Politécnica de Madrid). Posteriormente, foi feita uma comparação entre o
desempenho de uma bomba selecionada com o método tradicional e outra com o novo
método. Esta comparação foi realizada em três locais distintos da área mediterrânea: Madrid,
Marraquexe e Nice. Os resultados demonstram que o volume de água bombeada ao largo de
um ano aumenta entre 7.3 e 20.5%, enquanto a eficiência da bomba aumenta entre 4.3 e 5.3%
quando se compara a bomba selecionada com o novo método com a bomba selecionada com
o método tradicional.


XXI
CONTENTS
ACKNOWLEDGMENTS ..................................................................................................................................... III
ABSTRACT ..................................................................................................................................................... XIII
RESUMEN ....................................................................................................................................................... XV
RESUMO....................................................................................................................................................... XVII
LIST OF FIGURES .......................................................................................................................................... XXIII
LIST OF TABLES ...........................................................................................................................................XXVII
NOMENCLATURE ......................................................................................................................................... XXIX
1. INTRODUCTION ............................................................................................................................................ 1
1.1 BRIEF SUMMARY OF THE HISTORICAL MILESTONES IN PHOTOVOLTAIC PUMPING .............................................................. 6
1.1.1 PV water pumping systems for irrigation ............................................................................................ 10
1.2 LIMITATIONS OF PV IRRIGATION TECHNOLOGY IN THE CURRENT STATE OF THE ART AND THE MASLOWATEN PROJECT ....... 13
1.3 THE NEED OF HYBRID SYSTEMS ............................................................................................................................ 16
1.4 OBJECTIVES AND MAIN CONTRIBUTIONS OF THIS THESIS ........................................................................................... 17
FIRST PART: DESIGN, IMPLEMENTATION AND PERFORMANCE ANALYSIS OF HYBRID PV IRRIGATION SYSTEMS
....................................................................................................................................................................... 21
2. A 140 KWP HYBRID PV-DIESEL IRRIGATION SYSTEM IN PORTUGAL ............................................................ 23
2.1 INTRODUCTION ................................................................................................................................................ 23
2.2 THE ALTER DO CHÃO IRRIGATION SYSTEM ............................................................................................................. 24
2.2.1 The pre-existing only-diesel system ..................................................................................................... 24
2.2.2 The hybrid PV-diesel system ................................................................................................................ 26
2.2.3 The PV generator ................................................................................................................................. 29
2.2.4 Performance scenarios ........................................................................................................................ 30
2.3 PERFORMANCE INDICES FOR HYBRID PV SYSTEMS ................................................................................................... 32
2.3.1 Performance indices for the two scenarios ......................................................................................... 35
2.4 IN-THE-FIELD PERFORMANCE .............................................................................................................................. 37
2.4.1 Commissioning of the system .............................................................................................................. 37
2.4.2 Real performance in 2017 ................................................................................................................... 37
2.4.3 Real performance in 2018 ................................................................................................................... 38
2.5 ECONOMIC ANALYSIS ........................................................................................................................................ 39
2.5.1 Net Present Value, Internal Rate of Return and Payback Period ......................................................... 40
2.5.2 Levelized Cost of Energy ...................................................................................................................... 40
2.5.3 Results ................................................................................................................................................. 42
3. A 120 KWP HYBRID PV-GRID IRRIGATION SYSTEM IN MOROCCO ............................................................... 45
3.1 INTRODUCTION ................................................................................................................................................ 45
3.2 THE TAMELALT IRRIGATION SYSTEM ..................................................................................................................... 45
3.2.1 The pre-existing only-grid system ........................................................................................................ 45
3.2.2 The hybrid PV-grid system ................................................................................................................... 47
3.2.3 The PV generator ................................................................................................................................. 49
3.2.4 Performance scenarios ........................................................................................................................ 49
3.3 PERFORMANCE INDICES ..................................................................................................................................... 51
3.3.1 Performance indices for the two scenarios ......................................................................................... 52
3.4 IN-THE-FIELD PERFORMANCE .............................................................................................................................. 53
XXII
3.4.1 Commissioning of the system .............................................................................................................. 53
3.4.2 Real performance in 2017 ................................................................................................................... 54
3.4.3 Real performance in 2018 ................................................................................................................... 55
3.5 ECONOMIC ANALYSIS ........................................................................................................................................ 56
SECOND PART: CONTRIBUTIONS TO THE DESIGN OF PV IRRIGATION SYSTEMS .............................................. 59
4. PV ARRAYS WITH DELTA STRUCTURES FOR CONSTANT IRRADIANCE DAILY PROFILES ................................ 61
4.1 INTRODUCTION ................................................................................................................................................ 61
4.2 THE DELTA STRUCTURE ..................................................................................................................................... 62
4.2.1 Irradiance profiles ................................................................................................................................ 64
4.2.2 Ground Cover Ratio ............................................................................................................................. 66
4.2.3 Electrical losses .................................................................................................................................... 67
4.3 COMPARATIVE PERFORMANCE ANALYSIS ............................................................................................................... 70
5. ON THE NUMBER OF PV MODULES IN SERIES FOR LARGE-POWER IRRIGATION SYSTEMS .......................... 77
5.1 INTRODUCTION ................................................................................................................................................ 77
5.2 LIMITATION OF THE NUMBER OF PV MODULES IN SERIES AND IMPACT IN THE PV IRRIGATION SYSTEM PERFORMANCE .......... 78
5.3 ENERGY LOSSES VERSUS NUMBER OF PV MODULES IN SERIES .................................................................................... 80
5.3.1 Methodology ....................................................................................................................................... 80
5.3.2 Losses for the stand-alone PV irrigation system to a water pool ........................................................ 84
5.3.3 Losses for the hybrid PV-grid irrigation system at constant power ..................................................... 85
5.4 DISCUSSION OF THE RESULTS .............................................................................................................................. 86
5.4.1 Stand-alone PV irrigation system to a water pool ............................................................................... 86
5.4.2 Hybrid PV-grid irrigation system at constant power ........................................................................... 87
5.4.3 Summary and generalization of results ............................................................................................... 89
5.5 DESIGN OF SOLUTIONS TO AVOID ENERGY LOSSES ................................................................................................... 93
6. A NEW PUMP SELECTION METHOD FOR LARGE-POWER PV IRRIGATION SYSTEMS AT A VARIABLE
FREQUENCY .................................................................................................................................................... 95
6.1 INTRODUCTION ................................................................................................................................................ 95
6.2 THE TRADITIONAL PUMP SELECTION METHOD ........................................................................................................ 96
6.3 THE NEW SELECTION METHOD FOR PV IRRIGATION SYSTEMS AT A VARIABLE FREQUENCY .............................................. 101
6.4 PUMP SELECTION METHOD AND PV IRRIGATION SYSTEM PERFORMANCE ................................................................... 106
6.5 IMPLEMENTATION IN SISIFO ........................................................................................................................... 109
7. CONCLUSIONS AND FUTURE RESEARCH LINES .......................................................................................... 111
7.1 CONCLUSIONS ............................................................................................................................................... 111
7.2 FUTURE RESEARCH LINES ................................................................................................................................. 115
8. PUBLICATIONS .......................................................................................................................................... 117
8.1 INTERNATIONAL PEER REVIEWED JOURNALS ......................................................................................................... 117
8.2 CONFERENCE PROCEEDINGS ............................................................................................................................. 118
8.3 PATENTS ...................................................................................................................................................... 119
8.4 OTHER PUBLICATIONS DURING THE DOCTORATE NOT RELATED TO THE THESIS ............................................................. 119
9. REFERENCES ............................................................................................................................................. 121
XXIII
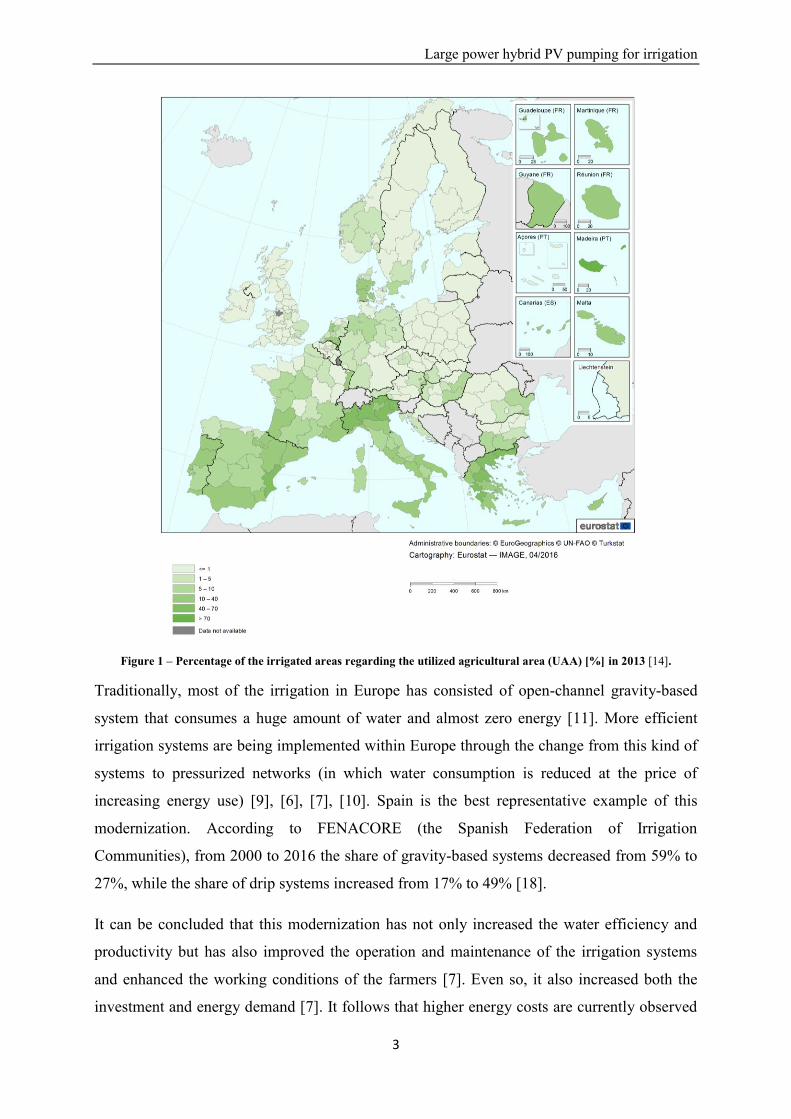
LIST OF FIGURES Figure 1 – Percentage of the irrigated areas regarding the utilized agricultural area (UAA) [%] in 2013 [14]. ..... 3
Figure 2 – Percentage of energy used in agriculture and forestry in the World, Europe, southern Europe and southern European countries in 2011 (it includes, but it is not limited to, the energy needed to irrigate) [18]. ........................................................................................................................................................................ 4
Figure 3 – PV pumping system for irrigation in Capim Grosso, Brasil [42]........................................................... 9
Figure 4 – Engineer conducting performance evaluation after 8 years of operation in Chihuahua, Mexico [43]. .. 9
Figure 5 – Components of a PV irrigation system: PV generator, frequency converter, motor-pump and water tank. .............................................................................................................................................................. 11
Figure 6 – Solar water pump in India (photograph from Raghav Agarwal, [58]). ................................................ 12
Figure 7 – PV irrigation system in Tizi, Morocco [30]. ........................................................................................ 12
Figure 8 – (a) Pre-existing irrigation system configuration: The electric power at the output of the diesel generator, PAC, is controlled in order to keep the hydraulic pressure constant at the input of the irrigation network, p1. Black and blue lines represent electricity and water ways respectively. (b) Cycling evolution of AC power (PAC) and pressure (p1 and p2) due to water filtering and filter cleaning periods. ....................... 25
Figure 9 – Hours per day of a) Irrigation scheduling, b) Daytime. ....................................................................... 26
Figure 10 – Hybrid PV irrigation system configuration. A PV generator, a new motor-pump, and two FCs have been added to the pre-existing configuration of Figure 1. The new components are marked in orange, while the previous ones are in green. ..................................................................................................................... 27
Figure 11 – Available PV power thresholds with hysteresis for the different operating modes – “Only PV”, Hybrid and “Only Diesel”. ........................................................................................................................... 28
Figure 12 – (a) Aerial view of the hybrid PV-diesel drip irrigation system. (b) Detail of the three motor-pumps and the water filter bench. The additional third pump is easily identifiable. ................................................ 29
Figure 13 – Incident irradiance profile on the tracker during the autumn equinox and the summer solstice. ....... 30
Figure 14 – Energy flows involved in a hybrid PV irrigation system. .................................................................. 33
Figure 15 – Graphical representation of the different irradiations considered: (a) is the irradiation during the irrigation period, (b) is the useful irradiation during the IP determined by the design of the PV irrigation system; and (c) is the irradiation used effectively by the system. ................................... 34
Figure 16 – The pre-existing irrigation system. .................................................................................................... 46
Figure 17 – Hours per day of a) Irrigation scheduling, b) Daytime. ..................................................................... 46
Figure 18 – Hybrid PV-grid system configuration. If ones compare this configuration with the one presented in Figure 16, the PV generator and the PLC were added, as well as the frequency converters (which replace the soft-starters). ........................................................................................................................................... 48
Figure 19 – Different components of the system: (a) PV generator. (b) Frequency converters and PLC boxes. (c) Motor-pumps. ............................................................................................................................................... 49
Figure 20 – Graphical representation of the different irradiations considered: (a) is the irradiation during the irrigation period, (b) is the useful irradiation during the IP determined by the design of the PV irrigation system; and (c) is the irradiation used effectively by the system.............................. 51
Figure 21 – The Delta structure, ΔS(β): The PV array is distributed in two halves. One half is oriented to the West while the other half is oriented to the East. For presentation clarity, the latter is not pointed out in the figure. ........................................................................................................................................................... 63

XXIV
Figure 22 – The in-plane global irradiance over a ΔS(60) measured on a clear day close to the Summer Solstice (23rd June 2017) at IES-UPM. In-plane global irradiance in the East- and West-oriented halves of the ΔS(60) are presented in blue and green respectively. The average value is in red. It is seen that constancy is almost achieved during the middle 8 hours of the day. Variations near 8 h and 20 h are due to shadows from surrounding objects. ............................................................................................................................. 63
Figure 23 – The in-plane global irradiance evolution during the Spring Equinox (green), the Summer Solstice (red), and the Winter Solstice (blue) days at Figueirinha, Silves, Portugal. The highest constancy index is obtained during the Summer Solstice (0.974), followed by the Spring Equinox (0.971), the lowest value being obtained during Winter Solstice (0.839). ............................................................................................ 65
Figure 24 – The constancy index and yearly irradiation for different angles of inclination (from 0 to 900) for the ΔS(β). As expected, the maximum constancy index is obtained for an inclination of 600 (0.948). The green point represents the yearly irradiation for S(25). .......................................................................................... 66
Figure 25 – Spacing between adjacent rows in ΔS(β) (a), S(β) (b), and 1xh (c). .................................................. 66
Figure 26 – The evolution of yearly energy yield in Figueirinha for the three structures considered. .................. 67
Figure 27 – DC power with 1 and 2 MPPTs, as well as electrical mismatching losses over a typical day of June. The monthly mean of electrical mismatching losses is 2%. ......................................................................... 69
Figure 28 – Electrical mismatching losses over a typical year. The yearly mean value is 2.4%. ......................... 69
Figure 29 – System (blue solid line) and pump curves (orange solid line represents 50 Hz and the points marked with circles have been obtained from manufacturer information, the remaining dashed lines corresponds to frequencies different from 50 Hz). ............................................................................................................... 71
Figure 30 – The yearly AC energy produced by a PVGCS with ΔS(60) and S(25) normalized by the AC energy produced by a 40 kWp 1xh (EAC/EAC1xh) as a function of its PV peak power normalized by the 40 kWp peak power of 1xh (P*/P*1xh). The two points with EAC/EAC1xh =1 represent the required oversizing of ΔS(60) and S(25) PV peak power to equal the performance of the 40 kWp 1xh. ........................................ 72
Figure 31 – Water volume pumped by a PVIS with ΔS(60) and S(25) normalized by the water volume pumped by a 40 kWp 1xh (Water volume/Water volume1xh) as a function of its PV peak power normalized by the 40 kWp peak power of 1xh (P*/P*1xh). The continuous lines represent yearly values and dashed lines show the water volume pumped during the irrigation period. The points with Water volume/Water volume1xh =1 represent the required oversizing of ΔS(60) and S(25) PV peak power to equal the performance of the 40 kWp 1xh. ...................................................................................................................................................... 72
Figure 32 – AC power of PVGCS (a) and water flow of PVIS (b) for a characteristic day of June for the three structures in the study. .................................................................................................................................. 74
Figure 33 – P-V curve of the stand-alone PV irrigation system to a water pool. The PV energy losses are calculated integrating along the whole irrigation period the difference of the maximum power that could be generated by the system and the power that is really producing due to the limitation of D S P M P . ........ 82
Figure 34 – P-V curve of the hybrid PV-grid system. The PV energy losses are calculated integrating the difference of Pp=cte and the PV power corresponding to D S ID: (a) PMPP≥Pp=cte; (b) PMPP< Pp=cte. ....... 83
Figure 35 – Frequency of occurrences of hourly Voc>800 V in the N-S structure. ............................................... 85
Figure 36 – PV energy losses: (a) Losses when PMPP>Pp=cte occur if the PV generator voltage for Pp=cte, D PV p cte, is less than D S ID, and they can be eliminated increasing the number of PV modules in series; (b) Losses when PMPP<Pp=cte depend on the difference between D S ID and D PV p cte and can be reduced but also increased when varying the number of PV modules in series. ........................................................ 88
Figure 37 – Evolution of the losses along the year for the case of D S ID V for a hybrid PVIS at constant pressure in Marrakech and depending on the number of PV modules. .......................................... 89
XXV
Figure 38 – Losses depending on the temperature of the location for a stand-alone PVIS to a water pool. The abscissa axis is expressed in terms of a temperature offset regarding the yearly mean maximum temperature in Villena. ..................................................................................................................................................... 90
Figure 39 – Losses depending on D S P M P for a stand-alone PVIS to a water pool. ....................................... 91
Figure 40 – Losses in a hybrid PV-grid irrigation system at constant power depending on the temperature. The abscissa axis is expressed in terms of a temperature offset regarding the yearly mean maximum temperature in Villena. ..................................................................................................................................................... 92
Figure 41 – Losses for a hybrid PV-grid irrigation system at constant power in Villena depending on D S ID. ...................................................................................................................................................................... 92
Figure 42 – Proposal of design to avoid overvoltages at the FC input when it is necessary to use 21 PV modules in series. ........................................................................................................................................................ 93
Figure 43 – PV pumping system from a well to a water tank. The figure illustrates the static head (Hst), the drawdown and the head of the water tank, (Hpool). The total manometric head is the addition of Hst, drawdown, Hpool plus the friction losses. ...................................................................................................... 97
Figure 44 – System curve, H-Q pump curve and characteristic points to select a pump. ..................................... 98
Figure 45 – Three possible pumps for a certain duty point. Pump A has its BEP too far to the left in respect to the duty point; Pump C has its BEP too far to the right in respect to the duty point. Pump B has the BEP close to the duty point and the pump would be the selected according to the traditional pump selection method. 99
Figure 46 – Preferred operating region to bring about the lowest energy and maintenance cost and to reduce the risk of system problems since hydraulic excitation forces and cavitation risk attain a minimum close to the BEP [137]. .................................................................................................................................................... 99
Figure 47 – List of the suitable pumps offered by PumpTutorNG tool for the duty point H= 288 m and Q= 227 m3/h. ........................................................................................................................................................... 100
Figure 48 – H-Q curves of the pumps offered by PumpTutorNG tool for the duty point H= 288 m and Q= 227 m3/h. ........................................................................................................................................................... 100
Figure 49 – Pumps with the highest slope. The E10S55/15A+MAC12340C-8V (a) and E12S50/11A+MAC12340C-8V (b) models show the ratio between the lowest and the highest head of 2.3 and 2.0 respectively. ................................................................................................................................... 102
Figure 50 – Detail of the H-Q, power-Q and efficiency-Q of both pumps. In both cases, the duty point is in the right-hand third of the H-Q curve. .............................................................................................................. 103
Figure 51 – Determination of the lowest operating frequency for the E10S55/15A+MAC12340C-8V pump (a) and the E12S50/11A+MAC12340C-8V pump (b). The values are 38 Hz and 39 Hz respectively. ........... 104
Figure 52 – H-Q, power-Q and efficiency-Q curves at the frequencies used to calculate EFFIRR for the E10S55/15A+MAC12340C-8V pump (a) and the E12S50/11A+MAC12340C-8V pump (b). Only the efficiency values for 50Hz are shown but the procedure is similar for the rest of the frequencies. ........... 105
Figure 53 – Monthly yield with both the proposed pump and the traditional one. ............................................. 107
Figure 54 – Comparison of the H-Q curves of several possible pumps for a certain duty point as shown by SISIFO – curves at 50 Hz are shown in (a), while the ones at start frequency are in (b). The system curve is also included. .............................................................................................................................................. 110
Figure 55 – Comparison of the volume of water pumped by four possible pumps during (a) the twelve months of a year and (b) during the pumping hours of the characteristic day of July. ................................................ 110


XXVII
LIST OF TABLES Table 1 – ON(1)/OFF(0) status of the different operating modes. ........................................................................ 28
Table 2 – PV energy and volume of water pumped (from PV and from diesel) in the Optimistic and Pessimist scenarios. Daily working hours are also given for “Only PV” and “Hybrid” modes with the threshold of 95 kW to transit between these two modes. ...................................................................................................... 31
Table 3 – Parameters of the simulation. ................................................................................................................ 32
Table 4 – Simulated performance indices for the Optimistic and Pessimist scenarios (NA means not applicable). ...................................................................................................................................................................... 36
Table 5 – Expected and actual STC power of the PV generator and FCs and motor-pumps efficiencies. ............ 37
Table 6 – Real operational data in 2017. ............................................................................................................... 38
Table 7 – Real performance indices in 2017. ........................................................................................................ 38
Table 8 – Real operational data in 2018. ............................................................................................................... 39
Table 9 – Real performance indices in 2018 (NA means not applicable). ............................................................ 39
Table 10 – Economic data for the Alter do Chão PV-diesel drip irrigation system. ............................................. 43
Table 11 – Economic results of the Alter do Chão PV-diesel drip irrigation system. ........................................... 43
Table 12 – PV energy, volume of water pumped (from PV and from grid) and daily working hours in the Pessimist and Optimistic scenarios. ............................................................................................................. 50
Table 13 – Parameters of the simulation. .............................................................................................................. 50
Table 14 – Simulated performance indices for the Optimistic and Pessimist scenarios. ...................................... 52
Table 15 – Expected and actual STC power of the PV generator and FCs and motor-pumps efficiencies. .......... 53
Table 16 – Real operational data in 2017. ............................................................................................................. 54
Table 17 – Real performance indices from August to November 2017. ............................................................... 54
Table 18 – Real operational data in 2018. ............................................................................................................. 55
Table 19 – Real performance indices from a period of 2018. ............................................................................... 55
Table 20 – Economic data for the Tamelalt PV-grid drip irrigation system. ........................................................ 56
Table 21 – Economic results of the Tamelalt PV-grid drip irrigation system. ...................................................... 56
Table 22 – Constancy index values, for three representative days and for three different PV array structures. ... 65
Table 23 – The separation between structures (L) and 1/GCR for the three structures in the study. .................... 67
Table 24 – Characteristics of the PV irrigation system. ........................................................................................ 70
Table 25 – AC energy for a PVGCS and water volume for a PVIS for a 40 kWp 1xh. NA means not applicable. ...................................................................................................................................................................... 71
Table 26 – PV generator size needed to guarantee the same yearly AC energy (for a PVGCS) or water volume (for a PVIS) than a 40 kWp 1xh ................................................................................................................... 73
Table 27 – Yearly mean of the constancy index (kC) applied to AC power of a PVGCS and to water flow for PVIS for the three structures in the study. .................................................................................................... 75
Table 28 – The required values of D S P M P depending on A P M P . ............................................................... 79
Table 29 – D S ID values corresponding to different A ID. ...................................................................... 80

XXVIII
Table 30 – PV generator size, frequency converter and pumping characteristics of the stand-alone and hybrid PVIS. ............................................................................................................................................................ 81
Table 31 – Maximum and minimum monthly mean ambient temperatures (TMm, Tmm) in Villena and Marrakech. ...................................................................................................................................................................... 81
Table 32 – PV energy losses of the stand-alone PV irrigation system in Villena (Vi) and Marrakech (Ma) for 20 to 22 PV modules in series and for the three values of D S P M P . ............................................................ 84
Table 33 – PV energy losses of the hybrid PV-grid irrigation system at constant power in Villena (Vi) and Marrakech (Ma) for 20 to 22 PV modules in series and for the two values of D S ID. ......................... 85
Table 34 – PV energy losses of the hybrid PV-grid irrigation system at constant power in Marrakech (Ma) for 20 to 22 PV modules in series. .......................................................................................................................... 88
Table 35 – Optimum number of PV modules in series to reduce the losses at the FC input for the stand-alone PV irrigation system to a water pool. ................................................................................................................. 89
Table 36 – Optimum number of PV modules in series to reduce the losses at the FC input for the hybrid PV-grid irrigation at constant power. ......................................................................................................................... 90
Table 37 – Values of the pump efficiency at the four frequencies used to calculate EFFIRR. ............................. 106
Table 38 – PV generator size, inverter and pumping characteristics. ................................................................. 107
Table 39 – Performance and annual efficiency of both pumps, that selected with the new method proposed here and that selected with the traditional method. ............................................................................................ 107
Table 40 – Performance comparison of the pumps selected with the new (Pump A: E10S55/15A+MAC12340C-8V) and the traditional method (Pump B: E12S55/9B+MAC12340C-8V) in the characteristic days of the months of May, June and July. ................................................................................................................... 108
Table 41 – Increase in the pumped water and efficiency obtained with the pump selected with the new method proposed here for to other locations: Marrakech and Nice. ........................................................................ 109
XXIX
NOMENCLATURE Parameter Description Unit
B In-plane direct irradiance W/m2
Inclination angle º
Coefficient of variation in the voltage with the temperature of
the solar cell
V/ºC
CAPEX Capital Expenditures €
CECn Annual price of the diesel/grid electricity €
CF Cash Flow €
CFPV,n Cash Flow of the PV for year n €
CR Capital Repayment €
DI Debt Interest %
EAC AC energy kWh
EAC1xh AC energy of 1xh kWh
Ed Diesel energy kWh
EFFIRR Irrigation efficiency p.u.
Eg Energy supplied by the grid kWh
Energy supplied by the diesel generator in “Hybrid” mode kWh
EHyd Hydraulic energy kWh
Energy supplied by the diesel generator in “Only Diesel”
mode
kWh
EPV PV energy kWh
Efficiency of the FC p.u.
Hydraulic efficiency p.u.
Efficiency at intermediate motor-pump frequency p.u.
Efficiency at intermediate motor-pump frequency p.u.
Efficiency at maximum motor-pump frequency p.u.
Efficiency at minimum motor-pump frequency p.u.
Ratio real power versus nominal power of the PV generator p.u.
Thermal efficiency of the PV generator p.u.
FML Electrical mismatching losses %
G In-plane global irradiance W/m2
G* Irradiance at Standard Test Conditions W/m2
XXX
γ Power temperature coefficient of the PV modules W/ºC
GCR Ground Cover Ratio p.u.
Gdm(0) Monthly mean daily horizontal irradiation Wh/m2
GIP Irradiance during the IP W/m2
Gmd In-plane irradiance at midday W/m2
Gused Irradiance effectively used by the system W/m2
Guseful Available useful irradiance during the IP W/m2
h Inflation rate %
H Pumping head m
HDR Hybrid diesel ratio p.u.
Hdyn Dynamic level of the water in the well m
Hfriction Friction losses m
HMT Total Manometric Head m
Hpool Height of the water pool m
IIC Initial Investment Cost €
IRR Internal Rate of Return %
ISC Short-circuit current A
K0 No-load parameter (Schmid model) p.u.
K1 Linear losses parameter (Schmid model) p.u.
K2 Joule losses parameter (Schmid model) p.u.
kc Constancy index p.u.
Kp Proportional gain p.u.
l Loan maturity %
LCOE Levelized Cost of Energy €/kWh
LCOECS Levelized Cost of Energy of the current system €/kWh
LCOEPS Levelized Cost of Energy of the previous system €/kWh
LCOEPV Levelized Cost of Energy of PV €/kWh
LEW Separation between rows of the PV generator in East-West
direction
p.u.
LNS Separation between rows of the PV generator in North-South
direction
p.u.
Mean value p.u.
NPV Net Present Value €

XXXI
Ns Number of PV modules in series p.u.
Standard deviation value p.u.
OPEX Operating expense €
OPEX0 Operating expense at year 0 €
P* Nominal power of the PV generator kW
P*1xh Peak power of 1xh kW
p1 Water pressure at the water outlet to the plants m
p2 Water pressure at the output of the pumps m
PAC AC power kW
PB Payback period year
Power of the Delta structure kW
Maximum power of Delta with one MPPT kW
PE Power of the East side of the Delta structure kW
Pi Power of the i side of the Delta structure (where i can be East
or West)
kW
Pi* Peak power of the i side of the Delta structure (where i can be
East or West)
kW
Pp=const Constant PV power kW
PEn Energy consumed by the diesel generator or the grid kWh
PR Performance Ratio p.u.
PRPV PR considering only losses strictly associated with the PV
system itself
p.u.
PVEn Energy that after the installation of the PV system is not
consumed by the diesel generator
kWh
PVS PV share p.u.
PVSH PV share characteristic solely to the “Hybrid” mode p.u.
PW Power of the West side of the Delta structure kW
Q Water flow m3/h
r Real interest rate %
s Additional spread %
Sn Annual savings €
TC Cell temperature ºC
TC* Cell temperature at Standard Test Conditions ºC

XXXII
Td Derivative time s
Ti Integral time s
TMm Maximum monthly mean ambient temperatures ºC
Tmm Minimum monthly mean ambient temperatures ºC
UREF Ratio of the irradiation required to keep PAC stable during the
irrigation scheduling to the same irradiation during the IP
p.u.
URIP Ratio of the total irradiation throughout the irrigation period to
the total annual irradiation
p.u.
URPVIS Ratio of the irradiation strictly required to keep PAC equal to
the stable AC power requirement to the total irradiation
throughout the IP
p.u.
VAC AC voltage V
A P M P AC voltage of the grid V
A P M P output AC voltage of the pump V
D S ID DC bus voltage established by the grid V
D S P M P DC bus voltage imposed by the pump V
Water volume pumped by diesel m3
VMPP Maximum Power Point Voltage V
Maximum power point voltage of the whole Delta structure V
Maximum power point voltage of each side of the Delta
structure (where i can be East or West)
V
Water volume pumped by PV m3
VOC Open-circuit voltage V
Vp=const Voltage at constant PV power V
Vt Thermal voltage of a PV module V
Water volume1xh Water volume of 1xh m3
WTday Daily working time h
Abbreviations
AC Alternate Current
DC Direct Current
1xh Single North-South horizontal axis tracker

XXXIII
BEP Best Efficient Point
ΔS(60) Delta structure
FAO Food and Agriculture Organization (of the United Nations)
FC Frequency Converter
FENACORE Spanish Federation of Irrigation Communities
FENAREG Portuguese Federation of Irrigation Associations
GTZ German Cooperation Agency
IES-UPM Solar Energy Institute, Universidad Politécnica de Madrid
IP Irrigation Period
Ma Marrakech
MASLOWATEN MArket uptake of an innovative irrigation Solution based on LOW WATer-
ENergy consumption
MP Motor-pump
MPP Maximum Power Point
MPPT Maximum Power Point Tracking
PAEGC Powering Agriculture: An Energy Grand Challenge for Development
PID Porportional, Integral, Differential
PRODEEM Program for Energy Development of States and Municipalities
PRS Solar Regional Program
PV Photovoltaics
PVGCS PV Grid-Connected System
PVGIS Photovoltaic Geographical Information System
PVIS PV irrigation system
S(25) Static structure oriented to the South and tilted 25º
STC Standard Test Conditions
UAA Utilized Agricultural Area
Vi Villena


Large power hybrid PV pumping for irrigation
1
CHAPTER 1
INTRODUCTION
Photovoltaic (PV) electricity prices have declined below 0.1 €/kWh [1], which means that PV
is currently able to compete with almost any other energy sources and in almost all scenarios.
Therefore, the general problem of the PV engineering can be understood as the problem of
adapting the particular characteristics of PV to a specific application.
This is well solved for two particular situations: grid-connected PV systems with low levels of
PV penetration (that is currently the majority of the PV market, with 385.7 GW of installed
capacity until 2017 [2]) – which has led, namely, to the inclusion of protections and support in
the regulations of active and reactive power – and stand-alone PV systems – which include a
battery to cover the deficits of radiation.
Currently, PV systems are also becoming more attractive to the market of large-power
irrigation systems since energy is a key input for irrigation services.
According to the Food and Agriculture Organization of the United Nations (FAO) the food
needed in 2050 to feed the rising world population will be 60% higher than the one in 2015
[3]. This increase in food production will only be possible with an increase of the irrigated
land.
Worldwide, irrigation needs vary with water availability, climate, topography and geology.
The structure of irrigation is also affected by regional activities, infrastructures and social
customs [4]. In 2007, according to Schoengold & Zilberman in [5], irrigation systems
represented 20% of agricultural land worldwide, 40% of the world food by volume and more
than 50% of the value of agricultural production.
Water is a critical asset for the competitiveness of the agricultural sector – 1 ha of irrigated
land produces 5 to 6 times more than 1 ha of dry land [6], [7]. [8]. Accordingly, agriculture is
a high water consuming sector [9] – currently, agriculture consumes around 70% of the
freshwater demand in the world; in 2012, it accounted for around 33% of total water use in
Europe, reaching up to 80% in a significant part of southern Europe [10]; in 2000 it was
responsible for around 30% of total water use in Europe (in the southern countries this value
was over 60% and in the northern ones it varied from almost zero to over 30% [11]).

Introduction
2
Southern European countries rely heavily upon irrigation for their crop production [10] and
therefore water becomes a limiting factor. In fact, the irregularity and unpredictability of rain
forces irrigation [6] and it is also a way to mitigate the adverse effects of climate change [6].
Moreover, agriculture employed a high percentage of the economically active population [6]
(e.g., in 2010, 9.8 % in Spain [12], 13.5% in Portugal [13]). On the other hand, in more humid
and low-temperature areas, irrigation is a way both to increase and stabilize the farmer
incomes (irrigation reduces the risks in case of low rainfall or droughts) [10].
The distribution of irrigated land in Europe, in 2013, can be seen in Figure 1 [14]. As
expected, the highest share of irrigated land is located in southern Europe. The national values
of the irrigated area as a percentage of the utilized agricultural area (UAA) in these countries
was 34.4% in Greece, 33.6% in Malta, 24.3% in Italy, 22.6% in Cyprus, 13.5% in Portugal
and 13.4% in Spain. Even so, Spain had, in absolute terms, the largest area of irrigated land in
Europe, with 2.9 million ha. The mean value across the 28 countries of the European Union
was 6.2% [15].
For instance, in Spain, in 2010, the UAA represented 47% of the country area (23.7 million
ha) and the average size of farms was 24 ha. Even so, 50% of the farms had less than 5 ha
(occupied less than 5% of the national UAA) and 5% of the farms had 100 ha or more
(represented 55% of the UAA and accounted for 63% of the total standard output, which is
the average monetary value of the agricultural output at farm-gate price, in €/ha).
Nevertheless, it is interesting to note that there was a tendency towards the increase of large
farms. The irrigable area was 15% of the UAA and the average water consumption was 5470
m3/ha [12]. Currently, the irrigated land in Spain occupies 22% of the UAA, which means 3.7
million ha [16]. According to Abadía cited in [17], the average contracted power in Spain is 2
kW/ha. This means that a farm of 100 ha or more needs 200 kW or more.
In Portugal, also in 2010, the UAA represented 40% of the country area. A tendency towards
the disappearance of small farms in favor of the bigger ones also occurred in this country.
Nevertheless, the average size of the farms was 12 ha, with 50% of the farms with less than 2
ha and only 2% with 50 ha or more. These last ones occupied 58% of the national UAA and
represented 23.7% of the total standard output of the country. The irrigable area was 14% of
the UAA [13].
Large power hybrid PV pumping for irrigation
3
Figure 1 – Percentage of the irrigated areas regarding the utilized agricultural area (UAA) [%] in 2013 [14].
Traditionally, most of the irrigation in Europe has consisted of open-channel gravity-based
system that consumes a huge amount of water and almost zero energy [11]. More efficient
irrigation systems are being implemented within Europe through the change from this kind of
systems to pressurized networks (in which water consumption is reduced at the price of
increasing energy use) [9], [6], [7], [10]. Spain is the best representative example of this
modernization. According to FENACORE (the Spanish Federation of Irrigation
Communities), from 2000 to 2016 the share of gravity-based systems decreased from 59% to
27%, while the share of drip systems increased from 17% to 49% [18].
It can be concluded that this modernization has not only increased the water efficiency and
productivity but has also improved the operation and maintenance of the irrigation systems
and enhanced the working conditions of the farmers [7]. Even so, it also increased both the
investment and energy demand [7]. It follows that higher energy costs are currently observed

Introduction
4
in the farms. Hence, farmers are looking for solutions to reduce these costs and ensure the
profitability of their farms [9].
The share of energy used in the World, Europe, southern Europe and southern European
countries in agriculture and forestry in 2011 is revealed in Figure 2 (data obtained from FAO
[19]). As expected, the highest share is verified in the southern Europe region, 2.60%.
Figure 2 – Percentage of the energy used in agriculture and forestry in the World, Europe, southern Europe and southern European countries in 2011 (it includes, but it is not limited to, the energy needed to irrigate) [19].
If ones focus again in the case of Spain, in 2011, 2.75% of the national energy was used in
agriculture and forestry (see Figure 2). Later, in 2016, 2.5% of the total electricity
consumption was in the category “agriculture, livestock, forestry, hunting and fisheries” [20].
It is important to mention that these previous values included, but are not limited to,
irrigation. Currently, and according to estimations done by FENACORE, irrigation accounts
for 2.1-2.2% of the national electricity consumption.
Still, in Spain, the energy consumption to irrigate increased 1800% from 1950 to 2010, while
the water used decreased by 21% [21]. According to the Spanish National Institute of
Statistics cited in [7], the energy consumed for irrigation has increased 70% from 1996 to
2011 (2136 GWh in 1996 to 3647 GWh in 2011). In Portugal, the energy consumption to
irrigate increased 665% from 1960 to 2014 (from 200 kWh/ha to 1534 kWh/ha respectively)
[6].

Large power hybrid PV pumping for irrigation
5
Moreover, the increase in energy prices is also negatively affecting the feasibility of
agriculture in southern Europe [22], [23]. In Spain, the price of energy for irrigation has risen
due to the liberalization of the electricity market in 2003 and the elimination of special
irrigation rates in 2008 [9]. According to FENACORE, the price of electricity for the Irrigator
Communities increased 1250% from 2008 to 2013 [24]. Similarly, in Portugal, the electricity
market was also liberalized, the seasonal electricity contracts were eliminated in 1983 and a
40% discount and a program called "Green Electricity" ended in 2005 [25]. From 1999 to
2014, the energy part of the electricity bill increased by 25% [25].
In Spain, the average price of the power term alone increased by 288% from 2008 to 2014 [9].
In Portugal, from 1999 to 2014, the electricity tariffs just for using the system increased 773%
[25]. Currently, the high tariffs of the fixed terms of the electricity bill (which need to be paid
for the 12 months of the year even if the system is used only during 6) represent 20 to 30% of
the electricity bill in Portugal [6]. The seasonal profile of irrigation is reflected in electricity
consumption. For instance, in Portugal, a study performed by FENAREG (the Portuguese
Federation of Irrigation Associations), in partnership with IMValores sv and Green Egg,
found that 90% of the annual electricity consumption in irrigation is between April and
September (with July and August being responsible for 61%) [6].
Following the tendency towards the increase of large farms, large powers are currently
needed. Furthermore, given the modernization of agriculture in southern Europe, greater
energy consumption and hence higher energy costs are becoming a critical matter in this
region. Accordingly, productive agriculture needs to decrease its costs in order to guarantee
the sustainability of the sector and to allow competitiveness.
As pointed out in [8], research and development projects are needed to promote the use of
stand-alone PV systems for irrigation both for communities of irrigators and private farms.
According to FENAREG, the current biggest challenge in the agricultural sector is to reduce
the energy bill associated with water pumping [26]. Three solutions are proposed by
FENAREG: the return to seasonal contracted power tariffs, the real liberalization of the
electricity market, and a national program to implement renewable energy systems [27]. In
what concerns this last recommendation, FENAREG appealed to the Portuguese Government,
in May 2018, to create specific support to the installation of PV systems in the public
irrigation sector (for example, through the Common Agricultural Policy or the PDR2020)
[26]. FENAREG considers that PV can contribute to the reduction of the irrigation costs [26].

Introduction
6
In this framework, the end-users (farmers, agro-industries and irrigator communities) are
seeking for alternatives to their conventional energy sources (national grid and diesel
generators [28]) that satisfy their needs of large power at reasonable costs. According to [5]
there is the need to develop technologies to decrease the cost of groundwater abstractions in
order to face the effects of rising energy prices. Moreover, in [7], authors said that it is
necessary to analyze the application of wind and PV for medium and large size farms since
renewable energy systems, mainly solar, are only used in small farms with small water
requirements (not exceeding 10 kW).
Furthermore, it can be pointed out that in 2014 electric irrigation pumps consumed around 62
TWh worldwide [29], with the southern Europe representing almost 40% of this consumption
[30], which means a potential market of 16 GWp of PV irrigation systems in this region [31].
Likewise, the north of Africa is also a very interesting market. For instance, in Morocco, in
2011, irrigated land represented 5% of the UAA [32] and, in 2009, 15% of the energy
consumed in the country was devoted to agriculture and forestry [19]. According to the
Ministry of Energy, Mines, Water and Environment, cited in [31], the annual electric
consumption in this region is estimated to yield 2500 GWh, which leads to a potential market
of PV irrigation system of 1.5 GWp.
Large-power PV irrigation systems are thus becoming more attractive to overcome the
problem of increasing energy consumption and electricity costs. Hence, this thesis intends to
adapt the characteristics of large-power PV generators to the need for irrigation of modernized
agriculture.
1.1 Brief summary of the historical milestones in photovoltaic pumping
The history of PV water pumping systems begins in 1973, when Dominique Campana
attended UNESCO's solar summit in Paris [33]. After this, she thought about using PV to
pump water. So, in the mid-1970s she coordinated the installation of the first PV water
pumping system. This system was installed in Corsica, France, and included a Guinard DC
pump fed by Philips PV modules [33], [34].
Father Bernard Vespieren was one of the first visitors of this system. At that time, he had a
Non- ove rnmental Organization in Mali, called “Mali Aqua Viva”, which, among other
things, supported the installation of hand pumps for drinking water. Excited with the good
Large power hybrid PV pumping for irrigation
7
performance of the solar pump in Corsica [31], he introduced the first PV pump in Africa in
1977 [34].
After these first experiences, many other PV pumping programs were developed. In 1978,
Newkirk, according to [35], did a bibliography of the published material on PV water
pumping systems. He found 7 publications about systems in the Soviet Union, 2 in France, 1
in Germany and 3 in the USA. The ones outside the USA had peak powers ranging from 300
Wp to 1 kWp. Regarding the ones in the USA, detailed information was only available for a
25 kWp system feeding a 7.5 kW pump for 12 hours a day in the months of July and August.
It was installed in the summer of 1977 in Nebraska, sponsored by the United States
Department of Energy.
Between 1979 and 1981, the United Nations Development Program, with the support of the
World Bank and the Intermediate Technology Development Group, implemented a pilot
project to test and evaluate PV pumping systems with powers ranging from 100 to 300 Wp
used in small-scale irrigation systems in Mali, Philippines and Sudan [36]. A great potential
was found but none of the products were approved to large-scale deployment. An
improvement in the reliability and a cost reduction (the PV modules price was about 16
USD/Wp in 1978 [37]) were recommended as a result of the project [38]. Between 1977 and
1990 around 200 systems were installed in Mali, with a total installed power of 220 kWp [34],
[38].
Following the experience in Mali, the countries of the Permanent Interstate Committee for
Drought Control in Sahel (Burkina Faso, Cape Verde, Chad, Gambia, Guinea-Bissau,
Mauritania, Nigeria, and Senegal), in cooperation with the European Commission, launched
the Solar Regional Program (PRS) in the early 1990s [39]. The main objective of this project
was to improve the water access to the population (both in quantity and quality), as well as
improving their economic conditions through the irrigation of vegetables and fruit trees [38],
[39]. This project allowed the installation of 1040 systems, with a total PV power of 1.3 MWp
[38], [39].
This program was the first one in the PV pumping field which included technical
specifications and quality control procedures [38]. For this reason, these systems presented
lower failures rates but these procedures only went from the borehole to the entry of the water
pool. Some problems occurred in the distribution networks and the main lesson learned was
that every component of the whole system should be carefully tested [38].

Introduction
8
Also in the early 1990s, from 1990 to 1994, the German Cooperation Agency (GTZ), in
partnership with the local governments, developed the "PVP Program" with the objective of
demonstrating the maturity of the technology and its real costs. The program installed 90 PV
pumping systems, with a total power of 180 kWp, in Argentina, Brazil, Indonesia, Jordan,
Philippines, Tunisia and Zimbabwe (according to Anhalt, cited in [38]).
During the 1990s some other national projects arose. As an example, in 1993, India had the
largest number of solar pumps in the world, with more than 1000 systems for village water
supplies [34]. In Morocco, more than 100 PV pumps had been installed by the Ministry of the
Interior, while it was estimated that around 100 more had been installed privately [34].
Moreover, in Brazil, the Program for Energy Development of States and Municipalities
(PRODEEM), established by the Brazilian Federal Government in December 1994 to install
mainly PV systems, carried out 6 International Biddings since May 1996. Along the six
phases, almost 2500 PV water pumping systems were installed, with a total power of 1.4
MWp (Figure 3 shows one of these systems). The main objective of this project was to supply
water mainly for human consumption but also for animals and small-scale irrigation [40]. A
couple of studies identified some drawbacks of this program such as the delay in the
implementation of the systems, the poor technical assistance and the lack of participation of
the end-users [41]. In addition, according to [41], an analysis in the Northeast region showed
that from the 801 installed systems, 18% presented problems in the controllers/inverters and
25% in the helical pumps. Still in the Northeast region, in Petrolina, the city hall evaluated 30
PV pumping systems of this project [42]. This evaluation was done in 2002-2003 and,
according to Petrolina (2002) cited in [39], only 65.6% of the systems were still working,
20.7% were broken or were not in use and the remaining 13.7% had been stolen. In January
2005, a new inspection was done and, according to Borges Neto (2005) cited in [39], only 4
of the initial 30 systems were still in operation.

Large power hybrid PV pumping for irrigation
9
Figure 3 – PV pumping system for irrigation in Capim Grosso, Brazil [43].
Finally, in Mexico, between 1994 and 2000, 206 PV water pumping pilot systems (with a
total power of 101 kW and benefiting around 10000 people) were installed in the framework
of the Mexican Renewable Energy Program [44]. From July 2003 to March 2004 a survey
was carried out in 46 of these systems. Results demonstrated that 26 systems had presented
failures in some of the components, from which 8 had been replaced and the systems continue
to work. Accordingly, 18 systems were not working. As in the PRODEEM, most failures
occurred in the pumps. According to [44], 54% of the problems were related to the pumps,
21% to the controllers/inverters, 17% to borehole-related issues and 8% of the systems were
dismantled.
Figure 4 – Engineer conducting performance evaluation after 8 years of operation in Chihuahua, Mexico [44].
The project “Implementation of a PV water pumping program in the Mediterranean
countries”, developed under the MEDA program (a cooperation program supported by the
European Union) in the beginning of the 2000s, also deserves attention. Fifty-two PV water
pumping systems were installed: 10 in Algeria, 29 in Morocco and 13 in Tunisia (with a total
power of 59, 138.7 and 58.3 kWp respectively) [45]. In this project, four standardized
services were proposed in order to allow a higher quality control procedure: 850, 1750, 2600
and 5500 m4/day [46]. Before the beginning of this project, a few other systems had been

Introduction
10
installed in Morocco [47]. It is remarkable that the development of a professionalized
structure allowed its maintenance along 12 years [47]. Once more, the majority of the failures
was not related to the PV components but with the lack of water in the boreholes.
The technological evolution in these programs went from dedicated inverters and centrifugal
pumps specifically dedicated to PV applications to both standard frequency converters and
AC centrifugal pumps [48]. This contributed to an increase in the reliability and efficiency of
the systems due to the use of well-proven components. Since this equipment was extensively
used in industrial applications, a decrease in price was also verified and the availability of
spare parts and the access to maintenance tasks significantly improved.
The year 2009 can be seen as a turning point for PV irrigation because the PV modules cost
decreased dramatically [1] and, as a consequence, PV systems become affordable for the
agriculture sector in general [49] and for PV irrigation systems in particular [50], [51], [52],
[53]. Although technical problems associated with the greater power required for agricultural
irrigation limited their introduction into the market, this market becomes extremely
interesting.
1.1.1 PV water pumping systems for irrigation
Although the first projects of PV water pumping systems were mainly devoted to drinkable
water to the populations, there were some cases of systems applied to irrigation worldwide
[36], [38]. According to [34], the predominance of drinkable water supply was due not only to
the smaller water quantities needed in drinking water but also due to the high social value of
domestic water when compared to the one for irrigation.
A PV water pumping system for irrigation is commonly made up of a PV generator, a
frequency converter (FC), a standard centrifugal pump and a water tank and/ or an irrigation
network (Figure 5) [48] and usually requires more power than a PV pumping system for
drinkable water. A PID (Proportional, Integral, Differential) algorithm for motor control
(implemented in the FC) automatically adjusts the output voltage and frequency to the PV DC
power available [54], [55]. A maximum power point tracking algorithm is usually included in
order to maximize the PV energy production [49], [56], [57].
These systems can be classified into two types: pumping to a water pool (at a variable
pressure and water flow) from where irrigation is done by gravity and direct pumping (with
constant pressure and water flow for each irrigation sector usually through drippers).
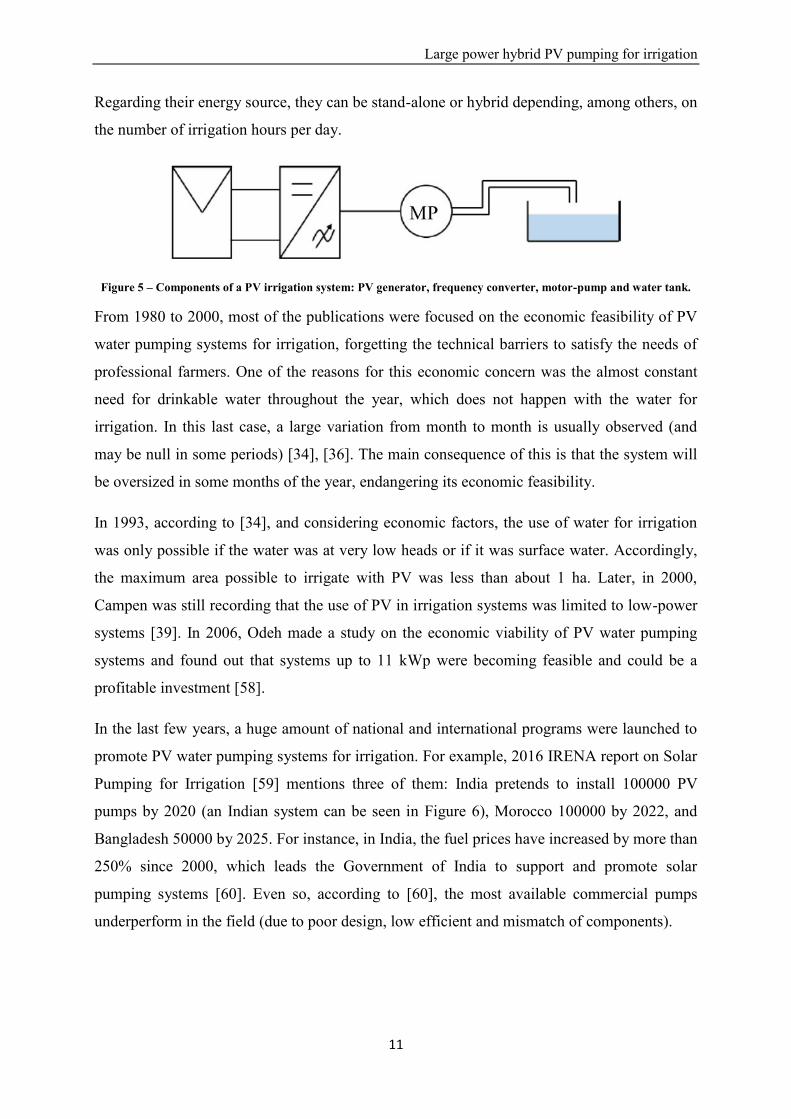
Large power hybrid PV pumping for irrigation
11
Regarding their energy source, they can be stand-alone or hybrid depending, among others, on
the number of irrigation hours per day.
Figure 5 – Components of a PV irrigation system: PV generator, frequency converter, motor-pump and water tank.
From 1980 to 2000, most of the publications were focused on the economic feasibility of PV
water pumping systems for irrigation, forgetting the technical barriers to satisfy the needs of
professional farmers. One of the reasons for this economic concern was the almost constant
need for drinkable water throughout the year, which does not happen with the water for
irrigation. In this last case, a large variation from month to month is usually observed (and
may be null in some periods) [34], [36]. The main consequence of this is that the system will
be oversized in some months of the year, endangering its economic feasibility.
In 1993, according to [34], and considering economic factors, the use of water for irrigation
was only possible if the water was at very low heads or if it was surface water. Accordingly,
the maximum area possible to irrigate with PV was less than about 1 ha. Later, in 2000,
Campen was still recording that the use of PV in irrigation systems was limited to low-power
systems [39]. In 2006, Odeh made a study on the economic viability of PV water pumping
systems and found out that systems up to 11 kWp were becoming feasible and could be a
profitable investment [58].
In the last few years, a huge amount of national and international programs were launched to
promote PV water pumping systems for irrigation. For example, 2016 IRENA report on Solar
Pumping for Irrigation [59] mentions three of them: India pretends to install 100000 PV
pumps by 2020 (an Indian system can be seen in Figure 6), Morocco 100000 by 2022, and
Bangladesh 50000 by 2025. For instance, in India, the fuel prices have increased by more than
250% since 2000, which leads the Government of India to support and promote solar
pumping systems [60]. Even so, according to [60], the most available commercial pumps
underperform in the field (due to poor design, low efficient and mismatch of components).
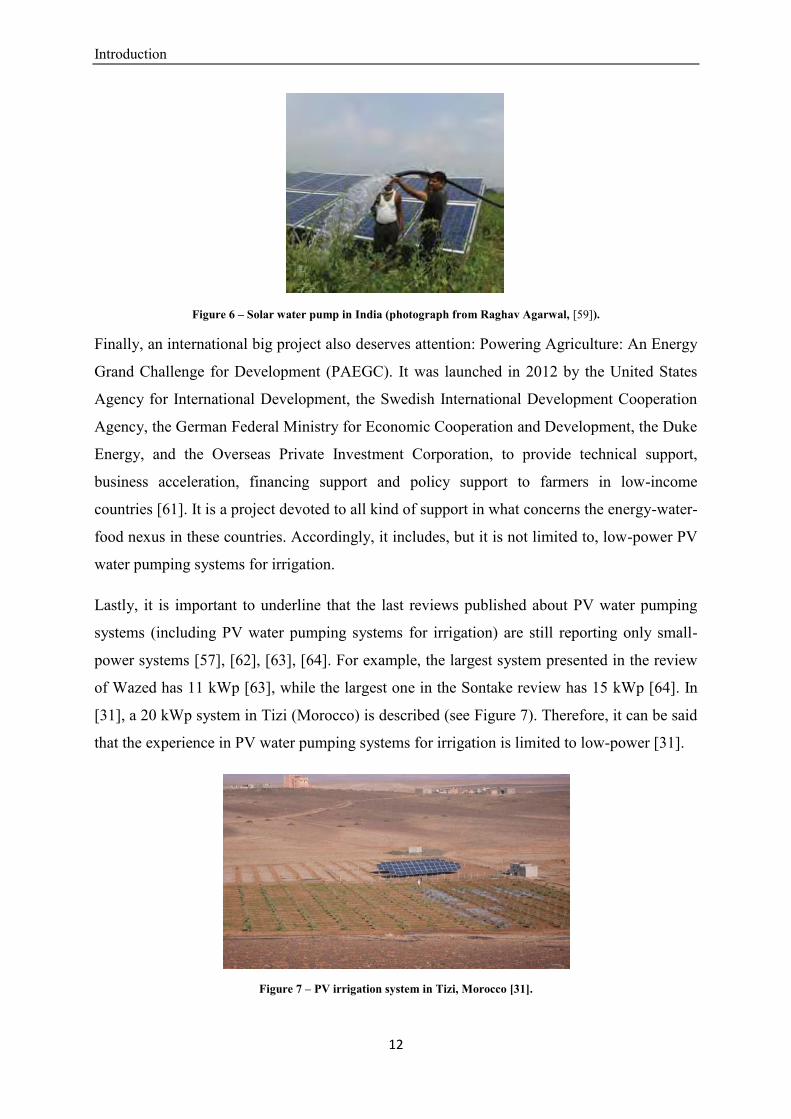
Introduction
12
Figure 6 – Solar water pump in India (photograph from Raghav Agarwal, [59]).
Finally, an international big project also deserves attention: Powering Agriculture: An Energy
Grand Challenge for Development (PAEGC). It was launched in 2012 by the United States
Agency for International Development, the Swedish International Development Cooperation
Agency, the German Federal Ministry for Economic Cooperation and Development, the Duke
Energy, and the Overseas Private Investment Corporation, to provide technical support,
business acceleration, financing support and policy support to farmers in low-income
countries [61]. It is a project devoted to all kind of support in what concerns the energy-water-
food nexus in these countries. Accordingly, it includes, but it is not limited to, low-power PV
water pumping systems for irrigation.
Lastly, it is important to underline that the last reviews published about PV water pumping
systems (including PV water pumping systems for irrigation) are still reporting only small-
power systems [57], [62], [63], [64]. For example, the largest system presented in the review
of Wazed has 11 kWp [63], while the largest one in the Sontake review has 15 kWp [64]. In
[31], a 20 kWp system in Tizi (Morocco) is described (see Figure 7). Therefore, it can be said
that the experience in PV water pumping systems for irrigation is limited to low-power [31].
Figure 7 – PV irrigation system in Tizi, Morocco [31].
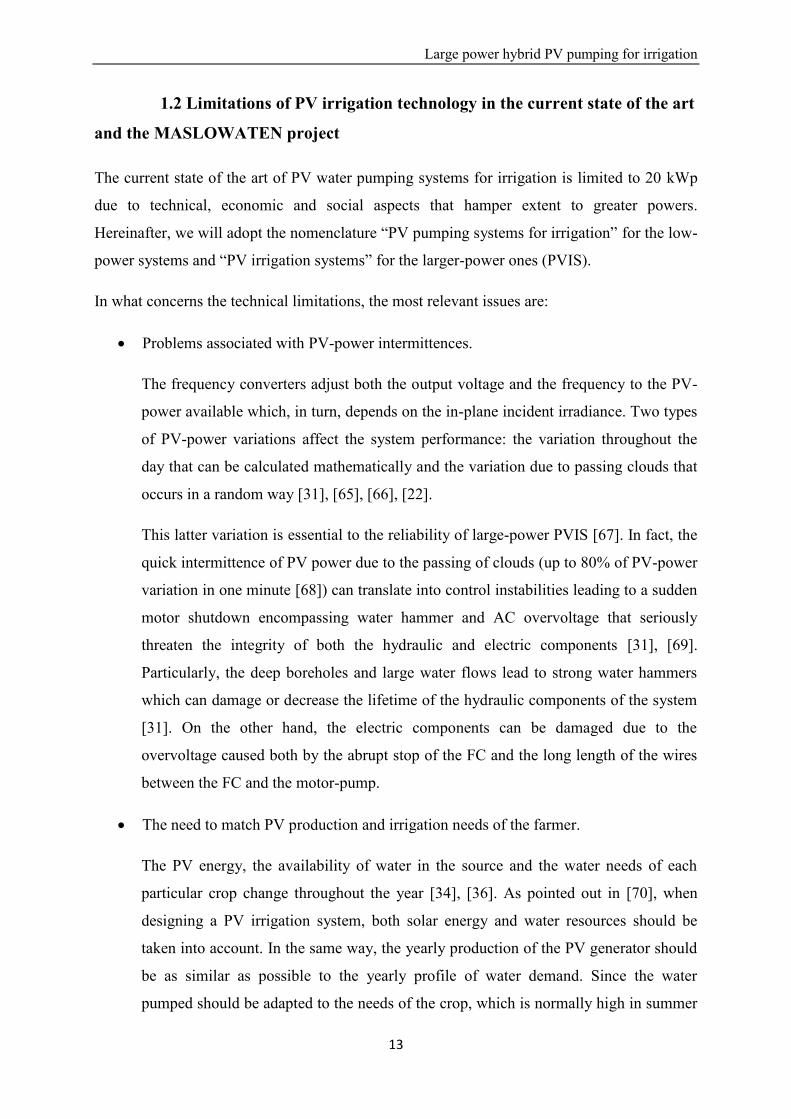
Large power hybrid PV pumping for irrigation
13
1.2 Limitations of PV irrigation technology in the current state of the art
and the MASLOWATEN project
The current state of the art of PV water pumping systems for irrigation is limited to 20 kWp
due to technical, economic and social aspects that hamper extent to greater powers.
Hereinafter, we will adopt the nomenclature “PV pumping systems for irrigation” for the low-
power systems and “PV irrigation systems” for the larger-power ones (PVIS).
In what concerns the technical limitations, the most relevant issues are:
Problems associated with PV-power intermittences.
The frequency converters adjust both the output voltage and the frequency to the PV-
power available which, in turn, depends on the in-plane incident irradiance. Two types
of PV-power variations affect the system performance: the variation throughout the
day that can be calculated mathematically and the variation due to passing clouds that
occurs in a random way [31], [65], [66], [22].
This latter variation is essential to the reliability of large-power PVIS [67]. In fact, the
quick intermittence of PV power due to the passing of clouds (up to 80% of PV-power
variation in one minute [68]) can translate into control instabilities leading to a sudden
motor shutdown encompassing water hammer and AC overvoltage that seriously
threaten the integrity of both the hydraulic and electric components [31], [69].
Particularly, the deep boreholes and large water flows lead to strong water hammers
which can damage or decrease the lifetime of the hydraulic components of the system
[31]. On the other hand, the electric components can be damaged due to the
overvoltage caused both by the abrupt stop of the FC and the long length of the wires
between the FC and the motor-pump.
The need to match PV production and irrigation needs of the farmer.
The PV energy, the availability of water in the source and the water needs of each
particular crop change throughout the year [34], [36]. As pointed out in [70], when
designing a PV irrigation system, both solar energy and water resources should be
taken into account. In the same way, the yearly production of the PV generator should
be as similar as possible to the yearly profile of water demand. Since the water
pumped should be adapted to the needs of the crop, which is normally high in summer
Introduction
14
months and null in winter months, it is good news that the water requirement is higher
when more solar energy is available [36], [71], [72].
In what concerns the intra-daily variations, this match of PV production and irrigation
needs is also crucial. A constant profile of water flow is required (which means that a
constant profile of PV power should be achieved) both in pumping to a water pool and
direct pumping systems. In the first case, the borehole should not be stressed out with
peaks of water flow. In direct pumping, that requires constant pressure and water flow
and, therefore, constant power, this constancy is even more important. It is easy to
understand that the typical static structure oriented to the Equator does not fulfill this
requirement.
The difficulty in the integration of the PV system in the pre-existing irrigation systems
that are very diverse.
A significant part of the potential PV irrigation market will be the retrofitting of
already existing irrigation systems fed by the national grid or diesel generators [73].
This suggests that the characteristics of the pre-existing irrigation system need to be
studied in detail to adapt the PV system to it. It seems easy but it is not since it
requires a deep knowledge of the previously installed irrigation system, namely its
irrigation network, motor-pumps, power source, irrigation automatism (if any),
irrigation scheduling, and type of irrigation: to a water pool or direct pumping
(through drippers, sprinklers or pivots). Moreover, it is also critical to know possible
restrictions and irrigation scheduling. There are some irrigation networks that force
irrigation during the night since the needed number of irrigation hours is higher than
the number of sun hours.
Furthermore, an irrigation controller that executes the irrigation programs according to
the irrigator operator desire is usually presented in the pre-existing irrigation system.
However, when integrating the PVIS, if the irrigator operator wants to irrigate, the
system will only work if there is enough PV-power available to run the pump.
Accordingly, it is easy to understand that it is necessary that the PV controller sends
this information to the irrigation controller. This integration would be also very useful
to the irrigator operator since he would be able to continue with his habits of just
programming the irrigation controller.

Large power hybrid PV pumping for irrigation
15
The tuning of the frequency converter.
The plug and play PV pumping systems available for low-power needs do not work
for large-power PVIS. This happens because the PID controller of the frequency
converter is affected by the characteristics of the hydraulic system and cannot be tuned
in the factory but on-site. Therefore, in large-power PVIS it is necessary to tune the
PID controller once the PVIS has been installed.
In addition to the technical issues, some economic and social aspects also appear:
The high initial investment cost (which means that if there is not an appropriate
financing mechanism available it is hard to install the system).
The low confidence of the end-user on the reliability of a new technology such as
PVIS.
The pre-conceived idea of the end-users that PV only works for low-power
applications and that the land surface needed to install the PV generator is too much.
MASLOWATEN, a H2020 European Project for the market uptake of large-power PVIS that
lasted from September 2015 to August 2018 [74] faced these limitations. The project included
the design, installation and operation of 5 real-scale large-power demonstrators with powers
from 40 to 360 kWp working in real facilities of farmers, cooperatives, agro-industries and
irrigator communities to show their reliability and economic feasibility. The final goal was to
introduce them to the market. The demonstrators cover the different possible configurations
of the irrigation systems: water pumping to a pool at a variable water flow and direct pumping
to the irrigation network through sprinklers, pivots or drip systems at a constant pressure and
water flow; powered by stand-alone PV systems or hybrid systems combining PV with the
grid or with diesel generators. The project considered also the development of the needed
tools for the bankability and market uptake of PVIS: technical specifications [50] and quality
control procedures, a simulation tool [75] and business plans. MASLOWATEN also
transferred the technology to 27 European small and medium enterprises, typically, installers
that are close to the farmers.
This thesis has been developed in the framework of MASLOWATEN project and,
specifically, in the aspects related to large-power hybrid PVIS.

Introduction
16
1.3 The need for hybrid systems
The hybrid solutions are imperative in a variety of situations. First, if the irrigation network
requires more irrigation hours than those available with PV (usually due to the diameter of the
pre-existing tubes), a hybrid system is indispensable because otherwise, the system will not be
able to deliver the water needed by the crop. So, in this case, the main purpose of the hybrid
system is to cover the night demand.
Second, when there are peaks of irrigation in some periods, one possibility is to oversize the
PV generator [76], although this may not be the most economical solution and a hybrid
system should be considered [49]. It must be pointed out that a diesel generator can be rented
for only one month (instead of doing it along the whole irrigation period). In this case, the
main purpose of the hybrid system is a response to the peak consumption.
Third, a hybrid system can be installed only to get the irrigator operator confidence in the PV
system. In this case, the hybrid was not strictly needed in terms of energy consumption but
can act as a backup system. An important aspect that should be considered in these situations
is the possible rebound effect in water consumption. Since electricity during the day tends to
be free, the irrigator operator can think about using the amount of money saved to increase
their irrigation hours and start irrigating during night-time, which will lead to a rise in both
energy and water consumption. The control of the water consumption by water authorities
would avoid this problem but it is surprising that the use of water meters to account the
volume of water used is not usual [77], [78].
Finally, since PV power is variable in time [22], [65], [66], the use of hybrid systems can also
be a possible strategy to solve the problems associated to the PV-power intermittences.
The use of hybrid PV systems has the advantage of improving the reliability of the system
[66], [76], increase the efficiency in power use, decrease energy costs and emissions [66].
Furthermore, in [73], it is mentioned that a hybrid system may be a cost-effective solution for
large-power PVIS, particularly if diesel generator or grid electricity are already being used.
Large power hybrid PV pumping for irrigation
17
1.4 Objectives and main contributions of this thesis
The objective of this thesis is the development of technical solutions for the reliable and
efficient performance of large-power hybrid PV irrigation systems.
These technical solutions have been applied in the design and implementation of two real-
scale large-power PVIS:
A 140 kWp hybrid PV-diesel drip irrigation system in Portugal in a super-intensive
olive plantation of 195 ha;
A 120 kWp hybrid PV-grid drip irrigation system in Morocco in an intensive olive
trees farm of 233 ha.
Both systems differentiate in the type of hybridization – while in Portugal the hybridization is
carried out in the hydraulic part of the system, in Morocco the PV and the grid are electrically
hybridized.
The technical solutions provided by this thesis tackle the aforementioned limitations and are
the following:
The problems associated with PV-power intermittences.
Instabilities have been addressed by specific FC control algorithms. These procedures,
applied to the large-power hybrid PVIS of Portugal, take advantage of the possibility
of power regeneration of the centrifugal pumps and have been patented [79]. This
way, instead of a sudden stop of the motor-pump, its frequency is reduced but the
motor-pump does not stop. It is easy to understand that this procedure does not
eliminate the PV-power variability, but it removes the problems associated with it
[31]. Furthermore, it is important to mention that the use of batteries was not
considered as an option to solve this problem because of reliability and economic
feasibility reasons.
In the case of the hybrid PVIS of Morocco, this limitation is directly solved due to the
electric hybridization of the system.

Introduction
18
The match between PV production and irrigation needs.
The use of a North-South horizontal axis tracker was the solution adopted in both
systems. This is very interesting both for pumping to a water pool or direct pumping.
It presents four main advantages: it maximizes the water pumped during the irrigation
period (the match between the yearly water demand of the crops and the yearly profile
of irradiance is very good, much better than with the typical static structure facing the
Equator [80]); the daily profile of irradiance is almost flat in this type of tracker
during the irrigation months [80], [81]; it allows the enlargement of the irrigation
hours per day when compared to the typical static structure facing the Equator (the
system will start pumping earlier in the morning and will keep working until later in
the afternoon, [31], [49], [80]); and it requires less nominal power to pump the same
water volume than PV static structures [31], [80]. Apart from technical considerations,
an economic analysis with current prices shows that the installed tracker prices are
below 0.2 €/Wp [82], while PV module prices are around 0.4 €/Wp [83], [84] which
means that the selection of the tracker should be made if one considers the total costs
of the system [31].
The integration of the PV system in the pre-existing irrigation system.
One of the PVIS was integrated into a pre-existing only-diesel system in Portugal,
while the other was integrated into a pre-existing only-grid system (the one in
Morocco). In both cases, the already existing irrigation infrastructure and the irrigation
scheduling were kept.
In the case of Portugal, the hybrid system was needed in order to fulfill the irrigation
needs of the farm. The daily irrigation hours during the summer months are as high as
17 hours, more than the sun hours. Moreover, the introduction of the PV generator in
the irrigation system might also lead to the possibility of reducing the number of
months of renting the diesel generator, which will obviously translate into additional
financial benefits.
Conversely, the system of Morocco is a hybrid one due to the end-user desire – this
occurs since this system belongs to a big agro-industry that wants to guarantee that the
pumps will run whenever they want. If the use of the PV system is maximized by the
end-user, the grid will only work as a back-up.
Large power hybrid PV pumping for irrigation
19
The tuning of the FCs.
Specific tuning procedures have been developed to adapt the PID control of the FC to
the characteristics of the pre-existing irrigation system. These procedures consisted in
three main steps: preliminary configuration, the definition of the proportional gain
(Kp), and the integral time (Ti). The derivative time (Td) is usually unfeasible (and not
used) due the high electrical noise presented in this type of systems.
These procedures have been applied to the tuning of the FCs of the two demonstrators
and their correct performance has been checked in commissioning tests and through
the monitoring data during two years of operation.
Both systems have been working since 2016 and two years of monitoring data have been
analyzed in this thesis. To appropriately evaluate the performance of the systems new
performance indices have been proposed and, based on them, the technical and economic
evaluation is presented.
This analysis is included in the first part of this document. Chapter 2 presents the design,
implementation and evaluation of the hybrid PV-diesel drip irrigation system in Portugal,
while chapter 3 presents the results of the hybrid PV-grid drip irrigation system in Morocco.
Furthermore, the second part of this document deals with other contributions to the design of
large-power PVIS:
a new type of PV generator structure – the Delta structure – that provides constant PV
profiles but with static structures (chapter 4);
an evaluation of the PV energy losses due to the limitation of the number of PV
modules in series in PVIS (chapter 5);
a new pump selection method for PV irrigation applications, which considers that
these systems work at a variable frequency (chapter 6).
Finally, conclusions and future research lines are presented in chapter 7, and the publications
elaborated in the framework of this thesis in chapter 8.


Large power hybrid PV pumping for irrigation
21
FIRST PART: DESIGN, IMPLEMENTATION AND
PERFORMANCE ANALYSIS OF HYBRID PV IRRIGATION
SYSTEMS
The first part of this thesis describes the design, implementation and performance analysis of
two real-scale large-power drip irrigation systems:
1) A 140 kWp hybrid PV-diesel system in Portugal (with hybridization in the hydraulic
part);
2) A 120 kWp hybrid PV-grid system in Morocco (with hybridization in the electric
part).
Both systems were designed to maximize the use of PV energy and the two hybridizations
were patented [85], [86].

Large power hybrid PV pumping for irrigation
23
CHAPTER 2
A 140 KWP HYBRID PV-DIESEL IRRIGATION SYSTEM IN
PORTUGAL
2.1 Introduction
Diesel generation typically supplies electricity at about 3.5 kWh per liter, which represents a
fuel consumption cost of around 0.3 €/kWh. Meanwhile, PV electricity prices have declined
below 0.1 €/kWh [1]. Thus, PV hybridization with pre-existing diesel based irrigation systems
is becoming increasingly attractive, as pointed out by several authors [28], [59], [87], [88].
This chapter describes the design, implementation and operational performance of a 140 kWp
hybrid PV-diesel installed in Alter do Chão (Portugal) for the drip irrigation of 195 ha of
super-intensive olive trees. This system belongs to ELAIA, which is part of Sovena Group,
one of the biggest producers of olive oil in the world.
The design has paid attention to the problem of integrating the novelty of PV into the existing
diesel system. Furthermore, an important consideration is that, apart from the technical
quality of the components, the performance of the PV system is not only affected by intrinsic-
to-design characteristics (for example, pumping at a given head requires the irradiance to be
higher than a certain threshold, which implies corresponding irradiation losses) but also by
circumstances external to the system. In fact, the PV system only works when water is both
available at the source and required by the plants. The corresponding useful period (and,
again, corresponding irradiation losses) substantially varies from case to case and from year to
year. This chapter also proposes new performance indices for distinguishing between PV
system quality and PV system use.
This chapter is structured as follows: section 2.2 includes a description of the Alter do Chão
irrigation system, both the pre-existing only-diesel system and the current hybrid PV-diesel
system. Section 2.3 is dedicated to the presentation of performance indices for hybrid PV
systems. Section 2.4 is about the in-the-field performance of the system, during the irrigation
campaigns of 2017 and 2018. The economical validation is detailed in section 2.5.

A 140 kWp hybrid PV-diesel irrigation system in Portugal
24
2.2 The Alter do Chão irrigation system
2.2.1 The pre-existing only-diesel system
The yearly and daily evolution of the electric power requirements of the irrigation system
need to be deeply understood to afford the PV system design. The pre-existing system, Figure
8 (a), was made up of two centrifugal pumps (Caprari MEC-MRS 100-2D 45 kW) fueled by a
250 kVA diesel generator through a soft-starter and a 55 kW FC. The first pump is always
kept at nominal frequency (50 Hz) while the second one is controlled by the FC in such a way
that the water pressure at the water outlet to the plants, p1, is kept constant at 5.7 bar. Since
the water filter at the input of the irrigation network is progressively becoming clogged with
water impurities, the pressure at the output of the pumps, p2, and, in turn, the AC power
demand, PAC, increases over time. There is also a filter cleaning device (fcd) that
automatically reverses the water flow (from the output to the input of the filter) when the
differential pressure at the filter, p2-p1, reaches 1 bar until the filter becomes clean. That
typically happens once an hour and takes 5 minutes. During such short cleaning periods, the
p1 suddenly decreases (because water is used for cleaning and not to irrigate the plants) and,
consequently PAC increases up to a certain limit imposed by the FC. Figure 8 (b) shows this
cycling evolution of p1, p2 and PAC. In addition, the system also includes a fertirrigation
device which is not included in Figure 8(a).
(a)

Large power hybrid PV pumping for irrigation
25
(b)
Figure 8 – (a) Pre-existing irrigation system configuration: The electric power at the output of the diesel generator, PAC, is controlled in order to keep the hydraulic pressure constant at the input of the irrigation network, p1. Black and blue lines represent electricity and waterways respectively. (b) Cycling evolution of AC power (PAC) and pressure (p1
and p2) due to water filtering and filter cleaning periods.
On the other hand, the pipe network is divided into 7 different irrigation sectors covering
areas corresponding from 27 to 30 ha and requiring water flows from 217 to 244 m3/h. The
irrigation period (IP) is typically from May to October. Each day, every sector is activated
sequentially and consequently, the water flow varies from 217 to 244 m3/h following a
timetable which is drawn up weekly by the operator responsible for the irrigation in
accordance with the water needs of the olive trees (related to the difference between the
evapotranspiration and the rain). It must be understood that, for a given volume of water, the
irrigation time is a consequence of the section of the pipe network. This is implemented
practically by means of an irrigation controller (Agronic 4000, from Progrés) which
automatically commands the shifts of the irrigation sectors and the diesel generator. This way,
the daily irrigation time varies from week to week and the PAC required varies throughout the
day in accordance with the different water requirements of the activated sector (this variation
is in addition to the cycling behaviour due to the filter cleaning system). The key information
to bear in mind is that, apart from the power peaks associated to the filter cleaning
requirements, PAC varies from 70 to 80 kW of stable power due to the different power
demands of the sectors. The intensive cultivation of olive trees usually has its maximum water
demand in July (around 500m3/Ha) that obliges the irrigation operator to schedule
approximately 2.5 h of irrigation per shift, per day. The irrigation lasts 17 h/day during this
month, longer than the daily sun hours. Figure 9 shows an example of the weekly irrigation
scheduling for a typical year. The figure also shows the sunlight hours, which is sometimes
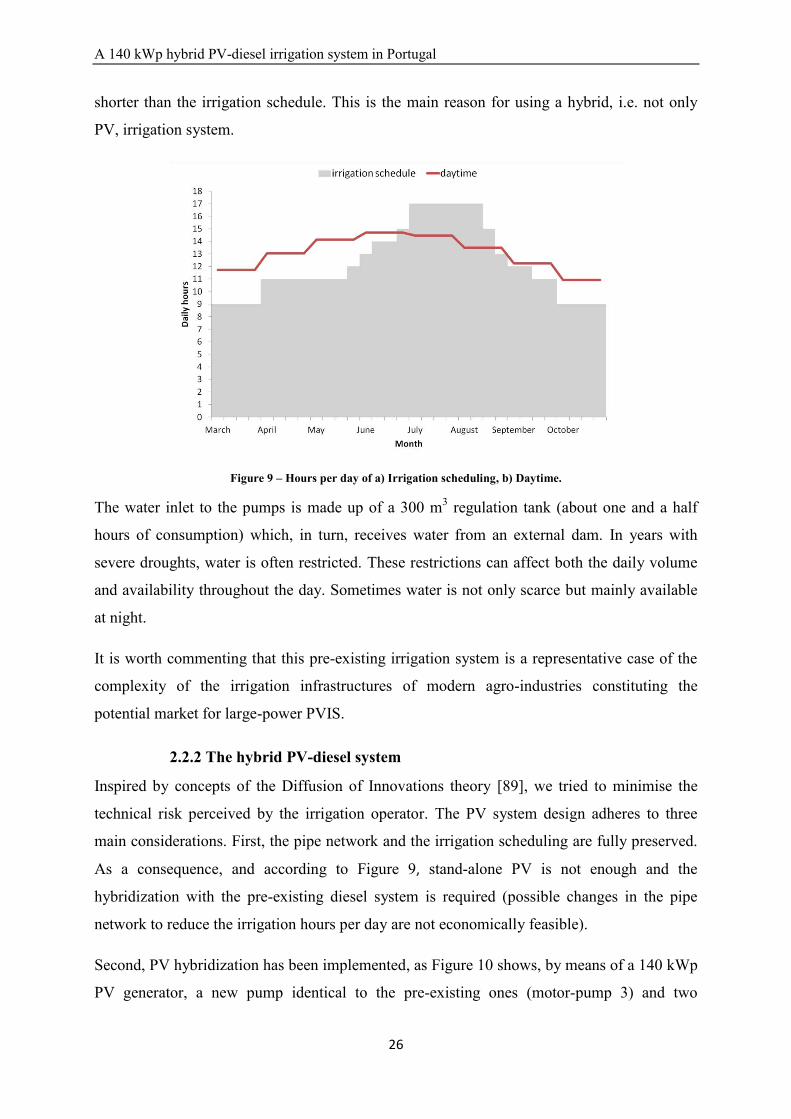
A 140 kWp hybrid PV-diesel irrigation system in Portugal
26
shorter than the irrigation schedule. This is the main reason for using a hybrid, i.e. not only
PV, irrigation system.
Figure 9 – Hours per day of a) Irrigation scheduling, b) Daytime.
The water inlet to the pumps is made up of a 300 m3 regulation tank (about one and a half
hours of consumption) which, in turn, receives water from an external dam. In years with
severe droughts, water is often restricted. These restrictions can affect both the daily volume
and availability throughout the day. Sometimes water is not only scarce but mainly available
at night.
It is worth commenting that this pre-existing irrigation system is a representative case of the
complexity of the irrigation infrastructures of modern agro-industries constituting the
potential market for large-power PVIS.
2.2.2 The hybrid PV-diesel system
Inspired by concepts of the Diffusion of Innovations theory [89], we tried to minimise the
technical risk perceived by the irrigation operator. The PV system design adheres to three
main considerations. First, the pipe network and the irrigation scheduling are fully preserved.
As a consequence, and according to Figure 9, stand-alone PV is not enough and the
hybridization with the pre-existing diesel system is required (possible changes in the pipe
network to reduce the irrigation hours per day are not economically feasible).
Second, PV hybridization has been implemented, as Figure 10 shows, by means of a 140 kWp
PV generator, a new pump identical to the pre-existing ones (motor-pump 3) and two
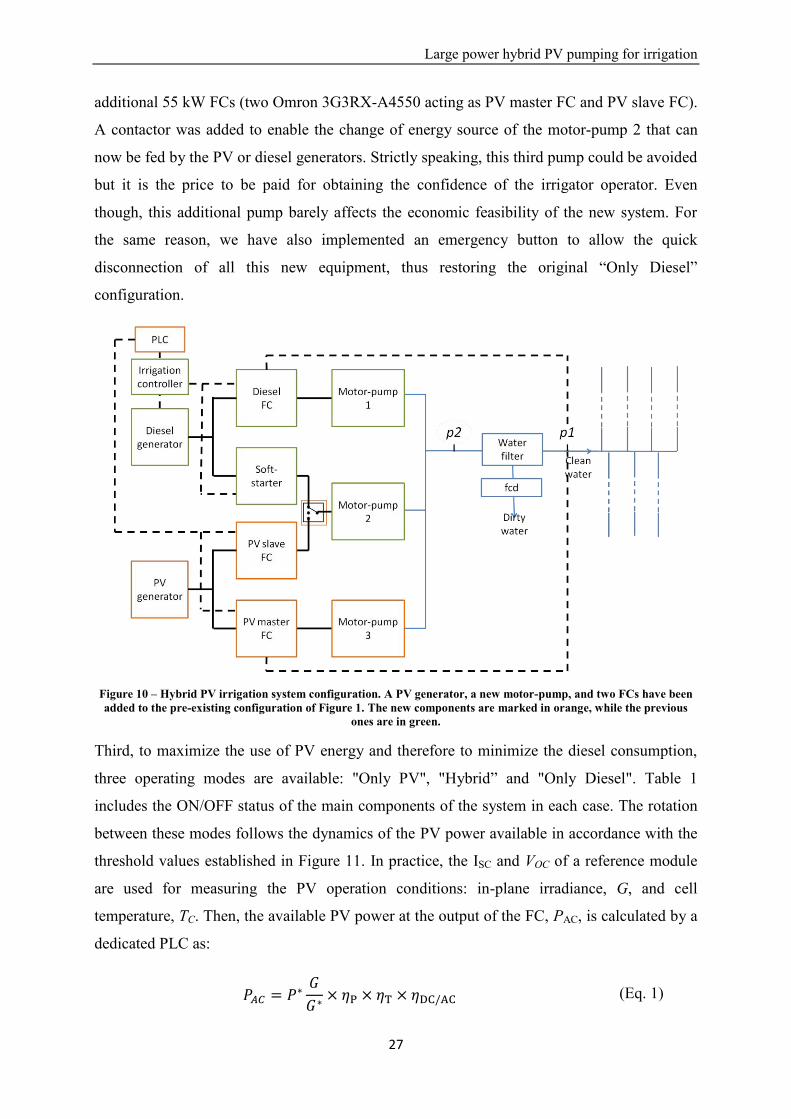
Large power hybrid PV pumping for irrigation
27
additional 55 kW FCs (two Omron 3G3RX-A4550 acting as PV master FC and PV slave FC).
A contactor was added to enable the change of energy source of the motor-pump 2 that can
now be fed by the PV or diesel generators. Strictly speaking, this third pump could be avoided
but it is the price to be paid for obtaining the confidence of the irrigator operator. Even
though, this additional pump barely affects the economic feasibility of the new system. For
the same reason, we have also implemented an emergency button to allow the quick
disconnection of all this new equipment, thus restoring the original “Only Diesel”
configuration.
Figure 10 – Hybrid PV irrigation system configuration. A PV generator, a new motor-pump, and two FCs have been added to the pre-existing configuration of Figure 1. The new components are marked in orange, while the previous
ones are in green.
Third, to maximize the use of PV energy and therefore to minimize the diesel consumption,
three operating modes are available: "Only PV", "Hybrid” and "Only Diesel". Table 1
includes the ON/OFF status of the main components of the system in each case. The rotation
between these modes follows the dynamics of the PV power available in accordance with the
threshold values established in Figure 11. In practice, the ISC and VOC of a reference module
are used for measuring the PV operation conditions: in-plane irradiance, G, and cell
temperature, TC. Then, the available PV power at the output of the FC, PAC, is calculated by a
dedicated PLC as:
(Eq. 1)

A 140 kWp hybrid PV-diesel irrigation system in Portugal
28
where P* is the nominal power of the PV generator, is the ratio real power versus nominal
power of the PV generator which includes the losses due to mismatching, dirtiness and ageing
of the PV generator, ηT=1+γ(TC-TC*) is the thermal efficiency of the PV generator (γ is the
power temperature coefficient of the PV modules) and is the efficiency of the FC.
It must be noted that the threshold for changing from the "Only PV" to "Hybrid" modes is
somewhat higher than the required stable PAC (80 kW). This is necessary to assure the stable
behavior of the system. As revealed during the initial tests, below this value the surge in
power demand due to the cleaning of the filters often translates into control instabilities.
Table 1 – ON(1)/OFF(0) status of the different operating modes.
Diesel PV Mode Soft-starter FC Master FC Slave FC
“Only PV” 0 0 1 1 “Hybrid” 0 1 1 0
“Only Diesel” 1 1 0 0
Figure 11 – Available PV power thresholds with hysteresis for the different operating modes – “Only PV”, Hybrid and “Only Diesel”.
Figure 12 shows (a) an aerial view of the hybrid PV-diesel system, and (b) the three motor-
pumps and the water filter bench.
(a)
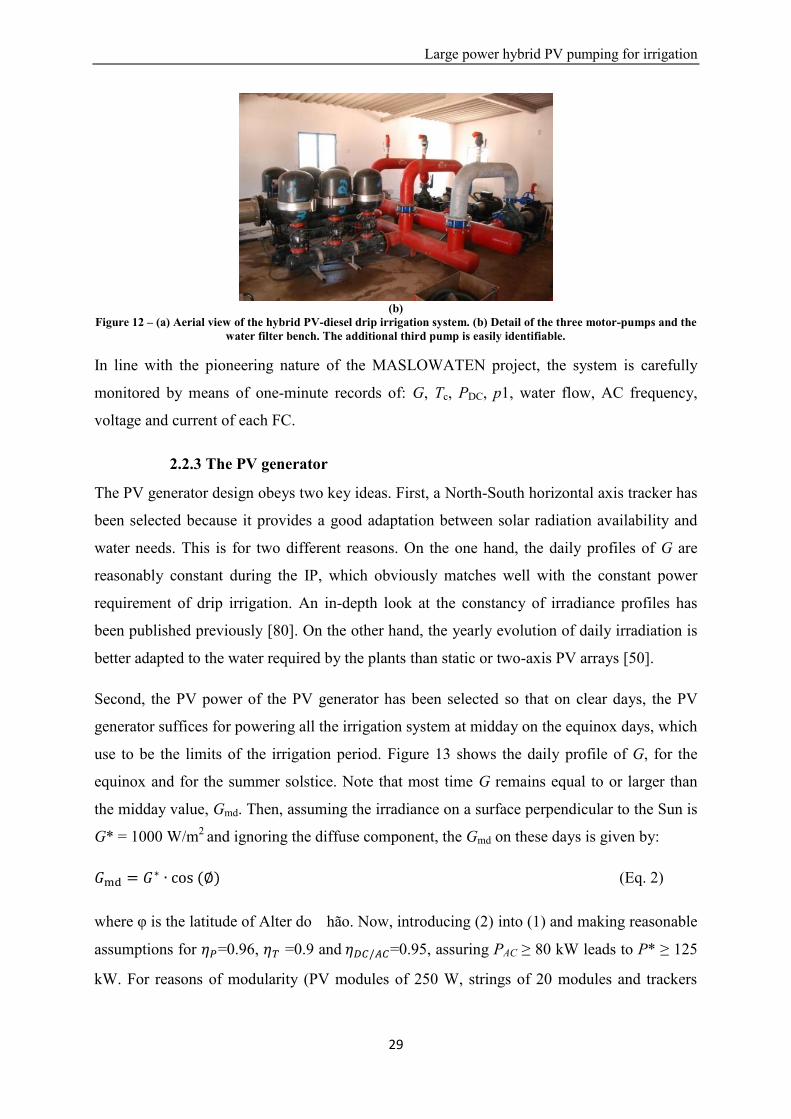
Large power hybrid PV pumping for irrigation
29
(b)
Figure 12 – (a) Aerial view of the hybrid PV-diesel drip irrigation system. (b) Detail of the three motor-pumps and the water filter bench. The additional third pump is easily identifiable.
In line with the pioneering nature of the MASLOWATEN project, the system is carefully
monitored by means of one-minute records of: G, Tc, PDC, p1, water flow, AC frequency,
voltage and current of each FC.
2.2.3 The PV generator
The PV generator design obeys two key ideas. First, a North-South horizontal axis tracker has
been selected because it provides a good adaptation between solar radiation availability and
water needs. This is for two different reasons. On the one hand, the daily profiles of G are
reasonably constant during the IP, which obviously matches well with the constant power
requirement of drip irrigation. An in-depth look at the constancy of irradiance profiles has
been published previously [80]. On the other hand, the yearly evolution of daily irradiation is
better adapted to the water required by the plants than static or two-axis PV arrays [50].
Second, the PV power of the PV generator has been selected so that on clear days, the PV
generator suffices for powering all the irrigation system at midday on the equinox days, which
use to be the limits of the irrigation period. Figure 13 shows the daily profile of G, for the
equinox and for the summer solstice. Note that most time G remains equal to or larger than
the midday value, Gmd. Then, assuming the irradiance on a surface perpendicular to the Sun is
G* = 1000 W/m2 and ignoring the diffuse component, the Gmd on these days is given by:
(Eq. 2)
where φ is the latitude of Alter do hão. Now, introducing (2) into (1) and making reasonable
assumptions for =0.96, =0.9 and =0.95, assuring PAC ≥ 80 kW leads to P* ≥ 125
kW. For reasons of modularity (PV modules of 250 W, strings of 20 modules and trackers

A 140 kWp hybrid PV-diesel irrigation system in Portugal
30
with 7 rows) the final P* was established as 140 kW. It is worth nothing that this PV
generator occupies 3000 m2, which represents 0.15% of the total farm area.
Figure 13 – Incident irradiance profile on the tracker during the autumn equinox and the summer solstice.
It should be noted that this rule (PV power at midday on the equinox is equal to the stable
power required for pumping) is just a rough guesswork. At first glance, it might appear that
this rule is equivalent to assuring that the irrigation system is fully powered by PV most of the
time. However, this is not completely true. As mentioned before, avoiding instabilities during
filter cleaning periods changes the operation to hybrid modes even at times when the available
PV power is larger than that suggested by this rule. For this reason, the option for large PV
peak power, even at the price of reducing the PR value would also be a possible option and,
finally, this is the reason at the root of establishing 95 kW for the transition between the
“Only PV” and the “Hybrid” modes.
2.2.4 Performance scenarios
The annual performance of the hybrid PV system is very dependent on the corresponding
water availability circumstances, which typically vary between two extremes.
On the one hand, an Optimistic Scenario defined by the absence of water restrictions. Then,
the water needs of the plants are fully covered and water is available throughout the day. That
means the irrigation system gets the maximum use of the PV potential during the irrigation
period, working in either “Only PV” or “Hybrid” modes. On the other hand, a Pessimistic
Scenario defined by severe water restrictions. Then water provision to the plants is restricted
to assure survival and minimum production. Table 2 shows the result of combining water
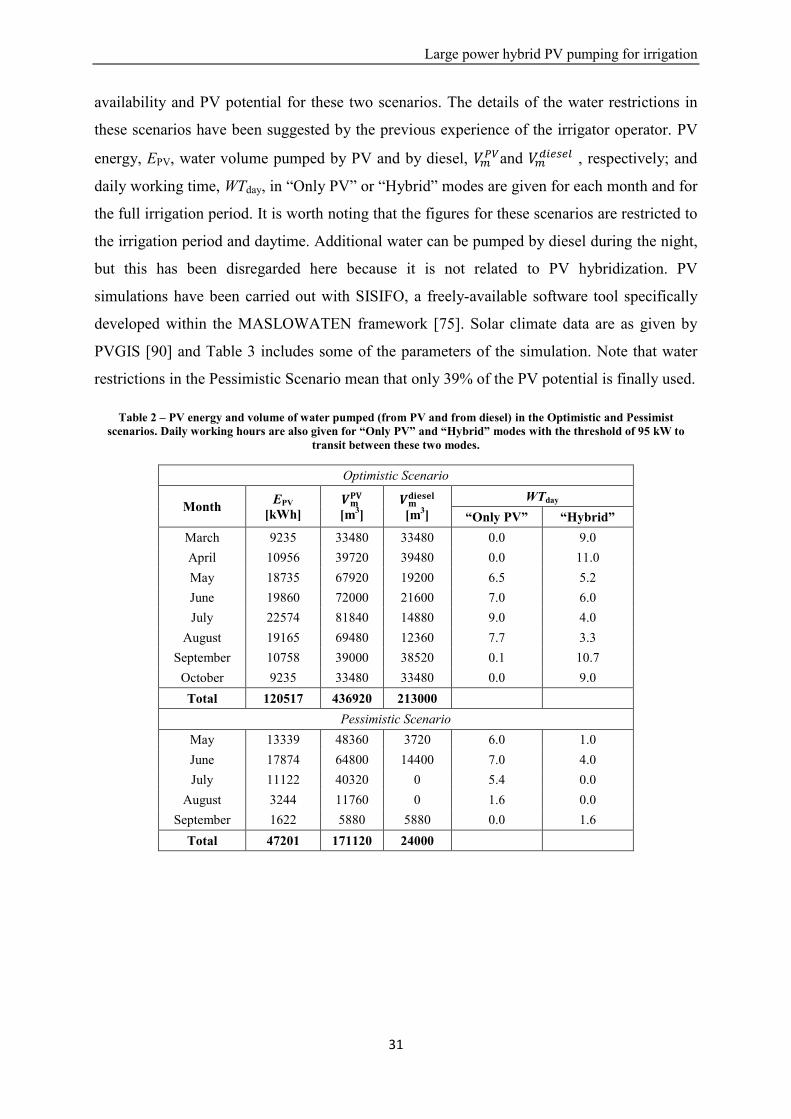
Large power hybrid PV pumping for irrigation
31
availability and PV potential for these two scenarios. The details of the water restrictions in
these scenarios have been suggested by the previous experience of the irrigator operator. PV
energy, EPV, water volume pumped by PV and by diesel, and , respectively; and
daily working time, WTday, in “Only PV” or “Hybrid” modes are given for each month and for
the full irrigation period. It is worth noting that the figures for these scenarios are restricted to
the irrigation period and daytime. Additional water can be pumped by diesel during the night,
but this has been disregarded here because it is not related to PV hybridization. PV
simulations have been carried out with SISIFO, a freely-available software tool specifically
developed within the MASLOWATEN framework [75]. Solar climate data are as given by
PVGIS [90] and Table 3 includes some of the parameters of the simulation. Note that water
restrictions in the Pessimistic Scenario mean that only 39% of the PV potential is finally used.
Table 2 – PV energy and volume of water pumped (from PV and from diesel) in the Optimistic and Pessimist scenarios. Daily working hours are also given for “Only PV” and “Hybrid” modes with the threshold of 95 kW to
transit between these two modes.
Optimistic Scenario
Month EPV [kWh]
[m3] [m3]
WTday “Only PV” “Hybrid”
March 9235 33480 33480 0.0 9.0 April 10956 39720 39480 0.0 11.0 May 18735 67920 19200 6.5 5.2 June 19860 72000 21600 7.0 6.0 July 22574 81840 14880 9.0 4.0
August 19165 69480 12360 7.7 3.3 September 10758 39000 38520 0.1 10.7
October 9235 33480 33480 0.0 9.0 Total 120517 436920 213000
Pessimistic Scenario May 13339 48360 3720 6.0 1.0 June 17874 64800 14400 7.0 4.0 July 11122 40320 0 5.4 0.0
August 3244 11760 0 1.6 0.0 September 1622 5880 5880 0.0 1.6
Total 47201 171120 24000

A 140 kWp hybrid PV-diesel irrigation system in Portugal
32
Table 3 – Parameters of the simulation.
Parameter Value/ option Solar climate data PVGIS
Real power vs nominal power [%] 96 DC/AC conversion [%] 95
Hydraulic part Motor-pump [%] 69 Filter [%] 80 Cleaning and other [%] 90
2.3 Performance indices for hybrid PV systems
This section proposes a set of indices for qualifying the design and operation of a general
hybrid PV system. First, the energy balance is described in Figure 14 and quantified by means
of three ratios defining the PV share (PVS), the PV performance (PR), and the hydraulic
efficiency (
). The following equations apply:
(Eq. 3)
(Eq. 4)
(Eq. 5)
where EPV and Ed are the energy supplied by the PV generator and the diesel generator
respectively, EHyd is the hydraulic energy and ηHyd is the efficiency of the hydraulic system.
The following comments apply.
On the one hand, from the PV engineering point of view, the two operational modes involving
diesel are different. In the case of systems designed for being powered mainly by PV during
the daytime, the “Only Diesel” mode becomes relevant mainly at night-time and is somewhat
out of PV concerns. On the other hand, the “Hybrid” mode only occurs during daytime and is
directly related to the design of the PV system. Therefore, it is interesting to distinguish
between a PVS characteristic of the overall operation, which is of interest to the user, and a
PVSH characteristic solely to the “Hybrid” mode. That can be easily done by defining a hybrid
diesel ratio, HDR, as:
(Eq. 6)

Large power hybrid PV pumping for irrigation
33
where and
are the energy supplied by the diesel generator in “Hybrid” and “Only
Diesel” operation modes respectively. Then, Eq. 3 can be rewritten as:
(Eq. 7)
and
(Eq. 8)
Figure 14 – Energy flows involved in a hybrid PV irrigation system.
Furthermore, the PR is widely used in general PV environments and provides an indication of
both the technical quality of the PV system’s equipment and the efficient use of the available
irradiation. It is interesting to distinguish between irradiation losses for three essentially
different reasons: the non-irrigation period, the intrinsic characteristics of the PV system
design and the external circumstances. For that, the PR is factorized as follows:
(Eq. 9)
where IP is the irrigation period determined by the crop and its water needs; Guseful is the
available useful irradiance during the IP determined by the relationship between the P*, the
PV generator structure and the type of irrigation system - water pool or constant pressure; and
Gused is the irradiance effectively used by the system. To clarify these concepts, G during IP,
GIP, Guseful, and Gused are shown in Figure 15 for a constant pressure system like that analyzed
in this chapter. It can be shown that GIP is the total irradiance during the irrigation period
determined by the water needs of the olive trees (Figure 15-a). Guseful is the irradiance required
to deliver the 80 kW needed to pump at a constant pressure of 5.7 bar (Figure 15-b). It is
worth noting that with irradiances below Guseful it will not be able to pump because the

A 140 kWp hybrid PV-diesel irrigation system in Portugal
34
required pressure would not be reached and irradiances higher than Guseful will be partially
wasted because the system works at constant pressure. Finally, Gused is the part of Guseful that
has been used effectively due to the availability of water and the irrigation scheduling (Figure
15-c). In this last figure, the irradiance from 7 am to 2 pm was wasted due to the irrigation
scheduling or the lack of water during this day and not because of technical problems in the
PV system or the needs of the crop.
(a)
(b) (c)
Figure 15 – Graphical representation of the different irradiations considered: (a) is the irradiation during the irrigation period, (b) is the useful irradiation during the IP determined by the design of the PV irrigation
system; and (c) is the irradiation used effectively by the system.
Now, it is possible to rewrite Eq. 9 as:
(Eq. 10)
where:
This is the PR considering only losses strictly associated with
the PV system itself, i.e., actual versus nominal peak power,
dirtiness, thermal and DC/AC conversion losses. It is intrinsic

Large power hybrid PV pumping for irrigation
35
to the technical quality of the PV component and its
maintenance.
This is the ratio of the total irradiation throughout the
irrigation period to the total annual irradiation (Figure 15-a). It
is intrinsic to a given crop. Note that it is one if the analysis is
done on a month inside the irrigation period.
This is the ratio of the irradiation strictly required to keep PAC
equal to the stable AC power requirement (80 kW, see section
2.2.1) to the total irradiation throughout the IP (Figure 15-b). It
is intrinsic to the PVIS design; specifically it depends on the
type of irrigation system (direct pumping or pumping to a
water pool), the ratio between the PV peak power and the
stable PV power required for irrigation, and on the tracking
geometry.
This is the ratio of the irradiation required to keep PAC stable
during the irrigation scheduling to the same irradiation during
the IP.
Finally, when the PV system is hybridized with already existing diesel facilities as in the Alter
do Chão case, the diesel-efficiency, which is usually expressed in terms of the specific fuel
consumption (liters per kWh) is really not a matter for the PV engineer and can be
disregarded.
It might be thought that using as much as 9 indices for describing the performance of a PV
system is just too complex. However, we think this is in coherence with the intrinsic
complexity of large modern irrigation and not particularly cumbersome to implement within
the automatic control frame characteristic of this type of irrigation. Moreover, it must be
understood that the set of these 9 indices constitute a general evaluation frame that becomes
reduced for simpler irrigation. For example, for stand-alone PV systems pumping to a water
pool throughout the year, which is likely the most commonly imagined PV irrigation system,
Ed = 0; PVS = 1; URIP = 1 and UREF= 1. Hence, the relevant indices are just the PR and
URPVIS.
2.3.1 Performance indices for the two scenarios
Table 4 shows the values of the performance indices for the two scenarios. At first glance, one
can expect a higher PVSH in the Optimistic Scenario, although this does not happen because
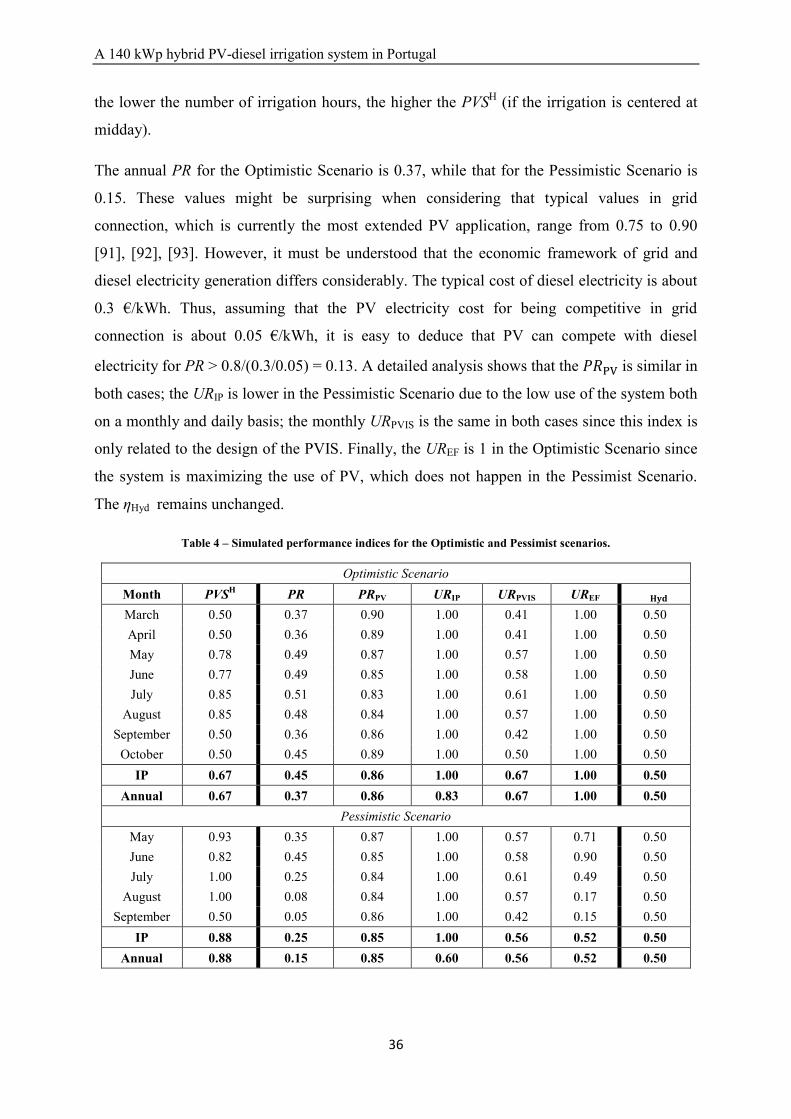
A 140 kWp hybrid PV-diesel irrigation system in Portugal
36
the lower the number of irrigation hours, the higher the PVSH (if the irrigation is centered at
midday).
The annual PR for the Optimistic Scenario is 0.37, while that for the Pessimistic Scenario is
0.15. These values might be surprising when considering that typical values in grid
connection, which is currently the most extended PV application, range from 0.75 to 0.90
[91], [92], [93]. However, it must be understood that the economic framework of grid and
diesel electricity generation differs considerably. The typical cost of diesel electricity is about
0.3 €/kWh. Thus, assuming that the PV electricity cost for being competitive in grid
connection is about 0.05 €/kWh, it is easy to deduce that PV can compete with diesel
electricity for PR > 0.8/(0.3/0.05) = 0.13. A detailed analysis shows that the is similar in
both cases; the URIP is lower in the Pessimistic Scenario due to the low use of the system both
on a monthly and daily basis; the monthly URPVIS is the same in both cases since this index is
only related to the design of the PVIS. Finally, the UREF is 1 in the Optimistic Scenario since
the system is maximizing the use of PV, which does not happen in the Pessimist Scenario.
The ηHyd remains unchanged.
Table 4 – Simulated performance indices for the Optimistic and Pessimist scenarios.
Optimistic Scenario Month PVSH PR PRPV URIP URPVIS UREF
March 0.50 0.37 0.90 1.00 0.41 1.00 0.50 April 0.50 0.36 0.89 1.00 0.41 1.00 0.50 May 0.78 0.49 0.87 1.00 0.57 1.00 0.50 June 0.77 0.49 0.85 1.00 0.58 1.00 0.50 July 0.85 0.51 0.83 1.00 0.61 1.00 0.50
August 0.85 0.48 0.84 1.00 0.57 1.00 0.50 September 0.50 0.36 0.86 1.00 0.42 1.00 0.50
October 0.50 0.45 0.89 1.00 0.50 1.00 0.50 IP 0.67 0.45 0.86 1.00 0.67 1.00 0.50
Annual 0.67 0.37 0.86 0.83 0.67 1.00 0.50 Pessimistic Scenario
May 0.93 0.35 0.87 1.00 0.57 0.71 0.50 June 0.82 0.45 0.85 1.00 0.58 0.90 0.50 July 1.00 0.25 0.84 1.00 0.61 0.49 0.50
August 1.00 0.08 0.84 1.00 0.57 0.17 0.50 September 0.50 0.05 0.86 1.00 0.42 0.15 0.50
IP 0.88 0.25 0.85 1.00 0.56 0.52 0.50 Annual 0.88 0.15 0.85 0.60 0.56 0.52 0.50
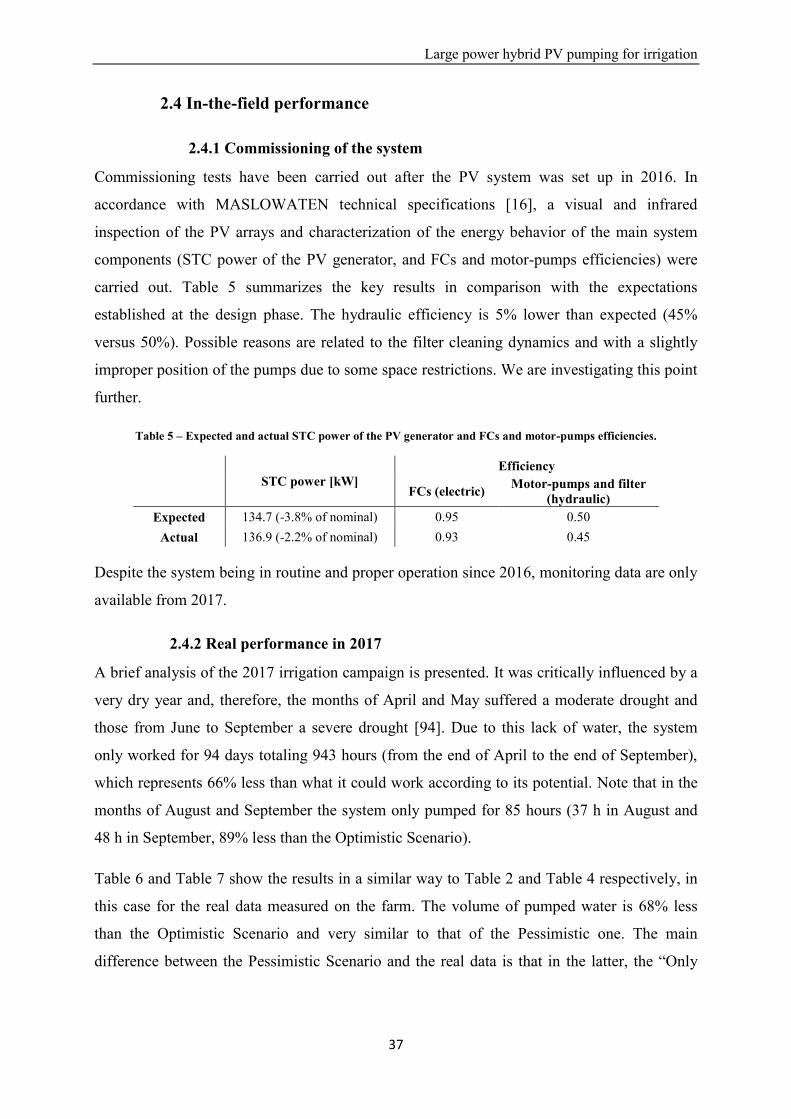
Large power hybrid PV pumping for irrigation
37
2.4 In-the-field performance
2.4.1 Commissioning of the system
Commissioning tests have been carried out after the PV system was set up in 2016. In
accordance with MASLOWATEN technical specifications [16], a visual and infrared
inspection of the PV arrays and characterization of the energy behavior of the main system
components (STC power of the PV generator, and FCs and motor-pumps efficiencies) were
carried out. Table 5 summarizes the key results in comparison with the expectations
established at the design phase. The hydraulic efficiency is 5% lower than expected (45%
versus 50%). Possible reasons are related to the filter cleaning dynamics and with a slightly
improper position of the pumps due to some space restrictions. We are investigating this point
further.
Table 5 – Expected and actual STC power of the PV generator and FCs and motor-pumps efficiencies.
STC power [kW] Efficiency
FCs (electric) Motor-pumps and filter (hydraulic)
Expected 134.7 (-3.8% of nominal) 0.95 0.50 Actual 136.9 (-2.2% of nominal) 0.93 0.45
Despite the system being in routine and proper operation since 2016, monitoring data are only
available from 2017.
2.4.2 Real performance in 2017
A brief analysis of the 2017 irrigation campaign is presented. It was critically influenced by a
very dry year and, therefore, the months of April and May suffered a moderate drought and
those from June to September a severe drought [94]. Due to this lack of water, the system
only worked for 94 days totaling 943 hours (from the end of April to the end of September),
which represents 66% less than what it could work according to its potential. Note that in the
months of August and September the system only pumped for 85 hours (37 h in August and
48 h in September, 89% less than the Optimistic Scenario).
Table 6 and Table 7 show the results in a similar way to Table 2 and Table 4 respectively, in
this case for the real data measured on the farm. The volume of pumped water is 68% less
than the Optimistic Scenario and very similar to that of the Pessimistic one. The main
difference between the Pessimistic Scenario and the real data is that in the latter, the “Only

A 140 kWp hybrid PV-diesel irrigation system in Portugal
38
Diesel” mode is included due to water restrictions during the sunlight hours, which obliges
the user to irrigate during the night.
Table 6 – Real operational data in 2017.
Month EPV [kWh]
[m3] [m3]
WTday [hours]
“Hybrid” “Only Diesel” “Only PV” “Hybrid” “Only Diesel”
April 1960 5880 2346 414 0.5 0.6 0.1 May 12480 37440 13105 14015 3.9 2.3 2.5 June 11701 32618 6714 42902 4.3 1.1 7.2 July 6293 17559 3620 14804 2.3 0.6 2.6
August 1872 5001 689 1849 0.7 0.1 0.4 September 1525 3958 3065 3049 0.3 0.6 0.6
Total 35832 102457 29540 77034
In this case, real data on the irradiance and cell temperature are considered and for this reason,
the URPVIS is different from that obtained in the scenarios. The PR is lower due to the use of
the system during the night and the ηHyd is lower for the reasons explained in section 2.4.1.
For example, in the month of June, the PVSH is equal to that of the Pessimistic Scenario (with
a PVS of 0.39). The PR is lower than before mainly because the UREF decreases from 0.90 to
0.51.
Table 7 – Real performance indices in 2017.
Month PVS HDR PVSH PR PRPV URIP URPVIS UREF
April 0.68 0.85 0.71 0.07 0.83 1.00 0.62 0.13 0.45 May 0.58 0.48 0.74 0.33 0.81 1.00 0.65 0.63 0.45 June 0.39 0.14 0.83 0.28 0.78 1.00 0.69 0.51 0.47 July 0.47 0.20 0.83 0.14 0.78 1.00 0.70 0.26 0.46
August 0.66 0.27 0.88 0.05 0.81 1.00 0.69 0.08 0.46 September 0.40 0.50 0.56 0.04 0.81 1.00 0.75 0.07 0.45
IP 0.49 0.28 0.78 0.16 0.79 1.00 0.69 0.29 0.46 Annual 0.49 0.28 0.78 0.11 0.79 0.68 0.69 0.29 0.46
2.4.3 Real performance in 2018
The system is also being monitored throughout the current irrigation campaign (2018). In this
case, water restrictions are not affecting the campaign (the daily mean working time was
between 9 and 16 hours) but a problem in the fertirrigation system until the end of July
negatively affects the performance of the system, since there was the need to use the diesel
system until this time. The real operational data and the performance indices are presented in
Table 8 and Table 9 respectively.
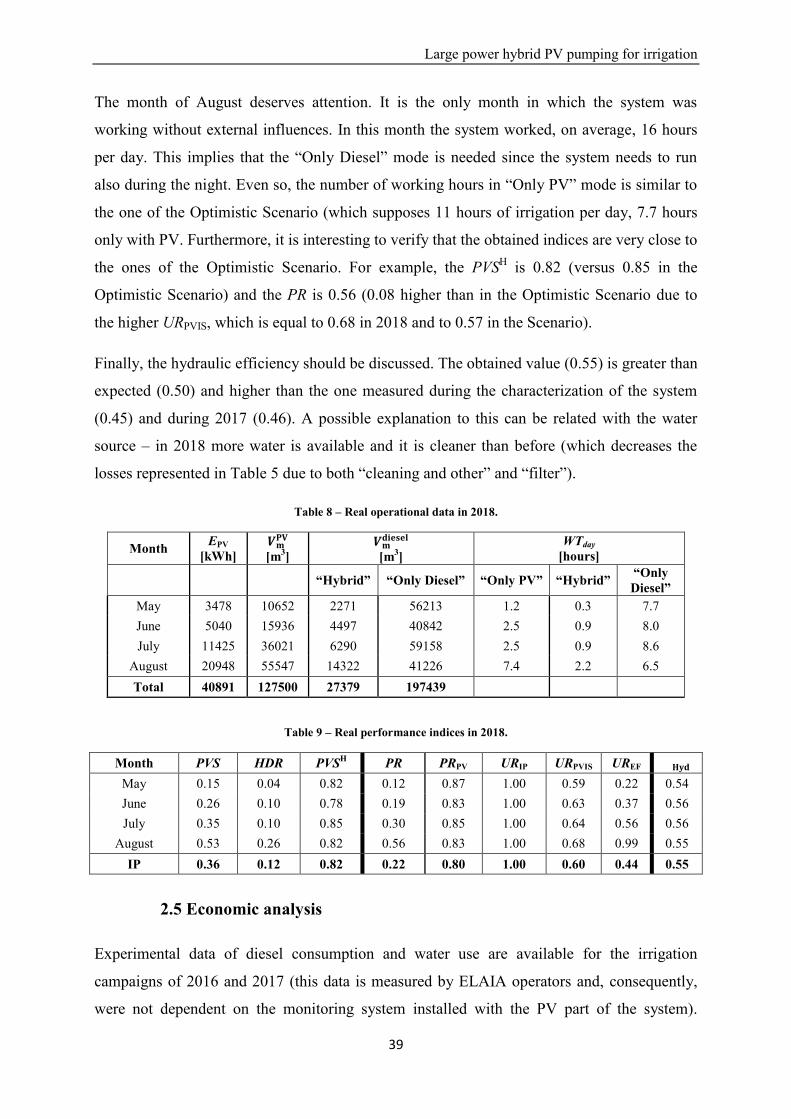
Large power hybrid PV pumping for irrigation
39
The month of August deserves attention. It is the only month in which the system was
working without external influences. In this month the system worked, on average, 16 hours
per day. This implies that the “Only Diesel” mode is needed since the system needs to run
also during the night. Even so, the number of working hours in “Only PV” mode is similar to
the one of the Optimistic Scenario (which supposes 11 hours of irrigation per day, 7.7 hours
only with PV. Furthermore, it is interesting to verify that the obtained indices are very close to
the ones of the Optimistic Scenario. For example, the PVSH is 0.82 (versus 0.85 in the
Optimistic Scenario) and the PR is 0.56 (0.08 higher than in the Optimistic Scenario due to
the higher URPVIS, which is equal to 0.68 in 2018 and to 0.57 in the Scenario).
Finally, the hydraulic efficiency should be discussed. The obtained value (0.55) is greater than
expected (0.50) and higher than the one measured during the characterization of the system
(0.45) and during 2017 (0.46). A possible explanation to this can be related with the water
source – in 2018 more water is available and it is cleaner than before (which decreases the
losses represented in Table 5 due to both “cleaning and other” and “filter”).
Table 8 – Real operational data in 2018.
Month EPV [kWh]
[m3] [m3]
WTday [hours]
“Hybrid” “Only Diesel” “Only PV” “Hybrid” “Only Diesel”
May 3478 10652 2271 56213 1.2 0.3 7.7 June 5040 15936 4497 40842 2.5 0.9 8.0 July 11425 36021 6290 59158 2.5 0.9 8.6
August 20948 55547 14322 41226 7.4 2.2 6.5 Total 40891 127500 27379 197439
Table 9 – Real performance indices in 2018.
Month PVS HDR PVSH PR PRPV URIP URPVIS UREF
May 0.15 0.04 0.82 0.12 0.87 1.00 0.59 0.22 0.54 June 0.26 0.10 0.78 0.19 0.83 1.00 0.63 0.37 0.56 July 0.35 0.10 0.85 0.30 0.85 1.00 0.64 0.56 0.56
August 0.53 0.26 0.82 0.56 0.83 1.00 0.68 0.99 0.55 IP 0.36 0.12 0.82 0.22 0.80 1.00 0.60 0.44 0.55
2.5 Economic analysis
Experimental data of diesel consumption and water use are available for the irrigation
campaigns of 2016 and 2017 (this data is measured by ELAIA operators and, consequently,
were not dependent on the monitoring system installed with the PV part of the system).

A 140 kWp hybrid PV-diesel irrigation system in Portugal
40
Irrigation in both years was very different due to the previously mentioned lack of water in
2017. On the other hand, 2016 was a standard year from the point of view of irrigation since it
was possible to give to the plants all the water they need.
Accordingly, two different situations are studied along 25 years (the period of warranty of the
PV modules, normally used for PV investments): case study A considers that all the 25 years
are equal to 2016, while case study B is a combination of 2016 and 2017 data and considers
that each 5 years there is a year like 2017 and the remaining ones are like 2016. As pointed
out in [95], in one out of ten years, in semi-arid areas, there is a drought event caused by
seasonal rainfall below minimum seasonal plant water requirement. This means that case
study A can be seen as an optimistic solution and case study B as a pessimist one.
The economic feasibility study is carried out based on four different indicators: the Net
Present Value (NPV), the Internal Rate of Return (IRR), the Payback Period (PBP) and the
Levelized Cost of Energy (LCOE).
2.5.1 Net Present Value, Internal Rate of Return and Payback Period
In order to estimate the NPV, the IRR and the PBP for an investment, the annual Cash Flows
(CF) need to be calculated for the whole lifetime of the system. In this study profit is the
economic savings derived from reducing diesel consumption due to the use of the PV system.
In other words, the viability of the PV system is evaluated in terms of the variation in the CF
before and after the installation of the PV generator. CF for the year n, is given by:
(Eq. 11)
where IIC is the Initial Investment Cost also known as CAPEX – Capital Expenditures, Sn is
the annual savings by not using the diesel generator, OPEX (Operating Expense) is the annual
operational expense and DI is the debt interests. In more detail, the Sn is given by:
(Eq. 12)
where is the energy that, after the installation of the PV system, is not consumed by the
diesel generator, and CECn is the annual price of the diesel. CECn is calculated by the
following equation:
(Eq. 13)
Large power hybrid PV pumping for irrigation
41
where h is the inflation rate and s is an additional spread. This spread is applicable over the
diesel price in order to reflect the most exact price evolution of this commodity throughout
the 25 years.
Regarding the OPEX, costs related to the maintenance, insurance and security costs associated
only to the PV system were considered. Finally, in order to calculate the DI, the following
equation is used [96]:
(Eq. 14)
where CR is the Capital Repayment and it is associated with the loan maturity (l) that in this
case was considered as 6 years. D is the debt ratio that was considered 70% and the CR is
given by the following equation [96]:
(Eq. 15)
The variation in CF for the year n when substituting the diesel energy (ΔCFn) is given by the
following [96]:
Δ
(Eq. 16)
where r (the real interest rate) can be calculated by the following equation [96]:
(Eq. 17)
where i is the interest rate.
With the ∆CFn, it is possible to calculate the NPV (Eq. 18) [96]. The NPV is the sum of all the
cash flows discounted to the present using the time value of money [96]. If the NPV is greater
than zero, it is expected that value will be created for the investor. If it is less than zero, it is
expected that value will be destroyed for the investor.
(Eq. 18)
Finally, it is possible to calculate the IRR as well as the PBP. The first one is defined as the
real interest rate that would make the NPV equals to zero after the 25 years of lifetime of the
project (i.e. the real interest rate at which the initial investment is returned at the end of the
lifetime of the project). The PBP is defined as the number of years (n) for which NPV is equal

A 140 kWp hybrid PV-diesel irrigation system in Portugal
42
to zero (i.e. the period required for the initial investment to be returned with the present value
of cash flows, disregarding the real interest rate).
2.5.2 Levelized Cost of Energy
The levelized cost of energy (LCOE) is the most common indicator used by entities in order
to compare different energy technologies. According to [97], the sum of the annual values of
the LCOE (LCOEn) multiplied by the energy generated annually (En) should be equal to the
sum of the values of the costs of the project (see Eq. 19).
(Eq. 19)
If we do the same rearrange done in [97] and [98], assuming a constant value per year, the
LCOE is given by the following equation:
(Eq. 20)
where the numerator of Eq. 20 is the total lifecycle cost of the system and the denominator,
the lifetime energy production. Based on this equation we are able to calculate different
LCOEs for each energy source. For a PV application (LCOEPV) we consider the costs as the
following:
(Eq. 21)
On the other hand, the LCOE of the previous system (LCOEPS), in this case, the only-diesel
system, is calculated as:
(Eq. 22)
where PEn is the energy consumed by the diesel generator.
In the case of a hybrid system, the LCOE of the system (LCOECS) is given by:

Large power hybrid PV pumping for irrigation
43
(Eq. 23)
2.5.3 Results
Table 10 includes the main economic data used in both study cases. The IIC of the system is
170277.03 € (1.22 €/Wp), while the OPEX at year zero (OPEX0) is 3064.8 €. The values for h
[99] and i [100] are the average value along the last 10 years, r is calculated based on these
two values and s is an estimated value based on information obtained from the different end-
users.
Table 10 – Economic data for the Alter do Chão PV-diesel drip irrigation system.
Values IIC [€] 170277.03
IIC per Wp [€/Wp] 1.22 OPEX0 [€] 3064.8
h [%] 1.19 i [%] 0.82 r [%] -0.37 s [%] 3
It can be seen in Table 11 that the economic results are very interesting: an IRR of 15% and
13%, a PBP of 8.8 and 10.1 years (less than half of the lifetime of the system), and an LCOEcs
of 0.12 and 0.15 €/kWh in case studies A and respectively. The LCOE of the only-diesel
system, LCOEPS, is 0.32 €/kWh, which means that savings are 61% in case study A and 53%
in case study B.
Table 11 – Economic results of the Alter do Chão PV-diesel drip irrigation system.
Case study A B NPV [€] 634767 549184 IRR [%] 15 13
PBP [years] 8.8 10.1 LCOECS [€/kWh] 0.13 0.15
Savings [%] 61 53


Large power hybrid PV pumping for irrigation
45
CHAPTER 3
A 120 KWP HYBRID PV-GRID IRRIGATION SYSTEM IN
MOROCCO
3.1 Introduction
This chapter describes the design, implementation and operational performance of a 120 kWp
hybrid PV-grid system installed in Tamelalt (Morocco) for the drip irrigation of 233 ha of
intensive olive trees. This system also belongs to ELAIA.
The design of this system also considers the problem of integrating the novelty of the PV
system, in this case, in a pre-existing only-grid system.
This chapter is structured in the same way as the previous one: section 3.2 includes a
description of the Tamelalt irrigation system, both the pre-existing only-grid system and the
current hybrid PV-grid system. Section 3.3 is devoted to the presentation of performance
indices for two different scenarios. Section 3.4 is about the in-the-field performance of the
system and section 3.5 about the economic feasibility.
3.2 The Tamelalt irrigation system
3.2.1 The pre-existing only-grid system
The pre-existing irrigation system (Figure 16) was composed by drip emitter devices and two
centrifugal surface pumps of 45 kW fed from the national electric grid. Each pump works
through a soft-starter at a constant frequency of 50 Hz. Accordingly, and to guarantee
constant pressure along the farm, pressure regulating valves are installed. The system also
includes a water filter and an fcd, which work as in the case of Alter do Chão.

A 120 kWp hybrid PV-grid irrigation system in Morocco
46
Figure 16 – The pre-existing irrigation system.
The IP is typically all year round. The pumps work with a pressure setpoint of 4 bar after the
bank of filters, giving each one a flow between 180 and 200 m3/h according to the irrigation
sector. The farm is divided into 4 sectors with areas ranging from 56 to 60 Ha. Daily, each
sector is activated sequentially (through the irrigation controller, an Agronic 4000, from
Progrés) in accordance with a weekly irrigation schedule done by the operator responsible for
the irrigation. An example of this weekly irrigation schedule for a typical year is shown in
Figure 17.
Figure 17 – Hours per day of a) Irrigation scheduling, b) Daytime.
The water to the irrigation pumps comes from a 25000 m3 reservoir. Four submersible pumps
(two of 30 kW and two of 37 kW), also fed from the grid, extract water from four different
wells to this reservoir.

Large power hybrid PV pumping for irrigation
47
This only-grid drip irrigation system is representative of the great number of systems present
in the current market.
3.2.2 The hybrid PV-grid system
As in the case of Portugal, the design of the PV system was done taking into account the
characteristics of the irrigation system already installed in the field and the end-user desire in
order to reduce the degree of novelty. So, first of all, the pipe network and the irrigation
schedule are preserved.
Second, this system is also a hybrid one. In this case, the hybridization is done because the
end-user wants to keep the connection to the previous energy source to guarantee that they
will be able to irrigate whenever they need. Therefore, hybridization could be seen as the
price to pay to have the confidence of the user. It should be mention that this system cannot
inject energy into the grid. The reason is twofold. First, the injection of PV electricity to the
grid is nationally regulated, which means that different countries have different laws.
Furthermore, even within the same country, this regulation can change within time and this
will lead to uncertainties in the investment. Second, if we are able to prove the technical and
economic feasibility of the system without sales to the grid, we are guaranteeing that in the
worst-case scenario the system will be profitable.
The new and current system (Figure 18) includes a PV generator of 120 kWp, electrically
divided into two equals fields of 60 kWp, each one feeding one frequency converter of 55 kW
(Omron 3G3RX-A4550) – which replaces the previous soft starters – and two 45 kW pumps
(Caprari – MEC-AS4/125C+ FELM 45KW 4P). This system has the hybridization in the
electric part, which means that each FC receives electricity from both the national grid and the
PV generator.

A 120 kWp hybrid PV-grid irrigation system in Morocco
48
Figure 18 – Hybrid PV-grid system configuration. If ones compare this configuration with the one presented in Figure 16, the PV generator and the PLC were added, as well as the frequency converters (which replace the soft-starters).
Finally, three operating modes are available: “Only PV”, “Hybrid” and “Only rid”. The
configuration adopted in this system allows the maximization of the use of the PV production
if the voltage at the maximum power point of the PV generator is higher than the DC voltage
imposed by the grid in the DC bus of the frequency converter. This was done for the first time
in this site and a patent was already accepted [86]. The two frequency converters work in a
master-slave mode, i.e., one of the frequency converters (the master) controls the pressure in
the irrigation system and sends an analog signal (representing the frequency) to the other
frequency converter (the slave).
Figure 19 shows the main components currently used in the system.
(a)
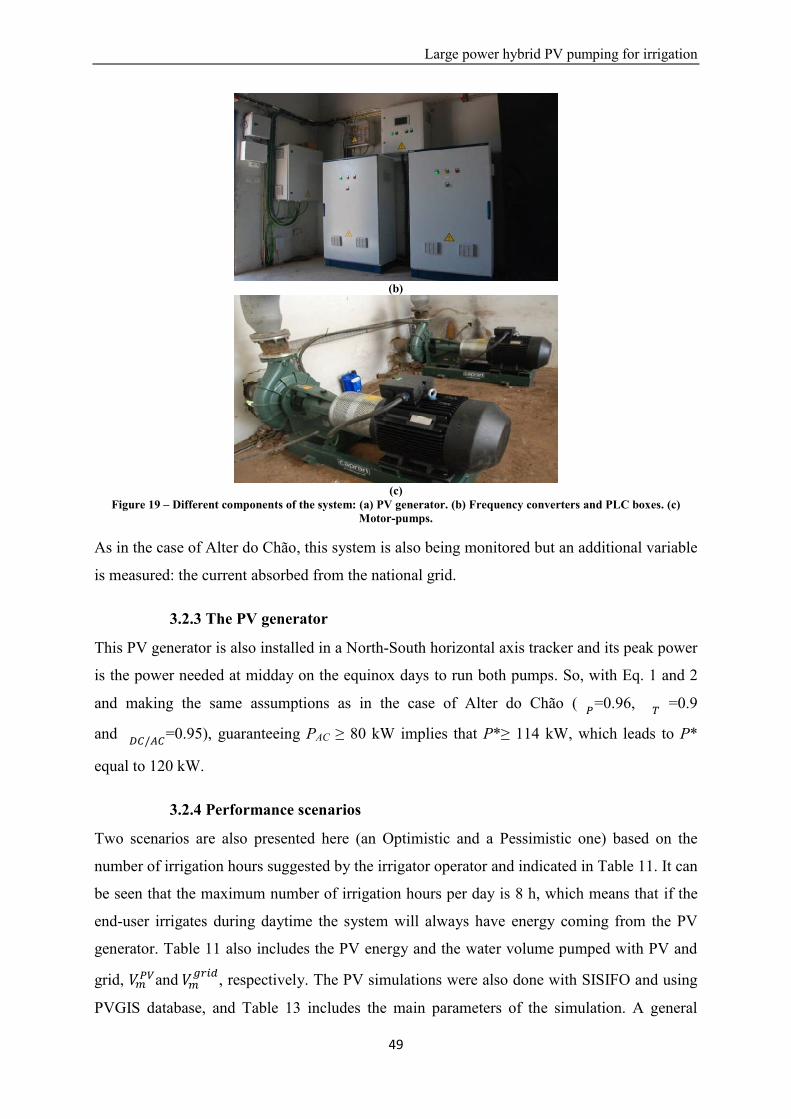
Large power hybrid PV pumping for irrigation
49
(b)
(c)
Figure 19 – Different components of the system: (a) PV generator. (b) Frequency converters and PLC boxes. (c) Motor-pumps.
As in the case of Alter do Chão, this system is also being monitored but an additional variable
is measured: the current absorbed from the national grid.
3.2.3 The PV generator
This PV generator is also installed in a North-South horizontal axis tracker and its peak power
is the power needed at midday on the equinox days to run both pumps. So, with Eq. 1 and 2
and making the same assumptions as in the case of Alter do Chão (
=0.96,
=0.9
and
=0.95), guaranteeing PAC ≥ 80 kW implies that P*≥ 114 kW, which leads to P*
equal to 120 kW.
3.2.4 Performance scenarios
Two scenarios are also presented here (an Optimistic and a Pessimistic one) based on the
number of irrigation hours suggested by the irrigator operator and indicated in Table 11. It can
be seen that the maximum number of irrigation hours per day is 8 h, which means that if the
end-user irrigates during daytime the system will always have energy coming from the PV
generator. Table 11 also includes the PV energy and the water volume pumped with PV and
grid, and , respectively. The PV simulations were also done with SISIFO and using
PVGIS database, and Table 13 includes the main parameters of the simulation. A general

A 120 kWp hybrid PV-grid irrigation system in Morocco
50
overview of Table 11 shows that in the Optimistic Scenario the irrigation period is the whole
year, while in the Pessimistic one the IP goes from March to November. The number of
irrigation hours along the year for the Optimistic Scenario is 2134 h, while in the Pessimist
Scenario they are 53.4% lower.
Table 12 – PV energy, volume of water pumped (from PV and from the grid) and daily working hours in the Pessimist and Optimistic scenarios.
Optimistic Scenario
Month EPV [kWh]
[m3]
[m3] WTday
[h] January 3840 17155 7645 2
February 5927 26478 7122 3 March 12536 55999 6001 5 April 15686 70072 1928 6 May 21153 94495 4705 8 June 20860 93186 2814 8 July 21314 95216 3984 8
August 20565 91870 7330 8 September 16362 73094 10906 7
October 15227 68024 18776 7 November 11245 50234 21766 6 December 3655 16326 8474 2
Total 168371 752148 101452 Pessimistic Scenario
March 2516 11240 1160 1 April 10510 46951 1049 4 May 16148 72135 2265 6 June 15878 70931 1069 6 July 13466 60155 1845 5
August 10494 46880 2720 4 September 7155 31965 4035 3
October 6654 29725 7475 3 November 924 4128 1872 1
Total 83746 374109 23491
Table 13 – Parameters of the simulation.
Parameter Value/ option Solar climate data PVGIS
Real power vs nominal power [%] 96 DC/AC conversion [%] 95
Hydraulic part Motor-pump [%] 72 Filter [%] 80 Cleaning and other [%] 90

Large power hybrid PV pumping for irrigation
51
3.3 Performance indices
The ratios defined in the case of Portugal will also be applied here. As a consequence of the
electric hybridization, in this case, two differences should be mentioned. First, the PVS is only
calculated with Eq. 3 substituting Ed by Eg (see Eq. 24).
(Eq. 24)
where Eg is the energy supplied by the grid.
Second, a minimum PV power to start pumping is not needed because with this type of
hybridization the PV can be used from sunshine to sunrise and the grid will supply the
remaining power in order to achieve the desired power level to guarantee the pressure set-
point. As a consequence, Figure 15 should be modified and replaced by Figure 20, where
Guseful is exploited since sun-shine being the only limitation the irradiance strictly required to
keep PAC stable to the power required by the pressure set-point. The PR equation and its
components keep unchanged. It is worth noting that, due to the design of the system, the
URPVIS will be higher than in the system of Portugal.
(a)
(b) (c)
Figure 20 – Graphical representation of the different irradiations considered: (a) is the irradiation during the irrigation period, (b) is the useful irradiation during the IP determined by the design of the PV irrigation
system; and (c) is the irradiation used effectively by the system.

A 120 kWp hybrid PV-grid irrigation system in Morocco
52
3.3.1 Performance indices for the two scenarios
Table 14 shows the performance indices for the two scenarios. The annual PVS is 0.88 and
0.94 and the PR is 0.48 and 0.24 for the Optimistic and Pessimistic Scenarios respectively.
The differences between the PR in both scenarios are due to lower values of URIP and UREF in
the Pessimistic Scenario. URIP in the Optimistic Scenario is 1 because irrigation is done
throughout the year, which does not happen in the Pessimistic Scenario. The lowest UREF is
due to the low utilization of the system. It is interesting to note that the lowest values of
URPVIS are observed in summer months because in this period there are moments of time in
which the available irradiance is higher than the one strictly required to keep PAC stable to the
power required by the pressure set-point.
Table 14 – Simulated performance indices for the Optimistic and Pessimist scenarios.
Optimistic Scenario Month PVS PR PRPV URIP URPVIS UREF
January 0.69 0.20 0.85 1.00 1.00 0.23 0.52 February 0.79 0.28 0.83 1.00 1.00 0.33 0.52 March 0.90 0.42 0.81 1.00 1.00 0.52 0.52 April 0.97 0.46 0.92 1.00 0.91 0.55 0.52 May 0.95 0.57 0.89 1.00 0.91 0.70 0.52 June 0.97 0.54 0.91 1.00 0.88 0.68 0.52 July 0.96 0.54 0.89 1.00 0.88 0.68 0.52
August 0.93 0.56 0.78 1.00 0.97 0.74 0.52 September 0.87 0.54 0.78 1.00 1.00 0.70 0.52
October 0.78 0.59 0.80 1.00 1.00 0.74 0.52 November 0.70 0.58 0.84 1.00 1.00 0.70 0.52 December 0.66 0.20 0.85 1.00 1.00 0.23 0.52
IP 0.88 0.48 0.85 1.00 0.95 0.60 0.52 Annual 0.88 0.48 0.85 1.00 0.95 0.60 0.52
Pessimistic Scenario March 0.91 0.08 0.80 1.00 1.00 0.11 0.52 April 0.98 0.31 0.94 1.00 0.91 0.36 0.52 May 0.97 0.44 0.91 1.00 0.91 0.53 0.52 June 0.99 0.41 0.93 1.00 0.88 0.51 0.52 July 0.97 0.34 0.89 1.00 0.88 0.43 0.52
August 0.95 0.29 0.77 1.00 0.97 0.38 0.52 September 0.89 0.24 0.77 1.00 1.00 0.31 0.52
October 0.80 0.26 0.79 1.00 1.00 0.33 0.52 November 0.69 0.05 0.83 1.00 1.00 0.06 0.52
IP 0.94 0.29 0.87 1.00 0.94 0.35 0.52 Annual 0.94 0.24 0.87 0.83 0.94 0.35 0.52
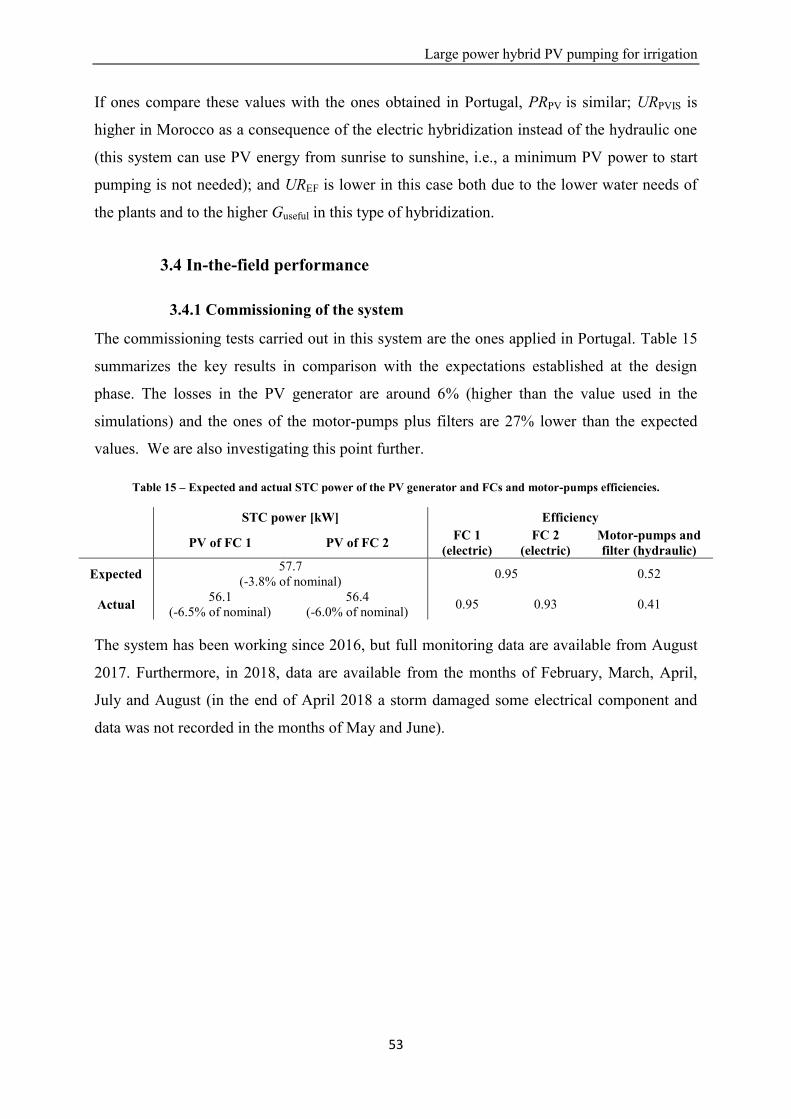
Large power hybrid PV pumping for irrigation
53
If ones compare these values with the ones obtained in Portugal, PRPV is similar; URPVIS is
higher in Morocco as a consequence of the electric hybridization instead of the hydraulic one
(this system can use PV energy from sunrise to sunshine, i.e., a minimum PV power to start
pumping is not needed); and UREF is lower in this case both due to the lower water needs of
the plants and to the higher Guseful in this type of hybridization.
3.4 In-the-field performance
3.4.1 Commissioning of the system
The commissioning tests carried out in this system are the ones applied in Portugal. Table 15
summarizes the key results in comparison with the expectations established at the design
phase. The losses in the PV generator are around 6% (higher than the value used in the
simulations) and the ones of the motor-pumps plus filters are 27% lower than the expected
values. We are also investigating this point further.
Table 15 – Expected and actual STC power of the PV generator and FCs and motor-pumps efficiencies.
STC power [kW] Efficiency
PV of FC 1 PV of FC 2 FC 1 (electric)
FC 2 (electric)
Motor-pumps and filter (hydraulic)
Expected 57.7 (-3.8% of nominal) 0.95 0.52
Actual 56.1 (-6.5% of nominal)
56.4 (-6.0% of nominal) 0.95 0.93 0.41
The system has been working since 2016, but full monitoring data are available from August
2017. Furthermore, in 2018, data are available from the months of February, March, April,
July and August (in the end of April 2018 a storm damaged some electrical component and
data was not recorded in the months of May and June).
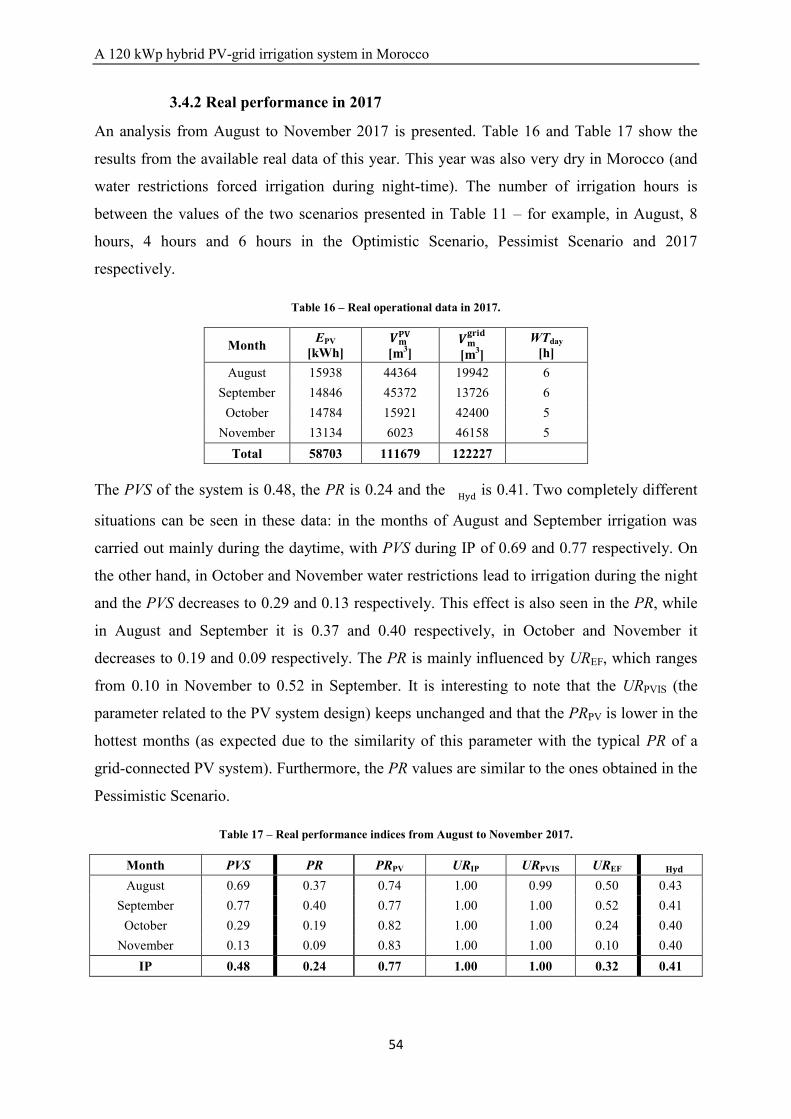
A 120 kWp hybrid PV-grid irrigation system in Morocco
54
3.4.2 Real performance in 2017
An analysis from August to November 2017 is presented. Table 16 and Table 17 show the
results from the available real data of this year. This year was also very dry in Morocco (and
water restrictions forced irrigation during night-time). The number of irrigation hours is
between the values of the two scenarios presented in Table 11 – for example, in August, 8
hours, 4 hours and 6 hours in the Optimistic Scenario, Pessimist Scenario and 2017
respectively.
Table 16 – Real operational data in 2017.
Month EPV [kWh]
[m3]
[m3] WTday
[h] August 15938 44364 19942 6
September 14846 45372 13726 6 October 14784 15921 42400 5
November 13134 6023 46158 5 Total 58703 111679 122227
The PVS of the system is 0.48, the PR is 0.24 and the
is 0.41. Two completely different
situations can be seen in these data: in the months of August and September irrigation was
carried out mainly during the daytime, with PVS during IP of 0.69 and 0.77 respectively. On
the other hand, in October and November water restrictions lead to irrigation during the night
and the PVS decreases to 0.29 and 0.13 respectively. This effect is also seen in the PR, while
in August and September it is 0.37 and 0.40 respectively, in October and November it
decreases to 0.19 and 0.09 respectively. The PR is mainly influenced by UREF, which ranges
from 0.10 in November to 0.52 in September. It is interesting to note that the URPVIS (the
parameter related to the PV system design) keeps unchanged and that the PRPV is lower in the
hottest months (as expected due to the similarity of this parameter with the typical PR of a
grid-connected PV system). Furthermore, the PR values are similar to the ones obtained in the
Pessimistic Scenario.
Table 17 – Real performance indices from August to November 2017.
Month PVS PR PRPV URIP URPVIS UREF
August 0.69 0.37 0.74 1.00 0.99 0.50 0.43 September 0.77 0.40 0.77 1.00 1.00 0.52 0.41
October 0.29 0.19 0.82 1.00 1.00 0.24 0.40 November 0.13 0.09 0.83 1.00 1.00 0.10 0.40
IP 0.48 0.24 0.77 1.00 1.00 0.32 0.41

Large power hybrid PV pumping for irrigation
55
3.4.3 Real performance in 2018
Table 18 and Table 19 show the same information as Table 16 and Table 17 for 2018 data. As
in 2017, the number of irrigation hours is in between the two scenarios considered. Table 18 – Real operational data in 2018.
Month EPV [kWh]
[m3]
[m3] WTday
[h] February 12192 34230 14963 4 March 11946 34504 15323 4 April 12527 40085 32358 4 July 15767 41757 17928 5
August 16294 15835 44803 6 Total 68726 166411 125374
The PVS is 0.55, the PR is 0.29 and the
is 0.42. As expected, the PR is mainly influenced
by the UREF that is between 0.41 and 0.45 from February to July and only 0.17 in August. The
value of August is a consequence of the need to irrigate mainly during the night.
If ones compare the data from 2017 and 2018, both the PVS and the PR are higher in 2018 –
the first one increases 0.07, while the second one increases 0.05. It is worth noting that the
higher PR is linked to an increase of both PRPV and UREF. The PRPV is higher due to the
influence of the spring months, while the increase in the UREF is a consequence of the higher
use of the PV system, which can easily be seen in the higher PVS.
A comparison between 2018 and the scenarios shows that, in February, the average number of
working hours per day was higher than the one supposed in the Optimistic Scenario (4 hours
versus 3 in the scenario). For this reason, the PR is higher than initially expected (0.39 versus
0.28), mainly influenced by a higher UREF (0.44 versus 0.33). On the other hand, the number
of irrigation hours in April and July is the one supposed in the Pessimist Scenario.
Accordingly, the obtained PRs are quite similar to the expected ones (0.35 in April and 0.33
in July, versus 0.31 and 0.34 respectively).
Table 19 – Real performance indices from a period of 2018.
Month PVS PR PRPV URIP URPVIS UREF
February 0.70 0.39 0.89 1.00 0.99 0.44 0.43 March 0.69 0.39 0.89 1.00 0.98 0.44 0.47 April 0.55 0.35 0.86 1.00 0.97 0.41 0.39 July 0.70 0.33 0.73 1.00 1.00 0.45 0.40
August 0.26 0.13 0.77 1.00 1.00 0.17 0.41 IP 0.55 0.29 0.81 1.00 0.99 0.36 0.42
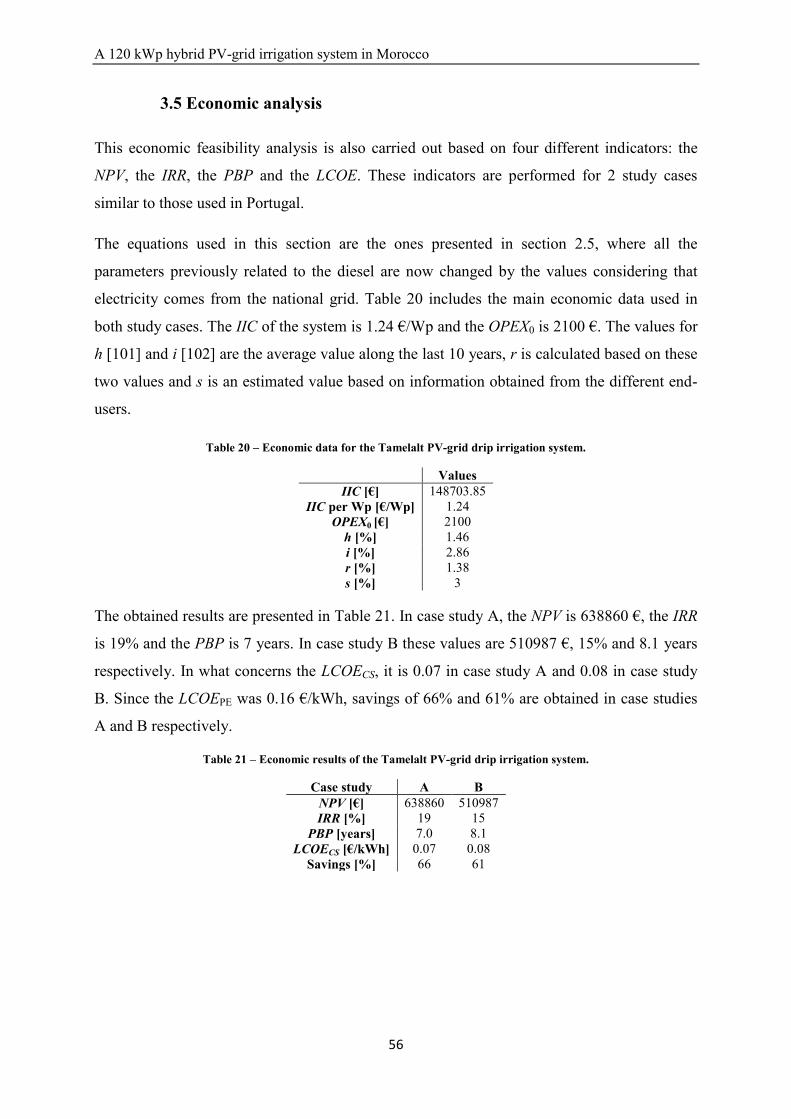
A 120 kWp hybrid PV-grid irrigation system in Morocco
56
3.5 Economic analysis
This economic feasibility analysis is also carried out based on four different indicators: the
NPV, the IRR, the PBP and the LCOE. These indicators are performed for 2 study cases
similar to those used in Portugal.
The equations used in this section are the ones presented in section 2.5, where all the
parameters previously related to the diesel are now changed by the values considering that
electricity comes from the national grid. Table 20 includes the main economic data used in
both study cases. The IIC of the system is 1.24 €/Wp and the OPEX0 is 2100 €. The values for
h [101] and i [102] are the average value along the last 10 years, r is calculated based on these
two values and s is an estimated value based on information obtained from the different end-
users.
Table 20 – Economic data for the Tamelalt PV-grid drip irrigation system.
Values IIC [€] 148703.85
IIC per Wp [€/Wp] 1.24 OPEX0 [€] 2100
h [%] 1.46 i [%] 2.86 r [%] 1.38 s [%] 3
The obtained results are presented in Table 21. In case study A, the NPV is 638860 €, the IRR
is 19% and the PBP is 7 years. In case study B these values are 510987 €, 15% and 8.1 years
respectively. In what concerns the LCOECS, it is 0.07 in case study A and 0.08 in case study
B. Since the LCOEPE was 0.16 €/kWh, savings of 66% and 61% are obtained in case studies
A and B respectively.
Table 21 – Economic results of the Tamelalt PV-grid drip irrigation system.
Case study A B NPV [€] 638860 510987 IRR [%] 19 15
PBP [years] 7.0 8.1 LCOECS [€/kWh] 0.07 0.08
Savings [%] 66 61


Large power hybrid PV pumping for irrigation
59
SECOND PART: CONTRIBUTIONS TO THE DESIGN OF PV
IRRIGATION SYSTEMS
This second part includes other contributions to the design of large-power PVIS. These
contributions are related to the PV generator structure, to the electrical design of the PV
generator and to the selection of the best motor-pump for PVIS. So, a new type of structure
called Delta that allows constant daily profiles of PV power is introduced in chapter 4; a
detailed analysis of the PV energy losses in PVIS depending on the number of PV modules in
series of the generator is shown in chapter 5; and finally a new pump selection method for
large-power PVIS that considers that these systems work at a variable frequency is presented
in chapter 6.

Large power hybrid PV pumping for irrigation
61
CHAPTER 4
PV ARRAYS WITH DELTA STRUCTURES FOR CONSTANT
IRRADIANCE DAILY PROFILES
4.1 Introduction
The constancy of in-plane irradiance daily profiles represents a significant advantage for a
number of PV applications [103], [104], [105]. In particular, when PV irrigation is concerned,
this constancy allows the daily water extraction to be maximized when pumping from flow-
limited boreholes, as well as optimizing PV performance with both constant pressure and
water flow such as drip irrigation systems [49], [67], [78].
At first glance, the immediate solution for the constancy of irradiance profiles is to use North-
South horizontal axis trackers [106], [107], [108]. This type of tracker is commonly used and
has largely demonstrated its reliability in utility-scale PV plants [109]. Nevertheless, when
smaller and isolated PV systems are concerned, trackers are still subject to reliability and cost
issues suspects and static-structures used to be preferred [49], [110], [111], [112], [113].
However, the classic static structure oriented to the Equator does not fit the requirement of
constant irradiance throughout the day [104].
In order to have these constant irradiance daily profiles without using solar trackers, this
chapter proposes a new and different type of static structure, made up of two halves, one
oriented to the East and the other to the West. In principle, both halves have an inclination of
600 with respect to the horizontal, which means that an equilateral triangle is made with the
two halves and the ground. We refer to this structure as a “Delta structure” and this chapter
aims at providing the knowledge about its constant profile and its operational performance,
including the possible mismatch losses due to the different operating conditions of its two
halves. The “Delta structure” provides constancy of irradiance at the price of reducing energy
production with respect to an optimally tilted and Equator-oriented PV array. It is opportune
to mention that instead of maximizing energy production, other objectives have been also
addressed for grid-connected PV systems in other applications. In particular, the search for
matching PV production with consumption in order to reduce transmission losses [114] and
increase PV penetration [115]. Similarly, the Sacramento Municipal Utility District had
promoted PV systems with other than Equator-orientated surfaces [116].

PV arrays with Delta structures for constant irradiance daily profiles
62
Furthermore, a new index is proposed to evaluate the constancy of the irradiance daily profile.
For a given time series of N values, xi, describing a general variable profile, a “constancy
index”, kc, can be defined as:
(Eq. 25)
where µ and σ are the mean and the standard deviation respectively
and
(Eq. 26)
Based on this new index, this chapter also sets out empirical evidence of the irradiance
constancy provided by a Delta structure prototype installed on the roof of the Solar Energy
Institute of the Universidad Politécnica de Madrid (IES-UPM) and compares it with those
corresponding to a one-horizontal axis tracker and tilt-fixed structure oriented to the Equator.
Another important and unknown aspect related to the Delta structure is the possible electrical
losses due to the different PV module operation temperatures of its two halves, leading to two
different working points of maximum power. This work pays attention to evaluating these
electrical mismatching losses when using just a single maximum power point tracker (MPPT).
Finally, an analysis of the electrical performance of the Delta structure when used for a PV
grid-connected system and for a PV irrigation system, filling the knowledge gap of the
behaviour of this new structure compared with the one-horizontal axis tracker and tilt-fixed
structure is performed. This is made by means of an extended simulation exercise carried out
in a representative location in Portugal.
4.2 The Delta structure
The Delta structure proposed is a static ground-mounted structure in which half of the PV
array is oriented to the East and the other half to the West, both parts with the same tilt angle,
β, (Figure 21). Hereinafter, this Delta structure will be denominated as ΔS(β). Note that in the
case of β=600, the PV array surface seen by the Sun is equal at three moments of any day: in
the morning when the Sun is perpendicular to the East-oriented surfaces, at Midday and in the
afternoon when the Sun is perpendicular to the West-oriented surfaces. These moments occur
about 4 hours before midday, at midday and 4 hours after midday. In-plane direct irradiance,

Large power hybrid PV pumping for irrigation
63
B, tends to be the same at these moments, which leads to in-plane global irradiance, G,
reasonably approaching constancy for 8 hours per day.
Figure 21 – The Delta structure, ΔS(β): The PV array is distributed in two halves. One half is oriented to the West while the other half is oriented to the East. For presentation clarity, the latter is not pointed out in the figure.
As a representative example, a ΔS(60), made up of two reference PV modules, has been
installed on the roof of the IES-UPM. Figure 22 shows the in-plane irradiance observed on a
clear day close to the Summer Solstice (23rd June). Subscripts “E” and “W” mean East- and
West-oriented surfaces respectively, and “Δ” means the average. As expected, the East-
oriented part receives more in-plane irradiance in the morning, while the West-oriented one
gets more in the afternoon. The average on both surfaces is presented in red and it can be seen
that constancy is almost achieved during the middle 8 hours of the day. The corresponding kC
value for just these 8 hours is 0.985. Despite they are not being shown in the figure, it is
interesting to mention that the kC values for the horizontal irradiance and for the in-plane
irradiance over a 410 tilted and South oriented surface during the same period are 0.837 and
0.787 respectively.
Figure 22 – The in-plane global irradiance over a ΔS(60) measured on a clear day close to the Summer Solstice (23rd June 2017) at IES-UPM. In-plane global irradiance in the East- and West-oriented halves of the ΔS(60) are presented
in blue and green respectively. The average value is in red. It is seen that constancy is almost achieved during the middle 8 hours of the day. Variations near 8 h and 20 h are due to shadows from surrounding objects.

PV arrays with Delta structures for constant irradiance daily profiles
64
This ΔS(β) has been incorporated in SISIFO [75], a PV system simulation tool able to deal
with different PV array static and tracking structure possibilities. As a representative case, we
have used this tool to analyse the performance of a PV grid-connected system and of a PV
irrigation system located in Figueirinha, Silves, Portugal. For comparison purposes, we have
considered the ΔS(60) proposed here and two representative cases of the current state-of-art: a
static structure oriented to the South and tilted 250, S(25), and a single North-South horizontal
axis tracker, 1xh, with the rotation angle limited to 600 and capable of backtracking [117],
[118].
The energy and water pumping performance depend extensively on the particularities of the
inverter and motor-pump (power limitation and efficiency curves) and of the borehole and
irrigation system (water flow limitation, irrigation period and pressure requirements), and will
be analysed in the next section. Here, we will only present the aspects which are intrinsic to
the ΔS(60): the constancy of the irradiance profile, the ground cover ratio and the electric
losses due to the division of the PV array into two halves subject to different operating
conditions.
4.2.1 Irradiance profiles
The monthly mean daily horizontal irradiation values, Gdm(0), have been obtained from
PVGIS [90] in Figueirinha (37.941 N, 7.998 W) and corresponding daily irradiance profiles
have been derived using SISIFO, by selecting the Erbs model [119] for decomposition of
monthly global values in direct and diffuse components, the Collares-Pereira and Rabl model
[120] for deriving instantaneous irradiance from daily irradiation values, and the Perez model
[121] for transposition from horizontal to in-plane diffuse irradiances. Soiling and ground
reflectance have been established at 2% and 0.3, respectively, and, finally, the simulation time
step has been set to 1 minute.
Figure 23 shows the in-plane global irradiance evolution on the Summer and Winter Solstices,
as well as the Spring Equinox. This is obtained as the weighted average of the in-plane global
irradiance on each half of the Delta, the instantaneous power of each half being the weighting
factor. Table 22 gives the values of kC between 8 am and 4 pm for these 3 days, together with
that corresponding to S(25) and to 1xh. Irradiance constancy provided by the ΔS(60) is nearly
as good as that provided by the 1xh (and the best in the Winter Solstice) and much better than
that corresponding to the S(25). It is worth recognizing that, due to irradiance fluctuations
caused by passing clouds, irradiance constancy on some real days would be lower than that
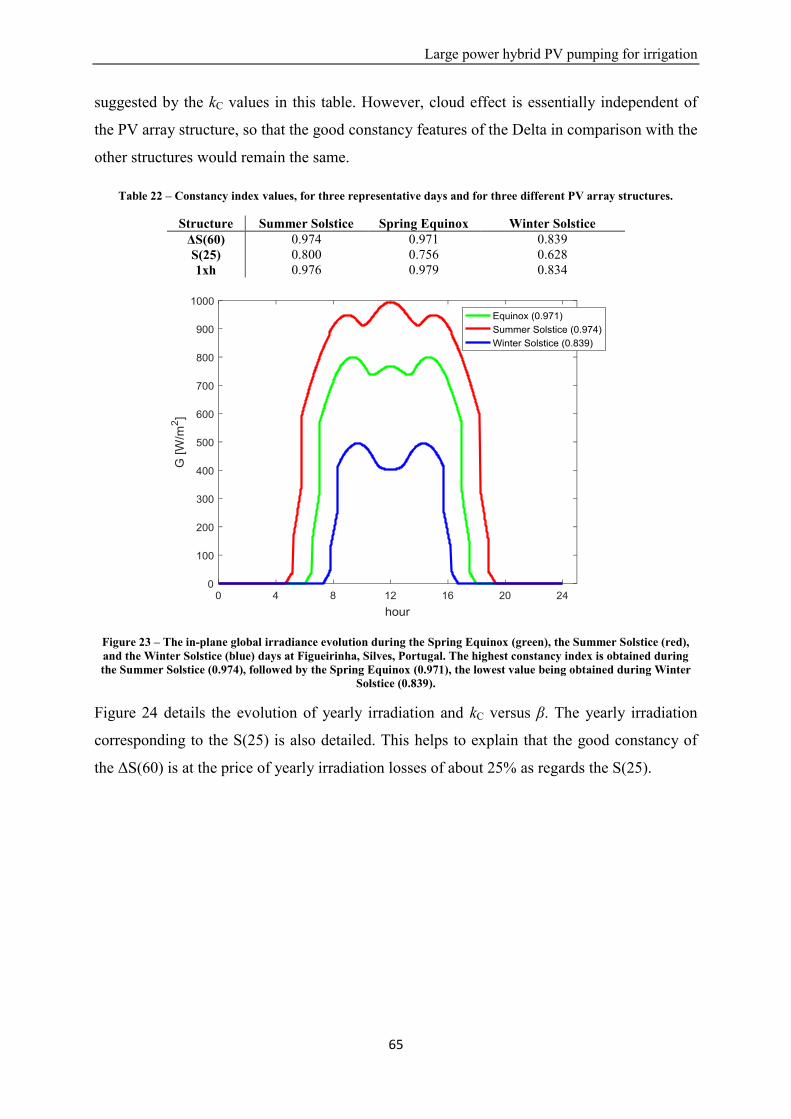
Large power hybrid PV pumping for irrigation
65
suggested by the kC values in this table. However, cloud effect is essentially independent of
the PV array structure, so that the good constancy features of the Delta in comparison with the
other structures would remain the same.
Table 22 – Constancy index values, for three representative days and for three different PV array structures.
Structure Summer Solstice Spring Equinox Winter Solstice ΔS(60) 0.974 0.971 0.839 S(25) 0.800 0.756 0.628 1xh 0.976 0.979 0.834
Figure 23 – The in-plane global irradiance evolution during the Spring Equinox (green), the Summer Solstice (red), and the Winter Solstice (blue) days at Figueirinha, Silves, Portugal. The highest constancy index is obtained during the Summer Solstice (0.974), followed by the Spring Equinox (0.971), the lowest value being obtained during Winter
Solstice (0.839).
Figure 24 details the evolution of yearly irradiation and kC versus β. The yearly irradiation
corresponding to the S(25) is also detailed. This helps to explain that the good constancy of
the ΔS(60) is at the price of yearly irradiation losses of about 25% as regards the S(25).
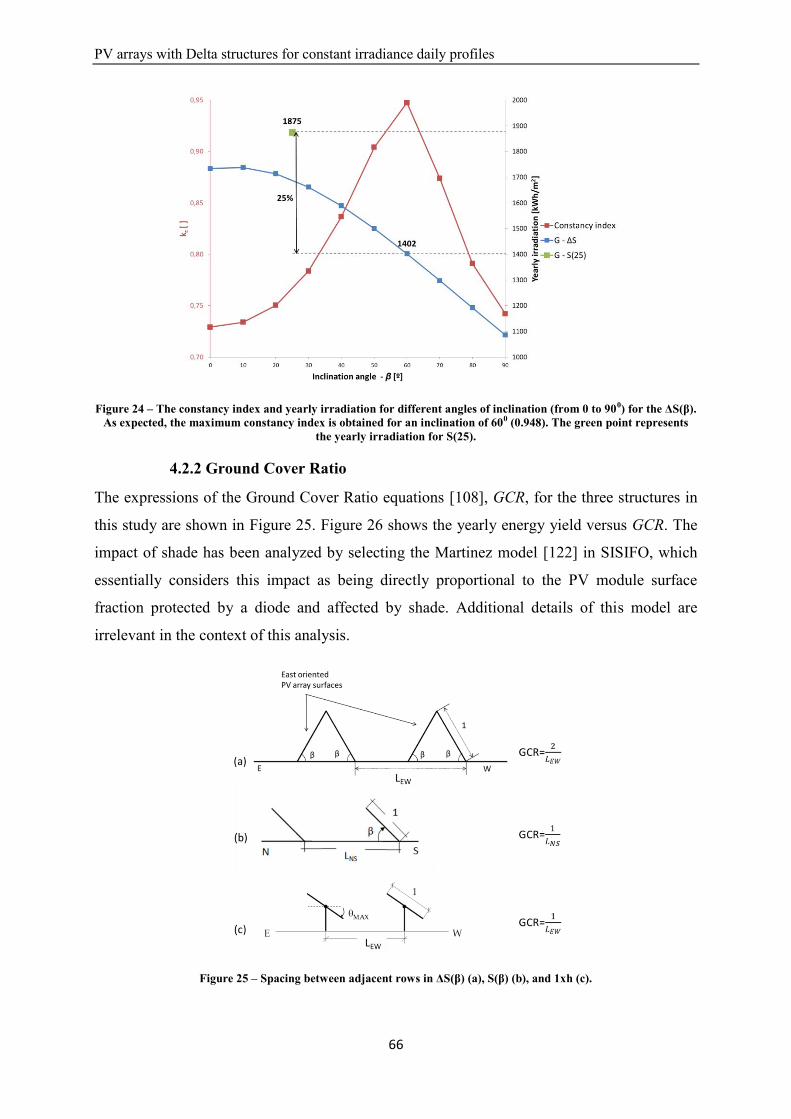
PV arrays with Delta structures for constant irradiance daily profiles
66
Figure 24 – The constancy index and yearly irradiation for different angles of inclination (from 0 to 900) for the ΔS(β). As expected, the maximum constancy index is obtained for an inclination of 600 (0.948). The green point represents
the yearly irradiation for S(25).
4.2.2 Ground Cover Ratio
The expressions of the Ground Cover Ratio equations [108], GCR, for the three structures in
this study are shown in Figure 25. Figure 26 shows the yearly energy yield versus GCR. The
impact of shade has been analyzed by selecting the Martinez model [122] in SISIFO, which
essentially considers this impact as being directly proportional to the PV module surface
fraction protected by a diode and affected by shade. Additional details of this model are
irrelevant in the context of this analysis.
Figure 25 – Spacing between adjacent rows in ΔS(β) (a), S(β) (b), and 1xh (c).
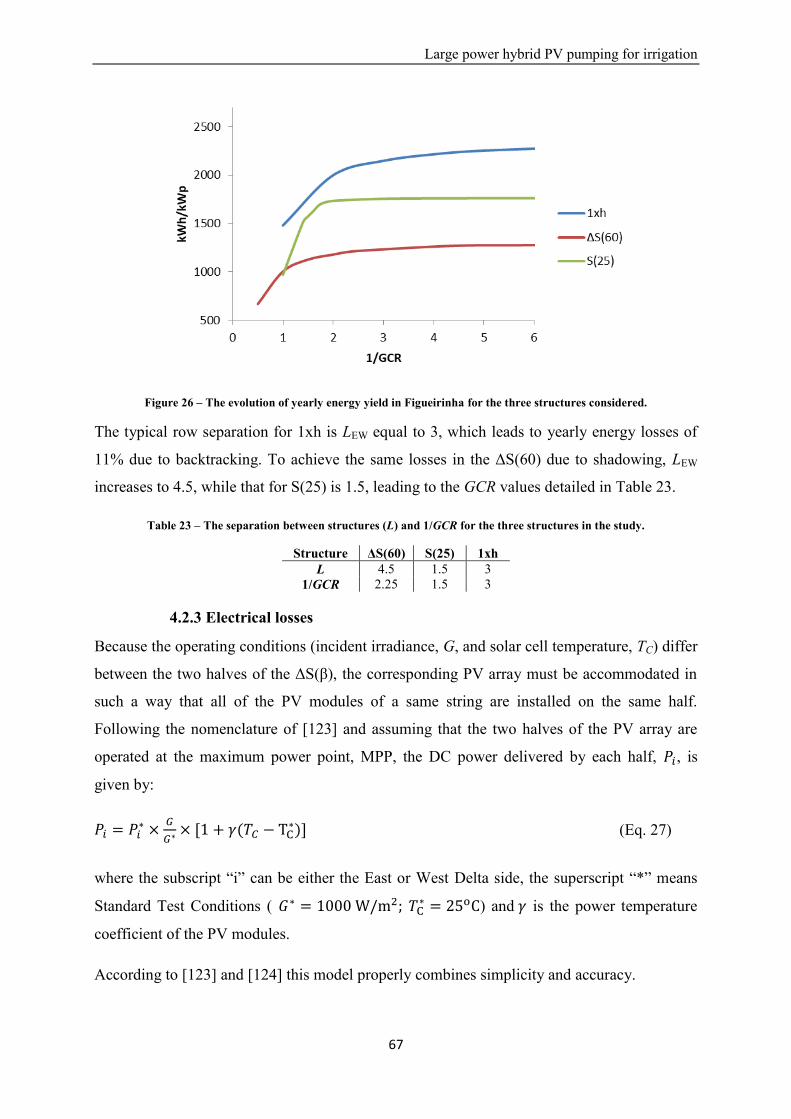
Large power hybrid PV pumping for irrigation
67
Figure 26 – The evolution of yearly energy yield in Figueirinha for the three structures considered.
The typical row separation for 1xh is LEW equal to 3, which leads to yearly energy losses of
11% due to backtracking. To achieve the same losses in the ΔS(60) due to shadowing, LEW
increases to 4.5, while that for S(25) is 1.5, leading to the GCR values detailed in Table 23.
Table 23 – The separation between structures (L) and 1/GCR for the three structures in the study.
Structure ΔS(60) S(25) 1xh L 4.5 1.5 3
1/GCR 2.25 1.5 3
4.2.3 Electrical losses
Because the operating conditions (incident irradiance, G, and solar cell temperature, TC) differ
between the two halves of the ΔS(β), the corresponding PV array must be accommodated in
such a way that all of the PV modules of a same string are installed on the same half.
Following the nomenclature of [123] and assuming that the two halves of the PV array are
operated at the maximum power point, MPP, the DC power delivered by each half, , is
given by:
(Eq. 27)
where the subscript “i” can be either the East or West Delta side, the superscript “*” means
Standard Test Conditions ( ) and is the power temperature
coefficient of the PV modules.
According to [123] and [124] this model properly combines simplicity and accuracy.

PV arrays with Delta structures for constant irradiance daily profiles
68
The total power delivered by the full ΔS(β), PΔ, is just:
(Eq. 28)
Since the MPP voltage varies both with irradiance and cell temperature, the MPP voltage of
the two PV array halves is different. Coupling this PV array to a single inverter requires two
different maximum power point trackings, MPPTs, one for each half. A cheaper alternative,
attractive in practice, consists of using only one MPPT. Then, electrical mismatching losses
appear and Eq. 27 must include the corresponding correction. For that, it is reasonable to
assume that the MPP voltage of the whole Delta structure, , is given by the weighted
average of the corresponding values of the two halves, the power being the weighting factor:
(Eq. 29)
On the other hand, the MPP voltage of each half, , is calculated through the following
equation [125], [126]:
(Eq. 30)
where is the number of modules in series, is the voltage temperature coefficient of the
PV modules and is the thermal voltage of a module.
Because the irradiance at the two halves is asymmetric, the resulting is slightly lower
than the VMPP of the more illuminated half, so the power corresponding to this voltage can
simply be calculated by linear approximations of the P-V curves. That is:
(Eq. 31)
when the total power of the Delta structure with only one MPPT ( is obtained as the
sum of both surfaces (as in Eq. 28). So, the electrical mismatching losses (FML) are obtained
as the difference between the power obtained with two and one MPPT – Eq. 32.
(Eq. 32)
It is interesting to point out that electrical mismatching losses are higher in the less
illuminated half of the Delta, which contributes less to the instantaneous available PV power.
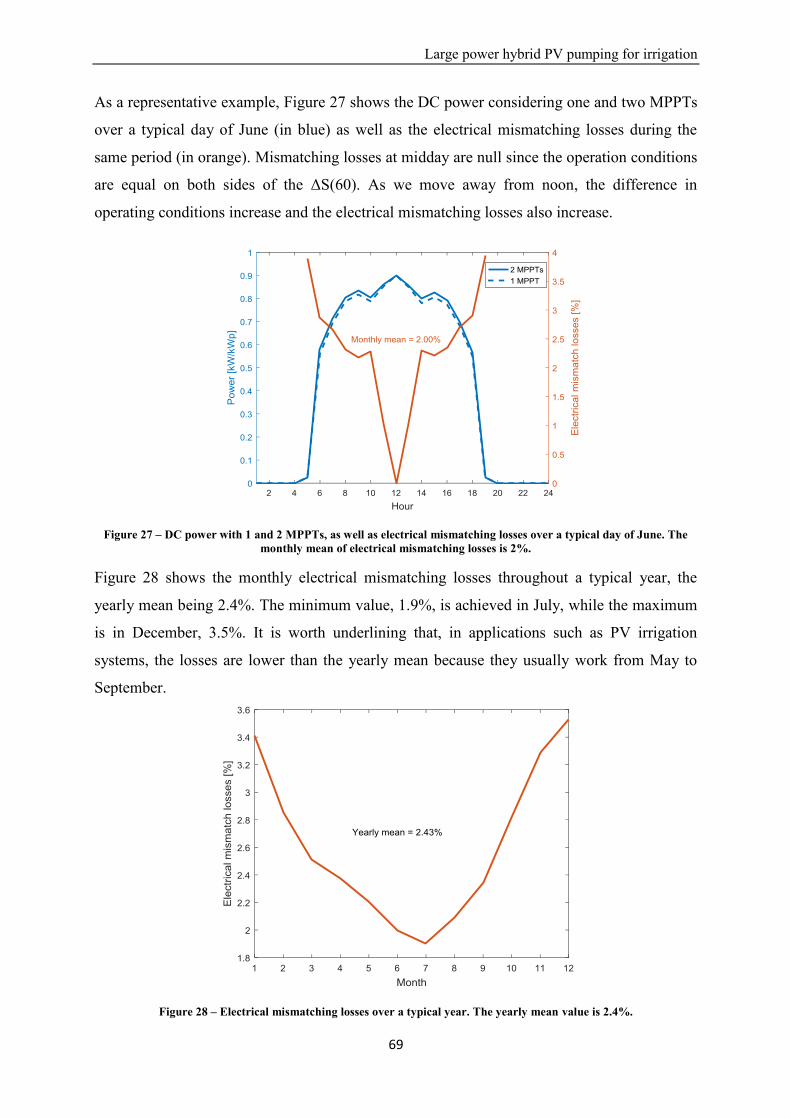
Large power hybrid PV pumping for irrigation
69
As a representative example, Figure 27 shows the DC power considering one and two MPPTs
over a typical day of June (in blue) as well as the electrical mismatching losses during the
same period (in orange). Mismatching losses at midday are null since the operation conditions
are equal on both sides of the ΔS(60). As we move away from noon, the difference in
operating conditions increase and the electrical mismatching losses also increase.
Figure 27 – DC power with 1 and 2 MPPTs, as well as electrical mismatching losses over a typical day of June. The monthly mean of electrical mismatching losses is 2%.
Figure 28 shows the monthly electrical mismatching losses throughout a typical year, the
yearly mean being 2.4%. The minimum value, 1.9%, is achieved in July, while the maximum
is in December, 3.5%. It is worth underlining that, in applications such as PV irrigation
systems, the losses are lower than the yearly mean because they usually work from May to
September.
Figure 28 – Electrical mismatching losses over a typical year. The yearly mean value is 2.4%.

PV arrays with Delta structures for constant irradiance daily profiles
70
4.3 Comparative performance analysis
This section compares the performance of the structure proposed here, the ΔS(60), with the
traditional ones, S(25) and 1xh, within the framework of two different PV applications also
characterized by different constancy requirements: grid connection (PVGCS) and irrigation
(PVIS). The grid connection performance is assessed in terms of yearly energy delivered to
the grid while the irrigation performance is assessed in terms of pumped water over two
different periods: the whole year and from May to September, which is a typical irrigation
period for many crops.
For this reason, we have extended the Figueirinha simulation exercise to a 40 kWp PV
generator mounted on 1xh. 40 kW is also the nominal power of the inverter (for PVGCS) and
of the frequency converter (for PVIS), and both have identical efficiency and just one single
MPP tracker. Their efficiency is calculated using the Schmid model [127], which is based on
three different parameters: K0 (no-load losses), K1 (linear losses), and K2 (Joule losses). For
this simulation, the values of Schmid parameters for both the inverter and the frequency
converter are K0= 0.0115, K1= 0.0015, and K2=0.0438, which lead to a European efficiency
value of 94.3%. The SISIFO models mentioned in section 4.2.1 are also selected here, and the
separation between the rows for the three PV array structures are those stated in section 4.2.2.
The losses scenario includes a soiling degree of 2%, wiring losses of 1.5 and 3% for DC and
AC, respectively, and a ratio between real and nominal power of the PV generator of 0.96 due
to initial degradation and mismatching losses.
In the case of the PVIS, a stand-alone PV irrigation system pumping into a water pool is
studied. The pumping head of the system is 50 m and the nominal frequency of the pump is
50 Hz, it being able to work from 38 to 55 Hz. The pump and system curves are shown in
Figure 29 and the main characteristics of the PVIS are summarized in Table 24.
Table 24 – Characteristics of the PV irrigation system.
Parameter Value Type of PV irrigation system Stand-alone
Type of pumping Water pool Pumping head [m] 50
Working flow [m3/h] Variable
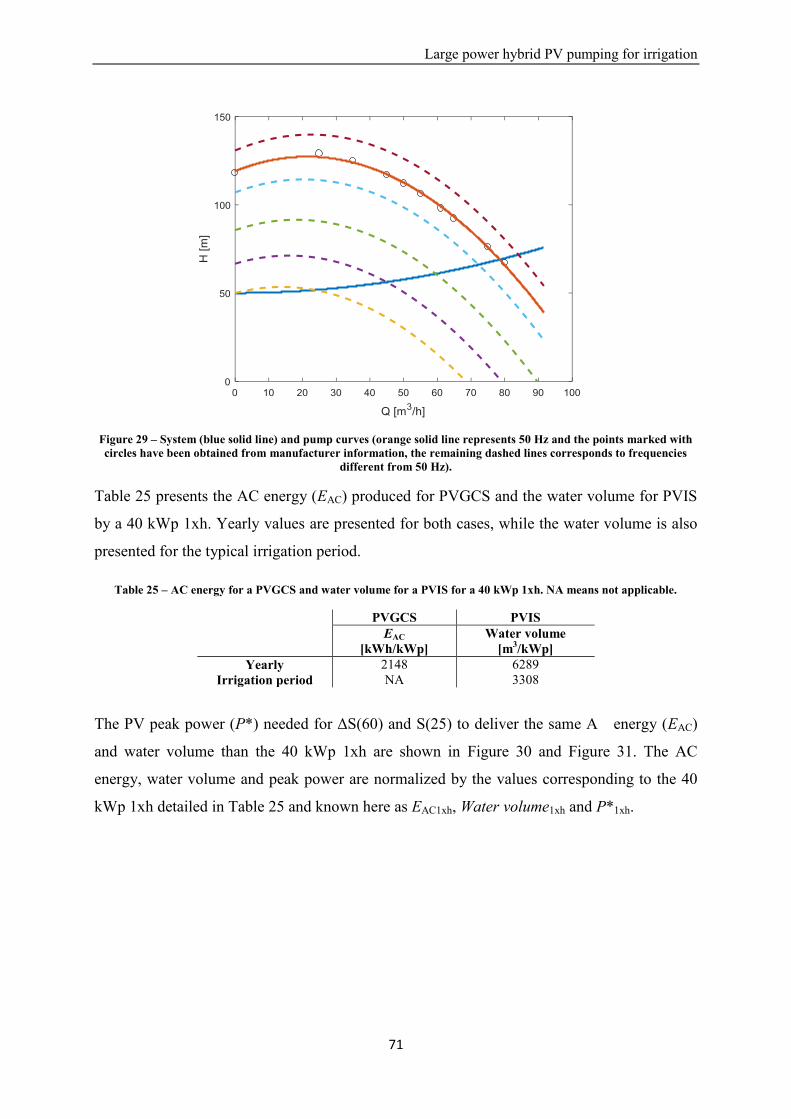
Large power hybrid PV pumping for irrigation
71
Figure 29 – System (blue solid line) and pump curves (orange solid line represents 50 Hz and the points marked with circles have been obtained from manufacturer information, the remaining dashed lines corresponds to frequencies
different from 50 Hz).
Table 25 presents the AC energy (EAC) produced for PVGCS and the water volume for PVIS
by a 40 kWp 1xh. Yearly values are presented for both cases, while the water volume is also
presented for the typical irrigation period.
Table 25 – AC energy for a PVGCS and water volume for a PVIS for a 40 kWp 1xh. NA means not applicable.
PVGCS PVIS
EAC [kWh/kWp]
Water volume [m3/kWp]
Yearly 2148 6289 Irrigation period NA 3308
The PV peak power (P*) needed for ΔS(60) and S(25) to deliver the same A energy (EAC)
and water volume than the 40 kWp 1xh are shown in Figure 30 and Figure 31. The AC
energy, water volume and peak power are normalized by the values corresponding to the 40
kWp 1xh detailed in Table 25 and known here as EAC1xh, Water volume1xh and P*1xh.
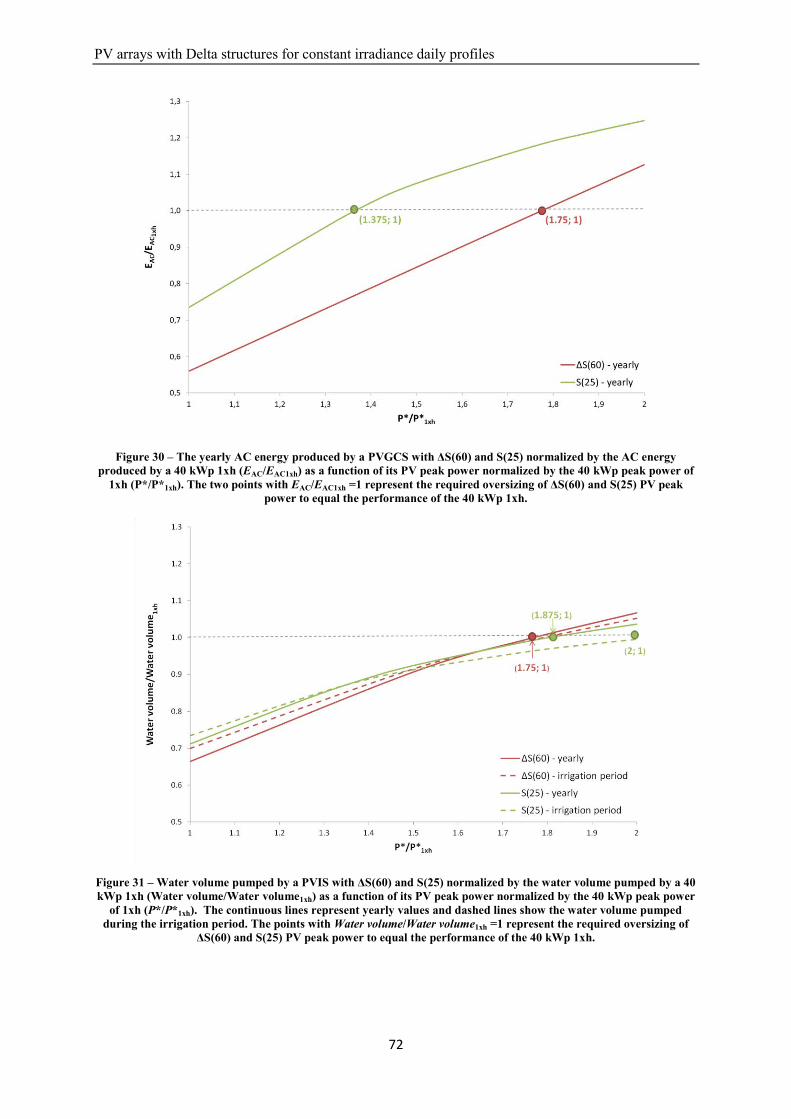
PV arrays with Delta structures for constant irradiance daily profiles
72
Figure 30 – The yearly AC energy produced by a PVGCS with ΔS(60) and S(25) normalized by the AC energy produced by a 40 kWp 1xh (EAC/EAC1xh) as a function of its PV peak power normalized by the 40 kWp peak power of
1xh (P*/P*1xh). The two points with EAC/EAC1xh =1 represent the required oversizing of ΔS(60) and S(25) PV peak power to equal the performance of the 40 kWp 1xh.
Figure 31 – Water volume pumped by a PVIS with ΔS(60) and S(25) normalized by the water volume pumped by a 40 kWp 1xh (Water volume/Water volume1xh) as a function of its PV peak power normalized by the 40 kWp peak power
of 1xh (P*/P*1xh). The continuous lines represent yearly values and dashed lines show the water volume pumped during the irrigation period. The points with Water volume/Water volume1xh =1 represent the required oversizing of
ΔS(60) and S(25) PV peak power to equal the performance of the 40 kWp 1xh.
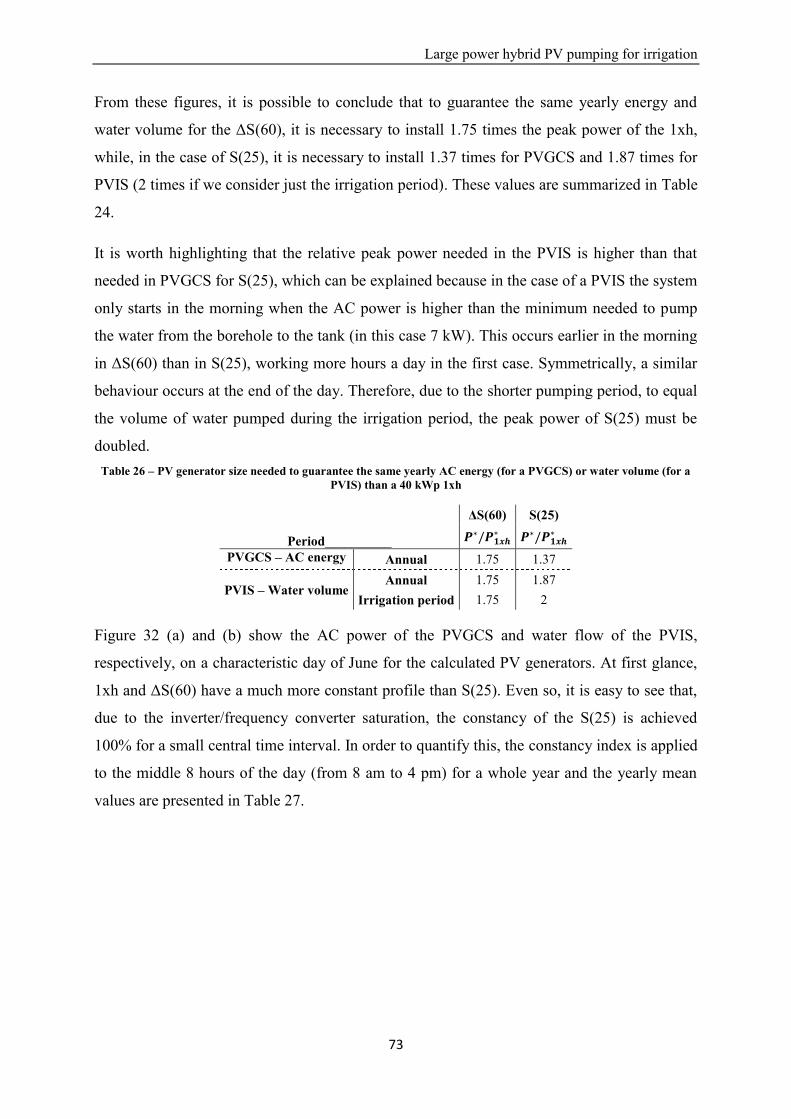
Large power hybrid PV pumping for irrigation
73
From these figures, it is possible to conclude that to guarantee the same yearly energy and
water volume for the ΔS(60), it is necessary to install 1.75 times the peak power of the 1xh,
while, in the case of S(25), it is necessary to install 1.37 times for PVGCS and 1.87 times for
PVIS (2 times if we consider just the irrigation period). These values are summarized in Table
24.
It is worth highlighting that the relative peak power needed in the PVIS is higher than that
needed in PVGCS for S(25), which can be explained because in the case of a PVIS the system
only starts in the morning when the AC power is higher than the minimum needed to pump
the water from the borehole to the tank (in this case 7 kW). This occurs earlier in the morning
in ΔS(60) than in S(25), working more hours a day in the first case. Symmetrically, a similar
behaviour occurs at the end of the day. Therefore, due to the shorter pumping period, to equal
the volume of water pumped during the irrigation period, the peak power of S(25) must be
doubled. Table 26 – PV generator size needed to guarantee the same yearly AC energy (for a PVGCS) or water volume (for a
PVIS) than a 40 kWp 1xh
ΔS(60) S(25)
Period__________
PVGCS – AC energy Annual 1.75 1.37
PVIS – Water volume Annual 1.75 1.87
Irrigation period 1.75 2
Figure 32 (a) and (b) show the AC power of the PVGCS and water flow of the PVIS,
respectively, on a characteristic day of June for the calculated PV generators. At first glance,
1xh and ΔS(60) have a much more constant profile than S(25). Even so, it is easy to see that,
due to the inverter/frequency converter saturation, the constancy of the S(25) is achieved
100% for a small central time interval. In order to quantify this, the constancy index is applied
to the middle 8 hours of the day (from 8 am to 4 pm) for a whole year and the yearly mean
values are presented in Table 27.

PV arrays with Delta structures for constant irradiance daily profiles
74
(a)
(b)
Figure 32 – AC power of PVGCS (a) and water flow of PVIS (b) for a characteristic day of June for the three structures in the study.
0
5
10
15
20
25
30
35
40
0:00 3:00 6:00 9:00 12:00 15:00 18:00 21:00 0:00
PA
C [
kW]
Hour
1xh
ΔS(60)
S(25) - 55 kWp
0
10
20
30
40
50
60
70
80
90
100
0:00 3:00 6:00 9:00 12:00 15:00 18:00 21:00 0:00
Flo
w [
m3/h
]
Hour
1xh
ΔS(60)
S(25) - 75 kWp
S(25) - 80 kWp

Large power hybrid PV pumping for irrigation
75
Table 27 – Yearly mean of the constancy index (kC) applied to AC power of a PVGCS and to water flow for PVIS for the three structures in the study.
ΔS(60) S(25) 1xh
55 kWp 75 kWp 80 kWp PVGCS Yearly mean 0.947 0.743 0.951
PVIS Yearly mean 0.954 0.844 0.956 PVIS Irrigation period 0.987 0.965 0.992
Some interesting results can be elicited from the previous table:
The values of the ΔS(60) and of the 1xh are very similar for both cases, PV S and
PVIS, and higher than the values of S(25).
The constancy index during the irrigation period is always higher than the yearly
mean, which is very interesting from the point of view of a PVIS.
It is also important to note that S(25) is the one which presents the best improvement from
PVGCS to PVIS. This happens because the peak power in the second case is so high that the
frequency converter works in saturation (55 Hz) for most of the day, i.e., delivering its
maximum power constantly. This is also another reason in favour of ΔS(60): with a similar kC
than S(25) (0.987 versus 0.965), ΔS(60) does not expose the borehole to the stress of working
continuously at maximum flow.

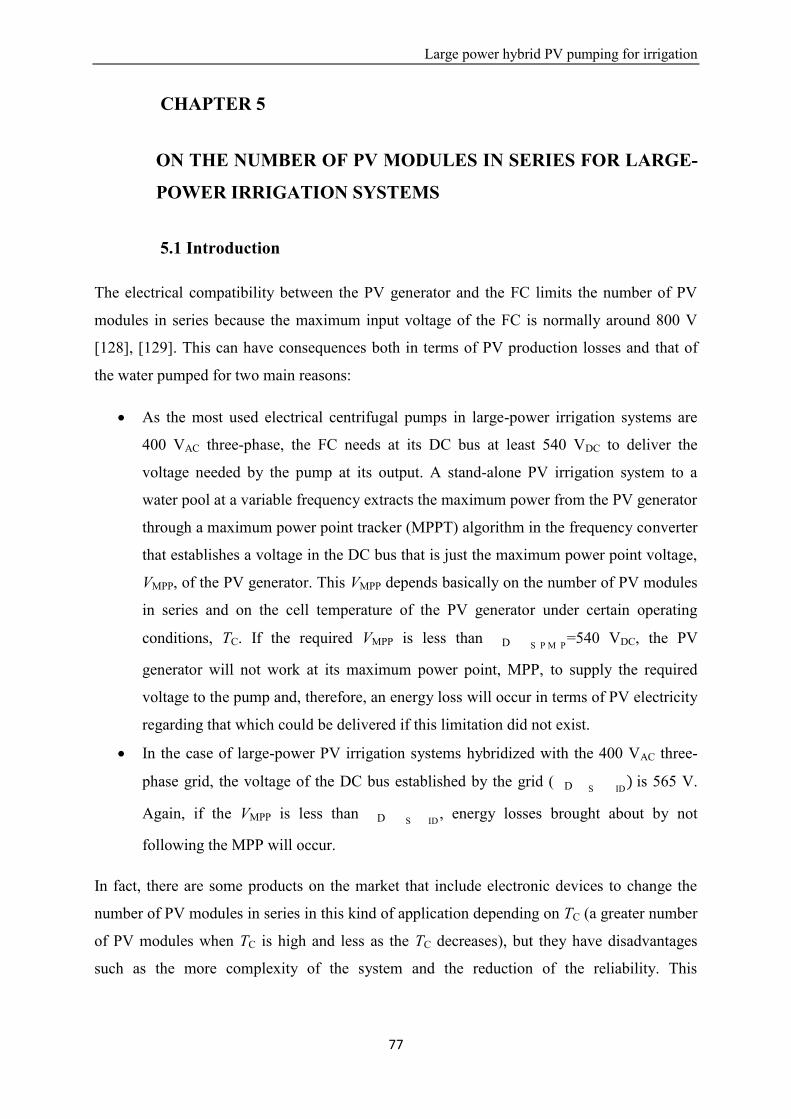
Large power hybrid PV pumping for irrigation
77
CHAPTER 5
ON THE NUMBER OF PV MODULES IN SERIES FOR LARGE-
POWER IRRIGATION SYSTEMS
5.1 Introduction
The electrical compatibility between the PV generator and the FC limits the number of PV
modules in series because the maximum input voltage of the FC is normally around 800 V
[128], [129]. This can have consequences both in terms of PV production losses and that of
the water pumped for two main reasons:
As the most used electrical centrifugal pumps in large-power irrigation systems are
400 VAC three-phase, the FC needs at its DC bus at least 540 VDC to deliver the
voltage needed by the pump at its output. A stand-alone PV irrigation system to a
water pool at a variable frequency extracts the maximum power from the PV generator
through a maximum power point tracker (MPPT) algorithm in the frequency converter
that establishes a voltage in the DC bus that is just the maximum power point voltage,
VMPP, of the PV generator. This VMPP depends basically on the number of PV modules
in series and on the cell temperature of the PV generator under certain operating
conditions, TC. If the required VMPP is less than D S P M P=540 VDC, the PV
generator will not work at its maximum power point, MPP, to supply the required
voltage to the pump and, therefore, an energy loss will occur in terms of PV electricity
regarding that which could be delivered if this limitation did not exist.
In the case of large-power PV irrigation systems hybridized with the 400 VAC three-
phase grid, the voltage of the DC bus established by the grid ( D S ID is 565 V.
Again, if the VMPP is less than D S ID , energy losses brought about by not
following the MPP will occur.
In fact, there are some products on the market that include electronic devices to change the
number of PV modules in series in this kind of application depending on TC (a greater number
of PV modules when TC is high and less as the TC decreases), but they have disadvantages
such as the more complexity of the system and the reduction of the reliability. This

On the number of PV modules in series for large-power irrigation systems
78
complexity is not justified because an in-depth analysis of the actual impact of these losses
has never been carried out.
This chapter analyses and quantifies the PV energy losses in large-power PV irrigation
systems depending on the number of PV modules in series, it discusses whether they are
relevant or not and proposes simple design solutions for those cases in which they are
relevant. The analysis is carried out by taking several factors into account: two different
applications (stand-alone and hybrid PVIS), two the different locations with different ambient
temperatures (Villena and Marrakech), and the different AC voltages required by the pump
(from 400 to 430 V) or supplied by the grid (from 400 to 415 V).
A detailed description of the limitation of the number of the PV modules in series and its
effects on the PV energy losses is made in section 5.2, and the actual impact on the PV
production depending on the number of PV modules is analysed in depth in section 5.3. The
results are discussed in section 5.4 and finally, section 5.5 shows a design of a simple solution
to avoid these losses when it is relevant.
5.2 Limitation of the number of PV modules in series and impact in the
PV irrigation system performance
As a starting point, it is important to answer two main questions: Why is not possible to install
more than a certain number of PV modules in series in large-power PV irrigation systems?
How does this limitation affect PV production?
As regards the former, the root of the limitation is that, in the current state of the art of the
most used FCs, the maximum input voltage that they accept is 800 V [128], [129]. If this
voltage is surpassed, the FC can be damaged and, in any case, the product guarantee is lost.
The open circuit voltage of a PV module under standard test conditions (STC), V*OC, is
typically 36 V or 43 V for 60 solar cells or 72 solar cells PV modules respectively. This V*OC
depends on the temperature of the solar cell, TC, according to the following equation:
(Eq. 33)
where is the temperature of the solar cell at STC (25ºC), is the coefficient of variation
in the voltage with the temperature of the solar cell and is the open circuit voltage under
certain ambient conditions.

Large power hybrid PV pumping for irrigation
79
It is significant to observe that, if we consider that a minimum TC in a certain location can
reach -10ºC at sunrise and a value of β -0.31%/ºC, the corresponding open circuit voltage is
VOC(60cells)= 39.9 V and VOC(72cells)= 47.7 V, which leads to a maximum number of PV
modules in series of NS(60 cells)= 20 and NS(72 cells)= 16. To surpass this number of PV
modules means that the maximum open circuit voltage can be higher than the maximum input
voltage of the FC at certain moments of the year.
The second question is how this limitation can affect the PV production in large-power PVIS.
The most used pumps in this kind of application are three-phase centrifugal ones with 400 V
nominal voltage. The equation that relates the output AC voltage ( A P M P) and the DC bus
voltage ( D S P M P) in an FC is [130]:
D S P M P 1 + 3 32
A P M P (Eq. 34)
So, the required DC bus voltage is D S P M P .
However, if there is an extensive length of wires between the FC and the pump and/or there
are filters between them, the voltage drop must be compensated to allow 400 V at the motor-
pump input, which means that higher voltages at the FC output are needed. Table 28 details
the required values of D S P M Pdepending on the A P M P .
Table 28 – The required values of DC S P Pdepending on ACP P.
ACP P [V] DC S P P [V]
400 540
415 561
430 581
So, in the case of a stand-alone PV irrigation system pumping to a water pool at a variable
frequency, it will be able to track the MPP whenever the corresponding MPP voltage (VMPP) is
higher than the D S P M Pvalues set out in Table 28. But if D S P M P , the DC bus
voltage will remain at D S P M P and will not be that corresponding to the MPP and some
potential PV energy will be wasted.
In the case of large hybrid PV-grid systems, both the PV generator and the three-phase 400 V
grid are connected to the FC input. The grid imposes the DC bus voltage, D S ID , in
accordance with the following equation [131]:
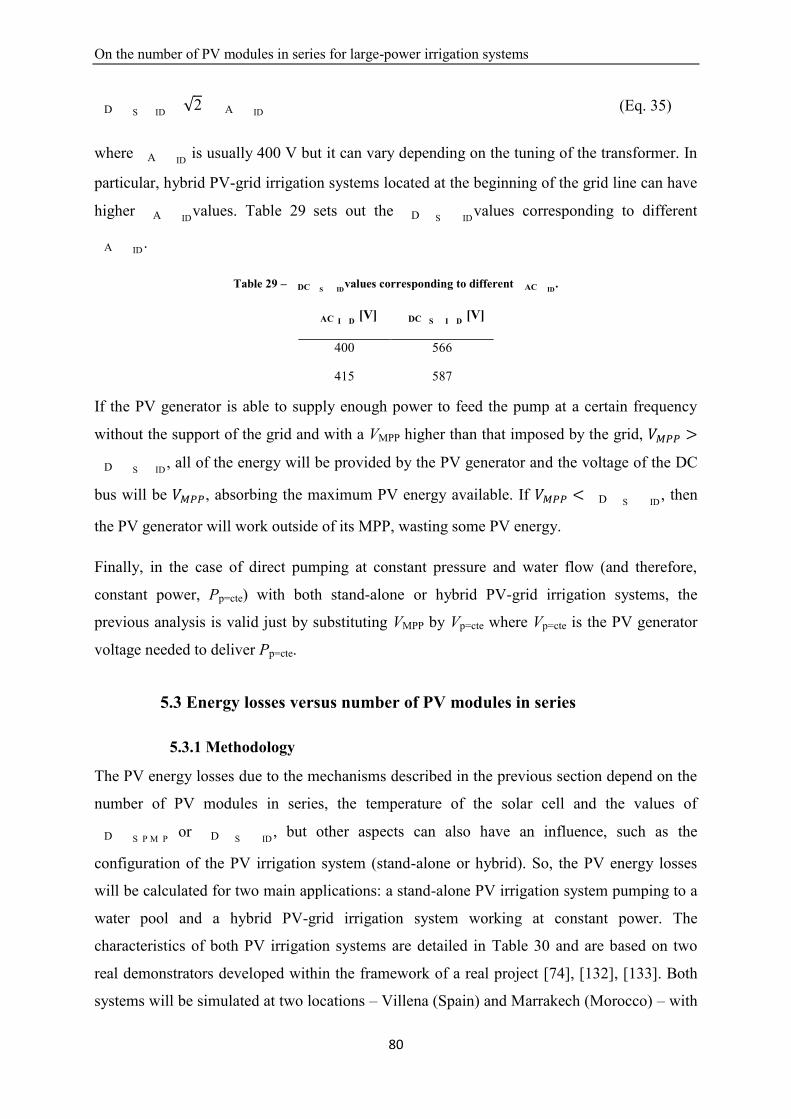
On the number of PV modules in series for large-power irrigation systems
80
D S ID 2 A ID (Eq. 35)
where A ID is usually 400 V but it can vary depending on the tuning of the transformer. In
particular, hybrid PV-grid irrigation systems located at the beginning of the grid line can have
higher A IDvalues. Table 29 sets out the D S IDvalues corresponding to different
A ID .
Table 29 – DC S IDvalues corresponding to different AC ID.
AC I D [V] DC S I D [V]
400 566
415 587
If the PV generator is able to supply enough power to feed the pump at a certain frequency
without the support of the grid and with a VMPP higher than that imposed by the grid,
D S ID , all of the energy will be provided by the PV generator and the voltage of the DC
bus will be , absorbing the maximum PV energy available. If D S ID , then
the PV generator will work outside of its MPP, wasting some PV energy.
Finally, in the case of direct pumping at constant pressure and water flow (and therefore,
constant power, Pp=cte) with both stand-alone or hybrid PV-grid irrigation systems, the
previous analysis is valid just by substituting VMPP by Vp=cte where Vp=cte is the PV generator
voltage needed to deliver Pp=cte.
5.3 Energy losses versus number of PV modules in series
5.3.1 Methodology
The PV energy losses due to the mechanisms described in the previous section depend on the
number of PV modules in series, the temperature of the solar cell and the values of
D S P M P or D S ID , but other aspects can also have an influence, such as the
configuration of the PV irrigation system (stand-alone or hybrid). So, the PV energy losses
will be calculated for two main applications: a stand-alone PV irrigation system pumping to a
water pool and a hybrid PV-grid irrigation system working at constant power. The
characteristics of both PV irrigation systems are detailed in Table 30 and are based on two
real demonstrators developed within the framework of a real project [74], [132], [133]. Both
systems will be simulated at two locations – Villena (Spain) and Marrakech (Morocco) – with
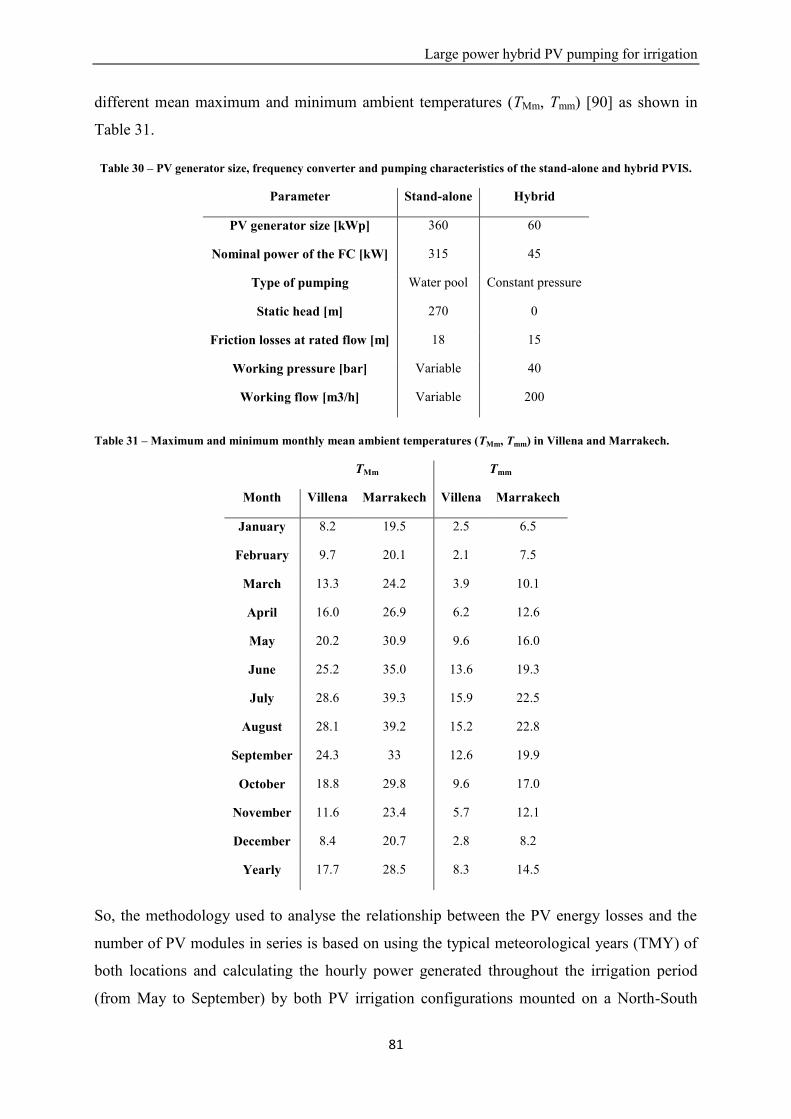
Large power hybrid PV pumping for irrigation
81
different mean maximum and minimum ambient temperatures (TMm, Tmm) [90] as shown in
Table 31.
Table 30 – PV generator size, frequency converter and pumping characteristics of the stand-alone and hybrid PVIS.
Parameter Stand-alone Hybrid
PV generator size [kWp] 360 60
Nominal power of the FC [kW] 315 45
Type of pumping Water pool Constant pressure
Static head [m] 270 0
Friction losses at rated flow [m] 18 15
Working pressure [bar] Variable 40
Working flow [m3/h] Variable 200
Table 31 – Maximum and minimum monthly mean ambient temperatures (TMm, Tmm) in Villena and Marrakech.
TMm Tmm
Month Villena Marrakech Villena Marrakech
January 8.2 19.5 2.5 6.5
February 9.7 20.1 2.1 7.5
March 13.3 24.2 3.9 10.1
April 16.0 26.9 6.2 12.6
May 20.2 30.9 9.6 16.0
June 25.2 35.0 13.6 19.3
July 28.6 39.3 15.9 22.5
August 28.1 39.2 15.2 22.8
September 24.3 33 12.6 19.9
October 18.8 29.8 9.6 17.0
November 11.6 23.4 5.7 12.1
December 8.4 20.7 2.8 8.2
Yearly 17.7 28.5 8.3 14.5
So, the methodology used to analyse the relationship between the PV energy losses and the
number of PV modules in series is based on using the typical meteorological years (TMY) of
both locations and calculating the hourly power generated throughout the irrigation period
(from May to September) by both PV irrigation configurations mounted on a North-South

On the number of PV modules in series for large-power irrigation systems
82
horizontal axis tracker. So, for the two typical series of power, the PV energy losses are
calculated as follows.
In the case of the stand-alone PVIS to a water pool, the PV energy losses are calculated by
integrating the difference in the maximum power that could be generated by the system and
the power that is really being produced due to the limitation of D S P M P , as shown in
Figure 33. The losses will be calculated for 20, 21 and 22 PV modules in series with 60 solar
cells and D S P M P will take the values set out in Table 28.
Figure 33 – P-V curve of the stand-alone PV irrigation system to a water pool. The PV energy losses are calculated integrating along the whole irrigation period the difference of the maximum power that could be generated by the
system and the power that is really producing due to the limitation of DC S P P.
In the case of the hybrid PV-grid irrigation systems, two different types of loss may take
place. The first one is when the PV-power available (PMPP) is higher than the constant power
required by the pump (Pp=cte) but the PV generator voltage needed is less than D S ID . In
this case, the PV generator will only produce the corresponding power at D S ID and the
rest of the power will be supplied by the grid. The PV energy losses are calculated by
integrating the difference between Pp=cte and the PV power at D S ID , as shown in Figure
34 (a).
The second type of loss occurs when the PV-power available is less than Pp=cte. In this case,
the grid is always supplying power and, therefore, imposing the D S ID . So, the PV
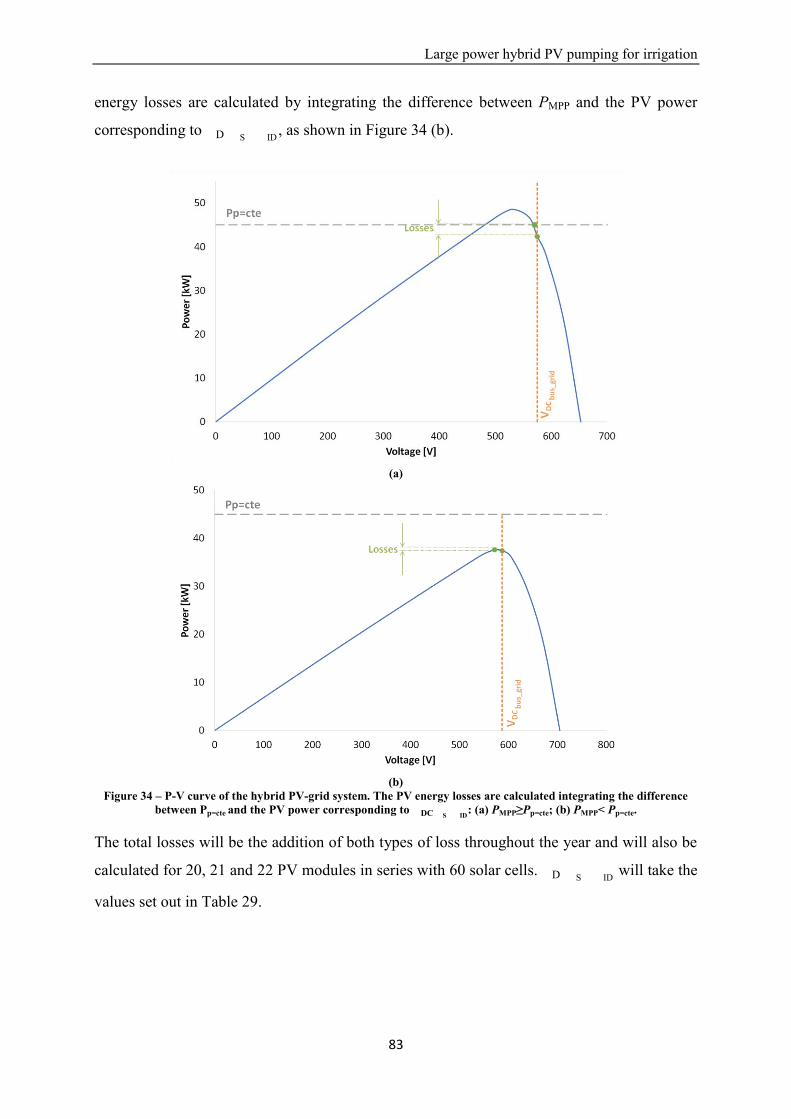
Large power hybrid PV pumping for irrigation
83
energy losses are calculated by integrating the difference between PMPP and the PV power
corresponding to D S ID , as shown in Figure 34 (b).
(a)
(b)
Figure 34 – P-V curve of the hybrid PV-grid system. The PV energy losses are calculated integrating the difference between Pp=cte and the PV power corresponding to DC S ID: (a) PMPP≥Pp=cte; (b) PMPP< Pp=cte.
The total losses will be the addition of both types of loss throughout the year and will also be
calculated for 20, 21 and 22 PV modules in series with 60 solar cells. D S ID will take the
values set out in Table 29.

On the number of PV modules in series for large-power irrigation systems
84
5.3.2 Losses for the stand-alone PV irrigation system to a water pool
Table 32 shows the PV energy losses of the stand-alone PV irrigation system in Villena (Vi)
and Marrakech (Ma) for 20 to 22 PV modules in series and for the three values of D S P M P
in Table 28.
Table 32 – PV energy losses of the stand-alone PV irrigation system in Villena (Vi) and Marrakech (Ma) for 20 to 22 PV modules in series and for the three values of DC S P P.
Losses [%] Number of PV modules 20 21 22
DC S P P [V] Vi Ma Vi Ma Vi Ma 540 0.00 0.29 0.00 0.00 0.00 0.00 561 0.59 2.15 0.00 0.08 0.00 0.00 581 2.88 6.21 0.17 1.25 0.00 0.00
These results show that, if the output of the FC is 400 V (i.e. D S P MP= 541 V), the losses
for both Villena and Marrakech are negligible and do not justify any further action. In the
case of 415 V ( D S P MP= 561 V), the losses are solved with 21 PV modules in series. For
430 V ( D S P M P= 581 V), the losses are practically eliminated with 21 PV modules in
Villena and completely solved in Marrakech with 22 PV modules.
Apart from the losses, another interesting result is the analysis of the occurrence of PV
generator voltages of more than the maximum 800 V allowed at the input of the FC. Figure 35
shows the frequency of occurrence of a Voc greater than this value per hour of the day during
the daytime in the tracker. As expected, most occurrences happen in the morning as a
consequence of the lowest cell temperature at these moments. It is interesting to note that for
22 modules in the coldest place (Villena) there are some days in which the overvoltages do
not disappear.

Large power hybrid PV pumping for irrigation
85
Figure 35 – Frequency of occurrences of hourly Voc>800 V in the N-S structure.
5.3.3 Losses for the hybrid PV-grid irrigation system at constant power
Table 33 shows the PV energy losses of the hybrid PV-grid irrigation system at constant
power in Villena (Vi) and Marrakech (Ma) for 20 to 22 PV modules in series and for the two
values of D S ID in Table 29.
Table 33 – PV energy losses of the hybrid PV-grid irrigation system at constant power in Villena (Vi) and Marrakech (Ma) for 20 to 22 PV modules in series and for the two values of DC S ID.
Losses [%] Number of PV modules 20 21 22
DC S I D [V] Vi Ma Vi Ma Vi Ma 566 0.77 0.88 1.89 1.10 2.52 1.70 587 1.30 4.07 0.87 0.56 2.23 1.03
The results show that, if the grid supplies 400 V (i.e. D S ID= 566 V) for both Villena and
Marrakech, the lowest losses correspond to 20 PV modules in series. In the case of 415 V
(i.e. D S ID=587 V), the losses are reduced, but not eliminated, with 21 PV modules in
series. It is worth noting that the losses increase if the number of PV modules in series
increases to 22. These results may seem surprising and will be discussed in section 4.

On the number of PV modules in series for large-power irrigation systems
86
As the hourly frequency of the open-circuit voltage is the same as in the previous case, the
number of occurrences of overvoltages at the input of the FC will also be very low here
because the optimum configurations are restricted to 20 and 21 PV modules in series.
5.4 Discussion of the results
5.4.1 Stand-alone PV irrigation system to a water pool
The relationship between the PV energy losses and the number of PV modules in series in this
application (Table 32) is as expected:
For the same location, the losses are reduced when increasing the number of PV
modules in series.
For the same number of PV modules in series, the losses increase with the increase in
the temperature of the location.
The most outstanding result is that, if between the FC and the motor-pump there is neither a
long distance nor any filter, that means a voltage drop and the FC output is 400 V (i.e.
D S P M P= 540 V), the PV energy losses are negligible even in locations with very high
temperature such as Marrakech.
If we establish a reasonable allowable value for the losses at 1.25%, the losses are only
relevant when the FC output is 415 V or 430 V (i.e. D S P M P equal to 561 V or 581 V
respectively) and they are solved just by increasing the number of PV modules in series to 21
in both sites.
The solution of 21 PV modules does not merit more action in Marrakech because, as it has
been shown in Figure 35, the number of occurrences of open-circuit voltages of more than
800 V is negligible. In the case of 21 PV modules in Villena, an action to protect the FC input
against overvoltage is necessary, as there are occurrences of open-circuit voltages of more
than 800 V during the irrigation period. A simple and reliable possible solution is described in
section 5.

Large power hybrid PV pumping for irrigation
87
5.4.2 Hybrid PV-grid irrigation system at constant power
The results regarding hybrid PV-grid systems at constant pressure are not so evident and
deserve an explanation. It was already mentioned that the PV energy losses in this system
result from two different mechanisms, depending on whether the PMPP available is higher than
the constant power required by the irrigation system (Pp=cte) or not.
If PMPP>Pp=cte, the losses will occur when the PV generator voltage for Pp=cte, D PV p cte , is less
than D S ID , as shown in Figure 36 (a). It can be noted that these losses can be eliminated
by increasing the number of PV modules in series because D PV p cte D S ID .
If PMPP<Pp=cte,the grid is constantly supplying power and, therefore, imposing the voltage of
the FC DC bus ( D S ID). So, the losses will be the difference between the PMPP and the
power that the PV generator is able to deliver at D S ID . These losses depend on the
difference between D S IDand D PV p cte and can be reduced as well as being increased
when varying the number of PV modules in series, as shown in Figure 36 (b).
(a)

On the number of PV modules in series for large-power irrigation systems
88
(b)
Figure 36 – PV energy losses: (a) Losses when PMPP>Pp=cte occur if the PV generator voltage for Pp=cte,VDCPV p=cte, is less than VDC S ID, and they can be eliminated increasing the number of PV modules in series; (b) Losses when
PMPP<Pp=cte depend on the difference between VDC S ID and VDCPV p=cte and can be reduced but also increased when varying the number of PV modules in series.
To illustrate this, Table 34 shows the breakdown of the losses in these two mechanisms for
the case of D S ID V in Marrakech when increasing the number of PV modules.
Table 34 – PV energy losses of the hybrid PV-grid irrigation system at constant power in Marrakech (Ma) for 20 to 22 PV modules in series.
Number of PV modules in series Losses PMPP> Pp=cte [%]
Losses PMPP< Pp=cte [%]
Total losses [%]
20 2.34 1.73 4.07 21 0.03 0.53 0.56 22 0.00 1.03 1.03
It is confirmed that the losses corresponding to PMPP> Pp=cte are reduced with the number of
PV modules in series. However, in the case of PMPP< Pp=cte the losses are reduced when
increasing the number to 21 PV modules but increase again with 22 PV modules. This
behaviour is reflected in the total losses.
For a better understanding, Figure 37 shows the evolution of the losses throughout the
irrigation period for this case depending on the number of PV modules in series. It can be
clearly observed that while the losses associated to the temperature of the solar cell decreases
with the number of PV modules in series (losses during the hottest months, July and August,
decrease), the losses associated to the D PV p cte is further away from the D S ID increase
(May, June and September).

Large power hybrid PV pumping for irrigation
89
Figure 37 – Evolution of the losses along the year for the case of VDC S ID V for a hybrid PVIS at constant pressure in Marrakech and depending on the number of PV modules.
In conclusion, if the grid supplies 400 V (i.e. D S ID= 566 V), the lowest losses
correspond to 20 PV modules in series, so it makes no sense to increase the number of PV
modules in series. When the grid supplies 415 V (i.e. D S ID= 587 V), the losses are
minimized with 21 PV modules in series.
5.4.3 Summary and generalization of results
In summary, the cases in which it is necessary to reduce the PV energy losses by increasing to
21 PV modules in series are detailed in Table 35 and Table 36 for the stand-alone and hybrid
PV-grid irrigation systems respectively.
Table 35 – Optimum number of PV modules in series to reduce the losses at the FC input for the stand-alone PV irrigation system to a water pool.
Number of PV modules DC S P P Vi Ma
540 20 20 561 20 21 581 21 21

On the number of PV modules in series for large-power irrigation systems
90
Table 36 – Optimum number of PV modules in series to reduce the losses at the FC input for the hybrid PV-grid irrigation at constant power.
Number of PV modules DC S I D Vi Ma
566 20 20 587 21 21
In order to generalize the previous results, the dependency of the losses with the temperature
of the location and with D S ID and with D S P M Phas been analysed.
Figure 38 shows the losses in a stand-alone PV irrigation system to a water pool for
D S P M P= 561 V depending on the temperature. The abscissa axis is expressed in terms of
a temperature offset regarding the yearly mean maximum temperature in Villena (17.7ºC, see
Table 31). As can be seen, a configuration of 21 PV modules in series does not show any
losses until the temperature is increased in 7ºC.
Figure 39 shows the losses again for a stand-alone PV irrigation system to a water pool in
Villena depending on D S P MP . The figure shows that the losses start with D S P M P
values of 550 V and 580 V for 20 and 21 PV modules in series respectively.
Figure 38 – Losses depending on the temperature of the location for a stand-alone PVIS to a water pool. The abscissa
axis is expressed in terms of a temperature offset regarding the yearly mean maximum temperature in Villena.
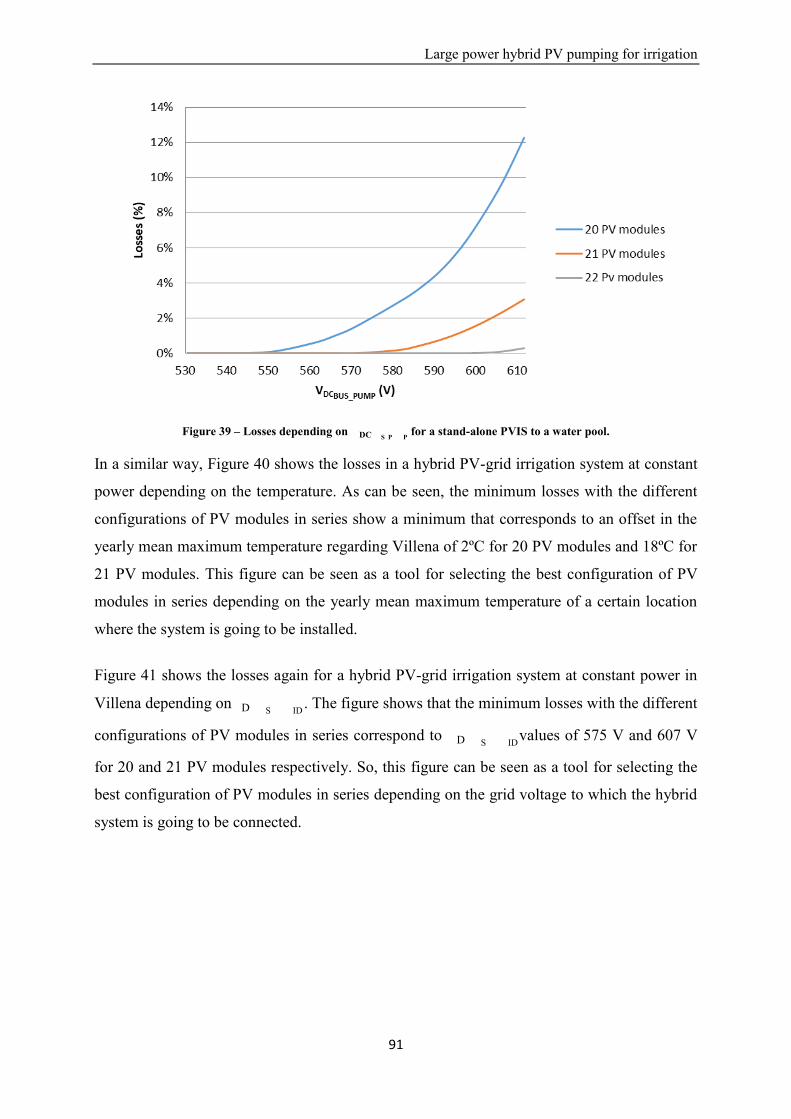
Large power hybrid PV pumping for irrigation
91
Figure 39 – Losses depending on DC S P P for a stand-alone PVIS to a water pool.
In a similar way, Figure 40 shows the losses in a hybrid PV-grid irrigation system at constant
power depending on the temperature. As can be seen, the minimum losses with the different
configurations of PV modules in series show a minimum that corresponds to an offset in the
yearly mean maximum temperature regarding Villena of 2ºC for 20 PV modules and 18ºC for
21 PV modules. This figure can be seen as a tool for selecting the best configuration of PV
modules in series depending on the yearly mean maximum temperature of a certain location
where the system is going to be installed.
Figure 41 shows the losses again for a hybrid PV-grid irrigation system at constant power in
Villena depending on D S ID . The figure shows that the minimum losses with the different
configurations of PV modules in series correspond to D S IDvalues of 575 V and 607 V
for 20 and 21 PV modules respectively. So, this figure can be seen as a tool for selecting the
best configuration of PV modules in series depending on the grid voltage to which the hybrid
system is going to be connected.

On the number of PV modules in series for large-power irrigation systems
92
Figure 40 – Losses in a hybrid PV-grid irrigation system at constant power depending on the temperature. The abscissa axis is expressed in terms of a temperature offset regarding the yearly mean maximum temperature in
Villena.
Figure 41 – Losses for a hybrid PV-grid irrigation system at constant power in Villena depending on DC S ID.

Large power hybrid PV pumping for irrigation
93
5.5 Design of solutions to avoid energy losses
Obviously, the best design solution would be to install the required number of PV modules in
series together with an FC that allows higher voltages at its input, but it is not easy to find this
kind of FC in the market.
Taking into account that the most voltages of more than 800 V are at sunrise, when the VOC is
higher but the PV-power available is very small, a simple, robust and reliable solution could
be to avoid the PV generator being in open circuit by installing a small-power load from the
sunrise till the VOC is less than 800 V. Figure 42 shows a schematic of the solution.
Figure 42 – Proposal of design to avoid overvoltages at the FC input when it is necessary to use 21 PV modules in series.
The concept is that a Programmable Logic Controller, PLC, evaluates the VOC and the PV-
power available, PMPP. From the sunrise, when PMPP is less than that needed to start pumping
and the VOC is more than 800 V, the PLC closes the switch to power the load. This load has
typically 1% of the power of the pump but it is enough to establish an operating voltage of
less than 800 V. Once there is incident irradiance on the PV generator that elevates the solar
cell temperature, the VOC decreases to less than 800 V, and the switch can be opened.
The main advantage of this solution is that it is very reliable and it is not dispersed throughout
the PV generator that, in large sizes, can cover a great area with the associated difficulties in
maintenance. Furthermore, this load could be the air-conditioning system that usually already
exists to control the temperature of the FC box.


Large power hybrid PV pumping for irrigation
95
CHAPTER 6
A NEW PUMP SELECTION METHOD FOR LARGE-POWER
PV IRRIGATION SYSTEMS AT A VARIABLE FREQUENCY
6.1 Introduction
The traditional way of selecting the appropriate pump is just to look for the pump that shows
the highest efficiency just at this duty point (usually at 50 or 60 Hz) [134]. The objective of
the pump selection procedure is to maximize the efficiency, i.e. that the duty point and the
point of maximum efficiency are as close as possible. In fact, professional irrigator
communities, in their maintenance tasks, periodically extract the pump from the well after a
certain number of hours of operation and refurbish the impellers and/or diffusers or replace
them with new ones, in order to increase the efficiency at the duty point even if this means
reducing efficiency at other working points that are not used.
However, this usual way of selecting is not valid for PVIS because they work at different
frequencies [135] and therefore at different working points [48], [54].
This chapter proposes a new way of selecting a pump suitable for PV irrigation applications at
a variable frequency that is based on considering not only the efficiency at the maximum
operating frequency but in the whole range of operating frequencies. This new method also
allows considering pumps that widen the range of operating frequencies and, therefore,
enlarge the daily number of hours of irrigation and increase the volume of water pumped
during low irradiation periods.
As it influences the performance of the system, it not only describes the new method but also
shows how it affects the final performance. For this, the yearly water pumped by two pumps
selected with the traditional method [134] and with the new method proposed here has been
simulated for three locations with different climatic conditions, showing the improvement in
the performance associated to this new pump selection method.
The impact of the way of selecting a pump on the performance of the system is shown for PV
irrigation systems pumping into a water pool but it can also be applied to direct pumping to

A new pump selection method for large-power PV irrigation systems at a variable frequency
96
the irrigation network, which usually is carried out with sprinklers, pivots or drip systems.
Direct pumping requires constant pressure and water flow which also means constant power.
But the reality is that one single irrigation network includes several sectors with different
values of constant pressure and water flow [135]. So, different powers are needed but, in this
case, it does not depend on the instantaneous PV-power available but on the sector being
irrigated [136]. In any case, the pump must also work at different frequencies and working-
points.
This new method has been implemented in SISIFO [75] and this is also shown.
6.2 The traditional pump selection method
The following items need to be considered to select the appropriate pump for an irrigation
system:
The total manometric head (HMT) against which the pump must operate. The HMT is
the addition of the static level of water in the well (Hst), the drawdown of the water
level at a certain water flow, the friction losses in the pipes (Hfriction)and the height of
the water tank (Hpool) (see Figure 43). Hst is the level at which the free water surface is
positioned in the well at zero pump flow. Frequently, Hst plus drawdown is called the
dynamic level of water in the well (Hdyn). Hdyn is the level at which the water is
positioned in the well at a determined flow. The relationship between Hst and Hdyn is a
characteristic of each well and is mainly a function of the nature of the soil and the
water veins contained therein.
The maximum flow rate. This value is usually determined by the well and/or by the
diameter of the pipes of the existing irrigation network.

Large power hybrid PV pumping for irrigation
97
Figure 43 – PV pumping system from a well to a water tank. The figure illustrates the static head (Hst), the drawdown and the head of the water tank, (Hpool). The total manometric head is the addition of Hst, drawdown, Hpool plus the
friction losses.
This information allows the system curve and the duty point to be identified. The "system
curve" is a graphical representation of the relationship between the pumping head, taking into
account the friction losses in the pipes of the irrigation system, and the flow rate. It is
completely independent of the pump characteristics and its basic shape is parabolic. If Hst is
zero, it will start at the point zero water flow (Q) and zero pumping head (H); otherwise the
curve will be vertically offset from the zero to Hst. In a generic system curve this point is
called the “geodetic head” and it represents the height between the water withdrawal point
and the ground.
The duty point is the intersection between the H-Q curve of the pump and the system curve.
Also referred to as the “operating point”, it indicates the values of H and Q that will be
obtained at stationary operation with the respective speed-related pump H-Q curve and it is
defined to be that point in the H-Q curve system for which a pump is to be selected.
In the traditional pump selection method, the objective is to minimize the deviation between
the specified and the actual duty points, and to choose a pump with the best efficiency point
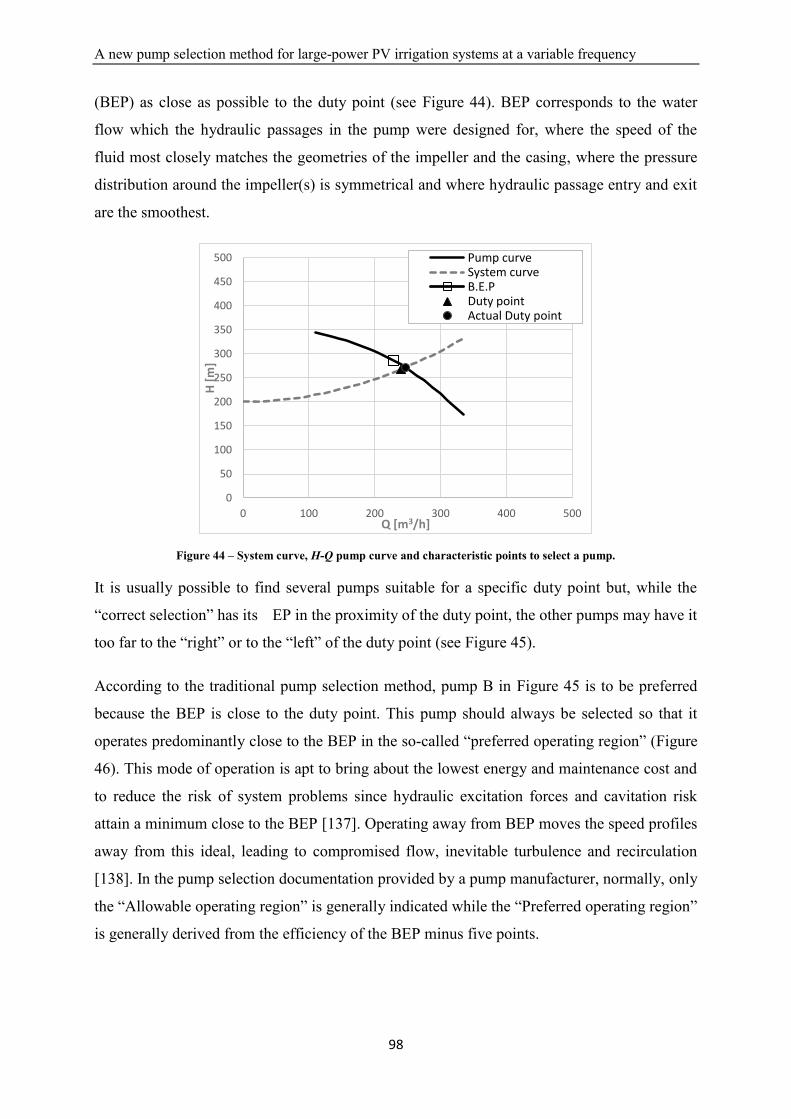
A new pump selection method for large-power PV irrigation systems at a variable frequency
98
(BEP) as close as possible to the duty point (see Figure 44). BEP corresponds to the water
flow which the hydraulic passages in the pump were designed for, where the speed of the
fluid most closely matches the geometries of the impeller and the casing, where the pressure
distribution around the impeller(s) is symmetrical and where hydraulic passage entry and exit
are the smoothest.
Figure 44 – System curve, H-Q pump curve and characteristic points to select a pump.
It is usually possible to find several pumps suitable for a specific duty point but, while the
“correct selection” has its EP in the proximity of the duty point, the other pumps may have it
too far to the “right” or to the “left” of the duty point (see Figure 45).
According to the traditional pump selection method, pump B in Figure 45 is to be preferred
because the BEP is close to the duty point. This pump should always be selected so that it
operates predominantly close to the BEP in the so-called “preferred operating region” (Figure
46). This mode of operation is apt to bring about the lowest energy and maintenance cost and
to reduce the risk of system problems since hydraulic excitation forces and cavitation risk
attain a minimum close to the BEP [137]. Operating away from BEP moves the speed profiles
away from this ideal, leading to compromised flow, inevitable turbulence and recirculation
[138]. In the pump selection documentation provided by a pump manufacturer, normally, only
the “Allowable operating region” is generally indicated while the “Preferred operating region”
is generally derived from the efficiency of the BEP minus five points.
0
50
100
150
200
250
300
350
400
450
500
0 100 200 300 400 500
H [
m]
Q [m3/h]
Pump curve System curve B.E.P Duty point Actual Duty point

Large power hybrid PV pumping for irrigation
99
Figure 45 – Three possible pumps for a certain duty point. Pump A has its BEP too far to the left in respect to the duty point; Pump C has its BEP too far to the right in respect to the duty point. Pump B has the BEP close to the duty
point and the pump would be the selected according to the traditional pump selection method.
Figure 46 – Preferred operating region to bring about the lowest energy and maintenance cost and to reduce the risk of system problems since hydraulic excitation forces and cavitation risk attain a minimum close to the BEP [137].
A pump selected with the duty point in a low water-flow rate range (Pump C) may have
problems due to increased internal turbulence, recirculation, increased pressure fluctuations
and vibrations, increased axial and radial thrust, and rise in temperature due to the high
internal energy loss. On the other hand, pump selected in proximity to the maximum
allowable water-flow rate (Pump A) may have problems of cavitation.
To illustrate this method, let us imagine a case in which it is necessary to pump a water flow
of Q= 227 m3/h from a deep well to a water pool with a total manometric head of 288 m (Hst=
270 m and drawdown plus friction losses of 18 m).
A
B
C
100
150
200
250
300
350
400
450
500
0 100 200 300 400 500
H [
m]
Q [m3/h]
(A) E12S50/12A+MAC12400C-8V
(B) E12S55/9B+MAC12340C-8V
(C) E12S58/7A+MAC12400C-8V
System curve
Duty point
B.E.P point

A new pump selection method for large-power PV irrigation systems at a variable frequency
100
The next step is to use any of the tools that the different pump manufacturers offer to select
the most suitable pump for this duty point. We will use the PumpTutorNG tool, offered by
Caprari [134] but the procedure would be similar with any other tool.
Once the H-Q duty point is introduced, the tool presents the possible pumps that could work
at this point. It can be observed in Figure 47 that the tool itself presents the list of suitable
pumps ordered according to their efficiency, which shows that this is the main criteria when
selecting a pump. In this case, the pump with the best efficiency at this duty point (79.3%) is
the E12S55/9B+MAC12340C-8V model. Figure 48 shows the H-Q curves of the different
possible pumps, in which the one with the best efficiency is highlighted.
Figure 47 – List of the suitable pumps offered by PumpTutorNG tool for the duty point H= 288 m and Q= 227 m3/h.
Figure 48 – H-Q curves of the pumps offered by PumpTutorNG tool for the duty point H= 288 m and Q= 227 m3/h.
There is another pump model with the same high efficiency, E12S55/9Q+M14330-8V but it
demands slightly more power, so from a technical point of view, the final selected pump
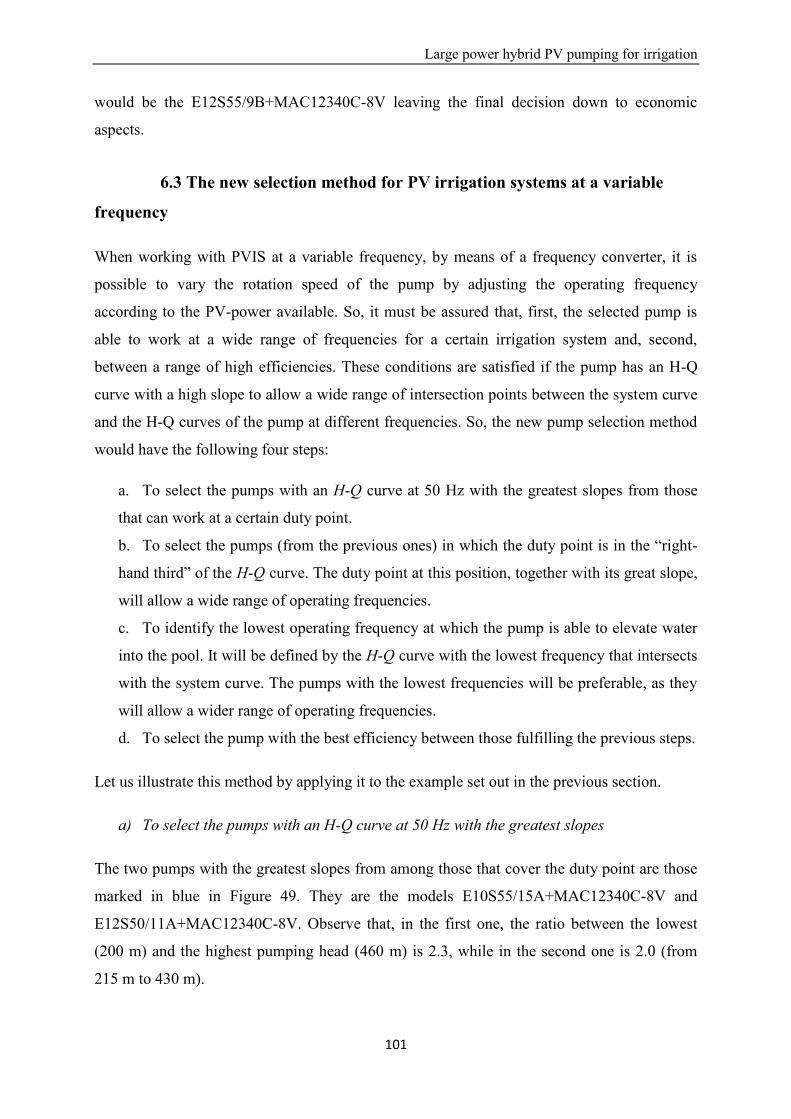
Large power hybrid PV pumping for irrigation
101
would be the E12S55/9B+MAC12340C-8V leaving the final decision down to economic
aspects.
6.3 The new selection method for PV irrigation systems at a variable
frequency
When working with PVIS at a variable frequency, by means of a frequency converter, it is
possible to vary the rotation speed of the pump by adjusting the operating frequency
according to the PV-power available. So, it must be assured that, first, the selected pump is
able to work at a wide range of frequencies for a certain irrigation system and, second,
between a range of high efficiencies. These conditions are satisfied if the pump has an H-Q
curve with a high slope to allow a wide range of intersection points between the system curve
and the H-Q curves of the pump at different frequencies. So, the new pump selection method
would have the following four steps:
a. To select the pumps with an H-Q curve at 50 Hz with the greatest slopes from those
that can work at a certain duty point.
b. To select the pumps (from the previous ones) in which the duty point is in the “right-
hand third” of the H-Q curve. The duty point at this position, together with its great slope,
will allow a wide range of operating frequencies.
c. To identify the lowest operating frequency at which the pump is able to elevate water
into the pool. It will be defined by the H-Q curve with the lowest frequency that intersects
with the system curve. The pumps with the lowest frequencies will be preferable, as they
will allow a wider range of operating frequencies.
d. To select the pump with the best efficiency between those fulfilling the previous steps.
Let us illustrate this method by applying it to the example set out in the previous section.
a) To select the pumps with an H-Q curve at 50 Hz with the greatest slopes
The two pumps with the greatest slopes from among those that cover the duty point are those
marked in blue in Figure 49. They are the models E10S55/15A+MAC12340C-8V and
E12S50/11A+MAC12340C-8V. Observe that, in the first one, the ratio between the lowest
(200 m) and the highest pumping head (460 m) is 2.3, while in the second one is 2.0 (from
215 m to 430 m).

A new pump selection method for large-power PV irrigation systems at a variable frequency
102
(a)
(b)
Figure 49 – Pumps with the highest slope. The E10S55/15A+MAC12340C-8V (a) and E12S50/11A+MAC12340C-8V (b) models show the ratio between the lowest and the highest head of 2.3 and 2.0 respectively.
b) To select the pump with the duty point in the right-hand third of the H-Q curve
Figure 50 shows the H-Q curve of both pumps in detail. They differ slightly in the slope and
the efficiency curve but both of them have the duty point (marked as P1 in Figure 50) in the
right-hand third of the H-Q curve.
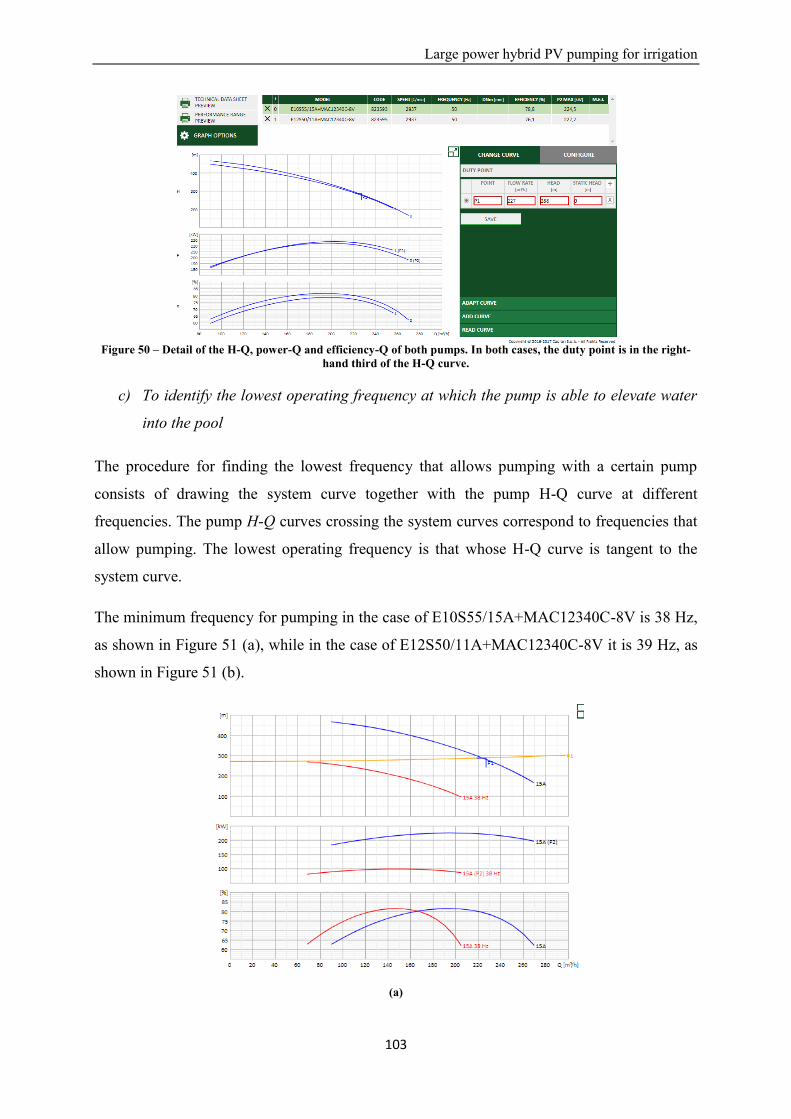
Large power hybrid PV pumping for irrigation
103
Figure 50 – Detail of the H-Q, power-Q and efficiency-Q of both pumps. In both cases, the duty point is in the right-
hand third of the H-Q curve.
c) To identify the lowest operating frequency at which the pump is able to elevate water
into the pool
The procedure for finding the lowest frequency that allows pumping with a certain pump
consists of drawing the system curve together with the pump H-Q curve at different
frequencies. The pump H-Q curves crossing the system curves correspond to frequencies that
allow pumping. The lowest operating frequency is that whose H-Q curve is tangent to the
system curve.
The minimum frequency for pumping in the case of E10S55/15A+MAC12340C-8V is 38 Hz,
as shown in Figure 51 (a), while in the case of E12S50/11A+MAC12340C-8V it is 39 Hz, as
shown in Figure 51 (b).
(a)

A new pump selection method for large-power PV irrigation systems at a variable frequency
104
(b)
Figure 51 – Determination of the lowest operating frequency for the E10S55/15A+MAC12340C-8V pump (a) and the E12S50/11A+MAC12340C-8V pump (b). The values are 38 Hz and 39 Hz respectively.
d) To select the pump with the best efficiency
The efficiency of a pump depends on the operating frequency. So, in order to analyse the
efficiency, it is necessary to evaluate its values at different frequencies. Obviously, in the
design stage, the necessary data to evaluate the energy efficiency are not available. So, for
design purposes, we will evaluate the power efficiency at four different operating frequencies
(maximum, max, minimum, min, and two intermediate frequencies, int1 and int2) and we
define an energy “Irrigation efficiency”, EFFIRR, in accordance with the following equation:
EFFIRR= 0.125 min + 0.125 int1 + 0.25 int2 + 0.50 max (Eq. 36)
Figure 52 (a) and (b) shows the efficiency curves at the aforementioned frequencies for both
pumps. Only the efficiency values for 50 Hz are shown but the procedure is similar for the
rest of the frequencies. By applying Eq. 36, the resulting EFFIRR for both pumps are shown in
Table 37.

Large power hybrid PV pumping for irrigation
105
(a)
(b)
Figure 52 – H-Q, power-Q and efficiency-Q curves at the frequencies used to calculate EFFIRR for the E10S55/15A+MAC12340C-8V pump (a) and the E12S50/11A+MAC12340C-8V pump (b). Only the efficiency values
for 50Hz are shown but the procedure is similar for the rest of the frequencies.

A new pump selection method for large-power PV irrigation systems at a variable frequency
106
Table 37 – Values of the pump efficiency at the four frequencies used to calculate EFFIRR.
E10S55/15A+MAC12340C-8V E12S50/11A+MAC12340C-8V max [%] 79.43 77.13 int2 [%] 81.29 78.53 int1 [%] 79.93 74.87 min [%] 63.18 60.36
EFFIRR [%] 77.93 75.10
According to the results, the selected pump would be the E10S55/15A+MAC12340C-8V with
a EFFIRR of 77.93% and a frequency range from 38 Hz to 50 Hz.
It is interesting to note that the efficiency of the pump selected with the traditional method
(E12S55/9B+MAC12340C-8V) is EFFIRR = 75.01% and the frequency range is from 44 Hz to
50 Hz.
Accordingly, with the new proposed method, the range of working frequencies is higher than
that of the traditional one, and the EFFIRR is also better. Although the pump may work in a
low water-flow region further away from the BEP, the low water-flow problems highlighted
in section 2 are not expected to happen because this condition only occurs for limited periods
at a low rotation speed, at a lower power and with a lower pump operating pressure than at the
duty point. Furthermore, although the duty point in this new method is in the right-hand third
of the pump H-Q curve and, therefore, working at a high-water flow, it is far from the
maximum allowable water flow limit and still within the preferred region of operation. So,
cavitation is not likely to occur. Moreover, the selection of the duty point to the right of the
BEP allows the pump to work at a high efficiency even at reduced frequencies, working at
low efficiency only at extremely low frequencies that occur just for a limited time, in the
start-up phase at sunrise and in the shutdown phase at sunset.
6.4 Pump selection method and PV irrigation system performance
The comparison of the performance of the same PV irrigation system with the two pumps
selected with both the traditional and the proposed method is carried out using the SISIFO
tool [75] with irradiation values for Madrid from the PVGIS database [90].
The main characteristics of the components of the system are summarized in Table 38
together with the main information of the hydraulic system curve. For the PV generator, we
have used the M Prime 3R PLUS of 250 Wp PV modules mounted on a North-South

Large power hybrid PV pumping for irrigation
107
horizontal axis tracker with backtracking to avoid mutual shadows, a ground cover ratio of
1/3 and a maximum rotation angle of 45º.
Table 38 – PV generator size, inverter and pumping characteristics.
Parameter Value/ option PV generator size [kWp] 360
Nominal power of the FC [kW] 315 Type of PV irrigation system Stand-alone
Type of pumping Water pool Static head [m] 270
Friction losses at rated flow [m] 18 Working flow [m3/h] 227
Table 39 details the results of the performance of both pumps, in terms of volume of water per
kWp of nominal power of the PV generator and in terms of the annual efficiency of the pump.
Figure 53 shows the monthly volume of water pumped with both pumps.
Table 39 – Performance and annual efficiency of both pumps, that selected with the new method proposed here and that selected with the traditional method.
Parameter Proposed method E10S55/15A+MAC12340C-8V
Traditional method E12S55/9B+MAC12340C-8V
Performance [m3/kWp] 1779 1476 Annual pump efficiency [%] 78.54 75.27
Figure 53 – Monthly yield with both the proposed pump and the traditional one.
The results show that the proposed pump selection method translates into an increase in the
performance of 20.5%. This increase is basically due to the wider range of operating
frequencies that allows the daily hours of pumping to be expanded and the increase in the
pump efficiency of 4.3%. To illustrate this, Table 40 shows the comparison of the time and
water flow of both pumps at the start, at the duty point and at the end during the characteristic
days of the months of May, June and July. It can be observed that the
E10S55/15A+MAC12340C-8V (Pump A in Table 40) has a longer period of pumping and
higher daily volume of water pumped due to its wider range of operating frequencies.

A new pump selection method for large-power PV irrigation systems at a variable frequency
108
Table 40 – Performance comparison of the pumps selected with the new (Pump A: E10S55/15A+MAC12340C-8V)
and the traditional method (Pump B: E12S55/9B+MAC12340C-8V) in the characteristic days of the months of May,
June and July.
Charac-
teristic
day
Pump
Start Duty point End ΣQ
h Q h Q h Q
[hh:mm] [m3/h] [hh:mm] [m3/h] [hh:mm] [m3/h] [m3]
May A 5:57 91 9:01 – 11:11 219-220 17:59 91 2412
B 6:14 111 9:15 – 10:42 219-220 17:41 111 2287
June A 5:39 91 8:28– 14:40 219-224 18:16 91 2571
B 5:57 111 8:35 – 14:22 219-224 17:58 111 2452
July A 5:41 91 7:55 – 15:31 219-231 18:14 91 2641
B 5:57 111 8:00 – 15:24 219-233 17:58 111 2552
Pump B requires a higher power threshold to start pumping and, therefore, in the one hand,
pump A has a longer daily period of pumping as seen in Table 40, and in the other hand pump
A pumps more water in the winter months with less mean irradiation, as seen in Figure 53.
This is the main reason why pump B has less annual energy efficiency (75.27%) than pump A
(78.54%) even when their power efficiency at the maximum operating frequency are more
similar (pump B: 77.13 % and pump A: 79.43%). These similar efficiency values of at the
maximum operating frequency are also the reason for having similar water flows at the duty
point.
A similar simulation has been performed for Marrakech (Morocco) and Nice (France), two
different locations in terms of latitude, total annual solar radiation and ambient temperature,
both in the Mediterranean zone. The comparative results between pump A and pump B show
an increase in the pumped water of 7.2% for Marrakech and 21.0% for Nice as well as an
increase in the pump efficiency of 4.3% for Marrakech and 5.3% for Nice. These differences
are presented in Table 41 and the variation in the performance is mainly due to the latitude:
the higher the latitude, the higher the increase in the performance. This is due to the North-
South tracker used in large-power PVIS that performs better in winter for latitudes closer to
the equator. This way, the power threshold to elevate water with Pump B is reached more
frequent in winter months in Marrakech but, even in this case, the increased volume of
pumped water is 7.2%.
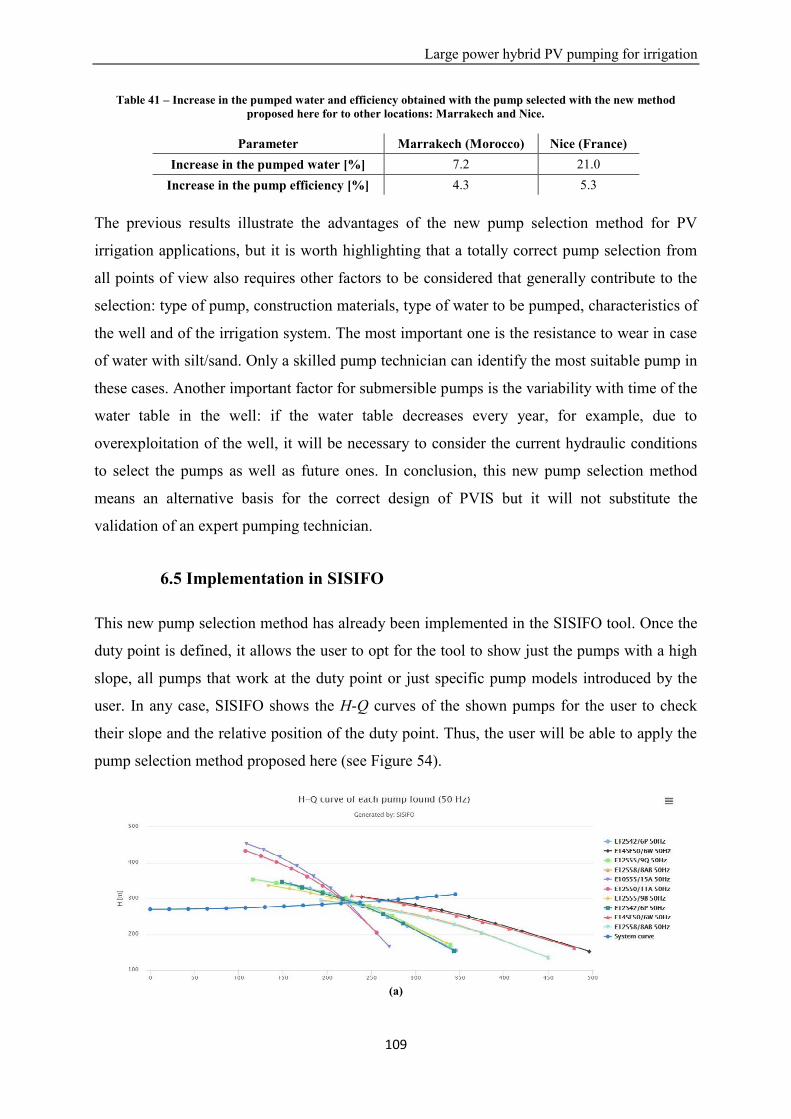
Large power hybrid PV pumping for irrigation
109
Table 41 – Increase in the pumped water and efficiency obtained with the pump selected with the new method proposed here for to other locations: Marrakech and Nice.
Parameter Marrakech (Morocco) Nice (France) Increase in the pumped water [%] 7.2 21.0
Increase in the pump efficiency [%] 4.3 5.3
The previous results illustrate the advantages of the new pump selection method for PV
irrigation applications, but it is worth highlighting that a totally correct pump selection from
all points of view also requires other factors to be considered that generally contribute to the
selection: type of pump, construction materials, type of water to be pumped, characteristics of
the well and of the irrigation system. The most important one is the resistance to wear in case
of water with silt/sand. Only a skilled pump technician can identify the most suitable pump in
these cases. Another important factor for submersible pumps is the variability with time of the
water table in the well: if the water table decreases every year, for example, due to
overexploitation of the well, it will be necessary to consider the current hydraulic conditions
to select the pumps as well as future ones. In conclusion, this new pump selection method
means an alternative basis for the correct design of PVIS but it will not substitute the
validation of an expert pumping technician.
6.5 Implementation in SISIFO
This new pump selection method has already been implemented in the SISIFO tool. Once the
duty point is defined, it allows the user to opt for the tool to show just the pumps with a high
slope, all pumps that work at the duty point or just specific pump models introduced by the
user. In any case, SISIFO shows the H-Q curves of the shown pumps for the user to check
their slope and the relative position of the duty point. Thus, the user will be able to apply the
pump selection method proposed here (see Figure 54).
(a)

A new pump selection method for large-power PV irrigation systems at a variable frequency
110
(b)
Figure 54 – Comparison of the H-Q curves of several possible pumps for a certain duty point as shown by SISIFO – curves at 50 Hz are shown in (a), while the ones at start frequency are in (b). The system curve is also included.
Moreover, SISIFO allows the simulation of the whole PVIS in a certain location with just the
selected pump or with a set of possible pumps for comparing their performance. SISIFO
delivers the total volume of water as output during the whole year or during an irrigation
period defined by the user. It also allows the monthly, daily or hourly water pumped in the
characteristics days of the months of interest to be compared (Figure 55). Thus, from the base
of the proposed pump selection method, fine-tuning of the selection is possible.
(a)
(b)
Figure 55 – Comparison of the volume of water pumped by four possible pumps during (a) the twelve months of a year and (b) during the pumping hours of the characteristic day of July.
The implementation of this method in SISIFO integrates the usefulness of the traditional tools
for selecting pumps, usually offered by pump manufacturers, and the possibility of simulating
the performance of PV irrigation systems by considering the variable water-flow depending
on the PV-power available.

Large power hybrid PV pumping for irrigation
111
CHAPTER 7
CONCLUSIONS AND FUTURE RESEARCH LINES
7.1 Conclusions
The aim of this thesis was the development of technical solutions for the reliable and efficient
performance of large-power PV irrigation systems (PVIS). These technical solutions have
been applied to the design and implementation of two real-scale large-power hybrid PV drip
irrigation systems – a 140 kWp hybrid PV-diesel system in Alter do Chão (Portugal) and a
120 kWp hybrid PV-grid in Tamelalt (Morocco). Both systems were installed in pre-existing
irrigation facilities of ELAIA, which is part of Sovena Group, one of the biggest producers of
olive oil in the world and that has all of the value chain form the cultivation of olive trees till
the commercialization of the olive oil. Accordingly, the systems represent the complexity of
the irrigation infrastructures of modern agro-industries.
The main technical solutions developed included:
a way to solve the problems associated with PV-power intermittences – in the case of
Portugal through tuning procedures in the frequency converter, in the case of
Morocco with the electric hybridization;
the match of PV production and irrigation needs with the use of a North-South
horizontal axis tracker in both systems;
the integration of the PV system into the pre-existing irrigation system – this meant
that a deep understanding of the irrigation system was needed for the correct design of
the system. For example, in Portugal, the irrigation network was designed in such a
way that the number of irrigation hours per day is higher than the number of sun
hours during some months of the year which meant that the best solution is the use of
a hybrid system.
A description of the previous and current systems is carried out for both systems, which can
currently work in three different operating modes: “Only PV”; “Hybrid”; and “Only-
Diesel”/“Only- r id”. Then, a performance analysis of two simulated Scenarios (an Optimistic
and a Pessimistic) is performed. The hybrid systems have been in routine operation since
2016 and two years (2017 and 2018) of full monitoring data are available. These data allowed
Conclusions and future research lines
112
the development of new performance indices in the PV field specifically designed to the
specific characteristics of a PVIS, as well as a technical and economic validation of these
particular systems and of the solution of large-power hybrid PVIS in general.
The following set of indices to evaluate the design and operation of hybrid PV systems were
proposed: the PV share (PVS), the PV performance ratio (PR), and the hydraulic efficiency
(
). Regarding the PVS, a hybrid diesel ratio is defined and a new PVS, the PVSH, is
calculated with the objective of knowing the PV share considering only the “Only PV” and
“Hybrid” modes.
In what concerns the PR, the typical PR of a grid-connected PV system does not allow a full
understanding of a PV irrigation system. This happens since the performance of a PVIS is not
only influenced by the technical quality of the PV system components and by the efficient use
of the available irradiation but by the characteristics of the irrigation system and also external
circumstances influencing a PVIS. For example, the power threshold to start pumping can be
seen as a factor which is a consequence of the irrigation system, while the availability of
water can be seen as an external circumstance.
So, the typical PR is kept but it is factorized in 4 different indicators (PRPV, URIP, URPVIS,
UREF) in order to distinguish the losses corresponding to four different reasons. The first one,
the PRPV, is the one which considers only losses strictly related to the PV system itself. The
URIP is intrinsic to a given crop and gives an idea of the losses associated with the irrigation
period. The URPVIS is intrinsic to the PVIS design (depends on the type of irrigation, the ratio
between the needed and peak power, and on the PV generator structure). Finally, the UREF
gives an idea of the use of the system (it is influenced by the irrigation scheduling in each
month and by the availability of water in the source).
The previous indices were calculated to the two hybrid PV drip irrigation systems. In the case
of Portugal, two external circumstances affect the performance of the system in the full
irrigation campaign of 2017 and in a huge part of the 2018 irrigation campaign. In 2017, a
huge lack of water only allows 94 days of irrigation along the whole irrigation period and
mainly during the night. So, the PVS achieved is 0.49 and the PR during the irrigation period
is 0.16 due to the low UREF (0.29). In 2018, the use of the diesel was higher than initially
expected due to a problem in the fertirrigation system. This problem was solved only in
August and it is interesting to verify that in this month the system worked, on average, 16

Large power hybrid PV pumping for irrigation
113
hours a day (with almost 7 and half hours only with PV, close to the Optimistic Scenario).
The PR during this month was 0.56.
In the case of Morocco, the lack of water affects both years under analysis. The real irrigation
hours were in between the two simulated scenarios. Full data in 2017 was only available from
August to November and the main conclusion is that the PR is lower than expected due to the
lower UREF. In 2018, data is available from February to April and then from July to August.
During this year, and even with the huge lack of water, the PVS is 0.55 and the PR achieves
0.29, with PRPV=0.81, URIP=1, URPVIS=0.99, UREF=0.36.
By comparing the real performance of both systems, it is very interesting to verify the effect
of the type of hybridization in the URPVIS. In the case of Portugal (hydraulic hybridization),
the URPVIS during the irrigation period ranges from 0.59 to 0.75. On the other hand, in the
case of Morocco (electric hybridization), this indicator is higher than 0.97 in all situations.
This happened because the design of the system in the case of the electric hybridization
allows the use of PV energy from sunrise to sunset.
Finally, the economic results of the systems are also very promising: the initial investment
cost of both systems is around 1.2 €/Wp; the payback period is 8.8 years in Portugal and 7 in
Morocco; and the Levelized Cost of Energy is 0.13 €/kWh in Portugal and 0.07 €/kWh in
Morocco, leading to savings in the electricity cost of 61% and 66% respectively.
Furthermore, other contributions to the design of large-power PVIS were developed regarding
the PV generator structure, the electrical design and the selection of the motor-pump: a new
type of structure called Delta was proposed and simulated, the PV energy losses in a PVIS as
a consequence of the number of PV modules in series was quantified, and finally a new pump
selection method for PVIS was developed and applied to a study case.
The main objective of Delta was to achieve constant in-plane irradiance profiles without using
trackers. The electrical mismatching losses were calculated and a yearly mean loss of 2.4%
was obtained. This solution is particularly interesting for PV irrigation systems since it
requires a peak power of less than that needed with the typical static structure oriented to the
Equator: in order to achieve the same water volume than the North-South horizontal axis
tracker, the Delta needs 1.75 the peak power of the tracker, while the static structure oriented
to the Equator requires twice this tracker peak power. Furthermore, the value of a new

Conclusions and future research lines
114
proposed constancy index is as good as that obtained with the tracker – the yearly value
achieves 0.95, reaching 0.99 during the irrigation period.
In what concerns the influence of the number of PV modules in series in large-power PVIS,
the PV energy losses were calculated for strings of 20, 21 and 22 PV modules (for modules of
60 cells), for two different applications (a stand-alone PV irrigation system to a water pool
and hybrid PV-grid system at constant pressure), two different locations (Villena, Spain and
Marrakech, Morocco), and for different AC voltages required by the pump or supplied by the
grid. In the case of the stand-alone system, if there is no AC voltage drop between the FC and
the motor-pump, the losses are null in Villena and negligible in Marrakech. As this voltage
drop increases, the percentage of losses also increases. If it is possible to put more than 20 PV
modules in series these losses can be eliminated but this is limited by the range of voltages
accepted at the FC input. In the case of the hybrid system, the losses cannot be eliminated but
they can be minimized – the best solution is 20 modules in series for a grid voltage of 400 V
and 21 for 415 V. Finally, a generalization of these results is performed through an analysis of
the dependency of the losses with the temperature of the location and with the voltage needed
in the DC bus voltage of the FC. For example, in the case of the stand-alone PVIS with strings
of 20 modules, losses will appear if the DC bus voltage is equal to or higher than 550 V. It is
also important to mention that if more than 20 PV modules in series need to be installed, a
specific design has been proposed to avoid that the voltage at the FC input surpass its
maximum allowed value (800 V).
Regarding the new pump selection method, the traditional way of selecting it just chooses the
one that shows the highest efficiency at 50 or 60 Hz at a certain duty point. This procedure is
not the best one in the case of PVIS working at different frequencies and duty points. So, in
this work, a new pump selection method for large-power PV irrigation is proposed. This
procedure was implemented in SISIFO and a comparison with the pump selected with the
new and the traditional selection method is carried out for three different places in the
Mediterranean zone: Madrid, Marrakech and Nice. The results show an increase in the yearly
volume of water pumped in the range of 7.3-20.5% and an increase in pump efficiency in the
range of 4.3-5.3%.
Large power hybrid PV pumping for irrigation
115
7.2 Future research lines
Finally, some future research lines are proposed: ones related to the proposed indices, others
to the frequency converters and finally some about SISIFO tool.
The new performance indices were proposed and defined to distinguish the losses due to the
different aspects that affect a PVIS. Then, they were applied to the two hybrid systems under
analysis in this document. Results seem promising and conclusions can be drawn from the
obtained values. Although, these indices should be applied to more PV irrigation systems to
obtain typical values and to allow an easy interpretation of the overall performance of PVIS.
For example, in the case of a grid-connected PV system, the expected PR is higher than 0.75.
As more and more PV irrigation systems are installed we should be able to have this kind of
values for each one of the indices proposed here.
In what concerns the FCs, two main issues deserve attention. First, since each FC has its own
programming language, it is difficult to have an updated version of the new developments in
different languages. Accordingly, a high-level programming language, regardless of the
manufacturer, should be developed. Second, the traditional way of auto-tuning the PID
parameters of the FC does not work in PVIS due to the high influence of the dynamic of the
water source and the characteristics of the irrigation network. So, there is the need to find a
way to do the auto-tuning in this kind of application.
Regarding SISIFO, its current version includes the possibility of simulating PV irrigation
systems both to a water pool and direct pumping. However, it does not allow the simulation of
more than one pump at a time. This is quite important and should be one priority since the use
of only one PV generator to fed more than one pump is being used in many installations (as in
the case of the demonstrator of Portugal).
Another drawback that can be seen as future research line is the integration in SISIFO of
hybrid PVIS. Currently, SISIFO only simulates stand-alone PVIS. As it can be seen during
this work, an important part of the market of large-power PVIS will be hybrid ones.
Accordingly, SISIFO should be able to do hybridizations both in the electric and hydraulic
part of the systems, as well as with the national grid and diesel generators. It should be
pointed out that this also means that the irrigation scheduling needs to be added as a new
input in SISIFO. This would open the door to the automatic calculation of the new
performance indices proposed for PVIS.


Large power hybrid PV pumping for irrigation
117
CHAPTER 8
PUBLICATIONS
8.1 International peer reviewed journals
1) L. Narvarte, R.H. Almeida, I.B. Carrêlo, L. Rodriguez, L.M. Carrasco, F. Martínez-
Moreno, On the number of PV modules in series for large-power irrigation systems,
submitted to Energy Conversion and Management.
2) R. H. Almeida, I. B. Carrêlo, E. Lorenzo, L. Narvarte, J. Fernández-Ramos, F.
Martínez-Moreno, L.M. Carrasco, Large-power hybrid PV irrigation: a 140 kW PV-
diesel representative case, submitted to Energies.
3) Giuseppe Todde, Lelia Murgia, Paola A Deligios, Rita Hogan, Isaac Carrêlo, Antonio
Pazzona, Luigi Ledda, Luis Narvarte, Energy and Environmental Performances of
Hybrid Photovoltaic Irrigation Systems in Mediterranean Intensive and Super-
Intensive Olive Orchards, Science of the Total Environment 651, Part 2, 2514-2523,
15 February 2019. DOI: 10.1016/j.scitotenv.2018.10.175
4) R. H. Almeida, J. R. Ledesma, I. B. Carrêlo, L. Narvarte, G. Ferrara, L. Antipodi, A
new pump selection method for large-power PV irrigation systems at a variable
frequency, Energy Conversion and Management, Volume 174, 874-885, 15 October
2018. DOI: 10.1016/j.enconman.2018.08.071
5) L. Narvarte, J. Fernández-Ramos, F. Martínez-Moreno, L.M. Carrasco, R.H.
Almeida, I.B. Carrêlo, Solutions for adapting photovoltaics to large power irrigation
systems for agriculture, Sustainable Energy Technologies and Assessments, Volume
29, 119-130, October 2018. DOI: 10.1016/j.seta.2018.07.004
6) R. H. Almeida, L. Narvarte, E. Lorenzo, PV arrays with delta structures for constant
irradiance daily profiles, Solar Energy, Volume 171, 23-30, September 2018. DOI:
10.1016/j.solener.2018.06.066
7) Giuseppe Todde, Lelia Murgia, Isaac Carrêlo, Rita Hogan, Antonio Pazzona, Luigi
Ledda, Luis Narvarte, Embodied Energy and Environmental Impact of Large-Power
Stand-Alone Photovoltaic Irrigation Systems, Energies, Volume 11, Issue 8, August
2018. DOI: 10.3390/en11082110
8) C. Lorenzo, R. H. Almeida, M. Martínez-Núñez, L. Narvarte, L. M. Carrasco,
Economic assessment of large power photovoltaic irrigation systems in the ECOWAS

Publications
118
region, Energy, Volume 155, 992-1003, 15 July 2018. DOI:
10.1016/j.energy.2018.05.066
8.2 Conference proceedings
1) R. H. Almeida, I.B. Carrêlo, C. Lorenzo, L. Narvarte , Economic validation of large
power PV irrigation systems, 35th EU PVSEC, 24-28 September 2018, Brussels,
Belgium.
2) R. H. Almeida, I.B. Carrêlo, L. Narvarte, J. Fernández-Ramos, F. Martinez-Moreno,
L. M. Carrasco, Main final results of MASLOWATEN - the H2020 project for market
uptake of large power PV irrigation systems, 35th EU PVSEC, 24-28 September 2018,
Brussels, Belgium.
3) R. H. Almeida, I. B. Carrêlo, L. Narvarte, E. Lorenzo, Delta structure for constant
daily power profile in PV irrigation systems, 35th EU PVSEC, 24-28 September 2018,
Brussels, Belgium.
4) I. B. Carrêlo, R. H. Almeida, L. Narvarte, Performance of a 40 kWp PV Irrigation
Demonstrator Combining Variable and Constant Pressure Pumping, 35th EU PVSEC,
24-28 September 2018, Brussels, Belgium.
5) R. H. Almeida, L. García, L. Narvarte, I. B. Carrêlo, F. Martinez-Moreno, L. M.
Carrasco, Sobre el número de módulos fotovoltaicos en serie para aplicaciones de
riego, XVI Congresso Ibérico & XII Congresso Iberoamericano de Energia Solar, 20-
22 June 2018, Madrid, Spain.
6) R. H. Almeida, I. B. Carrêlo, L. Narvarte, E. Lorenzo, Estrutura Delta para sistemas
de irrigação PV, XVI Congresso Ibérico & XII Congresso Iberoamericano de Energia
Solar, 20-22 June 2018, Madrid, Spain.
7) I. B. Carrêlo, R. H. Almeida, L. Narvarte, L. M. Carrasco, F. Martinez-Moreno,
Viabilidade técnica de dois sistemas de irrigação fotovoltaica de alta potência em
Espanha, XVI Congresso Ibérico & XII Congresso Iberoamericano de Energia Solar,
20-22 June 2018, Madrid, Spain.
8) C. Lorenzo, R. H. Almeida, M. Martínez-Nuñez, L. Narvarte, L. M. Carrasco,
Viabilidad Económica de Sistema de Riego Fotovoltaico de Alta Potencia en la
Región de ECOWAS, XVI Congresso Ibérico & XII Congresso Iberoamericano de
Energia Solar, 20-22 June 2018, Madrid, Spain.

Large power hybrid PV pumping for irrigation
119
9) R. H. Almeida, I.B. Carrêlo, L.M. Carrasco, F. Martinez-Moreno & L. Narvarte,
Large-scale hybrid PV-Grid irrigation system, 33rd EU PVSEC, 25-29 September
2017, Amsterdam, Netherlands. DOI: 10.4229/EUPVSEC20172017-6BV.1.26
10) R. H. Almeida, I.B. Carrêlo, F. Martinez-Moreno, L.M. Carrasco & L. Narvarte, A
140 kW hybrid PV-Diesel Pumping system for constant-pressure irrigation, 33rd EU
PVSEC, 25-29 September 2017, Amsterdam, Netherlands. DOI:
10.4229/EUPVSEC20172017-6BV.1.27
11) I.B. Carrêlo, R. H. Almeida, F. Martinez-Moreno, L.M. Carrasco & L. Narvarte, A
160 kWp constant pressure PV Irrigation system in Spain, 33rd EU PVSEC, 25-29
September 2017, Amsterdam, Netherlands. DOI: 10.4229/EUPVSEC20172017-
6BV.1.25
12) I.B. Carrêlo, R. H. Almeida, L.M. Carrasco, F. Martinez-Moreno & L. Narvarte, A
360 kWp PV Irrigation system to a water pool in Spain, 33rd EU PVSEC, 25-29
September 2017, Amsterdam, Netherlands. DOI: 10.4229/EUPVSEC20172017-
6BV.1.24
8.3 Patents
1) J. Fernández-Ramos, L. Narvarte-Fernández, R. Hogan Teves de Almeida, I. Barata
Carrêlo, L. M. Carrasco Moreno, E. Lorenzo Pigueiras, ES2607253B2 -
Procedimiento y dispositivo de control para sistemas de bombeo fotovoltaico,
01/03/2018.
2) J. Fernández-Ramos, L. Narvarte-Fernández, R. Hogan Teves de Almeida, I. Barata
Carrêlo, L. M. Carrasco Moreno, E. Lorenzo Pigueiras, ES2619555B2 - Sistema de
riego por bombeo fotovoltaico hibridado eléctricamente, 19/10/2017.
3) J. Fernández-Ramos, L. Narvarte-Fernández, R. Hogan Teves de Almeida, I. Barata
Carrêlo, L. M. Carrasco Moreno, E. Lorenzo Pigueiras, ES2608527B2 - Sistema de
bombeo fotovoltaico hibridado hidráulicamente con la red eléctrica o con grupos
diésel para aplicaciones de riego, 24/07/2017.
8.4 Other publications during the doctorate not related to the thesis
1) V. Reis, R. H. Almeida, J. A. Silva, M. C. Brito, Demand aggregation for
photovoltaic self-consumption, accepted in Energy Reports.

Publications
120
2) R. H. Almeida, M. C. Brito, A review of technical options for solar charging stations
in Asia and Africa, AIMS Energy, Volume 3, 428-449, 2015. DOI:
10.3934/energy.2015.3.428
3) C. Augusto, R. H. Almeida, S. Mandelli, M.C. Brito, Evaluation of potential of
demand side management strategies in isolated microgrids, 6th International
Conference on Clean Electrical Power, 27-29 June 2017, Santa Margherita Ligure,
Italy. DOI: 10.1109/ICCEP.2017.8004840
4) R. H. Almeida, I. B. Carrêlo, J. Maia Alves, Intelligent Stand Alone Solar Street
Light, 4th Symposium on Small PV Applications, 9-10 June 2015, Munich, Germany.

Large power hybrid PV pumping for irrigation
121
CHAPTER 9
REFERENCES
[1] IRENA, “Renewable Power Generation Costs in 2017,” International Renewable Energy
Agency, Abu Dhabi, 2018.
[2] IRENA, “Renewable capacity statistics 2018,” International Renewable Energy Agency, Abu
Dhabi, 2018.
[3] FAO & GIZ, Prospects for solar-powered irrigation systems (SPIS) in developing countries,
Rome, 2015.
[4] Eurostat, “Agricultural census 2010 - main results,” Eurostat, [Online]. Available:
https://ec.europa.eu/eurostat/statistics-
explained/index.php?title=Agricultural_census_2010_-_main_results. [Accessed 24 09 2018].
[5] D. Zilberman, T. Sproul, D. Rajagopal, S. Sexton and P. Hellegers, “Rising energy prices and
the economics of water in agriculture,” Water Policy, vol. 10, no. 1, pp. 11-21, 2008.
[6] J. Nuncio and C. Arranja, “Regadio: binómio água e energia,” Recursos Hídricos, vol. 38, pp.
17-23, 2017.
[7] J. M. Tarjuelo, J. A. Rodriguez-Diaz, R. Abadía, E. Camacho, C. Rocamora and M. A. Moreno,
“Efficient water and energy use in irrigation modernization: Lessons from Spanish case
studies,” Agricultural Water Management, vol. 162, p. 67*77, 2015.
[8] Instituto para la Diversificación y Ahorro de la Energía (IDAE), “Ahorro y Eficiencia Energética
en Agricultura de Regadío,” Instituto para la Diversificación y Ahorro de la Energía, Madrid,
2005.
[9] I. Fernández García, P. Montesinos, E. Camacho Poyato and J. A. Rodríguez Días, “Energy cost
optimization in pressurized irrigation networks,” Irrigation Science, vol. 34, no. 1, pp. 1-13,
2016.
[10] B. Werner and R. Collins, “Towards efficient use of water resources in Europe,” European
Environment Agency, Copenhagen, 2012.
[11] Institute for European Environmental Policy, London; Polytechnical University of Madrid; and
University of Athens, “The environmental impacts of irrigation in the European Union - A
report to the Environment Directorate of the European Commission,” 2000.
[12] Eurostat, “Agricultural census in Spain,” Eurostat, [Online]. Available:
https://ec.europa.eu/eurostat/statistics-explained/index.php/Agricultural_census_in_Spain.

References
122
[Accessed 25 09 2018].
[13] Eurostat, “Agricultural census in Portugal,” Eurostat, [Online]. Available:
https://ec.europa.eu/eurostat/statistics-
explained/index.php/Agricultural_census_in_Portugal. [Accessed 25 09 2018].
[14] Eurostat, “Share of irrigated areas in UAA by NUTS 2 regions, EU-28 and Norway, 2013,”
Eurostat, [Online]. Available: https://ec.europa.eu/eurostat/statistics-
explained/images/c/c7/Share_of_irrigated_areas_in_UAA_by_NUTS_2_regions%2C_EU-
28_and_NO%2C_2013_%28%25%29.png. [Accessed 24 09 2018].
[15] Eurostat, "Share of irrigable and irrigated areas in UAA, 2013 (%)," Eurostat, [Online].
Available: https://ec.europa.eu/eurostat/statistics-
explained/index.php?title=File:Share_of_irrigable_and_irrigated_areas_in_UAA,_2013_(%25
).png. [Accessed 24 09 2018].
[16] Secretaría General Técnica, Subdirección General de Estadística, Ministerio de Agricultura y
Pesca, Alimentación y Medio Ambiente, “Encuesta sobre superficies y rendimientos de
cultivos: informe sobre regadíos en España,” Ministerio de Agricultura y Pesca, Alimentación
y Medio Ambiente, Madrid, 2017.
[17] I. Fernández García, P. Montesinos, E. Camacho and J. A. Rodriguez Dias, “Medidas para la
mejora de la eficiencia energética en el suministro de agua de riego,” in La gestión integrada
de los recursos hídricos en Andalucía y norte de Marruecos, 2015, pp. 133-151.
[18] FENACORE - Federación Nacional de Comunidades de Regantes de España, “Federación
Nacional de Comunidades de Regantes - Dossier de prensa 2017,” FENACORE, Madrid, 2017.
[19] FAOSTAT, “FAOSTAT - Energy - Percentage of total energy used/production in agriculture and
forestry,” 2009. [Online]. Available: http://www.fao.org/faostat/en/#data/EE. [Accessed 24
09 2018].
[20] Secretaría de Estado de Energía - Ministerio para la Transición Energética, “Estadística de la
Industria de la Energía Eléctrica (datos provisionales a 14/06/2018),” Ministerio para la
Transición Energética, Madrid, 2016.
[21] J. Corominas, “Agua y Energía en el riego, en la época de la sostanibilidad,” Ingeniería del
Agua, vol. 17, no. 3, 2010.
[22] M. Abu-Aligah, “Design of Photovoltaic Water Pumping System and Compare it with Diesel
Powered Pump,” Jordan Journal of Mechanical and Industrial Engineering, vol. 5, no. 3, pp.
273-280, 2011.
[23] R. Langarita, J. Sánchez Chóliz, C. Sarasa, R. Duarte and S. Jiménez, “Electricity costs in
irrigated agriculture: A case study for an irrigation scheme in Spain,” Renewable and
Sustainable Energy Reviews, vol. 68, pp. 1008-1019, 2017.
Large power hybrid PV pumping for irrigation
123
[24] FENACORE, “September Bulletin,” FENACORE, Madrid, 2013.
[25] I. Martins and C. Arranja, “Água e energia no regadio - perspetiva do setor,” 4 12 2014.
[Online]. Available: http://pagina-
web.arbcas.pt/images/DOCUMENTOS/FENAREG_custo_energ_agricultura.pdf. [Accessed 21
9 2018].
[26] FENAREG (Press Release), “Regantes pedem apoios ao investimento em energias limpas -
FENAREG,” 21 05 2018. [Online]. Available: http://www.fenareg.pt/wp-
content/uploads/NOTA-DE-IMPRENSA_FENAREG_21_Maio_2018.pdf. [Accessed 25 09
2018].
[27] J. Nuncio and C. Arranja, “Regadio: água e energia,” in VI Congresso Nacional de Rega e
Drenagem, Beja, 2016.
[28] J. Carroquino, R. Dufo-López and J. L. Barnal-Augustin, “Sizing of off-grid renewable energy
systems for drip irrigation in Mediterranean crops,” Renewable Energy, no. 76, pp. 566-574,
2015.
[29] IRENA, “Solar pumping for irrigation: Improving livelihoods and sustainability,” The
International Renewable Energy Agency, Abu Dhabi, 2016.
[30] FENACORE, “Las tarifas eléctricas del regadío. Cronología, problemática y soluciones,”
FENACORE, 2017.
[31] L. Narvarte, J. Fernández-Ramos, F. Martínez-Moreno, L. M. Carrasco, R. H. Almeida and I. B.
Carrêlo, “Solutions for adapting photovoltaics to large power irrigation systems for
agriculture,” Sustainable Energy Technologies and Assessments, vol. 29, pp. 119-130, 2018.
[32] FAOSTAT, “Total area equipped for irrigation,” FAOSTAT, 2011.
[33] W. Palz, “The French Connection: The rise of the PV water pump,” Refocus: The International
Renewable Energy Magazine, vol. 2, no. 1, pp. 46-47, 2001.
[34] R. Barlow, B. Mc Nelis and A. Derrick, "Solar pumping: an introduction and update on the
technology, performance, costs, and economics (World Bank technical paper number 168),"
World Bank, Washington DC, 1993.
[35] R. V. Enochian, "Solar- and Wind-Powered Irrigation Systems," United States Department of
Agriculture, Washington D.C., 1982.
[36] W. Halcrow, "Small-scale solar-powered irrigation pumping systems - technical and
economical review," World Bank, 1981.
[37] M. N. Bahadori, "Solar Water Pumping," Solar Energy, pp. 307-316, 1978.

References
124
[38] M. C. Fedrizzi and I. L. Sauer, “Bombeamento Solar Fotovoltaico, histórico, características e
projectos,” in Encontro de Energia no Meio Rural, Campinas, 2002.
[39] B. van Campen, D. Guidi and G. Best, “Solar photovoltaics for sustainable agriculture and
rural development,” FAO, Rome, 2000.
[40] M. A. Galdino, “PRODEEM - The Brazilian Programme for Rural Electrification Using
Photovoltaics,” in World Climate & Energy Event, Rio de Janeiro, 2002.
[41] M. C. Fedrizzi, Sistemas fotovoltaicos de abastecimento de água para uso comunitário: lições
apreendidas e procedimentos para potencializar sua difusão, São Paulo: Tese (Doutorado) -
Programa Interunidades de Pós-Graduação em Energia da Universidade de São Paulo, 2003.
[42] M. R. Borges Neto and P. C. M. Carvalho, “Energia solar fotovoltaica no semi-árido: estudo de
caso sobre a atuação do prodeem em Petrolina-PE,” in Proceedings of the 6. Encontro de
Energia no Meio Rural, Campinas, 2006.
[43] Centro de Pesquisa de Energia Elétrica - Cepel, “Energia para as Comunidades Isoladas -
PRODEEM,” Centro de Pesquisa de Energia Elétrica, Brasilia.
[44] A. D. Cota Espericueta, R. E. Foster, M. P. Ross, C. Hanley, V. P. Gupta, O. Montúfar Avilez and
A. R. Paredes Rubio, “Ten-year reliability assessment of photovoltaic water pumping systems
in Mexico,” in Solar 2004, American Solar Energy Society, Portland, Oregon, 2004.
[45] E. Lorenzo Pigueiras, F. Poza Sauro, L. Narvarte Fernández, M. C. Fedrizzi, R. Zilles, M.
Aandam and S. Zaoui, “Boas práticas na implantação de sistemas de bombeamento
fotovoltaico,” Instituto de Energía Solar, Universidad Politécnica de Madrid, Madrid, 2005.
[46] L. Narvarte, F. Poza and E. Lorenzo, “Specification and Testing of PV Pumps for a Moroccan
Project,” Progress in Photovoltaics: Research and Applications, vol. 14, pp. 733-741, 2006.
[47] L. Narvarte and E. Lorenzo, “Sustainability of PV water pumping programmes: 12-years of
successful experience,” Progress in Photovoltaics: Research and applications, vol. 18, pp.
291-298, 2010.
[48] M. A. Abella, E. Lorenzo and F. Chenlo, "PV Water Pumping Systems Based on Standard
Frequency Converters," Prog. Photovolt: Res. Appl., vol. 11, pp. 179-191, 2003.
[49] H. Hartung and L. Pluschke, “The benefits and risks of solar-powered irrigation - a global
overview,” Food and Agriculture Organization of the United Nations and Deutsche
Gesellschaft für Internationale Zusammenarbeit, 2018.
[50] MASLOWATEN, "Technical Specifications for Photovoltaic Irrigation Systems," 2017.
[51] C. Lorenzo, R. H. Almeida, M. Martínez-Núñez, L. Narvarte and L. M. Carrasco, “Economic
assessment of large power photovoltaic irrigation systems in the ECOWAS region,” Energy,

Large power hybrid PV pumping for irrigation
125
vol. 155, pp. 992-1003, 2018.
[52] P. E. Campana, H. Li and J. Yan, “Techno-economic feasibility of the irrigation system for the
grassland and farmland conservation in China: Photovoltaic vs. wind power water pumping,”
Energy Conversion and Management, vol. 103, pp. 311-320, 2015.
[53] X. Gao, J. Liu, J. Zhang, J. Yan, S. Bao, H. Xu and T. Qin, “Feasibility evaluation of solar
photovoltaic pumping irrigation system based on analysis of dynamic variation of
groundwater table,” Applied Energy, vol. 105, pp. 182-193, 2013.
[54] A. U. Brito and R. Zilles, “Systematized Procedure for Parameter Characterization of a
Variable-speed Drive Used in Photovoltaic Pumping Applications,” Progress in Photovoltais:
Research and Application, vol. 14, pp. 249-260, 2006.
[55] L. R. Valler, T. A. Melendez, M. C. Fedrizzi, R. Zilles and A. M. de Moraes, “Variable-speed
drives in photovoltaic pumping systems for irrigation in Brazil,” Sustainable Energy
Technologies and Assessments, vol. 15, pp. 20-26, 2016.
[56] Z. Gao, Y. Zhang, L. Gao and R. Li, "Progress on Solar Photovoltaic Pumping Irrigation
Technology," Irrigation and Drainage, vol. 67, pp. 89-96, 2018.
[57] G. Li, Y. Jin, M. W. Akram and X. Chen, "Research and current status of the solar photovoltaic
water pumping system - A review," Renewable and Sustainable Energy Reviews, vol. 79, pp.
440-458, 2017.
[58] I. Odeh, Y. G. Yohanis and B. Norton, “Economic viability of photovoltaic water pumping
systems,” Solar Energy, vol. 80, pp. 850-860, 2006.
[59] IRENA, “Solar pumping for irrigation: Improving livelihoods and sustainability,” The
International Renewable Energy Agency, Abu Dhabi, 2016.
[60] A. Tiwari and V. Kalamkar, “Effects of total head and solar radiation on the performance of
solar water pumping system,” Renewable Energy, vol. 118, pp. 919-927, 2018.
[61] PoweringAg, “Powering Agriculture: An Energy Grand Challenge for Development (Fact
Sheet),” PoweringAg, 2016.
[62] S. S. Chandel, M. N. Naik and R. Chandel, "Review of performance studies of direct coupled
photovoltaic water pumping systems and case study," Renewable and Sustainable Energy
Reviews, vol. 76, pp. 163-175, 2017.
[63] S. M. Wazed, B. R. Hughes, D. O´Connor and J. K. Calautit, "A review of sustainable solar
irrigation systems for Sub-Saharan Africa," Renewable and Sustainable Energy Reviews, no.
81, pp. 1206-1225, 2018.
[64] V. C. Sontake and V. R. Kalamkar, “Solar photovoltaic water pumping system - A
comprehensive review,” Renewable and Sustainable Energy Reviews, vol. 59, pp. 1038-1067,

References
126
2016.
[65] L. E. Jones and G. Olsson, "Solar Photovoltaic and Wind Energy Providing Water," Global
Challenges, vol. 1, no. 5, 2017.
[66] K. Y. Lau, M. F. M. Yousof, S. N. M. Arshad, M. Anwari and A. H. M. Yatim, “Performance
analysis of hybrid photovoltaic/diesel energy system under Malaysian conditions,” Energy,
vol. 35, pp. 3245-3255, 2010.
[67] EIP Water, "European Innovation Partnership Water - Strategic Implementation Plan,"
Brussels, 2012.
[68] J. Marcos, L. Marroyo, E. Lorenzo, D. Alvira and E. Izco, "Power output fluctuations in large
scale PV plants: one year observations with one second resolution and a derived analytic
model," Progress in Photovoltaics: Research and Applications, vol. 19, pp. 218-27, 2011.
[69] J. Fernández-Ramos, L. Narvarte-Fernández and F. Poza-Saura, “Improvement of
photovoltaic pumping systems based on standard frequency converters,” Solar Energy, vol.
84, no. 1, pp. 101-109, 2010.
[70] J. Zhang, J. Liu, P. E. Campana, R. Zhang, J. Yan and X. Gao, “Model of evapotranspiration and
groundwater level based on photovoltaic water pumping system,” Applied Energy, vol. 136,
pp. 1132-1137, 2014.
[71] Z. A. Firatoglu and B. Yesilata, “New approaches on the optimization of directly coupled PV
pumping systems,” Solar Energy, vol. 77, pp. 81-93, 2004.
[72] O. Deveci, M. Onkol, H. O. Unver and Z. Ozturk, “Design and development of a low-cost solar
powered drip irrigation system using Systems Modeling Language,” Journal of Cleaner
Production, vol. 102, pp. 529-544, 2015.
[73] I. Kougias, S. S., N. Scarlat, F. Monforti, M. Banja, K. Bódis and M. Moner-Girona, “Water-
Energy-Food Nexus Interactions Assessment: Renewable energy sources to support water
access and quality in West Africa,” European Commission, Luxembourg, 2018.
[74] MASLOWATEN, "MASLOWATEN project," 2018. [Online]. Available: www.maslowaten.eu.
[75] Instituto de Energía Solar - Universidad Politécnica de Madrid, “SISIFO - Simulación de
Sistemas Fotovoltaicos,” [Online]. Available: http://sisifo.info.
[76] J. S. Ramos and H. M. Ramos, “Sustainable application of renewable sources in water
pumping systems: Optimized energy system configuration,” Energy Policy, vol. 37, pp. 633-
643, 2009.
[77] A. del Campo García, Las Comunidades de Regantes de España y su Federación Nacional,
Madrid: FENACORE, 2018.

Large power hybrid PV pumping for irrigation
127
[78] A. Closas and E. Rap, “Solar-based groundwater pumping for irrigation: Sustainability,
policies, and limitations,” Energy Policy, vol. 104, pp. 33-37, 2017.
[79] J. Fernandez Ramos, L. Narvarte Fernandez, R. Hogan Teves de Almeida, I. Barata Carrêlo, L.
M. Carrasco Moreno and E. Lorenzo Pigueiras, “Method and control device for photovoltaic
pumping systems”. Spain Patent ES 2 607 253 B2, 1 3 2018.
[80] R. H. Almeida, L. Narvarte and E. Lorenzo, “PV arrays with delta structures for constant
irradiance daily profiles,” Solar Energy, vol. 171, pp. 23-30, 2018.
[81] M. Das and R. Mandal, “A comparative performance analysis of direct, with battery,
supercapacitor, and battery-supercapacitor enabled photovoltaic water pumping systems
using centrifugal pump,” Solar Energy, vol. 171, pp. 302-309, 2018.
[82] F. Fu, D. Feldman, R. Margolis, M. Woodhouse and K. Ardani, “US Solar Photovoltaic system
cost benchmark: Q1 2017,” National Renewable Energy Laboratory, 2017.
[83] Fraunhofer Institute for Solar Energy Systems, “Photovoltaics report,” Fraunhofer ISE,
Freiburg, 2017.
[84] C. Kost, S. Shammugam, V. Jülch, T.-H. Nguyen and T. Schlegl, “Levelized cost of electricity
renewable energy technologies,” Fraunhofer ISE, Freiburg, 2018.
[85] J. Fernandez Ramos, L. Narvarte Fernandez, R. Hogan Teves de Almeida, I. Barata Carrêlo, L.
M. Carrasco Moreno and E. Lorenzo Pigueiras, “Sistema de bombeo fotovoltaico hibridado
hidráulicamente con la red eléctrica o con grupos diésel para aplicaciones de riego”. Spain
Patent ES 2608527 B2, 2017.
[86] J. Fernández-Ramos, L. Narvarte Fernandez, R. Hogan Teves de Almeida, I. Barata Carrêlo, L.
M. Carrasco Moreno and E. Lorenzo Pigueiras, "Sistema de riego por bombeo fotovoltaico
hibridado eléctricamente". Spain Patent ES 2 619 555 B2, 2017.
[87] H. Ammar, A. Melit, M. Adouane and M. T. Bouziane, “Techno-economic evaluation of a
hybrid PV/diesel water pumping system for different pumping heads,” in 3rd International
Renewable and Sustainable Energy Conference, Marrakech, 2015.
[88] Y. Bakelli, B. Gherbi, B. Taghezouit, O. Hazil and H. Mahammed, “Techno-economic
evalualution of different hybrid photovoltaic/diesel pumping systems with water tank
storage,” in 8th International Conference on Modelling, Identification and Control, Algiers,
2016.
[89] E. M. Rogers, Diffusion of Innovations, The Free Press, 1962.
[90] European Commission, Joint Research Centre, “Photovoltaic Geographical Information
System (PVGIS),” [Online]. Available: http://re.jrc.ec.europa.eu/pvgis/.

References
128
[91] U. Jahn, B. Grimmig and W. Nasse, “Analysis of Photovoltaic Systems (Report IEA-PVPS T2-01:
2000),” International Energy Agency, 2000.
[92] J. Leloux, L. Narvarte and D. Trebosc, “Performance Analysis of 10,000 Residential PV
Systems in France and Belgium,” in 26th European Photovoltaic Solar Energy Conference and
Exhibition, Hamburg, 2011.
[93] N. H. Reich, B. Mueller, A. Armbruster, W. van Sark and C. Reise, “Performance ratio
revisited: is PR > 90% realistic?,” Progress in Photovoltaics - Special Issue: 26th EU PVSEC,
Hamburg, Germany 2011, vol. 20, no. 6, pp. 717-726, 2012.
[94] Instituto Português do Mar e da Atmosfera, "Situação de Seca Meteorológica - 31 de outubro
de 2017 (in Portuguese)," IPMA, Lisbon, 2017.
[95] J. Rockström, L. Karlberg, S. P. Wani, J. Barron, N. Hatibu, T. Oweis, A. Bruggeman, J. Farahani
and Z. Qiang, “Managing water in rainfed agriculture - The need for a paradigm shift,”
Agricultural Water Management, no. 97, pp. 543-550, 2010.
[96] F. Crundwell, Finance for Engineers, London: Springer-Verlag London Limited, 2008.
[97] B. I. Ouedraogo, S. Kouame, Y. Azoumah and D. Yamegueu, “Incentives for rural off grid
electrification in Burkina Faso using LCOE,” Renewable Energy, no. 78, pp. 573-582, 2015.
[98] K. Branker, M. Pathak and J. Pearce, “A review of solar photovoltaic levelized cost of energy,”
Renewable and Sustainable Energy Reviews, no. 15, pp. 4470-4482, 2011.
[99] Trading Economics, “Portugal Inflation Rate,” Trading Economics, [Online]. Available:
https://tradingeconomics.com/portugal/inflation-cpi. [Accessed 10 10 2018].
[100] Trading Economics, “Portugal Interest Rate,” Trading Economics, [Online]. Available:
https://tradingeconomics.com/portugal/interest-rate. [Accessed 10 10 2018].
[101] Trading Economics, “Morocco Inflation Rate,” Trading Economics, [Online]. Available:
https://tradingeconomics.com/morocco/inflation-cpi. [Accessed 10 10 2018].
[102] Trading Economics, “Morocco Interest Rate,” Trading Economics, [Online]. Available:
https://tradingeconomics.com/morocco/interest-rate. [Accessed 10 10 2018].
[103] J. Remund, C. Calhau, L. Perret and D. Marcel, “Characterization of the spatio-temporal
variations and ramp rates of solar radiation and PV,” Internation Energy Agency -
Photovoltaic Power Systems Programme, 2015.
[104] G. Litjens, E. Worrell and W. van Sark, “Influence of demand patterns on the optimal
orientation of photovoltaic systems,” Solar Energy, vol. 155, pp. 1002-1014, 2017.
[105] E. Luiz, F. Martins, A. Gonçalves and E. Pereira, “Analysis of intra-day solar irradiance

Large power hybrid PV pumping for irrigation
129
variability in different Brazilian climate zones,” Solar Energy, vol. 167, pp. 210-219, 2018.
[106] J. Munoz, J. Carrillo, F. Martínez-Moreno, L. Carrasco and L. Narvarte, "Modeling and
simulation of large PV pumping systems," in Proceedings of the 31th European Photovoltaic
Solar Energy Conference and Exhibition, Hamburg, 2015.
[107] O. Vilela, N. Fraidenraich and C. Tiba, “Photovoltaic pumping systems driven by tracking
collectors. Experiments and simulation,” Solar Energy, vol. 74, no. 1, pp. 45-52, 2003.
[108] L. Narvarte and E. Lorenzo, “Tracking and ground cover ratio,” Progress in Photovoltaics.
Research and Applications, vol. 16, no. 8, pp. 703-714, 2008.
[109] Z. Lan and G. Tie Yu, “Performance and reliability of tracker and fixed-tilt mounting systems,”
PV- Tech Power, vol. 1, 2015.
[110] J. Shingleton, “One-Axis Trackers - Improved reliability, durability, performance and cost
reduction,” Subcontract Report NREL/SR-520-42769 NREL, 2008.
[111] R. Bruno, P. Bevilacqua, L. Longo and N. Arcuri, “Small Size Single-axis PV Trackers: Control
Strategies and System Layout for Energy Optimization,” Energy Procedia, vol. 82, pp. 737-
743, 2015.
[112] GmbH, G.C.G., “Manuals and Tools for Promoting SPIS - Workshop "Promotion of Solar-
Powered Irrigation Systems (SPIS)" - minutes of the workshop,” GFA, GIZ, Eschborn, 2015.
[113] W. Nsengiyumva, S. Chen, L. Hu and X. Chen, “Recent advancements and challenges in Solar
Tracking Systems (STS): A review,” Renewable and Sustainable Energy Reviews, vol. 81, pp.
250-279, 2018.
[114] R. Velik, “East-South-West orientation of PV systems and neighbourhood energy exchange to
maximize local photovoltaics energy consumption,” International Journal of Renewable
Energy Research , vol. 4, no. 3, 2014.
[115] H. Ruf, “Limitations for the feed-in power of residential photovoltaic systems in Germany -
An overview of the regulatory framework,” Solar Energy, vol. 159, pp. 588-600, 2018.
[116] G. Barbose, R. Wiser and M. Bolinger, “Case studies of state support for renewable energy -
Designing PV incentive programs to promote performance: a review of current practice.,”
Final report under Task2 of MPO No. DEK-6-66278-01., 2006.
[117] D. Panico, P. Garvison, H. Wenger and D. Shugar, “Backtracking: a novel strategy for tracking
PV systems,” in 22nd IEEE Photovoltaic Specialists Conference, Las Vegas, 1991.
[118] E. Lorenzo, L. Narvarte and J. Munoz, “Tracking and back-tracking,” Progress in Photovoltaics:
research and Application, vol. 19, no. 6, pp. 474-753, 2011.

References
130
[119] D. Erbs, S. Klein and J. Duffie, “Estimation of the diffuse radiation fraction for hourly, daily
and monthly-average global radiation,” Solar Energy, vol. 28, no. 4, pp. 293-302, 1982.
[120] M. Collares-Pereira and A. Rabl, “The average distribution of solar radiation-correlations
between diffuse and hemispherical and between daily and hourly insolation values,” Solar
Energy, vol. 22, no. 2, pp. 155-164, 1979.
[121] R. Perez, R. Stewart, C. Arbogast, R. Seals and J. Scott, “An anisotropic hourly diffuse
radiation model for sloping surfaces: Description, performance validation, site dependency
evaluation,” Solar Energy, vol. 36, no. 6, pp. 481-497, 1986.
[122] F. Martínez-Moreno, J. Muñoz and E. Lorenzo, “Experimental model to estimate shading
losses on PV arrays,” Solar Energy Materials and Solar Cells, vol. 94, no. 12, pp. 2298-2303,
2010.
[123] I. de la Parra, M. Muñoz, E. Lorenzo, M. García, J. Marcos and F. Martínez-Moreno, “PV
performance modelling: A review in the light of quality assurance for large PV plants,”
Renewable and Sustainable Energy Reviews, vol. 78, pp. 780-797, 2017.
[124] M. Fuentes, G. Nofuentes, J. Aguilera, D. Talavera and M. Castro, “Application and validation
of algebraic methods to predict the behaviour of crystalline silicon PV modules in
Mediterranean climates,” Solar Energy, vol. 81, no. 11, pp. 1396-1408, 2007.
[125] E. Caamaño, E. Lorenzo and C. Lastres, “Crystalline silicon photovoltaic modules:
Characterization in the field of rural electrification.,” Progress in Photovoltaics: Research and
Applications, vol. 10, no. 7, pp. 481-493, 2002.
[126] IEC-60891:2009, “Photovoltaic devices - Procedures for temperature and irradiance
corrections to measured I-V characteristics,” IEC, 2009.
[127] M. Jantsch, H. Schmidt and J. Schmid, “Results of the concerted action on power
conditioning and control,” in 11th Photovoltaic Solar Energy Conference, Montreux, 1992.
[128] OMRON, “RX-series Variable Frequency Drives,” [Online]. Available:
https://assets.omron.eu/downloads/datasheet/en/v4/i116e_rx-
series_variable_frequency_drives_datasheet_en.pdf. [Accessed 24 7 2018].
[129] Grundfos, “Grundfos RSI - AC drives: Installations and operating instructions,” 2016.
[130] E. Lorenzo, Electricidad solar fotovoltaica, volumen III: ingeniería fotovoltaica, Sevilla:
Progensa, 2014.
[131] A. E. Fitzgerald, C. Kingsley and S. D. Umans, Electric Machinery, sixt edition, New York:
McGraw-Hill, 2003.
[132] I. B. Carrêlo, R. H. Almeida, L. M. Carrasco, F. Martínez-Moreno and L. Narvarte, “A 360 kWp
PV irrigation system to a water pool in Spain,” in 33rd European Photovotaic Solar Energy

Large power hybrid PV pumping for irrigation
131
Conference and Exhibition, Amsterdam, 2017.
[133] R. H. Almeida, I. B. Carrêlo, L. M. Carrasco, F. Martínez-Moreno and L. Narvarte, “Large-scale
hybrid PV-Grid irrigation system,” in 33rd European Photovotaic Solar Energy Conference and
Exhibition, Amsterdam, 2017.
[134] Caprari, “iPump - Caprari,” Caprari, [Online]. Available: https://ipump.caprarinet.net.
[Accessed 2018].
[135] I. B. Carrêlo, R. H. Almeida, F. Martínez-Moreno, L. M. Carrasco and L. Narvarte, “A 160 kWp
constant pressure PV Irrigation system in Spain,” in 33rd European Photovotaic Solar Energy
Conference and Exhibition, Amsterdam, 2017.
[136] R. H. Almeida, I. B. Carrêlo, L. Narvarte, J. Fernández-Ramos, F. Martinez-Moreno and L. M.
Carrasco, “Main final results of MASLOWATEN - the H2020 project for market uptake of large
power PV irrigation systems,” in 35th European Photovoltaic Conference and Exhibition,
Brussels, 2018.
[137] J. F. Gülich, Centrifugal Pumps, Springer, 2010.
[138] E. Larralde and R. Ocampo, "Centrifugal pump selection process," World Pumps, pp. 21-28,
2010.
Related Documents