Flow, Turbulence and Combustion manuscript No. (will be inserted by the editor) Large Eddy Simulation of a Controlled Diffusion Compressor Cascade W.A.McMullan · G.J. Page Received: date / Accepted: date Abstract In this research a Controlled Diffusion (CD) compressor cascade stator blade is simulated at a Reynolds number of ∼ 700, 000, based on inflow velocity and chord length, using Large Eddy Simulation (LES). A wide range of flow inlet angles are computed, includ- ing conditions near the design angle, and at high negative and positive incidence. At all inlet angles the surface pressure distributions are well-predicted by the LES. Near the design an- gle the computed suction side boundary layer thickness agrees well with experimental data, whilst the pressure side boundary layer is poorly predicted due to the inability of LES to capture natural boundary layer transition on the present grid. A good estimation of the loss is computed near the design angle, whilst at both high positive and negative incidences the loss is less well predicted owing to discrepancies between the computed and experimental boundary layer thickness. At incidences above the design angle a laminar separation bubble forms near the leading edge of the suction surface, which undergoes a transition to tur- bulence. Similar behaviour is noted on the pressure surface at negative incidence. At high negative incidence contra-rotating vortex pairs are found to form around the leading edge in The authors would like to thank Rolls-Royce plc and the UK Technology Strategy Board for the funding this work under the CFMS Core Programme (TP/L3001H). The simulations in this study were performed on HECToR, the UK National Supercomputing Facility, under the UKAAC-2 Framework, EPSRC grant number EP/F005954/1. W.A. McMullan Department of Aeronautical & Automotive Engineering Loughborough University Loughborough Leicestershire LE11 3TU United Kingdom Present address: Dept. of Engineering, University of Leicester, University Road, Leicester, LE1 7RH. E-mail: [email protected] G. J. Page Department of Aeronautical & Automotive Engineering Loughborough University Loughborough Leicestershire LE11 3TU United Kingdom

Welcome message from author
This document is posted to help you gain knowledge. Please leave a comment to let me know what you think about it! Share it to your friends and learn new things together.
Transcript
Flow, Turbulence and Combustion manuscript No.(will be inserted by the editor)
Large Eddy Simulation of a Controlled Diffusion CompressorCascade
W.A.McMullan · G.J. Page
Received: date / Accepted: date
Abstract In this research a Controlled Diffusion (CD) compressor cascade stator blade issimulated at a Reynolds number of ∼ 700,000, based on inflow velocity and chord length,using Large Eddy Simulation (LES). A wide range of flow inlet angles are computed, includ-ing conditions near the design angle, and at high negative and positive incidence. At all inletangles the surface pressure distributions are well-predicted by the LES. Near the design an-gle the computed suction side boundary layer thickness agrees well with experimental data,whilst the pressure side boundary layer is poorly predicted due to the inability of LES tocapture natural boundary layer transition on the present grid. A good estimation of the lossis computed near the design angle, whilst at both high positive and negative incidences theloss is less well predicted owing to discrepancies between the computed and experimentalboundary layer thickness. At incidences above the design angle a laminar separation bubbleforms near the leading edge of the suction surface, which undergoes a transition to tur-bulence. Similar behaviour is noted on the pressure surface at negative incidence. At highnegative incidence contra-rotating vortex pairs are found to form around the leading edge in
The authors would like to thank Rolls-Royce plc and the UK Technology Strategy Board for the fundingthis work under the CFMS Core Programme (TP/L3001H). The simulations in this study were performed onHECToR, the UK National Supercomputing Facility, under the UKAAC-2 Framework, EPSRC grant numberEP/F005954/1.
W.A. McMullanDepartment of Aeronautical & Automotive EngineeringLoughborough UniversityLoughboroughLeicestershireLE11 3TUUnited KingdomPresent address: Dept. of Engineering, University of Leicester, University Road, Leicester, LE1 7RH. E-mail:[email protected]
G. J. PageDepartment of Aeronautical & Automotive EngineeringLoughborough UniversityLoughboroughLeicestershireLE11 3TUUnited Kingdom

2
response to an unsteady stagnation line across the span of the blade. Such structures are notapparent in time-averaged statistical data due to their highly-transient nature.
Keywords Large Eddy Simulation · Compressor · Transition · Vortex Structure
1 Introduction
In recent years the design of gas turbine compressor components has been complementedby the emergence of Computational Fluid Dynamics (CFD) in the design process. In a de-sign context CFD must be capable of producing accurate flow solutions within a very stricttimeframe, and this has limited the CFD techniques used in the design process to Reynolds-Averaged Navier-Stokes (RANS) methods. As the desire for more efficient gas turbines and,in particular, civilian aircraft engines becomes an increasing focus of research, the marginsfor improvements in efficiency through design advances have become increasingly small. Inorder to further understand the physical processes which lead to loss in turbomachinery de-signs a computational method that offers both a high spatial resolution and time-accurate de-scription of the flow is required. Whilst fully-resolved Direct Numerical Simulation (DNS)will remain limited to moderate Reynolds number flows in simple geometries for the fore-seeable future [1], [2], advances in modern super-computing power have made both LargeEddy Simulation (LES) and Detached Eddy Simulation (DES) viable options for industrialuse.
The majority of published research has focused on simulations of the mid-span of bladesin linear cascades. Whilst computationally expensive, DNS has been performed for suchturbine cascades at transitional Reynolds numbers [3]. LES of turbine cascades have beenperformed at conditions that match reference DNS data [4], and it was found that the LESpredicted a transition on the suction side of the blade that was delayed by some 10% whencompared to the DNS. This was attributed to the coarse grid used in the simulation andhighlights the resolution requirements for wall-bounded simulations. In all of the abovesimulations the incoming wakes were included in the simulations through the use of precur-sor calculations [5]. The effect of small-scale turbulence embedded within the wakes wasstudied by Wissink et al. [6], who concluded that whilst the large-scale motion of the waketriggers the Kelvin-Helmholtz (K-H) instability on the suction side of the blade, the smallscale disturbances embedded into the wake flow seed the transition to turbulence in the shearlayer flow.
Relatively few published studies of compressor-type flows have been performed usingLES. Pioneering work in the area by You et al. [7] established a computational frameworkwithin which Large Eddy Simulations of the loss mechanisms in rotor tip-clearance flowswere investigated [8], including the effect of varying tip-gap size [9]. Based on the findingsof this work, further efforts were made to improve turbulence modelling of the flow in tur-bomachinery [10]. The influence of freestream turbulence on transition on turbine bladeshas been investigated using LES [11], highlighting the need for reasonably posed inlet con-ditions. Simulations of a linear compressor cascade at a moderate Reynolds number wasstudied by Zaki et al. [12] - the periodically passing wake caused the suction-side flow toseparate and roll-up into discrete K-H vortices. On the pressure side the flow underwent abypass transition due to the passing of the wake.
In a more generic context LES has been extensively used to simulate flow features thatoccur in turbomachinery using simple geometries. The laminar separation and transition toturbulence of a boundary layer have been simulated both on a flat plate [13] and on a geom-etry that includes a curved leading edge [14]. In both cases the simulation results compared
3
well with experiment and elucidated the transition mechanism in the flow. Wake-inducedtransition of a flat-plate boundary layer has been simulated numerically [15] with the tran-sition mechanism captured in the simulation comparing very favourably with experiment.A study of the wake produced by two turbulent boundary layers has shown that LES canproduce extremely good agreement with experimental data for this flow type [16].
The simulations presented here are performed on a geometry that is restricted to anidealised, highly-loaded compressor blade [17] at a Reynolds number of ∼ 700,000 basedon chord length and inlet velocity Vi. Many numerical studies on this compressor have beenperformed but to date the cascade has not been the subject of a systematic study using LargeEddy Simulation. Previous studies of Large Eddy Simulations performed on the cascade hashighlighted the computational domain and mesh resolution requirements for the simulationmethodology [18], [19]. The purpose of the current study is to identify the relative strengthsand weaknesses of the LES method in predicting the flow in an idealised compressor atreasonably high Reynolds number. The simulated flow conditions are across a wide rangeof flow inlet angles that represent the near-design and off-design points of the blade.
This work uses the Rolls-Royce CFD code Hydra [20] which is an unstructured, mixedelement, compressible, density-based Reynolds Averaged Navier-Stokes solver. For the LESimplementation, the discretisation has been improved so as to avoid excessive dissipation ofresolved eddies, and subgrid scale models incorporated. The important features are sum-marised below, and further details of the discretisation and testing on simpler LES flowproblems can be found in Tristanto et al. [21]. The method has also been validated on mul-tiple impinging jet problems [22] and the complex geometry capability demonstrated by thecalculation of a Harrier aircraft in ground-effect [23].
2 Governing Equations
Employing Cartesian tensor notation and the conservative variables (ρ,ρui,E), the govern-ing time dependent equations in terms of spatially filtered, Favre-averaged compressible N-Sequations can be expressed as
∂
∂ t
∫Γ
QdV +∫
∂Γ
F(Q).ndS+∫
∂Γ
G(Q).ndS = 0, (1)
where,
Q =
ρ
ρ uρ vρwE
, F(Q).n =
ρUn
ρUnu+ nx pρUnv+ ny pρUnw+ nz pUn(E + p)
,
and G(Q) contains viscous and conduction flux terms. The finite volume discretisationprovides an implicit filter for the large eddies where ¯ denotes unweighted filtered variablesand ˜ density weighted filtered variables. The spatial filter size is computed at every nodefrom the control volume surrounding the node. The finite volumes are created from themedian-dual of the original unstructured mesh which may contain tetrahedra, hexahedra,pyramids and prisms.
4
2.1 Discretisation
The fluxes through the median dual control volume faces are accumulated by looping overall the edges connecting the nodes. For an edge i j that connects nodes i and j, the flux iscomputed using a second-order accurate scheme of Moinier [24]
Fi j =12
[F(Qi)+F(Q j)− smoothing
], (2)
The smoothing term is defined as [20],
smoothing = |Ai j|ε(Ll p
j (Q)−Ll pi (Q)
), (3)
where Ll p is the pseudo-Laplacian and
|Ai j|= ∂F/∂Q (4)
For LES it is essential that the smoothing term should be kept as small as possible soas to avoid unphysical dissipation of the resolved eddies. Careful examination of the split-ting and least-squares linear reconstruction of the smoothing terms in test cases [25], [26],showed that there was a lower ‘floor’ in the effective smoothing coefficient and that equiv-alent results (for a pipe and free jet) could be obtained with a fixed smoothing coefficientε = 0.2.
Temporal discretisation uses a standard third order accurate, three-stage Runge-Kuttaalgorithm.
2.2 Sub Grid Scale Model
The standard Smagorinsky SGS model [27] defines the subgrid scale viscosity as
µsgs = ρl2smag
√2Si jSi j, (5)
where the Smagorinsky length scale is,
lsmag =Cs∆ (6)
the strain rate is,
Si j =12
(∂ui∂xj
+∂uj∂xi
), (7)
the filter width ∆ is determined from the cube root of the control volume and Cs is amodel constant.
A typical hexahedral mesh used for engineering calculations resolves the gradients inthe boundary layer by decreasing spacing normal to the wall. This results in moderate tohigh aspect ratios close to the wall. The consequence is that the filter width stays relativelylarge and excessively high values of µsgs are found close to the wall. In order to reduce theeddy viscosity near the wall, a damping algorithm is implemented into the code. In the innerregion of the Baldwin-Lomax or Cebeci-Smith mixing length RANS model, the turbulentviscosity takes a similar form to the sub-grid scale viscosity of the Smagorinsky model
(µt)i = ρl2bl |ω| (8)
5
where the mixing length is in this case
lbl = κy[1− exp(y+
A+)] (9)
Since the Smagorinsky SGS model only accounts for the modelled part of the totalstress, this should be smaller than the Reynolds stress that would be predicted by a mixinglength model. Hence, we have a way of limiting the spurious excessive length scale in theSmagorinsky model,
lsmag = min(Cs4,κy) (10)
This can be interpreted as performing a similar operation to van Driest damping whichreduces the length scale to zero near to the wall. Although the limiter employs a RANS-type model to compute an upper bound on the length scale near the wall, the subgrid-scaleviscosity is calculated at every time step, and the simulation remains as a pure LES. Intesting on grids used here, this length scale restriction is typically activated for a layer of 2-5elements from the wall with the outer element having a y+ less than seven.
The unstructured nature of the solver requires an efficient partitioning strategy and care-ful handling of the message passing to achieve good efficiency on large numbers of pro-cessors. The unstructured solver uses the OPLUS library [28] with message passing subse-quently implemented in MPI. The partitioning is carried out in parallel using the ParMetislibrary. More information is provided by Hills [29] on how the parallel implementation hasbeen tuned for large scale problems and near linear speed-up is demonstrated up to 1024cores on an IBM Power5 system. Calculations presented here have been run on a Cray XT-4system using 1024 processor cores.
3 Reference Experiment and Computational Setup
The numerical method is applied to a Controlled Diffusion (CD) compressor cascade housedat the Naval Postgraduate School, Monterey, California. This cascade has been the subjectof an extensive experimental testing programme over a wide range of the flow inlet angle,β , and over a range of Reynolds numbers Re = 400,000−770,000 based on the freestreamvelocity and the chord length, c = 0.1273m. In this study, a cross-section of the experimentson the rig [30], [31], [32] are simulated numerically. The cases investigated are outlined inTable 1. Cases 1 and 2, where the inflow angle β = 24.49◦ and 28◦ respectively is lowerthan the design angle are referred to as negative incidence simulations. Cases 6-9, where theinflow angle is above the design point are referred to as positive incidence simulations.
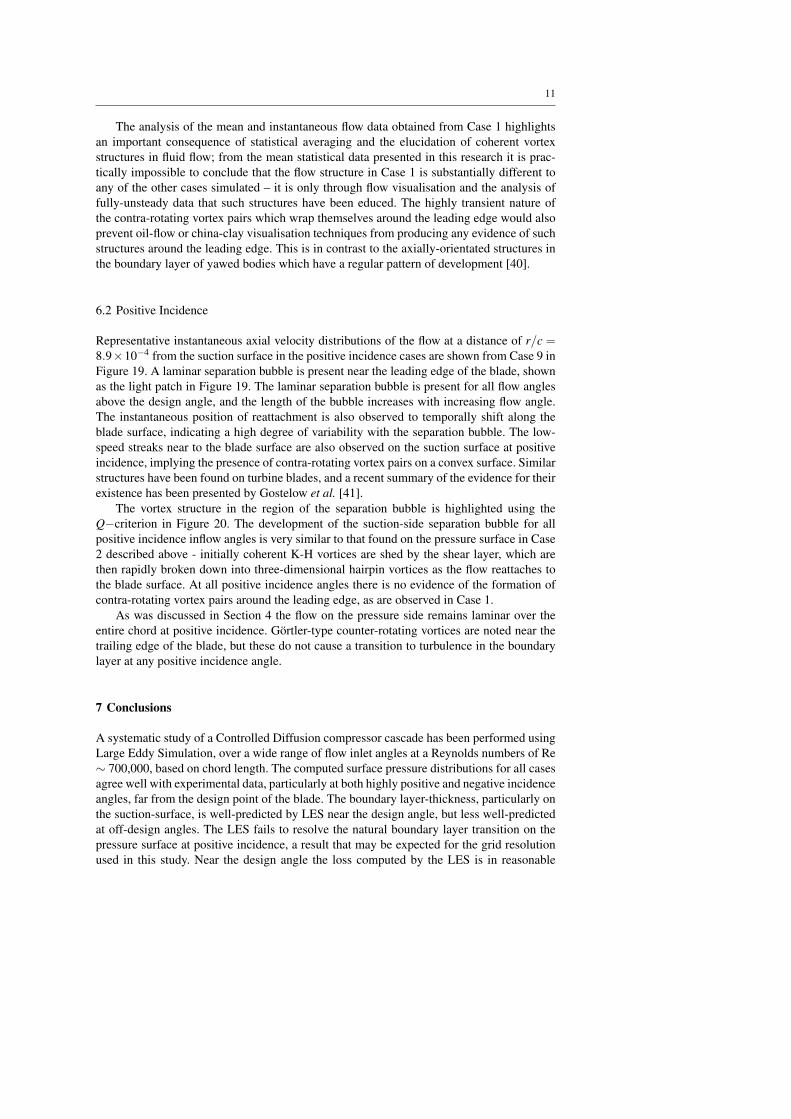
The computational domain and an outline of the mesh used in the study is shown inFigure 1, with only every other grid line shown for clarity. The global co-ordinate systemis Cartesian in nature, such that the x−, y−, and z− co-ordinates are global and have com-ponents of velocity associated with them that are u, v, and w respectively. The flow inletangle, β , is defined as zero along the positive x-direction and increases in a clockwise sense.The domain extends 0.25c upstream and 0.75c downstream of the leading and trailing edgesof the blade respectively. The spanwise domain has an extent of 0.2c, with 400 nodes dis-tributed uniformly across the span. The domain is derived from a streamtube representationof the blade and contains a contraction of the spanwise domain with axial distance such thatthe Axial Velocity Density Ratio (AVDR) has a value of 1.025, matching that of the β =40◦ experimental configuration. In the experimental configuration the AVDR was found toremain roughly constant in Cases 7-9, as reported by Elazar [33].
6
Table 1 Flow Simulation Parameters
Case β (◦) M1 Re1 24.49 0.2206 690,0002 28.00 0.2151 648,0003 32.95 0.2079 630,0004 37.07 0.2205 683,0005 38.91 0.2164 676,0006 42.90 0.2221 686,0007 45.96 0.2224 690,0008 40.00 0.2500 740,0009 43.40 0.2724 774,000
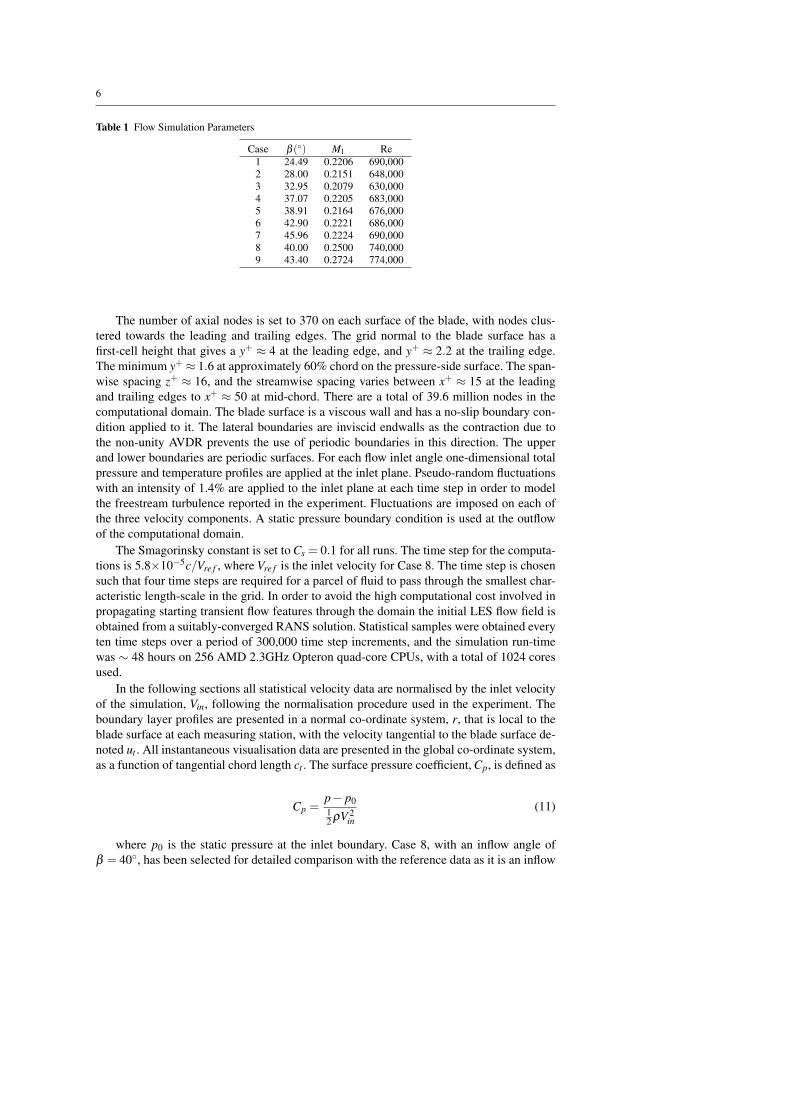
The number of axial nodes is set to 370 on each surface of the blade, with nodes clus-tered towards the leading and trailing edges. The grid normal to the blade surface has afirst-cell height that gives a y+ ≈ 4 at the leading edge, and y+ ≈ 2.2 at the trailing edge.The minimum y+ ≈ 1.6 at approximately 60% chord on the pressure-side surface. The span-wise spacing z+ ≈ 16, and the streamwise spacing varies between x+ ≈ 15 at the leadingand trailing edges to x+ ≈ 50 at mid-chord. There are a total of 39.6 million nodes in thecomputational domain. The blade surface is a viscous wall and has a no-slip boundary con-dition applied to it. The lateral boundaries are inviscid endwalls as the contraction due tothe non-unity AVDR prevents the use of periodic boundaries in this direction. The upperand lower boundaries are periodic surfaces. For each flow inlet angle one-dimensional totalpressure and temperature profiles are applied at the inlet plane. Pseudo-random fluctuationswith an intensity of 1.4% are applied to the inlet plane at each time step in order to modelthe freestream turbulence reported in the experiment. Fluctuations are imposed on each ofthe three velocity components. A static pressure boundary condition is used at the outflowof the computational domain.
The Smagorinsky constant is set to Cs = 0.1 for all runs. The time step for the computa-tions is 5.8×10⁻⁵c/Vre f , where Vre f is the inlet velocity for Case 8. The time step is chosensuch that four time steps are required for a parcel of fluid to pass through the smallest char-acteristic length-scale in the grid. In order to avoid the high computational cost involved inpropagating starting transient flow features through the domain the initial LES flow field isobtained from a suitably-converged RANS solution. Statistical samples were obtained everyten time steps over a period of 300,000 time step increments, and the simulation run-timewas ∼ 48 hours on 256 AMD 2.3GHz Opteron quad-core CPUs, with a total of 1024 coresused.
In the following sections all statistical velocity data are normalised by the inlet velocityof the simulation, Vin, following the normalisation procedure used in the experiment. Theboundary layer profiles are presented in a normal co-ordinate system, r, that is local to theblade surface at each measuring station, with the velocity tangential to the blade surface de-noted ut . All instantaneous visualisation data are presented in the global co-ordinate system,as a function of tangential chord length ct . The surface pressure coefficient, Cp, is defined as
Cp =p− p012 ρV 2
in(11)
where p0 is the static pressure at the inlet boundary. Case 8, with an inflow angle ofβ = 40◦, has been selected for detailed comparison with the reference data as it is an inflow
7
angle near to on-design conditions that has a large amount of experimental data available[31]. Statistical data from the other cases will be shown where appropriate.
4 Case 8, β = 40◦
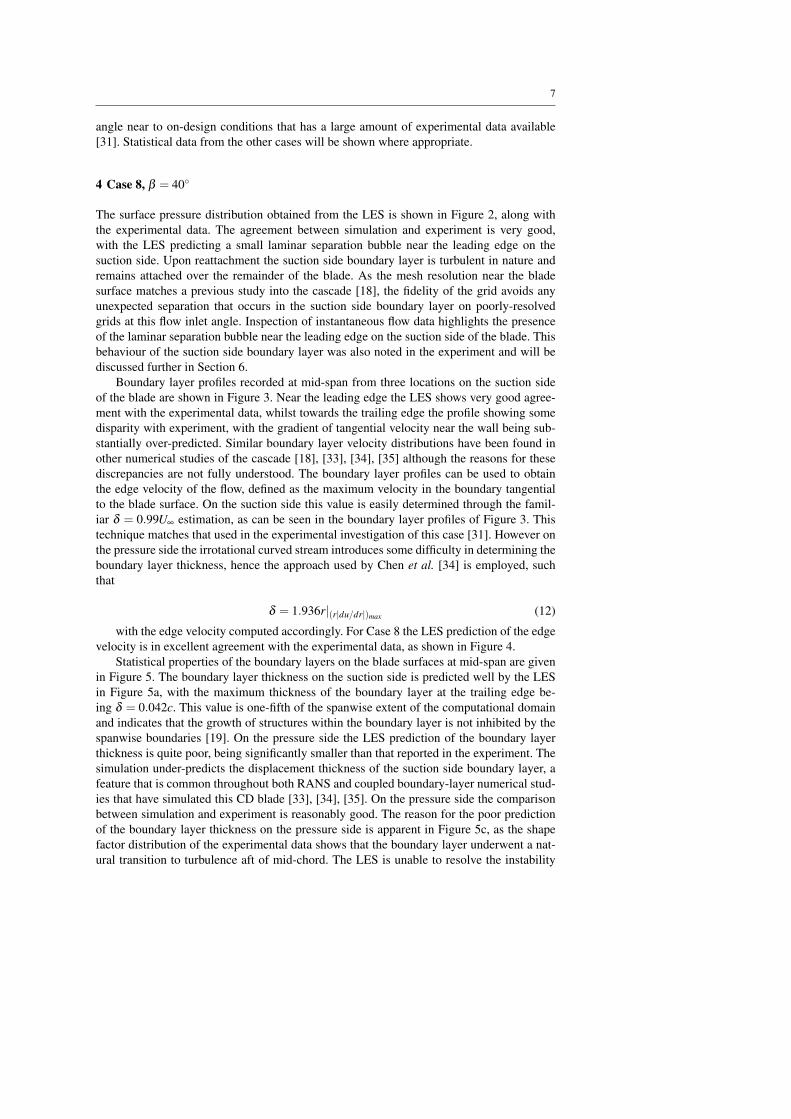
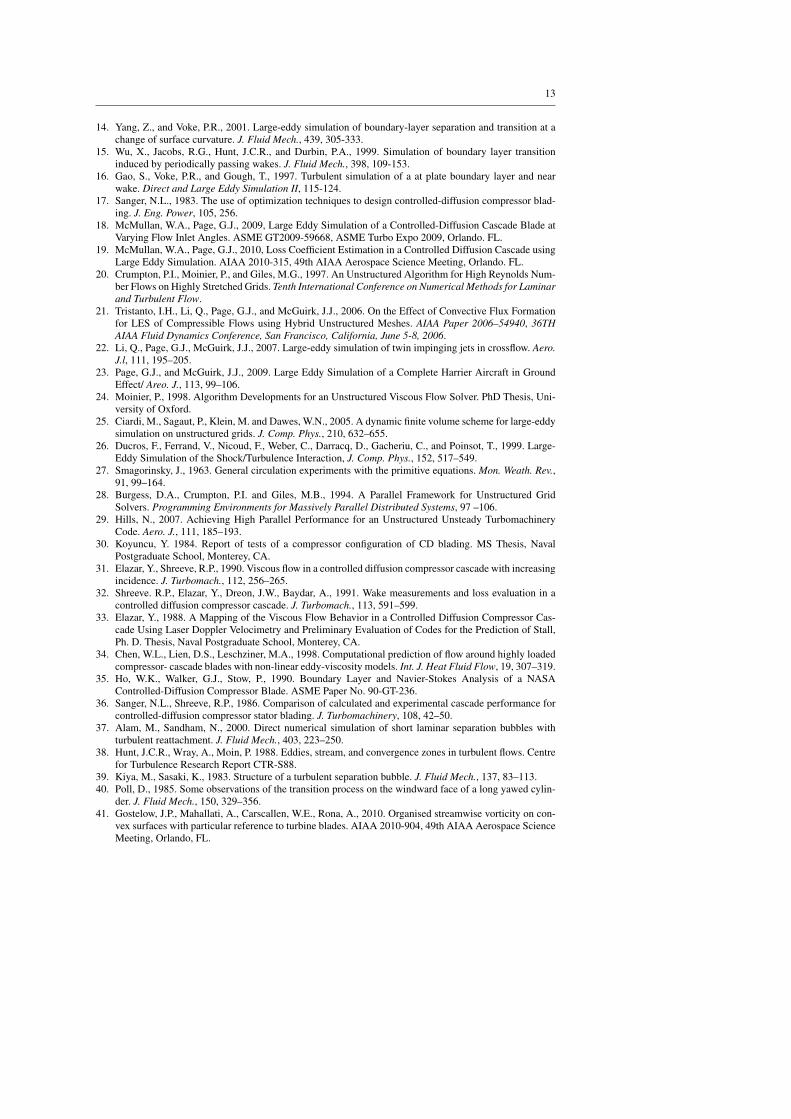
The surface pressure distribution obtained from the LES is shown in Figure 2, along withthe experimental data. The agreement between simulation and experiment is very good,with the LES predicting a small laminar separation bubble near the leading edge on thesuction side. Upon reattachment the suction side boundary layer is turbulent in nature andremains attached over the remainder of the blade. As the mesh resolution near the bladesurface matches a previous study into the cascade [18], the fidelity of the grid avoids anyunexpected separation that occurs in the suction side boundary layer on poorly-resolvedgrids at this flow inlet angle. Inspection of instantaneous flow data highlights the presenceof the laminar separation bubble near the leading edge on the suction side of the blade. Thisbehaviour of the suction side boundary layer was also noted in the experiment and will bediscussed further in Section 6.
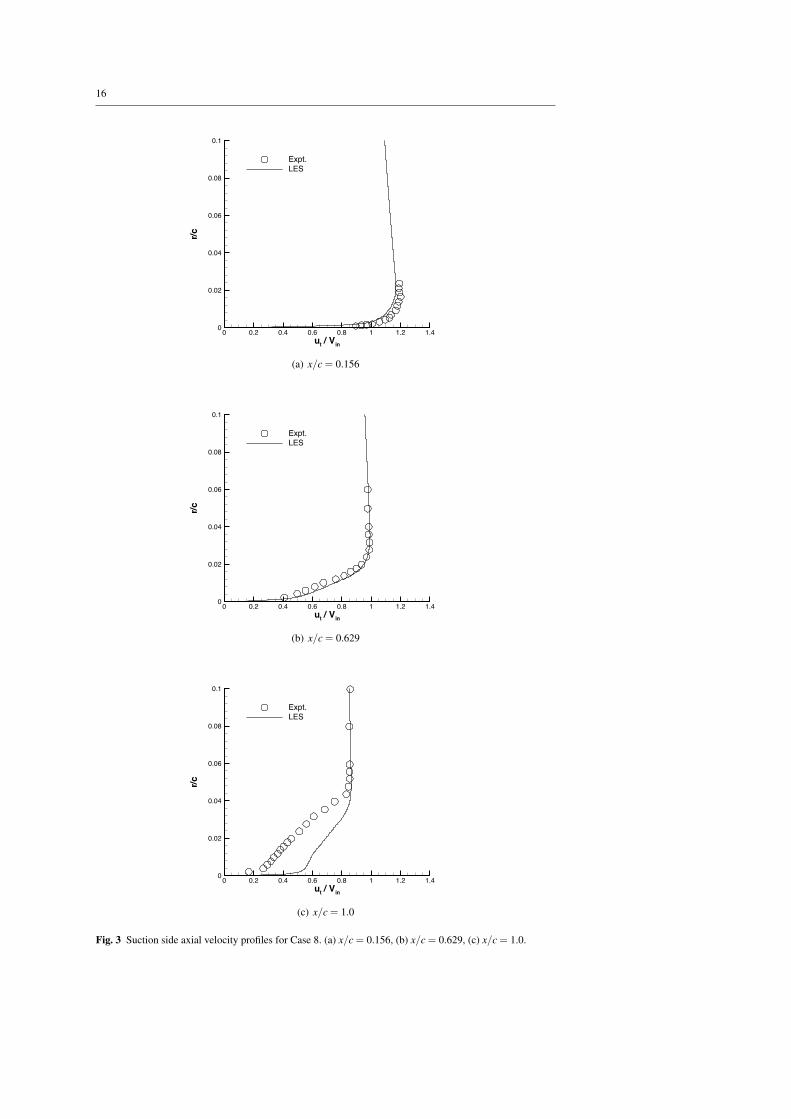
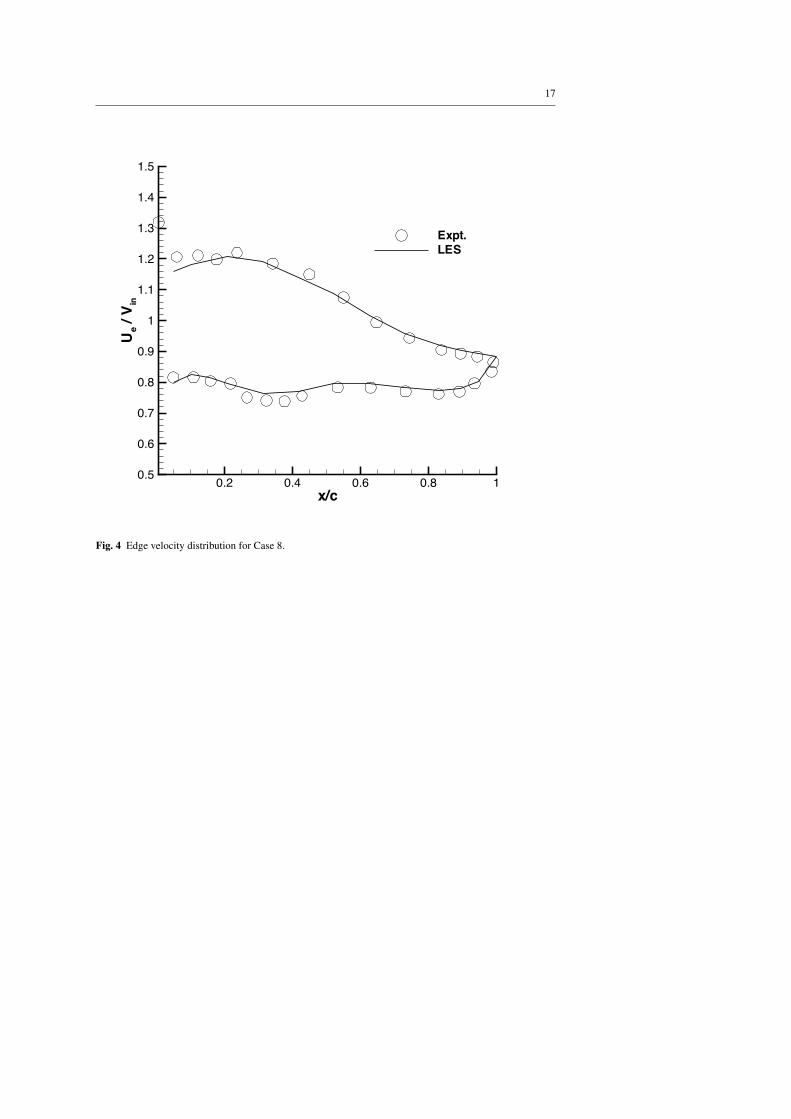
Boundary layer profiles recorded at mid-span from three locations on the suction sideof the blade are shown in Figure 3. Near the leading edge the LES shows very good agree-ment with the experimental data, whilst towards the trailing edge the profile showing somedisparity with experiment, with the gradient of tangential velocity near the wall being sub-stantially over-predicted. Similar boundary layer velocity distributions have been found inother numerical studies of the cascade [18], [33], [34], [35] although the reasons for thesediscrepancies are not fully understood. The boundary layer profiles can be used to obtainthe edge velocity of the flow, defined as the maximum velocity in the boundary tangentialto the blade surface. On the suction side this value is easily determined through the famil-iar δ = 0.99U∞ estimation, as can be seen in the boundary layer profiles of Figure 3. Thistechnique matches that used in the experimental investigation of this case [31]. However onthe pressure side the irrotational curved stream introduces some difficulty in determining theboundary layer thickness, hence the approach used by Chen et al. [34] is employed, suchthat
δ = 1.936r|(r|du/dr|)max (12)
with the edge velocity computed accordingly. For Case 8 the LES prediction of the edgevelocity is in excellent agreement with the experimental data, as shown in Figure 4.
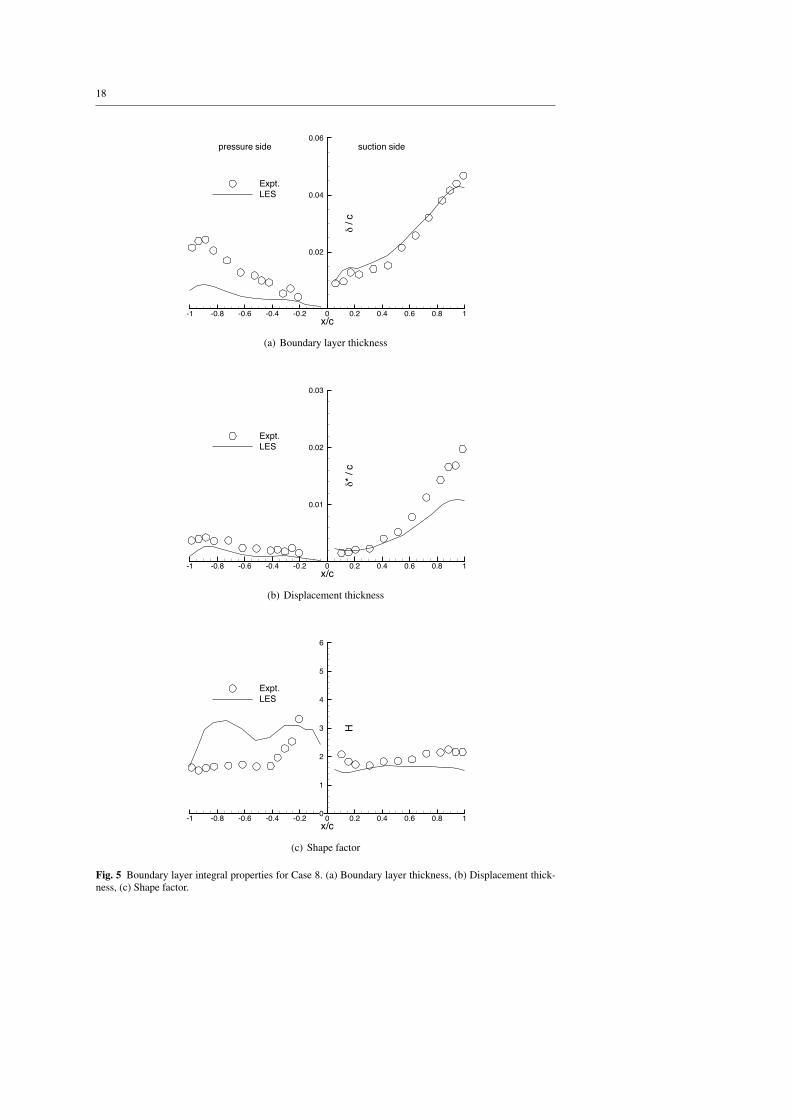
Statistical properties of the boundary layers on the blade surfaces at mid-span are givenin Figure 5. The boundary layer thickness on the suction side is predicted well by the LESin Figure 5a, with the maximum thickness of the boundary layer at the trailing edge be-ing δ = 0.042c. This value is one-fifth of the spanwise extent of the computational domainand indicates that the growth of structures within the boundary layer is not inhibited by thespanwise boundaries [19]. On the pressure side the LES prediction of the boundary layerthickness is quite poor, being significantly smaller than that reported in the experiment. Thesimulation under-predicts the displacement thickness of the suction side boundary layer, afeature that is common throughout both RANS and coupled boundary-layer numerical stud-ies that have simulated this CD blade [33], [34], [35]. On the pressure side the comparisonbetween simulation and experiment is reasonably good. The reason for the poor predictionof the boundary layer thickness on the pressure side is apparent in Figure 5c, as the shapefactor distribution of the experimental data shows that the boundary layer underwent a nat-ural transition to turbulence aft of mid-chord. The LES is unable to resolve the instability
8
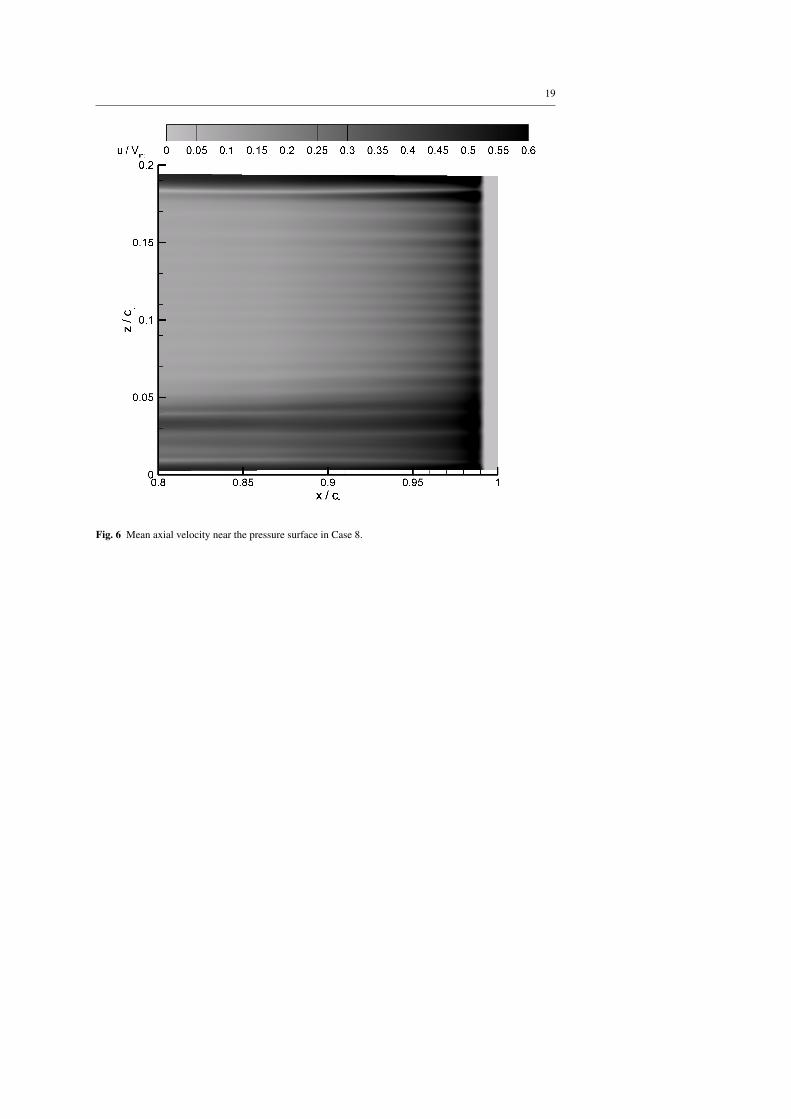
waves required to precipitate a natural transition to turbulence, and as such the shape factorof the flow suggests laminar boundary layer behaviour over the majority of the pressure-sidesurface. The value of the shape factor drops to H ≈ 1.6 at the trailing edge, suggesting thatthe boundary layer is at least transitional at this location. Analysis of the mean axial velocitynear the pressure surface shows that axially-orientated streaks appear in the boundary layer,as demonstrated in Figure 6. The streaks that are apparent in the pressure side boundarylayer appear to be Gortler vortices that arise due to the concavity of the pressure surface, butdo not precipitate a transition to turbulence in the boundary layer flow. These observationsdemonstrate the difficulty in using LES to simulate a high Reynolds number flow under-going natural transition, as producing a mesh that resolves the Tollmien-Schlichting wavesthat produce the transition would lead to a simulation that is closer to Direct NumericalSimulation than LES.
5 Off-Design Simulations
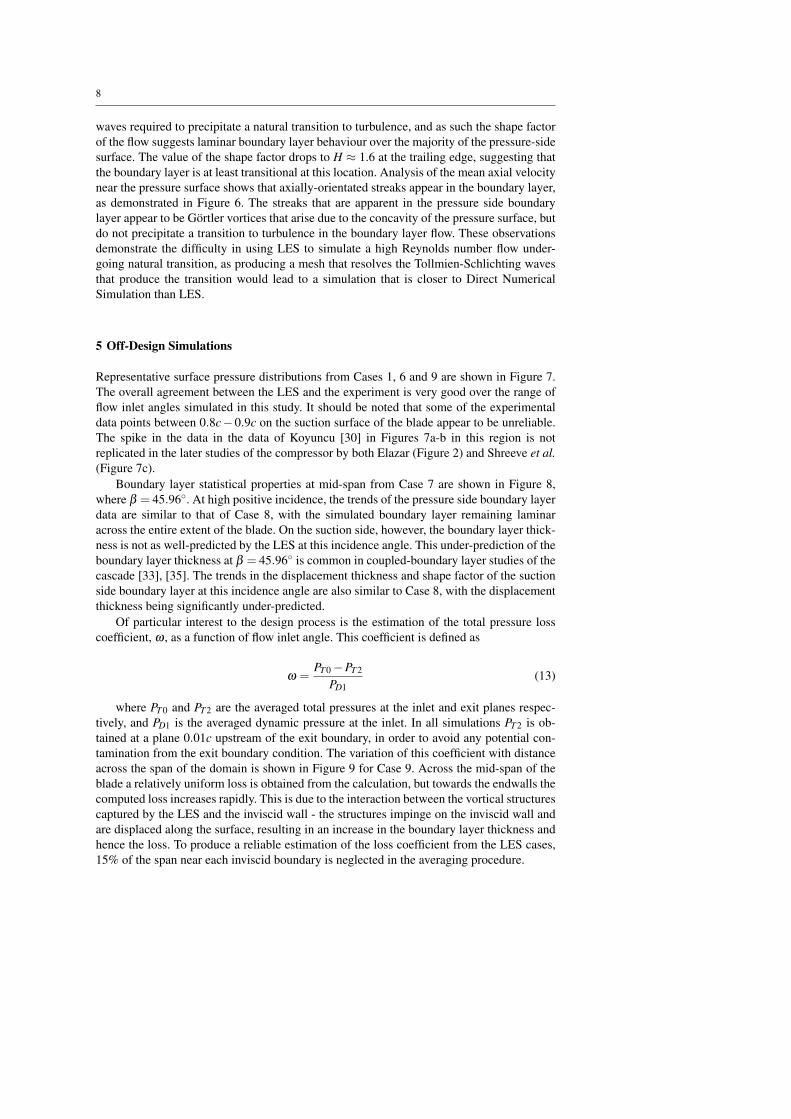
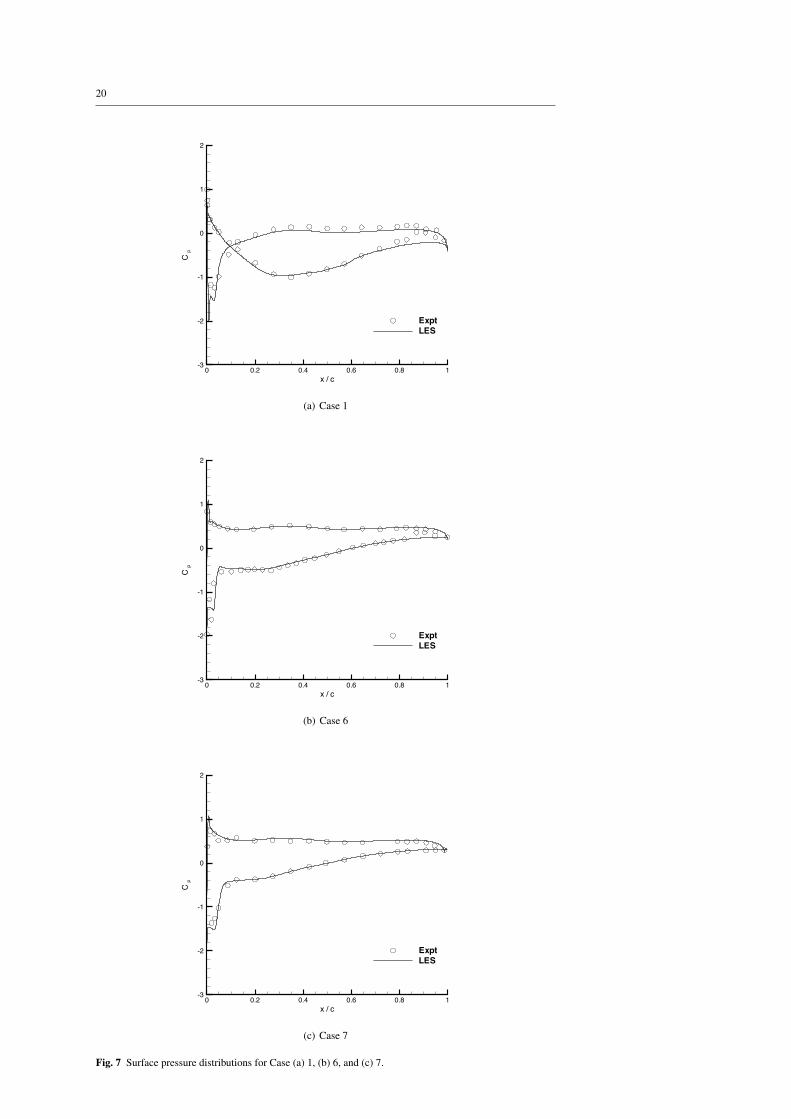
Representative surface pressure distributions from Cases 1, 6 and 9 are shown in Figure 7.The overall agreement between the LES and the experiment is very good over the range offlow inlet angles simulated in this study. It should be noted that some of the experimentaldata points between 0.8c−0.9c on the suction surface of the blade appear to be unreliable.The spike in the data in the data of Koyuncu [30] in Figures 7a-b in this region is notreplicated in the later studies of the compressor by both Elazar (Figure 2) and Shreeve et al.(Figure 7c).
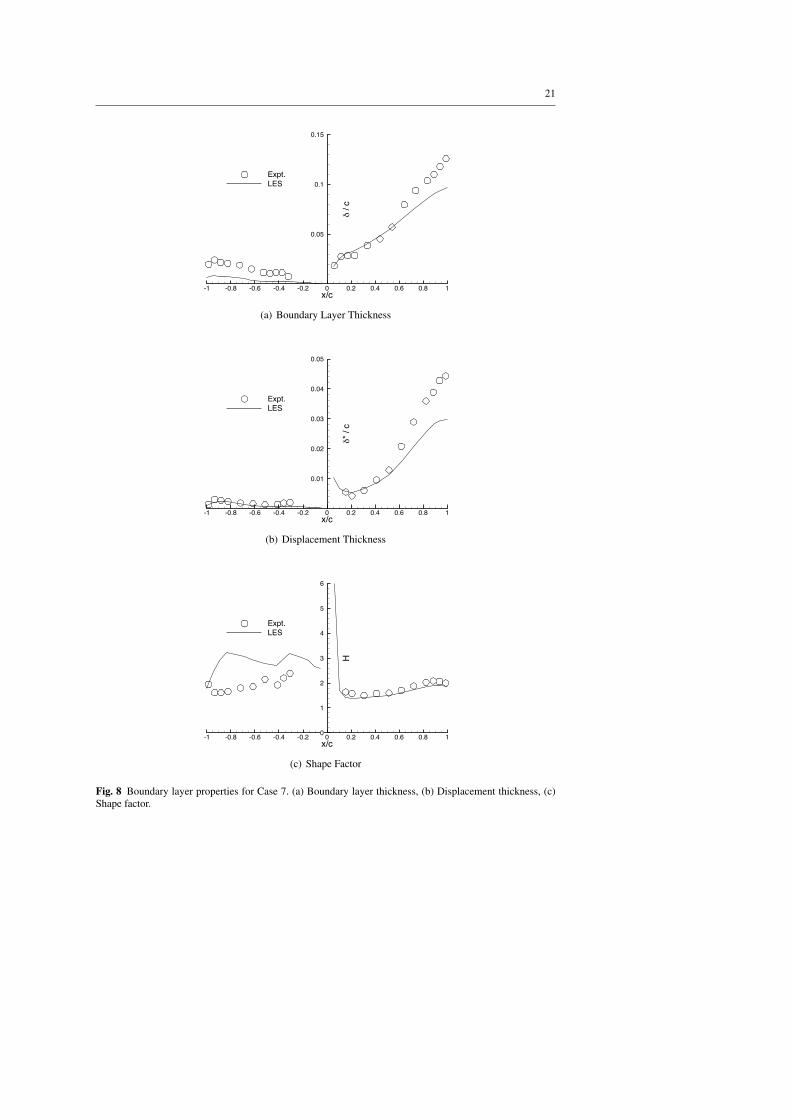
Boundary layer statistical properties at mid-span from Case 7 are shown in Figure 8,where β = 45.96◦. At high positive incidence, the trends of the pressure side boundary layerdata are similar to that of Case 8, with the simulated boundary layer remaining laminaracross the entire extent of the blade. On the suction side, however, the boundary layer thick-ness is not as well-predicted by the LES at this incidence angle. This under-prediction of theboundary layer thickness at β = 45.96◦ is common in coupled-boundary layer studies of thecascade [33], [35]. The trends in the displacement thickness and shape factor of the suctionside boundary layer at this incidence angle are also similar to Case 8, with the displacementthickness being significantly under-predicted.
Of particular interest to the design process is the estimation of the total pressure losscoefficient, ω , as a function of flow inlet angle. This coefficient is defined as
ω =PT 0−PT 2
PD1(13)
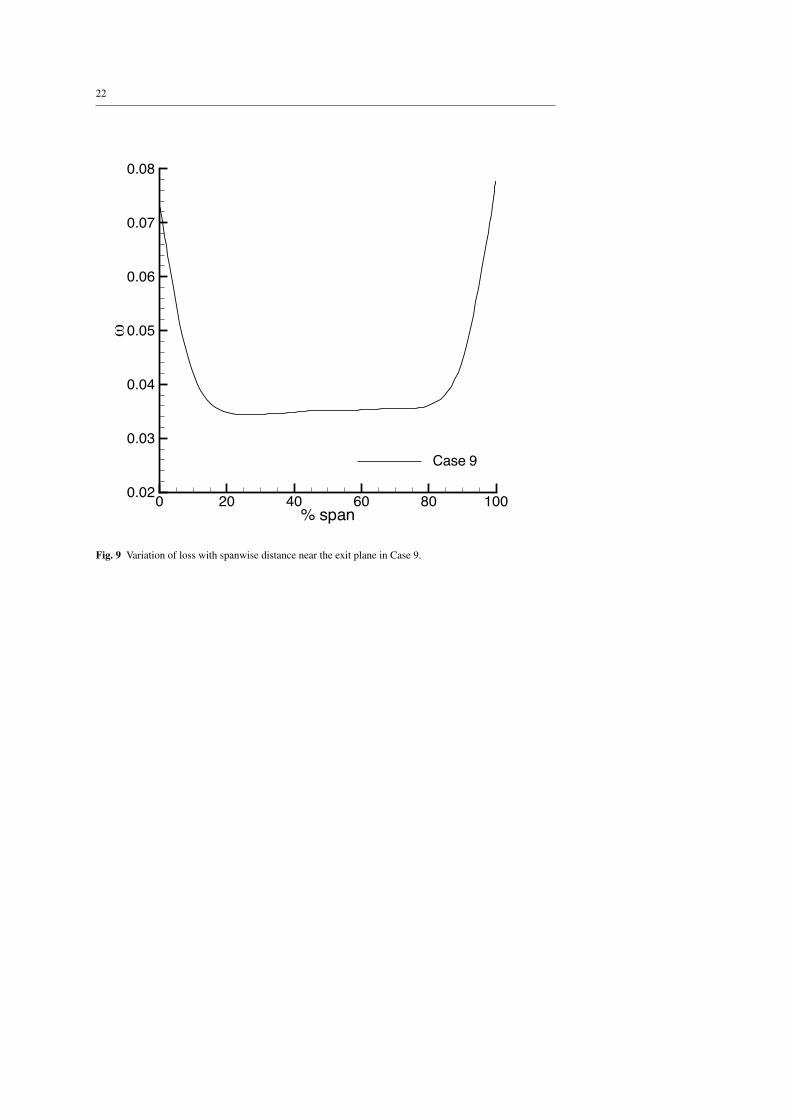
where PT 0 and PT 2 are the averaged total pressures at the inlet and exit planes respec-tively, and PD1 is the averaged dynamic pressure at the inlet. In all simulations PT 2 is ob-tained at a plane 0.01c upstream of the exit boundary, in order to avoid any potential con-tamination from the exit boundary condition. The variation of this coefficient with distanceacross the span of the domain is shown in Figure 9 for Case 9. Across the mid-span of theblade a relatively uniform loss is obtained from the calculation, but towards the endwalls thecomputed loss increases rapidly. This is due to the interaction between the vortical structurescaptured by the LES and the inviscid wall - the structures impinge on the inviscid wall andare displaced along the surface, resulting in an increase in the boundary layer thickness andhence the loss. To produce a reliable estimation of the loss coefficient from the LES cases,15% of the span near each inviscid boundary is neglected in the averaging procedure.

9
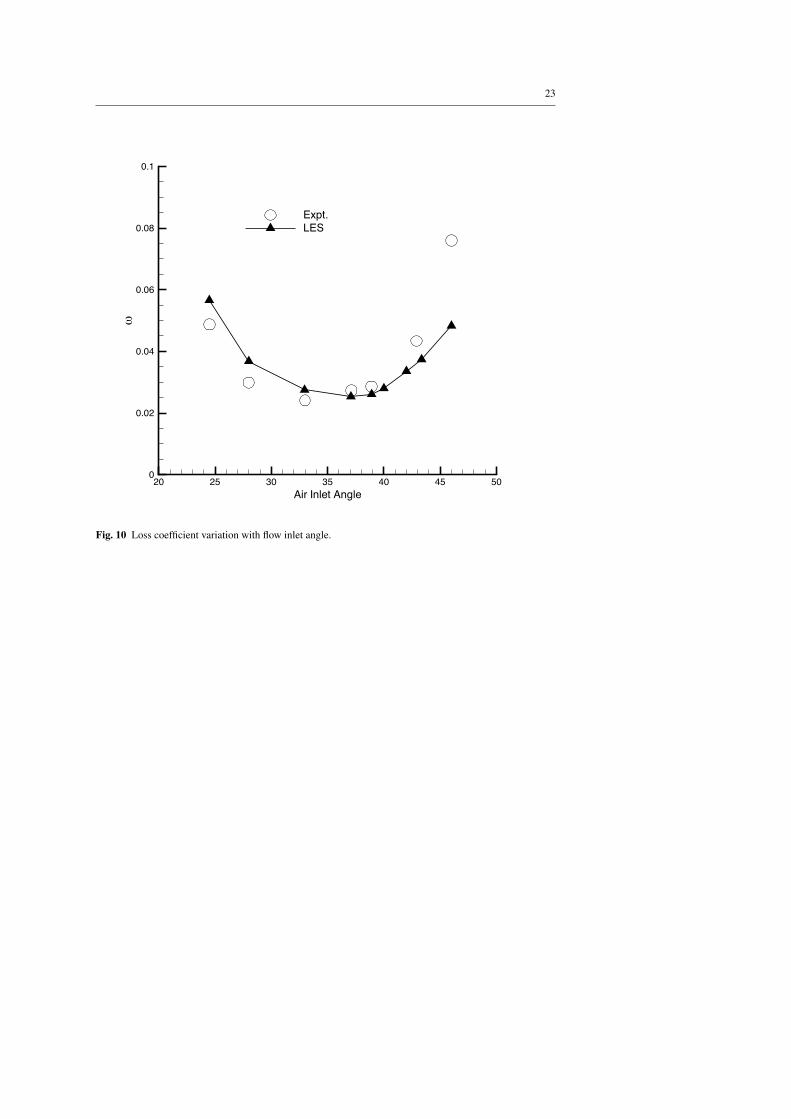
The loss coefficient for each case is shown in Figure 10, with a comparison to the linearmodel RANS data of Chen et al. [34]. Whilst the overall trend of the loss predicted bythe LES is in reasonable agreement with the experimental data, some discrepancies areevident. The under-prediction of the boundary layer thickness in Case 7 by approximately40% (Figure 8) results in the lower loss estimate from the LES. In Case 9 the computedsuction side boundary layer thickness is also too small when compared to experimentaldata. Similarly the boundary layers predicted in Cases 1-4 are too thick when compared toexperimental data, hence the loss obtained from these simulations is slightly too high. Someof the discrepancies in the computed loss may arise from the constant value of the AVDRused in the simulations, as the experimental data showed a small variation in this quantityover the wide range of flow angles studied in this research [36]. As shown by the comparativedata of Chen et al., RANS predictions of the loss of the compressor cascade have shownsimilar trends in the variation of loss with flow inlet angle and emphasises the difficultyinvolved in accurately predicting the loss through both steady-state Computational FluidDynamics, and time-dependent numerical simulation. As the LES captures the separation-induced transition in the flow, however, the obtained loss loop does show some improvementover traditional RANS modelling methods in the prediction of this quantity.
6 Instantaneous Flow Structure
The time-dependent nature of LES allows insights into the development of blade surfaceboundary layers to be obtained. Sequences of instantaneous flow outputs and the mean flow-field from each case are analysed in order to elucidate both the mechanism of transition toturbulence in the flow, and any structure that may be present in the turbulent flow field. Nearthe extremes of negative and positive flow angles the flow will undergo a transition on thepressure and suction surfaces respectively, and as such the discussion of the analysis will besplit between those regions.
6.1 Negative Incidence
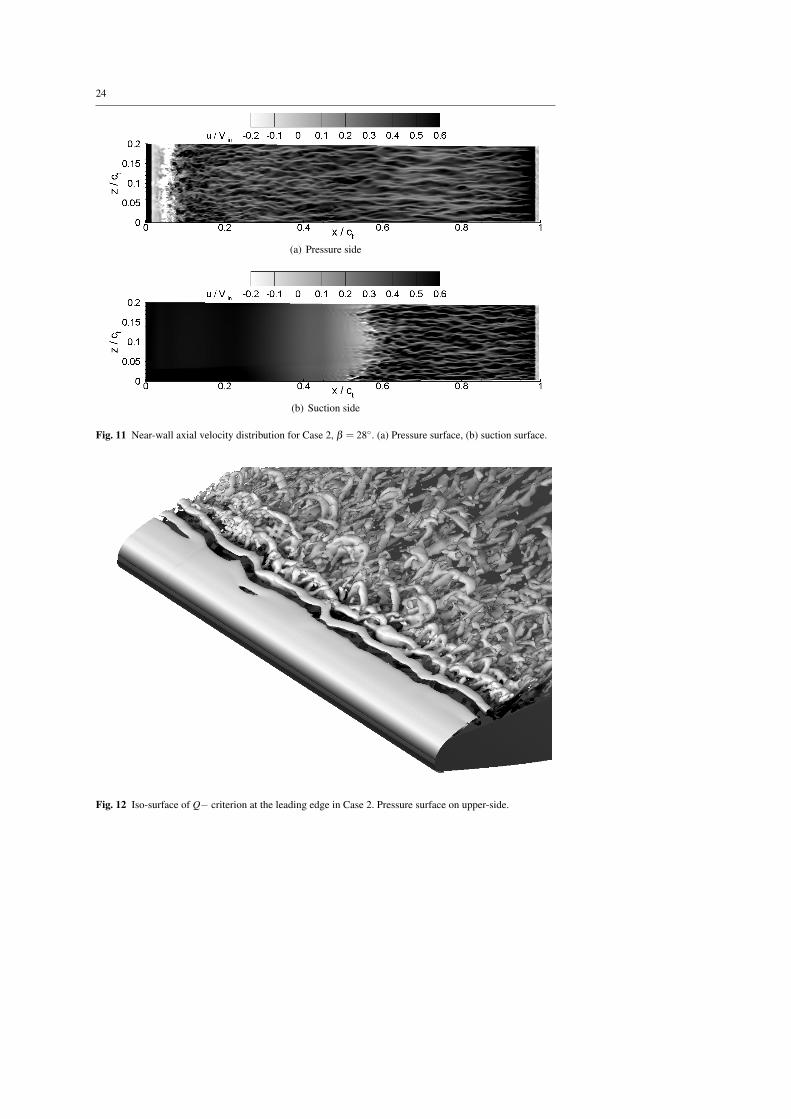
In Cases 1-3 the mean flow field data reveals the presence of laminar separation near theleading edge on the pressure-surface of the blade, and the structure of the flow in these casesis investigated further. The instantaneous global axial velocity, u, at a distance of r/c =8.9×10⁻⁴ from the blade surface in Case 2 is shown in Figure 11. At this particular instantin time the flow separates near the leading edge of the pressure surface (Figure 11a) andreattaches at approximately x/ct = 0.08. Upon reattachment axially-orientated low-velocitystreaks form in the boundary layer and persist to the trailing edge of the blade. This patternof flow development is very similar to that observed in DNS of boundary layers undergoinglaminar separation and turbulent reattachment [37]. On the suction surface, shown in Figure11b the flow is laminar up to x/ct = 0.53, at which point the flow undergoes a transitionto turbulence, prompting the appearance of streaks in the boundary layer flow. The flowstructure near the leading edge on the pressure surface is visualised in Figure 12, throughthe use of the Q−criterion [38]. The Q-criterion is given by the expression Q =−0.5ui ju ji,with the threshold of Q chosen to visualise the features near the leading edge of the blade.The shear layer that develops from the separating flow is inviscidly unstable and rapidlyforms Kelvin-Helmholtz vortices. These vortices initially display a high level of spanwise
10
coherence, but are quickly broken down as they proceed downstream. As the flow reattachesto the blade surface, hairpin vortices are evident in the boundary layer flow.
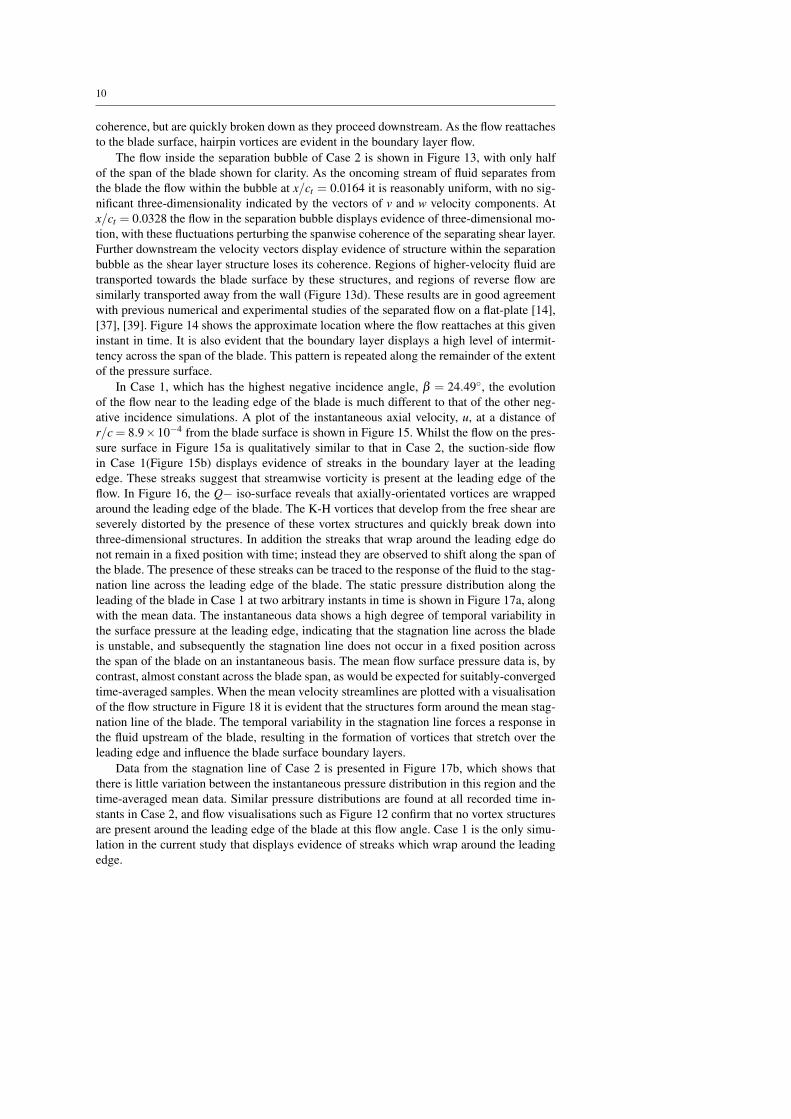
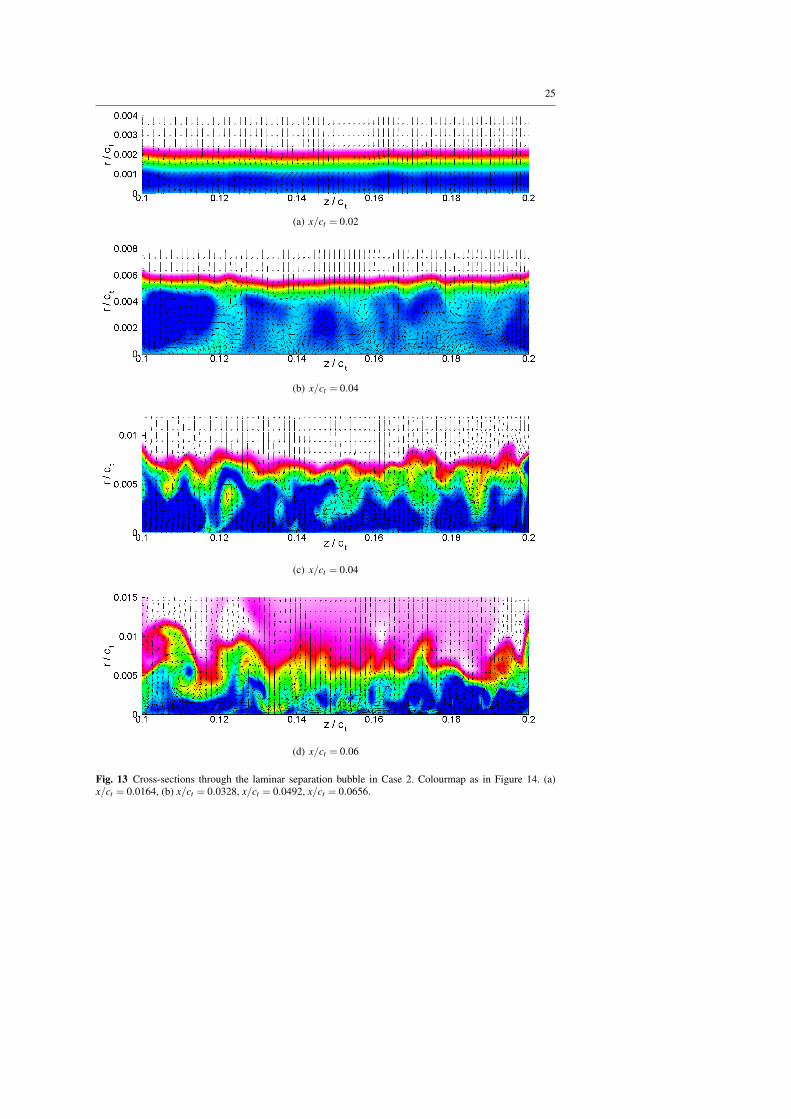
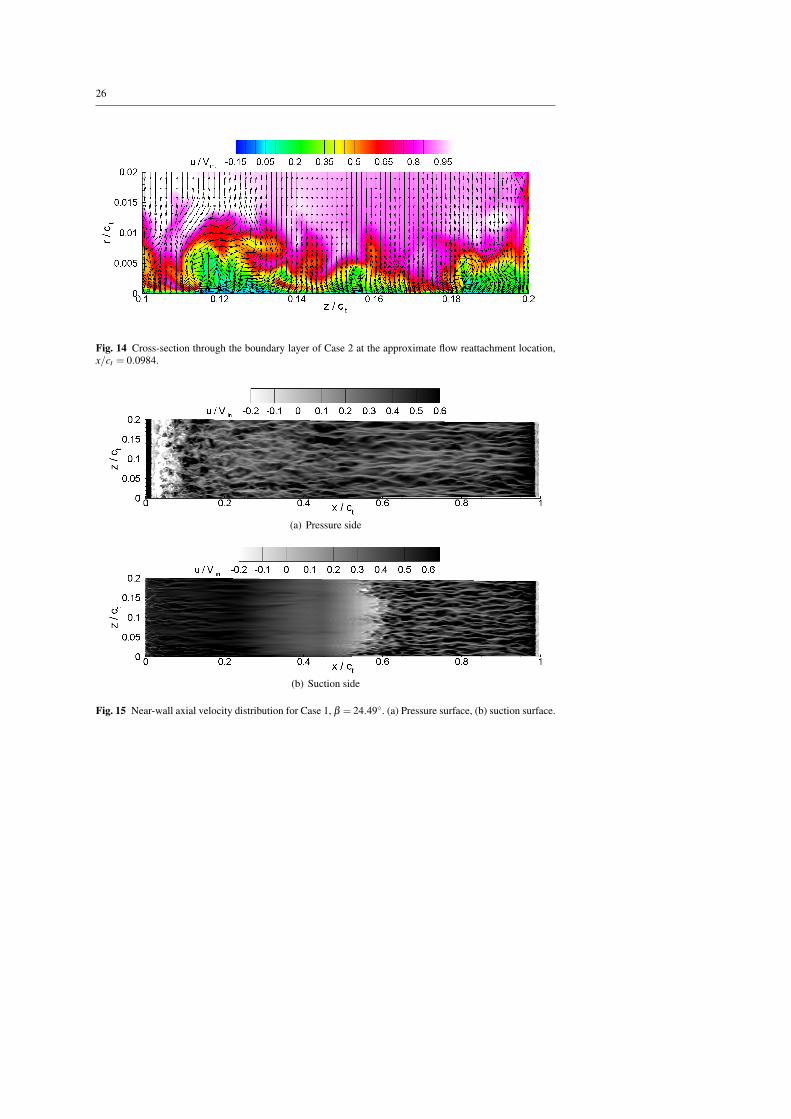
The flow inside the separation bubble of Case 2 is shown in Figure 13, with only halfof the span of the blade shown for clarity. As the oncoming stream of fluid separates fromthe blade the flow within the bubble at x/ct = 0.0164 it is reasonably uniform, with no sig-nificant three-dimensionality indicated by the vectors of v and w velocity components. Atx/ct = 0.0328 the flow in the separation bubble displays evidence of three-dimensional mo-tion, with these fluctuations perturbing the spanwise coherence of the separating shear layer.Further downstream the velocity vectors display evidence of structure within the separationbubble as the shear layer structure loses its coherence. Regions of higher-velocity fluid aretransported towards the blade surface by these structures, and regions of reverse flow aresimilarly transported away from the wall (Figure 13d). These results are in good agreementwith previous numerical and experimental studies of the separated flow on a flat-plate [14],[37], [39]. Figure 14 shows the approximate location where the flow reattaches at this giveninstant in time. It is also evident that the boundary layer displays a high level of intermit-tency across the span of the blade. This pattern is repeated along the remainder of the extentof the pressure surface.
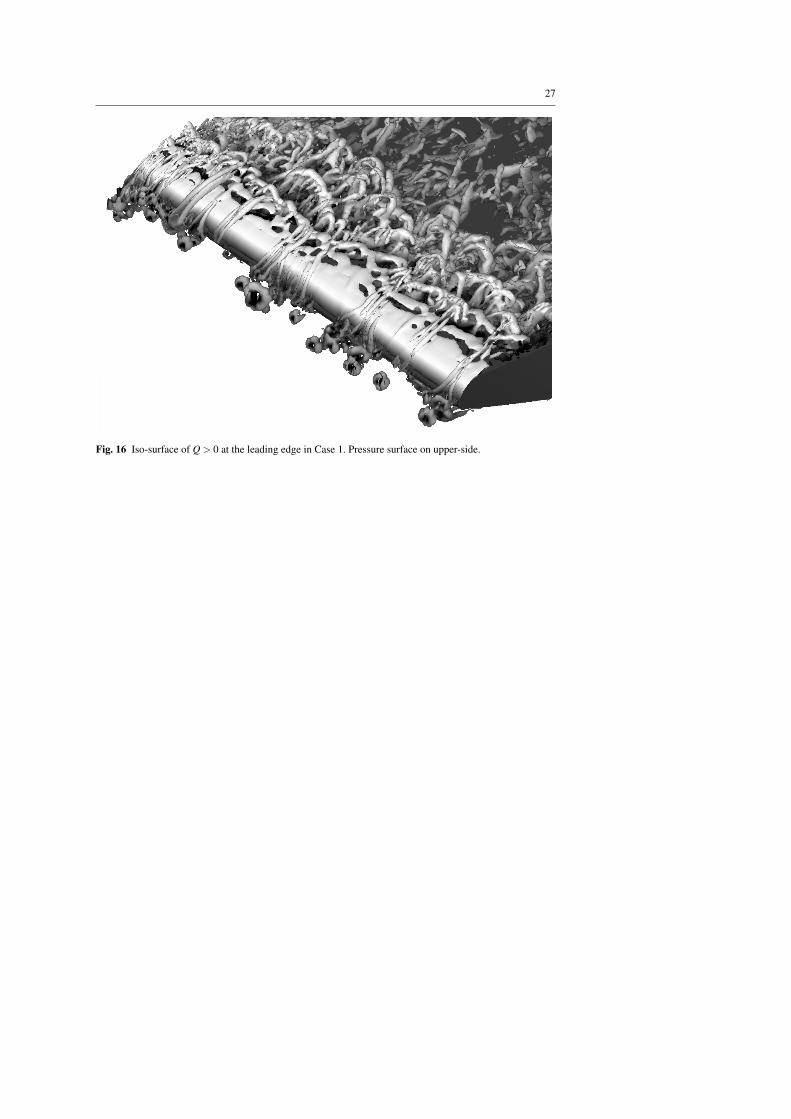
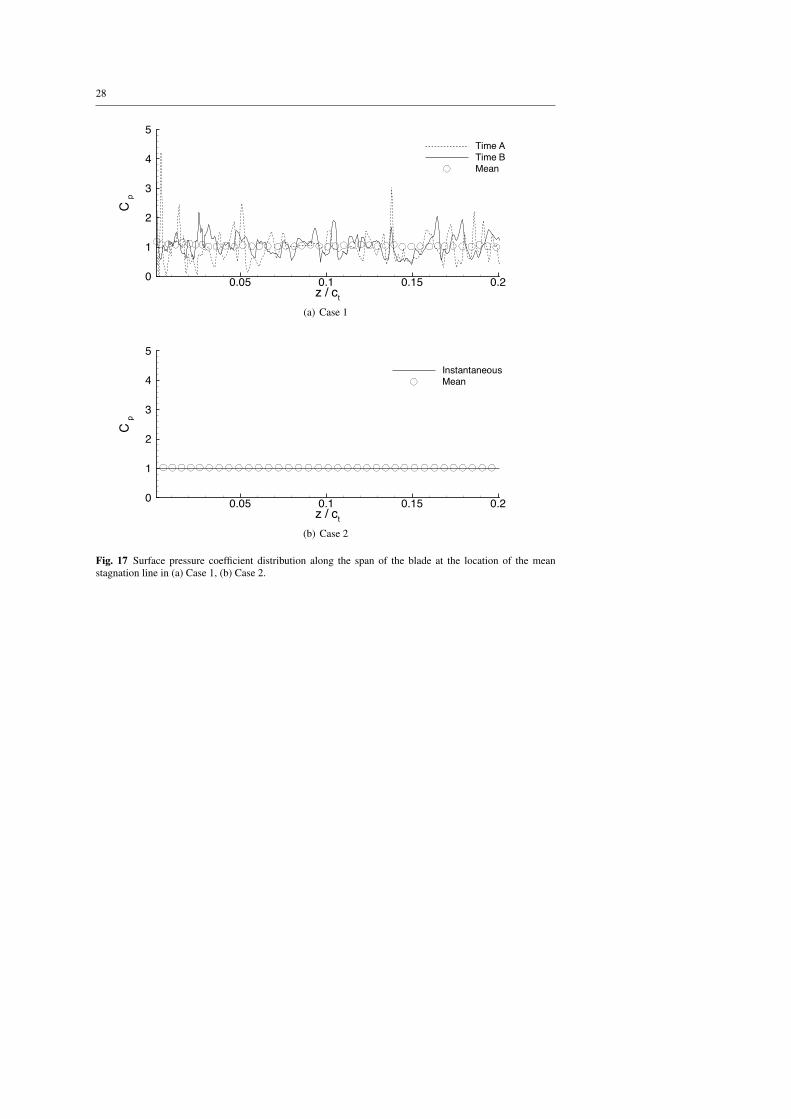
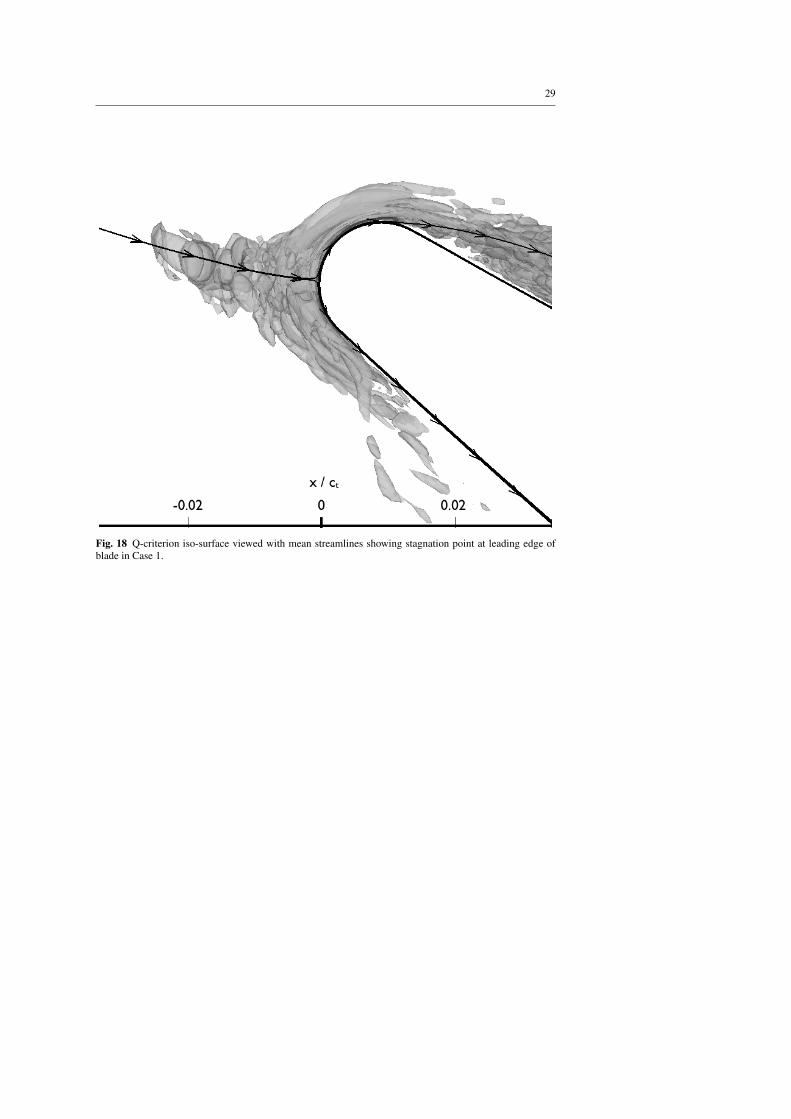
In Case 1, which has the highest negative incidence angle, β = 24.49◦, the evolutionof the flow near to the leading edge of the blade is much different to that of the other neg-ative incidence simulations. A plot of the instantaneous axial velocity, u, at a distance ofr/c = 8.9×10⁻⁴ from the blade surface is shown in Figure 15. Whilst the flow on the pres-sure surface in Figure 15a is qualitatively similar to that in Case 2, the suction-side flowin Case 1(Figure 15b) displays evidence of streaks in the boundary layer at the leadingedge. These streaks suggest that streamwise vorticity is present at the leading edge of theflow. In Figure 16, the Q− iso-surface reveals that axially-orientated vortices are wrappedaround the leading edge of the blade. The K-H vortices that develop from the free shear areseverely distorted by the presence of these vortex structures and quickly break down intothree-dimensional structures. In addition the streaks that wrap around the leading edge donot remain in a fixed position with time; instead they are observed to shift along the span ofthe blade. The presence of these streaks can be traced to the response of the fluid to the stag-nation line across the leading edge of the blade. The static pressure distribution along theleading of the blade in Case 1 at two arbitrary instants in time is shown in Figure 17a, alongwith the mean data. The instantaneous data shows a high degree of temporal variability inthe surface pressure at the leading edge, indicating that the stagnation line across the bladeis unstable, and subsequently the stagnation line does not occur in a fixed position acrossthe span of the blade on an instantaneous basis. The mean flow surface pressure data is, bycontrast, almost constant across the blade span, as would be expected for suitably-convergedtime-averaged samples. When the mean velocity streamlines are plotted with a visualisationof the flow structure in Figure 18 it is evident that the structures form around the mean stag-nation line of the blade. The temporal variability in the stagnation line forces a response inthe fluid upstream of the blade, resulting in the formation of vortices that stretch over theleading edge and influence the blade surface boundary layers.
Data from the stagnation line of Case 2 is presented in Figure 17b, which shows thatthere is little variation between the instantaneous pressure distribution in this region and thetime-averaged mean data. Similar pressure distributions are found at all recorded time in-stants in Case 2, and flow visualisations such as Figure 12 confirm that no vortex structuresare present around the leading edge of the blade at this flow angle. Case 1 is the only simu-lation in the current study that displays evidence of streaks which wrap around the leadingedge.
11
The analysis of the mean and instantaneous flow data obtained from Case 1 highlightsan important consequence of statistical averaging and the elucidation of coherent vortexstructures in fluid flow; from the mean statistical data presented in this research it is prac-tically impossible to conclude that the flow structure in Case 1 is substantially different toany of the other cases simulated – it is only through flow visualisation and the analysis offully-unsteady data that such structures have been educed. The highly transient nature ofthe contra-rotating vortex pairs which wrap themselves around the leading edge would alsoprevent oil-flow or china-clay visualisation techniques from producing any evidence of suchstructures around the leading edge. This is in contrast to the axially-orientated structures inthe boundary layer of yawed bodies which have a regular pattern of development [40].
6.2 Positive Incidence
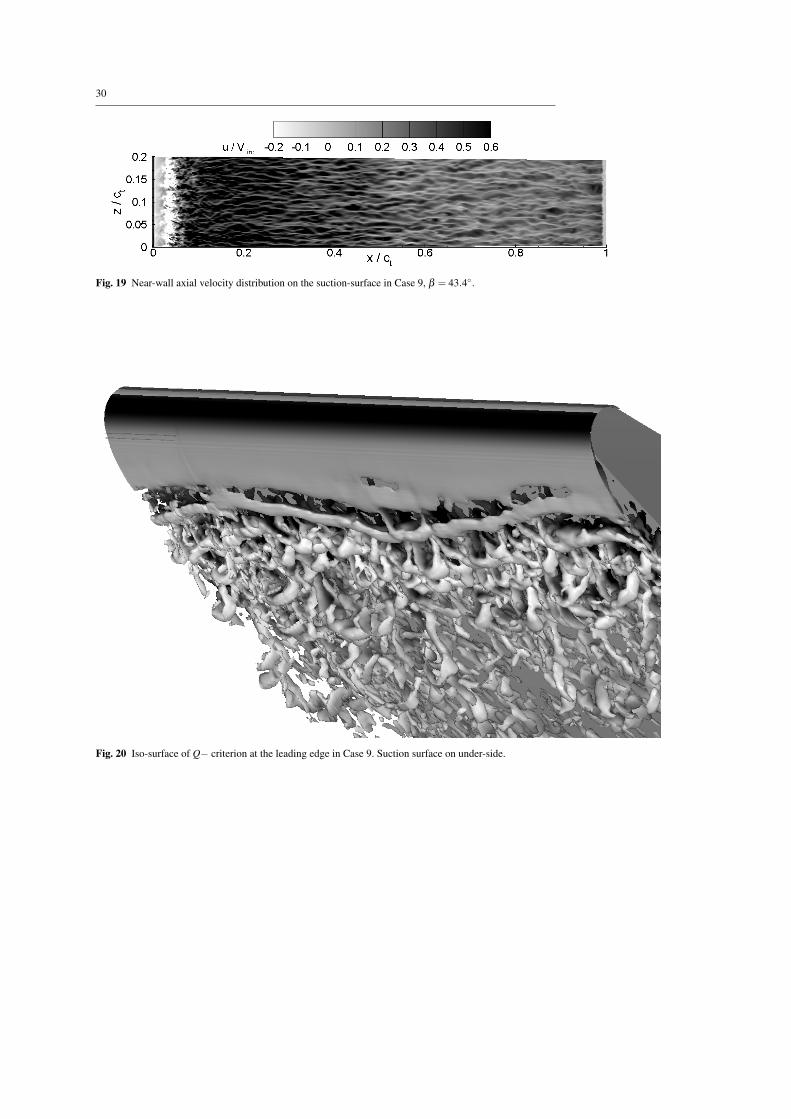
Representative instantaneous axial velocity distributions of the flow at a distance of r/c =8.9×10⁻⁴ from the suction surface in the positive incidence cases are shown from Case 9 inFigure 19. A laminar separation bubble is present near the leading edge of the blade, shownas the light patch in Figure 19. The laminar separation bubble is present for all flow anglesabove the design angle, and the length of the bubble increases with increasing flow angle.The instantaneous position of reattachment is also observed to temporally shift along theblade surface, indicating a high degree of variability with the separation bubble. The low-speed streaks near to the blade surface are also observed on the suction surface at positiveincidence, implying the presence of contra-rotating vortex pairs on a convex surface. Similarstructures have been found on turbine blades, and a recent summary of the evidence for theirexistence has been presented by Gostelow et al. [41].
The vortex structure in the region of the separation bubble is highlighted using theQ−criterion in Figure 20. The development of the suction-side separation bubble for allpositive incidence inflow angles is very similar to that found on the pressure surface in Case2 described above - initially coherent K-H vortices are shed by the shear layer, which arethen rapidly broken down into three-dimensional hairpin vortices as the flow reattaches tothe blade surface. At all positive incidence angles there is no evidence of the formation ofcontra-rotating vortex pairs around the leading edge, as are observed in Case 1.
As was discussed in Section 4 the flow on the pressure side remains laminar over theentire chord at positive incidence. Gortler-type counter-rotating vortices are noted near thetrailing edge of the blade, but these do not cause a transition to turbulence in the boundarylayer at any positive incidence angle.
7 Conclusions
A systematic study of a Controlled Diffusion compressor cascade has been performed usingLarge Eddy Simulation, over a wide range of flow inlet angles at a Reynolds numbers of Re∼ 700,000, based on chord length. The computed surface pressure distributions for all casesagree well with experimental data, particularly at both highly positive and negative incidenceangles, far from the design point of the blade. The boundary layer-thickness, particularly onthe suction-surface, is well-predicted by LES near the design angle, but less well-predictedat off-design angles. The LES fails to resolve the natural boundary layer transition on thepressure surface at positive incidence, a result that may be expected for the grid resolutionused in this study. Near the design angle the loss computed by the LES is in reasonable

12
agreement with experimental data, but at off-design angles the inadequate boundary layerthickness prediction results in discrepancies in the calculated loss.
Inspection of the vortex structure in the flow reveals that a laminar separation bubbleforms near the leading edge of the pressure- and suction-side when the flow is at negativeand positive incidence respectively. In the majority of cases the shear layer that forms abovethe laminar separation bubble sheds spanwise-coherent Kelvin-Helmholtz vortices whichare rapidly broken down into three-dimensional structures. Hairpin vortices are observedto form downstream of the reattachment point, and low-speed streaks are evident in theboundary layer from the reattachment point up to the trailing edge of the blade. At extremenegative incidence, axially-orientated vortex structures are found to form around the leadingedge of the blade, in response to an unsteady stagnation line across the blade span. The lo-cation of the formation of the vortex pairs is highly transient and the mean statistical data ofthe flow around the leading edge offers no direct evidence of their existence, in spite of theiroverall influence on the development of the flow. The lack of evidence of these structuresin mean statistical data indicates that time-dependent flow visualisation techniques will berequired to educe such vortex pairs in experimental researches.
Acknowledgements The permission of Rolls-Royce and CFMS to publish this work is gratefully acknowl-edged. The authors would like to thank Rolls-Royce plc and the UK Technology Strategy Board for thefunding this work under the CFMS Core Programme (TP/L3001H). The simulations in this study were per-formed on HECToR, the UK National Supercomputing Facility, under the UKAAC-2 Framework, EPSRCgrant number EP/F005954/1. One author expresses his gratitude to Professor J. Paul Gostelow for many in-sightful discussions during the analysis of the data presented here. Thanks are also expressed to Mike Howardof Rolls-Royce plc for assistance in interpretation of the experimental measurements.
References
1. Wu, X., Moin P., 2000. A direct numerical simulation study on the mean velocity characteristics inturbulent pipe flow. J. Fluid Mech, 50, 27–61.
2. Wang, Y., Tanahashi, M., Miyauchi, T., 2007. Coherent fine scale eddies in turbulence transition ofspatially-developing mixing layer. Int. J. Heat Fluid Flow, 28, 1280–1290.
3. Wissink, J.G., Rodi, W., 2006. Direct numerical simulation of flow and heat transfer in a turbine cascadewith incoming wakes. J. Fluid Mech., 569, 209–247.
4. Michelassi, V., Wissink, J.G., Frohlich, J., Rodi, W., 2003. Large-Eddy Simulation of Flow Around Low-Pressure Turbine Blade with Incoming Wakes. AIAA J., 41, 2143–2156.
5. Wu, X. and Durbin, P.A., Evidence of longitudinal vortices evolved from distorted wakes in a turbinepassage. J. Fluid Mech., 446, 199-228.
6. Wissink, J.G., Rodi, W., Hodson, H.P., 2006. The influence of disturbances carried by periodically in-coming wakes on the separating flow around a turbine blade. Int. J. Heat Fluid Flow, 27, 721–729
7. You, D., Mittal, R., Wang, M., and Moin, P., 2004. Computational Methodology for Large-Eddy Simu-lation of Tip-Clearance Flows. AIAA J., 42, 271-279.
8. You, D., Mittal, R., Moin, P., and Wang, M., 2004. Effects of tip-gap size on the tip-leakage flow in aturbomachinery cascade. Phys. Fluids, 18, 105102.1-105102.14.
9. You, D., Wang, M., Moin, P., and Mittal, R., 2007. Large-eddy simulation analysis of mechanisms forviscous losses in a turbomachinery tip-clearance flow. J. Fluid Mech., 586, 177-204.
10. Borello, D., Hankalic, K., and Rispoli, F., 2007. Computation of tip-leakage flow in a linear compressorcascade with a second-moment turbulence closure. Int. J. Heat Fluid Flow, 28, 587-601.
11. Matsuura, K., and Kato, C., 2007. Large Eddy Simulation of Compressible Transitional Cascade Flows.J. Fluid Sci. Tech., 2, 558-569.
12. Zaki, T.A., Wissink, J.G., Durbin, P.A., Rodi, W., 2009. Direct Computations of Boundary Lay-ers Distorted by Migrating Wakes in a Linear Compressor Cascade. Flow, Turb. Combust., DOI10.1007/s10494-009-9216-0
13. Roberts, S.K., and Yaras, M.I., 2007. Large-Eddy Simulation of Transition in a Separation Bubble. J.Fluids Eng., 128, 232-238.
13
14. Yang, Z., and Voke, P.R., 2001. Large-eddy simulation of boundary-layer separation and transition at achange of surface curvature. J. Fluid Mech., 439, 305-333.
15. Wu, X., Jacobs, R.G., Hunt, J.C.R., and Durbin, P.A., 1999. Simulation of boundary layer transitioninduced by periodically passing wakes. J. Fluid Mech., 398, 109-153.
16. Gao, S., Voke, P.R., and Gough, T., 1997. Turbulent simulation of a at plate boundary layer and nearwake. Direct and Large Eddy Simulation II, 115-124.
17. Sanger, N.L., 1983. The use of optimization techniques to design controlled-diffusion compressor blad-ing. J. Eng. Power, 105, 256.
18. McMullan, W.A., Page, G.J., 2009, Large Eddy Simulation of a Controlled-Diffusion Cascade Blade atVarying Flow Inlet Angles. ASME GT2009-59668, ASME Turbo Expo 2009, Orlando. FL.
19. McMullan, W.A., Page, G.J., 2010, Loss Coefficient Estimation in a Controlled Diffusion Cascade usingLarge Eddy Simulation. AIAA 2010-315, 49th AIAA Aerospace Science Meeting, Orlando. FL.
20. Crumpton, P.I., Moinier, P., and Giles, M.G., 1997. An Unstructured Algorithm for High Reynolds Num-ber Flows on Highly Stretched Grids. Tenth International Conference on Numerical Methods for Laminarand Turbulent Flow.
21. Tristanto, I.H., Li, Q., Page, G.J., and McGuirk, J.J., 2006. On the Effect of Convective Flux Formationfor LES of Compressible Flows using Hybrid Unstructured Meshes. AIAA Paper 2006–54940, 36THAIAA Fluid Dynamics Conference, San Francisco, California, June 5-8, 2006.
22. Li, Q., Page, G.J., McGuirk, J.J., 2007. Large-eddy simulation of twin impinging jets in crossflow. Aero.J.l, 111, 195–205.
23. Page, G.J., and McGuirk, J.J., 2009. Large Eddy Simulation of a Complete Harrier Aircraft in GroundEffect/ Areo. J., 113, 99–106.
24. Moinier, P., 1998. Algorithm Developments for an Unstructured Viscous Flow Solver. PhD Thesis, Uni-versity of Oxford.
25. Ciardi, M., Sagaut, P., Klein, M. and Dawes, W.N., 2005. A dynamic finite volume scheme for large-eddysimulation on unstructured grids. J. Comp. Phys., 210, 632–655.
26. Ducros, F., Ferrand, V., Nicoud, F., Weber, C., Darracq, D., Gacheriu, C., and Poinsot, T., 1999. Large-Eddy Simulation of the Shock/Turbulence Interaction, J. Comp. Phys., 152, 517–549.
27. Smagorinsky, J., 1963. General circulation experiments with the primitive equations. Mon. Weath. Rev.,91, 99–164.
28. Burgess, D.A., Crumpton, P.I. and Giles, M.B., 1994. A Parallel Framework for Unstructured GridSolvers. Programming Environments for Massively Parallel Distributed Systems, 97 –106.
29. Hills, N., 2007. Achieving High Parallel Performance for an Unstructured Unsteady TurbomachineryCode. Aero. J., 111, 185–193.
30. Koyuncu, Y. 1984. Report of tests of a compressor configuration of CD blading. MS Thesis, NavalPostgraduate School, Monterey, CA.
31. Elazar, Y., Shreeve, R.P., 1990. Viscous flow in a controlled diffusion compressor cascade with increasingincidence. J. Turbomach., 112, 256–265.
32. Shreeve. R.P., Elazar, Y., Dreon, J.W., Baydar, A., 1991. Wake measurements and loss evaluation in acontrolled diffusion compressor cascade. J. Turbomach., 113, 591–599.
33. Elazar, Y., 1988. A Mapping of the Viscous Flow Behavior in a Controlled Diffusion Compressor Cas-cade Using Laser Doppler Velocimetry and Preliminary Evaluation of Codes for the Prediction of Stall,Ph. D. Thesis, Naval Postgraduate School, Monterey, CA.
34. Chen, W.L., Lien, D.S., Leschziner, M.A., 1998. Computational prediction of flow around highly loadedcompressor- cascade blades with non-linear eddy-viscosity models. Int. J. Heat Fluid Flow, 19, 307–319.
35. Ho, W.K., Walker, G.J., Stow, P., 1990. Boundary Layer and Navier-Stokes Analysis of a NASAControlled-Diffusion Compressor Blade. ASME Paper No. 90-GT-236.
36. Sanger, N.L., Shreeve, R.P., 1986. Comparison of calculated and experimental cascade performance forcontrolled-diffusion compressor stator blading. J. Turbomachinery, 108, 42–50.
37. Alam, M., Sandham, N., 2000. Direct numerical simulation of short laminar separation bubbles withturbulent reattachment. J. Fluid Mech., 403, 223–250.
38. Hunt, J.C.R., Wray, A., Moin, P. 1988. Eddies, stream, and convergence zones in turbulent flows. Centrefor Turbulence Research Report CTR-S88.
39. Kiya, M., Sasaki, K., 1983. Structure of a turbulent separation bubble. J. Fluid Mech., 137, 83–113.40. Poll, D., 1985. Some observations of the transition process on the windward face of a long yawed cylin-
der. J. Fluid Mech., 150, 329–356.41. Gostelow, J.P., Mahallati, A., Carscallen, W.E., Rona, A., 2010. Organised streamwise vorticity on con-
vex surfaces with particular reference to turbine blades. AIAA 2010-904, 49th AIAA Aerospace ScienceMeeting, Orlando, FL.
14
Fig. 1 x− y plane through computational domain used in the simulations. Every second grid line shown forclarity.
15
x / c
Cp
0 0.2 0.4 0.6 0.8 1-3
-2
-1
0
1
2
Expt.LES
Fig. 2 Case 8 surface pressure distribution, β = 40◦. Experimental data produced by Elazar and Shreeve[31].
16
ut / Vin
r/c
0 0.2 0.4 0.6 0.8 1 1.2 1.40
0.02
0.04
0.06
0.08
0.1
Expt.LES
(a) x/c = 0.156
ut / Vin
r/c
0 0.2 0.4 0.6 0.8 1 1.2 1.40
0.02
0.04
0.06
0.08
0.1
Expt.LES
(b) x/c = 0.629
ut / Vin
r/c
0 0.2 0.4 0.6 0.8 1 1.2 1.40
0.02
0.04
0.06
0.08
0.1
Expt.LES
(c) x/c = 1.0
Fig. 3 Suction side axial velocity profiles for Case 8. (a) x/c = 0.156, (b) x/c = 0.629, (c) x/c = 1.0.
17
x/c
Ue/V
in
0.2 0.4 0.6 0.8 10.5
0.6
0.7
0.8
0.9
1
1.1
1.2
1.3
1.4
1.5
Expt.LES
Fig. 4 Edge velocity distribution for Case 8.
18
x/c
!/c
-1 -0.8 -0.6 -0.4 -0.2 0 0.2 0.4 0.6 0.8 1
0.02
0.04
0.06
Expt.LES
pressure side suction side
(a) Boundary layer thickness
x/c
!*/c
-1 -0.8 -0.6 -0.4 -0.2 0 0.2 0.4 0.6 0.8 1
0.01
0.02
0.03
Expt.LES
(b) Displacement thickness
x/c
H
-1 -0.8 -0.6 -0.4 -0.2 0 0.2 0.4 0.6 0.8 10
1
2
3
4
5
6
Expt.LES
(c) Shape factor
Fig. 5 Boundary layer integral properties for Case 8. (a) Boundary layer thickness, (b) Displacement thick-ness, (c) Shape factor.
19
Fig. 6 Mean axial velocity near the pressure surface in Case 8.
20
x / c
Cp
0 0.2 0.4 0.6 0.8 1-3
-2
-1
0
1
2
ExptLES
(a) Case 1
x / c
Cp
0 0.2 0.4 0.6 0.8 1-3
-2
-1
0
1
2
ExptLES
(b) Case 6
x / c
Cp
0 0.2 0.4 0.6 0.8 1-3
-2
-1
0
1
2
ExptLES
(c) Case 7
Fig. 7 Surface pressure distributions for Case (a) 1, (b) 6, and (c) 7.
21
x/c
!/c
-1 -0.8 -0.6 -0.4 -0.2 0 0.2 0.4 0.6 0.8 1
0.05
0.1
0.15
Expt.LES
(a) Boundary Layer Thickness
x/c
!*/c
-1 -0.8 -0.6 -0.4 -0.2 0 0.2 0.4 0.6 0.8 1
0.01
0.02
0.03
0.04
0.05
Expt.LES
(b) Displacement Thickness
x/c
H
-1 -0.8 -0.6 -0.4 -0.2 0 0.2 0.4 0.6 0.8 10
1
2
3
4
5
6
Expt.LES
(c) Shape Factor
Fig. 8 Boundary layer properties for Case 7. (a) Boundary layer thickness, (b) Displacement thickness, (c)Shape factor.
22
% span
!
0 20 40 60 80 1000.02
0.03
0.04
0.05
0.06
0.07
0.08
Case 9
Fig. 9 Variation of loss with spanwise distance near the exit plane in Case 9.
23
Air Inlet Angle
!
20 25 30 35 40 45 500
0.02
0.04
0.06
0.08
0.1
Expt.LES
Fig. 10 Loss coefficient variation with flow inlet angle.
24
(a) Pressure side
(b) Suction side
Fig. 11 Near-wall axial velocity distribution for Case 2, β = 28◦. (a) Pressure surface, (b) suction surface.
Fig. 12 Iso-surface of Q− criterion at the leading edge in Case 2. Pressure surface on upper-side.
25
(a) x/ct = 0.02
(b) x/ct = 0.04
(c) x/ct = 0.04
(d) x/ct = 0.06
Fig. 13 Cross-sections through the laminar separation bubble in Case 2. Colourmap as in Figure 14. (a)x/ct = 0.0164, (b) x/ct = 0.0328, x/ct = 0.0492, x/ct = 0.0656.
26
Fig. 14 Cross-section through the boundary layer of Case 2 at the approximate flow reattachment location,x/ct = 0.0984.
(a) Pressure side
(b) Suction side
Fig. 15 Near-wall axial velocity distribution for Case 1, β = 24.49◦. (a) Pressure surface, (b) suction surface.
27
Fig. 16 Iso-surface of Q > 0 at the leading edge in Case 1. Pressure surface on upper-side.
28
z / ct
Cp
0.05 0.1 0.15 0.20
1
2
3
4
5Time ATime BMean
(a) Case 1
z / ct
Cp
0.05 0.1 0.15 0.20
1
2
3
4
5InstantaneousMean
(b) Case 2
Fig. 17 Surface pressure coefficient distribution along the span of the blade at the location of the meanstagnation line in (a) Case 1, (b) Case 2.
29
Fig. 18 Q-criterion iso-surface viewed with mean streamlines showing stagnation point at leading edge ofblade in Case 1.
30
Fig. 19 Near-wall axial velocity distribution on the suction-surface in Case 9, β = 43.4◦.
Fig. 20 Iso-surface of Q− criterion at the leading edge in Case 9. Suction surface on under-side.
Related Documents


