1 SEI Institutional Managed Trust / Quarterly Report / December 31, 2021 SCHEDULE OF INVESTMENTS (Unaudited) December 31, 2021 Large Cap Fund Description Shares Market Value ($ Thousands) COMMON STOCK — 98.7% Communication Services — 6.2% Alphabet Inc, ClA * 4,756 $ 13,778 Alphabet Inc, ClC * 11,060 32,003 AT&T Inc 312,841 7,696 Comcast Corp, Cl A 142,077 7,151 Fox Corp 48,678 1,796 Live Nation Entertainment Inc * 29,670 3,551 Meta Platforms Inc, ClA * 80,395 27,041 Netflix Inc * 17,691 10,658 Nexstar Media Group Inc, Cl A 2,988 451 Omnicom Group Inc 22,156 1,623 Roku Inc, ClA * 12,615 2,879 Sea Ltd ADR * 12,996 2,907 Snap Inc, ClA * 77,887 3,663 TEGNA Inc 171,512 3,183 T-Mobile US Inc * 52,721 6,115 Verizon Communications Inc 280,734 14,587 ViacomCBS Inc, Cl B 22,664 684 139,766 Consumer Discretionary — 10.8% Advance Auto Parts Inc 35,133 8,428 Amazon.com Inc, ClA * 14,275 47,598 AutoZone Inc * 242 507 Best Buy Co Inc 38,681 3,930 BorgWarner Inc 244,805 11,033 Capri Holdings Ltd * 42,465 2,756 Carnival Corp *(A) 59,440 1,196 Carvana Co, Cl A * 8,458 1,961 Dick's Sporting Goods Inc 36,476 4,194 Dillard's Inc, Cl A 8,887 2,178 Dollar General Corp 40,005 9,434 DR Horton Inc 43,190 4,684 eBay Inc 56,727 3,772 Foot Locker Inc, Cl A 32,278 1,408 Ford Motor Co 147,806 3,070 General Motors Co * 239,785 14,059 Goodyear Tire & Rubber Co/The * 38,367 818 Harley-Davidson Inc, Cl A 49,267 1,857 Kohl's Corp 40,786 2,015 Lear Corp 26,627 4,872 Lennar Corp, Cl A 6,546 760 Lithia Motors Inc, Cl A 11,143 3,309 Lowe's Cos Inc 63,687 16,462 Magna International Inc, Cl A 49,219 3,984 MGM Resorts International 69,453 3,117 NIKE Inc, Cl B 70,519 11,753 PulteGroup Inc 217,624 12,439 Ralph Lauren Corp, Cl A 69,438 8,253 Ross Stores Inc 113,243 12,942 Starbucks Corp 75,737 8,859 Target Corp, Cl A 35,789 8,283 Description Shares Market Value ($ Thousands) COMMON STOCK (continued) Tesla Inc * 9,964 $ 10,530 Thor Industries Inc 33,250 3,450 Whirlpool Corp 27,260 6,397 240,308 Consumer Staples — 6.5% Altria Group Inc 159,288 7,549 Coca-Cola Co/The 128,168 7,589 Coca-Cola Europacific Partners PLC 137,396 7,684 Conagra Brands Inc 268,905 9,183 General Mills Inc 33,531 2,259 Ingredion Inc 89,406 8,640 J M Smucker Co/The 88,472 12,016 Kraft Heinz Co/The 17,400 625 Kroger Co/The 475,042 21,500 Molson Coors Beverage Co, Cl B 44,786 2,076 Mondelez International Inc, Cl A 7,300 484 PepsiCo Inc 63,667 11,059 Philip Morris International Inc 159,775 15,179 Procter & Gamble Co/The 7,458 1,220 Sysco Corp, Cl A 107,202 8,421 Tyson Foods Inc, Cl A 115,368 10,055 Unilever PLC ADR 286,631 15,418 US Foods Holding Corp * 55,086 1,919 Walgreens Boots Alliance Inc 38,917 2,030 144,906 Energy — 2.6% Baker Hughes Co, Cl A 561,897 13,519 BP PLC ADR 99,562 2,651 Canadian Natural Resources Ltd 120,423 5,088 Chevron Corp 67,685 7,943 ConocoPhillips 82,779 5,975 Devon Energy Corp 128,185 5,646 Exxon Mobil Corp 7,057 432 HollyFrontier Corp 50,627 1,659 Marathon Petroleum Corp 120,125 7,687 Phillips 66 43,346 3,141 Valero Energy Corp 54,263 4,076 57,817 Financials — 15.0% Aflac Inc 94,072 5,493 American Express Co 14,850 2,430 American Financial Group Inc/OH 4,314 592 Ameriprise Financial Inc 25,172 7,593 Annaly Capital Management Inc ‡ 88,276 690 Banco Santander SA ADR 322,550 1,061 Bank of America Corp 440,737 19,608 Bank of New York Mellon Corp/The 19,244 1,118 Berkshire Hathaway Inc, ClB * 88,045 26,325 Capital One Financial Corp 131,028 19,011 Charles Schwab Corp/The 152,473 12,823

Welcome message from author
This document is posted to help you gain knowledge. Please leave a comment to let me know what you think about it! Share it to your friends and learn new things together.
Transcript

1SEI Institutional Managed Trust / Quarterly Report / December 31, 2021
SCHEDULE OF INVESTMENTS (Unaudited)December 31, 2021
Large Cap Fund
Description SharesMarket Value
($ Thousands)
COMMON STOCK — 98.7%
Communication Services — 6.2%Alphabet Inc, Cl A * 4,756 $ 13,778Alphabet Inc, Cl C * 11,060 32,003AT&T Inc 312,841 7,696Comcast Corp, Cl A 142,077 7,151Fox Corp 48,678 1,796Live Nation Entertainment Inc * 29,670 3,551Meta Platforms Inc, Cl A * 80,395 27,041Netflix Inc * 17,691 10,658Nexstar Media Group Inc, Cl A 2,988 451Omnicom Group Inc 22,156 1,623Roku Inc, Cl A * 12,615 2,879Sea Ltd ADR * 12,996 2,907Snap Inc, Cl A * 77,887 3,663TEGNA Inc 171,512 3,183T-Mobile US Inc * 52,721 6,115Verizon Communications Inc 280,734 14,587ViacomCBS Inc, Cl B 22,664 684
139,766Consumer Discretionary — 10.8%
Advance Auto Parts Inc 35,133 8,428Amazon.com Inc, Cl A * 14,275 47,598AutoZone Inc * 242 507Best Buy Co Inc 38,681 3,930BorgWarner Inc 244,805 11,033Capri Holdings Ltd * 42,465 2,756Carnival Corp *(A) 59,440 1,196Carvana Co, Cl A * 8,458 1,961Dick's Sporting Goods Inc 36,476 4,194Dillard's Inc, Cl A 8,887 2,178Dollar General Corp 40,005 9,434DR Horton Inc 43,190 4,684eBay Inc 56,727 3,772Foot Locker Inc, Cl A 32,278 1,408Ford Motor Co 147,806 3,070General Motors Co * 239,785 14,059Goodyear Tire & Rubber Co/The * 38,367 818Harley-Davidson Inc, Cl A 49,267 1,857Kohl's Corp 40,786 2,015Lear Corp 26,627 4,872Lennar Corp, Cl A 6,546 760Lithia Motors Inc, Cl A 11,143 3,309Lowe's Cos Inc 63,687 16,462Magna International Inc, Cl A 49,219 3,984MGM Resorts International 69,453 3,117NIKE Inc, Cl B 70,519 11,753PulteGroup Inc 217,624 12,439Ralph Lauren Corp, Cl A 69,438 8,253Ross Stores Inc 113,243 12,942Starbucks Corp 75,737 8,859Target Corp, Cl A 35,789 8,283
Description SharesMarket Value
($ Thousands)
COMMON STOCK (continued)Tesla Inc * 9,964 $ 10,530Thor Industries Inc 33,250 3,450Whirlpool Corp 27,260 6,397
240,308Consumer Staples — 6.5%
Altria Group Inc 159,288 7,549Coca-Cola Co/The 128,168 7,589Coca-Cola Europacific Partners PLC 137,396 7,684Conagra Brands Inc 268,905 9,183General Mills Inc 33,531 2,259Ingredion Inc 89,406 8,640J M Smucker Co/The 88,472 12,016Kraft Heinz Co/The 17,400 625Kroger Co/The 475,042 21,500Molson Coors Beverage Co, Cl B 44,786 2,076Mondelez International Inc, Cl A 7,300 484PepsiCo Inc 63,667 11,059Philip Morris International Inc 159,775 15,179Procter & Gamble Co/The 7,458 1,220Sysco Corp, Cl A 107,202 8,421Tyson Foods Inc, Cl A 115,368 10,055Unilever PLC ADR 286,631 15,418US Foods Holding Corp * 55,086 1,919Walgreens Boots Alliance Inc 38,917 2,030
144,906Energy — 2.6%
Baker Hughes Co, Cl A 561,897 13,519BP PLC ADR 99,562 2,651Canadian Natural Resources Ltd 120,423 5,088Chevron Corp 67,685 7,943ConocoPhillips 82,779 5,975Devon Energy Corp 128,185 5,646Exxon Mobil Corp 7,057 432HollyFrontier Corp 50,627 1,659Marathon Petroleum Corp 120,125 7,687Phillips 66 43,346 3,141Valero Energy Corp 54,263 4,076
57,817Financials — 15.0%
Aflac Inc 94,072 5,493American Express Co 14,850 2,430American Financial Group Inc/OH 4,314 592Ameriprise Financial Inc 25,172 7,593Annaly Capital Management Inc ‡ 88,276 690Banco Santander SA ADR 322,550 1,061Bank of America Corp 440,737 19,608Bank of New York Mellon Corp/The 19,244 1,118Berkshire Hathaway Inc, Cl B * 88,045 26,325Capital One Financial Corp 131,028 19,011Charles Schwab Corp/The 152,473 12,823

SEI Institutional Managed Trust / Quarterly Report / December 31, 20212
SCHEDULE OF INVESTMENTS (Unaudited)December 31, 2021
Large Cap Fund (Continued)
Description SharesMarket Value
($ Thousands)
COMMON STOCK (continued)Citigroup Inc 195,670 $ 11,817Citizens Financial Group Inc 93,732 4,429Discover Financial Services 32,032 3,702Essent Group Ltd 25,116 1,144Everest Re Group Ltd 1,843 505Fifth Third Bancorp 146,251 6,369First American Financial Corp 6,938 543First Republic Bank/CA 94,489 19,513Goldman Sachs Group Inc/The 3,354 1,283Hartford Financial Services Group Inc/The 89,538 6,182JPMorgan Chase & Co 18,878 2,989KeyCorp 134,532 3,112KKR & Co Inc 55,247 4,116Lincoln National Corp 13,729 937Markel Corp * 11,289 13,931Marsh & McLennan Cos Inc 75,695 13,157MFA Financial Inc ‡ 119,753 546Moody's Corp 38,887 15,189Morgan Stanley 71,661 7,034New York Community Bancorp Inc 257,982 3,150Popular Inc 60,934 4,999Progressive Corp/The 58,789 6,035Radian Group Inc 32,673 690Regions Financial Corp 247,865 5,403S&P Global Inc 33,921 16,008Signature Bank/New York NY, Cl B 17,706 5,727SLM Corp 302,734 5,955State Street Corp 138,447 12,876Synchrony Financial 226,312 10,499Two Harbors Investment Corp ‡ 319,745 1,845Unum Group 18,535 455US Bancorp 323,806 18,188Voya Financial Inc 62,675 4,156Wells Fargo & Co 156,050 7,487Willis Towers Watson PLC 60,162 14,288Zions Bancorp NA 94,033 5,939
336,942Health Care — 13.5%
AbbVie Inc 51,700 7,000Align Technology Inc * 6,761 4,443AmerisourceBergen Corp, Cl A 93,784 12,463Amgen Inc, Cl A 57,858 13,016AstraZeneca PLC ADR 97,023 5,652Biogen Inc * 6,978 1,674Bristol-Myers Squibb Co 155,447 9,692Cardinal Health Inc 39,549 2,036Catalent Inc * 41,341 5,293CVS Health Corp 213,102 21,984Danaher Corp, Cl A 43,061 14,168DaVita Inc * 13,397 1,524DENTSPLY SIRONA Inc 118,511 6,612
Description SharesMarket Value
($ Thousands)
COMMON STOCK (continued)Dexcom Inc * 5,776 $ 3,102Doximity Inc, Cl A * 19,091 957Gilead Sciences Inc 34,934 2,537GlaxoSmithKline PLC ADR 38,428 1,695HCA Healthcare Inc 20,926 5,376Humana Inc 32,922 15,271IDEXX Laboratories Inc * 687 452Intra-Cellular Therapies Inc, Cl A * 36,662 1,919Jazz Pharmaceuticals PLC * 31,551 4,020Johnson & Johnson 217,191 37,155McKesson Corp 27,209 6,763Medtronic PLC 114,386 11,833Merck & Co Inc 121,115 9,282Mettler-Toledo International Inc * 9,933 16,858Natera Inc * 10,152 948Organon & Co 22,650 690PerkinElmer Inc 55,075 11,073Perrigo Co PLC 79,503 3,093Pfizer Inc 298,827 17,646Regeneron Pharmaceuticals Inc * 10,283 6,494Thermo Fisher Scientific Inc 8,995 6,002UnitedHealth Group Inc 54,171 27,202Viatris Inc, Cl W * 103,502 1,400Zimmer Biomet Holdings Inc 39,405 5,006
302,331Industrials — 10.3%
AerCap Holdings NV * 62,810 4,109AGCO Corp 49,960 5,796Allison Transmission Holdings Inc 48,690 1,770American Airlines Group Inc * 27,189 488AMETEK Inc 39,693 5,836Booz Allen Hamilton Holding Corp, Cl A 96,444 8,178Cintas Corp 11,523 5,107Cummins Inc 35,236 7,686Delta Air Lines Inc, Cl A * 24,730 966Eaton Corp PLC 30,927 5,345FedEx Corp 30,852 7,980Fortive Corp 169,478 12,929General Electric Co 75,955 7,175Honeywell International Inc 118,454 24,699Huntington Ingalls Industries Inc, Cl A 16,114 3,009Ingersoll Rand Inc 151,734 9,388L3Harris Technologies Inc 28,887 6,160Lockheed Martin Corp 4,348 1,545ManpowerGroup Inc 29,203 2,842Northrop Grumman Corp 2,095 811Oshkosh Corp 8,732 984Owens Corning 34,317 3,106Parker-Hannifin Corp, Cl A 25,904 8,241Robert Half International Inc 3,862 431Roper Technologies Inc 21,548 10,599
3SEI Institutional Managed Trust / Quarterly Report / December 31, 2021
SCHEDULE OF INVESTMENTS (Unaudited)December 31, 2021
Large Cap Fund (Continued)
Description SharesMarket Value
($ Thousands)
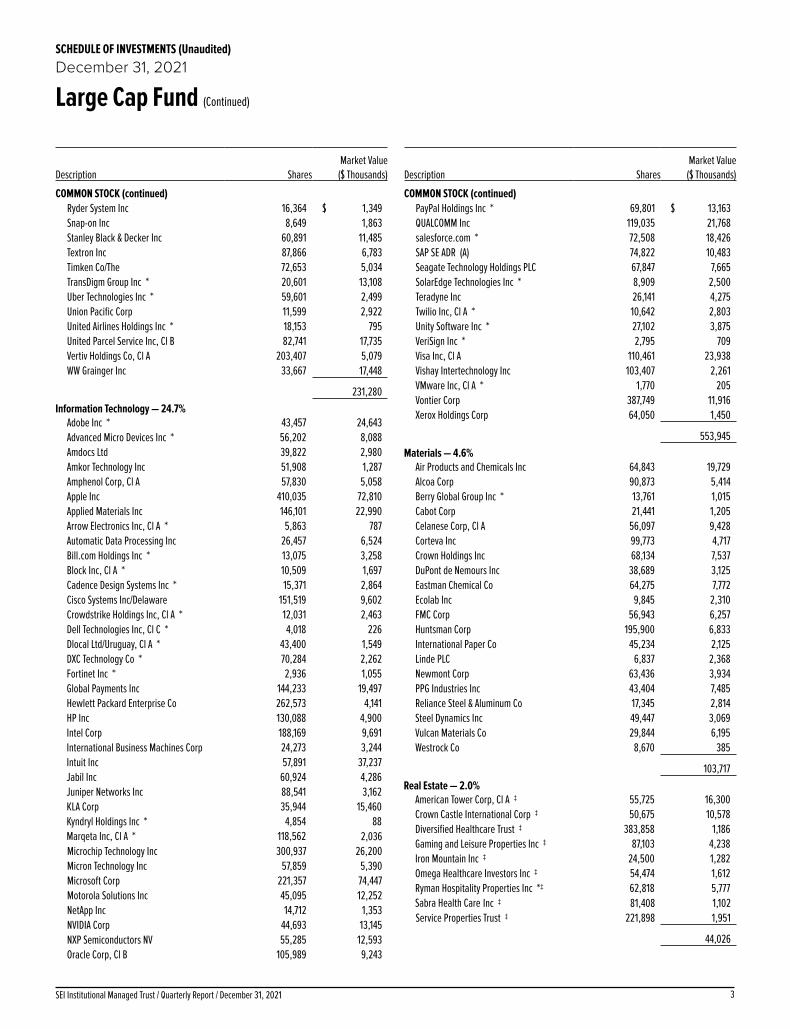
COMMON STOCK (continued)Ryder System Inc 16,364 $ 1,349Snap-on Inc 8,649 1,863Stanley Black & Decker Inc 60,891 11,485Textron Inc 87,866 6,783Timken Co/The 72,653 5,034TransDigm Group Inc * 20,601 13,108Uber Technologies Inc * 59,601 2,499Union Pacific Corp 11,599 2,922United Airlines Holdings Inc * 18,153 795United Parcel Service Inc, Cl B 82,741 17,735Vertiv Holdings Co, Cl A 203,407 5,079WW Grainger Inc 33,667 17,448
231,280Information Technology — 24.7%
Adobe Inc * 43,457 24,643Advanced Micro Devices Inc * 56,202 8,088Amdocs Ltd 39,822 2,980Amkor Technology Inc 51,908 1,287Amphenol Corp, Cl A 57,830 5,058Apple Inc 410,035 72,810Applied Materials Inc 146,101 22,990Arrow Electronics Inc, Cl A * 5,863 787Automatic Data Processing Inc 26,457 6,524Bill.com Holdings Inc * 13,075 3,258Block Inc, Cl A * 10,509 1,697Cadence Design Systems Inc * 15,371 2,864Cisco Systems Inc/Delaware 151,519 9,602Crowdstrike Holdings Inc, Cl A * 12,031 2,463Dell Technologies Inc, Cl C * 4,018 226Dlocal Ltd/Uruguay, Cl A * 43,400 1,549DXC Technology Co * 70,284 2,262Fortinet Inc * 2,936 1,055Global Payments Inc 144,233 19,497Hewlett Packard Enterprise Co 262,573 4,141HP Inc 130,088 4,900Intel Corp 188,169 9,691International Business Machines Corp 24,273 3,244Intuit Inc 57,891 37,237Jabil Inc 60,924 4,286Juniper Networks Inc 88,541 3,162KLA Corp 35,944 15,460Kyndryl Holdings Inc * 4,854 88Marqeta Inc, Cl A * 118,562 2,036Microchip Technology Inc 300,937 26,200Micron Technology Inc 57,859 5,390Microsoft Corp 221,357 74,447Motorola Solutions Inc 45,095 12,252NetApp Inc 14,712 1,353NVIDIA Corp 44,693 13,145NXP Semiconductors NV 55,285 12,593Oracle Corp, Cl B 105,989 9,243
Description SharesMarket Value
($ Thousands)
COMMON STOCK (continued)PayPal Holdings Inc * 69,801 $ 13,163QUALCOMM Inc 119,035 21,768salesforce.com * 72,508 18,426SAP SE ADR (A) 74,822 10,483Seagate Technology Holdings PLC 67,847 7,665SolarEdge Technologies Inc * 8,909 2,500Teradyne Inc 26,141 4,275Twilio Inc, Cl A * 10,642 2,803Unity Software Inc * 27,102 3,875VeriSign Inc * 2,795 709Visa Inc, Cl A 110,461 23,938Vishay Intertechnology Inc 103,407 2,261VMware Inc, Cl A * 1,770 205Vontier Corp 387,749 11,916Xerox Holdings Corp 64,050 1,450
553,945Materials — 4.6%
Air Products and Chemicals Inc 64,843 19,729Alcoa Corp 90,873 5,414Berry Global Group Inc * 13,761 1,015Cabot Corp 21,441 1,205Celanese Corp, Cl A 56,097 9,428Corteva Inc 99,773 4,717Crown Holdings Inc 68,134 7,537DuPont de Nemours Inc 38,689 3,125Eastman Chemical Co 64,275 7,772Ecolab Inc 9,845 2,310FMC Corp 56,943 6,257Huntsman Corp 195,900 6,833International Paper Co 45,234 2,125Linde PLC 6,837 2,368Newmont Corp 63,436 3,934PPG Industries Inc 43,404 7,485Reliance Steel & Aluminum Co 17,345 2,814Steel Dynamics Inc 49,447 3,069Vulcan Materials Co 29,844 6,195Westrock Co 8,670 385
103,717Real Estate — 2.0%
American Tower Corp, Cl A ‡ 55,725 16,300Crown Castle International Corp ‡ 50,675 10,578Diversified Healthcare Trust ‡ 383,858 1,186Gaming and Leisure Properties Inc ‡ 87,103 4,238Iron Mountain Inc ‡ 24,500 1,282Omega Healthcare Investors Inc ‡ 54,474 1,612Ryman Hospitality Properties Inc *‡ 62,818 5,777Sabra Health Care Inc ‡ 81,408 1,102Service Properties Trust ‡ 221,898 1,951
44,026

SEI Institutional Managed Trust / Quarterly Report / December 31, 20214
SCHEDULE OF INVESTMENTS (Unaudited)December 31, 2021
Large Cap Fund (Continued)
Description SharesMarket Value
($ Thousands)
COMMON STOCK (continued)Utilities — 2.5%
Edison International 14,675 $ 1,002FirstEnergy Corp 156,616 6,514MDU Resources Group Inc 97,537 3,008NextEra Energy Inc 178,607 16,675NiSource Inc 324,536 8,960NRG Energy Inc 85,945 3,702PPL Corp 210,324 6,322UGI Corp 139,722 6,415Vistra Corp 157,982 3,597
56,195
Total Common Stock
(Cost $1,263,025) ($ Thousands) 2,211,233
Description SharesMarket Value
($ Thousands)
AFFILIATED PARTNERSHIP — 0.1%SEI Liquidity Fund, L.P.
0.020% **†(B) 2,372,700 $ 2,377
Total Affiliated Partnership (Cost $2,371) ($ Thousands) 2,377
CASH EQUIVALENT — 1.2%SEI Daily Income Trust, Government
Fund, Cl F0.010%**† 27,845,422 27,845
Total Cash Equivalent(Cost $27,845) ($ Thousands) 27,845
Total Investments in Securities — 100.0%(Cost $1,293,241) ($ Thousands) $ 2,241,455
A list of the open futures contracts held by the Fund at December 31, 2021, is as follows:
Type of ContractNumber of Contracts
Expiration Date
Notional Amount (Thousands) Value (Thousands)
Unrealized Appreciation (Thousands)
Long ContractsS&P 500 Index E-MINI 100 Mar-2022 $ 23,283 $ 23,792 $ 509S&P Mid Cap 400 Index E-MINI 9 Mar-2022 2,480 2,554 74
$ 25,763 $ 26,346 $ 583
Percentages are based on Net Assets of $2,240,961 ($ Thousands).* Non-income producing security.** Rate shown is the 7-day effective yield as of December 31, 2021.† Investment in Affiliated Security.‡ Real Estate Investment Trust.(A) Certain securities or partial positions of certain securities are on loan at
December 31, 2021. The total market value of securities on loan at December 31, 2021 was $2,284 ($ Thousands).
(B) This security was purchased with cash collateral held from securities on loan. The total market value of such securities as of December 31, 2021 was $2,377 ($ Thousands).
ADR — American Depositary ReceiptCl — ClassL.P. — Limited PartnershipLtd. — LimitedPLC — Public Limited CompanyS&P— Standard & Poor'sSer — Series
The following is a list of the levels of inputs used as of December 31, 2021 in valuing the Fund’s investments and other financial instruments carried at value ($ Thousands):
Investments in SecuritiesLevel 1
($)Level 2
($)Level 3
($)Total
($)Common Stock 2,211,233 – – 2,211,233Affiliated Partnership – 2,377 – 2,377Cash Equivalent 27,845 – – 27,845
Total Investments in Securities 2,239,078 2,377 – 2,241,455
Other Financial InstrumentsLevel 1
($)Level 2
($)Level 3
($)Total
($)Futures Contracts*
Unrealized Appreciation 583 – – 583
Total Other Financial Instruments 583 – – 583*Futures contracts are valued at the unrealized appreciation on the instrument.
For the period ended December 31, 2021, there were no transfers in or out of Level 3.
For information regarding the Fund’s policy regarding valuation of investments and other significant accounting policies, please refer to the Fund’s more recent semi-annual and annual financial statements.

5SEI Institutional Managed Trust / Quarterly Report / December 31, 2021
SCHEDULE OF INVESTMENTS (Unaudited)December 31, 2021
Large Cap Fund (Concluded)
The following is a summary of the transactions with affiliates for the period ended December 31, 2021 ($ Thousands):
Security Description 9/30/2021 Purchases at Cost Proceeds from
Sales Realized Gain/
(Loss)
Change in Unrealized
Appreciation/(Depreciation)
Value 12/31/2021 Shares Income Capital Gains
SEI Liquidity Fund, L.P. $ 16,145 $ 25,252 $ (39,020) $ — $ — $ 2,377 2,372,700 $ 6 $ — SEI Daily Income Trust, Government Fund, Cl F 19,853 120,292 (112,301) 1 — 27,845 27,845,422 1 — Totals $ 35,998 $ 145,544 $ (151,321) $ 1 $ — $ 30,222 $ 7 $ —
Amounts designated as “—” are $0 or have been rounded to $0.

1SEI Institutional Managed Trust / Quarterly Report / December 31, 2021
SCHEDULE OF INVESTMENTS (Unaudited)December 31, 2021
Large Cap Value Fund
Description SharesMarket Value
($ Thousands)
COMMON STOCK — 98.9%
Communication Services — 5.4%AT&T Inc 1,031,235 $ 25,368BCE Inc 294,510 15,326Comcast Corp, Cl A 189,923 9,559Fox Corp, Cl A 114,572 4,228Meta Platforms Inc, Cl A * 14,359 4,830Omnicom Group Inc 123,622 9,058TEGNA Inc 136,100 2,526T-Mobile US Inc * 44,826 5,199Verizon Communications Inc 209,421 10,881ViacomCBS Inc, Cl B 47,731 1,440
88,415Consumer Discretionary — 7.7%
Best Buy Co Inc 62,685 6,369Carnival Corp *(A) 89,490 1,801Dick's Sporting Goods Inc 21,511 2,473Dillard's Inc, Cl A (A) 12,276 3,008DR Horton Inc 5,315 576eBay Inc 41,518 2,761Foot Locker Inc, Cl A 38,308 1,671Ford Motor Co 192,027 3,988General Motors Co * 265,937 15,592Genuine Parts Co 132,329 18,553Goodyear Tire & Rubber Co/The * 72,101 1,537Harley-Davidson Inc, Cl A 26,082 983Kohl's Corp 6,552 324Lear Corp 12,142 2,221Lennar Corp, Cl A 6,006 698Lowe's Cos Inc 52,140 13,477Magna International Inc, Cl A 24,663 1,996PulteGroup Inc 215,305 12,307Target Corp, Cl A 106,998 24,764Thor Industries Inc 36,139 3,750Whirlpool Corp 24,849 5,831
124,680Consumer Staples — 8.3%
Altria Group Inc 207,317 9,825Conagra Brands Inc 146,906 5,017Diageo PLC ADR 39,610 8,720General Mills Inc 4,632 312Ingredion Inc 83,947 8,113J M Smucker Co/The 17,549 2,384Kimberly-Clark Corp 79,941 11,425Kraft Heinz Co/The 56,221 2,018Kroger Co/The 458,739 20,762Molson Coors Beverage Co, Cl B 115,655 5,361Philip Morris International Inc 185,286 17,602Procter & Gamble Co/The 29,779 4,871Tyson Foods Inc, Cl A 168,142 14,655Unilever PLC ADR 172,247 9,265
Description SharesMarket Value
($ Thousands)
COMMON STOCK (continued)Walgreens Boots Alliance Inc 220,812 $ 11,518Walmart Inc 18,886 2,733
134,581Energy — 4.8%
BP PLC ADR 127,923 3,407Canadian Natural Resources Ltd 109,363 4,621Chevron Corp 193,503 22,708ConocoPhillips 250,305 18,067Devon Energy Corp 88,155 3,883Exxon Mobil Corp 193,469 11,838HollyFrontier Corp 55,971 1,835Marathon Petroleum Corp 78,478 5,022Phillips 66 31,140 2,256Valero Energy Corp 60,065 4,511
78,148Financials — 20.1%
Aflac Inc 88,114 5,145Allstate Corp/The 34,766 4,090American Financial Group Inc/OH 21,126 2,901Ameriprise Financial Inc 27,250 8,220Annaly Capital Management Inc ‡ 292,976 2,291Banco Santander SA ADR 752,254 2,475Bank of America Corp 657,400 29,248Bank of New York Mellon Corp/The 201,580 11,708Berkshire Hathaway Inc, Cl B * 43,288 12,943Capital One Financial Corp 28,002 4,063Chubb Ltd 94,141 18,198Citigroup Inc 538,848 32,541Citizens Financial Group Inc 139,869 6,609Discover Financial Services 37,526 4,336Essent Group Ltd 27,172 1,237Fifth Third Bancorp 113,014 4,922First American Financial Corp 19,225 1,504Goldman Sachs Group Inc/The 7,938 3,037Hartford Financial Services Group Inc/The 40,505 2,796JPMorgan Chase & Co 171,797 27,204KeyCorp 125,944 2,913KKR & Co Inc 30,397 2,265Lincoln National Corp 29,914 2,042MetLife Inc 85,353 5,334Morgan Stanley 281,159 27,598New York Community Bancorp Inc 262,592 3,206Popular Inc 58,412 4,792Principal Financial Group Inc, Cl A 7,330 530Prudential Financial Inc 60,510 6,550Radian Group Inc 35,327 746Regions Financial Corp 201,984 4,403SLM Corp 310,194 6,102State Street Corp 47,517 4,419Synchrony Financial 153,808 7,135T Rowe Price Group Inc 16,506 3,246

SEI Institutional Managed Trust / Quarterly Report / December 31, 20212
SCHEDULE OF INVESTMENTS (Unaudited)December 31, 2021
Large Cap Value Fund (Continued)
Description SharesMarket Value
($ Thousands)
COMMON STOCK (continued)Travelers Cos Inc/The 50,275 $ 7,865Truist Financial Corp 211,571 12,387Two Harbors Investment Corp ‡ 381,659 2,202Unum Group 55,915 1,374Voya Financial Inc 105,231 6,978Wells Fargo & Co 421,711 20,234Willis Towers Watson PLC 16,379 3,890Zions Bancorp NA 90,973 5,746
327,425Health Care — 16.6%
AbbVie Inc 51,187 6,931Amgen Inc, Cl A 23,008 5,176AstraZeneca PLC ADR 92,031 5,361Biogen Inc * 9,569 2,296Bristol-Myers Squibb Co 183,512 11,442Cardinal Health Inc 117,940 6,073Cigna Corp 28,504 6,545CVS Health Corp 207,302 21,385DaVita Inc * 27,976 3,183Eli Lilly & Co 48,685 13,448Gilead Sciences Inc 101,959 7,403GlaxoSmithKline PLC ADR 91,555 4,037HCA Healthcare Inc 27,187 6,985Hologic Inc * 16,620 1,272Intra-Cellular Therapies Inc, Cl A * 53,056 2,777Jazz Pharmaceuticals PLC * 46,680 5,947Johnson & Johnson 178,474 30,532McKesson Corp 48,778 12,125Medtronic PLC 169,834 17,569Merck & Co Inc 336,093 25,758Novartis AG ADR 152,220 13,315Organon & Co 25,161 766Pfizer Inc 813,860 48,058Regeneron Pharmaceuticals Inc * 5,277 3,333Viatris Inc, Cl W * 291,220 3,940Zimmer Biomet Holdings Inc 38,596 4,903
270,560Industrials — 10.4%
3M Co 61,376 10,902AerCap Holdings NV * 64,608 4,227AGCO Corp 40,664 4,718Allison Transmission Holdings Inc 68,559 2,492American Airlines Group Inc * 41,207 740Cummins Inc 46,257 10,091Delta Air Lines Inc, Cl A * 55,046 2,151FedEx Corp 33,908 8,770General Dynamics Corp 66,258 13,813Huntington Ingalls Industries Inc, Cl A 16,362 3,055Johnson Controls International plc 320,628 26,070L3Harris Technologies Inc 7,044 1,502Lockheed Martin Corp 10,513 3,736
Description SharesMarket Value
($ Thousands)
COMMON STOCK (continued)ManpowerGroup Inc 43,444 $ 4,228Northrop Grumman Corp 9,987 3,866Oshkosh Corp 17,457 1,968Owens Corning 23,991 2,171PACCAR Inc 18,523 1,635Raytheon Technologies Corp 209,293 18,012Ryder System Inc 23,674 1,952Siemens AG ADR 165,998 14,375Snap-on Inc 17,803 3,834Textron Inc 67,901 5,242Timken Co/The 50,058 3,469United Airlines Holdings Inc * 38,723 1,695United Parcel Service Inc, Cl B 68,302 14,640
169,354Information Technology — 11.4%
Amdocs Ltd 68,616 5,135Amkor Technology Inc 108,102 2,680Applied Materials Inc 61,889 9,739Arrow Electronics Inc, Cl A * 43,920 5,897Broadcom Inc 21,550 14,340Cisco Systems Inc/Delaware 349,960 22,177Cognizant Technology Solutions Corp, Cl A 107,595 9,546DXC Technology Co * 69,089 2,224Global Payments Inc 21,490 2,905Hewlett Packard Enterprise Co 260,289 4,105HP Inc 402,947 15,179Intel Corp 576,838 29,707International Business Machines Corp 35,900 4,799Jabil Inc 72,955 5,132Juniper Networks Inc 180,394 6,442Kyndryl Holdings Inc * 7,180 130Micron Technology Inc 70,689 6,585Microsoft Corp 39,275 13,209Oracle Corp, Cl B 77,414 6,751Seagate Technology Holdings PLC 48,818 5,515Teradyne Inc 45,757 7,483Vontier Corp 151,323 4,650Xerox Holdings Corp 94,367 2,136
186,466Materials — 5.3%
Alcoa Corp 70,246 4,185Berry Global Group Inc * 26,280 1,939Cabot Corp 38,287 2,152Celanese Corp, Cl A 37,783 6,350Corteva Inc 106,423 5,032Crown Holdings Inc 50,076 5,539Dow Inc 180,016 10,211DuPont de Nemours Inc 48,652 3,930Eastman Chemical Co 85,196 10,301Huntsman Corp 239,010 8,337International Paper Co 111,708 5,248
3SEI Institutional Managed Trust / Quarterly Report / December 31, 2021
SCHEDULE OF INVESTMENTS (Unaudited)December 31, 2021
Large Cap Value Fund (Continued)
Description SharesMarket Value
($ Thousands)
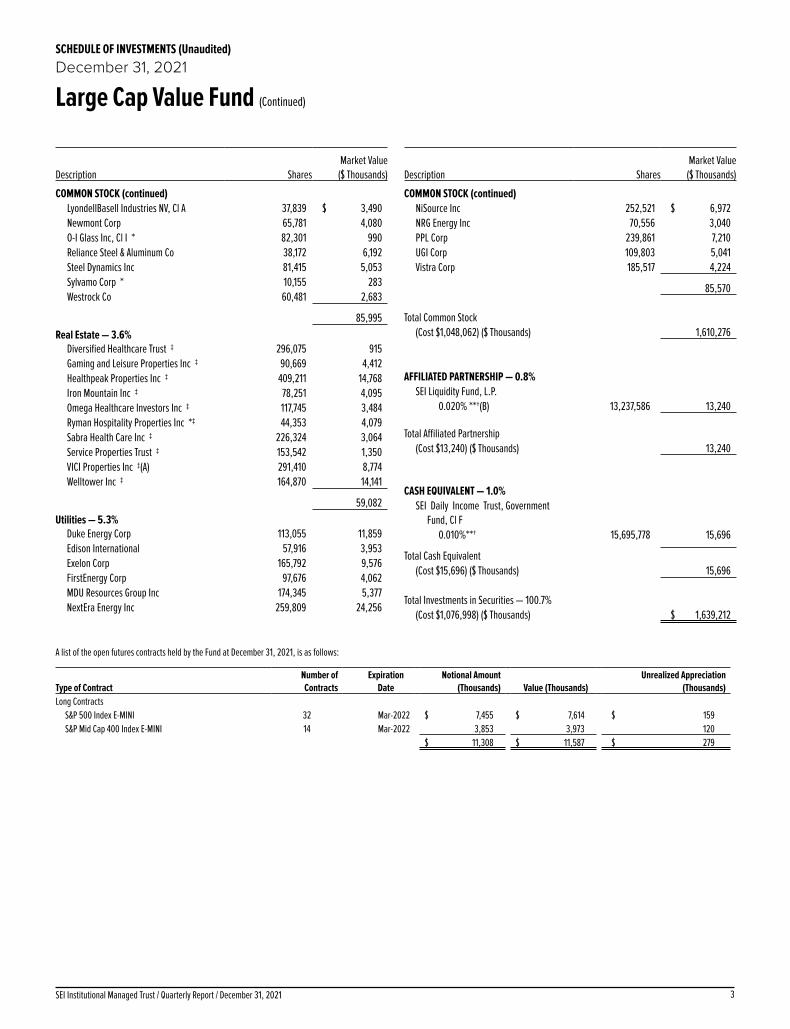
COMMON STOCK (continued)LyondellBasell Industries NV, Cl A 37,839 $ 3,490Newmont Corp 65,781 4,080O-I Glass Inc, Cl I * 82,301 990Reliance Steel & Aluminum Co 38,172 6,192Steel Dynamics Inc 81,415 5,053Sylvamo Corp * 10,155 283Westrock Co 60,481 2,683
85,995Real Estate — 3.6%
Diversified Healthcare Trust ‡ 296,075 915Gaming and Leisure Properties Inc ‡ 90,669 4,412Healthpeak Properties Inc ‡ 409,211 14,768Iron Mountain Inc ‡ 78,251 4,095Omega Healthcare Investors Inc ‡ 117,745 3,484Ryman Hospitality Properties Inc *‡ 44,353 4,079Sabra Health Care Inc ‡ 226,324 3,064Service Properties Trust ‡ 153,542 1,350VICI Properties Inc ‡(A) 291,410 8,774Welltower Inc ‡ 164,870 14,141
59,082Utilities — 5.3%
Duke Energy Corp 113,055 11,859Edison International 57,916 3,953Exelon Corp 165,792 9,576FirstEnergy Corp 97,676 4,062MDU Resources Group Inc 174,345 5,377NextEra Energy Inc 259,809 24,256
Description SharesMarket Value
($ Thousands)
COMMON STOCK (continued)NiSource Inc 252,521 $ 6,972NRG Energy Inc 70,556 3,040PPL Corp 239,861 7,210UGI Corp 109,803 5,041Vistra Corp 185,517 4,224
85,570
Total Common Stock
(Cost $1,048,062) ($ Thousands) 1,610,276
AFFILIATED PARTNERSHIP — 0.8%SEI Liquidity Fund, L.P.
0.020% **†(B) 13,237,586 13,240
Total Affiliated Partnership (Cost $13,240) ($ Thousands) 13,240
CASH EQUIVALENT — 1.0%SEI Daily Income Trust, Government
Fund, Cl F0.010%**† 15,695,778 15,696
Total Cash Equivalent(Cost $15,696) ($ Thousands) 15,696
Total Investments in Securities — 100.7%(Cost $1,076,998) ($ Thousands) $ 1,639,212
A list of the open futures contracts held by the Fund at December 31, 2021, is as follows:
Type of ContractNumber of Contracts
Expiration Date
Notional Amount (Thousands) Value (Thousands)
Unrealized Appreciation (Thousands)
Long ContractsS&P 500 Index E-MINI 32 Mar-2022 $ 7,455 $ 7,614 $ 159S&P Mid Cap 400 Index E-MINI 14 Mar-2022 3,853 3,973 120
$ 11,308 $ 11,587 $ 279

SEI Institutional Managed Trust / Quarterly Report / December 31, 20214
SCHEDULE OF INVESTMENTS (Unaudited)December 31, 2021
Large Cap Value Fund (Concluded)
Percentages are based on Net Assets of $1,628,216 ($ Thousands).* Non-income producing security.** Rate shown is the 7-day effective yield as of December 31, 2021.† Investment in Affiliated Security.‡ Real Estate Investment Trust.(A) Certain securities or partial positions of certain securities are on loan at
December 31, 2021. The total market value of securities on loan at December 31, 2021 was $12,980 ($ Thousands).
(B) This security was purchased with cash collateral held from securities on loan. The total market value of such securities as of December 31, 2021 was $13,240 ($ Thousands).
ADR — American Depositary ReceiptCl — ClassL.P. — Limited PartnershipLtd. — LimitedPLC — Public Limited CompanyS&P— Standard & Poor's
The following is a list of the level of inputs used as of December 31, 2021, in valuing the Fund’s investments and other financial instruments carried at value ($ Thousands):
Investments in SecuritiesLevel 1
($)Level 2
($)Level 3
($)Total
($)Common Stock 1,610,276 – – 1,610,276Affiliated Partnership – 13,240 – 13,240Cash Equivalent 15,696 – – 15,696
Total Investments in Securities 1,625,972 13,240 – 1,639,212
Other Financial InstrumentsLevel 1
($)Level 2
($)Level 3
($)Total
($)Futures Contracts*
Unrealized Appreciation 279 – – 279
Total Other Financial Instruments 279 – – 279
*Futures contracts are valued at the unrealized appreciation on the instrument.
For the period ended December 31, 2021, there were no transfers in or out of Level 3.
For information regarding the Fund’s policy regarding valuation of investments and other significant accounting policies, please refer to the Fund’s more recent semi-annual and annual financial statements.
The following is a summary of the transactions with affiliates for the period ended December 31, 2021 ($ Thousands):
Security Description Value
9/30/2021 Purchases at Cost Proceeds from
Sales Realized Gain/
(Loss)
Change in Unrealized
Appreciation/(Depreciation)
Value 12/31/2021 Shares Income Capital Gains
SEI Liquidity Fund, L.P. $ 6,431 $ 31,823 $ (25,014) $ — $ — $ 13,240 13,237,586 $ 5 $ — SEI Daily Income Trust, Government Fund, Cl F 20,275 38,039 (42,618) — — 15,696 15,695,778 — — Totals $ 26,706 $ 69,862 $ (67,632) $ — $ — $ 28,936 $ 5 $ —
Amounts designated as “—” are $0 or have been rounded to $0.
1SEI Institutional Managed Trust / Quarterly Report / December 31, 2021
SCHEDULE OF INVESTMENTS (Unaudited)December 31, 2021
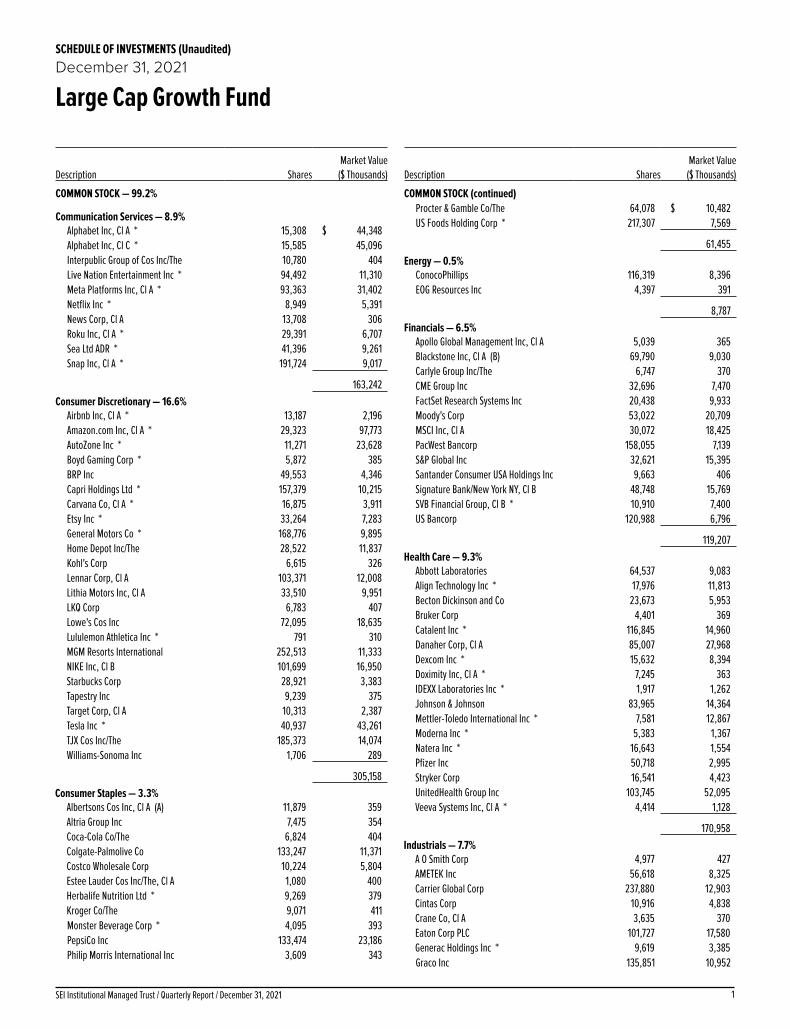
Large Cap Growth Fund
Description SharesMarket Value
($ Thousands)
COMMON STOCK — 99.2%
Communication Services — 8.9%Alphabet Inc, Cl A * 15,308 $ 44,348Alphabet Inc, Cl C * 15,585 45,096Interpublic Group of Cos Inc/The 10,780 404Live Nation Entertainment Inc * 94,492 11,310Meta Platforms Inc, Cl A * 93,363 31,402Netflix Inc * 8,949 5,391News Corp, Cl A 13,708 306Roku Inc, Cl A * 29,391 6,707Sea Ltd ADR * 41,396 9,261Snap Inc, Cl A * 191,724 9,017
163,242Consumer Discretionary — 16.6%
Airbnb Inc, Cl A * 13,187 2,196Amazon.com Inc, Cl A * 29,323 97,773AutoZone Inc * 11,271 23,628Boyd Gaming Corp * 5,872 385BRP Inc 49,553 4,346Capri Holdings Ltd * 157,379 10,215Carvana Co, Cl A * 16,875 3,911Etsy Inc * 33,264 7,283General Motors Co * 168,776 9,895Home Depot Inc/The 28,522 11,837Kohl's Corp 6,615 326Lennar Corp, Cl A 103,371 12,008Lithia Motors Inc, Cl A 33,510 9,951LKQ Corp 6,783 407Lowe's Cos Inc 72,095 18,635Lululemon Athletica Inc * 791 310MGM Resorts International 252,513 11,333NIKE Inc, Cl B 101,699 16,950Starbucks Corp 28,921 3,383Tapestry Inc 9,239 375Target Corp, Cl A 10,313 2,387Tesla Inc * 40,937 43,261TJX Cos Inc/The 185,373 14,074Williams-Sonoma Inc 1,706 289
305,158Consumer Staples — 3.3%
Albertsons Cos Inc, Cl A (A) 11,879 359Altria Group Inc 7,475 354Coca-Cola Co/The 6,824 404Colgate-Palmolive Co 133,247 11,371Costco Wholesale Corp 10,224 5,804Estee Lauder Cos Inc/The, Cl A 1,080 400Herbalife Nutrition Ltd * 9,269 379Kroger Co/The 9,071 411Monster Beverage Corp * 4,095 393PepsiCo Inc 133,474 23,186Philip Morris International Inc 3,609 343
Description SharesMarket Value
($ Thousands)
COMMON STOCK (continued)Procter & Gamble Co/The 64,078 $ 10,482US Foods Holding Corp * 217,307 7,569
61,455Energy — 0.5%
ConocoPhillips 116,319 8,396EOG Resources Inc 4,397 391
8,787Financials — 6.5%
Apollo Global Management Inc, Cl A 5,039 365Blackstone Inc, Cl A (B) 69,790 9,030Carlyle Group Inc/The 6,747 370CME Group Inc 32,696 7,470FactSet Research Systems Inc 20,438 9,933Moody's Corp 53,022 20,709MSCI Inc, Cl A 30,072 18,425PacWest Bancorp 158,055 7,139S&P Global Inc 32,621 15,395Santander Consumer USA Holdings Inc 9,663 406Signature Bank/New York NY, Cl B 48,748 15,769SVB Financial Group, Cl B * 10,910 7,400US Bancorp 120,988 6,796
119,207Health Care — 9.3%
Abbott Laboratories 64,537 9,083Align Technology Inc * 17,976 11,813Becton Dickinson and Co 23,673 5,953Bruker Corp 4,401 369Catalent Inc * 116,845 14,960Danaher Corp, Cl A 85,007 27,968Dexcom Inc * 15,632 8,394Doximity Inc, Cl A * 7,245 363IDEXX Laboratories Inc * 1,917 1,262Johnson & Johnson 83,965 14,364Mettler-Toledo International Inc * 7,581 12,867Moderna Inc * 5,383 1,367Natera Inc * 16,643 1,554Pfizer Inc 50,718 2,995Stryker Corp 16,541 4,423UnitedHealth Group Inc 103,745 52,095Veeva Systems Inc, Cl A * 4,414 1,128
170,958Industrials — 7.7%
A O Smith Corp 4,977 427AMETEK Inc 56,618 8,325Carrier Global Corp 237,880 12,903Cintas Corp 10,916 4,838Crane Co, Cl A 3,635 370Eaton Corp PLC 101,727 17,580Generac Holdings Inc * 9,619 3,385Graco Inc 135,851 10,952

SEI Institutional Managed Trust / Quarterly Report / December 31, 20212
SCHEDULE OF INVESTMENTS (Unaudited)December 31, 2021
Large Cap Growth Fund (Continued)
Description SharesMarket Value
($ Thousands)
COMMON STOCK (continued)Middleby Corp/The * 68,130 $ 13,405nVent Electric PLC 10,690 406Otis Worldwide Corp 108,620 9,457Robert Half International Inc 3,979 444Tetra Tech Inc 44,285 7,520Textron Inc 133,691 10,321Trane Technologies PLC 48,270 9,752TransDigm Group Inc * 18,558 11,808Uber Technologies Inc * 133,560 5,600Union Pacific Corp 53,466 13,470
140,963Information Technology — 42.9%
Adobe Inc * 56,436 32,003Advanced Micro Devices Inc * 122,552 17,635Analog Devices Inc 76,633 13,470Apple Inc 806,474 143,206Applied Materials Inc 257,963 40,593Arista Networks Inc * 20,133 2,894Autodesk Inc, Cl A * 1,172 330Bill.com Holdings Inc * 23,127 5,762Block Inc, Cl A * 15,104 2,439Broadcom Inc 27,194 18,095Cadence Design Systems Inc * 23,173 4,318Crowdstrike Holdings Inc, Cl A * 29,730 6,087Datadog Inc, Cl A * 2,041 364Dlocal Ltd/Uruguay, Cl A * 123,216 4,398Dolby Laboratories Inc, Cl A 3,861 368Dropbox Inc, Cl A * 11,560 284EPAM Systems Inc * 18,381 12,287F5 Inc, Cl A * 1,586 388Fortinet Inc * 16,370 5,883HP Inc 117,238 4,416Intuit Inc 56,166 36,127Jabil Inc 5,634 396Keysight Technologies Inc * 1,770 366KLA Corp 8,599 3,698Littelfuse Inc 1,163 366Manhattan Associates Inc * 2,228 346Marqeta Inc, Cl A * 285,701 4,905Mastercard Inc, Cl A 73,250 26,320Micron Technology Inc 128,024 11,925Microsoft Corp 605,376 203,600Monolithic Power Systems Inc 656 324NetApp Inc 20,218 1,860NVIDIA Corp 200,038 58,833ON Semiconductor Corp * 14,287 970Oracle Corp, Cl B 201,020 17,531Paychex Inc 3,042 415PayPal Holdings Inc * 94,307 17,784QUALCOMM Inc 110,045 20,124salesforce.com * 67,204 17,079
Description SharesMarket Value
($ Thousands)
COMMON STOCK (continued)ServiceNow Inc * 10,944 $ 7,104SolarEdge Technologies Inc * 24,460 6,863Twilio Inc, Cl A * 20,805 5,479Unity Software Inc * 49,618 7,095VeriSign Inc * 3,525 895Visa Inc, Cl A 102,357 22,182
787,807Materials — 3.2%
Ecolab Inc 18,344 4,303Freeport-McMoRan Inc, Cl B 172,991 7,219Linde PLC 24,232 8,395Louisiana-Pacific Corp 82,297 6,448Mosaic Co/The 135,738 5,333Olin Corp 6,224 358Sherwin-Williams Co/The, Cl A 53,261 18,757Steel Dynamics Inc 106,754 6,626
57,439Real Estate — 0.3%
CBRE Group Inc, Cl A * 30,534 3,313Duke Realty Corp ‡ 9,403 617Invitation Homes Inc ‡ 8,797 399Jones Lang LaSalle Inc *‡ 3,563 960Regency Centers Corp ‡ 5,120 386Simon Property Group Inc ‡ 2,255 360
6,035
Total Common Stock
(Cost $773,439) ($ Thousands) 1,821,051
AFFILIATED PARTNERSHIP — 0.0%SEI Liquidity Fund, L.P.
0.020% **†(C) 362,198 362
Total Affiliated Partnership (Cost $362) ($ Thousands) 362
CASH EQUIVALENT — 0.9%SEI Daily Income Trust, Government
Fund, Cl F0.010%**† 15,982,627 15,983
Total Cash Equivalent(Cost $15,983) ($ Thousands) 15,983
Total Investments in Securities — 100.1%(Cost $789,784) ($ Thousands) $ 1,837,396
3SEI Institutional Managed Trust / Quarterly Report / December 31, 2021
SCHEDULE OF INVESTMENTS (Unaudited)December 31, 2021
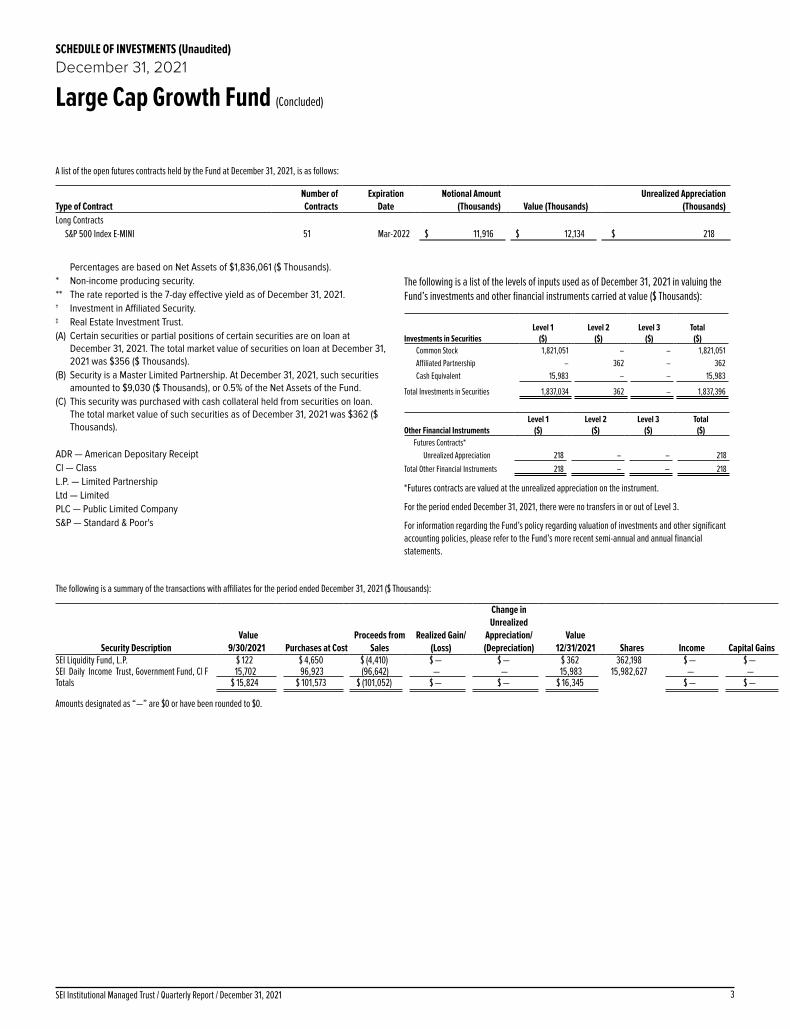
Large Cap Growth Fund (Concluded)
A list of the open futures contracts held by the Fund at December 31, 2021, is as follows:
Type of ContractNumber of Contracts
Expiration Date
Notional Amount (Thousands) Value (Thousands)
Unrealized Appreciation (Thousands)
Long ContractsS&P 500 Index E-MINI 51 Mar-2022 $ 11,916 $ 12,134 $ 218
Percentages are based on Net Assets of $1,836,061 ($ Thousands).* Non-income producing security.** The rate reported is the 7-day effective yield as of December 31, 2021.† Investment in Affiliated Security.‡ Real Estate Investment Trust.(A) Certain securities or partial positions of certain securities are on loan at
December 31, 2021. The total market value of securities on loan at December 31, 2021 was $356 ($ Thousands).
(B) Security is a Master Limited Partnership. At December 31, 2021, such securities amounted to $9,030 ($ Thousands), or 0.5% of the Net Assets of the Fund.
(C) This security was purchased with cash collateral held from securities on loan. The total market value of such securities as of December 31, 2021 was $362 ($ Thousands).
ADR — American Depositary ReceiptCl — ClassL.P. — Limited PartnershipLtd — LimitedPLC — Public Limited CompanyS&P — Standard & Poor's
The following is a list of the levels of inputs used as of December 31, 2021 in valuing the Fund’s investments and other financial instruments carried at value ($ Thousands):
Investments in SecuritiesLevel 1
($)Level 2
($)Level 3
($)Total
($)Common Stock 1,821,051 – – 1,821,051Affiliated Partnership – 362 – 362Cash Equivalent 15,983 – – 15,983
Total Investments in Securities 1,837,034 362 – 1,837,396
Other Financial InstrumentsLevel 1
($)Level 2
($)Level 3
($)Total
($)Futures Contracts*
Unrealized Appreciation 218 – – 218
Total Other Financial Instruments 218 – – 218
*Futures contracts are valued at the unrealized appreciation on the instrument.
For the period ended December 31, 2021, there were no transfers in or out of Level 3.
For information regarding the Fund’s policy regarding valuation of investments and other significant accounting policies, please refer to the Fund’s more recent semi-annual and annual financial statements.
The following is a summary of the transactions with affiliates for the period ended December 31, 2021 ($ Thousands):
Security Description Value
9/30/2021 Purchases at Cost Proceeds from
Sales Realized Gain/
(Loss)
Change in Unrealized
Appreciation/(Depreciation)
Value 12/31/2021 Shares Income Capital Gains
SEI Liquidity Fund, L.P. $ 122 $ 4,650 $ (4,410) $ — $ — $ 362 362,198 $ — $ — SEI Daily Income Trust, Government Fund, Cl F 15,702 96,923 (96,642) — — 15,983 15,982,627 — — Totals $ 15,824 $ 101,573 $ (101,052) $ — $ — $ 16,345 $ — $ —
Amounts designated as “—” are $0 or have been rounded to $0.

1SEI Institutional Managed Trust / Quarterly Report / December 31, 2021
SCHEDULE OF INVESTMENTS (Unaudited)December 31, 2021
Large Cap Index Fund
Description SharesMarket Value
($ Thousands)
COMMON STOCK — 98.1%
Communication Services — 9.4%Activision Blizzard Inc 20,381 $ 1,356Alphabet Inc, Cl A * 7,921 22,947Alphabet Inc, Cl C * 7,390 21,384Altice USA Inc, Cl A * 5,800 94AT&T Inc 188,191 4,629Cable One Inc 138 243Charter Communications Inc, Cl A * 3,336 2,175Comcast Corp, Cl A 120,029 6,041Discovery Inc, Cl A *(A) 4,400 104Discovery Inc, Cl C * 8,312 190DISH Network Corp, Cl A * 6,511 211Electronic Arts Inc 7,406 977Fox Corp, Cl A 8,231 304Fox Corp, Cl B 3,900 134IAC/InterActiveCorp * 1,998 261Interpublic Group of Cos Inc/The 10,300 386Liberty Broadband Corp, Cl A * 700 113Liberty Broadband Corp, Cl C * 3,758 605Liberty Media Corp-Liberty Formula One,
Cl A * 700 42Liberty Media Corp-Liberty Formula One,
Cl C * 5,200 329Liberty Media Corp-Liberty SiriusXM * 6,698 340Live Nation Entertainment Inc * 3,590 430Loyalty Ventures Inc * 510 15Lumen Technologies Inc 28,895 363Madison Square Garden Sports Corp * 553 96Match Group Inc * 7,399 978Meta Platforms Inc, Cl A * 62,255 20,939Netflix Inc * 11,377 6,854New York Times Co/The, Cl A 4,312 208News Corp, Cl A 10,300 230News Corp, Cl B 3,200 72Nexstar Media Group Inc, Cl A 1,100 166Omnicom Group Inc 5,526 405Pinterest Inc, Cl A * 14,576 530Playtika Holding Corp * 2,800 48Roku Inc, Cl A * 3,145 718Sirius XM Holdings Inc (A) 23,718 151Skillz Inc, Cl A *(A) 7,400 55Spotify Technology SA * 3,660 857Take-Two Interactive Software Inc, Cl A * 2,987 531T-Mobile US Inc * 15,517 1,800TripAdvisor Inc * 2,600 71Twitter Inc * 20,380 881Verizon Communications Inc 109,173 5,673ViacomCBS Inc 219 7ViacomCBS Inc, Cl B 15,153 457Vimeo Inc * 3,917 70Walt Disney Co/The * 47,867 7,414
Description SharesMarket Value
($ Thousands)
COMMON STOCK (continued)World Wrestling Entertainment Inc, Cl A 1,200 $ 59Zynga Inc, Cl A * 26,531 170
113,113Consumer Discretionary — 12.2%
Advance Auto Parts Inc 1,717 412Amazon.com Inc, Cl A * 11,422 38,085Aptiv PLC * 7,053 1,164Aramark 5,891 217AutoNation Inc * 1,194 140AutoZone Inc * 560 1,174Bath & Body Works Inc 6,400 447Best Buy Co Inc 6,580 668Booking Holdings Inc * 1,068 2,562BorgWarner Inc 6,300 284Boyd Gaming Corp 2,100 138Bright Horizons Family Solutions Inc * 1,600 201Brunswick Corp/DE 2,000 202Burlington Stores Inc * 1,753 511Caesars Entertainment Inc * 5,300 496Capri Holdings Ltd * 3,900 253CarMax Inc * 4,300 560Carnival Corp * 22,327 449Carter's Inc 1,100 111Carvana Co, Cl A * 2,068 479Chegg Inc * 3,687 113Chipotle Mexican Grill Inc, Cl A * 731 1,278Choice Hotels International Inc 928 145Churchill Downs Inc 961 232Columbia Sportswear Co 1,000 97Darden Restaurants Inc 3,399 512Deckers Outdoor Corp * 700 256Dick's Sporting Goods Inc 1,692 195Dollar General Corp 6,145 1,449Dollar Tree Inc * 6,018 846Domino's Pizza Inc 960 542DoorDash Inc, Cl A * 3,800 566DR Horton Inc 8,738 948DraftKings Inc, Cl A * 7,800 214eBay Inc 17,006 1,131Etsy Inc * 3,304 723Expedia Group Inc * 3,782 684Five Below Inc * 1,483 307Floor & Decor Holdings Inc, Cl A * 2,700 351Foot Locker Inc, Cl A 2,400 105Ford Motor Co 103,085 2,141Frontdoor Inc * 2,210 81GameStop Corp, Cl A * 1,700 252Gap Inc/The 5,300 93Garmin Ltd 3,957 539General Motors Co * 36,249 2,125Gentex Corp 6,235 217

SEI Institutional Managed Trust / Quarterly Report / December 31, 20212
SCHEDULE OF INVESTMENTS (Unaudited)December 31, 2021
Large Cap Index Fund (Continued)
Description SharesMarket Value
($ Thousands)
COMMON STOCK (continued)Genuine Parts Co 3,676 $ 515Grand Canyon Education Inc * 1,200 103H&R Block Inc 4,500 106Hanesbrands Inc 9,000 151Harley-Davidson Inc, Cl A 4,100 155Hasbro Inc 3,302 336Hayward Holdings Inc * 1,000 26Hilton Worldwide Holdings Inc * 7,184 1,121Home Depot Inc/The 28,033 11,634Hyatt Hotels Corp, Cl A * 1,294 124Kohl's Corp 4,025 199Las Vegas Sands Corp * 8,646 325Lear Corp 1,550 284Leggett & Platt Inc 3,400 140Lennar Corp, Cl A 7,089 824Lennar Corp, Cl B 450 43Leslie's Inc * 3,600 85Lithia Motors Inc, Cl A 800 238LKQ Corp 7,088 426Lowe's Cos Inc 18,292 4,728Lululemon Athletica Inc * 2,984 1,168Marriott International Inc/MD, Cl A * 7,155 1,182Marriott Vacations Worldwide Corp 1,100 186Mattel Inc * 9,000 194McDonald's Corp 19,700 5,281MGM Resorts International 10,453 469Mister Car Wash Inc * 2,100 38Mohawk Industries Inc * 1,502 274Newell Brands Inc, Cl B 9,770 213NIKE Inc, Cl B 32,617 5,436Nordstrom Inc * 3,000 68Norwegian Cruise Line Holdings Ltd * 9,763 203NVR Inc * 84 496Ollie's Bargain Outlet Holdings Inc * 1,661 85O'Reilly Automotive Inc * 1,774 1,253Peloton Interactive Inc, Cl A * 7,427 266Penn National Gaming Inc * 4,300 223Penske Automotive Group Inc, Cl A 800 86Petco Health & Wellness Co Inc, Cl A * 1,300 26Planet Fitness Inc, Cl A * 2,200 199Polaris Inc 1,531 168Pool Corp 1,021 578PulteGroup Inc 6,700 383PVH Corp 1,849 197QuantumScape Corp, Cl A * 6,600 147Qurate Retail Inc * 9,765 74Ralph Lauren Corp, Cl A 1,236 147RH * 446 239Rivian Automotive Inc, Cl A * 3,700 384Ross Stores Inc 9,244 1,056Royal Caribbean Cruises Ltd * 5,723 440Service Corp International/US 4,300 305
Description SharesMarket Value
($ Thousands)
COMMON STOCK (continued)Six Flags Entertainment Corp * 2,100 $ 89Skechers USA Inc, Cl A * 3,453 150Starbucks Corp 31,001 3,626Tapestry Inc 7,208 293Target Corp, Cl A 12,969 3,002Tempur Sealy International Inc 4,700 221Terminix Global Holdings Inc * 3,200 145Tesla Inc * 21,283 22,491Thor Industries Inc 1,400 145TJX Cos Inc/The 31,759 2,411Toll Brothers Inc 2,900 210TopBuild Corp * 900 248Tractor Supply Co 3,001 716Travel + Leisure Co 2,163 120Ulta Beauty Inc * 1,381 569Under Armour Inc, Cl A * 4,815 102Under Armour Inc, Cl C * 5,100 92Vail Resorts Inc 1,070 351VF Corp 8,464 620Victoria's Secret & Co * 2,066 115Vroom Inc * 3,100 33Wayfair Inc, Cl A * 1,975 375Wendy's Co/The 4,600 110Whirlpool Corp 1,638 384Williams-Sonoma Inc 2,000 338Wyndham Hotels & Resorts Inc 2,363 212Wynn Resorts Ltd * 2,715 231YETI Holdings Inc * 2,200 182Yum China Holdings Inc 11,285 562Yum! Brands Inc 7,809 1,084
146,949Consumer Staples — 5.5%
Albertsons Cos Inc, Cl A 4,100 124Altria Group Inc 48,650 2,306Archer-Daniels-Midland Co 14,571 985Beyond Meat Inc * 1,500 98Boston Beer Co Inc/The, Cl A * 229 116Brown-Forman Corp, Cl A 1,140 77Brown-Forman Corp, Cl B 4,822 351Bunge Ltd 3,600 336Campbell Soup Co 5,000 217Casey's General Stores Inc 996 197Church & Dwight Co Inc 6,410 657Clorox Co/The 3,271 570Coca-Cola Co/The 102,224 6,053Colgate-Palmolive Co 21,979 1,876Conagra Brands Inc 12,249 418Constellation Brands Inc, Cl A 4,154 1,042Costco Wholesale Corp 11,643 6,610Coty Inc, Cl A * 8,539 90Darling Ingredients Inc * 4,223 293

3SEI Institutional Managed Trust / Quarterly Report / December 31, 2021
SCHEDULE OF INVESTMENTS (Unaudited)December 31, 2021
Large Cap Index Fund (Continued)
Description SharesMarket Value
($ Thousands)
COMMON STOCK (continued)Estee Lauder Cos Inc/The, Cl A 6,075 $ 2,249Flowers Foods Inc 4,900 135Freshpet Inc * 1,100 105General Mills Inc 15,961 1,075Grocery Outlet Holding Corp * 2,300 65Hain Celestial Group Inc/The * 2,500 106Herbalife Nutrition Ltd * 2,774 114Hershey Co/The 3,810 737Hormel Foods Corp 7,437 363Ingredion Inc 1,710 165J M Smucker Co/The 2,754 374Kellogg Co 6,585 424Keurig Dr Pepper Inc 18,285 674Kimberly-Clark Corp 8,890 1,271Kraft Heinz Co/The 18,049 648Kroger Co/The 19,488 882Lamb Weston Holdings Inc 3,800 241McCormick & Co Inc/MD 6,482 626Molson Coors Beverage Co, Cl B 4,595 213Mondelez International Inc, Cl A 36,746 2,437Monster Beverage Corp * 9,739 935Olaplex Holdings Inc * 2,100 61PepsiCo Inc 36,407 6,324Philip Morris International Inc 40,963 3,891Pilgrim's Pride Corp * 1,300 37Post Holdings Inc * 1,507 170Procter & Gamble Co/The 63,420 10,374Reynolds Consumer Products Inc 1,500 47Seaboard Corp 6 24Spectrum Brands Holdings Inc 1,057 107Sysco Corp, Cl A 13,363 1,050Tyson Foods Inc, Cl A 7,508 654US Foods Holding Corp * 5,797 202Walgreens Boots Alliance Inc 18,741 977Walmart Inc 37,761 5,464
65,637Energy — 2.5%
Antero Midstream Corp 8,900 86APA Corp 9,700 261Baker Hughes Co, Cl A 19,302 464Cheniere Energy Inc 6,173 626Chevron Corp 50,948 5,979ConocoPhillips 34,751 2,508Continental Resources Inc/OK, Cl A 1,800 81Coterra Energy Inc 20,914 397Devon Energy Corp 17,561 773Diamondback Energy Inc, Cl A 4,729 510DT Midstream Inc 2,506 120EOG Resources Inc 15,382 1,366EQT Corp 8,067 176Exxon Mobil Corp 111,463 6,820
Description SharesMarket Value
($ Thousands)
COMMON STOCK (continued)Halliburton Co 23,245 $ 532Hess Corp 7,249 537HollyFrontier Corp 3,800 125Kinder Morgan Inc 50,934 808Marathon Oil Corp 20,592 338Marathon Petroleum Corp 16,612 1,063New Fortress Energy Inc, Cl A 700 17NOV Inc 10,000 136Occidental Petroleum Corp 22,023 639ONEOK Inc 11,561 679Phillips 66 11,462 831Pioneer Natural Resources Co 5,713 1,039Schlumberger NV, Cl A 36,875 1,104Targa Resources Corp 5,800 303Texas Pacific Land Corp 149 186Valero Energy Corp 10,674 802Williams Cos Inc/The 31,773 827
30,133Financials — 10.8%
Affiliated Managers Group Inc 1,071 176Aflac Inc 17,246 1,007AGNC Investment Corp ‡ 13,728 207Alleghany Corp * 354 236Allstate Corp/The 7,680 904Ally Financial Inc 9,358 446American Express Co 16,514 2,702American Financial Group Inc/OH 1,743 239American International Group Inc 22,403 1,274Ameriprise Financial Inc 2,975 897Annaly Capital Management Inc ‡ 36,774 288Aon PLC, Cl A 5,847 1,757Apollo Global Management Inc, Cl A * 6,200 449Arch Capital Group Ltd * 9,889 439Ares Management Corp, Cl A 3,800 309Arthur J Gallagher & Co 5,366 910Assurant Inc 1,500 234Assured Guaranty Ltd 1,814 91Athene Holding Ltd, Cl A * 3,000 250Axis Capital Holdings Ltd 2,023 110Bank of America Corp 189,593 8,435Bank of Hawaii Corp 1,048 88Bank of New York Mellon Corp/The 20,585 1,196Bank OZK 3,200 149Berkshire Hathaway Inc, Cl B * 48,302 14,442BlackRock Inc 3,723 3,409Blackstone Inc, Cl A (B) 17,899 2,316BOK Financial Corp 800 84Brighthouse Financial Inc * 2,100 109Brown & Brown Inc 6,100 429Capital One Financial Corp 11,122 1,614Carlyle Group Inc/The 4,200 231

SEI Institutional Managed Trust / Quarterly Report / December 31, 20214
SCHEDULE OF INVESTMENTS (Unaudited)December 31, 2021
Large Cap Index Fund (Continued)
Description SharesMarket Value
($ Thousands)
COMMON STOCK (continued)Cboe Global Markets Inc 2,800 $ 365Charles Schwab Corp/The 39,716 3,340Chubb Ltd 11,410 2,206Cincinnati Financial Corp 3,900 444Citigroup Inc 52,262 3,156Citizens Financial Group Inc 11,159 527CME Group Inc 9,415 2,151CNA Financial Corp 652 29Comerica Inc 3,453 300Commerce Bancshares Inc/MO 2,880 198Credit Acceptance Corp, Cl A * 217 149Cullen/Frost Bankers Inc 1,514 191Discover Financial Services 7,820 904East West Bancorp Inc 3,700 291Equitable Holdings Inc 9,600 315Erie Indemnity Co, Cl A 656 126Evercore Inc, Cl A 983 134Everest Re Group Ltd 1,051 288FactSet Research Systems Inc 992 482Fidelity National Financial Inc 7,110 371Fifth Third Bancorp 18,000 784First American Financial Corp 2,800 219First Citizens BancShares Inc/NC, Cl A 149 124First Hawaiian Inc 3,500 96First Horizon Corp 14,000 229First Republic Bank/CA 4,731 977FNB Corp/PA 8,200 99Franklin Resources Inc 7,600 254Globe Life Inc 2,601 244GoHealth Inc, Cl A * 900 3Goldman Sachs Group Inc/The 8,697 3,327Hanover Insurance Group Inc/The, Cl A 989 130Hartford Financial Services Group Inc/The 9,059 625Huntington Bancshares Inc/OH 38,138 588Interactive Brokers Group Inc, Cl A 2,121 168Intercontinental Exchange Inc 14,612 1,998Invesco Ltd 8,562 197Janus Henderson Group PLC 4,500 189Jefferies Financial Group Inc 5,700 221JPMorgan Chase & Co 77,380 12,253Kemper Corp, Cl A 1,555 91KeyCorp 24,788 573KKR & Co Inc 14,700 1,095Lazard Ltd, Cl A (B) 2,700 118Lemonade Inc * 1,059 45Lincoln National Corp 4,877 333Loews Corp 5,689 329LPL Financial Holdings Inc 2,092 335M&T Bank Corp 3,353 515Markel Corp * 350 432MarketAxess Holdings Inc 948 390Marsh & McLennan Cos Inc 13,395 2,328
Description SharesMarket Value
($ Thousands)
COMMON STOCK (continued)Mercury General Corp 700 $ 37MetLife Inc 18,915 1,182MGIC Investment Corp 9,000 130Moody's Corp 4,241 1,656Morgan Stanley 35,262 3,461Morningstar Inc, Cl A 600 205MSCI Inc, Cl A 2,087 1,279Nasdaq Inc, Cl A 3,100 651New Residential Investment Corp ‡ 11,140 119New York Community Bancorp Inc 12,000 147Northern Trust Corp 5,350 640Old Republic International Corp 7,300 179OneMain Holdings Inc, Cl A 2,981 149PacWest Bancorp 3,000 136People's United Financial Inc 11,224 200Pinnacle Financial Partners Inc 1,900 181PNC Financial Services Group Inc/The 11,177 2,241Popular Inc 2,100 172Primerica Inc 1,081 166Principal Financial Group Inc, Cl A 6,934 502Progressive Corp/The 15,307 1,571Prosperity Bancshares Inc 2,300 166Prudential Financial Inc 10,062 1,089Raymond James Financial Inc 4,805 482Regions Financial Corp 25,112 547Reinsurance Group of America Inc, Cl A 1,824 200RenaissanceRe Holdings Ltd 1,275 216Rocket Cos Inc, Cl A * 3,700 52S&P Global Inc 6,357 3,000Santander Consumer USA Holdings Inc 1,500 63SEI Investments Co † 2,800 171Signature Bank/New York NY, Cl B 1,578 510SLM Corp 7,840 154Starwood Property Trust Inc ‡ 7,600 185State Street Corp 9,709 903Sterling Bancorp/DE 4,900 126Stifel Financial Corp 2,700 190SVB Financial Group, Cl B * 1,464 993Synchrony Financial 14,868 690Synovus Financial Corp 3,800 182T Rowe Price Group Inc 5,971 1,174TFS Financial Corp 1,417 25Tradeweb Markets Inc, Cl A 2,700 270Travelers Cos Inc/The 6,570 1,028Truist Financial Corp 35,427 2,074Umpqua Holdings Corp 5,919 114Unum Group 5,475 135Upstart Holdings Inc * 1,200 182US Bancorp 35,380 1,987UWM Holdings Corp 2,800 17Virtu Financial Inc, Cl A 2,500 72Voya Financial Inc 2,900 192

5SEI Institutional Managed Trust / Quarterly Report / December 31, 2021
SCHEDULE OF INVESTMENTS (Unaudited)December 31, 2021
Large Cap Index Fund (Continued)
Description SharesMarket Value
($ Thousands)
COMMON STOCK (continued)W R Berkley Corp 3,600 $ 297Webster Financial Corp 2,300 128Wells Fargo & Co 105,391 5,057Western Alliance Bancorp 2,600 280White Mountains Insurance Group Ltd 79 80Willis Towers Watson PLC 3,350 796Wintrust Financial Corp 1,500 136Zions Bancorp NA 4,200 265
129,935Health Care — 12.8%
10X Genomics Inc, Cl A * 2,198 327Abbott Laboratories 45,708 6,433AbbVie Inc 46,561 6,304ABIOMED Inc * 1,148 412Acadia Healthcare Co Inc, Cl A * 2,300 140Adaptive Biotechnologies Corp * 2,900 81Agilent Technologies Inc 8,054 1,286agilon health Inc * 4,370 118Align Technology Inc * 2,051 1,348Alnylam Pharmaceuticals Inc * 3,074 521Amedisys Inc * 900 146AmerisourceBergen Corp, Cl A 3,895 518Amgen Inc, Cl A 14,932 3,359Anthem Inc 6,467 2,998Avantor Inc * 15,920 671Baxter International Inc 13,165 1,130Becton Dickinson and Co 7,553 1,899Biogen Inc * 3,859 926BioMarin Pharmaceutical Inc * 4,767 421Bio-Rad Laboratories Inc, Cl A * 544 411Bio-Techne Corp 1,018 527Boston Scientific Corp * 37,438 1,590Bristol-Myers Squibb Co 58,754 3,663Bruker Corp 2,700 227Cardinal Health Inc 7,500 386Catalent Inc * 4,523 579Centene Corp * 15,281 1,259Cerner Corp 7,700 715Certara Inc * 2,800 80Change Healthcare Inc * 6,535 140Charles River Laboratories International
Inc * 1,303 491Chemed Corp 415 220Cigna Corp 8,621 1,980Cooper Cos Inc/The, Cl A 1,254 525CureVac NV * 1,400 48CVS Health Corp 34,608 3,570Danaher Corp, Cl A 16,761 5,515DaVita Inc * 1,800 205Definitive Healthcare Corp, Cl A *(C) 300 8DENTSPLY SIRONA Inc 5,600 312
Description SharesMarket Value
($ Thousands)
COMMON STOCK (continued)Dexcom Inc * 2,518 $ 1,352Edwards Lifesciences Corp, Cl A * 16,247 2,105Elanco Animal Health Inc * 11,477 326Eli Lilly & Co 22,363 6,177Encompass Health Corp 2,600 170Envista Holdings Corp * 4,100 185Exact Sciences Corp * 4,400 342Exelixis Inc * 7,900 144Figs Inc, Cl A * 2,600 72Gilead Sciences Inc 33,044 2,399Globus Medical Inc, Cl A * 2,000 144Guardant Health Inc * 2,309 231HCA Healthcare Inc 6,549 1,682Henry Schein Inc * 3,647 283Hologic Inc * 6,500 498Horizon Therapeutics Plc * 5,700 614Humana Inc 3,375 1,565ICU Medical Inc * 519 123IDEXX Laboratories Inc * 2,205 1,452Illumina Inc * 3,834 1,459Incyte Corp * 4,843 355Insulet Corp * 1,719 457Integra LifeSciences Holdings Corp * 1,900 127Intuitive Surgical Inc * 9,307 3,344Ionis Pharmaceuticals Inc * 3,700 113Iovance Biotherapeutics Inc * 4,000 76IQVIA Holdings Inc * 5,005 1,412Jazz Pharmaceuticals PLC * 1,521 194Johnson & Johnson 69,380 11,869Laboratory Corp of America Holdings * 2,537 797Maravai LifeSciences Holdings Inc, Cl A * 2,700 113Masimo Corp * 1,300 381McKesson Corp 4,042 1,005Medtronic PLC 35,303 3,652Merck & Co Inc 66,702 5,112Mettler-Toledo International Inc * 593 1,006Mirati Therapeutics Inc * 1,100 161Moderna Inc * 8,893 2,259Molina Healthcare Inc * 1,495 476Natera Inc * 2,200 205Nektar Therapeutics, Cl A * 4,500 61Neurocrine Biosciences Inc * 2,484 212Novavax Inc * 2,000 286Novocure Ltd * 2,675 201Oak Street Health Inc * 2,500 83Organon & Co 6,470 197Penumbra Inc * 900 259PerkinElmer Inc 3,341 672Perrigo Co PLC 3,493 136Pfizer Inc 147,221 8,693Premier Inc, Cl A 3,100 128QIAGEN NV * 6,000 333
SEI Institutional Managed Trust / Quarterly Report / December 31, 20216
SCHEDULE OF INVESTMENTS (Unaudited)December 31, 2021
Large Cap Index Fund (Continued)
Description SharesMarket Value
($ Thousands)
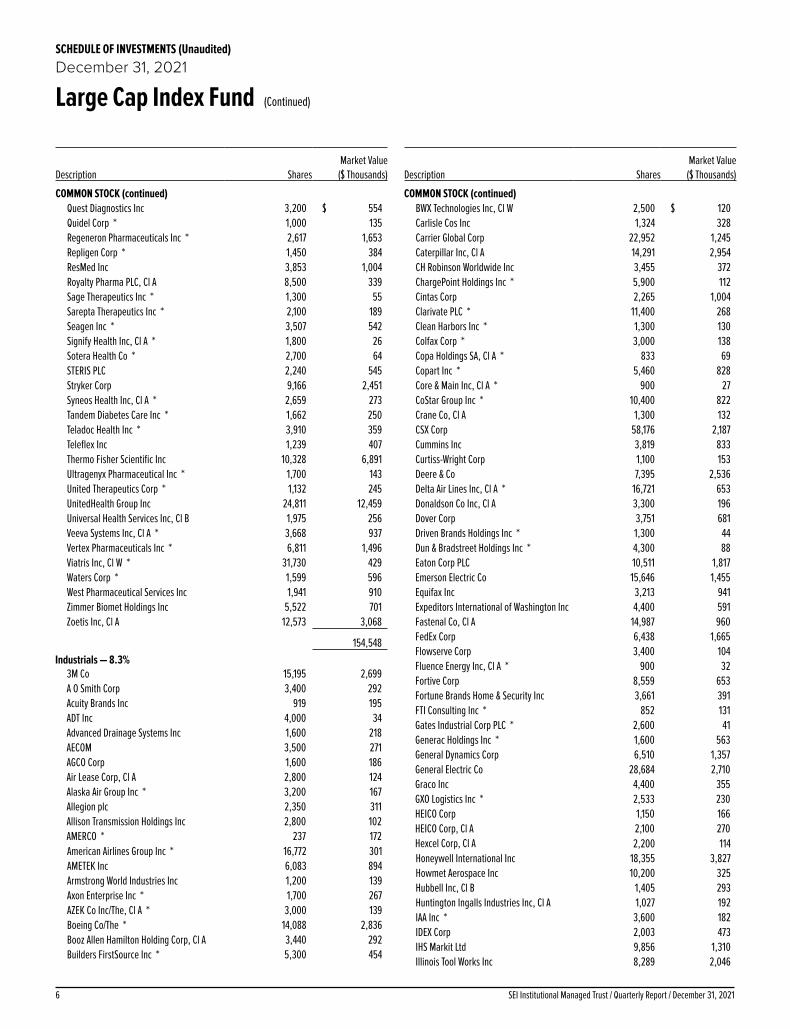
COMMON STOCK (continued)Quest Diagnostics Inc 3,200 $ 554Quidel Corp * 1,000 135Regeneron Pharmaceuticals Inc * 2,617 1,653Repligen Corp * 1,450 384ResMed Inc 3,853 1,004Royalty Pharma PLC, Cl A 8,500 339Sage Therapeutics Inc * 1,300 55Sarepta Therapeutics Inc * 2,100 189Seagen Inc * 3,507 542Signify Health Inc, Cl A * 1,800 26Sotera Health Co * 2,700 64STERIS PLC 2,240 545Stryker Corp 9,166 2,451Syneos Health Inc, Cl A * 2,659 273Tandem Diabetes Care Inc * 1,662 250Teladoc Health Inc * 3,910 359Teleflex Inc 1,239 407Thermo Fisher Scientific Inc 10,328 6,891Ultragenyx Pharmaceutical Inc * 1,700 143United Therapeutics Corp * 1,132 245UnitedHealth Group Inc 24,811 12,459Universal Health Services Inc, Cl B 1,975 256Veeva Systems Inc, Cl A * 3,668 937Vertex Pharmaceuticals Inc * 6,811 1,496Viatris Inc, Cl W * 31,730 429Waters Corp * 1,599 596West Pharmaceutical Services Inc 1,941 910Zimmer Biomet Holdings Inc 5,522 701Zoetis Inc, Cl A 12,573 3,068
154,548Industrials — 8.3%
3M Co 15,195 2,699A O Smith Corp 3,400 292Acuity Brands Inc 919 195ADT Inc 4,000 34Advanced Drainage Systems Inc 1,600 218AECOM 3,500 271AGCO Corp 1,600 186Air Lease Corp, Cl A 2,800 124Alaska Air Group Inc * 3,200 167Allegion plc 2,350 311Allison Transmission Holdings Inc 2,800 102AMERCO * 237 172American Airlines Group Inc * 16,772 301AMETEK Inc 6,083 894Armstrong World Industries Inc 1,200 139Axon Enterprise Inc * 1,700 267AZEK Co Inc/The, Cl A * 3,000 139Boeing Co/The * 14,088 2,836Booz Allen Hamilton Holding Corp, Cl A 3,440 292Builders FirstSource Inc * 5,300 454
Description SharesMarket Value
($ Thousands)
COMMON STOCK (continued)BWX Technologies Inc, Cl W 2,500 $ 120Carlisle Cos Inc 1,324 328Carrier Global Corp 22,952 1,245Caterpillar Inc, Cl A 14,291 2,954CH Robinson Worldwide Inc 3,455 372ChargePoint Holdings Inc * 5,900 112Cintas Corp 2,265 1,004Clarivate PLC * 11,400 268Clean Harbors Inc * 1,300 130Colfax Corp * 3,000 138Copa Holdings SA, Cl A * 833 69Copart Inc * 5,460 828Core & Main Inc, Cl A * 900 27CoStar Group Inc * 10,400 822Crane Co, Cl A 1,300 132CSX Corp 58,176 2,187Cummins Inc 3,819 833Curtiss-Wright Corp 1,100 153Deere & Co 7,395 2,536Delta Air Lines Inc, Cl A * 16,721 653Donaldson Co Inc, Cl A 3,300 196Dover Corp 3,751 681Driven Brands Holdings Inc * 1,300 44Dun & Bradstreet Holdings Inc * 4,300 88Eaton Corp PLC 10,511 1,817Emerson Electric Co 15,646 1,455Equifax Inc 3,213 941Expeditors International of Washington Inc 4,400 591Fastenal Co, Cl A 14,987 960FedEx Corp 6,438 1,665Flowserve Corp 3,400 104Fluence Energy Inc, Cl A * 900 32Fortive Corp 8,559 653Fortune Brands Home & Security Inc 3,661 391FTI Consulting Inc * 852 131Gates Industrial Corp PLC * 2,600 41Generac Holdings Inc * 1,600 563General Dynamics Corp 6,510 1,357General Electric Co 28,684 2,710Graco Inc 4,400 355GXO Logistics Inc * 2,533 230HEICO Corp 1,150 166HEICO Corp, Cl A 2,100 270Hexcel Corp, Cl A 2,200 114Honeywell International Inc 18,355 3,827Howmet Aerospace Inc 10,200 325Hubbell Inc, Cl B 1,405 293Huntington Ingalls Industries Inc, Cl A 1,027 192IAA Inc * 3,600 182IDEX Corp 2,003 473IHS Markit Ltd 9,856 1,310Illinois Tool Works Inc 8,289 2,046
7SEI Institutional Managed Trust / Quarterly Report / December 31, 2021
SCHEDULE OF INVESTMENTS (Unaudited)December 31, 2021
Large Cap Index Fund (Continued)
Description SharesMarket Value
($ Thousands)
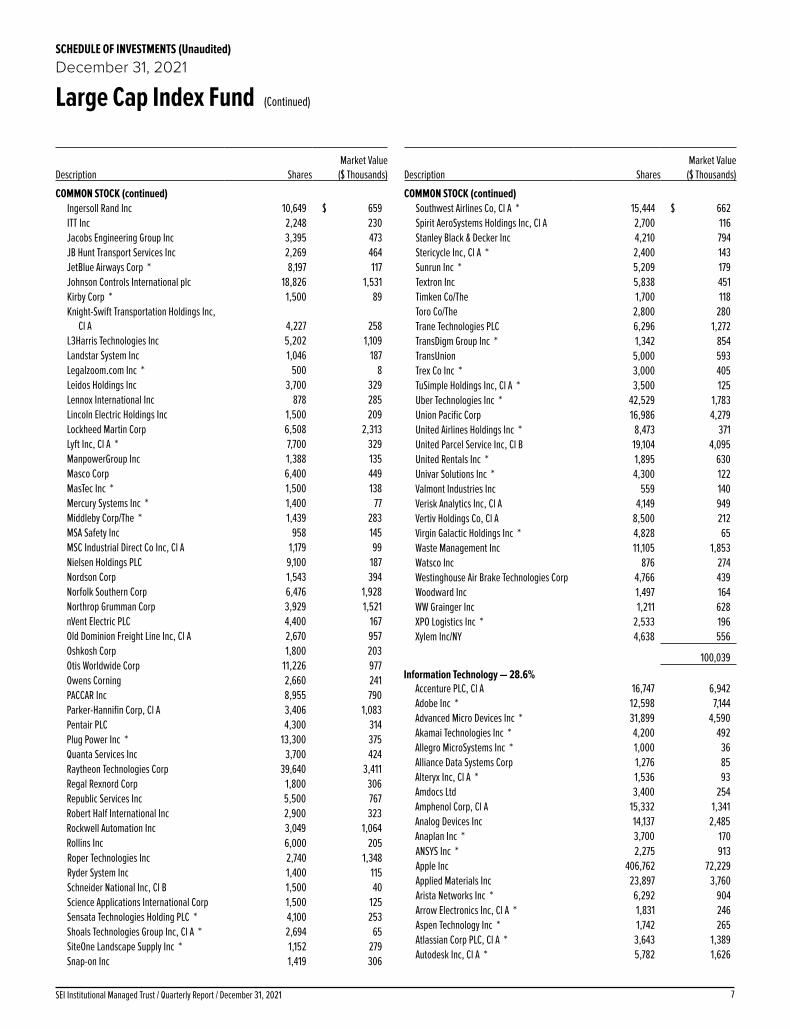
COMMON STOCK (continued)Ingersoll Rand Inc 10,649 $ 659ITT Inc 2,248 230Jacobs Engineering Group Inc 3,395 473JB Hunt Transport Services Inc 2,269 464JetBlue Airways Corp * 8,197 117Johnson Controls International plc 18,826 1,531Kirby Corp * 1,500 89Knight-Swift Transportation Holdings Inc,
Cl A 4,227 258L3Harris Technologies Inc 5,202 1,109Landstar System Inc 1,046 187Legalzoom.com Inc * 500 8Leidos Holdings Inc 3,700 329Lennox International Inc 878 285Lincoln Electric Holdings Inc 1,500 209Lockheed Martin Corp 6,508 2,313Lyft Inc, Cl A * 7,700 329ManpowerGroup Inc 1,388 135Masco Corp 6,400 449MasTec Inc * 1,500 138Mercury Systems Inc * 1,400 77Middleby Corp/The * 1,439 283MSA Safety Inc 958 145MSC Industrial Direct Co Inc, Cl A 1,179 99Nielsen Holdings PLC 9,100 187Nordson Corp 1,543 394Norfolk Southern Corp 6,476 1,928Northrop Grumman Corp 3,929 1,521nVent Electric PLC 4,400 167Old Dominion Freight Line Inc, Cl A 2,670 957Oshkosh Corp 1,800 203Otis Worldwide Corp 11,226 977Owens Corning 2,660 241PACCAR Inc 8,955 790Parker-Hannifin Corp, Cl A 3,406 1,083Pentair PLC 4,300 314Plug Power Inc * 13,300 375Quanta Services Inc 3,700 424Raytheon Technologies Corp 39,640 3,411Regal Rexnord Corp 1,800 306Republic Services Inc 5,500 767Robert Half International Inc 2,900 323Rockwell Automation Inc 3,049 1,064Rollins Inc 6,000 205Roper Technologies Inc 2,740 1,348Ryder System Inc 1,400 115Schneider National Inc, Cl B 1,500 40Science Applications International Corp 1,500 125Sensata Technologies Holding PLC * 4,100 253Shoals Technologies Group Inc, Cl A * 2,694 65SiteOne Landscape Supply Inc * 1,152 279Snap-on Inc 1,419 306
Description SharesMarket Value
($ Thousands)
COMMON STOCK (continued)Southwest Airlines Co, Cl A * 15,444 $ 662Spirit AeroSystems Holdings Inc, Cl A 2,700 116Stanley Black & Decker Inc 4,210 794Stericycle Inc, Cl A * 2,400 143Sunrun Inc * 5,209 179Textron Inc 5,838 451Timken Co/The 1,700 118Toro Co/The 2,800 280Trane Technologies PLC 6,296 1,272TransDigm Group Inc * 1,342 854TransUnion 5,000 593Trex Co Inc * 3,000 405TuSimple Holdings Inc, Cl A * 3,500 125Uber Technologies Inc * 42,529 1,783Union Pacific Corp 16,986 4,279United Airlines Holdings Inc * 8,473 371United Parcel Service Inc, Cl B 19,104 4,095United Rentals Inc * 1,895 630Univar Solutions Inc * 4,300 122Valmont Industries Inc 559 140Verisk Analytics Inc, Cl A 4,149 949Vertiv Holdings Co, Cl A 8,500 212Virgin Galactic Holdings Inc * 4,828 65Waste Management Inc 11,105 1,853Watsco Inc 876 274Westinghouse Air Brake Technologies Corp 4,766 439Woodward Inc 1,497 164WW Grainger Inc 1,211 628XPO Logistics Inc * 2,533 196Xylem Inc/NY 4,638 556
100,039Information Technology — 28.6%
Accenture PLC, Cl A 16,747 6,942Adobe Inc * 12,598 7,144Advanced Micro Devices Inc * 31,899 4,590Akamai Technologies Inc * 4,200 492Allegro MicroSystems Inc * 1,000 36Alliance Data Systems Corp 1,276 85Alteryx Inc, Cl A * 1,536 93Amdocs Ltd 3,400 254Amphenol Corp, Cl A 15,332 1,341Analog Devices Inc 14,137 2,485Anaplan Inc * 3,700 170ANSYS Inc * 2,275 913Apple Inc 406,762 72,229Applied Materials Inc 23,897 3,760Arista Networks Inc * 6,292 904Arrow Electronics Inc, Cl A * 1,831 246Aspen Technology Inc * 1,742 265Atlassian Corp PLC, Cl A * 3,643 1,389Autodesk Inc, Cl A * 5,782 1,626

SEI Institutional Managed Trust / Quarterly Report / December 31, 20218
SCHEDULE OF INVESTMENTS (Unaudited)December 31, 2021
Large Cap Index Fund (Continued)
Description SharesMarket Value
($ Thousands)
COMMON STOCK (continued)Automatic Data Processing Inc 11,174 $ 2,755Avalara Inc * 2,243 290Avnet Inc 2,500 103Azenta Inc 1,900 196Bentley Systems Inc, Cl B 3,600 174Bill.com Holdings Inc * 2,409 600Black Knight Inc * 4,000 332Block Inc, Cl A * 10,453 1,688Broadcom Inc 10,505 6,990Broadridge Financial Solutions Inc 3,081 563C3.ai Inc, Cl A * 1,600 50CACI International Inc, Cl A * 592 159Cadence Design Systems Inc * 7,251 1,351CDK Global Inc 3,276 137CDW Corp/DE 3,645 746Ceridian HCM Holding Inc * 3,455 361Ciena Corp * 4,100 316Cirrus Logic Inc * 1,500 138Cisco Systems Inc/Delaware 111,275 7,051Citrix Systems Inc 3,202 303Cloudflare Inc, Cl A * 6,800 894Cognex Corp 4,500 350Cognizant Technology Solutions Corp, Cl A 13,861 1,230Coherent Inc * 643 171CommScope Holding Co Inc * 5,100 56Concentrix Corp 1,100 196Corning Inc, Cl B 19,914 741Coupa Software Inc * 1,912 302Crowdstrike Holdings Inc, Cl A * 5,241 1,073Datadog Inc, Cl A * 6,700 1,193Datto Holding Corp * 500 13Dell Technologies Inc, Cl C * 7,087 398DocuSign Inc, Cl A * 5,120 780Dolby Laboratories Inc, Cl A 1,653 157DoubleVerify Holdings Inc * 1,400 47Dropbox Inc, Cl A * 7,800 191Duck Creek Technologies Inc * 1,900 57DXC Technology Co * 6,481 209Dynatrace Inc * 5,100 308Elastic NV * 1,900 234Enphase Energy Inc * 3,440 629Entegris Inc 3,500 485EPAM Systems Inc * 1,403 938Euronet Worldwide Inc * 1,300 155Everbridge Inc * 1,000 67F5 Inc, Cl A * 1,581 387Fair Isaac Corp * 719 312Fastly Inc, Cl A * 2,700 96Fidelity National Information Services
Inc, Cl B 16,219 1,770First Solar Inc * 2,800 244Fiserv Inc, Cl A * 15,728 1,632
Description SharesMarket Value
($ Thousands)
COMMON STOCK (continued)Five9 Inc * 1,800 $ 247FleetCor Technologies Inc * 2,111 473Fortinet Inc * 3,586 1,289Gartner Inc * 2,125 710Genpact Ltd 4,700 249Global Payments Inc 7,677 1,038GLOBALFOUNDRIES Inc * 1,400 91Globant SA * 1,100 346GoDaddy Inc, Cl A * 4,325 367Guidewire Software Inc, Cl Z * 2,182 248Hewlett Packard Enterprise Co 33,807 533HP Inc 31,301 1,179HubSpot Inc * 1,175 775Informatica Inc, Cl A * 900 33Intel Corp 106,476 5,484International Business Machines Corp 23,531 3,145Intuit Inc 6,983 4,492IPG Photonics Corp * 933 161Jabil Inc 3,900 274Jack Henry & Associates Inc 1,954 326Jamf Holding Corp * 1,290 49Juniper Networks Inc 8,500 304Keysight Technologies Inc * 4,932 1,019KLA Corp 3,989 1,716Kyndryl Holdings Inc * 6,077 110Lam Research Corp 3,725 2,679Littelfuse Inc 600 189Lumentum Holdings Inc * 2,000 212Mandiant Inc * 6,124 107Manhattan Associates Inc * 1,705 265Marvell Technology Inc 21,559 1,886Mastercard Inc, Cl A 23,046 8,281McAfee Corp, Cl A 1,900 49Microchip Technology Inc 14,350 1,249Micron Technology Inc 29,473 2,745Microsoft Corp 198,564 66,781MKS Instruments Inc 1,500 261MongoDB Inc, Cl A * 1,669 883Monolithic Power Systems Inc 1,184 584Motorola Solutions Inc 4,372 1,188N-able Inc * 1,050 12National Instruments Corp 3,527 154nCino Inc * 1,500 82NCR Corp * 3,423 138NetApp Inc 5,800 534New Relic Inc * 1,300 143NortonLifeLock Inc 14,401 374Nuance Communications Inc * 7,500 415Nutanix Inc, Cl A * 5,559 177NVIDIA Corp 63,043 18,542NXP Semiconductors NV 6,965 1,587Okta Inc, Cl A * 3,316 743

9SEI Institutional Managed Trust / Quarterly Report / December 31, 2021
SCHEDULE OF INVESTMENTS (Unaudited)December 31, 2021
Large Cap Index Fund (Continued)
Description SharesMarket Value
($ Thousands)
COMMON STOCK (continued)ON Semiconductor Corp * 11,057 $ 751Oracle Corp, Cl B 43,393 3,784Palantir Technologies Inc, Cl A * 43,620 794Palo Alto Networks Inc * 2,510 1,397Paychex Inc 8,490 1,159Paycom Software Inc * 1,316 546Paycor HCM Inc * 900 26Paylocity Holding Corp * 1,000 236PayPal Holdings Inc * 30,920 5,831Paysafe Ltd * 19,500 76Pegasystems Inc 1,100 123Procore Technologies Inc * 1,600 128PTC Inc * 2,765 335Pure Storage Inc, Cl A * 7,000 228Qorvo Inc * 2,868 449QUALCOMM Inc 29,702 5,432RingCentral Inc, Cl A * 2,110 395Sabre Corp * 8,600 74salesforce.com Inc * 24,654 6,265ServiceNow Inc * 5,152 3,344Shift4 Payments Inc, Cl A * 1,100 64Skyworks Solutions Inc 4,326 671Smartsheet Inc, Cl A * 3,100 240Snowflake Inc, Cl A * 5,200 1,762SolarWinds Corp * 1,050 15Splunk Inc * 4,282 496SS&C Technologies Holdings Inc 5,800 475StoneCo Ltd, Cl A * 5,800 98Switch Inc, Cl A 3,100 89Synopsys Inc * 3,992 1,471TD SYNNEX Corp 1,100 126Teledyne Technologies Inc * 1,199 524Teradata Corp * 2,897 123Teradyne Inc 4,354 712Texas Instruments Inc 24,326 4,585Thoughtworks Holding Inc * 1,100 30Trade Desk Inc/The, Cl A * 11,451 1,049Trimble Inc * 6,500 567Twilio Inc, Cl A * 4,358 1,148Tyler Technologies Inc * 1,060 570Ubiquiti Inc 169 52Unity Software Inc * 3,953 565Universal Display Corp 1,142 188VeriSign Inc * 2,608 662Viasat Inc * 1,900 85Visa Inc, Cl A 44,647 9,675VMware Inc, Cl A * 5,816 674Vontier Corp 4,463 137Western Digital Corp * 8,092 528Western Union Co/The 10,700 191WEX Inc * 1,195 168Wix.com Ltd * 1,400 221
Description SharesMarket Value
($ Thousands)
COMMON STOCK (continued)Wolfspeed Inc * 3,030 $ 339Workday Inc, Cl A * 4,997 1,365Xerox Holdings Corp 3,600 82Xilinx Inc 6,486 1,375Zebra Technologies Corp, Cl A * 1,388 826Zendesk Inc * 3,152 329Zoom Video Communications Inc, Cl A * 5,700 1,048Zscaler Inc * 2,076 667
344,865Materials — 2.3%
Air Products and Chemicals Inc 5,810 1,768Albemarle Corp 3,056 714Alcoa Corp 4,900 292Amcor PLC 40,400 485AptarGroup Inc 1,700 208Ardagh Metal Packaging SA * 5,450 49Ashland Global Holdings Inc 1,400 151Avery Dennison Corp 2,223 481Axalta Coating Systems Ltd * 5,400 179Ball Corp 8,435 812Berry Global Group Inc * 3,477 257Celanese Corp, Cl A 2,938 494CF Industries Holdings Inc 5,537 392Chemours Co/The 4,200 141Cleveland-Cliffs Inc * 12,000 261Corteva Inc 19,234 909Crown Holdings Inc 3,300 365Diversey Holdings Ltd * 2,200 29Dow Inc 19,675 1,116DuPont de Nemours Inc 13,838 1,118Eagle Materials Inc 1,059 176Eastman Chemical Co 3,532 427Ecolab Inc 6,646 1,559Element Solutions Inc 6,100 148FMC Corp 3,410 375Freeport-McMoRan Inc, Cl B 38,502 1,607Graphic Packaging Holding Co 7,500 146Huntsman Corp 5,605 196International Flavors & Fragrances Inc 6,711 1,011International Paper Co 10,291 484Louisiana-Pacific Corp 2,500 196LyondellBasell Industries NV, Cl A 6,861 633Martin Marietta Materials Inc, Cl A 1,624 715Mosaic Co/The 9,700 381NewMarket Corp 182 62Newmont Corp 21,155 1,312Nucor Corp 7,641 872Olin Corp 3,700 213Packaging Corp of America 2,427 330PPG Industries Inc 6,188 1,067Reliance Steel & Aluminum Co 1,687 274
SEI Institutional Managed Trust / Quarterly Report / December 31, 202110
SCHEDULE OF INVESTMENTS (Unaudited)December 31, 2021
Large Cap Index Fund (Continued)
Description SharesMarket Value
($ Thousands)
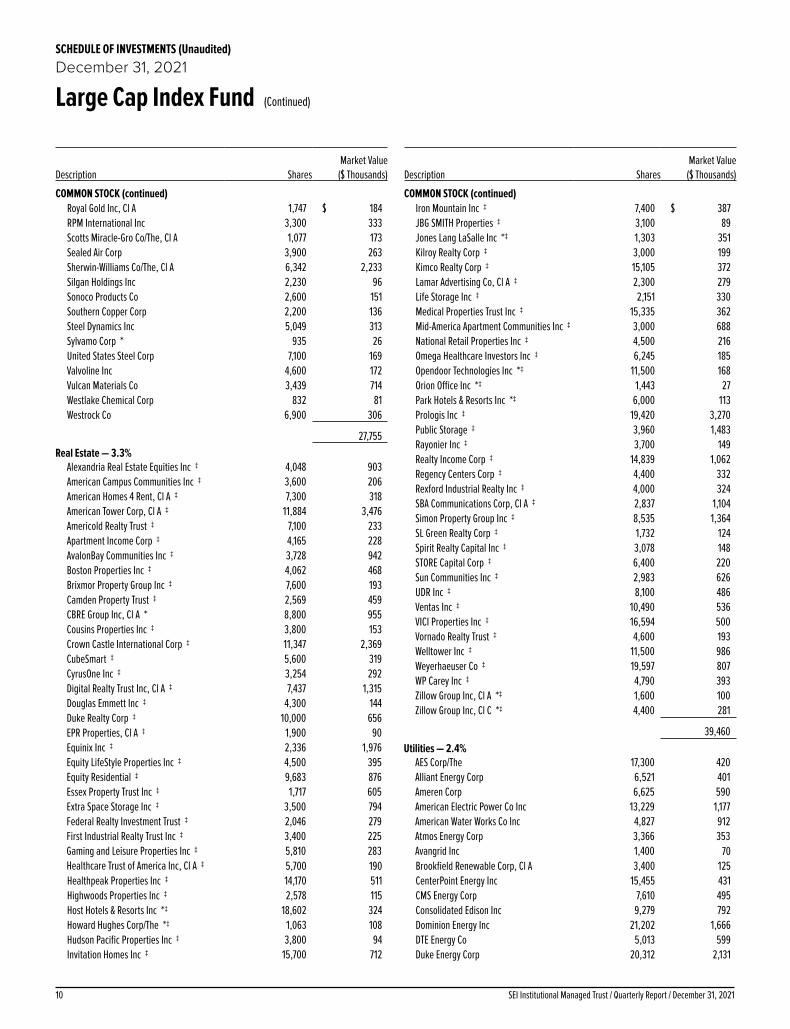
COMMON STOCK (continued)Royal Gold Inc, Cl A 1,747 $ 184RPM International Inc 3,300 333Scotts Miracle-Gro Co/The, Cl A 1,077 173Sealed Air Corp 3,900 263Sherwin-Williams Co/The, Cl A 6,342 2,233Silgan Holdings Inc 2,230 96Sonoco Products Co 2,600 151Southern Copper Corp 2,200 136Steel Dynamics Inc 5,049 313Sylvamo Corp * 935 26United States Steel Corp 7,100 169Valvoline Inc 4,600 172Vulcan Materials Co 3,439 714Westlake Chemical Corp 832 81Westrock Co 6,900 306
27,755Real Estate — 3.3%
Alexandria Real Estate Equities Inc ‡ 4,048 903American Campus Communities Inc ‡ 3,600 206American Homes 4 Rent, Cl A ‡ 7,300 318American Tower Corp, Cl A ‡ 11,884 3,476Americold Realty Trust ‡ 7,100 233Apartment Income Corp ‡ 4,165 228AvalonBay Communities Inc ‡ 3,728 942Boston Properties Inc ‡ 4,062 468Brixmor Property Group Inc ‡ 7,600 193Camden Property Trust ‡ 2,569 459CBRE Group Inc, Cl A * 8,800 955Cousins Properties Inc ‡ 3,800 153Crown Castle International Corp ‡ 11,347 2,369CubeSmart ‡ 5,600 319CyrusOne Inc ‡ 3,254 292Digital Realty Trust Inc, Cl A ‡ 7,437 1,315Douglas Emmett Inc ‡ 4,300 144Duke Realty Corp ‡ 10,000 656EPR Properties, Cl A ‡ 1,900 90Equinix Inc ‡ 2,336 1,976Equity LifeStyle Properties Inc ‡ 4,500 395Equity Residential ‡ 9,683 876Essex Property Trust Inc ‡ 1,717 605Extra Space Storage Inc ‡ 3,500 794Federal Realty Investment Trust ‡ 2,046 279First Industrial Realty Trust Inc ‡ 3,400 225Gaming and Leisure Properties Inc ‡ 5,810 283Healthcare Trust of America Inc, Cl A ‡ 5,700 190Healthpeak Properties Inc ‡ 14,170 511Highwoods Properties Inc ‡ 2,578 115Host Hotels & Resorts Inc *‡ 18,602 324Howard Hughes Corp/The *‡ 1,063 108Hudson Pacific Properties Inc ‡ 3,800 94Invitation Homes Inc ‡ 15,700 712
Description SharesMarket Value
($ Thousands)
COMMON STOCK (continued)Iron Mountain Inc ‡ 7,400 $ 387JBG SMITH Properties ‡ 3,100 89Jones Lang LaSalle Inc *‡ 1,303 351Kilroy Realty Corp ‡ 3,000 199Kimco Realty Corp ‡ 15,105 372Lamar Advertising Co, Cl A ‡ 2,300 279Life Storage Inc ‡ 2,151 330Medical Properties Trust Inc ‡ 15,335 362Mid-America Apartment Communities Inc ‡ 3,000 688National Retail Properties Inc ‡ 4,500 216Omega Healthcare Investors Inc ‡ 6,245 185Opendoor Technologies Inc *‡ 11,500 168Orion Office Inc *‡ 1,443 27Park Hotels & Resorts Inc *‡ 6,000 113Prologis Inc ‡ 19,420 3,270Public Storage ‡ 3,960 1,483Rayonier Inc ‡ 3,700 149Realty Income Corp ‡ 14,839 1,062Regency Centers Corp ‡ 4,400 332Rexford Industrial Realty Inc ‡ 4,000 324SBA Communications Corp, Cl A ‡ 2,837 1,104Simon Property Group Inc ‡ 8,535 1,364SL Green Realty Corp ‡ 1,732 124Spirit Realty Capital Inc ‡ 3,078 148STORE Capital Corp ‡ 6,400 220Sun Communities Inc ‡ 2,983 626UDR Inc ‡ 8,100 486Ventas Inc ‡ 10,490 536VICI Properties Inc ‡ 16,594 500Vornado Realty Trust ‡ 4,600 193Welltower Inc ‡ 11,500 986Weyerhaeuser Co ‡ 19,597 807WP Carey Inc ‡ 4,790 393Zillow Group Inc, Cl A *‡ 1,600 100Zillow Group Inc, Cl C *‡ 4,400 281
39,460Utilities — 2.4%
AES Corp/The 17,300 420Alliant Energy Corp 6,521 401Ameren Corp 6,625 590American Electric Power Co Inc 13,229 1,177American Water Works Co Inc 4,827 912Atmos Energy Corp 3,366 353Avangrid Inc 1,400 70Brookfield Renewable Corp, Cl A 3,400 125CenterPoint Energy Inc 15,455 431CMS Energy Corp 7,610 495Consolidated Edison Inc 9,279 792Dominion Energy Inc 21,202 1,666DTE Energy Co 5,013 599Duke Energy Corp 20,312 2,131

11SEI Institutional Managed Trust / Quarterly Report / December 31, 2021
SCHEDULE OF INVESTMENTS (Unaudited)December 31, 2021
Large Cap Index Fund (Continued)
Description SharesMarket Value
($ Thousands)
COMMON STOCK (continued)Edison International 9,749 $ 665Entergy Corp 5,289 596Essential Utilities Inc 6,100 327Evergy Inc 5,917 406Eversource Energy 8,998 819Exelon Corp 25,739 1,487FirstEnergy Corp 14,200 591Hawaiian Electric Industries Inc 2,800 116IDACORP Inc, Cl A 1,300 147MDU Resources Group Inc 5,300 163National Fuel Gas Co 2,300 147NextEra Energy Inc 51,745 4,831NiSource Inc 10,300 284NRG Energy Inc 6,400 276OGE Energy Corp 5,200 199PG&E Corp * 39,506 480Pinnacle West Capital Corp 2,900 205PPL Corp 20,103 604Public Service Enterprise Group Inc 13,180 879Sempra Energy 8,431 1,115Southern Co/The 27,862 1,911UGI Corp 5,430 249Vistra Corp 12,469 284WEC Energy Group Inc 8,284 804Xcel Energy Inc 14,090 954
28,701
Total Common Stock
(Cost $752,681) ($ Thousands) 1,181,135
AFFILIATED PARTNERSHIP — 0.0%SEI Liquidity Fund, L.P.
0.020% **†(D) 292,945 293
Total Affiliated Partnership (Cost $293) ($ Thousands) 293
CASH EQUIVALENT — 1.8%SEI Daily Income Trust, Government
Fund, Cl F0.010%**† 21,924,840 21,925
Total Cash Equivalent(Cost $21,925) ($ Thousands) 21,925
Total Investments in Securities — 99.9%(Cost $774,899) ($ Thousands) $ 1,203,353

SEI Institutional Managed Trust / Quarterly Report / December 31, 202112
SCHEDULE OF INVESTMENTS (Unaudited)December 31, 2021
Large Cap Index Fund (Concluded)
A list of the open futures contracts held by the Fund at December 31, 2021 is as follows:
Type of ContractNumber of Contracts
Expiration Date
Notional Amount (Thousands) Value (Thousands)
Unrealized Appreciation (Thousands)
Long ContractsS&P 500 Index E-MINI 93 Mar-2022 $ 21,612 $ 22,127 $ 515S&P Mid Cap 400 Index E-MINI 5 Mar-2022 1,368 1,419 51
$ 22,980 $ 23,546 $ 566
Percentages are based on Net Assets of $1,204,285 ($ Thousands).* Non-income producing security.** The rate reported is the 7-day effective yield as of December 31, 2021.† Investment in Affiliated Security.‡ Real Estate Investment Trust.(A) Certain securities or partial positions of certain securities are on loan at
December 31, 2021 . The total market value of securities on loan at December 31, 2021 was $287 ($ Thousands).
(B) Security is a Master Limited Partnership. At December 31, 2021, such securities amounted to $2,434 ($ Thousands), or 0.2% of the Net Assets of the Fund.
(C) Securities considered illiquid. The total value of such securities as of December 31, 2021 was $8 ($ Thousands) and represented 0.0% of the Net Assets of the Fund.
(D) This security was purchased with cash collateral held from securities on loan. The total market value of such securities as of December 31, 2021 was $293 ($ Thousands).
Cl — ClassL.P. — Limited PartnershipLtd — LimitedPLC — Public Limited CompanyS&P — Standard & Poor's
The following is a list of the levels of inputs used as of December 31, 2021 in valuing the Fund’s investments and other financial instruments carried at value ($ Thousands):
Investments in SecuritiesLevel 1
($)Level 2
($)Level 3
($)Total
($)Common Stock 1,181,135 – – 1,181,135Affiliated Partnership – 293 – 293Cash Equivalent 21,925 – – 21,925
Total Investments in Securities 1,203,060 293 – 1,203,353
Other Financial InstrumentsLevel 1
($)Level 2
($)Level 3
($)Total
($)Futures Contracts*
Unrealized Appreciation 566 – – 566
Total Other Financial Instruments 566 – – 566
* Futures contracts are valued at the unrealized appreciation on the instrument.
For the period ended December 31, 2021, there were no transfers in or out of Level 3.
For information regarding the Fund’s policy regarding valuation of investments and other significant accounting policies, please refer to the Fund’s more recent semi-annual and annual financial statements.
The following is a summary of the transactions with affiliates for the period ended December 31, 2021 ($ Thousands):
SecurityValue Description Value
9/30/2021 Purchases at Cost Proceeds from
Sales Realized Gain/
(Loss)
Change in Unrealized
Appreciation/(Depreciation)
Value 12/31/2021 Shares Income Capital Gains
SEI Investment Co $ 172 $ — $ (6) $ (1) $ 6 $ 171 2,800 $ 1 $ — SEI Liquidity Fund, L.P. 545 830 (1,082) — — 293 292,945 3 $ — SEI Daily Income Trust, Government Fund, Cl F 12,691 41,123 (31,889) — — 21,925 21,924,840 — — Totals $ 13,408 $ 41,953 $ (32,977) $ (1) $ 6 $ 22,389 $ 4 $ —
Amounts designated as “—” are $0 or have been rounded to $0.

1SEI Institutional Managed Trust / Quarterly Report / December 31, 2021
SCHEDULE OF INVESTMENTS (Unaudited)December 31, 2021
Tax-Managed Large Cap Fund
Description SharesMarket Value
($ Thousands)
COMMON STOCK — 99.7%
Communication Services — 5.4%Alphabet Inc, Cl A * 26,214 $ 75,943Alphabet Inc, Cl C * 22,848 66,113AT&T Inc 244,363 6,011BCE Inc 433,577 22,563Charter Communications Inc, Cl A * 14,857 9,686Comcast Corp, Cl A 121,805 6,130Electronic Arts Inc 48,975 6,460Lumen Technologies Inc 162,240 2,036Meta Platforms Inc, Cl A * 135,757 45,662Omnicom Group Inc 97,998 7,180TEGNA Inc 153,973 2,858Verizon Communications Inc 97,068 5,044ViacomCBS Inc, Cl B 300,000 9,054Walt Disney Co/The * 22,000 3,408
268,148Consumer Discretionary — 11.5%
Amazon.com Inc, Cl A * 18,448 61,512AutoZone Inc * 16,513 34,618Bath & Body Works Inc 16,235 1,133Best Buy Co Inc 186,465 18,945Booking Holdings Inc * 2,537 6,087BorgWarner Inc 89,239 4,022Brinker International Inc * 141,821 5,189Carnival Corp * 357,842 7,200Darden Restaurants Inc 3,127 471Dick's Sporting Goods Inc 131,310 15,099Dollar General Corp 222,711 52,522Domino's Pizza Inc 16,892 9,533DR Horton Inc 16,198 1,757eBay Inc 127,055 8,449Foot Locker Inc, Cl A 65,687 2,866Genuine Parts Co 79,642 11,166Goodyear Tire & Rubber Co/The * 406,438 8,665Harley-Davidson Inc, Cl A 88,020 3,318Home Depot Inc/The 28,380 11,778Lear Corp 89,362 16,349Lowe's Cos Inc 328,236 84,842Magna International Inc, Cl A 19,822 1,604NIKE Inc, Cl B 357,743 59,625O'Reilly Automotive Inc * 1,906 1,346PulteGroup Inc 251,522 14,377Ross Stores Inc 102,513 11,715Royal Caribbean Cruises Ltd * 71,822 5,523Starbucks Corp 68,046 7,959Target Corp, Cl A 185,748 42,989TJX Cos Inc/The 374,562 28,437TopBuild Corp * 40,098 11,063Victoria's Secret & Co * 5,411 301
Description SharesMarket Value
($ Thousands)
COMMON STOCK (continued)Whirlpool Corp 59,551 $ 13,974
564,434Consumer Staples — 8.0%
Altria Group Inc 458,579 21,732Archer-Daniels-Midland Co 50,878 3,439Coca-Cola Co/The 123,765 7,328Conagra Brands Inc 406,631 13,886Constellation Brands Inc, Cl A 10,975 2,754Costco Wholesale Corp 19,276 10,943Diageo PLC ADR 73,341 16,145Estee Lauder Cos Inc/The, Cl A 35,000 12,957Hershey Co/The 26,426 5,113Ingredion Inc 43,398 4,194J M Smucker Co/The 115,422 15,676Kimberly-Clark Corp 101,362 14,487Kraft Heinz Co/The 115,076 4,131Kroger Co/The 924,655 41,850Lamb Weston Holdings Inc 16,377 1,038Molson Coors Beverage Co, Cl B 248,427 11,515Mondelez International Inc, Cl A 24,475 1,623Monster Beverage Corp * 55,061 5,288PepsiCo Inc 208,587 36,234Philip Morris International Inc 469,703 44,622Procter & Gamble Co/The 233,806 38,246Sysco Corp, Cl A 22,279 1,750Tyson Foods Inc, Cl A 253,116 22,061Unilever PLC ADR 571,048 30,717Walgreens Boots Alliance Inc 303,967 15,855Walmart Inc 75,302 10,895
394,479Energy — 2.6%
BP PLC ADR 82,387 2,194Canadian Natural Resources Ltd 293,668 12,407Chevron Corp 212,408 24,926ConocoPhillips 223,162 16,108Devon Energy Corp 743,505 32,752Exxon Mobil Corp 129,439 7,920HollyFrontier Corp 40,846 1,339Marathon Petroleum Corp 154,884 9,911Phillips 66 109,951 7,967Valero Energy Corp 173,346 13,020
128,544Financials — 16.4%
Aflac Inc 136,144 7,949Allstate Corp/The 59,438 6,993American Financial Group Inc/OH 11,100 1,524Ameriprise Financial Inc 82,444 24,870Assurant Inc 36,000 5,611Assured Guaranty Ltd 31,872 1,600Bank of America Corp 1,550,747 68,993

SEI Institutional Managed Trust / Quarterly Report / December 31, 20212
SCHEDULE OF INVESTMENTS (Unaudited)December 31, 2021
Tax-Managed Large Cap Fund (Continued)
Description SharesMarket Value
($ Thousands)
COMMON STOCK (continued)Berkshire Hathaway Inc, Cl B * 93,247 $ 27,881Capital One Financial Corp 43,778 6,352Charles Schwab Corp/The 172,552 14,512Citigroup Inc 192,518 11,626Citizens Financial Group Inc 326,590 15,431CME Group Inc 77,815 17,778Comerica Inc 110,000 9,570Discover Financial Services 126,480 14,616Everest Re Group Ltd 38,172 10,456FactSet Research Systems Inc 11,209 5,448Fifth Third Bancorp 589,594 25,677First Republic Bank/CA 77,370 15,978Goldman Sachs Group Inc/The 21,644 8,280Hartford Financial Services Group Inc/The 66,936 4,621Intercontinental Exchange Inc 58,438 7,993JPMorgan Chase & Co 474,451 75,129KeyCorp 778,006 17,995KKR & Co Inc 193,080 14,384Lincoln National Corp 232,070 15,841Markel Corp * 1,260 1,555Marsh & McLennan Cos Inc 138,328 24,044Moody's Corp 263,689 102,992Morgan Stanley 311,935 30,619MSCI Inc, Cl A 80,675 49,429Navient Corp 263,511 5,592PNC Financial Services Group Inc/The 46,966 9,418Popular Inc 125,661 10,309Progressive Corp/The 44,272 4,544Prudential Financial Inc 17,700 1,916Regions Financial Corp 599,114 13,061S&P Global Inc 18,482 8,722SLM Corp 230,135 4,527State Street Corp 59,446 5,528T Rowe Price Group Inc 24,474 4,812Travelers Cos Inc/The 119,703 18,725Truist Financial Corp 178,724 10,464US Bancorp 490,721 27,564Voya Financial Inc 156,840 10,400Wells Fargo & Co 92,870 4,456Zions Bancorp NA 336,413 21,248
807,033Health Care — 14.6%
Abbott Laboratories 84,496 11,892AbbVie Inc 92,048 12,463AmerisourceBergen Corp, Cl A 137,635 18,290Amgen Inc, Cl A 145,948 32,834Anthem Inc 10,844 5,027AstraZeneca PLC ADR 122,916 7,160Baxter International Inc 63,282 5,432Becton Dickinson and Co 113,758 28,608Biogen Inc * 35,657 8,555
Description SharesMarket Value
($ Thousands)
COMMON STOCK (continued)Bristol-Myers Squibb Co 192,866 $ 12,025Cardinal Health Inc 72,515 3,734Centene Corp * 30,902 2,546Cigna Corp 27,340 6,278CVS Health Corp 379,134 39,111DaVita Inc * 31,137 3,542Edwards Lifesciences Corp, Cl A * 61,914 8,021Eli Lilly & Co 110,545 30,535Gilead Sciences Inc 120,443 8,745HCA Healthcare Inc 109,165 28,047Horizon Therapeutics Plc * 73,523 7,923Humana Inc 22,738 10,547IDEXX Laboratories Inc * 41,683 27,447Intuitive Surgical Inc * 23,007 8,266Johnson & Johnson 633,113 108,307McKesson Corp 12,923 3,212Medtronic PLC 32,896 3,403Merck & Co Inc 605,640 46,416Mettler-Toledo International Inc * 28,371 48,152Novo Nordisk A/S ADR 86,039 9,636Organon & Co 60,564 1,844Pfizer Inc 815,680 48,166Teleflex Inc 28,507 9,364United Therapeutics Corp * 38,304 8,277UnitedHealth Group Inc 167,008 83,861Veeva Systems Inc, Cl A * 18,537 4,736Vertex Pharmaceuticals Inc * 2,503 550Viatris Inc, Cl W * 87,616 1,186Zoetis Inc, Cl A 63,768 15,561
719,699Industrials — 9.3%
3M Co 131,281 23,319A O Smith Corp 43,114 3,701AerCap Holdings NV * 16,897 1,106AGCO Corp 52,600 6,103Carlisle Cos Inc 6,137 1,523Carrier Global Corp 357,041 19,366Caterpillar Inc, Cl A 32,511 6,721Chart Industries Inc * 52,089 8,308Cummins Inc 8,214 1,792Deere & Co 27,326 9,370Delta Air Lines Inc, Cl A * 128,832 5,035Eaton Corp PLC 62,865 10,864FedEx Corp 20,626 5,335Fortive Corp 64,772 4,941Graco Inc 542,313 43,721Honeywell International Inc 61,532 12,830Huntington Ingalls Industries Inc, Cl A 41,706 7,788Illinois Tool Works Inc 47,481 11,718Johnson Controls International plc 494,338 40,195L3Harris Technologies Inc 25,220 5,378

3SEI Institutional Managed Trust / Quarterly Report / December 31, 2021
SCHEDULE OF INVESTMENTS (Unaudited)December 31, 2021
Tax-Managed Large Cap Fund (Continued)
Description SharesMarket Value
($ Thousands)
COMMON STOCK (continued)Lockheed Martin Corp 15,688 $ 5,576ManpowerGroup Inc 18,167 1,768Middleby Corp/The * 100,000 19,676Northrop Grumman Corp 16,563 6,411Oshkosh Corp 61,954 6,983Otis Worldwide Corp 149,373 13,006PACCAR Inc 43,000 3,795Raytheon Technologies Corp 247,761 21,322Robert Half International Inc 25,692 2,865Roper Technologies Inc 56,426 27,754Siemens AG ADR 311,780 27,000Southwest Airlines Co, Cl A * 86,460 3,704SPX Corp * 148,826 8,882Stanley Black & Decker Inc 20,000 3,772Textron Inc 190,528 14,709Timken Co/The 112,333 7,784TransDigm Group Inc * 3,676 2,339United Parcel Service Inc, Cl B 81,427 17,453Waste Management Inc 18,232 3,043WW Grainger Inc 64,211 33,277
460,233Information Technology — 22.5%
Adobe Inc * 132,912 75,369Amphenol Corp, Cl A 104,624 9,150Analog Devices Inc 99,044 17,409Apple Inc 932,824 165,642Applied Materials Inc 148,944 23,438Arista Networks Inc * 92,424 13,286ASML Holding NV ADR, Cl G 12,522 9,969Broadcom Inc 17,131 11,399Cadence Design Systems Inc * 25,000 4,659Cisco Systems Inc/Delaware 498,298 31,577Citrix Systems Inc 44,716 4,230Cognizant Technology Solutions Corp, Cl A 8,912 791Corning Inc, Cl B 234,159 8,718Crowdstrike Holdings Inc, Cl A * 16,348 3,347Dropbox Inc, Cl A * 83,470 2,048F5 Inc, Cl A * 53,596 13,115Fair Isaac Corp * 3,582 1,553Hewlett Packard Enterprise Co 307,307 4,846HP Inc 480,394 18,096Intel Corp 571,741 29,445International Business Machines Corp 6,932 926Intuit Inc 156,005 100,346Juniper Networks Inc 7,046 252Keysight Technologies Inc * 96,705 19,971Lam Research Corp 10,701 7,696Marvell Technology Inc 121,828 10,659Mastercard Inc, Cl A 175,853 63,187Microchip Technology Inc 578,798 50,390Micron Technology Inc 156,515 14,579
Description SharesMarket Value
($ Thousands)
COMMON STOCK (continued)Microsoft Corp 486,353 $ 163,570Motorola Solutions Inc 22,111 6,008NetApp Inc 45,929 4,225Oracle Corp, Cl B 512,747 44,717Qorvo Inc * 23,736 3,712QUALCOMM Inc 67,431 12,331salesforce.com Inc * 15,984 4,062SAP SE ADR 7,111 996Seagate Technology Holdings PLC 112,151 12,671ServiceNow Inc * 12,689 8,237Texas Instruments Inc 44,297 8,349VeriSign Inc * 91,384 23,195Visa Inc, Cl A 275,684 59,743Vishay Intertechnology Inc 449,383 9,828Vontier Corp 279,165 8,579Western Digital Corp * 33,750 2,201Xerox Holdings Corp 689,643 15,613Zendesk Inc * 29,165 3,042
1,107,172Materials — 5.3%
Air Products and Chemicals Inc 26,733 8,134Cabot Corp 119,095 6,693Celanese Corp, Cl A 28,298 4,756Corteva Inc 64,004 3,026Dow Inc 162,912 9,240DuPont de Nemours Inc 43,599 3,522Eastman Chemical Co 165,233 19,978Ecolab Inc 83,739 19,644Huntsman Corp 531,983 18,556Ingevity Corp * 14,131 1,013International Paper Co 135,045 6,345Linde PLC 123,959 42,943LyondellBasell Industries NV, Cl A 74,826 6,901Newmont Corp 98,126 6,086O-I Glass Inc, Cl I * 451,358 5,430Reliance Steel & Aluminum Co 18,766 3,044Sherwin-Williams Co/The, Cl A 199,665 70,314Steel Dynamics Inc 349,887 21,718Sylvamo Corp * 12,276 342Westrock Co 27,405 1,216
258,901Real Estate — 1.9%
American Tower Corp, Cl A ‡ 101,757 29,764Brandywine Realty Trust ‡ 24,300 326CBRE Group Inc, Cl A * 41,173 4,468Crown Castle International Corp ‡ 40,644 8,484Diversified Healthcare Trust ‡ 636,083 1,965Equinix Inc ‡ 1,986 1,680Healthpeak Properties Inc ‡ 502,660 18,141Invitation Homes Inc ‡ 28,203 1,279Public Storage ‡ 4,106 1,538

SEI Institutional Managed Trust / Quarterly Report / December 31, 20214
SCHEDULE OF INVESTMENTS (Unaudited)December 31, 2021
Tax-Managed Large Cap Fund (Continued)
Description SharesMarket Value
($ Thousands)
COMMON STOCK (continued)SBA Communications Corp, Cl A ‡ 25,216 $ 9,810Service Properties Trust ‡ 461,799 4,059Welltower Inc ‡ 146,710 12,583
94,097Utilities — 2.2%
Ameren Corp 65,226 5,806American Electric Power Co Inc 57,553 5,121Duke Energy Corp 137,783 14,453Edison International 170,413 11,631Exelon Corp 194,915 11,258FirstEnergy Corp 73,115 3,041NextEra Energy Inc 221,528 20,682NiSource Inc 700,009 19,327NRG Energy Inc 58,385 2,515PPL Corp 412,161 12,390UGI Corp 29,973 1,376Vistra Corp 40,284 917
108,517
Description SharesMarket Value
($ Thousands)
COMMON STOCK (continued)
Total Common Stock
(Cost $1,587,129) ($ Thousands) $ 4,911,257
AFFILIATED PARTNERSHIP — 0.1%SEI Liquidity Fund, L.P.
0.020% **†(A) 6,138,327 6,139
Total Affiliated Partnership (Cost $6,140) ($ Thousands) 6,139
CASH EQUIVALENT — 0.3%SEI Daily Income Trust, Government
Fund, Cl F0.010%**† 16,235,286 16,235
Total Cash Equivalent(Cost $16,235) ($ Thousands) 16,235
Total Investments in Securities — 100.1%(Cost $1,609,504) ($ Thousands) $ 4,933,631
A list of the open futures contracts held by the Fund at December 31, 2021, is as follows:
Type of ContractNumber of Contracts
Expiration Date
Notional Amount (Thousands) Value (Thousands)
Unrealized Appreciation (Thousands)
Long ContractsS&P 500 Index E-MINI 32 Mar-2022 $ 7,499 $ 7,614 $ 115S&P Mid Cap 400 Index E-MINI 3 Mar-2022 838 851 13
$ 8,337 $ 8,465 $ 128
Percentages are based on Net Assets of $4,928,041 ($ Thousands).* Non-income producing security.** The rate reported is the 7-day effective yield as of December 31, 2021.† Investment in Affiliated Security.‡ Real Estate Investment Trust.(A) This security was purchased with cash collateral held from securities on loan.
The total market value of such securities as of December 31, 2021 was $6,139 ($ Thousands). Subsequent of the period end the security on loan was sold.
ADR — American Depositary ReceiptCl — ClassL.P. — Limited PartnershipLtd. — Limited PLC — Public Limited CompanyS&P— Standard & Poor's

5SEI Institutional Managed Trust / Quarterly Report / December 31, 2021
SCHEDULE OF INVESTMENTS (Unaudited)December 31, 2021
Tax-Managed Large Cap Fund (Concluded)
The following is a list of the levels of inputs used as of December 31, 2021 in valuing the Fund’s investments and other financial instruments carried at value ($ Thousands):
Investments in SecuritiesLevel 1
($)Level 2
($)Level 3
($)Total
($)Common Stock 4,911,257 – – 4,911,257Affiliated Partnership – 6,139 – 6,139Cash Equivalent 16,235 – – 16,235
Total Investments in Securities 4,927,492 6,139 – 4,933,631
Other Financial InstrumentsLevel 1
($)Level 2
($)Level 3
($)Total
($)Futures Contracts*
Unrealized Appreciation 128 – – 128
Total Other Financial Instruments 128 – – 128
*Futures contracts are valued at the unrealized appreciation on the instrument.
For the period ended December 31, 2021, there were no transfers in or out of Level 3.
For information regarding the Fund’s policy regarding valuation of investments and other significant accounting policies, please refer to the Fund’s more recent semi-annual and annual financial statements.
The following is a summary of the transactions with affiliates for the period ended December 31, 2021 ($ Thousands):
Security Description Value 9/30/2021 Purchases at Cost Proceeds from
Sales Realized Gain/
(Loss)
Change in Unrealized
Appreciation/(Depreciation)
Value 12/31/2021 Shares Income Capital Gains
SEI Liquidity Fund, L.P. $ 21,437 $ 76,930 $ (92,227) $ — $ (1) $ 6,139 6,138,327 $ 10 $ — SEI Daily Income Trust, Government Fund, Cl F 28,361 168,019 (180,145) — — 16,235 16,235,286 1 — Totals $ 49,798 $ 244,949 $ (272,372) $ — $ (1) $ 22,374 $ 11 $ —
Amounts designated as “—” are $0 or have been rounded to $0.

1SEI Institutional Managed Trust / Quarterly Report / December 31, 2021
SCHEDULE OF INVESTMENTS (Unaudited)December 31, 2021
S&P 500 Index Fund
Description SharesMarket Value
($ Thousands)
COMMON STOCK — 98.6%
Communication Services — 10.0%Activision Blizzard Inc 20,590 $ 1,370Alphabet Inc, Cl A * 7,953 23,040Alphabet Inc, Cl C * 7,393 21,392AT&T Inc 188,917 4,647Charter Communications Inc, Cl A * 3,253 2,121Comcast Corp, Cl A 120,296 6,055Discovery Inc, Cl A *(A) 4,500 106Discovery Inc, Cl C * 8,096 185DISH Network Corp, Cl A * 6,438 209Electronic Arts Inc 7,478 986Fox Corp 12,619 455Interpublic Group of Cos Inc/The 10,301 386Live Nation Entertainment Inc * 3,500 419Lumen Technologies Inc 26,170 328Match Group Inc * 7,500 992Meta Platforms Inc, Cl A * 62,562 21,043Netflix Inc * 11,666 7,028News Corp, Cl A 10,175 227News Corp, Cl B 3,400 77Omnicom Group Inc 5,704 418Take-Two Interactive Software Inc, Cl A * 3,000 533T-Mobile US Inc * 15,500 1,798Twitter Inc * 20,900 903Verizon Communications Inc 109,516 5,690ViacomCBS Inc, Cl B 15,821 477Walt Disney Co/The * 48,089 7,449
108,334Consumer Discretionary — 12.4%
Advance Auto Parts Inc 1,700 408Amazon.com Inc, Cl A * 11,531 38,448Aptiv PLC * 7,121 1,175AutoZone Inc * 567 1,189Bath & Body Works Inc 6,927 483Best Buy Co Inc 5,954 605Booking Holdings Inc * 1,080 2,591BorgWarner Inc 6,300 284Caesars Entertainment Inc * 5,600 524CarMax Inc * 4,300 560Carnival Corp * 20,884 420Chipotle Mexican Grill Inc, Cl A * 744 1,301Darden Restaurants Inc 3,418 515Dollar General Corp 6,181 1,458Dollar Tree Inc * 6,054 851Domino's Pizza Inc 964 544DR Horton Inc 8,558 928eBay Inc 17,049 1,134Etsy Inc * 3,300 722Expedia Group Inc * 3,855 697Ford Motor Co 103,170 2,143Gap Inc/The 5,731 101
Description SharesMarket Value
($ Thousands)
COMMON STOCK (continued)Garmin Ltd 4,005 $ 545General Motors Co * 38,413 2,252Genuine Parts Co 3,736 524Hasbro Inc 3,396 346Hilton Worldwide Holdings Inc * 7,300 1,139Home Depot Inc/The 27,861 11,563Las Vegas Sands Corp * 8,900 335Lennar Corp, Cl A 7,216 838LKQ Corp 7,100 426Lowe's Cos Inc 18,322 4,736Marriott International Inc/MD, Cl A * 7,224 1,194McDonald's Corp 19,785 5,304MGM Resorts International 10,500 471Mohawk Industries Inc * 1,500 273Newell Brands Inc, Cl B 9,855 215NIKE Inc, Cl B 33,823 5,637Norwegian Cruise Line Holdings Ltd * 9,900 205NVR Inc * 86 508O'Reilly Automotive Inc * 1,818 1,284Penn National Gaming Inc * 4,400 228Pool Corp 1,065 603PulteGroup Inc 6,899 394PVH Corp 1,859 198Ralph Lauren Corp, Cl A 1,305 155Ross Stores Inc 9,336 1,067Royal Caribbean Cruises Ltd * 5,900 454Starbucks Corp 31,187 3,648Tapestry Inc 7,319 297Target Corp, Cl A 13,028 3,015Tesla Inc * 21,507 22,728TJX Cos Inc/The 31,686 2,406Tractor Supply Co 2,980 711Ulta Beauty Inc * 1,447 597Under Armour Inc, Cl A * 5,005 106Under Armour Inc, Cl C * 5,149 93VF Corp 8,565 627Whirlpool Corp 1,612 378Wynn Resorts Ltd * 2,800 238Yum! Brands Inc 7,770 1,079
133,898Consumer Staples — 5.8%
Altria Group Inc 48,473 2,297Archer-Daniels-Midland Co 14,675 992Brown-Forman Corp, Cl B 4,865 354Campbell Soup Co 5,384 234Church & Dwight Co Inc 6,500 666Clorox Co/The 3,242 565Coca-Cola Co/The 102,849 6,090Colgate-Palmolive Co 22,195 1,894Conagra Brands Inc 12,665 433Constellation Brands Inc, Cl A 4,407 1,106

SEI Institutional Managed Trust / Quarterly Report / December 31, 20212
SCHEDULE OF INVESTMENTS (Unaudited)December 31, 2021
S&P 500 Index Fund (Continued)
Description SharesMarket Value
($ Thousands)
COMMON STOCK (continued)Costco Wholesale Corp 11,681 $ 6,631Estee Lauder Cos Inc/The, Cl A 6,090 2,255General Mills Inc 15,886 1,070Hershey Co/The 3,812 738Hormel Foods Corp 7,508 366J M Smucker Co/The 2,853 388Kellogg Co 6,667 429Kimberly-Clark Corp 8,903 1,272Kraft Heinz Co/The 18,708 672Kroger Co/The 17,836 807Lamb Weston Holdings Inc 3,800 241McCormick & Co Inc/MD 6,632 641Molson Coors Beverage Co, Cl B 5,051 234Mondelez International Inc, Cl A 36,720 2,435Monster Beverage Corp * 9,854 946PepsiCo Inc 36,559 6,351Philip Morris International Inc 41,187 3,913Procter & Gamble Co/The 63,965 10,463Sysco Corp, Cl A 13,420 1,054Tyson Foods Inc, Cl A 7,803 680Walgreens Boots Alliance Inc 18,857 984Walmart Inc 37,556 5,434
62,635Energy — 2.6%
APA Corp 10,000 269Baker Hughes Co, Cl A 23,149 557Chevron Corp 50,978 5,983ConocoPhillips 35,190 2,540Coterra Energy Inc 21,313 405Devon Energy Corp 16,713 736Diamondback Energy Inc, Cl A 4,500 485EOG Resources Inc 15,346 1,363Exxon Mobil Corp 111,946 6,850Halliburton Co 23,542 539Hess Corp 7,175 531Kinder Morgan Inc 51,082 810Marathon Oil Corp 20,756 341Marathon Petroleum Corp 16,760 1,073Occidental Petroleum Corp 23,562 683ONEOK Inc 11,709 688Phillips 66 11,460 830Pioneer Natural Resources Co 6,004 1,092Schlumberger NV, Cl A 36,700 1,099Valero Energy Corp 10,721 805Williams Cos Inc/The 31,869 830
28,509Financials — 10.6%
Aflac Inc 16,234 948Allstate Corp/The 7,759 913American Express Co 16,532 2,705American International Group Inc 22,435 1,276
Description SharesMarket Value
($ Thousands)
COMMON STOCK (continued)Ameriprise Financial Inc 2,984 $ 900Aon PLC, Cl A 5,929 1,782Arthur J Gallagher & Co 5,449 924Assurant Inc 1,505 235Bank of America Corp 190,450 8,473Bank of New York Mellon Corp/The 20,799 1,208Berkshire Hathaway Inc, Cl B * 48,418 14,477BlackRock Inc 3,756 3,439Brown & Brown Inc 6,200 436Capital One Financial Corp 11,255 1,633Cboe Global Markets Inc 2,800 365Charles Schwab Corp/The 39,736 3,342Chubb Ltd 11,539 2,231Cincinnati Financial Corp 3,883 442Citigroup Inc 52,451 3,167Citizens Financial Group Inc 11,300 534CME Group Inc 9,512 2,173Comerica Inc 3,492 304Discover Financial Services 7,830 905Everest Re Group Ltd 1,037 284FactSet Research Systems Inc 1,000 486Fifth Third Bancorp 18,111 789First Republic Bank/CA 4,759 983Franklin Resources Inc 7,538 252Globe Life Inc 2,439 229Goldman Sachs Group Inc/The 8,941 3,420Hartford Financial Services Group Inc/The 9,086 627Huntington Bancshares Inc/OH 39,014 602Intercontinental Exchange Inc 14,805 2,025Invesco Ltd 8,900 205JPMorgan Chase & Co 78,169 12,378KeyCorp 25,283 585Lincoln National Corp 4,698 321Loews Corp 5,262 304M&T Bank Corp 3,325 511MarketAxess Holdings Inc 1,000 411Marsh & McLennan Cos Inc 13,359 2,322MetLife Inc 19,139 1,196Moody's Corp 4,263 1,665Morgan Stanley 38,304 3,760MSCI Inc, Cl A 2,200 1,348Nasdaq Inc, Cl A 3,100 651Northern Trust Corp 5,509 659People's United Financial Inc 11,400 203PNC Financial Services Group Inc/The 11,184 2,243Principal Financial Group Inc, Cl A 6,557 474Progressive Corp/The 15,385 1,579Prudential Financial Inc 10,166 1,100Raymond James Financial Inc 4,858 488Regions Financial Corp 24,963 544S&P Global Inc 6,351 2,997Signature Bank/New York NY, Cl B 1,600 517
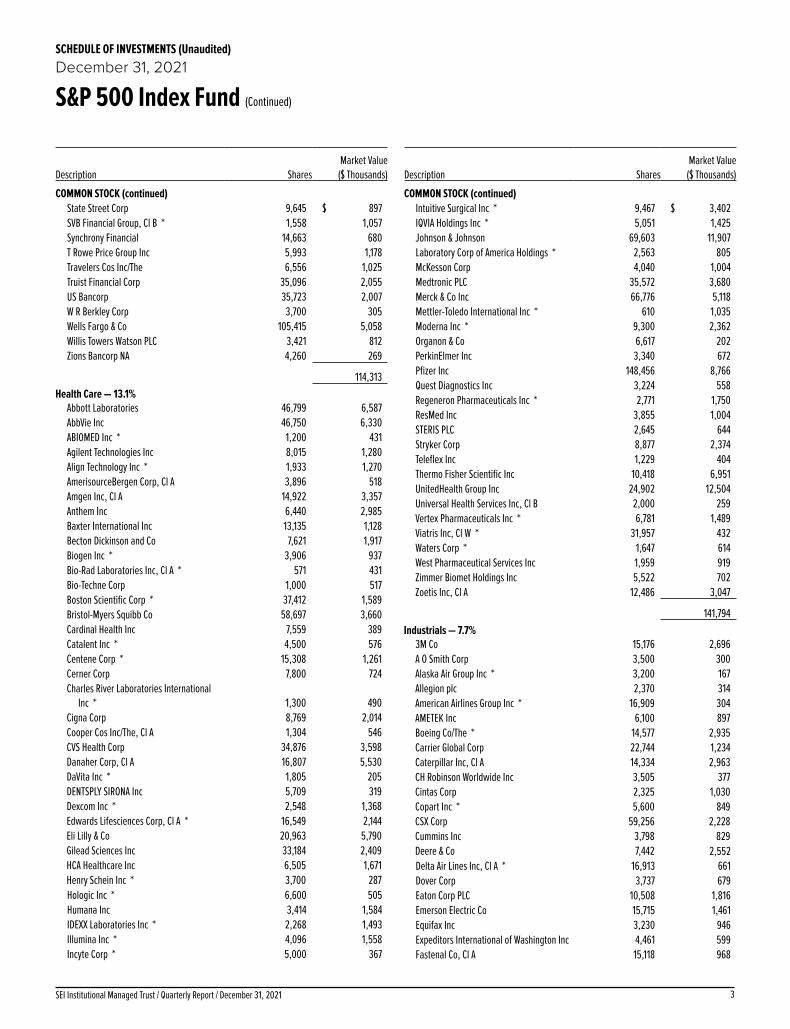
3SEI Institutional Managed Trust / Quarterly Report / December 31, 2021
SCHEDULE OF INVESTMENTS (Unaudited)December 31, 2021
S&P 500 Index Fund (Continued)
Description SharesMarket Value
($ Thousands)
COMMON STOCK (continued)State Street Corp 9,645 $ 897SVB Financial Group, Cl B * 1,558 1,057Synchrony Financial 14,663 680T Rowe Price Group Inc 5,993 1,178Travelers Cos Inc/The 6,556 1,025Truist Financial Corp 35,096 2,055US Bancorp 35,723 2,007W R Berkley Corp 3,700 305Wells Fargo & Co 105,415 5,058Willis Towers Watson PLC 3,421 812Zions Bancorp NA 4,260 269
114,313Health Care — 13.1%
Abbott Laboratories 46,799 6,587AbbVie Inc 46,750 6,330ABIOMED Inc * 1,200 431Agilent Technologies Inc 8,015 1,280Align Technology Inc * 1,933 1,270AmerisourceBergen Corp, Cl A 3,896 518Amgen Inc, Cl A 14,922 3,357Anthem Inc 6,440 2,985Baxter International Inc 13,135 1,128Becton Dickinson and Co 7,621 1,917Biogen Inc * 3,906 937Bio-Rad Laboratories Inc, Cl A * 571 431Bio-Techne Corp 1,000 517Boston Scientific Corp * 37,412 1,589Bristol-Myers Squibb Co 58,697 3,660Cardinal Health Inc 7,559 389Catalent Inc * 4,500 576Centene Corp * 15,308 1,261Cerner Corp 7,800 724Charles River Laboratories International
Inc * 1,300 490Cigna Corp 8,769 2,014Cooper Cos Inc/The, Cl A 1,304 546CVS Health Corp 34,876 3,598Danaher Corp, Cl A 16,807 5,530DaVita Inc * 1,805 205DENTSPLY SIRONA Inc 5,709 319Dexcom Inc * 2,548 1,368Edwards Lifesciences Corp, Cl A * 16,549 2,144Eli Lilly & Co 20,963 5,790Gilead Sciences Inc 33,184 2,409HCA Healthcare Inc 6,505 1,671Henry Schein Inc * 3,700 287Hologic Inc * 6,600 505Humana Inc 3,414 1,584IDEXX Laboratories Inc * 2,268 1,493Illumina Inc * 4,096 1,558Incyte Corp * 5,000 367
Description SharesMarket Value
($ Thousands)
COMMON STOCK (continued)Intuitive Surgical Inc * 9,467 $ 3,402IQVIA Holdings Inc * 5,051 1,425Johnson & Johnson 69,603 11,907Laboratory Corp of America Holdings * 2,563 805McKesson Corp 4,040 1,004Medtronic PLC 35,572 3,680Merck & Co Inc 66,776 5,118Mettler-Toledo International Inc * 610 1,035Moderna Inc * 9,300 2,362Organon & Co 6,617 202PerkinElmer Inc 3,340 672Pfizer Inc 148,456 8,766Quest Diagnostics Inc 3,224 558Regeneron Pharmaceuticals Inc * 2,771 1,750ResMed Inc 3,855 1,004STERIS PLC 2,645 644Stryker Corp 8,877 2,374Teleflex Inc 1,229 404Thermo Fisher Scientific Inc 10,418 6,951UnitedHealth Group Inc 24,902 12,504Universal Health Services Inc, Cl B 2,000 259Vertex Pharmaceuticals Inc * 6,781 1,489Viatris Inc, Cl W * 31,957 432Waters Corp * 1,647 614West Pharmaceutical Services Inc 1,959 919Zimmer Biomet Holdings Inc 5,522 702Zoetis Inc, Cl A 12,486 3,047
141,794Industrials — 7.7%
3M Co 15,176 2,696A O Smith Corp 3,500 300Alaska Air Group Inc * 3,200 167Allegion plc 2,370 314American Airlines Group Inc * 16,909 304AMETEK Inc 6,100 897Boeing Co/The * 14,577 2,935Carrier Global Corp 22,744 1,234Caterpillar Inc, Cl A 14,334 2,963CH Robinson Worldwide Inc 3,505 377Cintas Corp 2,325 1,030Copart Inc * 5,600 849CSX Corp 59,256 2,228Cummins Inc 3,798 829Deere & Co 7,442 2,552Delta Air Lines Inc, Cl A * 16,913 661Dover Corp 3,737 679Eaton Corp PLC 10,508 1,816Emerson Electric Co 15,715 1,461Equifax Inc 3,230 946Expeditors International of Washington Inc 4,461 599Fastenal Co, Cl A 15,118 968
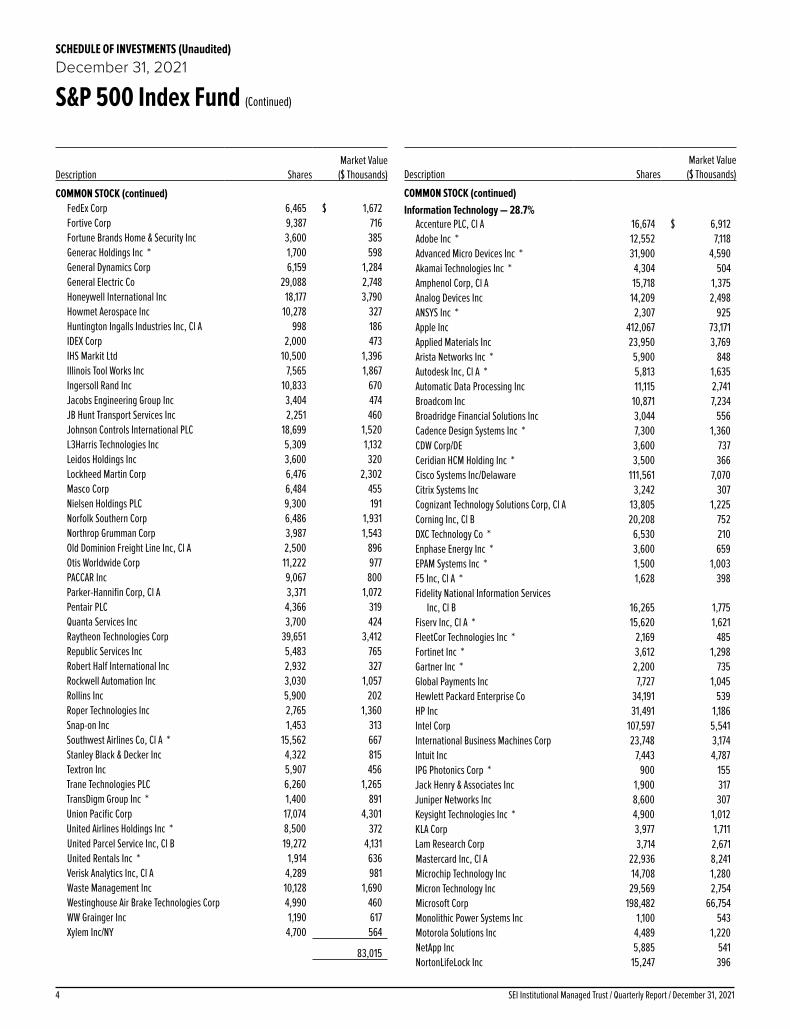
SEI Institutional Managed Trust / Quarterly Report / December 31, 20214
SCHEDULE OF INVESTMENTS (Unaudited)December 31, 2021
S&P 500 Index Fund (Continued)
Description SharesMarket Value
($ Thousands)
COMMON STOCK (continued)FedEx Corp 6,465 $ 1,672Fortive Corp 9,387 716Fortune Brands Home & Security Inc 3,600 385Generac Holdings Inc * 1,700 598General Dynamics Corp 6,159 1,284General Electric Co 29,088 2,748Honeywell International Inc 18,177 3,790Howmet Aerospace Inc 10,278 327Huntington Ingalls Industries Inc, Cl A 998 186IDEX Corp 2,000 473IHS Markit Ltd 10,500 1,396Illinois Tool Works Inc 7,565 1,867Ingersoll Rand Inc 10,833 670Jacobs Engineering Group Inc 3,404 474JB Hunt Transport Services Inc 2,251 460Johnson Controls International PLC 18,699 1,520L3Harris Technologies Inc 5,309 1,132Leidos Holdings Inc 3,600 320Lockheed Martin Corp 6,476 2,302Masco Corp 6,484 455Nielsen Holdings PLC 9,300 191Norfolk Southern Corp 6,486 1,931Northrop Grumman Corp 3,987 1,543Old Dominion Freight Line Inc, Cl A 2,500 896Otis Worldwide Corp 11,222 977PACCAR Inc 9,067 800Parker-Hannifin Corp, Cl A 3,371 1,072Pentair PLC 4,366 319Quanta Services Inc 3,700 424Raytheon Technologies Corp 39,651 3,412Republic Services Inc 5,483 765Robert Half International Inc 2,932 327Rockwell Automation Inc 3,030 1,057Rollins Inc 5,900 202Roper Technologies Inc 2,765 1,360Snap-on Inc 1,453 313Southwest Airlines Co, Cl A * 15,562 667Stanley Black & Decker Inc 4,322 815Textron Inc 5,907 456Trane Technologies PLC 6,260 1,265TransDigm Group Inc * 1,400 891Union Pacific Corp 17,074 4,301United Airlines Holdings Inc * 8,500 372United Parcel Service Inc, Cl B 19,272 4,131United Rentals Inc * 1,914 636Verisk Analytics Inc, Cl A 4,289 981Waste Management Inc 10,128 1,690Westinghouse Air Brake Technologies Corp 4,990 460WW Grainger Inc 1,190 617Xylem Inc/NY 4,700 564
83,015
Description SharesMarket Value
($ Thousands)
COMMON STOCK (continued)Information Technology — 28.7%
Accenture PLC, Cl A 16,674 $ 6,912Adobe Inc * 12,552 7,118Advanced Micro Devices Inc * 31,900 4,590Akamai Technologies Inc * 4,304 504Amphenol Corp, Cl A 15,718 1,375Analog Devices Inc 14,209 2,498ANSYS Inc * 2,307 925Apple Inc 412,067 73,171Applied Materials Inc 23,950 3,769Arista Networks Inc * 5,900 848Autodesk Inc, Cl A * 5,813 1,635Automatic Data Processing Inc 11,115 2,741Broadcom Inc 10,871 7,234Broadridge Financial Solutions Inc 3,044 556Cadence Design Systems Inc * 7,300 1,360CDW Corp/DE 3,600 737Ceridian HCM Holding Inc * 3,500 366Cisco Systems Inc/Delaware 111,561 7,070Citrix Systems Inc 3,242 307Cognizant Technology Solutions Corp, Cl A 13,805 1,225Corning Inc, Cl B 20,208 752DXC Technology Co * 6,530 210Enphase Energy Inc * 3,600 659EPAM Systems Inc * 1,500 1,003F5 Inc, Cl A * 1,628 398Fidelity National Information Services
Inc, Cl B 16,265 1,775Fiserv Inc, Cl A * 15,620 1,621FleetCor Technologies Inc * 2,169 485Fortinet Inc * 3,612 1,298Gartner Inc * 2,200 735Global Payments Inc 7,727 1,045Hewlett Packard Enterprise Co 34,191 539HP Inc 31,491 1,186Intel Corp 107,597 5,541International Business Machines Corp 23,748 3,174Intuit Inc 7,443 4,787IPG Photonics Corp * 900 155Jack Henry & Associates Inc 1,900 317Juniper Networks Inc 8,600 307Keysight Technologies Inc * 4,900 1,012KLA Corp 3,977 1,711Lam Research Corp 3,714 2,671Mastercard Inc, Cl A 22,936 8,241Microchip Technology Inc 14,708 1,280Micron Technology Inc 29,569 2,754Microsoft Corp 198,482 66,754Monolithic Power Systems Inc 1,100 543Motorola Solutions Inc 4,489 1,220NetApp Inc 5,885 541NortonLifeLock Inc 15,247 396

5SEI Institutional Managed Trust / Quarterly Report / December 31, 2021
SCHEDULE OF INVESTMENTS (Unaudited)December 31, 2021
S&P 500 Index Fund (Continued)
Description SharesMarket Value
($ Thousands)
COMMON STOCK (continued)NVIDIA Corp 66,072 $ 19,432NXP Semiconductors NV 6,997 1,594Oracle Corp, Cl B 42,708 3,725Paychex Inc 8,469 1,156Paycom Software Inc * 1,259 523PayPal Holdings Inc * 31,049 5,855PTC Inc * 2,800 339Qorvo Inc * 2,900 454QUALCOMM Inc 29,654 5,423salesforce.com Inc * 25,921 6,587Seagate Technology Holdings PLC 5,400 610ServiceNow Inc * 5,263 3,416Skyworks Solutions Inc 4,353 675SolarEdge Technologies Inc * 1,400 393Synopsys Inc * 4,007 1,477TE Connectivity Ltd 8,609 1,389Teledyne Technologies Inc * 1,251 547Teradyne Inc 4,300 703Texas Instruments Inc 24,403 4,599Trimble Inc * 6,600 575Tyler Technologies Inc * 1,100 592VeriSign Inc * 2,555 649Visa Inc, Cl A 44,345 9,610Western Digital Corp * 8,074 527Xilinx Inc 6,553 1,389Zebra Technologies Corp, Cl A * 1,419 845
311,135Materials — 2.5%
Air Products and Chemicals Inc 5,866 1,785Albemarle Corp 3,100 725Amcor PLC 40,732 489Avery Dennison Corp 2,215 480Ball Corp 8,572 825Celanese Corp, Cl A 2,952 496CF Industries Holdings Inc 5,650 400Corteva Inc 19,273 911Dow Inc 19,506 1,106DuPont de Nemours Inc 13,699 1,107Eastman Chemical Co 3,520 426Ecolab Inc 6,575 1,543FMC Corp 3,400 374Freeport-McMoRan Inc, Cl B 38,609 1,611International Flavors & Fragrances Inc 6,773 1,020International Paper Co 10,374 487Linde PLC 13,557 4,696LyondellBasell Industries NV, Cl A 6,974 643Martin Marietta Materials Inc, Cl A 1,619 713Mosaic Co/The 9,809 385Newmont Corp 21,025 1,304Nucor Corp 7,695 878Packaging Corp of America 2,500 340
Description SharesMarket Value
($ Thousands)
COMMON STOCK (continued)PPG Industries Inc 6,242 $ 1,076Sealed Air Corp 3,928 265Sherwin-Williams Co/The, Cl A 6,385 2,249Vulcan Materials Co 3,449 716Westrock Co 6,984 310
27,360Real Estate — 2.7%
Alexandria Real Estate Equities Inc ‡ 3,700 825American Tower Corp, Cl A ‡ 12,041 3,522AvalonBay Communities Inc ‡ 3,672 928Boston Properties Inc ‡ 3,700 426CBRE Group Inc, Cl A * 8,809 956Crown Castle International Corp ‡ 11,461 2,392Digital Realty Trust Inc, Cl A ‡ 7,469 1,321Duke Realty Corp ‡ 10,000 657Equinix Inc ‡ 2,361 1,997Equity Residential ‡ 8,944 810Essex Property Trust Inc ‡ 1,721 606Extra Space Storage Inc ‡ 3,545 804Federal Realty Investment Trust ‡ 1,800 245Healthpeak Properties Inc ‡ 14,300 516Host Hotels & Resorts Inc *‡ 18,574 323Iron Mountain Inc ‡ 7,638 400Kimco Realty Corp ‡ 16,313 402Mid-America Apartment Communities Inc ‡ 3,000 688Prologis Inc ‡ 19,520 3,286Public Storage ‡ 4,034 1,511Realty Income Corp ‡ 15,000 1,074Regency Centers Corp ‡ 3,999 301SBA Communications Corp, Cl A ‡ 2,849 1,108Simon Property Group Inc ‡ 8,606 1,375UDR Inc ‡ 7,700 462Ventas Inc ‡ 10,632 544Vornado Realty Trust ‡ 4,177 175Welltower Inc ‡ 11,500 986Weyerhaeuser Co ‡ 19,661 810
29,450Utilities — 2.5%
AES Corp/The 17,690 430Alliant Energy Corp 6,600 406Ameren Corp 6,753 601American Electric Power Co Inc 13,315 1,185American Water Works Co Inc 4,800 907Atmos Energy Corp 3,400 356CenterPoint Energy Inc 16,685 466CMS Energy Corp 7,601 494Consolidated Edison Inc 9,233 788Dominion Energy Inc 21,268 1,671DTE Energy Co 5,045 603Duke Energy Corp 20,316 2,131Edison International 9,957 680

SEI Institutional Managed Trust / Quarterly Report / December 31, 20216
SCHEDULE OF INVESTMENTS (Unaudited)December 31, 2021
S&P 500 Index Fund (Continued)
Description SharesMarket Value
($ Thousands)
COMMON STOCK (continued)Entergy Corp 5,326 $ 600Evergy Inc 6,099 418Eversource Energy 9,035 822Exelon Corp 25,655 1,482FirstEnergy Corp 14,323 596NextEra Energy Inc 51,880 4,843NiSource Inc 10,444 288NRG Energy Inc 6,413 276Pinnacle West Capital Corp 2,949 208PPL Corp 20,371 612Public Service Enterprise Group Inc 13,330 889Sempra Energy 8,445 1,117Southern Co/The 27,835 1,909WEC Energy Group Inc 8,319 808Xcel Energy Inc 14,136 957
26,543
Total Common Stock
(Cost $261,195) ($ Thousands) 1,066,986
Description SharesMarket Value
($ Thousands)
AFFILIATED PARTNERSHIP — 0.0%SEI Liquidity Fund, L.P.
0.020% **†(B) 97,383 $ 98
Total Affiliated Partnership (Cost $98) ($ Thousands) 98
CASH EQUIVALENT — 1.3%SEI Daily Income Trust, Government
Fund, Cl F0.010%**† 14,266,132 14,266
Total Cash Equivalent(Cost $14,266) ($ Thousands) 14,266
Total Investments in Securities — 99.9%(Cost $275,559) ($ Thousands) $ 1,081,350
A list of the open futures contracts held by the Fund at December 31, 2021, is as follows:
Type of ContractNumber of Contracts
Expiration Date
Notional Amount (Thousands) Value (Thousands)
Unrealized Appreciation (Thousands)
Long ContractsS&P 500 Index E-MINI 65 Mar-2022 $ 14,917 $ 15,465 $ 548
Percentages are based on Net Assets of $1,082,106 ($ Thousands).* Non-income producing security.** Rate shown is the 7-day effective yield as of December 31, 2021.† Investment in Affiliated Security.‡ Real Estate Investment Trust.(A) Certain securities or partial positions of certain securities are on loan at
December 31, 2021. The total market value of securities on loan at December 31, 2021 was $94 ($ Thousands).
(B) This security was purchased with cash collateral held from securities on loan. The total market value of such securities as of December 31, 2021 was $98 ($ Thousands).
Cl — ClassL.P. — Limited PartnershipLtd — LimitedPLC — Public Limited CompanyS&P — Standard & Poor's
The following is a list of the levels of inputs used as of December 31, 2021 in valuing the fund’s investments and other financial instruments carried at value ($ Thousands):
Investments in SecuritiesLevel 1
($)Level 2
($)Level 3
($)Total
($)Common Stock 1,066,986 – – 1,066,986Affiliated Partnership – 98 – 98Cash Equivalent 14,266 – – 14,266
Total Investments in Securities 1,081,252 98 – 1,081,350
Other Financial InstrumentsLevel 1
($)Level 2
($)Level 3
($)Total
($)Futures Contracts*
Unrealized Appreciation 548 – – 548 Total Other Financial Instruments 548 – – 548 *Futures contracts are valued at the unrealized appreciation on the instrument.
For the period ended December 31, 2021, there were no transfers in or out of Level 3.
For information regarding the Fund’s policy regarding valuation of investments and other significant accounting policies, please refer to the Fund’s most recent semi-annual and annual financial statements.
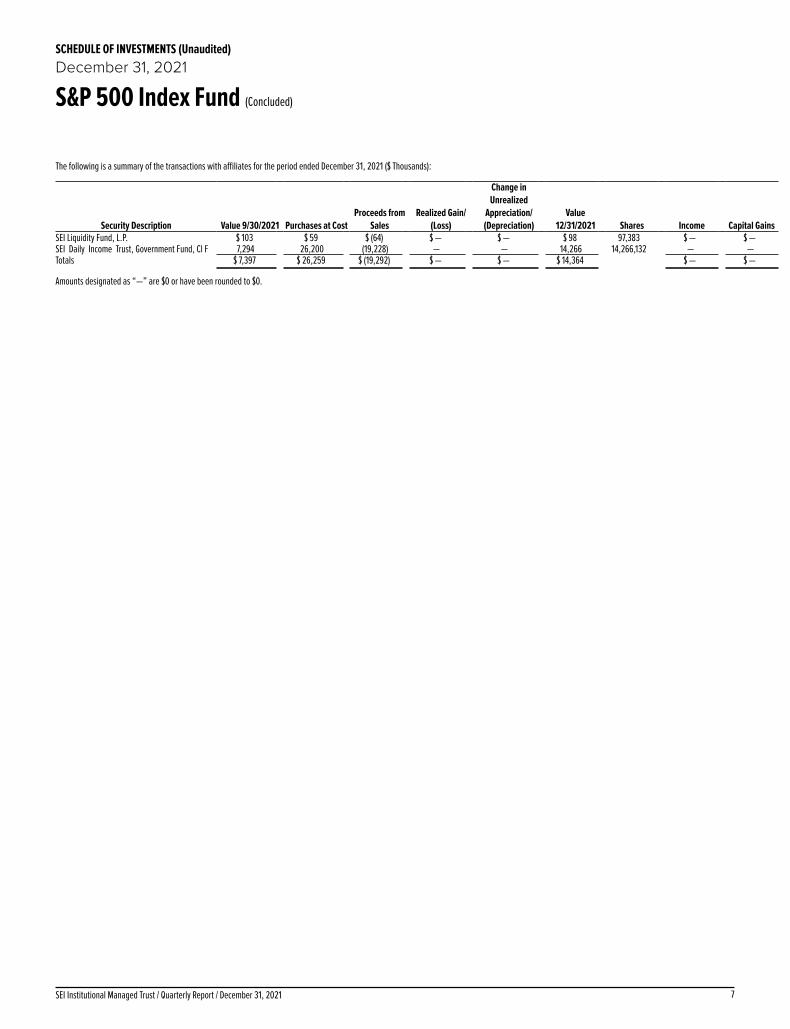
7SEI Institutional Managed Trust / Quarterly Report / December 31, 2021
SCHEDULE OF INVESTMENTS (Unaudited)December 31, 2021
S&P 500 Index Fund (Concluded)
The following is a summary of the transactions with affiliates for the period ended December 31, 2021 ($ Thousands):
Security Description Value 9/30/2021 Purchases at Cost Proceeds from
Sales Realized Gain/
(Loss)
Change in Unrealized
Appreciation/(Depreciation)
Value12/31/2021 Shares Income Capital Gains
SEI Liquidity Fund, L.P. $ 103 $ 59 $ (64) $ — $ — $ 98 97,383 $ — $ — SEI Daily Income Trust, Government Fund, Cl F 7,294 26,200 (19,228) — — 14,266 14,266,132 — — Totals $ 7,397 $ 26,259 $ (19,292) $ — $ — $ 14,364 $ — $ —
Amounts designated as “—” are $0 or have been rounded to $0.

1SEI Institutional Managed Trust / Quarterly Report / December 31, 2021
SCHEDULE OF INVESTMENTS (Unaudited)December 31, 2021
Small Cap Fund
Description SharesMarket Value
($ Thousands)
COMMON STOCK — 98.6%
Communication Services — 3.3%Advantage Solutions * 46,552 $ 373Anterix Inc * 8,469 498Cable One Inc 931 1,642Cargurus Inc, Cl A * 20,600 693Cars.com Inc * 31,710 510Cinemark Holdings Inc *(A) 259,400 4,181Clear Channel Outdoor Holdings Inc, Cl A * 258,843 857Cogent Communications Holdings Inc 29,025 2,124Gannett Co Inc * 105,267 561Hemisphere Media Group Inc, Cl A * 18,292 133Liberty Latin America Ltd, Cl A * 34,460 402Liberty Latin America Ltd, Cl C * 55,028 627Lions Gate Entertainment Corp, Cl A *(A) 277,909 4,624MediaAlpha Inc, Cl A * 11,110 172Nexstar Media Group Inc, Cl A 12,909 1,949Ooma Inc * 28,163 576QuinStreet Inc * 35,410 644TEGNA Inc 74,829 1,389Ziff Davis Inc * 9,913 1,099
23,054Consumer Discretionary — 15.1%
1-800-Flowers.com Inc, Cl A * 11,300 264Aaron's Co Inc/The 61,636 1,519Academy Sports & Outdoors Inc * 14,790 649Advance Auto Parts Inc 7,763 1,862American Eagle Outfitters Inc (A) 193,537 4,900American Outdoor Brands Inc * 22,724 453American Public Education Inc * 40,268 896Arko * 26,700 234Beazer Homes USA Inc, Cl A * 49,657 1,153Biglari Holdings Inc, Cl B * 2,576 367Bloomin' Brands Inc * 119,097 2,499Bluegreen Vacations Holding, Cl A * 15,208 534Boot Barn Holdings Inc * 15,631 1,923Brinker International Inc * 62,263 2,278Brunswick Corp/DE 21,099 2,125Buckle Inc/The 5,800 245Caleres Inc 7,290 165Callaway Golf Co * 17,357 476Carriage Services Inc 25,737 1,659Carter's Inc 21,667 2,193Cato Corp/The, Cl A 31,500 541Cavco Industries Inc * 4,913 1,561Century Casinos * 24,972 304Choice Hotels International Inc 4,920 767Churchill Downs Inc 8,441 2,033Chuy's Holdings Inc * 14,373 433Citi Trends Inc * 3,150 298Clarus Corp 25,450 706Conn's Inc * 46,654 1,097
Description SharesMarket Value
($ Thousands)
COMMON STOCK (continued)Container Store Group Inc/The * 75,720 $ 756Crocs Inc * 9,647 1,237Dave & Buster's Entertainment Inc * 15,997 614Del Taco Restaurants Inc 26,580 331Domino's Pizza Inc 3,372 1,903Dorman Products Inc * 8,436 953El Pollo Loco Holdings Inc * 61,850 878Ethan Allen Interiors Inc 53,950 1,418Everi Holdings Inc * 31,066 663Fiesta Restaurant Group Inc * 17,297 190Genesco Inc * 3,040 195Golden Entertainment Inc * 15,814 799Goodyear Tire & Rubber Co/The * 76,245 1,626Green Brick Partners Inc * 22,741 690Hamilton Beach Brands Holding Co, Cl A 19,181 275Haverty Furniture Cos Inc 34,149 1,044Hibbett Inc 7,313 526Hilton Grand Vacations Inc * 14,826 773Hooker Furnishings 26,837 625Houghton Mifflin Harcourt Co * 42,126 678Johnson Outdoors Inc, Cl A 4,481 420KB Home 39,264 1,756Lazydays Holdings Inc * 33,682 726Lifetime Brands Inc 15,275 244Liquidity Services Inc * 15,180 335LL Flooring Holdings * 30,982 529Lovesac Co/The * 8,580 569Macy's Inc 57,679 1,510Marine Products Corp 12,986 162MarineMax Inc * 6,130 362MasterCraft Boat Holdings Inc * 30,100 853Modine Manufacturing Co * 280,763 2,833Monarch Casino & Resort Inc * 23,918 1,769Monro Inc 27,396 1,596Motorcar Parts of America * 8,770 150Movado Group Inc 41,670 1,743Murphy USA Inc 15,451 3,078Noodles & Co, Cl A * 21,205 192ONE Group Hospitality * 15,206 192OneWater Marine Inc, Cl A * 17,764 1,083Oxford Industries Inc, Cl A 13,632 1,384Papa John's International Inc, Cl A 6,779 905Planet Fitness Inc, Cl A * 7,900 716Pool Corp 3,232 1,829Scientific Games Corp, Cl A * 9,390 628SeaWorld Entertainment Inc * 25,598 1,660Shoe Carnival Inc 23,518 919Shutterstock Inc 28,356 3,144Signet Jewelers Ltd 16,167 1,407Skechers USA Inc, Cl A * 11,914 517Skyline Champion Corp * 24,825 1,961Sportsman's Warehouse Holdings Inc * 27,159 321

SEI Institutional Managed Trust / Quarterly Report / December 31, 20212
SCHEDULE OF INVESTMENTS (Unaudited)December 31, 2021
Small Cap Fund (Continued)
Description SharesMarket Value
($ Thousands)
COMMON STOCK (continued)Steven Madden Ltd 46,488 $ 2,160Superior Group of Cos Inc 11,757 258Taylor Morrison Home Corp, Cl A * 56,749 1,984Tenneco Inc, Cl A * 35,180 398Tilly's Inc, Cl A * 59,519 959Toll Brothers Inc 9,500 688Tractor Supply Co 7,343 1,752Unifi Inc * 54,080 1,252Urban Outfitters Inc * 62,282 1,829Vera Bradley Inc * 320,002 2,723Vista Outdoor Inc * 32,195 1,483Wingstop Inc, Cl A 6,965 1,204Winmark Corp 3,798 943Zumiez Inc * 11,582 556
103,990Consumer Staples — 3.2%
Beauty Health * 23,076 558BJ's Wholesale Club Holdings Inc * 14,965 1,002Cal-Maine Foods Inc * 12,726 471Casey's General Stores Inc 7,508 1,482Central Garden & Pet Co, Cl A * 16,340 860elf Beauty Inc * 22,515 748Energizer Holdings Inc 24,488 982Hain Celestial Group Inc/The * 11,464 488Hostess Brands Inc, Cl A * 116,798 2,385Ingles Markets Inc, Cl A 8,370 723Ingredion Inc 18,043 1,744Inter Parfums Inc 16,550 1,769MGP Ingredients Inc 23,195 1,971Natural Grocers by Vitamin Cottage Inc 32,460 463Performance Food Group Co * 11,771 540Seneca Foods Corp, Cl A * 18,572 891Simply Good Foods Co/The * 17,582 731Spectrum Brands Holdings Inc 9,874 1,004Tootsie Roll Industries Inc 20,797 753TreeHouse Foods Inc * 37,464 1,518Veru Inc * 29,572 174Village Super Market Inc, Cl A 18,788 439Weis Markets Inc 11,080 730
22,426Energy — 4.5%
Alto Ingredients * 83,798 403Aspen Aerogels Inc * 13,422 668Berry Corp 29,385 247Cactus Inc, Cl A 34,378 1,311California Resources 14,108 603ChampionX Corp * 33,367 674Civitas Resources 7,391 362Comstock Resources * 155,560 1,258Coterra Energy Inc 73,761 1,401Delek US Holdings Inc * 265,639 3,982
Description SharesMarket Value
($ Thousands)
COMMON STOCK (continued)Diamondback Energy Inc, Cl A 20,379 $ 2,198Dorian LPG Ltd * 13,650 173Earthstone Energy Inc, Cl A * 21,599 236Energy Fuels Inc/Canada *(A) 62,637 478Green Plains Inc * 13,140 457Helmerich & Payne Inc 23,666 561Magnolia Oil & Gas Corp, Cl A 33,445 631Matador Resources Co 12,670 468Nabors Industries Ltd * 7,253 588National Energy Services Reunited Corp * 16,734 158Northern Oil and Gas 94,268 1,940Oasis Petroleum Inc 15,073 1,899Ovintiv Inc 44,659 1,505Par Pacific Holdings * 17,640 291PDC Energy Inc, Cl A 33,141 1,617Peabody Energy Corp * 46,159 465Range Resources Corp * 22,251 397Scorpio Tankers Inc 16,000 205Select Energy Services Inc, Cl A * 33,224 207SFL Corp Ltd 111,966 913SilverBow Resources Inc * 25,601 557SM Energy Co 23,429 691Solaris Oilfield Infrastructure Inc, Cl A 23,970 157Southwestern Energy Co * 342,605 1,597W&T Offshore Inc * 240,870 778Whiting Petroleum Corp * 11,568 748
30,824Financials — 19.3%
AFC Gamma ‡ 12,310 280Amalgamated Financial Corp 19,440 326Amerant Bancorp Inc, Cl A 30,114 1,040American Equity Investment Life Holding Co 122,755 4,778Argo Group International Holdings Ltd 9,271 539ARMOUR Residential REIT Inc ‡ 53,910 529Arrow Financial Corp 5,378 189AssetMark Financial Holdings * 62,677 1,643Atlantic Capital Bancshares Inc * 15,515 446Atlanticus Holdings * 3,150 225Axos Financial Inc * 11,500 643B Riley Financial Inc 5,941 528Banco Latinoamericano de Comercio
Exterior SA, Cl E 11,510 191Bank of Marin Bancorp 9,639 359Bank of NT Butterfield & Son Ltd/The 45,160 1,721Bank OZK 41,855 1,948BankUnited Inc 159,876 6,764Bankwell Financial Group Inc 20,566 675Bridgewater Bancshares Inc * 12,880 228Byline Bancorp Inc 48,906 1,338Capital Bancorp Inc 9,996 262Capstar Financial Holdings Inc 8,296 174

3SEI Institutional Managed Trust / Quarterly Report / December 31, 2021
SCHEDULE OF INVESTMENTS (Unaudited)December 31, 2021
Small Cap Fund (Continued)
Description SharesMarket Value
($ Thousands)
COMMON STOCK (continued)Carter Bankshares Inc * 15,208 $ 234Cathay General Bancorp 21,607 929Central Pacific Financial Corp 19,330 545Chimera Investment Corp ‡ 113,989 1,719CNO Financial Group Inc 195,275 4,655Cohen & Steers Inc 23,197 2,146Consumer Portfolio Services * 1,261 15Crawford & Co, Cl A 31,430 235CrossFirst Bankshares * 24,550 383Curo Group Holdings Corp 11,543 185Customers Bancorp Inc * 27,059 1,769Donnelley Financial Solutions Inc * 35,506 1,674Dynex Capital Inc ‡ 100,648 1,682Enova International Inc * 8,640 354Equity Bancshares Inc, Cl A 5,280 179Essent Group Ltd 16,906 770Evercore Inc, Cl A 6,132 833EZCORP Inc, Cl A * 58,050 428FactSet Research Systems Inc 3,401 1,653Farmers National Banc Corp 19,290 358Financial Institutions Inc 11,596 369First BanCorp/Puerto Rico 67,861 935First Bancshares Inc/The 5,003 193First Commonwealth Financial Corp 170,717 2,747First Community Bankshares Inc 17,640 590First Financial Corp/IN 5,780 262First Internet Bancorp 11,329 533First Midwest Bancorp Inc/IL 120,239 2,463First of Long Island Corp/The 12,271 265FirstCash Holdings 9,215 689Flushing Financial Corp 23,223 564FNB Corp/PA 308,590 3,743Focus Financial Partners Inc, Cl A * 11,768 703Globe Life Inc 12,191 1,143Green Dot Corp, Cl A * 52,041 1,886Greenhill & Co Inc 23,187 416Greenlight Capital Re Ltd, Cl A * 21,520 169Hamilton Lane Inc, Cl A 15,203 1,575Hanmi Financial Corp 23,660 560Hanover Insurance Group Inc/The, Cl A 12,204 1,599HarborOne Bancorp Inc 39,432 585HBT Financial Inc 21,980 412Hercules Capital Inc, Cl A (A) 91,266 1,514Heritage Commerce Corp 14,671 175Heritage Insurance Holdings Inc 25,012 147Home BancShares Inc/AR 73,939 1,800HomeTrust Bancshares Inc 12,200 378Independent Bank Corp/MI 25,550 610KKR Real Estate Finance Trust Inc ‡ 8,699 181Lakeland Bancorp Inc 35,610 676LendingClub * 21,518 520Live Oak Bancshares Inc 6,597 576
Description SharesMarket Value
($ Thousands)
COMMON STOCK (continued)Macatawa Bank Corp 18,306 $ 161MarketAxess Holdings Inc 1,947 801Mercantile Bank Corp 7,270 255Merchants Bancorp/IN 11,120 526Metrocity Bankshares Inc 7,602 209Metropolitan Bank Holding Corp * 13,972 1,488MGIC Investment Corp 74,567 1,075Moelis & Co, Cl A 12,449 778Morningstar Inc, Cl A 5,050 1,727National Western Life Group Inc, Cl A 750 161Nelnet Inc, Cl A 7,658 748Nicolet Bankshares Inc * 15,959 1,368NMI Holdings Inc, Cl A * 37,543 820Northrim BanCorp Inc 4,046 176OFG Bancorp 79,348 2,107Old Second Bancorp Inc 11,150 140Oportun Financial Corp * 16,613 336Oppenheimer Holdings Inc, Cl A 24,720 1,146Origin Bancorp Inc 25,424 1,091Pacific Premier Bancorp Inc 15,107 605PacWest Bancorp 113,111 5,109PCSB Financial Corp 17,970 342Peapack-Gladstone Financial Corp 9,550 338Peoples Bancorp Inc/OH 27,400 872Pinnacle Financial Partners Inc 25,157 2,403Piper Sandler Cos 5,273 941PROG Holdings Inc * 71,261 3,215Prosperity Bancshares Inc 20,037 1,449Provident Bancorp Inc 12,606 234Provident Financial Services Inc 27,091 656Pzena Investment Management Inc, Cl A 57,535 545QCR Holdings Inc 5,497 308RBB Bancorp 20,540 538Regional Management Corp 17,609 1,012ServisFirst Bancshares Inc 15,572 1,323Silvergate Capital, Cl A * 3,514 521South Plains Financial Inc 4,145 115StepStone Group Inc, Cl A 14,875 618Sterling Bancorp/DE 92,519 2,386Stewart Information Services Corp 11,527 919Towne Bank/Portsmouth VA 25,210 796Trean Insurance Group Inc * 35,696 318TriState Capital Holdings Inc * 14,438 437Triumph Bancorp Inc * 4,304 513Trupanion Inc * 6,200 819Umpqua Holdings Corp 310,322 5,971Universal Insurance Holdings Inc 70,297 1,195Univest Financial Corp 61,365 1,836Virtus Investment Partners Inc 2,901 862Walker & Dunlop Inc 5,550 837Waterstone Financial Inc 53,731 1,175Western Alliance Bancorp 23,103 2,487

SEI Institutional Managed Trust / Quarterly Report / December 31, 20214
SCHEDULE OF INVESTMENTS (Unaudited)December 31, 2021
Small Cap Fund (Continued)
Description SharesMarket Value
($ Thousands)
COMMON STOCK (continued)Wintrust Financial Corp 24,077 $ 2,187WisdomTree Investments Inc 26,240 161World Acceptance Corp * 980 241
133,947Health Care — 9.3%
Affimed NV * 65,670 363Albireo Pharma Inc * 7,560 176AMN Healthcare Services Inc * 7,593 929Amneal Pharmaceuticals Inc * 34,870 167AnaptysBio Inc * 42,032 1,461Anika Therapeutics Inc * 11,376 408Apollo Endosurgery * 71,590 603Apyx Medical Corp * 14,470 185Arcus Biosciences Inc * 14,774 598Arcutis Biotherapeutics * 8,650 179Aveanna Healthcare Holdings * 27,960 207Avid Bioservices Inc * 14,876 434Avidity Biosciences Inc * 28,230 671BioDelivery Sciences International Inc * 474,869 1,472Biohaven Pharmaceutical Holding Co Ltd * 7,102 979Black Diamond Therapeutics * 28,190 150Catalyst Pharmaceuticals Inc * 147,330 997Cerevel Therapeutics Holdings * 14,155 459Chemed Corp 3,724 1,970Co-Diagnostics Inc *(A) 174,401 1,557Computer Programs and Systems Inc * 8,140 238Cross Country Healthcare Inc * 63,497 1,763Curis * 46,440 221Cutera Inc * 4,848 200Cytokinetics Inc * 20,085 915Eagle Pharmaceuticals Inc/DE * 20,414 1,039Enanta Pharmaceuticals Inc * 5,887 440Encompass Health Corp 24,139 1,575Ensign Group Inc/The 24,140 2,027Envista Holdings Corp * 32,154 1,449Foghorn Therapeutics * 29,126 666Forma Therapeutics Holdings Inc * 11,390 162Generation Bio Co * 10,511 74Harpoon Therapeutics Inc * 25,416 192HealthStream Inc * 16,230 428ImmunityBio * 32,100 195Innoviva Inc * 43,483 750Inspire Medical Systems Inc * 2,798 644Integra LifeSciences Holdings Corp * 16,224 1,087Intellia Therapeutics Inc * 4,979 589Intra-Cellular Therapies Inc, Cl A * 14,800 775Invacare Corp * 51,750 141iRadimed Corp * 7,731 357iTeos Therapeutics Inc * 29,400 1,369IVERIC bio Inc * 37,102 620Kezar Life Sciences * 33,500 560
Description SharesMarket Value
($ Thousands)
COMMON STOCK (continued)Kiniksa Pharmaceuticals Ltd, Cl A * 13,701 $ 161Krystal Biotech Inc * 7,000 490LeMaitre Vascular Inc 38,284 1,923Lexicon Pharmaceuticals Inc * 43,090 170MaxCyte * 17,680 180Medpace Holdings Inc * 4,432 965Meridian Bioscience Inc * 17,932 366Merit Medical Systems Inc * 11,308 704Mesa Laboratories Inc 1,800 591Mirum Pharmaceuticals Inc * 11,540 184Mustang Bio Inc * 71,078 118Myriad Genetics Inc * 23,715 655Neoleukin Therapeutics Inc * 25,930 125NuVasive Inc * 12,492 656Omnicell Inc * 4,607 831OptimizeRx Corp * 8,558 532Option Care Health Inc * 61,707 1,755OraSure Technologies Inc * 18,083 157Organogenesis Holdings Inc, Cl A * 19,350 179ORIC Pharmaceuticals Inc * 10,510 154Ortho Clinical Diagnostics Holdings * 36,375 778Outset Medical Inc * 4,982 230PMV Pharmaceuticals Inc * 6,490 150Precigen * 256,330 951Precision BioSciences Inc * 16,134 119Prestige Consumer Healthcare Inc, Cl A * 41,273 2,503Prometheus Biosciences * 15,500 613Prothena Corp PLC * 13,854 684Puma Biotechnology Inc * 51,656 157Quest Diagnostics Inc 10,578 1,830Radius Health Inc * 21,220 147RAPT Therapeutics Inc * 5,476 201Rigel Pharmaceuticals Inc * 131,166 348Scholar Rock Holding Corp * 6,673 166Selecta Biosciences * 98,420 321Seres Therapeutics Inc * 26,000 217Sharps Compliance Corp * 22,020 157Shockwave Medical Inc * 7,047 1,257SIGA Technologies Inc * 75,004 564STAAR Surgical Co * 5,953 544STERIS PLC 8,697 2,117Stoke Therapeutics Inc * 6,494 156Surface Oncology Inc * 49,320 236Surmodics Inc * 4,756 229Sutro Biopharma Inc * 17,887 266Syndax Pharmaceuticals Inc * 11,833 259Syros Pharmaceuticals Inc * 74,977 244Tandem Diabetes Care Inc * 5,662 852Tenet Healthcare Corp * 11,926 974Triple-S Management Corp, Cl B * 34,822 1,242US Physical Therapy Inc 3,041 291Utah Medical Products Inc * 1,766 177

5SEI Institutional Managed Trust / Quarterly Report / December 31, 2021
SCHEDULE OF INVESTMENTS (Unaudited)December 31, 2021
Small Cap Fund (Continued)
Description SharesMarket Value
($ Thousands)
COMMON STOCK (continued)Vanda Pharmaceuticals Inc * 17,800 $ 279Viemed Healthcare Inc * 98,034 512Vocera Communications Inc * 10,400 674
63,782Industrials — 17.8%
ABM Industries Inc 33,753 1,379ACCO Brands Corp 608,794 5,029Acuity Brands Inc 3,174 672Air Lease Corp, Cl A 30,729 1,359Allied Motion Technologies Inc 4,925 180Allison Transmission Holdings Inc 42,077 1,530Altra Industrial Motion Corp 23,933 1,234Ameresco Inc, Cl A * 8,855 721API Group * 23,663 610Applied Industrial Technologies Inc, Cl A 7,933 815Argan Inc 16,477 637ASGN Inc * 4,906 605Atkore Inc * 16,807 1,869Atlas Air Worldwide Holdings Inc * 17,802 1,676BlueLinx Holdings * 4,191 401BWX Technologies Inc, Cl W 40,835 1,955CACI International Inc, Cl A * 4,447 1,197Carlisle Cos Inc 8,381 2,080Casella Waste Systems Inc, Cl A * 8,856 756CIRCOR International Inc * 18,155 493Clean Harbors Inc * 19,960 1,991Concrete Pumping Holdings * 19,500 160Cornerstone Building Brands Inc * 40,133 700Costamare Inc 104,934 1,327Covenant Logistics Group Inc, Cl A * 32,906 870CRA International Inc 12,466 1,164Daseke Inc * 89,214 896Ducommun Inc * 12,025 562DXP Enterprises Inc/TX * 22,451 576EMCOR Group Inc 15,812 2,014Encore Wire Corp 11,111 1,590Enerpac Tool Group Corp, Cl A 26,624 540Ennis Inc 6,886 134EnPro Industries Inc 14,900 1,640Evoqua Water Technologies Corp * 17,868 835First Advantage * 31,890 607Forrester Research Inc * 23,398 1,374Forward Air Corp 15,405 1,865Franklin Covey Co * 33,578 1,557Franklin Electric Co Inc 9,560 904Gates Industrial Corp PLC * 63,393 1,009Genco Shipping & Trading Ltd 19,744 316GFL Environmental 40,080 1,517Global Industrial 24,258 992GMS Inc * 14,782 889Harsco Corp * 41,457 693
Description SharesMarket Value
($ Thousands)
COMMON STOCK (continued)Heidrick & Struggles International Inc 46,840 $ 2,048Helios Technologies Inc 16,237 1,708Herc Holdings Inc 3,469 543Heritage-Crystal Clean Inc * 35,376 1,133Hexcel Corp, Cl A 17,212 892Hillenbrand Inc 22,234 1,156Huntington Ingalls Industries Inc, Cl A 5,910 1,104Huron Consulting Group Inc * 18,840 940INNOVATE * 58,370 216Insteel Industries Inc 9,381 373ITT Inc 18,864 1,928JetBlue Airways Corp * 195,772 2,788Kadant Inc 3,880 894Kelly Services Inc, Cl A 21,496 360Kforce Inc 12,609 948Knight-Swift Transportation Holdings Inc,
Cl A 12,376 754Korn Ferry 32,613 2,470Landstar System Inc 9,166 1,641Manitowoc Co Inc/The * 11,250 209ManTech International Corp/VA, Cl A 16,344 1,192Masonite International Corp * 12,830 1,513Matson Inc 14,600 1,314Matthews International Corp, Cl A 30,926 1,134Miller Industries Inc/TN 4,949 165Montrose Environmental Group Inc * 5,253 370MRC Global Inc * 57,760 397MSC Industrial Direct Co Inc, Cl A 20,588 1,731Mueller Industries Inc 16,506 980MYR Group Inc * 6,511 720NN Inc, Cl A * 207,761 852Nordson Corp 5,719 1,460Northwest Pipe Co * 10,341 329Park Aerospace Corp 39,470 521Quanex Building Products Corp 53,638 1,329Radiant Logistics Inc * 55,784 407Regal Beloit 20,731 3,528Resources Connection Inc 71,906 1,283Rush Enterprises Inc, Cl A 15,879 884Safe Bulkers Inc * 42,600 161Saia Inc * 2,827 953Shyft Group Inc/The 12,246 602Simpson Manufacturing Co Inc 4,428 616Snap-on Inc 6,600 1,422SP Plus Corp * 9,519 269SPX FLOW Inc 24,286 2,100Standex International Corp 25,661 2,840Sterling Construction Co Inc * 14,870 391Sun Country Airlines Holdings * 5,430 148Terex Corp 14,748 648Tetra Tech Inc 5,932 1,007Textainer Group Holdings Ltd 35,812 1,279

SEI Institutional Managed Trust / Quarterly Report / December 31, 20216
SCHEDULE OF INVESTMENTS (Unaudited)December 31, 2021
Small Cap Fund (Continued)
Description SharesMarket Value
($ Thousands)
COMMON STOCK (continued)Titan International Inc * 61,790 $ 677Titan Machinery Inc * 12,184 410TriNet Group Inc * 7,862 749Triton International Ltd 12,285 740TrueBlue Inc * 21,039 582UFP Industries Inc 30,748 2,829UniFirst Corp/MA 6,427 1,352Universal Logistics Holdings Inc 8,740 165US Xpress Enterprises Inc, Cl A * 15,570 91Vectrus Inc * 13,330 610Veritiv Corp * 6,947 852Vicor Corp * 9,404 1,194Watts Water Technologies Inc, Cl A 9,107 1,768WESCO International Inc * 21,096 2,776WillScot Mobile Mini Holdings, Cl A * 28,202 1,152Zurn Water Solutions 13,864 505
123,022Information Technology — 16.7%
A10 Networks Inc 143,528 2,380Alkami Technology * 15,740 316Alliance Data Systems Corp 48,424 3,224Alpha & Omega Semiconductor Ltd * 12,849 778Altair Engineering Inc, Cl A * 6,174 477Ambarella Inc * 9,969 2,023Arlo Technologies * 24,230 254Asana, Cl A * 7,637 569AudioCodes Ltd 46,685 1,622Avid Technology Inc * 21,625 704Axcelis Technologies Inc * 21,815 1,626AXT Inc * 33,424 294Belden Inc 29,373 1,931Broadridge Financial Solutions Inc 8,534 1,560Calix Inc * 22,767 1,821Casa Systems Inc * 49,606 281Cass Information Systems Inc 5,600 220ChannelAdvisor Corp * 14,400 355Ciena Corp * 9,700 747Clearfield * 24,517 2,070CMC Materials Inc 11,604 2,224Cognex Corp 11,688 909CSG Systems International Inc 13,964 805Digi International Inc * 27,621 679DigitalOcean Holdings * 6,073 488Diodes Inc * 14,829 1,628eGain Corp * 22,087 220EMCORE Corp * 22,760 159ePlus Inc * 12,544 676EVERTEC Inc 12,750 637ExlService Holdings Inc * 21,131 3,059Extreme Networks Inc * 109,532 1,720Fabrinet * 7,563 896
Description SharesMarket Value
($ Thousands)
COMMON STOCK (continued)Grid Dynamics Holdings * 39,302 $ 1,492Hackett Group Inc/The 55,437 1,138Harmonic Inc, Cl A * 160,805 1,891I3 Verticals Inc, Cl A * 8,772 200Ichor Holdings Ltd * 11,880 547Impinj Inc * 7,991 709Informatica Inc, Cl A * 15,424 570Information Services Group Inc 108,611 828International Money Express Inc * 76,437 1,220Jabil Inc 9,700 682Jack Henry & Associates Inc 8,998 1,503Juniper Networks Inc 20,163 720Kimball Electronics Inc * 7,649 166Kulicke & Soffa Industries Inc 31,450 1,904Lattice Semiconductor Corp * 24,695 1,903Littelfuse Inc 8,216 2,585Lumentum Holdings Inc * 23,121 2,445MACOM Technology Solutions Holdings
Inc * 20,048 1,570Manhattan Associates Inc * 3,015 469MAXIMUS Inc 15,781 1,257MaxLinear, Cl A * 22,508 1,697Mitek Systems Inc * 15,216 270MoneyGram International Inc * 48,184 380Napco Security Technologies Inc * 14,591 729New Relic Inc * 6,073 668Novanta Inc * 3,419 603NVE Corp 12,052 823Onto Innovation Inc * 15,137 1,532PDF Solutions Inc * 20,868 663Perficient Inc * 5,250 679Photronics Inc * 279,850 5,275Power Integrations Inc 28,871 2,682Pure Storage Inc, Cl A * 22,600 736Qualys Inc * 5,967 819Rackspace Technology Inc * 93,969 1,266Rambus Inc * 26,799 788Rapid7 Inc * 4,205 495Rimini Street Inc * 94,083 562Rogers Corp * 7,853 2,144ScanSource Inc * 24,792 870SecureWorks Corp, Cl A * 10,929 175Semtech Corp * 8,941 795Silicon Laboratories Inc * 3,956 817Silicon Motion Technology Corp ADR 32,030 3,044SiTime Corp * 6,530 1,910SMART Global Holdings Inc * 22,188 1,575Sprout Social Inc, Cl A * 6,943 630SPS Commerce Inc * 5,833 830StarTek Inc * 54,339 284Super Micro Computer Inc * 135,475 5,954Switch Inc, Cl A 56,742 1,625
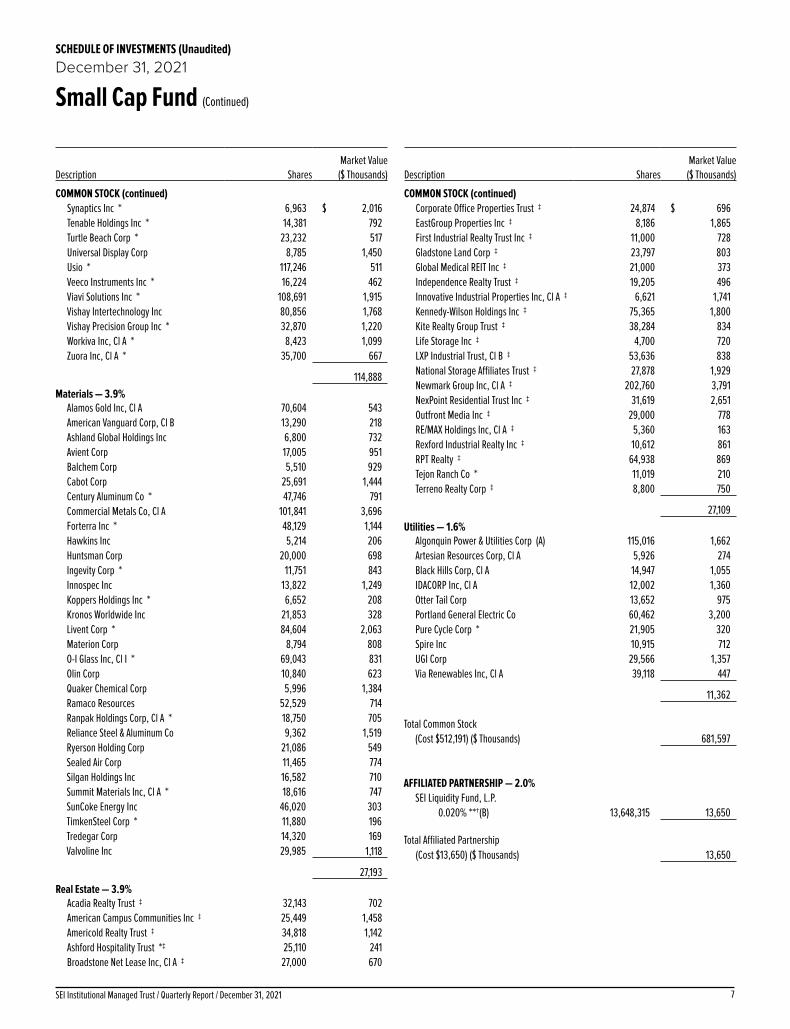
7SEI Institutional Managed Trust / Quarterly Report / December 31, 2021
SCHEDULE OF INVESTMENTS (Unaudited)December 31, 2021
Small Cap Fund (Continued)
Description SharesMarket Value
($ Thousands)
COMMON STOCK (continued)Synaptics Inc * 6,963 $ 2,016Tenable Holdings Inc * 14,381 792Turtle Beach Corp * 23,232 517Universal Display Corp 8,785 1,450Usio * 117,246 511Veeco Instruments Inc * 16,224 462Viavi Solutions Inc * 108,691 1,915Vishay Intertechnology Inc 80,856 1,768Vishay Precision Group Inc * 32,870 1,220Workiva Inc, Cl A * 8,423 1,099Zuora Inc, Cl A * 35,700 667
114,888Materials — 3.9%
Alamos Gold Inc, Cl A 70,604 543American Vanguard Corp, Cl B 13,290 218Ashland Global Holdings Inc 6,800 732Avient Corp 17,005 951Balchem Corp 5,510 929Cabot Corp 25,691 1,444Century Aluminum Co * 47,746 791Commercial Metals Co, Cl A 101,841 3,696Forterra Inc * 48,129 1,144Hawkins Inc 5,214 206Huntsman Corp 20,000 698Ingevity Corp * 11,751 843Innospec Inc 13,822 1,249Koppers Holdings Inc * 6,652 208Kronos Worldwide Inc 21,853 328Livent Corp * 84,604 2,063Materion Corp 8,794 808O-I Glass Inc, Cl I * 69,043 831Olin Corp 10,840 623Quaker Chemical Corp 5,996 1,384Ramaco Resources 52,529 714Ranpak Holdings Corp, Cl A * 18,750 705Reliance Steel & Aluminum Co 9,362 1,519Ryerson Holding Corp 21,086 549Sealed Air Corp 11,465 774Silgan Holdings Inc 16,582 710Summit Materials Inc, Cl A * 18,616 747SunCoke Energy Inc 46,020 303TimkenSteel Corp * 11,880 196Tredegar Corp 14,320 169Valvoline Inc 29,985 1,118
27,193Real Estate — 3.9%
Acadia Realty Trust ‡ 32,143 702American Campus Communities Inc ‡ 25,449 1,458Americold Realty Trust ‡ 34,818 1,142Ashford Hospitality Trust *‡ 25,110 241Broadstone Net Lease Inc, Cl A ‡ 27,000 670
Description SharesMarket Value
($ Thousands)
COMMON STOCK (continued)Corporate Office Properties Trust ‡ 24,874 $ 696EastGroup Properties Inc ‡ 8,186 1,865First Industrial Realty Trust Inc ‡ 11,000 728Gladstone Land Corp ‡ 23,797 803Global Medical REIT Inc ‡ 21,000 373Independence Realty Trust ‡ 19,205 496Innovative Industrial Properties Inc, Cl A ‡ 6,621 1,741Kennedy-Wilson Holdings Inc ‡ 75,365 1,800Kite Realty Group Trust ‡ 38,284 834Life Storage Inc ‡ 4,700 720LXP Industrial Trust, Cl B ‡ 53,636 838National Storage Affiliates Trust ‡ 27,878 1,929Newmark Group Inc, Cl A ‡ 202,760 3,791NexPoint Residential Trust Inc ‡ 31,619 2,651Outfront Media Inc ‡ 29,000 778RE/MAX Holdings Inc, Cl A ‡ 5,360 163Rexford Industrial Realty Inc ‡ 10,612 861RPT Realty ‡ 64,938 869Tejon Ranch Co * 11,019 210Terreno Realty Corp ‡ 8,800 750
27,109Utilities — 1.6%
Algonquin Power & Utilities Corp (A) 115,016 1,662Artesian Resources Corp, Cl A 5,926 274Black Hills Corp, Cl A 14,947 1,055IDACORP Inc, Cl A 12,002 1,360Otter Tail Corp 13,652 975Portland General Electric Co 60,462 3,200Pure Cycle Corp * 21,905 320Spire Inc 10,915 712UGI Corp 29,566 1,357Via Renewables Inc, Cl A 39,118 447
11,362
Total Common Stock
(Cost $512,191) ($ Thousands) 681,597
AFFILIATED PARTNERSHIP — 2.0%SEI Liquidity Fund, L.P.
0.020% **†(B) 13,648,315 13,650
Total Affiliated Partnership (Cost $13,650) ($ Thousands) 13,650
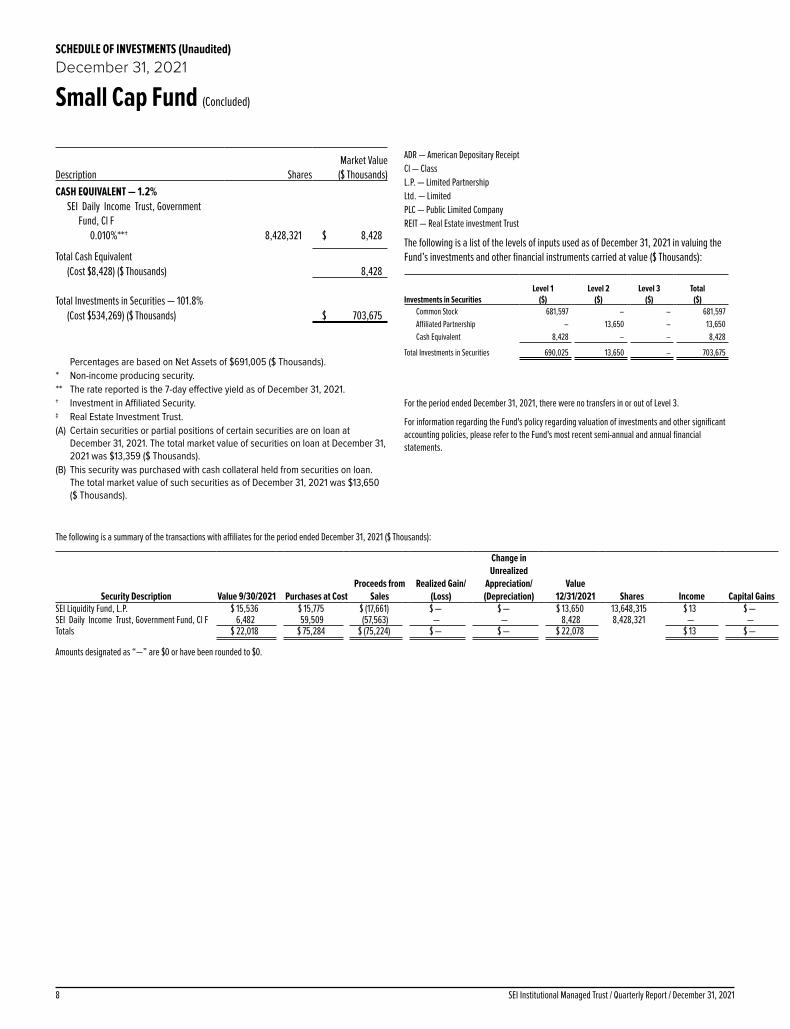
SEI Institutional Managed Trust / Quarterly Report / December 31, 20218
SCHEDULE OF INVESTMENTS (Unaudited)December 31, 2021
Small Cap Fund (Concluded)
Description SharesMarket Value
($ Thousands)CASH EQUIVALENT — 1.2%
SEI Daily Income Trust, Government Fund, Cl F
0.010%**† 8,428,321 $ 8,428
Total Cash Equivalent(Cost $8,428) ($ Thousands) 8,428
Total Investments in Securities — 101.8%(Cost $534,269) ($ Thousands) $ 703,675
Percentages are based on Net Assets of $691,005 ($ Thousands).* Non-income producing security.** The rate reported is the 7-day effective yield as of December 31, 2021.† Investment in Affiliated Security.‡ Real Estate Investment Trust.(A) Certain securities or partial positions of certain securities are on loan at
December 31, 2021. The total market value of securities on loan at December 31, 2021 was $13,359 ($ Thousands).
(B) This security was purchased with cash collateral held from securities on loan. The total market value of such securities as of December 31, 2021 was $13,650 ($ Thousands).
ADR — American Depositary ReceiptCl — ClassL.P. — Limited PartnershipLtd. — LimitedPLC — Public Limited CompanyREIT — Real Estate investment Trust
The following is a list of the levels of inputs used as of December 31, 2021 in valuing the Fund’s investments and other financial instruments carried at value ($ Thousands):
Investments in SecuritiesLevel 1
($)Level 2
($)Level 3
($)Total
($)Common Stock 681,597 – – 681,597Affiliated Partnership – 13,650 – 13,650Cash Equivalent 8,428 – – 8,428
Total Investments in Securities 690,025 13,650 – 703,675
For the period ended December 31, 2021, there were no transfers in or out of Level 3.
For information regarding the Fund's policy regarding valuation of investments and other significant accounting policies, please refer to the Fund's most recent semi-annual and annual financial statements.
The following is a summary of the transactions with affiliates for the period ended December 31, 2021 ($ Thousands):
Security Description Value 9/30/2021 Purchases at Cost Proceeds from
Sales Realized Gain/
(Loss)
Change in Unrealized
Appreciation/(Depreciation)
Value 12/31/2021 Shares Income Capital Gains
SEI Liquidity Fund, L.P. $ 15,536 $ 15,775 $ (17,661) $ — $ — $ 13,650 13,648,315 $ 13 $ — SEI Daily Income Trust, Government Fund, Cl F 6,482 59,509 (57,563) — — 8,428 8,428,321 — — Totals $ 22,018 $ 75,284 $ (75,224) $ — $ — $ 22,078 $ 13 $ —
Amounts designated as “—” are $0 or have been rounded to $0.

1SEI Institutional Managed Trust / Quarterly Report / December 31, 2021
SCHEDULE OF INVESTMENTS (Unaudited)December 31, 2021
Small Cap Value Fund
Description SharesMarket Value
($ Thousands)
COMMON STOCK — 97.9%
Communication Services — 5.9%AMC Networks Inc, Cl A * 20,653 $ 711Audacy Inc, Cl A * 82,881 213Cars.com Inc * 39,302 632Cinemark Holdings Inc *(A) 168,413 2,715Entravision Communications Corp, Cl A 16,827 114EW Scripps Co/The, Cl A * 6,466 125Gray Television Inc 68,624 1,384IDT Corp, Cl B * 1,133 50John Wiley & Sons Inc, Cl A 49,521 2,836Lions Gate Entertainment Corp, Cl A *(A) 179,471 2,987Nexstar Media Group Inc, Cl A 41,236 6,226Scholastic Corp, Cl B 7,584 303TEGNA Inc 64,130 1,190Telephone and Data Systems Inc 27,141 547Telesat Corp * 3,500 100Yelp Inc, Cl A * 5,085 184Ziff Davis Inc * 53,741 5,958
26,275Consumer Discretionary — 11.1%
Aaron's Co Inc/The 34,344 847American Axle & Manufacturing Holdings
Inc * 78,451 732American Eagle Outfitters Inc 95,716 2,423Bassett Furniture Industries Inc 2,500 42Big 5 Sporting Goods Corp 2,320 44Big Lots Inc 20,780 936Biglari Holdings Inc, Cl B * 323 46Bloomin' Brands Inc * 77,316 1,622Brinker International Inc * 40,904 1,497Carter's Inc 10,472 1,060Cato Corp/The, Cl A 5,500 94Dana Inc 58,253 1,329Dave & Buster's Entertainment Inc * 9,966 383Dick's Sporting Goods Inc 8,853 1,018Ethan Allen Interiors Inc 16,412 432Fossil Group Inc * 13,201 136Genesco Inc * 10,271 659G-III Apparel Group Ltd * 31,564 872Goodyear Tire & Rubber Co/The * 88,968 1,897Group 1 Automotive Inc 9,529 1,860H&R Block Inc 46,335 1,092Haverty Furniture Cos Inc 29,997 917Helen of Troy Ltd * 5,462 1,335Hibbett Inc 8,744 629KB Home 23,404 1,047Laureate Education Inc, Cl A * 7,000 86La-Z-Boy Inc, Cl Z 32,709 1,188Lazydays Holdings Inc * 1,477 32Lithia Motors Inc, Cl A 13,455 3,995MarineMax Inc * 5,508 325
Description SharesMarket Value
($ Thousands)
COMMON STOCK (continued)MDC Holdings Inc 28,167 $ 1,573Meritage Homes Corp * 13,757 1,679Modine Manufacturing Co * 191,531 1,933Murphy USA Inc 4,224 842ODP Corp/The * 20,477 804OneWater Marine Inc, Cl A * 1,775 108Perdoceo Education Corp * 17,797 209Rent-A-Center Inc/TX 13,689 658Sally Beauty Holdings Inc * 58,486 1,080Shoe Carnival Inc 1,335 52Signet Jewelers Ltd 2,715 236Skechers USA Inc, Cl A * 7,911 343Sleep Number Corp * 5,460 418Smith & Wesson Brands Inc 15,614 278Sonic Automotive Inc, Cl A 26,107 1,291Sturm Ruger & Co Inc 8,531 580Taylor Morrison Home Corp, Cl A * 37,530 1,312Tenneco Inc, Cl A * 19,326 218Tri Pointe Homes Inc * 90,497 2,524Tupperware Brands Corp * 32,355 495Urban Outfitters Inc * 22,685 666Vera Bradley Inc * 209,527 1,783Victoria's Secret & Co * 43,265 2,403Vista Outdoor Inc * 2,029 94Zumiez Inc * 5,709 274
50,428Consumer Staples — 3.6%
Coca-Cola Consolidated Inc 2,217 1,373Edgewell Personal Care Co 29,594 1,353Energizer Holdings Inc 33,876 1,359Hostess Brands Inc, Cl A * 46,539 950Ingles Markets Inc, Cl A 17,654 1,524Nature's Sunshine Products Inc * 3,114 58Nu Skin Enterprises Inc, Cl A 14,935 758Oil-Dri Corp of America 756 25Seneca Foods Corp, Cl A * 2,096 100SpartanNash Co 53,073 1,367Spectrum Brands Holdings Inc 34,047 3,463Sprouts Farmers Market Inc * 54,283 1,611Universal Corp/VA 20,963 1,151USANA Health Sciences Inc * 2,766 280Village Super Market Inc, Cl A 14,915 349Weis Markets Inc 4,337 286
16,007Energy — 4.4%
Arch Resources Inc 1,717 157Berry Corp 20,192 170Bristow Group Inc * 1,738 55Centrus Energy Corp, Cl A * 1,232 61Chesapeake Energy Corp 19,636 1,267CNX Resources Corp * 6,500 89

SEI Institutional Managed Trust / Quarterly Report / December 31, 20212
SCHEDULE OF INVESTMENTS (Unaudited)December 31, 2021
Small Cap Value Fund (Continued)
Description SharesMarket Value
($ Thousands)
COMMON STOCK (continued)CONSOL Energy Inc * 9,173 $ 208Delek US Holdings Inc * 173,094 2,595DHT Holdings Inc 80,517 418Dorian LPG Ltd * 11,812 150DT Midstream Inc 39,055 1,874Helix Energy Solutions Group Inc * 31,169 97HollyFrontier Corp 45,356 1,487Magnolia Oil & Gas Corp, Cl A 107,855 2,035Nabors Industries Ltd * 1,243 101National Energy Services Reunited Corp * 56,338 532Newpark Resources Inc, Cl A * 26,635 78Oasis Petroleum Inc 5,770 727PDC Energy Inc, Cl A 30,878 1,506Rattler Midstream LP (B) 87,668 998Southwestern Energy Co * 390,216 1,818Viper Energy Partners LP (B) 72,107 1,537W&T Offshore Inc * 203,048 656World Fuel Services Corp 39,992 1,059
19,675Financials — 25.0%
Amalgamated Financial Corp 4,560 76American Equity Investment Life Holding Co 84,501 3,289American National Group Inc 5,849 1,105Apollo Commercial Real Estate Finance
Inc ‡ 30,011 395Arbor Realty Trust Inc ‡ 74,360 1,362Argo Group International Holdings Ltd 5,865 341Artisan Partners Asset Management Inc,
Cl A 2,100 100Associated Banc-Corp 81,104 1,832Assured Guaranty Ltd 11,013 553Axis Capital Holdings Ltd 16,951 923B Riley Financial Inc 7,770 690Banco Latinoamericano de Comercio
Exterior SA, Cl E 50,004 830BankUnited Inc 70,972 3,003Bar Harbor Bankshares 3,932 114BGC Partners Inc, Cl A 540,238 2,512Business First Bancshares Inc 5,400 153Camden National Corp 22,847 1,100Capital Bancorp Inc 2,753 72Capstar Financial Holdings Inc 4,690 99Carter Bankshares Inc * 6,750 104Cathay General Bancorp 29,188 1,255Central Pacific Financial Corp 19,941 562CIT Group Inc 22,309 1,145Civista Bancshares Inc 4,000 98CNB Financial Corp/PA 4,166 110CNO Financial Group Inc 246,500 5,877Columbia Banking System Inc 82,433 2,697Community Trust Bancorp Inc 10,740 468
Description SharesMarket Value
($ Thousands)
COMMON STOCK (continued)CoreCivic Inc *‡ 21,375 $ 213Cowen Inc, Cl A 8,497 307Crawford & Co, Cl A 4,000 30Customers Bancorp Inc * 11,772 770Donegal Group Inc, Cl A 1,187 17Donnelley Financial Solutions Inc * 6,500 306Enova International Inc * 9,734 399EZCORP Inc, Cl A * 15,967 118Federal Agricultural Mortgage Corp, Cl C 8,472 1,050Federated Hermes Inc, Cl B 29,804 1,120Financial Institutions Inc 4,718 150First BanCorp/Puerto Rico 55,241 761First Bank/Hamilton NJ 5,328 77First Busey Corp 14,310 388First Commonwealth Financial Corp 183,930 2,959First Financial Corp/IN 3,095 140First Horizon Corp 46,699 763First Internet Bancorp 3,094 146First Merchants Corp 50,360 2,110First Midwest Bancorp Inc/IL 77,434 1,586Flagstar Bancorp Inc 22,529 1,080Flushing Financial Corp 52,314 1,271FNB Corp/PA 256,438 3,111FS Bancorp Inc 2,368 80FS KKR Capital Corp 34,292 718Fulton Financial Corp 68,912 1,171GAMCO Investors Inc, Cl A 2,021 50Genworth Financial Inc, Cl A * 139,567 565Great Southern Bancorp Inc 7,281 431Green Dot Corp, Cl A * 34,439 1,248Greenlight Capital Re Ltd, Cl A * 8,091 63Hancock Whitney Corp, Cl A 34,640 1,733Hanmi Financial Corp 30,666 726Hanover Insurance Group Inc/The, Cl A 6,673 875HarborOne Bancorp Inc 47,542 706HBT Financial Inc 4,307 81Hercules Capital Inc, Cl A (A) 52,748 875Heritage Insurance Holdings Inc 8,399 49Hilltop Holdings Inc 46,605 1,638Home Bancorp Inc 2,236 93HomeStreet Inc 24,499 1,274Hope Bancorp Inc 108,340 1,594Independent Bank Corp/MI 6,425 153Invesco Mortgage Capital Inc ‡ 209,173 581Investors Bancorp Inc 137,785 2,087Kearny Financial Corp/MD 54,370 720Luther Burbank Corp 5,628 79Merchants Bancorp/IN 4,611 218MFA Financial Inc ‡ 155,738 710MGIC Investment Corp 69,400 1,001Mid Penn Bancorp Inc 2,364 75Midland States Bancorp Inc 6,444 160

3SEI Institutional Managed Trust / Quarterly Report / December 31, 2021
SCHEDULE OF INVESTMENTS (Unaudited)December 31, 2021
Small Cap Value Fund (Continued)
Description SharesMarket Value
($ Thousands)
COMMON STOCK (continued)MidWestOne Financial Group Inc 4,288 $ 139Navient Corp 66,037 1,401New Mountain Finance Corp 39,866 546New Residential Investment Corp ‡ 127,831 1,369Northrim BanCorp Inc 1,803 78OFG Bancorp 128,235 3,406Old National Bancorp/IN, Cl A 43,055 780Oppenheimer Holdings Inc, Cl A 5,744 266Orrstown Financial Services Inc 3,388 85Pacific Premier Bancorp Inc 52,998 2,122PacWest Bancorp 207,879 9,390Peapack-Gladstone Financial Corp 5,462 193PennantPark Investment Corp 70,604 489PennyMac Financial Services Inc 12,662 884PennyMac Mortgage Investment Trust ‡ 55,281 958Peoples Bancorp Inc/OH 18,705 595Popular Inc 20,487 1,681PROG Holdings Inc * 45,977 2,074QCR Holdings Inc 4,175 234Radian Group Inc 84,914 1,794RBB Bancorp 4,906 129Redwood Trust Inc ‡ 46,804 617Republic Bancorp Inc/KY, Cl A 10,605 539Republic First Bancorp Inc * 21,445 80Sculptor Capital Management Inc, Cl A (B) 5,718 122Sierra Bancorp 3,739 102Simmons First National Corp, Cl A 43,370 1,283SiriusPoint Ltd * 22,552 183South Plains Financial Inc 3,343 93Spirit of Texas Bancshares Inc 4,058 117Starwood Property Trust Inc ‡ 168,278 4,089Stewart Information Services Corp 1,385 110Summit Financial Group Inc 2,954 81Synovus Financial Corp 17,352 831Tiptree Inc 8,692 120Two Harbors Investment Corp ‡ 49,203 284Umpqua Holdings Corp 208,762 4,017United Insurance Holdings Corp 7,351 32Universal Insurance Holdings Inc 25,645 436Waterstone Financial Inc 6,531 143Western Asset Mortgage Capital Corp ‡ 29,779 63Zions Bancorp NA 12,907 815
112,261Health Care — 4.7%
Alkermes PLC * 7,581 176Allscripts Healthcare Solutions Inc * 10,643 196Amneal Pharmaceuticals Inc * 100,961 484Atea Pharmaceuticals Inc * 3,708 33BioDelivery Sciences International Inc * 190,940 592Bioventus Inc, Cl A * 6,311 91Catalyst Pharmaceuticals Inc * 27,542 186
Description SharesMarket Value
($ Thousands)
COMMON STOCK (continued)Co-Diagnostics Inc *(A) 113,036 $ 1,009Collegium Pharmaceutical Inc * 35,372 661Community Health Systems Inc * 15,475 206Computer Programs and Systems Inc * 20,363 597Eagle Pharmaceuticals Inc/DE * 3,058 156Emergent BioSolutions * 4,753 207Endo International PLC * 102,313 385Innoviva Inc * 98,304 1,696Ironwood Pharmaceuticals Inc, Cl A * 166,479 1,941iTeos Therapeutics Inc * 5,500 256Ligand Pharmaceuticals Inc * 5,429 839MEDNAX Inc * 16,235 442National HealthCare Corp 3,532 240NextGen Healthcare Inc * 13,285 236Orthofix Medical Inc * 3,149 98Owens & Minor Inc 23,121 1,006Patterson Cos Inc 16,197 475Prestige Consumer Healthcare Inc, Cl A * 24,392 1,479Retractable Technologies Inc *(A) 4,489 31Select Medical Holdings Corp 42,032 1,236Sharps Compliance Corp * 5,385 38Surface Oncology Inc * 8,597 41Syneos Health Inc, Cl A * 45,091 4,630Utah Medical Products Inc * 893 89Vanda Pharmaceuticals Inc * 77,994 1,224
20,976Industrials — 14.7%
ABM Industries Inc 28,457 1,162ACCO Brands Corp 514,352 4,249Allison Transmission Holdings Inc 27,274 991American Woodmark Corp * 7,405 483Apogee Enterprises Inc 16,336 787ArcBest Corp 19,959 2,392Argan Inc 4,027 156Atkore Inc * 26,666 2,965Atlas Air Worldwide Holdings Inc * 29,544 2,781Beacon Roofing Supply Inc * 168 10Boise Cascade Co 10,848 772BWX Technologies Inc, Cl W 52,102 2,495Caesarstone Ltd 6,927 79Colfax Corp * 115,059 5,289Costamare Inc 12,369 156Covenant Logistics Group Inc, Cl A * 3,310 87Crane Co, Cl A 11,713 1,192Deluxe Corp 13,606 437Eagle Bulk Shipping Inc 2,500 114EMCOR Group Inc 12,353 1,574Encore Wire Corp 1,996 286Ennis Inc 24,344 475Fluor Corp * 16,945 420Genco Shipping & Trading Ltd 4,994 80

SEI Institutional Managed Trust / Quarterly Report / December 31, 20214
SCHEDULE OF INVESTMENTS (Unaudited)December 31, 2021
Small Cap Value Fund (Continued)
Description SharesMarket Value
($ Thousands)
COMMON STOCK (continued)GXO Logistics Inc * 30,101 $ 2,734Hawaiian Holdings Inc * 26,254 482Heidrick & Struggles International Inc 5,474 239Hillenbrand Inc 45,007 2,340Hub Group Inc, Cl A * 1,102 93Interface Inc, Cl A 42,184 673JetBlue Airways Corp * 127,054 1,809Kaman Corp, Cl A 36,768 1,587KAR Auction Services Inc * 176,663 2,759Kelly Services Inc, Cl A 44,321 743Kforce Inc 3,629 273ManpowerGroup Inc 7,668 746Matson Inc 900 81Matthews International Corp, Cl A 19,563 717Meritor Inc * 59,378 1,471Mesa Air Group Inc * 10,068 56Miller Industries Inc/TN 2,469 82Moog Inc, Cl A 13,774 1,115MRC Global Inc * 9,307 64Mueller Industries Inc 8,368 497NN Inc, Cl A * 132,838 545Park-Ohio Holdings Corp 11,948 253Preformed Line Products Co 972 63Primoris Services Corp 42,973 1,031Quanex Building Products Corp 9,039 224Resources Connection Inc 5,627 100RR Donnelley & Sons Co * 120,880 1,361Rush Enterprises Inc, Cl A 19,398 1,079Rush Enterprises Inc, Cl B 1,900 103Safe Bulkers Inc * 16,916 64SkyWest Inc * 10,378 408Steelcase Inc, Cl A 15,937 187Timken Co/The 16,651 1,154Titan Machinery Inc * 5,652 190Trinity Industries Inc 51,432 1,553Triton International Ltd 27,341 1,647TrueBlue Inc * 13,321 369Tutor Perini Corp * 11,956 148UFP Industries Inc 3,950 363Vectrus Inc * 5,393 247Veritiv Corp * 516 63Wabash National Corp 49,378 964Werner Enterprises Inc 19,140 912WESCO International Inc * 15,237 2,005XPO Logistics Inc * 35,719 2,766
65,792Information Technology — 11.4%
ACI Worldwide Inc * 117,021 4,061Alliance Data Systems Corp 31,414 2,091Amkor Technology Inc 123,486 3,061Avaya Holdings Corp * 29,245 579
Description SharesMarket Value
($ Thousands)
COMMON STOCK (continued)Benchmark Electronics Inc 38,182 $ 1,035Cass Information Systems Inc 3,800 149Cirrus Logic Inc * 6,326 582Cognyte Software Ltd * 44,540 698Conduent Inc * 43,702 233CSG Systems International Inc 17,466 1,006Daktronics Inc * 11,058 56Diodes Inc * 10,089 1,108Ebix Inc 9,807 298EchoStar Corp, Cl A * 11,616 306Euronet Worldwide Inc * 18,263 2,176Insight Enterprises Inc * 12,204 1,301Jabil Inc 34,789 2,447Lumentum Holdings Inc * 7,712 816Methode Electronics Inc 25,796 1,268NCR Corp * 23,138 930NETGEAR Inc * 8,231 241NetScout Systems Inc * 13,643 451Photronics Inc * 129,327 2,438Rimini Street Inc * 7,451 45Sanmina Corp * 57,157 2,370ScanSource Inc * 17,671 620Silicon Motion Technology Corp ADR 78,751 7,484SMART Global Holdings Inc * 1,583 112StarTek Inc * 8,352 44Super Micro Computer Inc * 66,600 2,927TD SYNNEX Corp 10,047 1,149Teledyne Technologies Inc * 4,587 2,004TTM Technologies Inc * 68,038 1,014Unisys Corp * 5,249 108Verint Systems Inc * 64,287 3,376Vishay Intertechnology Inc 97,029 2,122Xperi Holding Corp 28,284 535
51,241Materials — 8.4%
AdvanSix Inc 21,249 1,004Alamos Gold Inc, Cl A 42,621 328Ashland Global Holdings Inc 34,948 3,762Axalta Coating Systems Ltd * 123,308 4,084Cabot Corp 21,980 1,235Century Aluminum Co * 31,758 526Chemours Co/The 22,904 769Clearwater Paper Corp * 4,528 166Commercial Metals Co, Cl A 111,665 4,052FMC Corp 47,189 5,186FutureFuel Corp 8,285 63Greif Inc, Cl A 30,113 1,818Huntsman Corp 30,921 1,078Ingevity Corp * 11,011 789Koppers Holdings Inc * 26,222 821Kronos Worldwide Inc 1,434 21

5SEI Institutional Managed Trust / Quarterly Report / December 31, 2021
SCHEDULE OF INVESTMENTS (Unaudited)December 31, 2021
Small Cap Value Fund (Continued)
Description SharesMarket Value
($ Thousands)
COMMON STOCK (continued)Louisiana-Pacific Corp 13,957 $ 1,094Minerals Technologies Inc 1,214 89O-I Glass Inc, Cl I * 54,248 653Rayonier Advanced Materials Inc * 17,000 97Resolute Forest Products Inc * 92,070 1,406Schnitzer Steel Industries Inc, Cl A 14,813 769Schweitzer-Mauduit International Inc 14,488 433Silgan Holdings Inc 135,479 5,804Stepan Co 234 29SunCoke Energy Inc 22,000 145Tredegar Corp 8,099 96Trinseo PLC 4,964 260Valhi Inc 580 17Warrior Met Coal Inc 13,755 354Worthington Industries Inc 11,800 645
37,593Real Estate — 7.7%
Acadia Realty Trust ‡ 1,086 24Alexander & Baldwin Inc ‡ 11,054 277American Assets Trust Inc ‡ 23,777 892Brandywine Realty Trust ‡ 63,684 855Brixmor Property Group Inc ‡ 23,666 601CareTrust Inc ‡ 24,704 564Chatham Lodging Trust *‡ 34,618 475City Office Inc ‡ 31,172 615Corporate Office Properties Trust ‡ 25,644 717CTO Realty Growth Inc ‡ 1,523 94DiamondRock Hospitality Co *‡ 6,801 65Diversified Healthcare Trust ‡ 47,926 148Franklin Street Properties Corp ‡ 85,152 507Gaming and Leisure Properties Inc ‡ 96,019 4,672Global Net Lease Inc ‡ 34,674 530Hersha Hospitality Trust, Cl A *‡ 34,997 321Howard Hughes Corp/The *‡ 25,390 2,584Industrial Logistics Properties Trust ‡ 29,613 742Kite Realty Group Trust ‡ 106,741 2,325LXP Industrial Trust, Cl B ‡ 3,503 55Medical Properties Trust Inc ‡ 210,027 4,963Newmark Group Inc, Cl A ‡ 228,702 4,277Office Properties Income Trust ‡ 21,409 532Pebblebrook Hotel Trust ‡ 4,494 101Piedmont Office Realty Trust Inc, Cl A ‡ 73,033 1,342PotlatchDeltic Corp ‡ 17,526 1,055Realogy Holdings Corp * 31,745 534Retail Value Inc *‡ 4,979 32RLJ Lodging Trust ‡ 19,162 267Sabra Health Care Inc ‡ 127,036 1,720Service Properties Trust ‡ 30,253 266Summit Hotel Properties Inc *‡ 4,100 40Sunstone Hotel Investors Inc *‡ 18,142 213Tanger Factory Outlet Centers Inc ‡ 48,781 940
Description SharesMarket Value
($ Thousands)
COMMON STOCK (continued)Uniti Group Inc ‡ 71,416 $ 1,001Urstadt Biddle Properties Inc, Cl A ‡ 7,765 165Xenia Hotels & Resorts Inc *‡ 5,988 108
34,619Utilities — 1.0%
MDU Resources Group Inc 42,955 1,325National Fuel Gas Co 29,758 1,903Northwest Natural Holding Co 6,298 307Portland General Electric Co 9,736 515Southwest Gas Holdings Inc 3,316 232Via Renewables Inc, Cl A 4,253 49
4,331
Total Common Stock (Cost $314,547) ($ Thousands) 439,198
AFFILIATED PARTNERSHIP — 1.1%SEI Liquidity Fund, L.P.
0.020% **†(C) 4,865,591 4,869
Total Affiliated Partnership(Cost $4,867) ($ Thousands) 4,869
CASH EQUIVALENT — 1.9%SEI Daily Income Trust, Government
Fund, Cl F0.010%**† 8,401,411 8,401
Total Cash Equivalent(Cost $8,401) ($ Thousands) 8,401
Total Investments in Securities — 100.9%(Cost $327,815) ($ Thousands) $ 452,468
Percentages are based on Net Assets of $448,328 ($ Thousands).* Non-income producing security.** Rate shown is the 7-day effective yield as of December 31, 2021.† Investment in Affiliated Security.‡ Real Estate Investment Trust.(A) Certain securities or partial positions of certain securities are on loan at
December 31, 2021. The total market value of securities on loan at December 31, 2021 was $4,839 ($ Thousands).
(B) Security is a Master Limited Partnership. At December 31, 2021, such securities amounted to $2,657 ($ Thousands), or 0.6% of the net assets of the Fund.
(C) This security was purchased with cash collateral held from securities on loan. The total market value of such securities as of December 31, 2021 was $4,869 ($ Thousands).

SEI Institutional Managed Trust / Quarterly Report / December 31, 20216
SCHEDULE OF INVESTMENTS (Unaudited)December 31, 2021
Small Cap Value Fund (Concluded)
ADR — American Depositary ReceiptCl — ClassL.P. — Limited PartnershipLtd. — LimitedPLC — Public Limited CompanyUSD — U.S. Dollar
The following is a list of the levels of inputs used as of December 31, 2021 in valuing the Fund’s investments carried at value ($ Thousands):
Investments in SecuritiesLevel 1
($)Level 2
($)Level 3
($)Total
($)Common Stock 439,198 – – 439,198Affiliated Partnership – 4,869 – 4,869Cash Equivalent 8,401 – – 8,401
Total Investments in Securities 447,599 4,869 – 452,468
For the period ended December 31, 2021, there were no transfers in or out of Level 3.
For information regarding the Fund's policy regarding valuation of investments and other significant accounting policies, please refer to the Fund's most recent semi-annual and annual financial statements.
The following is a summary of the transactions with affiliates for the period ended December 31, 2021 ($ Thousands):
Security Description Value
9/30/2021 Purchases at Cost Proceeds from
Sales Realized Gain/
(Loss)
Change in Unrealized
Appreciation/(Depreciation)
Value 12/31/2021 Shares Income Capital Gains
SEI Liquidity Fund, L.P. $ 7,204 $ 3,773 $ (6,104) $ (4) $ — $ 4,869 4,865,591 $ 5 $ — SEI Daily Income Trust, Government Fund, Cl F 10,633 19,590 (21,822) — — 8,401 8,401,411 — — Totals $ 17,837 $ 23,363 $ (27,926) $ (4) $ — $ 13,270 $ 5 $ —
Amounts designated as “—” are $0 or have been rounded to $0.

1SEI Institutional Managed Trust / Quarterly Report / December 31, 2021
SCHEDULE OF INVESTMENTS (Unaudited)December 31, 2021
Small Cap Growth Fund
Description SharesMarket Value
($ Thousands)
COMMON STOCK — 97.7%
Communication Services — 1.3%Anterix Inc * 7,337 $ 431Cars.com Inc * 39,365 633Gogo Inc * 46,470 629John Wiley & Sons Inc, Cl A (A) 7,770 445TechTarget Inc * 14,630 1,400Yelp Inc, Cl A * 13,028 472Ziff Davis Inc * 7,068 783ZipRecruiter, Cl A * 32,710 816
5,609Consumer Discretionary — 12.3%
2U Inc * 77,054 1,546Acushnet Holdings Corp (A) 1,049 56Arko *(A) 44,681 392Asbury Automotive Group Inc * 7,151 1,235Boot Barn Holdings Inc * 14,070 1,731Boyd Gaming Corp * 6,066 398Camping World Holdings Inc, Cl A (A) 18,498 747Carriage Services Inc 13,938 898Carter's Inc 7,500 759Cavco Industries Inc * 2,379 756Century Communities Inc (A) 6,246 511Choice Hotels International Inc (A) 4,082 637Clarus Corp 46,387 1,286Cooper-Standard Holdings Inc * 30,074 674Crocs Inc * 10,665 1,367Everi Holdings Inc * 65,174 1,391Frontdoor Inc * 62,012 2,273Funko Inc, Cl A * 32,367 609Golden Entertainment Inc * 11,177 565Goodyear Tire & Rubber Co/The * 37,407 798Grand Canyon Education Inc * 19,185 1,644Green Brick Partners Inc * 19,730 598Hanesbrands Inc (A) 111,290 1,861Houghton Mifflin Harcourt Co * 57,085 919Jack in the Box Inc (A) 6,940 607Kontoor Brands Inc 4,243 217Macy's Inc 29,043 760Malibu Boats Inc, Cl A *(A) 11,245 773Movado Group Inc 16,556 693Murphy USA Inc 4,113 819Oxford Industries Inc, Cl A 7,717 783Papa John's International Inc, Cl A 10,155 1,355Patrick Industries Inc 13,191 1,064Planet Fitness Inc, Cl A * 6,657 603PlayAGS Inc * 136,007 924Red Rock Resorts Inc, Cl A 32,641 1,796RH * 371 199Sally Beauty Holdings Inc *(A) 153,235 2,829SeaWorld Entertainment Inc * 9,138 593Shoe Carnival Inc 35,134 1,373
Description SharesMarket Value
($ Thousands)
COMMON STOCK (continued)Shutterstock Inc 10,997 $ 1,219Signet Jewelers Ltd (A) 11,276 981Skechers USA Inc, Cl A * 68,510 2,973Skyline Champion Corp * 17,295 1,366Sonic Automotive Inc, Cl A 8,437 417Sonos Inc * 13,578 405Standard Motor Products Inc 11,476 601Steven Madden Ltd 14,048 653Stoneridge Inc * 17,763 351Taylor Morrison Home Corp, Cl A * 45,937 1,606Tilly's Inc, Cl A 40,454 652Toll Brothers Inc 6,797 492Vista Outdoor Inc * 38,724 1,784Winnebago Industries 5,121 384
52,923Consumer Staples — 1.9%
Beauty Health *(A) 27,026 653BJ's Wholesale Club Holdings Inc *(A) 30,063 2,013Central Garden & Pet Co, Cl A * 9,272 488Chefs' Warehouse Inc/The * 15,267 508Edgewell Personal Care Co 10,064 460Inter Parfums Inc 5,666 606MGP Ingredients Inc (A) 21,415 1,820Primo Water Corp (B) 26,573 469Simply Good Foods Co/The * 14,819 616Turning Point Brands Inc (A) 14,166 535
8,168Energy — 3.5%
Aspen Aerogels Inc * 12,470 621California Resources 23,851 1,019Chesapeake Energy Corp (A) 12,487 806Comstock Resources *(A) 127,623 1,032Energy Fuels Inc/Canada * 50,038 382Green Plains Inc * 10,244 356Magnolia Oil & Gas Corp, Cl A 105,140 1,984Matador Resources Co (A) 44,432 1,640Nabors Industries Ltd * 2,818 228Northern Oil and Gas 40,184 827Oceaneering International Inc, Cl A * 73,015 826Ovintiv Inc 46,782 1,577PDC Energy Inc, Cl A (A) 24,941 1,217Range Resources Corp * 31,144 555SM Energy Co 25,680 757Whiting Petroleum Corp *(A) 16,780 1,085
14,912Financials — 9.4%
Associated Banc-Corp 53,333 1,205Axos Financial Inc * 10,345 578Banc of California Inc 10,585 208Banner Corp 19,298 1,171

SEI Institutional Managed Trust / Quarterly Report / December 31, 20212
SCHEDULE OF INVESTMENTS (Unaudited)December 31, 2021
Small Cap Growth Fund (Continued)
Description SharesMarket Value
($ Thousands)
COMMON STOCK (continued)Build Acquisition *(B) 51,793 $ 510Cathay General Bancorp 12,010 516CNO Financial Group Inc 15,917 379Cohen & Steers Inc 440 41Community Bank System Inc (A) 7,188 535Cowen Inc, Cl A 14,110 509Customers Bancorp Inc * 26,310 1,720Donnelley Financial Solutions Inc * 23,004 1,084Enterprise Financial Services Corp 10,772 507First Bank/Hamilton NJ 21,953 318First Financial Bankshares Inc, Cl A (A) 9,805 498First Foundation Inc 6,467 161First Merchants Corp 12,907 541Fulton Financial Corp 50,504 859Great Ajax Corp ‡ 21,937 289Hancock Whitney Corp, Cl A 10,132 507Hanmi Financial Corp 16,217 384Hannon Armstrong Sustainable
Infrastructure Capital Inc ‡(A) 5,112 272HBT Financial Inc 21,927 411HomeStreet Inc 23,557 1,225Houlihan Lokey Inc, Cl A 12,488 1,293LendingClub * 22,562 545Live Oak Bancshares Inc 10,434 911Mercantile Bank Corp 22,352 783Metropolitan Bank Holding Corp * 7,218 769MGIC Investment Corp 24,246 350Moelis & Co, Cl A 17,243 1,078Mr Cooper Group Inc * 28,034 1,166MVB Financial Corp 5,912 245Navient Corp 28,406 603Nelnet Inc, Cl A 6,375 623OceanFirst Financial Corp 24,205 537Oportun Financial Corp * 7,954 161Orrstown Financial Services Inc 23,316 588Piper Sandler Cos 6,846 1,222Provident Financial Services Inc (A) 28,583 692Radian Group Inc 16,584 350RBB Bancorp 16,941 444Regional Management Corp 1,728 99RLI Corp 4,787 537Selective Insurance Group Inc (A) 6,978 572ServisFirst Bancshares Inc 11,355 964Silvergate Capital, Cl A * 2,494 370South Plains Financial Inc 8,114 226Stewart Information Services Corp 19,466 1,552Stifel Financial Corp 8,500 599Tishman Speyer Innovation II * 63,249 623Towne Bank/Portsmouth VA 12,724 402Triumph Bancorp Inc * 5,866 698Trupanion Inc * 5,605 740United Community Banks Inc/GA 19,653 706
Description SharesMarket Value
($ Thousands)
COMMON STOCK (continued)Value Creation *(C)(D) 145,600 $ 61Veritex Holdings Inc 36,693 1,460Virtus Investment Partners Inc 2,423 720Walker & Dunlop Inc 4,810 726Warrior Technologies Acquisition * 73,115 738Washington Federal Inc 24,533 819West BanCorp Inc 10,168 316WisdomTree Investments Inc 168,312 1,030
40,746Health Care — 21.0%
4D Molecular Therapeutics * 31,119 683Absci *(A) 30,354 249Albireo Pharma Inc *(A) 30,443 709Alector Inc *(A) 39,779 821Amicus Therapeutics Inc * 23,513 272AMN Healthcare Services Inc * 25,321 3,097Antares Pharma Inc * 84,886 303Arcus Biosciences Inc *(A) 15,207 615Arvinas Inc * 8,054 662Avid Bioservices Inc * 19,092 557Axogen Inc * 60,938 571Biohaven Pharmaceutical Holding Co Ltd * 5,137 708Blueprint Medicines Corp * 7,474 801C4 Therapeutics * 17,969 579Cano Health *(A) 79,588 709Cardiovascular Systems Inc * 34,077 640CareDx Inc * 21,788 991Castle Biosciences Inc * 9,781 419Catalyst Pharmaceuticals Inc * 79,284 537Cerevel Therapeutics Holdings *(A) 26,991 875Codex DNA *(A) 27,008 292Collegium Pharmaceutical Inc *(A) 19,944 373Community Health Systems Inc * 84,727 1,128CorVel Corp * 1,145 238Cross Country Healthcare Inc * 51,844 1,439CryoLife Inc * 46,721 951Cutera Inc * 2,300 95Cytokinetics Inc * 28,501 1,299CytomX Therapeutics Inc * 12,255 53DICE Therapeutics * 24,651 624Enanta Pharmaceuticals Inc * 9,862 737Endo International PLC * 159,449 600Ensign Group Inc/The 20,430 1,715Erasca *(A) 25,261 394Evelo Biosciences *(A) 16,311 99Foghorn Therapeutics *(A) 32,984 754Fortress Biotech Inc *(A) 27,855 70Halozyme Therapeutics Inc *(A) 38,975 1,567HealthEquity Inc * 29,012 1,283Heron Therapeutics Inc *(A) 80,462 735ImmunoGen Inc * 43,668 324

3SEI Institutional Managed Trust / Quarterly Report / December 31, 2021
SCHEDULE OF INVESTMENTS (Unaudited)December 31, 2021
Small Cap Growth Fund (Continued)
Description SharesMarket Value
($ Thousands)
COMMON STOCK (continued)Inhibrx Inc * 33,689 $ 1,471Instil Bio *(A) 30,584 523Integer Holdings Corp * 14,676 1,256Intercept Pharmaceuticals * 52,940 862Intra-Cellular Therapies Inc, Cl A * 12,923 676iRadimed Corp * 10,140 469Ironwood Pharmaceuticals Inc, Cl A * 182,438 2,127iTeos Therapeutics Inc * 46,174 2,150IVERIC bio Inc * 68,257 1,141Joint Corp/The * 1,213 80Kezar Life Sciences * 22,124 370Kiniksa Pharmaceuticals Ltd, Cl A *(A) 106,512 1,254Kodiak Sciences Inc *(A) 11,755 997Krystal Biotech Inc * 4,361 305LivaNova PLC * 9,633 842MaxCyte * 64,227 654MEDNAX Inc * 38,047 1,035Medpace Holdings Inc * 7,325 1,594Merit Medical Systems Inc * 50,535 3,148Mesa Laboratories Inc (A) 1,102 362ModivCare Inc * 2,486 369Nevro Corp * 6,210 503NextGen Healthcare Inc * 53,318 949Olema Pharmaceuticals * 31,793 298Omnicell Inc *(A) 18,431 3,326Option Care Health Inc * 65,793 1,871Organogenesis Holdings Inc, Cl A * 62,866 581ORIC Pharmaceuticals Inc * 51,721 760Owens & Minor Inc (A) 6,802 296Paragon 28 *(A) 27,271 482PMV Pharmaceuticals Inc * 20,464 473Precision BioSciences Inc * 63,618 471Prestige Consumer Healthcare Inc, Cl A * 41,518 2,518Privia Health Group * 31,002 802Progyny Inc *(A) 4,087 206Prometheus Biosciences *(A) 17,619 697Quidel Corp *(A) 8,436 1,139R1 RCM Inc * 4,834 123REGENXBIO Inc * 20,393 667Relay Therapeutics Inc *(A) 21,594 663Select Medical Holdings Corp 56,378 1,657Shockwave Medical Inc *(A) 2,604 464Sight Sciences *(A) 22,614 397Sonendo *(A) 79,512 458SpringWorks Therapeutics Inc * 12,964 803STAAR Surgical Co * 1,625 148Supernus Pharmaceuticals Inc * 24,448 713Syneos Health Inc, Cl A * 25,008 2,568Talis Biomedical * 41,036 165Tandem Diabetes Care Inc * 4,568 688TCR2 Therapeutics Inc * 70,445 328Tenet Healthcare Corp * 27,920 2,281
Description SharesMarket Value
($ Thousands)
COMMON STOCK (continued)Travere Therapeutics * 29,806 $ 925uniQure * 25,185 522US Physical Therapy Inc 10,570 1,010Vanda Pharmaceuticals Inc * 88,833 1,394Varex Imaging Corp * 55,374 1,747Veracyte Inc *(A) 46,109 1,900Viking Therapeutics Inc * 132,884 611Vir Biotechnology *(A) 31,848 1,333Vocera Communications Inc * 20,339 1,319Xencor Inc *(A) 25,127 1,008
90,517Industrials — 18.7%
ABM Industries Inc 46,971 1,919Acuity Brands Inc 4,197 889ACV Auctions, Cl A *(A) 58,737 1,107Albany International Corp, Cl A 6,108 540Alight * 108,251 1,170Ameresco Inc, Cl A * 7,380 601Applied Industrial Technologies Inc, Cl A (A) 8,255 848ArcBest Corp (A) 15,738 1,886ASGN Inc * 6,870 848Atkore Inc * 22,133 2,461Atlas Air Worldwide Holdings Inc * 21,861 2,058Avis Budget Group Inc * 2,002 415Beacon Roofing Supply Inc * 24,517 1,406BlueLinx Holdings * 11,713 1,122Boise Cascade Co 19,137 1,363Byrna Technologies * 34,893 466Cimpress PLC *(A) 12,495 895Clean Harbors Inc * 19,278 1,923Costamare Inc 15,492 196EMCOR Group Inc 17,006 2,166Encore Wire Corp 6,803 973Evoqua Water Technologies Corp * 15,642 731First Advantage * 71,432 1,360Forrester Research Inc * 33,855 1,988Forward Air Corp 21,635 2,620Franklin Electric Co Inc 7,025 664GATX (A) 5,745 599Genco Shipping & Trading Ltd 38,666 619GMS Inc * 11,708 704Graham Corp, Cl A 11,316 141Heartland Express Inc 17,258 290Heidrick & Struggles International Inc 13,399 586Helios Technologies Inc 6,875 723Herc Holdings Inc 11,733 1,837Heritage-Crystal Clean Inc * 116,085 3,717Hillenbrand Inc 34,271 1,782Hub Group Inc, Cl A * 6,341 534Hudson Technologies Inc * 300,415 1,334Interface Inc, Cl A 26,272 419

SEI Institutional Managed Trust / Quarterly Report / December 31, 20214
SCHEDULE OF INVESTMENTS (Unaudited)December 31, 2021
Small Cap Growth Fund (Continued)
Description SharesMarket Value
($ Thousands)
COMMON STOCK (continued)John Bean Technologies Corp, Cl A (A) 5,913 $ 908Kforce Inc 15,712 1,182Kirby Corp * 21,197 1,260Knight-Swift Transportation Holdings Inc,
Cl A 10,457 637Korn Ferry 29,972 2,270Legalzoom.com Inc * 10,279 165Matson Inc (A) 46,655 4,200Middleby Corp/The * 8,505 1,673MYR Group Inc *(A) 7,831 866NOW Inc * 56,722 484Ritchie Bros Auctioneers Inc 40,451 2,476Shyft Group Inc/The 6,110 300SP Plus Corp * 24,173 682Tennant Co (A) 24,536 1,988Tetra Tech Inc 6,597 1,120Textainer Group Holdings Ltd (A) 17,754 634Titan Machinery Inc * 24,117 812TriNet Group Inc * 36,267 3,455Triton International Ltd 25,587 1,541TrueBlue Inc *(A) 76,729 2,123UFP Industries Inc 6,012 553Veritiv Corp * 5,776 708Vicor Corp * 3,596 457Watts Water Technologies Inc, Cl A 3,673 713WESCO International Inc * 6,769 891WillScot Mobile Mini Holdings, Cl A * 47,575 1,943Zurn Water Solutions 23,926 871
80,812Information Technology — 22.0%
8x8 Inc * 72,336 1,212A10 Networks Inc 82,013 1,360Actua Corp *(C) 105,055 1ADTRAN Inc 28,557 652Alarm.com Holdings Inc *(A) 8,038 682Alkami Technology * 28,976 581Allegro MicroSystems Inc * 35,115 1,270Alpha & Omega Semiconductor Ltd * 30,193 1,828Altair Engineering Inc, Cl A * 7,627 590Ambarella Inc * 9,112 1,849Arlo Technologies * 47,305 496Asure Software Inc * 64,719 507Avid Technology Inc * 13,910 453Axcelis Technologies Inc * 12,087 901Belden Inc 24,006 1,578Blackbaud Inc, Cl A * 6,164 487Calix Inc * 24,445 1,955ChannelAdvisor Corp * 35,091 866Ciena Corp * 8,414 648Cirrus Logic Inc * 4,592 423Clearfield * 14,243 1,202
Description SharesMarket Value
($ Thousands)
COMMON STOCK (continued)Consensus Cloud Solutions *(A) 11,260 $ 652CTS Corp 71,877 2,639Datto Holding Corp * 57,664 1,519Digital Turbine Inc *(A) 8,751 534DigitalOcean Holdings * 6,851 550Diodes Inc * 22,226 2,441Domo Inc, Cl B * 2,203 109EMCORE Corp * 72,657 507EVERTEC Inc 20,287 1,014ExlService Holdings Inc * 15,159 2,195Extreme Networks Inc * 126,079 1,979ForgeRock, Cl A *(A) 16,912 451Grid Dynamics Holdings * 20,284 770Harmonic Inc, Cl A * 124,772 1,467Ichor Holdings Ltd * 12,124 558Impinj Inc * 8,168 724Informatica Inc, Cl A (A) 12,137 449International Money Express Inc * 30,753 491Jabil Inc 8,648 608Juniper Networks Inc 17,214 615KnowBe4, Cl A * 12,912 296Kulicke & Soffa Industries Inc (A) 31,597 1,913Latch *(A) 79,532 602Lattice Semiconductor Corp * 27,545 2,123Littelfuse Inc 2,277 716MACOM Technology Solutions Holdings
Inc * 5,711 447Manhattan Associates Inc * 9,055 1,408MaxLinear, Cl A * 18,352 1,383Mimecast Ltd * 43,051 3,426Model N Inc * 33,091 994Momentive Global * 124,301 2,629New Relic Inc * 5,496 604Novanta Inc * 6,747 1,190Onto Innovation Inc * 22,115 2,239PDF Solutions Inc * 15,594 496Perficient Inc * 24,009 3,104Photronics Inc * 57,493 1,084Ping Identity Holding Corp * 61,272 1,402Power Integrations Inc 10,638 988Progress Software Corp 26,385 1,274Pure Storage Inc, Cl A * 19,168 624Qualys Inc *(A) 4,893 671Rambus Inc * 23,436 689Rapid7 Inc * 10,158 1,195Rimini Street Inc * 23,561 141Silicon Laboratories Inc *(A) 3,540 731SiTime Corp * 4,436 1,298SMART Global Holdings Inc * 25,665 1,822Sprout Social Inc, Cl A * 6,451 585SPS Commerce Inc * 9,229 1,314Sumo Logic * 25,894 351

5SEI Institutional Managed Trust / Quarterly Report / December 31, 2021
SCHEDULE OF INVESTMENTS (Unaudited)December 31, 2021
Small Cap Growth Fund (Continued)
Description SharesMarket Value
($ Thousands)
COMMON STOCK (continued)Super Micro Computer Inc * 46,838 $ 2,058Synaptics Inc * 7,168 2,075TTEC Holdings Inc 17,533 1,588Ultra Clean Holdings Inc * 22,971 1,318Upland Software Inc * 39,782 714Verint Systems Inc * 26,109 1,371Veritone *(A) 26,748 601Verra Mobility Corp, Cl A * 32,765 506Vertex, Cl A * 40,925 649Viavi Solutions Inc * 68,111 1,200Vishay Intertechnology Inc (A) 87,630 1,917Weave Communications * 20,835 316Workiva Inc, Cl A * 12,198 1,592Zuora Inc, Cl A * 84,729 1,583
95,040Materials — 2.8%
AdvanSix Inc 18,515 875Ashland Global Holdings Inc 5,111 550Balchem Corp 5,542 934Commercial Metals Co, Cl A 40,198 1,459Huntsman Corp 14,105 492Livent Corp * 29,979 731Louisiana-Pacific Corp 2,540 199Materion Corp 5,922 544Olin Corp 11,371 654Orion Engineered Carbons (A) 35,868 658Ranpak Holdings Corp, Cl A * 33,790 1,270Schnitzer Steel Industries Inc, Cl A (A) 13,367 694Sealed Air Corp 9,706 655Sensient Technologies Corp 5,163 517Summit Materials Inc, Cl A * 15,167 609Trinseo PLC (A) 22,794 1,196
12,037Real Estate — 4.3%
Centerspace ‡(A) 6,371 707CorePoint Lodging *‡ 9,458 149Cushman & Wakefield PLC *‡ 24,604 547Easterly Government Properties Inc, Cl A ‡ 19,409 445EastGroup Properties Inc ‡ 9,370 2,135First Industrial Realty Trust Inc ‡ 9,595 635Four Corners Property Trust Inc ‡ 16,726 492Gladstone Land Corp ‡ 22,525 760Independence Realty Trust ‡ 82,976 2,143Life Storage Inc ‡ 4,183 641National Storage Affiliates Trust ‡ 34,408 2,381Newmark Group Inc, Cl A ‡ 81,085 1,516NexPoint Residential Trust Inc ‡ 8,095 679Pebblebrook Hotel Trust ‡(A) 28,474 637RE/MAX Holdings Inc, Cl A ‡ 28,625 873Rexford Industrial Realty Inc ‡ 8,827 716RPT Realty ‡ 51,528 689
Description SharesMarket Value
($ Thousands)
COMMON STOCK (continued)SITE Centers Corp ‡ 64,434 $ 1,020St Joe Co/The ‡(A) 2,825 147Tanger Factory Outlet Centers Inc ‡(A) 19,000 366Terreno Realty Corp ‡ 7,545 644Uniti Group Inc ‡(A) 9,381 131
18,453Utilities — 0.5%
Chesapeake Utilities Corp 3,873 565Clearway Energy Inc, Cl A 14,582 488Otter Tail Corp 11,753 839Portland General Electric Co 7,094 376
2,268
Total Common Stock
(Cost $338,112) ($ Thousands) 421,485
AFFILIATED PARTNERSHIP — 15.7%SEI Liquidity Fund, L.P.
0.020% **†(E) 67,687,548 67,697
Total Affiliated Partnership (Cost $67,701) ($ Thousands) 67,697
CASH EQUIVALENT — 2.3%SEI Daily Income Trust, Government
Fund, Cl F0.010%**† 9,797,334 9,797
Total Cash Equivalent(Cost $9,797) ($ Thousands) 9,797
Total Investments in Securities — 115.7%(Cost $415,610) ($ Thousands) $ 498,979
Percentages are based on Net Assets of $431,103 ($ Thousands).* Non-income producing security.** The rate reported is the 7-day effective yield as of December 31, 2021.† Investment in Affiliated Security.‡ Real Estate Investment Trust.(A) Certain securities or partial positions of certain securities are on loan at
December 31, 2021. The total market value of securities on loan at December 31, 2021 was $64,407 ($ Thousands).
(B) Securities considered illiquid. The total value of such securities as of December 31, 2021 was $979 ($ Thousands) and represented 0.2% of the Net Assets of the Fund.
(C) Level 3 security in accordance with fair value hierarchy.(D) Securities considered restricted. The total market value of such securities as
of December 31, 2021 was $61 ($ Thousands) and represented 0.0% of the Net Assets of the Fund.

SEI Institutional Managed Trust / Quarterly Report / December 31, 20216
SCHEDULE OF INVESTMENTS (Unaudited)December 31, 2021
Small Cap Growth Fund (Concluded)
(E) This security was purchased with cash collateral held from securities on loan. The total market value of such securities as of December 31, 2021 was $67,697 ($ Thousands).
Cl — ClassL.P. — Limited PartnershipLtd. — LimitedPLC — Public Limited Company
The following is a list of the levels of inputs used as of December 31, 2021 in valuing the Fund’s investments carried at value ($ Thousands):
Investments in SecuritiesLevel 1
($)Level 2
($)Level 3
($)(1)Total
($)Common Stock 421,423 – 62 421,485Affiliated Partnership – 67,697 – 67,697Cash Equivalent 9,797 – – 9,797
Total Investments in Securities 431,220 67,697 62 498,979
(1) A reconciliation of Level 3 investments is presented when the Fund has a significant amount of Level 3 investments at the beginning and/or end of the period in relation to the net assets. Management has concluded that Level 3 investments are not material in relation to net assets.
For the period ended December 31, 2021, there have been no transfers in or out of Level 3.
For information regarding the Fund's policy regarding valuation of investments and other significant accounting policies, please refer to the Fund's most recent semi-annual and annual financial statements.
The following is a summary of the transactions with affiliates for the period ended December 31, 2021 ($ Thousands):
Security Description Value 9/30/2021 Purchases at Cost Proceeds from
Sales Realized Gain/
(Loss)
Change in Unrealized
Appreciation/(Depreciation)
Value 12/31/2021 Shares Income Capital Gains
SEI Liquidity Fund, L.P. $ 162,855 $ 52,539 $ (147,695) $ — $ (2) $ 67,697 67,687,548 $ 40 $ — SEI Daily Income Trust, Government Fund, Cl F 6,747 22,331 (19,281) — — 9,797 9,797,334 — — Totals $ 169,602 $ 74,870 $ (166,976) $ — $ (2) $ 77,494 $ 40 $ —
Amounts designated as “—” are $0 or have been rounded to $0.

1SEI Institutional Managed Trust / Quarterly Report / December 31, 2021
SCHEDULE OF INVESTMENTS (Unaudited)December 31, 2021
Tax-Managed Small/Mid Cap Fund
Description SharesMarket Value
($ Thousands)
COMMON STOCK — 98.6%
Communication Services — 5.6%Cable One Inc 1,150 $ 2,028Cargurus Inc, Cl A * 22,446 755Cinemark Holdings Inc * 430,080 6,933Cogent Communications Holdings Inc 18,392 1,346Electronic Arts Inc 2,290 302IAC/InterActiveCorp * 3,105 406iHeartMedia Inc * 50,811 1,069Interpublic Group of Cos Inc/The 24,754 927John Wiley & Sons Inc, Cl A 91,526 5,242Liberty Latin America Ltd, Cl C * 93,159 1,062Lions Gate Entertainment Corp, Cl A * 439,020 7,305Match Group Inc * 1,449 192Nexstar Media Group Inc, Cl A 68,960 10,411Ooma Inc * 12,922 264Take-Two Interactive Software Inc, Cl A * 3,431 610TechTarget Inc * 534 51World Wrestling Entertainment Inc, Cl A 28,861 1,424Ziff Davis Inc * 178,049 19,739
60,066Consumer Discretionary — 10.0%
1-800-Flowers.com Inc, Cl A * 20,866 488Advance Auto Parts Inc 10,274 2,465American Eagle Outfitters Inc (A) 184,000 4,659America's Car-Mart Inc/TX * 5,643 578Asbury Automotive Group Inc * 3,907 675AutoNation Inc * 1,730 202Bloomin' Brands Inc * 164,957 3,461Boot Barn Holdings Inc * 8,000 984Bright Horizons Family Solutions Inc * 1,538 194Brinker International Inc * 96,417 3,528CarParts.com Inc * 26,372 295Carriage Services Inc 26,433 1,703Carter's Inc 10,264 1,039Cavco Industries Inc * 4,550 1,445Century Communities Inc 15,398 1,259Clarus Corp 20,000 554Crocs Inc * 5,724 734Dave & Buster's Entertainment Inc * 43,840 1,683Deckers Outdoor Corp * 3,400 1,245Dorman Products Inc * 2,086 236Etsy Inc * 25,651 5,616Everi Holdings Inc * 18,348 392Golden Entertainment Inc * 27,272 1,378Group 1 Automotive Inc 4,472 873Haverty Furniture Cos Inc 17,831 545Helen of Troy Ltd * 11,676 2,854Hibbett Inc 17,681 1,272Hilton Grand Vacations Inc * 15,934 830Inspired Entertainment Inc * 43,346 562Kontoor Brands Inc 12,635 648
Description SharesMarket Value
($ Thousands)
COMMON STOCK (continued)LCI Industries 24,809 $ 3,867Lithia Motors Inc, Cl A 24,454 7,262LKQ Corp 58,818 3,531Macy's Inc 37,996 995Modine Manufacturing Co * 557,125 5,621Monarch Casino & Resort Inc * 15,917 1,177Movado Group Inc 18,795 786Murphy USA Inc 5,255 1,047Ollie's Bargain Outlet Holdings Inc * 3,893 199Overstock.com * 8,538 504Oxford Industries Inc, Cl A 14,810 1,503Papa John's International Inc, Cl A 12,000 1,602Pool Corp 16,836 9,529Rent-A-Center Inc/TX 16,566 796SeaWorld Entertainment Inc * 21,440 1,391Service Corp International/US 8,000 568Signet Jewelers Ltd 15,111 1,315Skechers USA Inc, Cl A * 37,863 1,643Skyline Champion Corp * 15,016 1,186Sleep Number Corp * 1,260 96Sonos Inc * 24,186 721Standard Motor Products Inc 10,345 542Steven Madden Ltd 21,598 1,004Stride * 41,300 1,377Taylor Morrison Home Corp, Cl A * 95,826 3,350Urban Outfitters Inc * 72,105 2,117Vail Resorts Inc 9,517 3,121Vera Bradley Inc * 370,157 3,150Victoria's Secret & Co * 37,755 2,097Whirlpool Corp 3,320 779Williams-Sonoma Inc 7,799 1,319XPEL Inc * 10,021 684
107,276Consumer Staples — 3.9%
BJ's Wholesale Club Holdings Inc * 24,382 1,633Casey's General Stores Inc 6,437 1,270Celsius Holdings Inc * 8,979 670Central Garden & Pet Co, Cl A * 27,121 1,298Coca-Cola Consolidated Inc 2,500 1,548Darling Ingredients Inc * 16,819 1,165Flowers Foods Inc 23,770 653Freshpet Inc * 8,866 845Hostess Brands Inc, Cl A * 347,000 7,086Ingles Markets Inc, Cl A 6,621 572Ingredion Inc 9,898 956Inter Parfums Inc 3,337 357J & J Snack Foods Corp 7,030 1,110John B Sanfilippo & Son Inc 13,714 1,236Kroger Co/The 6,156 279Lancaster Colony Corp 5,300 878Medifast Inc 25,737 5,390
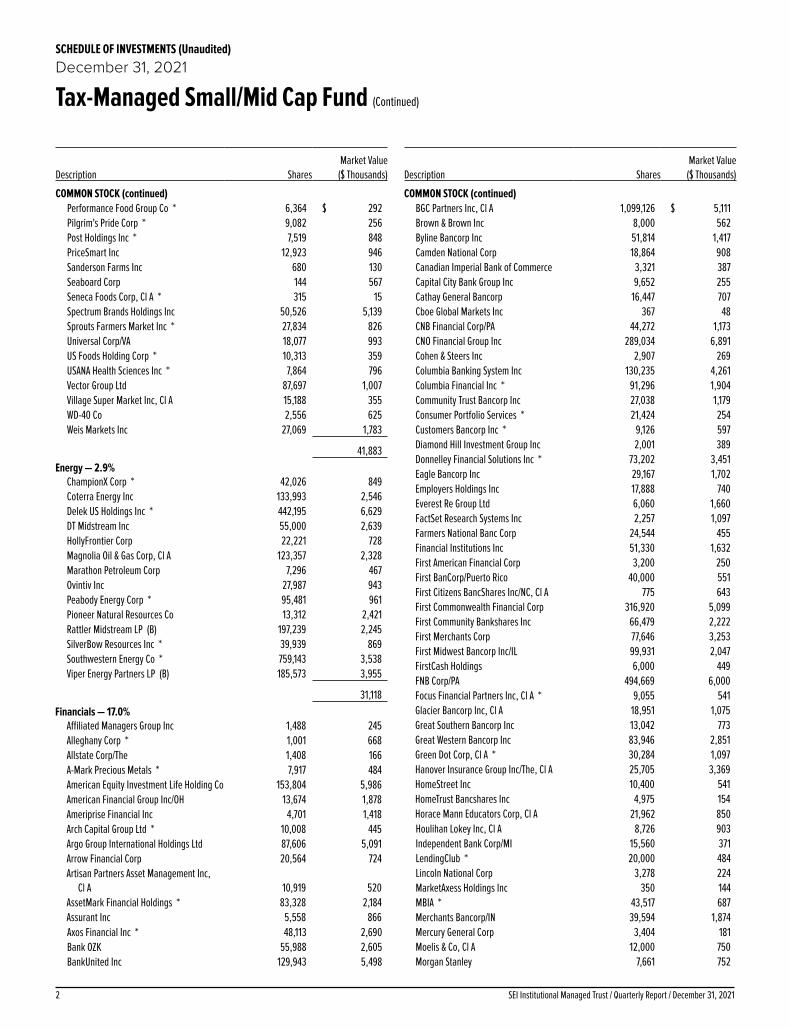
SEI Institutional Managed Trust / Quarterly Report / December 31, 20212
SCHEDULE OF INVESTMENTS (Unaudited)December 31, 2021
Tax-Managed Small/Mid Cap Fund (Continued)
Description SharesMarket Value
($ Thousands)
COMMON STOCK (continued)Performance Food Group Co * 6,364 $ 292Pilgrim's Pride Corp * 9,082 256Post Holdings Inc * 7,519 848PriceSmart Inc 12,923 946Sanderson Farms Inc 680 130Seaboard Corp 144 567Seneca Foods Corp, Cl A * 315 15Spectrum Brands Holdings Inc 50,526 5,139Sprouts Farmers Market Inc * 27,834 826Universal Corp/VA 18,077 993US Foods Holding Corp * 10,313 359USANA Health Sciences Inc * 7,864 796Vector Group Ltd 87,697 1,007Village Super Market Inc, Cl A 15,188 355WD-40 Co 2,556 625Weis Markets Inc 27,069 1,783
41,883Energy — 2.9%
ChampionX Corp * 42,026 849Coterra Energy Inc 133,993 2,546Delek US Holdings Inc * 442,195 6,629DT Midstream Inc 55,000 2,639HollyFrontier Corp 22,221 728Magnolia Oil & Gas Corp, Cl A 123,357 2,328Marathon Petroleum Corp 7,296 467Ovintiv Inc 27,987 943Peabody Energy Corp * 95,481 961Pioneer Natural Resources Co 13,312 2,421Rattler Midstream LP (B) 197,239 2,245SilverBow Resources Inc * 39,939 869Southwestern Energy Co * 759,143 3,538Viper Energy Partners LP (B) 185,573 3,955
31,118Financials — 17.0%
Affiliated Managers Group Inc 1,488 245Alleghany Corp * 1,001 668Allstate Corp/The 1,408 166A-Mark Precious Metals * 7,917 484American Equity Investment Life Holding Co 153,804 5,986American Financial Group Inc/OH 13,674 1,878Ameriprise Financial Inc 4,701 1,418Arch Capital Group Ltd * 10,008 445Argo Group International Holdings Ltd 87,606 5,091Arrow Financial Corp 20,564 724Artisan Partners Asset Management Inc,
Cl A 10,919 520AssetMark Financial Holdings * 83,328 2,184Assurant Inc 5,558 866Axos Financial Inc * 48,113 2,690Bank OZK 55,988 2,605BankUnited Inc 129,943 5,498
Description SharesMarket Value
($ Thousands)
COMMON STOCK (continued)BGC Partners Inc, Cl A 1,099,126 $ 5,111Brown & Brown Inc 8,000 562Byline Bancorp Inc 51,814 1,417Camden National Corp 18,864 908Canadian Imperial Bank of Commerce 3,321 387Capital City Bank Group Inc 9,652 255Cathay General Bancorp 16,447 707Cboe Global Markets Inc 367 48CNB Financial Corp/PA 44,272 1,173CNO Financial Group Inc 289,034 6,891Cohen & Steers Inc 2,907 269Columbia Banking System Inc 130,235 4,261Columbia Financial Inc * 91,296 1,904Community Trust Bancorp Inc 27,038 1,179Consumer Portfolio Services * 21,424 254Customers Bancorp Inc * 9,126 597Diamond Hill Investment Group Inc 2,001 389Donnelley Financial Solutions Inc * 73,202 3,451Eagle Bancorp Inc 29,167 1,702Employers Holdings Inc 17,888 740Everest Re Group Ltd 6,060 1,660FactSet Research Systems Inc 2,257 1,097Farmers National Banc Corp 24,544 455Financial Institutions Inc 51,330 1,632First American Financial Corp 3,200 250First BanCorp/Puerto Rico 40,000 551First Citizens BancShares Inc/NC, Cl A 775 643First Commonwealth Financial Corp 316,920 5,099First Community Bankshares Inc 66,479 2,222First Merchants Corp 77,646 3,253First Midwest Bancorp Inc/IL 99,931 2,047FirstCash Holdings 6,000 449FNB Corp/PA 494,669 6,000Focus Financial Partners Inc, Cl A * 9,055 541Glacier Bancorp Inc, Cl A 18,951 1,075Great Southern Bancorp Inc 13,042 773Great Western Bancorp Inc 83,946 2,851Green Dot Corp, Cl A * 30,284 1,097Hanover Insurance Group Inc/The, Cl A 25,705 3,369HomeStreet Inc 10,400 541HomeTrust Bancshares Inc 4,975 154Horace Mann Educators Corp, Cl A 21,962 850Houlihan Lokey Inc, Cl A 8,726 903Independent Bank Corp/MI 15,560 371LendingClub * 20,000 484Lincoln National Corp 3,278 224MarketAxess Holdings Inc 350 144MBIA * 43,517 687Merchants Bancorp/IN 39,594 1,874Mercury General Corp 3,404 181Moelis & Co, Cl A 12,000 750Morgan Stanley 7,661 752

3SEI Institutional Managed Trust / Quarterly Report / December 31, 2021
SCHEDULE OF INVESTMENTS (Unaudited)December 31, 2021
Tax-Managed Small/Mid Cap Fund (Continued)
Description SharesMarket Value
($ Thousands)
COMMON STOCK (continued)Morningstar Inc, Cl A 5,718 $ 1,955OFG Bancorp 133,441 3,544Origin Bancorp Inc 54,010 2,318Pacific Premier Bancorp Inc 84,780 3,394PacWest Bancorp 433,442 19,579PCSB Financial Corp 20,078 382Piper Sandler Cos 13,823 2,468PJT Partners Inc 16,396 1,215Popular Inc 11,261 924PROG Holdings Inc * 84,705 3,821Provident Financial Services Inc 24,819 601Reinsurance Group of America Inc, Cl A 7,938 869RenaissanceRe Holdings Ltd 7,345 1,244Republic Bancorp Inc/KY, Cl A 10,585 538Safety Insurance Group Inc 7,585 645Selective Insurance Group Inc 19,688 1,613ServisFirst Bancshares Inc 26,000 2,208Sierra Bancorp 36,085 980Starwood Property Trust Inc ‡ 310,592 7,547Stewart Information Services Corp 21,161 1,687Stifel Financial Corp 5,705 402SVB Financial Group, Cl B * 3,699 2,509Towne Bank/Portsmouth VA 64,456 2,036TPG RE Finance Trust Inc ‡ 58,414 720TriCo Bancshares 22,196 954UMH Properties ‡ 42,338 1,157Umpqua Holdings Corp 229,225 4,410United Fire Group Inc 57,059 1,323Univest Financial Corp 60,000 1,795Virtus Investment Partners Inc 4,899 1,455Waterstone Financial Inc 67,740 1,481
182,426Health Care — 10.3%
ABIOMED Inc * 967 347ACADIA Pharmaceuticals Inc * 33,435 780Aerie Pharmaceuticals Inc * 66,443 466Albireo Pharma Inc * 6,216 145AmerisourceBergen Corp, Cl A 4,713 626AMN Healthcare Services Inc * 37,327 4,566AnaptysBio Inc * 9,019 313Apollo Endosurgery * 204,136 1,721Arcutis Biotherapeutics * 16,936 351Arena Pharmaceuticals Inc * 15,000 1,394Ascendis Pharma ADR * 8,000 1,076AtriCure Inc * 14,000 973BioDelivery Sciences International Inc * 162,886 505Biohaven Pharmaceutical Holding Co Ltd * 10,301 1,420Bio-Techne Corp 3,600 1,862Blueprint Medicines Corp * 7,000 750Bruker Corp 6,000 503Catalent Inc * 16,500 2,113
Description SharesMarket Value
($ Thousands)
COMMON STOCK (continued)Charles River Laboratories International
Inc * 7,525 $ 2,835Chemed Corp 5,665 2,997Co-Diagnostics Inc *(A) 256,416 2,290Collegium Pharmaceutical Inc * 8,919 167Computer Programs and Systems Inc * 21,134 619CorVel Corp * 3,132 651Cross Country Healthcare Inc * 66,165 1,837Eagle Pharmaceuticals Inc/DE * 5,937 302Emergent BioSolutions Inc * 33,770 1,468Encompass Health Corp 19,928 1,301Ensign Group Inc/The 4,885 410Fate Therapeutics Inc * 11,655 682Global Blood Therapeutics Inc * 23,123 677Globus Medical Inc, Cl A * 14,804 1,069HealthStream Inc * 21,679 571Heska Corp * 167 30ICON PLC * 7,886 2,442ICU Medical Inc * 5,669 1,346IDEXX Laboratories Inc * 458 302Incyte Corp * 3,300 242Insmed Inc * 31,452 857Inspire Medical Systems Inc * 5,312 1,222Intellia Therapeutics Inc * 4,576 541iTeos Therapeutics Inc * 33,000 1,537Jazz Pharmaceuticals PLC * 5,000 637Karyopharm Therapeutics Inc * 174,871 1,124Kiniksa Pharmaceuticals Ltd, Cl A * 28,465 335LeMaitre Vascular Inc 467 23LHC Group Inc * 6,905 948Ligand Pharmaceuticals Inc * 28,582 4,415Masimo Corp * 3,863 1,131Medpace Holdings Inc * 12,087 2,631MeiraGTx Holdings plc * 11,243 267Merit Medical Systems Inc * 18,000 1,121Mettler-Toledo International Inc * 411 698ModivCare Inc * 4,264 632Molina Healthcare Inc * 5,750 1,829Myriad Genetics Inc * 53,393 1,474National HealthCare Corp 12,608 857Natus Medical Inc * 29,663 704Neogen Corp, Cl B * 8,052 366NeoGenomics Inc * 18,676 637Neurocrine Biosciences Inc * 10,038 855NextGen Healthcare Inc * 8,065 144Novocure Ltd * 2,480 186Omnicell Inc * 5,263 950OptimizeRx Corp * 12,618 784Option Care Health Inc * 42,714 1,215Ortho Clinical Diagnostics Holdings * 40,544 867Orthofix Medical Inc * 14,375 447Pacira BioSciences Inc * 44,489 2,677

SEI Institutional Managed Trust / Quarterly Report / December 31, 20214
SCHEDULE OF INVESTMENTS (Unaudited)December 31, 2021
Tax-Managed Small/Mid Cap Fund (Continued)
Description SharesMarket Value
($ Thousands)
COMMON STOCK (continued)Penumbra Inc * 1,427 $ 410PerkinElmer Inc 12,707 2,555Phibro Animal Health Corp, Cl A 32,589 665Premier Inc, Cl A 80,870 3,329Prestige Consumer Healthcare Inc, Cl A * 46,904 2,845Prothena Corp PLC * 24,889 1,230Puma Biotechnology Inc * 242,641 738Repligen Corp * 6,804 1,802Revance Therapeutics Inc * 82,213 1,342Shockwave Medical Inc * 6,948 1,239SIGA Technologies Inc * 10,625 80Supernus Pharmaceuticals Inc * 34,658 1,011Sutro Biopharma Inc * 14,443 215Syneos Health Inc, Cl A * 96,849 9,944Teleflex Inc 8,291 2,723Tenet Healthcare Corp * 13,477 1,101United Therapeutics Corp * 7,055 1,525Utah Medical Products Inc * 6,164 616Vir Biotechnology * 7,158 300Vocera Communications Inc * 7,298 473Xencor Inc * 5,719 229
108,632Industrials — 15.0%
A O Smith Corp 4,400 378ACCO Brands Corp 864,851 7,144Advanced Drainage Systems Inc 16,174 2,202AECOM 13,579 1,050Applied Industrial Technologies Inc, Cl A 12,000 1,232ArcBest Corp 17,512 2,099Armstrong World Industries Inc 25,821 2,998Atkore Inc * 40,352 4,487Atlas Air Worldwide Holdings Inc * 53,933 5,076Boise Cascade Co 4,228 301Builders FirstSource Inc * 23,370 2,003BWX Technologies Inc, Cl W 64,000 3,064Casella Waste Systems Inc, Cl A * 5,000 427CBIZ Inc * 2,449 96Cintas Corp 3,186 1,412Clean Harbors Inc * 7,022 701Colfax Corp * 192,422 8,846CoStar Group Inc * 44,460 3,514CRA International Inc 11,678 1,090CSW Industrials Inc 1,824 220Curtiss-Wright Corp 15,306 2,122EMCOR Group Inc 19,007 2,421Ennis Inc 34,657 677Evoqua Water Technologies Corp * 9,047 423Exponent Inc 30,000 3,502Forrester Research Inc * 9,468 556Franklin Covey Co * 1,977 92Franklin Electric Co Inc 10,000 946
Description SharesMarket Value
($ Thousands)
COMMON STOCK (continued)FTI Consulting Inc * 10,890 $ 1,671GMS Inc * 5,209 313Gorman-Rupp Co/The 8,693 387GXO Logistics Inc * 78,605 7,140Helios Technologies Inc 11,524 1,212Heritage-Crystal Clean Inc * 29,302 938Hillenbrand Inc 8,146 424Hub Group Inc, Cl A * 12,964 1,092IAA Inc * 84,934 4,299ICF International Inc, Cl A 4,655 477IDEX Corp 4,000 945JetBlue Airways Corp * 289,186 4,118Kadant Inc 16,160 3,725Kaman Corp, Cl A 59,436 2,565KAR Auction Services Inc * 294,197 4,595Kforce Inc 10,057 757L3Harris Technologies Inc 2,036 434Landstar System Inc 8,600 1,540ManTech International Corp/VA, Cl A 12,947 944Masonite International Corp * 37,876 4,467Matson Inc 26,632 2,398Matthews International Corp, Cl A 51,225 1,878Meritor Inc * 39,622 982MSA Safety Inc 10,698 1,615MSC Industrial Direct Co Inc, Cl A 3,679 309MYR Group Inc * 22,025 2,435NN Inc, Cl A * 364,393 1,494Old Dominion Freight Line Inc, Cl A 9,957 3,568Park Aerospace Corp 17,195 227Radiant Logistics Inc * 49,017 357RBC Bearings Inc * 4,000 808Regal Beloit 4,682 797Resources Connection Inc 21,841 390Rush Enterprises Inc, Cl A 38,922 2,166Saia Inc * 7,000 2,359Schneider National Inc, Cl B 13,231 356Science Applications International Corp 10,962 916Shyft Group Inc/The 28,592 1,405Simpson Manufacturing Co Inc 8,867 1,233SiteOne Landscape Supply Inc * 1,533 371SPX FLOW Inc 19,418 1,679Standex International Corp 5,842 646Tetra Tech Inc 27,739 4,710Textainer Group Holdings Ltd 56,064 2,002Toro Co/The 2,800 280Trinity Industries Inc 142,479 4,303TrueBlue Inc * 35,900 993UFP Industries Inc 9,396 865United Rentals Inc * 4,375 1,454Vicor Corp * 8,907 1,131Werner Enterprises Inc 29,446 1,403WESCO International Inc * 59,000 7,764

5SEI Institutional Managed Trust / Quarterly Report / December 31, 2021
SCHEDULE OF INVESTMENTS (Unaudited)December 31, 2021
Tax-Managed Small/Mid Cap Fund (Continued)
Description SharesMarket Value
($ Thousands)
COMMON STOCK (continued)Westinghouse Air Brake Technologies Corp 3,600 $ 332XPO Logistics Inc * 71,612 5,545Zurn Water Solutions 21,000 764
161,057Information Technology — 19.1%
A10 Networks Inc 136,224 2,259ACI Worldwide Inc * 348,764 12,102Agilysys Inc * 13,470 599Alliance Data Systems Corp 90,352 6,015Alpha & Omega Semiconductor Ltd * 39,527 2,394Ambarella Inc * 3,720 755Amdocs Ltd 14,000 1,048American Software Inc/GA, Cl A 30,440 797Amkor Technology Inc 50,512 1,252ANSYS Inc * 2,600 1,043Arista Networks Inc * 9,952 1,431Arrow Electronics Inc, Cl A * 5,000 671Aspen Technology Inc * 25,476 3,877Avid Technology Inc * 29,838 972Axcelis Technologies Inc * 22,971 1,713Belden Inc 21,158 1,391Broadridge Financial Solutions Inc 1,700 311Cadence Design Systems Inc * 12,100 2,255Calix Inc * 48,212 3,855Cass Information Systems Inc 9,000 354ChannelAdvisor Corp * 51,607 1,274CommVault Systems Inc * 26,733 1,842Conduent Inc * 11,295 60Consensus Cloud Solutions * 40,554 2,347CoreCard * 358 14CSG Systems International Inc 16,561 954Diodes Inc * 15,000 1,647Entegris Inc 17,353 2,405EPAM Systems Inc * 5,310 3,549ePlus Inc * 7,714 416Euronet Worldwide Inc * 49,026 5,842EVERTEC Inc 63,730 3,185ExlService Holdings Inc * 24,383 3,530Extreme Networks Inc * 128,668 2,020F5 Inc, Cl A * 5,000 1,224Fabrinet * 5,000 592Fair Isaac Corp * 2,500 1,084Gartner Inc * 1,518 507Genpact Ltd 30,604 1,625Global Payments Inc 1,009 136Globant SA * 4,500 1,413GreenSky Inc, Cl A * 106,507 1,210Hackett Group Inc/The 37,239 764Ichor Holdings Ltd * 16,589 764II-VI Inc * 15,210 1,039Information Services Group Inc 152,310 1,161
Description SharesMarket Value
($ Thousands)
COMMON STOCK (continued)Insight Enterprises Inc * 21,641 $ 2,307International Money Express Inc * 1,250 20Lattice Semiconductor Corp * 37,782 2,911Lumentum Holdings Inc * 21,910 2,317MACOM Technology Solutions Holdings
Inc * 12,485 978Manhattan Associates Inc * 10,280 1,598MAXIMUS Inc 35,530 2,831MaxLinear, Cl A * 10,848 818MicroStrategy Inc, Cl A * 726 395Model N Inc * 21,638 650Monolithic Power Systems Inc 6,335 3,125NCR Corp * 26,596 1,069Nuance Communications Inc * 17,654 977NVE Corp 9,565 653ON Semiconductor Corp * 106,610 7,241Onto Innovation Inc * 10,000 1,012OSI Systems Inc * 184 17Palo Alto Networks Inc * 786 438Perficient Inc * 12,505 1,617Photronics Inc * 204,266 3,850Power Integrations Inc 20,000 1,858Progress Software Corp 5,788 279PTC Inc * 19,109 2,315Qualys Inc * 14,326 1,966Rackspace Technology Inc * 114,991 1,549Radware Ltd * 26,112 1,087Rambus Inc * 12,784 376RingCentral Inc, Cl A * 773 145ScanSource Inc * 11,599 407Semtech Corp * 69,289 6,162Shutterstock Inc 21,003 2,329Silicon Motion Technology Corp ADR 212,305 20,175SiTime Corp * 5,000 1,463SolarWinds Corp * 372 5SPS Commerce Inc * 16,563 2,358Super Micro Computer Inc * 174,172 7,655Synaptics Inc * 4,000 1,158Synopsys Inc * 5,999 2,211Teledyne Technologies Inc * 16,712 7,301Tenable Holdings Inc * 29,500 1,625Teradyne Inc 11,312 1,850Trade Desk Inc/The, Cl A * 18,960 1,737TTEC Holdings Inc 31,473 2,850Tucows Inc, Cl A * 1,294 108Tyler Technologies Inc * 4,508 2,425Usio * 222,441 970Verint Systems Inc * 112,718 5,919Vishay Intertechnology Inc 40,164 878Wix.com Ltd * 15,023 2,371

SEI Institutional Managed Trust / Quarterly Report / December 31, 20216
SCHEDULE OF INVESTMENTS (Unaudited)December 31, 2021
Tax-Managed Small/Mid Cap Fund (Continued)
Description SharesMarket Value
($ Thousands)
COMMON STOCK (continued)WNS Holdings Ltd ADR * 26,370 $ 2,326
204,380Materials — 6.4%
Albemarle Corp 4,500 1,052Ashland Global Holdings Inc 55,852 6,013Avery Dennison Corp 2,472 535Avient Corp 22,000 1,231Axalta Coating Systems Ltd * 164,272 5,441B2Gold Corp 128,103 503Balchem Corp 20,761 3,500Century Aluminum Co * 184,374 3,053Chase 16,995 1,692Commercial Metals Co, Cl A 248,063 9,002Crown Holdings Inc 4,800 531FMC Corp 89,883 9,877Fortitude Gold Corp 40,846 270Hawkins Inc 12,136 479Hecla Mining Co 35,348 185Ingevity Corp * 36,000 2,581Louisiana-Pacific Corp 15,859 1,243Materion Corp 9,421 866NewMarket Corp 5,572 1,910Novagold Resources Inc * 94,000 645Packaging Corp of America 2,600 354Ramaco Resources 93,658 1,274Resolute Forest Products Inc * 84,330 1,288Royal Gold Inc, Cl A 8,757 921Silgan Holdings Inc 270,689 11,596Stepan Co 9,000 1,119TriMas Corp 23,190 858
68,019Real Estate — 6.5%
Acadia Realty Trust ‡ 70,589 1,541Armada Hoffler Properties Inc ‡ 4,176 64Camden Property Trust ‡ 13,101 2,341CatchMark Timber Trust Inc, Cl A ‡ 84,268 734Centerspace ‡ 15,417 1,710City Office REIT Inc ‡ 17,779 351Community Healthcare Trust Inc ‡ 384 18CorePoint Lodging *‡ 35,250 553CubeSmart ‡ 15,004 854Douglas Elliman *‡ 43,849 504EastGroup Properties Inc ‡ 14,800 3,372Equity LifeStyle Properties ‡ 20,564 1,803First Industrial Realty Trust Inc ‡ 24,000 1,589FRP Holdings Inc * 4,575 264Gaming and Leisure Properties Inc ‡ 167,435 8,147Getty Realty Corp ‡ 28,351 910Gladstone Commercial Corp ‡ 33,797 871Howard Hughes Corp/The *‡ 55,490 5,648Independence Realty Trust ‡ 113,415 2,930
Description SharesMarket Value
($ Thousands)
COMMON STOCK (continued)Invitation Homes Inc ‡ 32,569 $ 1,477Kennedy-Wilson Holdings Inc ‡ 67,500 1,612Kite Realty Group Trust ‡ 45,076 982Life Storage Inc ‡ 4,650 712Medical Properties Trust Inc ‡ 410,854 9,708Monmouth Real Estate Investment Corp,
Cl A ‡ 33,371 701National Storage Affiliates Trust ‡ 25,689 1,778Newmark Group Inc, Cl A ‡ 522,268 9,766Outfront Media Inc ‡ 49,774 1,335PS Business Parks Inc ‡ 6,125 1,128RMR Group Inc/The, Cl A ‡ 23,159 803RPT Realty ‡ 148,901 1,992Saul Centers Inc ‡ 24,768 1,313Sun Communities Inc ‡ 1,653 347Terreno Realty Corp ‡ 15,348 1,309Urstadt Biddle Properties Inc, Cl A ‡ 3,115 66Ventas Inc ‡ 7,436 380
69,613Utilities — 1.9%
American States Water Co 6,000 621Artesian Resources Corp, Cl A 30,081 1,394Brookfield Infrastructure, Cl A 8,000 546Brookfield Renewable Corp, Cl A 18,000 663California Water Service Group, Cl A 2,471 178Chesapeake Utilities Corp 6,037 880Hawaiian Electric Industries Inc 21,153 878IDACORP Inc, Cl A 10,909 1,236MDU Resources Group Inc 14,335 442MGE Energy Inc 21,134 1,738Middlesex Water Co 22,660 2,726NiSource Inc 15,000 414Northwest Natural Holding Co 1,724 84NorthWestern Corp 5,270 301Otter Tail Corp 29,000 2,071Portland General Electric Co 43,378 2,296SJW Group 8,500 622Spire Inc 16,000 1,043UGI Corp 6,450 296Unitil Corp 11,188 515York Water Co/The 18,850 938
19,882
Total Common Stock
(Cost $578,392) ($ Thousands) 1,054,352

7SEI Institutional Managed Trust / Quarterly Report / December 31, 2021
SCHEDULE OF INVESTMENTS (Unaudited)December 31, 2021
Tax-Managed Small/Mid Cap Fund (Concluded)
Description SharesMarket Value
($ Thousands)
AFFILIATED PARTNERSHIP — 0.5%SEI Liquidity Fund, L.P.
0.020% **†(C) 5,154,988 $ 5,163
Total Affiliated Partnership (Cost $5,155) ($ Thousands) 5,163
CASH EQUIVALENT — 1.5%SEI Daily Income Trust, Government
Fund, Cl F0.010%**† 16,109,322 16,109
Total Cash Equivalent(Cost $16,109) ($ Thousands) 16,109
Total Investments in Securities — 100.6%(Cost $599,656) ($ Thousands) $ 1,075,624
Percentages are based on Net Assets of $1,069,592 ($ Thousands).* Non-income producing security.** The rate reported is the 7-day effective yield as of December 31, 2021.† Investment in Affiliated Security.‡ Real Estate Investment Trust.
(A) Certain securities or partial positions of certain securities are on loan at December 31, 2021. The total market value of securities on loan at December 31, 2021 was $4,604 ($ Thousands).
(B) Security is a Master Limited Partnership. At December 31, 2021, such securities amounted to $6,200 ($ Thousands), or 0.6% of the Net Assets of the Fund.
(C) This security was purchased with cash collateral held from securities on loan. The total market value of such securities as of December 31, 2021 was $5,163 ($ Thousands).
ADR — American Depositary ReceiptCl — ClassL.P. — Limited PartnershipLtd. — LimitedPLC — Public Limited CompanyREIT — Real Estate investment Trust
The following is a list of the levels of inputs used as of December 31, 2021 in valuing the Fund’s investments and other financial instruments carried at value ($ Thousands):
Investments in SecuritiesLevel 1
($)Level 2
($)Level 3
($)Total
($)Common Stock 1,054,352 – – 1,054,352Affiliated Partnership – 5,163 – 5,163Cash Equivalent 16,109 – – 16,109
Total Investments in Securities 1,070,461 5,163 – 1,075,624
For the period ended December 31, 2021, there were no transfers in or out of Level 3.
For information regarding the Fund's policy regarding valuation of investments and other significant accounting policies, please refer to the Fund's most recent semi-annual and annual financial statements.
The following is a summary of the transactions with affiliates for the period ended December 31, 2021 ($ Thousands):
Security Description Value 9/30/2021 Purchases at Cost Proceeds from
Sales Realized Gain/
(Loss)
Change in Unrealized
Appreciation/(Depreciation)
Value 12/31/2021 Shares Income Capital Gains
SEI Liquidity Fund, L.P. $ 8,126 $ 9,519 $ (12,482) $ — $ — $ 5,163 5,154,988 $ 7 $ — SEI Daily Income Trust, Government Fund, Cl F 14,569 47,005 (45,465) — — 16,109 16,109,322 1 — Totals $ 22,695 $ 56,524 $ (57,947) $ — $ — $ 21,272 $ 8 $ —
Amounts designated as “—” are $0 or have been rounded to $0.

1SEI Institutional Managed Trust / Quarterly Report / December 31, 2021
SCHEDULE OF INVESTMENTS (Unaudited)December 31, 2021
Mid-Cap Fund
i
Description SharesMarket Value
($ Thousands)
COMMON STOCK — 98.0%
Communication Services — 2.4%Altice USA Inc, Cl A * 6,680 $ 108Liberty Media Corp-Liberty SiriusXM * 2,651 135News Corp, Cl A 7,561 169News Corp, Cl B 7,090 159Nexstar Media Group Inc, Cl A 1,492 225Pinterest Inc, Cl A * 4,685 170Playtika Holding Corp * 3,995 69Roku Inc, Cl A * 673 154Spotify Technology SA * 644 151Take-Two Interactive Software Inc, Cl A * 3,269 581Twitter Inc * 4,049 175
2,096Consumer Discretionary — 13.6%
Advance Auto Parts Inc 754 181AutoNation Inc * 3,564 416AutoZone Inc * 441 925Bath & Body Works Inc 3,760 262Best Buy Co Inc 1,403 143BorgWarner Inc 5,656 255Boyd Gaming Corp * 3,304 217Caesars Entertainment Inc * 1,642 154Capri Holdings Ltd * 3,200 208Carter's Inc 3,593 364Carvana Co, Cl A * 338 78Chipotle Mexican Grill Inc, Cl A * 114 199Columbia Sportswear Co 2,198 214Dick's Sporting Goods Inc 2,357 271Dollar Tree Inc * 3,162 444Domino's Pizza Inc 756 427DoorDash Inc, Cl A * 769 115DR Horton Inc 3,706 402Foot Locker Inc, Cl A 3,515 153Frontdoor Inc * 4,496 165Harley-Davidson Inc, Cl A 4,644 175Hasbro Inc 2,475 252Kohl's Corp 2,328 115Lennar Corp, Cl A 1,570 182Lennar Corp, Cl B 715 68Leslie's Inc * 4,460 106LKQ Corp 10,330 620Lululemon Athletica Inc * 1,171 458Mattel Inc * 3,560 77Norwegian Cruise Line Holdings Ltd * 4,643 96NVR Inc * 99 585O'Reilly Automotive Inc * 629 444Penn National Gaming Inc * 1,841 96Penske Automotive Group Inc, Cl A 1,918 206Pool Corp 1,157 655PVH Corp 2,059 220
Description SharesMarket Value
($ Thousands)
COMMON STOCK (continued)Qurate Retail Inc * 11,737 $ 89RH * 422 226Tapestry Inc 6,897 280Tempur Sealy International Inc 2,199 103Tractor Supply Co 844 201Ulta Beauty Inc * 397 164Victoria's Secret & Co * 1,833 102Wayfair Inc, Cl A * 639 121Williams-Sonoma Inc 881 149Wynn Resorts Ltd * 1,581 134Yum! Brands Inc 3,495 485
12,002Consumer Staples — 3.2%
Church & Dwight Co Inc 2,752 282Constellation Brands Inc, Cl A 982 247Darling Ingredients Inc * 5,144 356Hain Celestial Group Inc/The * 3,246 138Hershey Co/The 1,971 381Ingredion Inc 3,831 370Kellogg Co 2,033 131Lamb Weston Holdings Inc 3,054 194TreeHouse Foods Inc * 5,957 242Tyson Foods Inc, Cl A 5,740 500
2,841Energy — 4.9%
Baker Hughes Co, Cl A 3,662 88ChampionX Corp * 7,703 156Coterra Energy Inc 49,232 935Diamondback Energy Inc, Cl A 2,651 286DT Midstream Inc 4,995 240Halliburton Co 4,907 112Hess Corp 1,782 132HollyFrontier Corp 7,875 258Marathon Petroleum Corp 6,555 419ONEOK Inc 1,075 63Phillips 66 1,345 98Pioneer Natural Resources Co 3,191 580Targa Resources Corp 7,616 398Valero Energy Corp 7,187 540
4,305Financials — 15.9%
Affiliated Managers Group Inc 568 94Ally Financial Inc 7,981 380American International Group Inc 4,674 266Ameriprise Financial Inc 1,385 418Apollo Global Management Inc, Cl A 1,786 129Arch Capital Group Ltd * 16,610 739Cboe Global Markets Inc 2,474 323Chimera Investment Corp ‡ 17,587 265Citizens Financial Group Inc 2,820 133
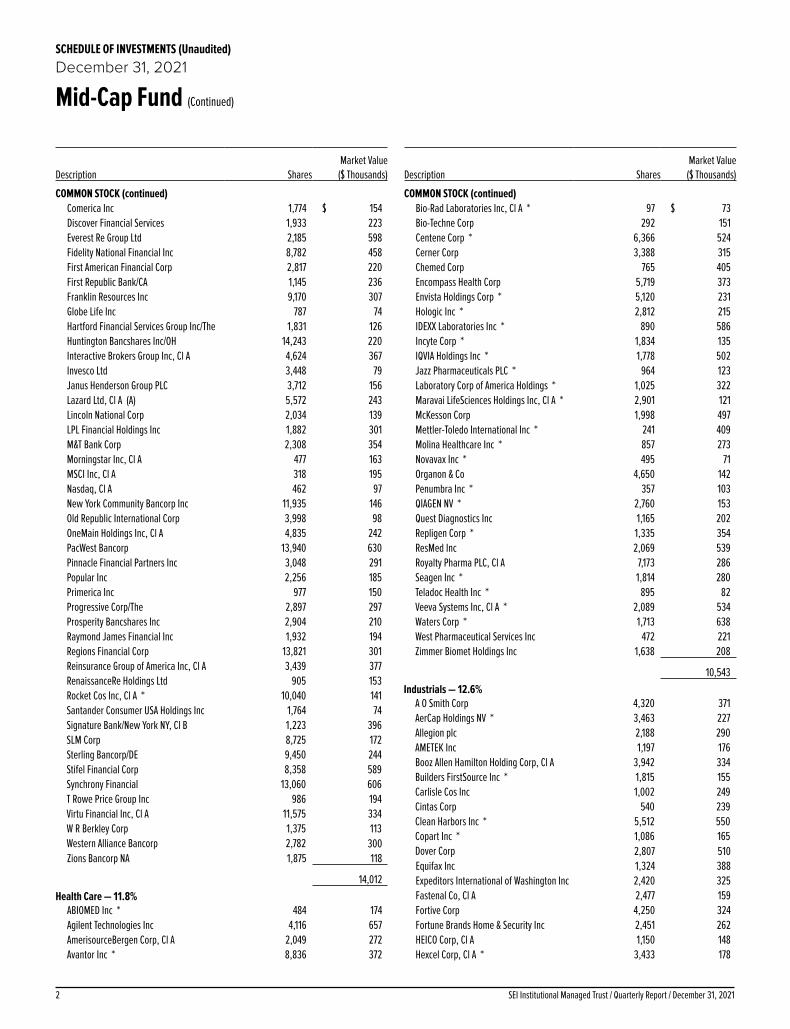
SEI Institutional Managed Trust / Quarterly Report / December 31, 20212
SCHEDULE OF INVESTMENTS (Unaudited)December 31, 2021
Mid-Cap Fund (Continued)
Description SharesMarket Value
($ Thousands)
COMMON STOCK (continued)Comerica Inc 1,774 $ 154Discover Financial Services 1,933 223Everest Re Group Ltd 2,185 598Fidelity National Financial Inc 8,782 458First American Financial Corp 2,817 220First Republic Bank/CA 1,145 236Franklin Resources Inc 9,170 307Globe Life Inc 787 74Hartford Financial Services Group Inc/The 1,831 126Huntington Bancshares Inc/OH 14,243 220Interactive Brokers Group Inc, Cl A 4,624 367Invesco Ltd 3,448 79Janus Henderson Group PLC 3,712 156Lazard Ltd, Cl A (A) 5,572 243Lincoln National Corp 2,034 139LPL Financial Holdings Inc 1,882 301M&T Bank Corp 2,308 354Morningstar Inc, Cl A 477 163MSCI Inc, Cl A 318 195Nasdaq, Cl A 462 97New York Community Bancorp Inc 11,935 146Old Republic International Corp 3,998 98OneMain Holdings Inc, Cl A 4,835 242PacWest Bancorp 13,940 630Pinnacle Financial Partners Inc 3,048 291Popular Inc 2,256 185Primerica Inc 977 150Progressive Corp/The 2,897 297Prosperity Bancshares Inc 2,904 210Raymond James Financial Inc 1,932 194Regions Financial Corp 13,821 301Reinsurance Group of America Inc, Cl A 3,439 377RenaissanceRe Holdings Ltd 905 153Rocket Cos Inc, Cl A * 10,040 141Santander Consumer USA Holdings Inc 1,764 74Signature Bank/New York NY, Cl B 1,223 396SLM Corp 8,725 172Sterling Bancorp/DE 9,450 244Stifel Financial Corp 8,358 589Synchrony Financial 13,060 606T Rowe Price Group Inc 986 194Virtu Financial Inc, Cl A 11,575 334W R Berkley Corp 1,375 113Western Alliance Bancorp 2,782 300Zions Bancorp NA 1,875 118
14,012Health Care — 11.8%
ABIOMED Inc * 484 174Agilent Technologies Inc 4,116 657AmerisourceBergen Corp, Cl A 2,049 272Avantor Inc * 8,836 372
Description SharesMarket Value
($ Thousands)
COMMON STOCK (continued)Bio-Rad Laboratories Inc, Cl A * 97 $ 73Bio-Techne Corp 292 151Centene Corp * 6,366 524Cerner Corp 3,388 315Chemed Corp 765 405Encompass Health Corp 5,719 373Envista Holdings Corp * 5,120 231Hologic Inc * 2,812 215IDEXX Laboratories Inc * 890 586Incyte Corp * 1,834 135IQVIA Holdings Inc * 1,778 502Jazz Pharmaceuticals PLC * 964 123Laboratory Corp of America Holdings * 1,025 322Maravai LifeSciences Holdings Inc, Cl A * 2,901 121McKesson Corp 1,998 497Mettler-Toledo International Inc * 241 409Molina Healthcare Inc * 857 273Novavax Inc * 495 71Organon & Co 4,650 142Penumbra Inc * 357 103QIAGEN NV * 2,760 153Quest Diagnostics Inc 1,165 202Repligen Corp * 1,335 354ResMed Inc 2,069 539Royalty Pharma PLC, Cl A 7,173 286Seagen Inc * 1,814 280Teladoc Health Inc * 895 82Veeva Systems Inc, Cl A * 2,089 534Waters Corp * 1,713 638West Pharmaceutical Services Inc 472 221Zimmer Biomet Holdings Inc 1,638 208
10,543Industrials — 12.6%
A O Smith Corp 4,320 371AerCap Holdings NV * 3,463 227Allegion plc 2,188 290AMETEK Inc 1,197 176Booz Allen Hamilton Holding Corp, Cl A 3,942 334Builders FirstSource Inc * 1,815 155Carlisle Cos Inc 1,002 249Cintas Corp 540 239Clean Harbors Inc * 5,512 550Copart Inc * 1,086 165Dover Corp 2,807 510Equifax Inc 1,324 388Expeditors International of Washington Inc 2,420 325Fastenal Co, Cl A 2,477 159Fortive Corp 4,250 324Fortune Brands Home & Security Inc 2,451 262HEICO Corp, Cl A 1,150 148Hexcel Corp, Cl A * 3,433 178
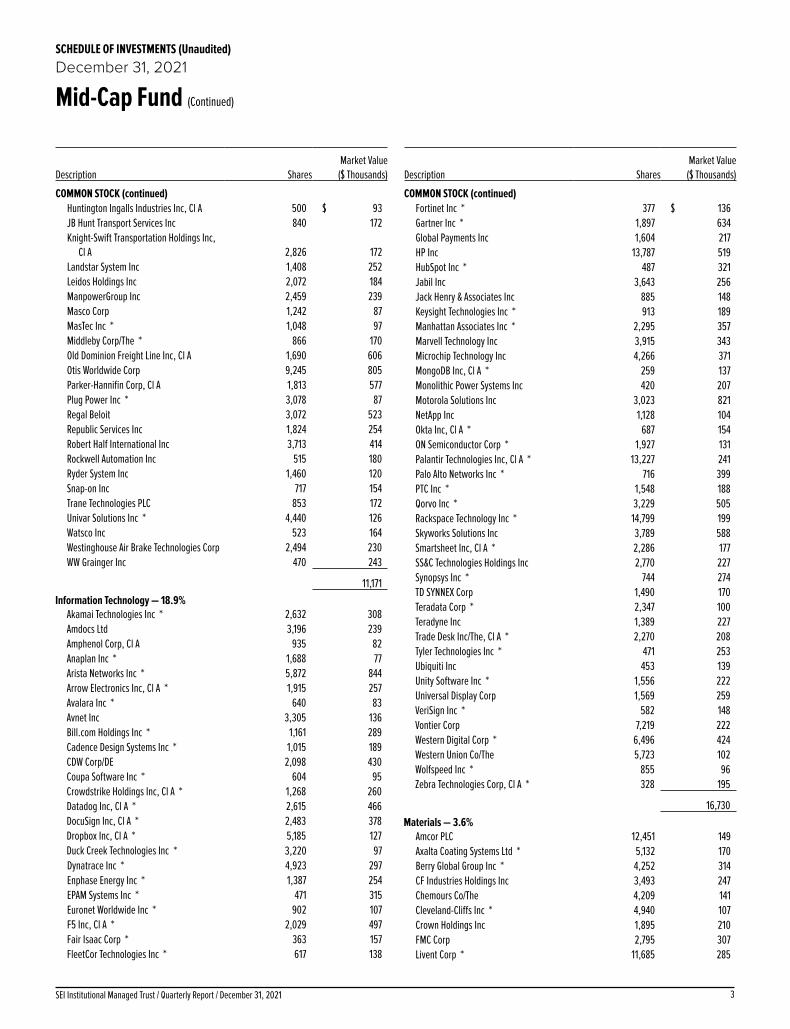
3SEI Institutional Managed Trust / Quarterly Report / December 31, 2021
SCHEDULE OF INVESTMENTS (Unaudited)December 31, 2021
Mid-Cap Fund (Continued)
Description SharesMarket Value
($ Thousands)
COMMON STOCK (continued)Huntington Ingalls Industries Inc, Cl A 500 $ 93JB Hunt Transport Services Inc 840 172Knight-Swift Transportation Holdings Inc,
Cl A 2,826 172Landstar System Inc 1,408 252Leidos Holdings Inc 2,072 184ManpowerGroup Inc 2,459 239Masco Corp 1,242 87MasTec Inc * 1,048 97Middleby Corp/The * 866 170Old Dominion Freight Line Inc, Cl A 1,690 606Otis Worldwide Corp 9,245 805Parker-Hannifin Corp, Cl A 1,813 577Plug Power Inc * 3,078 87Regal Beloit 3,072 523Republic Services Inc 1,824 254Robert Half International Inc 3,713 414Rockwell Automation Inc 515 180Ryder System Inc 1,460 120Snap-on Inc 717 154Trane Technologies PLC 853 172Univar Solutions Inc * 4,440 126Watsco Inc 523 164Westinghouse Air Brake Technologies Corp 2,494 230WW Grainger Inc 470 243
11,171Information Technology — 18.9%
Akamai Technologies Inc * 2,632 308Amdocs Ltd 3,196 239Amphenol Corp, Cl A 935 82Anaplan Inc * 1,688 77Arista Networks Inc * 5,872 844Arrow Electronics Inc, Cl A * 1,915 257Avalara Inc * 640 83Avnet Inc 3,305 136Bill.com Holdings Inc * 1,161 289Cadence Design Systems Inc * 1,015 189CDW Corp/DE 2,098 430Coupa Software Inc * 604 95Crowdstrike Holdings Inc, Cl A * 1,268 260Datadog Inc, Cl A * 2,615 466DocuSign Inc, Cl A * 2,483 378Dropbox Inc, Cl A * 5,185 127Duck Creek Technologies Inc * 3,220 97Dynatrace Inc * 4,923 297Enphase Energy Inc * 1,387 254EPAM Systems Inc * 471 315Euronet Worldwide Inc * 902 107F5 Inc, Cl A * 2,029 497Fair Isaac Corp * 363 157FleetCor Technologies Inc * 617 138
Description SharesMarket Value
($ Thousands)
COMMON STOCK (continued)Fortinet Inc * 377 $ 136Gartner Inc * 1,897 634Global Payments Inc 1,604 217HP Inc 13,787 519HubSpot Inc * 487 321Jabil Inc 3,643 256Jack Henry & Associates Inc 885 148Keysight Technologies Inc * 913 189Manhattan Associates Inc * 2,295 357Marvell Technology Inc 3,915 343Microchip Technology Inc 4,266 371MongoDB Inc, Cl A * 259 137Monolithic Power Systems Inc 420 207Motorola Solutions Inc 3,023 821NetApp Inc 1,128 104Okta Inc, Cl A * 687 154ON Semiconductor Corp * 1,927 131Palantir Technologies Inc, Cl A * 13,227 241Palo Alto Networks Inc * 716 399PTC Inc * 1,548 188Qorvo Inc * 3,229 505Rackspace Technology Inc * 14,799 199Skyworks Solutions Inc 3,789 588Smartsheet Inc, Cl A * 2,286 177SS&C Technologies Holdings Inc 2,770 227Synopsys Inc * 744 274TD SYNNEX Corp 1,490 170Teradata Corp * 2,347 100Teradyne Inc 1,389 227Trade Desk Inc/The, Cl A * 2,270 208Tyler Technologies Inc * 471 253Ubiquiti Inc 453 139Unity Software Inc * 1,556 222Universal Display Corp 1,569 259VeriSign Inc * 582 148Vontier Corp 7,219 222Western Digital Corp * 6,496 424Western Union Co/The 5,723 102Wolfspeed Inc * 855 96Zebra Technologies Corp, Cl A * 328 195
16,730Materials — 3.6%
Amcor PLC 12,451 149Axalta Coating Systems Ltd * 5,132 170Berry Global Group Inc * 4,252 314CF Industries Holdings Inc 3,493 247Chemours Co/The 4,209 141Cleveland-Cliffs Inc * 4,940 107Crown Holdings Inc 1,895 210FMC Corp 2,795 307Livent Corp * 11,685 285
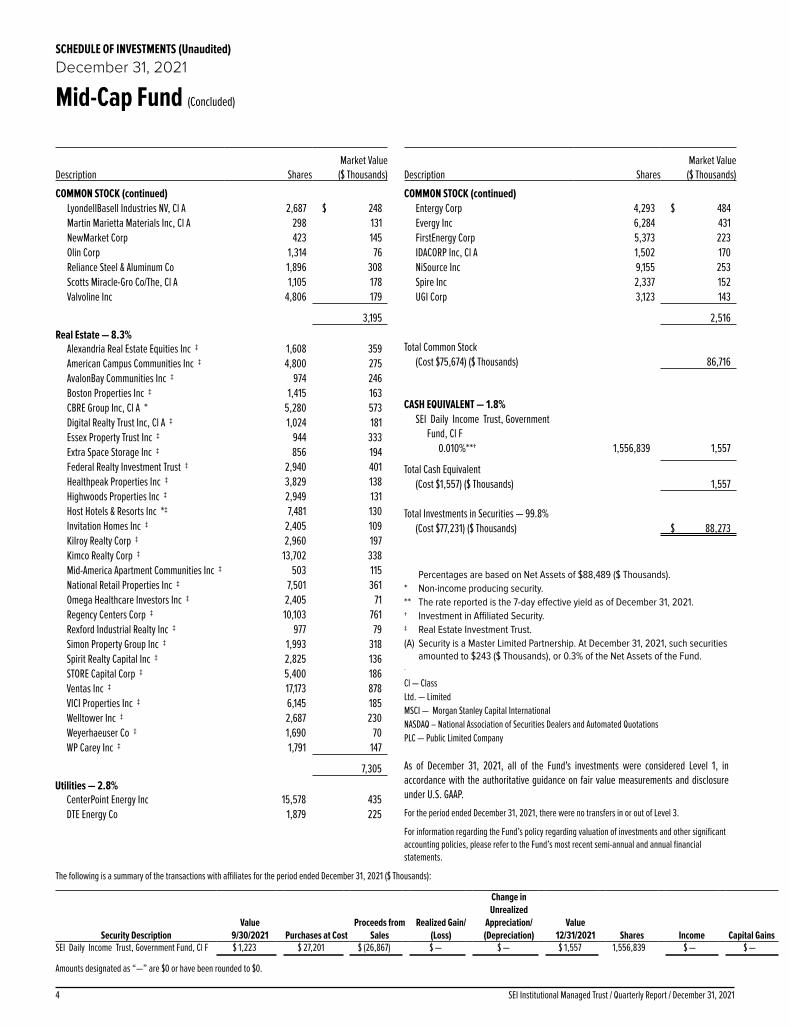
SEI Institutional Managed Trust / Quarterly Report / December 31, 20214
SCHEDULE OF INVESTMENTS (Unaudited)December 31, 2021
Mid-Cap Fund (Concluded)
Description SharesMarket Value
($ Thousands)
COMMON STOCK (continued)LyondellBasell Industries NV, Cl A 2,687 $ 248Martin Marietta Materials Inc, Cl A 298 131NewMarket Corp 423 145Olin Corp 1,314 76Reliance Steel & Aluminum Co 1,896 308Scotts Miracle-Gro Co/The, Cl A 1,105 178Valvoline Inc 4,806 179
3,195Real Estate — 8.3%
Alexandria Real Estate Equities Inc ‡ 1,608 359American Campus Communities Inc ‡ 4,800 275AvalonBay Communities Inc ‡ 974 246Boston Properties Inc ‡ 1,415 163CBRE Group Inc, Cl A * 5,280 573Digital Realty Trust Inc, Cl A ‡ 1,024 181Essex Property Trust Inc ‡ 944 333Extra Space Storage Inc ‡ 856 194Federal Realty Investment Trust ‡ 2,940 401Healthpeak Properties Inc ‡ 3,829 138Highwoods Properties Inc ‡ 2,949 131Host Hotels & Resorts Inc *‡ 7,481 130Invitation Homes Inc ‡ 2,405 109Kilroy Realty Corp ‡ 2,960 197Kimco Realty Corp ‡ 13,702 338Mid-America Apartment Communities Inc ‡ 503 115National Retail Properties Inc ‡ 7,501 361Omega Healthcare Investors Inc ‡ 2,405 71Regency Centers Corp ‡ 10,103 761Rexford Industrial Realty Inc ‡ 977 79Simon Property Group Inc ‡ 1,993 318Spirit Realty Capital Inc ‡ 2,825 136STORE Capital Corp ‡ 5,400 186Ventas Inc ‡ 17,173 878VICI Properties Inc ‡ 6,145 185Welltower Inc ‡ 2,687 230Weyerhaeuser Co ‡ 1,690 70WP Carey Inc ‡ 1,791 147
7,305Utilities — 2.8%
CenterPoint Energy Inc 15,578 435DTE Energy Co 1,879 225
Description SharesMarket Value
($ Thousands)
COMMON STOCK (continued)Entergy Corp 4,293 $ 484Evergy Inc 6,284 431FirstEnergy Corp 5,373 223IDACORP Inc, Cl A 1,502 170NiSource Inc 9,155 253Spire Inc 2,337 152UGI Corp 3,123 143
2,516
Total Common Stock
(Cost $75,674) ($ Thousands) 86,716
CASH EQUIVALENT — 1.8%SEI Daily Income Trust, Government
Fund, Cl F0.010%**† 1,556,839 1,557
Total Cash Equivalent(Cost $1,557) ($ Thousands) 1,557
Total Investments in Securities — 99.8%(Cost $77,231) ($ Thousands) $ 88,273
Percentages are based on Net Assets of $88,489 ($ Thousands).* Non-income producing security.** The rate reported is the 7-day effective yield as of December 31, 2021.† Investment in Affiliated Security.‡ Real Estate Investment Trust.(A) Security is a Master Limited Partnership. At December 31, 2021, such securities
amounted to $243 ($ Thousands), or 0.3% of the Net Assets of the Fund.68
Cl — ClassLtd. — LimitedMSCI — Morgan Stanley Capital InternationalNASDAQ – National Association of Securities Dealers and Automated QuotationsPLC — Public Limited Company
As of December 31, 2021, all of the Fund's investments were considered Level 1, in accordance with the authoritative guidance on fair value measurements and disclosure under U.S. GAAP.
For the period ended December 31, 2021, there were no transfers in or out of Level 3.
For information regarding the Fund’s policy regarding valuation of investments and other significant accounting policies, please refer to the Fund’s most recent semi-annual and annual financial statements.
The following is a summary of the transactions with affiliates for the period ended December 31, 2021 ($ Thousands):
Security Description Value
9/30/2021 Purchases at Cost Proceeds from
Sales Realized Gain/
(Loss)
Change in Unrealized
Appreciation/(Depreciation)
Value12/31/2021 Shares Income Capital Gains
SEI Daily Income Trust, Government Fund, Cl F $ 1,223 $ 27,201 $ (26,867) $ — $ — $ 1,557 1,556,839 $ — $ —
Amounts designated as “—” are $0 or have been rounded to $0.
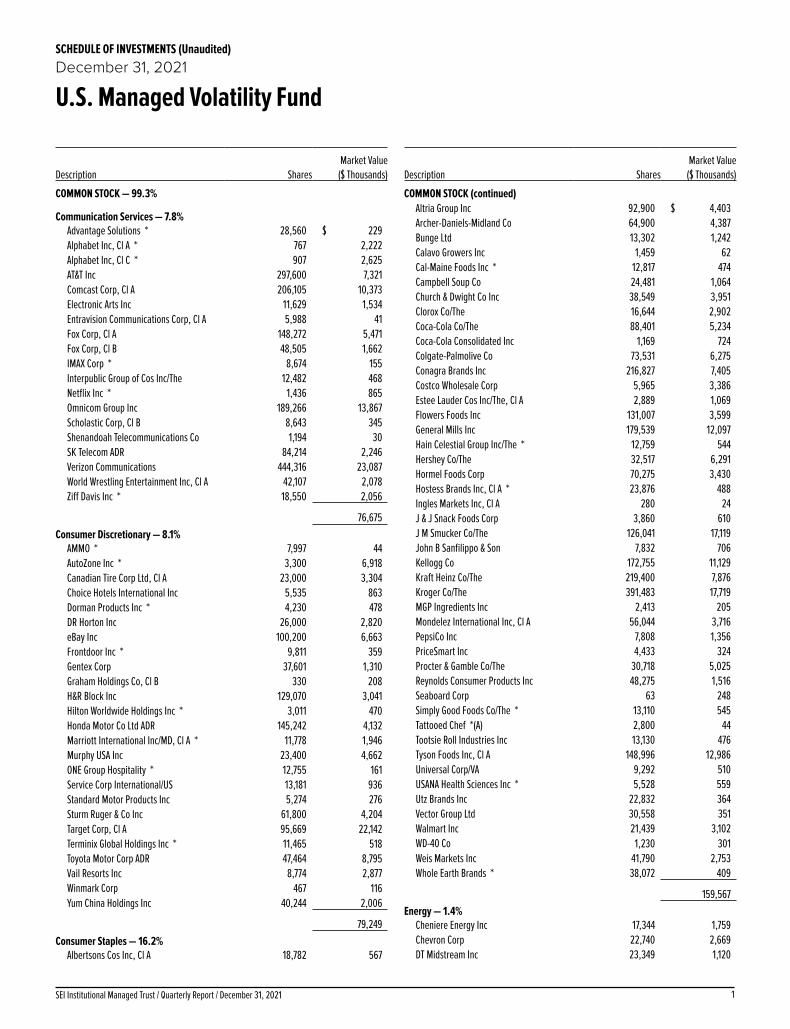
1SEI Institutional Managed Trust / Quarterly Report / December 31, 2021
SCHEDULE OF INVESTMENTS (Unaudited)December 31, 2021
U.S. Managed Volatility Fund
Description SharesMarket Value
($ Thousands)
COMMON STOCK — 99.3%
Communication Services — 7.8%Advantage Solutions * 28,560 $ 229Alphabet Inc, Cl A * 767 2,222Alphabet Inc, Cl C * 907 2,625AT&T Inc 297,600 7,321Comcast Corp, Cl A 206,105 10,373Electronic Arts Inc 11,629 1,534Entravision Communications Corp, Cl A 5,988 41Fox Corp, Cl A 148,272 5,471Fox Corp, Cl B 48,505 1,662IMAX Corp * 8,674 155Interpublic Group of Cos Inc/The 12,482 468Netflix Inc * 1,436 865Omnicom Group Inc 189,266 13,867Scholastic Corp, Cl B 8,643 345Shenandoah Telecommunications Co 1,194 30SK Telecom ADR 84,214 2,246Verizon Communications 444,316 23,087World Wrestling Entertainment Inc, Cl A 42,107 2,078Ziff Davis Inc * 18,550 2,056
76,675Consumer Discretionary — 8.1%
AMMO * 7,997 44AutoZone Inc * 3,300 6,918Canadian Tire Corp Ltd, Cl A 23,000 3,304Choice Hotels International Inc 5,535 863Dorman Products Inc * 4,230 478DR Horton Inc 26,000 2,820eBay Inc 100,200 6,663Frontdoor Inc * 9,811 359Gentex Corp 37,601 1,310Graham Holdings Co, Cl B 330 208H&R Block Inc 129,070 3,041Hilton Worldwide Holdings Inc * 3,011 470Honda Motor Co Ltd ADR 145,242 4,132Marriott International Inc/MD, Cl A * 11,778 1,946Murphy USA Inc 23,400 4,662ONE Group Hospitality * 12,755 161Service Corp International/US 13,181 936Standard Motor Products Inc 5,274 276Sturm Ruger & Co Inc 61,800 4,204Target Corp, Cl A 95,669 22,142Terminix Global Holdings Inc * 11,465 518Toyota Motor Corp ADR 47,464 8,795Vail Resorts Inc 8,774 2,877Winmark Corp 467 116Yum China Holdings Inc 40,244 2,006
79,249Consumer Staples — 16.2%
Albertsons Cos Inc, Cl A 18,782 567
Description SharesMarket Value
($ Thousands)
COMMON STOCK (continued)Altria Group Inc 92,900 $ 4,403Archer-Daniels-Midland Co 64,900 4,387Bunge Ltd 13,302 1,242Calavo Growers Inc 1,459 62Cal-Maine Foods Inc * 12,817 474Campbell Soup Co 24,481 1,064Church & Dwight Co Inc 38,549 3,951Clorox Co/The 16,644 2,902Coca-Cola Co/The 88,401 5,234Coca-Cola Consolidated Inc 1,169 724Colgate-Palmolive Co 73,531 6,275Conagra Brands Inc 216,827 7,405Costco Wholesale Corp 5,965 3,386Estee Lauder Cos Inc/The, Cl A 2,889 1,069Flowers Foods Inc 131,007 3,599General Mills Inc 179,539 12,097Hain Celestial Group Inc/The * 12,759 544Hershey Co/The 32,517 6,291Hormel Foods Corp 70,275 3,430Hostess Brands Inc, Cl A * 23,876 488Ingles Markets Inc, Cl A 280 24J & J Snack Foods Corp 3,860 610J M Smucker Co/The 126,041 17,119John B Sanfilippo & Son 7,832 706Kellogg Co 172,755 11,129Kraft Heinz Co/The 219,400 7,876Kroger Co/The 391,483 17,719MGP Ingredients Inc 2,413 205Mondelez International Inc, Cl A 56,044 3,716PepsiCo Inc 7,808 1,356PriceSmart Inc 4,433 324Procter & Gamble Co/The 30,718 5,025Reynolds Consumer Products Inc 48,275 1,516Seaboard Corp 63 248Simply Good Foods Co/The * 13,110 545Tattooed Chef *(A) 2,800 44Tootsie Roll Industries Inc 13,130 476Tyson Foods Inc, Cl A 148,996 12,986Universal Corp/VA 9,292 510USANA Health Sciences Inc * 5,528 559Utz Brands Inc 22,832 364Vector Group Ltd 30,558 351Walmart Inc 21,439 3,102WD-40 Co 1,230 301Weis Markets Inc 41,790 2,753Whole Earth Brands * 38,072 409
159,567Energy — 1.4%
Cheniere Energy Inc 17,344 1,759Chevron Corp 22,740 2,669DT Midstream Inc 23,349 1,120

SEI Institutional Managed Trust / Quarterly Report / December 31, 20212
SCHEDULE OF INVESTMENTS (Unaudited)December 31, 2021
U.S. Managed Volatility Fund (Continued)
Description SharesMarket Value
($ Thousands)
COMMON STOCK (continued)EOG Resources Inc 21,435 $ 1,904Exxon Mobil Corp 14,154 866Kinder Morgan Inc 317,300 5,032SFL Corp Ltd 13,683 112
13,462Financials — 12.1%
Aflac Inc 221,967 12,961AGNC Investment Corp ‡ 13,127 197Alerus Financial Corp 5,515 161Allstate Corp/The 115,300 13,565American Financial Group Inc/OH 23,700 3,254Annaly Capital Management Inc ‡ 253,100 1,979Arbor Realty Trust Inc ‡ 16,086 295Argo Group International Holdings Ltd 10,976 638Bank of New York Mellon Corp/The 198,000 11,500Berkshire Hathaway Inc, Cl B * 63,401 18,957Business First Bancshares Inc 4,180 118Byline Bancorp Inc 6,403 175Canadian Imperial Bank of Commerce 29,300 3,420Cboe Global Markets Inc 23,543 3,070Chimera Investment Corp ‡ 27,775 419Columbia Financial Inc * 10,941 228Community Bank System Inc 2,751 205Credit Acceptance Corp, Cl A * 3,981 2,738Dynex Capital Inc ‡ 25,751 430Eastern Bankshares 22,422 452Employers Holdings Inc 8,827 365Everest Re Group Ltd 12,673 3,472GCM Grosvenor 45,901 482Hanover Insurance Group Inc/The, Cl A 30,323 3,974Hartford Financial Services Group Inc/The 69,100 4,771HCI Group Inc 2,058 172HomeTrust Bancshares Inc 2,001 62Houlihan Lokey Inc, Cl A 5,099 528Invesco Mortgage Capital Inc ‡ 58,900 164JPMorgan Chase & Co 3,051 483Kearny Financial Corp/MD 30,515 404Loblaw Cos Ltd 70,000 5,744Marsh & McLennan Cos Inc 33,246 5,779Mercury General Corp 13,128 697MFA Financial Inc ‡ 62,176 283Morningstar Inc, Cl A 7,981 2,729National Bank Holdings Corp, Cl A 10,374 456NI Holdings Inc * 1,671 32PCSB Financial Corp 10,432 199Ready Capital Corp ‡ 17,707 277Redwood Trust Inc ‡ 18,468 244Safety Insurance Group Inc 7,739 658StepStone Group Inc, Cl A 10,160 422Stewart Information Services Corp 5,639 450Two Harbors Investment Corp ‡ 45,233 261
Description SharesMarket Value
($ Thousands)
COMMON STOCK (continued)US Bancorp 96,900 $ 5,443Value Line 581 27Virtu Financial Inc, Cl A 89,868 2,591Waterstone Financial Inc 17,721 387White Mountains Insurance Group Ltd 732 742Zions Bancorp NA 33,882 2,140
119,200Health Care — 17.2%
AbbVie Inc 108,326 14,667AdaptHealth Corp, Cl A * 4,881 119Alkermes PLC * 8,330 194Amgen Inc, Cl A 42,500 9,561AMN Healthcare Services Inc * 2,600 318Amphastar Pharmaceuticals Inc * 17,028 397Bristol-Myers Squibb Co 225,203 14,041Cerner Corp 38,118 3,540Citius Pharmaceuticals *(A) 62,211 96CONMED Corp 377 53CVS Health Corp 97,753 10,084Danaher Corp, Cl A 8,625 2,838DENTSPLY SIRONA Inc 50,716 2,829Eagle Pharmaceuticals Inc/DE * 3,345 170Gilead Sciences Inc 199,438 14,481Harvard Bioscience * 5,515 39HealthStream Inc * 8,805 232Henry Schein Inc * 28,808 2,234Horizon Therapeutics Plc * 3,532 380Ironwood Pharmaceuticals Inc, Cl A * 26,124 305iTeos Therapeutics Inc * 7,266 338Johnson & Johnson 133,224 22,791McKesson Corp 29,000 7,208Merck & Co Inc 307,973 23,603Mesa Laboratories Inc 921 302Natus Medical Inc * 5,192 123Omnicell Inc * 2,571 464Organogenesis Holdings Inc, Cl A * 2,871 27Organon & Co 24,839 756Orthofix Medical Inc * 8,068 251Pacira BioSciences Inc * 4,325 260Patterson Cos Inc 10,337 303Pfizer Inc 382,587 22,592Premier Inc, Cl A 102,317 4,212Prestige Consumer Healthcare Inc, Cl A * 11,080 672QIAGEN NV * 1,966 109Quest Diagnostics Inc 27,500 4,758Regeneron Pharmaceuticals Inc * 910 575Sharps Compliance Corp * 6,133 44SIGA Technologies Inc * 30,800 232Stereotaxis Inc * 2,681 17United Therapeutics Corp * 8,311 1,796Vanda Pharmaceuticals Inc * 1,883 30

3SEI Institutional Managed Trust / Quarterly Report / December 31, 2021
SCHEDULE OF INVESTMENTS (Unaudited)December 31, 2021
U.S. Managed Volatility Fund (Continued)
Description SharesMarket Value
($ Thousands)
COMMON STOCK (continued)Viemed Healthcare Inc * 27,213 $ 142Vocera Communications Inc * 2,666 173West Pharmaceutical Services Inc 1,650 774XBiotech Inc 3,047 34
169,164Industrials — 9.4%
3M Co 76,869 13,654Allison Transmission Holdings Inc 133,047 4,836AMERCO * 930 676AZZ Inc 2,186 121CBIZ Inc * 13,668 535CH Robinson Worldwide Inc 43,818 4,716Cummins Inc 31,600 6,893Encore Wire Corp 1,030 147Expeditors International of Washington Inc 35,915 4,823Exponent Inc 2,492 291FTI Consulting Inc * 20,573 3,156General Dynamics Corp 21,957 4,577Huntington Ingalls Industries Inc, Cl A 27,814 5,194Korn Ferry 1,553 118L3Harris Technologies Inc 24,000 5,118Landstar System Inc 6,994 1,252Lockheed Martin Corp 13,700 4,869Northrop Grumman Corp 35,208 13,628Old Dominion Freight Line Inc, Cl A 1,460 523Otis Worldwide Corp 12,518 1,090Red Violet Inc * – —Republic Services Inc 22,100 3,082Robert Half International Inc 37,989 4,237Snap-on Inc 20,400 4,394Toro Co/The 12,110 1,210Waste Management Inc 18,300 3,054Werner Enterprises Inc 4,132 197
92,391Information Technology — 16.3%
A10 Networks Inc 5,873 97Amdocs Ltd 280,874 21,021Arrow Electronics Inc, Cl A * 26,900 3,612Avnet Inc 61,200 2,523Broadridge Financial Solutions Inc 11,566 2,115CACI International Inc, Cl A * 17,162 4,620Canon Inc ADR (A) 130,800 3,196CDK Global Inc 61,444 2,565Cisco Systems Inc/Delaware 269,500 17,078Consensus Cloud Solutions * 11,533 667CSG Systems International Inc 9,781 564Datto Holding Corp * 52,574 1,385F5 Inc, Cl A * 14,500 3,548Hewlett Packard Enterprise Co 220,700 3,480Intel Corp 339,000 17,459International Business Machines Corp 102,708 13,728
Description SharesMarket Value
($ Thousands)
COMMON STOCK (continued)Jack Henry & Associates Inc 1,684 $ 281Jamf Holding Corp * 43,912 1,669Juniper Networks Inc 284,966 10,176Kyndryl Holdings Inc * 20,541 372MAXIMUS Inc 3,180 253Microsoft Corp 5,524 1,858Open Text Corp 57,000 2,709Oracle Corp, Cl B 264,900 23,102OSI Systems Inc * 6,061 565Progress Software Corp 9,839 475Rackspace Technology Inc * 13,827 186Sapiens International Corp NV 13,611 469Seagate Technology Holdings PLC 116,500 13,162SPS Commerce Inc * 1,582 225Tucows Inc, Cl A * 208 18Western Union Co/The 424,181 7,567
160,745Materials — 3.2%
Balchem Corp 3,589 605Berry Global Group Inc * 80,975 5,974International Paper Co 65,600 3,082NewMarket Corp 12,791 4,384Newmont Corp 115,789 7,181Novagold Resources Inc * 25,069 172Sealed Air Corp 80,978 5,464Silgan Holdings Inc 93,288 3,997Valvoline Inc 17,887 667
31,526Real Estate — 3.2%
Agree Realty Corp ‡ 2,596 185Brandywine Realty Trust ‡ 248,750 3,338Broadstone Net Lease Inc, Cl A ‡ 19,663 488City Office Inc ‡ 11,523 227CubeSmart ‡ 13,204 751Douglas Elliman *‡ 15,279 176Easterly Government Properties Inc, Cl A ‡ 8,107 186Extra Space Storage Inc ‡ 11,621 2,635Healthcare Realty Trust Inc ‡ 4,418 140Iron Mountain Inc ‡ 146,700 7,677Jones Lang LaSalle Inc *‡ 1,951 525National Storage Affiliates Trust ‡ 4,382 303Orion Office Inc *‡ 8,717 163Plymouth Industrial Inc ‡ 7,539 241Postal Realty Trust, Cl A ‡ 27,753 549PS Business Parks Inc ‡ 2,324 428Public Storage ‡ 15,952 5,975Realty Income Corp ‡ 87,171 6,241Retail Opportunity Investments Corp ‡ 11,272 221RMR Group Inc/The, Cl A ‡ 4,694 163RPT Realty ‡ 8,047 108SITE Centers Corp ‡ 7,573 120

SEI Institutional Managed Trust / Quarterly Report / December 31, 20214
SCHEDULE OF INVESTMENTS (Unaudited)December 31, 2021
U.S. Managed Volatility Fund (Continued)
Description SharesMarket Value
($ Thousands)
COMMON STOCK (continued)Terreno Realty Corp ‡ 3,154 $ 269Urban Edge Properties ‡ 11,719 223
31,332Utilities — 4.4%
American States Water Co 6,154 637Artesian Resources Corp, Cl A 2,706 125Avista Corp 4,976 211California Water Service Group, Cl A 4,859 349Chesapeake Utilities Corp 4,743 692DTE Energy Co 29,400 3,515Entergy Corp 29,700 3,346Evergy Inc 204,537 14,033Exelon Corp 61,000 3,523Hawaiian Electric Industries Inc 33,192 1,377National Fuel Gas Co 78,800 5,039Northwest Natural Holding Co 1,339 65Portland General Electric Co 196,692 10,409Pure Cycle Corp * 13,291 194Via Renewables Inc, Cl A 10,674 122
43,637
Total Common Stock
(Cost $728,000) ($ Thousands) 976,948
AFFILIATED PARTNERSHIP — 0.3%SEI Liquidity Fund, L.P.
0.020% **†(B) 3,413,885 3,414
Total Affiliated Partnership (Cost $3,414) ($ Thousands) 3,414
CASH EQUIVALENT — 0.8%SEI Daily Income Trust, Government
Fund, Cl F0.010%**† 7,387,752 7,388
Total Cash Equivalent(Cost $7,388) ($ Thousands) 7,388
Total Investments in Securities — 100.4%(Cost $738,802) ($ Thousands) $ 987,750
Percentages are based on Net Assets of $984,257 ($ Thousands).* Non-income producing security.** Rate shown is the 7-day effective yield as of December 31, 2021.† Investment in Affiliated Security.‡ Real Estate Investment Trust.(A) Certain securities or partial positions of certain securities are on loan at
December 31, 2021. The total market value of securities on loan at December 31, 2021 was $579 ($ Thousands).
(B) This security was purchased with cash collateral held from securities on loan. The total market value of such securities as of December 31, 2021 was $3,414 ($ Thousands).
,
ADR — American Depositary ReceiptCl — ClassL.P. — Limited PartnershipLtd. — LimitedPLC — Public Limited Company
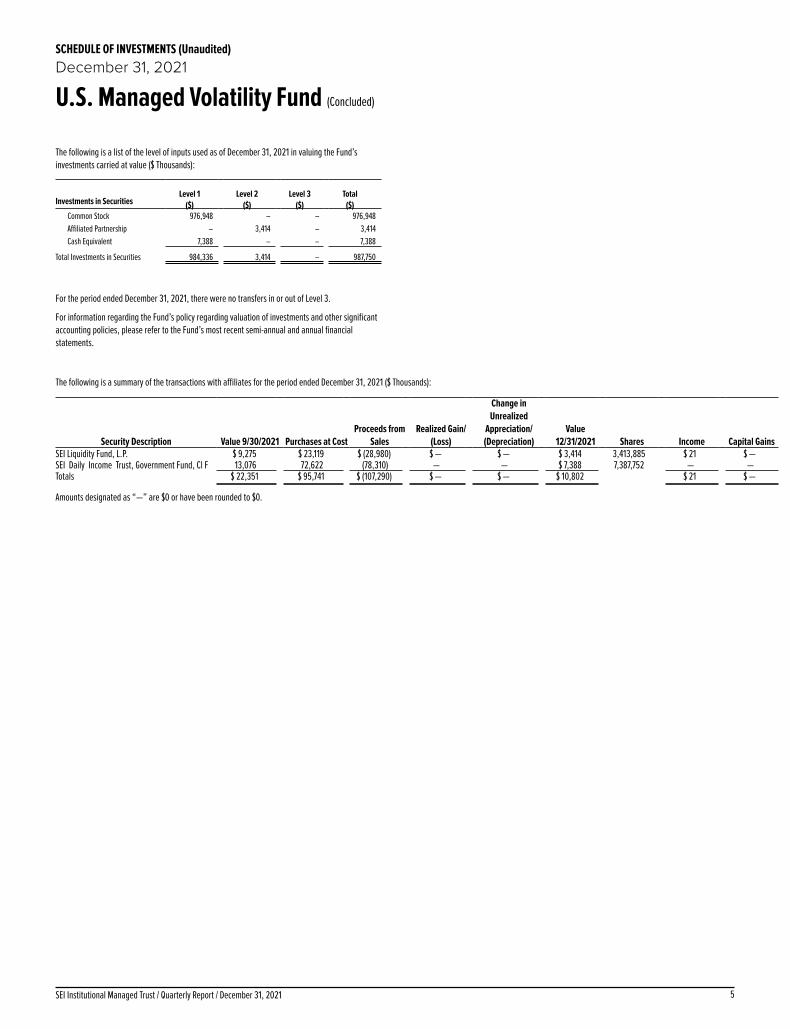
5SEI Institutional Managed Trust / Quarterly Report / December 31, 2021
SCHEDULE OF INVESTMENTS (Unaudited)December 31, 2021
U.S. Managed Volatility Fund (Concluded)
The following is a list of the level of inputs used as of December 31, 2021 in valuing the Fund’s investments carried at value ($ Thousands):
Investments in SecuritiesLevel 1
($)Level 2
($)Level 3
($)Total
($)Common Stock 976,948 – – 976,948Affiliated Partnership – 3,414 – 3,414Cash Equivalent 7,388 – – 7,388
Total Investments in Securities 984,336 3,414 – 987,750
For the period ended December 31, 2021, there were no transfers in or out of Level 3.
For information regarding the Fund’s policy regarding valuation of investments and other significant accounting policies, please refer to the Fund’s most recent semi-annual and annual financial statements.
The following is a summary of the transactions with affiliates for the period ended December 31, 2021 ($ Thousands):
Security Description Value 9/30/2021 Purchases at Cost Proceeds from
Sales Realized Gain/
(Loss)
Change in Unrealized
Appreciation/(Depreciation)
Value12/31/2021 Shares Income Capital Gains
SEI Liquidity Fund, L.P. $ 9,275 $ 23,119 $ (28,980) $ — $ — $ 3,414 3,413,885 $ 21 $ — SEI Daily Income Trust, Government Fund, Cl F 13,076 72,622 (78,310) — — $ 7,388 7,387,752 — — Totals $ 22,351 $ 95,741 $ (107,290) $ — $ — $ 10,802 $ 21 $ —
Amounts designated as “—” are $0 or have been rounded to $0.

1SEI Institutional Managed Trust / Quarterly Report / December 31, 2021
SCHEDULE OF INVESTMENTS (Unaudited)December 31, 2021
Global Managed Volatility Fund
Description SharesMarket Value
($ Thousands)
COMMON STOCK — 97.6%Australia — 0.2%
Aristocrat Leisure Ltd 12,068 $ 383Coles Group Ltd 174 2Medibank Pvt 15,714 38Sonic Healthcare Ltd 44,461 1,509Telstra Corp Ltd, Cl B 43,654 133
2,065 –
Austria — 0.0%Oberbank AG 81 8Telekom Austria AG, Cl A 44,848 388
396 –
Belgium — 0.7%Ackermans & van Haaren 429 82Etablissements Franz Colruyt 203 9KBC Group NV 38,015 3,262Proximus SADP 213,545 4,162Warehouses De Pauw CVA ‡ 2,387 115
7,630 –
Canada — 3.9%Alimentation Couche-Tard 85,300 3,579BCE Inc 147,478 7,675Empire Co Ltd, Cl A 98,812 3,015George Weston Ltd 104,821 12,171Loblaw Cos Ltd 160,926 13,204Metro Inc/CN, Cl A 24,700 1,316North West Co Inc/The 751 20
40,980 –
Denmark — 2.6%AP Moller - Maersk A/S, Cl B 1,628 5,833Carlsberg A/S, Cl B 33,312 5,751Coloplast A/S, Cl B 17,854 3,135Danske Bank A/S 75,885 1,308Demant A/S * 3 –DSV A/S 3,861 901Novo Nordisk A/S, Cl B 87,239 9,810Novozymes A/S, Cl B 11,863 973Schouw & Co A/S 497 43Spar Nord Bank 6,812 87
27,841 –
Finland — 0.7%Aktia Bank 5,982 84Elisa Oyj 66,230 4,072Kesko Oyj, Cl B 16,264 542Orion Oyj, Cl B 68,418 2,841
7,539 –
France — 1.0%ABC arbitrage 4,265 35Carrefour SA 237,961 4,358La Francaise des Jeux SAEM 11,997 531
Description SharesMarket Value
($ Thousands)
COMMON STOCK (continued)Sanofi 45,657 $ 4,599Technip Energies * 33,670 491Wavestone 1,230 76Wendel SA 3,741 449
10,539 –
Germany — 0.8%Beiersdorf AG 1,744 179Commerzbank AG * 28,234 215Deutsche Telekom AG 10,580 196Henkel AG & Co KGaA 19,851 1,551LEG Immobilien ‡ 1,134 158McKesson Europe AG 874 24Merck KGaA 24,404 6,300QIAGEN NV * 2 –Scout24 1 –Uniper SE 6,085 289
8,912 –
Hong Kong — 3.6%Bank of East Asia 103,685 149BOC Hong Kong Holdings Ltd 1,053,500 3,453Cafe de Coral Holdings 28,000 50CITIC Telecom International Holdings 1,597,000 539CK Hutchison Holdings Ltd 1,500 10CK Infrastructure Holdings Ltd 15,500 99CLP Holdings Ltd, Cl B 991,656 10,017Dah Sing Banking Group Ltd 70,498 60Far East Consortium International ‡ 334,000 122Hang Seng Bank Ltd 79,300 1,451HK Electric Investments & HK Electric
Investments Ltd 2,155,000 2,115HKT Trust & HKT Ltd 3,234,000 4,347Hong Kong & China Gas Co Ltd 2,835,000 4,414Kerry Logistics Network 174,054 425Langham Hospitality Investments and
Langham Hospitality Investments Ltd *‡ 425,500 46Link REIT ‡ 192,100 1,692Miramar Hotel & Investment 49,000 80MTR Corp Ltd 285,500 1,533PCCW Ltd 4,732,000 2,397Power Assets Holdings Ltd 541,000 3,372Prosperity ‡ 203,000 80Regal Hotels International Holdings Ltd * 174,000 68SmarTone Telecommunications Holdings 163,760 87Sun Hung Kai Properties Ltd ‡ 109,500 1,329VTech Holdings Ltd 58,569 459
38,394 –
Ireland — 1.2%Accenture PLC, Cl A 21,504 8,914Kerry Group PLC, Cl A 28,815 3,711
12,625 –
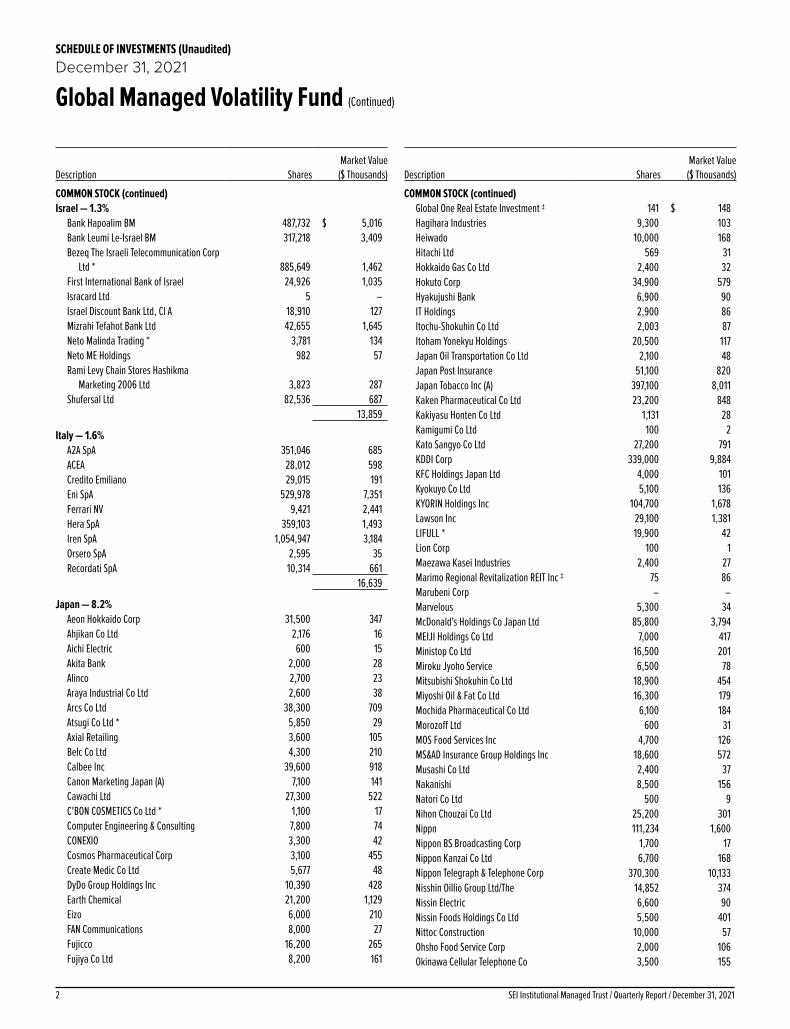
SEI Institutional Managed Trust / Quarterly Report / December 31, 20212
SCHEDULE OF INVESTMENTS (Unaudited)December 31, 2021
Global Managed Volatility Fund (Continued)
Description SharesMarket Value
($ Thousands)
COMMON STOCK (continued)Israel — 1.3%
Bank Hapoalim BM 487,732 $ 5,016Bank Leumi Le-Israel BM 317,218 3,409Bezeq The Israeli Telecommunication Corp
Ltd * 885,649 1,462First International Bank of Israel 24,926 1,035Isracard Ltd 5 –Israel Discount Bank Ltd, Cl A 18,910 127Mizrahi Tefahot Bank Ltd 42,655 1,645Neto Malinda Trading * 3,781 134Neto ME Holdings 982 57Rami Levy Chain Stores Hashikma
Marketing 2006 Ltd 3,823 287Shufersal Ltd 82,536 687
13,859 –
Italy — 1.6%A2A SpA 351,046 685ACEA 28,012 598Credito Emiliano 29,015 191Eni SpA 529,978 7,351Ferrari NV 9,421 2,441Hera SpA 359,103 1,493Iren SpA 1,054,947 3,184Orsero SpA 2,595 35Recordati SpA 10,314 661
16,639 –
Japan — 8.2%Aeon Hokkaido Corp 31,500 347Ahjikan Co Ltd 2,176 16Aichi Electric 600 15Akita Bank 2,000 28Alinco 2,700 23Araya Industrial Co Ltd 2,600 38Arcs Co Ltd 38,300 709Atsugi Co Ltd * 5,850 29Axial Retailing 3,600 105Belc Co Ltd 4,300 210Calbee Inc 39,600 918Canon Marketing Japan (A) 7,100 141Cawachi Ltd 27,300 522C'BON COSMETICS Co Ltd * 1,100 17Computer Engineering & Consulting 7,800 74CONEXIO 3,300 42Cosmos Pharmaceutical Corp 3,100 455Create Medic Co Ltd 5,677 48DyDo Group Holdings Inc 10,390 428Earth Chemical 21,200 1,129Eizo 6,000 210FAN Communications 8,000 27Fujicco 16,200 265Fujiya Co Ltd 8,200 161
Description SharesMarket Value
($ Thousands)
COMMON STOCK (continued)Global One Real Estate Investment ‡ 141 $ 148Hagihara Industries 9,300 103Heiwado 10,000 168Hitachi Ltd 569 31Hokkaido Gas Co Ltd 2,400 32Hokuto Corp 34,900 579Hyakujushi Bank 6,900 90IT Holdings 2,900 86Itochu-Shokuhin Co Ltd 2,003 87Itoham Yonekyu Holdings 20,500 117Japan Oil Transportation Co Ltd 2,100 48Japan Post Insurance 51,100 820Japan Tobacco Inc (A) 397,100 8,011Kaken Pharmaceutical Co Ltd 23,200 848Kakiyasu Honten Co Ltd 1,131 28Kamigumi Co Ltd 100 2Kato Sangyo Co Ltd 27,200 791KDDI Corp 339,000 9,884KFC Holdings Japan Ltd 4,000 101Kyokuyo Co Ltd 5,100 136KYORIN Holdings Inc 104,700 1,678Lawson Inc 29,100 1,381LIFULL * 19,900 42Lion Corp 100 1Maezawa Kasei Industries 2,400 27Marimo Regional Revitalization REIT Inc ‡ 75 86Marubeni Corp – –Marvelous 5,300 34McDonald's Holdings Co Japan Ltd 85,800 3,794MEIJI Holdings Co Ltd 7,000 417Ministop Co Ltd 16,500 201Miroku Jyoho Service 6,500 78Mitsubishi Shokuhin Co Ltd 18,900 454Miyoshi Oil & Fat Co Ltd 16,300 179Mochida Pharmaceutical Co Ltd 6,100 184Morozoff Ltd 600 31MOS Food Services Inc 4,700 126MS&AD Insurance Group Holdings Inc 18,600 572Musashi Co Ltd 2,400 37Nakanishi 8,500 156Natori Co Ltd 500 9Nihon Chouzai Co Ltd 25,200 301Nippn 111,234 1,600Nippon BS Broadcasting Corp 1,700 17Nippon Kanzai Co Ltd 6,700 168Nippon Telegraph & Telephone Corp 370,300 10,133Nisshin Oillio Group Ltd/The 14,852 374Nissin Electric 6,600 90Nissin Foods Holdings Co Ltd 5,500 401Nittoc Construction 10,000 57Ohsho Food Service Corp 2,000 106Okinawa Cellular Telephone Co 3,500 155

3SEI Institutional Managed Trust / Quarterly Report / December 31, 2021
SCHEDULE OF INVESTMENTS (Unaudited)December 31, 2021
Global Managed Volatility Fund (Continued)
Description SharesMarket Value
($ Thousands)
COMMON STOCK (continued)Ooedo Onsen Reit Investment Corp ‡ 67 $ 42Oracle Corp Japan 12,400 938Osaki Electric 13,700 56Otsuka Holdings Co Ltd (A) 19,400 702OUG Holdings Inc 2,236 53Plenus Co Ltd 14,200 249Rock Field Co Ltd 6,100 80Rohm Co Ltd 4,800 435Sakata Seed 2,600 74San Holdings Inc 3,800 50San ju San Financial Group 6,900 88San-A Co Ltd, Cl A 13,200 479Sankyo Co Ltd 24,400 632Shinmaywa Industries 8,000 61Showa Sangyo Co Ltd 18,600 430SKY Perfect JSAT Holdings Inc 51,700 189Softbank Corp 1,024,000 12,953Sompo Holdings 5,000 211SOSiLA Logistics REIT ‡ 33 50SRA Holdings 3,200 80ST Corp 2,300 31Sugi Holdings Co Ltd 30,300 1,831Sundrug Co Ltd 55,400 1,445Suzuden 2,100 33Takasago International 2,300 58Tekken 2,500 39Toho Holdings Co Ltd 3,311 50TOKAI Holdings 24,600 186Tosoh Corp 35,800 532Towa Bank 7,100 33Toyo Kanetsu 1,900 41Toyo Suisan Kaisha Ltd 5,900 250Trend Micro Inc/Japan 98,000 5,435Tsuruha Holdings Inc 12,700 1,218Unicafe Inc *(A) 6,400 57Unicharm Corp 53,200 2,313United Super Markets Holdings Inc 101,800 934Valor Holdings Co Ltd 6,500 121Vital KSK Holdings Inc 48,900 343Wowow Inc (A) 7,424 113XYMAX REIT Investment Corp ‡ 105 107Yakult Honsha Co Ltd 16,800 876Yamada Denki Co Ltd * 9,100 31Yaoko Co Ltd 6,100 370Yokohama Reito – –ZERIA Pharmaceutical 4,300 73ZIGExN 16,300 44ZOZO Inc 35,500 1,107
86,479 –
Netherlands — 1.5%ABN AMRO Bank NV 4,578 67
Description SharesMarket Value
($ Thousands)
COMMON STOCK (continued)Aegon NV 86,173 $ 431Heineken Holding NV 1,881 174ING Groep NV 105,961 1,475JDE Peet's 15,328 472Koninklijke Ahold Delhaize NV 122,549 4,200Koninklijke KPN NV 633,337 1,966NN Group NV 3 –Randstad NV 13,939 952Royal Dutch Shell PLC, Cl A 132,404 2,908Wolters Kluwer NV 26,902 3,169
15,814 –
New Zealand — 0.3%Freightways Ltd 26,211 231Heartland Group Holdings 81,990 141Mainfreight Ltd 8,347 537Spark New Zealand Ltd 468,014 1,448Trustpower Ltd 8,293 42Vector Ltd 34,384 94Warehouse Group Ltd/The 38,887 107
2,600 –
Norway — 0.7%AF Gruppen ASA 449 10Aker BP ASA 11,260 346Bouvet 2,334 20DNB Bank 78,749 1,800Gjensidige Forsikring ASA 55,455 1,345Kongsberg Gruppen 19,082 618Odfjell Drilling * 13,187 30Orkla ASA 3,563 36SpareBank 1 SR-Bank 13,495 204Telenor ASA 140,456 2,207Veidekke 21,684 325
6,941 –
Portugal — 0.4%Jeronimo Martins SGPS SA 107,398 2,455REN - Redes Energeticas Nacionais SGPS SA 426,813 1,235
3,690 –
Singapore — 0.4%Bukit Sembawang Estates ‡ 11,700 43Fraser and Neave Ltd 20,400 21Jardine Cycle & Carriage Ltd 60,000 917Kimly 90,400 28Oversea-Chinese Banking Corp Ltd 41,100 347Raffles Medical Group 19,700 20Sheng Siong Group Ltd 1,367,374 1,481Singapore Technologies Engineering Ltd 532,000 1,484
4,341 –
Spain — 0.2%Banco Bilbao Vizcaya Argentaria SA 1,782 11Enagas SA 8,418 195

SEI Institutional Managed Trust / Quarterly Report / December 31, 20214
SCHEDULE OF INVESTMENTS (Unaudited)December 31, 2021
Global Managed Volatility Fund (Continued)
Description SharesMarket Value
($ Thousands)
COMMON STOCK (continued)Financiera Alba 1,963 $ 115Red Electrica Corp SA 103,016 2,231
2,552 –
Sweden — 0.8%Axfood AB 235,292 6,766Essity AB, Cl B 47,942 1,562Telefonaktiebolaget LM Ericsson, Cl B 330 4
8,332 –
Switzerland — 6.3%AEVIS VICTORIA SA * 1,870 30Alcon Inc 40,684 3,589Allreal Holding AG, Cl A ‡ 8,266 1,833Berner Kantonalbank AG 37 8BKW AG 7,977 1,041Chocoladefabriken Lindt & Spruengli AG 235 3,253Emmi 1,122 1,326Georg Fischer 55 83LEM Holding 29 81Luzerner Kantonalbank 151 69Mobimo Holding AG *‡ 1,240 415Nestle SA 14,084 1,971Novartis AG 96,432 8,470Orior AG 1,082 107Plazza AG ‡ 133 49PSP Swiss Property AG ‡ 19,524 2,438Roche Holding 1,460 654Roche Holding AG 26,408 10,976SGS SA, Cl B 1,586 5,292SKAN Group 1,091 106Sonova Holding AG 19,796 7,744St Galler Kantonalbank AG 275 131Straumann Holding AG 400 850Swiss Life Holding AG 2,412 1,475Swiss Prime Site AG ‡ 2,580 254Swisscom AG 24,899 14,046TX Group AG * 491 84Valiant Holding AG 826 83Varia US Properties AG ‡ 560 31
66,489 –
United Kingdom — 3.4%Alliance Pharma 7,738 11Aon PLC, Cl A 7,297 2,193Big Yellow Group ‡ 9,108 211British Land (United Kingdom) ‡ 94,402 679Bunzl PLC 16,031 626Ferguson PLC 44,670 7,929Genus 5,958 398GlaxoSmithKline PLC 408,444 8,888Greggs PLC 937 42Howden Joinery Group 41,252 504
Description SharesMarket Value
($ Thousands)
COMMON STOCK (continued)Imperial Brands PLC 43,098 $ 944J Sainsbury PLC 996,991 3,724Kingfisher PLC 4,054 19Liberty Global PLC, Cl A * 28,939 803Liberty Global PLC, Cl C * 57,650 1,619M&G 424,707 1,148Medtronic PLC 23,554 2,437Rightmove PLC 36,023 388Tate & Lyle PLC 134,987 1,209Tesco 105,519 414Unilever PLC 23,783 1,271
35,457 –
United States — 57.8%Communication Services — 5.8%
Activision Blizzard Inc 2 –Alphabet Inc, Cl A * 4,511 13,069Alphabet Inc, Cl C * 1,052 3,044AT&T Inc 417,522 10,271Comcast Corp, Cl A 8,307 418Electronic Arts Inc 11,838 1,561Fox Corp, Cl A 54,494 2,011Fox Corp, Cl B 54,591 1,871Interpublic Group of Cos Inc/The 19,903 745John Wiley & Sons Inc, Cl A 21,320 1,221Liberty Media Corp-Liberty SiriusXM * 5,335 271Meta Platforms Inc, Cl A * 11,590 3,898News Corp, Cl A 34 1Omnicom Group Inc 80,838 5,923Scholastic Corp, Cl B 28,230 1,128Verizon Communications Inc 296,610 15,412Yelp Inc, Cl A * 21,438 777
61,621Consumer Discretionary — 2.0%
AutoZone Inc * 988 2,071Choice Hotels International Inc 1,557 243Domino's Pizza Inc 1,074 606General Motors Co * 3,466 203Genuine Parts Co 4,022 564Home Depot Inc/The 18,870 7,831O'Reilly Automotive Inc * 773 546Target Corp, Cl A 36,921 8,545
20,609Consumer Staples — 13.3%
Bunge Ltd 1 –Casey's General Stores Inc 31,854 6,286Central Garden & Pet Co, Cl A * 1,731 83Church & Dwight Co Inc 63,392 6,498Clorox Co/The 3,604 628Colgate-Palmolive Co 151,468 12,926Conagra Brands Inc 2,371 81Costco Wholesale Corp 27,859 15,816

5SEI Institutional Managed Trust / Quarterly Report / December 31, 2021
SCHEDULE OF INVESTMENTS (Unaudited)December 31, 2021
Global Managed Volatility Fund (Continued)
Description SharesMarket Value
($ Thousands)
COMMON STOCK (continued)Flowers Foods Inc 132,239 $ 3,633General Mills Inc 130,077 8,765Hershey Co/The 58,421 11,303Hormel Foods Corp 48,314 2,358Inter Parfums Inc 2,369 253J M Smucker Co/The 30,046 4,081John B Sanfilippo & Son Inc 7,496 676Kellogg Co 108,918 7,016Kimberly-Clark Corp 36,795 5,259Kroger Co/The 104,511 4,730Lancaster Colony Corp 809 134McCormick & Co Inc/MD 15,300 1,478Mondelez International Inc, Cl A 119,899 7,951Nomad Foods * 41,177 1,045PepsiCo Inc 34,575 6,006Philip Morris International Inc 62,997 5,985Procter & Gamble Co/The 61,937 10,132Tyson Foods Inc, Cl A 13,129 1,144USANA Health Sciences Inc * 14,391 1,456Walmart Inc 97,994 14,179
139,902Financials — 3.8%
American Business Bank * 1,369 54Arthur J Gallagher & Co 9,479 1,608Berkshire Hathaway, Cl A * 11 4,957Berkshire Hathaway Inc, Cl B * 31,500 9,419Brown & Brown Inc 2,692 189Cboe Global Markets Inc 23,313 3,040CME Group Inc 18,243 4,168First American Financial Corp 4,426 346Intercontinental Exchange Inc 54,363 7,435KKR Real Estate Finance Trust Inc ‡ 18,917 394Marsh & McLennan Cos Inc 43,922 7,635MFA Financial Inc ‡ 50,737 231Nelnet Inc, Cl A 3,366 329Sixth Street Specialty Lending Inc 51 1Waterstone Financial Inc 21,532 471
40,277Health Care — 11.9%
AbbVie Inc 37,359 5,058Agilent Technologies Inc 34,240 5,466Becton Dickinson and Co 10,447 2,627Bio-Rad Laboratories Inc, Cl A * 10,079 7,615Bristol-Myers Squibb Co 6,365 397Cerner Corp 158,922 14,759Chemed Corp 11,106 5,876CVS Health Corp 26,200 2,703Gilead Sciences Inc 71,332 5,180HCA Healthcare Inc 4,380 1,125Henry Schein Inc * 26,827 2,080IDEXX Laboratories Inc * 5,239 3,450Johnson & Johnson 81,733 13,982
Description SharesMarket Value
($ Thousands)
COMMON STOCK (continued)Laboratory Corp of America Holdings * 24,911 $ 7,827Merck & Co Inc 98,210 7,527Mettler-Toledo International Inc * 5,036 8,547Molina Healthcare Inc * 2,507 797National HealthCare Corp 10,063 684Pfizer Inc 238,086 14,059Prestige Consumer Healthcare Inc, Cl A * 31,741 1,925Quest Diagnostics Inc 11,585 2,004Regeneron Pharmaceuticals Inc * 3,423 2,162Stryker Corp 3,881 1,038Vertex Pharmaceuticals Inc * 7,748 1,701Waters Corp * 18,324 6,828West Pharmaceutical Services Inc 882 414
125,831Industrials — 3.8%
3M Co 9,794 1,740A O Smith Corp 13,272 1,139AMERCO 4,696 3,410CH Robinson Worldwide Inc 42,994 4,628Expeditors International of Washington Inc 97,942 13,153General Dynamics Corp 25,860 5,391Graco Inc 17,242 1,390Insperity Inc, Cl A 1,258 149Lockheed Martin Corp 724 257Northrop Grumman Corp 449 174Robert Half International Inc 67,217 7,496Waste Management Inc 2,314 386Watsco Inc 1,091 341ZIM Integrated Shipping Services 3,653 215
39,869Information Technology — 12.1%
Amdocs Ltd 6,120 458Arista Networks Inc * 57,800 8,309Avnet Inc 16,532 682Broadcom Inc 12,575 8,368Cadence Design Systems Inc * 7,616 1,419Check Point Software Technologies Ltd * 75,250 8,771Ciena Corp * 69,355 5,338Cisco Systems Inc/Delaware 199,110 12,618CommVault Systems Inc * 50,741 3,497Dell Technologies Inc, Cl C * 10,610 596F5 Inc, Cl A * 35,982 8,805Fair Isaac Corp * 6,422 2,785Fortinet Inc * 18,119 6,512Gartner Inc * 9,755 3,261HP Inc 39,179 1,476Intuit Inc 1,869 1,202Jack Henry & Associates Inc 5,917 988Juniper Networks Inc 315,642 11,272Keysight Technologies Inc * 6,277 1,296Microsoft Corp 22,025 7,407Motorola Solutions Inc 40,773 11,078

SEI Institutional Managed Trust / Quarterly Report / December 31, 20216
SCHEDULE OF INVESTMENTS (Unaudited)December 31, 2021
Global Managed Volatility Fund (Continued)
Description SharesMarket Value
($ Thousands)
COMMON STOCK (continued)National Instruments Corp 30,794 $ 1,345NetScout Systems Inc * 31,539 1,043Oracle Corp, Cl B 131,464 11,465Progress Software Corp 17,398 840Radware Ltd * 43,297 1,803SS&C Technologies Holdings Inc 39,592 3,246Synopsys Inc * 612 225VMware Inc, Cl A 11,189 1,297
127,402Materials — 3.2%
AptarGroup Inc 12,155 1,489Ecolab Inc 26,486 6,213Materion Corp 18,892 1,737Nucor Corp 14,545 1,660Packaging Corp of America 30,590 4,165Reliance Steel & Aluminum Co 57,596 9,343Royal Gold Inc, Cl A 24,448 2,572Sherwin-Williams Co/The, Cl A 7,601 2,677Silgan Holdings Inc 79,424 3,403
33,259Real Estate — 1.0%
CubeSmart ‡ 7,992 455Equity LifeStyle Properties Inc ‡ 17,076 1,497Extra Space Storage Inc ‡ 11,284 2,558Public Storage ‡ 16,579 6,210
10,720Utilities — 0.9%
American Electric Power Co Inc 9,451 841Consolidated Edison Inc 23,418 1,998Hawaiian Electric Industries Inc 34,368 1,426PPL Corp 74,291 2,233UGI Corp 62,114 2,852
9,350 608,840
–
Total Common Stock
(Cost $857,220) ($ Thousands) 1,028,954
PREFERRED STOCK — 0.2%Germany — 0.2%
Fuchs Petrolub (B) 4,331 196Henkel AG & Co KGaA(B) 18,613 1,506
–
Total Preferred Stock
(Cost $1,843) ($ Thousands) 1,702
Description SharesMarket Value
($ Thousands)
AFFILIATED PARTNERSHIP — 0.9%SEI Liquidity Fund, L.P.
0.020% **†(C) 9,445,960 $ 9,447
Total Affiliated Partnership (Cost $9,448) ($ Thousands) 9,447
CASH EQUIVALENT — 1.6%SEI Daily Income Trust, Government
Fund, Cl F0.010%**† 17,068,221 17,068
Total Cash Equivalent(Cost $17,068) ($ Thousands) 17,068
Total Investments in Securities — 100.3%(Cost $885,579) ($ Thousands) $ 1,057,171

7SEI Institutional Managed Trust / Quarterly Report / December 31, 2021
SCHEDULE OF INVESTMENTS (Unaudited)December 31, 2021
Global Managed Volatility Fund (Continued)
A list of the open futures contracts held by the Fund at December 31, 2021, is as follows:
Type of ContractNumber of Contracts
Expiration Date
Notional Amount (Thousands) Value (Thousands)
Unrealized Appreciation/ (Depreciation) (Thousands)
Long ContractsEuro STOXX 50 33 Mar-2022 $ 1,541 $ 1,609 $ 53FTSE 100 Index 5 Mar-2022 486 496 4Hang Seng Index 1 Jan-2022 150 150 1S&P 500 Index E-MINI 36 Mar-2022 8,418 8,565 147SPI 200 Index 3 Mar-2022 393 401 3TOPIX Index 6 Mar-2022 1,040 1,039 7
$ 12,028 $ 12,260 $ 215

SEI Institutional Managed Trust / Quarterly Report / December 31, 20218
SCHEDULE OF INVESTMENTS (Unaudited)December 31, 2021
Global Managed Volatility Fund (Continued)
A list of the open forward foreign currency contracts held by the Fund at December 31, 2021 is as follows:
Counterparty Settlement DateCurrency to Deliver
(Thousands)Currency to Receive
(Thousands)
Unrealized Appreciation
(Depreciation) (Thousands)
**Add Broker** WESTCAP 01/11/22 CHF 5,449,801 USD 127,930 $ (206)
Barclays PLC 01/10/22 CAD 24,971 USD 19,763 (7)
Barclays PLC 01/10/22 NOK 26,335 USD 2,940 (47)
Brown Brothers Harriman 01/10/22 USD 225 NZD 331 1
Brown Brothers Harriman 01/10/22 USD 309 SGD 422 3
Brown Brothers Harriman 01/10/22 NZD 25 USD 17 —
Brown Brothers Harriman 01/10/22 NZD 356 USD 240 (3)
Brown Brothers Harriman 01/10/22 USD 425 NOK 3,816 8
Brown Brothers Harriman 01/10/22 USD 34 NOK 296 —
Brown Brothers Harriman 01/10/22 SGD 20 USD 15 —
Brown Brothers Harriman 01/10/22 SGD 456 USD 334 (4)
Brown Brothers Harriman 01/10/22 USD 49 SEK 450 —
Brown Brothers Harriman 01/10/22 USD 662 SEK 5,981 (1)
Brown Brothers Harriman 01/10/22 USD 1,213 AUD 1,687 14
Brown Brothers Harriman 01/10/22 GBP 1,526 USD 2,027 (39)
Brown Brothers Harriman 01/10/22 AUD 131 USD 95 —
Brown Brothers Harriman 01/10/22 AUD 1,680 USD 1,202 (20)
Brown Brothers Harriman 01/10/22 USD 1,793 HKD 13,994 1
Brown Brothers Harriman 01/10/22 USD 25 HKD 198 —
Brown Brothers Harriman 01/10/22 USD 1,867 DKK 12,259 8
Brown Brothers Harriman 01/10/22 USD 1,915 GBP 1,436 31
Brown Brothers Harriman 01/10/22 USD 2,631 CAD 3,361 30
Brown Brothers Harriman 01/10/22 USD 3,882 CHF 3,567 34
Brown Brothers Harriman 01/10/22 CHF 214 USD 235 —
Brown Brothers Harriman 01/10/22 CHF 3,802 USD 4,127 (47)
Brown Brothers Harriman 01/10/22 CAD 7 USD 5 —
Brown Brothers Harriman 01/10/22 CAD 4,167 USD 3,252 (47)
Brown Brothers Harriman 01/10/22 NOK 333 USD 38 —
Brown Brothers Harriman 01/10/22 NOK 3,963 USD 440 (9)
Brown Brothers Harriman 01/10/22 USD 5,242 EUR 4,628 22
Brown Brothers Harriman 01/10/22 EUR 214 USD 243 —
Brown Brothers Harriman 01/10/22 EUR 5,156 USD 5,820 (44)
Brown Brothers Harriman 01/10/22 SEK 775 USD 86 —
Brown Brothers Harriman 01/10/22 SEK 6,856 USD 754 (3)
Brown Brothers Harriman 01/10/22 DKK 568 USD 87 —
Brown Brothers Harriman 01/10/22 DKK 13,642 USD 2,070 (16)
Brown Brothers Harriman 01/10/22 HKD 1,053 USD 135 —
Brown Brothers Harriman 01/10/22 HKD 16,533 USD 2,119 (1)
Brown Brothers Harriman 01/11/22 USD 369 JPY 42,479 —
Brown Brothers Harriman 01/11/22 USD 5,638 JPY 640,323 (77)
Brown Brothers Harriman 01/11/22 JPY 921,357 USD 8,089 88
Standard Chartered 01/10/22 NZD 2,263 USD 1,532 (17)
Standard Chartered 01/10/22 GBP 10,039 USD 13,251 (346)
Standard Chartered 01/10/22 SEK 48,456 USD 5,339 (13)
Standard Chartered 01/10/22 DKK 94,964 USD 14,416 (106)
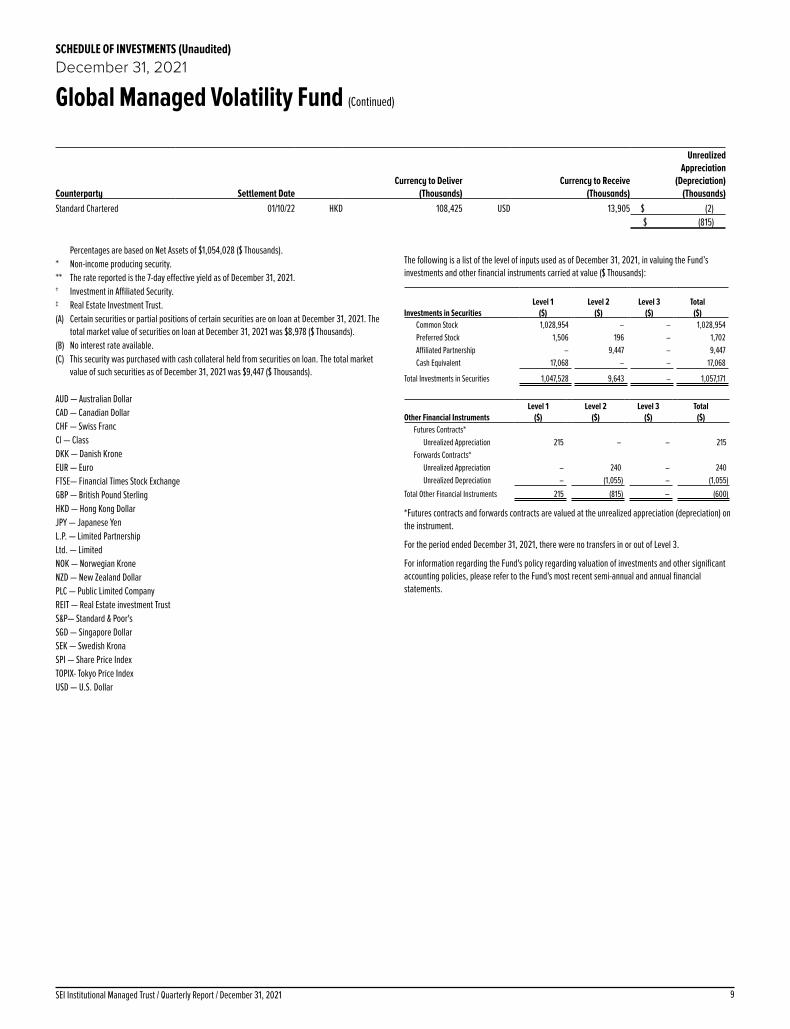
9SEI Institutional Managed Trust / Quarterly Report / December 31, 2021
SCHEDULE OF INVESTMENTS (Unaudited)December 31, 2021
Global Managed Volatility Fund (Continued)
Counterparty Settlement DateCurrency to Deliver
(Thousands)Currency to Receive
(Thousands)
Unrealized Appreciation
(Depreciation) (Thousands)
Standard Chartered 01/10/22 HKD 108,425 USD 13,905 $ (2) $ (815)
Percentages are based on Net Assets of $1,054,028 ($ Thousands).* Non-income producing security.** The rate reported is the 7-day effective yield as of December 31, 2021.† Investment in Affiliated Security.‡ Real Estate Investment Trust.(A) Certain securities or partial positions of certain securities are on loan at December 31, 2021. The
total market value of securities on loan at December 31, 2021 was $8,978 ($ Thousands).(B) No interest rate available.(C) This security was purchased with cash collateral held from securities on loan. The total market
value of such securities as of December 31, 2021 was $9,447 ($ Thousands).
AUD — Australian DollarCAD — Canadian DollarCHF — Swiss FrancCl — ClassDKK — Danish KroneEUR — EuroFTSE— Financial Times Stock ExchangeGBP — British Pound SterlingHKD — Hong Kong DollarJPY — Japanese YenL.P. — Limited PartnershipLtd. — LimitedNOK — Norwegian KroneNZD — New Zealand DollarPLC — Public Limited CompanyREIT — Real Estate investment TrustS&P— Standard & Poor'sSGD — Singapore DollarSEK — Swedish KronaSPI — Share Price IndexTOPIX- Tokyo Price IndexUSD — U.S. Dollar
The following is a list of the level of inputs used as of December 31, 2021, in valuing the Fund’s investments and other financial instruments carried at value ($ Thousands):
Investments in SecuritiesLevel 1
($)Level 2
($)Level 3
($)Total
($)Common Stock 1,028,954 – – 1,028,954Preferred Stock 1,506 196 – 1,702Affiliated Partnership – 9,447 – 9,447Cash Equivalent 17,068 – – 17,068
Total Investments in Securities 1,047,528 9,643 – 1,057,171
Other Financial InstrumentsLevel 1
($)Level 2
($)Level 3
($)Total
($)Futures Contracts*
Unrealized Appreciation 215 – – 215Forwards Contracts*
Unrealized Appreciation – 240 – 240Unrealized Depreciation – (1,055) – (1,055)
Total Other Financial Instruments 215 (815) – (600)
*Futures contracts and forwards contracts are valued at the unrealized appreciation (depreciation) on the instrument.
For the period ended December 31, 2021, there were no transfers in or out of Level 3.
For information regarding the Fund's policy regarding valuation of investments and other significant accounting policies, please refer to the Fund's most recent semi-annual and annual financial statements.

SEI Institutional Managed Trust / Quarterly Report / December 31, 202110
SCHEDULE OF INVESTMENTS (Unaudited)December 31, 2021
Global Managed Volatility Fund (Concluded)
The following is a summary of the transactions with affiliates for the period ended December 31, 2021 ($ Thousands):
Security Description Value 9/30/2021 Purchases at Cost Proceeds from
Sales Realized Gain/
(Loss)
Change in Unrealized
Appreciation/(Depreciation)
Value12/31/2021 Shares Income Capital Gains
SEI Liquidity Fund, L.P. $ 13,534 $ 21,850 $ (25,937) $ — $ — $ 9,447 9,445,960 $ 13 $ — SEI Daily Income Trust, Government Fund, Cl F 9,489 39,308 (31,729) — — 17,068 17,068,221 — — Totals $ 23,023 $ 61,158 $ (57,666) $ — $ — $ 26,515 $ 13 $ —
Amounts designated as “—” are $0 or have been rounded to $0.
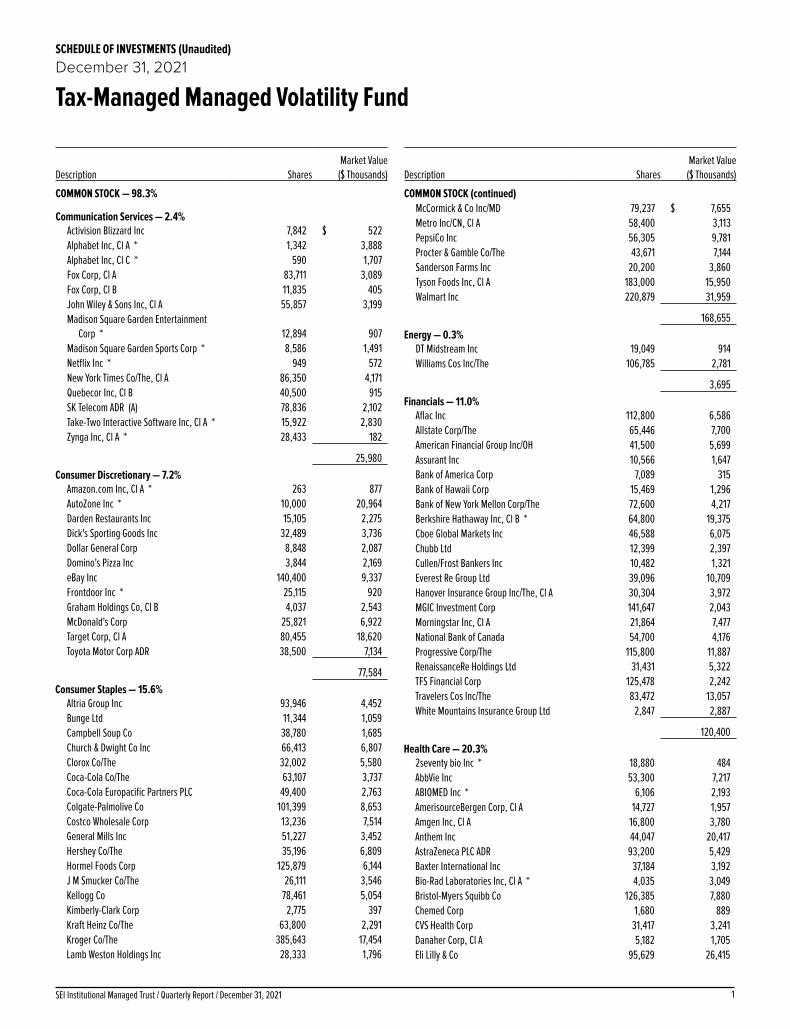
1SEI Institutional Managed Trust / Quarterly Report / December 31, 2021
SCHEDULE OF INVESTMENTS (Unaudited)December 31, 2021
Tax-Managed Managed Volatility Fund
Description SharesMarket Value
($ Thousands)
COMMON STOCK — 98.3%
Communication Services — 2.4%Activision Blizzard Inc 7,842 $ 522Alphabet Inc, Cl A * 1,342 3,888Alphabet Inc, Cl C * 590 1,707Fox Corp, Cl A 83,711 3,089Fox Corp, Cl B 11,835 405John Wiley & Sons Inc, Cl A 55,857 3,199Madison Square Garden Entertainment
Corp * 12,894 907Madison Square Garden Sports Corp * 8,586 1,491Netflix Inc * 949 572New York Times Co/The, Cl A 86,350 4,171Quebecor Inc, Cl B 40,500 915SK Telecom ADR (A) 78,836 2,102Take-Two Interactive Software Inc, Cl A * 15,922 2,830Zynga Inc, Cl A * 28,433 182
25,980Consumer Discretionary — 7.2%
Amazon.com Inc, Cl A * 263 877AutoZone Inc * 10,000 20,964Darden Restaurants Inc 15,105 2,275Dick's Sporting Goods Inc 32,489 3,736Dollar General Corp 8,848 2,087Domino's Pizza Inc 3,844 2,169eBay Inc 140,400 9,337Frontdoor Inc * 25,115 920Graham Holdings Co, Cl B 4,037 2,543McDonald's Corp 25,821 6,922Target Corp, Cl A 80,455 18,620Toyota Motor Corp ADR 38,500 7,134
77,584Consumer Staples — 15.6%
Altria Group Inc 93,946 4,452Bunge Ltd 11,344 1,059Campbell Soup Co 38,780 1,685Church & Dwight Co Inc 66,413 6,807Clorox Co/The 32,002 5,580Coca-Cola Co/The 63,107 3,737Coca-Cola Europacific Partners PLC 49,400 2,763Colgate-Palmolive Co 101,399 8,653Costco Wholesale Corp 13,236 7,514General Mills Inc 51,227 3,452Hershey Co/The 35,196 6,809Hormel Foods Corp 125,879 6,144J M Smucker Co/The 26,111 3,546Kellogg Co 78,461 5,054Kimberly-Clark Corp 2,775 397Kraft Heinz Co/The 63,800 2,291Kroger Co/The 385,643 17,454Lamb Weston Holdings Inc 28,333 1,796
Description SharesMarket Value
($ Thousands)
COMMON STOCK (continued)McCormick & Co Inc/MD 79,237 $ 7,655Metro Inc/CN, Cl A 58,400 3,113PepsiCo Inc 56,305 9,781Procter & Gamble Co/The 43,671 7,144Sanderson Farms Inc 20,200 3,860Tyson Foods Inc, Cl A 183,000 15,950Walmart Inc 220,879 31,959
168,655Energy — 0.3%
DT Midstream Inc 19,049 914Williams Cos Inc/The 106,785 2,781
3,695Financials — 11.0%
Aflac Inc 112,800 6,586Allstate Corp/The 65,446 7,700American Financial Group Inc/OH 41,500 5,699Assurant Inc 10,566 1,647Bank of America Corp 7,089 315Bank of Hawaii Corp 15,469 1,296Bank of New York Mellon Corp/The 72,600 4,217Berkshire Hathaway Inc, Cl B * 64,800 19,375Cboe Global Markets Inc 46,588 6,075Chubb Ltd 12,399 2,397Cullen/Frost Bankers Inc 10,482 1,321Everest Re Group Ltd 39,096 10,709Hanover Insurance Group Inc/The, Cl A 30,304 3,972MGIC Investment Corp 141,647 2,043Morningstar Inc, Cl A 21,864 7,477National Bank of Canada 54,700 4,176Progressive Corp/The 115,800 11,887RenaissanceRe Holdings Ltd 31,431 5,322TFS Financial Corp 125,478 2,242Travelers Cos Inc/The 83,472 13,057White Mountains Insurance Group Ltd 2,847 2,887
120,400Health Care — 20.3%
2seventy bio Inc * 18,880 484AbbVie Inc 53,300 7,217ABIOMED Inc * 6,106 2,193AmerisourceBergen Corp, Cl A 14,727 1,957Amgen Inc, Cl A 16,800 3,780Anthem Inc 44,047 20,417AstraZeneca PLC ADR 93,200 5,429Baxter International Inc 37,184 3,192Bio-Rad Laboratories Inc, Cl A * 4,035 3,049Bristol-Myers Squibb Co 126,385 7,880Chemed Corp 1,680 889CVS Health Corp 31,417 3,241Danaher Corp, Cl A 5,182 1,705Eli Lilly & Co 95,629 26,415
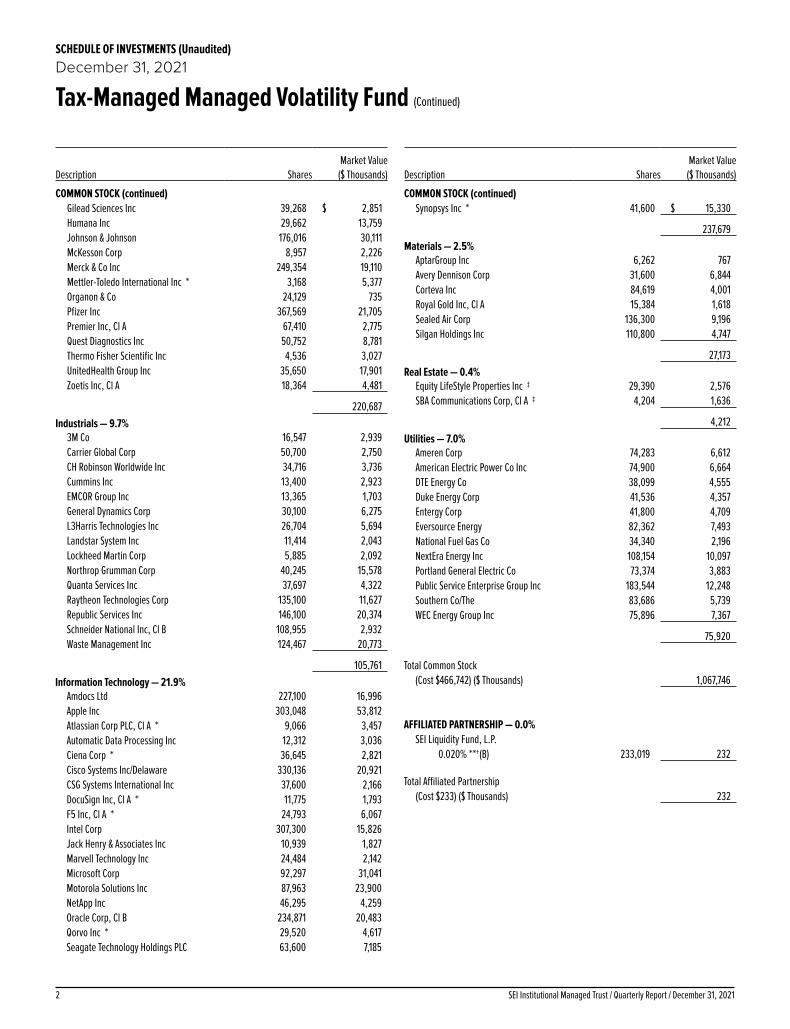
SEI Institutional Managed Trust / Quarterly Report / December 31, 20212
SCHEDULE OF INVESTMENTS (Unaudited)December 31, 2021
Tax-Managed Managed Volatility Fund (Continued)
Description SharesMarket Value
($ Thousands)
COMMON STOCK (continued)Gilead Sciences Inc 39,268 $ 2,851Humana Inc 29,662 13,759Johnson & Johnson 176,016 30,111McKesson Corp 8,957 2,226Merck & Co Inc 249,354 19,110Mettler-Toledo International Inc * 3,168 5,377Organon & Co 24,129 735Pfizer Inc 367,569 21,705Premier Inc, Cl A 67,410 2,775Quest Diagnostics Inc 50,752 8,781Thermo Fisher Scientific Inc 4,536 3,027UnitedHealth Group Inc 35,650 17,901Zoetis Inc, Cl A 18,364 4,481
220,687Industrials — 9.7%
3M Co 16,547 2,939Carrier Global Corp 50,700 2,750CH Robinson Worldwide Inc 34,716 3,736Cummins Inc 13,400 2,923EMCOR Group Inc 13,365 1,703General Dynamics Corp 30,100 6,275L3Harris Technologies Inc 26,704 5,694Landstar System Inc 11,414 2,043Lockheed Martin Corp 5,885 2,092Northrop Grumman Corp 40,245 15,578Quanta Services Inc 37,697 4,322Raytheon Technologies Corp 135,100 11,627Republic Services Inc 146,100 20,374Schneider National Inc, Cl B 108,955 2,932Waste Management Inc 124,467 20,773
105,761Information Technology — 21.9%
Amdocs Ltd 227,100 16,996Apple Inc 303,048 53,812Atlassian Corp PLC, Cl A * 9,066 3,457Automatic Data Processing Inc 12,312 3,036Ciena Corp * 36,645 2,821Cisco Systems Inc/Delaware 330,136 20,921CSG Systems International Inc 37,600 2,166DocuSign Inc, Cl A * 11,775 1,793F5 Inc, Cl A * 24,793 6,067Intel Corp 307,300 15,826Jack Henry & Associates Inc 10,939 1,827Marvell Technology Inc 24,484 2,142Microsoft Corp 92,297 31,041Motorola Solutions Inc 87,963 23,900NetApp Inc 46,295 4,259Oracle Corp, Cl B 234,871 20,483Qorvo Inc * 29,520 4,617Seagate Technology Holdings PLC 63,600 7,185
Description SharesMarket Value
($ Thousands)
COMMON STOCK (continued)Synopsys Inc * 41,600 $ 15,330
237,679Materials — 2.5%
AptarGroup Inc 6,262 767Avery Dennison Corp 31,600 6,844Corteva Inc 84,619 4,001Royal Gold Inc, Cl A 15,384 1,618Sealed Air Corp 136,300 9,196Silgan Holdings Inc 110,800 4,747
27,173Real Estate — 0.4%
Equity LifeStyle Properties Inc ‡ 29,390 2,576SBA Communications Corp, Cl A ‡ 4,204 1,636
4,212Utilities — 7.0%
Ameren Corp 74,283 6,612American Electric Power Co Inc 74,900 6,664DTE Energy Co 38,099 4,555Duke Energy Corp 41,536 4,357Entergy Corp 41,800 4,709Eversource Energy 82,362 7,493National Fuel Gas Co 34,340 2,196NextEra Energy Inc 108,154 10,097Portland General Electric Co 73,374 3,883Public Service Enterprise Group Inc 183,544 12,248Southern Co/The 83,686 5,739WEC Energy Group Inc 75,896 7,367
75,920
Total Common Stock
(Cost $466,742) ($ Thousands) 1,067,746
AFFILIATED PARTNERSHIP — 0.0%SEI Liquidity Fund, L.P.
0.020% **†(B) 233,019 232
Total Affiliated Partnership (Cost $233) ($ Thousands) 232
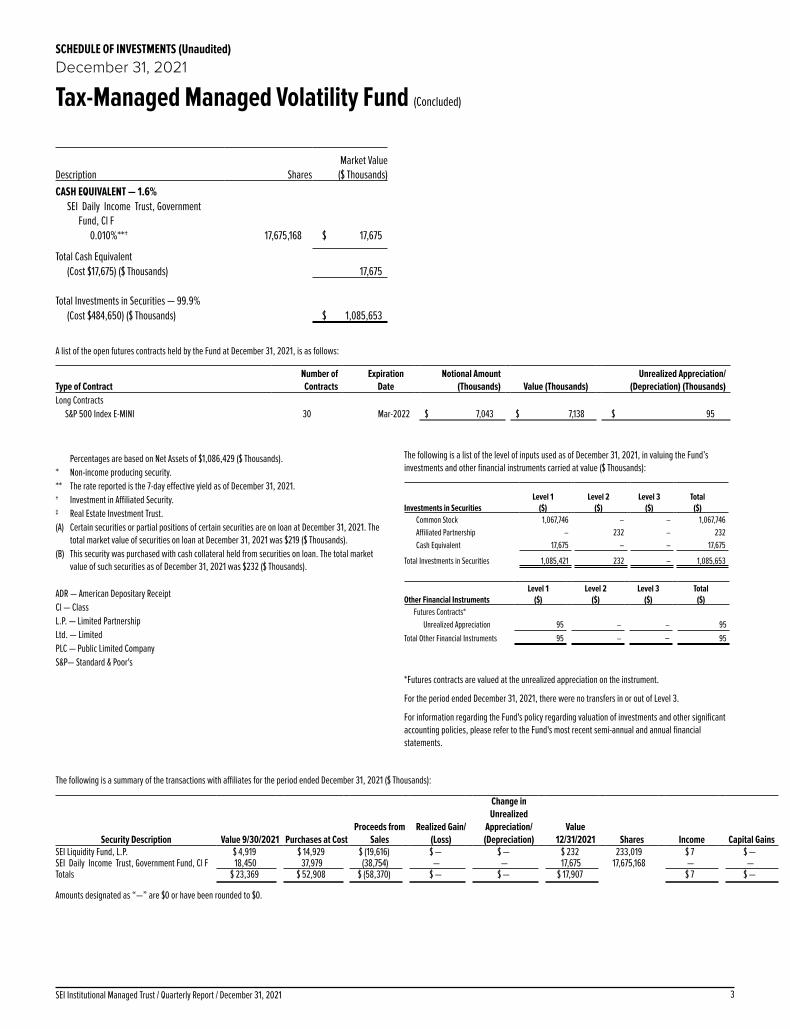
3SEI Institutional Managed Trust / Quarterly Report / December 31, 2021
SCHEDULE OF INVESTMENTS (Unaudited)December 31, 2021
Tax-Managed Managed Volatility Fund (Concluded)
Description SharesMarket Value
($ Thousands)CASH EQUIVALENT — 1.6%
SEI Daily Income Trust, Government Fund, Cl F
0.010%**† 17,675,168 $ 17,675
Total Cash Equivalent(Cost $17,675) ($ Thousands) 17,675
Total Investments in Securities — 99.9%(Cost $484,650) ($ Thousands) $ 1,085,653
A list of the open futures contracts held by the Fund at December 31, 2021, is as follows:
Type of ContractNumber of Contracts
Expiration Date
Notional Amount (Thousands) Value (Thousands)
Unrealized Appreciation/ (Depreciation) (Thousands)
Long ContractsS&P 500 Index E-MINI 30 Mar-2022 $ 7,043 $ 7,138 $ 95
Percentages are based on Net Assets of $1,086,429 ($ Thousands).* Non-income producing security.** The rate reported is the 7-day effective yield as of December 31, 2021.† Investment in Affiliated Security.‡ Real Estate Investment Trust.(A) Certain securities or partial positions of certain securities are on loan at December 31, 2021. The
total market value of securities on loan at December 31, 2021 was $219 ($ Thousands).(B) This security was purchased with cash collateral held from securities on loan. The total market
value of such securities as of December 31, 2021 was $232 ($ Thousands).
ADR — American Depositary ReceiptCl — ClassL.P. — Limited PartnershipLtd. — LimitedPLC — Public Limited CompanyS&P— Standard & Poor's
The following is a list of the level of inputs used as of December 31, 2021, in valuing the Fund’s investments and other financial instruments carried at value ($ Thousands):
Investments in SecuritiesLevel 1
($)Level 2
($)Level 3
($)Total
($)Common Stock 1,067,746 – – 1,067,746Affiliated Partnership – 232 – 232Cash Equivalent 17,675 – – 17,675
Total Investments in Securities 1,085,421 232 – 1,085,653
Other Financial InstrumentsLevel 1
($)Level 2
($)Level 3
($)Total
($)Futures Contracts*
Unrealized Appreciation 95 – – 95
Total Other Financial Instruments 95 – – 95
*Futures contracts are valued at the unrealized appreciation on the instrument.
For the period ended December 31, 2021, there were no transfers in or out of Level 3.
For information regarding the Fund's policy regarding valuation of investments and other significant accounting policies, please refer to the Fund's most recent semi-annual and annual financial statements.
The following is a summary of the transactions with affiliates for the period ended December 31, 2021 ($ Thousands):
Security Description Value 9/30/2021 Purchases at Cost Proceeds from
Sales Realized Gain/
(Loss)
Change in Unrealized
Appreciation/(Depreciation)
Value 12/31/2021 Shares Income Capital Gains
SEI Liquidity Fund, L.P. $ 4,919 $ 14,929 $ (19,616) $ — $ — $ 232 233,019 $ 7 $ — SEI Daily Income Trust, Government Fund, Cl F 18,450 37,979 (38,754) — — 17,675 17,675,168 — — Totals $ 23,369 $ 52,908 $ (58,370) $ — $ — $ 17,907 $ 7 $ —
Amounts designated as “—” are $0 or have been rounded to $0.

1SEI Institutional Managed Trust / Quarterly Report / December 31, 2021
SCHEDULE OF INVESTMENTS (Unaudited)December 31, 2021
Tax-Managed International Managed Volatility Fund
Description SharesMarket Value
($ Thousands)
COMMON STOCK — 96.0%Australia — 5.4%
Abacus Property Group ‡ 117,177 $ 323AGL Energy Ltd 212,782 951Ansell 50,216 1,151ASX Ltd 5,643 381Aurizon Holdings Ltd 566,069 1,439AusNet Services 198,571 371Bendigo & Adelaide Bank 74,373 492BlueScope Steel Ltd 6,598 100Charter Hall Long Wale ‡ 89,728 330Coles Group Ltd 78,882 1,028CSL Ltd 3,824 809Deterra Royalties 101,448 318Elders Ltd 57,879 517Endeavour Group 21,286 104Harvey Norman Holdings Ltd 469,181 1,685Inghams Group Ltd 330,641 844JB Hi-Fi 41,355 1,452Medibank Pvt 47,280 115Metcash, Cl A 361,737 1,185Newcrest Mining Ltd 13,198 235Orora 269,202 686REA Group Ltd 3,994 486Rio Tinto Ltd 14,158 1,033Sonic Healthcare Ltd 53,941 1,831Telstra Corp Ltd, Cl B 502,620 1,526TPG Telecom 25,359 108Treasury Wine Estates Ltd 37,848 340Wesfarmers Ltd 36,388 1,567Woolworths Group Ltd 21,286 588
21,995Austria — 1.2%
ANDRITZ AG 11,056 570CA Immobilien Anlagen AG 4,737 178Erste Group Bank AG 6,526 307EVN AG 6,728 203Mayr Melnhof Karton 4,405 886Oesterreichische Post AG 37,629 1,615S IMMO AG ‡ 9,548 236Telekom Austria AG, Cl A 81,520 706voestalpine AG 2,463 90
4,791Belgium — 1.1%
Ageas 29,613 1,534Etablissements Franz Colruyt 26,582 1,126Proximus SADP 49,034 956UCB SA, Cl A 5,816 664
4,280Canada — 2.4%
Bank of Nova Scotia, Cl C 13,689 971Canadian Imperial Bank of Commerce 15,826 1,847Canadian Tire Corp Ltd, Cl A 18,075 2,596
Description SharesMarket Value
($ Thousands)
COMMON STOCK (continued)Cogeco Communications 18,559 $ 1,480Empire Co Ltd, Cl A 34,652 1,057Loblaw Cos Ltd 24,108 1,978
9,929Denmark — 3.2%
AP Moller - Maersk A/S, Cl B 311 1,114Carlsberg A/S, Cl B 10,243 1,768Coloplast A/S, Cl B 10,603 1,862Danske Bank A/S 60,283 1,039DSV A/S 3,400 793Genmab A/S * 1,478 590Jyske Bank A/S 16,645 856Novo Nordisk A/S, Cl B 15,879 1,786Novozymes A/S, Cl B 2,754 226Royal Unibrew A/S 2,426 273Scandinavian Tobacco Group A/S 73,722 1,549Solar, Cl B 3,143 383Sydbank A/S 22,507 710UIE 564 160
13,109Finland — 1.8%
Aspo 3,559 46Elisa Oyj 6,082 374Kemira 53,724 813Kesko Oyj, Cl B 61,076 2,035Kone Oyj, Cl B 1,458 105Orion Oyj, Cl B 26,784 1,112TietoEVRY 41,758 1,304Tokmanni Group 30,857 690Valmet 16,417 703
7,182France — 9.2%
Arkema SA 8,090 1,139AXA SA 35,915 1,070BNP Paribas SA 3,209 222Caisse Regionale de Credit Agricole Mutuel
Brie Picardie 4,916 118Caisse Regionale de Credit Agricole Mutuel
Nord de France 4,065 94Carrefour SA 209,341 3,834Cie de L'Odet 80 121Cie Generale des Etablissements Michelin
SCA 20,163 3,305Covivio ‡ 1,293 106Credit Agricole 22,471 321Danone SA 3,206 199Dassault Systemes 8,698 518Engie SA 50,101 742Eurofins Scientific 10,084 1,248Eutelsat Communications SA 80,872 987Hermes International 1,456 2,543Ipsen SA 3,763 345

SEI Institutional Managed Trust / Quarterly Report / December 31, 20212
SCHEDULE OF INVESTMENTS (Unaudited)December 31, 2021
Tax-Managed International Managed Volatility Fund (Continued)
Description SharesMarket Value
($ Thousands)
COMMON STOCK (continued)Lagardere SCA 3,725 $ 103Legrand SA 6,656 779L'Oreal SA 3,384 1,605Metropole Television SA 56,336 1,099Orange SA 253,102 2,709Pernod Ricard SA 6,112 1,470Prodware 6,476 64Publicis Groupe SA 3,995 269Sanofi 66,653 6,714Sartorius Stedim Biotech 869 477SEB SA 1,787 278Societe BIC SA 25,897 1,394Societe Generale SA 34,187 1,174Societe LDC 865 95Stellantis 9,533 181Technip Energies * 7,749 113Thales SA, Cl A 6,701 570TOTAL SA 4,439 225Virbac 506 244Vivendi SA 39,336 532Wendel SA 1,943 233
37,240Germany — 6.1%
adidas AG 674 194Bayerische Motoren Werke AG 11,655 1,173Deutsche Post AG 43,140 2,774Deutsche Telekom AG 184,690 3,423E.ON SE 187,301 2,597Freenet AG 64,676 1,711Hannover Rueck SE 1,509 287Henkel AG & Co KGaA 12,280 959Hornbach Holding AG & Co KGaA 12,407 1,869Knorr-Bremse AG 9,277 917Merck KGaA 11,676 3,014Muenchener Rueckversicherungs-
Gesellschaft AG in Muenchen 5,603 1,660QIAGEN NV * 2,128 119SAP SE 1,064 151Scout24 8,275 578Siemens Healthineers AG 6,608 495Sirius Real Estate Ltd ‡ 87,389 167Talanx 3,767 182Uniper SE 52,457 2,494Vonovia SE ‡ 3,062 169
24,933Hong Kong — 3.6%
BOC Hong Kong Holdings Ltd 255,500 837China Motor Bus Co Ltd ‡ 9,200 113CK Hutchison Holdings Ltd 154,500 997CK Infrastructure Holdings Ltd 94,000 599CLP Holdings Ltd, Cl B 226,000 2,283Dah Sing Banking Group Ltd 585,600 500
Description SharesMarket Value
($ Thousands)
COMMON STOCK (continued)HK Electric Investments & HK Electric
Investments Ltd 1,490,000 $ 1,462HKT Trust & HKT Ltd 1,380,000 1,855Hutchison Telecommunications Hong Kong
Holdings 1,162,000 186Kerry Properties Ltd ‡ 283,000 737Lee & Man Paper Manufacturing Ltd 697,000 484Pacific Textiles Holdings 788,000 372PCCW Ltd 1,257,704 637Power Assets Holdings Ltd 186,500 1,163SmarTone Telecommunications Holdings 328,500 175VTech Holdings Ltd 286,300 2,242
14,642Ireland — 0.5%
Dole 11,373 151ICON PLC * 3,702 1,147Kerry Group PLC, Cl A 4,704 606
1,904Israel — 0.9%
Albaad Massuot Yitzhak * 8,411 85Bank Hapoalim BM 61,461 632Bank Leumi Le-Israel BM 115,413 1,240Elbit Systems Ltd 2,298 399Isracard Ltd – –Kerur Holdings Ltd 4,093 131Mizrahi Tefahot Bank Ltd 12,013 463Nice Ltd * 1,413 429Shufersal Ltd 26,493 221
3,600Italy — 2.1%
A2A SpA 821,655 1,602ACEA 54,526 1,164Assicurazioni Generali SpA 16,518 349Enel SpA 99,794 798Eni SpA 28,956 401Ferrari NV 388 101Hera SpA 309,958 1,289Intesa Sanpaolo SpA 58,793 152Iren SpA 38,535 116Terna - Rete Elettrica Nazionale 41,284 333UnipolSai Assicurazioni 764,986 2,151
8,456Japan — 22.3%
AEON Investment ‡ 755 1,057Aozora Bank Ltd (A) 37,600 822Arcs Co Ltd 55,100 1,021Bandai Namco Holdings Inc 2,300 179Bridgestone (A) 32,900 1,414Calbee Inc 19,500 452Canon Inc (A) 104,200 2,533Choushimaru Co Ltd 10,500 101COMSYS Holdings Corp 6,300 140
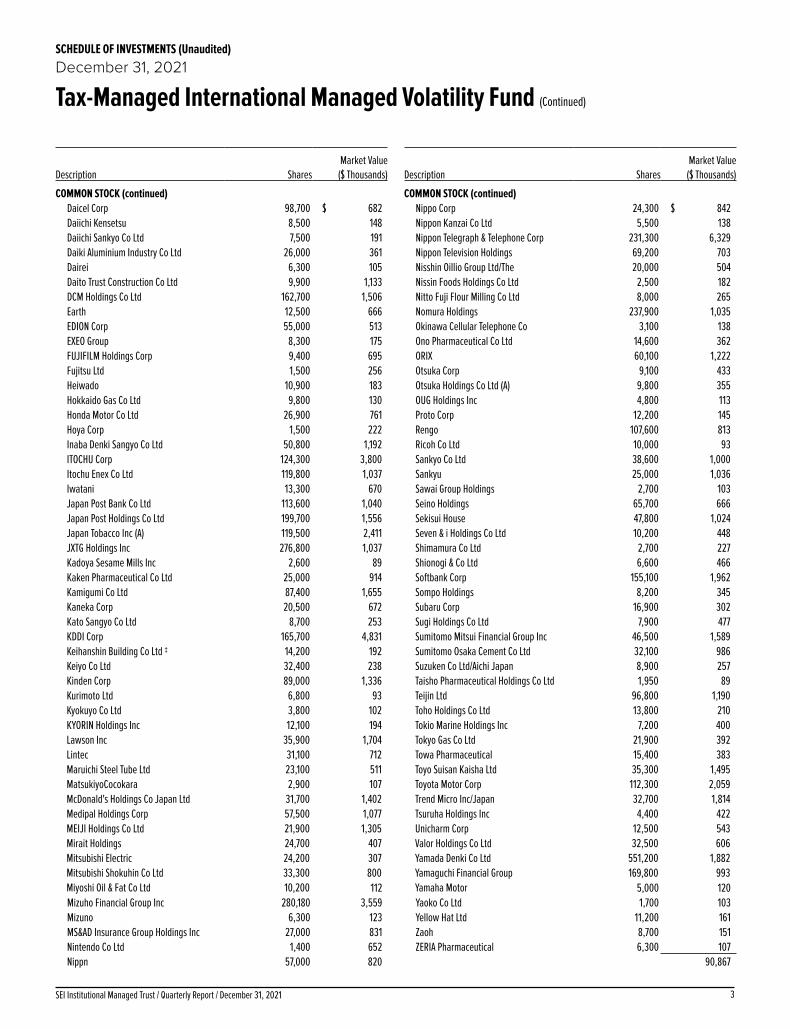
3SEI Institutional Managed Trust / Quarterly Report / December 31, 2021
SCHEDULE OF INVESTMENTS (Unaudited)December 31, 2021
Tax-Managed International Managed Volatility Fund (Continued)
Description SharesMarket Value
($ Thousands)
COMMON STOCK (continued)Daicel Corp 98,700 $ 682Daiichi Kensetsu 8,500 148Daiichi Sankyo Co Ltd 7,500 191Daiki Aluminium Industry Co Ltd 26,000 361Dairei 6,300 105Daito Trust Construction Co Ltd 9,900 1,133DCM Holdings Co Ltd 162,700 1,506Earth 12,500 666EDION Corp 55,000 513EXEO Group 8,300 175FUJIFILM Holdings Corp 9,400 695Fujitsu Ltd 1,500 256Heiwado 10,900 183Hokkaido Gas Co Ltd 9,800 130Honda Motor Co Ltd 26,900 761Hoya Corp 1,500 222Inaba Denki Sangyo Co Ltd 50,800 1,192ITOCHU Corp 124,300 3,800Itochu Enex Co Ltd 119,800 1,037Iwatani 13,300 670Japan Post Bank Co Ltd 113,600 1,040Japan Post Holdings Co Ltd 199,700 1,556Japan Tobacco Inc (A) 119,500 2,411JXTG Holdings Inc 276,800 1,037Kadoya Sesame Mills Inc 2,600 89Kaken Pharmaceutical Co Ltd 25,000 914Kamigumi Co Ltd 87,400 1,655Kaneka Corp 20,500 672Kato Sangyo Co Ltd 8,700 253KDDI Corp 165,700 4,831Keihanshin Building Co Ltd ‡ 14,200 192Keiyo Co Ltd 32,400 238Kinden Corp 89,000 1,336Kurimoto Ltd 6,800 93Kyokuyo Co Ltd 3,800 102KYORIN Holdings Inc 12,100 194Lawson Inc 35,900 1,704Lintec 31,100 712Maruichi Steel Tube Ltd 23,100 511MatsukiyoCocokara 2,900 107McDonald's Holdings Co Japan Ltd 31,700 1,402Medipal Holdings Corp 57,500 1,077MEIJI Holdings Co Ltd 21,900 1,305Mirait Holdings 24,700 407Mitsubishi Electric 24,200 307Mitsubishi Shokuhin Co Ltd 33,300 800Miyoshi Oil & Fat Co Ltd 10,200 112Mizuho Financial Group Inc 280,180 3,559Mizuno 6,300 123MS&AD Insurance Group Holdings Inc 27,000 831Nintendo Co Ltd 1,400 652Nippn 57,000 820
Description SharesMarket Value
($ Thousands)
COMMON STOCK (continued)Nippo Corp 24,300 $ 842Nippon Kanzai Co Ltd 5,500 138Nippon Telegraph & Telephone Corp 231,300 6,329Nippon Television Holdings 69,200 703Nisshin Oillio Group Ltd/The 20,000 504Nissin Foods Holdings Co Ltd 2,500 182Nitto Fuji Flour Milling Co Ltd 8,000 265Nomura Holdings 237,900 1,035Okinawa Cellular Telephone Co 3,100 138Ono Pharmaceutical Co Ltd 14,600 362ORIX 60,100 1,222Otsuka Corp 9,100 433Otsuka Holdings Co Ltd (A) 9,800 355OUG Holdings Inc 4,800 113Proto Corp 12,200 145Rengo 107,600 813Ricoh Co Ltd 10,000 93Sankyo Co Ltd 38,600 1,000Sankyu 25,000 1,036Sawai Group Holdings 2,700 103Seino Holdings 65,700 666Sekisui House 47,800 1,024Seven & i Holdings Co Ltd 10,200 448Shimamura Co Ltd 2,700 227Shionogi & Co Ltd 6,600 466Softbank Corp 155,100 1,962Sompo Holdings 8,200 345Subaru Corp 16,900 302Sugi Holdings Co Ltd 7,900 477Sumitomo Mitsui Financial Group Inc 46,500 1,589Sumitomo Osaka Cement Co Ltd 32,100 986Suzuken Co Ltd/Aichi Japan 8,900 257Taisho Pharmaceutical Holdings Co Ltd 1,950 89Teijin Ltd 96,800 1,190Toho Holdings Co Ltd 13,800 210Tokio Marine Holdings Inc 7,200 400Tokyo Gas Co Ltd 21,900 392Towa Pharmaceutical 15,400 383Toyo Suisan Kaisha Ltd 35,300 1,495Toyota Motor Corp 112,300 2,059Trend Micro Inc/Japan 32,700 1,814Tsuruha Holdings Inc 4,400 422Unicharm Corp 12,500 543Valor Holdings Co Ltd 32,500 606Yamada Denki Co Ltd 551,200 1,882Yamaguchi Financial Group 169,800 993Yamaha Motor 5,000 120Yaoko Co Ltd 1,700 103Yellow Hat Ltd 11,200 161Zaoh 8,700 151ZERIA Pharmaceutical 6,300 107
90,867

SEI Institutional Managed Trust / Quarterly Report / December 31, 20214
SCHEDULE OF INVESTMENTS (Unaudited)December 31, 2021
Tax-Managed International Managed Volatility Fund (Continued)
Description SharesMarket Value
($ Thousands)
COMMON STOCK (continued)Netherlands — 3.6%
ABN AMRO Bank NV 11,695 $ 172ASML Holding NV 751 603Heineken NV 6,605 743JDE Peet's 8,450 260Koninklijke Ahold Delhaize NV 207,688 7,117Koninklijke KPN NV 75,711 235NN Group NV 62,608 3,390Randstad NV 3,774 258Signify NV 18,561 861Universal Music Group 16,699 471Wolters Kluwer NV 5,179 610
14,720New Zealand — 0.9%
EBOS Group Ltd 5,627 159Fisher & Paykel Healthcare Corp Ltd 34,373 771Freightways Ltd 64,774 570Mainfreight Ltd 17,090 1,098Mercury NZ Ltd 109,078 457Meridian Energy 35,190 117Spark New Zealand Ltd 98,605 305
3,477Norway — 1.1%
Austevoll Seafood ASA 41,885 505DNB Bank 22,448 513Norsk Hydro ASA 104,457 824Orkla ASA 172,578 1,729Sparebank 1 Oestlandet 6,917 114SpareBank 1 SMN 6,562 111SpareBank 1 SR-Bank 17,208 260Telenor ASA 32,325 508
4,564Portugal — 0.7%
Jeronimo Martins SGPS SA 86,576 1,979NOS SGPS SA 37,349 145Sonae SGPS 467,890 533
2,657Singapore — 2.7%
DBS Group Holdings Ltd 125,500 3,040Great Eastern Holdings 6,700 100Jardine Cycle & Carriage Ltd 123,600 1,889Mapletree Industrial Trust ‡ 59,850 120Mapletree Logistics Trust ‡ 154,270 218Olam International Ltd 140,500 182Oversea-Chinese Banking Corp Ltd 241,700 2,044Sheng Siong Group Ltd 553,500 600Straits Trading 74,500 183United Overseas Bank Ltd 104,800 2,091Venture Corp Ltd 17,400 236Wilmar International Ltd 124,500 382
11,085
Description SharesMarket Value
($ Thousands)
COMMON STOCK (continued)Spain — 2.3%
CaixaBank SA 37,980 $ 104Cia de Distribucion Integral Logista
Holdings 81,284 1,626Ebro Foods SA 45,648 878Endesa SA 109,975 2,524Faes Farma 146,861 584Iberdrola SA 149,089 1,762Red Electrica Corp SA 85,948 1,861Repsol SA, Cl A 8,805 105
9,444Sweden — 2.1%
Axfood AB 54,195 1,558Epiroc, Cl B 14,793 314Industrivarden, Cl A 127 4KNOW IT AB 7,589 314Nordea Bank Abp, Cl A 110,952 1,353Nyfosa ‡ 18,745 322Samhallsbyggnadsbolaget i Norden ‡ 93,792 688Skandinaviska Enskilda Banken AB, Cl A 35,084 487Svenska Cellulosa AB SCA, Cl B 11,438 203Svenska Handelsbanken AB, Cl A 17,680 191Swedbank AB, Cl A 41,164 826Swedish Match 202,565 1,609Telefonaktiebolaget LM Ericsson, Cl B 69,843 765
8,634Switzerland — 10.0%
Alcon Inc 6,004 530ALSO Holding AG 606 200Baloise Holding AG 11,303 1,846Banque Cantonale de Geneve 570 100Banque Cantonale Vaudoise 2,566 199Barry Callebaut AG 491 1,193Basellandschaftliche Kantonalbank 408 407Berner Kantonalbank AG 473 105BKW AG 18,318 2,390Chocoladefabriken Lindt & Spruengli AG 155 2,749dormakaba Holding 596 394Emmi 905 1,070EMS-Chemie Holding AG 1,134 1,269Helvetia Holding 6,900 812Intershop Holding AG ‡ 203 137Kuehne + Nagel International AG 410 132Logitech International SA 834 70Nestle SA 10,269 1,437Novartis AG 32,351 2,842PSP Swiss Property AG ‡ 3,835 479Roche Holding 262 117Roche Holding AG 22,417 9,317Romande Energie Holding SA 76 114Schindler Holding AG 2,723 732SGS SA, Cl B 219 731
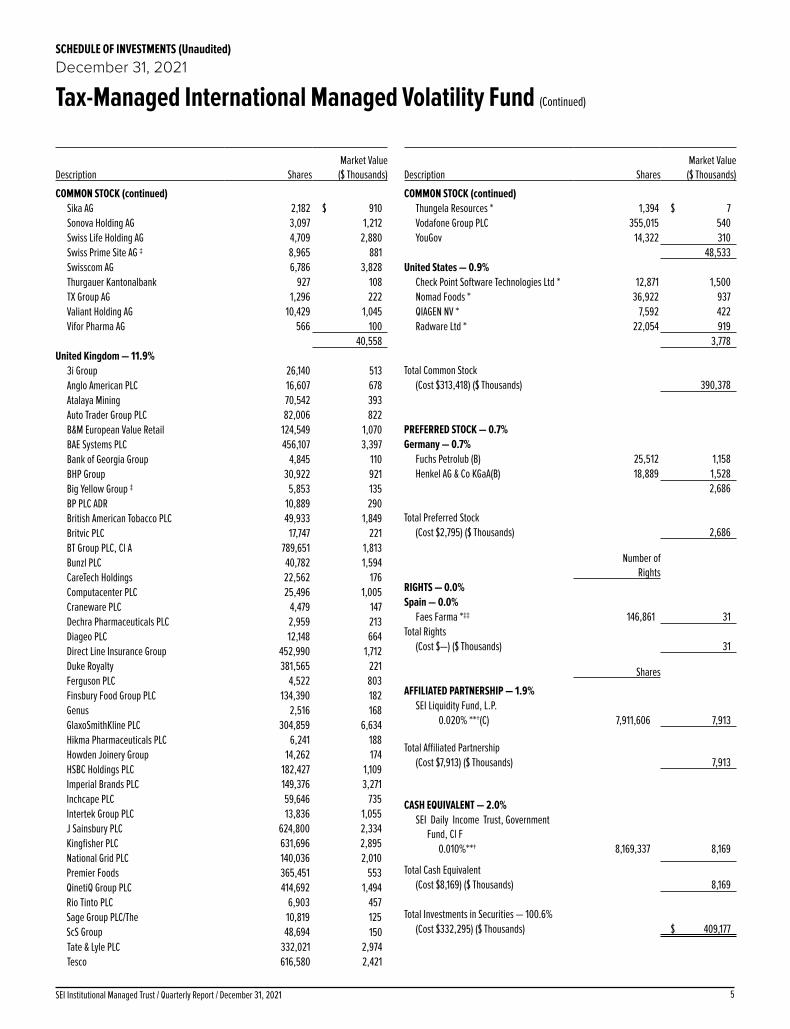
5SEI Institutional Managed Trust / Quarterly Report / December 31, 2021
SCHEDULE OF INVESTMENTS (Unaudited)December 31, 2021
Tax-Managed International Managed Volatility Fund (Continued)
Description SharesMarket Value
($ Thousands)
COMMON STOCK (continued)Sika AG 2,182 $ 910Sonova Holding AG 3,097 1,212Swiss Life Holding AG 4,709 2,880Swiss Prime Site AG ‡ 8,965 881Swisscom AG 6,786 3,828Thurgauer Kantonalbank 927 108TX Group AG 1,296 222Valiant Holding AG 10,429 1,045Vifor Pharma AG 566 100
40,558United Kingdom — 11.9%
3i Group 26,140 513Anglo American PLC 16,607 678Atalaya Mining 70,542 393Auto Trader Group PLC 82,006 822B&M European Value Retail 124,549 1,070BAE Systems PLC 456,107 3,397Bank of Georgia Group 4,845 110BHP Group 30,922 921Big Yellow Group ‡ 5,853 135BP PLC ADR 10,889 290British American Tobacco PLC 49,933 1,849Britvic PLC 17,747 221BT Group PLC, Cl A 789,651 1,813Bunzl PLC 40,782 1,594CareTech Holdings 22,562 176Computacenter PLC 25,496 1,005Craneware PLC 4,479 147Dechra Pharmaceuticals PLC 2,959 213Diageo PLC 12,148 664Direct Line Insurance Group 452,990 1,712Duke Royalty 381,565 221Ferguson PLC 4,522 803Finsbury Food Group PLC 134,390 182Genus 2,516 168GlaxoSmithKline PLC 304,859 6,634Hikma Pharmaceuticals PLC 6,241 188Howden Joinery Group 14,262 174HSBC Holdings PLC 182,427 1,109Imperial Brands PLC 149,376 3,271Inchcape PLC 59,646 735Intertek Group PLC 13,836 1,055J Sainsbury PLC 624,800 2,334Kingfisher PLC 631,696 2,895National Grid PLC 140,036 2,010Premier Foods 365,451 553QinetiQ Group PLC 414,692 1,494Rio Tinto PLC 6,903 457Sage Group PLC/The 10,819 125ScS Group 48,694 150Tate & Lyle PLC 332,021 2,974Tesco 616,580 2,421
Description SharesMarket Value
($ Thousands)
COMMON STOCK (continued)Thungela Resources * 1,394 $ 7Vodafone Group PLC 355,015 540YouGov 14,322 310
48,533United States — 0.9%
Check Point Software Technologies Ltd * 12,871 1,500Nomad Foods * 36,922 937QIAGEN NV * 7,592 422Radware Ltd * 22,054 919
3,778
Total Common Stock
(Cost $313,418) ($ Thousands) 390,378
PREFERRED STOCK — 0.7%Germany — 0.7%
Fuchs Petrolub (B) 25,512 1,158Henkel AG & Co KGaA(B) 18,889 1,528
2,686
Total Preferred Stock
(Cost $2,795) ($ Thousands) 2,686
Number of Rights
RIGHTS — 0.0%Spain — 0.0%
Faes Farma *‡‡ 146,861 31Total Rights
(Cost $—) ($ Thousands) 31
Shares
AFFILIATED PARTNERSHIP — 1.9%SEI Liquidity Fund, L.P.
0.020% **†(C) 7,911,606 7,913
Total Affiliated Partnership (Cost $7,913) ($ Thousands) 7,913
CASH EQUIVALENT — 2.0%SEI Daily Income Trust, Government
Fund, Cl F0.010%**† 8,169,337 8,169
Total Cash Equivalent(Cost $8,169) ($ Thousands) 8,169
Total Investments in Securities — 100.6%(Cost $332,295) ($ Thousands) $ 409,177

SEI Institutional Managed Trust / Quarterly Report / December 31, 20216
SCHEDULE OF INVESTMENTS (Unaudited)December 31, 2021
Tax-Managed International Managed Volatility Fund (Concluded)
A list of the open futures contracts held by the Fund at December 31, 2021, is as follows:
Type of ContractNumber of Contracts
Expiration Date
Notional Amount (Thousands) Value (Thousands)
Unrealized Appreciation/ (Depreciation) (Thousands)
Long ContractsEuro STOXX 50 51 Mar-2022 $ 2,406 $ 2,486 $ 59FTSE 100 Index 10 Mar-2022 951 992 19Hang Seng Index 2 Jan-2022 296 301 5SPI 200 Index 5 Mar-2022 647 668 7TOPIX Index 13 Mar-2022 2,269 2,250 3
$ 6,569 $ 6,697 $ 93
Percentages are based on Net Assets of $406,540 ($ Thousands).* Non-income producing security.** The rate reported is the 7-day effective yield as of December 31, 2021.† Investment in Affiliated Security.‡ Real Estate Investment Trust.‡‡ Expiration date not available.(A) Certain securities or partial positions of certain securities are on loan at December 31, 2021. The
total market value of securities on loan at December 31, 2021 was $7,520 ($ Thousands).(B) There is no interest rate available.(C) This security was purchased with cash collateral held from securities on loan. The total market
value of such securities as of December 31, 2021 was $7,913 ($ Thousands).
ADR — American Depositary ReceiptCl — ClassFTSE— Financial Times Stock ExchangeL.P. — Limited PartnershipLtd. — LimitedPLC — Public Limited CompanySPI — Share Price IndexTOPIX- Tokyo Price Index
The following is a list of the level of inputs used as of December 31, 2021, in valuing the Fund’s investments and other financial instruments carried at value ($ Thousands):
Investments in SecuritiesLevel 1
($)Level 2
($)Level 3
($)Total
($)Common Stock 390,378 – – 390,378Preferred Stock 1,528 1,158 – 2,686Rights 31 – – 31Affiliated Partnership – 7,913 – 7,913Cash Equivalent 8,169 – – 8,169
Total Investments in Securities 400,106 9,071 – 409,177
Other Financial InstrumentsLevel 1
($)Level 2
($)Level 3
($)Total
($)Futures Contracts*
Unrealized Appreciation 93 – – 93
Total Other Financial Instruments 93 – – 93
*Futures contracts are valued at the unrealized appreciation on the instrument.
For the period ended December 31, 2021, there were no transfers in or out of Level 3.
For information regarding the Fund's policy regarding valuation of investments and other significant accounting policies, please refer to the Fund's most recent semi-annual and annual financial statements.
The following is a summary of the transactions with affiliates for the period ended December 31, 2021 ($ Thousands):
Security Description 9/30/2021 Purchases at Cost Proceeds from
Sales Realized Gain/
(Loss)
Change in Unrealized
Appreciation/(Depreciation)
Value 12/31/2021 Shares Income Capital Gains
SEI Liquidity Fund, L.P. $ 19,946 $ 12,478 $ (24,511) $ — $ — $ 7,913 7,911,606 $ 103 $ — SEI Daily Income Trust, Government Fund, Cl F 8,193 7,564 (7,588) — — 8,169 8,169,337 — — Totals $ 28,139 $ 20,042 $ (32,099) $ — $ — $ 16,082 $ 103 $ —
Amounts designated as “—” are $0 or have been rounded to $0.

1SEI Institutional Managed Trust / Quarterly Report / December 31, 2021
SCHEDULE OF INVESTMENTS (Unaudited)December 31, 2021
Real Estate Fund
Description SharesMarket Value
($ Thousands)
COMMON STOCK— 98.8%
Real Estate — 98.8%Acadia Realty Trust ‡ 61,330 $ 1,339Alexandria Real Estate Equities Inc ‡ 6,630 1,478American Campus Communities Inc ‡ 43,986 2,520American Homes 4 Rent, Cl A ‡ 26,777 1,168American Tower Corp, Cl A ‡ 15,975 4,673Americold Realty Trust ‡ 23,210 761Apple Hospitality Inc ‡ 23,309 376AvalonBay Communities Inc ‡ 23,474 5,929Brixmor Property Group Inc ‡ 133,331 3,388Cousins Properties Inc ‡ 38,350 1,545Digital Realty Trust Inc, Cl A ‡ 22,120 3,912Diversified Healthcare Trust ‡ 82,084 254Duke Realty Corp ‡ 63,720 4,183Empire State Realty Trust Inc, Cl A ‡ 62,400 555Equinix Inc ‡ 11,642 9,847Equity Residential ‡ 47,088 4,262Essex Property Trust Inc ‡ 3,267 1,151Extra Space Storage Inc ‡ 8,510 1,930First Industrial Realty Trust Inc ‡ 28,596 1,893Healthpeak Properties Inc ‡ 60,272 2,175Host Hotels & Resorts Inc *‡ 108,664 1,890Hudson Pacific Properties Inc ‡ 65,640 1,622Independence Realty Trust Inc ‡ 33,806 873Invitation Homes Inc ‡ 118,917 5,392JBG SMITH Properties ‡ 51,000 1,464Kilroy Realty Corp ‡ 31,400 2,087Kite Realty Group Trust ‡ 34,300 747Life Storage Inc ‡ 24,690 3,782Medical Properties Trust Inc ‡ 53,285 1,259Mid-America Apartment Communities Inc ‡ 12,500 2,868Omega Healthcare Investors Inc ‡ 29,370 869Park Hotels & Resorts Inc *‡ 44,240 835Phillips Edison & Co Inc ‡ 11,802 390Prologis Inc ‡ 73,090 12,305Public Storage ‡ 18,520 6,937Rexford Industrial Realty Inc ‡ 38,330 3,109RPT Realty ‡ 48,750 652Sabra Health Care Inc ‡ 92,296 1,250SBA Communications Corp, Cl A ‡ 1,570 611Simon Property Group Inc ‡ 26,430 4,223SL Green Realty Corp ‡ 11,790 845Sun Communities Inc ‡ 20,095 4,219UDR Inc ‡ 68,735 4,123Ventas Inc ‡ 88,350 4,516Veris Residential Inc *‡ 58,515 1,076Welltower Inc ‡ 37,950 3,255WeWork Inc, Cl A *(A) 19,454 167WP Carey Inc ‡ 16,880 1,385Xenia Hotels & Resorts Inc *‡ 66,710 1,208
127,298
Description SharesMarket Value
($ Thousands)
COMMON STOCK(continued)
Total Common Stock (Cost $83,247) ($ Thousands) $ 127,298
AFFILIATED PARTNERSHIP — 0.1%SEI Liquidity Fund, L.P.
0.020% **†(B) 63,905 63
Total Affiliated Partnership(Cost $64) ($ Thousands) 63
CASH EQUIVALENT — 0.9%SEI Daily Income Trust, Government
Fund, Cl F0.010%**† 1,189,516 1,190
Total Cash Equivalent(Cost $1,190) ($ Thousands) 1,190
Total Investments in Securities — 99.8%(Cost $84,501) ($ Thousands) $ 128,551
Percentages are based on Net Assets of $128,793 ($ Thousands).* Non-income producing security.‡ Real Estate Investment Trust.** The rate reported is the 7-day effective yield as of December 31, 2021.(A) Certain securities or partial positions of certain securities are on loan at December 31, 2021. The
total market value of securities on loan at December 31, 2021 was $42 ($ Thousands).(B) This security was purchased with cash collateral held from securities on loan. The total market
value of such securities as of December 31, 2021 was $63 ($ Thousands).† Investment in Affiliated Security.
Cl — ClassL.P. — Limited PartnershipREIT — Real Estate investment Trust
The following is a list of the levels of inputs used as of December 31, 2021 in valuing the Fund’s investments and other financial instruments carried at value ($ Thousands):
Investments in SecuritiesLevel 1
($)Level 2
($)Level 3
($)Total
($)Common Stock 127,298 – – 127,298Affiliated Partnership – 63 – 63Cash Equivalent 1,190 – – 1,190
128,551Total Investments in Securities 128,488 63 –
For the period ended December 31, 2021, there were no transfers in or out of Level 3.
For information regarding the Fund's policy regarding valuation of investments and other significant accounting policies, please refer to the Fund's most recent semi-annual and annual financial statements.

SEI Institutional Managed Trust / Quarterly Report / December 31, 20212
SCHEDULE OF INVESTMENTS (Unaudited)December 31, 2021
Real Estate Fund (Concluded)
-
The following is a summary of the transactions with affiliates for the period ended December 31, 2021 ($ Thousands):
Security Description Value 9/30/2021 Purchases at Cost Proceeds from
Sales Realized Gain/
(Loss)
Change in Unrealized
Appreciation/(Depreciation)
Value 12/31/2021 Shares Income Capital Gains
SEI Liquidity Fund, L.P. $ — $ 300 $ (235) $ — $ (2) $ 63 63,905 $ — $ — SEI Daily Income Trust, Government Fund, Cl F 2,210 17,674 (18,695) — 1 1,190 1,189,516 — — Totals $ 2,210 $ 17,974 $ (18,930) $ — $ (1) $ 1,253 $ — $ —
Amounts designated as “—” are $0 or have been rounded to $0.

1SEI Institutional Managed Trust / Quarterly Report / December 31, 2021
SCHEDULE OF INVESTMENTS (Unaudited)December 31, 2021
Core Fixed Income Fund (Continued)
DescriptionFace Amount (Thousands)
Market Value ($ Thousands)
U.S. TREASURY OBLIGATIONS — 34.7%U.S. Treasury Bills (A)
0.180%, 06/23/2022 $ 9,975 $ 9,9670.121%, 06/16/2022 6,085 6,0810.120%, 06/09/2022 35,270 35,2530.110%, 04/26/2022 11,040 11,0370.045%, 01/27/2022 64,475 64,4740.045%, 02/03/2022 4,010 4,010
U.S. Treasury Bonds 2.500%, 02/15/2045 2,479 2,7262.395%, 05/15/2049 (A) 5,380 3,1872.375%, 05/15/2051 8,520 9,4112.250%, 05/15/2041 20,983 22,0392.000%, 11/15/2041 31,822 32,1852.000%, 02/15/2050 4,840 4,9162.000%, 08/15/2051 32,892 33,5291.875%, 02/15/2041 9,413 9,3171.875%, 02/15/2051 13,100 12,9611.875%, 11/15/2051 89,271 88,5601.750%, 08/15/2041 80,382 77,9331.625%, 11/15/2050 13,877 12,9291.375%, 11/15/2040 15,365 14,0031.375%, 08/15/2050 49,146 43,0511.250%, 05/15/2050 28,650 24,3291.125%, 05/15/2040 13,102 11,4841.125%, 08/15/2040 16,784 14,654
U.S. Treasury Inflation Protected Securities 0.125%, 02/15/2051 3,107 3,678
U.S. Treasury Notes 2.125%, 05/15/2025 7,842 8,1172.000%, 02/15/2022 8,164 8,1831.875%, 02/28/2022 11,021 11,0521.750%, 02/28/2022 662 6641.625%, 05/15/2031 6,420 6,5011.500%, 09/30/2024 3,330 3,3831.500%, 11/30/2028 9,339 9,3751.375%, 10/31/2028 20,810 20,7251.375%, 12/31/2028 82,700 82,3251.375%, 11/15/2031 71,780 70,8711.250%, 11/30/2026 95,290 95,2301.250%, 12/31/2026 84,988 84,8951.250%, 03/31/2028 260 2581.250%, 04/30/2028 22,020 21,8201.250%, 05/31/2028 9,290 9,1981.250%, 06/30/2028 4,310 4,2661.250%, 09/30/2028 17,325 17,1211.250%, 08/15/2031 6,310 6,1691.125%, 10/31/2026 73,500 73,0121.125%, 08/31/2028 8,290 8,1291.000%, 12/15/2024 17,873 17,8921.000%, 07/31/2028 8,090 7,8760.875%, 06/30/2026 10,802 10,6310.875%, 09/30/2026 19,821 19,467
DescriptionFace Amount (Thousands)
Market Value ($ Thousands)
U.S. TREASURY OBLIGATIONS (continued)0.750%, 12/31/2023 $ 76,903 $ 76,9180.750%, 11/15/2024 2,520 2,5060.750%, 04/30/2026 11,680 11,4490.750%, 05/31/2026 15,770 15,4460.750%, 01/31/2028 25,600 24,6520.625%, 12/31/2027 2,090 2,0000.500%, 11/30/2023 110,230 109,8080.500%, 02/28/2026 13,031 12,6610.500%, 08/31/2027 7,641 7,2910.375%, 10/31/2023 65,726 65,3380.375%, 04/15/2024 7,023 6,9520.375%, 11/30/2025 12,794 12,4080.375%, 12/31/2025 13,587 13,1700.375%, 01/31/2026 9,331 9,0270.250%, 09/30/2023 8,450 8,3910.250%, 11/15/2023 120 1190.250%, 05/15/2024 9,650 9,5180.250%, 06/15/2024 7,905 7,7890.250%, 05/31/2025 2,280 2,2180.250%, 06/30/2025 360 3500.250%, 08/31/2025 5,837 5,6540.250%, 09/30/2025 70 680.250%, 10/31/2025 11,195 10,8200.125%, 05/31/2022 3,212 3,2110.125%, 07/31/2022 40 400.125%, 09/30/2022 4,853 4,8470.125%, 12/31/2022 12,843 12,8030.125%, 03/31/2023 14,403 14,3370.125%, 08/31/2023 341 3380.125%, 01/15/2024 6,204 6,126
Total U.S. Treasury Obligations
(Cost $1,615,274) ($ Thousands) 1,605,129
CORPORATE OBLIGATIONS — 30.8%Communication Services — 3.3%
Alphabet 2.050%, 08/15/2050 400 3571.100%, 08/15/2030 240 2270.800%, 08/15/2027 220 2130.450%, 08/15/2025 110 108
AT&T 6.500%, 09/01/2037 1,335 1,7915.550%, 08/15/2041 130 1705.350%, 09/01/2040 130 1655.250%, 03/01/2037 2,420 2,9935.150%, 03/15/2042 25 314.850%, 03/01/2039 750 8964.750%, 05/15/2046 1,600 1,9324.500%, 05/15/2035 445 5144.350%, 03/01/2029 240 270

SEI Institutional Managed Trust / Quarterly Report / December 31, 20212
SCHEDULE OF INVESTMENTS (Unaudited)December 31, 2021
Core Fixed Income Fund (Continued)
SCHEDULE OF INVESTMENTS (Unaudited)December 31, 2021
Core Fixed Income Fund (Continued)
DescriptionFace Amount (Thousands)
Market Value ($ Thousands)
CORPORATE OBLIGATIONS (continued)4.350%, 06/15/2045 $ 350 $ 3953.800%, 02/15/2027 318 3453.800%, 12/01/2057 5,781 6,0183.650%, 06/01/2051 260 2693.650%, 09/15/2059 820 8283.550%, 09/15/2055 489 4913.500%, 06/01/2041 346 3563.500%, 09/15/2053 6,208 6,2633.300%, 02/01/2052 120 1183.100%, 02/01/2043 824 8013.000%, 06/30/2022 180 1812.550%, 12/01/2033 1,595 1,5602.300%, 06/01/2027 750 7632.250%, 02/01/2032 266 2571.700%, 03/25/2026 1,500 1,4921.650%, 02/01/2028 2,005 1,963
CCO Holdings 4.500%, 08/15/2030 (B) 50 514.500%, 05/01/2032 1,220 1,255
Charter Communications Operating 6.834%, 10/23/2055 70 1006.484%, 10/23/2045 110 1506.384%, 10/23/2035 10 135.750%, 04/01/2048 777 9695.375%, 04/01/2038 663 7915.375%, 05/01/2047 141 1684.908%, 07/23/2025 2,534 2,7904.800%, 03/01/2050 1,840 2,0604.464%, 07/23/2022 308 3134.400%, 12/01/2061 472 4884.200%, 03/15/2028 1,263 1,3833.900%, 06/01/2052 517 5183.750%, 02/15/2028 85 913.700%, 04/01/2051 170 1643.500%, 06/01/2041 427 4163.500%, 03/01/2042 963 9342.250%, 01/15/2029 1,446 1,411
Comcast 7.050%, 03/15/2033 90 1306.500%, 11/15/2035 97 1394.400%, 08/15/2035 1,770 2,1214.250%, 10/15/2030 560 6464.200%, 08/15/2034 220 2594.150%, 10/15/2028 2,220 2,5204.000%, 03/01/2048 70 813.999%, 11/01/2049 199 2313.969%, 11/01/2047 78 903.950%, 10/15/2025 90 983.750%, 04/01/2040 445 4983.700%, 04/15/2024 580 6163.400%, 04/01/2030 1,260 1,3753.400%, 07/15/2046 60 64
DescriptionFace Amount (Thousands)
Market Value ($ Thousands)
CORPORATE OBLIGATIONS (continued)3.300%, 04/01/2027 $ 190 $ 2043.250%, 11/01/2039 60 633.150%, 03/01/2026 390 4162.937%, 11/01/2056 (B) 533 5082.887%, 11/01/2051 (B) 1,175 1,1372.800%, 01/15/2051 170 1641.500%, 02/15/2031 2,045 1,930
Comcast Cable Communications Holdings 9.455%, 11/15/2022 180 194
Comcast Cable Holdings 10.125%, 04/15/2022 45 46
Corning 5.450%, 11/15/2079 725 957
Discovery Communications 4.000%, 09/15/2055 142 150
DISH DBS 7.750%, 07/01/2026 120 1275.875%, 11/15/2024 410 4215.250%, 12/01/2026 (B) 170 1735.125%, 06/01/2029 280 255
Fox 5.476%, 01/25/2039 520 6713.500%, 04/08/2030 310 334
Level 3 Financing 3.875%, 11/15/2029 (B) 1,760 1,7913.400%, 03/01/2027 (B) 1,455 1,502
Netflix 5.875%, 11/15/2028 619 7443.625%, 06/15/2025 (B) 577 608
NTT Finance 1.162%, 04/03/2026 (B) 2,250 2,207
SES Global Americas Holdings GP 5.300%, 03/25/2044 (B) 1,200 1,370
Sky 3.750%, 09/16/2024 (B) 1,090 1,161
Sprint Spectrum 5.152%, 03/20/2028 (B) 3,552 3,9164.738%, 03/20/2025 (B) 5,107 5,343
Telefonica Emisiones 5.213%, 03/08/2047 150 186
T-Mobile USA 4.375%, 04/15/2040 1,730 1,9783.875%, 04/15/2030 4,230 4,6273.750%, 04/15/2027 2,195 2,3773.500%, 04/15/2025 1,910 2,0243.500%, 04/15/2031 (B) 1,902 1,9793.400%, 10/15/2052 (B) 1,935 1,9263.375%, 04/15/2029 (B) 3,001 3,0582.875%, 02/15/2031 460 4542.700%, 03/15/2032 (B) 70 702.625%, 02/15/2029 330 3252.550%, 02/15/2031 1,159 1,153

3SEI Institutional Managed Trust / Quarterly Report / December 31, 2021
SCHEDULE OF INVESTMENTS (Unaudited)December 31, 2021
Core Fixed Income Fund (Continued)
DescriptionFace Amount (Thousands)
Market Value ($ Thousands)
CORPORATE OBLIGATIONS (continued)2.250%, 02/15/2026 (B) $ 3,945 $ 3,9552.050%, 02/15/2028 100 99
Verizon Communications 5.500%, 03/16/2047 60 845.250%, 03/16/2037 805 1,0464.862%, 08/21/2046 470 6054.500%, 08/10/2033 620 7294.400%, 11/01/2034 2,887 3,3634.329%, 09/21/2028 1,330 1,5114.272%, 01/15/2036 78 914.125%, 08/15/2046 320 3714.016%, 12/03/2029 714 8004.000%, 03/22/2050 170 1953.875%, 02/08/2029 210 2333.850%, 11/01/2042 610 6813.700%, 03/22/2061 985 1,0683.550%, 03/22/2051 960 1,0343.400%, 03/22/2041 652 6833.150%, 03/22/2030 360 3813.000%, 03/22/2027 140 1482.875%, 11/20/2050 1,681 1,5952.650%, 11/20/2040 2,307 2,1922.625%, 08/15/2026 1,000 1,0422.550%, 03/21/2031 3,059 3,0862.355%, 03/15/2032 (B) 5,121 5,0462.100%, 03/22/2028 400 4011.750%, 01/20/2031 410 3881.680%, 10/30/2030 650 618
ViacomCBS 6.875%, 04/30/2036 620 8875.900%, 10/15/2040 455 6054.950%, 01/15/2031 180 2144.950%, 05/19/2050 313 3994.750%, 05/15/2025 1,035 1,1354.200%, 05/19/2032 970 1,0943.875%, 04/01/2024 130 1373.700%, 08/15/2024 810 858
Vodafone Group 5.250%, 05/30/2048 1,810 2,3584.875%, 06/19/2049 1,544 1,9474.375%, 05/30/2028 670 754
Walt Disney 6.650%, 11/15/2037 235 3486.200%, 12/15/2034 65 914.700%, 03/23/2050 355 4684.625%, 03/23/2040 765 9513.600%, 01/13/2051 1,095 1,238
146,178
Consumer Discretionary — 1.6%Advance Auto Parts
3.900%, 04/15/2030 1,294 1,411
DescriptionFace Amount (Thousands)
Market Value ($ Thousands)
CORPORATE OBLIGATIONS (continued)Amazon.com
4.950%, 12/05/2044 $ 500 $ 6824.250%, 08/22/2057 110 1414.050%, 08/22/2047 380 4613.875%, 08/22/2037 910 1,0703.250%, 05/12/2061 336 3623.150%, 08/22/2027 680 7343.100%, 05/12/2051 1,074 1,1472.875%, 05/12/2041 1,355 1,4072.800%, 08/22/2024 245 2562.700%, 06/03/2060 151 1462.500%, 06/03/2050 550 5242.100%, 05/12/2031 1,852 1,8771.650%, 05/12/2028 1,209 1,2111.500%, 06/03/2030 350 3391.200%, 06/03/2027 672 6631.000%, 05/12/2026 2,206 2,1850.800%, 06/03/2025 560 554
American Honda Finance MTN 1.000%, 09/10/2025 1,250 1,230
AutoNation 4.750%, 06/01/2030 326 372
BMW US Capital 3.800%, 04/06/2023 (B) 700 726
Cox Communications 4.800%, 02/01/2035 (B) 890 1,0472.600%, 06/15/2031 (B) 675 674
CSC Holdings 4.500%, 11/15/2031 (B) 570 563
Daimler Finance North America 2.700%, 06/14/2024 (B) 595 6150.750%, 03/01/2024 (B) 980 971
Dollar General 3.250%, 04/15/2023 50 51
Ford Motor 5.291%, 12/08/2046 99 1164.750%, 01/15/2043 264 2913.250%, 02/12/2032 470 481
Ford Motor Credit 5.125%, 06/16/2025 400 4355.113%, 05/03/2029 200 2274.271%, 01/09/2027 1,040 1,1184.250%, 09/20/2022 1,000 1,0184.125%, 08/17/2027 200 2164.063%, 11/01/2024 259 2734.000%, 11/13/2030 950 1,0223.815%, 11/02/2027 261 2763.810%, 01/09/2024 300 3113.625%, 06/17/2031 1,491 1,5703.339%, 03/28/2022 1,730 1,7332.900%, 02/16/2028 200 2002.700%, 08/10/2026 1,476 1,489

SEI Institutional Managed Trust / Quarterly Report / December 31, 20214
SCHEDULE OF INVESTMENTS (Unaudited)December 31, 2021
Core Fixed Income Fund (Continued)
SCHEDULE OF INVESTMENTS (Unaudited)December 31, 2021
Core Fixed Income Fund (Continued)
DescriptionFace Amount (Thousands)
Market Value ($ Thousands)
CORPORATE OBLIGATIONS (continued)1.490%, VAR ICE LIBOR USD 3 Month
+ 1.270%, 03/28/2022 $ 1,100 $ 1,099General Motors
6.250%, 10/02/2043 260 3566.125%, 10/01/2025 320 3685.950%, 04/01/2049 80 1105.400%, 10/02/2023 190 2035.150%, 04/01/2038 240 2894.875%, 10/02/2023 315 335
General Motors Financial 4.350%, 01/17/2027 110 1214.250%, 05/15/2023 110 1144.150%, 06/19/2023 83 863.450%, 04/10/2022 415 4163.150%, 06/30/2022 870 880
Hanesbrands 4.875%, 05/15/2026 (B) 210 2244.625%, 05/15/2024 (B) 30 31
Hilton Domestic Operating 5.750%, 05/01/2028 (B) 150 1605.375%, 05/01/2025 (B) 460 479
Home Depot 4.250%, 04/01/2046 48 603.900%, 12/06/2028 40 453.900%, 06/15/2047 60 703.750%, 02/15/2024 66 703.350%, 04/15/2050 710 7743.300%, 04/15/2040 484 5253.125%, 12/15/2049 627 6612.700%, 04/15/2030 320 3362.500%, 04/15/2027 280 2922.375%, 03/15/2051 517 475
Hyundai Capital America 1.800%, 10/15/2025 (B) 807 8031.250%, 09/18/2023 (B) 505 505
Hyundai Capital America MTN 2.000%, 06/15/2028 (B) 490 4781.300%, 01/08/2026 (B) 1,006 9770.800%, 01/08/2024 (B) 860 848
Las Vegas Sands 3.200%, 08/08/2024 1,370 1,3952.900%, 06/25/2025 210 209
Lennar 4.750%, 11/29/2027 410 4644.500%, 04/30/2024 1,155 1,227
Lowe's 5.000%, 04/15/2040 965 1,2124.500%, 04/15/2030 200 232
Marriott International 5.750%, 05/01/2025 198 2234.625%, 06/15/2030 1,151 1,2953.500%, 10/15/2032 488 511
DescriptionFace Amount (Thousands)
Market Value ($ Thousands)
CORPORATE OBLIGATIONS (continued)2.850%, 04/15/2031 $ 797 $ 795
McDonald's MTN 4.875%, 12/09/2045 260 3344.450%, 03/01/2047 240 2934.450%, 09/01/2048 72 894.200%, 04/01/2050 530 6413.800%, 04/01/2028 665 7313.700%, 01/30/2026 220 2373.625%, 09/01/2049 180 1993.600%, 07/01/2030 290 3203.500%, 03/01/2027 510 5513.500%, 07/01/2027 200 2173.300%, 07/01/2025 320 3391.450%, 09/01/2025 80 81
MDC Holdings 6.000%, 01/15/2043 30 38
Newell Brands 4.700%, 04/01/2026 110 1204.350%, 04/01/2023 278 286
NIKE 3.375%, 03/27/2050 520 5883.250%, 03/27/2040 210 2282.850%, 03/27/2030 150 1592.750%, 03/27/2027 410 4342.400%, 03/27/2025 260 269
Nissan Motor 4.345%, 09/17/2027 (B) 1,100 1,1883.522%, 09/17/2025 (B) 1,190 1,2473.043%, 09/15/2023 (B) 580 595
QVC 4.850%, 04/01/2024 370 395
Sands China 5.400%, 08/08/2028 320 3445.125%, 08/08/2025 380 3993.800%, 01/08/2026 420 4222.850%, 03/08/2029 (B) 690 6492.300%, 03/08/2027 (B) 460 433
Starbucks 3.500%, 11/15/2050 1,705 1,8363.350%, 03/12/2050 120 1251.300%, 05/07/2022 410 411
Tapestry 3.050%, 03/15/2032 898 903
Target 2.250%, 04/15/2025 450 464
Time Warner Cable 7.300%, 07/01/2038 530 7506.750%, 06/15/2039 10 146.550%, 05/01/2037 138 1815.875%, 11/15/2040 1,405 1,7535.500%, 09/01/2041 1,599 1,939
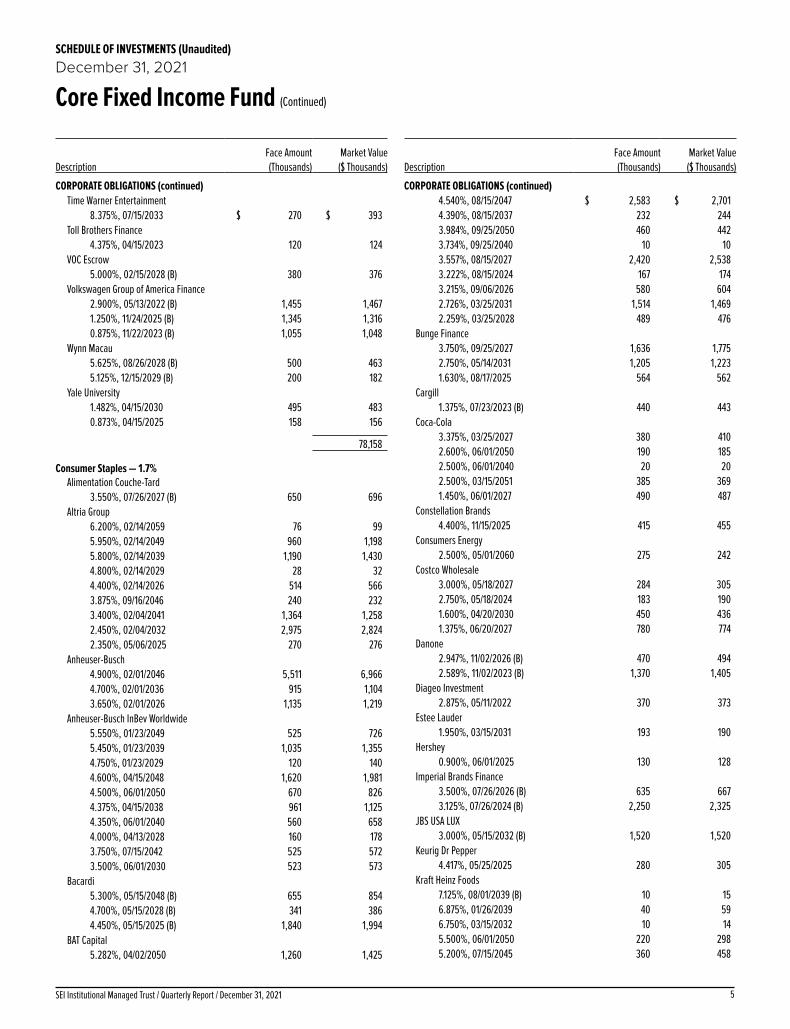
5SEI Institutional Managed Trust / Quarterly Report / December 31, 2021
SCHEDULE OF INVESTMENTS (Unaudited)December 31, 2021
Core Fixed Income Fund (Continued)
DescriptionFace Amount (Thousands)
Market Value ($ Thousands)
CORPORATE OBLIGATIONS (continued)Time Warner Entertainment
8.375%, 07/15/2033 $ 270 $ 393Toll Brothers Finance
4.375%, 04/15/2023 120 124VOC Escrow
5.000%, 02/15/2028 (B) 380 376Volkswagen Group of America Finance
2.900%, 05/13/2022 (B) 1,455 1,4671.250%, 11/24/2025 (B) 1,345 1,3160.875%, 11/22/2023 (B) 1,055 1,048
Wynn Macau 5.625%, 08/26/2028 (B) 500 4635.125%, 12/15/2029 (B) 200 182
Yale University 1.482%, 04/15/2030 495 4830.873%, 04/15/2025 158 156
78,158
Consumer Staples — 1.7%Alimentation Couche-Tard
3.550%, 07/26/2027 (B) 650 696Altria Group
6.200%, 02/14/2059 76 995.950%, 02/14/2049 960 1,1985.800%, 02/14/2039 1,190 1,4304.800%, 02/14/2029 28 324.400%, 02/14/2026 514 5663.875%, 09/16/2046 240 2323.400%, 02/04/2041 1,364 1,2582.450%, 02/04/2032 2,975 2,8242.350%, 05/06/2025 270 276
Anheuser-Busch 4.900%, 02/01/2046 5,511 6,9664.700%, 02/01/2036 915 1,1043.650%, 02/01/2026 1,135 1,219
Anheuser-Busch InBev Worldwide 5.550%, 01/23/2049 525 7265.450%, 01/23/2039 1,035 1,3554.750%, 01/23/2029 120 1404.600%, 04/15/2048 1,620 1,9814.500%, 06/01/2050 670 8264.375%, 04/15/2038 961 1,1254.350%, 06/01/2040 560 6584.000%, 04/13/2028 160 1783.750%, 07/15/2042 525 5723.500%, 06/01/2030 523 573
Bacardi 5.300%, 05/15/2048 (B) 655 8544.700%, 05/15/2028 (B) 341 3864.450%, 05/15/2025 (B) 1,840 1,994
BAT Capital 5.282%, 04/02/2050 1,260 1,425
DescriptionFace Amount (Thousands)
Market Value ($ Thousands)
CORPORATE OBLIGATIONS (continued)4.540%, 08/15/2047 $ 2,583 $ 2,7014.390%, 08/15/2037 232 2443.984%, 09/25/2050 460 4423.734%, 09/25/2040 10 103.557%, 08/15/2027 2,420 2,5383.222%, 08/15/2024 167 1743.215%, 09/06/2026 580 6042.726%, 03/25/2031 1,514 1,4692.259%, 03/25/2028 489 476
Bunge Finance 3.750%, 09/25/2027 1,636 1,7752.750%, 05/14/2031 1,205 1,2231.630%, 08/17/2025 564 562
Cargill 1.375%, 07/23/2023 (B) 440 443
Coca-Cola 3.375%, 03/25/2027 380 4102.600%, 06/01/2050 190 1852.500%, 06/01/2040 20 202.500%, 03/15/2051 385 3691.450%, 06/01/2027 490 487
Constellation Brands 4.400%, 11/15/2025 415 455
Consumers Energy 2.500%, 05/01/2060 275 242
Costco Wholesale 3.000%, 05/18/2027 284 3052.750%, 05/18/2024 183 1901.600%, 04/20/2030 450 4361.375%, 06/20/2027 780 774
Danone 2.947%, 11/02/2026 (B) 470 4942.589%, 11/02/2023 (B) 1,370 1,405
Diageo Investment 2.875%, 05/11/2022 370 373
Estee Lauder 1.950%, 03/15/2031 193 190
Hershey 0.900%, 06/01/2025 130 128
Imperial Brands Finance 3.500%, 07/26/2026 (B) 635 6673.125%, 07/26/2024 (B) 2,250 2,325
JBS USA LUX 3.000%, 05/15/2032 (B) 1,520 1,520
Keurig Dr Pepper 4.417%, 05/25/2025 280 305
Kraft Heinz Foods 7.125%, 08/01/2039 (B) 10 156.875%, 01/26/2039 40 596.750%, 03/15/2032 10 145.500%, 06/01/2050 220 2985.200%, 07/15/2045 360 458

SEI Institutional Managed Trust / Quarterly Report / December 31, 20216
SCHEDULE OF INVESTMENTS (Unaudited)December 31, 2021
Core Fixed Income Fund (Continued)
SCHEDULE OF INVESTMENTS (Unaudited)December 31, 2021
Core Fixed Income Fund (Continued)
DescriptionFace Amount (Thousands)
Market Value ($ Thousands)
CORPORATE OBLIGATIONS (continued)5.000%, 06/04/2042 $ 1,250 $ 1,5554.875%, 10/01/2049 2,370 2,9774.625%, 10/01/2039 10 124.375%, 06/01/2046 160 1874.250%, 03/01/2031 110 1253.000%, 06/01/2026 380 397
Kroger 4.450%, 02/01/2047 130 158
Lamb Weston Holdings 4.875%, 05/15/2028 (B) 90 97
Land O' Lakes 6.000%, 11/15/2022 (B) 1,020 1,051
Mars 3.200%, 04/01/2030 (B) 210 2262.700%, 04/01/2025 (B) 370 3852.375%, 07/16/2040 (B) 300 286
Molson Coors Beverage 4.200%, 07/15/2046 1,123 1,2453.500%, 05/01/2022 100 101
Mondelez International 1.500%, 05/04/2025 660 661
Mondelez International Holdings Netherlands BV
2.125%, 09/19/2022 (B) 290 293PepsiCo
3.100%, 07/17/2022 59 602.875%, 10/15/2049 60 632.625%, 03/19/2027 50 522.250%, 03/19/2025 50 521.625%, 05/01/2030 440 4270.750%, 05/01/2023 530 531
Philip Morris International 4.500%, 03/20/2042 130 1502.500%, 08/22/2022 590 5972.500%, 11/02/2022 680 6902.100%, 05/01/2030 290 2841.125%, 05/01/2023 280 281
Procter & Gamble 3.000%, 03/25/2030 240 2612.800%, 03/25/2027 80 85
Reckitt Benckiser Treasury Services 2.750%, 06/26/2024 (B) 1,860 1,922
Reynolds American 8.125%, 05/01/2040 570 8277.250%, 06/15/2037 390 5195.850%, 08/15/2045 3,140 3,815
Sysco 3.150%, 12/14/2051 328 323
Walmart 3.300%, 04/22/2024 60 632.500%, 09/22/2041 260 2621.800%, 09/22/2031 110 109
DescriptionFace Amount (Thousands)
Market Value ($ Thousands)
CORPORATE OBLIGATIONS (continued)1.500%, 09/22/2028 $ 865 $ 860
77,467
Energy — 3.2%Aker BP
4.000%, 01/15/2031 (B) 456 493Apache
5.350%, 07/01/2049 230 2635.250%, 02/01/2042 90 1045.100%, 09/01/2040 205 2324.750%, 04/15/2043 390 4284.375%, 10/15/2028 200 2184.250%, 01/15/2044 890 9013.250%, 04/15/2022 86 86
BP Capital Markets 3.535%, 11/04/2024 100 1063.506%, 03/17/2025 520 554
BP Capital Markets America 3.790%, 02/06/2024 100 1053.633%, 04/06/2030 320 3533.410%, 02/11/2026 1,110 1,1843.379%, 02/08/2061 756 7773.194%, 04/06/2025 835 8813.119%, 05/04/2026 230 2433.000%, 02/24/2050 940 9252.772%, 11/10/2050 487 459
Cameron LNG 3.302%, 01/15/2035 (B) 660 6892.902%, 07/15/2031 (B) 140 146
Canadian Natural Resources 6.450%, 06/30/2033 50 64
Cheniere Corpus Christi Holdings 3.700%, 11/15/2029 938 1,005
Cheniere Energy 4.625%, 10/15/2028 260 277
Cheniere Energy Partners 4.000%, 03/01/2031 100 1053.250%, 01/31/2032 (B) 530 535
Chevron 3.191%, 06/24/2023 22 232.895%, 03/03/2024 560 5822.355%, 12/05/2022 15 151.995%, 05/11/2027 635 6451.554%, 05/11/2025 520 524
Chevron USA 3.850%, 01/15/2028 200 2213.250%, 10/15/2029 50 541.018%, 08/12/2027 425 409
Conoco Funding 7.250%, 10/15/2031 180 254
ConocoPhillips 5.900%, 10/15/2032 10 13
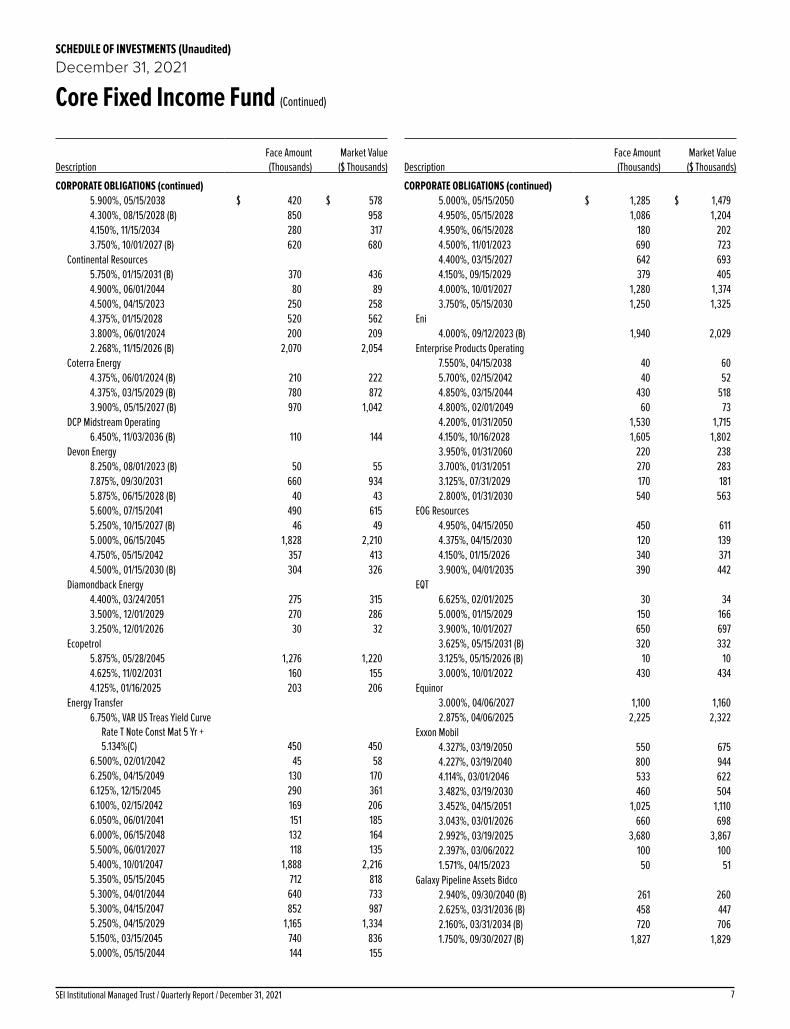
7SEI Institutional Managed Trust / Quarterly Report / December 31, 2021
SCHEDULE OF INVESTMENTS (Unaudited)December 31, 2021
Core Fixed Income Fund (Continued)
DescriptionFace Amount (Thousands)
Market Value ($ Thousands)
CORPORATE OBLIGATIONS (continued)5.900%, 05/15/2038 $ 420 $ 5784.300%, 08/15/2028 (B) 850 9584.150%, 11/15/2034 280 3173.750%, 10/01/2027 (B) 620 680
Continental Resources 5.750%, 01/15/2031 (B) 370 4364.900%, 06/01/2044 80 894.500%, 04/15/2023 250 2584.375%, 01/15/2028 520 5623.800%, 06/01/2024 200 2092.268%, 11/15/2026 (B) 2,070 2,054
Coterra Energy 4.375%, 06/01/2024 (B) 210 2224.375%, 03/15/2029 (B) 780 8723.900%, 05/15/2027 (B) 970 1,042
DCP Midstream Operating 6.450%, 11/03/2036 (B) 110 144
Devon Energy 8.250%, 08/01/2023 (B) 50 557.875%, 09/30/2031 660 9345.875%, 06/15/2028 (B) 40 435.600%, 07/15/2041 490 6155.250%, 10/15/2027 (B) 46 495.000%, 06/15/2045 1,828 2,2104.750%, 05/15/2042 357 4134.500%, 01/15/2030 (B) 304 326
Diamondback Energy 4.400%, 03/24/2051 275 3153.500%, 12/01/2029 270 2863.250%, 12/01/2026 30 32
Ecopetrol 5.875%, 05/28/2045 1,276 1,2204.625%, 11/02/2031 160 1554.125%, 01/16/2025 203 206
Energy Transfer 6.750%, VAR US Treas Yield Curve
Rate T Note Const Mat 5 Yr + 5.134%(C) 450 450
6.500%, 02/01/2042 45 586.250%, 04/15/2049 130 1706.125%, 12/15/2045 290 3616.100%, 02/15/2042 169 2066.050%, 06/01/2041 151 1856.000%, 06/15/2048 132 1645.500%, 06/01/2027 118 1355.400%, 10/01/2047 1,888 2,2165.350%, 05/15/2045 712 8185.300%, 04/01/2044 640 7335.300%, 04/15/2047 852 9875.250%, 04/15/2029 1,165 1,3345.150%, 03/15/2045 740 8365.000%, 05/15/2044 144 155
DescriptionFace Amount (Thousands)
Market Value ($ Thousands)
CORPORATE OBLIGATIONS (continued)5.000%, 05/15/2050 $ 1,285 $ 1,4794.950%, 05/15/2028 1,086 1,2044.950%, 06/15/2028 180 2024.500%, 11/01/2023 690 7234.400%, 03/15/2027 642 6934.150%, 09/15/2029 379 4054.000%, 10/01/2027 1,280 1,3743.750%, 05/15/2030 1,250 1,325
Eni 4.000%, 09/12/2023 (B) 1,940 2,029
Enterprise Products Operating 7.550%, 04/15/2038 40 605.700%, 02/15/2042 40 524.850%, 03/15/2044 430 5184.800%, 02/01/2049 60 734.200%, 01/31/2050 1,530 1,7154.150%, 10/16/2028 1,605 1,8023.950%, 01/31/2060 220 2383.700%, 01/31/2051 270 2833.125%, 07/31/2029 170 1812.800%, 01/31/2030 540 563
EOG Resources 4.950%, 04/15/2050 450 6114.375%, 04/15/2030 120 1394.150%, 01/15/2026 340 3713.900%, 04/01/2035 390 442
EQT 6.625%, 02/01/2025 30 345.000%, 01/15/2029 150 1663.900%, 10/01/2027 650 6973.625%, 05/15/2031 (B) 320 3323.125%, 05/15/2026 (B) 10 103.000%, 10/01/2022 430 434
Equinor 3.000%, 04/06/2027 1,100 1,1602.875%, 04/06/2025 2,225 2,322
Exxon Mobil 4.327%, 03/19/2050 550 6754.227%, 03/19/2040 800 9444.114%, 03/01/2046 533 6223.482%, 03/19/2030 460 5043.452%, 04/15/2051 1,025 1,1103.043%, 03/01/2026 660 6982.992%, 03/19/2025 3,680 3,8672.397%, 03/06/2022 100 1001.571%, 04/15/2023 50 51
Galaxy Pipeline Assets Bidco 2.940%, 09/30/2040 (B) 261 2602.625%, 03/31/2036 (B) 458 4472.160%, 03/31/2034 (B) 720 7061.750%, 09/30/2027 (B) 1,827 1,829

SEI Institutional Managed Trust / Quarterly Report / December 31, 20218
SCHEDULE OF INVESTMENTS (Unaudited)December 31, 2021
Core Fixed Income Fund (Continued)
SCHEDULE OF INVESTMENTS (Unaudited)December 31, 2021
Core Fixed Income Fund (Continued)
DescriptionFace Amount (Thousands)
Market Value ($ Thousands)
CORPORATE OBLIGATIONS (continued)Halliburton
5.000%, 11/15/2045 $ 80 $ 964.850%, 11/15/2035 60 713.800%, 11/15/2025 45 483.500%, 08/01/2023 3 3
Hess 6.000%, 01/15/2040 880 1,1185.600%, 02/15/2041 860 1,062
HollyFrontier 5.875%, 04/01/2026 620 695
KazMunayGas National JSC 5.750%, 04/19/2047 (B) 340 415
Kinder Morgan 5.550%, 06/01/2045 300 3795.200%, 03/01/2048 455 5625.050%, 02/15/2046 170 2044.300%, 06/01/2025 510 5514.300%, 03/01/2028 200 2223.150%, 01/15/2023 193 197
Kinder Morgan Energy Partners 5.500%, 03/01/2044 415 5095.400%, 09/01/2044 20 24
Lukoil Capital DAC 3.600%, 10/26/2031 (B) 720 7002.800%, 04/26/2027 (B) 705 694
Lundin Energy Finance BV 3.100%, 07/15/2031 (B) 2,172 2,1872.000%, 07/15/2026 (B) 1,160 1,152
Marathon Oil 5.200%, 06/01/2045 208 249
MEG Energy 5.875%, 02/01/2029 (B) 80 84
MPLX 5.500%, 02/15/2049 390 4984.875%, 12/01/2024 320 3474.800%, 02/15/2029 330 3774.700%, 04/15/2048 430 4964.500%, 04/15/2038 520 582
Northwest Pipeline 4.000%, 04/01/2027 219 238
Occidental Petroleum 7.875%, 09/15/2031 610 8147.500%, 05/01/2031 870 1,1456.950%, 07/01/2024 288 3206.600%, 03/15/2046 360 4676.450%, 09/15/2036 280 3575.550%, 03/15/2026 110 1224.625%, 06/15/2045 280 2914.500%, 07/15/2044 525 5414.400%, 04/15/2046 120 1234.200%, 03/15/2048 170 1704.100%, 02/15/2047 600 588
DescriptionFace Amount (Thousands)
Market Value ($ Thousands)
CORPORATE OBLIGATIONS (continued)3.400%, 04/15/2026 $ 270 $ 2773.000%, 02/15/2027 300 305
Oleoducto Central 4.000%, 07/14/2027 (B) 247 246
Parsley Energy 4.125%, 02/15/2028 (B) 60 60
Pertamina Persero 6.000%, 05/03/2042 (B) 300 367
Petrobras Global Finance BV 7.375%, 01/17/2027 310 3616.900%, 03/19/2049 1,870 1,9926.850%, 06/05/2115 820 8146.250%, 03/17/2024 1,394 1,5055.750%, 02/01/2029 300 3235.299%, 01/27/2025 1,278 1,374
Petroleos del Peru 5.625%, 06/19/2047 (B) 454 450
Petroleos Mexicanos 7.690%, 01/23/2050 150 1456.950%, 01/28/2060 780 6966.625%, 06/15/2035 767 7376.375%, 01/23/2045 1,105 9605.625%, 01/23/2046 480 3954.875%, 01/18/2024 32 332.460%, 12/15/2025 738 7582.378%, 04/15/2025 355 363
Petroleos Mexicanos MTN 6.875%, 08/04/2026 120 1326.750%, 09/21/2047 2,970 2,636
Phillips 66 1.300%, 02/15/2026 405 396
Pioneer Natural Resources 2.150%, 01/15/2031 450 4341.900%, 08/15/2030 867 8231.125%, 01/15/2026 110 107
Plains All American Pipeline 4.500%, 12/15/2026 495 5432.850%, 01/31/2023 250 253
Qatar Energy 3.300%, 07/12/2051 (B) 670 6903.125%, 07/12/2041 (B) 670 677
Qatar Petroleum 2.250%, 07/12/2031 (B) 1,040 1,030
Range Resources 5.875%, 07/01/2022 4 45.000%, 03/15/2023 322 3294.875%, 05/15/2025 120 124
Rockies Express Pipeline 6.875%, 04/15/2040 (B) 830 9384.950%, 07/15/2029 (B) 2,235 2,380
Ruby Pipeline 8.000%, 04/01/2022 (B)(D) 1,008 942

9SEI Institutional Managed Trust / Quarterly Report / December 31, 2021
SCHEDULE OF INVESTMENTS (Unaudited)December 31, 2021
Core Fixed Income Fund (Continued)
DescriptionFace Amount (Thousands)
Market Value ($ Thousands)
CORPORATE OBLIGATIONS (continued)Sabine Pass Liquefaction
5.750%, 05/15/2024 $ 1,370 $ 1,4905.000%, 03/15/2027 1,265 1,421
Saudi Arabian Oil 1.625%, 11/24/2025 (B) 540 5371.250%, 11/24/2023 (B) 450 450
Schlumberger Finance Canada 2.650%, 11/20/2022 (B) 329 334
Schlumberger Holdings 3.900%, 05/17/2028 (B) 475 513
Schlumberger Investment 3.650%, 12/01/2023 61 64
Shell International Finance BV 4.550%, 08/12/2043 1,330 1,6584.375%, 05/11/2045 470 5714.125%, 05/11/2035 1,566 1,8273.250%, 04/06/2050 840 8942.875%, 05/10/2026 900 9552.750%, 04/06/2030 440 460
Sinopec Group Overseas Development 4.375%, 04/10/2024 (B) 1,240 1,324
Southern Natural Gas 8.000%, 03/01/2032 170 236
Southwestern Energy 5.375%, 02/01/2029 20 215.375%, 03/15/2030 60 644.750%, 02/01/2032 150 158
Targa Resources Partners 5.500%, 03/01/2030 130 1425.000%, 01/15/2028 100 1054.875%, 02/01/2031 330 3584.000%, 01/15/2032 (B) 40 42
Tennessee Gas Pipeline 8.375%, 06/15/2032 1,140 1,6322.900%, 03/01/2030 (B) 1,510 1,534
TransCanada PipeLines 4.625%, 03/01/2034 860 1,010
Transcontinental Gas Pipe Line 7.850%, 02/01/2026 60 73
Western Midstream Operating 6.500%, 02/01/2050 210 2485.500%, 08/15/2048 244 2915.300%, 02/01/2030 1,200 1,3195.300%, 03/01/2048 162 1954.650%, 07/01/2026 40 444.500%, 03/01/2028 60 654.350%, 02/01/2025 390 4084.000%, 07/01/2022 35 351.972%, VAR ICE LIBOR USD 3 Month
+ 1.850%, 01/13/2023 130 130Williams
7.750%, 06/15/2031 841 1,138
DescriptionFace Amount (Thousands)
Market Value ($ Thousands)
CORPORATE OBLIGATIONS (continued)7.500%, 01/15/2031 $ 100 $ 1355.750%, 06/24/2044 51 665.400%, 03/04/2044 84 1043.750%, 06/15/2027 1,044 1,127
137,886
Financials — 9.9%ABN AMRO Bank
4.750%, 07/28/2025 (B) 360 392Alleghany
3.250%, 08/15/2051 490 483Ally Financial
1.450%, 10/02/2023 670 673Ambac Assurance
5.100%(B)(C) 8 11American International Group
4.750%, 04/01/2048 130 1664.375%, 06/30/2050 173 2164.200%, 04/01/2028 128 1434.125%, 02/15/2024 107 1143.900%, 04/01/2026 530 5743.875%, 01/15/2035 30 333.400%, 06/30/2030 317 3432.500%, 06/30/2025 260 268
Aon 6.250%, 09/30/2040 19 272.600%, 12/02/2031 2,080 2,116
Apollo Management Holdings 5.000%, 03/15/2048 (B) 780 1,0264.400%, 05/27/2026 (B) 530 585
Ares Capital 3.200%, 11/15/2031 1,006 989
Arthur J Gallagher 3.050%, 03/09/2052 1,370 1,325
ASB Bank 2.375%, 10/22/2031 (B) 812 807
Athene Global Funding 3.000%, 07/01/2022 (B) 211 2132.950%, 11/12/2026 (B) 2,090 2,1852.500%, 03/24/2028 (B) 1,133 1,1391.985%, 08/19/2028 (B) 839 8151.730%, 10/02/2026 (B) 971 9531.608%, 06/29/2026 (B) 1,365 1,3400.750%, VAR United States Secured
Overnight Financing Rate + 0.700%, 05/24/2024 (B) 2,025 2,031
Athene Global Funding MTN 2.646%, 10/04/2031 (B) 1,068 1,054
Athene Holding 4.125%, 01/12/2028 605 662
Avolon Holdings Funding 3.950%, 07/01/2024 (B) 715 749

SEI Institutional Managed Trust / Quarterly Report / December 31, 202110
SCHEDULE OF INVESTMENTS (Unaudited)December 31, 2021
Core Fixed Income Fund (Continued)
SCHEDULE OF INVESTMENTS (Unaudited)December 31, 2021
Core Fixed Income Fund (Continued)
DescriptionFace Amount (Thousands)
Market Value ($ Thousands)
CORPORATE OBLIGATIONS (continued)2.875%, 02/15/2025 (B) $ 975 $ 9962.528%, 11/18/2027 (B) 659 640
AXA Equitable Holdings 3.900%, 04/20/2023 500 517
Bain Capital Specialty Finance 2.550%, 10/13/2026 661 642
Banco de Chile 2.990%, 12/09/2031 (B) 502 495
Banco Santander 3.848%, 04/12/2023 600 6213.225%, VAR US Treas Yield Curve
Rate T Note Const Mat 1 Yr + 1.600%, 11/22/2032 800 801
2.749%, 12/03/2030 1,000 9792.746%, 05/28/2025 1,400 1,4471.722%, VAR US Treas Yield Curve
Rate T Note Const Mat 1 Yr + 0.900%, 09/14/2027 1,190 1,168
1.241%, VAR ICE LIBOR USD 3 Month + 1.120%, 04/12/2023 400 404
Bank of America 3.483%, VAR United States Secured
Overnight Financing Rate + 1.650%, 03/13/2052 320 353
3.419%, VAR ICE LIBOR USD 3 Month + 1.040%, 12/20/2028 1,010 1,078
3.311%, VAR United States Secured Overnight Financing Rate + 1.580%, 04/22/2042 1,210 1,272
3.004%, VAR ICE LIBOR USD 3 Month + 0.790%, 12/20/2023 3,731 3,808
2.687%, VAR United States Secured Overnight Financing Rate + 1.320%, 04/22/2032 2,478 2,515
2.592%, VAR United States Secured Overnight Financing Rate + 2.150%, 04/29/2031 1,575 1,591
2.572%, VAR United States Secured Overnight Financing Rate + 1.210%, 10/20/2032 2,215 2,226
1.734%, VAR United States Secured Overnight Financing Rate + 0.960%, 07/22/2027 6,453 6,406
1.658%, VAR United States Secured Overnight Financing Rate + 0.910%, 03/11/2027 8,288 8,230
Bank of America MTN 5.000%, 01/21/2044 830 1,0904.450%, 03/03/2026 847 9334.330%, VAR ICE LIBOR USD 3 Month
+ 1.520%, 03/15/2050 805 9964.271%, VAR ICE LIBOR USD 3 Month
+ 1.310%, 07/23/2029 65 72
DescriptionFace Amount (Thousands)
Market Value ($ Thousands)
CORPORATE OBLIGATIONS (continued)4.250%, 10/22/2026 $ 80 $ 884.244%, VAR ICE LIBOR USD 3 Month
+ 1.814%, 04/24/2038 179 2104.200%, 08/26/2024 1,530 1,6404.125%, 01/22/2024 290 3084.100%, 07/24/2023 340 3574.083%, VAR ICE LIBOR USD 3 Month
+ 3.150%, 03/20/2051 1,630 1,9614.000%, 04/01/2024 1,309 1,3924.000%, 01/22/2025 2,033 2,1713.974%, VAR ICE LIBOR USD 3 Month
+ 1.210%, 02/07/2030 1,900 2,0933.970%, VAR ICE LIBOR USD 3 Month
+ 1.070%, 03/05/2029 625 6843.864%, VAR ICE LIBOR USD 3 Month
+ 0.940%, 07/23/2024 600 6253.824%, VAR ICE LIBOR USD 3 Month
+ 1.575%, 01/20/2028 524 5673.593%, VAR ICE LIBOR USD 3 Month
+ 1.370%, 07/21/2028 1,364 1,4683.559%, VAR ICE LIBOR USD 3 Month
+ 1.060%, 04/23/2027 799 8543.550%, VAR ICE LIBOR USD 3 Month
+ 0.780%, 03/05/2024 860 8863.500%, 04/19/2026 944 1,0173.458%, VAR ICE LIBOR USD 3 Month
+ 0.970%, 03/15/2025 631 6603.300%, 01/11/2023 1,200 1,2333.194%, VAR ICE LIBOR USD 3 Month
+ 1.180%, 07/23/2030 240 2533.093%, VAR ICE LIBOR USD 3 Month
+ 1.090%, 10/01/2025 1,250 1,3012.884%, VAR ICE LIBOR USD 3 Month
+ 1.190%, 10/22/2030 265 2742.496%, VAR ICE LIBOR USD 3 Month
+ 0.990%, 02/13/2031 910 9122.087%, VAR United States Secured
Overnight Financing Rate + 1.060%, 06/14/2029 6,025 5,983
1.922%, VAR United States Secured Overnight Financing Rate + 1.370%, 10/24/2031 543 520
1.898%, VAR United States Secured Overnight Financing Rate + 1.530%, 07/23/2031 642 614
1.530%, VAR United States Secured Overnight Financing Rate + 0.650%, 12/06/2025 2,300 2,304
1.319%, VAR United States Secured Overnight Financing Rate + 1.150%, 06/19/2026 433 428
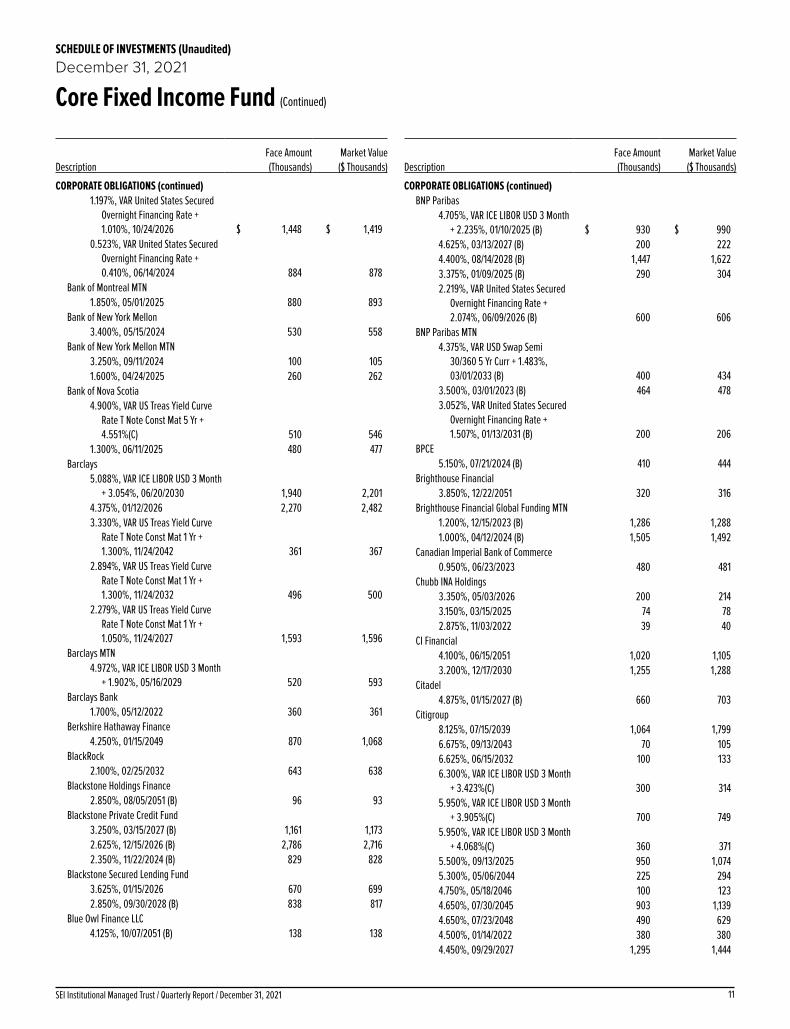
11SEI Institutional Managed Trust / Quarterly Report / December 31, 2021
SCHEDULE OF INVESTMENTS (Unaudited)December 31, 2021
Core Fixed Income Fund (Continued)
DescriptionFace Amount (Thousands)
Market Value ($ Thousands)
CORPORATE OBLIGATIONS (continued)1.197%, VAR United States Secured
Overnight Financing Rate + 1.010%, 10/24/2026 $ 1,448 $ 1,419
0.523%, VAR United States Secured Overnight Financing Rate + 0.410%, 06/14/2024 884 878
Bank of Montreal MTN 1.850%, 05/01/2025 880 893
Bank of New York Mellon 3.400%, 05/15/2024 530 558
Bank of New York Mellon MTN 3.250%, 09/11/2024 100 1051.600%, 04/24/2025 260 262
Bank of Nova Scotia 4.900%, VAR US Treas Yield Curve
Rate T Note Const Mat 5 Yr + 4.551%(C) 510 546
1.300%, 06/11/2025 480 477Barclays
5.088%, VAR ICE LIBOR USD 3 Month + 3.054%, 06/20/2030 1,940 2,201
4.375%, 01/12/2026 2,270 2,4823.330%, VAR US Treas Yield Curve
Rate T Note Const Mat 1 Yr + 1.300%, 11/24/2042 361 367
2.894%, VAR US Treas Yield Curve Rate T Note Const Mat 1 Yr + 1.300%, 11/24/2032 496 500
2.279%, VAR US Treas Yield Curve Rate T Note Const Mat 1 Yr + 1.050%, 11/24/2027 1,593 1,596
Barclays MTN 4.972%, VAR ICE LIBOR USD 3 Month
+ 1.902%, 05/16/2029 520 593Barclays Bank
1.700%, 05/12/2022 360 361Berkshire Hathaway Finance
4.250%, 01/15/2049 870 1,068BlackRock
2.100%, 02/25/2032 643 638Blackstone Holdings Finance
2.850%, 08/05/2051 (B) 96 93Blackstone Private Credit Fund
3.250%, 03/15/2027 (B) 1,161 1,1732.625%, 12/15/2026 (B) 2,786 2,7162.350%, 11/22/2024 (B) 829 828
Blackstone Secured Lending Fund 3.625%, 01/15/2026 670 6992.850%, 09/30/2028 (B) 838 817
Blue Owl Finance LLC 4.125%, 10/07/2051 (B) 138 138
DescriptionFace Amount (Thousands)
Market Value ($ Thousands)
CORPORATE OBLIGATIONS (continued)BNP Paribas
4.705%, VAR ICE LIBOR USD 3 Month + 2.235%, 01/10/2025 (B) $ 930 $ 990
4.625%, 03/13/2027 (B) 200 2224.400%, 08/14/2028 (B) 1,447 1,6223.375%, 01/09/2025 (B) 290 3042.219%, VAR United States Secured
Overnight Financing Rate + 2.074%, 06/09/2026 (B) 600 606
BNP Paribas MTN 4.375%, VAR USD Swap Semi
30/360 5 Yr Curr + 1.483%, 03/01/2033 (B) 400 434
3.500%, 03/01/2023 (B) 464 4783.052%, VAR United States Secured
Overnight Financing Rate + 1.507%, 01/13/2031 (B) 200 206
BPCE 5.150%, 07/21/2024 (B) 410 444
Brighthouse Financial 3.850%, 12/22/2051 320 316
Brighthouse Financial Global Funding MTN 1.200%, 12/15/2023 (B) 1,286 1,2881.000%, 04/12/2024 (B) 1,505 1,492
Canadian Imperial Bank of Commerce 0.950%, 06/23/2023 480 481
Chubb INA Holdings 3.350%, 05/03/2026 200 2143.150%, 03/15/2025 74 782.875%, 11/03/2022 39 40
CI Financial 4.100%, 06/15/2051 1,020 1,1053.200%, 12/17/2030 1,255 1,288
Citadel 4.875%, 01/15/2027 (B) 660 703
Citigroup 8.125%, 07/15/2039 1,064 1,7996.675%, 09/13/2043 70 1056.625%, 06/15/2032 100 1336.300%, VAR ICE LIBOR USD 3 Month
+ 3.423%(C) 300 3145.950%, VAR ICE LIBOR USD 3 Month
+ 3.905%(C) 700 7495.950%, VAR ICE LIBOR USD 3 Month
+ 4.068%(C) 360 3715.500%, 09/13/2025 950 1,0745.300%, 05/06/2044 225 2944.750%, 05/18/2046 100 1234.650%, 07/30/2045 903 1,1394.650%, 07/23/2048 490 6294.500%, 01/14/2022 380 3804.450%, 09/29/2027 1,295 1,444
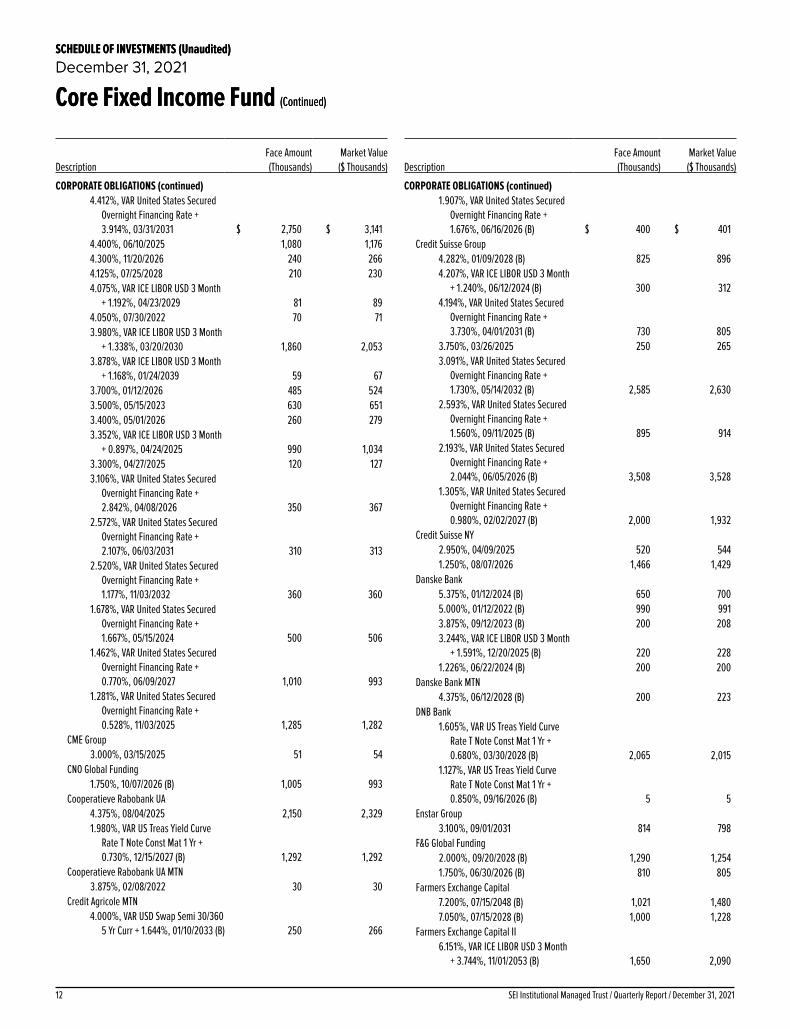
SEI Institutional Managed Trust / Quarterly Report / December 31, 202112
SCHEDULE OF INVESTMENTS (Unaudited)December 31, 2021
Core Fixed Income Fund (Continued)
SCHEDULE OF INVESTMENTS (Unaudited)December 31, 2021
Core Fixed Income Fund (Continued)
DescriptionFace Amount (Thousands)
Market Value ($ Thousands)
CORPORATE OBLIGATIONS (continued)4.412%, VAR United States Secured
Overnight Financing Rate + 3.914%, 03/31/2031 $ 2,750 $ 3,141
4.400%, 06/10/2025 1,080 1,1764.300%, 11/20/2026 240 2664.125%, 07/25/2028 210 2304.075%, VAR ICE LIBOR USD 3 Month
+ 1.192%, 04/23/2029 81 894.050%, 07/30/2022 70 713.980%, VAR ICE LIBOR USD 3 Month
+ 1.338%, 03/20/2030 1,860 2,0533.878%, VAR ICE LIBOR USD 3 Month
+ 1.168%, 01/24/2039 59 673.700%, 01/12/2026 485 5243.500%, 05/15/2023 630 6513.400%, 05/01/2026 260 2793.352%, VAR ICE LIBOR USD 3 Month
+ 0.897%, 04/24/2025 990 1,0343.300%, 04/27/2025 120 1273.106%, VAR United States Secured
Overnight Financing Rate + 2.842%, 04/08/2026 350 367
2.572%, VAR United States Secured Overnight Financing Rate + 2.107%, 06/03/2031 310 313
2.520%, VAR United States Secured Overnight Financing Rate + 1.177%, 11/03/2032 360 360
1.678%, VAR United States Secured Overnight Financing Rate + 1.667%, 05/15/2024 500 506
1.462%, VAR United States Secured Overnight Financing Rate + 0.770%, 06/09/2027 1,010 993
1.281%, VAR United States Secured Overnight Financing Rate + 0.528%, 11/03/2025 1,285 1,282
CME Group 3.000%, 03/15/2025 51 54
CNO Global Funding 1.750%, 10/07/2026 (B) 1,005 993
Cooperatieve Rabobank UA 4.375%, 08/04/2025 2,150 2,3291.980%, VAR US Treas Yield Curve
Rate T Note Const Mat 1 Yr + 0.730%, 12/15/2027 (B) 1,292 1,292
Cooperatieve Rabobank UA MTN 3.875%, 02/08/2022 30 30
Credit Agricole MTN 4.000%, VAR USD Swap Semi 30/360
5 Yr Curr + 1.644%, 01/10/2033 (B) 250 266
DescriptionFace Amount (Thousands)
Market Value ($ Thousands)
CORPORATE OBLIGATIONS (continued)1.907%, VAR United States Secured
Overnight Financing Rate + 1.676%, 06/16/2026 (B) $ 400 $ 401
Credit Suisse Group 4.282%, 01/09/2028 (B) 825 8964.207%, VAR ICE LIBOR USD 3 Month
+ 1.240%, 06/12/2024 (B) 300 3124.194%, VAR United States Secured
Overnight Financing Rate + 3.730%, 04/01/2031 (B) 730 805
3.750%, 03/26/2025 250 2653.091%, VAR United States Secured
Overnight Financing Rate + 1.730%, 05/14/2032 (B) 2,585 2,630
2.593%, VAR United States Secured Overnight Financing Rate + 1.560%, 09/11/2025 (B) 895 914
2.193%, VAR United States Secured Overnight Financing Rate + 2.044%, 06/05/2026 (B) 3,508 3,528
1.305%, VAR United States Secured Overnight Financing Rate + 0.980%, 02/02/2027 (B) 2,000 1,932
Credit Suisse NY 2.950%, 04/09/2025 520 5441.250%, 08/07/2026 1,466 1,429
Danske Bank 5.375%, 01/12/2024 (B) 650 7005.000%, 01/12/2022 (B) 990 9913.875%, 09/12/2023 (B) 200 2083.244%, VAR ICE LIBOR USD 3 Month
+ 1.591%, 12/20/2025 (B) 220 2281.226%, 06/22/2024 (B) 200 200
Danske Bank MTN 4.375%, 06/12/2028 (B) 200 223
DNB Bank 1.605%, VAR US Treas Yield Curve
Rate T Note Const Mat 1 Yr + 0.680%, 03/30/2028 (B) 2,065 2,015
1.127%, VAR US Treas Yield Curve Rate T Note Const Mat 1 Yr + 0.850%, 09/16/2026 (B) 5 5
Enstar Group 3.100%, 09/01/2031 814 798
F&G Global Funding 2.000%, 09/20/2028 (B) 1,290 1,2541.750%, 06/30/2026 (B) 810 805
Farmers Exchange Capital 7.200%, 07/15/2048 (B) 1,021 1,4807.050%, 07/15/2028 (B) 1,000 1,228
Farmers Exchange Capital II 6.151%, VAR ICE LIBOR USD 3 Month
+ 3.744%, 11/01/2053 (B) 1,650 2,090
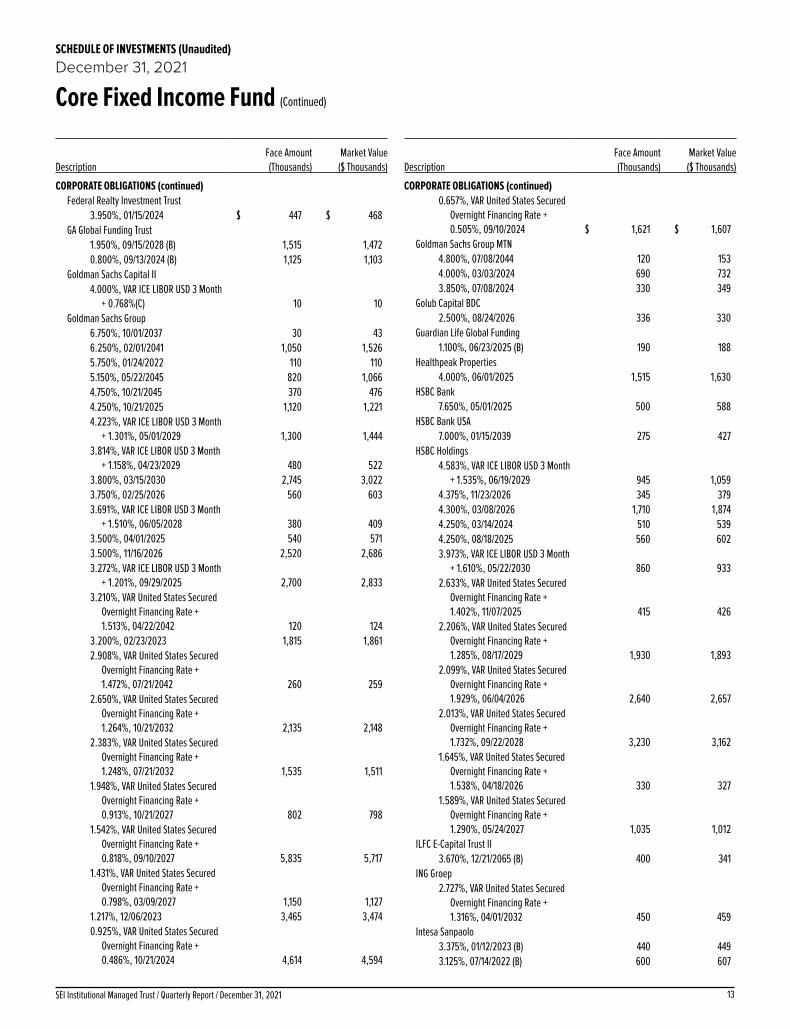
13SEI Institutional Managed Trust / Quarterly Report / December 31, 2021
SCHEDULE OF INVESTMENTS (Unaudited)December 31, 2021
Core Fixed Income Fund (Continued)
DescriptionFace Amount (Thousands)
Market Value ($ Thousands)
CORPORATE OBLIGATIONS (continued)Federal Realty Investment Trust
3.950%, 01/15/2024 $ 447 $ 468GA Global Funding Trust
1.950%, 09/15/2028 (B) 1,515 1,4720.800%, 09/13/2024 (B) 1,125 1,103
Goldman Sachs Capital II 4.000%, VAR ICE LIBOR USD 3 Month
+ 0.768%(C) 10 10Goldman Sachs Group
6.750%, 10/01/2037 30 436.250%, 02/01/2041 1,050 1,5265.750%, 01/24/2022 110 1105.150%, 05/22/2045 820 1,0664.750%, 10/21/2045 370 4764.250%, 10/21/2025 1,120 1,2214.223%, VAR ICE LIBOR USD 3 Month
+ 1.301%, 05/01/2029 1,300 1,4443.814%, VAR ICE LIBOR USD 3 Month
+ 1.158%, 04/23/2029 480 5223.800%, 03/15/2030 2,745 3,0223.750%, 02/25/2026 560 6033.691%, VAR ICE LIBOR USD 3 Month
+ 1.510%, 06/05/2028 380 4093.500%, 04/01/2025 540 5713.500%, 11/16/2026 2,520 2,6863.272%, VAR ICE LIBOR USD 3 Month
+ 1.201%, 09/29/2025 2,700 2,8333.210%, VAR United States Secured
Overnight Financing Rate + 1.513%, 04/22/2042 120 124
3.200%, 02/23/2023 1,815 1,8612.908%, VAR United States Secured
Overnight Financing Rate + 1.472%, 07/21/2042 260 259
2.650%, VAR United States Secured Overnight Financing Rate + 1.264%, 10/21/2032 2,135 2,148
2.383%, VAR United States Secured Overnight Financing Rate + 1.248%, 07/21/2032 1,535 1,511
1.948%, VAR United States Secured Overnight Financing Rate + 0.913%, 10/21/2027 802 798
1.542%, VAR United States Secured Overnight Financing Rate + 0.818%, 09/10/2027 5,835 5,717
1.431%, VAR United States Secured Overnight Financing Rate + 0.798%, 03/09/2027 1,150 1,127
1.217%, 12/06/2023 3,465 3,4740.925%, VAR United States Secured
Overnight Financing Rate + 0.486%, 10/21/2024 4,614 4,594
DescriptionFace Amount (Thousands)
Market Value ($ Thousands)
CORPORATE OBLIGATIONS (continued)0.657%, VAR United States Secured
Overnight Financing Rate + 0.505%, 09/10/2024 $ 1,621 $ 1,607
Goldman Sachs Group MTN 4.800%, 07/08/2044 120 1534.000%, 03/03/2024 690 7323.850%, 07/08/2024 330 349
Golub Capital BDC 2.500%, 08/24/2026 336 330
Guardian Life Global Funding 1.100%, 06/23/2025 (B) 190 188
Healthpeak Properties 4.000%, 06/01/2025 1,515 1,630
HSBC Bank 7.650%, 05/01/2025 500 588
HSBC Bank USA 7.000%, 01/15/2039 275 427
HSBC Holdings 4.583%, VAR ICE LIBOR USD 3 Month
+ 1.535%, 06/19/2029 945 1,0594.375%, 11/23/2026 345 3794.300%, 03/08/2026 1,710 1,8744.250%, 03/14/2024 510 5394.250%, 08/18/2025 560 6023.973%, VAR ICE LIBOR USD 3 Month
+ 1.610%, 05/22/2030 860 9332.633%, VAR United States Secured
Overnight Financing Rate + 1.402%, 11/07/2025 415 426
2.206%, VAR United States Secured Overnight Financing Rate + 1.285%, 08/17/2029 1,930 1,893
2.099%, VAR United States Secured Overnight Financing Rate + 1.929%, 06/04/2026 2,640 2,657
2.013%, VAR United States Secured Overnight Financing Rate + 1.732%, 09/22/2028 3,230 3,162
1.645%, VAR United States Secured Overnight Financing Rate + 1.538%, 04/18/2026 330 327
1.589%, VAR United States Secured Overnight Financing Rate + 1.290%, 05/24/2027 1,035 1,012
ILFC E-Capital Trust II 3.670%, 12/21/2065 (B) 400 341
ING Groep 2.727%, VAR United States Secured
Overnight Financing Rate + 1.316%, 04/01/2032 450 459
Intesa Sanpaolo 3.375%, 01/12/2023 (B) 440 4493.125%, 07/14/2022 (B) 600 607

SEI Institutional Managed Trust / Quarterly Report / December 31, 202114
SCHEDULE OF INVESTMENTS (Unaudited)December 31, 2021
Core Fixed Income Fund (Continued)
SCHEDULE OF INVESTMENTS (Unaudited)December 31, 2021
Core Fixed Income Fund (Continued)
DescriptionFace Amount (Thousands)
Market Value ($ Thousands)
CORPORATE OBLIGATIONS (continued)Intesa Sanpaolo MTN
5.017%, 06/26/2024 (B) $ 2,320 $ 2,486Jackson Financial
4.000%, 11/23/2051 (B) 417 4203.125%, 11/23/2031 (B) 2,227 2,239
JPMorgan Chase 8.750%, 09/01/2030 970 1,4644.950%, 06/01/2045 430 5604.452%, VAR ICE LIBOR USD 3 Month
+ 1.330%, 12/05/2029 300 3404.260%, VAR ICE LIBOR USD 3 Month
+ 1.580%, 02/22/2048 84 1034.250%, 10/01/2027 720 8084.203%, VAR ICE LIBOR USD 3 Month
+ 1.260%, 07/23/2029 800 8954.032%, VAR ICE LIBOR USD 3 Month
+ 1.460%, 07/24/2048 645 7614.023%, VAR ICE LIBOR USD 3 Month
+ 1.000%, 12/05/2024 1,480 1,5603.897%, VAR ICE LIBOR USD 3 Month
+ 1.220%, 01/23/2049 115 1333.882%, VAR ICE LIBOR USD 3 Month
+ 1.360%, 07/24/2038 325 3693.875%, 09/10/2024 1,140 1,2093.625%, 05/13/2024 230 2433.625%, 12/01/2027 230 2483.200%, 01/25/2023 100 1033.200%, 06/15/2026 400 4243.157%, VAR United States Secured
Overnight Financing Rate + 1.460%, 04/22/2042 450 470
3.109%, VAR United States Secured Overnight Financing Rate + 2.440%, 04/22/2051 130 134
2.956%, VAR United States Secured Overnight Financing Rate + 2.515%, 05/13/2031 620 642
2.950%, 10/01/2026 377 3982.739%, VAR United States Secured
Overnight Financing Rate + 1.510%, 10/15/2030 165 170
2.545%, VAR United States Secured Overnight Financing Rate + 1.180%, 11/08/2032 1,380 1,388
2.522%, VAR United States Secured Overnight Financing Rate + 2.040%, 04/22/2031 450 455
2.301%, VAR United States Secured Overnight Financing Rate + 1.160%, 10/15/2025 1,392 1,424
2.182%, VAR United States Secured Overnight Financing Rate + 1.890%, 06/01/2028 992 1,000
DescriptionFace Amount (Thousands)
Market Value ($ Thousands)
CORPORATE OBLIGATIONS (continued)2.083%, VAR United States Secured
Overnight Financing Rate + 1.850%, 04/22/2026 $ 2,862 $ 2,905
2.069%, VAR United States Secured Overnight Financing Rate + 1.015%, 06/01/2029 2,900 2,876
2.005%, VAR United States Secured Overnight Financing Rate + 1.585%, 03/13/2026 2,045 2,069
1.578%, VAR United States Secured Overnight Financing Rate + 0.885%, 04/22/2027 4,945 4,887
1.561%, VAR United States Secured Overnight Financing Rate + 0.605%, 12/10/2025 7,445 7,453
1.514%, VAR United States Secured Overnight Financing Rate + 1.455%, 06/01/2024 1,340 1,350
1.470%, VAR United States Secured Overnight Financing Rate + 0.765%, 09/22/2027 3,351 3,285
1.045%, VAR United States Secured Overnight Financing Rate + 0.800%, 11/19/2026 1,806 1,759
1.040%, VAR United States Secured Overnight Financing Rate + 0.695%, 02/04/2027 3,240 3,136
0.969%, VAR United States Secured Overnight Financing Rate + 0.580%, 06/23/2025 4,070 4,030
0.680%, VAR ICE LIBOR USD 3 Month + 0.550%, 02/01/2027 1,590 1,535
KKR Group Finance II 5.500%, 02/01/2043 (B) 80 107
KKR Group Finance III 5.125%, 06/01/2044 (B) 535 690
KKR Group Finance X 3.250%, 12/15/2051 (B) 434 433
Lloyds Banking Group 4.375%, 03/22/2028 925 1,0384.344%, 01/09/2048 200 2334.050%, 08/16/2023 200 2103.870%, VAR US Treas Yield Curve
Rate T Note Const Mat 1 Yr + 3.500%, 07/09/2025 1,190 1,257
2.907%, VAR ICE LIBOR USD 3 Month + 0.810%, 11/07/2023 1,815 1,844
2.858%, VAR ICE LIBOR USD 3 Month + 1.249%, 03/17/2023 855 858
1.627%, VAR US Treas Yield Curve Rate T Note Const Mat 1 Yr + 0.850%, 05/11/2027 2,000 1,969

15SEI Institutional Managed Trust / Quarterly Report / December 31, 2021
SCHEDULE OF INVESTMENTS (Unaudited)December 31, 2021
Core Fixed Income Fund (Continued)
DescriptionFace Amount (Thousands)
Market Value ($ Thousands)
CORPORATE OBLIGATIONS (continued)Macquarie Bank
3.624%, 06/03/2030 (B) $ 425 $ 444Macquarie Group
1.340%, VAR United States Secured Overnight Financing Rate + 1.069%, 01/12/2027 (B) 2,045 1,990
Macquarie Group MTN 2.871%, VAR United States Secured
Overnight Financing Rate + 1.532%, 01/14/2033 (B) 2,354 2,347
1.935%, VAR United States Secured Overnight Financing Rate + 0.995%, 04/14/2028 (B) 1,240 1,220
1.201%, VAR United States Secured Overnight Financing Rate + 0.694%, 10/14/2025 (B) 1,463 1,450
Massachusetts Mutual Life Insurance 3.729%, 10/15/2070 (B) 88 97
Mercury General 4.400%, 03/15/2027 935 1,031
MetLife 6.400%, 12/15/2036 420 5165.700%, 06/15/2035 15 20
MetLife Capital Trust IV 7.875%, 12/15/2037 (B) 800 1,092
Metropolitan Life Global Funding I 3.450%, 12/18/2026 (B) 1,955 2,108
Mitsubishi UFJ Financial Group 2.998%, 02/22/2022 230 2312.494%, VAR US Treas Yield Curve
Rate T Note Const Mat 1 Yr + 0.970%, 10/13/2032 662 663
2.309%, VAR US Treas Yield Curve Rate T Note Const Mat 1 Yr + 0.950%, 07/20/2032 1,042 1,027
1.640%, VAR US Treas Yield Curve Rate T Note Const Mat 1 Yr + 0.670%, 10/13/2027 1,621 1,600
1.538%, VAR US Treas Yield Curve Rate T Note Const Mat 1 Yr + 0.750%, 07/20/2027 1,896 1,862
0.953%, VAR US Treas Yield Curve Rate T Note Const Mat 1 Yr + 0.550%, 07/19/2025 1,919 1,896
Morgan Stanley 1.593%, VAR United States Secured
Overnight Financing Rate + 0.879%, 05/04/2027 2,535 2,510
0.985%, VAR United States Secured Overnight Financing Rate + 0.720%, 12/10/2026 1,648 1,598
DescriptionFace Amount (Thousands)
Market Value ($ Thousands)
CORPORATE OBLIGATIONS (continued)0.790%, VAR United States Secured
Overnight Financing Rate + 0.525%, 05/30/2025 $ 3,377 $ 3,333
Morgan Stanley MTN 4.431%, VAR ICE LIBOR USD 3 Month
+ 1.628%, 01/23/2030 340 3873.971%, VAR ICE LIBOR USD 3 Month
+ 1.455%, 07/22/2038 119 1363.772%, VAR ICE LIBOR USD 3 Month
+ 1.140%, 01/24/2029 1,080 1,1753.622%, VAR United States Secured
Overnight Financing Rate + 3.120%, 04/01/2031 2,920 3,182
3.125%, 07/27/2026 190 2012.750%, 05/19/2022 1 12.720%, VAR United States Secured
Overnight Financing Rate + 1.152%, 07/22/2025 980 1,010
2.699%, VAR United States Secured Overnight Financing Rate + 1.143%, 01/22/2031 520 532
2.511%, VAR United States Secured Overnight Financing Rate + 1.200%, 10/20/2032 1,905 1,903
2.239%, VAR United States Secured Overnight Financing Rate + 1.178%, 07/21/2032 961 940
2.188%, VAR United States Secured Overnight Financing Rate + 1.990%, 04/28/2026 1,300 1,326
1.512%, VAR United States Secured Overnight Financing Rate + 0.858%, 07/20/2027 1,260 1,240
1.164%, VAR United States Secured Overnight Financing Rate + 0.560%, 10/21/2025 7,294 7,236
0.864%, VAR United States Secured Overnight Financing Rate + 0.745%, 10/21/2025 644 635
0.791%, VAR United States Secured Overnight Financing Rate + 0.509%, 01/22/2025 4,523 4,477
MUFG Bank 4.100%, 09/09/2023 (B) 200 211
National Securities Clearing 1.500%, 04/23/2025 (B) 3,035 3,0531.200%, 04/23/2023 (B) 410 413
Nationwide Building Society 4.363%, VAR ICE LIBOR USD 3 Month
+ 1.392%, 08/01/2024 (B) 800 8383.766%, VAR ICE LIBOR USD 3 Month
+ 1.064%, 03/08/2024 (B) 1,840 1,895

SEI Institutional Managed Trust / Quarterly Report / December 31, 202116
SCHEDULE OF INVESTMENTS (Unaudited)December 31, 2021
Core Fixed Income Fund (Continued)
SCHEDULE OF INVESTMENTS (Unaudited)December 31, 2021
Core Fixed Income Fund (Continued)
DescriptionFace Amount (Thousands)
Market Value ($ Thousands)
CORPORATE OBLIGATIONS (continued)Nationwide Building Society MTN
3.622%, VAR ICE LIBOR USD 3 Month + 1.181%, 04/26/2023 (B) $ 830 $ 837
Nationwide Mutual Insurance 2.493%, VAR ICE LIBOR USD 3 Month
+ 2.290%, 12/15/2024 (B) 3,735 3,740Natwest Group
4.519%, VAR ICE LIBOR USD 3 Month + 1.550%, 06/25/2024 830 868
4.269%, VAR ICE LIBOR USD 3 Month + 1.762%, 03/22/2025 1,500 1,587
1.642%, VAR US Treas Yield Curve Rate T Note Const Mat 1 Yr + 0.900%, 06/14/2027 920 907
NatWest Group 4.892%, VAR ICE LIBOR USD 3 Month
+ 1.754%, 05/18/2029 200 229New York Life Global Funding
0.950%, 06/24/2025 (B) 340 335New York Life Insurance
6.750%, 11/15/2039 (B) 345 521Nomura Holdings
2.648%, 01/16/2025 550 566Northwestern Mutual Life Insurance
3.625%, 09/30/2059 (B) 1,212 1,335Ohio National Financial Services
5.550%, 01/24/2030 (B) 625 708Owl Rock Capital
3.400%, 07/15/2026 1,387 1,4092.875%, 06/11/2028 337 331
Owl Rock Capital III 3.125%, 04/13/2027 (B) 1,103 1,078
Park Aerospace Holdings 5.500%, 02/15/2024 (B) 212 2275.250%, 08/15/2022 (B) 25 264.500%, 03/15/2023 (B) 2,070 2,136
PNC Bank 3.875%, 04/10/2025 430 462
Pricoa Global Funding I MTN 1.200%, 09/01/2026 (B) 144 141
Principal Life Global Funding II 1.250%, 06/23/2025 (B) 160 158
Private Export Funding 0.550%, 07/30/2024 (B) 845 834
Prospect Capital 3.706%, 01/22/2026 500 509
Protective Life Global Funding 1.618%, 04/15/2026 (B) 2,170 2,160
Prudential Financial MTN 5.625%, 05/12/2041 10 13
Raymond James Financial 4.950%, 07/15/2046 180 229
DescriptionFace Amount (Thousands)
Market Value ($ Thousands)
CORPORATE OBLIGATIONS (continued)Royal Bank of Canada MTN
1.600%, 04/17/2023 $ 760 $ 7681.150%, 06/10/2025 460 456
Santander Holdings USA 4.500%, 07/17/2025 80 873.450%, 06/02/2025 640 671
Santander UK Group Holdings 4.796%, VAR ICE LIBOR USD 3 Month
+ 1.570%, 11/15/2024 3,050 3,2373.823%, VAR ICE LIBOR USD 3 Month
+ 1.400%, 11/03/2028 610 6551.673%, VAR United States Secured
Overnight Financing Rate + 0.989%, 06/14/2027 445 436
1.532%, VAR US Treas Yield Curve Rate T Note Const Mat 1 Yr + 1.250%, 08/21/2026 235 231
1.089%, VAR United States Secured Overnight Financing Rate + 0.787%, 03/15/2025 2,475 2,452
SBL Holdings 5.000%, 02/18/2031 (B) 1,121 1,184
Scentre Group Trust 1 4.375%, 05/28/2030 (B)(D) 635 7253.625%, 01/28/2026 (B) 1,146 1,223
Societe Generale 3.625%, 03/01/2041 (B) 645 656
Societe Generale MTN 2.625%, 01/22/2025 (B) 735 753
State Street 3.300%, 12/16/2024 70 75
Stewart Information Services 3.600%, 11/15/2031 437 443
Sumitomo Mitsui Financial Group 1.902%, 09/17/2028 2,001 1,9621.402%, 09/17/2026 1,284 1,253
Swedbank 1.300%, 06/02/2023 (B) 580 583
Teachers Insurance & Annuity Association of America
6.850%, 12/16/2039 (B) 124 1854.900%, 09/15/2044 (B) 240 3083.300%, 05/15/2050 (B) 2,455 2,560
The Vanguard Group 3.050%, 08/22/2050 670 655
Toronto-Dominion Bank MTN 1.250%, 09/10/2026 814 8001.150%, 06/12/2025 460 4560.750%, 06/12/2023 910 910
Trust Fibra Uno 6.390%, 01/15/2050 (B) 344 4025.250%, 01/30/2026 (B) 490 537

17SEI Institutional Managed Trust / Quarterly Report / December 31, 2021
SCHEDULE OF INVESTMENTS (Unaudited)December 31, 2021
Core Fixed Income Fund (Continued)
DescriptionFace Amount (Thousands)
Market Value ($ Thousands)
CORPORATE OBLIGATIONS (continued)UBS
1.750%, 04/21/2022 (B) $ 850 $ 8530.700%, 08/09/2024 (B) 2,075 2,051
UBS MTN 4.500%, 06/26/2048 (B) 440 574
UBS Group 7.000%, VAR USD Swap Semi 30/360
5 Yr Curr + 4.344%(B)(C) 1,640 1,7684.253%, 03/23/2028 (B) 350 3884.125%, 09/24/2025 (B) 200 2163.491%, 05/23/2023 (B) 1,650 1,6672.859%, VAR ICE LIBOR USD 3 Month
+ 0.954%, 08/15/2023 (B) 200 2022.650%, 02/01/2022 (B) 385 386
UniCredit MTN 6.572%, 01/14/2022 (B) 1,350 1,352
US Bancorp 1.450%, 05/12/2025 1,020 1,024
US Bancorp MTN 2.950%, 07/15/2022 25 25
Validus Holdings 8.875%, 01/26/2040 905 1,496
WEA Finance 4.750%, 09/17/2044 (B) 230 2483.750%, 09/17/2024 (B) 990 1,038
Wells Fargo 7.950%, 11/15/2029 495 6805.375%, 11/02/2043 400 5293.000%, 10/23/2026 1,030 1,0822.188%, VAR United States Secured
Overnight Financing Rate + 2.000%, 04/30/2026 5,025 5,114
Wells Fargo MTN 5.013%, VAR United States Secured
Overnight Financing Rate + 4.502%, 04/04/2051 4,010 5,476
4.900%, 11/17/2045 909 1,1434.750%, 12/07/2046 700 8744.650%, 11/04/2044 261 3164.478%, VAR United States Secured
Overnight Financing Rate + 4.032%, 04/04/2031 2,630 3,055
4.400%, 06/14/2046 1,370 1,6244.150%, 01/24/2029 1,010 1,1314.125%, 08/15/2023 900 9443.750%, 01/24/2024 250 2623.500%, 03/08/2022 72 723.450%, 02/13/2023 660 6793.196%, VAR ICE LIBOR USD 3 Month
+ 1.170%, 06/17/2027 1,550 1,6342.879%, VAR United States Secured
Overnight Financing Rate + 1.432%, 10/30/2030 20 21
DescriptionFace Amount (Thousands)
Market Value ($ Thousands)
CORPORATE OBLIGATIONS (continued)2.406%, VAR United States Secured
Overnight Financing Rate + 1.087%, 10/30/2025 $ 1,005 $ 1,030
2.393%, VAR United States Secured Overnight Financing Rate + 2.100%, 06/02/2028 900 915
2.164%, VAR ICE LIBOR USD 3 Month + 0.750%, 02/11/2026 4,415 4,481
Westpac Banking 3.133%, 11/18/2041 162 1613.020%, VAR US Treas Yield Curve
Rate T Note Const Mat 5 Yr + 1.530%, 11/18/2036 162 160
2.668%, VAR US Treas Yield Curve Rate T Note Const Mat 5 Yr + 1.750%, 11/15/2035 450 438
1.953%, 11/20/2028 1,299 1,294
456,691
Health Care — 3.2%Abbott Laboratories
4.900%, 11/30/2046 470 6434.750%, 11/30/2036 260 3323.750%, 11/30/2026 463 512
AbbVie 4.625%, 10/01/2042 38 464.550%, 03/15/2035 1,700 2,0444.500%, 05/14/2035 510 6104.450%, 05/14/2046 238 2884.400%, 11/06/2042 1,000 1,1934.300%, 05/14/2036 235 2774.250%, 11/14/2028 335 3794.250%, 11/21/2049 2,210 2,6574.050%, 11/21/2039 961 1,1033.800%, 03/15/2025 460 4903.750%, 11/14/2023 100 1053.600%, 05/14/2025 770 8193.450%, 03/15/2022 370 3703.200%, 11/06/2022 44 453.200%, 11/21/2029 2,178 2,3292.950%, 11/21/2026 380 4002.900%, 11/06/2022 10 102.600%, 11/21/2024 1,820 1,8882.300%, 11/21/2022 2,939 2,980
Advocate Health & Hospitals 2.211%, 06/15/2030 1,615 1,617
Aetna 3.875%, 08/15/2047 90 1002.800%, 06/15/2023 2,650 2,715
Amgen 6.375%, 06/01/2037 910 1,2895.150%, 11/15/2041 332 422

SEI Institutional Managed Trust / Quarterly Report / December 31, 202118
SCHEDULE OF INVESTMENTS (Unaudited)December 31, 2021
Core Fixed Income Fund (Continued)
SCHEDULE OF INVESTMENTS (Unaudited)December 31, 2021
Core Fixed Income Fund (Continued)
DescriptionFace Amount (Thousands)
Market Value ($ Thousands)
CORPORATE OBLIGATIONS (continued)4.663%, 06/15/2051 $ 269 $ 3444.400%, 05/01/2045 375 4473.625%, 05/22/2024 130 1373.150%, 02/21/2040 190 1953.000%, 01/15/2052 1,313 1,2742.770%, 09/01/2053 263 2462.000%, 01/15/2032 1,515 1,4671.650%, 08/15/2028 1,301 1,275
Anthem 4.625%, 05/15/2042 41 513.650%, 12/01/2027 220 2413.500%, 08/15/2024 90 953.350%, 12/01/2024 1,425 1,5053.125%, 05/15/2022 468 4722.950%, 12/01/2022 661 674
AstraZeneca 3.000%, 05/28/2051 74 782.125%, 08/06/2050 162 144
Astrazeneca Finance 1.750%, 05/28/2028 1,141 1,134
Bausch Health 7.250%, 05/30/2029 (B) 170 1686.250%, 02/15/2029 (B) 500 4755.500%, 11/01/2025 (B) 20 20
Baxalta 3.600%, 06/23/2022 546 551
Baxter International 3.950%, 04/01/2030 425 473
BayCare Health System 3.831%, 11/15/2050 1,595 1,890
Bayer US Finance 3.375%, 10/08/2024 (B) 800 836
Bayer US Finance II 4.875%, 06/25/2048 (B) 1,795 2,2064.700%, 07/15/2064 (B) 210 2444.625%, 06/25/2038 (B) 420 4904.375%, 12/15/2028 (B) 3,535 3,9484.250%, 12/15/2025 (B) 2,345 2,536
Becton Dickinson 4.685%, 12/15/2044 301 3793.734%, 12/15/2024 287 3053.700%, 06/06/2027 121 1323.363%, 06/06/2024 758 794
Biogen 3.625%, 09/15/2022 430 4393.250%, 02/15/2051 (B) 134 131
Bon Secours Mercy Health 3.464%, 06/01/2030 855 929
Bristol-Myers Squibb 5.000%, 08/15/2045 175 2324.550%, 02/20/2048 166 2124.350%, 11/15/2047 51 63
DescriptionFace Amount (Thousands)
Market Value ($ Thousands)
CORPORATE OBLIGATIONS (continued)3.875%, 08/15/2025 $ 217 $ 2353.550%, 08/15/2022 360 3673.400%, 07/26/2029 400 4383.200%, 06/15/2026 770 8282.900%, 07/26/2024 785 8212.750%, 02/15/2023 300 3072.600%, 05/16/2022 550 5552.550%, 11/13/2050 522 494
Centene 4.625%, 12/15/2029 230 2483.375%, 02/15/2030 230 2343.000%, 10/15/2030 3,398 3,4542.500%, 03/01/2031 107 1042.450%, 07/15/2028 1,760 1,734
Cigna 4.900%, 12/15/2048 750 9694.800%, 08/15/2038 1,144 1,4074.375%, 10/15/2028 730 8304.125%, 11/15/2025 290 3173.875%, 10/15/2047 570 6363.750%, 07/15/2023 462 4803.400%, 03/01/2027 380 4083.400%, 03/15/2050 120 1253.400%, 03/15/2051 588 615
CommonSpirit Health 4.350%, 11/01/2042 480 5514.187%, 10/01/2049 635 7392.782%, 10/01/2030 1,970 2,016
CVS Health 5.125%, 07/20/2045 670 8715.050%, 03/25/2048 4,005 5,2364.780%, 03/25/2038 1,075 1,3094.300%, 03/25/2028 1,336 1,4994.250%, 04/01/2050 30 364.125%, 04/01/2040 160 1843.875%, 07/20/2025 515 5533.750%, 04/01/2030 400 4393.625%, 04/01/2027 690 7493.000%, 08/15/2026 347 3662.750%, 12/01/2022 510 5172.700%, 08/21/2040 500 4822.125%, 09/15/2031 370 362
CVS Pass-Through Trust 5.926%, 01/10/2034 (B) 68 81
Danaher 2.800%, 12/10/2051 257 2532.600%, 10/01/2050 386 368
DH Europe Finance II Sarl 2.200%, 11/15/2024 888 9072.050%, 11/15/2022 516 523
Fresenius Medical Care US Finance II 5.875%, 01/31/2022 (B) 170 171

19SEI Institutional Managed Trust / Quarterly Report / December 31, 2021
SCHEDULE OF INVESTMENTS (Unaudited)December 31, 2021
Core Fixed Income Fund (Continued)
DescriptionFace Amount (Thousands)
Market Value ($ Thousands)
CORPORATE OBLIGATIONS (continued)Fresenius Medical Care US Finance III
1.875%, 12/01/2026 (B) $ 1,345 $ 1,330Gilead Sciences
5.650%, 12/01/2041 35 484.750%, 03/01/2046 380 4824.600%, 09/01/2035 500 6054.500%, 02/01/2045 10 124.000%, 09/01/2036 288 3313.700%, 04/01/2024 410 4313.650%, 03/01/2026 460 4963.250%, 09/01/2022 185 1882.800%, 10/01/2050 371 3602.600%, 10/01/2040 561 540
GlaxoSmithKline Capital 2.850%, 05/08/2022 30 30
HCA 5.875%, 02/01/2029 702 8365.625%, 09/01/2028 60 705.500%, 06/15/2047 60 795.375%, 02/01/2025 2,491 2,7385.250%, 04/15/2025 820 9075.250%, 06/15/2026 650 7315.250%, 06/15/2049 2,150 2,7615.000%, 03/15/2024 1,390 1,4954.500%, 02/15/2027 20 224.125%, 06/15/2029 1,500 1,6513.500%, 09/01/2030 1,331 1,4072.375%, 07/15/2031 945 930
Health Care Service A Mutual Legal Reserve 2.200%, 06/01/2030 (B) 855 837
Humana 4.950%, 10/01/2044 60 774.800%, 03/15/2047 30 384.625%, 12/01/2042 170 2094.500%, 04/01/2025 80 873.950%, 03/15/2027 70 773.850%, 10/01/2024 1,470 1,5603.150%, 12/01/2022 560 5691.350%, 02/03/2027 594 578
Johnson & Johnson 3.700%, 03/01/2046 170 2003.625%, 03/03/2037 260 2983.500%, 01/15/2048 92 1053.400%, 01/15/2038 173 1952.625%, 01/15/2025 86 902.450%, 09/01/2060 935 8830.950%, 09/01/2027 610 5970.550%, 09/01/2025 300 294
Mass General Brigham 3.192%, 07/01/2049 115 122
Medtronic 4.625%, 03/15/2045 9 12
DescriptionFace Amount (Thousands)
Market Value ($ Thousands)
CORPORATE OBLIGATIONS (continued)3.500%, 03/15/2025 $ 241 $ 257
Merck 2.400%, 09/15/2022 29 291.450%, 06/24/2030 300 2870.750%, 02/24/2026 530 520
New York and Presbyterian Hospital 3.563%, 08/01/2036 730 808
Pfizer 4.000%, 12/15/2036 815 9692.800%, 03/11/2022 309 3102.625%, 04/01/2030 440 4642.550%, 05/28/2040 1,124 1,1211.700%, 05/28/2030 420 4110.800%, 05/28/2025 670 662
Roche Holdings 2.607%, 12/13/2051 (B) 425 4172.076%, 12/13/2031 (B) 1,051 1,048
Royalty Pharma 1.200%, 09/02/2025 535 5240.750%, 09/02/2023 925 919
RWJ Barnabas Health 3.949%, 07/01/2046 1,030 1,205
Shire Acquisitions Investments Ireland DAC 2.875%, 09/23/2023 2,413 2,482
Smith & Nephew 2.032%, 10/14/2030 670 647
STERIS Irish FinCo UnLtd 3.750%, 03/15/2051 1,447 1,583
Takeda Pharmaceutical 5.000%, 11/26/2028 460 5404.400%, 11/26/2023 2,174 2,3003.175%, 07/09/2050 936 9443.025%, 07/09/2040 362 3682.050%, 03/31/2030 1,236 1,210
Teva Pharmaceutical Finance BV 2.950%, 12/18/2022 190 190
Teva Pharmaceutical Finance Netherlands III BV
7.125%, 01/31/2025 390 4176.000%, 04/15/2024 200 2105.125%, 05/09/2029 1,570 1,5393.150%, 10/01/2026 1,540 1,4482.800%, 07/21/2023 630 632
Thermo Fisher Scientific 2.800%, 10/15/2041 260 2632.000%, 10/15/2031 548 5401.750%, 10/15/2028 615 6111.215%, 10/18/2024 1,298 1,297
UnitedHealth Group 5.800%, 03/15/2036 280 3884.625%, 07/15/2035 523 6544.450%, 12/15/2048 90 115

SEI Institutional Managed Trust / Quarterly Report / December 31, 202120
SCHEDULE OF INVESTMENTS (Unaudited)December 31, 2021
Core Fixed Income Fund (Continued)
SCHEDULE OF INVESTMENTS (Unaudited)December 31, 2021
Core Fixed Income Fund (Continued)
DescriptionFace Amount (Thousands)
Market Value ($ Thousands)
CORPORATE OBLIGATIONS (continued)4.250%, 04/15/2047 $ 450 $ 5514.250%, 06/15/2048 110 1363.875%, 12/15/2028 170 1913.875%, 08/15/2059 360 4313.750%, 07/15/2025 270 2933.700%, 08/15/2049 150 1733.500%, 06/15/2023 150 1563.350%, 07/15/2022 28 283.250%, 05/15/2051 544 5893.125%, 05/15/2060 50 523.050%, 05/15/2041 169 1772.900%, 05/15/2050 576 5872.875%, 03/15/2023 50 512.750%, 05/15/2040 248 2522.375%, 10/15/2022 70 712.300%, 05/15/2031 1,169 1,1892.000%, 05/15/2030 140 1391.250%, 01/15/2026 170 169
Universal Health Services 1.650%, 09/01/2026 (B) 685 672
Utah Acquisition Sub 3.950%, 06/15/2026 1,645 1,774
Viatris 4.000%, 06/22/2050 675 7192.700%, 06/22/2030 140 141
Wyeth 5.950%, 04/01/2037 470 662
149,553
Industrials — 2.4%3M
3.700%, 04/15/2050 660 7743.050%, 04/15/2030 90 972.375%, 08/26/2029 390 400
Adani International Container Terminal Pvt 3.000%, 02/16/2031 (B)(D) 273 264
Adani Ports & Special Economic Zone 4.200%, 08/04/2027 (B) 594 616
AerCap Ireland Capital DAC 4.875%, 01/16/2024 1,500 1,5953.875%, 01/23/2028 345 3663.500%, 01/15/2025 232 2423.300%, 01/30/2032 3,775 3,8463.150%, 02/15/2024 560 5783.000%, 10/29/2028 2,375 2,4092.450%, 10/29/2026 4,180 4,2141.750%, 10/29/2024 2,110 2,1051.650%, 10/29/2024 3,088 3,0821.150%, 10/29/2023 2,597 2,586
Air Lease 3.625%, 04/01/2027 221 2323.625%, 12/01/2027 216 227
DescriptionFace Amount (Thousands)
Market Value ($ Thousands)
CORPORATE OBLIGATIONS (continued)3.500%, 01/15/2022 $ 1,110 $ 1,1113.375%, 07/01/2025 310 3233.250%, 03/01/2025 1,645 1,707
Air Lease MTN 2.300%, 02/01/2025 355 360
Avolon Holdings Funding 5.250%, 05/15/2024 (B) 120 129
Boeing 5.930%, 05/01/2060 20 285.805%, 05/01/2050 1,607 2,1765.705%, 05/01/2040 796 1,0225.150%, 05/01/2030 1,262 1,4705.040%, 05/01/2027 160 1804.875%, 05/01/2025 2,075 2,2704.508%, 05/01/2023 1,050 1,0973.750%, 02/01/2050 1,058 1,1003.625%, 02/01/2031 698 7443.625%, 03/01/2048 23 233.550%, 03/01/2038 196 1993.250%, 02/01/2028 693 7223.250%, 02/01/2035 1,607 1,6193.200%, 03/01/2029 490 5043.100%, 05/01/2026 160 1672.800%, 03/01/2027 190 1942.700%, 02/01/2027 540 5492.196%, 02/04/2026 2,160 2,1591.433%, 02/04/2024 2,065 2,062
Burlington Northern Santa Fe 7.290%, 06/01/2036 90 1355.400%, 06/01/2041 50 674.150%, 12/15/2048 150 1854.050%, 06/15/2048 124 1492.875%, 06/15/2052 120 120
Canadian Pacific Railway 6.125%, 09/15/2115 44 653.100%, 12/02/2051 416 4283.000%, 12/02/2041 305 3122.450%, 12/02/2031 640 6531.750%, 12/02/2026 800 8031.350%, 12/02/2024 2,404 2,407
Carrier Global 3.577%, 04/05/2050 30 32
Cintas No. 2 3.700%, 04/01/2027 400 4382.900%, 04/01/2022 400 402
Continental Airlines Pass-Through Trust, Ser 2007-1, Cl A
5.983%, 04/19/2022 379 383CoStar Group
2.800%, 07/15/2030 (B) 830 830Crowley Conro
4.181%, 08/15/2043 435 505
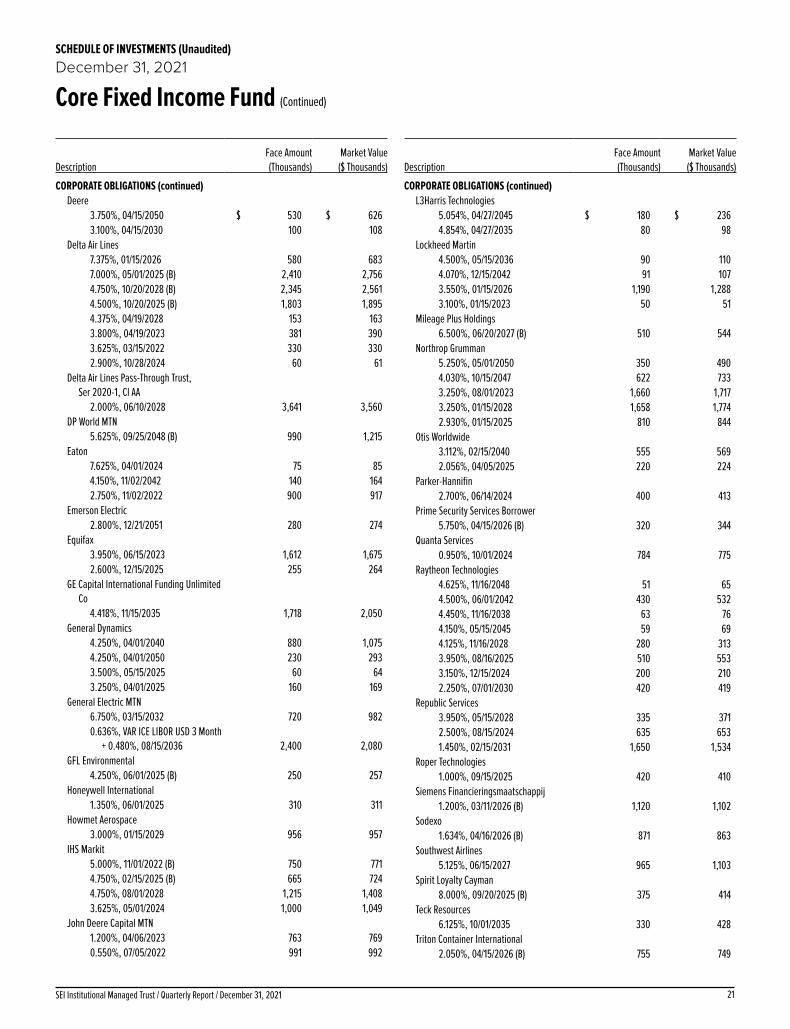
21SEI Institutional Managed Trust / Quarterly Report / December 31, 2021
SCHEDULE OF INVESTMENTS (Unaudited)December 31, 2021
Core Fixed Income Fund (Continued)
DescriptionFace Amount (Thousands)
Market Value ($ Thousands)
CORPORATE OBLIGATIONS (continued)Deere
3.750%, 04/15/2050 $ 530 $ 6263.100%, 04/15/2030 100 108
Delta Air Lines 7.375%, 01/15/2026 580 6837.000%, 05/01/2025 (B) 2,410 2,7564.750%, 10/20/2028 (B) 2,345 2,5614.500%, 10/20/2025 (B) 1,803 1,8954.375%, 04/19/2028 153 1633.800%, 04/19/2023 381 3903.625%, 03/15/2022 330 3302.900%, 10/28/2024 60 61
Delta Air Lines Pass-Through Trust, Ser 2020-1, Cl AA
2.000%, 06/10/2028 3,641 3,560DP World MTN
5.625%, 09/25/2048 (B) 990 1,215Eaton
7.625%, 04/01/2024 75 854.150%, 11/02/2042 140 1642.750%, 11/02/2022 900 917
Emerson Electric 2.800%, 12/21/2051 280 274
Equifax 3.950%, 06/15/2023 1,612 1,6752.600%, 12/15/2025 255 264
GE Capital International Funding Unlimited Co
4.418%, 11/15/2035 1,718 2,050General Dynamics
4.250%, 04/01/2040 880 1,0754.250%, 04/01/2050 230 2933.500%, 05/15/2025 60 643.250%, 04/01/2025 160 169
General Electric MTN 6.750%, 03/15/2032 720 9820.636%, VAR ICE LIBOR USD 3 Month
+ 0.480%, 08/15/2036 2,400 2,080GFL Environmental
4.250%, 06/01/2025 (B) 250 257Honeywell International
1.350%, 06/01/2025 310 311Howmet Aerospace
3.000%, 01/15/2029 956 957IHS Markit
5.000%, 11/01/2022 (B) 750 7714.750%, 02/15/2025 (B) 665 7244.750%, 08/01/2028 1,215 1,4083.625%, 05/01/2024 1,000 1,049
John Deere Capital MTN 1.200%, 04/06/2023 763 7690.550%, 07/05/2022 991 992
DescriptionFace Amount (Thousands)
Market Value ($ Thousands)
CORPORATE OBLIGATIONS (continued)L3Harris Technologies
5.054%, 04/27/2045 $ 180 $ 2364.854%, 04/27/2035 80 98
Lockheed Martin 4.500%, 05/15/2036 90 1104.070%, 12/15/2042 91 1073.550%, 01/15/2026 1,190 1,2883.100%, 01/15/2023 50 51
Mileage Plus Holdings 6.500%, 06/20/2027 (B) 510 544
Northrop Grumman 5.250%, 05/01/2050 350 4904.030%, 10/15/2047 622 7333.250%, 08/01/2023 1,660 1,7173.250%, 01/15/2028 1,658 1,7742.930%, 01/15/2025 810 844
Otis Worldwide 3.112%, 02/15/2040 555 5692.056%, 04/05/2025 220 224
Parker-Hannifin 2.700%, 06/14/2024 400 413
Prime Security Services Borrower 5.750%, 04/15/2026 (B) 320 344
Quanta Services 0.950%, 10/01/2024 784 775
Raytheon Technologies 4.625%, 11/16/2048 51 654.500%, 06/01/2042 430 5324.450%, 11/16/2038 63 764.150%, 05/15/2045 59 694.125%, 11/16/2028 280 3133.950%, 08/16/2025 510 5533.150%, 12/15/2024 200 2102.250%, 07/01/2030 420 419
Republic Services 3.950%, 05/15/2028 335 3712.500%, 08/15/2024 635 6531.450%, 02/15/2031 1,650 1,534
Roper Technologies 1.000%, 09/15/2025 420 410
Siemens Financieringsmaatschappij 1.200%, 03/11/2026 (B) 1,120 1,102
Sodexo 1.634%, 04/16/2026 (B) 871 863
Southwest Airlines 5.125%, 06/15/2027 965 1,103
Spirit Loyalty Cayman 8.000%, 09/20/2025 (B) 375 414
Teck Resources 6.125%, 10/01/2035 330 428
Triton Container International 2.050%, 04/15/2026 (B) 755 749
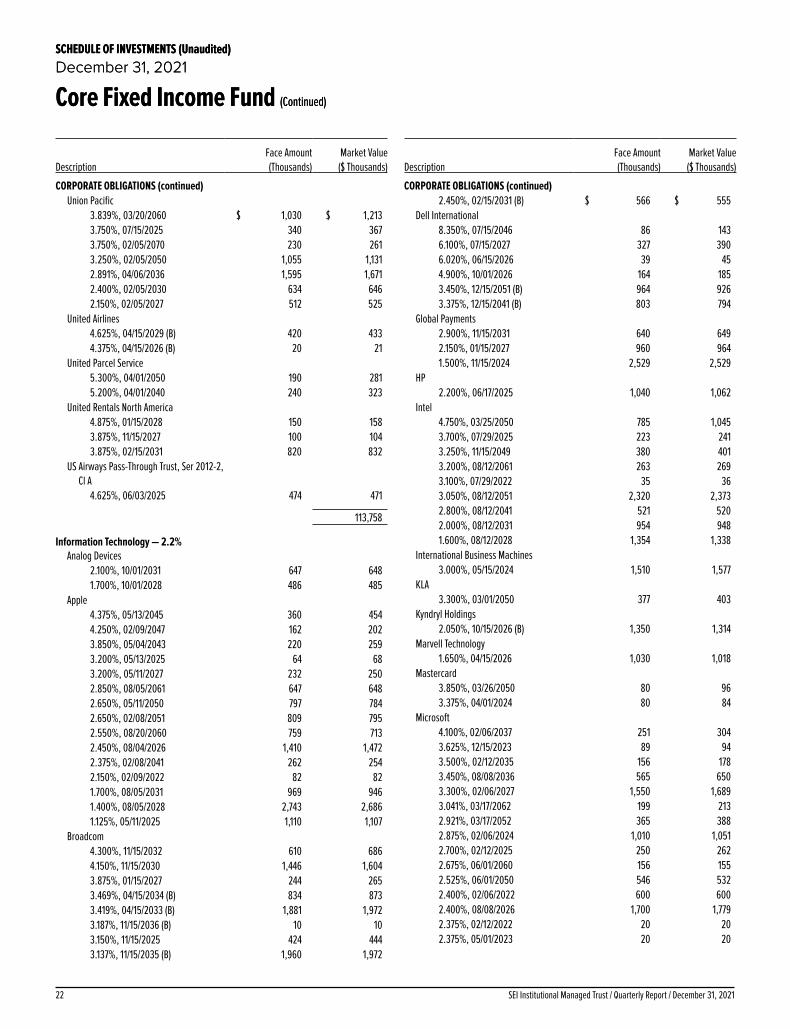
SEI Institutional Managed Trust / Quarterly Report / December 31, 202122
SCHEDULE OF INVESTMENTS (Unaudited)December 31, 2021
Core Fixed Income Fund (Continued)
SCHEDULE OF INVESTMENTS (Unaudited)December 31, 2021
Core Fixed Income Fund (Continued)
DescriptionFace Amount (Thousands)
Market Value ($ Thousands)
CORPORATE OBLIGATIONS (continued)Union Pacific
3.839%, 03/20/2060 $ 1,030 $ 1,2133.750%, 07/15/2025 340 3673.750%, 02/05/2070 230 2613.250%, 02/05/2050 1,055 1,1312.891%, 04/06/2036 1,595 1,6712.400%, 02/05/2030 634 6462.150%, 02/05/2027 512 525
United Airlines 4.625%, 04/15/2029 (B) 420 4334.375%, 04/15/2026 (B) 20 21
United Parcel Service 5.300%, 04/01/2050 190 2815.200%, 04/01/2040 240 323
United Rentals North America 4.875%, 01/15/2028 150 1583.875%, 11/15/2027 100 1043.875%, 02/15/2031 820 832
US Airways Pass-Through Trust, Ser 2012-2, Cl A
4.625%, 06/03/2025 474 471
113,758
Information Technology — 2.2%Analog Devices
2.100%, 10/01/2031 647 6481.700%, 10/01/2028 486 485
Apple 4.375%, 05/13/2045 360 4544.250%, 02/09/2047 162 2023.850%, 05/04/2043 220 2593.200%, 05/13/2025 64 683.200%, 05/11/2027 232 2502.850%, 08/05/2061 647 6482.650%, 05/11/2050 797 7842.650%, 02/08/2051 809 7952.550%, 08/20/2060 759 7132.450%, 08/04/2026 1,410 1,4722.375%, 02/08/2041 262 2542.150%, 02/09/2022 82 821.700%, 08/05/2031 969 9461.400%, 08/05/2028 2,743 2,6861.125%, 05/11/2025 1,110 1,107
Broadcom 4.300%, 11/15/2032 610 6864.150%, 11/15/2030 1,446 1,6043.875%, 01/15/2027 244 2653.469%, 04/15/2034 (B) 834 8733.419%, 04/15/2033 (B) 1,881 1,9723.187%, 11/15/2036 (B) 10 103.150%, 11/15/2025 424 4443.137%, 11/15/2035 (B) 1,960 1,972
DescriptionFace Amount (Thousands)
Market Value ($ Thousands)
CORPORATE OBLIGATIONS (continued)2.450%, 02/15/2031 (B) $ 566 $ 555
Dell International 8.350%, 07/15/2046 86 1436.100%, 07/15/2027 327 3906.020%, 06/15/2026 39 454.900%, 10/01/2026 164 1853.450%, 12/15/2051 (B) 964 9263.375%, 12/15/2041 (B) 803 794
Global Payments 2.900%, 11/15/2031 640 6492.150%, 01/15/2027 960 9641.500%, 11/15/2024 2,529 2,529
HP 2.200%, 06/17/2025 1,040 1,062
Intel 4.750%, 03/25/2050 785 1,0453.700%, 07/29/2025 223 2413.250%, 11/15/2049 380 4013.200%, 08/12/2061 263 2693.100%, 07/29/2022 35 363.050%, 08/12/2051 2,320 2,3732.800%, 08/12/2041 521 5202.000%, 08/12/2031 954 9481.600%, 08/12/2028 1,354 1,338
International Business Machines 3.000%, 05/15/2024 1,510 1,577
KLA 3.300%, 03/01/2050 377 403
Kyndryl Holdings 2.050%, 10/15/2026 (B) 1,350 1,314
Marvell Technology 1.650%, 04/15/2026 1,030 1,018
Mastercard 3.850%, 03/26/2050 80 963.375%, 04/01/2024 80 84
Microsoft 4.100%, 02/06/2037 251 3043.625%, 12/15/2023 89 943.500%, 02/12/2035 156 1783.450%, 08/08/2036 565 6503.300%, 02/06/2027 1,550 1,6893.041%, 03/17/2062 199 2132.921%, 03/17/2052 365 3882.875%, 02/06/2024 1,010 1,0512.700%, 02/12/2025 250 2622.675%, 06/01/2060 156 1552.525%, 06/01/2050 546 5322.400%, 02/06/2022 600 6002.400%, 08/08/2026 1,700 1,7792.375%, 02/12/2022 20 202.375%, 05/01/2023 20 20

23SEI Institutional Managed Trust / Quarterly Report / December 31, 2021
SCHEDULE OF INVESTMENTS (Unaudited)December 31, 2021
Core Fixed Income Fund (Continued)
DescriptionFace Amount (Thousands)
Market Value ($ Thousands)
CORPORATE OBLIGATIONS (continued)NVIDIA
3.700%, 04/01/2060 $ 310 $ 3703.500%, 04/01/2040 430 4833.500%, 04/01/2050 1,200 1,3682.850%, 04/01/2030 1,560 1,657
NXP BV 3.875%, 06/18/2026 (B) 1,382 1,4923.250%, 05/11/2041 (B) 354 3663.150%, 05/01/2027 (B) 321 3382.700%, 05/01/2025 (B) 280 289
Oracle 4.375%, 05/15/2055 420 4603.950%, 03/25/2051 3,702 3,8433.900%, 05/15/2035 1,720 1,8423.800%, 11/15/2037 2,255 2,3543.650%, 03/25/2041 336 3403.600%, 04/01/2040 1,265 1,2693.600%, 04/01/2050 310 3042.950%, 11/15/2024 315 3282.950%, 04/01/2030 790 7992.875%, 03/25/2031 1,320 1,3282.800%, 04/01/2027 562 5791.650%, 03/25/2026 1,100 1,092
PayPal Holdings 2.300%, 06/01/2030 2,845 2,8901.650%, 06/01/2025 400 4051.350%, 06/01/2023 390 393
Prosus 3.832%, 02/08/2051 (B) 320 298
Prosus MTN 4.027%, 08/03/2050 (B) 730 7013.061%, 07/13/2031 (B) 2,100 2,047
salesforce.com 3.700%, 04/11/2028 670 7433.250%, 04/11/2023 480 495
Sprint 7.875%, 09/15/2023 110 121
Sprint Capital 8.750%, 03/15/2032 490 735
Tencent Holdings MTN 3.975%, 04/11/2029 (B) 600 6533.840%, 04/22/2051 (B) 2,035 2,1373.680%, 04/22/2041 (B) 1,300 1,3493.595%, 01/19/2028 (B) 570 605
Texas Instruments 4.150%, 05/15/2048 300 3741.750%, 05/04/2030 290 2841.125%, 09/15/2026 322 319
TSMC Arizona 3.250%, 10/25/2051 290 3051.750%, 10/25/2026 1,300 1,301
DescriptionFace Amount (Thousands)
Market Value ($ Thousands)
CORPORATE OBLIGATIONS (continued)TSMC Global
1.375%, 09/28/2030 (B) $ 1,925 $ 1,786Visa
4.300%, 12/14/2045 690 8683.650%, 09/15/2047 235 2733.150%, 12/14/2025 1,410 1,504
VMware 4.700%, 05/15/2030 650 7573.900%, 08/21/2027 128 1391.800%, 08/15/2028 706 6871.400%, 08/15/2026 1,283 1,2611.000%, 08/15/2024 1,123 1,1120.600%, 08/15/2023 1,603 1,592
Vontier 2.950%, 04/01/2031 (B) 425 4211.800%, 04/01/2026 (B) 495 487
95,462
Materials — 0.6%Amcor Finance USA
3.625%, 04/28/2026 2,425 2,583Anglo American Capital
4.750%, 04/10/2027 (B) 720 8014.000%, 09/11/2027 (B) 200 2153.625%, 09/11/2024 (B) 710 745
ArcelorMittal 7.000%, 10/15/2039 120 165
Ball 3.125%, 09/15/2031 310 306
Barrick 5.250%, 04/01/2042 80 104
Barrick North America Finance 5.750%, 05/01/2043 290 3945.700%, 05/30/2041 509 692
Berry Global 1.570%, 01/15/2026 2,985 2,921
BHP Billiton Finance USA 5.000%, 09/30/2043 410 5424.125%, 02/24/2042 40 472.875%, 02/24/2022 50 50
Dow Chemical 5.250%, 11/15/2041 25 324.800%, 05/15/2049 360 4583.600%, 11/15/2050 647 701
DuPont de Nemours 4.493%, 11/15/2025 1,775 1,961
Ecolab 2.700%, 12/15/2051 354 3482.125%, 02/01/2032 964 956
Equate Petrochemical BV MTN 4.250%, 11/03/2026 (B) 480 521

SEI Institutional Managed Trust / Quarterly Report / December 31, 202124
SCHEDULE OF INVESTMENTS (Unaudited)December 31, 2021
Core Fixed Income Fund (Continued)
SCHEDULE OF INVESTMENTS (Unaudited)December 31, 2021
Core Fixed Income Fund (Continued)
DescriptionFace Amount (Thousands)
Market Value ($ Thousands)
CORPORATE OBLIGATIONS (continued)Freeport-McMoRan
5.450%, 03/15/2043 $ 645 $ 8114.625%, 08/01/2030 180 1934.550%, 11/14/2024 40 433.875%, 03/15/2023 20 21
Glencore Funding 4.125%, 05/30/2023 (B) 200 2084.125%, 03/12/2024 (B) 1,340 1,4094.000%, 03/27/2027 (B) 1,200 1,2953.875%, 10/27/2027 (B) 220 2363.000%, 10/27/2022 (B) 30 31
Industrias Penoles 4.150%, 09/12/2029 (B) 1,005 1,084
International Flavors & Fragrances 5.000%, 09/26/2048 1,505 1,9341.230%, 10/01/2025 (B) 1,835 1,794
LYB International Finance III 3.625%, 04/01/2051 959 1,0153.375%, 10/01/2040 968 1,008
Nacional del Cobre de Chile 4.250%, 07/17/2042 (B) 970 1,070
Newcrest Finance Pty 3.250%, 05/13/2030 (B) 630 660
OCP 5.125%, 06/23/2051 (B) 360 3394.500%, 10/22/2025 (B) 400 4223.750%, 06/23/2031 (B) 410 398
Orbia Advance 2.875%, 05/11/2031 (B) 780 7671.875%, 05/11/2026 (B) 820 808
Sealed Air 1.573%, 10/15/2026 (B) 795 771
Southern Copper 5.250%, 11/08/2042 2,220 2,794
Suzano Austria GmbH 3.750%, 01/15/2031 1,400 1,4233.125%, 01/15/2032 70 68
Teck Resources 6.250%, 07/15/2041 376 4996.000%, 08/15/2040 30 385.200%, 03/01/2042 382 449
Vale Overseas 6.875%, 11/21/2036 874 1,1616.250%, 08/10/2026 32 37
Westlake Chemical 3.600%, 08/15/2026 352 3783.125%, 08/15/2051 1,157 1,114
WestRock RKT 4.000%, 03/01/2023 70 72
38,892
DescriptionFace Amount (Thousands)
Market Value ($ Thousands)
CORPORATE OBLIGATIONS (continued)Real Estate — 0.9%
Agree 2.600%, 06/15/2033 $ 160 $ 1572.000%, 06/15/2028 706 692
American Campus Communities Operating Partnership
3.750%, 04/15/2023 1,350 1,3863.625%, 11/15/2027 745 7963.300%, 07/15/2026 1,495 1,5752.250%, 01/15/2029 486 481
American Tower 1.875%, 10/15/2030 1,430 1,351
AvalonBay Communities MTN 4.350%, 04/15/2048 110 1412.450%, 01/15/2031 1,155 1,184
Boston Properties 3.800%, 02/01/2024 1,250 1,3073.400%, 06/21/2029 720 764
Brandywine Operating Partnership 3.950%, 11/15/2027 17 18
Brixmor Operating Partnership 2.500%, 08/16/2031 390 3822.250%, 04/01/2028 226 225
Camden Property Trust 2.800%, 05/15/2030 435 452
Crown Castle International 4.000%, 03/01/2027 162 1762.900%, 04/01/2041 453 4402.500%, 07/15/2031 708 7032.100%, 04/01/2031 1,791 1,7141.050%, 07/15/2026 969 936
CyrusOne 3.450%, 11/15/2029 760 8242.900%, 11/15/2024 1,250 1,2902.150%, 11/01/2030 155 153
Equinix 2.950%, 09/15/2051 590 557
Essential Properties 2.950%, 07/15/2031 1,290 1,271
Essex Portfolio 2.550%, 06/15/2031 333 3341.700%, 03/01/2028 847 825
Extra Space Storage 2.350%, 03/15/2032 291 283
GLP Capital 5.375%, 04/15/2026 2,615 2,9125.300%, 01/15/2029 1,521 1,7275.250%, 06/01/2025 775 8494.000%, 01/15/2030 150 1593.350%, 09/01/2024 125 1293.250%, 01/15/2032 443 445

25SEI Institutional Managed Trust / Quarterly Report / December 31, 2021
SCHEDULE OF INVESTMENTS (Unaudited)December 31, 2021
Core Fixed Income Fund (Continued)
DescriptionFace Amount (Thousands)
Market Value ($ Thousands)
CORPORATE OBLIGATIONS (continued)Healthcare Realty Trust
3.875%, 05/01/2025 $ 200 $ 212Healthpeak Properties
2.125%, 12/01/2028 320 320Hudson Pacific Properties
4.650%, 04/01/2029 580 6553.950%, 11/01/2027 1,246 1,335
Kilroy Realty 2.650%, 11/15/2033 2,497 2,427
Life Storage 3.875%, 12/15/2027 915 1,004
Mid-America Apartments 4.300%, 10/15/2023 331 3464.000%, 11/15/2025 395 4273.950%, 03/15/2029 324 362
Realty Income 3.400%, 01/15/2028 344 3712.850%, 12/15/2032 470 4882.200%, 06/15/2028 346 349
Regency Centers 2.950%, 09/15/2029 703 729
Rexford Industrial Realty 2.150%, 09/01/2031 359 339
Sabra Health Care 3.900%, 10/15/2029 715 749
Simon Property Group 2.450%, 09/13/2029 1,020 1,027
Spirit Realty 3.400%, 01/15/2030 389 4092.700%, 02/15/2032 194 1922.100%, 03/15/2028 645 628
STORE Capital 4.625%, 03/15/2029 412 4614.500%, 03/15/2028 1,222 1,3502.750%, 11/18/2030 574 5692.700%, 12/01/2031 224 219
Sun Communities Operating 2.300%, 11/01/2028 322 322
Ventas Realty 2.500%, 09/01/2031 275 272
Welltower 4.500%, 01/15/2024 102 108
42,308
Utilities — 1.8%AEP Texas
6.650%, 02/15/2033 500 665AES
1.375%, 01/15/2026 698 677Alabama Power
3.700%, 12/01/2047 1,600 1,767
DescriptionFace Amount (Thousands)
Market Value ($ Thousands)
CORPORATE OBLIGATIONS (continued)American Transmission Systems
2.650%, 01/15/2032 (B) $ 1,285 $ 1,297Baltimore Gas and Electric
2.250%, 06/15/2031 483 483Berkshire Hathaway Energy
2.850%, 05/15/2051 1,060 1,020Black Hills
3.875%, 10/15/2049 291 318Boston Gas
4.487%, 02/15/2042 (B) 35 40Cleco Power
6.000%, 12/01/2040 700 953Comision Federal de Electricidad
3.875%, 07/26/2033 (B) 656 643Consolidated Edison of New York
4.650%, 12/01/2048 1,500 1,8564.450%, 03/15/2044 1,120 1,3123.950%, 04/01/2050 130 1493.350%, 04/01/2030 180 194
Consumers Energy 2.650%, 08/15/2052 356 346
Dominion Energy 3.071%, 08/15/2024 980 1,0141.450%, 04/15/2026 408 403
DTE Electric 2.950%, 03/01/2050 564 568
DTE Energy 2.950%, 03/01/2030 433 4442.529%, 10/01/2024 830 8541.050%, 06/01/2025 1,833 1,796
Duke Energy 3.500%, 06/15/2051 193 1993.150%, 08/15/2027 280 2952.550%, 06/15/2031 3,711 3,7152.400%, 08/15/2022 340 3430.900%, 09/15/2025 705 685
Duke Energy Carolinas 4.250%, 12/15/2041 628 7404.000%, 09/30/2042 1,000 1,1482.550%, 04/15/2031 328 337
Duke Energy Florida 3.850%, 11/15/2042 380 4263.200%, 01/15/2027 1,080 1,1492.400%, 12/15/2031 480 486
Duke Energy Indiana 4.200%, 03/15/2042 30 342.750%, 04/01/2050 280 272
Duke Energy Progress 4.100%, 05/15/2042 425 4962.800%, 05/15/2022 25 252.500%, 08/15/2050 486 449
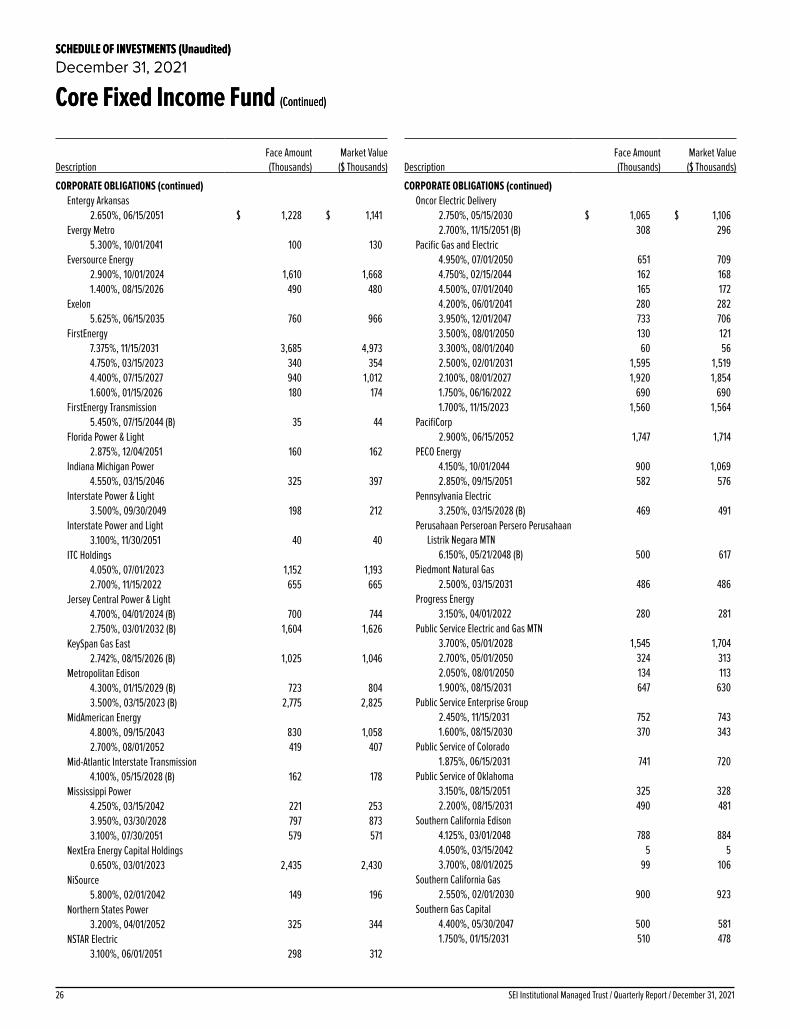
SEI Institutional Managed Trust / Quarterly Report / December 31, 202126
SCHEDULE OF INVESTMENTS (Unaudited)December 31, 2021
Core Fixed Income Fund (Continued)
SCHEDULE OF INVESTMENTS (Unaudited)December 31, 2021
Core Fixed Income Fund (Continued)
DescriptionFace Amount (Thousands)
Market Value ($ Thousands)
CORPORATE OBLIGATIONS (continued)Entergy Arkansas
2.650%, 06/15/2051 $ 1,228 $ 1,141Evergy Metro
5.300%, 10/01/2041 100 130Eversource Energy
2.900%, 10/01/2024 1,610 1,6681.400%, 08/15/2026 490 480
Exelon 5.625%, 06/15/2035 760 966
FirstEnergy 7.375%, 11/15/2031 3,685 4,9734.750%, 03/15/2023 340 3544.400%, 07/15/2027 940 1,0121.600%, 01/15/2026 180 174
FirstEnergy Transmission 5.450%, 07/15/2044 (B) 35 44
Florida Power & Light 2.875%, 12/04/2051 160 162
Indiana Michigan Power 4.550%, 03/15/2046 325 397
Interstate Power & Light 3.500%, 09/30/2049 198 212
Interstate Power and Light 3.100%, 11/30/2051 40 40
ITC Holdings 4.050%, 07/01/2023 1,152 1,1932.700%, 11/15/2022 655 665
Jersey Central Power & Light 4.700%, 04/01/2024 (B) 700 7442.750%, 03/01/2032 (B) 1,604 1,626
KeySpan Gas East 2.742%, 08/15/2026 (B) 1,025 1,046
Metropolitan Edison 4.300%, 01/15/2029 (B) 723 8043.500%, 03/15/2023 (B) 2,775 2,825
MidAmerican Energy 4.800%, 09/15/2043 830 1,0582.700%, 08/01/2052 419 407
Mid-Atlantic Interstate Transmission 4.100%, 05/15/2028 (B) 162 178
Mississippi Power 4.250%, 03/15/2042 221 2533.950%, 03/30/2028 797 8733.100%, 07/30/2051 579 571
NextEra Energy Capital Holdings 0.650%, 03/01/2023 2,435 2,430
NiSource 5.800%, 02/01/2042 149 196
Northern States Power 3.200%, 04/01/2052 325 344
NSTAR Electric 3.100%, 06/01/2051 298 312
DescriptionFace Amount (Thousands)
Market Value ($ Thousands)
CORPORATE OBLIGATIONS (continued)Oncor Electric Delivery
2.750%, 05/15/2030 $ 1,065 $ 1,1062.700%, 11/15/2051 (B) 308 296
Pacific Gas and Electric 4.950%, 07/01/2050 651 7094.750%, 02/15/2044 162 1684.500%, 07/01/2040 165 1724.200%, 06/01/2041 280 2823.950%, 12/01/2047 733 7063.500%, 08/01/2050 130 1213.300%, 08/01/2040 60 562.500%, 02/01/2031 1,595 1,5192.100%, 08/01/2027 1,920 1,8541.750%, 06/16/2022 690 6901.700%, 11/15/2023 1,560 1,564
PacifiCorp 2.900%, 06/15/2052 1,747 1,714
PECO Energy 4.150%, 10/01/2044 900 1,0692.850%, 09/15/2051 582 576
Pennsylvania Electric 3.250%, 03/15/2028 (B) 469 491
Perusahaan Perseroan Persero Perusahaan Listrik Negara MTN
6.150%, 05/21/2048 (B) 500 617Piedmont Natural Gas
2.500%, 03/15/2031 486 486Progress Energy
3.150%, 04/01/2022 280 281Public Service Electric and Gas MTN
3.700%, 05/01/2028 1,545 1,7042.700%, 05/01/2050 324 3132.050%, 08/01/2050 134 1131.900%, 08/15/2031 647 630
Public Service Enterprise Group 2.450%, 11/15/2031 752 7431.600%, 08/15/2030 370 343
Public Service of Colorado 1.875%, 06/15/2031 741 720
Public Service of Oklahoma 3.150%, 08/15/2051 325 3282.200%, 08/15/2031 490 481
Southern California Edison 4.125%, 03/01/2048 788 8844.050%, 03/15/2042 5 53.700%, 08/01/2025 99 106
Southern California Gas 2.550%, 02/01/2030 900 923
Southern Gas Capital 4.400%, 05/30/2047 500 5811.750%, 01/15/2031 510 478
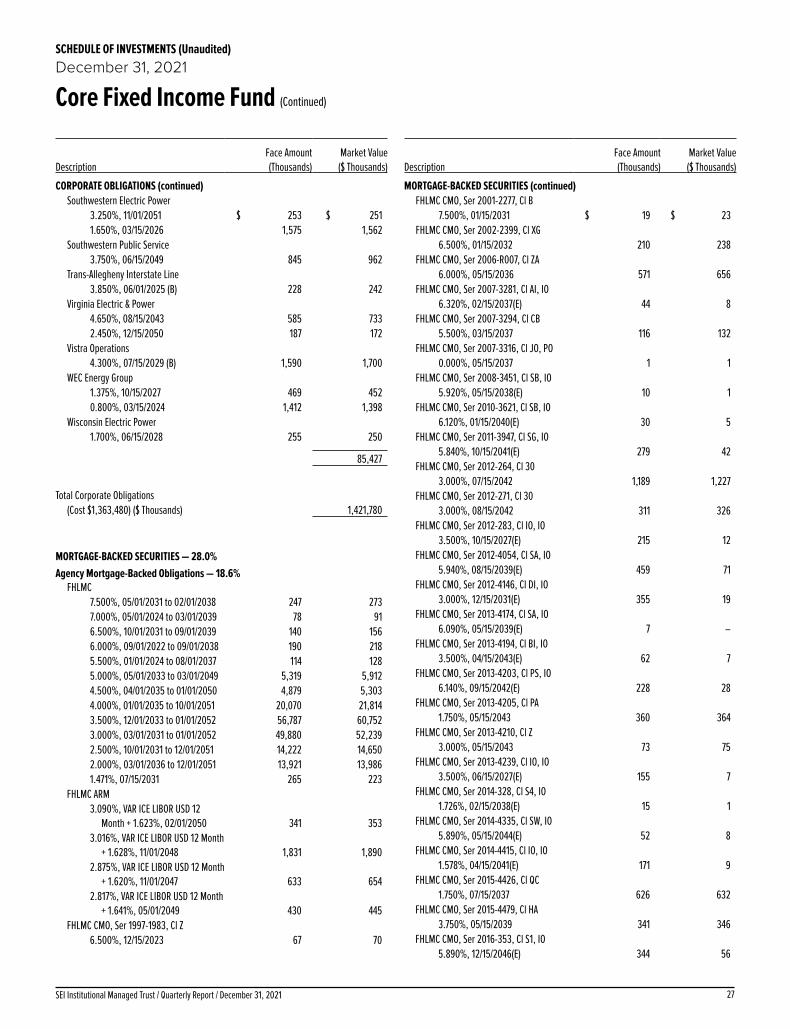
27SEI Institutional Managed Trust / Quarterly Report / December 31, 2021
SCHEDULE OF INVESTMENTS (Unaudited)December 31, 2021
Core Fixed Income Fund (Continued)
DescriptionFace Amount (Thousands)
Market Value ($ Thousands)
CORPORATE OBLIGATIONS (continued)Southwestern Electric Power
3.250%, 11/01/2051 $ 253 $ 2511.650%, 03/15/2026 1,575 1,562
Southwestern Public Service 3.750%, 06/15/2049 845 962
Trans-Allegheny Interstate Line 3.850%, 06/01/2025 (B) 228 242
Virginia Electric & Power 4.650%, 08/15/2043 585 7332.450%, 12/15/2050 187 172
Vistra Operations 4.300%, 07/15/2029 (B) 1,590 1,700
WEC Energy Group 1.375%, 10/15/2027 469 4520.800%, 03/15/2024 1,412 1,398
Wisconsin Electric Power 1.700%, 06/15/2028 255 250
85,427
Total Corporate Obligations
(Cost $1,363,480) ($ Thousands) 1,421,780
MORTGAGE-BACKED SECURITIES — 28.0%Agency Mortgage-Backed Obligations — 18.6%
FHLMC7.500%, 05/01/2031 to 02/01/2038 247 2737.000%, 05/01/2024 to 03/01/2039 78 916.500%, 10/01/2031 to 09/01/2039 140 1566.000%, 09/01/2022 to 09/01/2038 190 2185.500%, 01/01/2024 to 08/01/2037 114 1285.000%, 05/01/2033 to 03/01/2049 5,319 5,9124.500%, 04/01/2035 to 01/01/2050 4,879 5,3034.000%, 01/01/2035 to 10/01/2051 20,070 21,8143.500%, 12/01/2033 to 01/01/2052 56,787 60,7523.000%, 03/01/2031 to 01/01/2052 49,880 52,2392.500%, 10/01/2031 to 12/01/2051 14,222 14,6502.000%, 03/01/2036 to 12/01/2051 13,921 13,9861.471%, 07/15/2031 265 223
FHLMC ARM3.090%, VAR ICE LIBOR USD 12
Month + 1.623%, 02/01/2050 341 3533.016%, VAR ICE LIBOR USD 12 Month
+ 1.628%, 11/01/2048 1,831 1,8902.875%, VAR ICE LIBOR USD 12 Month
+ 1.620%, 11/01/2047 633 6542.817%, VAR ICE LIBOR USD 12 Month
+ 1.641%, 05/01/2049 430 445FHLMC CMO, Ser 1997-1983, Cl Z
6.500%, 12/15/2023 67 70
DescriptionFace Amount (Thousands)
Market Value ($ Thousands)
MORTGAGE-BACKED SECURITIES (continued)FHLMC CMO, Ser 2001-2277, Cl B
7.500%, 01/15/2031 $ 19 $ 23FHLMC CMO, Ser 2002-2399, Cl XG
6.500%, 01/15/2032 210 238FHLMC CMO, Ser 2006-R007, Cl ZA
6.000%, 05/15/2036 571 656FHLMC CMO, Ser 2007-3281, Cl AI, IO
6.320%, 02/15/2037(E) 44 8FHLMC CMO, Ser 2007-3294, Cl CB
5.500%, 03/15/2037 116 132FHLMC CMO, Ser 2007-3316, Cl JO, PO
0.000%, 05/15/2037 1 1FHLMC CMO, Ser 2008-3451, Cl SB, IO
5.920%, 05/15/2038(E) 10 1FHLMC CMO, Ser 2010-3621, Cl SB, IO
6.120%, 01/15/2040(E) 30 5FHLMC CMO, Ser 2011-3947, Cl SG, IO
5.840%, 10/15/2041(E) 279 42FHLMC CMO, Ser 2012-264, Cl 30
3.000%, 07/15/2042 1,189 1,227FHLMC CMO, Ser 2012-271, Cl 30
3.000%, 08/15/2042 311 326FHLMC CMO, Ser 2012-283, Cl IO, IO
3.500%, 10/15/2027(E) 215 12FHLMC CMO, Ser 2012-4054, Cl SA, IO
5.940%, 08/15/2039(E) 459 71FHLMC CMO, Ser 2012-4146, Cl DI, IO
3.000%, 12/15/2031(E) 355 19FHLMC CMO, Ser 2013-4174, Cl SA, IO
6.090%, 05/15/2039(E) 7 –FHLMC CMO, Ser 2013-4194, Cl BI, IO
3.500%, 04/15/2043(E) 62 7FHLMC CMO, Ser 2013-4203, Cl PS, IO
6.140%, 09/15/2042(E) 228 28FHLMC CMO, Ser 2013-4205, Cl PA
1.750%, 05/15/2043 360 364FHLMC CMO, Ser 2013-4210, Cl Z
3.000%, 05/15/2043 73 75FHLMC CMO, Ser 2013-4239, Cl IO, IO
3.500%, 06/15/2027(E) 155 7FHLMC CMO, Ser 2014-328, Cl S4, IO
1.726%, 02/15/2038(E) 15 1FHLMC CMO, Ser 2014-4335, Cl SW, IO
5.890%, 05/15/2044(E) 52 8FHLMC CMO, Ser 2014-4415, Cl IO, IO
1.578%, 04/15/2041(E) 171 9FHLMC CMO, Ser 2015-4426, Cl QC
1.750%, 07/15/2037 626 632FHLMC CMO, Ser 2015-4479, Cl HA
3.750%, 05/15/2039 341 346FHLMC CMO, Ser 2016-353, Cl S1, IO
5.890%, 12/15/2046(E) 344 56

SEI Institutional Managed Trust / Quarterly Report / December 31, 202128
SCHEDULE OF INVESTMENTS (Unaudited)December 31, 2021
Core Fixed Income Fund (Continued)
SCHEDULE OF INVESTMENTS (Unaudited)December 31, 2021
Core Fixed Income Fund (Continued)
DescriptionFace Amount (Thousands)
Market Value ($ Thousands)
MORTGAGE-BACKED SECURITIES (continued)FHLMC CMO, Ser 2016-4639, Cl HZ
3.250%, 04/15/2053 $ 1,774 $ 1,926FHLMC CMO, Ser 2017-356, Cl 300
3.000%, 09/15/2047 1,646 1,738FHLMC CMO, Ser 2017-4705, Cl A
4.500%, 09/15/2042 96 97FHLMC CMO, Ser 2017-4742, Cl PA
3.000%, 10/15/2047 1,371 1,401FHLMC CMO, Ser 2018-4763, Cl CA
3.000%, 09/15/2038 217 227FHLMC CMO, Ser 2018-4767, Cl KA
3.000%, 03/15/2048 592 620FHLMC CMO, Ser 2018-4813, Cl CJ
3.000%, 08/15/2048 255 263FHLMC CMO, Ser 2018-4818, Cl CA
3.000%, 04/15/2048 576 593FHLMC CMO, Ser 2018-4846, Cl PA
4.000%, 06/15/2047 106 109FHLMC CMO, Ser 2018-4846, Cl PF
0.460%, VAR ICE LIBOR USD 1 Month + 0.350%, 12/15/2048 103 102
FHLMC CMO, Ser 2019-4880, Cl DA3.000%, 05/15/2050 807 845
FHLMC CMO, Ser 2020-4995, Cl IC, IO4.500%, 07/25/2050(E) 994 155
FHLMC CMO, Ser 2020-5010, Cl IK, IO2.500%, 09/25/2050(E) 300 39
FHLMC CMO, Ser 2020-5010, Cl JI, IO2.500%, 09/25/2050(E) 801 116
FHLMC CMO, Ser 2020-5012, Cl BI, IO4.000%, 09/25/2050(E) 3,735 502
FHLMC CMO, Ser 2020-5013, Cl IN, IO2.500%, 09/25/2050(E) 373 55
FHLMC CMO, Ser 2020-5018, Cl IH, IO3.500%, 10/25/2050(E) 1,252 206
FHLMC CMO, Ser 2020-5018, Cl MI, IO2.000%, 10/25/2050(E) 554 70
FHLMC CMO, Ser 2020-5018, Cl IO, IO3.500%, 10/25/2050(E) 2,248 370
FHLMC CMO, Ser 2020-5038, Cl IJ, IO4.000%, 11/25/2050(E) 3,134 499
FHLMC CMO, Ser 2020-5040, Cl IB, IO2.500%, 11/25/2050(E) 170 20
FHLMC CMO, Ser 2020-5059, Cl IB, IO2.500%, 01/25/2051(E) 755 118
FHLMC CMO, Ser 2021-5070, Cl DI, IO4.000%, 02/25/2051(E) 3,032 464
FHLMC CMO, Ser 2021-5091, Cl AB1.500%, 03/25/2051 1,444 1,420
FHLMC CMO, Ser 2021-5119, Cl AB1.500%, 08/25/2049 596 590
DescriptionFace Amount (Thousands)
Market Value ($ Thousands)
MORTGAGE-BACKED SECURITIES (continued)FHLMC CMO, Ser 2021-5140, Cl NI, IO
2.500%, 05/25/2049(E) $ 1,082 $ 146FHLMC Multiclass Certificates, Ser P009,
Cl A21.878%, 01/25/2031 500 507
FHLMC Multifamily Structured Pass-Through Certificates, Ser K032, Cl X1, IO
0.072%, 05/25/2023(E) 30,716 40FHLMC Multifamily Structured Pass-Through
Certificates, Ser K047, Cl A23.329%, 05/25/2025(E) 280 298
FHLMC Multifamily Structured Pass-Through Certificates, Ser K064, Cl X1, IO
0.604%, 03/25/2027(E) 4,696 133FHLMC Multifamily Structured Pass-Through
Certificates, Ser K094, Cl XAM, IO1.147%, 06/25/2029(E) 4,850 390
FHLMC Multifamily Structured Pass-Through Certificates, Ser K094, Cl X1, IO
0.880%, 06/25/2029(E) 1,995 117FHLMC Multifamily Structured Pass-Through
Certificates, Ser K095, Cl XAM, IO1.238%, 06/25/2029(E) 700 60
FHLMC Multifamily Structured Pass-Through Certificates, Ser K110, Cl X1, IO
1.697%, 04/25/2030(E) 1,297 155FHLMC Multifamily Structured Pass-Through
Certificates, Ser K136, Cl A22.127%, 11/25/2031 814 836
FHLMC Multifamily Structured Pass-Through Certificates, Ser K723, Cl X1, IO
0.913%, 08/25/2023(E) 6,516 81FHLMC Multifamily Structured Pass-Through
Certificates, Ser K736, Cl X1, IO1.311%, 07/25/2026(E) 1,038 50
FHLMC Multifamily Structured Pass-Through Certificates, Ser K741, Cl X1, IO
0.572%, 12/25/2027(E) 2,999 93FHLMC Multifamily Structured Pass-Through
Certificates, Ser K743, Cl X1, IO0.926%, 05/25/2028(E) 4,000 216
FHLMC Multifamily Structured Pass-Through Certificates, Ser KC05, Cl X1, IO
1.202%, 06/25/2027(E) 1,562 69FHLMC Multifamily Structured Pass-Through
Certificates, Ser KLU1, Cl A42.854%, 01/25/2031 600 642
FHLMC Multifamily Structured Pass-Through Certificates, Ser KSG2, Cl A2
2.091%, 11/25/2031(E) 710 725FHLMC Multifamily Structured Pass-Through
Certificates, Ser S8FX, Cl A23.291%, 03/25/2027 320 341
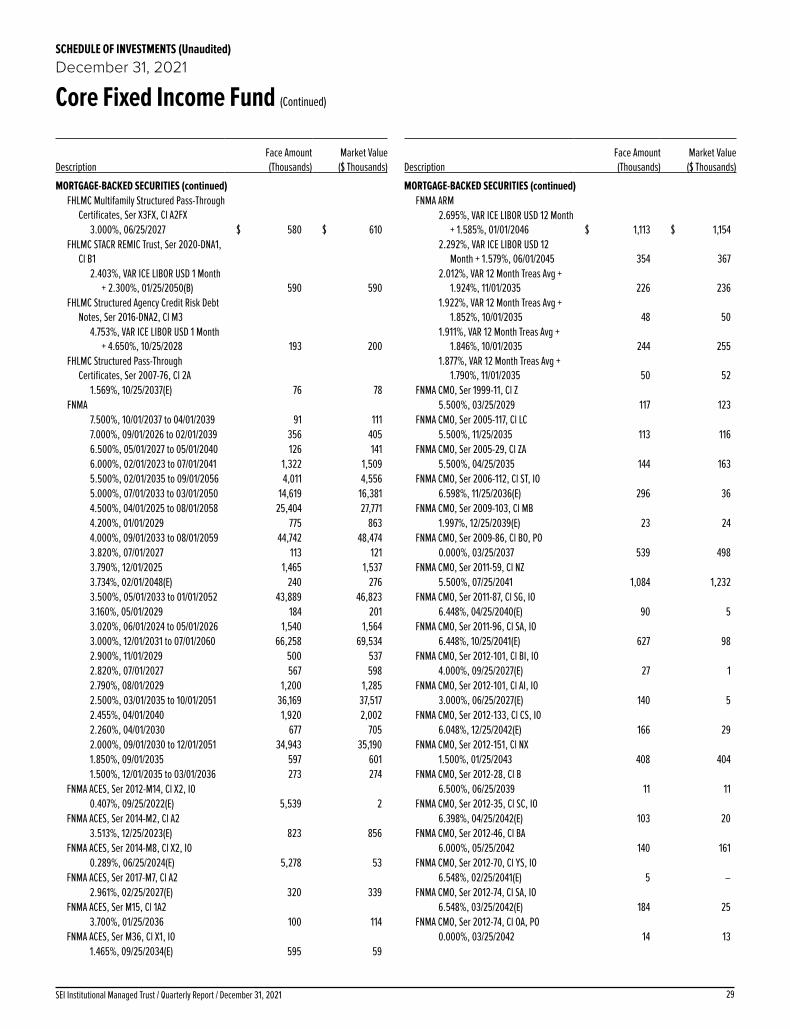
29SEI Institutional Managed Trust / Quarterly Report / December 31, 2021
SCHEDULE OF INVESTMENTS (Unaudited)December 31, 2021
Core Fixed Income Fund (Continued)
DescriptionFace Amount (Thousands)
Market Value ($ Thousands)
MORTGAGE-BACKED SECURITIES (continued)FHLMC Multifamily Structured Pass-Through
Certificates, Ser X3FX, Cl A2FX3.000%, 06/25/2027 $ 580 $ 610
FHLMC STACR REMIC Trust, Ser 2020-DNA1, Cl B1
2.403%, VAR ICE LIBOR USD 1 Month + 2.300%, 01/25/2050(B) 590 590
FHLMC Structured Agency Credit Risk Debt Notes, Ser 2016-DNA2, Cl M3
4.753%, VAR ICE LIBOR USD 1 Month + 4.650%, 10/25/2028 193 200
FHLMC Structured Pass-Through Certificates, Ser 2007-76, Cl 2A
1.569%, 10/25/2037(E) 76 78FNMA
7.500%, 10/01/2037 to 04/01/2039 91 1117.000%, 09/01/2026 to 02/01/2039 356 4056.500%, 05/01/2027 to 05/01/2040 126 1416.000%, 02/01/2023 to 07/01/2041 1,322 1,5095.500%, 02/01/2035 to 09/01/2056 4,011 4,5565.000%, 07/01/2033 to 03/01/2050 14,619 16,3814.500%, 04/01/2025 to 08/01/2058 25,404 27,7714.200%, 01/01/2029 775 8634.000%, 09/01/2033 to 08/01/2059 44,742 48,4743.820%, 07/01/2027 113 1213.790%, 12/01/2025 1,465 1,5373.734%, 02/01/2048(E) 240 2763.500%, 05/01/2033 to 01/01/2052 43,889 46,8233.160%, 05/01/2029 184 2013.020%, 06/01/2024 to 05/01/2026 1,540 1,5643.000%, 12/01/2031 to 07/01/2060 66,258 69,5342.900%, 11/01/2029 500 5372.820%, 07/01/2027 567 5982.790%, 08/01/2029 1,200 1,2852.500%, 03/01/2035 to 10/01/2051 36,169 37,5172.455%, 04/01/2040 1,920 2,0022.260%, 04/01/2030 677 7052.000%, 09/01/2030 to 12/01/2051 34,943 35,1901.850%, 09/01/2035 597 6011.500%, 12/01/2035 to 03/01/2036 273 274
FNMA ACES, Ser 2012-M14, Cl X2, IO0.407%, 09/25/2022(E) 5,539 2
FNMA ACES, Ser 2014-M2, Cl A23.513%, 12/25/2023(E) 823 856
FNMA ACES, Ser 2014-M8, Cl X2, IO0.289%, 06/25/2024(E) 5,278 53
FNMA ACES, Ser 2017-M7, Cl A22.961%, 02/25/2027(E) 320 339
FNMA ACES, Ser M15, Cl 1A23.700%, 01/25/2036 100 114
FNMA ACES, Ser M36, Cl X1, IO1.465%, 09/25/2034(E) 595 59
DescriptionFace Amount (Thousands)
Market Value ($ Thousands)
MORTGAGE-BACKED SECURITIES (continued)FNMA ARM
2.695%, VAR ICE LIBOR USD 12 Month + 1.585%, 01/01/2046 $ 1,113 $ 1,154
2.292%, VAR ICE LIBOR USD 12 Month + 1.579%, 06/01/2045 354 367
2.012%, VAR 12 Month Treas Avg + 1.924%, 11/01/2035 226 236
1.922%, VAR 12 Month Treas Avg + 1.852%, 10/01/2035 48 50
1.911%, VAR 12 Month Treas Avg + 1.846%, 10/01/2035 244 255
1.877%, VAR 12 Month Treas Avg + 1.790%, 11/01/2035 50 52
FNMA CMO, Ser 1999-11, Cl Z5.500%, 03/25/2029 117 123
FNMA CMO, Ser 2005-117, Cl LC5.500%, 11/25/2035 113 116
FNMA CMO, Ser 2005-29, Cl ZA5.500%, 04/25/2035 144 163
FNMA CMO, Ser 2006-112, Cl ST, IO6.598%, 11/25/2036(E) 296 36
FNMA CMO, Ser 2009-103, Cl MB1.997%, 12/25/2039(E) 23 24
FNMA CMO, Ser 2009-86, Cl BO, PO0.000%, 03/25/2037 539 498
FNMA CMO, Ser 2011-59, Cl NZ5.500%, 07/25/2041 1,084 1,232
FNMA CMO, Ser 2011-87, Cl SG, IO6.448%, 04/25/2040(E) 90 5
FNMA CMO, Ser 2011-96, Cl SA, IO6.448%, 10/25/2041(E) 627 98
FNMA CMO, Ser 2012-101, Cl BI, IO4.000%, 09/25/2027(E) 27 1
FNMA CMO, Ser 2012-101, Cl AI, IO3.000%, 06/25/2027(E) 140 5
FNMA CMO, Ser 2012-133, Cl CS, IO6.048%, 12/25/2042(E) 166 29
FNMA CMO, Ser 2012-151, Cl NX1.500%, 01/25/2043 408 404
FNMA CMO, Ser 2012-28, Cl B6.500%, 06/25/2039 11 11
FNMA CMO, Ser 2012-35, Cl SC, IO6.398%, 04/25/2042(E) 103 20
FNMA CMO, Ser 2012-46, Cl BA6.000%, 05/25/2042 140 161
FNMA CMO, Ser 2012-70, Cl YS, IO6.548%, 02/25/2041(E) 5 –
FNMA CMO, Ser 2012-74, Cl SA, IO6.548%, 03/25/2042(E) 184 25
FNMA CMO, Ser 2012-74, Cl OA, PO0.000%, 03/25/2042 14 13

SEI Institutional Managed Trust / Quarterly Report / December 31, 202130
SCHEDULE OF INVESTMENTS (Unaudited)December 31, 2021
Core Fixed Income Fund (Continued)
SCHEDULE OF INVESTMENTS (Unaudited)December 31, 2021
Core Fixed Income Fund (Continued)
DescriptionFace Amount (Thousands)
Market Value ($ Thousands)
MORTGAGE-BACKED SECURITIES (continued)FNMA CMO, Ser 2012-75, Cl AO, PO
0.000%, 03/25/2042 $ 28 $ 26FNMA CMO, Ser 2013-11, Cl AP
1.500%, 01/25/2043 1,441 1,435FNMA CMO, Ser 2013-111, Cl PL
2.000%, 12/25/2042 359 364FNMA CMO, Ser 2013-124, Cl SB, IO
5.848%, 12/25/2043(E) 275 48FNMA CMO, Ser 2013-126, Cl CS, IO
6.048%, 09/25/2041(E) 194 21FNMA CMO, Ser 2013-35, Cl CL
3.000%, 02/25/2043 6,875 7,175FNMA CMO, Ser 2013-43, Cl BP
1.750%, 05/25/2043 475 480FNMA CMO, Ser 2013-54, Cl BS, IO
6.048%, 06/25/2043(E) 108 19FNMA CMO, Ser 2013-73, Cl IB, IO
3.500%, 07/25/2028(E) 45 3FNMA CMO, Ser 2013-73, Cl IA, IO
3.000%, 09/25/2032(E) 260 16FNMA CMO, Ser 2013-9, Cl BC
6.500%, 07/25/2042 166 195FNMA CMO, Ser 2013-9, Cl CB
5.500%, 04/25/2042 1,253 1,410FNMA CMO, Ser 2013-9, Cl SA, IO
6.048%, 03/25/2042(E) 226 29FNMA CMO, Ser 2014-47, Cl AI, IO
1.611%, 08/25/2044(E) 112 6FNMA CMO, Ser 2014-73, Cl MA
2.500%, 11/25/2044 273 278FNMA CMO, Ser 2015-55, Cl IO, IO
1.394%, 08/25/2055(E) 317 13FNMA CMO, Ser 2015-56, Cl AS, IO
6.048%, 08/25/2045(E) 38 8FNMA CMO, Ser 2015-84, Cl PA
1.700%, 08/25/2033 1,713 1,740FNMA CMO, Ser 2016-37, Cl MJ
3.500%, 08/25/2043 131 134FNMA CMO, Ser 2016-48, Cl MA
2.000%, 06/25/2038 1,703 1,741FNMA CMO, Ser 2016-57, Cl PC
1.750%, 06/25/2046 3,227 3,211FNMA CMO, Ser 2017-13, Cl PA
3.000%, 08/25/2046 650 671FNMA CMO, Ser 2017-76, Cl SB, IO
5.998%, 10/25/2057(E) 1,061 194FNMA CMO, Ser 2017-85, Cl SC, IO
6.098%, 11/25/2047(E) 335 58FNMA CMO, Ser 2018-14, Cl KC
3.000%, 03/25/2048 1,166 1,220FNMA CMO, Ser 2018-15, Cl AB
3.000%, 03/25/2048 270 283
DescriptionFace Amount (Thousands)
Market Value ($ Thousands)
MORTGAGE-BACKED SECURITIES (continued)FNMA CMO, Ser 2018-43, Cl CT
3.000%, 06/25/2048 $ 961 $ 988FNMA CMO, Ser 2018-54, Cl KA
3.500%, 01/25/2047 506 519FNMA CMO, Ser 2018-8, Cl KL
2.500%, 03/25/2047 307 314FNMA CMO, Ser 2019-15, Cl AB
3.500%, 05/25/2053 1,380 1,476FNMA CMO, Ser 2019-25, Cl PA
3.000%, 05/25/2048 1,120 1,170FNMA CMO, Ser 2019-35, Cl A
3.000%, 07/25/2049 427 439FNMA CMO, Ser 2019-79, Cl FA
0.602%, VAR ICE LIBOR USD 1 Month + 0.500%, 01/25/2050 1,661 1,675
FNMA CMO, Ser 2020-101, Cl IA, IO3.500%, 01/25/2051(E) 3,875 562
FNMA CMO, Ser 2020-25, Cl BI, IO3.500%, 01/25/2047(E) 805 113
FNMA CMO, Ser 2020-47, Cl GZ2.000%, 07/25/2050 412 380
FNMA CMO, Ser 2020-48, Cl AB2.000%, 07/25/2050 604 611
FNMA CMO, Ser 2020-48, Cl DA2.000%, 07/25/2050 1,856 1,855
FNMA CMO, Ser 2020-56, Cl DI, IO2.500%, 08/25/2050(E) 608 89
FNMA CMO, Ser 2020-57, Cl NI, IO2.500%, 08/25/2050(E) 360 51
FNMA CMO, Ser 2020-64, Cl IB, IO4.000%, 09/25/2050(E) 1,204 200
FNMA CMO, Ser 2020-65, Cl JI, IO4.000%, 09/25/2050(E) 2,440 397
FNMA CMO, Ser 2020-65, Cl EI, IO4.000%, 09/25/2050(E) 2,014 335
FNMA CMO, Ser 2020-65, Cl DI, IO4.000%, 09/25/2050(E) 1,386 223
FNMA CMO, Ser 2020-84, Cl ID, IO3.500%, 12/25/2050(E) 1,173 181
FNMA CMO, Ser 2020-99, Cl IA, IO3.500%, 09/25/2049(E) 725 122
FNMA CMO, Ser 2021-1, Cl IG, IO2.500%, 02/25/2051(E) 189 27
FNMA CMO, Ser 2021-27, Cl EC1.500%, 05/25/2051 2,370 2,340
FNMA CMO, Ser 2021-78, Cl ND1.500%, 11/25/2051 1,383 1,380
FNMA Connecticut Avenue Securities, Ser 2014-C02, Cl 1M2
2.703%, VAR ICE LIBOR USD 1 Month + 2.600%, 05/25/2024 456 465

31SEI Institutional Managed Trust / Quarterly Report / December 31, 2021
SCHEDULE OF INVESTMENTS (Unaudited)December 31, 2021
Core Fixed Income Fund (Continued)
DescriptionFace Amount (Thousands)
Market Value ($ Thousands)
MORTGAGE-BACKED SECURITIES (continued)FNMA Connecticut Avenue Securities,
Ser 2014-C03, Cl 1M23.103%, VAR ICE LIBOR USD 1 Month
+ 3.000%, 07/25/2024 $ 1,700 $ 1,726FNMA Connecticut Avenue Securities,
Ser 2018-C05, Cl 1B14.353%, VAR ICE LIBOR USD 1 Month
+ 4.250%, 01/25/2031 540 566FNMA Interest CMO, Ser 2005-360, Cl 2, IO
5.000%, 08/25/2035(E) 656 112FNMA Interest CMO, Ser 2012-409, Cl C13,
IO3.500%, 11/25/2041(E) 163 16
FNMA Interest CMO, Ser 2012-409, Cl C2, IO3.000%, 04/25/2027(E) 213 10
FNMA Interest CMO, Ser 2012-409, Cl C22, IO
4.500%, 11/25/2039(E) 269 37FNMA Interest CMO, Ser 2012-411, Cl A3
3.000%, 08/25/2042 826 855FNMA Interest CMO, Ser 2012-414, Cl A35
3.500%, 10/25/2042 1,207 1,292FNMA Interest CMO, Ser 2018-424, Cl C11,
IO3.500%, 02/25/2048(E) 1,600 263
FNMA TBA5.000%, 01/01/2038 2,970 3,2364.500%, 01/15/2051 1,888 2,0224.000%, 01/15/2052 1,021 1,0863.500%, 02/15/2051 to 01/15/2052 3,028 3,1863.000%, 01/15/2043 to 03/15/2045 37,493 38,7902.500%, 01/01/2026 to 01/15/2051 39,738 40,5772.000%, 01/15/2036 to 02/15/2051 104,855 104,449
FREMF Mortgage Trust, Ser 2012-K20, Cl X2A, IO
0.200%, 05/25/2045(B)(E) 10,429 3FREMF Mortgage Trust, Ser 2019-KF58, Cl B
2.244%, VAR ICE LIBOR USD 1 Month + 2.150%, 01/25/2026(B) 861 857
GNMA8.000%, 11/15/2029 to 09/15/2030 32 347.500%, 03/15/2029 to 10/15/2037 45 517.000%, 09/15/2031 17 206.500%, 07/15/2028 to 12/15/2035 918 1,0396.000%, 12/15/2028 to 10/20/2040 1,599 1,8045.511%, 07/20/2060(E) 1 15.000%, 12/20/2039 to 03/20/2049 7,359 7,9494.700%, 09/20/2061(E) 100 1064.500%, 04/20/2041 to 12/20/2050 8,619 9,2264.475%, 01/20/2069(E) 15 154.000%, 06/20/2047 to 11/20/2050 13,116 13,9563.630%, 04/20/2063(E) 34 353.500%, 01/20/2046 to 10/20/2050 13,846 14,573
DescriptionFace Amount (Thousands)
Market Value ($ Thousands)
MORTGAGE-BACKED SECURITIES (continued)3.000%, 09/15/2042 to 01/20/2050 $ 9,082 $ 9,4822.500%, 12/20/2050 to 07/20/2051 3,705 3,8282.000%, 02/20/2034 to 12/20/2050 115 120
GNMA CMO, Ser 2007-17, Cl IB, IO6.146%, 04/20/2037(E) 321 44
GNMA CMO, Ser 2007-51, Cl SG, IO6.476%, 08/20/2037(E) 40 5
GNMA CMO, Ser 2007-78, Cl SA, IO6.423%, 12/16/2037(E) 398 48
GNMA CMO, Ser 2009-66, Cl XS, IO6.693%, 07/16/2039(E) 235 26
GNMA CMO, Ser 2010-4, Cl NS, IO6.283%, 01/16/2040(E) 2,657 471
GNMA CMO, Ser 2010-85, Cl HS, IO6.546%, 01/20/2040(E) 11 –
GNMA CMO, Ser 2010-H11, Cl FA1.092%, VAR ICE LIBOR USD 1 Month
+ 1.000%, 06/20/2060 345 350GNMA CMO, Ser 2010-H27, Cl FA
0.461%, VAR ICE LIBOR USD 1 Month + 0.380%, 12/20/2060 937 937
GNMA CMO, Ser 2010-H28, Cl FE0.481%, VAR ICE LIBOR USD 1 Month
+ 0.400%, 12/20/2060 351 351GNMA CMO, Ser 2011-H08, Cl FG
0.561%, VAR ICE LIBOR USD 1 Month + 0.480%, 03/20/2061 335 336
GNMA CMO, Ser 2011-H08, Cl FD0.581%, VAR ICE LIBOR USD 1 Month
+ 0.500%, 02/20/2061 169 169GNMA CMO, Ser 2011-H09, Cl AF
0.581%, VAR ICE LIBOR USD 1 Month + 0.500%, 03/20/2061 255 256
GNMA CMO, Ser 2012-141, Cl WA4.534%, 11/16/2041(E) 204 223
GNMA CMO, Ser 2012-34, Cl SA, IO5.946%, 03/20/2042(E) 303 58
GNMA CMO, Ser 2012-43, Cl SN, IO6.493%, 04/16/2042(E) 54 12
GNMA CMO, Ser 2012-66, Cl CI, IO3.500%, 02/20/2038(E) 13 –
GNMA CMO, Ser 2012-98, Cl SA, IO5.993%, 08/16/2042(E) 125 23
GNMA CMO, Ser 2012-H25, Cl FA0.781%, VAR ICE LIBOR USD 1 Month +
0.700%, 12/20/2061 6 6GNMA CMO, Ser 2012-H27, Cl AI, IO
1.764%, 10/20/2062(E) 786 34GNMA CMO, Ser 2013-53, Cl OI, IO
3.500%, 04/20/2043(E) 120 11GNMA CMO, Ser 2013-69, Cl AI, IO
3.500%, 05/20/2043(E) 328 45

SEI Institutional Managed Trust / Quarterly Report / December 31, 202132
SCHEDULE OF INVESTMENTS (Unaudited)December 31, 2021
Core Fixed Income Fund (Continued)
SCHEDULE OF INVESTMENTS (Unaudited)December 31, 2021
Core Fixed Income Fund (Continued)
DescriptionFace Amount (Thousands)
Market Value ($ Thousands)
MORTGAGE-BACKED SECURITIES (continued)GNMA CMO, Ser 2014-5, Cl SP, IO
6.043%, 06/16/2043(E) $ 115 $ 10GNMA CMO, Ser 2014-H10, Cl TA
0.681%, VAR ICE LIBOR USD 1 Month + 0.600%, 04/20/2064 462 465
GNMA CMO, Ser 2015-167, Cl OI, IO4.000%, 04/16/2045(E) 86 14
GNMA CMO, Ser 2015-H10, Cl FC0.561%, VAR ICE LIBOR USD 1 Month
+ 0.480%, 04/20/2065 302 303GNMA CMO, Ser 2015-H18, Cl FA
0.531%, VAR ICE LIBOR USD 1 Month + 0.450%, 06/20/2065 155 156
GNMA CMO, Ser 2015-H20, Cl FA0.551%, VAR ICE LIBOR USD 1 Month
+ 0.470%, 08/20/2065 216 216GNMA CMO, Ser 2016-135, Cl SB, IO
5.993%, 10/16/2046(E) 224 57GNMA CMO, Ser 2017-167, Cl BQ
2.500%, 08/20/2044 677 691GNMA CMO, Ser 2017-H15, Cl KI, IO
2.199%, 07/20/2067(E) 598 60GNMA CMO, Ser 2017-H18, Cl BI, IO
1.614%, 09/20/2067(E) 3,860 223GNMA CMO, Ser 2017-H20, Cl IB, IO
2.034%, 10/20/2067(E) 281 23GNMA CMO, Ser 2017-H22, Cl IC, IO
2.361%, 11/20/2067(E) 126 10GNMA CMO, Ser 2018-11, Cl PC
2.750%, 12/20/2047 675 685GNMA CMO, Ser 2018-H06, Cl PF
0.381%, VAR ICE LIBOR USD 1 Month + 0.300%, 02/20/2068 366 365
GNMA CMO, Ser 2018-H07, Cl FD0.381%, VAR ICE LIBOR USD 1 Month
+ 0.300%, 05/20/2068 677 676GNMA CMO, Ser 2019-132, Cl NA
3.500%, 09/20/2049 589 616GNMA CMO, Ser 2019-31, Cl JC
3.500%, 03/20/2049 374 395GNMA CMO, Ser 2019-90, Cl AB
3.000%, 07/20/2049 410 426GNMA CMO, Ser 2020-123, Cl NI, IO
2.500%, 08/20/2050(E) 726 93GNMA CMO, Ser 2020-123, Cl IL, IO
2.500%, 08/20/2050(E) 278 36GNMA CMO, Ser 2020-127, Cl IN, IO
2.500%, 08/20/2050(E) 362 48GNMA CMO, Ser 2020-129, Cl IE, IO
2.500%, 09/20/2050(E) 278 38GNMA CMO, Ser 2020-160, Cl VI, IO
2.500%, 10/20/2050(E) 277 36
DescriptionFace Amount (Thousands)
Market Value ($ Thousands)
MORTGAGE-BACKED SECURITIES (continued)GNMA CMO, Ser 2020-160, Cl IH, IO
2.500%, 10/20/2050(E) $ 188 $ 25GNMA CMO, Ser 2020-160, Cl YI, IO
2.500%, 10/20/2050(E) 1,018 135GNMA CMO, Ser 2020-181, Cl WI, IO
2.000%, 12/20/2050(E) 2,369 242GNMA CMO, Ser 2020-47, Cl MI, IO
3.500%, 04/20/2050(E) 676 89GNMA CMO, Ser 2020-47, Cl NI, IO
3.500%, 04/20/2050(E) 261 39GNMA CMO, Ser 2020-H09, Cl NF
1.354%, VAR ICE LIBOR USD 1 Month + 1.250%, 04/20/2070 295 303
GNMA CMO, Ser 2020-H09, Cl FL1.254%, VAR ICE LIBOR USD 1 Month
+ 1.150%, 05/20/2070 745 778GNMA CMO, Ser 2020-H12, Cl F
0.604%, VAR ICE LIBOR USD 1 Month + 0.500%, 07/20/2070 69 70
GNMA CMO, Ser 2020-H13, Cl FA0.554%, VAR ICE LIBOR USD 1 Month
+ 0.450%, 07/20/2070 653 657GNMA CMO, Ser 2021-23, Cl MG
1.500%, 02/20/2051 1,572 1,548GNMA CMO, Ser 2021-29, Cl TI, IO
2.500%, 02/20/2051(E) 489 91GNMA REMIC CMO, Ser 2014-117, Cl SJ, IO
5.496%, 08/20/2044(E) 2 –GNMA TBA
3.000%, 01/15/2043 200 2072.500%, 01/15/2051 to 02/15/2052 24,050 24,6102.000%, 02/15/2051 13,525 13,622
GNMA, Ser 107, Cl AD2.768%, 11/16/2047(E) 309 316
GNMA, Ser 110, Cl IO, IO0.879%, 11/16/2063(E) 2,464 203
GNMA, Ser 145, Cl XI, IO0.001%, 09/16/2044(E) 38 –
GNMA, Ser 2012-112, Cl IO, IO0.132%, 02/16/2053(E) 492 2
GNMA, Ser 2012-152, Cl IO, IO0.566%, 01/16/2054(E) 2,714 54
GNMA, Ser 2012-27, Cl IO, IO0.718%, 04/16/2053(E) 958 10
GNMA, Ser 2013-96, Cl IO, IO0.120%, 10/16/2054(E) 803 3
GNMA, Ser 2014-47, Cl IA, IO0.143%, 02/16/2048(E) 58 1
GNMA, Ser 2014-50, Cl IO, IO0.599%, 09/16/2055(E) 314 10
GNMA, Ser 2014-92, Cl IX, IO0.181%, 05/16/2054(E) 3,185 28

33SEI Institutional Managed Trust / Quarterly Report / December 31, 2021
SCHEDULE OF INVESTMENTS (Unaudited)December 31, 2021
Core Fixed Income Fund (Continued)
DescriptionFace Amount (Thousands)
Market Value ($ Thousands)
MORTGAGE-BACKED SECURITIES (continued)GNMA, Ser 2015-5, Cl IK, IO
0.413%, 11/16/2054(E) $ 2,847 $ 43GNMA, Ser 2019-71, Cl PT
3.000%, 06/20/2049 281 289GNMA, Ser 28, Cl AB
3.150%, 06/16/2060 66 66GNMA, Ser 41, Cl IO, IO
0.617%, 07/16/2058(E) 967 38GNMA, Ser 60, Cl IO, IO
0.835%, 05/16/2063(E) 2,466 185
858,573Non-Agency Mortgage-Backed Obligations — 9.4%
Adjustable Rate Mortgage Trust, Ser 2004-2, Cl 3A1
2.649%, 02/25/2035(E) 17 17Adjustable Rate Mortgage Trust, Ser 2007-
1, Cl 5A310.382%, VAR ICE LIBOR USD 1 Month
+ 0.280%, 03/25/2037 890 891Alen Mortgage Trust, Ser ACEN, Cl A
1.260%, VAR ICE LIBOR USD 1 Month + 1.150%, 04/15/2034(B) 885 884
Alternative Loan Trust, Ser 2006-18CB, Cl A6
28.193%, VAR ICE LIBOR USD 1 Month + 28.600%, 07/25/2036 159 231
American Home Mortgage Investment Trust, Ser 2004-4, Cl 4A
2.246%, VAR ICE LIBOR USD 6 Month + 2.000%, 02/25/2045 41 41
American Home Mortgage Investment Trust, Ser 2005-1, Cl 6A
2.252%, VAR ICE LIBOR USD 6 Month + 2.000%, 06/25/2045 772 790
American Home Mortgage Investment Trust, Ser 2005-4, Cl 5A
1.996%, VAR ICE LIBOR USD 6 Month + 1.750%, 11/25/2045 817 477
American Home Mortgage Investment Trust, Ser 2006-1, Cl 12A1
0.502%, VAR ICE LIBOR USD 1 Month + 0.400%, 03/25/2046 2,500 2,433
Angel Oak Mortgage Trust I, Ser 2019-2, Cl A1
3.628%, 03/25/2049(B)(E) 81 81Angel Oak Mortgage Trust, Ser 2020-2,
Cl A1A2.531%, 01/26/2065(B)(E) 483 484
Angel Oak Mortgage Trust, Ser 2020-5, Cl A1
1.373%, 05/25/2065(B)(E) 176 176
DescriptionFace Amount (Thousands)
Market Value ($ Thousands)
MORTGAGE-BACKED SECURITIES (continued)Angel Oak Mortgage Trust, Ser 2021-6,
Cl A11.458%, 09/25/2066(B)(E) $ 653 $ 647
Arbor Multifamily Mortgage Securities Trust, Ser MF2, Cl B
2.560%, 06/15/2054(B)(E) 615 607AREIT Trust, Ser CRE3, Cl A
1.185%, VAR SOFR30A + 1.134%, 09/14/2036(B) 1,996 1,994
BAMLL Commercial Mortgage Securities Trust, Ser 2018-PARK, Cl A
4.091%, 08/10/2038(B)(E) 1,790 1,995BAMLL Re-REMIC Trust, Ser 2016-GG10,
Cl AJA5.830%, 08/10/2045(B)(E) 1,625 589
BANK, Ser BN38, Cl A52.521%, 12/15/2064 1,125 1,156
Barclays Commercial Mortgage Trust, Ser C3, Cl A3
3.319%, 05/15/2052 110 117BBCMS Mortgage Trust, Ser C12, Cl A5
2.689%, 11/15/2054 642 665BBCMS Mortgage Trust, Ser C2, Cl ASB
4.236%, 12/15/2051 221 243BBCMS Mortgage Trust, Ser C6, Cl A2
2.690%, 02/15/2053 660 676BBCMS Trust, Ser 2015-SRCH, Cl A1
3.312%, 08/10/2035(B) 493 514BCAP LLC Trust, Ser 2015-RR2, Cl 21A1
0.492%, 03/28/2037(B)(E) 536 532Bear Stearns Adjustable Rate Mortgage
Trust, Ser 2004-2, Cl 14A2.867%, 05/25/2034(E) 5 5
Bear Stearns ARM Trust, Ser 2003-7, Cl 9A2.622%, 10/25/2033(E) 307 312
Bear Stearns Asset Backed Securities I Trust, Ser 2005-AC8, Cl A3, IO
7.548%, 11/25/2035(E) 2,521 764Bear Stearns Asset-Backed Securities I
Trust, Ser 2005-AC6, Cl 1A35.500%, 09/25/2035(E) 699 707
Bear Stearns Commercial Mortgage Securities, Ser 2005-PWR8, Cl X1, IO
0.716%, 06/11/2041(B)(E) 1 –Bear Stearns Mortgage Funding Trust,
Ser 2007-AR3, Cl 1A10.242%, VAR ICE LIBOR USD 1 Month
+ 0.140%, 03/25/2037 2,942 2,828Benchmark Mortgage Trust, Ser B31, Cl A5
2.669%, 12/15/2054 1,449 1,502Bunker Hill Loan Depositary Trust,
Ser 2019-2, Cl A12.879%, 07/25/2049(B) 574 577

SEI Institutional Managed Trust / Quarterly Report / December 31, 202134
SCHEDULE OF INVESTMENTS (Unaudited)December 31, 2021
Core Fixed Income Fund (Continued)
SCHEDULE OF INVESTMENTS (Unaudited)December 31, 2021
Core Fixed Income Fund (Continued)
DescriptionFace Amount (Thousands)
Market Value ($ Thousands)
MORTGAGE-BACKED SECURITIES (continued)Bunker Hill Loan Depositary Trust,
Ser 2019-3, Cl A12.724%, 11/25/2059(B) $ 403 $ 406
BWAY Mortgage Trust, Ser 1740, Cl A2.917%, 01/10/2035(B) 1,540 1,537
BX Commercial Mortgage Trust, Ser 2019-XL, Cl F
2.110%, VAR ICE LIBOR USD 1 Month + 2.000%, 10/15/2036(B) 2,303 2,291
BX Commercial Mortgage Trust, Ser 2019-XL, Cl A
1.030%, VAR ICE LIBOR USD 1 Month + 0.920%, 10/15/2036(B) 4,067 4,068
BX Commercial Mortgage Trust, Ser IND, Cl H
3.110%, VAR ICE LIBOR USD 1 Month + 3.000%, 11/15/2035(B) 4,102 4,087
BX Commercial Mortgage Trust, Ser XL2, Cl A
0.799%, VAR ICE LIBOR USD 1 Month + 0.689%, 10/15/2038(B) 1,034 1,028
BX Trust, Ser 2019-OC11, Cl A3.202%, 12/09/2041(B) 610 642
BX Trust, Ser MMP, Cl A1.110%, VAR ICE LIBOR USD 1 Month +
1.000%, 08/15/2036(B) 483 482BX, Ser MFM1, Cl A
0.810%, VAR ICE LIBOR USD 1 Month + 0.700%, 01/15/2034(B) 735 730
Cali Mortgage Trust, Ser 101C, Cl A3.957%, 03/10/2039(B) 1,280 1,418
CAMB Commercial Mortgage Trust, Ser 2019-LIFE, Cl A
1.180%, VAR ICE LIBOR USD 1 Month + 1.070%, 12/15/2037(B) 940 941
CD Commercial Mortgage Trust, Ser 2006-CD2, Cl X, IO
0.023%, 01/15/2046(B)(E) 53 –CD Commercial Mortgage Trust, Ser 2017-
CD3, Cl A43.631%, 02/10/2050 310 334
CD Commercial Mortgage Trust, Ser 2017-CD5, Cl XA, IO
0.868%, 08/15/2050(E) 8,431 291CD Mortgage Trust, Ser CD8, Cl A4
2.912%, 08/15/2057 406 426Century Plaza Towers, Ser 2019-CPT, Cl A
2.865%, 11/13/2039(B) 1,160 1,207CFCRE Commercial Mortgage Trust,
Ser 2017-C8, Cl ASB3.367%, 06/15/2050 306 321
DescriptionFace Amount (Thousands)
Market Value ($ Thousands)
MORTGAGE-BACKED SECURITIES (continued)CFCRE Commercial Mortgage Trust,
Ser 2017-C8, Cl A43.572%, 06/15/2050 $ 371 $ 398
CFK Trust, Ser 2020-MF2, Cl E3.458%, 03/15/2039(B)(E) 2,840 2,749
CFK Trust, Ser MF2, Cl F3.458%, 03/15/2039(B)(E) 2,960 2,760
Chase Mortgage Finance, Ser 2007-A1, Cl 9A1
2.771%, 02/25/2037(E) 4 4Chase Mortgage Finance, Ser 2007-A1,
Cl 2A12.439%, 02/25/2037(E) 7 8
Chase Mortgage Finance, Ser 2007-A2, Cl 1A1
2.295%, 06/25/2035(E) 8 8CHT Mortgage Trust, Ser 2017-CSMO, Cl A
1.040%, VAR ICE LIBOR USD 1 Month + 0.930%, 11/15/2036(B) 490 490
CIM Trust, Ser 2018-INV1, Cl A44.000%, 08/25/2048(B)(E) 91 92
CIM Trust, Ser 2021-R6, Cl A11.425%, 07/25/2061(B)(E) 1,605 1,580
Citigroup Commercial Mortgage Trust, Ser 2013-375P, Cl A
3.251%, 05/10/2035(B) 240 245Citigroup Commercial Mortgage Trust,
Ser 2019-GC41, Cl A52.869%, 08/10/2056 2,680 2,811
Citigroup Global Markets Mortgage Securities VII, Ser 2003-HYB1, Cl A
2.240%, 09/25/2033(E) 5 5Citigroup Mortgage Loan Trust, Ser 2021-
INV1, Cl A3A2.500%, 05/25/2051(B)(E) 1,882 1,885
COLT Mortgage Loan Trust, Ser 2021-4, Cl A1
1.397%, 10/25/2066(B)(E) 864 855COMM Mortgage Trust, Ser 2012-LC4, Cl A4
3.288%, 12/10/2044 9 9COMM Mortgage Trust, Ser 2013-CR10,
Cl A44.210%, 08/10/2046(E) 15 16
COMM Mortgage Trust, Ser 2013-CR12, Cl C5.072%, 10/10/2046(E) 70 69
COMM Mortgage Trust, Ser 2013-CR12, Cl B4.762%, 10/10/2046(E) 120 124
COMM Mortgage Trust, Ser 2013-CR12, Cl AM
4.300%, 10/10/2046 130 134COMM Mortgage Trust, Ser 2013-CR6, Cl B
3.397%, 03/10/2046(B) 299 303

35SEI Institutional Managed Trust / Quarterly Report / December 31, 2021
SCHEDULE OF INVESTMENTS (Unaudited)December 31, 2021
Core Fixed Income Fund (Continued)
DescriptionFace Amount (Thousands)
Market Value ($ Thousands)
MORTGAGE-BACKED SECURITIES (continued)COMM Mortgage Trust, Ser 2014-UBS2,
Cl A53.961%, 03/10/2047 $ 236 $ 247
COMM Mortgage Trust, Ser 2014-UBS2, Cl XA, IO
1.117%, 03/10/2047(E) 1,509 29COMM Mortgage Trust, Ser 2014-UBS3,
Cl AM4.012%, 06/10/2047 285 300
COMM Mortgage Trust, Ser 2015-LC19, Cl XA, IO
1.113%, 02/10/2048(E) 5,629 157COMM Mortgage Trust, Ser 2017-PANW, Cl A
3.244%, 10/10/2029(B) 410 418COMM Mortgage Trust, Ser CBM, Cl A2
2.896%, 02/10/2037(B) 1,230 1,243COMM Mortgage Trust, Ser CR11, Cl A4
4.258%, 08/10/2050 1,822 1,908COMM Mortgage Trust, Ser CR14, Cl B
4.605%, 02/10/2047(E) 850 890COMM Mortgage Trust, Ser CR26, Cl C
4.478%, 10/10/2048(E) 870 915COMM Mortgage Trust, Ser CR6, Cl A4
3.101%, 03/10/2046 1,420 1,434COMM Mortgage Trust, Ser CR8, Cl A5
3.612%, 06/10/2046(E) 320 329COMM Mortgage Trust, Ser LC21, Cl A4
3.708%, 07/10/2048 311 331COMM Mortgage Trust, Ser LC23, Cl ASB
3.598%, 10/10/2048 616 640COMM Mortgage Trust, Ser LC23, Cl A3
3.521%, 10/10/2048 368 386COMM Mortgage Trust, Ser LC6, Cl AM
3.282%, 01/10/2046 1,560 1,588COMM Mortgage Trust, Ser UBS4, Cl A4
3.420%, 08/10/2047 729 751Commercial Mortgage Pass-Through
Certificates, Ser 2012-CR3, Cl A32.822%, 10/15/2045 471 474
Commercial Mortgage Pass-Through Certificates, Ser 2012-CR4, Cl AM
3.251%, 10/15/2045 590 594Commercial Mortgage Trust, Ser PF1, Cl A5
2.522%, 11/15/2054 480 487Connecticut Avenue Securities Trust,
Ser 2019-R02, Cl 1M22.403%, VAR ICE LIBOR USD 1 Month
+ 2.300%, 08/25/2031(B) 458 460Connecticut Avenue Securities Trust,
Ser 2019-R07, Cl 1M22.203%, VAR ICE LIBOR USD 1 Month
+ 2.100%, 10/25/2039(B) 612 613
DescriptionFace Amount (Thousands)
Market Value ($ Thousands)
MORTGAGE-BACKED SECURITIES (continued)Connecticut Avenue Securities Trust,
Ser 2020-R01, Cl 1M22.153%, VAR ICE LIBOR USD 1 Month
+ 2.050%, 01/25/2040(B) $ 339 $ 340Credit Suisse First Boston Mortgage
Securities, Ser 2003-29, Cl 5A17.000%, 12/25/2033 16 17
Credit Suisse First Boston Mortgage Securities, Ser 2003-AR24, Cl 2A4
2.519%, 10/25/2033(E) 502 498Credit Suisse Mortgage Trust, Ser NXSR,
Cl A43.795%, 12/15/2049(E) 730 787
Credit Suisse Mortgage Trust, Ser RIO, Cl A4.024%, VAR ICE LIBOR USD 1 Month
+ 3.024%, 12/15/2022(B) 3,790 3,792CSAIL Commercial Mortgage Trust,
Ser 2015-C2, Cl A43.504%, 06/15/2057 414 436
CSAIL Commercial Mortgage Trust, Ser 2015-C3, Cl A3
3.447%, 08/15/2048 499 519CSAIL Commercial Mortgage Trust, Ser C20,
Cl A32.805%, 03/15/2054 1,049 1,090
CSAIL Commercial Mortgage Trust, Ser C3, Cl ASB
3.448%, 08/15/2048 1,207 1,244CSMC Trust, Ser 2014-USA, Cl E
4.373%, 09/15/2037(B) 290 258CSMC Trust, Ser 2017-CHOP, Cl G
5.710%, VAR ICE LIBOR USD 1 Month + 5.600%, 07/15/2032(B) 1,000 916
CSMC Trust, Ser 2017-PFHP, Cl A1.060%, VAR ICE LIBOR USD 1 Month
+ 0.950%, 12/15/2030(B) 1,190 1,190CSMC Trust, Ser 2017-RPL1, Cl M2
2.988%, 07/25/2057(B)(E) 1,760 1,758CSMC Trust, Ser 2018-J1, Cl A2
3.500%, 02/25/2048(B)(E) 2,738 2,780CSMC Trust, Ser 2020-RPL4, Cl A1
2.000%, 01/25/2060(B)(E) 748 752CSMC Trust, Ser 2021-RPL3, Cl A1
2.000%, 01/25/2060(B)(E) 2,025 2,035CSMC Trust, Ser 2021-RPL4, Cl A1
1.796%, 12/27/2060(B)(E) 530 530CSMC Trust, Ser 2021-RPL6, Cl A1
2.000%, 10/25/2060(B)(E) 1,875 1,873CSMC, Ser 2014-11R, Cl 9A2
0.372%, VAR ICE LIBOR USD 1 Month + 0.140%, 10/27/2036(B) 2,120 1,837
CSMC, Ser 2014-7R, Cl 8A12.972%, 07/27/2037(B)(E) 20 20

SEI Institutional Managed Trust / Quarterly Report / December 31, 202136
SCHEDULE OF INVESTMENTS (Unaudited)December 31, 2021
Core Fixed Income Fund (Continued)
SCHEDULE OF INVESTMENTS (Unaudited)December 31, 2021
Core Fixed Income Fund (Continued)
DescriptionFace Amount (Thousands)
Market Value ($ Thousands)
MORTGAGE-BACKED SECURITIES (continued)CSMC, Ser 2014-USA, Cl A2
3.953%, 09/15/2037(B) $ 2,135 $ 2,246CSMC, Ser 2015-5R, Cl 1A1
1.004%, 09/27/2046(B)(E) 99 100CSMC, Ser 2021-2R, Cl 1A1
1.844%, VAR ICE LIBOR USD 1 Month + 1.750%, 07/25/2047(B) 1,042 1,039
CSMC, Ser 2021-NQM8, Cl A11.841%, 10/25/2066(B)(E) 1,675 1,671
DBCCRE Mortgage Trust, Ser 2014-ARCP, Cl A
4.238%, 01/10/2034(B) 1,175 1,222DBCCRE Mortgage Trust, Ser 2018-ARCP,
Cl C4.935%, 01/10/2034(B)(E) 315 324
DC Office Trust, Ser 2019-MTC, Cl A2.965%, 09/15/2045(B) 1,240 1,292
DSLA Mortgage Loan Trust, Ser 2004-AR2, Cl A2B
0.904%, VAR ICE LIBOR USD 1 Month + 0.800%, 11/19/2044 322 311
EQUS Mortgage Trust, Ser EQAZ, Cl A0.865%, VAR ICE LIBOR USD 1 Month
+ 0.755%, 10/15/2038(B) 816 812EQUS Mortgage Trust, Ser EQAZ, Cl B
1.210%, VAR ICE LIBOR USD 1 Month + 1.100%, 10/15/2038(B) 790 786
EverBank Mortgage Loan Trust, Ser 2018-1, Cl A22
3.500%, 02/25/2048(B)(E) 173 175Flagstar Mortgage Trust, Ser 2018-2, Cl A4
3.500%, 04/25/2048(B)(E) 233 233Flagstar Mortgage Trust, Ser 2021-13IN,
Cl A23.000%, 12/30/2051(B)(E) 1,890 1,923
FNMA TBA2.500%, 03/01/2043 to 02/15/2051 148,375 150,9312.000%, 02/15/2036 to 01/15/2051 49,572 49,8411.500%, 02/15/2036 10,225 10,234
FWDSecuritization Trust, Ser 2019-INV1, Cl A1
2.810%, 06/25/2049(B)(E) 555 558GNMA
3.000%, 09/20/2051 to 10/20/2051 8,172 8,478GPMT, Ser FL3, Cl A
1.354%, VAR ICE LIBOR USD 1 Month + 1.250%, 07/16/2035(B) 959 959
GS Mortgage Securities II, Ser 2010-C1, Cl A2
4.592%, 08/10/2043(B) 214 214GS Mortgage Securities II, Ser 2017-SLP,
Cl C3.924%, 10/10/2032(B) 1,310 1,323
DescriptionFace Amount (Thousands)
Market Value ($ Thousands)
MORTGAGE-BACKED SECURITIES (continued)GS Mortgage Securities II, Ser GC30, Cl B
4.029%, 05/10/2050(E) $ 480 $ 505GS Mortgage Securities II, Ser SRP5, Cl A
1.660%, VAR ICE LIBOR USD 1 Month + 1.550%, 09/15/2031(B) 2,781 2,528
GS Mortgage Securities Trust, Ser 2013-GC16, Cl B
5.161%, 11/10/2046(E) 270 281GS Mortgage Securities Trust, Ser 2014-
GC18, Cl A44.074%, 01/10/2047 977 1,020
GS Mortgage Securities Trust, Ser 2014-GC26, Cl B
4.215%, 11/10/2047(E) 680 678GS Mortgage Securities Trust, Ser GC14,
Cl A54.243%, 08/10/2046 415 432
GS Mortgage Securities Trust, Ser GC47, Cl A5
2.377%, 05/12/2053 728 738GS Mortgage Securities Trust, Ser GSA2,
Cl A41.721%, 12/12/2053 807 778
GS Mortgage Securities Trust, Ser GSA3, Cl A5
2.618%, 12/15/2054 809 826GS Mortgage Securities Trust, Ser ROSS,
Cl A1.260%, VAR ICE LIBOR USD 1 Month
+ 1.150%, 05/15/2026(B) 2,170 2,158GS Mortgage-Backed Securities Trust,
Ser 2018-RPL1, Cl A1A3.750%, 10/25/2057(B) 2,678 2,756
GSMPS Mortgage Loan Trust, Ser 1998-1, Cl A
8.000%, 09/19/2027(B)(E) 12 12GSR Mortgage Loan Trust, Ser 2003-13,
Cl 1A12.622%, 10/25/2033(E) 117 124
GSR Mortgage Loan Trust, Ser 2004-8F, Cl 2A3
6.000%, 09/25/2034 10 11GSR Mortgage Loan Trust, Ser 2007-1F,
Cl 2A45.500%, 01/25/2037 3 3
HarborView Mortgage Loan, Ser 2004-3, Cl 1A
2.700%, 05/19/2034(E) 480 486Hudson Yards Mortgage Trust, Ser 2019-
30HY, Cl A3.228%, 07/10/2039(B) 1,225 1,306

37SEI Institutional Managed Trust / Quarterly Report / December 31, 2021
SCHEDULE OF INVESTMENTS (Unaudited)December 31, 2021
Core Fixed Income Fund (Continued)
DescriptionFace Amount (Thousands)
Market Value ($ Thousands)
MORTGAGE-BACKED SECURITIES (continued)Hudson Yards Mortgage Trust, Ser 2019-
55HY, Cl A2.943%, 12/10/2041(B)(E) $ 1,240 $ 1,297
Impact Funding, Ser 2010-1, Cl A15.314%, 01/25/2051(B) 883 919
JPMBB Commercial Mortgage Securities Trust, Ser 2013-C17, Cl B
4.886%, 01/15/2047(E) 130 137JPMBB Commercial Mortgage Securities
Trust, Ser 2014-C22, Cl C4.553%, 09/15/2047(E) 120 117
JPMBB Commercial Mortgage Securities Trust, Ser 2014-C23, Cl A4
3.670%, 09/15/2047 339 353JPMBB Commercial Mortgage Securities
Trust, Ser 2015-C28, Cl A32.912%, 10/15/2048 1,792 1,818
JPMBB Commercial Mortgage Securities Trust, Ser C12, Cl A5
3.664%, 07/15/2045 605 622JPMBB Commercial Mortgage Securities
Trust, Ser C15, Cl AS4.420%, 11/15/2045 925 970
JPMBB Commercial Mortgage Securities Trust, Ser C21, Cl AS
3.997%, 08/15/2047 415 435JPMorgan Chase Commercial Mortgage
Securities Trust, Ser 2006-CB15, Cl X1, IO
0.210%, 06/12/2043(E) 331 –JPMorgan Chase Commercial Mortgage
Securities Trust, Ser 2007-LD12, Cl AJ6.502%, 02/15/2051(E) 2 2
JPMorgan Chase Commercial Mortgage Securities Trust, Ser 2014-C20, Cl C
4.576%, 07/15/2047(E) 380 379JPMorgan Chase Commercial Mortgage
Securities Trust, Ser 2018-BCON, Cl B3.756%, 01/05/2031(B)(E) 1,305 1,328
JPMorgan Chase Commercial Mortgage Securities Trust, Ser 2019-OSB, Cl A
3.397%, 06/05/2039(B) 1,500 1,617JPMorgan Chase Commercial Mortgage
Securities Trust, Ser C16, Cl A44.166%, 12/15/2046 908 949
JPMorgan Mortgage Trust, Ser 2006-A2, Cl 5A3
2.268%, 11/25/2033(E) 13 14JPMorgan Mortgage Trust, Ser 2006-A2,
Cl 4A12.225%, 08/25/2034(E) 31 32
DescriptionFace Amount (Thousands)
Market Value ($ Thousands)
MORTGAGE-BACKED SECURITIES (continued)JPMorgan Mortgage Trust, Ser 2015-5,
Cl A92.339%, 05/25/2045(B)(E) $ 55 $ 55
JPMorgan Mortgage Trust, Ser 2018-4, Cl A13.500%, 10/25/2048(B)(E) 135 136
JPMorgan Mortgage Trust, Ser 2018-5, Cl A1
3.500%, 10/25/2048(B)(E) 420 423JPMorgan Mortgage Trust, Ser 2019-8,
Cl A3A3.000%, 03/25/2050(B)(E) 214 216
JPMorgan Mortgage Trust, Ser 2020-1, Cl A3A
3.000%, 06/25/2050(B)(E) 200 202Lehman XS Trust, Ser 2007-16N, Cl 2A2
0.952%, VAR ICE LIBOR USD 1 Month + 0.850%, 09/25/2047 4,635 4,764
Master Resecuritization Trust, Ser 2005, Cl 3, PO
0.000%, 05/28/2035(B) 3 2MASTR Reperforming Loan Trust, Ser 2005-
1, Cl 1A16.000%, 08/25/2034(B) 1,190 955
Med Trust, Ser MDLN, Cl A1.060%, VAR ICE LIBOR USD 1 Month
+ 0.950%, 11/15/2038(B) 1,314 1,312Mello Warehouse Securitization Trust,
Ser 2020-1, Cl A1.002%, VAR ICE LIBOR USD 1 Month
+ 0.900%, 10/25/2053(B) 895 895Mello Warehouse Securitization Trust,
Ser 2020-2, Cl A0.902%, VAR ICE LIBOR USD 1 Month
+ 0.800%, 11/25/2053(B) 971 967Mello Warehouse Securitization Trust,
Ser 2021-1, Cl A0.802%, VAR ICE LIBOR USD 1 Month
+ 0.700%, 02/25/2055(B) 280 278Mello Warehouse Securitization Trust,
Ser 2021-2, Cl A0.852%, VAR ICE LIBOR USD 1 Month
+ 0.750%, 04/25/2055(B) 780 777Merrill Lynch Mortgage Investors Trust,
Ser 2003-A4, Cl 2A2.405%, 07/25/2033(E) 9 8
Merrill Lynch Mortgage Investors Trust, Ser 2004-A1, Cl 4A
2.375%, 02/25/2034(E) 36 37MFA Trust, Ser 2021-RPL1, Cl A1
1.131%, 07/25/2060(B)(E) 711 699MHC Trust, Ser MHC2, Cl A
0.960%, VAR ICE LIBOR USD 1 Month + 0.850%, 05/15/2023(B) 1,250 1,243
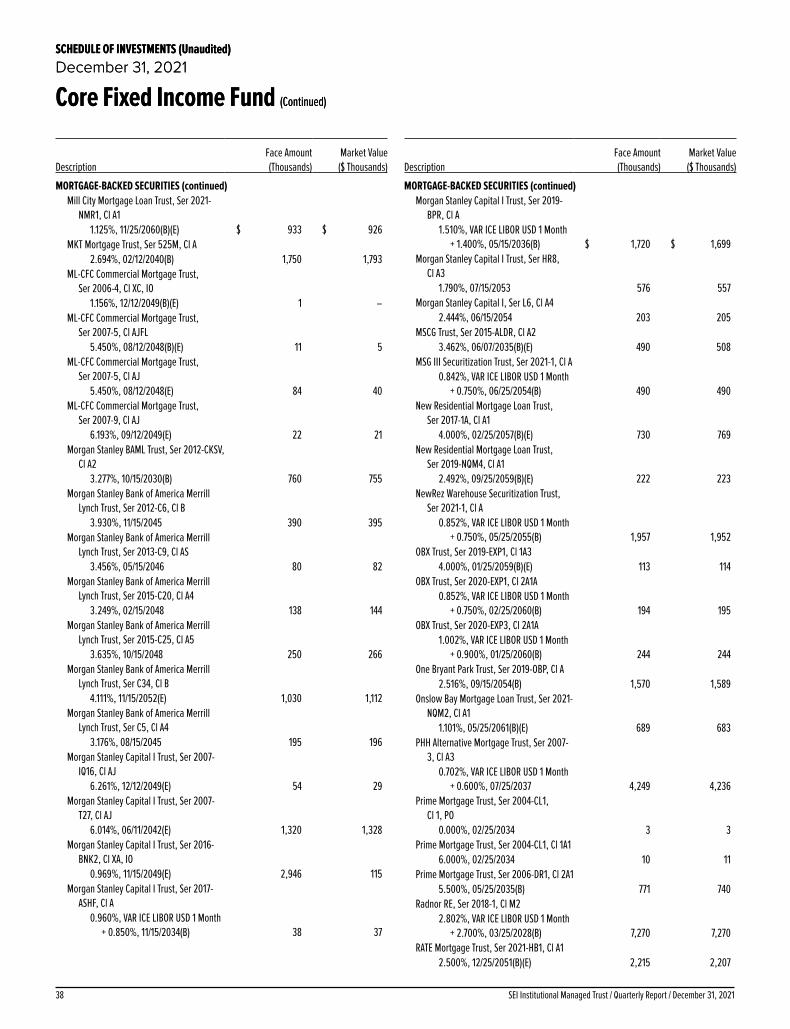
SEI Institutional Managed Trust / Quarterly Report / December 31, 202138
SCHEDULE OF INVESTMENTS (Unaudited)December 31, 2021
Core Fixed Income Fund (Continued)
SCHEDULE OF INVESTMENTS (Unaudited)December 31, 2021
Core Fixed Income Fund (Continued)
DescriptionFace Amount (Thousands)
Market Value ($ Thousands)
MORTGAGE-BACKED SECURITIES (continued)Mill City Mortgage Loan Trust, Ser 2021-
NMR1, Cl A11.125%, 11/25/2060(B)(E) $ 933 $ 926
MKT Mortgage Trust, Ser 525M, Cl A2.694%, 02/12/2040(B) 1,750 1,793
ML-CFC Commercial Mortgage Trust, Ser 2006-4, Cl XC, IO
1.156%, 12/12/2049(B)(E) 1 –ML-CFC Commercial Mortgage Trust,
Ser 2007-5, Cl AJFL5.450%, 08/12/2048(B)(E) 11 5
ML-CFC Commercial Mortgage Trust, Ser 2007-5, Cl AJ
5.450%, 08/12/2048(E) 84 40ML-CFC Commercial Mortgage Trust,
Ser 2007-9, Cl AJ6.193%, 09/12/2049(E) 22 21
Morgan Stanley BAML Trust, Ser 2012-CKSV, Cl A2
3.277%, 10/15/2030(B) 760 755Morgan Stanley Bank of America Merrill
Lynch Trust, Ser 2012-C6, Cl B3.930%, 11/15/2045 390 395
Morgan Stanley Bank of America Merrill Lynch Trust, Ser 2013-C9, Cl AS
3.456%, 05/15/2046 80 82Morgan Stanley Bank of America Merrill
Lynch Trust, Ser 2015-C20, Cl A43.249%, 02/15/2048 138 144
Morgan Stanley Bank of America Merrill Lynch Trust, Ser 2015-C25, Cl A5
3.635%, 10/15/2048 250 266Morgan Stanley Bank of America Merrill
Lynch Trust, Ser C34, Cl B4.111%, 11/15/2052(E) 1,030 1,112
Morgan Stanley Bank of America Merrill Lynch Trust, Ser C5, Cl A4
3.176%, 08/15/2045 195 196Morgan Stanley Capital I Trust, Ser 2007-
IQ16, Cl AJ6.261%, 12/12/2049(E) 54 29
Morgan Stanley Capital I Trust, Ser 2007-T27, Cl AJ
6.014%, 06/11/2042(E) 1,320 1,328Morgan Stanley Capital I Trust, Ser 2016-
BNK2, Cl XA, IO0.969%, 11/15/2049(E) 2,946 115
Morgan Stanley Capital I Trust, Ser 2017-ASHF, Cl A
0.960%, VAR ICE LIBOR USD 1 Month + 0.850%, 11/15/2034(B) 38 37
DescriptionFace Amount (Thousands)
Market Value ($ Thousands)
MORTGAGE-BACKED SECURITIES (continued)Morgan Stanley Capital I Trust, Ser 2019-
BPR, Cl A1.510%, VAR ICE LIBOR USD 1 Month
+ 1.400%, 05/15/2036(B) $ 1,720 $ 1,699Morgan Stanley Capital I Trust, Ser HR8,
Cl A31.790%, 07/15/2053 576 557
Morgan Stanley Capital I, Ser L6, Cl A42.444%, 06/15/2054 203 205
MSCG Trust, Ser 2015-ALDR, Cl A23.462%, 06/07/2035(B)(E) 490 508
MSG III Securitization Trust, Ser 2021-1, Cl A0.842%, VAR ICE LIBOR USD 1 Month
+ 0.750%, 06/25/2054(B) 490 490New Residential Mortgage Loan Trust,
Ser 2017-1A, Cl A14.000%, 02/25/2057(B)(E) 730 769
New Residential Mortgage Loan Trust, Ser 2019-NQM4, Cl A1
2.492%, 09/25/2059(B)(E) 222 223NewRez Warehouse Securitization Trust,
Ser 2021-1, Cl A0.852%, VAR ICE LIBOR USD 1 Month
+ 0.750%, 05/25/2055(B) 1,957 1,952OBX Trust, Ser 2019-EXP1, Cl 1A3
4.000%, 01/25/2059(B)(E) 113 114OBX Trust, Ser 2020-EXP1, Cl 2A1A
0.852%, VAR ICE LIBOR USD 1 Month + 0.750%, 02/25/2060(B) 194 195
OBX Trust, Ser 2020-EXP3, Cl 2A1A1.002%, VAR ICE LIBOR USD 1 Month
+ 0.900%, 01/25/2060(B) 244 244One Bryant Park Trust, Ser 2019-OBP, Cl A
2.516%, 09/15/2054(B) 1,570 1,589Onslow Bay Mortgage Loan Trust, Ser 2021-
NQM2, Cl A11.101%, 05/25/2061(B)(E) 689 683
PHH Alternative Mortgage Trust, Ser 2007-3, Cl A3
0.702%, VAR ICE LIBOR USD 1 Month + 0.600%, 07/25/2037 4,249 4,236
Prime Mortgage Trust, Ser 2004-CL1, Cl 1, PO
0.000%, 02/25/2034 3 3Prime Mortgage Trust, Ser 2004-CL1, Cl 1A1
6.000%, 02/25/2034 10 11Prime Mortgage Trust, Ser 2006-DR1, Cl 2A1
5.500%, 05/25/2035(B) 771 740Radnor RE, Ser 2018-1, Cl M2
2.802%, VAR ICE LIBOR USD 1 Month + 2.700%, 03/25/2028(B) 7,270 7,270
RATE Mortgage Trust, Ser 2021-HB1, Cl A12.500%, 12/25/2051(B)(E) 2,215 2,207

39SEI Institutional Managed Trust / Quarterly Report / December 31, 2021
SCHEDULE OF INVESTMENTS (Unaudited)December 31, 2021
Core Fixed Income Fund (Continued)
DescriptionFace Amount (Thousands)
Market Value ($ Thousands)
MORTGAGE-BACKED SECURITIES (continued)RBSCF Trust, Ser 2013-GSP, Cl A
3.834%, 01/15/2032(B)(E) $ 445 $ 461Residential Asset Securitization Trust,
Ser 2004-IP2, Cl 2A12.818%, 12/25/2034(E) 206 204
Residential Mortgage Loan Trust, Ser 2019-3, Cl A1
2.633%, 09/25/2059(B)(E) 757 757Seasoned Credit Risk Transfer Trust,
Ser 2016-1, Cl M23.750%, 09/25/2055(B)(E) 2,810 2,863
Seasoned Credit Risk Transfer Trust, Ser 2019-1, Cl M
4.750%, 07/25/2058(B)(E) 2,840 2,904Sequoia Mortgage Trust, Ser 2018-CH4,
Cl B1B5.037%, 10/25/2048(B)(E) 1,201 1,222
SFAVE Commercial Mortgage Securities Trust, Ser 2015-5AVE, Cl A2B
4.144%, 01/05/2043(B)(E) 75 81SFAVE Commercial Mortgage Securities
Trust, Ser 2015-5AVE, Cl A13.872%, 01/05/2043(B)(E) 390 410
Silverstone Master Issuer, Ser 2018-1A, Cl 1A
0.520%, VAR ICE LIBOR USD 3 Month + 0.390%, 01/21/2070(B) 179 179
STACR Trust, Ser 2018-DNA3, Cl M2A2.203%, VAR ICE LIBOR USD 1 Month
+ 2.100%, 09/25/2048(B) 670 672STAR Trust, Ser 2021-1, Cl A1
1.219%, 05/25/2065(B)(E) 424 422Starwood Mortgage Residential Trust,
Ser 2020-1, Cl A12.275%, 02/25/2050(B)(E) 400 402
Starwood Mortgage Residential Trust, Ser 2020-3, Cl A1
1.486%, 04/25/2065(B)(E) 349 349Starwood Mortgage Residential Trust,
Ser 2020-INV1, Cl A11.027%, 11/25/2055(B)(E) 367 364
Structured Asset Mortgage Investments II Trust, Ser 2007-AR3, Cl 2A1
0.292%, VAR ICE LIBOR USD 1 Month + 0.190%, 09/25/2047 3,642 3,503
Structured Asset Securities Mortgage Pass-Through Certificates, Ser 2003-24A, Cl 3A2
2.203%, 07/25/2033(E) 32 33Structured Asset Securities Mortgage
Pass-Through Certificates, Ser 2003-37A, Cl 2A
2.040%, 12/25/2033(E) 14 14
DescriptionFace Amount (Thousands)
Market Value ($ Thousands)
MORTGAGE-BACKED SECURITIES (continued)Towd Point Mortgage Trust, Ser 2021-1,
Cl A12.250%, 11/25/2061(B)(E) $ 661 $ 669
UBS-Barclays Commercial Mortgage Trust, Ser 2012-C4, Cl D
4.461%, 12/10/2045(B)(E) 670 603Verus Securitization Trust, Ser 2019-3, Cl A1
2.784%, 07/25/2059(B) 340 341Verus Securitization Trust, Ser 2019-4, Cl A1
2.642%, 11/25/2059(B) 497 501Verus Securitization Trust, Ser 2019-INV2,
Cl A12.913%, 07/25/2059(B)(E) 263 264
Verus Securitization Trust, Ser 2019-INV3, Cl A1
2.692%, 11/25/2059(B)(E) 384 389Verus Securitization Trust, Ser 2020-2, Cl A1
2.226%, 05/25/2060(B)(E) 467 467Verus Securitization Trust, Ser 2020-5, Cl A1
1.218%, 05/25/2065(B) 162 161Verus Securitization Trust, Ser 2021-1, Cl A1
0.815%, 01/25/2066(B)(E) 528 523Verus Securitization Trust, Ser 2021-2, Cl A1
1.031%, 02/25/2066(B)(E) 1,026 1,015Verus Securitization Trust, Ser 2021-3, Cl A1
1.046%, 06/25/2066(B)(E) 694 686Verus Securitization Trust, Ser 2021-7, Cl A1
1.829%, 10/25/2066(B)(E) 1,116 1,113Verus Securitization Trust, Ser 2021-8, Cl A1
1.824%, 11/25/2066(B)(E) 815 815Verus Securitization Trust, Ser 2021-R1,
Cl A10.820%, 10/25/2063(B)(E) 560 558
Verus Securitization Trust, Ser 2021-R3, Cl A1
1.020%, 04/25/2064(B)(E) 578 576Visio Trust, Ser 2020-1R, Cl A1
1.312%, 11/25/2055(B) 421 419VNDO Mortgage Trust, Ser 2012-6AVE, Cl C
3.337%, 11/15/2030(B)(E) 987 1,001VNO Mortgage Trust, Ser 2012-6AVE, Cl A
2.996%, 11/15/2030(B) 110 112WaMu Mortgage Pass-Through Certificates,
Ser 2003-AR10, Cl A72.493%, 10/25/2033(E) 23 23
WaMu Mortgage Pass-Through Certificates, Ser 2003-AR7, Cl A7
2.368%, 08/25/2033(E) 14 14WaMu Mortgage Pass-Through Certificates,
Ser 2003-AR9, Cl 1A62.515%, 09/25/2033(E) 25 25
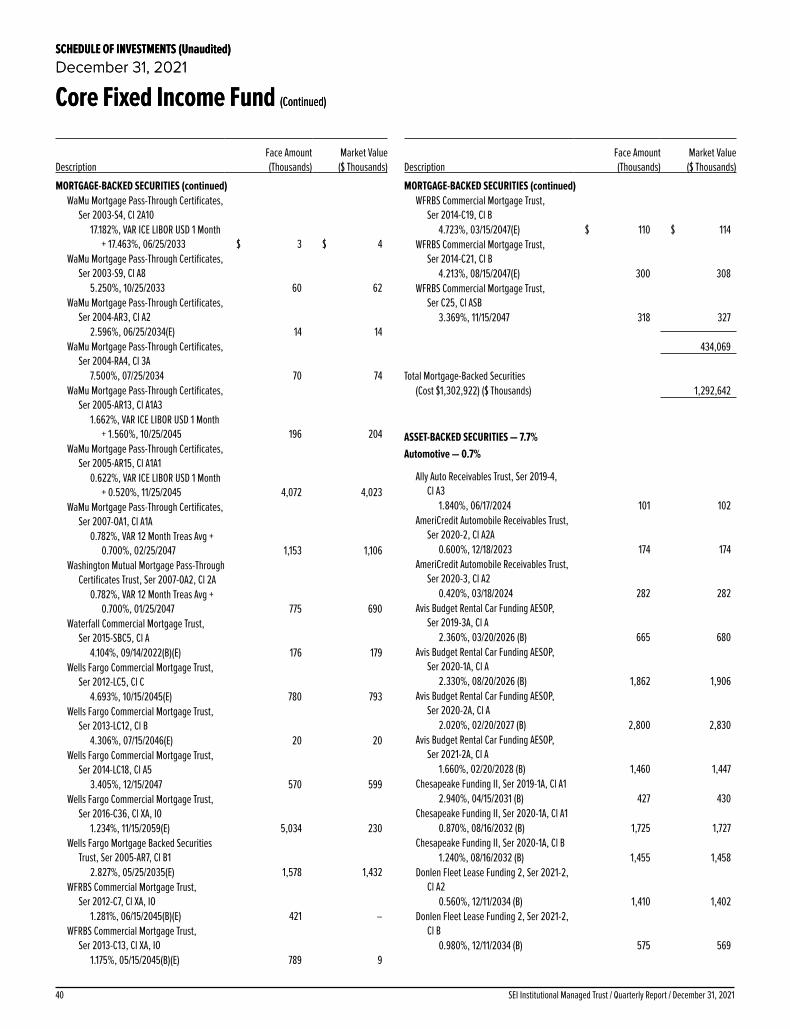
SEI Institutional Managed Trust / Quarterly Report / December 31, 202140
SCHEDULE OF INVESTMENTS (Unaudited)December 31, 2021
Core Fixed Income Fund (Continued)
SCHEDULE OF INVESTMENTS (Unaudited)December 31, 2021
Core Fixed Income Fund (Continued)
DescriptionFace Amount (Thousands)
Market Value ($ Thousands)
MORTGAGE-BACKED SECURITIES (continued)WaMu Mortgage Pass-Through Certificates,
Ser 2003-S4, Cl 2A1017.182%, VAR ICE LIBOR USD 1 Month
+ 17.463%, 06/25/2033 $ 3 $ 4WaMu Mortgage Pass-Through Certificates,
Ser 2003-S9, Cl A85.250%, 10/25/2033 60 62
WaMu Mortgage Pass-Through Certificates, Ser 2004-AR3, Cl A2
2.596%, 06/25/2034(E) 14 14WaMu Mortgage Pass-Through Certificates,
Ser 2004-RA4, Cl 3A7.500%, 07/25/2034 70 74
WaMu Mortgage Pass-Through Certificates, Ser 2005-AR13, Cl A1A3
1.662%, VAR ICE LIBOR USD 1 Month + 1.560%, 10/25/2045 196 204
WaMu Mortgage Pass-Through Certificates, Ser 2005-AR15, Cl A1A1
0.622%, VAR ICE LIBOR USD 1 Month + 0.520%, 11/25/2045 4,072 4,023
WaMu Mortgage Pass-Through Certificates, Ser 2007-OA1, Cl A1A
0.782%, VAR 12 Month Treas Avg + 0.700%, 02/25/2047 1,153 1,106
Washington Mutual Mortgage Pass-Through Certificates Trust, Ser 2007-OA2, Cl 2A
0.782%, VAR 12 Month Treas Avg + 0.700%, 01/25/2047 775 690
Waterfall Commercial Mortgage Trust, Ser 2015-SBC5, Cl A
4.104%, 09/14/2022(B)(E) 176 179Wells Fargo Commercial Mortgage Trust,
Ser 2012-LC5, Cl C4.693%, 10/15/2045(E) 780 793
Wells Fargo Commercial Mortgage Trust, Ser 2013-LC12, Cl B
4.306%, 07/15/2046(E) 20 20Wells Fargo Commercial Mortgage Trust,
Ser 2014-LC18, Cl A53.405%, 12/15/2047 570 599
Wells Fargo Commercial Mortgage Trust, Ser 2016-C36, Cl XA, IO
1.234%, 11/15/2059(E) 5,034 230Wells Fargo Mortgage Backed Securities
Trust, Ser 2005-AR7, Cl B12.827%, 05/25/2035(E) 1,578 1,432
WFRBS Commercial Mortgage Trust, Ser 2012-C7, Cl XA, IO
1.281%, 06/15/2045(B)(E) 421 –WFRBS Commercial Mortgage Trust,
Ser 2013-C13, Cl XA, IO1.175%, 05/15/2045(B)(E) 789 9
DescriptionFace Amount (Thousands)
Market Value ($ Thousands)
MORTGAGE-BACKED SECURITIES (continued)WFRBS Commercial Mortgage Trust,
Ser 2014-C19, Cl B4.723%, 03/15/2047(E) $ 110 $ 114
WFRBS Commercial Mortgage Trust, Ser 2014-C21, Cl B
4.213%, 08/15/2047(E) 300 308WFRBS Commercial Mortgage Trust,
Ser C25, Cl ASB3.369%, 11/15/2047 318 327
434,069
Total Mortgage-Backed Securities
(Cost $1,302,922) ($ Thousands) 1,292,642
ASSET-BACKED SECURITIES — 7.7%Automotive — 0.7%
Ally Auto Receivables Trust, Ser 2019-4, Cl A3
1.840%, 06/17/2024 101 102AmeriCredit Automobile Receivables Trust,
Ser 2020-2, Cl A2A0.600%, 12/18/2023 174 174
AmeriCredit Automobile Receivables Trust, Ser 2020-3, Cl A2
0.420%, 03/18/2024 282 282Avis Budget Rental Car Funding AESOP,
Ser 2019-3A, Cl A2.360%, 03/20/2026 (B) 665 680
Avis Budget Rental Car Funding AESOP, Ser 2020-1A, Cl A
2.330%, 08/20/2026 (B) 1,862 1,906Avis Budget Rental Car Funding AESOP,
Ser 2020-2A, Cl A2.020%, 02/20/2027 (B) 2,800 2,830
Avis Budget Rental Car Funding AESOP, Ser 2021-2A, Cl A
1.660%, 02/20/2028 (B) 1,460 1,447Chesapeake Funding II, Ser 2019-1A, Cl A1
2.940%, 04/15/2031 (B) 427 430Chesapeake Funding II, Ser 2020-1A, Cl A1
0.870%, 08/16/2032 (B) 1,725 1,727Chesapeake Funding II, Ser 2020-1A, Cl B
1.240%, 08/16/2032 (B) 1,455 1,458Donlen Fleet Lease Funding 2, Ser 2021-2,
Cl A20.560%, 12/11/2034 (B) 1,410 1,402
Donlen Fleet Lease Funding 2, Ser 2021-2, Cl B
0.980%, 12/11/2034 (B) 575 569

41SEI Institutional Managed Trust / Quarterly Report / December 31, 2021
SCHEDULE OF INVESTMENTS (Unaudited)December 31, 2021
Core Fixed Income Fund (Continued)
DescriptionFace Amount (Thousands)
Market Value ($ Thousands)
ASSET-BACKED SECURITIES (continued)Donlen Fleet Lease Funding 2, Ser 2021-2,
Cl C1.200%, 12/11/2034 (B) $ 1,010 $ 994
Enterprise Fleet Financing, Ser 2019-1, Cl A2
2.980%, 10/20/2024 (B) 70 70Enterprise Fleet Funding, Ser 2021-1, Cl A3
0.700%, 12/21/2026 (B) 425 419Exeter Automobile Receivables Trust,
Ser 2021-2A, Cl A20.270%, 01/16/2024 277 277
Ford Credit Auto Owner Trust, Ser 2018-1, Cl A
3.190%, 07/15/2031 (B) 588 620GLS Auto Receivables Issuer Trust,
Ser 2021-3A, Cl A0.420%, 01/15/2025 (B) 859 858
Hertz Vehicle Financing III, Ser 2021-2A, Cl A
1.680%, 12/27/2027 (B) 1,271 1,252Hyundai Auto Receivables Trust, Ser 2020-
B, Cl A20.380%, 03/15/2023 67 67
Hyundai Auto Receivables Trust, Ser 2021-C, Cl A4
1.030%, 12/15/2027 566 561JPMorgan Chase Bank - CACLN, Ser 2020-1,
Cl B0.991%, 01/25/2028 (B) 372 372
JPMorgan Chase Bank - CACLN, Ser 2020-2, Cl B
0.840%, 02/25/2028 (B) 659 658JPMorgan Chase Bank - CACLN, Ser 2021-2,
Cl B0.889%, 12/26/2028 (B) 744 741
JPMorgan Chase Bank - CACLN, Ser 2021-3, Cl B
0.760%, 02/26/2029 (B) 1,505 1,495Mercedes-Benz Auto Receivables Trust,
Ser 2021-1, Cl A30.460%, 06/15/2026 854 844
Santander Drive Auto Receivables Trust, Ser 2020-1, Cl A3
2.030%, 02/15/2024 8 8Santander Drive Auto Receivables Trust,
Ser 2020-3, Cl A30.520%, 07/15/2024 372 372
Santander Drive Auto Receivables Trust, Ser 2020-4, Cl A3
0.480%, 07/15/2024 1,852 1,852Santander Drive Auto Receivables Trust,
Ser 2021-2, Cl A20.280%, 04/15/2024 367 367
DescriptionFace Amount (Thousands)
Market Value ($ Thousands)
ASSET-BACKED SECURITIES (continued)Santander Drive Auto Receivables Trust,
Ser 2021-2, Cl B0.590%, 09/15/2025 $ 1,930 $ 1,926
Tidewater Auto Receivables Trust, Ser 2020-AA, Cl A2
1.390%, 08/15/2024 (B) 58 58Toyota Auto Loan Extended Note Trust,
Ser 2021-1A, Cl A1.070%, 02/27/2034 (B) 1,491 1,463
Toyota Auto Receivables Owner Trust, Ser 2021-D, Cl A4
1.020%, 03/15/2027 608 602Westlake Automobile Receivables Trust,
Ser 2019-3A, Cl C2.490%, 10/15/2024 (B) 1,105 1,112
Westlake Automobile Receivables Trust, Ser 2021-1A, Cl A2A
0.390%, 10/15/2024 (B) 739 738Westlake Automobile Receivables Trust,
Ser 2021-2A, Cl A2A0.320%, 04/15/2025 (B) 455 453
Wheels SPV 2, Ser 2020-1A, Cl A20.510%, 08/20/2029 (B) 1,321 1,319
32,505
Credit Cards — 0.1%
American Express Credit Account Master Trust, Ser 2021-1, Cl A
0.900%, 11/15/2026 3,305 3,278Capital One Multi-Asset Execution Trust,
Ser 2021-A2, Cl A21.390%, 07/15/2030 1,036 1,019
Citibank Credit Card Issuance Trust, Ser 2017-A6, Cl A6
0.879%, VAR ICE LIBOR USD 1 Month + 0.770%, 05/14/2029 2,340 2,377
6,674
Financials — 0.0%
Sequoia Infrastructure Funding I Ltd., Ser 2021-1A, Cl A
1.524%, VAR ICE LIBOR USD 3 Month + 1.400%, 04/15/2031 (B) 892 891
Mortgage Related Securities — 0.3%
Aegis Asset-Backed Securities Trust, Ser 2003-3, Cl M1
1.152%, VAR ICE LIBOR USD 1 Month + 1.050%, 01/25/2034 505 503

SEI Institutional Managed Trust / Quarterly Report / December 31, 202142
SCHEDULE OF INVESTMENTS (Unaudited)December 31, 2021
Core Fixed Income Fund (Continued)
SCHEDULE OF INVESTMENTS (Unaudited)December 31, 2021
Core Fixed Income Fund (Continued)
DescriptionFace Amount (Thousands)
Market Value ($ Thousands)
ASSET-BACKED SECURITIES (continued)Bayview Financial Mortgage Pass-Through
Trust, Ser 2006-A, Cl M31.077%, VAR ICE LIBOR USD 1 Month +
0.975%, 02/28/2041 $ 535 $ 535Bear Stearns Asset-Backed Securities I
Trust, Ser 2004-HE10, Cl M11.067%, VAR ICE LIBOR USD 1 Month
+ 0.975%, 12/25/2034 271 269Bear Stearns Asset-Backed Securities I
Trust, Ser 2004-HE6, Cl M10.947%, VAR ICE LIBOR USD 1 Month
+ 0.855%, 08/25/2034 2,599 2,593Citigroup Mortgage LoanTrust, Ser 2006-
HE2, Cl M10.538%, VAR ICE LIBOR USD 1 Month
+ 0.290%, 08/25/2036 2,337 2,330Master Asset-Backed Securities Trust,
Ser 2007-HE1, Cl A40.382%, VAR ICE LIBOR USD 1 Month
+ 0.280%, 05/25/2037 5,500 5,072Morgan Stanley ABS Capital I Trust,
Ser 2005-HE1, Cl M10.777%, VAR ICE LIBOR USD 1 Month +
0.675%, 12/25/2034 315 314Option One Mortgage Loan Trust, Ser 2006-
1, Cl 1A10.542%, VAR ICE LIBOR USD 1 Month
+ 0.440%, 01/25/2036 279 279 11,895
Other Asset-Backed Securities — 6.6%
Academic Loan Funding Trust, Ser 2012-1A, Cl A2
1.203%, VAR ICE LIBOR USD 1 Month + 1.100%, 12/27/2044 (B) 1,242 1,245
ACRES Commercial Realty, Ser 2021-FL1, Cl A
1.310%, VAR ICE LIBOR USD 1 Month + 1.200%, 06/15/2036 (B) 1,760 1,755
AIG CLO, Ser 2021-1A, Cl A1R1.252%, VAR ICE LIBOR USD 3 Month
+ 1.120%, 04/20/2032 (B) 3,400 3,404AMMC CLO XIII, Ser 2021-13A, Cl A1R2
1.175%, VAR ICE LIBOR USD 3 Month + 1.050%, 07/24/2029 (B) 3,350 3,349
Antares CLO, Ser 2021-1A, Cl A1R1.588%, 10/23/2033 (B)(E) 1,400 1,397
Apidos CLO XXI, Ser 2018-21A, Cl A1R1.052%, VAR ICE LIBOR USD 3 Month
+ 0.930%, 07/18/2027 (B) 255 255Applebee's Funding, Ser 2019-1A, Cl A2I
4.194%, 06/05/2049 (B) 1,851 1,872
DescriptionFace Amount (Thousands)
Market Value ($ Thousands)
ASSET-BACKED SECURITIES (continued)Aqua Finance Trust, Ser 2021-A, Cl A
1.540%, 07/17/2046 (B) $ 1,390 $ 1,378Barings CLO, Ser 2017-IA, Cl AR
0.932%, VAR ICE LIBOR USD 3 Month + 0.800%, 01/20/2028 (B) 938 938
Bayview MSR Opportunity Master Fund Trust, Ser 2021-2, Cl A2
2.500%, 06/25/2051 (B)(E) 894 900BPR Trust, Ser TY, Cl A
1.160%, VAR ICE LIBOR USD 1 Month + 1.050%, 09/15/2038 (B) 1,160 1,158
Brazos Education Loan Authority, Ser 2021-2, Cl A1A
2.060%, 01/25/2072 575 575Brazos Higher Education Authority,
Ser 2010-1, Cl A21.378%, VAR ICE LIBOR USD 3 Month
+ 1.200%, 02/25/2035 3,050 3,085Brazos Higher Education Authority,
Ser 2011-2, Cl A31.124%, VAR ICE LIBOR USD 3 Month +
1.000%, 10/27/2036 2,150 2,161BX Commercial Mortgage Trust, Ser VOLT,
Cl A0.810%, VAR ICE LIBOR USD 1 Month
+ 0.700%, 09/15/2036 (B) 2,867 2,857CARLYLE US CLO, Ser 2021-1A, Cl A1
1.264%, VAR ICE LIBOR USD 3 Month + 1.140%, 04/15/2034 (B) 1,150 1,150
CARLYLE US CLO, Ser 2021-1A, Cl A2R1.782%, VAR ICE LIBOR USD 3 Month
+ 1.650%, 07/20/2034 (B) 1,560 1,559Cedar Funding XI CLO, Ser 2021-11A, Cl B2R
1.776%, VAR ICE LIBOR USD 3 Month + 1.600%, 05/29/2032 (B) 1,690 1,690
Cedar Funding XII CLO, Ser 2021-12A, Cl BR1.733%, VAR ICE LIBOR USD 3 Month
+ 1.600%, 10/25/2034 (B) 3,000 2,988Chase Funding Mortgage Loan Asset-
Backed Certificates, Ser 2003-6, Cl 1A54.924%, 11/25/2034 29 30
CIFC Funding, Ser 2021-7A, Cl A11.258%, VAR ICE LIBOR USD 3 Month
+ 1.130%, 01/23/2035 (B) 3,500 3,499CIT Education Loan Trust, Ser 2007-1, Cl A
0.310%, VAR ICE LIBOR USD 3 Month + 0.090%, 03/25/2042 (B) 1,014 984
Citicorp Residential Mortgage Trust, Ser 2007-1, Cl A5
5.066%, 03/25/2037 1,033 1,046Citicorp Residential Mortgage Trust,
Ser 2007-1, Cl M15.066%, 03/25/2037 1,430 1,485
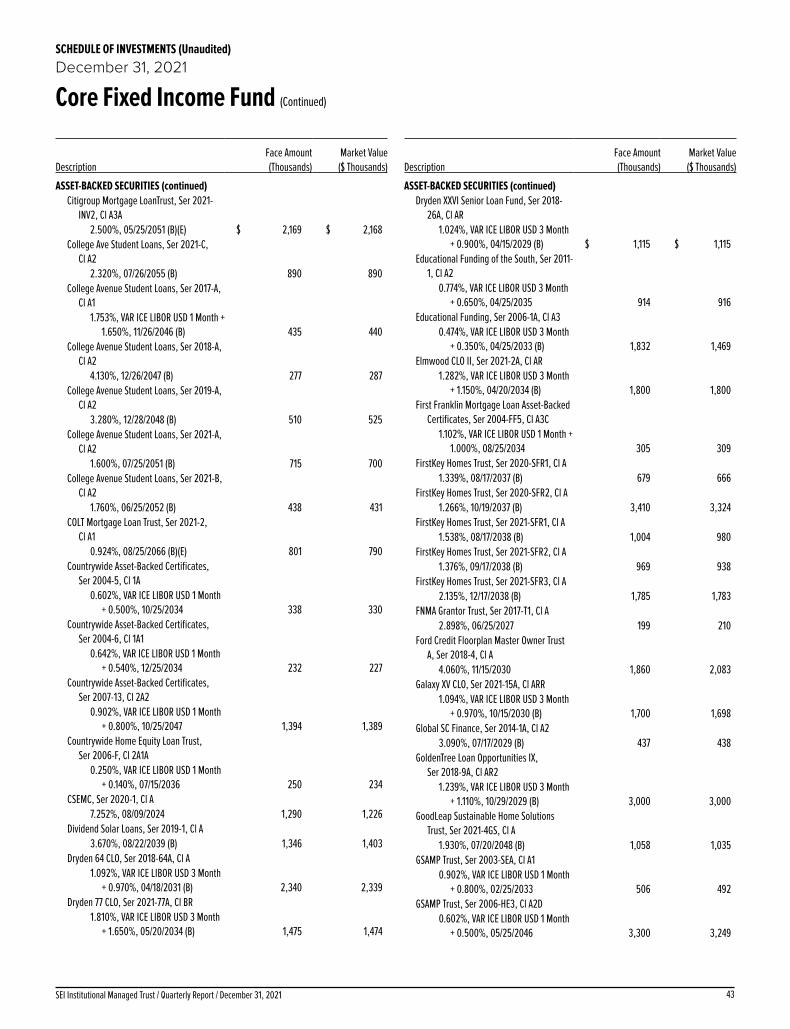
43SEI Institutional Managed Trust / Quarterly Report / December 31, 2021
SCHEDULE OF INVESTMENTS (Unaudited)December 31, 2021
Core Fixed Income Fund (Continued)
DescriptionFace Amount (Thousands)
Market Value ($ Thousands)
ASSET-BACKED SECURITIES (continued)Citigroup Mortgage LoanTrust, Ser 2021-
INV2, Cl A3A2.500%, 05/25/2051 (B)(E) $ 2,169 $ 2,168
College Ave Student Loans, Ser 2021-C, Cl A2
2.320%, 07/26/2055 (B) 890 890College Avenue Student Loans, Ser 2017-A,
Cl A11.753%, VAR ICE LIBOR USD 1 Month +
1.650%, 11/26/2046 (B) 435 440College Avenue Student Loans, Ser 2018-A,
Cl A24.130%, 12/26/2047 (B) 277 287
College Avenue Student Loans, Ser 2019-A, Cl A2
3.280%, 12/28/2048 (B) 510 525College Avenue Student Loans, Ser 2021-A,
Cl A21.600%, 07/25/2051 (B) 715 700
College Avenue Student Loans, Ser 2021-B, Cl A2
1.760%, 06/25/2052 (B) 438 431COLT Mortgage Loan Trust, Ser 2021-2,
Cl A10.924%, 08/25/2066 (B)(E) 801 790
Countrywide Asset-Backed Certificates, Ser 2004-5, Cl 1A
0.602%, VAR ICE LIBOR USD 1 Month + 0.500%, 10/25/2034 338 330
Countrywide Asset-Backed Certificates, Ser 2004-6, Cl 1A1
0.642%, VAR ICE LIBOR USD 1 Month + 0.540%, 12/25/2034 232 227
Countrywide Asset-Backed Certificates, Ser 2007-13, Cl 2A2
0.902%, VAR ICE LIBOR USD 1 Month + 0.800%, 10/25/2047 1,394 1,389
Countrywide Home Equity Loan Trust, Ser 2006-F, Cl 2A1A
0.250%, VAR ICE LIBOR USD 1 Month + 0.140%, 07/15/2036 250 234
CSEMC, Ser 2020-1, Cl A7.252%, 08/09/2024 1,290 1,226
Dividend Solar Loans, Ser 2019-1, Cl A3.670%, 08/22/2039 (B) 1,346 1,403
Dryden 64 CLO, Ser 2018-64A, Cl A1.092%, VAR ICE LIBOR USD 3 Month
+ 0.970%, 04/18/2031 (B) 2,340 2,339Dryden 77 CLO, Ser 2021-77A, Cl BR
1.810%, VAR ICE LIBOR USD 3 Month + 1.650%, 05/20/2034 (B) 1,475 1,474
DescriptionFace Amount (Thousands)
Market Value ($ Thousands)
ASSET-BACKED SECURITIES (continued)Dryden XXVI Senior Loan Fund, Ser 2018-
26A, Cl AR1.024%, VAR ICE LIBOR USD 3 Month
+ 0.900%, 04/15/2029 (B) $ 1,115 $ 1,115Educational Funding of the South, Ser 2011-
1, Cl A20.774%, VAR ICE LIBOR USD 3 Month
+ 0.650%, 04/25/2035 914 916Educational Funding, Ser 2006-1A, Cl A3
0.474%, VAR ICE LIBOR USD 3 Month + 0.350%, 04/25/2033 (B) 1,832 1,469
Elmwood CLO II, Ser 2021-2A, Cl AR1.282%, VAR ICE LIBOR USD 3 Month
+ 1.150%, 04/20/2034 (B) 1,800 1,800First Franklin Mortgage Loan Asset-Backed
Certificates, Ser 2004-FF5, Cl A3C1.102%, VAR ICE LIBOR USD 1 Month +
1.000%, 08/25/2034 305 309FirstKey Homes Trust, Ser 2020-SFR1, Cl A
1.339%, 08/17/2037 (B) 679 666FirstKey Homes Trust, Ser 2020-SFR2, Cl A
1.266%, 10/19/2037 (B) 3,410 3,324FirstKey Homes Trust, Ser 2021-SFR1, Cl A
1.538%, 08/17/2038 (B) 1,004 980FirstKey Homes Trust, Ser 2021-SFR2, Cl A
1.376%, 09/17/2038 (B) 969 938FirstKey Homes Trust, Ser 2021-SFR3, Cl A
2.135%, 12/17/2038 (B) 1,785 1,783FNMA Grantor Trust, Ser 2017-T1, Cl A
2.898%, 06/25/2027 199 210Ford Credit Floorplan Master Owner Trust
A, Ser 2018-4, Cl A4.060%, 11/15/2030 1,860 2,083
Galaxy XV CLO, Ser 2021-15A, Cl ARR1.094%, VAR ICE LIBOR USD 3 Month
+ 0.970%, 10/15/2030 (B) 1,700 1,698Global SC Finance, Ser 2014-1A, Cl A2
3.090%, 07/17/2029 (B) 437 438GoldenTree Loan Opportunities IX,
Ser 2018-9A, Cl AR21.239%, VAR ICE LIBOR USD 3 Month
+ 1.110%, 10/29/2029 (B) 3,000 3,000GoodLeap Sustainable Home Solutions
Trust, Ser 2021-4GS, Cl A1.930%, 07/20/2048 (B) 1,058 1,035
GSAMP Trust, Ser 2003-SEA, Cl A10.902%, VAR ICE LIBOR USD 1 Month
+ 0.800%, 02/25/2033 506 492GSAMP Trust, Ser 2006-HE3, Cl A2D
0.602%, VAR ICE LIBOR USD 1 Month + 0.500%, 05/25/2046 3,300 3,249

SEI Institutional Managed Trust / Quarterly Report / December 31, 202144
SCHEDULE OF INVESTMENTS (Unaudited)December 31, 2021
Core Fixed Income Fund (Continued)
SCHEDULE OF INVESTMENTS (Unaudited)December 31, 2021
Core Fixed Income Fund (Continued)
DescriptionFace Amount (Thousands)
Market Value ($ Thousands)
ASSET-BACKED SECURITIES (continued)GSAMP Trust, Ser 2006-NC1, Cl A3
0.682%, VAR ICE LIBOR USD 1 Month + 0.580%, 02/25/2036 $ 513 $ 513
Higher Education Funding, Ser 2014-1, Cl A1.230%, VAR ICE LIBOR USD 3 Month
+ 1.050%, 05/25/2034 (B) 972 975Hildene Community Funding CDO, Ser 2021-
1A, Cl ARR2.600%, 11/01/2035 (B) 1,240 1,231
Hilton Grand Vacations Trust, Ser 2020-AA, Cl A
2.740%, 02/25/2039 (B) 605 622Home Partners of America Trust, Ser 2019-
2, Cl A2.703%, 10/19/2039 (B) 1,568 1,603
Home Partners of America Trust, Ser 2021-2, Cl A
1.901%, 12/17/2026 (B) 1,221 1,208Home Partners of America Trust, Ser 2021-
3, Cl A2.200%, 01/17/2041 (B) 1,605 1,600
Hotwire Funding, Ser 2021-1, Cl A22.311%, 11/20/2051 (B) 820 816
HSI Asset Securitization Trust, Ser 2006-OPT3, Cl 3A3
0.462%, VAR ICE LIBOR USD 1 Month + 0.360%, 02/25/2036 32 32
Invitation Homes Trust, Ser 2018-SFR2, Cl A1.010%, VAR ICE LIBOR USD 1 Month
+ 0.900%, 06/17/2037 (B) 3,260 3,260JGWPT XXX, Ser 2013-3A, Cl A
4.080%, 01/17/2073 (B) 787 872JGWPT XXXII, Ser 2014-2A, Cl A
3.610%, 01/17/2073 (B) 1,079 1,164JP Morgan Mortgage Trust, Ser 2021-INV2,
Cl A22.500%, 12/25/2051 (B)(E) 2,137 2,135
JPMorgan Chase Commercial Mortgage Securities Trust, Ser JP4, Cl A3
3.393%, 12/15/2049 206 216LCM 32, Ser 2021-32A, Cl B
1.832%, VAR ICE LIBOR USD 3 Month + 1.700%, 07/20/2034 (B) 1,450 1,454
LCM XXI, Ser 2018-21A, Cl AR1.012%, VAR ICE LIBOR USD 3 Month
+ 0.880%, 04/20/2028 (B) 606 605LCM XXIV, Ser 2021-24A, Cl AR
1.112%, VAR ICE LIBOR USD 3 Month + 0.980%, 03/20/2030 (B) 950 950
LoanCore Issuer, Ser 2019-CRE2, Cl A1.240%, VAR ICE LIBOR USD 1 Month
+ 1.130%, 05/15/2036 (B) 1,318 1,318
DescriptionFace Amount (Thousands)
Market Value ($ Thousands)
ASSET-BACKED SECURITIES (continued)Lunar Structured Aircraft Portfolio Notes,
Ser 2021-1, Cl A2.636%, 10/15/2046 (B) $ 1,138 $ 1,131
Magnetite VII, Ser 2018-7A, Cl A1R20.924%, VAR ICE LIBOR USD 3 Month
+ 0.800%, 01/15/2028 (B) 981 982Magnetite XXVIII, Ser 2021-28A, Cl AR
1.360%, 01/20/2035 (B)(E) 1,800 1,799MF1, Ser 2020-FL4, Cl A
1.865%, VAR SOFR30A + 1.814%, 11/15/2035 (B) 980 984
MF1, Ser 2021-FL7, Cl A1.188%, VAR ICE LIBOR USD 1 Month +
1.080%, 10/16/2036 (B) 875 872MFA Trust, Ser 2021-NQM2, Cl A1
1.029%, 11/25/2064 (B)(E) 453 449Mid-State Trust, Ser 2003-11, Cl A1
4.864%, 07/15/2038 1,375 1,423Morgan Stanley Capital I Trust, Ser L7, Cl A5
2.574%, 10/15/2054 798 815Morgan Stanley Resecuritization Trust,
Ser 2015-R7, Cl 1BXA7.246%, 02/26/2029 (B)(E) 930 928
MVW, Ser 2021-1WA, Cl A1.140%, 01/22/2041 (B) 805 789
MVW, Ser 2021-1WA, Cl B1.440%, 01/22/2041 (B) 400 394
Navient Private Education Loan Trust, Ser 2014-AA, Cl A3
1.710%, VAR ICE LIBOR USD 1 Month + 1.600%, 10/15/2031 (B) 457 464
Navient Private Education Loan Trust, Ser 2016-AA, Cl A2B
2.260%, VAR ICE LIBOR USD 1 Month + 2.150%, 12/15/2045 (B) 327 336
Navient Private Education Loan Trust, Ser 2018-BA, Cl A2A
3.610%, 12/15/2059 (B) 370 381Navient Private Education Loan Trust,
Ser 2020-IA, Cl A1A1.330%, 04/15/2069 (B) 2,052 2,022
Navient Private Education Refi Loan Trust, Ser 2018-A, Cl A2
3.190%, 02/18/2042 (B) 107 108Navient Private Education Refi Loan Trust,
Ser 2018-CA, Cl A23.520%, 06/16/2042 (B) 85 86
Navient Private Education Refi Loan Trust, Ser 2018-DA, Cl A2A
4.000%, 12/15/2059 (B) 1,086 1,127Navient Private Education Refi Loan Trust,
Ser 2019-A, Cl A2A3.420%, 01/15/2043 (B) 942 961

45SEI Institutional Managed Trust / Quarterly Report / December 31, 2021
SCHEDULE OF INVESTMENTS (Unaudited)December 31, 2021
Core Fixed Income Fund (Continued)
DescriptionFace Amount (Thousands)
Market Value ($ Thousands)
ASSET-BACKED SECURITIES (continued)Navient Private Education Refi Loan Trust,
Ser 2019-CA, Cl A23.130%, 02/15/2068 (B) $ 1,367 $ 1,393
Navient Private Education Refi Loan Trust, Ser 2019-D, Cl A2A
3.010%, 12/15/2059 (B) 1,447 1,489Navient Private Education Refi Loan Trust,
Ser 2019-FA, Cl A22.600%, 08/15/2068 (B) 2,459 2,491
Navient Private Education Refi Loan Trust, Ser 2019-GA, Cl A
2.400%, 10/15/2068 (B) 448 455Navient Private Education Refi Loan Trust,
Ser 2020-BA, Cl A22.120%, 01/15/2069 (B) 561 567
Navient Private Education Refi Loan Trust, Ser 2020-DA, Cl A
1.690%, 05/15/2069 (B) 603 603Navient Private Education Refi Loan Trust,
Ser 2020-FA, Cl A1.220%, 07/15/2069 (B) 1,022 1,019
Navient Private Education Refi Loan Trust, Ser 2020-GA, Cl A
1.170%, 09/16/2069 (B) 1,679 1,671Navient Private Education Refi Loan Trust,
Ser 2020-HA, Cl A1.310%, 01/15/2069 (B) 1,093 1,088
Navient Private Education Refi Loan Trust, Ser 2021-A, Cl A
0.840%, 05/15/2069 (B) 136 134Navient Private Education Refi Loan Trust,
Ser 2021-BA, Cl A0.940%, 07/15/2069 (B) 1,023 1,012
Navient Private Education Refi Loan Trust, Ser 2021-CA, Cl A
1.060%, 10/15/2069 (B) 1,717 1,692Navient Private Education Refi Loan Trust,
Ser 2021-EA, Cl A0.970%, 12/16/2069 (B) 2,849 2,801
Navient Private Education Refi Loan Trust, Ser 2021-FA, Cl A
1.110%, 02/18/2070 (B) 2,572 2,528Navient Private Education Refi Loan Trust,
Ser 2021-GA, Cl A1.580%, 04/15/2070 (B) 2,273 2,265
Navient Student Loan Trust, Ser 2014-1, Cl A3
0.613%, VAR ICE LIBOR USD 1 Month + 0.510%, 06/25/2031 2,531 2,474
Navient Student Loan Trust, Ser 2014-3, Cl A0.722%, VAR ICE LIBOR USD 1 Month
+ 0.620%, 03/25/2083 2,217 2,220
DescriptionFace Amount (Thousands)
Market Value ($ Thousands)
ASSET-BACKED SECURITIES (continued)Navient Student Loan Trust, Ser 2014-4, Cl A
0.723%, VAR ICE LIBOR USD 1 Month + 0.620%, 03/25/2083 $ 1,486 $ 1,488
Navient Student Loan Trust, Ser 2016-2A, Cl A3
1.603%, VAR ICE LIBOR USD 1 Month + 1.500%, 06/25/2065 (B) 1,270 1,314
Navient Student Loan Trust, Ser 2017-1A, Cl A3
1.253%, VAR ICE LIBOR USD 1 Month + 1.150%, 07/26/2066 (B) 1,000 1,013
Navient Student Loan Trust, Ser 2017-3A, Cl A3
1.153%, VAR ICE LIBOR USD 1 Month + 1.050%, 07/26/2066 (B) 2,900 2,907
Navient Student Loan Trust, Ser 2019-BA, Cl A2A
3.390%, 12/15/2059 (B) 1,563 1,611Navient Student Loan Trust, Ser 2021-1A,
Cl A1A1.310%, 12/26/2069 (B) 526 511
Navient Student Loan Trust, Ser 2021-3A, Cl A1A
1.770%, 08/25/2070 (B) 1,274 1,260Nelnet Student Loan Trust, Ser 2004-3,
Cl A50.304%, VAR ICE LIBOR USD 3 Month
+ 0.180%, 10/27/2036 538 531Nelnet Student Loan Trust, Ser 2004-4,
Cl A50.284%, VAR ICE LIBOR USD 3 Month
+ 0.160%, 01/25/2037 897 887Nelnet Student Loan Trust, Ser 2005-1,
Cl A50.234%, VAR ICE LIBOR USD 3 Month
+ 0.110%, 10/25/2033 3,080 3,042Nelnet Student Loan Trust, Ser 2005-2,
Cl A50.314%, VAR ICE LIBOR USD 3 Month
+ 0.100%, 03/23/2037 2,553 2,512Nelnet Student Loan Trust, Ser 2005-3,
Cl A50.334%, VAR ICE LIBOR USD 3 Month
+ 0.120%, 12/24/2035 2,525 2,499Nelnet Student Loan Trust, Ser 2005-4,
Cl A40.394%, VAR ICE LIBOR USD 3 Month
+ 0.180%, 03/22/2032 404 393Nelnet Student Loan Trust, Ser 2014-2A,
Cl A30.953%, VAR ICE LIBOR USD 1 Month
+ 0.850%, 07/27/2037 (B) 950 958

SEI Institutional Managed Trust / Quarterly Report / December 31, 202146
SCHEDULE OF INVESTMENTS (Unaudited)December 31, 2021
Core Fixed Income Fund (Continued)
SCHEDULE OF INVESTMENTS (Unaudited)December 31, 2021
Core Fixed Income Fund (Continued)
DescriptionFace Amount (Thousands)
Market Value ($ Thousands)
ASSET-BACKED SECURITIES (continued)Nelnet Student Loan Trust, Ser 2014-4A,
Cl A21.053%, VAR ICE LIBOR USD 1 Month
+ 0.950%, 11/25/2048 (B) $ 2,155 $ 2,202Nelnet Student Loan Trust, Ser 2021-CA,
Cl AFX1.320%, 04/20/2062 (B) 1,661 1,635
Neuberger Berman CLO XVII, Ser 2020-17A, Cl AR2
1.158%, VAR ICE LIBOR USD 3 Month + 1.030%, 04/22/2029 (B) 350 350
Neuberger Berman Loan Advisers CLO 40, Ser 2021-40A, Cl A
1.182%, VAR ICE LIBOR USD 3 Month + 1.060%, 04/16/2033 (B) 2,075 2,078
New Residential Mortgage Loan Trust, Ser 2021-NQM3, Cl A3
1.516%, 11/27/2056 (B)(E) 600 593Oak Street Investment Grade Net Lease
Fund, Ser 2020-1A, Cl A11.850%, 11/20/2050 (B) 1,100 1,090
OBX Trust, Ser 2021-NQM3, Cl A31.362%, 07/25/2061 (B)(E) 574 567
Octagon Investment Partners 50, Ser 2021-4A, Cl AR
1.273%, VAR ICE LIBOR USD 3 Month + 1.150%, 01/15/2035 (B) 1,725 1,725
Octagon Investment Partners XIV, Ser 2021-1A, Cl AARR
1.074%, VAR ICE LIBOR USD 3 Month + 0.950%, 07/15/2029 (B) 3,200 3,201
Orange Lake Timeshare Trust, Ser 2019-A, Cl A
3.060%, 04/09/2038 (B) 605 616Origen Manufactured Housing, Ser 2006-A,
Cl A21.616%, 10/15/2037 (E) 751 723
Pawneee Equipment Receivables, Ser 2021-1, Cl A2
1.100%, 07/15/2027 (B) 1,040 1,034PFCA Home Equity Investment Trust,
Ser 2004-GP2, Cl A3.326%, 08/25/2035 (B)(E) 1,137 1,116
Progress Residential Trust, Ser 2019-SFR2, Cl A
3.147%, 05/17/2036 (B) 99 100Progress Residential Trust, Ser 2019-SFR3,
Cl A2.271%, 09/17/2036 (B) 1,064 1,072
Progress Residential Trust, Ser 2019-SFR4, Cl A
2.687%, 10/17/2036 (B) 880 891
DescriptionFace Amount (Thousands)
Market Value ($ Thousands)
ASSET-BACKED SECURITIES (continued)Progress Residential Trust, Ser 2021-SFR11,
Cl A2.283%, 01/17/2039 (B) $ 700 $ 698
Progress Residential Trust, Ser 2021-SFR3, Cl A
1.637%, 05/17/2026 (B) 2,384 2,353Progress Residential Trust, Ser 2021-SFR8,
Cl A1.510%, 10/17/2038 (B) 2,185 2,135
RAMP Trust, Ser 2006-RZ3, Cl M10.452%, VAR ICE LIBOR USD 1 Month
+ 0.350%, 08/25/2036 4,887 4,839Rockford Tower CLO, Ser 2021-2A, Cl AR
1.260%, VAR ICE LIBOR USD 3 Month + 1.100%, 08/20/2032 (B) 3,150 3,149
SBA Small Business Investment, Ser 2018-10B, Cl 1
3.548%, 09/10/2028 1,036 1,097SBA Small Business Investment, Ser 2019-
10A, Cl 13.113%, 03/10/2029 641 671
Sierra Timeshare Receivables Funding, Ser 2018-3A, Cl B
3.870%, 09/20/2035 (B) 784 803SLM Private Credit Student Loan Trust,
Ser 2004-B, Cl A30.533%, VAR ICE LIBOR USD 3 Month
+ 0.330%, 03/15/2024 272 271SLM Private Credit Student Loan Trust,
Ser 2005-A, Cl A40.513%, VAR ICE LIBOR USD 3 Month
+ 0.310%, 12/15/2038 1,206 1,186SLM Student Loan Trust, Ser 2003-1, Cl A5C
0.953%, VAR ICE LIBOR USD 3 Month + 0.750%, 12/15/2032 (B) 619 613
SLM Student Loan Trust, Ser 2003-7A, Cl A5A
1.403%, VAR ICE LIBOR USD 3 Month + 1.200%, 12/15/2033 (B) 1,966 1,969
SLM Student Loan Trust, Ser 2005-4, Cl A40.294%, VAR ICE LIBOR USD 3 Month
+ 0.170%, 07/25/2040 3,000 2,913SLM Student Loan Trust, Ser 2006-8, Cl A6
0.284%, VAR ICE LIBOR USD 3 Month + 0.160%, 01/25/2041 2,374 2,317
SLM Student Loan Trust, Ser 2007-2, Cl A40.184%, VAR ICE LIBOR USD 3 Month
+ 0.060%, 07/25/2022 2,671 2,597SLM Student Loan Trust, Ser 2007-7, Cl B
0.874%, VAR ICE LIBOR USD 3 Month + 0.750%, 10/27/2070 1,050 968

47SEI Institutional Managed Trust / Quarterly Report / December 31, 2021
SCHEDULE OF INVESTMENTS (Unaudited)December 31, 2021
Core Fixed Income Fund (Continued)
DescriptionFace Amount (Thousands)
Market Value ($ Thousands)
ASSET-BACKED SECURITIES (continued)SLM Student Loan Trust, Ser 2008-2, Cl A3
0.874%, VAR ICE LIBOR USD 3 Month + 0.750%, 04/25/2023 $ 748 $ 737
SLM Student Loan Trust, Ser 2008-2, Cl B1.324%, VAR ICE LIBOR USD 3 Month
+ 1.200%, 01/25/2083 685 617SLM Student Loan Trust, Ser 2008-3, Cl B
1.324%, VAR ICE LIBOR USD 3 Month + 1.200%, 04/26/2083 685 651
SLM Student Loan Trust, Ser 2008-4, Cl A41.774%, VAR ICE LIBOR USD 3 Month
+ 1.650%, 07/25/2022 581 588SLM Student Loan Trust, Ser 2008-4, Cl B
1.974%, VAR ICE LIBOR USD 3 Month + 1.850%, 04/25/2073 685 681
SLM Student Loan Trust, Ser 2008-5, Cl A41.824%, VAR ICE LIBOR USD 3 Month
+ 1.700%, 07/25/2023 98 98SLM Student Loan Trust, Ser 2008-5, Cl B
1.974%, VAR ICE LIBOR USD 3 Month + 1.850%, 07/25/2073 685 678
SLM Student Loan Trust, Ser 2008-6, Cl A41.224%, VAR ICE LIBOR USD 3 Month
+ 1.100%, 07/25/2023 2,923 2,920SLM Student Loan Trust, Ser 2008-6, Cl B
1.974%, VAR ICE LIBOR USD 3 Month + 1.850%, 07/26/2083 685 687
SLM Student Loan Trust, Ser 2008-7, Cl B1.974%, VAR ICE LIBOR USD 3 Month
+ 1.850%, 07/26/2083 685 688SLM Student Loan Trust, Ser 2008-8, Cl B
2.374%, VAR ICE LIBOR USD 3 Month + 2.250%, 10/25/2075 685 698
SLM Student Loan Trust, Ser 2008-9, Cl A1.624%, VAR ICE LIBOR USD 3 Month
+ 1.500%, 04/25/2023 1,217 1,226SLM Student Loan Trust, Ser 2008-9, Cl B
2.374%, VAR ICE LIBOR USD 3 Month + 2.250%, 10/25/2083 685 694
SLM Student Loan Trust, Ser 2009-3, Cl A0.852%, VAR ICE LIBOR USD 1 Month
+ 0.750%, 01/25/2045 (B) 508 508SLM Student Loan Trust, Ser 2010-1, Cl A
0.503%, VAR ICE LIBOR USD 1 Month + 0.400%, 03/25/2025 326 321
SLM Student Loan Trust, Ser 2012-1, Cl A31.052%, VAR ICE LIBOR USD 1 Month
+ 0.950%, 09/25/2028 1,714 1,699SLM Student Loan Trust, Ser 2012-2, Cl A
0.803%, VAR ICE LIBOR USD 1 Month + 0.700%, 01/25/2029 1,463 1,428
DescriptionFace Amount (Thousands)
Market Value ($ Thousands)
ASSET-BACKED SECURITIES (continued)SLM Student Loan Trust, Ser 2012-6, Cl A3
0.853%, VAR ICE LIBOR USD 1 Month + 0.750%, 05/26/2026 $ 313 $ 307
SLM Student Loan Trust, Ser 2021-10A, Cl A40.873%, VAR ICE LIBOR USD 3 Month
+ 0.670%, 12/17/2068 (B) 2,657 2,664SMB Private Education Loan Trust,
Ser 2016-A, Cl A2A2.700%, 05/15/2031 (B) 729 738
SMB Private Education Loan Trust, Ser 2016-B, Cl A2A
2.430%, 02/17/2032 (B) 370 375SMB Private Education Loan Trust,
Ser 2016-B, Cl A2B1.560%, VAR ICE LIBOR USD 1 Month
+ 1.450%, 02/17/2032 (B) 320 324SMB Private Education Loan Trust,
Ser 2016-C, Cl A2B1.210%, VAR ICE LIBOR USD 1 Month
+ 1.100%, 09/15/2034 (B) 343 346SMB Private Education Loan Trust,
Ser 2018-C, Cl A2A3.630%, 11/15/2035 (B) 458 476
SMB Private Education Loan Trust, Ser 2019-A, Cl A2A
3.440%, 07/15/2036 (B) 1,813 1,872SMB Private Education Loan Trust,
Ser 2020-B, Cl A1A1.290%, 07/15/2053 (B) 1,198 1,185
SMB Private Education Loan Trust, Ser 2020-PTA, Cl A2A
1.600%, 09/15/2054 (B) 1,140 1,131SMB Private Education Loan Trust,
Ser 2020-PTB, Cl A2A1.600%, 09/15/2054 (B) 3,500 3,449
SMB Private Education Loan Trust, Ser 2021-A, Cl APT1
1.070%, 01/15/2053 (B) 2,777 2,703SMB Private Education Loan Trust,
Ser 2021-B, Cl A1.310%, 07/17/2051 (B) 2,376 2,356
SMB Private Education Loan Trust, Ser 2021-C, Cl A2
0.890%, VAR ICE LIBOR USD 1 Month + 0.800%, 01/15/2053 (B) 1,274 1,272
SMB Private Education Loan Trust, Ser 2021-D, Cl A1A
1.340%, 03/17/2053 (B) 3,269 3,217SMB Private Education Loan Trust,
Ser 2021-E, Cl A1A1.680%, 02/15/2051 (B) 1,628 1,614

SEI Institutional Managed Trust / Quarterly Report / December 31, 202148
SCHEDULE OF INVESTMENTS (Unaudited)December 31, 2021
Core Fixed Income Fund (Continued)
SCHEDULE OF INVESTMENTS (Unaudited)December 31, 2021
Core Fixed Income Fund (Continued)
DescriptionFace Amount (Thousands)
Market Value ($ Thousands)
ASSET-BACKED SECURITIES (continued)SoFi Consumer Loan Program Trust,
Ser 2019-4, Cl A2.450%, 08/25/2028 (B) $ 76 $ 76
SoFi Professional Loan Program Trust, Ser 2020-C, Cl AFX
1.950%, 02/15/2046 (B) 485 488SoFi Professional Loan Program Trust,
Ser 2021-A, Cl AFX1.030%, 08/17/2043 (B) 953 940
SoFi Professional Loan Program Trust, Ser 2021-B, Cl AFX
1.140%, 02/15/2047 (B) 935 918SoFi Professional Loan Program, Ser 2016-
D, Cl A11.053%, VAR ICE LIBOR USD 1 Month
+ 0.950%, 01/25/2039 (B) 32 32SoFi Professional Loan Program, Ser 2016-
E, Cl A10.953%, VAR ICE LIBOR USD 1 Month
+ 0.850%, 07/25/2039 (B) 34 34SoFi Professional Loan Program, Ser 2017-
A, Cl A10.803%, VAR ICE LIBOR USD 1 Month
+ 0.700%, 03/26/2040 (B) 39 39SoFi Professional Loan Program, Ser 2017-
E, Cl A10.603%, VAR ICE LIBOR USD 1 Month
+ 0.500%, 11/26/2040 (B) 14 14SoFi Professional Loan Program, Ser 2018-
A, Cl A2B2.950%, 02/25/2042 (B) 227 230
South Carolina Student Loan, Ser 2015-A, Cl A
1.602%, VAR ICE LIBOR USD 1 Month + 1.500%, 01/25/2036 1,205 1,213
Southwick Park CLO, Ser 2021-4A, Cl A1R1.186%, 07/20/2032 (B)(E) 2,610 2,614
Stack Infrastructure Issuer, Ser 2020-1A, Cl A2
1.893%, 08/25/2045 (B) 1,355 1,331Starwood Mortgage Residential Trust,
Ser 2021-4, Cl A11.162%, 08/25/2056 (B)(E) 953 945
Structured Asset Investment Loan Trust, Ser 2004-8, Cl A2
0.652%, VAR ICE LIBOR USD 1 Month + 0.550%, 09/25/2034 400 392
Structured Asset Securities Mortgage Loan Trust, Ser 2007-WF1, Cl A1
0.522%, VAR ICE LIBOR USD 1 Month + 0.420%, 02/25/2037 3,318 3,277
DescriptionFace Amount (Thousands)
Market Value ($ Thousands)
ASSET-BACKED SECURITIES (continued)Structured Asset Securities Mortgage
Pass-Through Certificates, Ser 2002-AL1, Cl A2
3.450%, 02/25/2032 $ 7 $ 7STWD, Ser 2019-FL1, Cl A
1.245%, VAR SOFR30A + 1.194%, 07/15/2038 (B) 445 445
Sunrun Vulcan Issuer, Ser 2021-1A, Cl A2.460%, 01/30/2052 (B) 712 704
Symphony CLO XXVI, Ser 2021-26A, Cl AR1.212%, VAR ICE LIBOR USD 3 Month
+ 1.080%, 04/20/2033 (B) 1,140 1,140TCI-Flatiron CLO, Ser 2021-1A, Cl AR2
1.272%, VAR ICE LIBOR USD 3 Month + 1.150%, 01/17/2032 (B) 1,500 1,500
Towd Point Mortgage Trust, Ser 2017-4, Cl A1
2.750%, 06/25/2057 (B)(E) 950 966Towd Point Mortgage Trust, Ser 2017-5,
Cl A10.692%, VAR ICE LIBOR USD 1 Month
+ 0.600%, 02/25/2057 (B) 520 519Towd Point Mortgage Trust, Ser 2017-6,
Cl M13.250%, 10/25/2057 (B)(E) 1,050 1,084
Towd Point Mortgage Trust, Ser 2019-4, Cl A1
2.900%, 10/25/2059 (B)(E) 992 1,011Towd Point Mortgage Trust, Ser 2019-HY2,
Cl A11.102%, VAR ICE LIBOR USD 1 Month +
1.000%, 05/25/2058 (B) 807 810Towd Point Mortgage Trust, Ser 2019-MH1,
Cl A13.000%, 11/25/2058 (B)(E) 1,010 1,022
Towd Point Mortgage Trust, Ser 2020-3, Cl A1
3.088%, 02/25/2063 (B)(E) 1,276 1,303TPG Real Estate Finance Issuer, Ser 2018-
FL2, Cl A1.239%, VAR ICE LIBOR USD 1 Month
+ 1.130%, 11/15/2037 (B) 2,455 2,455Trestles CLO IV, Ser 2021-4A, Cl B1
1.824%, VAR ICE LIBOR USD 3 Month + 1.700%, 07/21/2034 (B) 3,445 3,443
Trinity Rail Leasing, Ser 2020-2A, Cl A22.560%, 11/19/2050 (B) 955 968
Triton Container Finance VIII, Ser 2020-1A, Cl A
2.110%, 09/20/2045 (B) 374 370TRTX Issuer, Ser 2019-FL3, Cl A
1.315%, VAR SOFR30A + 1.264%, 10/15/2034 (B) 2,495 2,495

49SEI Institutional Managed Trust / Quarterly Report / December 31, 2021
SCHEDULE OF INVESTMENTS (Unaudited)December 31, 2021
Core Fixed Income Fund (Continued)
DescriptionFace Amount (Thousands)
Market Value ($ Thousands)
ASSET-BACKED SECURITIES (continued)United States Small Business
Administration, Ser 2019-20D, Cl 12.980%, 04/01/2039 $ 188 $ 200
United States Small Business Administration, Ser 2019-25G, Cl 1
2.690%, 07/01/2044 351 367Vantage Data Centers Issuer, Ser 2018-2A,
Cl A24.196%, 11/16/2043 (B) 3,382 3,466
Verizon Master Trust, Ser 2021-1, Cl A0.500%, 05/20/2027 1,602 1,581
Verizon Master Trust, Ser 2021-2, Cl A0.990%, 04/20/2028 2,611 2,598
Verus Securitization Trust, Ser 2021-4, Cl A10.938%, 07/25/2066 (B)(E) 766 751
Verus Securitization Trust, Ser 2021-5, Cl A11.013%, 09/25/2066 (B)(E) 2,762 2,712
Wells Fargo Home Equity Asset-Backed Securities Trust, Ser 2006-2, Cl M2
0.392%, VAR ICE LIBOR USD 1 Month + 0.290%, 07/25/2036 6,442 6,351
Z Capital Credit Partners CLO, Ser 2021-1A, Cl A1R
1.632%, VAR ICE LIBOR USD 3 Month + 1.510%, 07/16/2031 (B) 1,000 1,000
ZH Trust, Ser 2021-2, Cl A2.349%, 10/17/2027 (B) 600 595
303,497
Total Asset-Backed Securities
(Cost $353,266) ($ Thousands) 355,462
SOVEREIGN DEBT — 2.3%
Abu Dhabi Government International Bond3.875%, 04/16/2050(B) 2,170 2,5283.000%, 09/15/2051(B) 223 2232.500%, 10/11/2022(B) 1,010 1,025
Argentine Republic Government International Bond
2.500%, 3.500%, 07/09/2022, 07/09/2041 (F) 1,460 515
1.125%, 1.500%, 07/09/2022, 07/09/2035 (F) 2,557 818
1.000%, 07/09/2029 203 730.500%, 0.750%, 07/09/2023,
07/09/2030 (F) 1,216 426Brazil Notas do Tesouro Nacional, Ser F
10.000%, 01/01/2023 BRL 3,994 70610.000%, 01/01/2025 20,585 3,63610.000%, 01/01/2027 7,601 1,33210.000%, 01/01/2031 28,484 4,893
DescriptionFace Amount (Thousands)
Market Value ($ Thousands)
SOVEREIGN DEBT (continued)Brazilian Government International Bond
5.625%, 01/07/2041 $ 1,120 $ 1,1425.000%, 01/27/2045 3,400 3,1864.625%, 01/13/2028(D) 2,890 3,0162.625%, 01/05/2023 200 204
Buenos Aires Government International Bond MTN
3.900%, 09/01/2037(B) 859 365China Government Bond
3.390%, 05/21/2025 CNY 2,000 3213.310%, 11/30/2025 11,500 1,847
Colombia Government International Bond5.625%, 02/26/2044 $ 660 6395.200%, 05/15/2049 941 8635.000%, 06/15/2045 830 7494.125%, 02/22/2042 680 5683.250%, 04/22/2032 870 782
Egypt Government International Bond5.577%, 02/21/2023(B) 410 424
Export-Import Bank of India3.375%, 08/05/2026(B) 350 367
Indonesia Government International Bond5.875%, 01/15/2024(B) 840 9205.250%, 01/08/2047(B) 400 5135.125%, 01/15/2045(B) 400 4974.350%, 01/11/2048 460 5263.850%, 07/18/2027(B) 800 8753.750%, 04/25/2022(B) 740 7473.700%, 10/30/2049 1,550 1,6393.500%, 01/11/2028 400 431
Indonesia Treasury Bond6.500%, 02/15/2031 IDR 100,717,000 7,1316.375%, 04/15/2032 58,803,000 4,155
Israel Government International Bond3.375%, 01/15/2050 $ 280 3022.750%, 07/03/2030 470 500
Japan Bank for International Cooperation1.750%, 10/17/2024 950 967
Kenya Government International Bond7.250%, 02/28/2028(B) 200 2156.875%, 06/24/2024 200 2116.300%, 01/23/2034(B) 960 941
Kuwait International Government Bond3.500%, 03/20/2027(B) 930 1,013
Mexico Government International Bond6.050%, 01/11/2040 1,210 1,5034.750%, 03/08/2044 10,476 11,4064.500%, 04/22/2029 1,116 1,2424.280%, 08/14/2041 1,349 1,3983.750%, 01/11/2028 390 4192.659%, 05/24/2031 4,870 4,748

SEI Institutional Managed Trust / Quarterly Report / December 31, 202150
SCHEDULE OF INVESTMENTS (Unaudited)December 31, 2021
Core Fixed Income Fund (Continued)
SCHEDULE OF INVESTMENTS (Unaudited)December 31, 2021
Core Fixed Income Fund (Continued)
DescriptionFace Amount (Thousands)
Market Value ($ Thousands)
SOVEREIGN DEBT (continued)Nigeria Government International Bond
7.143%, 02/23/2030(B) $ 240 $ 2366.500%, 11/28/2027(B) 220 219
Panama Government International Bond4.500%, 04/01/2056 540 5952.252%, 09/29/2032 620 588
Paraguay Government International Bond5.400%, 03/30/2050(B) 664 7584.950%, 04/28/2031(B) 234 262
Peruvian Government International Bond5.625%, 11/18/2050 600 8433.600%, 01/15/2072 715 6973.000%, 01/15/2034 1,136 1,1312.783%, 01/23/2031 2,078 2,0682.392%, 01/23/2026 675 685
Province of Quebec Canada2.625%, 02/13/2023 620 634
Qatar Government International Bond4.817%, 03/14/2049(B) 1,640 2,1504.000%, 03/14/2029(B) 880 9913.875%, 04/23/2023 430 4473.250%, 06/02/2026 200 213
Republic of Italy Government International Bond
3.875%, 05/06/2051 1,020 1,089Republic of Poland Government
International Bond5.000%, 03/23/2022 100 1014.000%, 01/22/2024 1,327 1,403
Russian Federal Bond - OFZ8.150%, 02/03/2027 RUB 315,940 4,1927.700%, 03/16/2039 162,070 2,0557.650%, 04/10/2030 63,630 8197.250%, 05/10/2034 24,200 2997.000%, 01/25/2023 34,160 4507.000%, 08/16/2023 231,430 3,0306.900%, 05/23/2029 452,100 5,577
Russian Foreign Bond - Eurobond7.500%, 03/31/2030 $ 388 4385.625%, 04/04/2042 2,000 2,6044.875%, 09/16/2023 200 211
Saudi Government International Bond MTN2.875%, 03/04/2023(B) 360 369
Total Sovereign Debt (Cost $109,398) ($ Thousands) 108,101
LOAN PARTICIPATIONS — 1.5%Air Canada, Term Loan, 1st Lien
4.250%, 08/11/2028 420 418Ali Group
0.000%, 10/13/2028 (G) 930 924
DescriptionFace Amount (Thousands)
Market Value ($ Thousands)
LOAN PARTICIPATIONS (continued)Allied Universal Holdco LLC (f/k/a USAGM
Holdco, LLC), Initial U.S. Dollar Term Loan, 1st Lien
4.250%, VAR LIBOR + 3.750%, 05/12/2028 $ 1,261 $ 1,256
Alterra Moutain Company, Series B-2 Term Loan, 1st Lien
4.000%, 08/17/2028 565 564AMWINS Group Inc.
3.000%, 02/19/2028 447 443APi Group DE, Inc., Initial Term Loan, 1st
Lien2.601%, VAR LIBOR + 2.500%,
10/01/2026 858 857Aramark Intermediate HoldCo Corp., Term
Loan B, 1st Lien1.851%, VAR LIBOR + 1.750%,
03/11/2025 274 270AsplundhTree Expert, LLC
1.854%, 09/07/2027 416 414Asurion, LLC, New B-7 Term Loan, 1st Lien
3.104%, VAR LIBOR + 3.000%, 11/03/2024 565 562
Asurion, LLC, New B-8 Term Loan, 1st Lien3.354%, VAR LIBOR + 3.250%,
12/23/2026 331 328Asurion, LLC, New B-9 Term Loan, 1st Lien
3.354%, VAR LIBOR + 3.250%, 07/31/2027 378 376
athenahealth, Inc., Term B-1 Loan, 1st Lien4.333%, VAR LIBOR + 4.250%,
02/11/2026 4 4Athenahealth, Inc., Term B-1 Loan, 1st Liena
4.400%, VAR LIBOR + 4.250%, 02/11/2026 1,702 1,700
Avolon TLB Borrower 1 LLC2.750%, 12/01/2027 278 278
B.C. ULC1.854%, VAR LIBOR + 1.750%,
11/19/2026 1,447 1,425Bausch Health Companies Inc., Initial Term
Loan, 1st Lien3.104%, VAR LIBOR + 3.000%,
06/02/2025 (G) 200 199Berry Global, Inc.
1.864%, 07/01/2026 678 673Brightview Landscapes LLC, Initial Term
Loan, 1st Lien2.625%, 08/15/2025 155 154
Brookfeild WEC Holdings3.250%, 08/01/2025 (E) 228 226
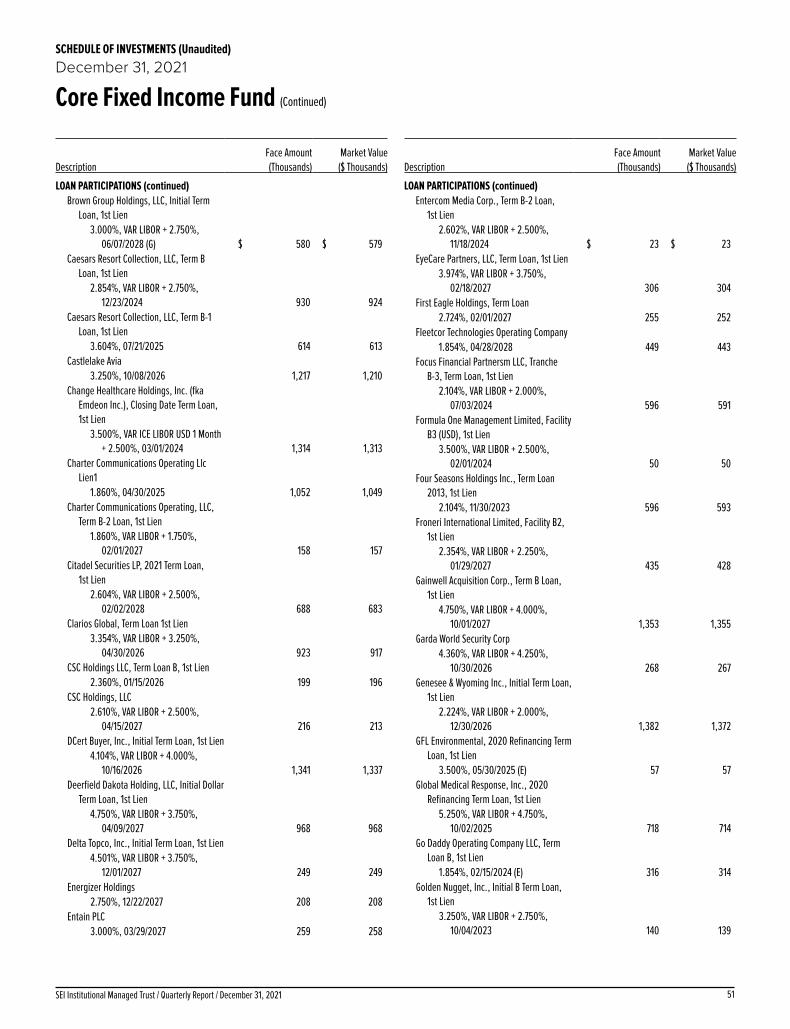
51SEI Institutional Managed Trust / Quarterly Report / December 31, 2021
SCHEDULE OF INVESTMENTS (Unaudited)December 31, 2021
Core Fixed Income Fund (Continued)
DescriptionFace Amount (Thousands)
Market Value ($ Thousands)
LOAN PARTICIPATIONS (continued)Brown Group Holdings, LLC, Initial Term
Loan, 1st Lien3.000%, VAR LIBOR + 2.750%,
06/07/2028 (G) $ 580 $ 579Caesars Resort Collection, LLC, Term B
Loan, 1st Lien2.854%, VAR LIBOR + 2.750%,
12/23/2024 930 924Caesars Resort Collection, LLC, Term B-1
Loan, 1st Lien3.604%, 07/21/2025 614 613
Castlelake Avia3.250%, 10/08/2026 1,217 1,210
Change Healthcare Holdings, Inc. (fka Emdeon Inc.), Closing Date Term Loan, 1st Lien
3.500%, VAR ICE LIBOR USD 1 Month + 2.500%, 03/01/2024 1,314 1,313
Charter Communications Operating Llc Lien1
1.860%, 04/30/2025 1,052 1,049Charter Communications Operating, LLC,
Term B-2 Loan, 1st Lien1.860%, VAR LIBOR + 1.750%,
02/01/2027 158 157Citadel Securities LP, 2021 Term Loan,
1st Lien2.604%, VAR LIBOR + 2.500%,
02/02/2028 688 683Clarios Global, Term Loan 1st Lien
3.354%, VAR LIBOR + 3.250%, 04/30/2026 923 917
CSC Holdings LLC, Term Loan B, 1st Lien2.360%, 01/15/2026 199 196
CSC Holdings, LLC2.610%, VAR LIBOR + 2.500%,
04/15/2027 216 213DCert Buyer, Inc., Initial Term Loan, 1st Lien
4.104%, VAR LIBOR + 4.000%, 10/16/2026 1,341 1,337
Deerfield Dakota Holding, LLC, Initial Dollar Term Loan, 1st Lien
4.750%, VAR LIBOR + 3.750%, 04/09/2027 968 968
Delta Topco, Inc., Initial Term Loan, 1st Lien4.501%, VAR LIBOR + 3.750%,
12/01/2027 249 249Energizer Holdings
2.750%, 12/22/2027 208 208Entain PLC
3.000%, 03/29/2027 259 258
DescriptionFace Amount (Thousands)
Market Value ($ Thousands)
LOAN PARTICIPATIONS (continued)Entercom Media Corp., Term B-2 Loan,
1st Lien2.602%, VAR LIBOR + 2.500%,
11/18/2024 $ 23 $ 23EyeCare Partners, LLC, Term Loan, 1st Lien
3.974%, VAR LIBOR + 3.750%, 02/18/2027 306 304
First Eagle Holdings, Term Loan2.724%, 02/01/2027 255 252
Fleetcor Technologies Operating Company1.854%, 04/28/2028 449 443
Focus Financial Partnersm LLC, Tranche B-3, Term Loan, 1st Lien
2.104%, VAR LIBOR + 2.000%, 07/03/2024 596 591
Formula One Management Limited, Facility B3 (USD), 1st Lien
3.500%, VAR LIBOR + 2.500%, 02/01/2024 50 50
Four Seasons Holdings Inc., Term Loan 2013, 1st Lien
2.104%, 11/30/2023 596 593Froneri International Limited, Facility B2,
1st Lien2.354%, VAR LIBOR + 2.250%,
01/29/2027 435 428Gainwell Acquisition Corp., Term B Loan,
1st Lien4.750%, VAR LIBOR + 4.000%,
10/01/2027 1,353 1,355Garda World Security Corp
4.360%, VAR LIBOR + 4.250%, 10/30/2026 268 267
Genesee & Wyoming Inc., Initial Term Loan, 1st Lien
2.224%, VAR LIBOR + 2.000%, 12/30/2026 1,382 1,372
GFL Environmental, 2020 Refinancing Term Loan, 1st Lien
3.500%, 05/30/2025 (E) 57 57Global Medical Response, Inc., 2020
Refinancing Term Loan, 1st Lien5.250%, VAR LIBOR + 4.750%,
10/02/2025 718 714Go Daddy Operating Company LLC, Term
Loan B, 1st Lien1.854%, 02/15/2024 (E) 316 314
Golden Nugget, Inc., Initial B Term Loan, 1st Lien
3.250%, VAR LIBOR + 2.750%, 10/04/2023 140 139

SEI Institutional Managed Trust / Quarterly Report / December 31, 202152
SCHEDULE OF INVESTMENTS (Unaudited)December 31, 2021
Core Fixed Income Fund (Continued)
SCHEDULE OF INVESTMENTS (Unaudited)December 31, 2021
Core Fixed Income Fund (Continued)
DescriptionFace Amount (Thousands)
Market Value ($ Thousands)
LOAN PARTICIPATIONS (continued)Great Outdoors Group, LLC, Term B-2 Loan,
1st Lien4.500%, 03/05/2028 $ 308 $ 308
Grifols Worldwide Operations Limited, Dollar Tranche B Term Loan, 1st Lien
2.104%, VAR LIBOR + 2.000%, 11/15/2027 1,279 1,259
Harbor Freight Tools USA, Inc3.250%, 10/19/2027 792 790
Hilton Worldwide Finance LLC, Refinanced Series B-2 Term Loan, 1st Lien
1.852%, VAR LIBOR + 1.750%, 06/22/2026 1,348 1,336
Horizon Therapeudics2.250%, 03/15/2028 1,035 1,030
Hudson River Trading LLC, Term Loan, 1st Lien
3.104%, VAR LIBOR + 3.000%, 03/20/2028 448 444
Icon Public Limited Company, Lux Term Loan, 1st Lien
2.750%, 07/03/2028 862 862Icon Public Limited Company, U.S. Term
Loan, 1st Lien2.750%, 07/03/2028 215 215
iHeartCommunications, Inc. (fka Clear Channel Communications, Inc.), New Term Loan, 1st Lien
3.104%, VAR LIBOR + 3.000%, 05/01/2026 802 796
II-VI Incorporated0.000%, 12/15/2029 (G) 760 758
INEOS Styrolution Group GmbH, 2026 Tranche B Dollar Term Loan, 1st Lien
3.250%, VAR LIBOR + 2.750%, 01/29/2026 489 487
Jane Street Group, LLC, Dollar Term Loan, 1st Lien
2.854%, VAR LIBOR + 2.750%, 01/26/2028 526 522
Jazz Pharmaceuticals Public Limited Company, Initial Dollar Term Loan, 1st Lien
4.000%, VAR LIBOR + 3.500%, 05/05/2028 1,157 1,161
Level 3 Financing, Inc., Tranche B 2027 Term Loan, 1st Lien
1.854%, VAR LIBOR + 1.750%, 03/01/2027 1,162 1,146
Magenta Buyer LLC, Initial Term Loan, 1st Lien
5.750%, VAR LIBOR + 5.000%, 07/27/2028 1,520 1,515
DescriptionFace Amount (Thousands)
Market Value ($ Thousands)
LOAN PARTICIPATIONS (continued)Michaels Companies, Inc. The, Term B
Loan, 1st Lien5.000%, VAR LIBOR + 4.250%,
04/15/2028 $ 617 $ 610Micro Focus, MA FinanceCo
2.854%, 06/21/2024 (E) 11 11Mozart Debt Merger, Term Loan, 1st Lien
3.750%, 09/30/2028 (H) 1,010 1,010Nexstar Broadcasting, Inc., Term B-4 Loan,
1st Lien2.599%, 09/18/2026 1,454 1,450
Numericable U.S. LLC, Term Loan B, 1st Lien3.814%, 01/31/2026 213 211
Parexel International, Term Loan, 1st Lien4.000%, 08/11/2028 470 470
PCI Gaming Authority, Term B Facility Loan2.604%, 05/29/2026 453 451
Peraton Corp., Term B Loan, 1st Lien4.500%, VAR LIBOR + 3.750%,
02/01/2028 1,164 1,164Petco Health and Wellness Company, Inc.,
Initial Term Loan, 1st Lien4.000%, VAR LIBOR + 3.250%,
03/03/2028 (G) 607 605Phoenix Guarantor Inc., Tranche B-1 Term
Loan, 1st Lien3.354%, VAR LIBOR + 3.250%,
03/05/2026 1,298 1,289Pilot Travel Centers, LLC, Initial Tranche B
Term Loan2.104%, 08/04/2028 1,840 1,827
Prime Security Services Borrower, LLC, 2021 Refinancing Term B-1 Loan, 1st Lien
3.500%, VAR LIBOR + 2.750%, 09/23/2026 965 964
Project Sky, Term Loan, 1st Lien4.250%, 10/08/2028 340 339
Quikrete Holding, Term Loan B1, 1st Lien0.000%, 02/21/2028 (G) 460 459
Rackspace Technology Global, Inc., 2021 Term B Loan, 1st Lien
3.500%, 02/15/2028 642 637Realpage Inc.
3.750%, 04/24/2028 1,050 1,046Regionalcare Hospital Partners Holdings,
Inc., Term B Loan, 1st Lien3.852%, VAR LIBOR + 3.750%,
11/16/2025 688 687Reynolds Consumer Products LLC, Initial
Term Loan, 1st Lien1.854%, VAR LIBOR + 1.750%,
02/04/2027 1,205 1,197

53SEI Institutional Managed Trust / Quarterly Report / December 31, 2021
SCHEDULE OF INVESTMENTS (Unaudited)December 31, 2021
Core Fixed Income Fund (Continued)
DescriptionFace Amount (Thousands)
Market Value ($ Thousands)
LOAN PARTICIPATIONS (continued)Scientific Games International, Inc., Initial
Term B-5 Loan, 1st Lien2.854%, VAR LIBOR + 2.750%,
08/14/2024 $ 1,423 $ 1,417Seattle SpinCo, Inc., Initial Term Loan,
1st Lien2.854%, VAR LIBOR + 2.500%,
06/21/2024 77 77Setanta Aircraft
2.140%, 11/02/2028 1,060 1,059Sotera Health Holdings, LLC, Refinancing
Loan, 1st Lien3.250%, 12/11/2026 (E) 1,380 1,374
Station Casinos LLC, Term B-1 Facility Term Loan, 1st Lien
2.500%, 02/08/2027 676 670Terrier Media Buyer, Inc., 2021 Term B
Loan, 1st Lien3.604%, VAR LIBOR + 3.500%,
12/17/2026 678 674TransDigm Inc., Tranche F Refinancing Term
Loan, 1st Lien2.354%, 12/09/2025 60 59
Triton Water Holdings, Inc., Initial Term Loan
0.069%, 03/31/2028 73 72Triton Water Holdings, Inc., Initial Term
Loan, 1st Lien4.000%, VAR LIBOR + 3.500%,
03/31/2028 745 736UFC Holdings, Term Loan, 1st Lien
3.500%, 04/29/2026 906 901United AirLines, Inc., Class B Term Loan,
1st Lien4.500%, VAR LIBOR + 3.750%,
04/21/2028 826 827Univision Communications, Inc.,
Replacement Converted Term Loan, 1st Lien
4.000%, 03/15/2026 1,042 1,043US Foods, Inc., Term Loan
2.104%, 09/13/2026 (E) 87 86Verscend Holding Corp., Term B-1 Loan,
1st Lien4.104%, VAR LIBOR + 4.000%,
08/27/2025 736 736VFH Parent LLC, Initial Term Loan, 1st Lien
3.102%, VAR LIBOR + 3.000%, 03/01/2026 117 116
Virgin Media Bristol LLC, N Facility, 1st Lien2.610%, VAR LIBOR + 2.500%,
01/31/2028 1,377 1,363
DescriptionFace Amount (Thousands)
Market Value ($ Thousands)
LOAN PARTICIPATIONS (continued)Whatabrands LLC, Initial Term B Loan, 1st
Lien3.750%, 08/03/2028 $ 10 $ 10
XPO Logistics, Inc., Term Loan B, 1st Lien1.853%, 02/24/2025 (E) 550 547
Zayo Group Holdings, Inc., Initial Dollar Term Loan, 1st Lien
3.104%, VAR LIBOR + 3.000%, 03/09/2027 630 621
Zebra Buyer LLC3.750%, 04/21/2028 451 452
Total Loan Participations
(Cost $68,919) ($ Thousands) 68,743
U.S. GOVERNMENT AGENCY OBLIGATIONS — 0.6%FHLB
1.040%, 06/14/2024 13,660 13,664FHLMC
1.736%, 09/15/2029(A) 1,934 1,712FHLMC MTN
1.733%, 12/14/2029(A) 1,213 1,063FNMA
1.823%, 11/15/2030(A) 3,564 3,0530.500%, 06/17/2025 4,215 4,131
Resolution Funding Interest1.345%, 01/15/2030(A) 905 789
Resolution Funding Principal1.326%, 04/15/2030(A) 1,165 1,007
Tennessee Valley Authority0.750%, 05/15/2025 1,055 1,040
Total U.S. Government Agency Obligations
(Cost $26,561) ($ Thousands) 26,459
MUNICIPAL BONDS — 0.3%California — 0.0%
California State University, Ser B, RB Callable 11/01/2031 @ 100
2.374%, 11/01/2035 685 663University of California, Ser N, RB
Callable 11/15/2059 @ 100 3.256%, 05/15/2060 790 850
1,513

SEI Institutional Managed Trust / Quarterly Report / December 31, 202154
SCHEDULE OF INVESTMENTS (Unaudited)December 31, 2021
Core Fixed Income Fund (Continued)
SCHEDULE OF INVESTMENTS (Unaudited)December 31, 2021
Core Fixed Income Fund (Continued)
DescriptionFace Amount (Thousands)
Market Value ($ Thousands)
MUNICIPAL BONDS (continued)Georgia — 0.1%
Georgia State, Municipal Electric Authority, RB
7.055%, 04/01/2057 $ 1,064 $ 1,579
Nevada — 0.1%Clark County, Department of Aviation,
Ser C, RB 6.820%, 07/01/2045 728 1,143
New York — 0.1%Metropolitan New York, Transportation
Authority, Ser C2, RB 5.175%, 11/15/2049 (D) 260 356
New York and New Jersey, Port Authority, RB
4.458%, 10/01/2062 505 669New York City, Ser D, GO
2.223%, 08/01/2035 1,350 1,2791.823%, 08/01/2030 610 598
New York City, Transitional Finance Authority Future Tax Secured Revenue, Sub-Ser B-3, RB Callable 08/01/2030 @ 100
2.000%, 08/01/2035 1,000 935New York City, Transitional Finance
Authority Future Tax Secured Revenue, Sub-Ser D-3, RB Callable 11/01/2030 @ 100
2.400%, 11/01/2032 610 609New York City, Transitional Finance
Authority, Future Tax Secured Revenue, Sub-Ser, RB
5.508%, 08/01/2037 275 361New York State, Dormitory Authority, RB
5.289%, 03/15/2033 850 1,022
5,829
Ohio — 0.0%Ohio State University, Ser A, RB
4.800%, 06/01/2111 433 655
Texas — 0.0%North Texas, Tollway Authority, Ser B, RB
6.718%, 01/01/2049 632 1,068University of Texas, Ser B, RB
Callable 02/15/2049 @ 100 2.439%, 08/15/2049 295 292
1,360
DescriptionFace Amount (Thousands)
Market Value ($ Thousands)
MUNICIPAL BONDS (continued)Virginia — 0.0%
University of Virginia, RB Callable 03/01/2050 @ 100
2.256%, 09/01/2050 $ 480 $ 454
Total Municipal Bonds(Cost $11,114) ($ Thousands) 12,533
Shares
AFFILIATED PARTNERSHIP — 2.3%SEI Liquidity Fund, L.P.
0.020% **†(I) 105,049,231 105,073
Total Affiliated Partnership (Cost $105,059) ($ Thousands) 105,073
CASH EQUIVALENT — 3.3%SEI Daily Income Trust, Government
Fund, Cl F0.010%**† 151,230,663 151,231
Total Cash Equivalent(Cost $151,231) ($ Thousands) 151,231
Total Investments in Securities — 111.5%(Cost $5,107,224) ($ Thousands) $ 5,147,153
ContractsPURCHASED OPTIONS* — 0.0%Total Purchased Options (J)
(Cost $933) ($ Thousands) 2,907 $ 728
PURCHASED SWAPTION* — 0.0% Total Purchased Swaption (K)
(Cost $154) ($ Thousands) 5,220,000 $ 129
WRITTEN OPTIONS* — (0.0)%Total Written Options (J)
(Premiums Received $1,921) ($ Thousands) (4,837) $ (1,573)

55SEI Institutional Managed Trust / Quarterly Report / December 31, 2021
SCHEDULE OF INVESTMENTS (Unaudited)December 31, 2021
Core Fixed Income Fund (Continued)
A list of the exchange traded option contracts held by the Fund at December 31, 2021, is as follows:
Description Number of ContractsNotional Amount
(Thousands)†† Exercise Price Expiration DateValue
(Thousands)
PURCHASED OPTIONS — 0.0%
Put OptionsJune 2022, IMM Eurodollar Future Option* 323 $ 73 $99.50 6/18/2022 $ 137March 2022, IMM Eurodollar Future Option* 415 38 99.63 3/19/2022 49January 2022, U.S. 10 Year Future Option* 155 70 130.50 1/22/2022 61December 2021, U.S. 10 Year Future Option* 377 95 130.25 1/22/2022 –December 2021, U.S. 10 Year Future Option* 207 46 131.00 1/22/2022 110
– –
322 357 – – – –
– – – –
Call OptionsSeptember 2022, Eurodollar Mid-Curve Option* 820 515 98.75 9/17/2022 369March 2022, IMM Eurodollar Future Option* 145 2 99.88 3/19/2022 2December 2021, U.S. 10 Year Future Option* 465 94 132.00 1/22/2022 –
– –
611 371 – – – –
– – – –
Total Purchased Options $ 933 $ 728WRITTEN OPTIONS — (0.0)%
Put OptionsSeptember 2022, Eurodollar Mid-Curve Option* (820) $ (207) 97.88 09/17/22 $ (210)September 2022, Eurodollar Mid-Curve Option* (390) (335) 98.25 09/17/22 (266)June 2022, IMM Eurodollar Future Option* (323) (20) 99.00 06/18/22 (20)June 2023, IMM Eurodollar Future Option* (310) (61) 97.00 06/17/23 (48)March 2022, IMM Eurodollar Future Option* (342) (18) 99.38 03/19/22 (4)March 2022, IMM Eurodollar Future Option* (145) (29) 99.75 03/19/22 (43)February 2022, U.S. 10 Year Future Option* (155) (123) 131.50 01/22/22 (189)March 2022, U.S. 10 Year Future Option* (257) (127) 129.00 02/19/22 (104)
– – – –
(920) (884)
Call OptionsSeptember 2022, Eurodollar Mid-Curve Option* (820) (271) 99.00 09/17/22 (205)September 2022, Eurodollar Mid-Curve Option* (390) (316) 98.25 09/17/22 (339)March 2022, IMM Eurodollar Future Option* (145) (25) 99.75 03/19/22 (8)February 2022, U.S. 10 Year Future Option* (155) (98) 131.50 01/22/22 (29)March 2022, U.S. 10 Year Future Option* (140) (40) 133.50 02/19/22 (13)February 2022, U.S. 5 Year Future Option* (121) (35) 121.25 01/22/22 (28)February 2022, U.S. 5 Year Future Option* (124) (31) 121.50 01/22/22 (19)March 2022, U.S. Bond Future Option* (200) (184) 169.00 02/19/22 (47)
– – – –
(1,000) (688)
Total Written Options $ (1,920) $ (1,572)
†† Represents cost.
A list of open OTC swaptions held by the Fund at December 31, 2021, is as follows:
Description CounterpartyNumber of Contracts/
Notional Amount Exercise Price Expiration DateValue
(Thousands)
PURCHASED SWAPTION — 0.0%
Put SwaptionsSwaption 30 Year* Bank of America Merrill Lynch 5,220,000 $2.75 01/20/2024 $ 129

SEI Institutional Managed Trust / Quarterly Report / December 31, 202156
SCHEDULE OF INVESTMENTS (Unaudited)December 31, 2021
Core Fixed Income Fund (Continued)
SCHEDULE OF INVESTMENTS (Unaudited)December 31, 2021
Core Fixed Income Fund (Continued)
A list of the open futures contracts held by the Fund at December 31, 2021, is as follows:
Type of ContractNumber of Contracts
Expiration Date
Notional Amount (Thousands) Value (Thousands)
Unrealized Appreciation/ (Depreciation) (Thousands)
Long Contracts90-Day Euro$ 240 Jun-2023 $ 59,545 $ 59,178 $ (367)90-Day Euro$ 1,066 Dec-2022 264,355 263,715 (640)90-Day Euro$ 1,449 Dec-2023 358,206 356,490 (1,716)Euro-OAT 71 Mar-2022 13,267 13,173 (230)U.S. 5-Year Treasury Note 3,789 Apr-2022 457,605 458,380 775U.S. 10-Year Treasury Note 213 Mar-2022 27,707 27,790 83U.S. Long Treasury Bond 584 Mar-2022 92,564 93,696 1,132U.S. Ultra Long Treasury Bond 297 Mar-2022 57,661 58,546 885
1,330,910 1,330,968 (78)Short Contracts
90-Day Euro$ (231) Mar-2022 $ (57,600) $ (57,551) $ 49Euro-Bund (226) Mar-2022 (44,244) (44,043) 563Euro-Buxl (5) Mar-2022 (1,199) (1,176) 34U.S. 2-Year Treasury Note (352) Apr-2022 (76,879) (76,796) 83U.S. 10-Year Treasury Note (2,227) Mar-2022 (289,968) (290,554) (586)U.S. Long Treasury Bond (46) Mar-2022 (7,371) (7,380) (9)Ultra 10-Year U.S. Treasury Note (397) Mar-2022 (57,339) (58,136) (797)
(534,600) (535,636) (663) $ 796,310 $ 795,332 $ (741)
A list of the open forward foreign currency contracts held by the Fund at December 31, 2021 is as follows:
Counterparty Settlement DateCurrency to Deliver
(Thousands)Currency to Receive
(Thousands)
Unrealized Appreciation
(Depreciation) (Thousands)
BNP Paribas 01/18/22 USD 267 BRL 1,521 $ 5
BNP Paribas 01/18/22 EUR 26,550 USD 30,822 620
BNP Paribas 01/18/22 COP 5,189,635 USD 1,361 87
Citigroup 01/18/22 USD 451 BRL 2,574 9
Citigroup 01/18/22 EUR 220 USD 255 5
Citigroup 01/18/22 EUR 250 USD 282 (2)
Citigroup 01/18/22 USD 13,617 AUD 18,672 (42)
Citigroup 01/18/22 USD 14,998 IDR 216,529,634 202
Citigroup 01/18/22 USD 15,267 EUR 13,162 (295)
Citigroup 01/18/22 USD 21,902 CAD 27,510 (121)
Citigroup 01/18/22 IDR 123,288,306 USD 8,543 (112)
Goldman Sachs 01/18/22 USD 2,392 GBP 1,753 (18)
Goldman Sachs 01/18/22 USD 12,537 RUB 928,573 (165)
Goldman Sachs 01/18/22 CNH 14,971 USD 2,294 (58)
Goldman Sachs 01/18/22 RUB 146,710 USD 2,043 88
Morgan Stanley 01/18/22 USD 4,085 BRL 22,659 (35)
Morgan Stanley 01/18/22 USD 13,198 JPY 1,498,110 (185)
Morgan Stanley 01/18/22 USD 16,378 CAD 20,561 (99) $ (116)

57SEI Institutional Managed Trust / Quarterly Report / December 31, 2021
SCHEDULE OF INVESTMENTS (Unaudited)December 31, 2021
Core Fixed Income Fund (Continued)
A list of open centrally cleared swap agreements held by the Fund at December 31, 2021, is as follows:
Interest Rate Swaps
Fund Pays Fund ReceivesPayment
Frequency Termination Date Currency
Notional Amount
(Thousands)Value
(Thousands)
Upfront Payments/
Receipts (Thousands)
Net Unrealized Appreciation
(Depreciation) (Thousands)
0.19% USD LIBOR BBA Semi-Annual 06/15/2022 USD 40,784 $ (17) $ – $ (17)1.225% USD-LIBOR-BBA Quarterly 02/15/2047 USD 1,086 117 1 116
1.72875% FIXED CMENA IR 2/15/47 Annual 02/15/2047 USD 3,250 (186) – (186)1.52% FIXED USD-SOFR-COMPOUND 2/15/47 Annual 02/15/2047 USD 5,559 (71) (66) (5)1.63 % FIXED CMENA IR LIBOR 2/15/47 Quarterly 02/15/2047 USD 6,257 139 38 101
USD-LIBOR-BBA 1.6% Quarterly 02/15/2047 USD 2,748 79 15 641.00% USD-LIBOR-BBA Quarterly 02/15/2047 USD 7,073 1,097 71 1,0261.2% USD-LIBOR-BBA Quarterly 02/15/2047 USD 2,162 244 11 233
2.00% USD-LIBOR-BBA Quarterly 02/15/2047 USD 115 (6) 2 (8)2.00% USD-LIBOR-BBA Quarterly 06/03/2051 USD 494 (33) 5 (38)2.05% USD-LIBOR-BBA Quarterly 06/07/2051 USD 1,480 (118) – (118)
1.67125% FIXED CMENA IR 7/9/2051 LIBOR Quarterly 07/09/2051 USD 4,528 50 (20) 701.8075% 3 MONTH USD - LIBOR Quarterly 07/24/2053 USD 1,300 (13) – (13)
3M USD LIBOR 1.7725% Quarterly 07/24/2053 USD 2,600 (5) – (5)3 MONTH USD - LIBOR 1.785% Quarterly 07/24/2053 USD 1,920 (10) – (10)
1.2% US LIBOR BBA Quarterly 10/07/2050 USD 946 116 6 110USD-SOFRRATE 0.74% Annual 08/19/2045 USD 5,670 834 – 834
0.56% USD-SOFRRATE Annual 07/20/2045 USD 8,660 1,585 105 1,480USD CPI INDEX 2.77% Annual 10/20/2031 USD 10,870 (162) 9 (171)
.97% USA-CPI-U Annual 11/18/2023 USD 12,250 (2) (65) 633 MONTH USD - LIBOR .0725% Quarterly 07/24/2025 USD 15,555 (165) – (165)3 MONTH USD - LIBOR .0255% Semi-Annual 07/24/2025 USD 31,110 (359) – (359)3 MONTH USD - LIBOR .0355% Semi-Annual 07/24/2025 USD 23,015 (262) – (262)
3M LIBOR 1.39% FIXED Semi-Annual 09/28/2025 USD 35,750 (172) – (172)3M LIBOR .6875% FIXED Semi-Annual 12/07/2025 USD 39,405 30 – 30
2.95% USD CPI INDEX Annual 10/20/2026 USD 10,870 180 (5) 185.37% SA-CPI-U Annual 11/18/2026 USD 12,250 100 189 (89).52% USD-SOFR-OIS-COMPOUND Annual 11/20/2026 USD 13,910 (60) (32) (28)
0.71 % FIXED USD-SOFR-COMPOUND 5/15/2027 Annual 05/15/2027 USD 37,002 824 – 8241.35% USD-LIBOR-BBA Quarterly 02/15/2028 USD 26,862 111 (73) 1841.113% SOFR- COMPOUNDING Annual 08/15/2028 USD 21,686 86 153 (67)
.22% FIXED SD-SOFR-OIS-COMPOUND Annual 08/15/2028 USD 9,318 (17) (1) (16)1.2% SOFR- COMPOUNDING Annual 11/01/2028 USD 7,156 – – 0
1.7334% USD LIBOR BBA Annual 10/20/2031 USD 10,870 (112) 42 (154)3M LIBOR .87% Quarterly 09/28/2053 USD 3,050 (76) – (76)3M LIBOR .6875% FIXED Quarterly 12/07/2053 USD 3,295 17 – 17
$ 3,763 $ 385 $ 3,378
Credit Default Swaps
Reference Entity/ ObligationBuy/Sell
Protection(Pays)/
Receives RatePayment
Frequency Termination DateNotional Amount
(Thousands)Value
(Thousands)
Upfront Payments/ Receipts
(Thousands)
Net Unrealized Appreciation
(Depreciation) (Thousands)
CDS-CDX.NA.HY.37 Sell 5.00% Quarterly 12/20/2026 (19,560) $ 1,799 $ 1,771 $ 28CDS-CDX.NA.IG.37 Sell 1.00% Quarterly 12/20/2026 (126,786) 3,098 2,872 226
$ 4,897 $ 4,643 $ 254

SEI Institutional Managed Trust / Quarterly Report / December 31, 202158
SCHEDULE OF INVESTMENTS (Unaudited)December 31, 2021
Core Fixed Income Fund (Continued)
SCHEDULE OF INVESTMENTS (Unaudited)December 31, 2021
Core Fixed Income Fund (Continued)
Percentages are based on Net Assets of $4,616,428 ($ Thousands).* Non-income producing security.** The rate reported is the 7-day effective yield as of December 31, 2021.† Investment in Affiliated Security.(A) Zero coupon security. The rate shown on the Schedule of Investments is the
security's effective yield at the time of purchase.(B) Security exempt from registration under Rule 144A of the Securities Act of
1933. These securities may be resold in transactions exempt from registration normally to qualified institutions. On December 31, 2021, the value of these securities amounted to $695,952 ($ Thousands), representing 15.1% of the Net Assets of the Fund.
(C) Perpetual security with no stated maturity date.(D) Certain securities or partial positions of certain securities are on loan at
December 31, 2021. The total market value of securities on loan at December 31, 2021 was $3,649 ($ Thousands).
(E) Variable or floating rate security, the interest rate of which adjusts periodically based on changes in current interest rates and prepayments on the underlying pool of assets.
(F) Step Bonds – Represents the current rate, the step rate, the step date and the final maturity date.
(G) Unsettled bank loan. Interest rate may not be available.(H) Level 3 security in accordance with fair value hierarchy.(I) This security was purchased with cash collateral held from securities on loan.
The total market value of such securities as of December 31, 2021 was $105,073 ($ Thousands).
(J) Refer to table below for details on Options Contracts.(K) Refer to table below for details on Swaption Contracts.
ACES — Alternative Credit Enhancement StructureARM — Adjustable Rate MortgageAUD — Australian DollarBRL — Brazilian RealCAD — Canadian DollarCl — ClassCLO — Collateralized Loan ObligationCMO — Collateralized Mortgage ObligationCNH — Chinese Offshore YuanCNY — Chinese YuanCOP — Colombian PesoDAC — Designated Activity CompanyEUR — EuroFHLB — Federal Home Loan BankFHLMC — Federal Home Loan Mortgage CorporationFNMA — Federal National Mortgage AssociationFREMF — Freddie Mac Multi-FamilyGBP — British Pound SterlingGNMA — Government National Mortgage AssociationGO — General ObligationICE — Intercontinental ExchangeIDR — Indonesian RupiahIO — Interest OnlyJPY — Japanese YenJSC — Joint-Stock CompanyLIBOR — London Interbank Offered RateLLC — Limited Liability CompanyL.P. — Limited PartnershipMTN — Medium Term NotePLC — Public Limited CompanyPO — Principal OnlyRB — Revenue BondRe-REMIC — Resecuritization of Real Estate Mortgage Investment ConduitRUB — Russian RubleSer — SeriesSTRIPS — Separately Traded Registered Interest and Principal SecuritiesTA — Tax AllocationTBA — To Be AnnouncedULC — Unlimited Liability CompanyUSD — United States DollarVAR — Variable Rate

59SEI Institutional Managed Trust / Quarterly Report / December 31, 2021
SCHEDULE OF INVESTMENTS (Unaudited)December 31, 2021
Core Fixed Income Fund (Continued)
The following is a list of the level of inputs used as of December 31, 2021, in valuing the Fund’s investments and other financial instruments carried at value ($ Thousands):
Investments in SecuritiesLevel 1
($)Level 2
($)Level 3
($)(1)Total
($)U.S. Treasury Obligations – 1,605,129 – 1,605,129Corporate Obligations – 1,421,780 – 1,421,780Mortgage-Backed Securities – 1,292,642 – 1,292,642Asset-Backed Securities – 355,462 – 355,462Sovereign Debt – 108,101 – 108,101Loan Participations – 67,733 1,010 68,743U.S. Government Agency Obligations – 26,459 – 26,459Municipal Bonds – 12,533 – 12,533Affiliated Partnership – 105,073 – 105,073Cash Equivalent 151,231 – – 151,231
Total Investments in Securities 151,231 4,994,912 1,010 5,147,153
Other Financial InstrumentsLevel 1
($)Level 2
($)Level 3
($)Total
($)
Purchased Options 728 – – 728 Written Options (1,572 ) – – (1,572 )
Purchased Swaptions – 129 – 129 Futures Contracts*
Unrealized Appreciation 3,604 – – 3,604 Unrealized Depreciation (4,345 ) – – (4,345 )
Forwards Contracts*
Unrealized Appreciation – 1,016 – 1,016 Unrealized Depreciation – (1,132 ) – (1,132 )
Centrally Cleared SwapsInterest Rate Swaps*
Unrealized Appreciation – 5,337 – 5,337 Unrealized Depreciation – (1,959 ) – (1,959 )
Centrally Cleared SwapsCredit Default Swaps*
Unrealized Appreciation – 254 – 254 Total Other Financial Instruments (1,585 ) 3,645 – 2,060 *Futures contracts, forwards contracts and swaps contracts are valued at the unrealized appreciation (depreciation) on the instrument.
(1) A reconciliation of Level 3 investments and disclosures of significant unobservable inputs are presented when the Fund has a significant amount of Level 3 investments at the beginning and/or end of the year in relation to Net Assets. Management has concluded that Level 3 investments are not material in relation to Net Assets.
For the period ended December 31, 2021, there were no transfers in or out of Level 3.
For information regarding the Fund's policy regarding valuation of investments and other significant accounting policies, please refer to the Fund's most recent semi-annual and annual financial statements.
The following is a summary of the transactions with affiliates for the period ended December 31, 2021 ($ Thousands):
Security Description Value 9/30/2021 Purchases at Cost Proceeds from
Sales Realized Gain/
(Loss)
Change in Unrealized
Appreciation/(Depreciation)
Value 12/31/2021 Shares Income Capital Gains
SEI Liquidity Fund, L.P. $ 80,566 $ 406,182 $ (381,671) $ — $ (4) $ 105,073 105,049,231 $ 41 $ — SEI Daily Income Trust, Government Fund, Cl F 222,427 1,216,047 (1,287,243) — — 151,231 151,230,663 6 — Totals $ 302,993 $ 1,622,229 $ (1,668,914) $ — $ (4) $ 256,304 $ 47 $ —
Amounts designated as “-” are $0 or have been rounded to $0.

1SEI Institutional Managed Trust / Quarterly Report / December 31, 2021
SCHEDULE OF INVESTMENTS (Unaudited)December 31, 2021
High Yield Bond Fund
Cy
DescriptionFace Amount (Thousands)
Market Value ($ Thousands)
CORPORATE OBLIGATIONS — 73.6%Communication Services — 9.1%
Altice France 10.500%, 05/15/2027 (A) $ 1,140 $ 1,2268.125%, 02/01/2027 (A) 800 8555.500%, 10/15/2029 (A) 1,357 1,3375.125%, 07/15/2029 (A) 1,002 977
Altice France Holding 6.000%, 02/15/2028 (A) 1,756 1,677
AMC Entertainment Holdings 12.000%cash/12.000% PIK,
06/15/2026 (A) 1,402 1,38610.500%, 04/24/2026 (A) 38 406.125%, 05/15/2027 420 2985.750%, 06/15/2025 85 67
AMC Networks 4.250%, 02/15/2029 1,533 1,523
ANGI Group 3.875%, 08/15/2028 (A) 1,281 1,252
Audacy Capital 6.750%, 03/31/2029 (A) 3,319 3,2436.500%, 05/01/2027 (A) 237 234
Belo 7.250%, 09/15/2027 250 288
CCO Holdings 5.500%, 05/01/2026 (A) 276 2845.375%, 06/01/2029 (A) 1,050 1,1335.125%, 05/01/2027 (A) 3,807 3,9215.000%, 02/01/2028 (A) 765 7964.750%, 03/01/2030 (A) 975 1,0144.500%, 08/15/2030 (A) 5,613 5,7434.250%, 02/01/2031 (A) 3,609 3,6414.250%, 01/15/2034 (A) 325 320
Cinemark USA 8.750%, 05/01/2025 (A) 115 1225.250%, 07/15/2028 (A) 135 132
Clear Channel International BV 6.625%, 08/01/2025 (A) 564 585
Clear Channel Outdoor Holdings 7.750%, 04/15/2028 (A) 3,234 3,4607.500%, 06/01/2029 (A) 459 490
Clear Channel Worldwide Holdings 5.125%, 08/15/2027 (A) 1,820 1,883
Consolidated Communications 6.500%, 10/01/2028 (A) 3,823 4,0525.000%, 10/01/2028 (A) 310 313
DISH DBS 7.750%, 07/01/2026 2,353 2,4827.375%, 07/01/2028 4,350 4,4045.875%, 07/15/2022 45 465.875%, 11/15/2024 3,112 3,1975.750%, 12/01/2028 (A) 1,868 1,887
DescriptionFace Amount (Thousands)
Market Value ($ Thousands)
CORPORATE OBLIGATIONS (continued)5.250%, 12/01/2026 (A) $ 2,761 $ 2,8055.125%, 06/01/2029 2,116 1,9265.000%, 03/15/2023 1,072 1,099
DKT Finance ApS 9.375%, 06/17/2023 (A) 1,845 1,864
Front Range BidCo 6.125%, 03/01/2028 (A) 571 562
Frontier Communications Holdings 6.750%, 05/01/2029 (A) 269 2806.000%, 01/15/2030 (A) 968 9735.875%, 10/15/2027 (A) 206 2185.875%, 11/01/2029 1,177 1,1775.000%, 05/01/2028 (A) 1,205 1,241
Gannett Holdings 6.000%, 11/01/2026 (A) 1,056 1,078
Gray Escrow II 5.375%, 11/15/2031 (A) 2,171 2,233
Gray Television 4.750%, 10/15/2030 (A) 1,527 1,517
iHeartCommunications 8.375%, 05/01/2027 300 3166.375%, 05/01/2026 94 975.250%, 08/15/2027 (A) 1,088 1,1324.750%, 01/15/2028 (A) 842 854
Iliad Holding SASU 7.000%, 10/15/2028 (A) 180 1896.500%, 10/15/2026 (A) 1,280 1,345
Intelsat Jackson Holdings 9.750%, 07/15/2025 (A)(B) 2,202 1,0118.500%, 10/15/2024 (A)(B) 1,695 7775.500%, 08/01/2023 (B) 268 121
Intelsat Luxembourg 8.125%, 06/01/2023 (B) 635 5
Level 3 Financing 5.375%, 05/01/2025 760 7774.625%, 09/15/2027 (A) 764 7793.750%, 07/15/2029 (A) 320 3043.625%, 01/15/2029 (A) 2,124 2,018
Live Nation Entertainment 6.500%, 05/15/2027 (A) 701 7675.625%, 03/15/2026 (A) 264 2734.875%, 11/01/2024 (A) 370 3744.750%, 10/15/2027 (A) 500 5143.750%, 01/15/2028 (A) 55 55
Lumen Technologies 7.500%, 04/01/2024 464 5085.625%, 04/01/2025 206 2185.375%, 06/15/2029 (A) 771 7715.125%, 12/15/2026 (A) 3,165 3,2944.500%, 01/15/2029 (A) 110 1064.000%, 02/15/2027 (A) 1,108 1,124

SEI Institutional Managed Trust / Quarterly Report / December 31, 20212
SCHEDULE OF INVESTMENTS (Unaudited)December 31, 2021
High Yield Bond Fund (Continued)
DescriptionFace Amount (Thousands)
Market Value ($ Thousands)
CORPORATE OBLIGATIONS (continued)Midas OpCo Holdings
5.625%, 08/15/2029 (A) $ 173 $ 177Netflix
5.875%, 11/15/2028 470 5655.375%, 11/15/2029 (A) 205 2434.875%, 04/15/2028 1,273 1,4514.875%, 06/15/2030 (A) 666 777
News 3.875%, 05/15/2029 (A) 174 176
Nexstar Media 5.625%, 07/15/2027 (A) 3,343 3,5244.750%, 11/01/2028 (A) 1,232 1,255
Outfront Media Capital 5.000%, 08/15/2027 (A) 465 476
ROBLOX 3.875%, 05/01/2030 (A) 1,333 1,352
Sable International Finance 5.750%, 09/07/2027 (A) 854 874
Salem Media Group 6.750%, 06/01/2024 (A) 1,841 1,841
Scripps (Escrow Security) 5.875%, 07/15/2027 (A) 115 121
Scripps II (Escrow Security) 5.375%, 01/15/2031 (A) 81 823.875%, 01/15/2029 (A) 1,544 1,542
Sinclair Television Group 5.125%, 02/15/2027 (A) 215 2094.125%, 12/01/2030 (A) 3,860 3,657
Sirius XM Radio 5.500%, 07/01/2029 (A) 994 1,0715.000%, 08/01/2027 (A) 925 9614.125%, 07/01/2030 (A) 1,353 1,3534.000%, 07/15/2028 (A) 1,952 1,963
SoftBank Group 6.000%, VAR USD ICE Swap 11:00 NY
5 Yr + 4.226%(C) 605 6005.125%, 09/19/2027 527 529
Spanish Broadcasting System 9.750%, 03/01/2026 (A) 2,486 2,558
Sprint 7.625%, 03/01/2026 1,490 1,789
TEGNA 4.625%, 03/15/2028 2,259 2,283
Telecom Italia Capital 6.000%, 09/30/2034 285 302
Telesat Canada 6.500%, 10/15/2027 (A) 5,973 4,6355.625%, 12/06/2026 (A) 994 9334.875%, 06/01/2027 (A) 1,120 989
T-Mobile USA 4.750%, 02/01/2028 964 1,0153.500%, 04/15/2031 930 968
DescriptionFace Amount (Thousands)
Market Value ($ Thousands)
CORPORATE OBLIGATIONS (continued)3.375%, 04/15/2029 $ 905 $ 922
Trilogy International South Pacific 8.875%, 05/15/2023 (A) 1,016 1,006
Trilogy Private Notes 10.000%, 05/15/2023 (D)(E) 33 33
United States Cellular 6.700%, 12/15/2033 1,289 1,558
Urban One 7.375%, 02/01/2028 (A) 5,935 6,113
Windstream Escrow 7.750%, 08/15/2028 (A) 1,355 1,437
WMG Acquisition 3.750%, 12/01/2029 (A) 309 3083.000%, 02/15/2031 (A) 231 221
140,879
Consumer Discretionary — 14.1%1011778 BC ULC / New Red Finance Inc
4.375%, 01/15/2028 (A) 1,608 1,6404.000%, 10/15/2030 (A) 2,194 2,1563.875%, 01/15/2028 (A) 128 1303.500%, 02/15/2029 (A) 93 92
Academy 6.000%, 11/15/2027 (A) 1,028 1,096
Adient Global Holdings 4.875%, 08/15/2026 (A) 525 536
Adient US 9.000%, 04/15/2025 (A) 144 153
Adtalem Global Education 5.500%, 03/01/2028 (A) 1,710 1,672
Altice Financing 5.750%, 08/15/2029 (A) 1,629 1,6135.000%, 01/15/2028 (A) 4,050 3,952
American Axle & Manufacturing 6.875%, 07/01/2028 223 2406.500%, 04/01/2027 310 3226.250%, 03/15/2026 600 6135.000%, 10/01/2029 212 208
American Greetings 8.750%, 04/15/2025 (A) 3,210 3,290
Aramark Services 5.000%, 02/01/2028 (A) 277 286
Asbury Automotive Group 4.625%, 11/15/2029 (A) 536 5464.500%, 03/01/2028 1,916 1,954
Ashton Woods USA 6.625%, 01/15/2028 (A) 3,069 3,2384.625%, 08/01/2029 (A) 715 706
Aston Martin Capital Holdings 10.500%, 11/30/2025 (A) 3,177 3,495
Aventine (Escrow Security) 0.000%, 10/15/2049 (B)(D)(E)(F) 2,750 –
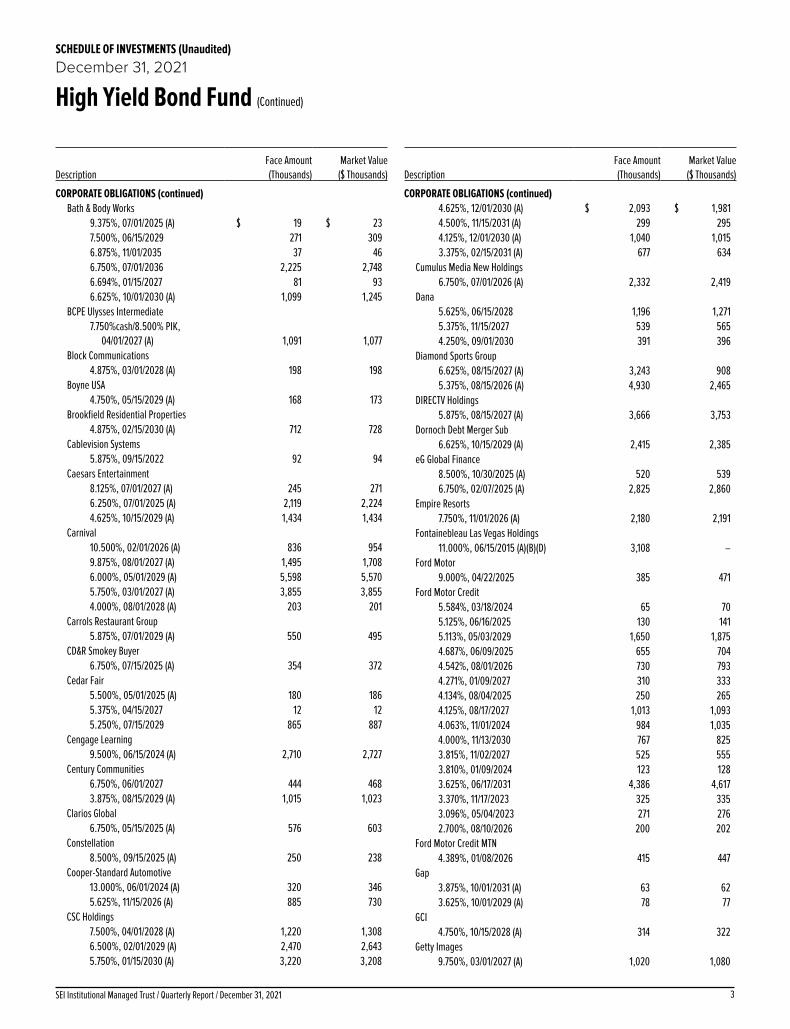
3SEI Institutional Managed Trust / Quarterly Report / December 31, 2021
SCHEDULE OF INVESTMENTS (Unaudited)December 31, 2021
High Yield Bond Fund (Continued)
DescriptionFace Amount (Thousands)
Market Value ($ Thousands)
CORPORATE OBLIGATIONS (continued)Bath & Body Works
9.375%, 07/01/2025 (A) $ 19 $ 237.500%, 06/15/2029 271 3096.875%, 11/01/2035 37 466.750%, 07/01/2036 2,225 2,7486.694%, 01/15/2027 81 936.625%, 10/01/2030 (A) 1,099 1,245
BCPE Ulysses Intermediate 7.750%cash/8.500% PIK,
04/01/2027 (A) 1,091 1,077Block Communications
4.875%, 03/01/2028 (A) 198 198Boyne USA
4.750%, 05/15/2029 (A) 168 173Brookfield Residential Properties
4.875%, 02/15/2030 (A) 712 728Cablevision Systems
5.875%, 09/15/2022 92 94Caesars Entertainment
8.125%, 07/01/2027 (A) 245 2716.250%, 07/01/2025 (A) 2,119 2,2244.625%, 10/15/2029 (A) 1,434 1,434
Carnival 10.500%, 02/01/2026 (A) 836 9549.875%, 08/01/2027 (A) 1,495 1,7086.000%, 05/01/2029 (A) 5,598 5,5705.750%, 03/01/2027 (A) 3,855 3,8554.000%, 08/01/2028 (A) 203 201
Carrols Restaurant Group 5.875%, 07/01/2029 (A) 550 495
CD&R Smokey Buyer 6.750%, 07/15/2025 (A) 354 372
Cedar Fair 5.500%, 05/01/2025 (A) 180 1865.375%, 04/15/2027 12 125.250%, 07/15/2029 865 887
Cengage Learning 9.500%, 06/15/2024 (A) 2,710 2,727
Century Communities 6.750%, 06/01/2027 444 4683.875%, 08/15/2029 (A) 1,015 1,023
Clarios Global 6.750%, 05/15/2025 (A) 576 603
Constellation 8.500%, 09/15/2025 (A) 250 238
Cooper-Standard Automotive 13.000%, 06/01/2024 (A) 320 3465.625%, 11/15/2026 (A) 885 730
CSC Holdings 7.500%, 04/01/2028 (A) 1,220 1,3086.500%, 02/01/2029 (A) 2,470 2,6435.750%, 01/15/2030 (A) 3,220 3,208
DescriptionFace Amount (Thousands)
Market Value ($ Thousands)
CORPORATE OBLIGATIONS (continued)4.625%, 12/01/2030 (A) $ 2,093 $ 1,9814.500%, 11/15/2031 (A) 299 2954.125%, 12/01/2030 (A) 1,040 1,0153.375%, 02/15/2031 (A) 677 634
Cumulus Media New Holdings 6.750%, 07/01/2026 (A) 2,332 2,419
Dana 5.625%, 06/15/2028 1,196 1,2715.375%, 11/15/2027 539 5654.250%, 09/01/2030 391 396
Diamond Sports Group 6.625%, 08/15/2027 (A) 3,243 9085.375%, 08/15/2026 (A) 4,930 2,465
DIRECTV Holdings 5.875%, 08/15/2027 (A) 3,666 3,753
Dornoch Debt Merger Sub 6.625%, 10/15/2029 (A) 2,415 2,385
eG Global Finance 8.500%, 10/30/2025 (A) 520 5396.750%, 02/07/2025 (A) 2,825 2,860
Empire Resorts 7.750%, 11/01/2026 (A) 2,180 2,191
Fontainebleau Las Vegas Holdings 11.000%, 06/15/2015 (A)(B)(D) 3,108 –
Ford Motor 9.000%, 04/22/2025 385 471
Ford Motor Credit 5.584%, 03/18/2024 65 705.125%, 06/16/2025 130 1415.113%, 05/03/2029 1,650 1,8754.687%, 06/09/2025 655 7044.542%, 08/01/2026 730 7934.271%, 01/09/2027 310 3334.134%, 08/04/2025 250 2654.125%, 08/17/2027 1,013 1,0934.063%, 11/01/2024 984 1,0354.000%, 11/13/2030 767 8253.815%, 11/02/2027 525 5553.810%, 01/09/2024 123 1283.625%, 06/17/2031 4,386 4,6173.370%, 11/17/2023 325 3353.096%, 05/04/2023 271 2762.700%, 08/10/2026 200 202
Ford Motor Credit MTN 4.389%, 01/08/2026 415 447
Gap 3.875%, 10/01/2031 (A) 63 623.625%, 10/01/2029 (A) 78 77
GCI 4.750%, 10/15/2028 (A) 314 322
Getty Images 9.750%, 03/01/2027 (A) 1,020 1,080

SEI Institutional Managed Trust / Quarterly Report / December 31, 20214
SCHEDULE OF INVESTMENTS (Unaudited)December 31, 2021
High Yield Bond Fund (Continued)
DescriptionFace Amount (Thousands)
Market Value ($ Thousands)
CORPORATE OBLIGATIONS (continued)Goodyear Tire & Rubber
5.250%, 04/30/2031 $ 285 $ 3105.250%, 07/15/2031 (A) 81 885.000%, 07/15/2029 (A) 127 136
GPS Hospitality Holding 7.000%, 08/15/2028 (A) 830 753
Hanesbrands 4.625%, 05/15/2024 (A) 2,293 2,401
Hertz (Escrow Security) 7.125%, 08/01/2026 465 156.000%, 01/15/2028 450 155.500%, 10/15/2024 559 2
Hilton Domestic Operating 5.750%, 05/01/2028 (A) 246 2635.375%, 05/01/2025 (A) 74 773.750%, 05/01/2029 (A) 97 98
Hilton Worldwide Finance 4.875%, 04/01/2027 110 113
Houghton Mifflin Harcourt Publishers 9.000%, 02/15/2025 (A) 2,050 2,142
International Game Technology 6.250%, 01/15/2027 (A) 1,858 2,0814.125%, 04/15/2026 (A) 200 206
IRB Holding 7.000%, 06/15/2025 (A) 125 132
Jaguar Land Rover Automotive 5.500%, 07/15/2029 (A) 2,150 2,152
KB Home 4.000%, 06/15/2031 508 527
Ken Garff Automotive 4.875%, 09/15/2028 (A) 278 278
LBM Acquisition 6.250%, 01/15/2029 (A) 1,856 1,835
LCM Investments Holdings II 4.875%, 05/01/2029 (A) 1,945 1,999
LCPR Senior Secured Financing DAC 6.750%, 10/15/2027 (A) 1,797 1,887
Liberty Interactive 8.250%, 02/01/2030 3,457 3,785
Lions Gate Capital Holdings 5.500%, 04/15/2029 (A) 1,018 1,036
Lithia Motors 4.375%, 01/15/2031 (A) 1,356 1,4483.875%, 06/01/2029 (A) 838 856
Macy's Retail Holdings 5.875%, 04/01/2029 (A) 1,064 1,1355.125%, 01/15/2042 2,068 1,975
MajorDrive Holdings IV 6.375%, 06/01/2029 (A) 3,386 3,276
Marriott Ownership Resorts 6.125%, 09/15/2025 (A) 114 1194.500%, 06/15/2029 (A) 41 41
DescriptionFace Amount (Thousands)
Market Value ($ Thousands)
CORPORATE OBLIGATIONS (continued)Mattamy Group
4.625%, 03/01/2030 (A) $ 1,388 $ 1,414Mattel
5.875%, 12/15/2027 (A) 190 2043.750%, 04/01/2029 (A) 98 1023.375%, 04/01/2026 (A) 78 80
Mav Acquisition 5.750%, 08/01/2028 (A) 2,680 2,653
Meritage Homes 3.875%, 04/15/2029 (A) 997 1,047
MGM Resorts International 6.750%, 05/01/2025 850 8886.000%, 03/15/2023 1,285 1,3435.750%, 06/15/2025 367 395
Michaels 7.875%, 05/01/2029 (A) 2,240 2,2065.250%, 05/01/2028 (A) 1,335 1,336
Midcontinent Communications 5.375%, 08/15/2027 (A) 552 569
Midwest Gaming Borrower 4.875%, 05/01/2029 (A) 1,227 1,233
Millennium Escrow 6.625%, 08/01/2026 (A) 1,420 1,424
National CineMedia 5.875%, 04/15/2028 (A) 150 1355.750%, 08/15/2026 763 593
NCL 12.250%, 05/15/2024 (A) 651 771
Neiman Marcus Group (Escrow Security) 28.828%, 10/15/2022 (D)(E) 820 28111.946%, 10/15/2022 (D)(E) 762 261
NESCO Holdings II 5.500%, 04/15/2029 (A) 271 280
Newell Brands 5.875%, 04/01/2036 873 1,0764.700%, 04/01/2026 240 261
Panther BF Aggregator 2 8.500%, 05/15/2027 (A) 961 1,0196.250%, 05/15/2026 (A) 1,300 1,360
PECF USS Intermediate Holding III 8.000%, 11/15/2029 (A) 1,780 1,843
Peninsula Pacific Entertainment 8.500%, 11/15/2027 (A) 4,897 5,289
PetSmart 7.750%, 02/15/2029 (A) 673 7314.750%, 02/15/2028 (A) 611 627
Photo Holdings Merger Sub 8.500%, 10/01/2026 (A) 575 598
PM General Purchaser 9.500%, 10/01/2028 (A) 383 388
Radiate Holdco 6.500%, 09/15/2028 (A) 550 553

5SEI Institutional Managed Trust / Quarterly Report / December 31, 2021
SCHEDULE OF INVESTMENTS (Unaudited)December 31, 2021
High Yield Bond Fund (Continued)
DescriptionFace Amount (Thousands)
Market Value ($ Thousands)
CORPORATE OBLIGATIONS (continued)4.500%, 09/15/2026 (A) $ 550 $ 556
Remington Outdoor Company 0.000%, 12/31/2049 (D)(F) 1,245 –
Royal Caribbean Cruises 11.500%, 06/01/2025 (A) 272 30510.875%, 06/01/2023 (A) 458 5009.125%, 06/15/2023 (A) 581 6145.500%, 08/31/2026 (A) 1,703 1,7325.500%, 04/01/2028 (A) 1,305 1,320
Service International 7.500%, 04/01/2027 640 7684.000%, 05/15/2031 75 76
Shea Homes 4.750%, 02/15/2028 (A) 711 7274.750%, 04/01/2029 (A) 825 841
Six Flags Entertainment 5.500%, 04/15/2027 (A) 80 834.875%, 07/31/2024 (A) 2,476 2,501
Six Flags Theme Parks 7.000%, 07/01/2025 (A) 668 713
Sonic Automotive 4.875%, 11/15/2031 (A) 929 9384.625%, 11/15/2029 (A) 852 860
Sotheby's 5.875%, 06/01/2029 (A) 460 469
Specialty Building Products Holdings 6.375%, 09/30/2026 (A) 1,800 1,887
Speedway Motorsports 4.875%, 11/01/2027 (A) 846 863
SRS Distribution 6.125%, 07/01/2029 (A) 1,461 1,4896.000%, 12/01/2029 (A) 962 9674.625%, 07/01/2028 (A) 847 850
Staples 10.750%, 04/15/2027 (A) 2,860 2,6967.500%, 04/15/2026 (A) 1,753 1,801
Station Casinos 4.500%, 02/15/2028 (A) 510 513
StoneMor 8.500%, 05/15/2029 (A) 1,410 1,456
Studio City Finance 5.000%, 01/15/2029 (A) 2,405 2,153
Sugarhouse HSP Gaming Prop Mezz 5.875%, 05/15/2025 (A) 1,945 1,935
Superior Plus 4.500%, 03/15/2029 (A) 202 208
Telenet Finance Luxembourg Notes Sarl 5.500%, 03/01/2028 (A) 2,400 2,472
Tempur Sealy International 4.000%, 04/15/2029 (A) 385 3923.875%, 10/15/2031 (A) 121 121
DescriptionFace Amount (Thousands)
Market Value ($ Thousands)
CORPORATE OBLIGATIONS (continued)Tenneco
7.875%, 01/15/2029 (A) $ 138 $ 1495.375%, 12/15/2024 110 1095.125%, 04/15/2029 (A) 2,379 2,3255.000%, 07/15/2026 2,610 2,509
Terrier Media Buyer 8.875%, 12/15/2027 (A) 3,964 4,284
Thor Industries 4.000%, 10/15/2029 (A) 1,311 1,298
Univision Communications 6.625%, 06/01/2027 (A) 784 8454.500%, 05/01/2029 (A) 383 387
Vail Resorts 6.250%, 05/15/2025 (A) 437 455
Virgin Media Finance 5.000%, 07/15/2030 (A) 493 491
Virgin Media Secured Finance 5.500%, 05/15/2029 (A) 1,191 1,2584.500%, 08/15/2030 (A) 480 483
Virgin Media Vendor Financing Notes IV DAC 5.000%, 07/15/2028 (A) 1,934 1,949
Vista Outdoor 4.500%, 03/15/2029 (A) 1,180 1,187
VOC Escrow 5.000%, 02/15/2028 (A) 1,020 1,010
Wheel Pros 6.500%, 05/15/2029 (A) 2,150 2,064
White Capital Buyer 6.875%, 10/15/2028 (A) 105 109
White Capital Parent 8.250%cash/9.000% PIK,
03/15/2026 (A) 2,505 2,561Wynn Las Vegas
5.500%, 03/01/2025 (A) 1,135 1,1695.250%, 05/15/2027 (A) 190 194
Wynn Resorts Finance 7.750%, 04/15/2025 (A) 1,610 1,6895.125%, 10/01/2029 (A) 379 385
Yum! Brands 7.750%, 04/01/2025 (A) 110 1166.875%, 11/15/2037 1,065 1,3505.350%, 11/01/2043 130 1444.625%, 01/31/2032 217 2313.625%, 03/15/2031 239 238
229,454
Consumer Staples — 3.4%Albertsons
5.875%, 02/15/2028 (A) 125 1324.875%, 02/15/2030 (A) 185 2004.625%, 01/15/2027 (A) 2,072 2,1743.500%, 02/15/2023 (A) 130 132
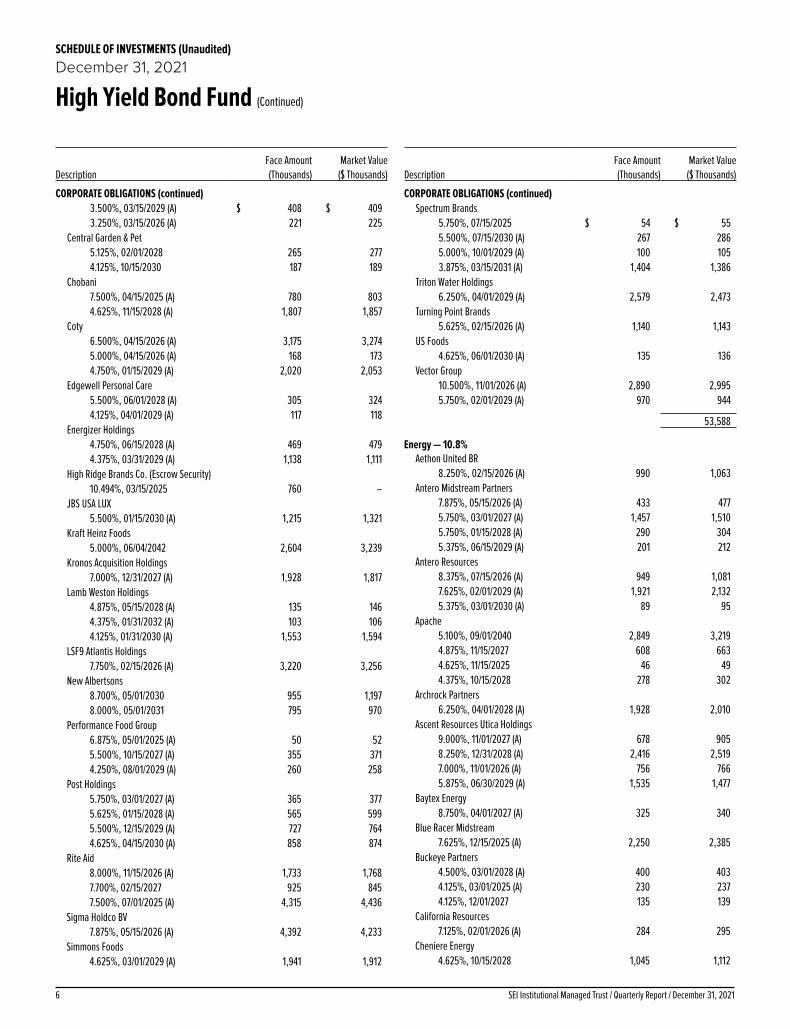
SEI Institutional Managed Trust / Quarterly Report / December 31, 20216
SCHEDULE OF INVESTMENTS (Unaudited)December 31, 2021
High Yield Bond Fund (Continued)
DescriptionFace Amount (Thousands)
Market Value ($ Thousands)
CORPORATE OBLIGATIONS (continued)3.500%, 03/15/2029 (A) $ 408 $ 4093.250%, 03/15/2026 (A) 221 225
Central Garden & Pet 5.125%, 02/01/2028 265 2774.125%, 10/15/2030 187 189
Chobani 7.500%, 04/15/2025 (A) 780 8034.625%, 11/15/2028 (A) 1,807 1,857
Coty 6.500%, 04/15/2026 (A) 3,175 3,2745.000%, 04/15/2026 (A) 168 1734.750%, 01/15/2029 (A) 2,020 2,053
Edgewell Personal Care 5.500%, 06/01/2028 (A) 305 3244.125%, 04/01/2029 (A) 117 118
Energizer Holdings 4.750%, 06/15/2028 (A) 469 4794.375%, 03/31/2029 (A) 1,138 1,111
High Ridge Brands Co. (Escrow Security) 10.494%, 03/15/2025 760 –
JBS USA LUX 5.500%, 01/15/2030 (A) 1,215 1,321
Kraft Heinz Foods 5.000%, 06/04/2042 2,604 3,239
Kronos Acquisition Holdings 7.000%, 12/31/2027 (A) 1,928 1,817
Lamb Weston Holdings 4.875%, 05/15/2028 (A) 135 1464.375%, 01/31/2032 (A) 103 1064.125%, 01/31/2030 (A) 1,553 1,594
LSF9 Atlantis Holdings 7.750%, 02/15/2026 (A) 3,220 3,256
New Albertsons 8.700%, 05/01/2030 955 1,1978.000%, 05/01/2031 795 970
Performance Food Group 6.875%, 05/01/2025 (A) 50 525.500%, 10/15/2027 (A) 355 3714.250%, 08/01/2029 (A) 260 258
Post Holdings 5.750%, 03/01/2027 (A) 365 3775.625%, 01/15/2028 (A) 565 5995.500%, 12/15/2029 (A) 727 7644.625%, 04/15/2030 (A) 858 874
Rite Aid 8.000%, 11/15/2026 (A) 1,733 1,7687.700%, 02/15/2027 925 8457.500%, 07/01/2025 (A) 4,315 4,436
Sigma Holdco BV 7.875%, 05/15/2026 (A) 4,392 4,233
Simmons Foods 4.625%, 03/01/2029 (A) 1,941 1,912
DescriptionFace Amount (Thousands)
Market Value ($ Thousands)
CORPORATE OBLIGATIONS (continued)Spectrum Brands
5.750%, 07/15/2025 $ 54 $ 555.500%, 07/15/2030 (A) 267 2865.000%, 10/01/2029 (A) 100 1053.875%, 03/15/2031 (A) 1,404 1,386
Triton Water Holdings 6.250%, 04/01/2029 (A) 2,579 2,473
Turning Point Brands 5.625%, 02/15/2026 (A) 1,140 1,143
US Foods 4.625%, 06/01/2030 (A) 135 136
Vector Group 10.500%, 11/01/2026 (A) 2,890 2,9955.750%, 02/01/2029 (A) 970 944
53,588
Energy — 10.8%Aethon United BR
8.250%, 02/15/2026 (A) 990 1,063Antero Midstream Partners
7.875%, 05/15/2026 (A) 433 4775.750%, 03/01/2027 (A) 1,457 1,5105.750%, 01/15/2028 (A) 290 3045.375%, 06/15/2029 (A) 201 212
Antero Resources 8.375%, 07/15/2026 (A) 949 1,0817.625%, 02/01/2029 (A) 1,921 2,1325.375%, 03/01/2030 (A) 89 95
Apache 5.100%, 09/01/2040 2,849 3,2194.875%, 11/15/2027 608 6634.625%, 11/15/2025 46 494.375%, 10/15/2028 278 302
Archrock Partners 6.250%, 04/01/2028 (A) 1,928 2,010
Ascent Resources Utica Holdings 9.000%, 11/01/2027 (A) 678 9058.250%, 12/31/2028 (A) 2,416 2,5197.000%, 11/01/2026 (A) 756 7665.875%, 06/30/2029 (A) 1,535 1,477
Baytex Energy 8.750%, 04/01/2027 (A) 325 340
Blue Racer Midstream 7.625%, 12/15/2025 (A) 2,250 2,385
Buckeye Partners 4.500%, 03/01/2028 (A) 400 4034.125%, 03/01/2025 (A) 230 2374.125%, 12/01/2027 135 139
California Resources 7.125%, 02/01/2026 (A) 284 295
Cheniere Energy 4.625%, 10/15/2028 1,045 1,112

7SEI Institutional Managed Trust / Quarterly Report / December 31, 2021
SCHEDULE OF INVESTMENTS (Unaudited)December 31, 2021
High Yield Bond Fund (Continued)
DescriptionFace Amount (Thousands)
Market Value ($ Thousands)
CORPORATE OBLIGATIONS (continued)Cheniere Energy Partners
4.500%, 10/01/2029 $ 3,065 $ 3,2494.000%, 03/01/2031 389 4083.250%, 01/31/2032 (A) 567 573
Chesapeake Energy 5.500%, 02/01/2026 (A) 82 86
Chesapeake Energy (Escrow Security) 0.000%, 12/31/2049 (D)(F) 3,650 35
Citgo Holding 9.250%, 08/01/2024 (A) 5,656 5,684
CNX Midstream Partners 4.750%, 04/15/2030 (A) 519 517
CNX Resources 7.250%, 03/14/2027 (A) 2,075 2,2016.000%, 01/15/2029 (A) 866 901
Colgate Energy Partners III 5.875%, 07/01/2029 (A) 1,490 1,535
Comstock Resources 7.500%, 05/15/2025 (A) 190 1966.750%, 03/01/2029 (A) 2,344 2,5425.875%, 01/15/2030 (A) 140 143
Continental Resources 5.750%, 01/15/2031 (A) 1,325 1,560
CQP Holdco 5.500%, 06/15/2031 (A) 1,906 1,989
CrownRock 5.625%, 10/15/2025 (A) 1,520 1,554
DCP Midstream Operating 8.125%, 08/16/2030 1,125 1,5295.625%, 07/15/2027 638 7215.125%, 05/15/2029 538 6083.250%, 02/15/2032 215 217
Delek Logistics Partners 6.750%, 05/15/2025 811 829
Devon Energy 7.950%, 04/15/2032 834 1,169
DT Midstream 4.375%, 06/15/2031 (A) 1,352 1,4064.125%, 06/15/2029 (A) 2,391 2,448
Encino Acquisition Partners Holdings 8.500%, 05/01/2028 (A) 2,834 2,944
Endeavor Energy Resources 6.625%, 07/15/2025 (A) 248 262
Energy Transfer 5.500%, 06/01/2027 1,564 1,783
EnLink Midstream 5.375%, 06/01/2029 2,741 2,803
EnLink Midstream Partners 4.850%, 07/15/2026 190 200
Enviva Partners 6.500%, 01/15/2026 (A) 1,833 1,893
DescriptionFace Amount (Thousands)
Market Value ($ Thousands)
CORPORATE OBLIGATIONS (continued)EQM Midstream Partners
6.500%, 07/01/2027 (A) $ 712 $ 7976.500%, 07/15/2048 1,679 2,0406.000%, 07/01/2025 (A) 747 8124.750%, 01/15/2031 (A) 204 2164.500%, 01/15/2029 (A) 424 441
EQT 7.500%, 02/01/2030 540 6946.625%, 02/01/2025 1,460 1,6465.000%, 01/15/2029 92 1023.900%, 10/01/2027 10 113.625%, 05/15/2031 (A) 883 9163.125%, 05/15/2026 (A) 110 113
Exterran Energy Solutions 8.125%, 05/01/2025 2,054 1,910
Genesis Energy 8.000%, 01/15/2027 977 1,0077.750%, 02/01/2028 1,168 1,1776.500%, 10/01/2025 20 20
Great Western Petroleum 12.000%, 09/01/2025 (A) 1,158 1,216
Gulfport Energy Operating 8.000%, 05/17/2026 (A) 2,293 2,502
Gulfport Energy Operating (Escrow Security) 6.375%, 05/15/2025 (D) 183 76.375%, 01/15/2026 585 236.000%, 10/15/2024 215 9
Harvest Midstream I 7.500%, 09/01/2028 (A) 1,990 2,129
Hess Midstream Operations 5.625%, 02/15/2026 (A) 325 3354.250%, 02/15/2030 (A) 182 181
Howard Midstream Energy Partners 6.750%, 01/15/2027 (A) 2,775 2,844
ITT Holdings 6.500%, 08/01/2029 (A) 2,442 2,418
Laredo Petroleum 10.125%, 01/15/2028 929 9749.500%, 01/15/2025 2,139 2,1827.750%, 07/31/2029 (A) 783 763
Marathon Oil 6.600%, 10/01/2037 1,527 1,995
MEG Energy 7.125%, 02/01/2027 (A) 335 3576.500%, 01/15/2025 (A) 410 417
Moss Creek Resources Holdings 10.500%, 05/15/2027 (A) 1,820 1,8367.500%, 01/15/2026 (A) 2,022 1,891
Motiva Enterprises 6.850%, 01/15/2040 (A) 967 1,190
Nabors Industries 7.250%, 01/15/2026 (A) 93 86

SEI Institutional Managed Trust / Quarterly Report / December 31, 20218
SCHEDULE OF INVESTMENTS (Unaudited)December 31, 2021
High Yield Bond Fund (Continued)
DescriptionFace Amount (Thousands)
Market Value ($ Thousands)
CORPORATE OBLIGATIONS (continued)5.750%, 02/01/2025 $ 285 $ 264
New Fortress Energy 6.750%, 09/15/2025 (A) 618 6246.500%, 09/30/2026 (A) 2,142 2,126
NGL Energy Operating 7.500%, 02/01/2026 (A) 3,477 3,586
NGL Energy Partners 7.500%, 11/01/2023 2,661 2,6217.500%, 04/15/2026 455 3906.125%, 03/01/2025 3,113 2,662
Northern Oil and Gas 8.125%, 03/01/2028 (A) 2,176 2,296
NuStar Logistics 6.375%, 10/01/2030 685 7606.000%, 06/01/2026 255 2775.750%, 10/01/2025 129 1395.625%, 04/28/2027 50 53
Oasis Midstream Partners 8.000%, 04/01/2029 (A) 328 358
Oasis Petroleum 6.375%, 06/01/2026 (A) 104 109
Occidental Petroleum 8.875%, 07/15/2030 2,063 2,7828.500%, 07/15/2027 1,188 1,4828.000%, 07/15/2025 696 8136.625%, 09/01/2030 968 1,1986.450%, 09/15/2036 430 5486.375%, 09/01/2028 1,771 2,1036.125%, 01/01/2031 3,012 3,6605.875%, 09/01/2025 165 1825.500%, 12/01/2025 2,079 2,3064.625%, 06/15/2045 1,165 1,2094.500%, 07/15/2044 95 98
PBF Holding 9.250%, 05/15/2025 (A) 1,415 1,3467.250%, 06/15/2025 965 6886.000%, 02/15/2028 78 50
Peabody Energy 6.375%, 03/31/2025 (A) 769 731
Precision Drilling 7.125%, 01/15/2026 (A) 240 2446.875%, 01/15/2029 (A) 31 32
Range Resources 8.250%, 01/15/2029 107 1194.875%, 05/15/2025 430 444
Rockcliff Energy II 5.500%, 10/15/2029 (A) 903 930
Seventy Seven Operating (Escrow Security) 6.625%, 11/15/2019 (B)(D) 1,869 –
Shelf Drilling Holdings 8.875%, 11/15/2024 (A) 335 3438.250%, 02/15/2025 (A) 1,685 1,230
DescriptionFace Amount (Thousands)
Market Value ($ Thousands)
CORPORATE OBLIGATIONS (continued)SM Energy
6.625%, 01/15/2027 $ 1,118 $ 1,1526.500%, 07/15/2028 63 655.625%, 06/01/2025 1,395 1,405
Southwestern Energy 7.750%, 10/01/2027 774 8355.375%, 03/15/2030 284 3044.750%, 02/01/2032 1,208 1,272
Strathcona Resources 6.875%, 08/01/2026 (A) 1,435 1,410
Summit Midstream Holdings 8.500%, 10/15/2026 (A) 287 2995.750%, 04/15/2025 1,620 1,458
Sunoco 5.875%, 03/15/2028 1,585 1,6764.500%, 05/15/2029 243 2474.500%, 04/30/2030 (A) 317 325
Tallgrass Energy Partners 7.500%, 10/01/2025 (A) 381 4126.000%, 03/01/2027 (A) 2,065 2,1486.000%, 12/31/2030 (A) 2,579 2,5796.000%, 09/01/2031 (A) 807 7995.500%, 01/15/2028 (A) 70 69
Targa Resources Partners 6.875%, 01/15/2029 192 2156.500%, 07/15/2027 333 3575.875%, 04/15/2026 525 5485.375%, 02/01/2027 35 365.000%, 01/15/2028 1,056 1,1134.875%, 02/01/2031 250 2714.000%, 01/15/2032 (A) 167 175
TerraForm Power Operating 4.750%, 01/15/2030 (A) 375 393
Transocean 11.500%, 01/30/2027 (A) 1,005 9858.000%, 02/01/2027 (A) 1,670 1,2027.500%, 04/15/2031 990 585
Transocean Guardian 5.875%, 01/15/2024 (A) 1,251 1,185
Transocean Pontus 6.125%, 08/01/2025 (A) 1,472 1,439
Transocean Proteus 6.250%, 12/01/2024 (A) 973 958
USA Compression Partners 6.875%, 09/01/2027 2,105 2,223
Venture Global Calcasieu Pass 4.125%, 08/15/2031 (A) 255 2703.875%, 08/15/2029 (A) 255 2653.875%, 11/01/2033 (A) 560 588
Vine Energy Holdings 6.750%, 04/15/2029 (A) 537 583
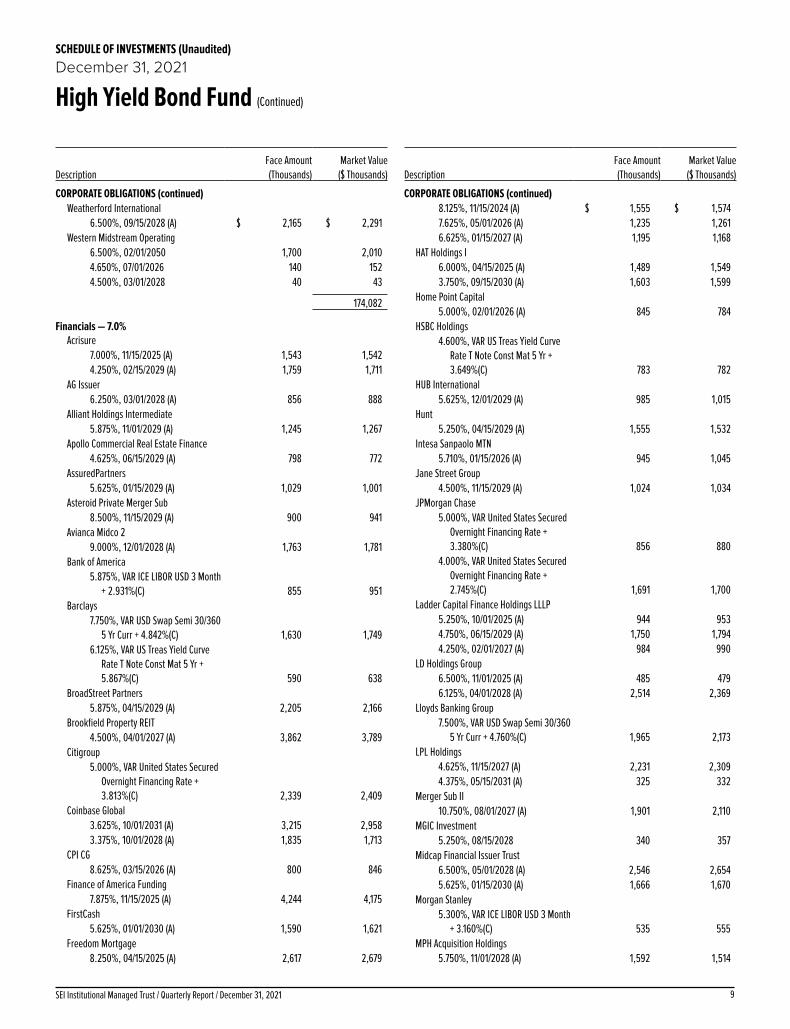
9SEI Institutional Managed Trust / Quarterly Report / December 31, 2021
SCHEDULE OF INVESTMENTS (Unaudited)December 31, 2021
High Yield Bond Fund (Continued)
DescriptionFace Amount (Thousands)
Market Value ($ Thousands)
CORPORATE OBLIGATIONS (continued)Weatherford International
6.500%, 09/15/2028 (A) $ 2,165 $ 2,291Western Midstream Operating
6.500%, 02/01/2050 1,700 2,0104.650%, 07/01/2026 140 1524.500%, 03/01/2028 40 43
174,082
Financials — 7.0%Acrisure
7.000%, 11/15/2025 (A) 1,543 1,5424.250%, 02/15/2029 (A) 1,759 1,711
AG Issuer 6.250%, 03/01/2028 (A) 856 888
Alliant Holdings Intermediate 5.875%, 11/01/2029 (A) 1,245 1,267
Apollo Commercial Real Estate Finance 4.625%, 06/15/2029 (A) 798 772
AssuredPartners 5.625%, 01/15/2029 (A) 1,029 1,001
Asteroid Private Merger Sub 8.500%, 11/15/2029 (A) 900 941
Avianca Midco 2 9.000%, 12/01/2028 (A) 1,763 1,781
Bank of America 5.875%, VAR ICE LIBOR USD 3 Month
+ 2.931%(C) 855 951Barclays
7.750%, VAR USD Swap Semi 30/360 5 Yr Curr + 4.842%(C) 1,630 1,749
6.125%, VAR US Treas Yield Curve Rate T Note Const Mat 5 Yr + 5.867%(C) 590 638
BroadStreet Partners 5.875%, 04/15/2029 (A) 2,205 2,166
Brookfield Property REIT 4.500%, 04/01/2027 (A) 3,862 3,789
Citigroup 5.000%, VAR United States Secured
Overnight Financing Rate + 3.813%(C) 2,339 2,409
Coinbase Global 3.625%, 10/01/2031 (A) 3,215 2,9583.375%, 10/01/2028 (A) 1,835 1,713
CPI CG 8.625%, 03/15/2026 (A) 800 846
Finance of America Funding 7.875%, 11/15/2025 (A) 4,244 4,175
FirstCash 5.625%, 01/01/2030 (A) 1,590 1,621
Freedom Mortgage 8.250%, 04/15/2025 (A) 2,617 2,679
DescriptionFace Amount (Thousands)
Market Value ($ Thousands)
CORPORATE OBLIGATIONS (continued)8.125%, 11/15/2024 (A) $ 1,555 $ 1,5747.625%, 05/01/2026 (A) 1,235 1,2616.625%, 01/15/2027 (A) 1,195 1,168
HAT Holdings I 6.000%, 04/15/2025 (A) 1,489 1,5493.750%, 09/15/2030 (A) 1,603 1,599
Home Point Capital 5.000%, 02/01/2026 (A) 845 784
HSBC Holdings 4.600%, VAR US Treas Yield Curve
Rate T Note Const Mat 5 Yr + 3.649%(C) 783 782
HUB International 5.625%, 12/01/2029 (A) 985 1,015
Hunt 5.250%, 04/15/2029 (A) 1,555 1,532
Intesa Sanpaolo MTN 5.710%, 01/15/2026 (A) 945 1,045
Jane Street Group 4.500%, 11/15/2029 (A) 1,024 1,034
JPMorgan Chase 5.000%, VAR United States Secured
Overnight Financing Rate + 3.380%(C) 856 880
4.000%, VAR United States Secured Overnight Financing Rate + 2.745%(C) 1,691 1,700
Ladder Capital Finance Holdings LLLP 5.250%, 10/01/2025 (A) 944 9534.750%, 06/15/2029 (A) 1,750 1,7944.250%, 02/01/2027 (A) 984 990
LD Holdings Group 6.500%, 11/01/2025 (A) 485 4796.125%, 04/01/2028 (A) 2,514 2,369
Lloyds Banking Group 7.500%, VAR USD Swap Semi 30/360
5 Yr Curr + 4.760%(C) 1,965 2,173LPL Holdings
4.625%, 11/15/2027 (A) 2,231 2,3094.375%, 05/15/2031 (A) 325 332
Merger Sub II 10.750%, 08/01/2027 (A) 1,901 2,110
MGIC Investment 5.250%, 08/15/2028 340 357
Midcap Financial Issuer Trust 6.500%, 05/01/2028 (A) 2,546 2,6545.625%, 01/15/2030 (A) 1,666 1,670
Morgan Stanley 5.300%, VAR ICE LIBOR USD 3 Month
+ 3.160%(C) 535 555MPH Acquisition Holdings
5.750%, 11/01/2028 (A) 1,592 1,514
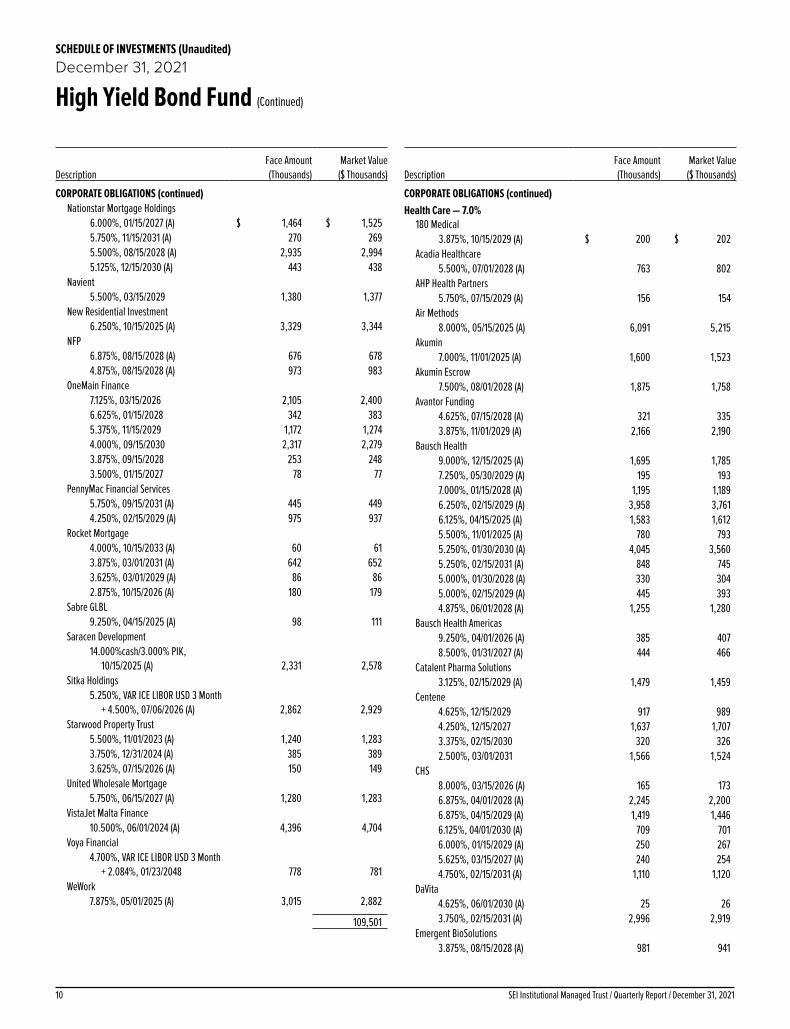
SEI Institutional Managed Trust / Quarterly Report / December 31, 202110
SCHEDULE OF INVESTMENTS (Unaudited)December 31, 2021
High Yield Bond Fund (Continued)
DescriptionFace Amount (Thousands)
Market Value ($ Thousands)
CORPORATE OBLIGATIONS (continued)Nationstar Mortgage Holdings
6.000%, 01/15/2027 (A) $ 1,464 $ 1,5255.750%, 11/15/2031 (A) 270 2695.500%, 08/15/2028 (A) 2,935 2,9945.125%, 12/15/2030 (A) 443 438
Navient 5.500%, 03/15/2029 1,380 1,377
New Residential Investment 6.250%, 10/15/2025 (A) 3,329 3,344
NFP 6.875%, 08/15/2028 (A) 676 6784.875%, 08/15/2028 (A) 973 983
OneMain Finance 7.125%, 03/15/2026 2,105 2,4006.625%, 01/15/2028 342 3835.375%, 11/15/2029 1,172 1,2744.000%, 09/15/2030 2,317 2,2793.875%, 09/15/2028 253 2483.500%, 01/15/2027 78 77
PennyMac Financial Services 5.750%, 09/15/2031 (A) 445 4494.250%, 02/15/2029 (A) 975 937
Rocket Mortgage 4.000%, 10/15/2033 (A) 60 613.875%, 03/01/2031 (A) 642 6523.625%, 03/01/2029 (A) 86 862.875%, 10/15/2026 (A) 180 179
Sabre GLBL 9.250%, 04/15/2025 (A) 98 111
Saracen Development 14.000%cash/3.000% PIK,
10/15/2025 (A) 2,331 2,578Sitka Holdings
5.250%, VAR ICE LIBOR USD 3 Month + 4.500%, 07/06/2026 (A) 2,862 2,929
Starwood Property Trust 5.500%, 11/01/2023 (A) 1,240 1,2833.750%, 12/31/2024 (A) 385 3893.625%, 07/15/2026 (A) 150 149
United Wholesale Mortgage 5.750%, 06/15/2027 (A) 1,280 1,283
VistaJet Malta Finance 10.500%, 06/01/2024 (A) 4,396 4,704
Voya Financial 4.700%, VAR ICE LIBOR USD 3 Month
+ 2.084%, 01/23/2048 778 781WeWork
7.875%, 05/01/2025 (A) 3,015 2,882
109,501
DescriptionFace Amount (Thousands)
Market Value ($ Thousands)
CORPORATE OBLIGATIONS (continued)Health Care — 7.0%
180 Medical 3.875%, 10/15/2029 (A) $ 200 $ 202
Acadia Healthcare 5.500%, 07/01/2028 (A) 763 802
AHP Health Partners 5.750%, 07/15/2029 (A) 156 154
Air Methods 8.000%, 05/15/2025 (A) 6,091 5,215
Akumin 7.000%, 11/01/2025 (A) 1,600 1,523
Akumin Escrow 7.500%, 08/01/2028 (A) 1,875 1,758
Avantor Funding 4.625%, 07/15/2028 (A) 321 3353.875%, 11/01/2029 (A) 2,166 2,190
Bausch Health 9.000%, 12/15/2025 (A) 1,695 1,7857.250%, 05/30/2029 (A) 195 1937.000%, 01/15/2028 (A) 1,195 1,1896.250%, 02/15/2029 (A) 3,958 3,7616.125%, 04/15/2025 (A) 1,583 1,6125.500%, 11/01/2025 (A) 780 7935.250%, 01/30/2030 (A) 4,045 3,5605.250%, 02/15/2031 (A) 848 7455.000%, 01/30/2028 (A) 330 3045.000%, 02/15/2029 (A) 445 3934.875%, 06/01/2028 (A) 1,255 1,280
Bausch Health Americas 9.250%, 04/01/2026 (A) 385 4078.500%, 01/31/2027 (A) 444 466
Catalent Pharma Solutions 3.125%, 02/15/2029 (A) 1,479 1,459
Centene 4.625%, 12/15/2029 917 9894.250%, 12/15/2027 1,637 1,7073.375%, 02/15/2030 320 3262.500%, 03/01/2031 1,566 1,524
CHS 8.000%, 03/15/2026 (A) 165 1736.875%, 04/01/2028 (A) 2,245 2,2006.875%, 04/15/2029 (A) 1,419 1,4466.125%, 04/01/2030 (A) 709 7016.000%, 01/15/2029 (A) 250 2675.625%, 03/15/2027 (A) 240 2544.750%, 02/15/2031 (A) 1,110 1,120
DaVita 4.625%, 06/01/2030 (A) 25 263.750%, 02/15/2031 (A) 2,996 2,919
Emergent BioSolutions 3.875%, 08/15/2028 (A) 981 941

11SEI Institutional Managed Trust / Quarterly Report / December 31, 2021
SCHEDULE OF INVESTMENTS (Unaudited)December 31, 2021
High Yield Bond Fund (Continued)
DescriptionFace Amount (Thousands)
Market Value ($ Thousands)
CORPORATE OBLIGATIONS (continued)Encompass Health
5.750%, 09/15/2025 $ 915 $ 9364.750%, 02/01/2030 1,521 1,5674.500%, 02/01/2028 375 386
Endo DAC 9.500%, 07/31/2027 (A) 1,406 1,4316.000%, 06/30/2028 (A) 1,177 877
Endo Luxembourg Finance I S.A.R.L. 6.125%, 04/01/2029 (A) 1,035 1,014
Envision Healthcare 8.750%, 10/15/2026 (A) 2,601 1,496
Global Medical Response 6.500%, 10/01/2025 (A) 3,155 3,186
Grifols Escrow Issuer 4.750%, 10/15/2028 (A) 200 204
HCA 5.875%, 02/15/2026 4,455 5,0255.875%, 02/01/2029 465 5545.625%, 09/01/2028 130 1525.375%, 02/01/2025 1,510 1,6593.500%, 09/01/2030 1,480 1,564
HealthEquity 4.500%, 10/01/2029 (A) 62 61
Hill-Rom Holdings 4.375%, 09/15/2027 (A) 200 209
Hologic 3.250%, 02/15/2029 (A) 508 508
IQVIA 5.000%, 10/15/2026 (A) 805 826
Jazz Securities DAC 4.375%, 01/15/2029 (A) 200 207
Lannett 7.750%, 04/15/2026 (A) 2,325 1,790
Legacy LifePoint Health 6.750%, 04/15/2025 (A) 374 390
LifePoint Health 5.375%, 01/15/2029 (A) 1,591 1,5834.375%, 02/15/2027 (A) 5,081 5,119
Mallinckrodt International Finance 5.625%, 10/15/2023 (A)(B) 315 1725.500%, 04/15/2025 (A)(B) 630 343
MEDNAX 6.250%, 01/15/2027 (A) 992 1,038
ModivCare Escrow Issuer 5.000%, 10/01/2029 (A) 760 776
Mozart Debt Merger Sub 5.250%, 10/01/2029 (A) 2,433 2,4663.875%, 04/01/2029 (A) 3,670 3,657
Option Care Health 4.375%, 10/31/2029 (A) 666 668
Organon 5.125%, 04/30/2031 (A) 613 640
DescriptionFace Amount (Thousands)
Market Value ($ Thousands)
CORPORATE OBLIGATIONS (continued)4.125%, 04/30/2028 (A) $ 1,206 $ 1,226
Owens & Minor 4.500%, 03/31/2029 (A) 312 320
Par Pharmaceutical 7.500%, 04/01/2027 (A) 2,816 2,878
Prestige Brands 5.125%, 01/15/2028 (A) 315 328
Prime Security Services Borrower 3.375%, 08/31/2027 (A) 679 655
Radiology Partners 9.250%, 02/01/2028 (A) 974 1,023
RP Escrow Issuer 5.250%, 12/15/2025 (A) 791 798
Syneos Health 3.625%, 01/15/2029 (A) 1,836 1,813
Tenet Healthcare 7.500%, 04/01/2025 (A) 164 1736.875%, 11/15/2031 595 6806.250%, 02/01/2027 (A) 1,433 1,4836.125%, 10/01/2028 (A) 3,215 3,3965.125%, 11/01/2027 (A) 663 6904.875%, 01/01/2026 (A) 1,729 1,7764.625%, 07/15/2024 201 2034.625%, 06/15/2028 (A) 2,470 2,5384.375%, 01/15/2030 (A) 1,150 1,1654.250%, 06/01/2029 (A) 1,476 1,499
US Acute Care Solutions 6.375%, 03/01/2026 (A) 594 622
US Renal Care 10.625%, 07/15/2027 (A) 2,010 2,040
Varex Imaging 7.875%, 10/15/2027 (A) 1,201 1,334
111,863
Industrials — 7.3%ACCO Brands
4.250%, 03/15/2029 (A) 310 308ADT Security
4.875%, 07/15/2032 (A) 1,508 1,5404.125%, 08/01/2029 (A) 271 267
Allied Universal Holdco 6.625%, 07/15/2026 (A) 185 1944.625%, 06/01/2028 (A) 400 396
Allison Transmission 5.875%, 06/01/2029 (A) 210 2284.750%, 10/01/2027 (A) 2,432 2,5333.750%, 01/30/2031 (A) 190 185
American Airlines 11.750%, 07/15/2025 (A) 1,184 1,4615.750%, 04/20/2029 (A) 3,144 3,3605.500%, 04/20/2026 (A) 2,213 2,301

SEI Institutional Managed Trust / Quarterly Report / December 31, 202112
SCHEDULE OF INVESTMENTS (Unaudited)December 31, 2021
High Yield Bond Fund (Continued)
DescriptionFace Amount (Thousands)
Market Value ($ Thousands)
CORPORATE OBLIGATIONS (continued)American Airlines Group
3.750%, 03/01/2025 (A) $ 1,306 $ 1,221American Builders & Contractors Supply
4.000%, 01/15/2028 (A) 2,400 2,4563.875%, 11/15/2029 (A) 262 261
APi Escrow 4.750%, 10/15/2029 (A) 135 138
APi Group DE 4.125%, 07/15/2029 (A) 159 160
Artera Services 9.033%, 12/04/2025 (A) 3,258 3,447
ATS Automation Tooling Systems 4.125%, 12/15/2028 (A) 270 272
Avis Budget Car Rental 5.750%, 07/15/2027 (A) 205 2135.375%, 03/01/2029 (A) 518 546
Boeing 5.150%, 05/01/2030 225 262
Bombardier 7.875%, 04/15/2027 (A) 725 7527.500%, 12/01/2024 (A) 1,324 1,3797.500%, 03/15/2025 (A) 765 7797.125%, 06/15/2026 (A) 781 810
Brand Industrial Services 8.500%, 07/15/2025 (A) 1,464 1,463
Builders FirstSource 5.000%, 03/01/2030 (A) 853 9154.250%, 02/01/2032 (A) 203 210
BWX Technologies 4.125%, 06/30/2028 (A) 712 7234.125%, 04/15/2029 (A) 2,413 2,443
Cargo Aircraft Management 4.750%, 02/01/2028 (A) 2,148 2,186
CDW 4.250%, 04/01/2028 370 3823.250%, 02/15/2029 171 173
Clark Equipment 5.875%, 06/01/2025 (A) 696 723
Clean Harbors 4.875%, 07/15/2027 (A) 1,571 1,618
CoreCivic 8.250%, 04/15/2026 267 279
CP Atlas Buyer 7.000%, 12/01/2028 (A) 2,847 2,833
Delta Air Lines 7.375%, 01/15/2026 283 3337.000%, 05/01/2025 (A) 1,073 1,2274.750%, 10/20/2028 (A) 1,627 1,777
Deluxe 8.000%, 06/01/2029 (A) 2,030 2,121
Dun & Bradstreet 5.000%, 12/15/2029 (A) 83 85
DescriptionFace Amount (Thousands)
Market Value ($ Thousands)
CORPORATE OBLIGATIONS (continued)EnerSys
4.375%, 12/15/2027 (A) $ 559 $ 580EnPro Industries
5.750%, 10/15/2026 328 343Fortress Transportation and Infrastructure
Investors 9.750%, 08/01/2027 (A) 495 5546.500%, 10/01/2025 (A) 1,170 1,2095.500%, 05/01/2028 (A) 980 999
Garda World Security 9.500%, 11/01/2027 (A) 310 3346.000%, 06/01/2029 (A) 242 231
GFL Environmental 5.125%, 12/15/2026 (A) 1,140 1,1864.750%, 06/15/2029 (A) 177 1794.375%, 08/15/2029 (A) 771 7644.000%, 08/01/2028 (A) 204 2003.750%, 08/01/2025 (A) 333 3363.500%, 09/01/2028 (A) 1,415 1,394
Global Infrastructure Solutions 5.625%, 06/01/2029 (A) 232 238
GrafTech Finance 4.625%, 12/15/2028 (A) 1,985 2,015
Granite Holdings US Acquisition 11.000%, 10/01/2027 (A) 1,895 2,061
Griffon 5.750%, 03/01/2028 450 467
H&E Equipment Services 3.875%, 12/15/2028 (A) 1,592 1,580
Harsco 5.750%, 07/31/2027 (A) 465 474
Hawaiian Brand Intellectual Property 5.750%, 01/20/2026 (A) 1,130 1,182
Herc Holdings 5.500%, 07/15/2027 (A) 525 546
Hertz 5.000%, 12/01/2029 (A) 1,128 1,1294.625%, 12/01/2026 (A) 425 428
Howmet Aerospace 6.875%, 05/01/2025 5 65.900%, 02/01/2027 535 611
Icahn Enterprises 4.750%, 09/15/2024 660 6854.375%, 02/01/2029 560 546
IEA Energy Services 6.625%, 08/15/2029 (A) 1,225 1,210
JELD-WEN 6.250%, 05/15/2025 (A) 235 2464.875%, 12/15/2027 (A) 15 154.625%, 12/15/2025 (A) 355 358
Korn Ferry 4.625%, 12/15/2027 (A) 1,444 1,487

13SEI Institutional Managed Trust / Quarterly Report / December 31, 2021
SCHEDULE OF INVESTMENTS (Unaudited)December 31, 2021
High Yield Bond Fund (Continued)
DescriptionFace Amount (Thousands)
Market Value ($ Thousands)
CORPORATE OBLIGATIONS (continued)Madison IAQ
5.875%, 06/30/2029 (A) $ 288 $ 2884.125%, 06/30/2028 (A) 50 50
Masonite International 5.375%, 02/01/2028 (A) 298 313
MasTec 4.500%, 08/15/2028 (A) 433 450
Mileage Plus Holdings 6.500%, 06/20/2027 (A) 1,306 1,394
Monitronics International (Escrow Security) 9.125%, 04/01/2020 (B)(D) 5,936 –
Nielsen Finance 5.875%, 10/01/2030 (A) 412 4355.625%, 10/01/2028 (A) 647 668
PGT Innovations 4.375%, 10/01/2029 (A) 133 134
Prime Security Services Borrower 6.250%, 01/15/2028 (A) 640 6675.750%, 04/15/2026 (A) 1,179 1,266
Ritchie Bros Holdings 4.750%, 12/15/2031 (A) 766 799
Roller Bearing of America 4.375%, 10/15/2029 (A) 54 55
Rolls-Royce 5.750%, 10/15/2027 (A) 1,255 1,388
Sensata Technologies 4.375%, 02/15/2030 (A) 1,779 1,8684.000%, 04/15/2029 (A) 416 4253.750%, 02/15/2031 (A) 1,764 1,758
Signature Aviation US Holdings 4.000%, 03/01/2028 (A) 1,133 1,125
Spirit AeroSystems 7.500%, 04/15/2025 (A) 268 2814.600%, 06/15/2028 2,210 2,215
Standard Industries 5.000%, 02/15/2027 (A) 30 314.750%, 01/15/2028 (A) 725 7493.375%, 01/15/2031 (A) 132 127
Stericycle 3.875%, 01/15/2029 (A) 229 226
Stevens Holding 6.125%, 10/01/2026 (A) 245 261
Team Health Holdings 6.375%, 02/01/2025 (A) 3,541 3,333
Terex 5.000%, 05/15/2029 (A) 120 123
Tervita 11.000%, 12/01/2025 (A) 820 944
TransDigm 8.000%, 12/15/2025 (A) 500 5276.250%, 03/15/2026 (A) 3,537 3,6765.500%, 11/15/2027 1,982 2,041
DescriptionFace Amount (Thousands)
Market Value ($ Thousands)
CORPORATE OBLIGATIONS (continued)4.625%, 01/15/2029 $ 488 $ 486
Triumph Group 8.875%, 06/01/2024 (A) 276 3017.750%, 08/15/2025 1,630 1,6186.250%, 09/15/2024 (A) 250 252
Tutor Perini 6.875%, 05/01/2025 (A) 5,808 5,853
Uber Technologies 4.500%, 08/15/2029 (A) 244 248
United Airlines 4.625%, 04/15/2029 (A) 1,117 1,1524.375%, 04/15/2026 (A) 2,488 2,594
United Rentals North America 5.500%, 05/15/2027 378 3934.875%, 01/15/2028 875 919
Wabash National 4.500%, 10/15/2028 (A) 185 187
Welbilt 9.500%, 02/15/2024 190 192
WESCO Distribution 7.250%, 06/15/2028 (A) 411 4517.125%, 06/15/2025 (A) 356 377
Western Global Airlines 10.375%, 08/15/2025 (A) 1,135 1,263
Wolverine Escrow 13.125%, 11/15/2027 (A) 100 649.000%, 11/15/2026 (A) 614 583
113,103
Information Technology — 4.4%ACI Worldwide
5.750%, 08/15/2026 (A) 394 411Ahead DB Holdings
6.625%, 05/01/2028 (A) 1,862 1,848Alliance Data Systems
4.750%, 12/15/2024 (A) 840 857AMS
7.000%, 07/31/2025 (A) 1,617 1,715Arches Buyer
6.125%, 12/01/2028 (A) 1,686 1,6974.250%, 06/01/2028 (A) 213 213
Austin BidCo 7.125%, 12/15/2028 (A) 1,327 1,370
Avaya 6.125%, 09/15/2028 (A) 3,077 3,262
Black Knight InfoServ 3.625%, 09/01/2028 (A) 236 236
Castle US Holding 9.500%, 02/15/2028 (A) 1,205 1,256
CDK Global 5.250%, 05/15/2029 (A) 190 201
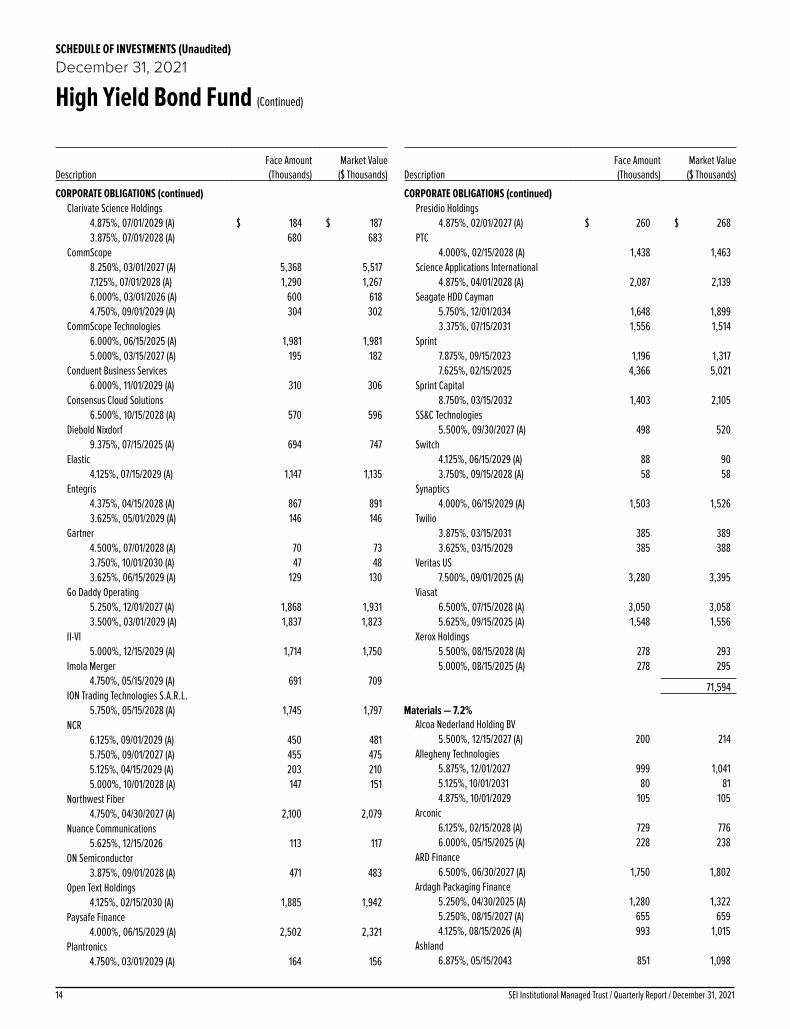
SEI Institutional Managed Trust / Quarterly Report / December 31, 202114
SCHEDULE OF INVESTMENTS (Unaudited)December 31, 2021
High Yield Bond Fund (Continued)
DescriptionFace Amount (Thousands)
Market Value ($ Thousands)
CORPORATE OBLIGATIONS (continued)Clarivate Science Holdings
4.875%, 07/01/2029 (A) $ 184 $ 1873.875%, 07/01/2028 (A) 680 683
CommScope 8.250%, 03/01/2027 (A) 5,368 5,5177.125%, 07/01/2028 (A) 1,290 1,2676.000%, 03/01/2026 (A) 600 6184.750%, 09/01/2029 (A) 304 302
CommScope Technologies 6.000%, 06/15/2025 (A) 1,981 1,9815.000%, 03/15/2027 (A) 195 182
Conduent Business Services 6.000%, 11/01/2029 (A) 310 306
Consensus Cloud Solutions 6.500%, 10/15/2028 (A) 570 596
Diebold Nixdorf 9.375%, 07/15/2025 (A) 694 747
Elastic 4.125%, 07/15/2029 (A) 1,147 1,135
Entegris 4.375%, 04/15/2028 (A) 867 8913.625%, 05/01/2029 (A) 146 146
Gartner 4.500%, 07/01/2028 (A) 70 733.750%, 10/01/2030 (A) 47 483.625%, 06/15/2029 (A) 129 130
Go Daddy Operating 5.250%, 12/01/2027 (A) 1,868 1,9313.500%, 03/01/2029 (A) 1,837 1,823
II-VI 5.000%, 12/15/2029 (A) 1,714 1,750
Imola Merger 4.750%, 05/15/2029 (A) 691 709
ION Trading Technologies S.A.R.L. 5.750%, 05/15/2028 (A) 1,745 1,797
NCR 6.125%, 09/01/2029 (A) 450 4815.750%, 09/01/2027 (A) 455 4755.125%, 04/15/2029 (A) 203 2105.000%, 10/01/2028 (A) 147 151
Northwest Fiber 4.750%, 04/30/2027 (A) 2,100 2,079
Nuance Communications 5.625%, 12/15/2026 113 117
ON Semiconductor 3.875%, 09/01/2028 (A) 471 483
Open Text Holdings 4.125%, 02/15/2030 (A) 1,885 1,942
Paysafe Finance 4.000%, 06/15/2029 (A) 2,502 2,321
Plantronics 4.750%, 03/01/2029 (A) 164 156
DescriptionFace Amount (Thousands)
Market Value ($ Thousands)
CORPORATE OBLIGATIONS (continued)Presidio Holdings
4.875%, 02/01/2027 (A) $ 260 $ 268PTC
4.000%, 02/15/2028 (A) 1,438 1,463Science Applications International
4.875%, 04/01/2028 (A) 2,087 2,139Seagate HDD Cayman
5.750%, 12/01/2034 1,648 1,8993.375%, 07/15/2031 1,556 1,514
Sprint 7.875%, 09/15/2023 1,196 1,3177.625%, 02/15/2025 4,366 5,021
Sprint Capital 8.750%, 03/15/2032 1,403 2,105
SS&C Technologies 5.500%, 09/30/2027 (A) 498 520
Switch 4.125%, 06/15/2029 (A) 88 903.750%, 09/15/2028 (A) 58 58
Synaptics 4.000%, 06/15/2029 (A) 1,503 1,526
Twilio 3.875%, 03/15/2031 385 3893.625%, 03/15/2029 385 388
Veritas US 7.500%, 09/01/2025 (A) 3,280 3,395
Viasat 6.500%, 07/15/2028 (A) 3,050 3,0585.625%, 09/15/2025 (A) 1,548 1,556
Xerox Holdings 5.500%, 08/15/2028 (A) 278 2935.000%, 08/15/2025 (A) 278 295
71,594
Materials — 7.2%Alcoa Nederland Holding BV
5.500%, 12/15/2027 (A) 200 214Allegheny Technologies
5.875%, 12/01/2027 999 1,0415.125%, 10/01/2031 80 814.875%, 10/01/2029 105 105
Arconic 6.125%, 02/15/2028 (A) 729 7766.000%, 05/15/2025 (A) 228 238
ARD Finance 6.500%, 06/30/2027 (A) 1,750 1,802
Ardagh Packaging Finance 5.250%, 04/30/2025 (A) 1,280 1,3225.250%, 08/15/2027 (A) 655 6594.125%, 08/15/2026 (A) 993 1,015
Ashland 6.875%, 05/15/2043 851 1,098
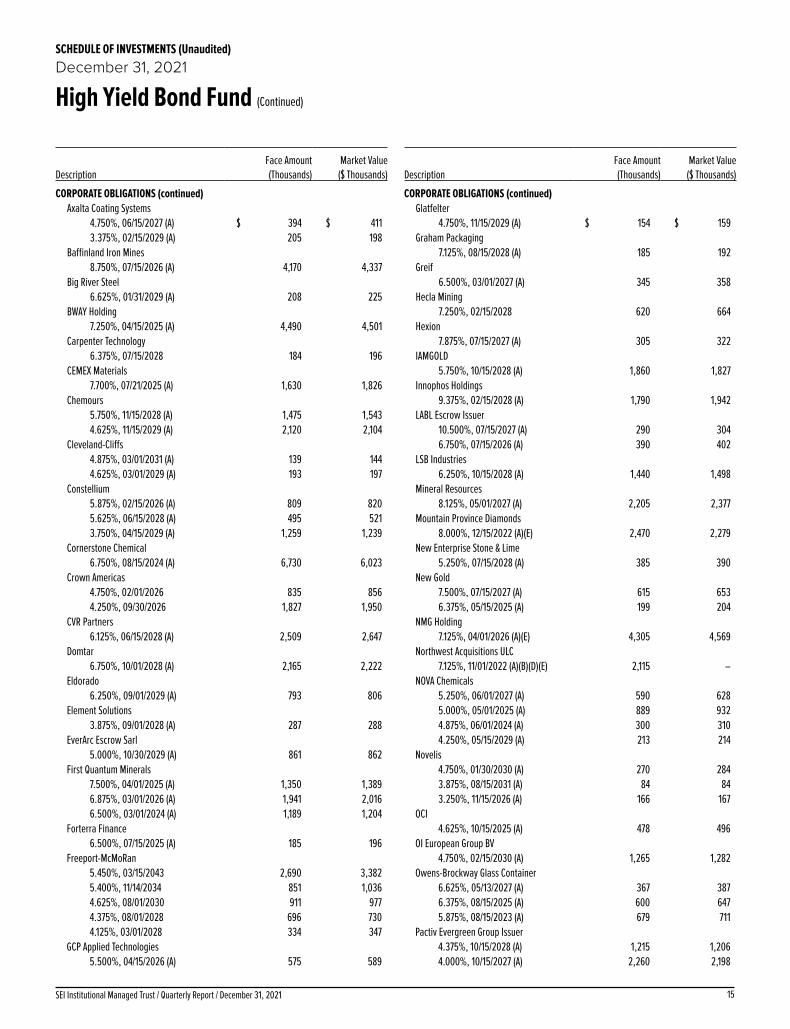
15SEI Institutional Managed Trust / Quarterly Report / December 31, 2021
SCHEDULE OF INVESTMENTS (Unaudited)December 31, 2021
High Yield Bond Fund (Continued)
DescriptionFace Amount (Thousands)
Market Value ($ Thousands)
CORPORATE OBLIGATIONS (continued)Axalta Coating Systems
4.750%, 06/15/2027 (A) $ 394 $ 4113.375%, 02/15/2029 (A) 205 198
Baffinland Iron Mines 8.750%, 07/15/2026 (A) 4,170 4,337
Big River Steel 6.625%, 01/31/2029 (A) 208 225
BWAY Holding 7.250%, 04/15/2025 (A) 4,490 4,501
Carpenter Technology 6.375%, 07/15/2028 184 196
CEMEX Materials 7.700%, 07/21/2025 (A) 1,630 1,826
Chemours 5.750%, 11/15/2028 (A) 1,475 1,5434.625%, 11/15/2029 (A) 2,120 2,104
Cleveland-Cliffs 4.875%, 03/01/2031 (A) 139 1444.625%, 03/01/2029 (A) 193 197
Constellium 5.875%, 02/15/2026 (A) 809 8205.625%, 06/15/2028 (A) 495 5213.750%, 04/15/2029 (A) 1,259 1,239
Cornerstone Chemical 6.750%, 08/15/2024 (A) 6,730 6,023
Crown Americas 4.750%, 02/01/2026 835 8564.250%, 09/30/2026 1,827 1,950
CVR Partners 6.125%, 06/15/2028 (A) 2,509 2,647
Domtar 6.750%, 10/01/2028 (A) 2,165 2,222
Eldorado 6.250%, 09/01/2029 (A) 793 806
Element Solutions 3.875%, 09/01/2028 (A) 287 288
EverArc Escrow Sarl 5.000%, 10/30/2029 (A) 861 862
First Quantum Minerals 7.500%, 04/01/2025 (A) 1,350 1,3896.875%, 03/01/2026 (A) 1,941 2,0166.500%, 03/01/2024 (A) 1,189 1,204
Forterra Finance 6.500%, 07/15/2025 (A) 185 196
Freeport-McMoRan 5.450%, 03/15/2043 2,690 3,3825.400%, 11/14/2034 851 1,0364.625%, 08/01/2030 911 9774.375%, 08/01/2028 696 7304.125%, 03/01/2028 334 347
GCP Applied Technologies 5.500%, 04/15/2026 (A) 575 589
DescriptionFace Amount (Thousands)
Market Value ($ Thousands)
CORPORATE OBLIGATIONS (continued)Glatfelter
4.750%, 11/15/2029 (A) $ 154 $ 159Graham Packaging
7.125%, 08/15/2028 (A) 185 192Greif
6.500%, 03/01/2027 (A) 345 358Hecla Mining
7.250%, 02/15/2028 620 664Hexion
7.875%, 07/15/2027 (A) 305 322IAMGOLD
5.750%, 10/15/2028 (A) 1,860 1,827Innophos Holdings
9.375%, 02/15/2028 (A) 1,790 1,942LABL Escrow Issuer
10.500%, 07/15/2027 (A) 290 3046.750%, 07/15/2026 (A) 390 402
LSB Industries 6.250%, 10/15/2028 (A) 1,440 1,498
Mineral Resources 8.125%, 05/01/2027 (A) 2,205 2,377
Mountain Province Diamonds 8.000%, 12/15/2022 (A)(E) 2,470 2,279
New Enterprise Stone & Lime 5.250%, 07/15/2028 (A) 385 390
New Gold 7.500%, 07/15/2027 (A) 615 6536.375%, 05/15/2025 (A) 199 204
NMG Holding 7.125%, 04/01/2026 (A)(E) 4,305 4,569
Northwest Acquisitions ULC 7.125%, 11/01/2022 (A)(B)(D)(E) 2,115 –
NOVA Chemicals 5.250%, 06/01/2027 (A) 590 6285.000%, 05/01/2025 (A) 889 9324.875%, 06/01/2024 (A) 300 3104.250%, 05/15/2029 (A) 213 214
Novelis 4.750%, 01/30/2030 (A) 270 2843.875%, 08/15/2031 (A) 84 843.250%, 11/15/2026 (A) 166 167
OCI 4.625%, 10/15/2025 (A) 478 496
OI European Group BV 4.750%, 02/15/2030 (A) 1,265 1,282
Owens-Brockway Glass Container 6.625%, 05/13/2027 (A) 367 3876.375%, 08/15/2025 (A) 600 6475.875%, 08/15/2023 (A) 679 711
Pactiv Evergreen Group Issuer 4.375%, 10/15/2028 (A) 1,215 1,2064.000%, 10/15/2027 (A) 2,260 2,198
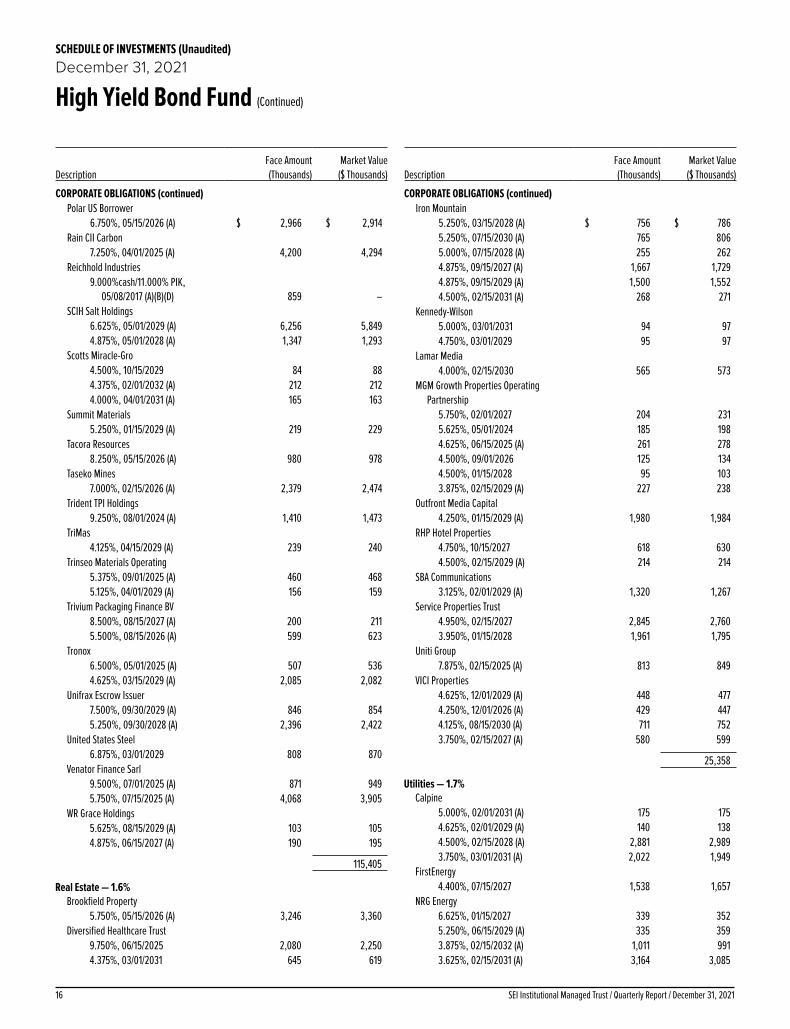
SEI Institutional Managed Trust / Quarterly Report / December 31, 202116
SCHEDULE OF INVESTMENTS (Unaudited)December 31, 2021
High Yield Bond Fund (Continued)
DescriptionFace Amount (Thousands)
Market Value ($ Thousands)
CORPORATE OBLIGATIONS (continued)Polar US Borrower
6.750%, 05/15/2026 (A) $ 2,966 $ 2,914Rain CII Carbon
7.250%, 04/01/2025 (A) 4,200 4,294Reichhold Industries
9.000%cash/11.000% PIK, 05/08/2017 (A)(B)(D) 859 –
SCIH Salt Holdings 6.625%, 05/01/2029 (A) 6,256 5,8494.875%, 05/01/2028 (A) 1,347 1,293
Scotts Miracle-Gro 4.500%, 10/15/2029 84 884.375%, 02/01/2032 (A) 212 2124.000%, 04/01/2031 (A) 165 163
Summit Materials 5.250%, 01/15/2029 (A) 219 229
Tacora Resources 8.250%, 05/15/2026 (A) 980 978
Taseko Mines 7.000%, 02/15/2026 (A) 2,379 2,474
Trident TPI Holdings 9.250%, 08/01/2024 (A) 1,410 1,473
TriMas 4.125%, 04/15/2029 (A) 239 240
Trinseo Materials Operating 5.375%, 09/01/2025 (A) 460 4685.125%, 04/01/2029 (A) 156 159
Trivium Packaging Finance BV 8.500%, 08/15/2027 (A) 200 2115.500%, 08/15/2026 (A) 599 623
Tronox 6.500%, 05/01/2025 (A) 507 5364.625%, 03/15/2029 (A) 2,085 2,082
Unifrax Escrow Issuer 7.500%, 09/30/2029 (A) 846 8545.250%, 09/30/2028 (A) 2,396 2,422
United States Steel 6.875%, 03/01/2029 808 870
Venator Finance Sarl 9.500%, 07/01/2025 (A) 871 9495.750%, 07/15/2025 (A) 4,068 3,905
WR Grace Holdings 5.625%, 08/15/2029 (A) 103 1054.875%, 06/15/2027 (A) 190 195
115,405
Real Estate — 1.6%Brookfield Property
5.750%, 05/15/2026 (A) 3,246 3,360Diversified Healthcare Trust
9.750%, 06/15/2025 2,080 2,2504.375%, 03/01/2031 645 619
DescriptionFace Amount (Thousands)
Market Value ($ Thousands)
CORPORATE OBLIGATIONS (continued)Iron Mountain
5.250%, 03/15/2028 (A) $ 756 $ 7865.250%, 07/15/2030 (A) 765 8065.000%, 07/15/2028 (A) 255 2624.875%, 09/15/2027 (A) 1,667 1,7294.875%, 09/15/2029 (A) 1,500 1,5524.500%, 02/15/2031 (A) 268 271
Kennedy-Wilson 5.000%, 03/01/2031 94 974.750%, 03/01/2029 95 97
Lamar Media 4.000%, 02/15/2030 565 573
MGM Growth Properties Operating Partnership
5.750%, 02/01/2027 204 2315.625%, 05/01/2024 185 1984.625%, 06/15/2025 (A) 261 2784.500%, 09/01/2026 125 1344.500%, 01/15/2028 95 1033.875%, 02/15/2029 (A) 227 238
Outfront Media Capital 4.250%, 01/15/2029 (A) 1,980 1,984
RHP Hotel Properties 4.750%, 10/15/2027 618 6304.500%, 02/15/2029 (A) 214 214
SBA Communications 3.125%, 02/01/2029 (A) 1,320 1,267
Service Properties Trust 4.950%, 02/15/2027 2,845 2,7603.950%, 01/15/2028 1,961 1,795
Uniti Group 7.875%, 02/15/2025 (A) 813 849
VICI Properties 4.625%, 12/01/2029 (A) 448 4774.250%, 12/01/2026 (A) 429 4474.125%, 08/15/2030 (A) 711 7523.750%, 02/15/2027 (A) 580 599
25,358
Utilities — 1.7%Calpine
5.000%, 02/01/2031 (A) 175 1754.625%, 02/01/2029 (A) 140 1384.500%, 02/15/2028 (A) 2,881 2,9893.750%, 03/01/2031 (A) 2,022 1,949
FirstEnergy 4.400%, 07/15/2027 1,538 1,657
NRG Energy 6.625%, 01/15/2027 339 3525.250%, 06/15/2029 (A) 335 3593.875%, 02/15/2032 (A) 1,011 9913.625%, 02/15/2031 (A) 3,164 3,085

17SEI Institutional Managed Trust / Quarterly Report / December 31, 2021
SCHEDULE OF INVESTMENTS (Unaudited)December 31, 2021
High Yield Bond Fund (Continued)
DescriptionFace Amount (Thousands)
Market Value ($ Thousands)
CORPORATE OBLIGATIONS (continued)3.375%, 02/15/2029 (A) $ 115 $ 113
Pattern Energy Operations 4.500%, 08/15/2028 (A) 1,659 1,721
PG&E 5.250%, 07/01/2030 1,974 2,0705.000%, 07/01/2028 284 299
Pike 5.500%, 09/01/2028 (A) 192 192
Rockpoint Gas Storage Canada 7.000%, 03/31/2023 (A) 1,995 1,990
Talen Energy Supply 10.500%, 01/15/2026 (A) 735 3167.625%, 06/01/2028 (A) 5 47.250%, 05/15/2027 (A) 385 3416.625%, 01/15/2028 (A) 1,090 9566.500%, 06/01/2025 600 239
Vistra 7.000%, VAR US Treas Yield Curve
Rate T Note Const Mat 5 Yr + 5.740%(A)(C) 2,209 2,237
Vistra Operations 5.625%, 02/15/2027 (A) 457 4715.000%, 07/31/2027 (A) 2,526 2,6224.375%, 05/01/2029 (A) 1,461 1,4634.300%, 07/15/2029 (A) 808 864
27,593
Total Corporate Obligations
(Cost $1,164,111) ($ Thousands) 1,172,420
LOAN PARTICIPATIONS — 10.6%1236904 B.C. Ltd., Initial Term Loan, 1st
Lien5.604%, VAR LIBOR + 5.500%,
03/04/2027 176 173AAdvantage Loyality IP Ltd. (American
Airlines, Inc.), Initial Term Loan, 1st Lien5.500%, VAR LIBOR + 4.750%,
04/20/2028 3,059 3,164ACProducts Holdings, Inc., Initial Term
Loan, 1st Lien4.750%, VAR LIBOR + 4.250%,
05/17/2028 334 329Adient US LLC, Term B-1 Loan, 1st Lien
3.604%, VAR LIBOR + 3.500%, 04/10/2028 282 282
Agrofresh Inc., Initial Term Loan, 1st Lien7.250%, 12/31/2024 (G) 1,406 1,412
DescriptionFace Amount (Thousands)
Market Value ($ Thousands)
LOAN PARTICIPATIONS (continued)AI Convoy (Luxembourg) S.a r.l., Facility B
(USD), 1st Lien4.500%, 01/18/2027 $ 2 $ 24.500%, 01/18/2027 2 2
AI Convoy (Luxembourg) S.a r.l., Facility B1 (USD), 1st Lien
4.500%, VAR LIBOR + 3.500%, 01/18/2027 845 845
Alchemy US Holdco 1 LLC, Initial Term Loan, 1st Lien
5.604%, 10/10/2025 248 247Alchemy US Holdco 1, LLC, Initial Term
Loan, 1st Lien5.604%, 10/10/2025 248 2475.604%, VAR LIBOR + 5.500%,
10/10/2025 488 487Alvogen Pharma US, Inc., January 2020
Loan, 1st Lien6.250%, VAR LIBOR + 5.250%,
12/31/2023 1,896 1,806American Gaming, Term Loan, 1st Lien
14.000%, 02/15/2024 (D)(G) 854 867American Trailer World Corp., Initial Term
Loan, 1st Lien4.500%, VAR LIBOR + 3.750%,
03/03/2028 384 382AOC/Aliancys, Inc., Term Loan, 1st Lien
4.250%, 09/30/2028 981 979AP Core Holdings II LLC, Term B1 Loan,
1st Lien6.250%, 09/01/2027 (H) 1,098 1,097
AP Core Holdings II LLC, Term B2 Loan, 1st Lien
6.250%, 09/01/2027 (H) 1,098 1,099AP Gaming I, LLC, Incremental Term B Loan,
1st Lien4.500%, VAR LIBOR + 3.500%,
02/15/2024 718 713Apollo Commercial Real Estate Finance,
Inc., Term B-1 Loan, 1st Lien4.000%, VAR LIBOR + 3.500%,
03/11/2028 (D) 754 748Arctic Canadian Diamond Company Ltd.,
Term Loan A-2, 1st Lien6.000%, 12/31/2024 (D) 161 160
Arctic Canadian Diamond Company Ltd., Term Loan, 2nd Lien
17.500%, 12/31/2027 (D) 1,058 1,059Aruba Investments Holdings, LLC, Initial
Term Loan, 2nd Lien8.500%, 11/24/2028 (G) 1,060 1,062

SEI Institutional Managed Trust / Quarterly Report / December 31, 202118
SCHEDULE OF INVESTMENTS (Unaudited)December 31, 2021
High Yield Bond Fund (Continued)
DescriptionFace Amount (Thousands)
Market Value ($ Thousands)
LOAN PARTICIPATIONS (continued)ASP Unifrax Holdings, Inc., Term Loan B,
1st Lien3.974%, 12/12/2025 (H) $ 640 $ 630
Autokiniton, Term Loan B, 1st Lien5.000%, 04/06/2028 (G) 1,058 1,059
Bausch Health Companies Inc., Initial Term Loan, 1st Lien
3.104%, VAR LIBOR + 3.000%, 06/02/2025 378 376
Blackhawk Network Cov-Lite, Term Loan, 2nd Lien
7.125%, 06/15/2026 1,412 1,400Boardriders Inc., Closing Date Tranche A
Loan, 1st Lien9.000%, 10/23/2023 (E) 391 383
Boardriders Inc., Closing Date Tranche B-2 Loan, 1st Lien
9.000%, 04/23/2024 (E) 1,626 1,594Bright Bidco, Term Loan B, 1st Lien
4.500%, 06/30/2024 1,127 866BWay Holding Company , Initial Term Loan,
1st Lien3.354%, VAR LIBOR + 3.250%,
04/03/2024 1,234 1,216Byju's Cov-Lite, Term Loan, 1st Lien
6.250%, 11/05/2026 (H) 3,592 3,627Carecentrix 4/18 Cov-Lite, Term Loan, 1st
Lien4.724%, 04/03/2025 (G) 753 748
Carestream Health Inc., 2023 Extended Term Loan, 1st Lien
7.750%, 05/08/2023 (G) 1,366 1,368Carestream Health Inc., 2023 Extended
Term Loan, 2nd Lien13.500%, 08/08/2023 (G) 2,477 2,403
CBAC Borrower, LLC, Term Loan B, 1st Lien4.104%, 07/08/2024 (G) 1,486 1,464
CCI Buyer, Inc., Initial Term Loan, 1st Lien4.500%, VAR LIBOR + 4.000%,
12/17/2027 167 167Cenveo Corporation, Exit Term Loan, 1st
Lien8.500%, 06/23/2026 2,230 2,188
Cincinnati Bell Inc., Term B-2 Loan, 1st Lien3.750%, 11/17/2028 105 105
Claire's Stores, Inc., Initial Term Loan, 1st Lien
6.604%, VAR LIBOR + 6.500%, 12/18/2026 1,122 1,114
Clarios Global, Term Loan 1st Lien3.354%, VAR LIBOR + 3.250%,
04/30/2026 592 588
DescriptionFace Amount (Thousands)
Market Value ($ Thousands)
LOAN PARTICIPATIONS (continued)CNT Holdings I Corp, Initial Term Loan,
1st Lien4.250%, VAR LIBOR + 3.750%,
11/08/2027 $ 767 $ 767ConvergeOne Holdings, Corp., Initial Term
Loan, 1st Lien5.104%, VAR LIBOR + 5.000%,
01/04/2026 2,760 2,698Delta Topco, Inc., Initial Term Loan, 2nd
Lien8.002%, VAR LIBOR + 7.250%,
12/01/2028 891 895DexKo Global Inc., Term B Loan, 1st Lien
4.250%, 09/22/2028 325 324DirectTV Financing LLC, Closing Date Term
Loan, 1st Lien5.750%, 08/02/2027 4,251 4,252
DMT Solutions Global Corporation, Initial Term Loan, 1st Lien
8.500%, 07/02/2024 (D) 605 590DMT Solutions Global Corporation, Term
Loan8.500%, 07/02/2024 593 579
E.W. Scripps Company, The, Tranche B-3 Term Loan, 1st Lien
3.750%, VAR LIBOR + 3.000%, 01/07/2028 518 517
East Valley Tourist Development Authority , Term Loan, 1st Lien
8.500%, VAR LIBOR + 8.000%, 03/07/2022 (D) 2,823 2,815
Emerald Expositions Holding Inc., Initial Term Loan, 1st Lien
2.604%, 05/22/2024 978 936Endo Luxembourg Finance Company S.a.r.l,
Term Loan, 1st Lien5.750%, 03/27/2028 (G) 754 732
Enterprise Development Authority, Term Loan B, 1st Lien
5.000%, 02/28/2028 (D)(G) 2,748 2,742Envision Healthcare Corporation, Initial
Term Loan, 1st Lien3.854%, VAR LIBOR + 3.750%,
10/10/2025 (H) 7,572 6,071Epic Crude Services, LP, Term Loan, 1st Lien
5.180%, VAR LIBOR + 5.000%, 03/02/2026 1,699 1,317
Epic Y-Grade Services LP, Term Loan, 1st Lien
7.000%, 06/30/2027 (H) 5,494 4,623

19SEI Institutional Managed Trust / Quarterly Report / December 31, 2021
SCHEDULE OF INVESTMENTS (Unaudited)December 31, 2021
High Yield Bond Fund (Continued)
DescriptionFace Amount (Thousands)
Market Value ($ Thousands)
LOAN PARTICIPATIONS (continued)eResearchTechnology, Inc., Initial Term
Loan, 1st Lien5.500%, VAR LIBOR + 4.500%,
02/04/2027 $ 2,370 $ 2,376First Student Bidco Inc, Initial Term B Loan,
1st Lien3.500%, 07/21/2028 (H) 245 244
First Student Bidco Inc, Initial Term C Loan, 1st Lien
3.500%, 07/21/2028 (H) 90 90Foresight Energy Operating, LLC, Tranche A
Term Loan, 1st Lien9.500%, VAR LIBOR + 8.000%,
06/30/2027 (D) 226 226Freeport LNG investments, LLLP, Initial
Term B Loan, 1st Lien4.000%, 11/17/2028 1,560 1,544
Gates Global LLC, Initial B-3 Dollar Term Loan, 1st Lien
3.250%, 03/31/2027 (G) 409 408Geon Performance Solutions LLC, Initial
Term Loan, 1st Lien5.500%, 08/18/2028 464 467
Global Medical Response, Inc., 2018 New Term Loan, 1st Lien
5.250%, VAR LIBOR + 4.250%, 03/14/2025 (H) 446 444
Grab Holdings, Inc., Initial Term Loan, 1st Lien
5.500%, VAR LIBOR + 4.500%, 01/29/2026 3,430 3,435
Graham Packaging Company Inc., Initial Term Loan (2021), 1st Lien
3.750%, VAR LIBOR + 3.000%, 08/04/2027 347 346
Greeneden U.S. Holdings I, LLC, Initial Dollar Term Loan (2020), 1st Lien
4.750%, VAR LIBOR + 4.000%, 12/01/2027 283 283
Gulf Finance, LLC, Term Loan, 1st Lien7.750%, VAR LIBOR + 6.750%,
08/25/2026 (H) 2,017 1,879Hercules Achievement, Inc. (Varsity Brands
Holding Co., Inc.), Initial Term Loan, 1st Lien
4.500%, VAR LIBOR + 3.500%, 12/16/2024 306 299
Hoffmaster Group, Term Loan B, 1st Lien5.000%, 11/21/2023 (G) 501 465
DescriptionFace Amount (Thousands)
Market Value ($ Thousands)
LOAN PARTICIPATIONS (continued)iHeartCommunications, Inc. (fka Clear
Channel Communications, Inc.), New Term Loan, 1st Lien
3.104%, VAR LIBOR + 3.000%, 05/01/2026 $ 426 $ 422
IRB Holding Corp., Fourth Amendment Incremental Term Loan, 1st Lien
4.250%, 12/15/2027 228 228Ivanti Software, Inc., 2021 Specified
Refinancing Term Loan, 1st Lien5.000%, VAR LIBOR + 4.250%,
12/01/2027 1,517 1,518Ivanti Software, Inc., First Amendment
Term Loan, 1st Lien4.750%, VAR LIBOR + 4.000%,
12/01/2027 300 298J.C. Penney Corporation Inc., Term Loan,
1st Lien5.250%, VAR LIBOR + 4.250%,
06/23/2023 (B)(D) 2,253 2Journey Personal Care Corp., Initial Term
Loan, 1st Lien5.000%, 03/01/2028 (G) 2,025 2,022
Jump Financial LLC, Term Loan, 1st Lien4.000%, 08/07/2028 2,460 2,441
Knight Energy Services, Exit Facility Loan8.500%, 02/09/2024 (D)(G) 66 —
KNS Acquisition Corp., Initial Term Loan, 1st Lien
7.000%, VAR LIBOR + 6.250%, 04/21/2027 2,175 2,126
LABL, Inc., Initial Dollar Term Loan, 1st Lien5.500%, 10/20/2028 (H) 287 286
Lifescan Global Corporation, Initial Term Loan, 1st Lien
6.130%, 10/01/2024 (G) 5,659 5,520Madison IAQ, LLC, Initial Term Loan, 1st Lien
3.750%, VAR LIBOR + 3.250%, 06/21/2028 250 250
Magnite Inc., Initial Term Loan, 1st Lien5.750%, 04/28/2028 (G) 636 632
Mashantucket (Western) Pequot Tribe, Term Loan B, 1st Lien
8.375%, VAR LIBOR + 8.125%, 02/16/2022 5,207 5,031
Mavenir Systems Inc., Initial Term Loan, 1st Lien
5.250%, 08/18/2028 1,095 1,092MED ParentCo LP, Initial Term Loan, 1st Lien
4.354%, 08/31/2026 642 640
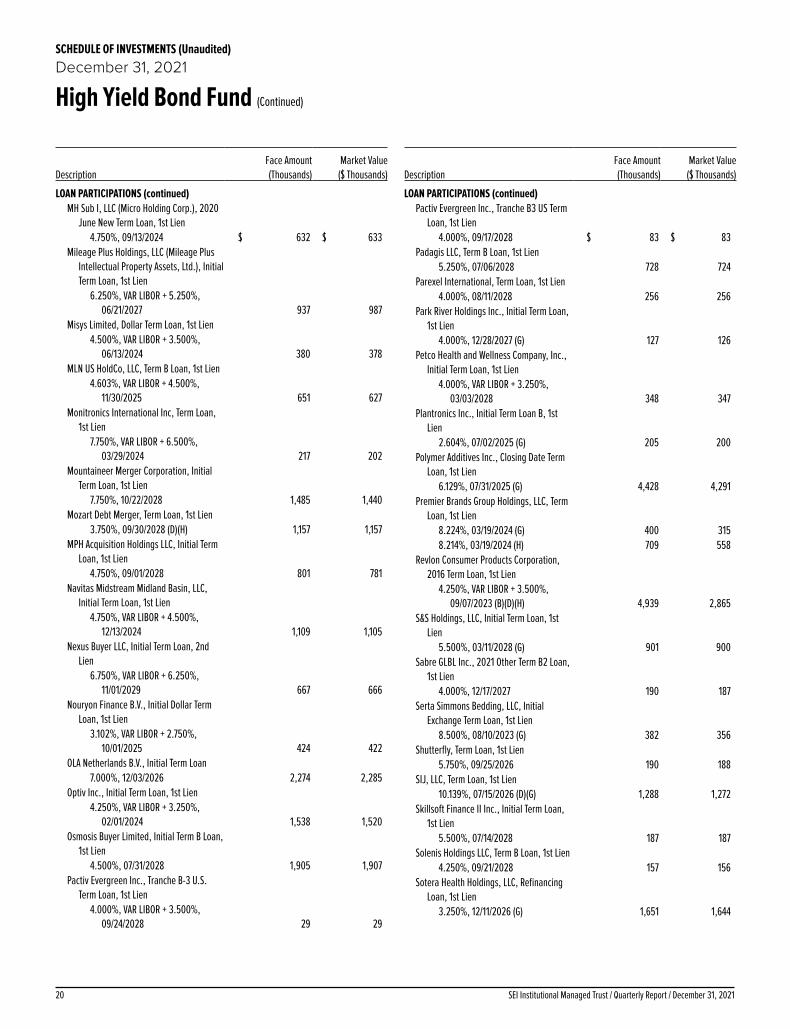
SEI Institutional Managed Trust / Quarterly Report / December 31, 202120
SCHEDULE OF INVESTMENTS (Unaudited)December 31, 2021
High Yield Bond Fund (Continued)
DescriptionFace Amount (Thousands)
Market Value ($ Thousands)
LOAN PARTICIPATIONS (continued)MH Sub I, LLC (Micro Holding Corp.), 2020
June New Term Loan, 1st Lien4.750%, 09/13/2024 $ 632 $ 633
Mileage Plus Holdings, LLC (Mileage Plus Intellectual Property Assets, Ltd.), Initial Term Loan, 1st Lien
6.250%, VAR LIBOR + 5.250%, 06/21/2027 937 987
Misys Limited, Dollar Term Loan, 1st Lien4.500%, VAR LIBOR + 3.500%,
06/13/2024 380 378MLN US HoldCo, LLC, Term B Loan, 1st Lien
4.603%, VAR LIBOR + 4.500%, 11/30/2025 651 627
Monitronics International Inc, Term Loan, 1st Lien
7.750%, VAR LIBOR + 6.500%, 03/29/2024 217 202
Mountaineer Merger Corporation, Initial Term Loan, 1st Lien
7.750%, 10/22/2028 1,485 1,440Mozart Debt Merger, Term Loan, 1st Lien
3.750%, 09/30/2028 (D)(H) 1,157 1,157MPH Acquisition Holdings LLC, Initial Term
Loan, 1st Lien4.750%, 09/01/2028 801 781
Navitas Midstream Midland Basin, LLC, Initial Term Loan, 1st Lien
4.750%, VAR LIBOR + 4.500%, 12/13/2024 1,109 1,105
Nexus Buyer LLC, Initial Term Loan, 2nd Lien
6.750%, VAR LIBOR + 6.250%, 11/01/2029 667 666
Nouryon Finance B.V., Initial Dollar Term Loan, 1st Lien
3.102%, VAR LIBOR + 2.750%, 10/01/2025 424 422
OLA Netherlands B.V., Initial Term Loan7.000%, 12/03/2026 2,274 2,285
Optiv Inc., Initial Term Loan, 1st Lien4.250%, VAR LIBOR + 3.250%,
02/01/2024 1,538 1,520Osmosis Buyer Limited, Initial Term B Loan,
1st Lien4.500%, 07/31/2028 1,905 1,907
Pactiv Evergreen Inc., Tranche B-3 U.S. Term Loan, 1st Lien
4.000%, VAR LIBOR + 3.500%, 09/24/2028 29 29
DescriptionFace Amount (Thousands)
Market Value ($ Thousands)
LOAN PARTICIPATIONS (continued)Pactiv Evergreen Inc., Tranche B3 US Term
Loan, 1st Lien4.000%, 09/17/2028 $ 83 $ 83
Padagis LLC, Term B Loan, 1st Lien5.250%, 07/06/2028 728 724
Parexel International, Term Loan, 1st Lien4.000%, 08/11/2028 256 256
Park River Holdings Inc., Initial Term Loan, 1st Lien
4.000%, 12/28/2027 (G) 127 126Petco Health and Wellness Company, Inc.,
Initial Term Loan, 1st Lien4.000%, VAR LIBOR + 3.250%,
03/03/2028 348 347Plantronics Inc., Initial Term Loan B, 1st
Lien2.604%, 07/02/2025 (G) 205 200
Polymer Additives Inc., Closing Date Term Loan, 1st Lien
6.129%, 07/31/2025 (G) 4,428 4,291Premier Brands Group Holdings, LLC, Term
Loan, 1st Lien8.224%, 03/19/2024 (G) 400 3158.214%, 03/19/2024 (H) 709 558
Revlon Consumer Products Corporation, 2016 Term Loan, 1st Lien
4.250%, VAR LIBOR + 3.500%, 09/07/2023 (B)(D)(H) 4,939 2,865
S&S Holdings, LLC, Initial Term Loan, 1st Lien
5.500%, 03/11/2028 (G) 901 900Sabre GLBL Inc., 2021 Other Term B2 Loan,
1st Lien4.000%, 12/17/2027 190 187
Serta Simmons Bedding, LLC, Initial Exchange Term Loan, 1st Lien
8.500%, 08/10/2023 (G) 382 356Shutterfly, Term Loan, 1st Lien
5.750%, 09/25/2026 190 188SIJ, LLC, Term Loan, 1st Lien
10.139%, 07/15/2026 (D)(G) 1,288 1,272Skillsoft Finance II Inc., Initial Term Loan,
1st Lien5.500%, 07/14/2028 187 187
Solenis Holdings LLC, Term B Loan, 1st Lien4.250%, 09/21/2028 157 156
Sotera Health Holdings, LLC, Refinancing Loan, 1st Lien
3.250%, 12/11/2026 (G) 1,651 1,644

21SEI Institutional Managed Trust / Quarterly Report / December 31, 2021
SCHEDULE OF INVESTMENTS (Unaudited)December 31, 2021
High Yield Bond Fund (Continued)
DescriptionFace Amount (Thousands)
Market Value ($ Thousands)
LOAN PARTICIPATIONS (continued)SP PF Buyer, LLC, Closing Date Term Loan,
1st Lien4.604%, VAR LIBOR + 4.500%,
12/22/2025 $ 1,502 $ 1,454Springs Window Fashions LLC, Tranche B
Term Loan, 1st Lien4.750%, 09/17/2028 1,505 1,490
Staples, Inc., 2019 Refinancing New Term B-1 Loan, 1st Lien
5.132%, VAR LIBOR + 5.000%, 04/16/2026 3,744 3,612
Summer (BC) Bidco B LLC, Additional Facility Term B2 Loan, 1st Lien
5.250%, 12/04/2026 90 90Sunshine Luxembourg VII S.a r.l., Facility
B3, 1st Lien4.500%, VAR LIBOR + 3.750%,
10/01/2026 784 786Syniverse Holdings, Inc., Initial Term Loan,
2nd Lien10.000%, VAR LIBOR + 9.000%,
03/11/2024 1,125 1,112Syniverse Holdings, Inc., Tranche C Term
Loan , 1st Lien6.000%, VAR LIBOR + 5.000%,
03/09/2023 6,322 6,277Team Health Holdings, Inc., Initial Term
Loan, 1st Lien3.750%, VAR LIBOR + 2.750%,
02/06/2024 3,463 3,301Tecta America Corp., Term Loan, 1st Lien
5.000%, VAR LIBOR + 4.250%, 04/10/2028 903 902
Thryv Inc., Initial Term Loan, 1st Lien9.500%, 03/01/2026 (G) 1,027 1,041
Titan Acquisition Limited, Initial Term Loan, 1st Lien
3.354%, VAR LIBOR + 3.000%, 03/28/2025 1,061 1,043
TK Elevator Midco GmbH, Facility Term B1 Loan, 1st Lien
4.000%, 07/30/2027 275 275Tortoise Borrower, LLC, Initial Term Loan,
1st Lien4.500%, 01/31/2025 (G) 1,021 752
Travelport Finance (Luxembourg) S.a r.l., Initial Term Loan (Priority), 1st Lien
2.500%, 02/28/2025 (H) 443 455Travelport Finance (Luxembourg) S.a r.l.,
Initial Term Loan, 1st Lien5.132%, VAR LIBOR + 5.000%,
05/29/2026 (H) 966 802
DescriptionFace Amount (Thousands)
Market Value ($ Thousands)
LOAN PARTICIPATIONS (continued)Traverse Midstream Partners, LLC,
Advance, 1st Lien5.250%, VAR LIBOR + 4.250%,
09/27/2024 $ 506 $ 502Triton Water Holdings, Inc., Initial Term
Loan0.069%, 03/31/2028 18 18
Triton Water Holdings, Inc., Initial Term Loan, 1st Lien
4.000%, VAR LIBOR + 3.500%, 03/31/2028 1,286 1,271
Tutor Perini Corporation, Term Loan, 1st Lien
5.750%, 08/18/2027 (G) 1,921 1,921U.S. Renal Care, Inc., Initial Term Loan,
1st Lien5.104%, VAR LIBOR + 5.000%,
06/26/2026 481 466UKG Inc., 2021 Incremental Term Loan,
2nd Lien5.750%, VAR LIBOR + 5.250%,
05/03/2027 (H) 532 533VeriFone Systems, Inc., Initial Term Loan,
1st Lien4.178%, VAR LIBOR + 4.000%,
08/20/2025 1,519 1,491Vertiv Group Corporation, Term Loan, 1st
Lien2.844%, 03/02/2027 (G) 148 147
Whatabrands LLC, Initial Term B Loan, 1st Lien
3.750%, 08/03/2028 (H) 1,039 1,035White Cap Buyer, LLC, Initial Closing Date
Term Loan, 1st Lien4.500%, VAR LIBOR + 4.000%,
10/19/2027 440 439Wilsonart, LLC, Tranche E Term Loan, 1st
Lien4.500%, VAR LIBOR + 3.500%,
12/31/2026 2,145 2,142Wok Holdings Inc., Initial Term Loan, 1st
Lien6.354%, 03/01/2026 (G) 646 639
Woodford Express, LLC, Initial Term Loan, 1st Lien
6.000%, 01/27/2025 2,205 2,181

SEI Institutional Managed Trust / Quarterly Report / December 31, 202122
SCHEDULE OF INVESTMENTS (Unaudited)December 31, 2021
High Yield Bond Fund (Continued)
DescriptionFace Amount (Thousands)
Market Value ($ Thousands)
LOAN PARTICIPATIONS (continued)Zayo Group Holdings, Inc., Initial Dollar
Term Loan, 1st Lien3.104%, VAR LIBOR + 3.000%,
03/09/2027 (H) $ 227 $ 224
Total Loan Participations
(Cost $168,636) ($ Thousands) 168,525
ASSET-BACKED SECURITIES — 9.9%Other Asset-Backed Securities — 9.9%
Airplanes Pass-Through Trust, Ser 2001-1A, Cl A9(I)
0.735%, VAR ICE LIBOR USD 1 Month + 0.550%, 03/15/2019 (A)(B)(D) 587 21
Ares CLO XXXIV, Ser 2020-2A, Cl FR8.722%, VAR ICE LIBOR USD 3 Month
+ 8.600%, 04/17/2033 (A)(D) 1,446 1,330B&M CLO, Ser 2014-1A, Cl E
5.872%, VAR ICE LIBOR USD 3 Month + 5.750%, 04/16/2026 (A)(D) 2,546 1,839
Battalion CLO VII, Ser 2014-7A, Cl SUB0.000%, 07/17/2028(A)(D)(F) 4,490 718
Battalion CLO VIII, Ser 2015-8A, Cl SUB0.000%, 07/18/2030(A)(D)(F) 3,390 2,170
Battalion CLO X, Ser 2016-10A, Cl SUB0.000%, 01/25/2035(A)(D)(F) 4,450 4,066
Battalion CLO XI, Ser 2017-11A, Cl SUB0.000%, 04/24/2034(A)(D)(F) 5,857 4,803
Battalion CLO XII, Ser 2018-12A, Cl SUB0.000%, 05/17/2031(A)(D)(F) 4,663 3,375
Battalion CLO XIV, Ser 2019-14A0.000%, 04/20/2032(D)(F) 3,427 2,605
Battalion CLO XVI, Ser 2019-16A, Cl SUB0.000%, 12/19/2032(A)(D)(F) 2,128 1,947
Battalion CLO XX, Ser 2021-20A0.000%, 07/15/2034(D)(F) 4,839 4,422
Benefit Street Partners CLO III, Ser 2013-IIIA, Cl SUB
0.000%, 07/20/2029(A)(D)(F) 2,531 683Benefit Street Partners CLO IV
0.000%, 07/20/2026*(A)(D)(F) 7 3,195Benefit Street Partners CLO IX
0.000%, 07/20/2025(A)(D)(F) 2,293 1,476Benefit Street Partners CLO V
0.000%, 10/20/2026(A)(D)(F) 6,387 –Benefit Street Partners CLO V-B
0.000%, 04/20/2031(D)(F) 10,259 5,365Benefit Street Partners CLO VI, Ser 2015-
VIA, Cl SUB0.000%, 10/18/2029(A)(D)(F) 7,502 4,218
DescriptionFace Amount (Thousands)
Market Value ($ Thousands)
ASSET-BACKED SECURITIES (continued)Benefit Street Partners CLO VII, Ser 2015-
VIII, Cl SUB0.000%, 07/18/2027(D)(F) $ 6,715 $ 101
Benefit Street Partners CLO VIII0.000%, 01/20/2028(A)(D)(F) 6,720 3,427
Benefit Street Partners CLO X, Ser 2016-10A, Cl SUB
0.000%, 04/20/2034(A)(D)(F) 7,631 4,350Benefit Street Partners CLO XIV, Ser 2018-
14A, Cl SUB0.000%, 04/20/2031(A)(D)(F) 3,809 2,626
Benefit Street Partners CLO XVIII, Ser 2019-18A, Cl SUB
0.000%, 10/15/2034(A)(D)(F) 3,486 2,783Benefit Street Partners CLO XX, Ser 2020-
20A, Cl SUB0.000%, 07/15/2034(A)(D)(F) 2,261 2,214
Benefit Street Partners CLO XXIII, Ser 2021-23A
0.000%, 04/25/2034(D)(F) 5,130 4,135Blue Ridge CLO II, Ser 2014-2A, Cl D
4.922%, VAR ICE LIBOR USD 3 Month + 4.800%, 07/18/2026 (A)(B)(D) 2,309 1,928
Blue Ridge CLO II, Ser 2014-2A, Cl E5.922%, VAR ICE LIBOR USD 3 Month
+ 5.800%, 07/18/2026 (A)(B)(D) 2,761 307Cathedral Lake CLO III, Ser 2015-3A, Cl SUB
0.000%, 01/15/2026(A)(D)(F) 2,725 1,253Cathedral Lake V, Ser 2018-5A, Cl SUB
0.000%, 10/21/2030(A)(D)(F) 3,139 1,507First Eagle Clarendon Fund CLO, Ser 2015-
1A, Cl E6.174%, VAR ICE LIBOR USD 3 Month
+ 6.050%, 01/25/2027 (A)(D) 2,352 2,315Great Lakes CLO, Ser 2015-1A, Cl ER
7.482%, VAR ICE LIBOR USD 3 Month + 7.360%, 01/16/2030 (A)(D) 3,253 3,100
Great Lakes CLO, Ser 2015-1A, Cl FR10.122%, VAR ICE LIBOR USD 3 Month
+ 10.000%, 01/16/2030 (A)(D) 1,198 1,082Great Lakes CLO, Ser 2015-1A, Cl SUB
0.000%, 01/16/2030(A)(D)(F) 4,519 2,734Great Lakes CLO, Ser 2017-1A, Cl ER
7.624%, VAR ICE LIBOR USD 3 Month + 7.500%, 10/15/2029 (A)(D) 3,321 3,227
Ivy Hill Middle Market Credit Fund VII, Ser 2013-7A, Cl SUB
0.000%, 10/20/2029(A)(D)(F) 2,484 1,664Ivy Hill Middle Market Credit Fund XII,
Ser 2017-12A, Cl SUB0.000%, 07/20/2029(A)(D)(F) 651 613

23SEI Institutional Managed Trust / Quarterly Report / December 31, 2021
SCHEDULE OF INVESTMENTS (Unaudited)December 31, 2021
High Yield Bond Fund (Continued)
DescriptionFace Amount (Thousands)
Market Value ($ Thousands)
ASSET-BACKED SECURITIES (continued)Ivy Hill Middle Market Credit Fund XIV,
Ser 2018-14A, Cl D7.192%, VAR ICE LIBOR USD 3 Month +
7.070%, 04/18/2030 (A)(D) $ 1,559 $ 1,503IVY Hill Middle Market Credit Fund XIV,
Ser 2018-14A, Cl SUB0.000%, 04/18/2030(A)(D)(F) 1,169 715
LCM CLO, Ser 31A0.000%, 01/20/2032(D)(F) 1,115 926
Lockwood Grove CLO, Ser 2014-1A, Cl SUB0.000%, 01/25/2030(A)(D)(F) 3,797 2,696
Lockwood Grove CLO, Ser 2018-1A, Cl ERR5.974%, VAR ICE LIBOR USD 3 Month
+ 5.850%, 01/25/2030 (A)(D) 2,499 2,437Neuberger Berman CLO XXII, Ser 2016-22A,
Cl SUB0.000%, 10/17/2027(A)(D)(F) 3,640 2,040
Neuberger Berman Loan Advisers CLO XLI, Ser 2021-41
0.000%, 04/15/2034(D)(F) 2,534 2,164Neuberger Berman Loan Advisers CLO
XXXIX, Ser 2020-390.000%, 01/20/2032(D)(F) 3,294 2,825
Neuberger Berman Loan Advisers CLO XXXVI, Ser 2020-36A, Cl INC
0.000%, 04/20/2033(A)(D)(F) 1,095 855Neuberger Berman Loan Advisers CLO
XXXVIII0.000%, 10/20/2032(D)(F) 3,438 2,953
Neuberger Berman Loan Advisers CLO, Ser 2020-36A, Cl SPIN
0.114%, 04/20/2033 (A)(D)(G) 14 11NewStar Exeter Fund CLO, Ser 2015-1A, Cl E
7.332%, VAR ICE LIBOR USD 3 Month + 7.200%, 01/20/2027 (A)(D) 3,890 3,694
NewStar Fairfield Fund CLO, Ser 2015-2A, Cl SUB
0.000%, 04/20/2030(A)(D)(F) 7,983 4,269OCP CLO, Ser 2017-14A, Cl SUB
0.000%, 11/20/2030(A)(D)(F) 1,655 1,010OCP CLO, Ser 2020-19A, Cl SUB
0.000%, 10/20/2034(A)(D)(F) 1,224 1,297OCP CLO, Ser 2021-21A
0.000%, 07/20/2034(D)(F) 4,413 3,807Shackleton CLO, Ser 2014-6RA
0.000%, 07/17/2028(D)(F) 6,388 2,811Shackleton CLO, Ser 2019-14A, Cl SUB
0.000%, 07/20/2034(A)(D)(F) 1,999 1,459TCP Whitney CLO, Ser 2017-1I, Cl SUB
0.000%, 08/20/2029(D)(F) 9,085 7,449TCW CLO, Ser 2017-1A, Cl SUB
0.000%, 10/29/2034(A)(D)(F) 4,194 2,978
DescriptionFace Amount (Thousands)
Market Value ($ Thousands)
ASSET-BACKED SECURITIES (continued)TCW CLO, Ser 2018-1A, Cl SUB
0.000%, 04/25/2031(A)(D)(F) $ 2,978 $ 2,057TCW CLO, Ser 2019-2A, Cl SUB
0.000%, 10/20/2032(A)(D)(F) 3,528 2,611TCW CLO, Ser 2020-1
0.000%, 04/20/2028(D)(F) 5,352 3,853Venture CDO, Ser 2016-25A, Cl SUB
0.000%, 04/20/2029(A)(D)(F) 2,030 903Venture CLO XXVI, Ser 2017-26A, Cl SUB
0.000%, 01/20/2029(A)(D)(F) 1,609 660Venture CLO XXVIII, Ser 2017-28A, Cl SUB
0.000%, 07/20/2030(A)(D)(F) 3,228 1,775Venture CLO XXXV, Ser 2018-35A, Cl SUB
0.000%, 10/22/2031(A)(D)(F) 11,892 5,708Voya CLO, Ser 2020-2
0.000%, 07/19/2034(D)(F) 4,915 4,835Wind River CLO, Ser 2021-3
0.000%, 07/20/2033(D)(F) 6,577 5,533
Total Asset-Backed Securities
(Cost $101,966) ($ Thousands) 157,433
Shares
COMMON STOCK — 2.0%21st Century Oncology Private Company
*(D) 15,311 154Aquity Holdings Inc *(D) 85,745 965Arctic Canadian Diamond Company Ltd.
*(D) 1,054 —Aspect Software, Cl CR1 *(D) 27,500 —Aspect Software, Cl CR2 *(D) 11,134 —Battalion Oil Corp * 418 4Berry Corp 331,646 2,793Cenveo Corporation *(D) 84,157 603CHC Group * 399 —Chesapeake Energy Corp 934 60Civitas Resources 33,962 1,663Clear Channel Outdoor Holdings Inc, Cl A * 202,317 670Copper Property Pass-Through Certificates
*(D)(E) 147,922 3,402EP Energy Corp * 15,235 1,325Frontier Communications Parent Inc * 14,809 437Guitar Center *(D) 13,905 2,416Gulfport Energy Operating Corp * 8,256 595Gymboree Holding Corp *(D)(E) 40,312 —Hexion Holdings Corp, Cl B *(E) 100,575 2,857iHeartMedia Inc * 37,193 782Knight Energy Services *(D)(J) 1,764 —Magnachip Semiconductor Corp * 22,871 479Medical Card Systems *(D) 284,758 136Monitronics International Inc *(D)(K) 211,006 2,278MYT Holding LLC *(D) 274,755 1,133

SEI Institutional Managed Trust / Quarterly Report / December 31, 202124
SCHEDULE OF INVESTMENTS (Unaudited)December 31, 2021
High Yield Bond Fund (Continued)
Description SharesMarket Value
($ Thousands)
COMMON STOCK (continued)Neiman Marcus Group *(D) 5,934 $ 872Neiman Marcus Group *(D)(E) 620 91Nine West FKA Premier Brands *(D) 92,548 67Noble Corp * 15,164 372Oasis Petroleum Inc 8,448 1,064Parker Drilling Co *(D)(E)(K) 79,089 356Penney Borrower LLC * 19,723 242Quad/Graphics Inc * 54 —Reichhold Industries *(D) 1,427 2,757Rue 21 * 1,835 771SandRidge Energy Inc * 8,295 87Titan Energy LLC *(D) 22,243 —Valaris Ltd * 22,905 825VICI Properties Inc ‡ 52,784 1,590Whiting Petroleum Corp * 4,453 288Windstream Services * 10,897 182
Total Common Stock
(Cost $26,524) ($ Thousands) 32,316
PREFERRED STOCK — 0.4%Boardriders Inc., 0.000% *(D)(E)(F) 215,931 264Bowlero, 0.000% *(D)(F) 1,110 1,110Claire's Stores, 0.000% *(D)(E)(F) 777 944Crestwood Equity Partners, 9.250% (C)(L) 113,214 1,114FHLMC, 0.000% *(C)(F) 16,903 62FNMA, 0.000% *(C)(F) 24,650 90Foresight, 0.000% *(D)(E)(F) 32,601 424Guitar Center, 0.000% *(D)(F) 365 36Gulfport Energy, 0.000% *(D)(F) 26 134Ladenburg Thalmann Financial Services,
6.500% * 64,888 1,113MPLX, 8.462% *(C)(D)(K) 23,039 806MYT Holding LLC, 10.000% 325,766 350ViacomCBS, 5.750% * 11,480 577
Total Preferred Stock
(Cost $6,879) ($ Thousands) 7,024
Face Amount (Thousands)
CONVERTIBLE BONDS — 0.4%Air Canada CV to 65.134
4.000% , 07/01/2025 $ 260 343Chesapeake Energy CV to 116.7134
5.500% , 12/31/2049 100 1DISH Network CV to 15.343
3.375% , 08/15/2026 465 440Golar LNG CV to 26.9925
2.750% , 02/15/2022 556 555
DescriptionFace Amount (Thousands)
Market Value ($ Thousands)
CONVERTIBLE BONDS (continued)Liberty Latin America CV to 48.4315
2.000% , 07/15/2024 $ 1,145 $ 1,125Liberty Media CV to 16.776
3.750% , 02/15/2030 2,640 2,007Liberty Media CV to 22.947
4.000% , 11/15/2029 488 366Pebblebrook Hotel Trust CV to 39.2549
1.750% , 12/15/2026 715 787Twitter CV to 7.6905
0.897% , 03/15/2026(A)(M) 765 685
Total Convertible Bonds(Cost $5,854) ($ Thousands) 6,309
Number of Warrants
WARRANTS — 0.1%Carestream Health Inc.
Strike Price $– *‡‡(D) 47 –Chesapeake Energy Corp,
Expires 02/12/2026Strike Price $27.63 * 1,516 61
Chesapeake Energy Corp, Expires 02/12/2026Strike Price $32.13 * 1,684 60
Chesapeake Energy Corp, Expires 02/12/2026Strike Price $36.18 * 1,763 57
Guitar Center, Expires 12/22/2070Strike Price $100.00 *(D) 3,680 292
Guitar Center, Expires 12/22/2070Strike Price $160.00 *(D) 3,681 180
Neiman Marcus GroupStrike Price *‡‡(D) 3,938 77
Noble Corp, Expires 02/05/2028Strike Price $0.01 * 22,660 240
SandRidge Energy Inc, Expires 10/07/2022Strike Price $41.34 * 7,165 –
SandRidge Energy Inc, Expires 10/07/2022Strike Price $42.03 * 3,017 –
WindstreamStrike Price $– *‡‡(D) 104 2
Windstream ServicesStrike Price $– *‡‡ 12,184 232
Total Warrants(Cost $578) ($ Thousands) 1,201

25SEI Institutional Managed Trust / Quarterly Report / December 31, 2021
SCHEDULE OF INVESTMENTS (Unaudited)December 31, 2021
High Yield Bond Fund (Continued)
Description SharesMarket Value
($ Thousands)
AFFILIATED PARTNERSHIP — 0.0%SEI Liquidity Fund, L.P.
0.020% **†(N) 1,141 $ 1
Total Affiliated Partnership (Cost $1) ($ Thousands) 1
CASH EQUIVALENT — 1.7%SEI Daily Income Trust, Government
Fund, Cl F0.010%**† 27,158,850 27,159
Total Cash Equivalent(Cost $27,159) ($ Thousands) 27,159
Total Investments in Securities — 98.7%(Cost $1,501,708) ($ Thousands) $ 1,572,388
Percentages are based on Net Assets of $1,592,544 ($ Thousands).* Non-income producing security.** The rate reported is the 7-day effective yield as of December 31, 2021.† Investment in Affiliated Security.‡ Real Estate Investment Trust.‡‡ Expiration date not available.(A) Security exempt from registration under Rule 144A of the Securities Act of
1933. These securities may be resold in transactions exempt from registration normally to qualified institutions. On December 31, 2021, the value of these securities amounted to $1,033,640 ($ Thousands), representing 64.9% of the Net Assets of the Fund.
(B) Security is in default on interest payment.(C) Perpetual security with no stated maturity date.(D) Level 3 security in accordance with fair value hierarchy.(E) Securities considered restricted. The total market value of such securities as of
December 31, 2021 was $17,740 ($ Thousands) and represented 1.1% of the Net Assets of the Fund.
(F) No interest rate available.(G) Variable or floating rate security, the interest rate of which adjusts periodically
based on changes in current interest rates and prepayments on the underlying pool of assets.
(H) Unsettled bank loan. Interest rate may not be available.(I) Security, or a portion thereof, is owned through a holding entity, 717 AEP
Leasing, LLC.(J) Security, or a portion thereof, is owned through a holding entity, Knights Energy
Topco, LLC.(K) Securities considered illiquid. The total value of such securities as of December
31, 2021 was $3,427 ($ Thousands) and represented 0.2% of the Net Assets of the Fund.
(L) Security is a Master Limited Partnership. At December 31, 2021, such securities amounted to $1,114 ($ Thousands), or 0.1% of the Net Assets of the Fund.
(M) Zero coupon security. The rate shown on the Schedule of Investments is the security's effective yield at the time of purchase.
(N) This security was purchased with cash collateral held from securities on loan. The total market value of such securities as of December 31, 2021 was $1 ($ Thousands).
CDO — Collateralized Debt ObligationCl — ClassCLO — Collateralized Loan ObligationCV — Convertible SecurityDAC — Designated Activity CompanyFHLMC — Federal Home Loan Mortgage CorporationFNMA — Federal National Mortgage AssociationICE— Intercontinental ExchangeLIBOR— London Interbank Offered RateLLC — Limited Liability CompanyLLLP — Limited Liability Limited PartnershipL.P. — Limited PartnershipLtd. — LimitedMTN — Medium Term NotePIK — Payment-in-KindREIT — Real Estate investment TrustSer — SeriesULC — Unlimited Liability CompanyUSD — U.S. DollarVAR — Variable Rate
The following is a list of the level of inputs used as of December 31, 2021, in valuing the Fund’s investments carried at value ($ Thousands):
Investments in SecuritiesLevel 1
($)Level 2
($)Level 3
($)(1)Total
($)Corporate Obligations – 1,171,804 616 1,172,420Loan Participations – 154,022 14,503 168,525Asset-Backed Securities – – 157,433 157,433Common Stock 12,662 4,424 15,230 32,316Preferred Stock 2,131 1,175 3,718 7,024Convertible Bonds – 6,309 – 6,309Warrants 57 593 551 1,201Affiliated Partnership – 1 – 1Cash Equivalent 27,159 – – 27,159
Total Investments in Securities 42,009 1,338,328 192,051 1,572,388
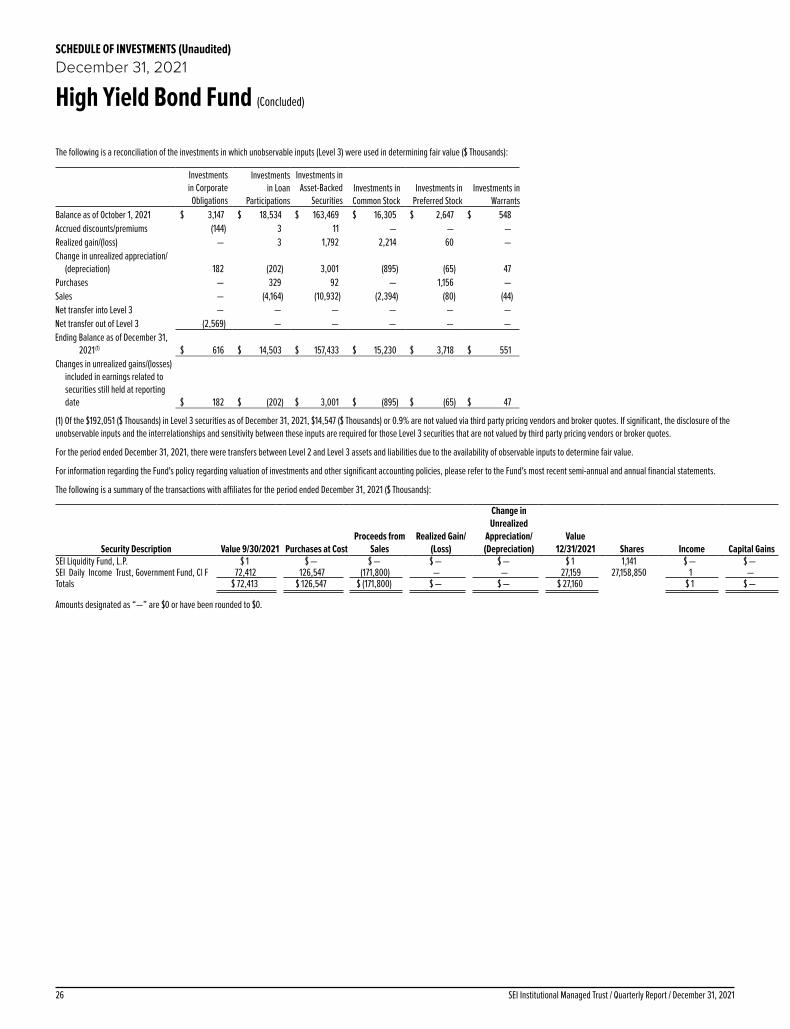
SEI Institutional Managed Trust / Quarterly Report / December 31, 202126
SCHEDULE OF INVESTMENTS (Unaudited)December 31, 2021
High Yield Bond Fund (Concluded)
The following is a reconciliation of the investments in which unobservable inputs (Level 3) were used in determining fair value ($ Thousands):
Investments in Corporate Obligations
Investments in Loan
Participations
Investments in Asset-Backed
SecuritiesInvestments in Common Stock
Investments in Preferred Stock
Investments in Warrants
Balance as of October 1, 2021 $ 3,147 $ 18,534 $ 163,469 $ 16,305 $ 2,647 $ 548Accrued discounts/premiums (144) 3 11 — — —Realized gain/(loss) — 3 1,792 2,214 60 —Change in unrealized appreciation/
(depreciation) 182 (202) 3,001 (895) (65) 47Purchases — 329 92 — 1,156 —Sales — (4,164) (10,932) (2,394) (80) (44)Net transfer into Level 3 — — — — — —Net transfer out of Level 3 (2,569) — — — — —Ending Balance as of December 31,
2021(1) $ 616 $ 14,503 $ 157,433 $ 15,230 $ 3,718 $ 551Changes in unrealized gains/(losses)
included in earnings related to securities still held at reporting date $ 182 $ (202) $ 3,001 $ (895) $ (65) $ 47
(1) Of the $192,051 ($ Thousands) in Level 3 securities as of December 31, 2021, $14,547 ($ Thousands) or 0.9% are not valued via third party pricing vendors and broker quotes. If significant, the disclosure of the unobservable inputs and the interrelationships and sensitivity between these inputs are required for those Level 3 securities that are not valued by third party pricing vendors or broker quotes.
For the period ended December 31, 2021, there were transfers between Level 2 and Level 3 assets and liabilities due to the availability of observable inputs to determine fair value.
For information regarding the Fund's policy regarding valuation of investments and other significant accounting policies, please refer to the Fund's most recent semi-annual and annual financial statements.
The following is a summary of the transactions with affiliates for the period ended December 31, 2021 ($ Thousands):
Security Description Value 9/30/2021 Purchases at Cost Proceeds from
Sales Realized Gain/
(Loss)
Change in Unrealized
Appreciation/(Depreciation)
Value12/31/2021 Shares Income Capital Gains
SEI Liquidity Fund, L.P. $ 1 $ — $ — $ — $ — $ 1 1,141 $ — $ — SEI Daily Income Trust, Government Fund, Cl F 72,412 126,547 (171,800) — — 27,159 27,158,850 1 — Totals $ 72,413 $ 126,547 $ (171,800) $ — $ — $ 27,160 $ 1 $ —
Amounts designated as “—” are $0 or have been rounded to $0.
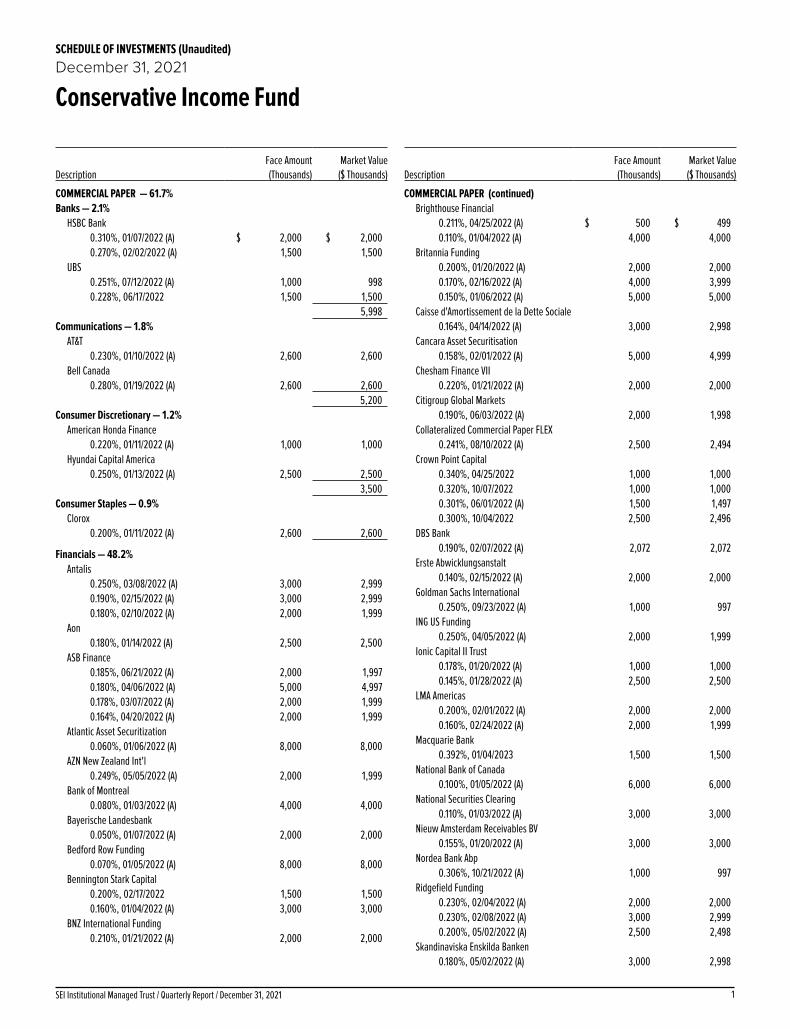
1SEI Institutional Managed Trust / Quarterly Report / December 31, 2021
SCHEDULE OF INVESTMENTS (Unaudited)December 31, 2021
Conservative Income Fund
DescriptionFace Amount (Thousands)
Market Value ($ Thousands)
COMMERCIAL PAPER — 61.7%Banks — 2.1%
HSBC Bank0.310%, 01/07/2022 (A) $ 2,000 $ 2,0000.270%, 02/02/2022 (A) 1,500 1,500
UBS0.251%, 07/12/2022 (A) 1,000 9980.228%, 06/17/2022 1,500 1,500
5,998Communications — 1.8%
AT&T0.230%, 01/10/2022 (A) 2,600 2,600
Bell Canada0.280%, 01/19/2022 (A) 2,600 2,600
5,200Consumer Discretionary — 1.2%
American Honda Finance0.220%, 01/11/2022 (A) 1,000 1,000
Hyundai Capital America0.250%, 01/13/2022 (A) 2,500 2,500
3,500Consumer Staples — 0.9%
Clorox0.200%, 01/11/2022 (A) 2,600 2,600
Financials — 48.2%Antalis
0.250%, 03/08/2022 (A) 3,000 2,9990.190%, 02/15/2022 (A) 3,000 2,9990.180%, 02/10/2022 (A) 2,000 1,999
Aon0.180%, 01/14/2022 (A) 2,500 2,500
ASB Finance0.185%, 06/21/2022 (A) 2,000 1,9970.180%, 04/06/2022 (A) 5,000 4,9970.178%, 03/07/2022 (A) 2,000 1,9990.164%, 04/20/2022 (A) 2,000 1,999
Atlantic Asset Securitization0.060%, 01/06/2022 (A) 8,000 8,000
AZN New Zealand Int'l0.249%, 05/05/2022 (A) 2,000 1,999
Bank of Montreal0.080%, 01/03/2022 (A) 4,000 4,000
Bayerische Landesbank0.050%, 01/07/2022 (A) 2,000 2,000
Bedford Row Funding0.070%, 01/05/2022 (A) 8,000 8,000
Bennington Stark Capital0.200%, 02/17/2022 1,500 1,5000.160%, 01/04/2022 (A) 3,000 3,000
BNZ International Funding0.210%, 01/21/2022 (A) 2,000 2,000
DescriptionFace Amount (Thousands)
Market Value ($ Thousands)
COMMERCIAL PAPER (continued)Brighthouse Financial
0.211%, 04/25/2022 (A) $ 500 $ 4990.110%, 01/04/2022 (A) 4,000 4,000
Britannia Funding0.200%, 01/20/2022 (A) 2,000 2,0000.170%, 02/16/2022 (A) 4,000 3,9990.150%, 01/06/2022 (A) 5,000 5,000
Caisse d'Amortissement de la Dette Sociale0.164%, 04/14/2022 (A) 3,000 2,998
Cancara Asset Securitisation0.158%, 02/01/2022 (A) 5,000 4,999
Chesham Finance VII0.220%, 01/21/2022 (A) 2,000 2,000
Citigroup Global Markets0.190%, 06/03/2022 (A) 2,000 1,998
Collateralized Commercial Paper FLEX0.241%, 08/10/2022 (A) 2,500 2,494
Crown Point Capital0.340%, 04/25/2022 1,000 1,0000.320%, 10/07/2022 1,000 1,0000.301%, 06/01/2022 (A) 1,500 1,4970.300%, 10/04/2022 2,500 2,496
DBS Bank0.190%, 02/07/2022 (A) 2,072 2,072
Erste Abwicklungsanstalt0.140%, 02/15/2022 (A) 2,000 2,000
Goldman Sachs International0.250%, 09/23/2022 (A) 1,000 997
ING US Funding0.250%, 04/05/2022 (A) 2,000 1,999
Ionic Capital II Trust0.178%, 01/20/2022 (A) 1,000 1,0000.145%, 01/28/2022 (A) 2,500 2,500
LMA Americas0.200%, 02/01/2022 (A) 2,000 2,0000.160%, 02/24/2022 (A) 2,000 1,999
Macquarie Bank0.392%, 01/04/2023 1,500 1,500
National Bank of Canada0.100%, 01/05/2022 (A) 6,000 6,000
National Securities Clearing0.110%, 01/03/2022 (A) 3,000 3,000
Nieuw Amsterdam Receivables BV0.155%, 01/20/2022 (A) 3,000 3,000
Nordea Bank Abp0.306%, 10/21/2022 (A) 1,000 997
Ridgefield Funding0.230%, 02/04/2022 (A) 2,000 2,0000.230%, 02/08/2022 (A) 3,000 2,9990.200%, 05/02/2022 (A) 2,500 2,498
Skandinaviska Enskilda Banken0.180%, 05/02/2022 (A) 3,000 2,998

SEI Institutional Managed Trust / Quarterly Report / December 31, 20212
SCHEDULE OF INVESTMENTS (Unaudited)December 31, 2021
Conservative Income Fund (Continued)
DescriptionFace Amount (Thousands)
Market Value ($ Thousands)
COMMERCIAL PAPER (continued)Starbird Funding
0.298%, 05/04/2022 (A) $ 2,000 $ 1,998Swedbank NY
0.180%, 02/07/2022 (A) 4,000 4,0000.175%, 04/20/2022 (A) 2,000 1,999
Washington Morgan Capital0.500%, 09/01/2022 2,000 1,999
Westpac Banking0.271%, 10/14/2022 (A) 1,000 997
138,520Government — 1.4%
Province of British Columbia Canada0.150%, 03/08/2022 (A) 4,000 3,999
Materials — 2.8%Amcor Finance USA
0.280%, 01/14/2022 (A) 2,600 2,600Great Bear Funding
0.160%, 01/12/2022 (A) 3,000 3,000Nutrien
0.280%, 01/18/2022 (A) 2,600 2,599 8,199
Technology — 2.4%Lime Funding
0.230%, 02/10/2022 (A) 2,000 1,9990.210%, 01/12/2022 (A) 5,000 5,000
6,999Utilities — 0.9%
National Grid North America0.280%, 01/20/2022 (A) 2,600 2,600
Total Commercial Paper (Cost $177,626) ($ Thousands) 177,615
CORPORATE OBLIGATIONS — 4.0%Consumer Discretionary — 2.2%
Jets Stadium Development 0.170%, 04/01/2047 (B)(C) 4,000 4,000
Toyota Motor Credit MTN 0.330%, VAR United States Secured
Overnight Financing Rate + 0.280%, 12/14/2022 643 644
0.200%, VAR United States Secured Overnight Financing Rate + 0.150%, 08/15/2022 1,752 1,750
6,394
Financials — 1.8%Bank of Montreal
0.200%, VAR United States Secured Overnight Financing Rate + 0.150%, 09/21/2022 2,000 1,999
DescriptionFace Amount (Thousands)
Market Value ($ Thousands)
CORPORATE OBLIGATIONS (continued)Goldman Sachs Bank USA NY
0.220%, VAR United States Secured Overnight Financing Rate + 0.170%, 07/26/2022 $ 1,000 $ 999
Sumitomo Mitsui Banking 0.220%, VAR United States Secured
Overnight Financing Rate + 0.170%, 09/14/2022 2,000 1,999
4,997
Total Corporate Obligations
(Cost $11,395) ($ Thousands) 11,391
U.S. TREASURY OBLIGATION — 1.4%U.S. Treasury Bill
0.110%, 04/26/2022 (A) 4,043 4,042
Total U.S. Treasury Obligation (Cost $4,041) ($ Thousands) 4,042
MUNICIPAL BONDS — 0.7%California — 0.3%
Tender Option Bond Trust Receipts, Ser 2021-XMT0950, RB Callable 11/01/2031 @ 100
0.120%, 11/01/2035 (B)(C) 1,000 1,000
New York — 0.4%Metropolitan Transportation Authority,
Ser A, RB Callable 04/15/2022 @ 100
0.777%, 11/15/2022 1,145 1,146
Total Municipal Bonds(Cost $2,145) ($ Thousands) 2,146
CERTIFICATES OF DEPOSIT — 27.8%Australia & New Zealand Banking Group
0.228%, 03/09/2022 (B) 1,500 1,5000.203%, 03/02/2022 (B) 1,000 1,000
Bank of Montreal 0.230%, 06/06/2022 1,500 1,5000.214%, 02/23/2022 1,000 1,0000.205%, 05/16/2022 1,500 1,5000.196%, 08/15/2022 2,000 2,000
Bank of Nova Scotia 0.250%, 06/17/2022 2,000 2,0000.210%, 06/03/2022 2,000 2,000

3SEI Institutional Managed Trust / Quarterly Report / December 31, 2021
SCHEDULE OF INVESTMENTS (Unaudited)December 31, 2021
Conservative Income Fund (Continued)
DescriptionFace Amount (Thousands)
Market Value ($ Thousands)
CERTIFICATES OF DEPOSIT (continued)Canadian Imperial Bank of Commerce NY
0.350%, 01/06/2023 $ 1,000 $ 1,0000.238%, 06/07/2022 2,000 2,0000.234%, 01/14/2022 1,000 1,0000.180%, 06/08/2022 2,000 2,000
Credit Industriel et Commercial 0.194%, 05/06/2022 2,000 2,000
Credit Suisse NY 0.300%, 06/01/2022 1,500 1,5000.270%, 04/08/2022 1,500 1,500
Kookmin Bank 0.334%, 02/07/2022 1,000 1,000
Landesbank Baden-Wuerttemberg NY 0.070%, 01/07/2022 9,500 9,5000.070%, 01/07/2022 3,000 3,000
Lloyds Bank Corporate Markets NY 0.230%, 08/17/2022 1,200 1,200
Mitsubishi UFJ Trust and Banking NY 0.300%, 04/22/2022 3,000 3,000
MUFG Bank NY 0.330%, 11/01/2022 1,500 1,4980.300%, 10/31/2022 1,000 9990.230%, 01/28/2022 2,000 2,000
National Australia Bank 0.260%, 03/29/2022 (B) 1,500 1,5010.170%, 06/16/2022 (B) 1,500 1,500
Natixis NY 0.220%, 08/05/2022 1,750 1,750
Norinchukin Bank 0.210%, 03/14/2022 5,000 5,000
Standard Chartered Bank NY 0.274%, 03/18/2022 4,000 4,0010.240%, 09/02/2022 1,500 1,500
Sumitomo Mitsui Banking 0.220%, 06/22/2022 1,500 1,5000.172%, 01/20/2022 1,750 1,7500.050%, 01/04/2022 3,000 3,000
Toronto-Dominion Bank 0.300%, 10/25/2022 1,500 1,498
UBS 0.350%, 12/08/2022 1,500 1,5000.290%, 04/05/2022 1,000 1,0000.250%, 02/08/2022 2,500 2,5000.217%, 09/22/2022 2,000 1,998
Westpac Banking 0.178%, 02/17/2022 (B) 2,800 2,8000.155%, 02/04/2022 (B) 1,500 1,500
Total Certificates of Deposit (Cost $80,000) ($ Thousands) 79,995
Description SharesMarket Value
($ Thousands)CASH EQUIVALENT — 0.0%
SEI Daily Income Trust, Government Fund, Cl F
0.010%**† 1,290 $ 1
Total Cash Equivalent(Cost $1) ($ Thousands) 1
Face Amount (Thousands)
REPURCHASE AGREEMENTS (D)— 4.9%Bank of America Securities
0.050%, dated 12/31/2021, to be repurchased on 1/3/2022, repurchase price $6,000,008 (collateralized by U.S. Treasury obligations, par value $5,608,900, 2.625%, 2/15/2029; with total market value $6,120,021) $ 6,000 6,000
Goldman Sachs & Co0.050%, dated 12/31/2021, to be repurchased on 1/3/2022, repurchase price $2,000,003 (collateralized by GNMA obligations, ranging in par value $25,000 - $814,348, 2.500% - 4.500%, 12/20/2032 - 7/20/2051; with total market value $2,040,000) 2,000 2,000
TD Securities0.050%, dated 12/31/2021, to be repurchased on 1/3/2022, repurchase price $6,000,008 (collateralized by U.S. Treasury obligations, par value $5,935,500, 2.500%, 3/31/2023; with total market value $6,120,027) 6,000 6,000
Total Repurchase Agreements
(Cost $14,000) ($ Thousands) 14,000
Total Investments in Securities — 100.5%(Cost $289,208) ($ Thousands) $ 289,190
Percentages are based on Net Assets of $287,691 ($ Thousands).** The rate reported is the 7-day effective yield as of December 31, 2021.† Investment in Affiliated Security.(A) Zero coupon security. The rate shown on the Schedule of Investments is the
security's effective yield at the time of purchase.(B) Variable or floating rate security, the interest rate of which adjusts
periodically based on prevailing interest rates.(C) Security exempt from registration under Rule 144A of the Securities Act of
1933. These securities may be resold in transactions exempt from registration normally to qualified institutions. On December 31, 2021, the value of these securities amounted to $155,920 ($ Thousands), representing 54.2% of the Net Assets of the Fund.
(D) Tri-Party Repurchase Agreement.

SEI Institutional Managed Trust / Quarterly Report / December 31, 20214
SCHEDULE OF INVESTMENTS (Unaudited)December 31, 2021
Conservative Income Fund (Concluded)
Cl — ClassMTN — Medium Term NoteRB — Revenue BondSer — SeriesVAR — Variable Rate
The following is a list of the levels of inputs used as of December 31, 2021 in valuing the Fund’s investments carried at value ($ Thousands):
Investments in Securities Level 1 Level 2 Level 3 Total
Commercial Paper $ – $ 177,615 $ – $ 177,615Corporate Obligations – 11,391 – 11,391U.S. Treasury Obligation – 4,042 – 4,042Municipal Bonds – 2,146 – 2,146Certificates of Deposit – 79,995 – 79,995Cash Equivalent 1 – – 1Repurchase Agreements – 14,000 – 14,000
Total Investments in Securities $ 1 $ 289,189 $ – $ 289,190
For the period ended December 31, 2021, there were no transfers in or out of Level 3.
For information on the Fund's policy regarding valuation of investments, fair value hierarchy levels and other significant accounting policies, please refer to the Fund's most recent financial statements.
The following is a summary of the transactions with affiliates for the period ended December 31, 2021 ($ Thousands):
Security Description Value 9/30/2021 Purchases at Cost Proceeds from
Sales Realized Gain
Change in Unrealized
Appreciation/(Depreciation)
Value 12/31/2021 Shares Income Capital Gains
SEI Daily Income Trust, Government Fund, Cl F $ 87 $ 2,045 $ (2,131) $ — $ — $ 1 1,290 $ — $ —
Amounts designated as “—” are $0 or have been rounded to $0.

1SEI Institutional Managed Trust / Quarterly Report / December 31, 2021
SCHEDULE OF INVESTMENTS (Unaudited)December 31, 2021
Tax-Free Conservative Income Fund
DescriptionFace Amount (Thousands)
Market Value ($ Thousands)
MUNICIPAL BONDS — 70.5%Arizona — 1.2%
Arizona State University, Board of Regents, Ser A, RB Callable 01/07/2022 @ 100
0.050%, 07/01/2034 (A) $ 500 $ 500Avondale, RB
3.000%, 07/01/2022 270 274Yavapai County, Industrial Development
Authority, Drake Cement Project, Ser A, RB Callable 01/07/2022 @ 100
0.100%, 09/01/2035 (A)(B) 1,500 1,500
2,274
Connecticut — 1.7%Connecticut State, Housing Finance
Authority, Mortgage Finance Program, Sub-Ser C-3, RB Callable 01/07/2022 @ 100
0.050%, 11/15/2045 (A) 375 375Connecticut State, Ser C, GO
Callable 01/07/2022 @ 100 0.090%, 05/15/2034 (A) 2,870 2,870
3,245
District of Columbia — 2.4%RBC Municipal Products Trust, Ser 2018-
G63, GO 0.090%, 12/01/2023 (A)(B)(C) 2,000 2,000
Tender Option Bond Trust Receipts, Ser 2019-XG0267, RB Callable 10/01/2029 @ 100
0.150%, 10/01/2053 (A)(B)(C) 2,650 2,650
4,650
Florida — 3.5%Escambia County, Solid Waste Disposal,
Florida Power & Light, RB Callable 01/07/2022 @ 100
0.030%, 04/01/2039 (A) 3,800 3,800Miami-Dade County, Industrial
Development Authority, Dave and Mary Alper Jewish Community Center Project, RB Callable 01/07/2022 @ 100
0.050%, 04/01/2032 (A)(B) 2,895 2,895
6,695
DescriptionFace Amount (Thousands)
Market Value ($ Thousands)
MUNICIPAL BONDS (continued)Georgia — 1.0%
Georgia State, Municipal Electric Authority, Project One, Sub-Ser B, RB Callable 01/07/2022 @ 100
0.060%, 01/01/2048 (A)(B) $ 2,000 $ 2,000
Illinois — 6.5%Aurora, Fox Valley Counseling Center, RB
Callable 01/07/2022 @ 100 0.060%, 05/01/2028 (A)(B) 1,710 1,710
Illinois State, Development Finance Authority, Glenwood School For Boys, RB Callable 01/07/2022 @ 100
0.080%, 02/01/2033 (A)(B) 2,000 2,000Illinois State, Development Finance
Authority, YMCA Metropolitan Chicago Project, RB Callable 01/07/2022 @ 100
0.040%, 06/01/2029 (A)(B) 3,500 3,500Tender Option Bond Trust Receipts,
Ser 2015-XF1043, GO 0.100%, 03/01/2033 (A)(B)(C) 4,250 4,250
University of Illinois, Hospital & Health Sciences System, Ser B, RB Callable 01/07/2022 @ 100
0.050%, 10/01/2026 (A)(B) 1,100 1,100
12,560
Indiana — 3.8%Indiana State, Finance Authority, Stadium
Project, Ser 2005, RB Callable 01/07/2022 @ 100
0.070%, 02/01/2035 (A) 2,000 2,000Indiana State, Housing & Community
Development Authority, Ser B-3, RB Callable 01/07/2022 @ 100
0.010%, 07/01/2047 (A) 1,000 1,000Indiana State, Housing & Community
Development Authority, Ser C-3, RB Callable 01/07/2022 @ 100
0.010%, 07/01/2047 (A) 4,400 4,400
7,400
Iowa — 3.6%Iowa State, Finance Authority, Bio America
Project, RB Callable 01/07/2022 @ 100
0.110%, 12/01/2041 (A)(B)(C) 2,000 2,000Iowa State, Finance Authority, Pollution
Control Facilities, MidAmerican Energy Project, RB Callable 02/01/2022 @ 100
0.080%, 09/01/2036 (A) 1,500 1,500

SEI Institutional Managed Trust / Quarterly Report / December 31, 20212
SCHEDULE OF INVESTMENTS (Unaudited)December 31, 2021
Tax-Free Conservative Income Fund (Continued)
DescriptionFace Amount (Thousands)
Market Value ($ Thousands)
MUNICIPAL BONDS (continued)Iowa State, Finance Authority, Pollution
Control Facilities, MidAmerican Energy Project, Ser B, RB Callable 01/07/2022 @ 100
0.080%, 05/01/2023 (A) $ 3,000 $ 3,000Iowa State, Finance Authority, UnityPoint
Health Project, RB Callable 01/07/2022 @ 100
0.010%, 02/15/2039 (A)(B) 600 600
7,100
Louisiana — 1.0%Louisiana State, Offshore Terminal
Authority, RB Callable 02/01/2022 @ 100
0.050%, 09/01/2033 (A)(B) 1,850 1,850
Maryland — 0.6%Maryland State, Community Development
Administration, Department of Housing and Community Development, Crusader Arms Apartments Project, Ser D, RB Callable 02/01/2022 @ 100
0.100%, 02/01/2041 (A) 1,070 1,070
Massachusetts — 2.9%Massachusetts State, Water Resources
Authority, Sub-Ser A-3, RB Callable 01/07/2022 @ 100
0.060%, 08/01/2037 (A) 5,605 5,605
Michigan — 1.6%Central Michigan University, Ser A, RB
Callable 01/07/2022 @ 100 0.050%, 10/01/2032 (A)(B) 1,400 1,400
Michigan State University, Ser A, RB Callable 01/07/2022 @ 100
0.060%, 02/15/2033 (A) 1,700 1,700
3,100
Minnesota — 0.3%Minneapolis, University Gateway Project,
RB 0.100%, 12/01/2040 (A) 500 500
Mississippi — 4.1%Mississippi State, Business Finance,
Chevron USA Project, Ser B, RB Callable 02/01/2022 @ 100
0.010%, 11/01/2035 (A) 860 860
DescriptionFace Amount (Thousands)
Market Value ($ Thousands)
MUNICIPAL BONDS (continued)Mississippi State, Business Finance,
Chevron USA Project, Ser F, RB Callable 02/01/2022 @ 100
0.010%, 12/01/2030 (A) $ 3,900 $ 3,900Mississippi State, Business Finance,
Chevron USA Project, Ser G, RB Callable 02/01/2022 @ 100
0.010%, 11/01/2035 (A) 3,000 3,000Mississippi State, Business Finance,
Chevron USA Project, Ser I, RB Callable 02/01/2022 @ 100
0.010%, 11/01/2035 (A) 400 400
8,160
Missouri — 2.3%Kansas City, Special Obligation, H Roe
Bartle Project, Ser E, RB Callable 01/07/2022 @ 100
0.060%, 04/15/2034 (A)(B) 920 920RBC Municipal Products Trust, Ser C-16, RB
0.120%, 09/01/2039 (A)(B)(C) 3,500 3,500
4,420
Nevada — 0.4%Tender Option Bond Trust Receipts,
Ser 2020-XF2858, RB Callable 07/01/2029 @ 100
0.090%, 07/01/2050 (A)(C) 700 700
New Jersey — 6.8%Deptford, Ser A, GO
1.000%, 07/13/2022 6,100 6,125Evesham, GO
1.000%, 06/14/2022 4,000 4,014Park Ridge, GO
1.000%, 04/29/2022 3,257 3,264
13,403
New York — 7.1%Kings Point, GO
1.000%, 07/22/2022 2,115 2,124New York City, Housing Development
Corporation, Multi-Family Housing, Ser H, RB Callable 01/24/2022 @ 100
0.120%, 11/01/2051 (A) 950 950New York City, Housing Development
Corporation, Multi-Family Housing, Ser I, RB Callable 01/07/2022 @ 100
0.050%, 11/01/2060 (A) 200 200

3SEI Institutional Managed Trust / Quarterly Report / December 31, 2021
SCHEDULE OF INVESTMENTS (Unaudited)December 31, 2021
Tax-Free Conservative Income Fund (Continued)
DescriptionFace Amount (Thousands)
Market Value ($ Thousands)
MUNICIPAL BONDS (continued)New York City, Transitional Finance
Authority, Future Tax Secured Revenue, RB Callable 01/07/2022 @ 100
0.010%, 11/01/2029 (A) $ 1,100 $ 1,100New York State, Housing Finance Agency,
Ser A, RB 0.040%, 11/01/2050 (A)(B) 1,000 1,000
Newburgh, GO 1.000%, 05/18/2022 3,370 3,379
Oneida County, Industrial Development Agency, Mohawk Valley Community College Dormitory Project, Ser A, RB Callable 01/07/2022 @ 100
0.160%, 08/01/2036 (A)(B) 1,100 1,100RBC Municipal Products Trust, Ser 2018-
G5, GO 0.090%, 10/01/2025 (A)(B)(C) 1,900 1,900
Tender Option Bond Trust Receipts, Ser 2017-XF0550, RB Callable 02/15/2027 @ 100
0.100%, 02/15/2042 (A)(C) 2,000 2,000
13,753
North Carolina — 1.9%Charlotte, Governmental Facilities Project,
RB Callable 01/07/2022 @ 100
0.050%, 06/01/2033 (A) 1,990 1,990Charlotte-Mecklenburg, Hospital Authority,
Ser E, RB Callable 01/07/2022 @ 100
0.010%, 01/15/2044 (A)(B) 1,025 1,025North Carolina, Medical Care Commission,
Ser A, RB Callable 01/07/2022 @ 100
0.050%, 10/01/2035 (A) 800 800
3,815
Ohio — 0.5%Franklin County, Hospital Facilities
Revenue, Sub-Ser R, RB Callable 01/07/2022 @ 100
0.050%, 12/01/2028 (A)(B) 945 945
Pennsylvania — 3.0%Butler County, Industrial Development
Authority, Ser A-R, RB Callable 01/07/2022 @ 100
0.140%, 05/01/2034 (A)(B) 1,430 1,430Emmaus, General Authority Revenue, RB
0.090%, 12/01/2028 (A) 200 200
DescriptionFace Amount (Thousands)
Market Value ($ Thousands)
MUNICIPAL BONDS (continued)Montgomery County, Industrial
Development Authority, Acts Retirement Life Communities, RB, AGC Callable 02/01/2022 @ 100
0.110%, 11/15/2029 (A) $ 175 $ 175Pennsylvania State, Economic Development
Financing Authority, PPL Energy Supply Project, RB Callable 01/07/2022 @ 100
0.140%, 12/01/2037 (A)(B) 3,000 3,000Philadelphia Gas Works, Ser D, RB
Callable 02/01/2022 @ 100 0.050%, 08/01/2031 (A)(B) 600 600
South Central, General Authority, Wellspan Health Highland Groups, RB Callable 01/07/2022 @ 100
0.090%, 06/01/2037 (A) 500 500
5,905
South Dakota — 1.5%South Dakota State, Housing Development
Authority, Ser A, RB Callable 01/07/2022 @ 100
0.060%, 11/01/2062 (A) 2,960 2,960
Tennessee — 0.8%Clarksville, Public Building Authority,
Pooled Financing, RB Callable 02/01/2022 @ 100
0.080%, 06/01/2029 (A)(B) 1,500 1,500
Texas — 8.7%Houston, Combined Utility System
Revenue, RB Callable 01/07/2022 @ 100
0.050%, 05/15/2034 (A)(B) 1,125 1,125North Fort Bend, Water Authority, Ser 2019-
XF0816, RB 0.120%, 06/15/2027 (A)(C) 1,500 1,500
Port Arthur, Navigation District, Industrial Development, Petrochemicals USA Project, RB Callable 03/01/2022 @ 100
0.100%, 03/01/2039 (A) 5,300 5,300Port Arthur, Navigation District, Industrial
Development, Petrochemicals USA Project, Ser A, RB Callable 02/01/2022 @ 100
0.100%, 12/01/2040 (A) 1,000 1,000Tarrant County, Cultural Education Facilities
Finance, Christus Health, RB Callable 01/07/2022 @ 100
0.050%, 07/01/2047 (A)(B) 1,525 1,525
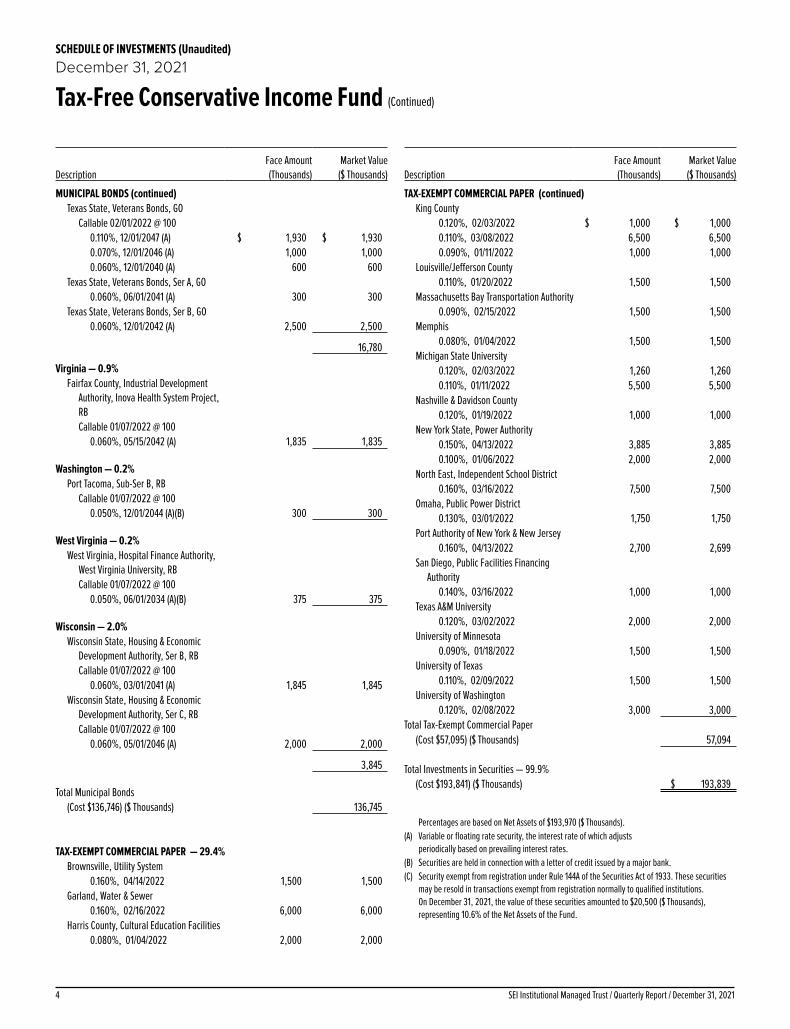
SEI Institutional Managed Trust / Quarterly Report / December 31, 20214
SCHEDULE OF INVESTMENTS (Unaudited)December 31, 2021
Tax-Free Conservative Income Fund (Continued)
DescriptionFace Amount (Thousands)
Market Value ($ Thousands)
MUNICIPAL BONDS (continued)Texas State, Veterans Bonds, GO
Callable 02/01/2022 @ 100 0.110%, 12/01/2047 (A) $ 1,930 $ 1,9300.070%, 12/01/2046 (A) 1,000 1,0000.060%, 12/01/2040 (A) 600 600
Texas State, Veterans Bonds, Ser A, GO 0.060%, 06/01/2041 (A) 300 300
Texas State, Veterans Bonds, Ser B, GO 0.060%, 12/01/2042 (A) 2,500 2,500
16,780
Virginia — 0.9%Fairfax County, Industrial Development
Authority, Inova Health System Project, RB Callable 01/07/2022 @ 100
0.060%, 05/15/2042 (A) 1,835 1,835
Washington — 0.2%Port Tacoma, Sub-Ser B, RB
Callable 01/07/2022 @ 100 0.050%, 12/01/2044 (A)(B) 300 300
West Virginia — 0.2%West Virginia, Hospital Finance Authority,
West Virginia University, RB Callable 01/07/2022 @ 100
0.050%, 06/01/2034 (A)(B) 375 375
Wisconsin — 2.0%Wisconsin State, Housing & Economic
Development Authority, Ser B, RB Callable 01/07/2022 @ 100
0.060%, 03/01/2041 (A) 1,845 1,845Wisconsin State, Housing & Economic
Development Authority, Ser C, RB Callable 01/07/2022 @ 100
0.060%, 05/01/2046 (A) 2,000 2,000
3,845
Total Municipal Bonds(Cost $136,746) ($ Thousands) 136,745
TAX-EXEMPT COMMERCIAL PAPER — 29.4%Brownsville, Utility System
0.160%, 04/14/2022 1,500 1,500Garland, Water & Sewer
0.160%, 02/16/2022 6,000 6,000Harris County, Cultural Education Facilities
0.080%, 01/04/2022 2,000 2,000
DescriptionFace Amount (Thousands)
Market Value ($ Thousands)
TAX-EXEMPT COMMERCIAL PAPER (continued)King County
0.120%, 02/03/2022 $ 1,000 $ 1,0000.110%, 03/08/2022 6,500 6,5000.090%, 01/11/2022 1,000 1,000
Louisville/Jefferson County0.110%, 01/20/2022 1,500 1,500
Massachusetts Bay Transportation Authority0.090%, 02/15/2022 1,500 1,500
Memphis0.080%, 01/04/2022 1,500 1,500
Michigan State University0.120%, 02/03/2022 1,260 1,2600.110%, 01/11/2022 5,500 5,500
Nashville & Davidson County0.120%, 01/19/2022 1,000 1,000
New York State, Power Authority0.150%, 04/13/2022 3,885 3,8850.100%, 01/06/2022 2,000 2,000
North East, Independent School District0.160%, 03/16/2022 7,500 7,500
Omaha, Public Power District0.130%, 03/01/2022 1,750 1,750
Port Authority of New York & New Jersey0.160%, 04/13/2022 2,700 2,699
San Diego, Public Facilities Financing Authority
0.140%, 03/16/2022 1,000 1,000Texas A&M University
0.120%, 03/02/2022 2,000 2,000University of Minnesota
0.090%, 01/18/2022 1,500 1,500University of Texas
0.110%, 02/09/2022 1,500 1,500University of Washington
0.120%, 02/08/2022 3,000 3,000Total Tax-Exempt Commercial Paper
(Cost $57,095) ($ Thousands) 57,094
Total Investments in Securities — 99.9%(Cost $193,841) ($ Thousands) $ 193,839
Percentages are based on Net Assets of $193,970 ($ Thousands).(A) Variable or floating rate security, the interest rate of which adjusts
periodically based on prevailing interest rates.(B) Securities are held in connection with a letter of credit issued by a major bank.(C) Security exempt from registration under Rule 144A of the Securities Act of 1933. These securities
may be resold in transactions exempt from registration normally to qualified institutions. On December 31, 2021, the value of these securities amounted to $20,500 ($ Thousands), representing 10.6% of the Net Assets of the Fund.

5SEI Institutional Managed Trust / Quarterly Report / December 31, 2021
SCHEDULE OF INVESTMENTS (Unaudited)December 31, 2021
Tax-Free Conservative Income Fund (Concluded)
AGC — Assured Guaranty CorporationGO — General ObligationRB — Revenue BondSer — Series
As of December 31, 2021, all of the Fund's investments were considered Level 2, in accordance with the authoritative guidance on fair value measurements and disclosure under U.S. GAAP.
For the period ended December 31, 2021, there were no transfers in or out of Level 3.
For information on the Fund's policy regarding valuation of investments, fair value hierarchy levels and other significant accounting policies, please refer to the Fund's most recent financial statements.

1SEI Institutional Managed Trust / Quarterly Report / December 31, 2021
SCHEDULE OF INVESTMENTS (Unaudited)December 31, 2021
Real Return Fund
DescriptionFace Amount (Thousands)
Market Value ($ Thousands)
U.S. TREASURY OBLIGATIONS — 99.4%U.S. Treasury Inflation Protected Securities
2.375%, 01/15/2025 $ 9,728 $ 11,0782.000%, 01/15/2026 6,421 7,4300.625%, 04/15/2023 15,516 16,2200.625%, 01/15/2024 16,794 17,8710.625%, 01/15/2026 12,949 14,2200.500%, 04/15/2024 9,333 9,9480.375%, 07/15/2023 17,489 18,3880.375%, 07/15/2025 15,325 16,6430.250%, 01/15/2025 13,864 14,8520.125%, 01/15/2023 18,196 18,7910.125%, 07/15/2024 15,222 16,2260.125%, 10/15/2024 13,442 14,3570.125%, 04/15/2025 11,050 11,8190.125%, 10/15/2025 13,352 14,3940.125%, 10/15/2025 54 590.125%, 04/15/2026 10,640 11,4810.125%, 07/15/2026 12,990 14,1030.125%, 10/15/2026 14,556 15,829
Total U.S. Treasury Obligations
(Cost $235,080) ($ Thousands) 243,709
Description SharesMarket Value
($ Thousands)CASH EQUIVALENT — 0.2%
SEI Daily Income Trust, Government Fund, Cl F
0.010%**† 445,295 $ 445
Total Cash Equivalent(Cost $445) ($ Thousands) 445
Total Investments in Securities — 99.6%(Cost $235,525) ($ Thousands) $ 244,154
Percentages are based on Net Assets of $245,243 ($ Thousands).** The rate reported is the 7-day effective yield as of December 31, 2021.† Investment in Affiliated Security.
Cl — Class The following is a list of the level of inputs used as of December 31, 2021, in valuing the Fund’s investments carried at value ($ Thousands):
Investments in SecuritiesLevel 1
($)Level 2
($)Level 3
($)Total
($)U.S. Treasury Obligations – 243,709 – 243,709Cash Equivalent 445 – – 445
Total Investments in Securities 445 243,709 – 244,154
For the period ended December 31, 2021, there were no transfers in or out of Level 3.
For information regarding the Fund’s policy regarding valuation of investments and other significant accounting policies, please refer to the Fund’s more recent semi-annual and annual financial statements.
The following is a summary of the transactions with affiliates for the period ended December 31, 2021 ($ Thousands):
Security Description Value 9/30/2021 Purchases at Cost Proceeds from
Sales Realized Gain/
(Loss)
Change in Unrealized
Appreciation/(Depreciation)
Value12/31/2021 Shares Income Capital Gains
SEI Daily Income Trust, Government Fund, Cl F $ 987 $ 4,258 $ (4,800) $ — $ — $ 445 445,295 $ — $ —
Amounts designated as “—” are $0 or have been rounded to $0.
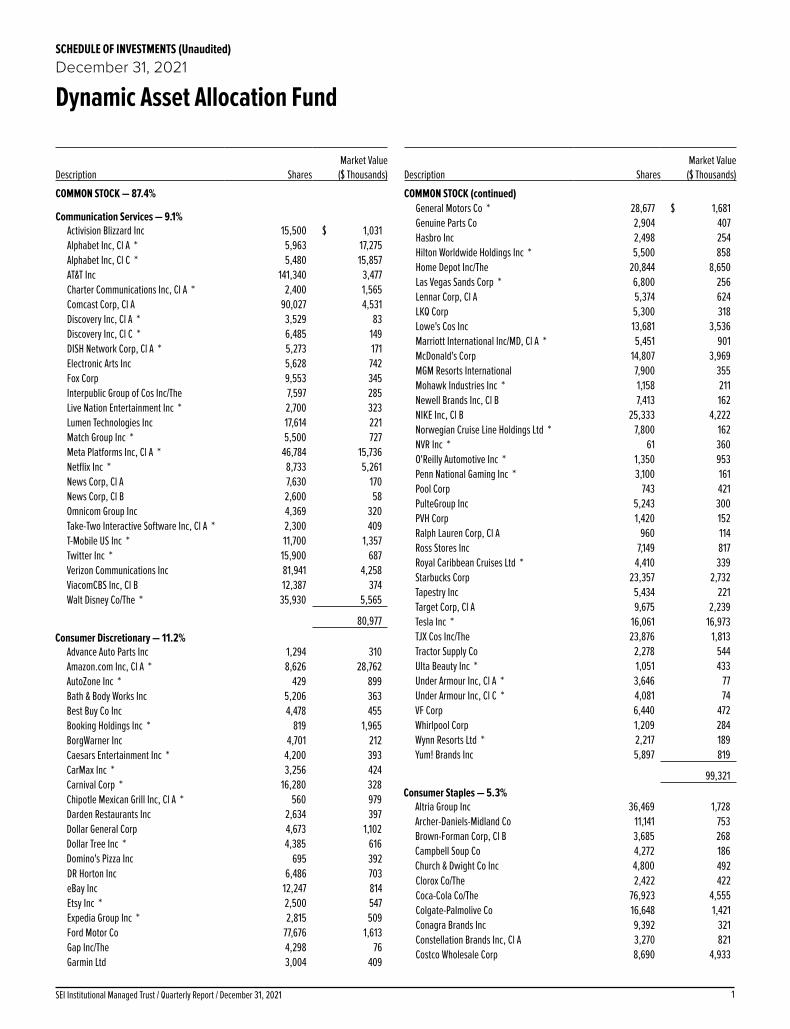
1SEI Institutional Managed Trust / Quarterly Report / December 31, 2021
SCHEDULE OF INVESTMENTS (Unaudited)December 31, 2021
Dynamic Asset Allocation Fund
Description SharesMarket Value
($ Thousands)
COMMON STOCK — 87.4%
Communication Services — 9.1%Activision Blizzard Inc 15,500 $ 1,031Alphabet Inc, Cl A * 5,963 17,275Alphabet Inc, Cl C * 5,480 15,857AT&T Inc 141,340 3,477Charter Communications Inc, Cl A * 2,400 1,565Comcast Corp, Cl A 90,027 4,531Discovery Inc, Cl A * 3,529 83Discovery Inc, Cl C * 6,485 149DISH Network Corp, Cl A * 5,273 171Electronic Arts Inc 5,628 742Fox Corp 9,553 345Interpublic Group of Cos Inc/The 7,597 285Live Nation Entertainment Inc * 2,700 323Lumen Technologies Inc 17,614 221Match Group Inc * 5,500 727Meta Platforms Inc, Cl A * 46,784 15,736Netflix Inc * 8,733 5,261News Corp, Cl A 7,630 170News Corp, Cl B 2,600 58Omnicom Group Inc 4,369 320Take-Two Interactive Software Inc, Cl A * 2,300 409T-Mobile US Inc * 11,700 1,357Twitter Inc * 15,900 687Verizon Communications Inc 81,941 4,258ViacomCBS Inc, Cl B 12,387 374Walt Disney Co/The * 35,930 5,565
80,977Consumer Discretionary — 11.2%
Advance Auto Parts Inc 1,294 310Amazon.com Inc, Cl A * 8,626 28,762AutoZone Inc * 429 899Bath & Body Works Inc 5,206 363Best Buy Co Inc 4,478 455Booking Holdings Inc * 819 1,965BorgWarner Inc 4,701 212Caesars Entertainment Inc * 4,200 393CarMax Inc * 3,256 424Carnival Corp * 16,280 328Chipotle Mexican Grill Inc, Cl A * 560 979Darden Restaurants Inc 2,634 397Dollar General Corp 4,673 1,102Dollar Tree Inc * 4,385 616Domino's Pizza Inc 695 392DR Horton Inc 6,486 703eBay Inc 12,247 814Etsy Inc * 2,500 547Expedia Group Inc * 2,815 509Ford Motor Co 77,676 1,613Gap Inc/The 4,298 76Garmin Ltd 3,004 409
Description SharesMarket Value
($ Thousands)
COMMON STOCK (continued)General Motors Co * 28,677 $ 1,681Genuine Parts Co 2,904 407Hasbro Inc 2,498 254Hilton Worldwide Holdings Inc * 5,500 858Home Depot Inc/The 20,844 8,650Las Vegas Sands Corp * 6,800 256Lennar Corp, Cl A 5,374 624LKQ Corp 5,300 318Lowe's Cos Inc 13,681 3,536Marriott International Inc/MD, Cl A * 5,451 901McDonald's Corp 14,807 3,969MGM Resorts International 7,900 355Mohawk Industries Inc * 1,158 211Newell Brands Inc, Cl B 7,413 162NIKE Inc, Cl B 25,333 4,222Norwegian Cruise Line Holdings Ltd * 7,800 162NVR Inc * 61 360O'Reilly Automotive Inc * 1,350 953Penn National Gaming Inc * 3,100 161Pool Corp 743 421PulteGroup Inc 5,243 300PVH Corp 1,420 152Ralph Lauren Corp, Cl A 960 114Ross Stores Inc 7,149 817Royal Caribbean Cruises Ltd * 4,410 339Starbucks Corp 23,357 2,732Tapestry Inc 5,434 221Target Corp, Cl A 9,675 2,239Tesla Inc * 16,061 16,973TJX Cos Inc/The 23,876 1,813Tractor Supply Co 2,278 544Ulta Beauty Inc * 1,051 433Under Armour Inc, Cl A * 3,646 77Under Armour Inc, Cl C * 4,081 74VF Corp 6,440 472Whirlpool Corp 1,209 284Wynn Resorts Ltd * 2,217 189Yum! Brands Inc 5,897 819
99,321Consumer Staples — 5.3%
Altria Group Inc 36,469 1,728Archer-Daniels-Midland Co 11,141 753Brown-Forman Corp, Cl B 3,685 268Campbell Soup Co 4,272 186Church & Dwight Co Inc 4,800 492Clorox Co/The 2,422 422Coca-Cola Co/The 76,923 4,555Colgate-Palmolive Co 16,648 1,421Conagra Brands Inc 9,392 321Constellation Brands Inc, Cl A 3,270 821Costco Wholesale Corp 8,690 4,933

SEI Institutional Managed Trust / Quarterly Report / December 31, 20212
SCHEDULE OF INVESTMENTS (Unaudited)December 31, 2021
Dynamic Asset Allocation Fund (Continued)
Description SharesMarket Value
($ Thousands)
COMMON STOCK (continued)Estee Lauder Cos Inc/The, Cl A 4,544 $ 1,682General Mills Inc 12,041 811Hershey Co/The 2,886 558Hormel Foods Corp 5,816 284J M Smucker Co/The 2,104 286Kellogg Co 5,194 335Kimberly-Clark Corp 6,677 954Kraft Heinz Co/The 14,200 510Kroger Co/The 13,448 609Lamb Weston Holdings Inc 2,900 184McCormick & Co Inc/MD 4,964 479Molson Coors Beverage Co, Cl B 3,724 173Mondelez International Inc, Cl A 27,653 1,834Monster Beverage Corp * 7,465 717PepsiCo Inc 27,340 4,749Philip Morris International Inc 30,837 2,930Procter & Gamble Co/The 47,819 7,822Sysco Corp, Cl A 10,143 797Tyson Foods Inc, Cl A 5,775 503Walgreens Boots Alliance Inc 14,207 741Walmart Inc 28,088 4,064
46,922Energy — 2.4%
APA Corp 6,901 186Baker Hughes Co, Cl A 16,315 392Chevron Corp 38,092 4,470ConocoPhillips 26,056 1,881Coterra Energy Inc 16,598 315Devon Energy Corp 12,406 546Diamondback Energy Inc, Cl A 3,400 367EOG Resources Inc 11,627 1,033Exxon Mobil Corp 83,781 5,127Halliburton Co 17,542 401Hess Corp 5,374 398Kinder Morgan Inc 38,614 612Marathon Oil Corp 15,992 263Marathon Petroleum Corp 12,050 771Occidental Petroleum Corp 17,528 508ONEOK Inc 8,854 520Phillips 66 8,699 630Pioneer Natural Resources Co 4,523 823Schlumberger NV, Cl A 27,837 834Valero Energy Corp 8,097 608Williams Cos Inc/The 24,146 629
21,314Financials — 9.3%
Aflac Inc 12,218 713Allstate Corp/The 5,812 684American Express Co 12,418 2,032American International Group Inc 16,305 927Ameriprise Financial Inc 2,266 684
Description SharesMarket Value
($ Thousands)
COMMON STOCK (continued)Arthur J Gallagher & Co 4,137 $ 702Assurant Inc 1,182 184Bank of America Corp 142,868 6,356Bank of New York Mellon Corp/The 14,943 868Berkshire Hathaway Inc, Cl B * 36,224 10,831BlackRock Inc 2,815 2,577Brown & Brown Inc 4,700 330Capital One Financial Corp 8,415 1,221Cboe Global Markets Inc 2,100 274Charles Schwab Corp/The 29,735 2,501Chubb Ltd 8,466 1,637Cincinnati Financial Corp 2,993 341Citigroup Inc 39,234 2,369Citizens Financial Group Inc 8,400 397CME Group Inc 7,148 1,633Comerica Inc 2,773 241Discover Financial Services 5,946 687FactSet Research Systems Inc 700 340Fifth Third Bancorp 13,651 595First Republic Bank/CA 3,500 723Franklin Resources Inc 5,536 185Globe Life Inc 1,864 175Goldman Sachs Group Inc/The 6,701 2,564Hartford Financial Services Group Inc/The 6,861 474Huntington Bancshares Inc/OH 29,147 449Intercontinental Exchange Inc 11,180 1,529Invesco Ltd 6,912 159JPMorgan Chase & Co 58,426 9,252KeyCorp 18,752 434Lincoln National Corp 3,609 246Loews Corp 4,189 242M&T Bank Corp 2,508 385MarketAxess Holdings Inc 779 320Marsh & McLennan Cos Inc 10,017 1,741MetLife Inc 14,012 876Moody's Corp 3,204 1,251Morgan Stanley 28,375 2,785MSCI Inc, Cl A 1,633 1,001Nasdaq Inc, Cl A 2,287 480Northern Trust Corp 4,071 487People's United Financial Inc 8,489 151PNC Financial Services Group Inc/The 8,397 1,684Principal Financial Group Inc, Cl A 4,833 350Progressive Corp/The 11,621 1,193Prudential Financial Inc 7,377 798Raymond James Financial Inc 3,600 361Regions Financial Corp 18,860 411S&P Global Inc 4,707 2,221Signature Bank/New York NY, Cl B 1,200 388SVB Financial Group, Cl B * 1,133 768Synchrony Financial 11,201 520T Rowe Price Group Inc 4,440 873

3SEI Institutional Managed Trust / Quarterly Report / December 31, 2021
SCHEDULE OF INVESTMENTS (Unaudited)December 31, 2021
Dynamic Asset Allocation Fund (Continued)
Description SharesMarket Value
($ Thousands)
COMMON STOCK (continued)Travelers Cos Inc/The 4,952 $ 775Truist Financial Corp 26,382 1,545US Bancorp 26,702 1,500W R Berkley Corp 2,800 231Wells Fargo & Co 79,077 3,794Zions Bancorp NA 3,337 211
82,656Health Care — 11.6%
Abbott Laboratories 34,924 4,915AbbVie Inc 34,993 4,738ABIOMED Inc * 866 311Agilent Technologies Inc 6,085 971Align Technology Inc * 1,445 950AmerisourceBergen Corp, Cl A 2,954 392Amgen Inc, Cl A 11,063 2,489Anthem Inc 4,838 2,243Baxter International Inc 9,892 849Becton Dickinson and Co 5,667 1,425Biogen Inc * 2,950 708Bio-Rad Laboratories Inc, Cl A * 448 339Bio-Techne Corp 800 414Boston Scientific Corp * 28,392 1,206Bristol-Myers Squibb Co 44,032 2,745Cardinal Health Inc 5,903 304Catalent Inc * 3,400 435Centene Corp * 11,632 958Cerner Corp 5,812 540Charles River Laboratories International
Inc * 1,000 377Cigna Corp 6,520 1,497Cooper Cos Inc/The, Cl A 1,000 419CVS Health Corp 26,160 2,699Danaher Corp, Cl A 12,591 4,143DaVita Inc * 1,357 154DENTSPLY SIRONA Inc 4,371 244Dexcom Inc * 1,934 1,038Edwards Lifesciences Corp, Cl A * 12,416 1,609Eli Lilly & Co 15,666 4,327Gilead Sciences Inc 24,813 1,802HCA Healthcare Inc 4,743 1,219Henry Schein Inc * 2,644 205Hologic Inc * 5,000 383Humana Inc 2,545 1,181IDEXX Laboratories Inc * 1,694 1,115Illumina Inc * 3,084 1,173Incyte Corp * 3,800 279Intuitive Surgical Inc * 7,010 2,519IQVIA Holdings Inc * 3,800 1,072Johnson & Johnson 52,127 8,917Laboratory Corp of America Holdings * 1,917 602McKesson Corp 3,075 764
Description SharesMarket Value
($ Thousands)
COMMON STOCK (continued)Merck & Co Inc 50,066 $ 3,837Mettler-Toledo International Inc * 460 781Moderna Inc * 6,900 1,752Organon & Co 4,966 151PerkinElmer Inc 2,269 456Pfizer Inc 110,969 6,553Quest Diagnostics Inc 2,378 411Regeneron Pharmaceuticals Inc * 2,110 1,333ResMed Inc 2,900 755Stryker Corp 6,676 1,785Teleflex Inc 932 306Thermo Fisher Scientific Inc 7,810 5,211UnitedHealth Group Inc 18,582 9,331Universal Health Services Inc, Cl B 1,542 200Vertex Pharmaceuticals Inc * 4,958 1,089Viatris Inc, Cl W * 23,811 322Waters Corp * 1,220 455West Pharmaceutical Services Inc 1,500 704Zimmer Biomet Holdings Inc 4,153 528Zoetis Inc, Cl A 9,373 2,287
102,917Industrials — 6.5%
3M Co 11,426 2,030A O Smith Corp 2,600 223Alaska Air Group Inc * 2,600 135American Airlines Group Inc * 12,725 229AMETEK Inc 4,564 671Boeing Co/The * 10,909 2,196Carrier Global Corp 17,307 939Caterpillar Inc, Cl A 10,645 2,201CH Robinson Worldwide Inc 2,687 289Cintas Corp 1,685 747Copart Inc * 4,200 637CSX Corp 43,664 1,642Cummins Inc 2,863 625Deere & Co 5,568 1,909Delta Air Lines Inc, Cl A * 12,622 493Dover Corp 2,846 517Emerson Electric Co 11,926 1,109Equifax Inc 2,376 696Expeditors International of Washington Inc 3,408 458Fastenal Co, Cl A 11,444 733FedEx Corp 4,869 1,259Fortive Corp 7,054 538Fortune Brands Home & Security Inc 2,800 299Generac Holdings Inc * 1,226 431General Dynamics Corp 4,565 952General Electric Co 21,724 2,052Honeywell International Inc 13,652 2,847Howmet Aerospace Inc 7,492 238Huntington Ingalls Industries Inc, Cl A 800 149

SEI Institutional Managed Trust / Quarterly Report / December 31, 20214
SCHEDULE OF INVESTMENTS (Unaudited)December 31, 2021
Dynamic Asset Allocation Fund (Continued)
Description SharesMarket Value
($ Thousands)
COMMON STOCK (continued)IDEX Corp 1,500 $ 354IHS Markit Ltd 7,900 1,050Illinois Tool Works Inc 5,631 1,390Ingersoll Rand Inc 8,014 496Jacobs Engineering Group Inc 2,621 365JB Hunt Transport Services Inc 1,645 336L3Harris Technologies Inc 3,871 825Leidos Holdings Inc 2,900 258Lockheed Martin Corp 4,893 1,739Masco Corp 4,823 339Norfolk Southern Corp 4,802 1,430Northrop Grumman Corp 2,964 1,147Old Dominion Freight Line Inc, Cl A 1,850 663Otis Worldwide Corp 8,453 736PACCAR Inc 6,919 611Parker-Hannifin Corp, Cl A 2,552 812Quanta Services Inc 2,782 319Raytheon Technologies Corp 29,548 2,543Republic Services Inc 4,162 580Robert Half International Inc 2,259 252Rockwell Automation Inc 2,335 815Rollins Inc 4,675 160Roper Technologies Inc 2,117 1,041Snap-on Inc 1,055 227Southwest Airlines Co, Cl A * 11,733 503Stanley Black & Decker Inc 3,211 606Textron Inc 4,437 342TransDigm Group Inc * 1,009 642Union Pacific Corp 12,742 3,210United Airlines Holdings Inc * 6,300 276United Parcel Service Inc, Cl B 14,411 3,089United Rentals Inc * 1,399 465Verisk Analytics Inc, Cl A 3,200 732Waste Management Inc 7,682 1,282Westinghouse Air Brake Technologies Corp 3,690 340WW Grainger Inc 847 439Xylem Inc/NY 3,548 425
58,083Information Technology — 25.4%
Adobe Inc * 9,356 5,305Advanced Micro Devices Inc * 22,000 3,166Akamai Technologies Inc * 3,174 371Amphenol Corp, Cl A 11,940 1,044Analog Devices Inc 10,660 1,874ANSYS Inc * 1,700 682Apple Inc 308,309 54,746Applied Materials Inc 17,871 2,812Arista Networks Inc * 4,500 647Autodesk Inc, Cl A * 4,305 1,211Automatic Data Processing Inc 8,342 2,057Broadcom Inc 8,091 5,384
Description SharesMarket Value
($ Thousands)
COMMON STOCK (continued)Broadridge Financial Solutions Inc 2,314 $ 423Cadence Design Systems Inc * 5,500 1,025CDW Corp/DE 2,700 553Ceridian HCM Holding Inc * 2,700 282Cisco Systems Inc/Delaware 83,397 5,285Citrix Systems Inc 2,526 239Cognizant Technology Solutions Corp, Cl A 10,477 929Corning Inc, Cl B 15,171 565DXC Technology Co * 4,976 160Enphase Energy Inc * 2,700 494EPAM Systems Inc * 1,100 735F5 Inc, Cl A * 1,191 291Fidelity National Information Services
Inc, Cl B 11,953 1,305Fiserv Inc, Cl A * 11,864 1,231FleetCor Technologies Inc * 1,600 358Fortinet Inc * 2,700 970Gartner Inc * 1,669 558Global Payments Inc 5,789 783Hewlett Packard Enterprise Co 25,610 404HP Inc 22,610 852Intel Corp 80,326 4,137International Business Machines Corp 17,768 2,375Intuit Inc 5,545 3,567IPG Photonics Corp * 700 120Jack Henry & Associates Inc 1,400 234Juniper Networks Inc 6,477 231Keysight Technologies Inc * 3,600 743KLA Corp 2,949 1,268Lam Research Corp 2,796 2,011Mastercard Inc, Cl A 17,127 6,154Microchip Technology Inc 10,874 947Micron Technology Inc 22,271 2,075Microsoft Corp 148,493 49,941Monolithic Power Systems Inc 800 395Motorola Solutions Inc 3,302 897NetApp Inc 4,428 407NortonLifeLock Inc 11,808 307NVIDIA Corp 49,341 14,512NXP Semiconductors NV 5,300 1,207Oracle Corp, Cl B 31,933 2,785Paychex Inc 6,400 874Paycom Software Inc * 920 382PayPal Holdings Inc * 23,279 4,390PTC Inc * 2,100 254Qorvo Inc * 2,205 345QUALCOMM Inc 22,168 4,054salesforce.com Inc * 19,278 4,899ServiceNow Inc * 3,900 2,532Skyworks Solutions Inc 3,207 497SolarEdge Technologies Inc * 1,000 281Synopsys Inc * 3,000 1,105

5SEI Institutional Managed Trust / Quarterly Report / December 31, 2021
SCHEDULE OF INVESTMENTS (Unaudited)December 31, 2021
Dynamic Asset Allocation Fund (Continued)
Description SharesMarket Value
($ Thousands)
COMMON STOCK (continued)Teledyne Technologies Inc * 922 $ 403Teradyne Inc 3,300 540Texas Instruments Inc 18,252 3,440Trimble Inc * 5,000 436Tyler Technologies Inc * 837 450VeriSign Inc * 1,878 477Visa Inc, Cl A 33,165 7,187Western Digital Corp * 6,038 394Xilinx Inc 6,287 1,333Zebra Technologies Corp, Cl A * 1,013 603
225,930Materials — 1.9%
Air Products and Chemicals Inc 4,409 1,342Albemarle Corp 2,320 542Avery Dennison Corp 1,676 363Ball Corp 6,512 627Celanese Corp, Cl A 2,200 370CF Industries Holdings Inc 4,437 314Corteva Inc 14,591 690Dow Inc 14,825 841DuPont de Nemours Inc 10,407 841Eastman Chemical Co 2,598 314Ecolab Inc 4,946 1,160FMC Corp 2,449 269Freeport-McMoRan Inc, Cl B 29,262 1,221International Flavors & Fragrances Inc 4,962 748International Paper Co 7,673 360LyondellBasell Industries NV, Cl A 5,213 481Martin Marietta Materials Inc, Cl A 1,265 557Mosaic Co/The 7,110 279Newmont Corp 15,904 986Nucor Corp 5,548 633Packaging Corp of America 1,900 259PPG Industries Inc 4,670 805Sealed Air Corp 2,958 200Sherwin-Williams Co/The, Cl A 4,814 1,695Vulcan Materials Co 2,630 546Westrock Co 5,292 235
16,678Real Estate — 2.5%
Alexandria Real Estate Equities Inc ‡ 2,712 605American Tower Corp, Cl A ‡ 8,992 2,630AvalonBay Communities Inc ‡ 2,722 687Boston Properties Inc ‡ 2,908 335CBRE Group Inc, Cl A * 6,625 719Crown Castle International Corp ‡ 8,528 1,780Digital Realty Trust Inc, Cl A ‡ 5,600 990Duke Realty Corp ‡ 7,500 492Equinix Inc ‡ 1,780 1,506Equity Residential ‡ 6,733 609Essex Property Trust Inc ‡ 1,260 444
Description SharesMarket Value
($ Thousands)
COMMON STOCK (continued)Extra Space Storage Inc ‡ 2,600 $ 589Federal Realty Investment Trust ‡ 1,400 191Healthpeak Properties Inc ‡ 10,630 384Host Hotels & Resorts Inc *‡ 14,012 244Iron Mountain Inc ‡ 5,576 292Kimco Realty Corp ‡ 12,496 308Mid-America Apartment Communities Inc ‡ 2,300 528Prologis Inc ‡ 14,669 2,470Public Storage ‡ 3,000 1,124Realty Income Corp ‡ 10,918 782Regency Centers Corp ‡ 3,100 233SBA Communications Corp, Cl A ‡ 2,163 841Simon Property Group Inc ‡ 6,558 1,048UDR Inc ‡ 5,500 330Ventas Inc ‡ 7,710 394Vornado Realty Trust ‡ 3,131 131Welltower Inc ‡ 8,307 712Weyerhaeuser Co ‡ 14,760 608
22,006Utilities — 2.2%
AES Corp/The 13,012 316Alliant Energy Corp 4,900 301Ameren Corp 5,044 449American Electric Power Co Inc 9,929 883American Water Works Co Inc 3,600 680Atmos Energy Corp 2,700 283CenterPoint Energy Inc 12,117 338CMS Energy Corp 5,913 385Consolidated Edison Inc 6,978 595Dominion Energy Inc 15,968 1,254DTE Energy Co 3,841 459Duke Energy Corp 15,198 1,594Edison International 7,564 516Entergy Corp 3,977 448Evergy Inc 4,500 309Eversource Energy 6,844 623Exelon Corp 19,490 1,126FirstEnergy Corp 10,840 451NextEra Energy Inc 38,792 3,622NiSource Inc 8,213 227NRG Energy Inc 4,664 201Pinnacle West Capital Corp 2,394 169PPL Corp 15,139 455Public Service Enterprise Group Inc 9,957 664Sempra Energy 6,347 840Southern Co/The 20,982 1,439WEC Energy Group Inc 6,237 605Xcel Energy Inc 10,646 721
19,953
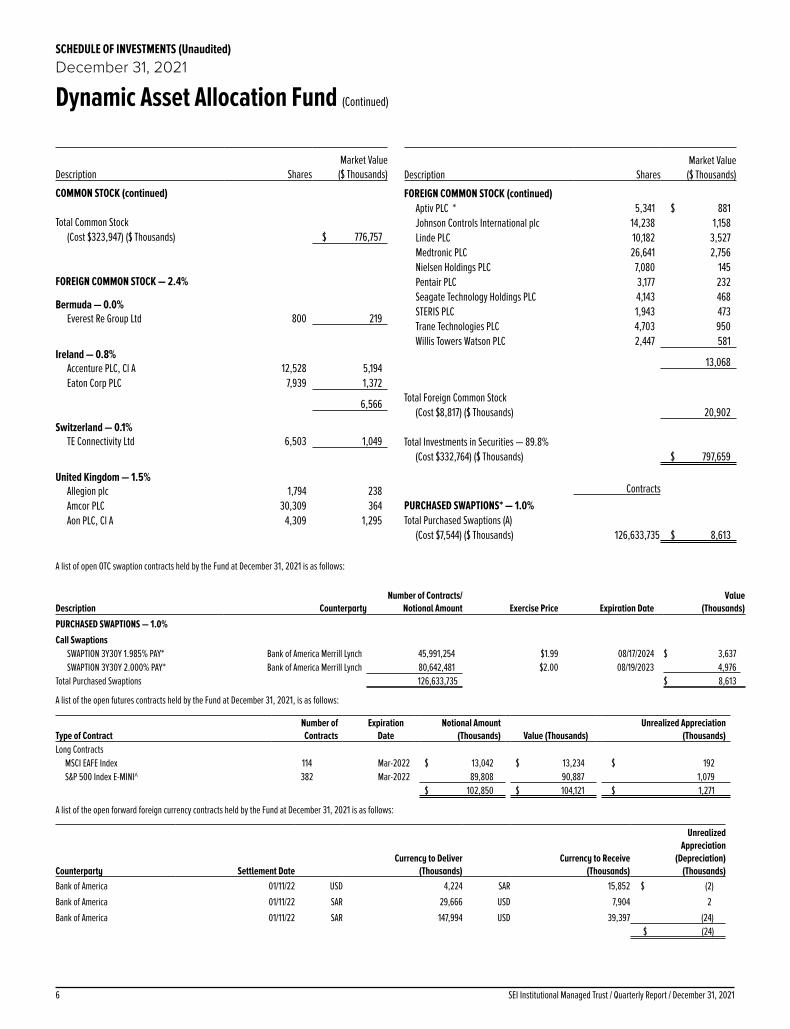
SEI Institutional Managed Trust / Quarterly Report / December 31, 20216
SCHEDULE OF INVESTMENTS (Unaudited)December 31, 2021
Dynamic Asset Allocation Fund (Continued)
Description SharesMarket Value
($ Thousands)
COMMON STOCK (continued)
Total Common Stock
(Cost $323,947) ($ Thousands) $ 776,757
FOREIGN COMMON STOCK — 2.4%
Bermuda — 0.0%Everest Re Group Ltd 800 219
Ireland — 0.8%Accenture PLC, Cl A 12,528 5,194Eaton Corp PLC 7,939 1,372
6,566
Switzerland — 0.1%TE Connectivity Ltd 6,503 1,049
United Kingdom — 1.5%Allegion plc 1,794 238Amcor PLC 30,309 364Aon PLC, Cl A 4,309 1,295
Description SharesMarket Value
($ Thousands)
FOREIGN COMMON STOCK (continued)Aptiv PLC * 5,341 $ 881Johnson Controls International plc 14,238 1,158Linde PLC 10,182 3,527Medtronic PLC 26,641 2,756Nielsen Holdings PLC 7,080 145Pentair PLC 3,177 232Seagate Technology Holdings PLC 4,143 468STERIS PLC 1,943 473Trane Technologies PLC 4,703 950Willis Towers Watson PLC 2,447 581
13,068
Total Foreign Common Stock
(Cost $8,817) ($ Thousands) 20,902
Total Investments in Securities — 89.8%(Cost $332,764) ($ Thousands) $ 797,659
ContractsPURCHASED SWAPTIONS* — 1.0%Total Purchased Swaptions (A)
(Cost $7,544) ($ Thousands) 126,633,735 $ 8,613
A list of open OTC swaption contracts held by the Fund at December 31, 2021 is as follows:
Description CounterpartyNumber of Contracts/
Notional Amount Exercise Price Expiration DateValue
(Thousands)
PURCHASED SWAPTIONS — 1.0%
Call SwaptionsSWAPTION 3Y30Y 1.985% PAY* Bank of America Merrill Lynch 45,991,254 $1.99 08/17/2024 $ 3,637SWAPTION 3Y30Y 2.000% PAY* Bank of America Merrill Lynch 80,642,481 $2.00 08/19/2023 4,976
Total Purchased Swaptions 126,633,735 $ 8,613
A list of the open futures contracts held by the Fund at December 31, 2021, is as follows:
Type of ContractNumber of Contracts
Expiration Date
Notional Amount (Thousands) Value (Thousands)
Unrealized Appreciation (Thousands)
Long ContractsMSCI EAFE Index 114 Mar-2022 $ 13,042 $ 13,234 $ 192S&P 500 Index E-MINI^ 382 Mar-2022 89,808 90,887 1,079
$ 102,850 $ 104,121 $ 1,271
A list of the open forward foreign currency contracts held by the Fund at December 31, 2021 is as follows:
Counterparty Settlement DateCurrency to Deliver
(Thousands)Currency to Receive
(Thousands)
Unrealized Appreciation
(Depreciation) (Thousands)
Bank of America 01/11/22 USD 4,224 SAR 15,852 $ (2)
Bank of America 01/11/22 SAR 29,666 USD 7,904 2
Bank of America 01/11/22 SAR 147,994 USD 39,397 (24) $ (24)
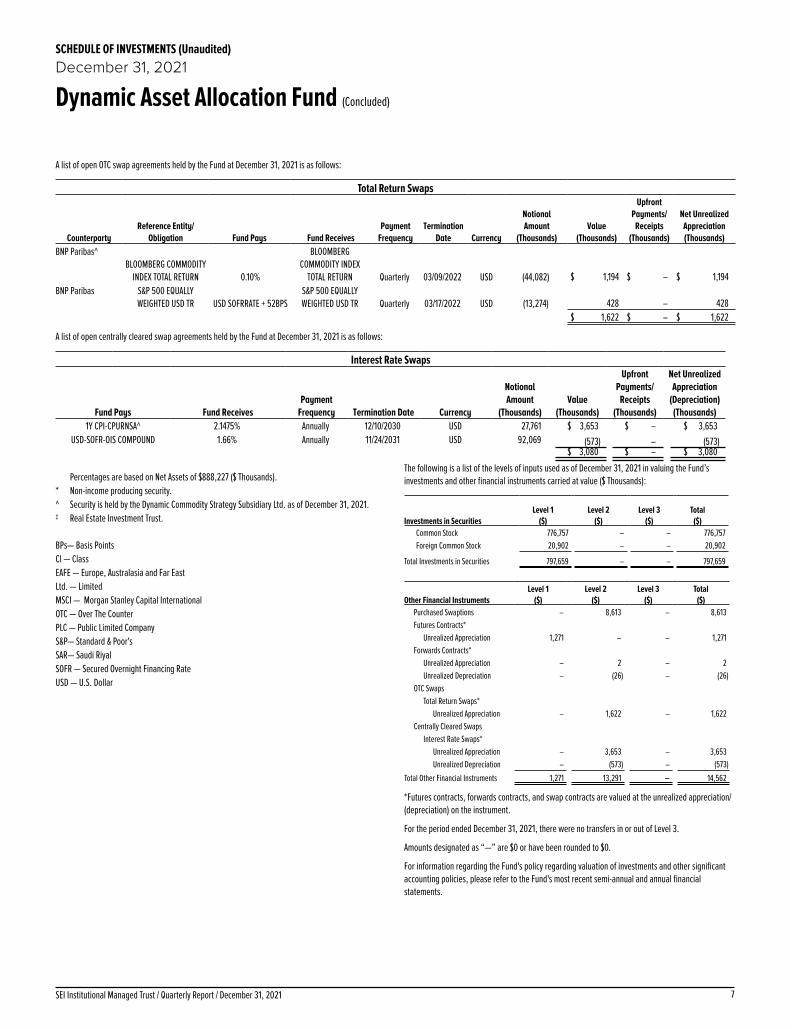
7SEI Institutional Managed Trust / Quarterly Report / December 31, 2021
SCHEDULE OF INVESTMENTS (Unaudited)December 31, 2021
Dynamic Asset Allocation Fund (Concluded)
A list of open OTC swap agreements held by the Fund at December 31, 2021 is as follows:
Total Return Swaps
CounterpartyReference Entity/
Obligation Fund Pays Fund ReceivesPayment
FrequencyTermination
Date Currency
Notional Amount
(Thousands)Value
(Thousands)
Upfront Payments/
Receipts (Thousands)
Net Unrealized Appreciation (Thousands)
BNP Paribas^BLOOMBERG COMMODITY
INDEX TOTAL RETURN 0.10%
BLOOMBERG COMMODITY INDEX
TOTAL RETURN Quarterly 03/09/2022 USD (44,082) $ 1,194 $ – $ 1,194BNP Paribas S&P 500 EQUALLY
WEIGHTED USD TR USD SOFRRATE + 52BPSS&P 500 EQUALLY WEIGHTED USD TR Quarterly 03/17/2022 USD (13,274) 428 – 428
$ 1,622 $ – $ 1,622
A list of open centrally cleared swap agreements held by the Fund at December 31, 2021 is as follows:
Interest Rate Swaps
Fund Pays Fund ReceivesPayment
Frequency Termination Date Currency
Notional Amount
(Thousands)Value
(Thousands)
Upfront Payments/
Receipts (Thousands)
Net Unrealized Appreciation
(Depreciation) (Thousands)
1Y CPI-CPURNSA^ 2.1475% Annually 12/10/2030 USD 27,761 $ 3,653 $ – $ 3,653USD-SOFR-OIS COMPOUND 1.66% Annually 11/24/2031 USD 92,069 (573) – (573)
$ 3,080 $ – $ 3,080
Percentages are based on Net Assets of $888,227 ($ Thousands).* Non-income producing security.^ Security is held by the Dynamic Commodity Strategy Subsidiary Ltd. as of December 31, 2021.‡ Real Estate Investment Trust.
BPs— Basis PointsCl — ClassEAFE — Europe, Australasia and Far EastLtd. — LimitedMSCI — Morgan Stanley Capital InternationalOTC — Over The CounterPLC — Public Limited CompanyS&P— Standard & Poor'sSAR— Saudi RiyalSOFR — Secured Overnight Financing RateUSD — U.S. Dollar
The following is a list of the levels of inputs used as of December 31, 2021 in valuing the Fund’s investments and other financial instruments carried at value ($ Thousands):
Investments in SecuritiesLevel 1
($)Level 2
($)Level 3
($)Total
($)Common Stock 776,757 – – 776,757Foreign Common Stock 20,902 – – 20,902
Total Investments in Securities 797,659 – – 797,659
Other Financial InstrumentsLevel 1
($)Level 2
($)Level 3
($)Total
($)Purchased Swaptions – 8,613 – 8,613Futures Contracts*
Unrealized Appreciation 1,271 – – 1,271Forwards Contracts*
Unrealized Appreciation – 2 – 2Unrealized Depreciation – (26) – (26)
OTC SwapsTotal Return Swaps*
Unrealized Appreciation – 1,622 – 1,622Centrally Cleared Swaps
Interest Rate Swaps*Unrealized Appreciation – 3,653 – 3,653Unrealized Depreciation – (573) – (573)
Total Other Financial Instruments 1,271 13,291 – 14,562
*Futures contracts, forwards contracts, and swap contracts are valued at the unrealized appreciation/ (depreciation) on the instrument.
For the period ended December 31, 2021, there were no transfers in or out of Level 3.
Amounts designated as “—” are $0 or have been rounded to $0.
For information regarding the Fund's policy regarding valuation of investments and other significant accounting policies, please refer to the Fund's most recent semi-annual and annual financial statements.
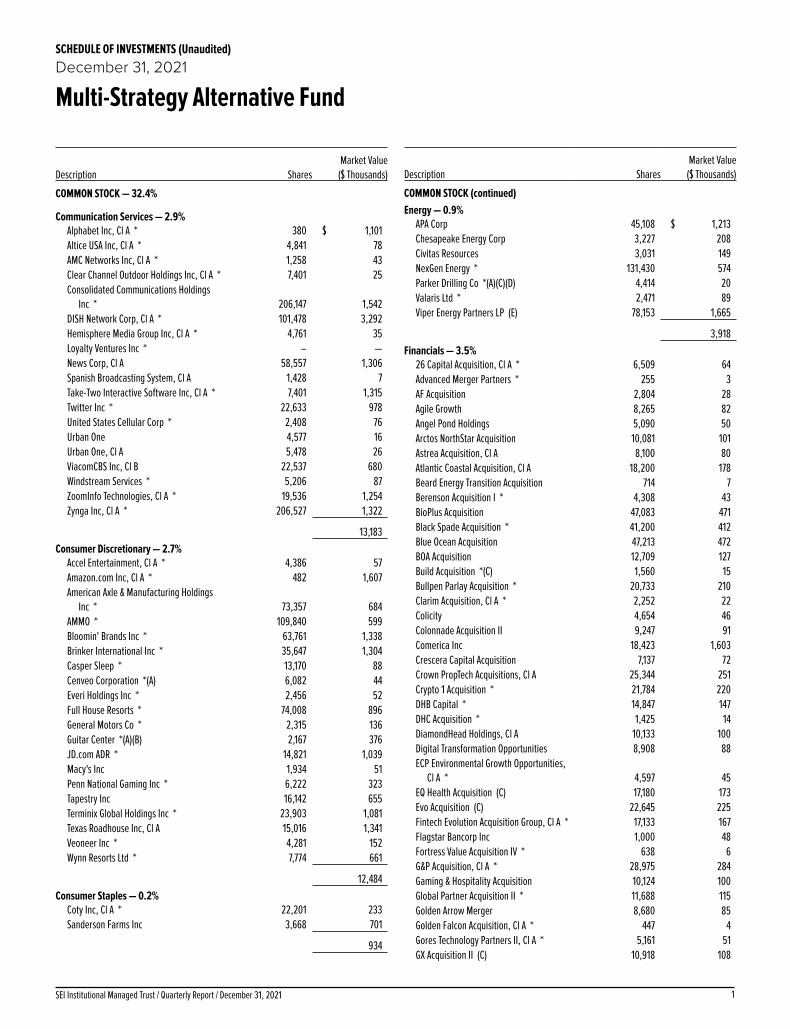
1SEI Institutional Managed Trust / Quarterly Report / December 31, 2021
SCHEDULE OF INVESTMENTS (Unaudited)December 31, 2021
Multi-Strategy Alternative Fund
Description SharesMarket Value
($ Thousands)
COMMON STOCK — 32.4%
Communication Services — 2.9%Alphabet Inc, Cl A * 380 $ 1,101Altice USA Inc, Cl A * 4,841 78AMC Networks Inc, Cl A * 1,258 43Clear Channel Outdoor Holdings Inc, Cl A * 7,401 25Consolidated Communications Holdings
Inc * 206,147 1,542DISH Network Corp, Cl A * 101,478 3,292Hemisphere Media Group Inc, Cl A * 4,761 35Loyalty Ventures Inc * – —News Corp, Cl A 58,557 1,306Spanish Broadcasting System, Cl A 1,428 7Take-Two Interactive Software Inc, Cl A * 7,401 1,315Twitter Inc * 22,633 978United States Cellular Corp * 2,408 76Urban One 4,577 16Urban One, Cl A 5,478 26ViacomCBS Inc, Cl B 22,537 680Windstream Services * 5,206 87ZoomInfo Technologies, Cl A * 19,536 1,254Zynga Inc, Cl A * 206,527 1,322
13,183Consumer Discretionary — 2.7%
Accel Entertainment, Cl A * 4,386 57Amazon.com Inc, Cl A * 482 1,607American Axle & Manufacturing Holdings
Inc * 73,357 684AMMO * 109,840 599Bloomin' Brands Inc * 63,761 1,338Brinker International Inc * 35,647 1,304Casper Sleep * 13,170 88Cenveo Corporation *(A) 6,082 44Everi Holdings Inc * 2,456 52Full House Resorts * 74,008 896General Motors Co * 2,315 136Guitar Center *(A)(B) 2,167 376JD.com ADR * 14,821 1,039Macy's Inc 1,934 51Penn National Gaming Inc * 6,222 323Tapestry Inc 16,142 655Terminix Global Holdings Inc * 23,903 1,081Texas Roadhouse Inc, Cl A 15,016 1,341Veoneer Inc * 4,281 152Wynn Resorts Ltd * 7,774 661
12,484Consumer Staples — 0.2%
Coty Inc, Cl A * 22,201 233Sanderson Farms Inc 3,668 701
934
Description SharesMarket Value
($ Thousands)
COMMON STOCK (continued)Energy — 0.9%
APA Corp 45,108 $ 1,213Chesapeake Energy Corp 3,227 208Civitas Resources 3,031 149NexGen Energy * 131,430 574Parker Drilling Co *(A)(C)(D) 4,414 20Valaris Ltd * 2,471 89Viper Energy Partners LP (E) 78,153 1,665
3,918Financials — 3.5%
26 Capital Acquisition, Cl A * 6,509 64Advanced Merger Partners * 255 3AF Acquisition 2,804 28Agile Growth 8,265 82Angel Pond Holdings 5,090 50Arctos NorthStar Acquisition 10,081 101Astrea Acquisition, Cl A 8,100 80Atlantic Coastal Acquisition, Cl A 18,200 178Beard Energy Transition Acquisition 714 7Berenson Acquisition I * 4,308 43BioPlus Acquisition 47,083 471Black Spade Acquisition * 41,200 412Blue Ocean Acquisition 47,213 472BOA Acquisition 12,709 127Build Acquisition *(C) 1,560 15Bullpen Parlay Acquisition * 20,733 210Clarim Acquisition, Cl A * 2,252 22Colicity 4,654 46Colonnade Acquisition II 9,247 91Comerica Inc 18,423 1,603Crescera Capital Acquisition 7,137 72Crown PropTech Acquisitions, Cl A 25,344 251Crypto 1 Acquisition * 21,784 220DHB Capital * 14,847 147DHC Acquisition * 1,425 14DiamondHead Holdings, Cl A 10,133 100Digital Transformation Opportunities 8,908 88ECP Environmental Growth Opportunities,
Cl A * 4,597 45EQ Health Acquisition (C) 17,180 173Evo Acquisition (C) 22,645 225Fintech Evolution Acquisition Group, Cl A * 17,133 167Flagstar Bancorp Inc 1,000 48Fortress Value Acquisition IV * 638 6G&P Acquisition, Cl A * 28,975 284Gaming & Hospitality Acquisition 10,124 100Global Partner Acquisition II * 11,688 115Golden Arrow Merger 8,680 85Golden Falcon Acquisition, Cl A * 447 4Gores Technology Partners II, Cl A * 5,161 51GX Acquisition II (C) 10,918 108

SEI Institutional Managed Trust / Quarterly Report / December 31, 20212
SCHEDULE OF INVESTMENTS (Unaudited)December 31, 2021
Multi-Strategy Alternative Fund (Continued)
Description SharesMarket Value
($ Thousands)
COMMON STOCK (continued)Healthcare Capital, Cl A 2,552 $ 25Howard Bancorp Inc * 1,386 30Inflection Point Acquisition 5,700 57InterPrivate II Acquisition 7,668 76InterPrivate IV InfraTech Partners 7,186 71Investors Bancorp Inc 53,300 808Kismet Acquisition Three 15,810 153LAMF Global Ventures I 26 —Leo Holdings II 1,439 14LF Capital Acquisition II 714 7Marblegate Acquisition 4,304 43MDH Acquisition, Cl A * 4,499 44Mission Advancement, Cl A 57,657 561Nabors Energy Transition 1,427 14NightDragon Acquisition 1,439 14Noble Corp * 1,654 41Noble Rock Acquisition, Cl A * 17,735 172Northern Star Investment IV 5,047 50OneMain Holdings Inc, Cl A 1,522 76Orion Acquisition 2,436 24Pearl Holdings Acquisition * 20,000 200Penney Borrower LLC * 3,070 38People's United Financial Inc 20,976 374Peridot Acquisition II * 10,922 108Phoenix Biotech Acquisition 7,126 72Pine Technology Acquisition (C) 18,129 183Plum Acquisition I 5,674 55Priveterra Acquisition * 14,584 145PROG Holdings Inc 22,196 1,001Ribbit LEAP *(C) 56,719 564Rosecliff Acquisition I, Cl A 23,980 235RXR Acquisition * 3,781 37Science Strategic Acquisition Alpha 11,414 113SCP & CO Healthcare Acquisition * 2,840 29ShoulderUp Technology Acquisition * 1,427 14Silvergate Capital, Cl A * 6,477 960Skydeck Acquisition 37,555 372Social Leverage Acquisition I 66 1Tailwind International Acquisition *(C) 15,880 157TB Acquisition (C) 21,719 215TCV Acquisition, Cl A 50,160 495Thunder Bridge Capital Partners III, Cl A * 755 8TLG Acquisition One * 11,077 110TPB Acquisition I 86 1Twelve Seas Investment II, Cl A 18,340 178TZP Strategies Acquisition 9,979 99VPC Impact Acquisition Holdings II, Cl A * 2,246 22Worldwide Webb Acquisition 161 2XPAC Acquisition 207 2Zions Bancorp NA 23,843 1,506
Description SharesMarket Value
($ Thousands)
COMMON STOCK (continued)Z-Work Acquisition * 7,794 $ 77
16,061Health Care — 2.5%
Arena Pharmaceuticals Inc * 16,949 1,575Bausch Health * 140,066 3,867Definitive Healthcare Corp, Cl A *(C) 29,145 797Intersect ENT Inc * 29,508 806Jazz Pharmaceuticals PLC * 2,592 330Monitronics International Inc *(A)(B)(C) 18,437 199Ortho Clinical Diagnostics Holdings * 3,055 65Quidel Corp * 354 48Viatris Inc, Cl W * 245,035 3,315
11,002Industrials — 2.9%
Air Transport Services Group Inc * 84,290 2,476AutoStore Holdings 78,629 310Canadian Pacific Railway 1 —IHS Markit Ltd 14,646 1,947Kirby Corp * 40,876 2,429RR Donnelley & Sons Co * 2,357 27Spirit AeroSystems Holdings Inc, Cl A 56,767 2,446Thomson Reuters 7,016 839Timken Co/The 20,037 1,388Uber Technologies Inc * 32,393 1,358
13,220Information Technology — 9.4%
Advanced Micro Devices Inc * 4,635 667Alliance Data Systems Corp 12,598 839Aquity Holdings Inc *(A) 3,945 44Bill.com Holdings Inc * 4,250 1,059CDW Corp/DE 2,372 486Cirrus Logic Inc * 7,249 667CommScope Holding Co Inc * 61,521 679Dlocal Ltd/Uruguay, Cl A * 31,874 1,138Dynatrace Inc * 28,680 1,731EPAM Systems Inc * 1,021 682Fidelity National Information Services
Inc, Cl B 12,503 1,365Flex * 52,037 954Gitlab, Cl A 119 10HubSpot Inc * 1,287 848Intuit Inc 2,982 1,918Mandiant Inc * 187,780 3,294Mastercard Inc, Cl A 2,818 1,013McAfee Corp, Cl A 1,634 42MicroStrategy Inc, Cl A * 1,198 652Momentive Global * 15,110 320NeoPhotonics Corp * 23,558 362Nuance Communications Inc * 87,660 4,849NVIDIA Corp 3,256 958
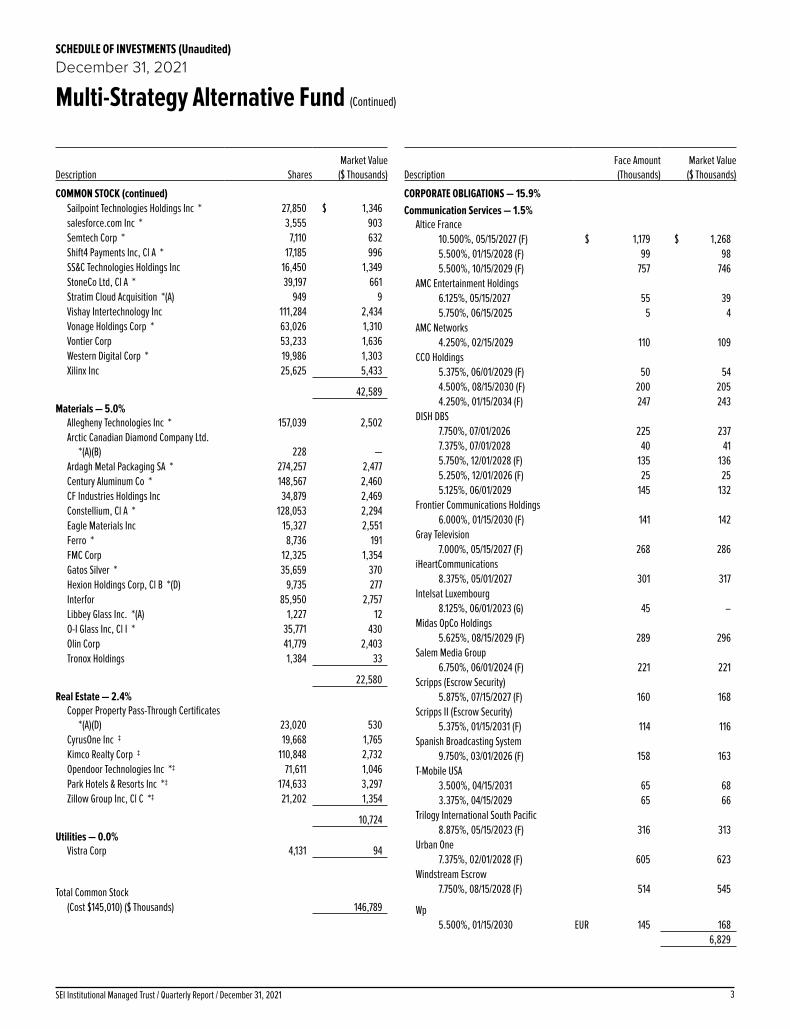
3SEI Institutional Managed Trust / Quarterly Report / December 31, 2021
SCHEDULE OF INVESTMENTS (Unaudited)December 31, 2021
Multi-Strategy Alternative Fund (Continued)
Description SharesMarket Value
($ Thousands)
COMMON STOCK (continued)Sailpoint Technologies Holdings Inc * 27,850 $ 1,346salesforce.com Inc * 3,555 903Semtech Corp * 7,110 632Shift4 Payments Inc, Cl A * 17,185 996SS&C Technologies Holdings Inc 16,450 1,349StoneCo Ltd, Cl A * 39,197 661Stratim Cloud Acquisition *(A) 949 9Vishay Intertechnology Inc 111,284 2,434Vonage Holdings Corp * 63,026 1,310Vontier Corp 53,233 1,636Western Digital Corp * 19,986 1,303Xilinx Inc 25,625 5,433
42,589Materials — 5.0%
Allegheny Technologies Inc * 157,039 2,502Arctic Canadian Diamond Company Ltd.
*(A)(B) 228 —Ardagh Metal Packaging SA * 274,257 2,477Century Aluminum Co * 148,567 2,460CF Industries Holdings Inc 34,879 2,469Constellium, Cl A * 128,053 2,294Eagle Materials Inc 15,327 2,551Ferro * 8,736 191FMC Corp 12,325 1,354Gatos Silver * 35,659 370Hexion Holdings Corp, Cl B *(D) 9,735 277Interfor 85,950 2,757Libbey Glass Inc. *(A) 1,227 12O-I Glass Inc, Cl I * 35,771 430Olin Corp 41,779 2,403Tronox Holdings 1,384 33
22,580Real Estate — 2.4%
Copper Property Pass-Through Certificates *(A)(D) 23,020 530
CyrusOne Inc ‡ 19,668 1,765Kimco Realty Corp ‡ 110,848 2,732Opendoor Technologies Inc *‡ 71,611 1,046Park Hotels & Resorts Inc *‡ 174,633 3,297Zillow Group Inc, Cl C *‡ 21,202 1,354
10,724Utilities — 0.0%
Vistra Corp 4,131 94
Total Common Stock
(Cost $145,010) ($ Thousands) 146,789
DescriptionFace Amount (Thousands)
Market Value ($ Thousands)
CORPORATE OBLIGATIONS — 15.9%Communication Services — 1.5%
Altice France 10.500%, 05/15/2027 (F) $ 1,179 $ 1,2685.500%, 01/15/2028 (F) 99 985.500%, 10/15/2029 (F) 757 746
AMC Entertainment Holdings 6.125%, 05/15/2027 55 395.750%, 06/15/2025 5 4
AMC Networks 4.250%, 02/15/2029 110 109
CCO Holdings 5.375%, 06/01/2029 (F) 50 544.500%, 08/15/2030 (F) 200 2054.250%, 01/15/2034 (F) 247 243
DISH DBS 7.750%, 07/01/2026 225 2377.375%, 07/01/2028 40 415.750%, 12/01/2028 (F) 135 1365.250%, 12/01/2026 (F) 25 255.125%, 06/01/2029 145 132
Frontier Communications Holdings 6.000%, 01/15/2030 (F) 141 142
Gray Television 7.000%, 05/15/2027 (F) 268 286
iHeartCommunications 8.375%, 05/01/2027 301 317
Intelsat Luxembourg 8.125%, 06/01/2023 (G) 45 –
Midas OpCo Holdings 5.625%, 08/15/2029 (F) 289 296
Salem Media Group 6.750%, 06/01/2024 (F) 221 221
Scripps (Escrow Security) 5.875%, 07/15/2027 (F) 160 168
Scripps II (Escrow Security) 5.375%, 01/15/2031 (F) 114 116
Spanish Broadcasting System 9.750%, 03/01/2026 (F) 158 163
T-Mobile USA 3.500%, 04/15/2031 65 683.375%, 04/15/2029 65 66
Trilogy International South Pacific 8.875%, 05/15/2023 (F) 316 313
Urban One 7.375%, 02/01/2028 (F) 605 623
Windstream Escrow 7.750%, 08/15/2028 (F) 514 545
Wp 5.500%, 01/15/2030 EUR 145 168
6,829
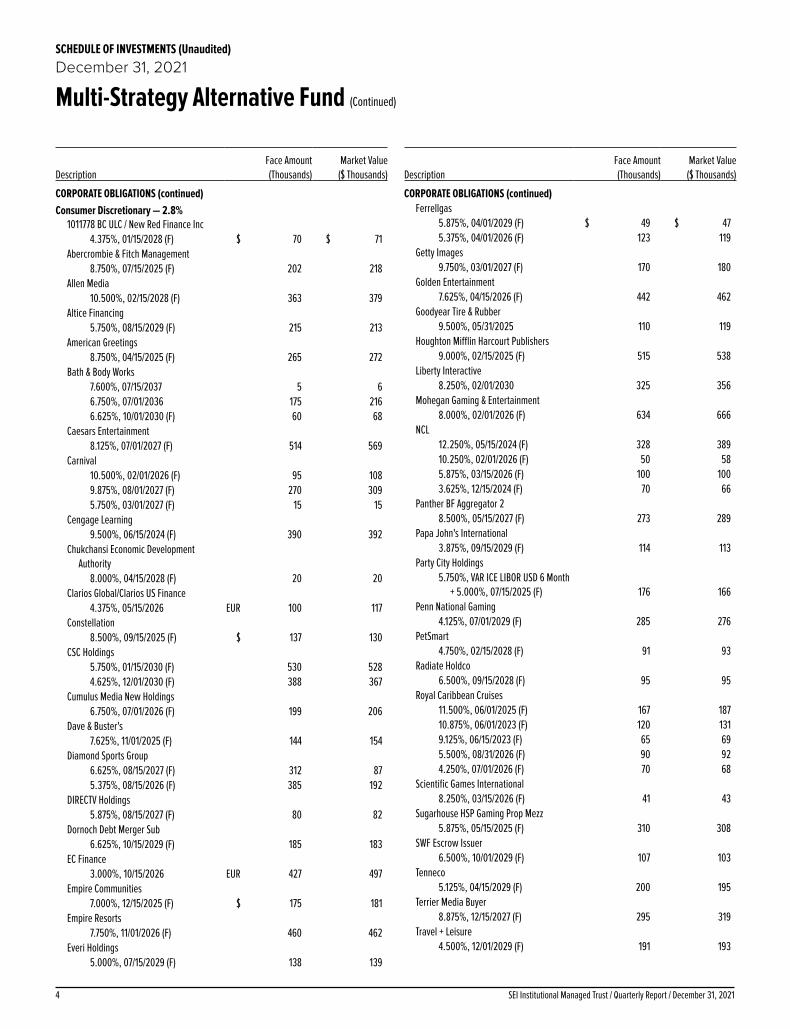
SEI Institutional Managed Trust / Quarterly Report / December 31, 20214
SCHEDULE OF INVESTMENTS (Unaudited)December 31, 2021
Multi-Strategy Alternative Fund (Continued)
DescriptionFace Amount (Thousands)
Market Value ($ Thousands)
CORPORATE OBLIGATIONS (continued)Consumer Discretionary — 2.8%
1011778 BC ULC / New Red Finance Inc 4.375%, 01/15/2028 (F) $ 70 $ 71
Abercrombie & Fitch Management 8.750%, 07/15/2025 (F) 202 218
Allen Media 10.500%, 02/15/2028 (F) 363 379
Altice Financing 5.750%, 08/15/2029 (F) 215 213
American Greetings 8.750%, 04/15/2025 (F) 265 272
Bath & Body Works 7.600%, 07/15/2037 5 66.750%, 07/01/2036 175 2166.625%, 10/01/2030 (F) 60 68
Caesars Entertainment 8.125%, 07/01/2027 (F) 514 569
Carnival 10.500%, 02/01/2026 (F) 95 1089.875%, 08/01/2027 (F) 270 3095.750%, 03/01/2027 (F) 15 15
Cengage Learning 9.500%, 06/15/2024 (F) 390 392
Chukchansi Economic Development Authority
8.000%, 04/15/2028 (F) 20 20Clarios Global/Clarios US Finance
4.375%, 05/15/2026 EUR 100 117Constellation
8.500%, 09/15/2025 (F) $ 137 130CSC Holdings
5.750%, 01/15/2030 (F) 530 5284.625%, 12/01/2030 (F) 388 367
Cumulus Media New Holdings 6.750%, 07/01/2026 (F) 199 206
Dave & Buster's 7.625%, 11/01/2025 (F) 144 154
Diamond Sports Group 6.625%, 08/15/2027 (F) 312 875.375%, 08/15/2026 (F) 385 192
DIRECTV Holdings 5.875%, 08/15/2027 (F) 80 82
Dornoch Debt Merger Sub 6.625%, 10/15/2029 (F) 185 183
EC Finance 3.000%, 10/15/2026 EUR 427 497
Empire Communities 7.000%, 12/15/2025 (F) $ 175 181
Empire Resorts 7.750%, 11/01/2026 (F) 460 462
Everi Holdings 5.000%, 07/15/2029 (F) 138 139
DescriptionFace Amount (Thousands)
Market Value ($ Thousands)
CORPORATE OBLIGATIONS (continued)Ferrellgas
5.875%, 04/01/2029 (F) $ 49 $ 475.375%, 04/01/2026 (F) 123 119
Getty Images 9.750%, 03/01/2027 (F) 170 180
Golden Entertainment 7.625%, 04/15/2026 (F) 442 462
Goodyear Tire & Rubber 9.500%, 05/31/2025 110 119
Houghton Mifflin Harcourt Publishers 9.000%, 02/15/2025 (F) 515 538
Liberty Interactive 8.250%, 02/01/2030 325 356
Mohegan Gaming & Entertainment 8.000%, 02/01/2026 (F) 634 666
NCL 12.250%, 05/15/2024 (F) 328 38910.250%, 02/01/2026 (F) 50 585.875%, 03/15/2026 (F) 100 1003.625%, 12/15/2024 (F) 70 66
Panther BF Aggregator 2 8.500%, 05/15/2027 (F) 273 289
Papa John's International 3.875%, 09/15/2029 (F) 114 113
Party City Holdings 5.750%, VAR ICE LIBOR USD 6 Month
+ 5.000%, 07/15/2025 (F) 176 166Penn National Gaming
4.125%, 07/01/2029 (F) 285 276PetSmart
4.750%, 02/15/2028 (F) 91 93Radiate Holdco
6.500%, 09/15/2028 (F) 95 95Royal Caribbean Cruises
11.500%, 06/01/2025 (F) 167 18710.875%, 06/01/2023 (F) 120 1319.125%, 06/15/2023 (F) 65 695.500%, 08/31/2026 (F) 90 924.250%, 07/01/2026 (F) 70 68
Scientific Games International 8.250%, 03/15/2026 (F) 41 43
Sugarhouse HSP Gaming Prop Mezz 5.875%, 05/15/2025 (F) 310 308
SWF Escrow Issuer 6.500%, 10/01/2029 (F) 107 103
Tenneco 5.125%, 04/15/2029 (F) 200 195
Terrier Media Buyer 8.875%, 12/15/2027 (F) 295 319
Travel + Leisure 4.500%, 12/01/2029 (F) 191 193

5SEI Institutional Managed Trust / Quarterly Report / December 31, 2021
SCHEDULE OF INVESTMENTS (Unaudited)December 31, 2021
Multi-Strategy Alternative Fund (Continued)
DescriptionFace Amount (Thousands)
Market Value ($ Thousands)
CORPORATE OBLIGATIONS (continued)VOC Escrow
5.000%, 02/15/2028 (F) $ 135 $ 134White Capital Parent
8.250%cash/9.000% PIK, 03/15/2026 (F) 125 128
William Hill MTN 4.750%, 05/01/2026 GBP 200 279
Wynn Las Vegas 5.500%, 03/01/2025 (F) $ 50 525.250%, 05/15/2027 (F) 60 614.250%, 05/30/2023 (F) 15 15
Wynn Resorts Finance 7.750%, 04/15/2025 (F) 120 1265.125%, 10/01/2029 (F) 263 267
13,083
Consumer Staples — 0.7%Albertsons
7.500%, 03/15/2026 (F) 1,452 1,550New Albertsons
8.700%, 05/01/2030 235 295Post Holdings
5.500%, 12/15/2029 (F) 5 54.625%, 04/15/2030 (F) 95 974.500%, 09/15/2031 (F) 171 170
Rite Aid 8.000%, 11/15/2026 (F) 76 787.700%, 02/15/2027 345 315
US Foods 6.250%, 04/15/2025 (F) 157 163
Vector Group 10.500%, 11/01/2026 (F) 225 2335.750%, 02/01/2029 (F) 305 297
3,203
Energy — 3.0%Aethon United BR
8.250%, 02/15/2026 (F) 160 172Antero Midstream Partners
7.875%, 05/15/2026 (F) 15 165.750%, 03/01/2027 (F) 125 130
Antero Resources 7.625%, 02/01/2029 (F) 102 113
Ascent Resources Utica Holdings 8.250%, 12/31/2028 (F) 43 455.875%, 06/30/2029 (F) 351 338
Blue Racer Midstream 6.625%, 07/15/2026 (F) 155 160
Carrizo Oil & Gas 8.250%, 07/15/2025 200 197
Chesapeake Energy (Escrow Security) 0.000%, 12/31/2049 (A)(B) 225 2
DescriptionFace Amount (Thousands)
Market Value ($ Thousands)
CORPORATE OBLIGATIONS (continued)CNX Midstream Partners
4.750%, 04/15/2030 (F) $ 25 $ 25CNX Resources
7.250%, 03/14/2027 (F) 95 101Comstock Resources
7.500%, 05/15/2025 (F) 199 205CQP Holdco
5.500%, 06/15/2031 (F) 598 624CrownRock
5.625%, 10/15/2025 (F) 271 277DCP Midstream Operating
3.250%, 02/15/2032 125 126Encino Acquisition Partners Holdings
8.500%, 05/01/2028 (F) 122 127Energy Transfer
6.625%, VAR ICE LIBOR USD 3 Month + 4.155%(H) 83 79
EnLink Midstream 5.625%, 01/15/2028 (F) 80 835.375%, 06/01/2029 60 61
EQT 7.500%, 02/01/2030 115 1486.625%, 02/01/2025 50 56
GAC Holdco 12.000%, 08/15/2025 (F) 272 294
Genesis Energy 8.000%, 01/15/2027 150 1557.750%, 02/01/2028 110 111
Harvest Midstream I 7.500%, 09/01/2028 (F) 467 500
Howard Midstream Energy Partners 6.750%, 01/15/2027 (F) 315 323
ITT Holdings 6.500%, 08/01/2029 (F) 115 114
Laredo Petroleum 10.125%, 01/15/2028 40 429.500%, 01/15/2025 125 127
MC Brazil Downstream Trading SARL 7.250%, 06/30/2031 (F) 840 836
New Fortress Energy 6.750%, 09/15/2025 (F) 70 716.500%, 09/30/2026 (F) 81 80
NGL Energy Operating 7.500%, 02/01/2026 (F) 120 124
NGL Energy Partners 7.500%, 11/01/2023 290 2867.500%, 04/15/2026 65 566.125%, 03/01/2025 145 124
Northern Oil and Gas 8.125%, 03/01/2028 (F) 245 258
Oasis Midstream Partners 8.000%, 04/01/2029 (F) 392 427

SEI Institutional Managed Trust / Quarterly Report / December 31, 20216
SCHEDULE OF INVESTMENTS (Unaudited)December 31, 2021
Multi-Strategy Alternative Fund (Continued)
DescriptionFace Amount (Thousands)
Market Value ($ Thousands)
CORPORATE OBLIGATIONS (continued)Occidental Petroleum
6.125%, 01/01/2031 $ 40 $ 495.500%, 12/01/2025 70 784.625%, 06/15/2045 120 1244.500%, 07/15/2044 10 104.400%, 04/15/2046 10 10
OQ SAOC MTN 5.125%, 05/06/2028 (F) 200 203
PBF Holding 9.250%, 05/15/2025 (F) 263 2507.250%, 06/15/2025 195 139
Petrofac 9.750%, 11/15/2026 (F) 505 515
Petroleos Mexicanos 6.950%, 01/28/2060 (F) 351 3136.875%, 10/16/2025 (F) 223 2446.700%, 02/16/2032 (F) 156 1585.950%, 01/28/2031 (F) 305 2964.500%, 01/23/2026 211 2133.500%, 01/30/2023 604 610
Petroleos Mexicanos MTN 6.750%, 09/21/2047 403 358
Range Resources 9.250%, 02/01/2026 706 761
Rockcliff Energy II 5.500%, 10/15/2029 (F) 512 527
Secure Energy Services 7.250%, 12/30/2026 (F) CAD 221 176
Shelf Drilling Holdings 8.875%, 11/15/2024 (F) $ 60 628.250%, 02/15/2025 (F) 270 197
Strathcona Resources 6.875%, 08/01/2026 (F) 320 315
Summit Midstream Holdings 8.500%, 10/15/2026 (F) 69 72
Tallgrass Energy Partners 6.000%, 09/01/2031 (F) 272 269
Targa Resources Partners 4.000%, 01/15/2032 (F) 145 151
Transocean 11.500%, 01/30/2027 (F) 185 1816.800%, 03/15/2038 290 157
Tullow Oil 10.250%, 05/15/2026 (F) 662 669
Vine Energy Holdings 6.750%, 04/15/2029 (F) 184 200
14,320
Financials — 2.4%AG Issuer
6.250%, 03/01/2028 (F) 180 187
DescriptionFace Amount (Thousands)
Market Value ($ Thousands)
CORPORATE OBLIGATIONS (continued)Avianca Midco 2
9.000%, 12/01/2028 (F) $ 368 $ 371Barclays
7.750%, VAR USD Swap Semi 30/360 5 Yr Curr + 4.842%(H) 195 209
Citigroup Global Markets Holdings 12.575%, 03/31/2022 (F)(I) EGP 13,128 814
Enact Holdings 6.500%, 08/15/2025 (F) $ 140 153
Finance of America Funding 7.875%, 11/15/2025 (F) 435 428
Freedom Mortgage 8.250%, 04/15/2025 (F) 398 4076.625%, 01/15/2027 (F) 360 352
Goldman Sachs International MTN 13.111%, 01/13/2022 (F)(I) EGP 11,900 756
Home Point Capital 5.000%, 02/01/2026 (F) $ 130 121
HSBC Bank 0.000%, 02/10/2022 (F)(I) EGP 6,825 430
Jane Street Group 4.500%, 11/15/2029 (F) $ 220 222
JPMorgan Chase Bank MTN 12.396%, 03/17/2022 (F)(I) EGP 9,141 570
LD Holdings Group 6.500%, 11/01/2025 (F) $ 165 1636.125%, 04/01/2028 (F) 130 122
MDGH - GMTN BV MTN 4.500%, 11/07/2028 200 230
New Residential Investment 6.250%, 10/15/2025 (F) 280 281
Novo Banco MTN 3.500%, 01/02/2043 EUR 20 223.500%, 01/23/2043 280 312
OneMain Finance 7.125%, 03/15/2026 $ 105 1206.875%, 03/15/2025 100 111
PennyMac Financial Services 5.750%, 09/15/2031 (F) 15 154.250%, 02/15/2029 (F) 160 154
Sabre GLBL 9.250%, 04/15/2025 (F) 259 2937.375%, 09/01/2025 (F) 70 73
Saracen Development 14.000%cash/3.000% PIK,
10/15/2025 (F) 390 432Shimao Group Holdings
6.125%, 02/21/2024 1,003 643United Wholesale Mortgage
5.750%, 06/15/2027 (F) 200 200VistaJet Malta Finance
10.500%, 06/01/2024 (F) 789 844

7SEI Institutional Managed Trust / Quarterly Report / December 31, 2021
SCHEDULE OF INVESTMENTS (Unaudited)December 31, 2021
Multi-Strategy Alternative Fund (Continued)
DescriptionFace Amount (Thousands)
Market Value ($ Thousands)
CORPORATE OBLIGATIONS (continued)VTB Bank Via VTB Capital
6.950%, 10/17/2022 $ 653 $ 669WeWork
7.875%, 05/01/2025 (F) 570 5455.000%, 07/10/2025 (F) 97 84
10,333
Government — 0.4%CBB International Sukuk Programme WLL
3.875%, 05/18/2029 (F) 1,894 1,847
Health Care — 1.3%Akumin
7.000%, 11/01/2025 (F) 400 381Akumin Escrow
7.500%, 08/01/2028 (F) 125 117Bausch Health
9.000%, 12/15/2025 (F) 109 1157.250%, 05/30/2029 (F) 160 1587.000%, 01/15/2028 (F) 70 706.250%, 02/15/2029 (F) 315 2995.250%, 01/30/2030 (F) 155 1365.000%, 02/15/2029 (F) 218 1924.875%, 06/01/2028 (F) 35 36
Bausch Health Americas 9.250%, 04/01/2026 (F) 68 72
Cano Health 6.250%, 10/01/2028 (F) 415 415
Centene 4.625%, 12/15/2029 198 2143.375%, 02/15/2030 239 243
CHS 6.875%, 04/15/2029 (F) 67 686.125%, 04/01/2030 (F) 267 2644.750%, 02/15/2031 (F) 135 136
DaVita 3.750%, 02/15/2031 (F) 212 207
Endo DAC 9.500%, 07/31/2027 (F) 194 1986.000%, 06/30/2028 (F) 128 95
Endo Finance 5.750%, 01/15/2022 (F) 130 120
Endo Luxembourg Finance I S.A.R.L. 6.125%, 04/01/2029 (F) 25 25
Envision Healthcare 8.750%, 10/15/2026 (F) 125 72
FXI Holdings 12.250%, 11/15/2026 (F) 200 2257.875%, 11/01/2024 (F) 123 125
Grifols Escrow Issuer 3.875%, 10/15/2028 EUR 216 246
DescriptionFace Amount (Thousands)
Market Value ($ Thousands)
CORPORATE OBLIGATIONS (continued)Lannett
7.750%, 04/15/2026 (F) $ 385 $ 296RegionalCare Hospital Partners Holdings
9.750%, 12/01/2026 (F) 429 453Tenet Healthcare
4.375%, 01/15/2030 (F) 170 172Trulieve Cannabis Corp
8.000%, 10/06/2026 309 315Varex Imaging
7.875%, 10/15/2027 (F) 203 226Verisure Midholding
5.250%, 02/15/2029 EUR 131 151
5,842
Industrials — 1.0%American Airlines
5.750%, 04/20/2029 (F) $ 135 1445.500%, 04/20/2026 (F) 90 94
Bombardier 7.875%, 04/15/2027 (F) 65 677.500%, 12/01/2024 (F) 25 267.500%, 03/15/2025 (F) 105 107
Builders FirstSource 6.750%, 06/01/2027 (F) 323 341
CoreLogic 4.500%, 05/01/2028 (F) 257 256
Delta Air Lines 7.000%, 05/01/2025 (F) 79 90
Fortress Transportation and Infrastructure Investors
9.750%, 08/01/2027 (F) 240 2696.500%, 10/01/2025 (F) 50 52
Garda World Security 9.500%, 11/01/2027 (F) 194 209
GFL Environmental 4.750%, 06/15/2029 (F) 280 2824.375%, 08/15/2029 (F) 105 104
Icahn Enterprises 4.375%, 02/01/2029 165 161
Monitronics International (Escrow Security) 9.125%, 04/01/2020 (A)(G) 495 –
OHL Operaciones 6.600%, cash/6.600% PIK,
03/31/2026 EUR 146 155OT Merger
7.875%, 10/15/2029 (F) $ 165 162PGT Innovations
4.375%, 10/01/2029 (F) 87 87Team Health Holdings
6.375%, 02/01/2025 (F) 120 113Tervita
11.000%, 12/01/2025 (F) 98 113

SEI Institutional Managed Trust / Quarterly Report / December 31, 20218
SCHEDULE OF INVESTMENTS (Unaudited)December 31, 2021
Multi-Strategy Alternative Fund (Continued)
DescriptionFace Amount (Thousands)
Market Value ($ Thousands)
CORPORATE OBLIGATIONS (continued)TransDigm
8.000%, 12/15/2025 (F) $ 324 $ 3426.250%, 03/15/2026 (F) 437 454
Triumph Group 8.875%, 06/01/2024 (F) 43 477.750%, 08/15/2025 220 2186.250%, 09/15/2024 (F) 20 20
Tutor Perini 6.875%, 05/01/2025 (F) 370 373
Western Global Airlines 10.375%, 08/15/2025 (F) 160 178
4,464
Information Technology — 0.6%Arches Buyer
4.250%, 06/01/2028 (F) 366 366Boxer Parent
9.125%, 03/01/2026 (F) 158 165Castle US Holding
9.500%, 02/15/2028 (F) 170 177CommScope
8.250%, 03/01/2027 (F) 185 1907.125%, 07/01/2028 (F) 409 4026.000%, 03/01/2026 (F) 150 154
CommScope Technologies 6.000%, 06/15/2025 (F) 188 1885.000%, 03/15/2027 (F) 35 33
Magnum Holdings 5.375%, 10/31/2026 (F) 138 143
Presidio Holdings 8.250%, 02/01/2028 (F) 618 658
Twilio 3.875%, 03/15/2031 65 663.625%, 03/15/2029 65 65
Veritas US 7.500%, 09/01/2025 (F) 260 269
2,876
Materials — 1.5%Ardagh Packaging Finance
5.250%, 08/15/2027 (F) 297 299Braskem Idesa SAPI
6.990%, 02/20/2032 (F) 368 369CEMEX Materials
7.700%, 07/21/2025 (F) 265 297Cleveland-Cliffs
9.875%, 10/17/2025 (F) 88 100Cornerstone Chemical
6.750%, 08/15/2024 (F) 1,145 1,025Domtar
6.750%, 10/01/2028 (F) 345 354
DescriptionFace Amount (Thousands)
Market Value ($ Thousands)
CORPORATE OBLIGATIONS (continued)First Quantum Minerals
7.500%, 04/01/2025 (F) $ 650 $ 6696.500%, 03/01/2024 (F) 208 210
Freeport-McMoRan 5.450%, 03/15/2043 195 245
LSB Industries 6.250%, 10/15/2028 (F) 230 239
Mineral Resources 8.125%, 05/01/2027 (F) 265 286
Mountain Province Diamonds 8.000%, 12/15/2022 (D)(F) 390 360
NMG Holding 7.125%, 04/01/2026 (D)(F) 265 281
Northwest Acquisitions ULC 7.125%, 11/01/2022 (A)(D)(F)(G) 460 –
Novelis 3.875%, 08/15/2031 (F) 80 80
Rain CII Carbon 7.250%, 04/01/2025 (F) 335 343
Rayonier AM Products 7.625%, 01/15/2026 (F) 152 161
Tacora Resources 8.250%, 05/15/2026 (F) 165 165
Trident Merger Sub 6.625%, 11/01/2025 (F) 79 79
Trident TPI Holdings 9.250%, 08/01/2024 (F) 114 119
Tronox 4.625%, 03/15/2029 (F) 593 592
6,273
Real Estate — 0.2%Diversified Healthcare Trust
9.750%, 06/15/2025 210 2274.375%, 03/01/2031 85 82
Realogy Group 9.375%, 04/01/2027 (F) 187 2025.750%, 01/15/2029 (F) 280 287
798
Utilities — 0.5%Eskom Holdings SOC MTN
8.450%, 08/10/2028 1,158 1,245NRG Energy
3.875%, 02/15/2032 (F) 277 272Oryx Funding
5.800%, 02/03/2031 (F) 212 224Talen Energy Supply
10.500%, 01/15/2026 (F) 110 477.625%, 06/01/2028 (F) 5 47.250%, 05/15/2027 (F) 120 106

9SEI Institutional Managed Trust / Quarterly Report / December 31, 2021
SCHEDULE OF INVESTMENTS (Unaudited)December 31, 2021
Multi-Strategy Alternative Fund (Continued)
DescriptionFace Amount (Thousands)
Market Value ($ Thousands)
CORPORATE OBLIGATIONS (continued)6.625%, 01/15/2028 (F) $ 75 $ 666.500%, 06/01/2025 95 38
Vistra 7.000%, VAR US Treas Yield Curve
Rate T Note Const Mat 5 Yr + 5.740%(F)(H) 69 70
Vistra Operations 5.500%, 09/01/2026 (F) 55 57
2,129
Total Corporate Obligations
(Cost $71,614) ($ Thousands) 71,997
Shares
REGISTERED INVESTMENT COMPANIES — 11.1%Merger Fund , Cl L 2,877,796 49,843Sprott Physical Uranium Trust 19,864 219
Total Registered Investment Companies
(Cost $46,437) ($ Thousands) 50,062
Face Amount (Thousands)
SOVEREIGN DEBT — 4.2%
Angolan Government International Bond9.375%, 05/08/2048 $ 636 6218.000%, 11/26/2029 1,176 1,158
Argentine Republic Government International Bond
3.875% , 07/09/2022 495 1873.500%, 07/09/2022 75 261.500%, 07/09/2022 1,933 619
Bahrain Government International Bond7.000%, 01/26/2026 400 439
Ecuador Government International Bond2.500% , 07/31/2022 484 318
Egypt Government International Bond MTN7.600%, 03/01/2029 663 6577.500%, 01/31/2027 877 9125.875%, 02/16/2031(F) 365 323
Ghana Government International Bond7.750%, 04/07/2029 534 4466.399%, 04/07/2025(F)(I) 200 140
Jordan Government International Bond5.850%, 07/07/2030(F) 289 2924.950%, 07/07/2025(F) 433 446
Nigeria Government International Bond7.625%, 11/21/2025 1,688 1,7977.375%, 09/28/2033(F) 329 313
DescriptionFace Amount (Thousands)
Market Value ($ Thousands)
SOVEREIGN DEBT (continued)Oman Government International Bond
7.000%, 01/25/2051(F) $ 214 $ 2246.750%, 01/17/2048 495 5036.250%, 01/25/2031 596 651
Oman Sovereign Sukuk4.875%, 06/15/2030(F) 200 212
Paraguay Government International Bond4.625%, 01/25/2023 1,810 1,869
Saudi Government International Bond MTN3.750%, 01/21/2055(F) 300 3222.750%, 02/03/2032(F) 972 1,000
South Africa Government Bond10.500%, 12/21/2026 ZAR 21,618 1,4988.875%, 02/28/2035 3,107 1758.250%, 03/31/2032 1,346 76
South Africa Government International Bond
8.000%, 01/31/2030 9,470 547Turkey Government International Bond
6.375%, 10/14/2025 $ 506 493Ukraine Government International Bond
7.375%, 09/25/2032 1,100 9796.876%, 05/21/2029 1,269 1,1210.026%, 05/31/2040 890 809
Total Sovereign Debt (Cost $19,577) ($ Thousands) 19,173
LOAN PARTICIPATIONS — 4.2%1236904 B.C. Ltd., Initial Term Loan, 1st
Lien5.604%, 03/04/2027 (J) 260 255
Advisors Group, 1st Lien4.604%, 07/31/2026 60 60
Aegion, 1st Lien5.500%, 05/17/2028 140 140
Agrofresh Inc., Initial Term Loan, 1st Lien7.250%, 12/31/2024 (J) 201 202
American Gaming, Term Loan, 1st Lien14.000%, 02/15/2024 (A)(J) 128 130
American Greetings, Term Loan, 1st Lien5.500%, 04/06/2024 (J) 171 171
American Tire, 1st Lien7.000%, 10/08/2028 (K) 285 286
Apollo Commercial Real Estate Finance, Inc., Term B-1 Loan, 1st Lien
4.000%, VAR LIBOR + 3.500%, 03/11/2028 (A) 199 198
Aquity Solutions, 1st Lien6.750%, 09/13/2026 (A)(B) 440 440

SEI Institutional Managed Trust / Quarterly Report / December 31, 202110
SCHEDULE OF INVESTMENTS (Unaudited)December 31, 2021
Multi-Strategy Alternative Fund (Continued)
DescriptionFace Amount (Thousands)
Market Value ($ Thousands)
LOAN PARTICIPATIONS (continued)Arctic Canadian Diamond Company Ltd.,
Term Loan A-2, 1st Lien6.000%, 12/31/2024 (A)(B) $ 35 $ 35
Arctic Canadian Diamond Company Ltd., Term Loan, 2nd Lien
17.500%, 12/31/2027 (A)(B) 229 229Aveanna Healthcare LLC, 2021 Extended
Term Loan, 1st Lien4.250%, 07/17/2028 39 39
Aveanna Healthcare LLC, Extended Term Loan, 1st Lien
4.250%, 07/17/2028 166 165Boardriders Inc., Closing Date Tranche A
Loan, 1st Lien9.000%, 10/23/2023 (D) 46 45
Boardriders Inc., Closing Date Tranche B-2 Loan, 1st Lien
9.000%, 04/23/2024 (D) 272 267Boxer Parent Inc., Replacement Dollar Term
Loan, 1st Lien3.974%, 10/02/2025 273 271
Bright Bidco, Term Loan B, 1st Lien4.500%, 06/30/2024 208 160
Carestream Health Inc., 2023 Extended Term Loan, 1st Lien
7.750%, 05/08/2023 (J) 486 487Carestream Health Inc., 2023 Extended
Term Loan, 2nd Lien13.500%, 08/08/2023 (J) 208 202
CBAC Borrower, LLC, Term Loan B, 1st Lien4.104%, 07/08/2024 (J) 242 239
Century Casinos, Inc., Term Loan, 1st Lien6.500%, 12/07/2026 (A) 184 183
Cenveo Corporation, Exit Term Loan, 1st Lien
8.500%, 06/23/2026 576 565Cogeco Communications Finance, Initial
Term B Loan, 1st Lien3.000%, 09/01/2028 56 56
ConvergeOne Holdings, Corp., Initial Term Loan, 1st Lien
5.104%, VAR LIBOR + 5.000%, 01/04/2026 458 448
Cooper’s Hawk Intermediate Holding, LLC, Initial Term Loan, 1st Lien
6.604%, 10/31/2026 (A)(K) 238 231DEI Sales Inc., Initial Term Loan, 1st Lien
5.604%, 04/28/2028 (A) 291 290DirectTV Financing LLC, Closing Date Term
Loan, 1st Lien5.750%, 08/02/2027 265 265
DescriptionFace Amount (Thousands)
Market Value ($ Thousands)
LOAN PARTICIPATIONS (continued)DMT Solutions Global Corporation, Initial
Term Loan, 1st Lien8.500%, 07/02/2024 (A) $ 44 $ 43
DMT Solutions Global Corporation, Term B-2 Loan, 1st Lien
8.000%, 07/02/2024 103 100DMT Solutions Global Corporation, Term
Loan8.500%, 07/02/2024 42 418.000%, 07/02/2024 99 97
East Valley Tourist Development Authority , Term Loan, 1st Lien
8.500%, VAR LIBOR + 8.000%, 03/07/2022 (A) 176 175
Eastman Tire, Term Loan B, 1st Lien6.000%, 08/12/2028 (A) 175 175
ELO Touch Solutions, Term Loan B, 1st Lien6.604%, 12/14/2025 165 165
Envision Healthcare Corporation, Initial Term Loan, 1st Lien
3.854%, VAR LIBOR + 3.750%, 10/10/2025 (K) 973 780
Epic Y-Grade Services LP, Term Loan, 1st Lien
7.000%, 06/30/2027 (K) 939 790Getty Images, Inc., Initial Dollar Term Loan,
1st Lien4.625%, VAR LIBOR + 4.500%,
02/19/2026 145 145Glass Mountain Holdings Pipeline, 1st Lien
5.500%, 10/28/2027 17 15Global Medical Response, Inc., 2018 New
Term Loan, 1st Lien5.250%, VAR LIBOR + 4.250%,
03/14/2025 285 284Hurtigruten Group, 1st Lien
8.000%, 06/11/2023 (D) 138 156J.C. Penney Borrower LLC, Term Loan
9.250%, 12/07/2025 (J) 368 368J.C. Penney Corporation Inc., Term Loan,
1st Lien5.250%, VAR LIBOR + 4.250%,
06/23/2023 (A) 378 —Jadex Inc., Refinancing Term Loan, 1st Lien
5.500%, 02/18/2028 154 153KNS Acquisition Corp., Initial Term Loan,
1st Lien7.000%, VAR LIBOR + 6.250%,
04/21/2027 302 295Libbey, 1st Lien
11.000%, 11/13/2025 (J) 143 148

11SEI Institutional Managed Trust / Quarterly Report / December 31, 2021
SCHEDULE OF INVESTMENTS (Unaudited)December 31, 2021
Multi-Strategy Alternative Fund (Continued)
DescriptionFace Amount (Thousands)
Market Value ($ Thousands)
LOAN PARTICIPATIONS (continued)Lifescan Global Corporation, Initial Term
Loan, 1st Lien6.130%, 10/01/2024 (J) $ 877 $ 855
LifeScan, 2nd Lien9.630%, 10/01/2025 85 80
Mashantucket (Western) Pequot Tribe, Term Loan B, 1st Lien
8.375%, VAR LIBOR + 8.125%, 02/16/2022 723 698
Mavenir Systems Inc., Initial Term Loan, 1st Lien
5.250%, 08/18/2028 195 195Mcgraw-Hill Education Inc., Initial Term
Loan, 1st Lien5.250%, 07/28/2028 285 283
Mozart Debt Merger, Term Loan, 1st Lien3.750%, 09/30/2028 (A) 235 235
MSG National, 1st Lien7.000%, 12/31/2049 (A) 308 314
Newport Parent, Inc., Initial Term Loan, 1st Lien
7.500%, 12/10/2027 (J) 232 232Onex TSG Intermediate Corp., Initial Term
Loan, 1st Lien5.500%, 02/28/2028 195 194
Peraton Corp., Term B Loan, 1st Lien4.500%, VAR LIBOR + 3.750%,
02/01/2028 204 204PLNTF Holdings Inc., 1st Lien
9.000%, 03/22/2026 (A)(J) 204 204Polymer Additives Inc., Closing Date Term
Loan, 1st Lien6.129%, 07/31/2025 (J) 655 634
Premier Brands Group Holdings, LLC, Term Loan, 1st Lien
8.224%, 03/19/2024 (J) 43 348.214%, 03/19/2024 (K) 151 119
Quantum Health, Inc., Amendment No. 1 Refinancing Term Loan, 1st Lien
5.250%, 12/22/2027 (A) 195 194R.R. Donnelley & Sons Company, Term B
Loan5.104%, 01/15/2024 64 64
Radar Bidco SARL, Initial Term Loan, 1st Lien
10.000%, 12/16/2024 (K) 307 352Revlon Consumer Products Corporation,
2016 Term Loan, 1st Lien4.250%, VAR LIBOR + 3.500%,
09/07/2023 (A)(G) 897 520
DescriptionFace Amount (Thousands)
Market Value ($ Thousands)
LOAN PARTICIPATIONS (continued)RXB Holdings Inc., Initial Term Loan, 1st
Lien5.250%, 12/20/2027 (A) $ 212 $ 212
S&S Holdings, LLC, Cov-Lite, 1st Lien5.500%, 03/11/2028 8 8
S&S Holdings, LLC, Initial Term Loan, 1st Lien
5.500%, 03/11/2028 (J) 281 281SIJ, LLC, Term Loan, 1st Lien
10.139%, 07/15/2026 (A)(J) 149 147Spencer Gifts LLC (Spirit Halloween
Superstores LLC), Term Loan, 1st Lien6.104%, 06/19/2026 (J) 214 213
Springs Window Fashions LLC, Tranche B Term Loan, 1st Lien
4.750%, 09/17/2028 320 317Syniverse Holdings, Inc., Initial Term Loan,
2nd Lien10.000%, VAR LIBOR + 9.000%,
03/11/2024 140 138Syniverse Holdings, Inc., Tranche C Term
Loan , 1st Lien6.000%, VAR LIBOR + 5.000%,
03/09/2023 1,202 1,194Team Health Holdings, Inc., Initial Term
Loan, 1st Lien3.750%, VAR LIBOR + 2.750%,
02/06/2024 566 539Travelport Finance (Luxembourg) S.a r.l.,
Initial Term Loan (Priority), 1st Lien2.500%, 02/28/2025 71 73
Travelport Finance (Luxembourg) S.a r.l., Initial Term Loan, 1st Lien
5.132%, VAR LIBOR + 5.000%, 05/29/2026 (K) 162 135
VC GB Holdings Corp, Initial Term Loan, 1st Lien
4.000%, 07/21/2028 285 282Vida Capital, Term Loan
6.104%, 10/01/2026 (A)(J) 185 169
Total Loan Participations
(Cost $19,013) ($ Thousands) 19,108
Shares
FOREIGN COMMON STOCK — 1.6%
Australia — 0.5%Western Areas 866,988 2,162

SEI Institutional Managed Trust / Quarterly Report / December 31, 202112
SCHEDULE OF INVESTMENTS (Unaudited)December 31, 2021
Multi-Strategy Alternative Fund (Continued)
Description SharesMarket Value
($ Thousands)
FOREIGN COMMON STOCK (continued)Canada — 0.2%
Lightspeed Commerce * 18,605 $ 752
France — 0.1%X-Fab Silicon Foundries *(F) 45,423 472
Hong Kong — 0.1%Alibaba Group Holding * 35,282 538
Italy — 0.2%Nexi * 50,438 802
Luxembourg — 0.0%SES SA, Cl A 4,231 34
Netherlands — 0.2%Adyen NV * 328 862
Norway — 0.1%Nordic Semiconductor * 14,593 493
Spain — 0.0%Obrascon Huarte Lain 35,004 41
United Kingdom — 0.2%Clarivate PLC * 33,327 784John Menzies PLC 7,166 30Micro Focus International ADR 8,205 46Venator Materials PLC * 6,906 17
877
Total Foreign Common Stock
(Cost $7,908) ($ Thousands) 7,033
Face Amount (Thousands)
MUNICIPAL BONDS — 1.4%Puerto Rico — 1.4%
Commonwealth of Puerto Rico, Ser A, GO 8.000%, 07/01/2035 (G) $ 4 4
Commonwealth of Puerto Rico, Ser A-PSA, GO
8.000%, 07/01/2035 (G) 6,255 5,551Commonwealth of Puerto Rico, Ser A-PSA,
GO 5.500%, 07/01/2039 (G) 325 306
DescriptionFace Amount (Thousands)
Market Value ($ Thousands)
MUNICIPAL BONDS (continued)5.000%, 07/01/2041 (G) $ 660 $ 593
Total Municipal Bonds(Cost $6,358) ($ Thousands) 6,454
Number of Warrants
WARRANTS — 0.5%Accretion Acquisition, Expires 02/22/2023
Strike Price $11.50 * 22,925 9Achari Ventures Holdings I,
Expires 02/08/2023Strike Price $11.50 * 46,839 15
Aequi Acquisition, Expires 12/03/2027Strike Price $11.50 * 16,618 9
Aesther Healthcare Acquisition, Expires 01/22/2023Strike Price $11.50 * 9,269 4
AF Acquisition, Expires 04/03/2028Strike Price $11.50 * 12,153 7
AfterNext HealthTech Acquisition, Expires 07/12/2023Strike Price $11.50 * 6,212 4
Agrico Acquisition, Expires 01/03/2029Strike Price $11.50 * 18,387 8
Alberton Acquisition, Expires 11/24/2023Strike Price $11.50 * 2,253 –
Alpha Partners Technology Merger, Expires 04/03/2028Strike Price $11.50 * 7,178 4
Altimar Acquisition III, Expires 01/03/2029Strike Price $11.50 * 2,861 3
AMERICAS TECHNOLOGY ACQUISITION CORP, Expires 01/03/2028Strike Price $11.50 * 1,139 –
Arctos NorthStar Acquisition, Expires 01/03/2029Strike Price $11.50 * 9,421 7
Armada Acquisition I, Expires 01/05/2023Strike Price $11.50 * 1,732 1
Arrowroot Acquisition, Expires 03/05/2026Strike Price $11.50 * 17,880 9
Artemis Strategic Investment, Expires 02/15/2023Strike Price $11.50 * 5,458 3
Astrea Acquisition, Expires 01/16/2026Strike Price $11.50 * 19,270 10
Athlon Acquisition, Expires 03/08/2026Strike Price $11.50 * 58,512 35
Atlantic Avenue Acquisition, Expires 10/09/2027Strike Price $11.50 * 54,602 27
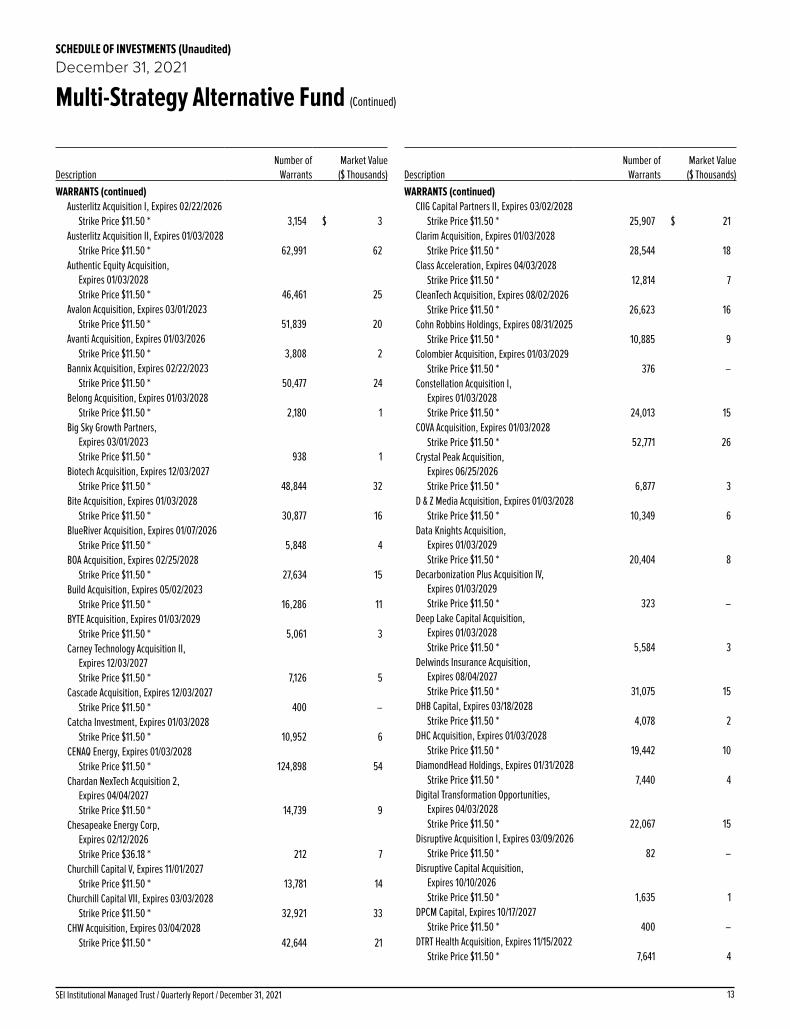
13SEI Institutional Managed Trust / Quarterly Report / December 31, 2021
SCHEDULE OF INVESTMENTS (Unaudited)December 31, 2021
Multi-Strategy Alternative Fund (Continued)
DescriptionNumber of
WarrantsMarket Value
($ Thousands)WARRANTS (continued)
Austerlitz Acquisition I, Expires 02/22/2026Strike Price $11.50 * 3,154 $ 3
Austerlitz Acquisition II, Expires 01/03/2028Strike Price $11.50 * 62,991 62
Authentic Equity Acquisition, Expires 01/03/2028Strike Price $11.50 * 46,461 25
Avalon Acquisition, Expires 03/01/2023Strike Price $11.50 * 51,839 20
Avanti Acquisition, Expires 01/03/2026Strike Price $11.50 * 3,808 2
Bannix Acquisition, Expires 02/22/2023Strike Price $11.50 * 50,477 24
Belong Acquisition, Expires 01/03/2028Strike Price $11.50 * 2,180 1
Big Sky Growth Partners, Expires 03/01/2023Strike Price $11.50 * 938 1
Biotech Acquisition, Expires 12/03/2027Strike Price $11.50 * 48,844 32
Bite Acquisition, Expires 01/03/2028Strike Price $11.50 * 30,877 16
BlueRiver Acquisition, Expires 01/07/2026Strike Price $11.50 * 5,848 4
BOA Acquisition, Expires 02/25/2028Strike Price $11.50 * 27,634 15
Build Acquisition, Expires 05/02/2023Strike Price $11.50 * 16,286 11
BYTE Acquisition, Expires 01/03/2029Strike Price $11.50 * 5,061 3
Carney Technology Acquisition II, Expires 12/03/2027Strike Price $11.50 * 7,126 5
Cascade Acquisition, Expires 12/03/2027Strike Price $11.50 * 400 –
Catcha Investment, Expires 01/03/2028Strike Price $11.50 * 10,952 6
CENAQ Energy, Expires 01/03/2028Strike Price $11.50 * 124,898 54
Chardan NexTech Acquisition 2, Expires 04/04/2027Strike Price $11.50 * 14,739 9
Chesapeake Energy Corp, Expires 02/12/2026Strike Price $36.18 * 212 7
Churchill Capital V, Expires 11/01/2027Strike Price $11.50 * 13,781 14
Churchill Capital VII, Expires 03/03/2028Strike Price $11.50 * 32,921 33
CHW Acquisition, Expires 03/04/2028Strike Price $11.50 * 42,644 21
DescriptionNumber of
WarrantsMarket Value
($ Thousands)WARRANTS (continued)
CIIG Capital Partners II, Expires 03/02/2028Strike Price $11.50 * 25,907 $ 21
Clarim Acquisition, Expires 01/03/2028Strike Price $11.50 * 28,544 18
Class Acceleration, Expires 04/03/2028Strike Price $11.50 * 12,814 7
CleanTech Acquisition, Expires 08/02/2026Strike Price $11.50 * 26,623 16
Cohn Robbins Holdings, Expires 08/31/2025Strike Price $11.50 * 10,885 9
Colombier Acquisition, Expires 01/03/2029Strike Price $11.50 * 376 –
Constellation Acquisition I, Expires 01/03/2028Strike Price $11.50 * 24,013 15
COVA Acquisition, Expires 01/03/2028Strike Price $11.50 * 52,771 26
Crystal Peak Acquisition, Expires 06/25/2026Strike Price $11.50 * 6,877 3
D & Z Media Acquisition, Expires 01/03/2028Strike Price $11.50 * 10,349 6
Data Knights Acquisition, Expires 01/03/2029Strike Price $11.50 * 20,404 8
Decarbonization Plus Acquisition IV, Expires 01/03/2029Strike Price $11.50 * 323 –
Deep Lake Capital Acquisition, Expires 01/03/2028Strike Price $11.50 * 5,584 3
Delwinds Insurance Acquisition, Expires 08/04/2027Strike Price $11.50 * 31,075 15
DHB Capital, Expires 03/18/2028Strike Price $11.50 * 4,078 2
DHC Acquisition, Expires 01/03/2028Strike Price $11.50 * 19,442 10
DiamondHead Holdings, Expires 01/31/2028Strike Price $11.50 * 7,440 4
Digital Transformation Opportunities, Expires 04/03/2028Strike Price $11.50 * 22,067 15
Disruptive Acquisition I, Expires 03/09/2026Strike Price $11.50 * 82 –
Disruptive Capital Acquisition, Expires 10/10/2026Strike Price $11.50 * 1,635 1
DPCM Capital, Expires 10/17/2027Strike Price $11.50 * 400 –
DTRT Health Acquisition, Expires 11/15/2022Strike Price $11.50 * 7,641 4

SEI Institutional Managed Trust / Quarterly Report / December 31, 202114
SCHEDULE OF INVESTMENTS (Unaudited)December 31, 2021
Multi-Strategy Alternative Fund (Continued)
DescriptionNumber of
WarrantsMarket Value
($ Thousands)WARRANTS (continued)
Dune Acquisition, Expires 11/01/2027Strike Price $11.50 * 9,044 $ 4
E.Merge Technology Acquisition, Expires 08/02/2025Strike Price $11.50 * 27,582 15
East Resources Acquisition, Expires 07/04/2027Strike Price $11.50 * 47,713 25
Edify Acquisition, Expires 01/03/2028Strike Price $11.50 * 22,125 11
Empowerment & Inclusion Capital I, Expires 01/03/2028Strike Price $11.50 * 22,282 11
EQ Health Acquisition, Expires 02/05/2028Strike Price $11.50 * 11,911 6
Evo Acquisition, Expires 01/03/2028Strike Price $11.50 * 1,533 1
Executive Network Partnering, Expires 09/28/2028Strike Price $11.50 * 7,711 5
Finnovate Acquisition, Expires 04/18/2023Strike Price $11.50 * 7,422 3
Fintech Evolution Acquisition Group, Expires 04/03/2028Strike Price $11.50 * 5,892 4
Forest Road Acquisition II, Expires 01/18/2026Strike Price $11.50 * 1,525 1
Fortistar Sustainable Solutions, Expires 01/03/2028Strike Price $11.50 * 28,967 18
Fortress Capital Acquisition, Expires 01/03/2028Strike Price $11.50 * 746 1
Fortress Value Acquisition IV, Expires 03/21/2028Strike Price $11.50 * 277 –
Freedom Acquisition I, Expires 01/03/2028Strike Price $11.50 * 14,213 8
Fusion Acquisition II, Expires 01/03/2028Strike Price $11.50 * 29,344 18
G Squared Ascend II, Expires 01/03/2027Strike Price $11.50 * 3,633 2
G&P Acquisition, Expires 03/08/2027Strike Price $11.50 * 24,238 13
GAC Holdco, Expires 08/15/2026Strike Price $– *(A)(B) 272 41
Galata Acquisition, Expires 01/03/2029Strike Price $11.50 * 1,286 1
Gaming & Hospitality Acquisition, Expires 02/07/2028Strike Price $11.50 * 3,738 2
DescriptionNumber of
WarrantsMarket Value
($ Thousands)WARRANTS (continued)
GigCapital5, Expires 01/03/2029Strike Price $11.50 * 53,115 $ 28
Gladstone Acquisition, Expires 01/03/2028Strike Price $11.50 * 10,821 6
Global Consumer Acquisition, Expires 01/03/2028Strike Price $11.50 * 49,117 29
Global SPAC Partners, Expires 12/03/2027Strike Price $11.50 * 24,026 12
Global Synergy Acquisition, Expires 01/03/2028Strike Price $11.50 * 19,802 10
GO Acquisition, Expires 09/03/2027Strike Price $11.50 * 17,821 12
Goal Acquisitions, Expires 02/03/2022Strike Price $11.50 * 99,008 54
GoGreen Investments, Expires 06/07/2023Strike Price $11.50 * 1,048 –
Golden Arrow Merger, Expires 08/03/2026Strike Price $11.50 * 4,618 2
Golden Falcon Acquisition, Expires 11/07/2026Strike Price $11.50 * 10,745 7
Growth Capital Acquisition, Expires 06/04/2027Strike Price $11.50 * 3,942 3
Guitar Center, Expires 12/22/2070Strike Price $160.00 *(A)(B) 574 28
Guitar Center, Expires 12/22/2070Strike Price $100.00 *(A)(B) 574 45
GX Acquisition II, Expires 01/03/2029Strike Price $11.50 * 21,247 11
Hamilton Lane Alliance Holdings I, Expires 01/11/2026Strike Price $11.50 * 74 –
Healthcare Services Acquisition, Expires 01/03/2028Strike Price $11.50 * 15,656 8
Healthwell Acquisition I, Expires 08/08/2028Strike Price $11.50 * 5,502 3
HH&L Acquisition, Expires 02/07/2026Strike Price $11.50 * 27,521 16
HPX, Expires 07/17/2025Strike Price $11.50 * 31,444 17
HumanCo Acquisition, Expires 01/03/2028Strike Price $11.50 * 5,242 4
Industrial Human Capital, Expires 01/03/2029Strike Price $11.50 * 14,727 6
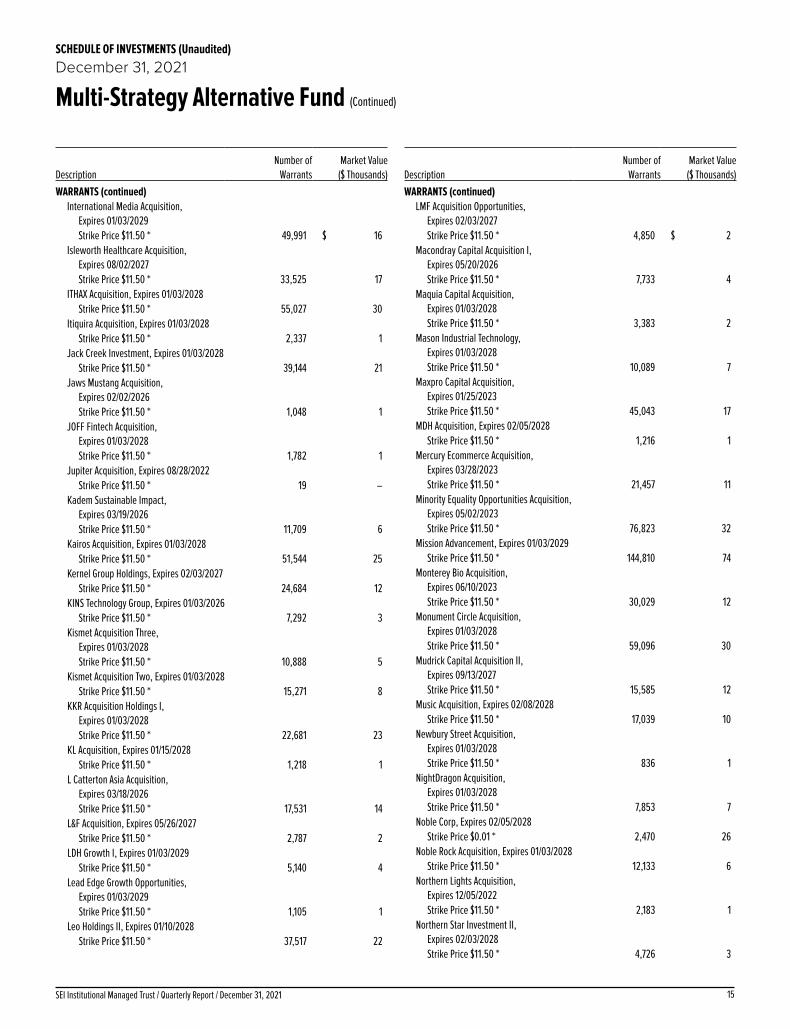
15SEI Institutional Managed Trust / Quarterly Report / December 31, 2021
SCHEDULE OF INVESTMENTS (Unaudited)December 31, 2021
Multi-Strategy Alternative Fund (Continued)
DescriptionNumber of
WarrantsMarket Value
($ Thousands)WARRANTS (continued)
International Media Acquisition, Expires 01/03/2029Strike Price $11.50 * 49,991 $ 16
Isleworth Healthcare Acquisition, Expires 08/02/2027Strike Price $11.50 * 33,525 17
ITHAX Acquisition, Expires 01/03/2028Strike Price $11.50 * 55,027 30
Itiquira Acquisition, Expires 01/03/2028Strike Price $11.50 * 2,337 1
Jack Creek Investment, Expires 01/03/2028Strike Price $11.50 * 39,144 21
Jaws Mustang Acquisition, Expires 02/02/2026Strike Price $11.50 * 1,048 1
JOFF Fintech Acquisition, Expires 01/03/2028Strike Price $11.50 * 1,782 1
Jupiter Acquisition, Expires 08/28/2022Strike Price $11.50 * 19 –
Kadem Sustainable Impact, Expires 03/19/2026Strike Price $11.50 * 11,709 6
Kairos Acquisition, Expires 01/03/2028Strike Price $11.50 * 51,544 25
Kernel Group Holdings, Expires 02/03/2027Strike Price $11.50 * 24,684 12
KINS Technology Group, Expires 01/03/2026Strike Price $11.50 * 7,292 3
Kismet Acquisition Three, Expires 01/03/2028Strike Price $11.50 * 10,888 5
Kismet Acquisition Two, Expires 01/03/2028Strike Price $11.50 * 15,271 8
KKR Acquisition Holdings I, Expires 01/03/2028Strike Price $11.50 * 22,681 23
KL Acquisition, Expires 01/15/2028Strike Price $11.50 * 1,218 1
L Catterton Asia Acquisition, Expires 03/18/2026Strike Price $11.50 * 17,531 14
L&F Acquisition, Expires 05/26/2027Strike Price $11.50 * 2,787 2
LDH Growth I, Expires 01/03/2029Strike Price $11.50 * 5,140 4
Lead Edge Growth Opportunities, Expires 01/03/2029Strike Price $11.50 * 1,105 1
Leo Holdings II, Expires 01/10/2028Strike Price $11.50 * 37,517 22
DescriptionNumber of
WarrantsMarket Value
($ Thousands)WARRANTS (continued)
LMF Acquisition Opportunities, Expires 02/03/2027Strike Price $11.50 * 4,850 $ 2
Macondray Capital Acquisition I, Expires 05/20/2026Strike Price $11.50 * 7,733 4
Maquia Capital Acquisition, Expires 01/03/2028Strike Price $11.50 * 3,383 2
Mason Industrial Technology, Expires 01/03/2028Strike Price $11.50 * 10,089 7
Maxpro Capital Acquisition, Expires 01/25/2023Strike Price $11.50 * 45,043 17
MDH Acquisition, Expires 02/05/2028Strike Price $11.50 * 1,216 1
Mercury Ecommerce Acquisition, Expires 03/28/2023Strike Price $11.50 * 21,457 11
Minority Equality Opportunities Acquisition, Expires 05/02/2023Strike Price $11.50 * 76,823 32
Mission Advancement, Expires 01/03/2029Strike Price $11.50 * 144,810 74
Monterey Bio Acquisition, Expires 06/10/2023Strike Price $11.50 * 30,029 12
Monument Circle Acquisition, Expires 01/03/2028Strike Price $11.50 * 59,096 30
Mudrick Capital Acquisition II, Expires 09/13/2027Strike Price $11.50 * 15,585 12
Music Acquisition, Expires 02/08/2028Strike Price $11.50 * 17,039 10
Newbury Street Acquisition, Expires 01/03/2028Strike Price $11.50 * 836 1
NightDragon Acquisition, Expires 01/03/2028Strike Price $11.50 * 7,853 7
Noble Corp, Expires 02/05/2028Strike Price $0.01 * 2,470 26
Noble Rock Acquisition, Expires 01/03/2028Strike Price $11.50 * 12,133 6
Northern Lights Acquisition, Expires 12/05/2022Strike Price $11.50 * 2,183 1
Northern Star Investment II, Expires 02/03/2028Strike Price $11.50 * 4,726 3
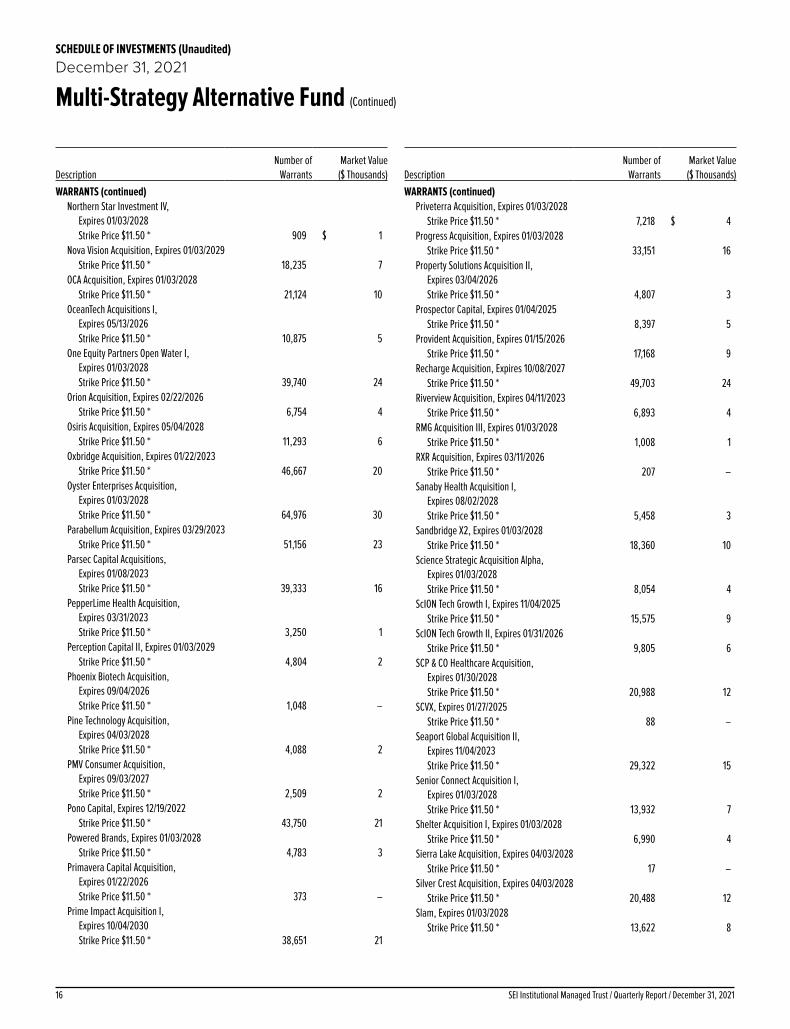
SEI Institutional Managed Trust / Quarterly Report / December 31, 202116
SCHEDULE OF INVESTMENTS (Unaudited)December 31, 2021
Multi-Strategy Alternative Fund (Continued)
DescriptionNumber of
WarrantsMarket Value
($ Thousands)WARRANTS (continued)
Northern Star Investment IV, Expires 01/03/2028Strike Price $11.50 * 909 $ 1
Nova Vision Acquisition, Expires 01/03/2029Strike Price $11.50 * 18,235 7
OCA Acquisition, Expires 01/03/2028Strike Price $11.50 * 21,124 10
OceanTech Acquisitions I, Expires 05/13/2026Strike Price $11.50 * 10,875 5
One Equity Partners Open Water I, Expires 01/03/2028Strike Price $11.50 * 39,740 24
Orion Acquisition, Expires 02/22/2026Strike Price $11.50 * 6,754 4
Osiris Acquisition, Expires 05/04/2028Strike Price $11.50 * 11,293 6
Oxbridge Acquisition, Expires 01/22/2023Strike Price $11.50 * 46,667 20
Oyster Enterprises Acquisition, Expires 01/03/2028Strike Price $11.50 * 64,976 30
Parabellum Acquisition, Expires 03/29/2023Strike Price $11.50 * 51,156 23
Parsec Capital Acquisitions, Expires 01/08/2023Strike Price $11.50 * 39,333 16
PepperLime Health Acquisition, Expires 03/31/2023Strike Price $11.50 * 3,250 1
Perception Capital II, Expires 01/03/2029Strike Price $11.50 * 4,804 2
Phoenix Biotech Acquisition, Expires 09/04/2026Strike Price $11.50 * 1,048 –
Pine Technology Acquisition, Expires 04/03/2028Strike Price $11.50 * 4,088 2
PMV Consumer Acquisition, Expires 09/03/2027Strike Price $11.50 * 2,509 2
Pono Capital, Expires 12/19/2022Strike Price $11.50 * 43,750 21
Powered Brands, Expires 01/03/2028Strike Price $11.50 * 4,783 3
Primavera Capital Acquisition, Expires 01/22/2026Strike Price $11.50 * 373 –
Prime Impact Acquisition I, Expires 10/04/2030Strike Price $11.50 * 38,651 21
DescriptionNumber of
WarrantsMarket Value
($ Thousands)WARRANTS (continued)
Priveterra Acquisition, Expires 01/03/2028Strike Price $11.50 * 7,218 $ 4
Progress Acquisition, Expires 01/03/2028Strike Price $11.50 * 33,151 16
Property Solutions Acquisition II, Expires 03/04/2026Strike Price $11.50 * 4,807 3
Prospector Capital, Expires 01/04/2025Strike Price $11.50 * 8,397 5
Provident Acquisition, Expires 01/15/2026Strike Price $11.50 * 17,168 9
Recharge Acquisition, Expires 10/08/2027Strike Price $11.50 * 49,703 24
Riverview Acquisition, Expires 04/11/2023Strike Price $11.50 * 6,893 4
RMG Acquisition III, Expires 01/03/2028Strike Price $11.50 * 1,008 1
RXR Acquisition, Expires 03/11/2026Strike Price $11.50 * 207 –
Sanaby Health Acquisition I, Expires 08/02/2028Strike Price $11.50 * 5,458 3
Sandbridge X2, Expires 01/03/2028Strike Price $11.50 * 18,360 10
Science Strategic Acquisition Alpha, Expires 01/03/2028Strike Price $11.50 * 8,054 4
ScION Tech Growth I, Expires 11/04/2025Strike Price $11.50 * 15,575 9
ScION Tech Growth II, Expires 01/31/2026Strike Price $11.50 * 9,805 6
SCP & CO Healthcare Acquisition, Expires 01/30/2028Strike Price $11.50 * 20,988 12
SCVX, Expires 01/27/2025Strike Price $11.50 * 88 –
Seaport Global Acquisition II, Expires 11/04/2023Strike Price $11.50 * 29,322 15
Senior Connect Acquisition I, Expires 01/03/2028Strike Price $11.50 * 13,932 7
Shelter Acquisition I, Expires 01/03/2028Strike Price $11.50 * 6,990 4
Sierra Lake Acquisition, Expires 04/03/2028Strike Price $11.50 * 17 –
Silver Crest Acquisition, Expires 04/03/2028Strike Price $11.50 * 20,488 12
Slam, Expires 01/03/2028Strike Price $11.50 * 13,622 8

17SEI Institutional Managed Trust / Quarterly Report / December 31, 2021
SCHEDULE OF INVESTMENTS (Unaudited)December 31, 2021
Multi-Strategy Alternative Fund (Continued)
DescriptionNumber of
WarrantsMarket Value
($ Thousands)WARRANTS (continued)
Software Acquisition Group III, Expires 01/03/2028Strike Price $11.50 * 13,613 $ 8
Sports Ventures Acquisition, Expires 01/03/2028Strike Price $11.50 * 12,401 8
SportsTek Acquisition, Expires 01/03/2028Strike Price $11.50 * 29,252 17
Springwater Special Situations, Expires 04/15/2026Strike Price $11.50 * 3,030 2
StoneBridge Acquisition, Expires 03/01/2023Strike Price $11.50 * 8,747 4
Stratim Cloud Acquisition, Expires 03/08/2026Strike Price $11.50 * 9,690 6
Sustainable Development Acquisition I, Expires 01/03/2029Strike Price $11.50 * 625 –
Tailwind Acquisition, Expires 09/10/2027Strike Price $11.50 * 29,784 15
Tailwind International Acquisition, Expires 03/04/2028Strike Price $11.50 * 53,436 30
Tastemaker Acquisition, Expires 01/03/2026Strike Price $11.50 * 3,311 2
TB Acquisition, Expires 03/28/2028Strike Price $11.50 * 1,944 1
TCW Special Purpose AcquisitionStrike Price $11.50 *‡‡ 5,058 3
Tech and Energy Transition, Expires 01/03/2028Strike Price $11.50 * 27,648 19
TG Venture Acquisition, Expires 08/16/2023Strike Price $11.50 * 10,865 5
Thrive Acquisition, Expires 03/12/2023Strike Price $11.50 * 3,143 2
Tiga Acquisition, Expires 11/30/2026Strike Price $11.50 * 629 –
TLG Acquisition One, Expires 01/28/2028Strike Price $11.50 * 36,511 19
TPG Pace Beneficial Finance, Expires 10/12/2027Strike Price $11.50 * 677 1
Trepont Acquisition I, Expires 11/27/2025Strike Price $11.50 * 33,472 19
Tuatara Capital Acquisition, Expires 01/03/2028Strike Price $11.50 * 2,210 1
DescriptionNumber of
WarrantsMarket Value
($ Thousands)WARRANTS (continued)
Twelve Seas Investment II, Expires 03/05/2028Strike Price $11.50 * 24,081 $ 12
TZP Strategies Acquisition, Expires 01/03/2028Strike Price $11.50 * 40,244 20
Ventoux CCM Acquisition, Expires 10/03/2025Strike Price $11.50 * 19,301 9
Virgin Group Acquisition II, Expires 03/16/2026Strike Price $11.50 * 115 –
Warrior Technologies Acquisition, Expires 04/03/2028Strike Price $11.50 * 37,805 19
WeWork, Expires 10/23/2026Strike Price $11.50 * 689 1
Williams Rowland Acquisition, Expires 12/28/2022Strike Price $11.50 * 63,737 33
Windstream ServicesStrike Price $– *‡‡ 5,809 110
WinVest Acquisition, Expires 02/22/2023Strike Price $11.50 * 45,182 9
World Quantum Growth Acquisition, Expires 01/03/2029Strike Price $11.50 * 2,724 2
XPAC Acquisition, Expires 05/16/2027Strike Price $11.50 * 9,400 5
Z-Work Acquisition, Expires 01/07/2026Strike Price $11.50 * 29,570 18
Total Warrants(Cost $2,450) ($ Thousands) 2,422
Face Amount (Thousands)
ASSET-BACKED SECURITIES — 0.5%Other Asset-Backed Securities — 0.5%
CFIP CLO, Ser 2021-1A, Cl D3.654%, VAR ICE LIBOR USD 3 Month
+ 3.540%, 01/20/2035(F) $ 250 248Marathon CLO, Ser 2021-17A, Cl C
4.323%, VAR ICE LIBOR USD 3 Month + 4.110%, 01/20/2035(F) 250 248
Octagon Investment Partners 43, Ser 2019-1A, Cl D
4.024%, VAR ICE LIBOR USD 3 Month + 3.900%, 10/25/2032(F) 250 250
Sound Point CLO XXIX, Ser 2021-1A, Cl D3.624%, VAR ICE LIBOR USD 3 Month
+ 3.500%, 04/25/2034(F) 250 250

SEI Institutional Managed Trust / Quarterly Report / December 31, 202118
SCHEDULE OF INVESTMENTS (Unaudited)December 31, 2021
Multi-Strategy Alternative Fund (Continued)
DescriptionFace Amount (Thousands)
Market Value ($ Thousands)
ASSET-BACKED SECURITIES (continued)STWD, Ser 2021-FL2, Cl D
2.909%, VAR ICE LIBOR USD 1 Month + 2.800%, 04/18/2038(F) $ 100 $ 100
STWD, Ser 2021-FL2, Cl E3.659%, VAR ICE LIBOR USD 1 Month
+ 3.550%, 04/18/2038(F) 100 100THL Credit Wind River CLO, Ser 2017-2A,
Cl DR2.724%, VAR ICE LIBOR USD 3 Month
+ 2.600%, 10/15/2027(F) 250 250TPG Real Estate Finance Issuer, Ser 2021-
FL4, Cl D3.709%, VAR ICE LIBOR USD 1 Month
+ 3.600%, 03/15/2038(F) 100 100TPG Real Estate Finance Issuer, Ser 2021-
FL4, Cl E4.459%, VAR ICE LIBOR USD 1 Month
+ 4.350%, 03/15/2038(F) 100 100Tryon Park CLO, Ser 2018-1A, Cl CR
2.824%, VAR ICE LIBOR USD 3 Month + 2.700%, 04/15/2029(F) 250 248
Venture XVII CLO, Ser 2018-17A, Cl DRR2.944%, VAR ICE LIBOR USD 3 Month
+ 2.820%, 04/15/2027(F) 200 192
Total Asset-Backed Securities
(Cost $2,094) ($ Thousands) 2,086
U.S. TREASURY OBLIGATIONS — 0.2%U.S. Treasury Bill
0.064%, 05/19/2022 (I) 483 483U.S. Treasury Notes
1.375%, 11/15/2031 326 3221.250%, 11/30/2026 233 233
Total U.S. Treasury Obligations
(Cost $1,042) ($ Thousands) 1,038
CONVERTIBLE BONDS — 0.2%Air Canada CV to 65.134
4.000% , 07/01/2025 60 79Canopy Growth CV to 20.758
4.250% , 07/15/2023(F) CAD 152 111Granite Point Mortgage Trust CV to 50.089
6.375% , 10/01/2023 $ 15 15Granite Point Mortgage Trust CV to 51.994
5.625% , 12/01/2022(F) 55 55Liberty Latin America CV to 48.432
2.000% , 07/15/2024 265 261
DescriptionFace Amount (Thousands)
Market Value ($ Thousands)
CONVERTIBLE BONDS (continued)Liberty Media CV to 16.776
3.750% , 02/15/2030 $ 230 $ 174Liberty Media CV to 22.947
4.000% , 11/15/2029 216 162Pebblebrook Hotel Trust CV to 39.2549
1.750% , 12/15/2026 115 127
Total Convertible Bonds(Cost $922) ($ Thousands) 984
Shares
PREFERRED STOCK — 0.1%
Consumer Discretionary — 0.1%Boardriders Inc. *(A)(B)(D)(L) 25,646 31Bowlero (A)(B)(L) 290 290Guitar Center *(A)(B)(L) 39 4
325Materials — 0.0%
Libbey Glass Inc. (A)(L) 766 90
Total Preferred Stock
(Cost $370) ($ Thousands) 415
Face Amount (Thousands)
MORTGAGE-BACKED SECURITY — 0.0%Non-Agency Mortgage-Backed Obligations — 0.0%
CHT Mortgage Trust, Ser 2017-CSMO, Cl F3.851%, VAR ICE LIBOR USD 1 Month
+ 3.741%, 11/15/2036(F) 175 175
Total Mortgage-Backed Security
(Cost $175) ($ Thousands) 175
SharesCASH EQUIVALENTS — 25.3%
Morgan Stanley Institutional Liquidity Fund Treasury Securities Portfolio, Cl I
0.004%** 64,744 65SEI Daily Income Trust, Government
Fund, Cl F0.010%**† 114,445,452 114,445
Total Cash Equivalents (Cost $114,510) ($ Thousands) 114,510
Total Investments in Securities — 97.6%(Cost $437,480) ($ Thousands) $ 442,246
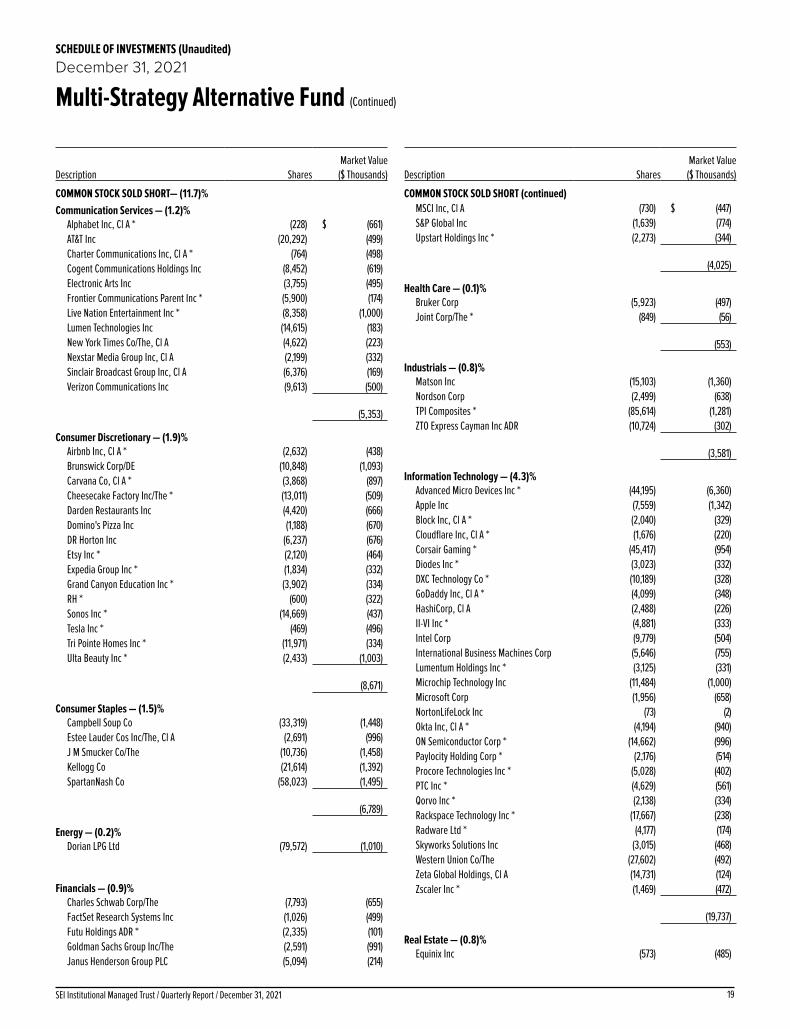
19SEI Institutional Managed Trust / Quarterly Report / December 31, 2021
SCHEDULE OF INVESTMENTS (Unaudited)December 31, 2021
Multi-Strategy Alternative Fund (Continued)
Description SharesMarket Value
($ Thousands)
COMMON STOCK SOLD SHORT— (11.7)%Communication Services — (1.2)%
Alphabet Inc, Cl A * (228) $ (661)AT&T Inc (20,292) (499)Charter Communications Inc, Cl A * (764) (498)Cogent Communications Holdings Inc (8,452) (619)Electronic Arts Inc (3,755) (495)Frontier Communications Parent Inc * (5,900) (174)Live Nation Entertainment Inc * (8,358) (1,000)Lumen Technologies Inc (14,615) (183)New York Times Co/The, Cl A (4,622) (223)Nexstar Media Group Inc, Cl A (2,199) (332)Sinclair Broadcast Group Inc, Cl A (6,376) (169)Verizon Communications Inc (9,613) (500)
(5,353)
Consumer Discretionary — (1.9)%Airbnb Inc, Cl A * (2,632) (438)Brunswick Corp/DE (10,848) (1,093)Carvana Co, Cl A * (3,868) (897)Cheesecake Factory Inc/The * (13,011) (509)Darden Restaurants Inc (4,420) (666)Domino's Pizza Inc (1,188) (670)DR Horton Inc (6,237) (676)Etsy Inc * (2,120) (464)Expedia Group Inc * (1,834) (332)Grand Canyon Education Inc * (3,902) (334)RH * (600) (322)Sonos Inc * (14,669) (437)Tesla Inc * (469) (496)Tri Pointe Homes Inc * (11,971) (334)Ulta Beauty Inc * (2,433) (1,003)
(8,671)
Consumer Staples — (1.5)%Campbell Soup Co (33,319) (1,448)Estee Lauder Cos Inc/The, Cl A (2,691) (996)J M Smucker Co/The (10,736) (1,458)Kellogg Co (21,614) (1,392)SpartanNash Co (58,023) (1,495)
(6,789)
Energy — (0.2)%Dorian LPG Ltd (79,572) (1,010)
Financials — (0.9)%Charles Schwab Corp/The (7,793) (655)FactSet Research Systems Inc (1,026) (499)Futu Holdings ADR * (2,335) (101)Goldman Sachs Group Inc/The (2,591) (991)Janus Henderson Group PLC (5,094) (214)
Description SharesMarket Value
($ Thousands)
COMMON STOCK SOLD SHORT (continued)MSCI Inc, Cl A (730) $ (447)S&P Global Inc (1,639) (774)Upstart Holdings Inc * (2,273) (344)
(4,025)
Health Care — (0.1)%Bruker Corp (5,923) (497)Joint Corp/The * (849) (56)
(553)
Industrials — (0.8)%Matson Inc (15,103) (1,360)Nordson Corp (2,499) (638)TPI Composites * (85,614) (1,281)ZTO Express Cayman Inc ADR (10,724) (302)
(3,581)
Information Technology — (4.3)%Advanced Micro Devices Inc * (44,195) (6,360)Apple Inc (7,559) (1,342)Block Inc, Cl A * (2,040) (329)Cloudflare Inc, Cl A * (1,676) (220)Corsair Gaming * (45,417) (954)Diodes Inc * (3,023) (332)DXC Technology Co * (10,189) (328)GoDaddy Inc, Cl A * (4,099) (348)HashiCorp, Cl A (2,488) (226)II-VI Inc * (4,881) (333)Intel Corp (9,779) (504)International Business Machines Corp (5,646) (755)Lumentum Holdings Inc * (3,125) (331)Microchip Technology Inc (11,484) (1,000)Microsoft Corp (1,956) (658)NortonLifeLock Inc (73) (2)Okta Inc, Cl A * (4,194) (940)ON Semiconductor Corp * (14,662) (996)Paylocity Holding Corp * (2,176) (514)Procore Technologies Inc * (5,028) (402)PTC Inc * (4,629) (561)Qorvo Inc * (2,138) (334)Rackspace Technology Inc * (17,667) (238)Radware Ltd * (4,177) (174)Skyworks Solutions Inc (3,015) (468)Western Union Co/The (27,602) (492)Zeta Global Holdings, Cl A (14,731) (124)Zscaler Inc * (1,469) (472)
(19,737)
Real Estate — (0.8)%Equinix Inc (573) (485)

SEI Institutional Managed Trust / Quarterly Report / December 31, 202120
SCHEDULE OF INVESTMENTS (Unaudited)December 31, 2021
Multi-Strategy Alternative Fund (Continued)
Description SharesMarket Value
($ Thousands)
COMMON STOCK SOLD SHORT (continued)Federal Realty Investment Trust (4,947) $ (674)Hudson Pacific Properties Inc (27,192) (672)Jones Lang LaSalle Inc * (2,473) (666)Redfin Corp * (8,728) (335)Regency Centers Corp (9,089) (685)
(3,517)
Total Common Stock Sold Short
(Proceeds $52,951) ($ Thousands) (53,236)
Face Amount (Thousands)
CORPORATE OBLIGATIONS SOLD SHORT — (2.1)%Communication Services — (0.1)%
Front Range BidCo6.125%, 03/01/2028 (F) $ (559) (551)
Consumer Discretionary — (0.7)%American Axle & Manufacturing
5.000%, 10/01/2029 (151) (148)Cooper-Standard Automotive
5.625%, 11/15/2026 (F) (65) (54)Douglas GmbH
6.000%, 04/08/2026 EUR (321) (364)Las Vegas Sands
3.900%, 08/08/2029 $ (223) (224)MGM Resorts International
5.500%, 04/15/2027 (95) (101)4.625%, 09/01/2026 (471) (490)
Sands China5.400%, 08/08/2028 (176) (190)3.250%, 08/08/2031 (F) (65) (61)
Signal Parent6.125%, 04/01/2029 (F) (53) (47)
WW International4.500%, 04/15/2029 (F) (325) (311)
Wynn Las Vegas5.250%, 05/15/2027 (F) (701) (717)
(2,707)Consumer Staples — (0.1)%
B&G Foods5.250%, 09/15/2027 (65) (67)
Bellis Finco4.000%, 02/16/2027 GBP (59) (75)
Kronos Acquisition Holdings7.000%, 12/31/2027 (F) $ (173) (163)
Ontex Group3.500%, 07/15/2026 EUR (195) (211)
Oriflame Investment Holding5.125%, 05/04/2026 (F) $ (32) (30)
(546)
DescriptionFace Amount (Thousands)
Market Value ($ Thousands)
CORPORATE OBLIGATIONS SOLD SHORT (continued)Energy — (0.3)%
Bristow Group6.875%, 03/01/2028 (F) $ (31) $ (32)
Callon Petroleum8.000%, 08/01/2028 (F) (334) (337)
Comstock Resources6.750%, 03/01/2029 (F) (295) (320)5.875%, 01/15/2030 (F) (43) (44)
Laredo Petroleum9.500%, 01/15/2025 (88) (90)7.750%, 07/31/2029 (F) (80) (78)
Precision Drilling6.875%, 01/15/2029 (F) (43) (44)
SM Energy6.750%, 09/15/2026 (199) (204)
Western Midstream Operating5.300%, 02/01/2030 (308) (339)
(1,488)Health Care — (0.3)%
Bausch Health5.250%, 02/15/2031 (F) (130) (114)
Cardinal Health3.410%, 06/15/2027 (218) (234)
Emergent BioSolutions3.875%, 08/15/2028 (F) (151) (145)
Global Medical Response6.500%, 10/01/2025 (F) (117) (118)
Lannett7.750%, 04/15/2026 (F) (70) (54)
LifePoint Health5.375%, 01/15/2029 (F) (195) (194)
Mozart Debt Merger Sub5.250%, 10/01/2029 (F) (151) (153)
Option Care Health4.375%, 10/31/2029 (F) (198) (199)
(1,211)Industrials — (0.2)%
Allied Universal Holdco6.000%, 06/01/2029 (F) (211) (205)
American Airlines Group5.000%, 06/01/2022 (F) (281) (282)
Bombardier6.000%, 02/15/2028 (F) (142) (142)
Garda World Security6.000%, 06/01/2029 (F) (108) (103)
Park-Ohio Industries6.625%, 04/15/2027 (61) (59)
Wolverine Escrow9.000%, 11/15/2026 (F) (121) (115)
(906)
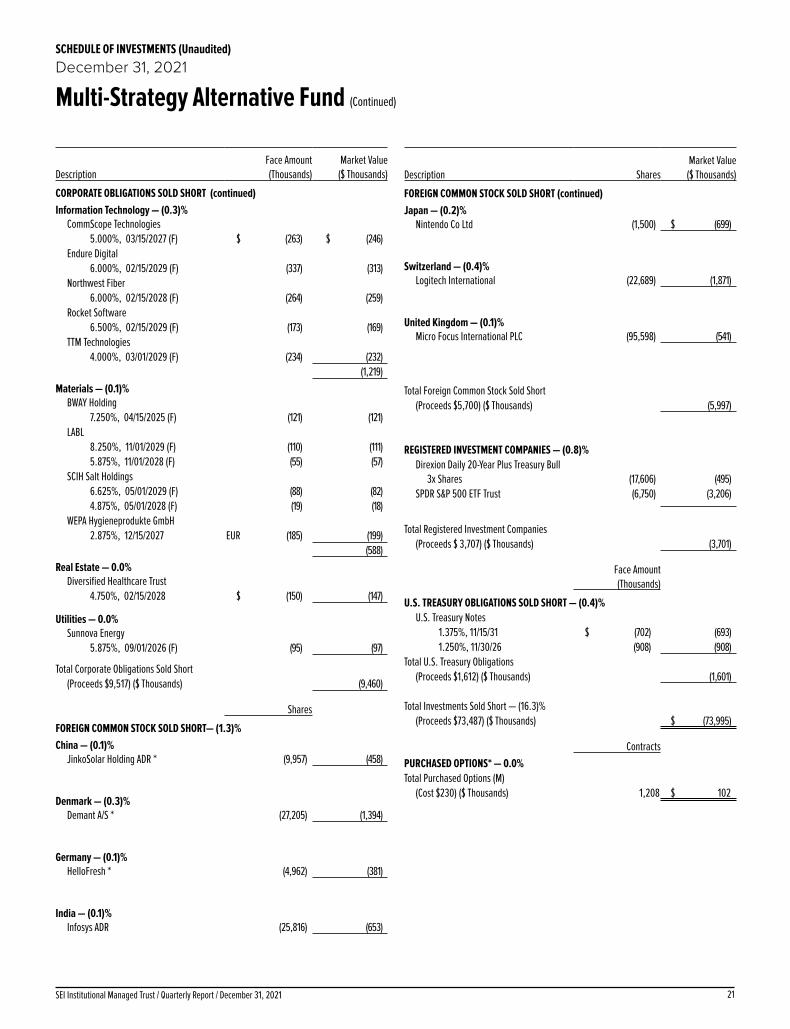
21SEI Institutional Managed Trust / Quarterly Report / December 31, 2021
SCHEDULE OF INVESTMENTS (Unaudited)December 31, 2021
Multi-Strategy Alternative Fund (Continued)
DescriptionFace Amount (Thousands)
Market Value ($ Thousands)
CORPORATE OBLIGATIONS SOLD SHORT (continued)Information Technology — (0.3)%
CommScope Technologies5.000%, 03/15/2027 (F) $ (263) $ (246)
Endure Digital6.000%, 02/15/2029 (F) (337) (313)
Northwest Fiber6.000%, 02/15/2028 (F) (264) (259)
Rocket Software6.500%, 02/15/2029 (F) (173) (169)
TTM Technologies4.000%, 03/01/2029 (F) (234) (232)
(1,219)Materials — (0.1)%
BWAY Holding7.250%, 04/15/2025 (F) (121) (121)
LABL8.250%, 11/01/2029 (F) (110) (111)5.875%, 11/01/2028 (F) (55) (57)
SCIH Salt Holdings6.625%, 05/01/2029 (F) (88) (82)4.875%, 05/01/2028 (F) (19) (18)
WEPA Hygieneprodukte GmbH2.875%, 12/15/2027 EUR (185) (199)
(588)Real Estate — 0.0%
Diversified Healthcare Trust4.750%, 02/15/2028 $ (150) (147)
Utilities — 0.0%Sunnova Energy
5.875%, 09/01/2026 (F) (95) (97)
Total Corporate Obligations Sold Short (Proceeds $9,517) ($ Thousands) (9,460)
Shares
FOREIGN COMMON STOCK SOLD SHORT— (1.3)%China — (0.1)%
JinkoSolar Holding ADR * (9,957) (458)
Denmark — (0.3)%Demant A/S * (27,205) (1,394)
Germany — (0.1)%HelloFresh * (4,962) (381)
India — (0.1)%Infosys ADR (25,816) (653)
Description SharesMarket Value
($ Thousands)
FOREIGN COMMON STOCK SOLD SHORT (continued)Japan — (0.2)%
Nintendo Co Ltd (1,500) $ (699)
Switzerland — (0.4)%Logitech International (22,689) (1,871)
United Kingdom — (0.1)%Micro Focus International PLC (95,598) (541)
Total Foreign Common Stock Sold Short
(Proceeds $5,700) ($ Thousands) (5,997)
REGISTERED INVESTMENT COMPANIES — (0.8)%Direxion Daily 20-Year Plus Treasury Bull
3x Shares (17,606) (495)SPDR S&P 500 ETF Trust (6,750) (3,206)
Total Registered Investment Companies
(Proceeds $ 3,707) ($ Thousands) (3,701)
Face Amount (Thousands)
U.S. TREASURY OBLIGATIONS SOLD SHORT — (0.4)%U.S. Treasury Notes
1.375%, 11/15/31 $ (702) (693)1.250%, 11/30/26 (908) (908)
Total U.S. Treasury Obligations (Proceeds $1,612) ($ Thousands) (1,601)
Total Investments Sold Short — (16.3)%(Proceeds $73,487) ($ Thousands) $ (73,995)
ContractsPURCHASED OPTIONS* — 0.0%Total Purchased Options (M)
(Cost $230) ($ Thousands) 1,208 $ 102

SEI Institutional Managed Trust / Quarterly Report / December 31, 202122
SCHEDULE OF INVESTMENTS (Unaudited)December 31, 2021
Multi-Strategy Alternative Fund (Continued)
A list of the open option contracts held by the Fund at December 31, 2021 is as follows:
Description Number of ContractsNotional Amount
(Thousands)†† Exercise Price Expiration DateValue
(Thousands)
PURCHASED OPTIONS — 0.0%
Put OptionsChange Healthcare Inc* 14 $ 1 $17.00 1/22/2022 $ –iShares iBoxx $ High Yield Corporate Bond ETF* 220 18 82.00 2/19/2022 3SPDR® S&P® Oil & Gas Exploration & Production ETF* 17 4 85.00 1/22/2022 –United Natural Foods Inc* 11 3 40.00 1/22/2022 –
– –
26 3 – – – –
– – – –
Call OptionsCaesars Entertainment Inc* 6 3 110.00 3/19/2022 2Chesapeake Energy Corp.* 6 2 70.00 1/22/2022 –Hertz Global Holdings Inc* 24 4 35.00 2/19/2022 1Katapult Holdings Inc.* 79 4 7.50 1/22/2022 –Katapult Holdings Inc.* 44 3 12.50 1/22/2022 –Katapult Holdings Inc.* 31 4 10.00 1/22/2022 –Norwegian Cruise Line Holdings Ltd.* 25 5 30.00 3/19/2022 1Penn National Gaming, Inc* 10 4 70.00 4/16/2022 2Royal Caribbean Cruises Ltd.* 7 3 85.00 3/19/2022 3Service Properties Trust* 40 2 10.00 3/19/2022 2TEGNA Inc* 66 8 20.00 1/22/2022 2Viper Energy Partners LP* 532 162 24.00 6/18/2022 86
– –
204 99 – – – –
– – – –
Total Purchased Options $ 230 $ 102
†† Represents Cost
A list of the open future contracts held by the Fund at December 31, 2021 is as follows:
Type of ContractNumber of Contracts
Expiration Date
Notional Amount (Thousands) Value (Thousands)
Unrealized Depreciation (Thousands)
Short ContractsS&P 500 Index E-MINI (4) Mar-2022 $ (935) $ (951) $ (16)U.S. 10-Year Treasury Note (3) Mar-2022 (387) (392) (5)U.S. Long Treasury Bond (20) Mar-2022 (3,168) (3,208) (40)
$ (4,490) $ (4,551) $ (61)
A list of the open forward foreign currency contracts held by the Fund at December 31, 2021 is as follows:
Counterparty Settlement DateCurrency to Deliver
(Thousands)Currency to Receive
(Thousands)
Unrealized Appreciation
(Depreciation) (Thousands)
NATWEST MARKETS INC. (PAS) 01/19/22 USD 235 CAD 296 $ (1)
NATWEST MARKETS INC. (PAS) 01/19/22 CAD 296 USD 231 (3)
Barclays PLC 02/11/22 USD 22 CAD 28 —
Barclays PLC 02/11/22 CAD 330 USD 265 4
Barclays PLC 02/11/22 EUR 700 USD 809 12
Barclays PLC 02/16/22 USD 218 JPY 24,747 (3)
Barclays PLC 03/16/22 CHF 130 USD 142 (1)
Barclays PLC 03/16/22 EUR 361 USD 410 (1)
BNYMellon 03/16/22 USD 45 CAD 56 —
BNYMellon 03/16/22 CAD 203 USD 161 —
BNYMellon 03/16/22 GBP 228 USD 301 (8)

23SEI Institutional Managed Trust / Quarterly Report / December 31, 2021
SCHEDULE OF INVESTMENTS (Unaudited)December 31, 2021
Multi-Strategy Alternative Fund (Continued)
Counterparty Settlement DateCurrency to Deliver
(Thousands)Currency to Receive
(Thousands)
Unrealized Appreciation
(Depreciation) (Thousands)
BNYMellon 03/16/22 EUR 1,240 USD 1,405 $ (8)
Citi 01/19/22 USD 366 CAD 468 5
Citi 01/19/22 CAD 820 USD 653 4
Citi 02/16/22 USD 112 JPY 12,696 (1)
Deutsche Bank 03/16/22 USD 899 CZK 20,402 28
Deutsche Bank 03/16/22 USD 1,241 RUB 94,752 6
Deutsche Bank 03/16/22 RUB 195,172 USD 2,556 (12)
Goldman Sachs 01/19/22 USD 46 ILS 147 2
Goldman Sachs 01/19/22 USD 367 CAD 469 5
Goldman Sachs 01/19/22 USD 253 CAD 319 (1)
Goldman Sachs 01/19/22 CAD 788 USD 617 (7)
Goldman Sachs 02/02/22 USD 722 BRL 4,085 5
Goldman Sachs 02/02/22 USD 212 BRL 1,179 (2)
Goldman Sachs 02/02/22 BRL 7,701 USD 1,409 38
Goldman Sachs 02/02/22 BRL 1,473 USD 257 (6)
Goldman Sachs 02/16/22 USD 436 JPY 49,505 (5)
Goldman Sachs 02/16/22 USD 828 CNH 5,311 5
Goldman Sachs 02/16/22 USD 834 KRW 991,344 (2)
Goldman Sachs 02/16/22 CNH 8,768 USD 1,362 (13)
Goldman Sachs 03/16/22 USD 157 NOK 1,427 4
Goldman Sachs 03/16/22 USD 333 ZAR 5,438 5
Goldman Sachs 03/16/22 USD 460 GBP 345 8
Goldman Sachs 03/16/22 CHF 496 USD 542 (4)
Goldman Sachs 03/16/22 USD 534 PLN 2,182 4
Goldman Sachs 03/16/22 USD 662 EUR 582 2
Goldman Sachs 03/16/22 USD 2,061 RUB 155,157 (20)
Goldman Sachs 03/16/22 ZAR 43,407 USD 2,707 14
Goldman Sachs 03/16/22 ZAR 6,603 USD 405 (4)
HSBC 01/19/22 USD 147 CAD 187 1
HSBC 01/19/22 CAD 1,631 USD 1,296 5
HSBC 02/16/22 USD 978 JPY 111,204 (12)
HSBC 03/16/22 GBP 199 USD 265 (4)
HSBC 03/16/22 USD 431 ZAR 7,093 9
HSBC 03/16/22 EUR 623 USD 708 (1)
HSBC 03/16/22 NOK 1,580 USD 174 (5)
HSBC 03/16/22 CZK 20,402 USD 891 (36)
JPMorgan Chase Bank 01/19/22 USD 198 CAD 253 3
JPMorgan Chase Bank 01/19/22 CAD 253 USD 201 1
JPMorgan Chase Bank 02/16/22 USD 598 JPY 67,946 (8)
JPMorgan Chase Bank 02/16/22 USD 1,272 SGD 1,737 16
JPMorgan Chase Bank 02/16/22 SGD 1,576 USD 1,167 (2)
JPMorgan Chase Bank 03/16/22 GBP 125 USD 166 (3)
JPMorgan Chase Bank 03/16/22 USD 531 RUB 40,015 (5)
JPMorgan Chase Bank 03/16/22 USD 543 CHF 497 4
JPMorgan Chase Bank 03/16/22 EUR 1,414 USD 1,607 (3)
Montgomery/Bank of America 01/19/22 USD 1,137 CAD 1,430 (5)
Montgomery/Bank of America 01/19/22 CAD 251 USD 202 3
Montgomery/Bank of America 01/19/22 CAD 1,179 USD 921 (13)

SEI Institutional Managed Trust / Quarterly Report / December 31, 202124
SCHEDULE OF INVESTMENTS (Unaudited)December 31, 2021
Multi-Strategy Alternative Fund (Continued)
Counterparty Settlement DateCurrency to Deliver
(Thousands)Currency to Receive
(Thousands)
Unrealized Appreciation
(Depreciation) (Thousands)
Montgomery/Bank of America 02/16/22 USD 46 JPY 5,220 $ (1)
Montgomery/Bank of America 03/16/22 USD 78 GBP 59 1
Montgomery/Bank of America 03/16/22 USD 424 CHF 389 4
Montgomery/Bank of America 03/16/22 USD 813 EUR 715 2
Morgan Stanley 01/19/22 USD 571 CAD 731 8
Morgan Stanley 01/19/22 CAD 731 USD 581 2
Morgan Stanley 02/16/22 JPY 24,923 USD 219 3
Morgan Stanley 03/16/22 CHF 122 USD 133 (1)
Morgan Stanley 03/16/22 USD 264 GBP 198 4
Morgan Stanley 03/16/22 USD 1,638 EUR 1,441 3
Morgan Stanley 03/16/22 RUB 94,752 USD 1,265 18
Standard Chartered 03/16/22 IDR 31,753,520 USD 2,203 (17)
State Street 01/19/22 USD 14 ILS 45 —
State Street 01/19/22 USD 1,080 CAD 1,337 (21)
State Street 01/19/22 CAD 4,614 USD 3,669 16
State Street 02/16/22 CNH 10,197 USD 1,582 (16)
State Street 02/16/22 JPY 203,335 USD 1,789 22
State Street 03/16/22 USD 133 EUR 117 1
State Street 03/16/22 USD 156 CHF 143 1
State Street 03/16/22 USD 514 GBP 386 9
State Street 03/16/22 EUR 2,101 USD 2,385 (8)
State Street 03/16/22 NOK 3,826 USD 420 (13)
TD Bank 01/19/22 USD 518 CAD 664 7
TD Bank 01/19/22 CAD 664 USD 528 2
TD Bank 03/16/22 EUR 984 USD 1,119 (2)
UBS 01/19/22 USD 888 CAD 1,111 (8)
UBS 01/19/22 CAD 1,111 USD 868 (12)
UBS 02/16/22 USD 45 JPY 5,149 (1)
UBS 03/16/22 GBP 216 USD 288 (5)
UBS 03/16/22 USD 286 CHF 262 2
UBS 03/16/22 USD 1,528 EUR 1,345 3
UBS 03/16/22 NOK 3,415 USD 375 (12)
Westpac Banking 01/19/22 USD 2,400 CAD 3,019 (10)
Westpac Banking 02/16/22 USD 280 JPY 31,815 (3)
Westpac Banking 03/16/22 USD 70 EUR 62 —
Westpac Banking 03/16/22 GBP 689 USD 917 (15) $ (43)
A list of open OTC swap agreements held by the Fund at December 31, 2021, is as follows:
Total Return Swaps
CounterpartyReference Entity/
Obligation Fund Pays Fund ReceivesPayment
FrequencyTermination
Date Currency
Notional Amount
(Thousands)Value
(Thousands)
Upfront Payments/
Receipts (Thousands)
Net Unrealized Appreciation
(Depreciation) (Thousands)
Goldman Sachs Samsung ElectronicsAsset Return
1 Month USD LIBOR – 0.50% Monthly 12/15/2025 KRW 411 $ (5) $ – $ (5)
Bank of America Merrill Lynch
INDONESIA GOVERNMENT 3 MONTH USD - LIBOR + 1% INDONESIA GOVERNMENT Semi-Annually 05/23/2022 USD 20,382,000 (20) – (20)
Deutsche Bank Indonesia Treasury Bond 3 MONTH USD - LIBOR INDONESIA GOVERNMENT Semi-Annually 06/15/2032 USD 8,423,000 40 – 40Goldman Sachs Allegro EU SA 1 MONTH USD LIBOR
+0.65 ALLEGRO.EU SA Monthly 12/15/2025 PLN 406 (57) – (57)

25SEI Institutional Managed Trust / Quarterly Report / December 31, 2021
SCHEDULE OF INVESTMENTS (Unaudited)December 31, 2021
Multi-Strategy Alternative Fund (Continued)
Total Return Swaps (continued)
CounterpartyReference Entity/
Obligation Fund Pays Fund ReceivesPayment
FrequencyTermination
Date Currency
Notional Amount
(Thousands)Value
(Thousands)
Upfront Payments/
Receipts (Thousands)
Net Unrealized Appreciation
(Depreciation) (Thousands)
Goldman Sachs Aspeed Technology 1 MONTH USD LIBOR +0.50 ASPEED TECHNOLOGY Annually 12/15/2025 USD (1,241) $ 176 $ – $ 176
Goldman Sachs AU Optronics ASSET RETURN AU OPTRONICS Monthly 12/15/2025 TWD (447) (4) – (4)Goldman Sachs Kakao ASSET RETURN KAKAO Monthly 12/15/2025 KRW 355 19 – 19Goldman Sachs Kuaishou Technology ASSET RETURN KUAISHOU TECHNOLOGY Monthly 12/15/2025 HKD 305 37 – 37Goldman Sachs Russell 2000 Growth
Index Technology ASSET RETURNRUSSELL 2000 GROWTH
INDEX TECHNOLOGY Monthly 12/15/2025 USD 9,213 39 – 39Goldman Sachs SILERGY CORP 1 MONTH LIBOR + 50 SILERGY CORP Annually 12/08/2022 USD (1,420) 215 – 215Goldman Sachs WINBOND ELECTRONICS ASSET RETURN WINBOND ELECTRONICS Monthly 12/15/2025 TWD 747 (83) – (83)JPMorgan Chase CNP Assurances ASSET RETURN CNP ASSURANCES Annually 11/03/2022 EUR (372) 3 – 3Morgan Stanley Avast PLC 1 MONTH USD LIBOR AVAST PLC (K) Annually 09/12/2023 USD (4,288) 346 – 346Morgan Stanley Biotest VZ EURIB-1M BIOTEST VZ (K) Annually 11/03/2022 EUR (504) (6) – (6)Morgan Stanley Citizens Financial ASSET RETURN CITIZENS FINANL (S) Monthly 09/09/2022 USD 778 30 – 30Morgan Stanley COHERENT INC FEDEF-1-DAY COHERENT INC (K) Annually 06/09/2022 USD (672) 42 – 42Morgan Stanley FNB Corp ASSET RETURN FNB CORP (S) Monthly 09/09/2022 USD 30 — – –Morgan Stanley IHS MARKIT LTD FEDEF-1-DAY IHS MARKIT LTD (K) Annually 06/09/2022 USD (1,333) 130 – 130Morgan Stanley II-VI Inc ASSET RETURN II-VI INC (S) Monthly 09/09/2022 USD 145 (22) – (22)Morgan Stanley M&T Bank Corp ASSET RETURN M & T BANK CORP (S) Monthly 10/01/2023 USD 377 (3) – (3)Morgan Stanley Meggitt PLC 1-MONTH USD - LIBOR MEGGITT PLC (K) Annually 08/16/2023 GBP (1,756) 4 – 4Morgan Stanley MICROSOFT CORP ASSET RETURN MICROSOFT CORP (S) Monthly 06/25/2023 USD 275 4 – 4Morgan Stanley New York Communications ASSET RETURN NEW YORK COMMUNI (S) Monthly 07/16/2023 USD 20 — – –Morgan Stanley NortonLifeLock ASSET RETURN NORTONLIFELOCK (S) Monthly 09/09/2022 USD 431 (12) – (12)Morgan Stanley S&P GLOBAL INC ASSET RETURN S&P GLOBAL INC(S) Monthly 09/09/2022 USD 2,639 (53) – (53)Morgan Stanley SHAW COMM DISC -1-DAY SHAW COMM (K) Annually 08/25/2022 CAD (315) 18 – 18Morgan Stanley SILTRONICAG-TEND EURIB-1M SILTRONICAG-TEND(K) Annually 11/03/2022 EUR (173) 10 – 10Morgan Stanley Vivo Energy PLC 1 MONTH USD LIBOR VIVO ENERGY PLC Annually 09/12/2023 USD (457) 8 – 8UBS Intertrust EURIB-1M INTERTRUST (K) Annually 11/03/2022 EUR (240) 6 – 6UBS Playtech PLC 1-MONTH USD - LIBOR PLAYTECH PLC (K) Annually 08/16/2023 GBP (171) (1) – (1)UBS Vifor Pharma AG 1-MONTH USD - LIBOR VIFOR PHARMA AG (K) Annually 09/12/2023 USD (449) (22) – (22)
$ 839 $ – $ 839
A list of open centrally cleared swap agreements held by the Fund at December 31, 2021, is as follows:
Interest Rate Swaps
Fund Pays Fund ReceivesPayment
Frequency Termination Date Currency
Notional Amount
(Thousands)Value
(Thousands)
Upfront Payments/
Receipts (Thousands)
Net Unrealized Appreciation
(Depreciation) (Thousands)
1.0 X WIBR6-MONTH + 0.0 BPS 2.95% Semi-Annually 03/16/2027 PLN 14,793 $ 105 $ – $ 1051.0 X SIBCSORA + 0.0 BPS 1.492% Semi-Annually 03/16/2032 SGD 1,660 26 – 26
$ 131 $ – $ 131
Credit Default Swaps
Reference Entity/ ObligationBuy/Sell
Protection(Pays)/Receives
RatePayment
Frequency Termination DateNotional Amount
(Thousands)Value
(Thousands)
Upfront Payments/ Receipts
(Thousands)
Net Unrealized Appreciation
(Depreciation) (Thousands)
CDX.HY.37 Buy 5.00% Quarterly 12/20/2026 104 $ (10) $ (9) $ (1)CDX.HY.37 Buy 5.00% Quarterly 12/20/2026 137 (13) (13) –CDX.HY.37 Buy 5.00% Quarterly 12/20/2026 414 (38) (31) (7)CDX.HY.37 Buy 5.00% Quarterly 12/20/2026 46 (29) (4) (25)CDX.HY.37 Buy 5.00% Quarterly 12/20/2026 1,728 (154) (155) 1CDX.IG.37 Buy 1.00% Quarterly 12/20/2026 1,172 (62) (26) (36)GAP Inc. Buy 1.00% Quarterly 06/20/2025 270 5 30 (25)
ITRX.XOVER.36 Buy 5.00% Quarterly 12/20/2026 138 (19) (18) (1)ITRX.XOVER.36 Buy 5.00% Quarterly 12/20/2026 698 (94) (77) (17)
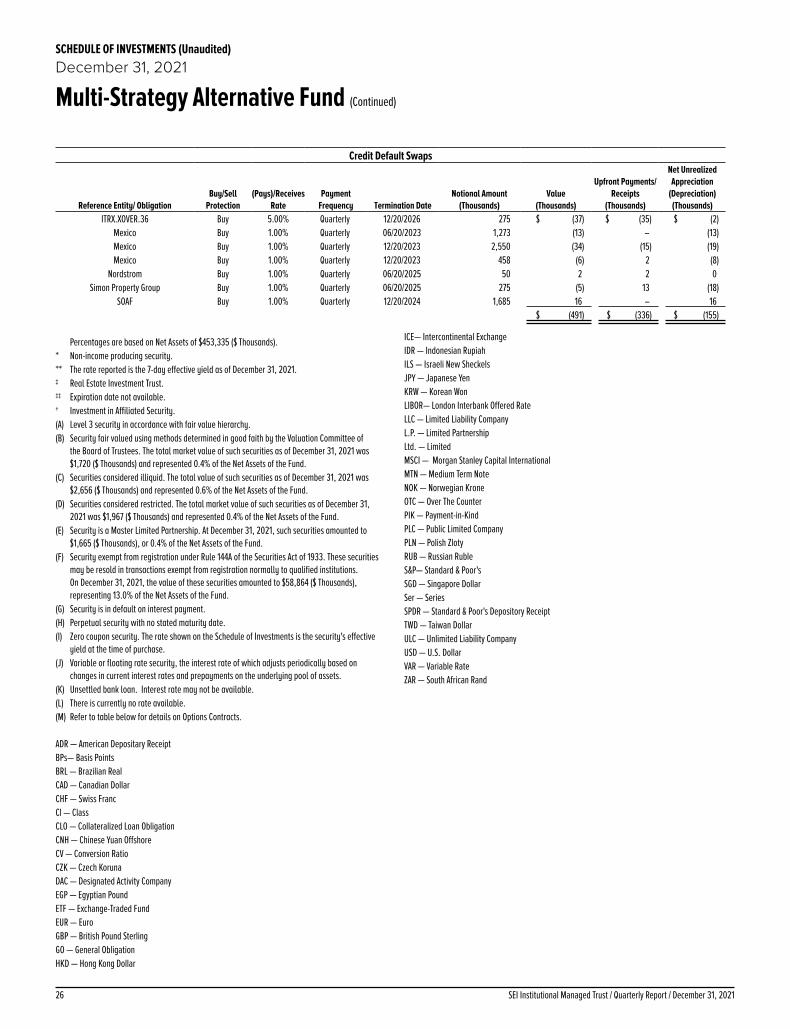
SEI Institutional Managed Trust / Quarterly Report / December 31, 202126
SCHEDULE OF INVESTMENTS (Unaudited)December 31, 2021
Multi-Strategy Alternative Fund (Continued)
Credit Default Swaps
Reference Entity/ ObligationBuy/Sell
Protection(Pays)/Receives
RatePayment
Frequency Termination DateNotional Amount
(Thousands)Value
(Thousands)
Upfront Payments/ Receipts
(Thousands)
Net Unrealized Appreciation
(Depreciation) (Thousands)
ITRX.XOVER.36 Buy 5.00% Quarterly 12/20/2026 275 $ (37) $ (35) $ (2)Mexico Buy 1.00% Quarterly 06/20/2023 1,273 (13) – (13)Mexico Buy 1.00% Quarterly 12/20/2023 2,550 (34) (15) (19)Mexico Buy 1.00% Quarterly 12/20/2023 458 (6) 2 (8)
Nordstrom Buy 1.00% Quarterly 06/20/2025 50 2 2 0Simon Property Group Buy 1.00% Quarterly 06/20/2025 275 (5) 13 (18)
SOAF Buy 1.00% Quarterly 12/20/2024 1,685 16 – 16 $ (491) $ (336) $ (155)
Percentages are based on Net Assets of $453,335 ($ Thousands).* Non-income producing security.** The rate reported is the 7-day effective yield as of December 31, 2021.‡ Real Estate Investment Trust.‡‡ Expiration date not available.† Investment in Affiliated Security.(A) Level 3 security in accordance with fair value hierarchy.(B) Security fair valued using methods determined in good faith by the Valuation Committee of
the Board of Trustees. The total market value of such securities as of December 31, 2021 was $1,720 ($ Thousands) and represented 0.4% of the Net Assets of the Fund.
(C) Securities considered illiquid. The total value of such securities as of December 31, 2021 was $2,656 ($ Thousands) and represented 0.6% of the Net Assets of the Fund.
(D) Securities considered restricted. The total market value of such securities as of December 31, 2021 was $1,967 ($ Thousands) and represented 0.4% of the Net Assets of the Fund.
(E) Security is a Master Limited Partnership. At December 31, 2021, such securities amounted to $1,665 ($ Thousands), or 0.4% of the Net Assets of the Fund.
(F) Security exempt from registration under Rule 144A of the Securities Act of 1933. These securities may be resold in transactions exempt from registration normally to qualified institutions. On December 31, 2021, the value of these securities amounted to $58,864 ($ Thousands), representing 13.0% of the Net Assets of the Fund.
(G) Security is in default on interest payment.(H) Perpetual security with no stated maturity date.(I) Zero coupon security. The rate shown on the Schedule of Investments is the security's effective
yield at the time of purchase.(J) Variable or floating rate security, the interest rate of which adjusts periodically based on
changes in current interest rates and prepayments on the underlying pool of assets.(K) Unsettled bank loan. Interest rate may not be available.(L) There is currently no rate available.(M) Refer to table below for details on Options Contracts.
ADR — American Depositary ReceiptBPs— Basis PointsBRL — Brazilian RealCAD — Canadian DollarCHF — Swiss FrancCl — ClassCLO — Collateralized Loan ObligationCNH — Chinese Yuan OffshoreCV — Conversion RatioCZK — Czech KorunaDAC — Designated Activity CompanyEGP — Egyptian PoundETF — Exchange-Traded FundEUR — EuroGBP — British Pound SterlingGO — General ObligationHKD — Hong Kong Dollar
ICE— Intercontinental ExchangeIDR — Indonesian RupiahILS — Israeli New SheckelsJPY — Japanese YenKRW — Korean WonLIBOR— London Interbank Offered RateLLC — Limited Liability CompanyL.P. — Limited PartnershipLtd. — LimitedMSCI — Morgan Stanley Capital InternationalMTN — Medium Term NoteNOK — Norwegian KroneOTC — Over The CounterPIK — Payment-in-KindPLC — Public Limited CompanyPLN — Polish ZlotyRUB — Russian RubleS&P— Standard & Poor'sSGD — Singapore DollarSer — SeriesSPDR — Standard & Poor's Depository ReceiptTWD — Taiwan DollarULC — Unlimited Liability CompanyUSD — U.S. DollarVAR — Variable RateZAR — South African Rand

27SEI Institutional Managed Trust / Quarterly Report / December 31, 2021
SCHEDULE OF INVESTMENTS (Unaudited)December 31, 2021
Multi-Strategy Alternative Fund (Concluded)
The following is a list of the levels of inputs used as of December 31, 2021 in valuing the Fund’s investments and other financial instruments carried at value ($ Thousands):
Investments in SecuritiesLevel 1
($)Level 2
($)Level 3
($)(1)Total
($)Common Stock 145,114 442 1,233 146,789Corporate Obligations – 71,995 2 71,997Registered Investment Companies 50,062 – – 50,062Sovereign Debt – 19,173 – 19,173Loan Participations – 14,984 4,124 19,108Foreign Common Stock 7,033 – – 7,033Municipal Bonds – 6,454 – 6,454Warrants 26 2,281 115 2,422Asset-Backed Securities – 2,086 – 2,086U.S. Treasury Obligations – 1,038 – 1,038Convertible Bonds – 984 – 984Preferred Stock – – 415 415Mortgage-Backed Security – 175 – 175Cash Equivalents 114,510 – – 114,510
Total Investments in Securities 316,745 119,612 5,889 442,246Securities Sold Short
Common Stock (53,236) – – (53,236)Corporate Obligations – (9,460) – (9,460)Foreign Common Stock (5,997) – – (5,997)Registered Investment Companies (3,701) – – (3,701)U.S. Treasury Obligations – (1,601) – (1,601)
Total Securities Sold Short (62,934) (11,061) – (73,995)
Other Financial InstrumentsLevel 1
($)Level 2
($)Level 3
($)Total
($)
Purchased Options 102 – – 102 Futures Contracts*
Unrealized Depreciation (61 ) – – (61 )Forwards Contracts*
Unrealized Appreciation – 301 – 301 Unrealized Depreciation – (344 ) – (344 )
OTC SwapsTotal Return Swaps*
Unrealized Appreciation – 1,127 – 1,127 Unrealized Depreciation – (288 ) – (288 )
Centrally Cleared SwapsInterest Rate Swaps*
Unrealized Appreciation – 131 – 131 Credit Default Swaps*
Unrealized Appreciation – 17 – 17 Unrealized Depreciation – (172 ) – (172 )
Total Other Financial Instruments 41 772 – 813 *Futures contracts, forwards contracts and swap contracts are valued at the unrealized appreciation/(depreciation) on the instrument.
The following is a reconciliation of the investments in which significant unobservable inputs (Level 3) were used in determining value ($ Thousands):
Investments in Common Stock
Investments in Corporate Obligations
Investments in Loan
ParticipationsInvestments in
Warrants
Investments in Preferred
StockBalance as of September 30, 2021 $ 1,147 $ – $ 3,896 $ 73 $ 115Accrued discounts/premiums – – 2 – –Realized gain/(loss) – – – – –Change in unrealized appreciation/
(depreciation) 89 2 (11) 9 10Purchases – – 311 33 290Sales (3) – (74) – –Net transfer into Level 3 – – – – –Net transfer out of Level 3 – – – – –Ending Balance as of December 31,
2021(1) $ 1,233 $ 2 $ 4,124 $ 115 $ 415 Changes in unrealized gains/(losses)
included in earnings related to securities still held at reporting date $ 96 $ 2 $ (11) $ 9 $ 1
(1) Of the $5,889 ($ Thousands) in Level 3 securities as of December 31, 2021, $5,491 ($ Thousands) or 1.2% of the Net Assets of the Fund are not valued via third party pricing vendors and broker quotes. If significant, the disclosure of the unobservable inputs and the interrelationships and sensitivity between these inputs are required for those Level 3 securities that are not valued by third party pricing vendors or broker quotes. The value of these securities is immaterial and no further disclosure is required.
For the period ended December 31, 2021, there were transfers between Level 2 and Level 3 assets and liabilities due to the availability of observable inputs to determine fair value.
For information regarding the Fund's policy regarding valuation of investments and other significant accounting policies, please refer to the Fund's most recent semi-annual and annual financial statements.
The following is a summary of the transactions with affiliates for the period ended December 31, 2021 ($ Thousands):
Security Description Value 9/30/2021 Purchases at Cost Proceeds from
Sales Realized Gain/
(Loss)
Change in Unrealized
Appreciation/ (Depreciation)
Value 12/31/2021 Shares Income Capital Gains
SEI Daily Income Trust, Government Fund, Cl F $ 153,952 $ 113,448 $ (152,955) $ — $ — $ 114,445 114,445,452 $ 4 $ —
Amounts designated as “—” are $0 or have been rounded to $0.

1SEI Institutional Managed Trust / Quarterly Report / December 31, 2021
SCHEDULE OF INVESTMENTS (Unaudited)December 31, 2021
Multi-Asset Accumulation Fund
DescriptionFace Amount (Thousands)
Market Value ($ Thousands)
U.S. TREASURY OBLIGATIONS — 43.7%U.S. Treasury Bills
0.160%, 06/23/2022 (A) $ 873 $ 8720.129%, 06/16/2022 (A) 4,257 4,2540.070%, 05/26/2022 (A) 101,855 101,8170.064%, 05/19/2022 (A)(B) 45,651 45,6340.060%, 04/21/2022 (A)(B) 53,432 53,4200.060%, 04/28/2022 (A)(B) 423 4230.055%, 04/07/2022 (A)(B) 200,467 200,4290.055%, 04/14/2022 (A)(B) 30,000 29,9940.054%, 03/03/2022 (A)(B) 30,000 29,9980.050%, 01/20/2022 (A)(B) 68,250 68,2500.050%, 02/24/2022 (A)(B) 30,000 29,9990.050%, 03/17/2022 (A)(B) 117,432 117,4190.050%, 03/31/2022 (A) 41,480 41,4750.042%, 01/06/2022 (A) 23,000 23,0000.039%, 03/24/2022 (A) 34,640 34,636
U.S. Treasury Inflation Protected Securities 3.875%, 04/15/2029 3,365 4,6863.625%, 04/15/2028 1,710 2,2723.375%, 04/15/2032 4,675 6,9522.500%, 01/15/2029 2,448 3,1292.375%, 01/15/2025 1,174 1,3372.375%, 01/15/2027 1,372 1,6562.125%, 02/15/2040 2,559 3,9162.125%, 02/15/2041 2,526 3,9082.000%, 01/15/2026 1,394 1,6121.750%, 01/15/2028 626 7511.375%, 02/15/2044 1,187 1,6931.000%, 02/15/2046 1,518 2,0731.000%, 02/15/2049 3,847 5,4580.875%, 01/15/2029 1,035 1,1970.750%, 07/15/2028 20,286 23,2290.750%, 02/15/2042 4,162 5,2570.750%, 02/15/2045 881 1,1330.625%, 01/15/2024 1,185 1,2610.625%, 01/15/2026 5,820 6,3920.625%, 02/15/2043 1,805 2,2420.500%, 01/15/2028 26,990 30,1980.375%, 07/15/2023 1,189 1,2500.375%, 07/15/2025 12,830 13,9340.375%, 01/15/2027 2,290 2,5190.250%, 01/15/2025 584 6250.250%, 07/15/2029 36,764 41,1910.250%, 02/15/2050 323 3900.125%, 01/15/2022 611 6120.125%, 04/15/2022 7,961 8,0770.125%, 07/15/2022 601 6160.125%, 01/15/2023 5,991 6,1870.125%, 07/15/2024 8,154 8,6920.125%, 10/15/2024 8,085 8,6350.125%, 10/15/2025 426 4600.125%, 10/15/2025 20,893 22,522
DescriptionFace Amount (Thousands)
Market Value ($ Thousands)
U.S. TREASURY OBLIGATIONS (continued)0.125%, 04/15/2026 $ 5,115 $ 5,5200.125%, 07/15/2026 9,231 10,0220.125%, 10/15/2026 202 2200.125%, 01/15/2030 36,229 40,2080.125%, 07/15/2030 32,363 36,2060.125%, 01/15/2031 43,563 48,7710.125%, 07/15/2031 36,429 40,945
Total U.S. Treasury Obligations
(Cost $1,170,299) ($ Thousands) 1,189,574
SOVEREIGN DEBT — 18.4%
Andina de Fomento4.375%, 06/15/2022(B) 125 127
Asian Development Bank2.625%, 01/30/2024(B) 375 3892.625%, 01/12/2027(B) 1,750 1,8562.375%, 08/10/2027(B) 500 5252.000%, 04/24/2026(B) 500 5151.750%, 08/14/2026(B) 500 510
Asian Infrastructure Investment Bank2.250%, 05/16/2024(B) 375 387
Canada Government International Bond2.000%, 11/15/2022(B) 375 380
Council of Europe Development Bank2.625%, 02/13/2023(B) 500 5112.500%, 02/27/2024(B) 750 7761.750%, 09/26/2022(B) 250 253
Deutsche Bundesrepublik Inflation Linked Bond
0.500%, 04/15/2030 EUR 42,337 59,5670.100%, 04/15/2023 7,916 9,3190.100%, 04/15/2026 13,031 16,4020.100%, 04/15/2033 4,277 6,1370.100%, 04/15/2046 5,562 10,366
European Bank for Reconstruction & Development MTN
2.750%, 03/07/2023(B) $ 750 7691.875%, 02/23/2022(B) 375 376
European Investment Bank4.875%, 02/15/2036(B) 250 3443.250%, 01/29/2024(B) 1,500 1,5753.125%, 12/14/2023(B) 250 2612.625%, 03/15/2024(B) 1,000 1,0392.500%, 03/15/2023(B) 375 3842.500%, 10/15/2024(B) 1,000 1,0412.375%, 05/24/2027(B) 250 2622.125%, 04/13/2026(B) 500 5181.875%, 02/10/2025(B) 500 513

SEI Institutional Managed Trust / Quarterly Report / December 31, 20212
SCHEDULE OF INVESTMENTS (Unaudited)December 31, 2021
Multi-Asset Accumulation Fund (Continued)
DescriptionFace Amount (Thousands)
Market Value ($ Thousands)
SOVEREIGN DEBT (continued)Export Development Canada
2.750%, 03/15/2023(B) $ 750 $ 7692.625%, 02/21/2024(B) 1,375 1,4272.500%, 01/24/2023(B) 750 766
French Republic Government Bond OAT3.400%, 07/25/2029 EUR 1,342 2,1783.150%, 07/25/2032 2,693 4,7662.100%, 07/25/2023(C) 2,237 2,7271.850%, 07/25/2027 14,319 20,1311.800%, 07/25/2040(C) 1,871 3,5401.100%, 07/25/2022 1,181 1,3860.700%, 07/25/2030(C) 16,244 22,7720.250%, 07/25/2024 4,646 5,6830.100%, 03/01/2025 4,615 5,6160.100%, 03/01/2026(C) 4,588 5,7300.100%, 03/01/2028 9,965 12,7610.100%, 03/01/2029 11,451 14,9550.100%, 07/25/2031(C) 5,948 7,9930.100%, 03/01/2032 1,738 2,3220.100%, 03/01/2036(C) 2,549 3,5550.100%, 07/25/2036(C) 4,333 6,0990.100%, 07/25/2047(C) 1,272 2,022
Inter-American Development Bank7.000%, 06/15/2025(B) $ 500 5993.125%, 09/18/2028(B) 375 4143.000%, 10/04/2023(B) 250 2603.000%, 02/21/2024(B) 250 2622.625%, 01/16/2024(B) 375 3892.500%, 01/18/2023(B) 750 7652.000%, 06/02/2026(B) 1,000 1,0312.000%, 07/23/2026(B) 375 3871.750%, 09/14/2022(B) 1,000 1,009
International Bank for Reconstruction & Development
7.625%, 01/19/2023(B) 750 8064.750%, 02/15/2035(B) 250 3343.000%, 09/27/2023(B) 750 7792.500%, 03/19/2024(B) 750 7772.500%, 11/25/2024(B) 500 5212.500%, 07/29/2025(B) 375 3932.500%, 11/22/2027(B) 750 7922.125%, 07/01/2022(B) 375 3781.875%, 10/07/2022(B) 875 8841.875%, 10/27/2026(B) 375 3841.750%, 04/19/2023(B) 1,000 1,0151.500%, 08/28/2024(B) 375 380
International Finance MTN2.875%, 07/31/2023(B) 375 3882.125%, 04/07/2026(B) 1,000 1,0372.000%, 10/24/2022(B) 750 760
DescriptionFace Amount (Thousands)
Market Value ($ Thousands)
SOVEREIGN DEBT (continued)Italy Buoni Poliennali Del Tesoro
3.100%, 09/15/2026(C) EUR 3,696 $ 5,1172.600%, 09/15/2023(C) 1,243 1,5372.550%, 09/15/2041(C) 1,869 3,3282.350%, 09/15/2024(C) 1,970 2,5002.350%, 09/15/2035(C) 3,254 5,1101.300%, 05/15/2028(C) 5,258 6,8471.250%, 09/15/2032(C) 6,418 8,7080.650%, 05/15/2026 819 1,0080.400%, 05/15/2030(C) 4,472 5,5250.150%, 05/15/2051(C) 522 5960.100%, 05/15/2022(C) 2,164 2,5000.100%, 05/15/2023 952 1,117
Korea International Bond2.750%, 01/19/2027(B) $ 1,000 1,054
North American Development Bank2.400%, 10/26/2022(B) 200 203
Province of Alberta Canada3.350%, 11/01/2023(B) 250 2613.300%, 03/15/2028(B) 500 5482.950%, 01/23/2024(B) 250 2602.200%, 07/26/2022(B) 1,000 1,010
Province of British Columbia Canada6.500%, 01/15/2026(B) 250 2982.000%, 10/23/2022(B) 750 759
Province of Manitoba Canada3.050%, 05/14/2024(B) 250 2622.600%, 04/16/2024(B) 500 5182.125%, 05/04/2022(B) 250 251
Province of Ontario Canada3.200%, 05/16/2024(B) 250 2632.500%, 04/27/2026(B) 1,000 1,0462.450%, 06/29/2022(B) 250 2532.400%, 02/08/2022(B) 750 7512.250%, 05/18/2022(B) 500 5042.200%, 10/03/2022(B) 500 5072.000%, 10/02/2029(B) 500 508
Province of Quebec Canada7.500%, 09/15/2029(B) 450 6282.875%, 10/16/2024(B) 500 5252.625%, 02/13/2023(B) 500 5112.500%, 04/09/2024(B) 1,000 1,0352.500%, 04/20/2026(B) 750 786

3SEI Institutional Managed Trust / Quarterly Report / December 31, 2021
SCHEDULE OF INVESTMENTS (Unaudited)December 31, 2021
Multi-Asset Accumulation Fund (Continued)
DescriptionFace Amount (Thousands)
Market Value ($ Thousands)
SOVEREIGN DEBT (continued)United Kingdom Gilt Inflation Linked
4.125%, 07/22/2030 GBP 500 $ 2,6062.500%, 07/17/2024 340 1,6852.000%, 01/26/2035 932 3,8951.875%, 11/22/2022 759 1,0951.250%, 11/22/2027 6,752 11,8221.250%, 11/22/2032 16,381 34,0871.250%, 11/22/2055 1,299 4,8881.125%, 11/22/2037 2,931 6,9970.750%, 03/22/2034 2,821 5,7890.750%, 11/22/2047 1,352 3,8720.625%, 03/22/2040 2,161 5,1030.625%, 11/22/2042 3,524 8,8710.500%, 03/22/2050 731 2,1080.375%, 03/22/2062 1,455 5,2030.250%, 03/22/2052 1,547 4,4060.125%, 03/22/2024 3,089 4,5780.125%, 03/22/2026 3,625 5,6890.125%, 08/10/2028 10,447 17,5980.125%, 03/22/2029 9,330 15,9200.125%, 08/10/2031 2,338 4,2570.125%, 03/22/2044 3,990 9,4410.125%, 08/10/2048 2,611 6,7750.125%, 03/22/2058 1,463 4,5510.125%, 11/22/2065 1,318 4,8460.125%, 03/22/2068 2,499 9,897
Total Sovereign Debt (Cost $461,959) ($ Thousands) 499,657
Shares
FOREIGN COMMON STOCK — 2.9%
Australia — 0.1%Afterpay * 911 55Ampol 2,048 44APA Group 14,676 107Aristocrat Leisure Ltd 3,212 102ASX Ltd 1,383 93Aurizon Holdings Ltd 21,309 54AusNet Services 121,425 227Brambles Ltd 4,589 36Cochlear Ltd 834 131Coles Group Ltd 10,674 139Commonwealth Bank of Australia 792 58Computershare Ltd 8,847 129Crown Resorts Ltd 10,576 92CSL Ltd 892 189Dexus ‡ 7,723 62Endeavour Group 6,248 31Evolution Mining Ltd 51,564 152Goodman Group ‡ 3,333 64Insurance Australia Group Ltd 20,132 62
Description SharesMarket Value
($ Thousands)
FOREIGN COMMON STOCK (continued)Lendlease Group ‡ 5,588 $ 43Medibank Pvt 28,257 69Newcrest Mining Ltd 3,749 67Northern Star Resources Ltd 20,330 139Orica Ltd 4,582 46Origin Energy Ltd 9,571 36REA Group Ltd 484 59Santos Ltd 10,191 47SEEK Ltd 2,052 49Sonic Healthcare Ltd 4,379 148Suncorp Group 7,008 56Tabcorp Holdings Ltd 30,312 111Telstra Corp Ltd, Cl B 53,641 163Treasury Wine Estates Ltd 15,968 144Washington H Soul Pattinson & Co Ltd 3,573 77Wesfarmers Ltd 2,749 119WiseTech Global 4,748 202Woodside Petroleum Ltd 5,284 84Woolworths Group Ltd 6,248 173Xero * 1,105 114
3,773
Austria — 0.0%Erste Group Bank AG 2,047 96OMV AG 775 44Verbund AG 519 59
199
Belgium — 0.1%Ageas 1,537 79Anheuser-Busch InBev SA/NV 1,152 70Argenx * 613 220Elia System Operator SA/NV 1,419 187Etablissements Franz Colruyt 9,528 404Groupe Bruxelles Lambert SA 357 40KBC Group NV 780 67Proximus SADP 11,315 220UCB SA, Cl A 2,051 234Umicore SA 1,214 49
1,570
Canada — 0.2%Agnico Eagle Mines Ltd 2,376 126Algonquin Power & Utilities Corp 5,110 74Alimentation Couche-Tard 1,594 67Ballard Power Systems * 2,282 29Bank of Nova Scotia/The, Cl C 1,590 113Barrick Gold Corp 6,818 130Bausch Health Cos Inc * 1,753 49BCE Inc 920 48BlackBerry Ltd * 8,664 81Brookfield Renewable, Cl A 2,401 89

SEI Institutional Managed Trust / Quarterly Report / December 31, 20214
SCHEDULE OF INVESTMENTS (Unaudited)December 31, 2021
Multi-Asset Accumulation Fund (Continued)
Description SharesMarket Value
($ Thousands)
FOREIGN COMMON STOCK (continued)Cameco Corp 2,521 $ 55Canadian Pacific Railway Ltd 1,355 98Canadian Tire Corp Ltd, Cl A 894 128Canadian Utilities Ltd, Cl A 2,438 71Canopy Growth Corp * 3,668 32CCL Industries Inc, Cl B 2,082 112CGI Inc, Cl A * 1,997 177Constellation Software Inc/Canada 100 186Dollarama Inc 3,557 178Emera Inc 1,092 55Empire Co Ltd, Cl A 7,348 224First Quantum Minerals Ltd (Canada) 2,143 51FirstService ‡ 408 80Fortis Inc/Canada 2,017 97Franco-Nevada Corp 892 124George Weston Ltd 1,417 165GFL Environmental 1,398 53Gildan Activewear Inc 3,722 158Hydro One Ltd 2,869 75iA Financial Corp Inc 1,071 61Imperial Oil Ltd 822 30Keyera 1,776 40Kinross Gold Corp 13,832 80Kirkland Lake Gold Ltd 2,875 121Loblaw Cos Ltd 7,305 599Magna International Inc, Cl A 1,415 115Metro Inc/CN, Cl A 10,610 566Northland Power 1,799 54Nutrien Ltd 1,332 100Onex Corp 1,036 81Open Text Corp 2,952 140Pan American Silver 2,322 58Parkland 1,300 36Quebecor Inc, Cl B 3,150 71Restaurant Brands International Inc 2,731 166Ritchie Bros Auctioneers, Cl B 913 56Royal Bank of Canada 1,066 113Saputo Inc 4,704 106Shopify Inc, Cl A * 63 87Teck Resources Ltd, Cl B 2,736 79TELUS Corp 4,854 115Thomson Reuters 1,656 198Toronto-Dominion Bank/The 1,857 142Wheaton Precious Metals Corp 3,501 150WSP Global Inc 1,000 145
6,434
China — 0.0%Sands China Ltd 18,800 44
Description SharesMarket Value
($ Thousands)
FOREIGN COMMON STOCK (continued)Denmark — 0.1%
Ambu A/S, Cl B 4,155 $ 110Carlsberg A/S, Cl B 1,017 176Chr Hansen Holding A/S 1,282 101Coloplast A/S, Cl B 1,741 306Danske Bank A/S 4,552 79Demant A/S * 2,583 132DSV A/S 468 109Genmab A/S * 435 175GN Store Nord A/S 1,712 108Novo Nordisk A/S, Cl B 3,164 355Novozymes A/S, Cl B 2,193 180Orsted A/S 1,151 147Pandora A/S 660 82Tryg A/S 3,506 87
2,147
Finland — 0.0%Elisa Oyj 1,739 107Fortum Oyj 5,767 177Kesko Oyj, Cl B 4,597 154Nokia Oyj 20,694 131Orion Oyj, Cl B 2,179 90UPM-Kymmene Oyj, Cl V 1,682 64
723
France — 0.2%Aeroports de Paris, Cl A 373 48Air Liquide SA 839 146Arkema SA 736 104AXA SA 1,342 40BioMerieux 1,592 226Bollore SA 19,190 107Bouygues SA 892 32Capgemini SE 433 106Carrefour SA 6,251 114Covivio ‡ 434 36Dassault Systemes 1,640 98Edenred 1,794 83Electricite de France SA 16,450 193Engie SA 7,170 106Eurazeo 468 41Eurofins Scientific 990 122Getlink SE 4,624 77Ipsen SA 736 67Kering 119 96Legrand SA 1,748 205L'Oreal SA 545 258LVMH Moet Hennessy Louis Vuitton SE 84 69Orange SA 24,112 258Orpea 727 73Pernod Ricard SA 684 165
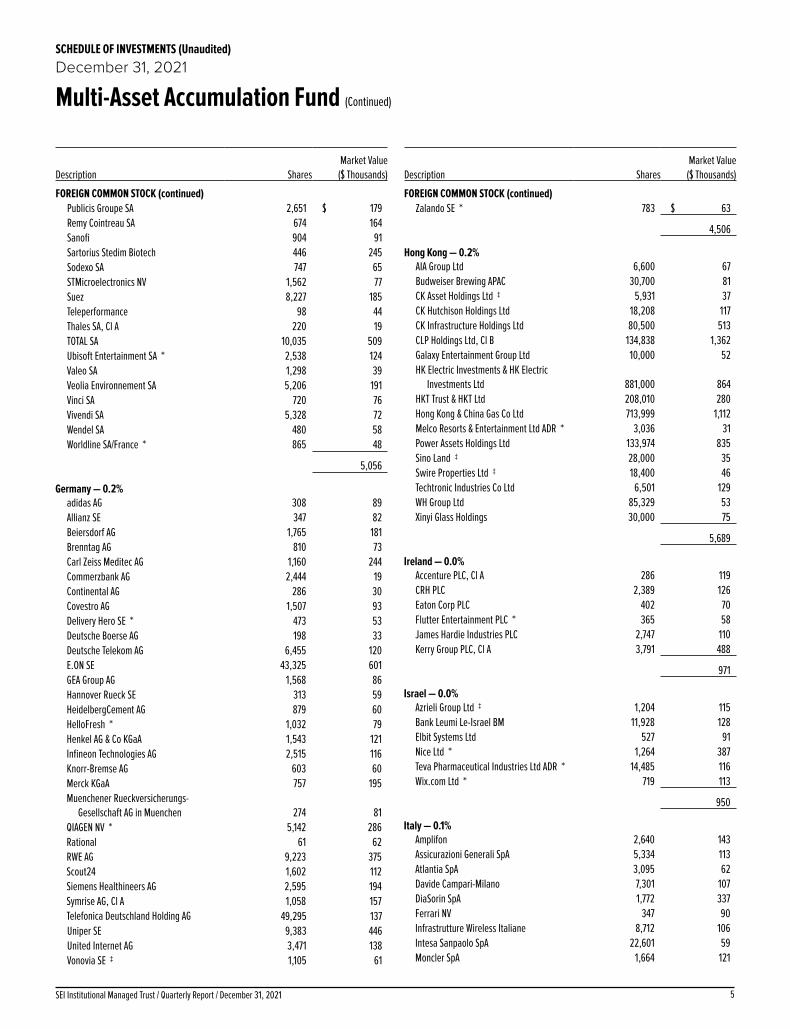
5SEI Institutional Managed Trust / Quarterly Report / December 31, 2021
SCHEDULE OF INVESTMENTS (Unaudited)December 31, 2021
Multi-Asset Accumulation Fund (Continued)
Description SharesMarket Value
($ Thousands)
FOREIGN COMMON STOCK (continued)Publicis Groupe SA 2,651 $ 179Remy Cointreau SA 674 164Sanofi 904 91Sartorius Stedim Biotech 446 245Sodexo SA 747 65STMicroelectronics NV 1,562 77Suez 8,227 185Teleperformance 98 44Thales SA, Cl A 220 19TOTAL SA 10,035 509Ubisoft Entertainment SA * 2,538 124Valeo SA 1,298 39Veolia Environnement SA 5,206 191Vinci SA 720 76Vivendi SA 5,328 72Wendel SA 480 58Worldline SA/France * 865 48
5,056
Germany — 0.2%adidas AG 308 89Allianz SE 347 82Beiersdorf AG 1,765 181Brenntag AG 810 73Carl Zeiss Meditec AG 1,160 244Commerzbank AG 2,444 19Continental AG 286 30Covestro AG 1,507 93Delivery Hero SE * 473 53Deutsche Boerse AG 198 33Deutsche Telekom AG 6,455 120E.ON SE 43,325 601GEA Group AG 1,568 86Hannover Rueck SE 313 59HeidelbergCement AG 879 60HelloFresh * 1,032 79Henkel AG & Co KGaA 1,543 121Infineon Technologies AG 2,515 116Knorr-Bremse AG 603 60Merck KGaA 757 195Muenchener Rueckversicherungs-
Gesellschaft AG in Muenchen 274 81QIAGEN NV * 5,142 286Rational 61 62RWE AG 9,223 375Scout24 1,602 112Siemens Healthineers AG 2,595 194Symrise AG, Cl A 1,058 157Telefonica Deutschland Holding AG 49,295 137Uniper SE 9,383 446United Internet AG 3,471 138Vonovia SE ‡ 1,105 61
Description SharesMarket Value
($ Thousands)
FOREIGN COMMON STOCK (continued)Zalando SE * 783 $ 63
4,506
Hong Kong — 0.2%AIA Group Ltd 6,600 67Budweiser Brewing APAC 30,700 81CK Asset Holdings Ltd ‡ 5,931 37CK Hutchison Holdings Ltd 18,208 117CK Infrastructure Holdings Ltd 80,500 513CLP Holdings Ltd, Cl B 134,838 1,362Galaxy Entertainment Group Ltd 10,000 52HK Electric Investments & HK Electric
Investments Ltd 881,000 864HKT Trust & HKT Ltd 208,010 280Hong Kong & China Gas Co Ltd 713,999 1,112Melco Resorts & Entertainment Ltd ADR * 3,036 31Power Assets Holdings Ltd 133,974 835Sino Land ‡ 28,000 35Swire Properties Ltd ‡ 18,400 46Techtronic Industries Co Ltd 6,501 129WH Group Ltd 85,329 53Xinyi Glass Holdings 30,000 75
5,689
Ireland — 0.0%Accenture PLC, Cl A 286 119CRH PLC 2,389 126Eaton Corp PLC 402 70Flutter Entertainment PLC * 365 58James Hardie Industries PLC 2,747 110Kerry Group PLC, Cl A 3,791 488
971
Israel — 0.0%Azrieli Group Ltd ‡ 1,204 115Bank Leumi Le-Israel BM 11,928 128Elbit Systems Ltd 527 91Nice Ltd * 1,264 387Teva Pharmaceutical Industries Ltd ADR * 14,485 116Wix.com Ltd * 719 113
950
Italy — 0.1%Amplifon 2,640 143Assicurazioni Generali SpA 5,334 113Atlantia SpA 3,095 62Davide Campari-Milano 7,301 107DiaSorin SpA 1,772 337Ferrari NV 347 90Infrastrutture Wireless Italiane 8,712 106Intesa Sanpaolo SpA 22,601 59Moncler SpA 1,664 121

SEI Institutional Managed Trust / Quarterly Report / December 31, 20216
SCHEDULE OF INVESTMENTS (Unaudited)December 31, 2021
Multi-Asset Accumulation Fund (Continued)
Description SharesMarket Value
($ Thousands)
FOREIGN COMMON STOCK (continued)Nexi * 6,804 $ 108Poste Italiane SpA 8,102 106Prysmian SpA 1,571 59Recordati SpA 3,108 200Snam SpA 15,257 92Stellantis 4,810 91Telecom Italia SpA/Milano 79,865 39Tenaris SA 1,325 14Terna - Rete Elettrica Nazionale 16,471 133
1,980
Japan — 0.9%Advantest Corp 500 47Aeon Co Ltd, Cl H 2,600 61Aisin Seiki Co Ltd 1,500 57Ajinomoto Co Inc 23,200 704ANA Holdings Inc 3,500 73Asahi Group Holdings Ltd 2,100 82Asahi Intecc Co Ltd 2,400 51Asahi Kasei Corp 4,200 39Astellas Pharma Inc 6,600 107Bandai Namco Holdings Inc 1,500 117Canon Inc 5,200 126Capcom 5,100 120Central Japan Railway Co 600 80Chiba Bank Ltd/The, Cl B 7,300 42Chubu Electric Power Co Inc 39,300 414Chugai Pharmaceutical Co Ltd 2,500 81Concordia Financial Group Ltd 15,100 55Cosmos Pharmaceutical Corp 700 103CyberAgent Inc 9,100 151Dai Nippon Printing Co Ltd 3,300 83Daifuku Co Ltd 700 57Dai-ichi Life Holdings 2,300 46Daiichi Sankyo Co Ltd 2,400 61Daito Trust Construction Co Ltd 900 103Daiwa House Industry Co Ltd ‡ 1,300 37Daiwa House Investment Corp ‡ 42 127Dentsu Group Inc 3,500 125Disco 200 61East Japan Railway Co 1,200 74Eisai Co Ltd 1,400 79FUJIFILM Holdings Corp 3,500 259Fujitsu Ltd 400 68GLP J-Reit ‡ 44 76GMO Payment Gateway Inc 600 75Hakuhodo DY Holdings Inc 3,400 57Hamamatsu Photonics 1,500 96Hankyu Hanshin Holdings Inc 3,600 102Hino Motors Ltd 6,700 55Hirose Electric Co Ltd 682 114Hitachi Construction Machinery Co Ltd 1,600 46
Description SharesMarket Value
($ Thousands)
FOREIGN COMMON STOCK (continued)Hitachi Metals Ltd 3,300 $ 61Hoya Corp 800 119Ibiden 1,500 89Idemitsu Kosan Co Ltd 50,898 1,298Iida Group Holdings 3,000 70Inpex Corp 82,300 716IT Holdings 3,300 98Ito En 1,700 89ITOCHU Corp 3,700 113Itochu Techno-Solutions Corp 2,800 90Japan Metropolitan Fund Invest, Cl A ‡ 64 55Japan Post Bank Co Ltd 14,500 133Japan Post Holdings Co Ltd 13,200 103Japan Real Estate Investment Corp ‡ 12 68Japan Tobacco Inc 6,700 135JFE Holdings 4,500 57JSR Corp 1,900 72JXTG Holdings Inc 333,100 1,245Kakaku.com Inc 4,300 115Kansai Electric Power Co Inc/The 67,100 626Kao Corp 1,800 94KDDI Corp 8,800 257Keio Corp 2,500 110Keyence 200 125Kikkoman Corp 900 76Kintetsu Group Holdings Co Ltd 4,000 112Kirin Holdings Co Ltd 4,100 66Kobayashi Pharmaceutical 900 71Kobe Bussan 2,600 101Komatsu Ltd 2,500 58Konami Holdings Corp 1,600 77Kose 500 57Kubota 2,600 58Kyocera Corp 1,500 94Kyowa Hakko Kirin Co Ltd 4,100 112Lasertec Corp 300 92Lawson Inc 12,000 568Lion Corp 19,700 263LIXIL Group Corp 2,000 53M3 Inc 800 40Marubeni Corp 7,100 69Matsushita Electric Industrial 20,400 224McDonald's Holdings Co Japan Ltd 5,223 231Medipal Holdings Corp 6,800 127MEIJI Holdings Co Ltd 2,400 143Mercari * 1,100 56Mitsubishi Chemical Holdings Corp, Cl B 8,100 60Mitsui Fudosan Co Ltd ‡ 2,500 49MonotaRO 4,700 85Murata Manufacturing Co Ltd 700 56NEC Corp 1,400 64Nexon Co Ltd 5,800 112

7SEI Institutional Managed Trust / Quarterly Report / December 31, 2021
SCHEDULE OF INVESTMENTS (Unaudited)December 31, 2021
Multi-Asset Accumulation Fund (Continued)
Description SharesMarket Value
($ Thousands)
FOREIGN COMMON STOCK (continued)Nintendo Co Ltd 204 $ 95Nippon Building Fund Inc ‡ 13 76Nippon Paint Holdings 5,400 59Nippon Prologis Inc ‡ 40 141Nippon Shinyaku 1,500 104Nippon Telegraph & Telephone Corp 7,400 202Nippon Yusen 4,400 335Nissan Chemical 1,800 104Nisshin Seifun Group Inc 4,815 69Nissin Foods Holdings Co Ltd 2,000 146Nitori Holdings 600 90Nomura Holdings 12,000 52Nomura Real Estate Master Fund ‡ 44 62Nomura Research Institute Ltd 2,934 126NTT Data Corp 5,700 122Obic Co Ltd 400 75Odakyu Electric Railway Co Ltd 2,700 50Oji Holdings Corp 14,000 68Olympus 3,600 83Ono Pharmaceutical Co Ltd 10,800 268Oracle Corp Japan 1,200 91Oriental Land 1,200 202ORIX 3,400 69Orix JREIT Inc ‡ 51 80Osaka Gas Co Ltd 22,700 375Otsuka Corp 2,000 95Otsuka Holdings Co Ltd 2,600 94Pan Pacific International Holdings Corp 19,200 265Pola Orbis Holdings Inc 3,200 53Rakuten Group Inc 7,600 76Ricoh Co Ltd 5,000 46Rohm Co Ltd 700 64Ryohin Keikaku Co Ltd 5,000 76Santen Pharmaceutical Co Ltd 8,000 98SBI Holdings 4,300 117SCSK 3,600 72Secom Co Ltd 1,700 118Seven & i Holdings Co Ltd 3,600 158Sharp 3,900 45Shimano 400 106Shionogi & Co Ltd 1,600 113Shiseido Co Ltd 1,400 78Shizuoka Bank Ltd/The 12,000 86Softbank Corp 10,500 133SoftBank Group Corp 900 42Sohgo Security Services 4,600 182Sompo Holdings 2,100 89Sony Group 800 101Square Enix Holdings Co Ltd 1,700 87Subaru Corp 3,700 66SUMCO Corp 1,800 37Sumitomo Chemical 39,700 187
Description SharesMarket Value
($ Thousands)
FOREIGN COMMON STOCK (continued)Sumitomo Corp 6,500 $ 96Sumitomo Dainippon Pharma Co Ltd 4,600 53Sumitomo Metal Mining 1,000 38Suntory Beverage & Food Ltd 3,500 126Sysmex Corp 1,700 230T&D Holdings 4,600 59Taisei Corp 1,900 58Taisho Pharmaceutical Holdings Co Ltd 1,900 87Taiyo Nippon Sanso Corp 2,600 57Takeda Pharmaceutical Co Ltd 4,318 118TDK Corp 1,200 47Tecmo Koei Holdings 2,480 97Terumo Corp 2,800 118Tobu Railway Co Ltd 5,000 114Toho Co Ltd/Tokyo 3,600 154Tokio Marine Holdings Inc 2,300 128Tokyo Electric Power Co Holdings Inc * 82,700 213Tokyo Electron 100 58Tokyo Gas Co Ltd 42,300 757Tokyu Corp 7,000 93Toray Industries Inc 10,000 59Toyo Suisan Kaisha Ltd 10,800 457Toyota Industries Corp 700 56Toyota Motor Corp 12,000 219Trend Micro Inc/Japan 2,400 133Tsuruha Holdings Inc 900 86Unicharm Corp 7,900 343Welcia Holdings Co Ltd 4,000 125Yakult Honsha Co Ltd 2,100 109Yamaha 1,100 54Yamato Holdings Co Ltd 2,500 59Yokogawa Electric 3,700 67Z Holdings Corp 17,700 103ZOZO Inc 1,800 56
23,878
Netherlands — 0.1%ABN AMRO Bank NV 6,628 98Adyen NV * 65 171Aegon NV 17,146 85Akzo Nobel NV 447 49ArcelorMittal SA 2,187 70ASM International 322 142ASML Holding NV 209 168Just Eat Takeaway.com * 928 51Koninklijke Ahold Delhaize NV 6,728 231Koninklijke DSM NV 490 110Koninklijke KPN NV 54,612 170Koninklijke Philips NV 3,809 142Prosus NV 898 75Universal Music Group 5,328 150
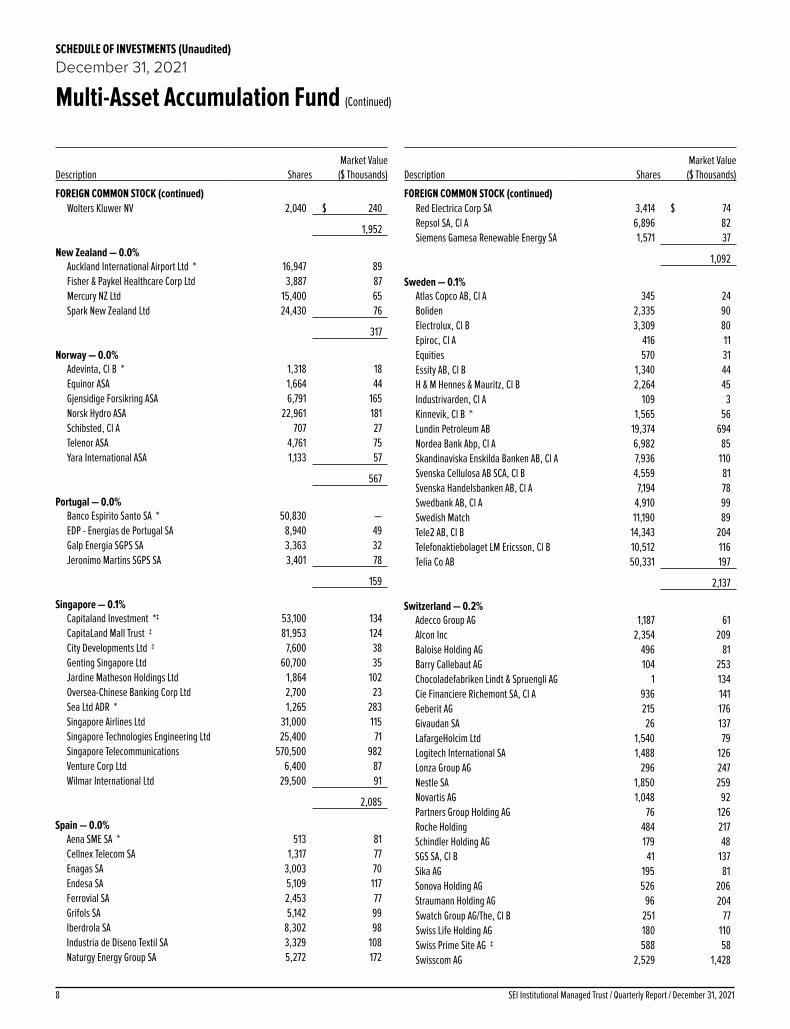
SEI Institutional Managed Trust / Quarterly Report / December 31, 20218
SCHEDULE OF INVESTMENTS (Unaudited)December 31, 2021
Multi-Asset Accumulation Fund (Continued)
Description SharesMarket Value
($ Thousands)
FOREIGN COMMON STOCK (continued)Wolters Kluwer NV 2,040 $ 240
1,952
New Zealand — 0.0%Auckland International Airport Ltd * 16,947 89Fisher & Paykel Healthcare Corp Ltd 3,887 87Mercury NZ Ltd 15,400 65Spark New Zealand Ltd 24,430 76
317
Norway — 0.0%Adevinta, Cl B * 1,318 18Equinor ASA 1,664 44Gjensidige Forsikring ASA 6,791 165Norsk Hydro ASA 22,961 181Schibsted, Cl A 707 27Telenor ASA 4,761 75Yara International ASA 1,133 57
567
Portugal — 0.0%Banco Espirito Santo SA * 50,830 —EDP - Energias de Portugal SA 8,940 49Galp Energia SGPS SA 3,363 32Jeronimo Martins SGPS SA 3,401 78
159
Singapore — 0.1%Capitaland Investment *‡ 53,100 134CapitaLand Mall Trust ‡ 81,953 124City Developments Ltd ‡ 7,600 38Genting Singapore Ltd 60,700 35Jardine Matheson Holdings Ltd 1,864 102Oversea-Chinese Banking Corp Ltd 2,700 23Sea Ltd ADR * 1,265 283Singapore Airlines Ltd 31,000 115Singapore Technologies Engineering Ltd 25,400 71Singapore Telecommunications 570,500 982Venture Corp Ltd 6,400 87Wilmar International Ltd 29,500 91
2,085
Spain — 0.0%Aena SME SA * 513 81Cellnex Telecom SA 1,317 77Enagas SA 3,003 70Endesa SA 5,109 117Ferrovial SA 2,453 77Grifols SA 5,142 99Iberdrola SA 8,302 98Industria de Diseno Textil SA 3,329 108Naturgy Energy Group SA 5,272 172
Description SharesMarket Value
($ Thousands)
FOREIGN COMMON STOCK (continued)Red Electrica Corp SA 3,414 $ 74Repsol SA, Cl A 6,896 82Siemens Gamesa Renewable Energy SA 1,571 37
1,092
Sweden — 0.1%Atlas Copco AB, Cl A 345 24Boliden 2,335 90Electrolux, Cl B 3,309 80Epiroc, Cl A 416 11Equities 570 31Essity AB, Cl B 1,340 44H & M Hennes & Mauritz, Cl B 2,264 45Industrivarden, Cl A 109 3Kinnevik, Cl B * 1,565 56Lundin Petroleum AB 19,374 694Nordea Bank Abp, Cl A 6,982 85Skandinaviska Enskilda Banken AB, Cl A 7,936 110Svenska Cellulosa AB SCA, Cl B 4,559 81Svenska Handelsbanken AB, Cl A 7,194 78Swedbank AB, Cl A 4,910 99Swedish Match 11,190 89Tele2 AB, Cl B 14,343 204Telefonaktiebolaget LM Ericsson, Cl B 10,512 116Telia Co AB 50,331 197
2,137
Switzerland — 0.2%Adecco Group AG 1,187 61Alcon Inc 2,354 209Baloise Holding AG 496 81Barry Callebaut AG 104 253Chocoladefabriken Lindt & Spruengli AG 1 134Cie Financiere Richemont SA, Cl A 936 141Geberit AG 215 176Givaudan SA 26 137LafargeHolcim Ltd 1,540 79Logitech International SA 1,488 126Lonza Group AG 296 247Nestle SA 1,850 259Novartis AG 1,048 92Partners Group Holding AG 76 126Roche Holding 484 217Schindler Holding AG 179 48SGS SA, Cl B 41 137Sika AG 195 81Sonova Holding AG 526 206Straumann Holding AG 96 204Swatch Group AG/The, Cl B 251 77Swiss Life Holding AG 180 110Swiss Prime Site AG ‡ 588 58Swisscom AG 2,529 1,428
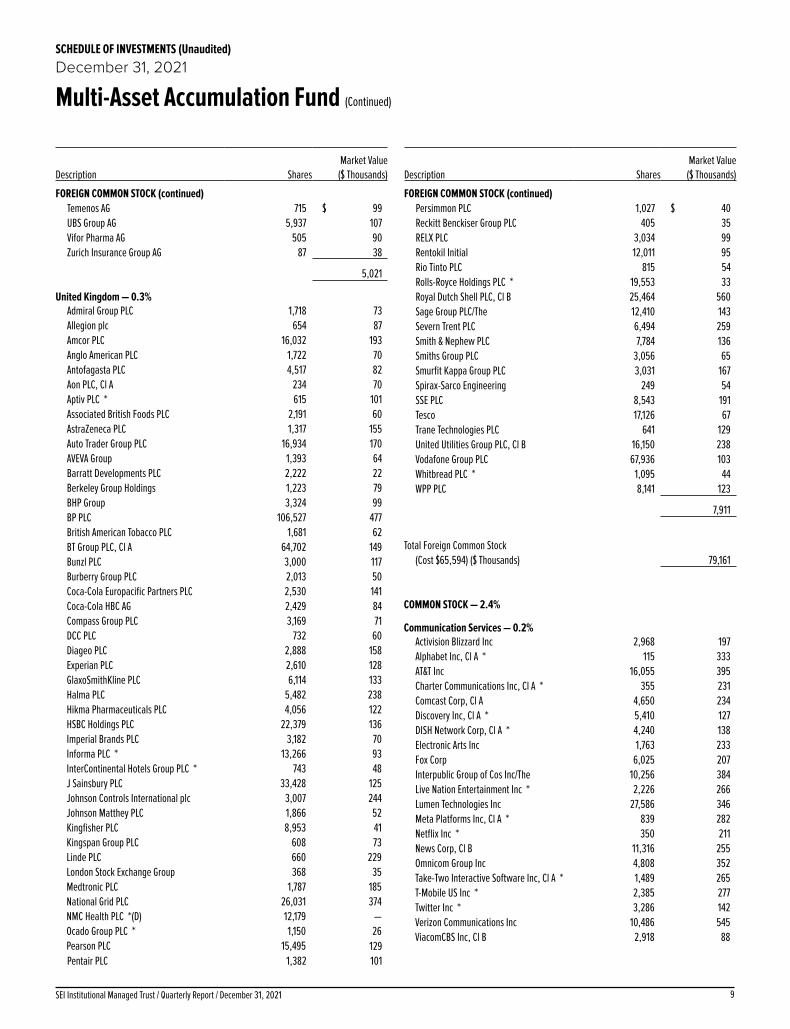
9SEI Institutional Managed Trust / Quarterly Report / December 31, 2021
SCHEDULE OF INVESTMENTS (Unaudited)December 31, 2021
Multi-Asset Accumulation Fund (Continued)
Description SharesMarket Value
($ Thousands)
FOREIGN COMMON STOCK (continued)Temenos AG 715 $ 99UBS Group AG 5,937 107Vifor Pharma AG 505 90Zurich Insurance Group AG 87 38
5,021
United Kingdom — 0.3%Admiral Group PLC 1,718 73Allegion plc 654 87Amcor PLC 16,032 193Anglo American PLC 1,722 70Antofagasta PLC 4,517 82Aon PLC, Cl A 234 70Aptiv PLC * 615 101Associated British Foods PLC 2,191 60AstraZeneca PLC 1,317 155Auto Trader Group PLC 16,934 170AVEVA Group 1,393 64Barratt Developments PLC 2,222 22Berkeley Group Holdings 1,223 79BHP Group 3,324 99BP PLC 106,527 477British American Tobacco PLC 1,681 62BT Group PLC, Cl A 64,702 149Bunzl PLC 3,000 117Burberry Group PLC 2,013 50Coca-Cola Europacific Partners PLC 2,530 141Coca-Cola HBC AG 2,429 84Compass Group PLC 3,169 71DCC PLC 732 60Diageo PLC 2,888 158Experian PLC 2,610 128GlaxoSmithKline PLC 6,114 133Halma PLC 5,482 238Hikma Pharmaceuticals PLC 4,056 122HSBC Holdings PLC 22,379 136Imperial Brands PLC 3,182 70Informa PLC * 13,266 93InterContinental Hotels Group PLC * 743 48J Sainsbury PLC 33,428 125Johnson Controls International plc 3,007 244Johnson Matthey PLC 1,866 52Kingfisher PLC 8,953 41Kingspan Group PLC 608 73Linde PLC 660 229London Stock Exchange Group 368 35Medtronic PLC 1,787 185National Grid PLC 26,031 374NMC Health PLC *(D) 12,179 —Ocado Group PLC * 1,150 26Pearson PLC 15,495 129Pentair PLC 1,382 101
Description SharesMarket Value
($ Thousands)
FOREIGN COMMON STOCK (continued)Persimmon PLC 1,027 $ 40Reckitt Benckiser Group PLC 405 35RELX PLC 3,034 99Rentokil Initial 12,011 95Rio Tinto PLC 815 54Rolls-Royce Holdings PLC * 19,553 33Royal Dutch Shell PLC, Cl B 25,464 560Sage Group PLC/The 12,410 143Severn Trent PLC 6,494 259Smith & Nephew PLC 7,784 136Smiths Group PLC 3,056 65Smurfit Kappa Group PLC 3,031 167Spirax-Sarco Engineering 249 54SSE PLC 8,543 191Tesco 17,126 67Trane Technologies PLC 641 129United Utilities Group PLC, Cl B 16,150 238Vodafone Group PLC 67,936 103Whitbread PLC * 1,095 44WPP PLC 8,141 123
7,911
Total Foreign Common Stock
(Cost $65,594) ($ Thousands) 79,161
COMMON STOCK — 2.4%
Communication Services — 0.2%Activision Blizzard Inc 2,968 197Alphabet Inc, Cl A * 115 333AT&T Inc 16,055 395Charter Communications Inc, Cl A * 355 231Comcast Corp, Cl A 4,650 234Discovery Inc, Cl A * 5,410 127DISH Network Corp, Cl A * 4,240 138Electronic Arts Inc 1,763 233Fox Corp 6,025 207Interpublic Group of Cos Inc/The 10,256 384Live Nation Entertainment Inc * 2,226 266Lumen Technologies Inc 27,586 346Meta Platforms Inc, Cl A * 839 282Netflix Inc * 350 211News Corp, Cl B 11,316 255Omnicom Group Inc 4,808 352Take-Two Interactive Software Inc, Cl A * 1,489 265T-Mobile US Inc * 2,385 277Twitter Inc * 3,286 142Verizon Communications Inc 10,486 545ViacomCBS Inc, Cl B 2,918 88

SEI Institutional Managed Trust / Quarterly Report / December 31, 202110
SCHEDULE OF INVESTMENTS (Unaudited)December 31, 2021
Multi-Asset Accumulation Fund (Continued)
Description SharesMarket Value
($ Thousands)
COMMON STOCK (continued)Walt Disney Co/The * 1,361 $ 211
5,719Consumer Discretionary — 0.2%
Advance Auto Parts Inc 554 133Amazon.com Inc, Cl A * 29 97AutoZone Inc * 63 132Bath & Body Works Inc 1,468 102Best Buy Co Inc 879 89Booking Holdings Inc * 33 79BorgWarner Inc 1,798 81CarMax Inc * 607 79Chipotle Mexican Grill Inc, Cl A * 60 105Darden Restaurants Inc 642 97Dollar General Corp 398 94Dollar Tree Inc * 910 128Domino's Pizza Inc 229 129DR Horton Inc 1,517 165eBay Inc 1,485 99Etsy Inc * 261 57Expedia Group Inc * 886 160Ford Motor Co 6,979 145Gap Inc/The 2,713 48General Motors Co * 1,328 78Hanesbrands Inc 5,402 90Hasbro Inc 959 98Hilton Worldwide Holdings Inc * 1,035 161Home Depot Inc/The 344 143Leggett & Platt Inc 1,806 74Lennar Corp, Cl A 714 83LKQ Corp 2,394 144Lowe's Cos Inc 368 95Marriott International Inc/MD, Cl A * 453 75McDonald's Corp 344 92MGM Resorts International 1,069 48Mohawk Industries Inc * 714 130Newell Brands Inc, Cl B 3,837 84NIKE Inc, Cl B 427 71O'Reilly Automotive Inc * 186 131PulteGroup Inc 1,206 69PVH Corp 953 102Ralph Lauren Corp, Cl A 665 79Ross Stores Inc 854 98Starbucks Corp 1,082 127Tapestry Inc 2,823 115Target Corp, Cl A 521 120Tesla Inc * 79 84TJX Cos Inc/The 1,474 112Tractor Supply Co 712 170Ulta Beauty Inc * 141 58Under Armour Inc, Cl A * 2,909 62VF Corp 958 70
Description SharesMarket Value
($ Thousands)
COMMON STOCK (continued)Whirlpool Corp 398 $ 93Wynn Resorts Ltd * 546 46Yum! Brands Inc 758 105
5,126Consumer Staples — 0.3%
Altria Group Inc 4,096 194Archer-Daniels-Midland Co 2,936 199Brown-Forman Corp, Cl B 2,289 167Campbell Soup Co 7,410 322Church & Dwight Co Inc 2,519 258Clorox Co/The 1,065 186Coca-Cola Co/The 3,032 180Colgate-Palmolive Co 3,689 315Conagra Brands Inc 7,947 271Constellation Brands Inc, Cl A 1,139 286Costco Wholesale Corp 479 272Estee Lauder Cos Inc/The, Cl A 852 315General Mills Inc 5,970 402Hershey Co/The 1,347 261Hormel Foods Corp 9,195 449J M Smucker Co/The 2,772 377Kellogg Co 4,858 313Kimberly-Clark Corp 2,081 297Kraft Heinz Co/The 4,956 178Kroger Co/The 6,207 281Lamb Weston Holdings Inc 2,378 151McCormick & Co Inc/MD 3,138 303Molson Coors Beverage Co, Cl B 3,119 145Mondelez International Inc, Cl A 3,684 244Monster Beverage Corp * 3,145 302PepsiCo Inc 1,095 190Philip Morris International Inc 2,561 243Procter & Gamble Co/The 2,075 339Sysco Corp, Cl A 2,272 178Tyson Foods Inc, Cl A 2,695 235Walgreens Boots Alliance Inc 4,466 233Walmart Inc 1,137 164
8,250Energy — 0.1%
APA Corp 4,561 123Baker Hughes Co, Cl A 6,778 163Chevron Corp 1,364 160ConocoPhillips 8,119 586Coterra Energy Inc 9,055 172Devon Energy Corp 6,537 288Diamondback Energy Inc, Cl A 2,478 267EOG Resources Inc 2,533 225Exxon Mobil Corp 6,272 384Hess Corp 3,016 223Kinder Morgan Inc 8,358 133Marathon Oil Corp 17,930 294

11SEI Institutional Managed Trust / Quarterly Report / December 31, 2021
SCHEDULE OF INVESTMENTS (Unaudited)December 31, 2021
Multi-Asset Accumulation Fund (Continued)
Description SharesMarket Value
($ Thousands)
COMMON STOCK (continued)Marathon Petroleum Corp 842 $ 54ONEOK Inc 2,048 120Phillips 66 2,119 153Pioneer Natural Resources Co 950 173Schlumberger NV, Cl A 6,517 195Valero Energy Corp 2,323 175Williams Cos Inc/The 6,562 171
4,059Financials — 0.2%
Allstate Corp/The 963 113American International Group Inc 273 16Ameriprise Financial Inc 518 156Arthur J Gallagher & Co 347 59Assurant Inc 976 152Bank of America Corp 1,088 48Bank of New York Mellon Corp/The 1,593 92BlackRock Inc 75 69Capital One Financial Corp 280 41Cboe Global Markets Inc 436 57Charles Schwab Corp/The 1,358 114Chubb Ltd 198 38Cincinnati Financial Corp 315 36Citizens Financial Group Inc 2,888 136Discover Financial Services 794 92Fifth Third Bancorp 3,964 173Franklin Resources Inc 2,773 93Globe Life Inc 870 82Goldman Sachs Group Inc/The 156 60Hartford Financial Services Group Inc/The 671 46Huntington Bancshares Inc/OH 2,954 46Intercontinental Exchange Inc 482 66Invesco Ltd 3,850 89JPMorgan Chase & Co 293 46KeyCorp 2,956 68Loews Corp 1,583 91M&T Bank Corp 598 92MarketAxess Holdings Inc 80 33Marsh & McLennan Cos Inc 634 110MetLife Inc 351 22Morgan Stanley 1,357 133MSCI Inc, Cl A 231 142Nasdaq Inc, Cl A 368 77Northern Trust Corp 370 44People's United Financial Inc 7,837 140PNC Financial Services Group Inc/The 607 122Principal Financial Group Inc, Cl A 1,498 108Progressive Corp/The 529 54Prudential Financial Inc 736 80Raymond James Financial Inc 1,773 178Regions Financial Corp 3,285 72State Street Corp 770 72
Description SharesMarket Value
($ Thousands)
COMMON STOCK (continued)SVB Financial Group, Cl B * 177 $ 120Synchrony Financial 2,695 125T Rowe Price Group Inc 327 64Travelers Cos Inc/The 101 16US Bancorp 2,336 131Wells Fargo & Co 1,682 81Willis Towers Watson PLC 490 116
4,211Health Care — 0.2%
Abbott Laboratories 798 112AbbVie Inc 968 131ABIOMED Inc * 280 101Agilent Technologies Inc 1,033 165Align Technology Inc * 126 83AmerisourceBergen Corp, Cl A 593 79Amgen Inc, Cl A 646 145Anthem Inc 269 125Baxter International Inc 1,597 137Becton Dickinson and Co 396 100Biogen Inc * 427 103Bio-Rad Laboratories Inc, Cl A * 142 107Boston Scientific Corp * 2,255 96Bristol-Myers Squibb Co 1,520 95Cardinal Health Inc 1,236 64Centene Corp * 1,160 96Cerner Corp 2,555 237Cigna Corp 365 84Cooper Cos Inc/The, Cl A 327 137CVS Health Corp 1,342 138Danaher Corp, Cl A 606 199DaVita Inc * 510 58DENTSPLY SIRONA Inc 1,707 95Dexcom Inc * 215 115Edwards Lifesciences Corp, Cl A * 1,150 149Eli Lilly & Co 431 119Gilead Sciences Inc 1,887 137HCA Healthcare Inc 406 104Henry Schein Inc * 950 74Hologic Inc * 1,195 91Humana Inc 212 98IDEXX Laboratories Inc * 187 123Illumina Inc * 236 90Incyte Corp * 1,159 85Intuitive Surgical Inc * 390 140Johnson & Johnson 1,720 294Laboratory Corp of America Holdings * 675 212McKesson Corp 787 196Merck & Co Inc 1,941 149Mettler-Toledo International Inc * 80 136Organon & Co 2,369 72PerkinElmer Inc 728 146

SEI Institutional Managed Trust / Quarterly Report / December 31, 202112
SCHEDULE OF INVESTMENTS (Unaudited)December 31, 2021
Multi-Asset Accumulation Fund (Continued)
Description SharesMarket Value
($ Thousands)
COMMON STOCK (continued)Pfizer Inc 2,320 $ 137Quest Diagnostics Inc 658 114Regeneron Pharmaceuticals Inc * 259 164ResMed Inc 487 127Stryker Corp 346 93Thermo Fisher Scientific Inc 120 80UnitedHealth Group Inc 200 100Universal Health Services Inc, Cl B 971 126Vertex Pharmaceuticals Inc * 617 135Viatris Inc, Cl W * 5,825 79Waters Corp * 259 97West Pharmaceutical Services Inc 276 129Zimmer Biomet Holdings Inc 639 81Zoetis Inc, Cl A 653 159
6,838Industrials — 0.2%
3M Co 411 73A O Smith Corp 980 84Alaska Air Group Inc * 840 44AMETEK Inc 926 136Canadian Pacific Railway 1,375 99Carrier Global Corp 916 50CH Robinson Worldwide Inc 978 105Cintas Corp 146 65Copart Inc * 726 110CSX Corp 2,961 111Cummins Inc 289 63Delta Air Lines Inc, Cl A * 1,126 44Dover Corp 565 103Emerson Electric Co 986 92Equifax Inc 349 102Expeditors International of Washington Inc 870 117Fastenal Co, Cl A 1,178 75Fortive Corp 1,754 134Fortune Brands Home & Security Inc 492 53General Dynamics Corp 849 177General Electric Co 646 61Honeywell International Inc 394 82Howmet Aerospace Inc 2,374 76Huntington Ingalls Industries Inc, Cl A 251 47IHS Markit Ltd 978 130Illinois Tool Works Inc 606 150Ingersoll Rand Inc 1,458 90Jacobs Engineering Group Inc 539 75JB Hunt Transport Services Inc 390 80L3Harris Technologies Inc 320 68Lockheed Martin Corp 186 66Masco Corp 1,288 90Nielsen Holdings PLC 2,219 46Norfolk Southern Corp 347 103Northrop Grumman Corp 381 147
Description SharesMarket Value
($ Thousands)
COMMON STOCK (continued)Otis Worldwide Corp 879 $ 77PACCAR Inc 956 84Parker-Hannifin Corp, Cl A 549 175Quanta Services Inc 797 91Raytheon Technologies Corp 905 78Robert Half International Inc 845 94Rockwell Automation Inc 289 101Rollins Inc 4,270 146Snap-on Inc 986 213Southwest Airlines Co, Cl A * 1,959 84Textron Inc 2,178 168TransDigm Group Inc * 128 81Union Pacific Corp 311 78United Parcel Service Inc, Cl B 363 78United Rentals Inc * 170 56Verisk Analytics Inc, Cl A 884 202Waste Management Inc 830 139Xylem Inc/NY 691 83
5,176Information Technology — 0.3%
Adobe Inc * 192 109Advanced Micro Devices Inc * 498 72Akamai Technologies Inc * 831 97Analog Devices Inc 376 66ANSYS Inc * 288 116Applied Materials Inc 1,164 183Arista Networks Inc * 1,288 185Autodesk Inc, Cl A * 232 65Automatic Data Processing Inc 354 87Broadcom Inc 192 128Cadence Design Systems Inc * 1,227 229Check Point Software Technologies Ltd * 1,215 142Cisco Systems Inc/Delaware 2,109 134Citrix Systems Inc 584 55Cognizant Technology Solutions Corp, Cl A 1,546 137Corning Inc, Cl B 2,864 107CyberArk Software Ltd * 1,251 217DXC Technology Co * 1,512 49F5 Inc, Cl A * 420 103Fidelity National Information Services
Inc, Cl B 799 87Fiserv Inc, Cl A * 790 82FleetCor Technologies Inc * 390 87Fortinet Inc * 468 168Gartner Inc * 1,003 335Global Payments Inc 436 59Hewlett Packard Enterprise Co 8,829 139HP Inc 2,363 89Intel Corp 1,628 84International Business Machines Corp 341 46Intuit Inc 357 230

13SEI Institutional Managed Trust / Quarterly Report / December 31, 2021
SCHEDULE OF INVESTMENTS (Unaudited)December 31, 2021
Multi-Asset Accumulation Fund (Continued)
Description SharesMarket Value
($ Thousands)
COMMON STOCK (continued)IPG Photonics Corp * 338 $ 58Jack Henry & Associates Inc 575 96Juniper Networks Inc 2,925 104Keysight Technologies Inc * 736 152KLA Corp 464 200Microchip Technology Inc 1,142 99Micron Technology Inc 831 77Microsoft Corp 768 258Motorola Solutions Inc 235 64NetApp Inc 725 67NortonLifeLock Inc 4,139 107NVIDIA Corp 456 134Oracle Corp, Cl B 2,724 238Paychex Inc 656 90Paycom Software Inc * 198 82Qorvo Inc * 628 98QUALCOMM Inc 570 104salesforce.com Inc * 252 64Seagate Technology Holdings PLC 1,509 170ServiceNow Inc * 159 103Skyworks Solutions Inc 656 102Synopsys Inc * 211 78Teledyne Technologies Inc * 176 77Texas Instruments Inc 282 53Tyler Technologies Inc * 247 133VeriSign Inc * 681 173Western Digital Corp * 1,138 74Western Union Co/The 3,204 57Xilinx Inc 654 139Zebra Technologies Corp, Cl A * 113 67
7,005Materials — 0.2%
Air Products and Chemicals Inc 580 176Albemarle Corp 1,075 251Avery Dennison Corp 1,153 250Ball Corp 1,736 167Celanese Corp, Cl A 628 106CF Industries Holdings Inc 3,811 270Corteva Inc 5,121 242Dow Inc 2,337 133DuPont de Nemours Inc 1,117 90Eastman Chemical Co 1,987 240Ecolab Inc 731 171FMC Corp 1,834 202Freeport-McMoRan Inc, Cl B 3,462 144International Flavors & Fragrances Inc 1,993 300International Paper Co 1,705 80LyondellBasell Industries NV, Cl A 1,153 106Martin Marietta Materials Inc, Cl A 696 307Mosaic Co/The 5,396 212Newmont Corp 4,763 295
Description SharesMarket Value
($ Thousands)
COMMON STOCK (continued)Nucor Corp 2,612 $ 298Packaging Corp of America 1,034 141PPG Industries Inc 1,382 238Sealed Air Corp 3,350 226Sherwin-Williams Co/The, Cl A 828 292Vulcan Materials Co 1,039 216Westrock Co 3,440 153
5,306Real Estate — 0.1%
Alexandria Real Estate Equities Inc ‡ 628 140American Tower Corp, Cl A ‡ 353 103Boston Properties Inc ‡ 379 44Crown Castle International Corp ‡ 437 91Digital Realty Trust Inc, Cl A ‡ 526 93Duke Realty Corp ‡ 2,124 139Equinix Inc ‡ 66 56Equity Residential ‡ 1,670 151Essex Property Trust Inc ‡ 198 70Extra Space Storage Inc ‡ 738 167Federal Realty Investment Trust ‡ 1,348 184Healthpeak Properties Inc ‡ 1,687 61Host Hotels & Resorts Inc *‡ 2,919 51Iron Mountain Inc ‡ 1,556 81Mid-America Apartment Communities Inc ‡ 1,107 254Prologis Inc ‡ 549 92Public Storage ‡ 325 122Realty Income Corp ‡ 2,310 165Regency Centers Corp ‡ 515 39SBA Communications Corp, Cl A ‡ 152 59Simon Property Group Inc ‡ 848 136UDR Inc ‡ 2,549 153Vornado Realty Trust ‡ 747 31Welltower Inc ‡ 476 41Weyerhaeuser Co ‡ 1,020 42
2,565Utilities — 0.4%
AES Corp/The 8,922 217Alliant Energy Corp 7,767 477Ameren Corp 5,646 503American Electric Power Co Inc 5,935 528American Water Works Co Inc 1,287 243Atmos Energy Corp 1,688 177CenterPoint Energy Inc 10,623 296CMS Energy Corp 7,099 462Consolidated Edison Inc 7,733 660Dominion Energy Inc 7,520 591DTE Energy Co 2,191 262Duke Energy Corp 3,471 364Edison International 5,332 364Entergy Corp 2,469 278Evergy Inc 5,347 367

SEI Institutional Managed Trust / Quarterly Report / December 31, 202114
SCHEDULE OF INVESTMENTS (Unaudited)December 31, 2021
Multi-Asset Accumulation Fund (Continued)
Description SharesMarket Value
($ Thousands)
COMMON STOCK (continued)Eversource Energy 5,556 $ 505Exelon Corp 5,763 333FirstEnergy Corp 5,862 244NextEra Energy Inc 3,133 292NiSource Inc 15,120 417NRG Energy Inc 6,095 263Pinnacle West Capital Corp 3,525 249PPL Corp 9,644 290Public Service Enterprise Group Inc 5,156 344Sempra Energy 2,197 291Southern Co/The 5,517 378WEC Energy Group Inc 5,563 540Xcel Energy Inc 7,537 510
10,445
Total Common Stock
(Cost $36,107) ($ Thousands) 64,700
Face Amount (Thousands)
CORPORATE OBLIGATIONS — 1.3%Consumer Discretionary — 0.0%
Toyota Motor 3.419%, 07/20/2023 (B) $ 500 521
Toyota Motor Credit MTN 3.200%, 01/11/2027 (B) 750 8042.625%, 01/10/2023 (B) 375 383
University of Southern California 5.250%, 10/01/2111 (B) 100 160
1,868
Consumer Staples — 0.1%Colgate-Palmolive MTN
2.250%, 11/15/2022 (B) 1,250 1,268Procter & Gamble Co/The
2.150%, 08/11/2022 (B) 250 253
1,521
Energy — 0.1%Chevron
2.954%, 05/16/2026 (B) 1,000 1,059CNOOC Petroleum North America ULC
5.875%, 03/10/2035 (B) 100 123Equinor ASA
2.450%, 01/17/2023 (B) 1,250 1,272Shell International Finance BV
3.250%, 05/11/2025 (B) 250 266XTO Energy
6.750%, 08/01/2037 (B) 300 425
3,145
DescriptionFace Amount (Thousands)
Market Value ($ Thousands)
CORPORATE OBLIGATIONS (continued)Financials — 0.7%
Bank of Montreal MTN 2.550%, 11/06/2022 (B) $ 250 $ 254
Bank of Nova Scotia 2.700%, 03/07/2022 (B) 500 502
Berkshire Hathaway 3.400%, 01/31/2022 (B) 150 1502.750%, 03/15/2023 (B) 1,000 1,021
BlackRock 3.375%, 06/01/2022 (B) 500 506
Canadian Imperial Bank of Commerce 2.550%, 06/16/2022 (B) 500 505
CME Group 3.000%, 09/15/2022 (B) 100 1023.000%, 03/15/2025 (B) 1,000 1,050
FMS Wertmanagement 2.750%, 03/06/2023 (B) 375 3842.750%, 01/30/2024 (B) 375 3902.000%, 08/01/2022 (B) 875 884
Kreditanstalt fuer Wiederaufbau 2.875%, 04/03/2028 (B) 375 4062.625%, 02/28/2024 (B) 1,000 1,0392.500%, 11/20/2024 (B) 1,000 1,0422.125%, 03/07/2022 (B) 500 5012.125%, 06/15/2022 (B) 500 5042.125%, 01/17/2023 (B) 1,250 1,2712.000%, 09/29/2022 (B) 750 759
Landwirtschaftliche Rentenbank 2.500%, 11/15/2027 (B) 125 1322.375%, 06/10/2025 (B) 625 6512.000%, 01/13/2025 (B) 250 257
Landwirtschaftliche Rentenbank MTN 1.750%, 07/27/2026 (B) 1,125 1,144
National Australia Bank Ltd 3.000%, 01/20/2023 (B) 200 205
Oesterreichische Kontrollbank 3.125%, 11/07/2023 (B) 250 2612.625%, 01/31/2022 (B) 250 2511.625%, 09/17/2022 (B) 250 252
Oesterreichische Kontrollbank AG MTN 2.875%, 03/13/2023 (B) 500 513
Svensk Exportkredit MTN 2.000%, 08/30/2022 (B) 250 2521.625%, 11/14/2022 (B) 125 126
Svensk Exportkredit AB MTN 2.875%, 03/14/2023 (B) 1,000 1,027
Toronto-Dominion Bank MTN 3.500%, 07/19/2023 (B) 250 2603.250%, 03/11/2024 (B) 125 131
16,732

15SEI Institutional Managed Trust / Quarterly Report / December 31, 2021
SCHEDULE OF INVESTMENTS (Unaudited)December 31, 2021
Multi-Asset Accumulation Fund (Continued)
DescriptionFace Amount (Thousands)
Market Value ($ Thousands)
CORPORATE OBLIGATIONS (continued)Health Care — 0.1%
Johnson & Johnson 5.950%, 08/15/2037 (B) $ 300 $ 4343.375%, 12/05/2023 (B) 500 5252.450%, 03/01/2026 (B) 1,000 1,043
Novartis Capital 4.400%, 05/06/2044 (B) 250 320
2,322
Industrials — 0.0%3M Co MTN
5.700%, 03/15/2037 (B) 150 208GE Capital International Funding Unlimited
Co 4.418%, 11/15/2035 (B) 406 485
693
Information Technology — 0.2%Apple
3.000%, 02/09/2024 (B) 375 3912.850%, 02/23/2023 (B) 1,000 1,0212.850%, 05/11/2024 (B) 250 2602.500%, 02/09/2022 (B) 500 5002.450%, 08/04/2026 (B) 375 3922.400%, 05/03/2023 (B) 250 256
Microsoft 3.700%, 08/08/2046 (B) 500 5963.300%, 02/06/2027 (B) 1,000 1,0902.125%, 11/15/2022 (B) 500 508
Visa 4.150%, 12/14/2035 (B) 125 1503.150%, 12/14/2025 (B) 500 5342.800%, 12/14/2022 (B) 125 1272.150%, 09/15/2022 (B) 125 126
5,951
Utilities — 0.1%Duke Energy Carolinas LLC
2.950%, 12/01/2026 (B) 1,000 1,055Florida Power & Light Co
3.125%, 12/01/2025 (B) 1,000 1,057Southern California Gas
5.125%, 11/15/2040 (B) 150 1943.750%, 09/15/2042 (B) 250 276
2,582
Total Corporate Obligations
(Cost $33,700) ($ Thousands) 34,814
Description SharesMarket Value
($ Thousands)
EXCHANGE TRADED FUND — 0.6%
iShares iBoxx $ Investment Grade Corporate Bond ETF 130,327 $ 17,271
Total Exchange Traded Fund
(Cost $14,921) ($ Thousands) 17,271
PREFERRED STOCK — 0.0%
Health Care — 0.0%Sartorius AG (E) 306 207
Materials — 0.0%Fuchs Petrolub (E) 1,520 69
Total Preferred Stock
(Cost $201) ($ Thousands) 276
Total Investments in Securities — 69.3%(Cost $1,782,781) ($ Thousands) $ 1,885,453

SEI Institutional Managed Trust / Quarterly Report / December 31, 202116
SCHEDULE OF INVESTMENTS (Unaudited)December 31, 2021
Multi-Asset Accumulation Fund (Continued)
A list of the open futures contracts held by the Fund at December 31, 2021, is as follows:
Type of ContractNumber of Contracts
Expiration Date
Notional Amount (Thousands) Value (Thousands)
Unrealized Appreciation/ (Depreciation) (Thousands)
Long ContractsAmsterdam Index 56 Jan-2022 $ 9,818 $ 10,160 $ 255Australian 10-Year Bond 1,861 Mar-2022 185,674 188,299 (225)Bloomberg Commodity Index^ 3,709 Mar-2022 36,092 36,782 691Brent Crude^ 422 Mar-2022 30,705 32,642 1,937Brent Crude^ 167 Feb-2022 13,138 12,989 (149)CAC40 10 Euro Index 192 Jan-2022 15,267 15,596 235Canadian 10-Year Bond 1,548 Mar-2022 170,566 174,782 3,282Coffee C^ 143 Mar-2022 11,329 12,125 795Copper^ 86 Apr-2022 9,408 9,597 189Corn^ 976 Mar-2022 27,927 28,951 1,024Cotton No. 2^ 165 Mar-2022 8,155 9,289 1,134DAX Index 42 Mar-2022 18,554 18,933 249Euro STOXX 50 800 Mar-2022 37,737 39,006 932Euro-Bob 955 Mar-2022 145,118 144,703 (1,159)Euro-BTP 423 Mar-2022 71,550 70,717 (1,287)Euro-Bund 699 Mar-2022 137,775 136,223 (2,439)Euro-Buxl 167 Mar-2022 41,022 39,263 (1,998)Euro-OAT 165 Mar-2022 30,891 30,613 (606)Euro-Schatz 344 Mar-2022 43,403 43,826 (42)Feeder Cattle^ 15 Jan-2022 1,184 1,252 67Feeder Cattle^ 87 Apr-2022 7,144 7,393 248FTSE 100 Index 352 Mar-2022 33,688 34,918 524FTSE MIB Index 98 Mar-2022 14,695 15,183 347FTSE Taiwan Index 139 Jan-2022 8,898 8,915 18FTSE/JSE Top 40 Index 271 Mar-2022 11,127 11,375 218Gasoline^ 58 Feb-2022 5,175 5,419 244Gasoline^ 101 Mar-2022 9,410 9,454 44Gold^ 266 Feb-2022 48,600 48,641 41Gold^ 27 Apr-2022 4,932 4,944 11Hang Seng China Enterprises Index 163 Jan-2022 8,549 8,642 91Hang Seng Index 94 Jan-2022 13,973 14,137 159IBEX 81 Jan-2022 7,620 7,999 311Japanese 10-Year Bond 246 Mar-2022 328,970 324,027 (783)Japanese 10-Year Government Bond E-MINI 2,353 Mar-2022 314,783 309,790 (922)KC HRW Wheat^ 49 Mar-2022 1,902 1,964 61KOSPI 200 Index 116 Mar-2022 9,594 9,618 87Lean Hogs^ 178 Feb-2022 5,668 5,801 133Lean Hogs^ 27 Apr-2022 943 937 (7)Live Cattle^ 81 Feb-2022 4,432 4,526 94Live Cattle^ 117 May-2022 6,597 6,778 181LME Copper^ 102 Mar-2022 24,378 24,815 437LME Lead^ 39 Mar-2022 2,190 2,256 66LME Nickel^ 116 Mar-2022 13,394 14,472 1,078LME Primary Aluminum^ 225 Mar-2022 15,327 15,795 468LME Zinc^ 226 Mar-2022 18,446 20,046 1,600Long Gilt 10-Year Bond 871 Apr-2022 146,251 147,347 (614)Low Sulphur Gasoil^ 208 Mar-2022 13,514 13,790 276Low Sulphur Gasoil^ 53 Feb-2022 3,578 3,531 (47)MSCI Emerging Markets 1,104 Mar-2022 68,448 67,692 (756)Natural Gas^ 401 Mar-2022 17,587 14,264 (3,323)Natural Gas^ 16 Jan-2022 795 597 (198)NY Harbor ULSD^ 61 Feb-2022 5,742 5,957 215NY Harbor ULSD^ 110 Mar-2022 10,426 10,665 239NYMEX Cocoa^ 418 Mar-2022 11,004 10,534 (470)

17SEI Institutional Managed Trust / Quarterly Report / December 31, 2021
SCHEDULE OF INVESTMENTS (Unaudited)December 31, 2021
Multi-Asset Accumulation Fund (Continued)
Type of ContractNumber of Contracts
Expiration Date
Notional Amount (Thousands) Value (Thousands)
Unrealized Appreciation/ (Depreciation) (Thousands)
OMX Stockholm 30 304 Jan-2022 $ 7,685 $ 8,123 $ 362Russell 2000 Index E-MINI 1,437 Mar-2022 159,209 161,145 1,936S&P - Goldman Sachs Commodity Index^ 99 Jan-2022 13,344 13,901 557S&P 500 Index E-MINI 2,072 Mar-2022 484,364 492,981 8,617S&P Mid Cap 400 Index E-MINI 89 Mar-2022 24,599 25,256 656S&P TSX 60 Index 160 Mar-2022 31,601 32,450 525SGX Nifty 50 438 Jan-2022 15,035 15,277 242Silver^ 144 Apr-2022 17,617 16,813 (804)Soybean^ 132 Mar-2022 8,377 8,839 462Soybean Meal^ 342 Mar-2022 12,108 13,649 1,541Soybean Oil^ 132 Mar-2022 4,369 4,477 108SPI 200 Index 198 Mar-2022 25,788 26,441 179Sugar No. 11^ 850 Mar-2022 18,777 17,974 (803)TOPIX Index 349 Mar-2022 60,535 60,402 651U.S. 2-Year Treasury Note 904 Apr-2022 197,269 197,227 (41)U.S. 5-Year Treasury Note 4,252 Apr-2022 513,982 514,392 410U.S. 10-Year Treasury Note 6,637 Mar-2022 858,850 865,921 7,072U.S. Long Treasury Bond 1,220 Mar-2022 195,126 195,734 608U.S. Ultra Long Treasury Bond 184 Mar-2022 36,271 36,271 –Wheat^ 177 Mar-2022 6,906 6,821 (85)WTI Crude Oil^ 153 Mar-2022 11,129 11,457 327WTI Crude Oil^ 16 Jan-2022 1,143 1,203 61
$ 4,947,177 $ 4,974,724 $ 25,537
A list of the open forward foreign currency contracts held by the Fund at December 31, 2021 is as follows:
Counterparty Settlement DateCurrency to Deliver
(Thousands)Currency to Receive
(Thousands)
Unrealized Appreciation
(Depreciation) (Thousands)
BNP Paribas 01/28/22 CHF 4,600 USD 5,021 $ (32)
BNYMellon 01/28/22 AUD 5,100 USD 3,698 (10)
BNYMellon 01/28/22 CAD 8,100 USD 6,332 (81)
BNYMellon 01/28/22 HKD 44,200 USD 5,667 (3)
Brown Brothers Harriman 01/28/22 AUD 246 USD 178 (1)
Brown Brothers Harriman 01/28/22 EUR 146,300 USD 164,979 (1,474)
Citigroup 03/16/22 USD 652 CLP 564,650 4
Citigroup 03/16/22 USD 1,229 CLP 1,023,850 (39)
Citigroup 03/16/22 USD 2,311 HUF 767,000 40
Citigroup 03/16/22 USD 2,458 PLN 10,050 23
Citigroup 03/16/22 USD 9,206 CZK 207,050 205
Citigroup 03/16/22 USD 11,922 BRL 68,400 136
Citigroup 03/16/22 CNH 15,300 USD 2,379 (15)
Citigroup 03/16/22 BRL 15,550 USD 2,678 (62)
Citigroup 03/16/22 USD 17,013 CNH 109,450 118
Citigroup 03/16/22 USD 17,416 EUR 15,402 124
Citigroup 03/16/22 USD 9,865 RUB 754,706 65
Citigroup 03/16/22 USD 8,595 RUB 645,544 (102)
Citigroup 03/16/22 USD 6,127 ZAR 99,956 73
Citigroup 03/16/22 USD 14,728 ZAR 235,994 (89)
Citigroup 03/16/22 USD 23,121 KRW 27,411,900 (129)
Citigroup 03/16/22 CZK 23,200 USD 1,014 (41)
Citigroup 03/16/22 GBP 23,245 USD 31,052 (416)
Citigroup 03/16/22 USD 29,720 MXN 640,000 1,159
Citigroup 03/16/22 USD 766 MXN 15,800 (4)

SEI Institutional Managed Trust / Quarterly Report / December 31, 202118
SCHEDULE OF INVESTMENTS (Unaudited)December 31, 2021
Multi-Asset Accumulation Fund (Continued)
Counterparty Settlement DateCurrency to Deliver
(Thousands)Currency to Receive
(Thousands)
Unrealized Appreciation
(Depreciation) (Thousands)
Citigroup 03/16/22 USD 29,306 INR 2,215,150 $ 183
Citigroup 03/16/22 USD 1,966 INR 147,300 (5)
Citigroup 03/16/22 ZAR 44,250 USD 2,757 13
Citigroup 03/16/22 ZAR 27,850 USD 1,700 (28)
Citigroup 03/16/22 EUR 122,089 USD 138,110 (927)
Citigroup 03/16/22 MXN 152,150 USD 7,016 (325)
Citigroup 03/16/22 RUB 157,250 USD 2,103 34
Citigroup 03/16/22 RUB 271,250 USD 3,547 (22)
Citigroup 03/16/22 HUF 527,300 USD 1,596 (20)
Citigroup 03/16/22 INR 761,250 USD 10,007 (127)
Citigroup 03/16/22 KRW 4,078,550 USD 3,425 4
Citigroup 03/16/22 KRW 1,835,200 USD 1,536 (3)
JPMorgan Chase Bank 03/16/22 USD 652 CLP 564,650 4
JPMorgan Chase Bank 03/16/22 USD 1,229 CLP 1,023,850 (40)
JPMorgan Chase Bank 03/16/22 USD 2,311 HUF 767,000 40
JPMorgan Chase Bank 03/16/22 USD 2,458 PLN 10,050 23
JPMorgan Chase Bank 03/16/22 USD 9,206 CZK 207,050 205
JPMorgan Chase Bank 03/16/22 USD 11,922 BRL 68,400 135
JPMorgan Chase Bank 03/16/22 USD 14,918 EUR 13,200 115
JPMorgan Chase Bank 03/16/22 CNH 15,300 USD 2,379 (16)
JPMorgan Chase Bank 03/16/22 BRL 15,550 USD 2,678 (63)
JPMorgan Chase Bank 03/16/22 USD 17,013 CNH 109,450 118
JPMorgan Chase Bank 03/16/22 USD 9,865 RUB 754,706 64
JPMorgan Chase Bank 03/16/22 USD 8,595 RUB 645,544 (102)
JPMorgan Chase Bank 03/16/22 USD 6,127 ZAR 99,956 73
JPMorgan Chase Bank 03/16/22 USD 14,728 ZAR 235,994 (90)
JPMorgan Chase Bank 03/16/22 GBP 23,099 USD 30,858 (411)
JPMorgan Chase Bank 03/16/22 USD 23,121 KRW 27,411,900 (129)
JPMorgan Chase Bank 03/16/22 CZK 23,200 USD 1,014 (41)
JPMorgan Chase Bank 03/16/22 USD 29,720 MXN 640,000 1,158
JPMorgan Chase Bank 03/16/22 USD 766 MXN 15,800 (4)
JPMorgan Chase Bank 03/16/22 USD 29,306 INR 2,215,150 182
JPMorgan Chase Bank 03/16/22 USD 1,966 INR 147,300 (5)
JPMorgan Chase Bank 03/16/22 ZAR 44,250 USD 2,757 12
JPMorgan Chase Bank 03/16/22 ZAR 27,850 USD 1,700 (28)
JPMorgan Chase Bank 03/16/22 EUR 122,089 USD 138,110 (927)
JPMorgan Chase Bank 03/16/22 MXN 152,150 USD 7,016 (325)
JPMorgan Chase Bank 03/16/22 RUB 157,250 USD 2,103 34
JPMorgan Chase Bank 03/16/22 RUB 271,250 USD 3,547 (22)
JPMorgan Chase Bank 03/16/22 HUF 527,300 USD 1,596 (21)
JPMorgan Chase Bank 03/16/22 INR 761,250 USD 10,007 (127)
JPMorgan Chase Bank 03/16/22 KRW 4,078,550 USD 3,425 4
JPMorgan Chase Bank 03/16/22 KRW 1,835,200 USD 1,536 (4)
State Street 01/28/22 EUR 16,100 USD 18,232 (85)
State Street 01/28/22 GBP 99,800 USD 132,300 (2,839)
State Street 01/28/22 JPY 2,740,650 USD 23,882 73 $ (4,813)

19SEI Institutional Managed Trust / Quarterly Report / December 31, 2021
SCHEDULE OF INVESTMENTS (Unaudited)December 31, 2021
Multi-Asset Accumulation Fund (Continued)
A list of open OTC swap agreements held by the Fund at December 31, 2021, is as follows:
Total Return Swaps
CounterpartyReference Entity/
Obligation Fund Pays Fund ReceivesPayment
FrequencyTermination
Date Currency
Notional Amount ($ Thousands)
Value ($ Thousands)
Upfront Payments
($ Thousands)
Net Unrealized
Appreciation (Depreciation) ($ Thousands)
Bank of America Taiwan Index (TAIEX) NEGATIVE PRICE RETURN POSITIVE PRICE RETURN At Maturity 01/22/2022 TWD $ 4,586 $ 4,739 $ – $ 133 Bank of America Taiwan Index (TAIEX) NEGATIVE PRICE RETURN POSITIVE PRICE RETURN At Maturity 01/22/2022 TWD 8,922 9,214 – 254 Bank of America Taiwan Index (TAIEX) NEGATIVE PRICE RETURN POSITIVE PRICE RETURN At Maturity 01/22/2022 TWD 8,796 9,082 – 248 Bank of America SGX Nifty 50 NEGATIVE PRICE RETURN POSITIVE PRICE RETURN At Maturity 01/30/2022 USD 3,081 3,139 – 58
CitibankHang Seng China
Enterprises Index NEGATIVE PRICE RETURN POSITIVE PRICE RETURN At Maturity 01/31/2022 HKD 1,678 1,697 – 18
JPMorgan ChaseHang Seng China
Enterprises Index NEGATIVE PRICE RETURN POSITIVE PRICE RETURN At Maturity 01/31/2022 HKD 15,712 15,906 – 190
Bank of AmericaHang Seng China
Enterprises Index NEGATIVE PRICE RETURN POSITIVE PRICE RETURN At Maturity 01/31/2022 HKD 15,130 15,322 – 188 Bank of America Live Cattle^ NEGATIVE PRICE RETURN POSITIVE PRICE RETURN At Maturity 02/02/2022 USD 6,271 6,482 – 211 Bank of America Bovespa Index NEGATIVE PRICE RETURN POSITIVE PRICE RETURN At Maturity 02/19/2022 BRL 4,470 4,369 – (160 )
Bank of America Sugar^ NEGATIVE PRICE RETURN POSITIVE PRICE RETURN At Maturity 03/02/2022 USD 110 106 – (5 )
Citibank Sugar^ NEGATIVE PRICE RETURN POSITIVE PRICE RETURN At Maturity 03/02/2022 USD 23 21 – (1 )
Bank of America Cotton No. 2^ NEGATIVE PRICE RETURN POSITIVE PRICE RETURN At Maturity 03/12/2022 USD 1,162 1,239 – 77 JPMorgan Chase KOSPI Index NEGATIVE PRICE RETURN POSITIVE PRICE RETURN At Maturity 03/13/2022 KRW 14,524 14,593 – 165 Bank of America Soybean^ NEGATIVE PRICE RETURN POSITIVE PRICE RETURN At Maturity 03/17/2022 USD 6,498 7,165 – 667 Bank of America Soybean Meal^ NEGATIVE PRICE RETURN POSITIVE PRICE RETURN At Maturity 03/17/2022 USD 503 559 – 56 Bank of America Soybean Oil^ NEGATIVE PRICE RETURN POSITIVE PRICE RETURN At Maturity 03/17/2022 USD 3,725 3,901 – 175 Bank of America Soybean Oil^ NEGATIVE PRICE RETURN POSITIVE PRICE RETURN At Maturity 03/17/2022 USD 1,882 1,967 – 85 Bank of America Corn^ NEGATIVE PRICE RETURN POSITIVE PRICE RETURN At Maturity 03/17/2022 USD 8,009 8,187 – 178 Bank of America Swiss Market NEGATIVE PRICE RETURN POSITIVE PRICE RETURN At Maturity 03/21/2022 CHF 25,954 27,109 – 769 Bank of America Live Cattle^ NEGATIVE PRICE RETURN POSITIVE PRICE RETURN At Maturity 05/02/2022 USD 1,680 1,680 – –
$ 136,476 $ – $ 3,306 A list of open centrally cleared swap agreements held by the Fund at December 31, 2021, is as follows:
Interest Rate Swaps
Fund Pays Fund ReceivesPayment
Frequency Termination Date Currency
Notional Amount
(Thousands)Value
(Thousands)
Upfront Payments/
Receipts (Thousands)
Net Unrealized Appreciation
(Depreciation) (Thousands)
1.00% 3 MONTH USD - LIBOR Annually 09/21/2024 USD 374,000 $ (756) $ (431) $ (325)1.00% 3 MONTH USD - LIBOR Annually 06/15/2027 USD 118,500 (1,335) (678) (658)1.00% 1D USD SOFR Annually 06/15/2027 USD 140,175 (1,580) (1,842) 263
$ (3,671) $ (2,951) $ (720)
Percentages are based on Net Assets of $2,719,665 ($ Thousands).* Non-income producing security.‡ Real Estate Investment Trust.(A) Zero coupon security. The rate shown on the Schedule of Investments is the security's effective
yield at the time of purchase.(B) Security exempt from registration under Rule 144A of the Securities Act of 1933. These securities
may be resold in transactions exempt from registration normally to qualified institutions. On December 31, 2021, the value of these securities amounted to $96,206 ($ Thousands), representing 3.5% of the Net Assets of the Fund.
(C) Securities considered illiquid. The total value of such securities as of December 31, 2021 was $0 ($ Thousands) and represented 0.0% of the Net Assets of the Fund.
(D) No interest rate available.(E) There is currently no rate available.
^ Security, or a portion thereof, is held by the Accumulation Commodity Strategy Subsidiary, Ltd. as of December 31, 2021.

SEI Institutional Managed Trust / Quarterly Report / December 31, 202120
SCHEDULE OF INVESTMENTS (Unaudited)December 31, 2021
Multi-Asset Accumulation Fund (Concluded)
ADR — American Depositary ReceiptAUD — Australian DollarBRL — Brazilian RealCAD — Canadian DollarCHF — Swiss FrancCl — ClassCLP — Chilean PesoCNH — Chinese Yuan OffshoreCZK — Czech KorunaDAX — German Stock IndexETF — Exchange-Traded FundEUR — EuroFTSE— Financial Times Stock ExchangeGBP — British Pound SterlingHKD — Hong Kong DollarHRW— Hard Red WinterHUF — Hungarian ForintIBEX — Spanish Stock Exchange IndexINR — Indian RupeeJPY — Japanese YenJSE — Johannesburg Stock ExchangeKRW — Korean WonLIBOR— London Interbank Offered RateLLC — Limited Liability CompanyLME — London Metal ExchangeLtd. — LimitedMSCI — Morgan Stanley Capital InternationalMTN — Medium Term NoteMXN — Mexican PesoNYMEX — New York Mercantile ExchangeOMX — Offset Market ExchangeOTC — Over The CounterPLC — Public Limited CompanyPLN — Polish ZlotyREIT — Real Estate investment TrustRUB — Russian RubleS&P— Standard & Poor'sSOFR30A — Secured Overnight Financing Rate 30-day AverageSPI — Share Price IndexTOPIX- Tokyo Price IndexTSX — Toronto Stock ExchangeTWD— Taiwan DollarULC — Unlimited Liability CompanyULSD — Ultra-Low Sulfur DieselUSD — U.S. DollarWTI — West Texas IntermediateZAR — South African Rand
The following is a list of the level of inputs used as of December 31, 2021, in valuing the Fund’s investments and other financial instruments carried at value ($ Thousands):
Investments in SecuritiesLevel 1
($)Level 2
($)Level 3
($)Total
($)U.S. Treasury Obligations – 1,189,574 – 1,189,574Sovereign Debt – 499,657 – 499,657Foreign Common Stock 79,064 97 – 79,161Common Stock 64,700 – – 64,700Corporate Obligations – 34,814 – 34,814Exchange Traded Fund 17,271 – – 17,271Preferred Stock 207 69 – 276
Total Investments in Securities 161,242 1,724,211 – 1,885,453
Other Financial InstrumentsLevel 1
($)Level 2
($)Level 3
($)Total
($)Futures Contracts*
Unrealized Appreciation 42,295 – – 42,295Unrealized Depreciation (16,758) – – (16,758)
Forwards Contracts*Unrealized Appreciation – 4,421 – 4,421Unrealized Depreciation – (9,234) – (9,234)
OTC SwapsTotal Return Swaps*
Unrealized Appreciation – 3,472 – 3,472Unrealized Depreciation – (166) – (166)
Centrally Cleared SwapsInterest Rate Swaps*
Unrealized Appreciation – 263 – 263Unrealized Depreciation – (983) – (983)
Total Other Financial Instruments 25,537 (2,227) – 23,310
*Futures contracts, forward contracts and swaps contracts are valued at the unrealized appreciation (depreciation) on the instrument.
For the period ended December 31, 2021, there were no transfers in or out of Level 3.
Amounts designated as “—” are $0 or have been rounded to $0.
For information regarding the Fund's policy regarding valuation of investments and other significant accounting policies, please refer to the Fund's most recent semi-annual and annual financial statements.
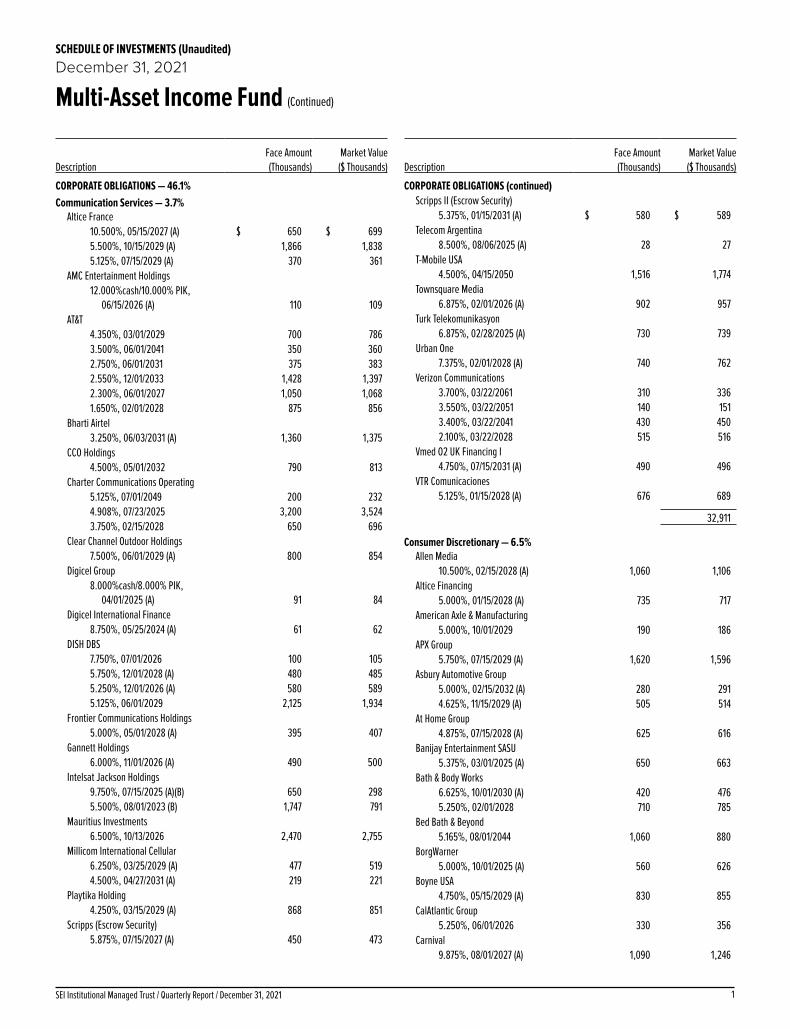
1SEI Institutional Managed Trust / Quarterly Report / December 31, 2021
SCHEDULE OF INVESTMENTS (Unaudited)December 31, 2021
Multi-Asset Income Fund (Continued)
DescriptionFace Amount (Thousands)
Market Value ($ Thousands)
CORPORATE OBLIGATIONS — 46.1%Communication Services — 3.7%
Altice France 10.500%, 05/15/2027 (A) $ 650 $ 6995.500%, 10/15/2029 (A) 1,866 1,8385.125%, 07/15/2029 (A) 370 361
AMC Entertainment Holdings 12.000%cash/10.000% PIK,
06/15/2026 (A) 110 109AT&T
4.350%, 03/01/2029 700 7863.500%, 06/01/2041 350 3602.750%, 06/01/2031 375 3832.550%, 12/01/2033 1,428 1,3972.300%, 06/01/2027 1,050 1,0681.650%, 02/01/2028 875 856
Bharti Airtel 3.250%, 06/03/2031 (A) 1,360 1,375
CCO Holdings 4.500%, 05/01/2032 790 813
Charter Communications Operating 5.125%, 07/01/2049 200 2324.908%, 07/23/2025 3,200 3,5243.750%, 02/15/2028 650 696
Clear Channel Outdoor Holdings 7.500%, 06/01/2029 (A) 800 854
Digicel Group 8.000%cash/8.000% PIK,
04/01/2025 (A) 91 84Digicel International Finance
8.750%, 05/25/2024 (A) 61 62DISH DBS
7.750%, 07/01/2026 100 1055.750%, 12/01/2028 (A) 480 4855.250%, 12/01/2026 (A) 580 5895.125%, 06/01/2029 2,125 1,934
Frontier Communications Holdings 5.000%, 05/01/2028 (A) 395 407
Gannett Holdings 6.000%, 11/01/2026 (A) 490 500
Intelsat Jackson Holdings 9.750%, 07/15/2025 (A)(B) 650 2985.500%, 08/01/2023 (B) 1,747 791
Mauritius Investments 6.500%, 10/13/2026 2,470 2,755
Millicom International Cellular 6.250%, 03/25/2029 (A) 477 5194.500%, 04/27/2031 (A) 219 221
Playtika Holding 4.250%, 03/15/2029 (A) 868 851
Scripps (Escrow Security) 5.875%, 07/15/2027 (A) 450 473
DescriptionFace Amount (Thousands)
Market Value ($ Thousands)
CORPORATE OBLIGATIONS (continued)Scripps II (Escrow Security)
5.375%, 01/15/2031 (A) $ 580 $ 589Telecom Argentina
8.500%, 08/06/2025 (A) 28 27T-Mobile USA
4.500%, 04/15/2050 1,516 1,774Townsquare Media
6.875%, 02/01/2026 (A) 902 957Turk Telekomunikasyon
6.875%, 02/28/2025 (A) 730 739Urban One
7.375%, 02/01/2028 (A) 740 762Verizon Communications
3.700%, 03/22/2061 310 3363.550%, 03/22/2051 140 1513.400%, 03/22/2041 430 4502.100%, 03/22/2028 515 516
Vmed O2 UK Financing I 4.750%, 07/15/2031 (A) 490 496
VTR Comunicaciones 5.125%, 01/15/2028 (A) 676 689
32,911
Consumer Discretionary — 6.5%Allen Media
10.500%, 02/15/2028 (A) 1,060 1,106Altice Financing
5.000%, 01/15/2028 (A) 735 717American Axle & Manufacturing
5.000%, 10/01/2029 190 186APX Group
5.750%, 07/15/2029 (A) 1,620 1,596Asbury Automotive Group
5.000%, 02/15/2032 (A) 280 2914.625%, 11/15/2029 (A) 505 514
At Home Group 4.875%, 07/15/2028 (A) 625 616
Banijay Entertainment SASU 5.375%, 03/01/2025 (A) 650 663
Bath & Body Works 6.625%, 10/01/2030 (A) 420 4765.250%, 02/01/2028 710 785
Bed Bath & Beyond 5.165%, 08/01/2044 1,060 880
BorgWarner 5.000%, 10/01/2025 (A) 560 626
Boyne USA 4.750%, 05/15/2029 (A) 830 855
CalAtlantic Group 5.250%, 06/01/2026 330 356
Carnival 9.875%, 08/01/2027 (A) 1,090 1,246
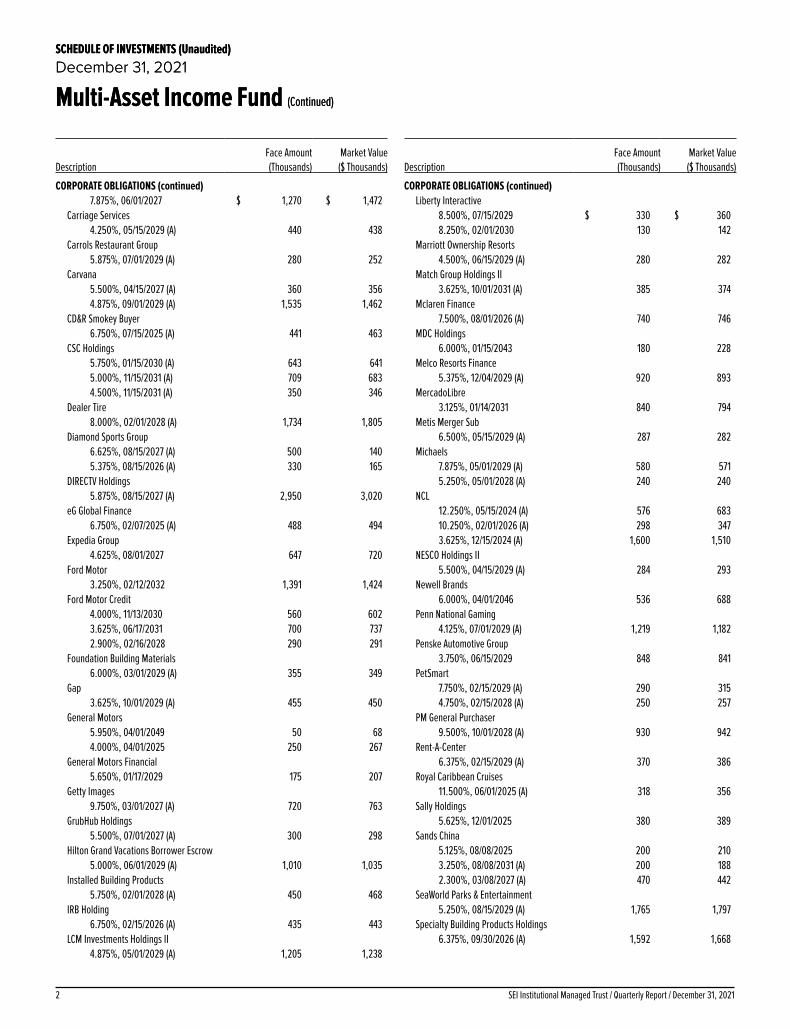
SEI Institutional Managed Trust / Quarterly Report / December 31, 20212
SCHEDULE OF INVESTMENTS (Unaudited)December 31, 2021
Multi-Asset Income Fund (Continued)
SCHEDULE OF INVESTMENTS (Unaudited)December 31, 2021
Multi-Asset Income Fund (Continued)
DescriptionFace Amount (Thousands)
Market Value ($ Thousands)
CORPORATE OBLIGATIONS (continued)7.875%, 06/01/2027 $ 1,270 $ 1,472
Carriage Services 4.250%, 05/15/2029 (A) 440 438
Carrols Restaurant Group 5.875%, 07/01/2029 (A) 280 252
Carvana 5.500%, 04/15/2027 (A) 360 3564.875%, 09/01/2029 (A) 1,535 1,462
CD&R Smokey Buyer 6.750%, 07/15/2025 (A) 441 463
CSC Holdings 5.750%, 01/15/2030 (A) 643 6415.000%, 11/15/2031 (A) 709 6834.500%, 11/15/2031 (A) 350 346
Dealer Tire 8.000%, 02/01/2028 (A) 1,734 1,805
Diamond Sports Group 6.625%, 08/15/2027 (A) 500 1405.375%, 08/15/2026 (A) 330 165
DIRECTV Holdings 5.875%, 08/15/2027 (A) 2,950 3,020
eG Global Finance 6.750%, 02/07/2025 (A) 488 494
Expedia Group 4.625%, 08/01/2027 647 720
Ford Motor 3.250%, 02/12/2032 1,391 1,424
Ford Motor Credit 4.000%, 11/13/2030 560 6023.625%, 06/17/2031 700 7372.900%, 02/16/2028 290 291
Foundation Building Materials 6.000%, 03/01/2029 (A) 355 349
Gap 3.625%, 10/01/2029 (A) 455 450
General Motors 5.950%, 04/01/2049 50 684.000%, 04/01/2025 250 267
General Motors Financial 5.650%, 01/17/2029 175 207
Getty Images 9.750%, 03/01/2027 (A) 720 763
GrubHub Holdings 5.500%, 07/01/2027 (A) 300 298
Hilton Grand Vacations Borrower Escrow 5.000%, 06/01/2029 (A) 1,010 1,035
Installed Building Products 5.750%, 02/01/2028 (A) 450 468
IRB Holding 6.750%, 02/15/2026 (A) 435 443
LCM Investments Holdings II 4.875%, 05/01/2029 (A) 1,205 1,238
DescriptionFace Amount (Thousands)
Market Value ($ Thousands)
CORPORATE OBLIGATIONS (continued)Liberty Interactive
8.500%, 07/15/2029 $ 330 $ 3608.250%, 02/01/2030 130 142
Marriott Ownership Resorts 4.500%, 06/15/2029 (A) 280 282
Match Group Holdings II 3.625%, 10/01/2031 (A) 385 374
Mclaren Finance 7.500%, 08/01/2026 (A) 740 746
MDC Holdings 6.000%, 01/15/2043 180 228
Melco Resorts Finance 5.375%, 12/04/2029 (A) 920 893
MercadoLibre 3.125%, 01/14/2031 840 794
Metis Merger Sub 6.500%, 05/15/2029 (A) 287 282
Michaels 7.875%, 05/01/2029 (A) 580 5715.250%, 05/01/2028 (A) 240 240
NCL 12.250%, 05/15/2024 (A) 576 68310.250%, 02/01/2026 (A) 298 3473.625%, 12/15/2024 (A) 1,600 1,510
NESCO Holdings II 5.500%, 04/15/2029 (A) 284 293
Newell Brands 6.000%, 04/01/2046 536 688
Penn National Gaming 4.125%, 07/01/2029 (A) 1,219 1,182
Penske Automotive Group 3.750%, 06/15/2029 848 841
PetSmart 7.750%, 02/15/2029 (A) 290 3154.750%, 02/15/2028 (A) 250 257
PM General Purchaser 9.500%, 10/01/2028 (A) 930 942
Rent-A-Center 6.375%, 02/15/2029 (A) 370 386
Royal Caribbean Cruises 11.500%, 06/01/2025 (A) 318 356
Sally Holdings 5.625%, 12/01/2025 380 389
Sands China 5.125%, 08/08/2025 200 2103.250%, 08/08/2031 (A) 200 1882.300%, 03/08/2027 (A) 470 442
SeaWorld Parks & Entertainment 5.250%, 08/15/2029 (A) 1,765 1,797
Specialty Building Products Holdings 6.375%, 09/30/2026 (A) 1,592 1,668
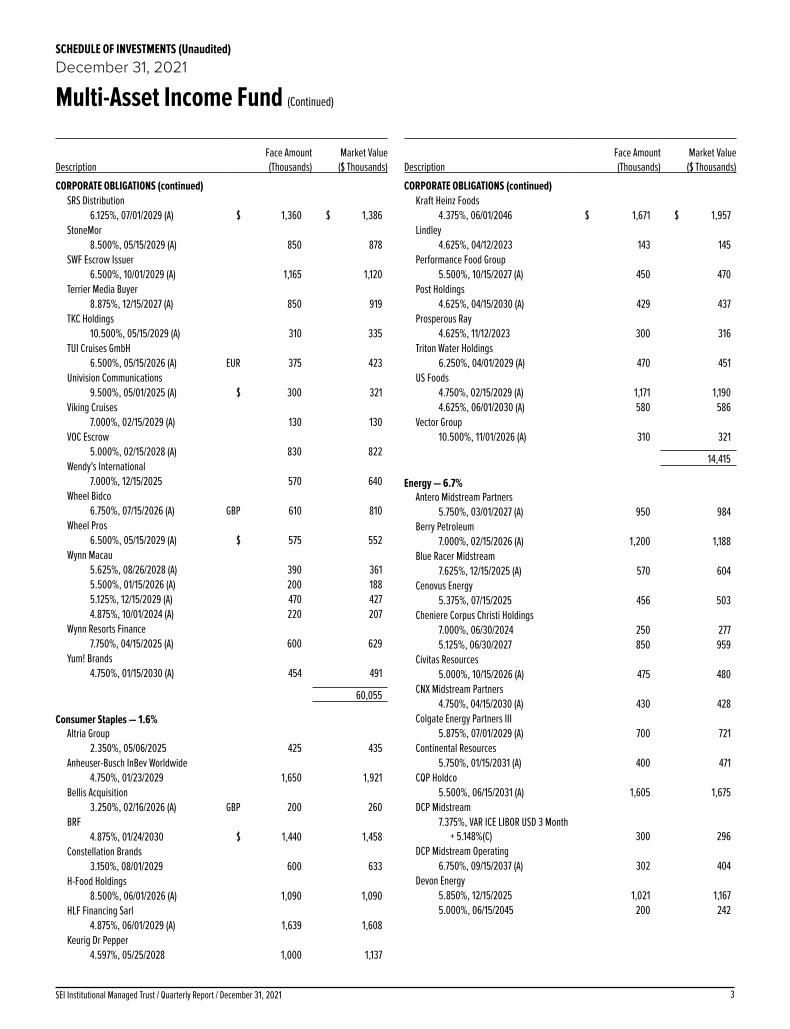
3SEI Institutional Managed Trust / Quarterly Report / December 31, 2021
SCHEDULE OF INVESTMENTS (Unaudited)December 31, 2021
Multi-Asset Income Fund (Continued)
DescriptionFace Amount (Thousands)
Market Value ($ Thousands)
CORPORATE OBLIGATIONS (continued)SRS Distribution
6.125%, 07/01/2029 (A) $ 1,360 $ 1,386StoneMor
8.500%, 05/15/2029 (A) 850 878SWF Escrow Issuer
6.500%, 10/01/2029 (A) 1,165 1,120Terrier Media Buyer
8.875%, 12/15/2027 (A) 850 919TKC Holdings
10.500%, 05/15/2029 (A) 310 335TUI Cruises GmbH
6.500%, 05/15/2026 (A) EUR 375 423Univision Communications
9.500%, 05/01/2025 (A) $ 300 321Viking Cruises
7.000%, 02/15/2029 (A) 130 130VOC Escrow
5.000%, 02/15/2028 (A) 830 822Wendy's International
7.000%, 12/15/2025 570 640Wheel Bidco
6.750%, 07/15/2026 (A) GBP 610 810Wheel Pros
6.500%, 05/15/2029 (A) $ 575 552Wynn Macau
5.625%, 08/26/2028 (A) 390 3615.500%, 01/15/2026 (A) 200 1885.125%, 12/15/2029 (A) 470 4274.875%, 10/01/2024 (A) 220 207
Wynn Resorts Finance 7.750%, 04/15/2025 (A) 600 629
Yum! Brands 4.750%, 01/15/2030 (A) 454 491
60,055
Consumer Staples — 1.6%Altria Group
2.350%, 05/06/2025 425 435Anheuser-Busch InBev Worldwide
4.750%, 01/23/2029 1,650 1,921Bellis Acquisition
3.250%, 02/16/2026 (A) GBP 200 260BRF
4.875%, 01/24/2030 $ 1,440 1,458Constellation Brands
3.150%, 08/01/2029 600 633H-Food Holdings
8.500%, 06/01/2026 (A) 1,090 1,090HLF Financing Sarl
4.875%, 06/01/2029 (A) 1,639 1,608Keurig Dr Pepper
4.597%, 05/25/2028 1,000 1,137
DescriptionFace Amount (Thousands)
Market Value ($ Thousands)
CORPORATE OBLIGATIONS (continued)Kraft Heinz Foods
4.375%, 06/01/2046 $ 1,671 $ 1,957Lindley
4.625%, 04/12/2023 143 145Performance Food Group
5.500%, 10/15/2027 (A) 450 470Post Holdings
4.625%, 04/15/2030 (A) 429 437Prosperous Ray
4.625%, 11/12/2023 300 316Triton Water Holdings
6.250%, 04/01/2029 (A) 470 451US Foods
4.750%, 02/15/2029 (A) 1,171 1,1904.625%, 06/01/2030 (A) 580 586
Vector Group 10.500%, 11/01/2026 (A) 310 321
14,415
Energy — 6.7%Antero Midstream Partners
5.750%, 03/01/2027 (A) 950 984Berry Petroleum
7.000%, 02/15/2026 (A) 1,200 1,188Blue Racer Midstream
7.625%, 12/15/2025 (A) 570 604Cenovus Energy
5.375%, 07/15/2025 456 503Cheniere Corpus Christi Holdings
7.000%, 06/30/2024 250 2775.125%, 06/30/2027 850 959
Civitas Resources 5.000%, 10/15/2026 (A) 475 480
CNX Midstream Partners 4.750%, 04/15/2030 (A) 430 428
Colgate Energy Partners III 5.875%, 07/01/2029 (A) 700 721
Continental Resources 5.750%, 01/15/2031 (A) 400 471
CQP Holdco 5.500%, 06/15/2031 (A) 1,605 1,675
DCP Midstream 7.375%, VAR ICE LIBOR USD 3 Month
+ 5.148%(C) 300 296DCP Midstream Operating
6.750%, 09/15/2037 (A) 302 404Devon Energy
5.850%, 12/15/2025 1,021 1,1675.000%, 06/15/2045 200 242
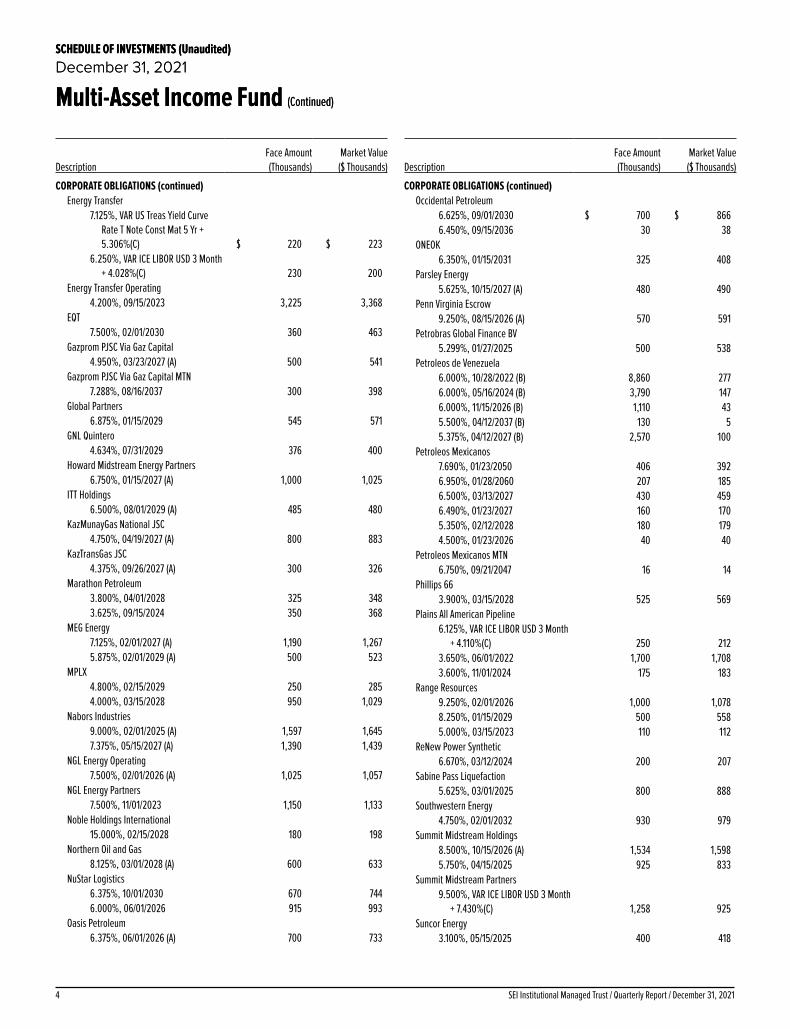
SEI Institutional Managed Trust / Quarterly Report / December 31, 20214
SCHEDULE OF INVESTMENTS (Unaudited)December 31, 2021
Multi-Asset Income Fund (Continued)
SCHEDULE OF INVESTMENTS (Unaudited)December 31, 2021
Multi-Asset Income Fund (Continued)
DescriptionFace Amount (Thousands)
Market Value ($ Thousands)
CORPORATE OBLIGATIONS (continued)Energy Transfer
7.125%, VAR US Treas Yield Curve Rate T Note Const Mat 5 Yr + 5.306%(C) $ 220 $ 223
6.250%, VAR ICE LIBOR USD 3 Month + 4.028%(C) 230 200
Energy Transfer Operating 4.200%, 09/15/2023 3,225 3,368
EQT 7.500%, 02/01/2030 360 463
Gazprom PJSC Via Gaz Capital 4.950%, 03/23/2027 (A) 500 541
Gazprom PJSC Via Gaz Capital MTN 7.288%, 08/16/2037 300 398
Global Partners 6.875%, 01/15/2029 545 571
GNL Quintero 4.634%, 07/31/2029 376 400
Howard Midstream Energy Partners 6.750%, 01/15/2027 (A) 1,000 1,025
ITT Holdings 6.500%, 08/01/2029 (A) 485 480
KazMunayGas National JSC 4.750%, 04/19/2027 (A) 800 883
KazTransGas JSC 4.375%, 09/26/2027 (A) 300 326
Marathon Petroleum 3.800%, 04/01/2028 325 3483.625%, 09/15/2024 350 368
MEG Energy 7.125%, 02/01/2027 (A) 1,190 1,2675.875%, 02/01/2029 (A) 500 523
MPLX 4.800%, 02/15/2029 250 2854.000%, 03/15/2028 950 1,029
Nabors Industries 9.000%, 02/01/2025 (A) 1,597 1,6457.375%, 05/15/2027 (A) 1,390 1,439
NGL Energy Operating 7.500%, 02/01/2026 (A) 1,025 1,057
NGL Energy Partners 7.500%, 11/01/2023 1,150 1,133
Noble Holdings International 15.000%, 02/15/2028 180 198
Northern Oil and Gas 8.125%, 03/01/2028 (A) 600 633
NuStar Logistics 6.375%, 10/01/2030 670 7446.000%, 06/01/2026 915 993
Oasis Petroleum 6.375%, 06/01/2026 (A) 700 733
DescriptionFace Amount (Thousands)
Market Value ($ Thousands)
CORPORATE OBLIGATIONS (continued)Occidental Petroleum
6.625%, 09/01/2030 $ 700 $ 8666.450%, 09/15/2036 30 38
ONEOK 6.350%, 01/15/2031 325 408
Parsley Energy 5.625%, 10/15/2027 (A) 480 490
Penn Virginia Escrow 9.250%, 08/15/2026 (A) 570 591
Petrobras Global Finance BV 5.299%, 01/27/2025 500 538
Petroleos de Venezuela 6.000%, 10/28/2022 (B) 8,860 2776.000%, 05/16/2024 (B) 3,790 1476.000%, 11/15/2026 (B) 1,110 435.500%, 04/12/2037 (B) 130 55.375%, 04/12/2027 (B) 2,570 100
Petroleos Mexicanos 7.690%, 01/23/2050 406 3926.950%, 01/28/2060 207 1856.500%, 03/13/2027 430 4596.490%, 01/23/2027 160 1705.350%, 02/12/2028 180 1794.500%, 01/23/2026 40 40
Petroleos Mexicanos MTN 6.750%, 09/21/2047 16 14
Phillips 66 3.900%, 03/15/2028 525 569
Plains All American Pipeline 6.125%, VAR ICE LIBOR USD 3 Month
+ 4.110%(C) 250 2123.650%, 06/01/2022 1,700 1,7083.600%, 11/01/2024 175 183
Range Resources 9.250%, 02/01/2026 1,000 1,0788.250%, 01/15/2029 500 5585.000%, 03/15/2023 110 112
ReNew Power Synthetic 6.670%, 03/12/2024 200 207
Sabine Pass Liquefaction 5.625%, 03/01/2025 800 888
Southwestern Energy 4.750%, 02/01/2032 930 979
Summit Midstream Holdings 8.500%, 10/15/2026 (A) 1,534 1,5985.750%, 04/15/2025 925 833
Summit Midstream Partners 9.500%, VAR ICE LIBOR USD 3 Month
+ 7.430%(C) 1,258 925Suncor Energy
3.100%, 05/15/2025 400 418

5SEI Institutional Managed Trust / Quarterly Report / December 31, 2021
SCHEDULE OF INVESTMENTS (Unaudited)December 31, 2021
Multi-Asset Income Fund (Continued)
DescriptionFace Amount (Thousands)
Market Value ($ Thousands)
CORPORATE OBLIGATIONS (continued)Tallgrass Energy Partners
6.000%, 12/31/2030 (A) $ 230 $ 230TechnipFMC
6.500%, 02/01/2026 (A) 846 906Total Capital International
2.829%, 01/10/2030 1,350 1,414Transocean
11.500%, 01/30/2027 (A) 3,565 3,4947.500%, 01/15/2026 (A) 500 373
Transocean Poseidon 6.875%, 02/01/2027 (A) 470 454
Transportadora de Gas del Sur 6.750%, 05/02/2025 (A) 1,250 1,147
USA Compression Partners 6.875%, 04/01/2026 1,175 1,222
Valero Energy 2.850%, 04/15/2025 350 363
Venture Global Calcasieu Pass 4.125%, 08/15/2031 (A) 390 4133.875%, 11/01/2033 (A) 430 452
Viper Energy Partners 5.375%, 11/01/2027 (A) 500 516
Western Midstream Operating 5.450%, 04/01/2044 1,100 1,3155.300%, 03/01/2048 530 639
YPF 9.000%, 9.000%, 02/12/2023,
02/12/2023 (A)(D) 825 6588.500%, 07/28/2025 (A) 410 306
60,784
Financials — 10.6%ABN AMRO Bank
4.375%(C)(E) EUR 400 487Acrisure
6.000%, 08/01/2029 (A) $ 915 9044.250%, 02/15/2029 (A) 975 948
ADLER Real Estate 3.000%, 04/27/2026 EUR 1,100 1,148
AFC Gamma 5.750%, 05/01/2027 (A) $ 370 366
AIA Group 3.900%, 04/06/2028 (A) 475 524
AIA Group MTN 3.200%, 03/11/2025 (A) 425 444
AIB Group MTN 4.750%, 10/12/2023 (A) 550 582
Akbank T.A.S. 6.797%, VAR USD Swap Semi 30/360
5 Yr Curr + 4.029%, 04/27/2028 200 192Alliant Holdings Intermediate
6.750%, 10/15/2027 (A) 760 788
DescriptionFace Amount (Thousands)
Market Value ($ Thousands)
CORPORATE OBLIGATIONS (continued)Ally Financial
4.700%, VAR H15T7Y + 3.481%(C) $ 1,325 $ 1,366American International Group
4.200%, 04/01/2028 275 3073.900%, 04/01/2026 325 3523.400%, 06/30/2030 225 243
Apollo Commercial Real Estate Finance 4.625%, 06/15/2029 (A) 510 493
Aviation Capital Group 5.500%, 12/15/2024 (A) 390 4271.950%, 01/30/2026 (A) 350 341
Avolon Holdings Funding 5.125%, 10/01/2023 (A) 140 1474.250%, 04/15/2026 (A) 430 4562.875%, 02/15/2025 (A) 1,250 1,277
B3 - Brasil Bolsa Balcao 4.125%, 09/20/2031 (A) 700 675
Banco Bilbao Vizcaya Argentaria 5.875%, VAR EUR Swap Annual 5 Yr +
5.660%(C) EUR 800 965Banco de Bogota
6.250%, 05/12/2026 (A) $ 980 1,058Banco do Brasil
9.000%, VAR US Treas Yield Curve Rate T Note Const Mat 10 Yr + 6.362%(C) 200 213
6.250%, VAR US Treas Yield Curve Rate T Note Const Mat 10 Yr + 4.398%(C) 1,920 1,907
Banco Mercantil del Norte 7.625%, VAR US Treas Yield Curve
Rate T Note Const Mat 10 Yr + 5.353%(A)(C) 200 215
7.500%, VAR US Treas Yield Curve Rate T Note Const Mat 10 Yr + 5.470%(A)(C) 970 1,032
6.750%, VAR US Treas Yield Curve Rate T Note Const Mat 5 Yr + 4.967%(A)(C) 420 435
5.875%, VAR US Treas Yield Curve Rate T Note Const Mat 5 Yr + 4.643%(A)(C) 1,340 1,335
Banco Santander 4.250%, 04/11/2027 400 4403.306%, 06/27/2029 400 4232.749%, 12/03/2030 200 1962.746%, 05/28/2025 600 620
Bank of America 6.250%, VAR ICE LIBOR USD 3 Month
+ 3.705%(C) 150 1613.419%, VAR ICE LIBOR USD 3 Month
+ 1.040%, 12/20/2028 2,115 2,258

SEI Institutional Managed Trust / Quarterly Report / December 31, 20216
SCHEDULE OF INVESTMENTS (Unaudited)December 31, 2021
Multi-Asset Income Fund (Continued)
SCHEDULE OF INVESTMENTS (Unaudited)December 31, 2021
Multi-Asset Income Fund (Continued)
DescriptionFace Amount (Thousands)
Market Value ($ Thousands)
CORPORATE OBLIGATIONS (continued)Bank of America MTN
4.200%, 08/26/2024 $ 225 $ 2414.000%, 01/22/2025 1,350 1,4423.824%, VAR ICE LIBOR USD 3 Month
+ 1.575%, 01/20/2028 1,525 1,651Banque Centrale de Tunisie International
Bond 6.750%, 10/31/2023 (A) EUR 440 416
Banque Ouest Africaine de Developpement 2.750%, 01/22/2033 (A) 1,870 2,233
Barclays 8.000%, VAR US Treas Yield Curve
Rate T Note Const Mat 5 Yr + 5.672%(C) $ 970 1,072
7.125%, VAR UK Govt Bonds 5 Year Note Generic Bid Yield + 6.579%(C) GBP 700 1,043
2.852%, VAR United States Secured Overnight Financing Rate + 2.714%, 05/07/2026 $ 725 748
BBVA Bancomer 5.125%, VAR US Treas Yield Curve
Rate T Note Const Mat 5 Yr + 2.650%, 01/18/2033 (A) 410 420
BNP Paribas 3.375%, 01/09/2025 (A) 1,000 1,0501.323%, VAR United States Secured
Overnight Financing Rate + 1.004%, 01/13/2027 (A) 675 657
BPCE 4.625%, 09/12/2028 (A) 500 5692.277%, VAR United States Secured
Overnight Financing Rate + 1.312%, 01/20/2032 (A) 375 361
BroadStreet Partners 5.875%, 04/15/2029 (A) 1,195 1,174
Citigroup 6.300%, VAR ICE LIBOR USD 3 Month
+ 3.423%(C) 1,250 1,3105.900%, VAR ICE LIBOR USD 3 Month
+ 4.230%(C) 675 6954.125%, 07/25/2028 1,450 1,5913.400%, 05/01/2026 1,675 1,796
Coinbase Global 3.625%, 10/01/2031 (A) 400 3683.375%, 10/01/2028 (A) 710 663
Commerzbank 6.125% (C) EUR 400 495
Cooperatieve Rabobank UA 4.625%, VAR EUR Swap Annual 5 Yr
+ 4.098%(C) 1,400 1,741
DescriptionFace Amount (Thousands)
Market Value ($ Thousands)
CORPORATE OBLIGATIONS (continued)Credit Bank of Moscow Via CBOM Finance
7.500%, VAR USD Swap Semi 30/360 5 Yr Curr + 5.416%, 10/05/2027 $ 470 $ 467
Credit Suisse Group 7.500%, VAR USD Swap Semi 30/360
5 Yr Curr + 4.600%(A)(C) 410 4337.250%, VAR USD ICE Swap 11:00 NY
5 Yr + 4.332%(A)(C) 200 2204.550%, 04/17/2026 802 8843.869%, VAR ICE LIBOR USD 3 Month
+ 1.410%, 01/12/2029 (A) 600 642Deutsche Bank
6.000%, VAR US Treas Yield Curve Rate T Note Const Mat 5 Yr + 4.524%(C) 400 415
DP World MTN 5.625%, 09/25/2048 200 245
Eastern & Southern African Trade & Development Bank MTN
5.375%, 03/14/2022 210 211First Horizon National
4.000%, 05/26/2025 625 668FirstCash
5.625%, 01/01/2030 (A) 340 347First-Citizens Bank & Trust
5.250%, 03/07/2025 185 204Freedom Mortgage
7.625%, 05/01/2026 (A) 1,450 1,4816.625%, 01/15/2027 (A) 1,015 992
Global Aircraft Leasing 7.250%cash/6.500% PIK,
09/15/2024 (A) 3,078 2,970HSBC Holdings
5.250%, VAR EUR Swap Annual 5 Yr + 4.383%(C) EUR 700 820
4.950%, 03/31/2030 $ 226 2653.803%, VAR ICE LIBOR USD 3 Month
+ 1.211%, 03/11/2025 700 7351.645%, VAR United States Secured
Overnight Financing Rate + 1.538%, 04/18/2026 1,000 992
Huarong Finance 2017 4.500%, VAR US Treas Yield
Curve Rate T Note Const Mat 5 Yr 7.773%(C) 200 200
Huarong Finance 2017 MTN 4.000%, VAR US Treas Yield
Curve Rate T Note Const Mat 5 Yr 6.983%(C) 310 308
Huarong Finance 2019 MTN 3.375%, 02/24/2030 200 1922.500%, 02/24/2023 550 546

7SEI Institutional Managed Trust / Quarterly Report / December 31, 2021
SCHEDULE OF INVESTMENTS (Unaudited)December 31, 2021
Multi-Asset Income Fund (Continued)
DescriptionFace Amount (Thousands)
Market Value ($ Thousands)
CORPORATE OBLIGATIONS (continued)Huarong Finance II MTN
5.000%, 11/19/2025 $ 210 $ 2184.625%, 06/03/2026 1,190 1,226
Intercontinental Exchange 2.100%, 06/15/2030 800 795
Intesa Sanpaolo MTN 5.710%, 01/15/2026 (A) 1,080 1,195
Itau Unibanco Holding 4.625%, VAR US Treas Yield Curve
Rate T Note Const Mat 5 Yr + 3.222%(A)(C) 1,120 1,049
Jane Street Group 4.500%, 11/15/2029 (A) 160 162
JPMorgan Chase 4.125%, 12/15/2026 3,400 3,7502.956%, VAR United States Secured
Overnight Financing Rate + 2.515%, 05/13/2031 250 259
LD Holdings Group 6.500%, 11/01/2025 (A) 860 8486.125%, 04/01/2028 (A) 755 712
Lloyds Banking Group 4.947% (C) EUR 290 359
Midcap Financial Issuer Trust 6.500%, 05/01/2028 (A) $ 1,532 1,5975.625%, 01/15/2030 (A) 535 536
Morgan Stanley 3.625%, 01/20/2027 750 813
Morgan Stanley MTN 3.950%, 04/23/2027 1,100 1,2111.794%, VAR United States Secured
Overnight Financing Rate + 1.034%, 02/13/2032 625 592
MPH Acquisition Holdings 5.750%, 11/01/2028 (A) 30 295.500%, 09/01/2028 (A) 510 517
National Bank of Uzbekistan 4.850%, 10/21/2025 200 199
Nationstar Mortgage Holdings 5.500%, 08/15/2028 (A) 1,754 1,789
Nationwide Building Society 3.960%, VAR ICE LIBOR USD 3 Month
+ 1.855%, 07/18/2030 (A) 450 494NatWest Group
8.000%, VAR USD Swap Semi 30/360 5 Yr Curr + 5.720%(C) 750 871
4.500%, VAR UK Govt Bonds 5 Year Note Generic Bid Yield + 3.992%(C) GBP 1,160 1,563
3.754%, VAR US Treas Yield Curve Rate T Note Const Mat 5 Yr + 2.100%, 11/01/2029 $ 225 235
DescriptionFace Amount (Thousands)
Market Value ($ Thousands)
CORPORATE OBLIGATIONS (continued)2.544%, VAR ICE LIBOR USD 3 Month
+ 2.320%(C) $ 1,000 $ 995Navient
5.500%, 03/15/2029 1,519 1,5155.000%, 03/15/2027 1,100 1,122
Navient MTN 5.625%, 08/01/2033 180 171
NFP 6.875%, 08/15/2028 (A) 893 895
NMI Holdings 7.375%, 06/01/2025 (A) 410 466
Noble Holdings International 15.000%, 02/15/2028 (A) 68 75
Park Aerospace Holdings 4.500%, 03/15/2023 (A) 170 175
Raymond James Financial 4.650%, 04/01/2030 400 464
Rocket Mortgage 4.000%, 10/15/2033 (A) 160 162
Turkiye Vakiflar Bankasi TAO 8.125%, 03/28/2024 760 7616.500%, 01/08/2026 (A) 680 635
UBS Group 7.000%, VAR USD Swap Semi 30/360
5 Yr Curr + 4.344%(A)(C) 510 550UniCredit MTN
7.296%, VAR USD ICE Swap 11:00 NY 5 Yr + 4.914%, 04/02/2034 (A) 260 312
5.459%, VAR US Treas Yield Curve Rate T Note Const Mat 5 Yr + 4.750%, 06/30/2035 (A) 440 479
United Wholesale Mortgage 5.500%, 04/15/2029 (A) 1,360 1,334
VistaJet Malta Finance 10.500%, 06/01/2024 (A) 320 342
Wells Fargo 5.875%, VAR ICE LIBOR USD 3 Month
+ 3.990%(C) 525 574Wells Fargo MTN
4.100%, 06/03/2026 1,575 1,717Yapi ve Kredi Bankasi
7.875%, VAR US Treas Yield Curve Rate T Note Const Mat 5 Yr + 7.415%, 01/22/2031 (A) 1,050 1,009
Yapi ve Kredi Bankasi MTN 13.875%, VAR USD Swap Semi
30/360 5 Yr Curr + 11.245%(C) 480 5218.250%, 10/15/2024 (A) 500 5076.100%, 03/16/2023 510 507
96,005

SEI Institutional Managed Trust / Quarterly Report / December 31, 20218
SCHEDULE OF INVESTMENTS (Unaudited)December 31, 2021
Multi-Asset Income Fund (Continued)
SCHEDULE OF INVESTMENTS (Unaudited)December 31, 2021
Multi-Asset Income Fund (Continued)
DescriptionFace Amount (Thousands)
Market Value ($ Thousands)
CORPORATE OBLIGATIONS (continued)Health Care — 2.8%
AbbVie 3.200%, 11/21/2029 $ 1,375 $ 1,470
AdaptHealth 6.125%, 08/01/2028 (A) 670 7105.125%, 03/01/2030 (A) 560 5704.625%, 08/01/2029 (A) 605 605
Akumin 7.000%, 11/01/2025 (A) 500 476
Bausch Health 5.000%, 01/30/2028 (A) 325 2995.000%, 02/15/2029 (A) 390 344
Bausch Health Americas 8.500%, 01/31/2027 (A) 500 525
Bayer US Finance II 4.375%, 12/15/2028 (A) 300 3354.250%, 12/15/2025 (A) 500 541
Becton Dickinson 3.700%, 06/06/2027 690 7522.823%, 05/20/2030 625 647
CAB SELAS 3.375%, 02/01/2028 (A) EUR 475 539
Catalent Pharma Solutions 3.125%, 02/15/2029 (A) $ 440 434
Cheplapharm Arzneimittel GmbH 5.500%, 01/15/2028 (A) 578 585
Chrome Holdco SASU 5.000%, 05/31/2029 (A) EUR 375 426
CHS 6.125%, 04/01/2030 (A) $ 1,270 1,256
Cidron Aida Finco Sarl 6.250%, 04/01/2028 (A) GBP 440 589
CVS Health 3.750%, 04/01/2030 $ 590 647
DaVita 3.750%, 02/15/2031 (A) 1,760 1,715
Dentsply Sirona 3.250%, 06/01/2030 325 343
DH Europe Finance II S.A.R.L. 2.600%, 11/15/2029 175 181
Endo DAC 9.500%, 07/31/2027 (A) 200 204
Endo Luxembourg Finance I S.A.R.L. 6.125%, 04/01/2029 (A) 540 529
HealthEquity 4.500%, 10/01/2029 (A) 376 372
Laboratoire Eimer Selas 5.000%, 02/01/2029 (A) EUR 225 259
LifePoint Health 5.375%, 01/15/2029 (A) $ 1,185 1,179
Mozart Debt Merger Sub 5.250%, 10/01/2029 (A) 1,310 1,328
DescriptionFace Amount (Thousands)
Market Value ($ Thousands)
CORPORATE OBLIGATIONS (continued)3.875%, 04/01/2029 (A) $ 1,160 $ 1,156
Option Care Health 4.375%, 10/31/2029 (A) 590 592
Prestige Brands 3.750%, 04/01/2031 (A) 810 786
Radiology Partners 9.250%, 02/01/2028 (A) 400 420
Stryker 1.950%, 06/15/2030 825 807
Tenet Healthcare 6.250%, 02/01/2027 (A) 200 207
Teva Pharmaceutical Finance LLC 6.150%, 02/01/2036 950 996
Teva Pharmaceutical Finance Netherlands III BV
4.750%, 05/09/2027 300 297US Renal Care
10.625%, 07/15/2027 (A) 430 436Verisure Holding
3.250%, 02/15/2027 (A) EUR 475 538Verisure Midholding
5.250%, 02/15/2029 (A) 500 576Zoetis
2.000%, 05/15/2030 $ 1,100 1,084
25,755
Industrials — 7.0%AerCap Ireland Capital DAC
6.500%, 07/15/2025 285 3264.875%, 01/16/2024 400 4254.625%, 07/01/2022 2,300 2,3453.300%, 01/30/2032 260 265
Aeropuerto Internacional de Tocumen 5.125%, 08/11/2061 (A) 520 5444.000%, 08/11/2041 (A) 640 652
Aeropuertos Dominicanos Siglo XXI 6.750%, 03/30/2029 (A) 350 360
Air Canada 3.875%, 08/15/2026 (A) 965 984
Air Lease 3.250%, 03/01/2025 850 882
Air Lease MTN 3.750%, 06/01/2026 600 639
Allied Universal Holdco 9.750%, 07/15/2027 649 6936.000%, 06/01/2029 (A) 1,000 9734.625%, 06/01/2028 (A) 340 334
American Airlines 11.750%, 07/15/2025 (A) 160 1975.750%, 04/20/2029 (A) 1,071 1,1455.500%, 04/20/2026 (A) 582 605

9SEI Institutional Managed Trust / Quarterly Report / December 31, 2021
SCHEDULE OF INVESTMENTS (Unaudited)December 31, 2021
Multi-Asset Income Fund (Continued)
DescriptionFace Amount (Thousands)
Market Value ($ Thousands)
CORPORATE OBLIGATIONS (continued)American Airlines Pass-Through Trust
4.950%, 02/15/2025 $ 351 $ 350American Builders & Contractors Supply
3.875%, 11/15/2029 (A) 1,115 1,112American News
10.000%cash/8.500% PIK, 09/01/2026 (A) 1,641 1,871
APi Escrow 4.750%, 10/15/2029 (A) 143 146
APi Group DE 4.125%, 07/15/2029 (A) 1,460 1,467
Arcosa 4.375%, 04/15/2029 (A) 500 507
Avis Budget Car Rental 5.375%, 03/01/2029 (A) 705 744
BCPE Empire Holdings 7.625%, 05/01/2027 (A) 990 1,011
Boeing 5.930%, 05/01/2060 410 5695.805%, 05/01/2050 350 4745.150%, 05/01/2030 150 1753.450%, 11/01/2028 375 3923.250%, 03/01/2028 425 440
Cargo Aircraft Management 4.750%, 02/01/2028 (A) 320 326
Carriage Purchaser 7.875%, 10/15/2029 (A) 240 230
Carrier Global 2.493%, 02/15/2027 1,100 1,1302.242%, 02/15/2025 1,000 1,024
CoreCivic 8.250%, 04/15/2026 1,060 1,108
Cornerstone Building Brands 6.125%, 01/15/2029 (A) 567 606
CoStar Group 2.800%, 07/15/2030 (A) 625 625
CP Atlas Buyer 7.000%, 12/01/2028 (A) 955 950
Delta Air Lines 7.000%, 05/01/2025 (A) 700 800
DP World MTN 6.850%, 07/02/2037 (A) 100 1325.625%, 09/25/2048 (A) 750 920
GFL Environmental 4.000%, 08/01/2028 (A) 1,188 1,164
Global Infrastructure Solutions 5.625%, 06/01/2029 (A) 1,095 1,122
Granite Holdings US Acquisition 11.000%, 10/01/2027 (A) 820 892
GYP Holdings III 4.625%, 05/01/2029 (A) 470 471
DescriptionFace Amount (Thousands)
Market Value ($ Thousands)
CORPORATE OBLIGATIONS (continued)H&E Equipment Services
3.875%, 12/15/2028 (A) $ 340 $ 337Hawaiian Brand Intellectual Property
5.750%, 01/20/2026 (A) 430 450Hillenbrand
3.750%, 03/01/2031 589 590Husky III Holding
13.750%cash/13.000% PIK, 02/15/2025 (A) 600 630
IHS Holding 6.250%, 11/29/2028 (A) 350 3545.625%, 11/29/2026 (A) 440 444
KOC Holding 6.500%, 03/11/2025 2,170 2,1915.250%, 03/15/2023 1,330 1,331
Legends Hospitality Holding 5.000%, 02/01/2026 (A) 510 513
Madison IAQ 5.875%, 06/30/2029 (A) 879 8794.125%, 06/30/2028 (A) 179 179
Mexico City Airport Trust 5.500%, 10/31/2046 (A) 400 4005.500%, 07/31/2047 892 8944.250%, 10/31/2026 (A) 210 2223.875%, 04/30/2028 (A) 1,190 1,233
MHP Lux 6.950%, 04/03/2026 1,870 1,859
MV24 Capital BV 6.748%, 06/01/2034 3,070 3,166
Northrop Grumman 3.250%, 01/15/2028 1,950 2,087
Otis Worldwide 2.565%, 02/15/2030 1,425 1,446
Park-Ohio Industries 6.625%, 04/15/2027 2,070 2,009
Prime Security Services Borrower 6.250%, 01/15/2028 (A) 330 344
Ritchie Bros Holdings 4.750%, 12/15/2031 (A) 470 491
Spirit AeroSystems 4.600%, 06/15/2028 1,680 1,684
Spirit Loyalty Cayman 8.000%, 09/20/2025 (A) 503 555
Standard Industries 4.375%, 07/15/2030 (A) 645 658
Stanley Black & Decker 4.250%, 11/15/2028 650 738
Swire Pacific Financing MTN 4.500%, 10/09/2023 200 211
Titan Acquisition 7.750%, 04/15/2026 (A) 1,465 1,487

SEI Institutional Managed Trust / Quarterly Report / December 31, 202110
SCHEDULE OF INVESTMENTS (Unaudited)December 31, 2021
Multi-Asset Income Fund (Continued)
SCHEDULE OF INVESTMENTS (Unaudited)December 31, 2021
Multi-Asset Income Fund (Continued)
DescriptionFace Amount (Thousands)
Market Value ($ Thousands)
CORPORATE OBLIGATIONS (continued)TransDigm
8.000%, 12/15/2025 (A) $ 170 $ 1797.500%, 03/15/2027 260 2725.500%, 11/15/2027 1,330 1,3704.875%, 05/01/2029 359 3614.625%, 01/15/2029 135 135
Triumph Group 7.750%, 08/15/2025 1,161 1,152
United Airlines 4.375%, 04/15/2026 (A) 665 693
United Airlines Pass-Through Trust, Ser 2020-1, Cl B
4.875%, 01/15/2026 72 75Vertiv Group
4.125%, 11/15/2028 (A) 500 505Wolverine Escrow
9.000%, 11/15/2026 (A) 105 1008.500%, 11/15/2024 (A) 1,370 1,271
XPO CNW 6.700%, 05/01/2034 590 725
66,347
Information Technology — 2.8%Arches Buyer
6.125%, 12/01/2028 (A) 364 366Austin BidCo
7.125%, 12/15/2028 (A) 275 284Blast Motion
7.000%, 01/15/2024 (A)(F) 520 521Broadcom
3.500%, 02/15/2041 (A) 525 5393.469%, 04/15/2034 (A) 175 1833.419%, 04/15/2033 (A) 1,150 1,2053.187%, 11/15/2036 (A) 53 53
Brunello Bidco 3.500%, 02/15/2028 (A) EUR 550 619
Castle US Holding 9.500%, 02/15/2028 (A) $ 839 875
Clarivate Science Holdings 4.875%, 07/01/2029 (A) 1,206 1,2233.875%, 07/01/2028 (A) 1,037 1,042
CommScope 8.250%, 03/01/2027 (A) 710 730
Dell International 6.020%, 06/15/2026 1,600 1,8495.450%, 06/15/2023 141 149
Elastic 4.125%, 07/15/2029 (A) 695 687
Endure Digital 6.000%, 02/15/2029 (A) 2,285 2,125
Global Payments 2.650%, 02/15/2025 400 411
DescriptionFace Amount (Thousands)
Market Value ($ Thousands)
CORPORATE OBLIGATIONS (continued)Hewlett Packard Enterprise
4.900%, 10/15/2025 $ 1,865 $ 2,069II-VI
5.000%, 12/15/2029 (A) 420 429ION Trading Technologies S.A.R.L.
5.750%, 05/15/2028 (A) 687 708Lam Research
1.900%, 06/15/2030 300 295LogMeIn
5.500%, 09/01/2027 (A) 450 455Magnum Holdings
5.375%, 10/31/2026 (A) 210 217MEGlobal Canada ULC MTN
5.875%, 05/18/2030 (A) 660 799NXP BV
3.400%, 05/01/2030 (A) 225 240Open Text Holdings
4.125%, 02/15/2030 (A) 3 3Paysafe Finance
4.000%, 06/15/2029 (A) 720 668Prosus
3.680%, 01/21/2030 (A) 250 257Prosus MTN
4.027%, 08/03/2050 (A) 560 5383.061%, 07/13/2031 (A) 740 721
Rocket Software 6.500%, 02/15/2029 (A) 530 517
Saga 5.500%, 07/15/2026 GBP 610 797
Sprint Capital 8.750%, 03/15/2032 $ 510 7656.875%, 11/15/2028 520 658
Sunny Express Enterprises 3.350%, VAR US Treas Yield
Curve Rate T Note Const Mat 3 Yr 4.762%(C) 200 202
Switch 4.125%, 06/15/2029 (A) 300 307
Uniquify 6.000%, 06/15/2024 (A) 180 181
United Group BV 4.625%, 08/15/2028 (A) EUR 450 511
Vericast 13.000%, 10/15/2027 (A) $ 180 22211.000%, 09/15/2026 (A) 240 254
24,674
Materials — 2.4%Anglo American Capital
5.625%, 04/01/2030 (A) 500 593Ardagh Metal Packaging Finance USA
4.000%, 09/01/2029 (A) 360 357

11SEI Institutional Managed Trust / Quarterly Report / December 31, 2021
SCHEDULE OF INVESTMENTS (Unaudited)December 31, 2021
Multi-Asset Income Fund (Continued)
DescriptionFace Amount (Thousands)
Market Value ($ Thousands)
CORPORATE OBLIGATIONS (continued)Axalta Coating Systems
3.375%, 02/15/2029 (A) $ 1,405 $ 1,359Berry Global
1.570%, 01/15/2026 325 318Braskem Netherlands Finance BV
4.500%, 01/10/2028 (A) 970 1,028Chemours
4.625%, 11/15/2029 (A) 1,645 1,632Cleveland-Cliffs
4.875%, 03/01/2031 (A) 715 743First Quantum Minerals
6.875%, 10/15/2027 (A) 1,300 1,399Freeport-McMoRan
5.450%, 03/15/2043 750 943Glencore Funding
4.125%, 03/12/2024 (A) 400 421Huntsman International
4.500%, 05/01/2029 375 415INEOS Quattro Finance II
3.375%, 01/15/2026 (A) 205 206Ingevity
3.875%, 11/01/2028 (A) 735 716Kleopatra Finco Sarl
4.250%, 03/01/2026 (A) EUR 425 466Kleopatra Holdings 2 SCA
6.500%, 09/01/2026 (A) 375 389LABL Escrow Issuer
6.750%, 07/15/2026 (A) $ 950 979LSF11 A5 HoldCo
6.625%, 10/15/2029 (A) 840 827Metinvest BV
7.750%, 04/23/2023 (A) 375 380Newcrest Finance Pty
3.250%, 05/13/2030 (A) 150 157NMG Holding
7.125%, 04/01/2026 (A)(G) 430 456OCP
3.750%, 06/23/2031 (A) 200 194Owens-Brockway Glass Container
6.625%, 05/13/2027 (A) 267 282Pactiv
8.375%, 04/15/2027 1,515 1,685Rayonier AM Products
7.625%, 01/15/2026 (A) 125 132Samarco Mineracao
5.750%, 10/24/2023 (B) 200 1294.125%, 11/01/2022 (B) 200 118
Sasol Financing USA 5.500%, 03/18/2031 440 4444.375%, 09/18/2026 1,800 1,811
Sealed Air 6.875%, 07/15/2033 (A) 411 522
DescriptionFace Amount (Thousands)
Market Value ($ Thousands)
CORPORATE OBLIGATIONS (continued)SRM Escrow Issuer
6.000%, 11/01/2028 (A) $ 710 $ 758Suzano Austria GmbH
6.000%, 01/15/2029 530 6145.750%, 07/14/2026 400 4563.125%, 01/15/2032 590 571
Syngenta Finance MTN 1.250%, 09/10/2027 EUR 200 228
Teck Resources 3.900%, 07/15/2030 $ 250 269
Unifrax Escrow Issuer 5.250%, 09/30/2028 (A) 365 369
Vale Overseas 6.250%, 08/10/2026 880 1,018
WR Grace Holdings 5.625%, 08/15/2029 (A) 670 686
24,070
Real Estate — 0.9%Agree
2.900%, 10/01/2030 175 178Alexandria Real Estate Equities
3.375%, 08/15/2031 375 404Diversified Healthcare Trust
9.750%, 06/15/2025 470 509Duke Realty
1.750%, 07/01/2030 300 285Essex Portfolio
3.000%, 01/15/2030 400 419GEO Group
5.875%, 10/15/2024 990 871IIP Operating Partnership
5.500%, 05/25/2026 320 339Iron Mountain Information Management
Services 5.000%, 07/15/2032 (A) 820 839
MPT Operating Partnership 3.692%, 06/05/2028 GBP 544 769
Realty Income 4.875%, 06/01/2026 $ 1,000 1,1252.850%, 12/15/2032 375 389
Service Properties Trust 5.500%, 12/15/2027 600 616
Spirit Realty 3.200%, 01/15/2027 600 627
WP Carey 4.250%, 10/01/2026 700 766
8,136
Utilities — 1.1%AES
2.450%, 01/15/2031 340 331
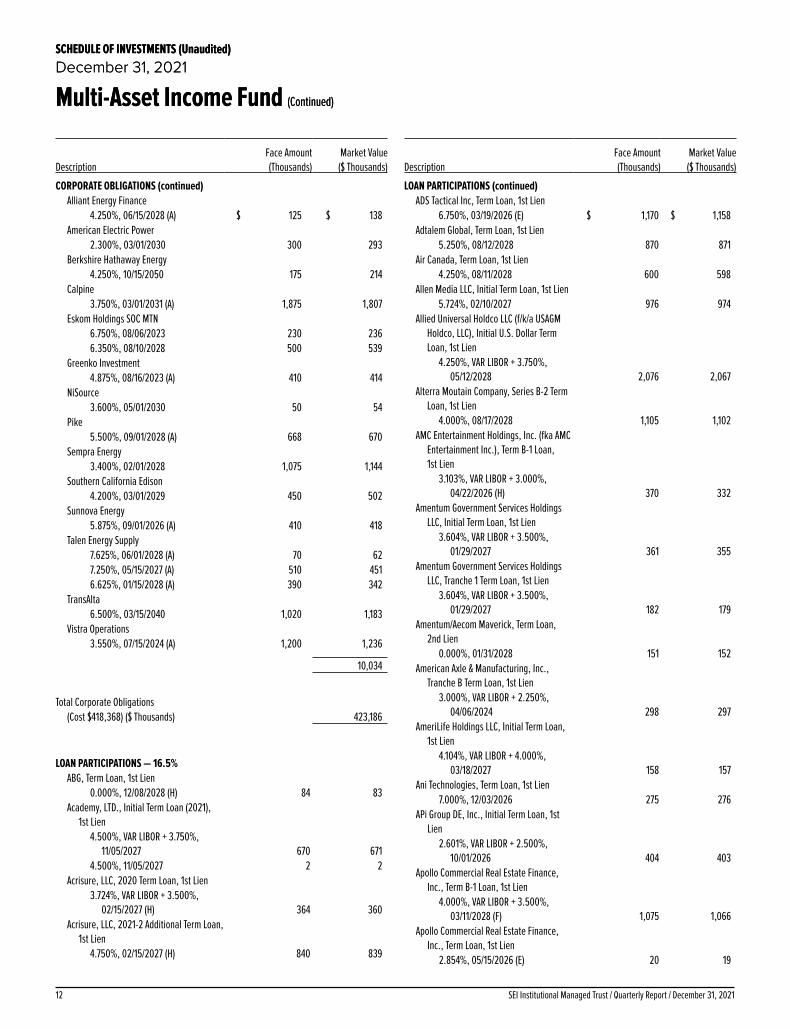
SEI Institutional Managed Trust / Quarterly Report / December 31, 202112
SCHEDULE OF INVESTMENTS (Unaudited)December 31, 2021
Multi-Asset Income Fund (Continued)
SCHEDULE OF INVESTMENTS (Unaudited)December 31, 2021
Multi-Asset Income Fund (Continued)
DescriptionFace Amount (Thousands)
Market Value ($ Thousands)
CORPORATE OBLIGATIONS (continued)Alliant Energy Finance
4.250%, 06/15/2028 (A) $ 125 $ 138American Electric Power
2.300%, 03/01/2030 300 293Berkshire Hathaway Energy
4.250%, 10/15/2050 175 214Calpine
3.750%, 03/01/2031 (A) 1,875 1,807Eskom Holdings SOC MTN
6.750%, 08/06/2023 230 2366.350%, 08/10/2028 500 539
Greenko Investment 4.875%, 08/16/2023 (A) 410 414
NiSource 3.600%, 05/01/2030 50 54
Pike 5.500%, 09/01/2028 (A) 668 670
Sempra Energy 3.400%, 02/01/2028 1,075 1,144
Southern California Edison 4.200%, 03/01/2029 450 502
Sunnova Energy 5.875%, 09/01/2026 (A) 410 418
Talen Energy Supply 7.625%, 06/01/2028 (A) 70 627.250%, 05/15/2027 (A) 510 4516.625%, 01/15/2028 (A) 390 342
TransAlta 6.500%, 03/15/2040 1,020 1,183
Vistra Operations 3.550%, 07/15/2024 (A) 1,200 1,236
10,034
Total Corporate Obligations
(Cost $418,368) ($ Thousands) 423,186
LOAN PARTICIPATIONS — 16.5%ABG, Term Loan, 1st Lien
0.000%, 12/08/2028 (H) 84 83Academy, LTD., Initial Term Loan (2021),
1st Lien4.500%, VAR LIBOR + 3.750%,
11/05/2027 670 6714.500%, 11/05/2027 2 2
Acrisure, LLC, 2020 Term Loan, 1st Lien3.724%, VAR LIBOR + 3.500%,
02/15/2027 (H) 364 360Acrisure, LLC, 2021-2 Additional Term Loan,
1st Lien4.750%, 02/15/2027 (H) 840 839
DescriptionFace Amount (Thousands)
Market Value ($ Thousands)
LOAN PARTICIPATIONS (continued)ADS Tactical Inc, Term Loan, 1st Lien
6.750%, 03/19/2026 (E) $ 1,170 $ 1,158Adtalem Global, Term Loan, 1st Lien
5.250%, 08/12/2028 870 871Air Canada, Term Loan, 1st Lien
4.250%, 08/11/2028 600 598Allen Media LLC, Initial Term Loan, 1st Lien
5.724%, 02/10/2027 976 974Allied Universal Holdco LLC (f/k/a USAGM
Holdco, LLC), Initial U.S. Dollar Term Loan, 1st Lien
4.250%, VAR LIBOR + 3.750%, 05/12/2028 2,076 2,067
Alterra Moutain Company, Series B-2 Term Loan, 1st Lien
4.000%, 08/17/2028 1,105 1,102AMC Entertainment Holdings, Inc. (fka AMC
Entertainment Inc.), Term B-1 Loan, 1st Lien
3.103%, VAR LIBOR + 3.000%, 04/22/2026 (H) 370 332
Amentum Government Services Holdings LLC, Initial Term Loan, 1st Lien
3.604%, VAR LIBOR + 3.500%, 01/29/2027 361 355
Amentum Government Services Holdings LLC, Tranche 1 Term Loan, 1st Lien
3.604%, VAR LIBOR + 3.500%, 01/29/2027 182 179
Amentum/Aecom Maverick, Term Loan, 2nd Lien
0.000%, 01/31/2028 151 152American Axle & Manufacturing, Inc.,
Tranche B Term Loan, 1st Lien3.000%, VAR LIBOR + 2.250%,
04/06/2024 298 297AmeriLife Holdings LLC, Initial Term Loan,
1st Lien4.104%, VAR LIBOR + 4.000%,
03/18/2027 158 157Ani Technologies, Term Loan, 1st Lien
7.000%, 12/03/2026 275 276APi Group DE, Inc., Initial Term Loan, 1st
Lien2.601%, VAR LIBOR + 2.500%,
10/01/2026 404 403Apollo Commercial Real Estate Finance,
Inc., Term B-1 Loan, 1st Lien4.000%, VAR LIBOR + 3.500%,
03/11/2028 (F) 1,075 1,066Apollo Commercial Real Estate Finance,
Inc., Term Loan, 1st Lien2.854%, 05/15/2026 (E) 20 19

13SEI Institutional Managed Trust / Quarterly Report / December 31, 2021
SCHEDULE OF INVESTMENTS (Unaudited)December 31, 2021
Multi-Asset Income Fund (Continued)
DescriptionFace Amount (Thousands)
Market Value ($ Thousands)
LOAN PARTICIPATIONS (continued)AppLovin Corporation, Amendment No. 6
New Term Loan, 1st Lien3.500%, 10/21/2028 $ 470 $ 469
Applovin Corporation, Initial Term Loan, 1st Lien
3.354%, VAR LIBOR + 3.250%, 08/15/2025 521 520
Arcis Golf LLC, Initial Term Loan, 1st Lien4.750%, 11/19/2028 700 702
Arctic Canadian Diamond Company Ltd., Term Loan, 2nd Lien
17.500%, 12/31/2027 (F) 760 760Aristocrat Leisure Limited, Initial Term
Loan, 1st Lien4.750%, VAR LIBOR + 3.750%,
10/19/2024 375 376Asurion, LLC, New B-4 Term Loan, 2nd Lien
5.354%, 01/20/2029 950 945Asurion, LLC, New B-7 Term Loan, 1st Lien
3.104%, VAR LIBOR + 3.000%, 11/03/2024 721 718
Asurion, LLC, New B-8 Term Loan, 1st Lien3.354%, VAR LIBOR + 3.250%,
12/23/2026 804 798Asurion, LLC, New B-9 Term Loan, 1st Lien
3.354%, VAR LIBOR + 3.250%, 07/31/2027 507 504
athenahealth, Inc., Term B-1 Loan, 1st Lien4.333%, VAR LIBOR + 4.250%,
02/11/2026 1 1Athenahealth, Inc., Term B-1 Loan, 1st Liena
4.400%, VAR LIBOR + 4.250%, 02/11/2026 465 464
Atlantic Aviation, Term Loan, 2nd Lien6.250%, 07/13/2029 (H) 125 126
Authentic Brands, Delayed Draw Term Loan, 1st Lien
0.000%, 12/08/2028 (H) 616 613Autokiniton, Term Loan B, 1st Lien
5.000%, 04/06/2028 (E) 219 220Boyd Gaming Corporation, Refinancing
Term B Loan, 1st Lien2.354%, VAR LIBOR + 2.250%,
09/15/2023 757 756Brown Group Holdings, LLC, Initial Term
Loan, 1st Lien3.000%, VAR LIBOR + 2.750%,
06/07/2028 1,065 1,062Caesars Resort Collection, LLC, Term B
Loan, 1st Lien2.854%, VAR LIBOR + 2.750%,
12/23/2024 707 702
DescriptionFace Amount (Thousands)
Market Value ($ Thousands)
LOAN PARTICIPATIONS (continued)Caesars Resort Collection, LLC, Term B-1
Loan, 1st Lien3.604%, 07/21/2025 $ 305 $ 305
Cardinal Parent, Inc., Initial Term Loan, 1st Lien
5.250%, VAR LIBOR + 4.500%, 11/12/2027 621 619
Carnival Corporation, 2021 Incremental Term B Advance, 1st Lien
4.000%, 10/06/2028 760 752Carnival Corporation, Initial Term Loan,
1st Lien3.750%, 06/30/2025 536 531
Castle US Holding Corporation, Initial Dollar Term Loan, 1st Lien
3.974%, VAR LIBOR + 3.750%, 01/29/2027 365 362
ChampionX Holding Inc., Term Loan, 1st Lien
6.000%, VAR LIBOR + 5.000%, 06/03/2027 1,538 1,557
Chariot Buyer LLC, Initial Term Loan, 1st Lien
4.000%, 10/22/2028 575 574Cinemark USA, Term Loan, 1st Lien
1.860%, 03/31/2025 (E) 158 151Citadel Securities LP, 2021 Term Loan,
1st Lien2.604%, VAR LIBOR + 2.500%,
02/02/2028 1,002 995City Brewing Company, LLC, Closing Date
Term Loan, 1st Lien4.250%, VAR LIBOR + 3.500%,
04/05/2028 380 359Clarios Global, Term Loan 1st Lien
3.354%, VAR LIBOR + 3.250%, 04/30/2026 666 661
Clark Equipment, Term Loan, 1st Lien2.474%, VAR LIBOR + 2.250%,
05/18/2024 597 596ClubCorp Holdings, Inc., Term B Loan, 1st
Lien2.970%, VAR LIBOR + 2.750%,
09/18/2024 863 830CNT Holdings I Corp, Initial Term Loan,
1st Lien4.250%, VAR LIBOR + 3.750%,
11/08/2027 746 746Commscope, Inc., Initial Term Loan, 1st
Lien3.354%, VAR LIBOR + 3.250%,
04/06/2026 941 928

SEI Institutional Managed Trust / Quarterly Report / December 31, 202114
SCHEDULE OF INVESTMENTS (Unaudited)December 31, 2021
Multi-Asset Income Fund (Continued)
SCHEDULE OF INVESTMENTS (Unaudited)December 31, 2021
Multi-Asset Income Fund (Continued)
DescriptionFace Amount (Thousands)
Market Value ($ Thousands)
LOAN PARTICIPATIONS (continued)ConnextWise, LLC, Term Loan B, 1st Lien
4.000%, 09/24/2028 (H) $ 725 $ 723Conservice Midco, LLC, Initial Term Loan,
1st Lien4.474%, VAR LIBOR + 4.250%,
05/13/2027 1,658 1,654CoreCivic, Inc., Term Loan, 1st Lien
5.500%, VAR LIBOR + 4.500%, 12/18/2024 203 201
CP Atlas Buyer, Inc., Term B Loan, 1st Lien4.250%, VAR LIBOR + 3.750%,
11/23/2027 408 406CPP, Term Loan, 2nd Lien
8.750%, 04/30/2026 370 360Crosby US Acquisition Corp., Initial Term
Loan, 1st Lien4.854%, VAR LIBOR + 4.750%,
06/26/2026 1,002 998CWGS Group, LLC, Initial Term Loan, 1st Lien
3.250%, 06/03/2028 596 591DCert Buyer, Inc., First Amendment
Refinancing Loan, 2nd Lien7.104%, VAR LIBOR + 7.000%,
02/19/2029 2,190 2,190DCert Buyer, Inc., Initial Term Loan, 1st Lien
4.104%, VAR LIBOR + 4.000%, 10/16/2026 883 880
Deerfield Dakota Holding, Llc 4/7/2028 2021 Replacement Term Loan, 2nd Lien
7.500%, 04/07/2028 (E)(F) 300 305Deerfield Dakota Holding, LLC, Initial Dollar
Term Loan, 1st Lien4.750%, VAR LIBOR + 3.750%,
04/09/2027 247 247Delta Topco, Inc., Initial Term Loan, 1st Lien
4.501%, VAR LIBOR + 3.750%, 12/01/2027 (H) 1,327 1,328
DirectTV Financing LLC, Closing Date Term Loan, 1st Lien
5.750%, 08/02/2027 950 950DivesiTech Holdings, Inc., Term Loan, 1st
Lien0.000%, 12/15/2028 (H) 133 133
Edelman Financial Engines Center, LLC, The, Initial Term Loan (2021), 1st Lien
4.250%, VAR LIBOR + 3.500%, 04/07/2028 1,521 1,519
Empire Today, Term Loan, 1st Lien5.750%, 04/03/2028 (E) 658 647
Energize Holdco LLC, Initial Term Loan, 1st Lien
4.250%, 11/17/2028 800 795
DescriptionFace Amount (Thousands)
Market Value ($ Thousands)
LOAN PARTICIPATIONS (continued)Energize Holdco LLC, Initial Term Loan,
2nd Lien7.250%, 11/19/2029 $ 425 $ 421
Engineered Machinery Holdings, Inc., Incremental Amendment No. 4 Term Loan, 1st Lien
3.750%, VAR Euribor + 3.750%, 05/21/2028 325 368
Engineered Machinery Holdings, Inc., Incremental Amendment No. 5 Term Loan, 1st Lien
4.500%, 05/19/2028 723 721Entercom Media Corp., Term B-2 Loan,
1st Lien2.602%, VAR LIBOR + 2.500%,
11/18/2024 325 321Equinox Holdings Inc., Incremental Term
B-2 Loan, 1st Lien10.000%, 03/08/2024 (E) 247 251
EyeCare Partners, LLC, Term Loan, 1st Lien3.974%, VAR LIBOR + 3.750%,
02/18/2027 760 755EyeCare Partners, Term Loan, 1st Lien
4.250%, 10/14/2028 370 368EyeCare Partners, Term Loan, 2nd Lien
7.250%, 10/14/2029 430 430Fanatics Commercial, Term Loan, 1st Lien
3.750%, 11/17/2028 (H) 720 715First Brand Group, Term Loan, 2nd Lien
9.500%, 03/30/2028 1,410 1,414First Brands Group, LLC, 2021 Term Loan,
1st Lien6.000%, VAR LIBOR + 5.000%,
03/30/2027 787 789Focus Financial Partnersm LLC, Tranche
B-3, Term Loan, 1st Lien2.104%, VAR LIBOR + 2.000%,
07/03/2024 1,802 1,785Focus Financial, Term Loan, 1st Lien
3.000%, 06/30/2028 438 435Four Seasons Holdings Inc., Term Loan
2013, 1st Lien2.104%, 11/30/2023 80 80
Freedom Acquirer, 1st Lien5.602%, 03/30/2028 828 824
Freeport LNG investments, LLLP, Initial Term B Loan, 1st Lien
4.000%, 11/17/2028 (H) 600 594Froneri International Limited, Facility B1,
1st Lien2.375%, VAR Euribor + 2.375%,
01/29/2027 330 367

15SEI Institutional Managed Trust / Quarterly Report / December 31, 2021
SCHEDULE OF INVESTMENTS (Unaudited)December 31, 2021
Multi-Asset Income Fund (Continued)
DescriptionFace Amount (Thousands)
Market Value ($ Thousands)
LOAN PARTICIPATIONS (continued)Froneri International Limited, Facility B2,
1st Lien2.354%, VAR LIBOR + 2.250%,
01/29/2027 $ 138 $ 137Gainwell Acquisition Corp., Term B Loan,
1st Lien4.750%, VAR LIBOR + 4.000%,
10/01/2027 1,985 1,988Garda World Security Corp
4.360%, VAR LIBOR + 4.250%, 10/30/2026 679 676
Garrett Motion Sarl, Dollar Term Loan, 1st Lien
3.750%, VAR LIBOR + 3.250%, 04/30/2028 1,200 1,195
Getty Images, Inc., Initial Dollar Term Loan, 1st Lien
4.625%, VAR LIBOR + 4.500%, 02/19/2026 553 553
Global Medical Response, Inc., 2020 Refinancing Term Loan, 1st Lien
5.250%, VAR LIBOR + 4.750%, 10/02/2025 (H) 1,183 1,177
Global Tel*Link Corporation, Term Loan, 1st Lien
8.354%, VAR LIBOR + 4.250%, 11/29/2026 110 102
4.354%, VAR LIBOR + 0.040%, 11/29/2025 573 556
Grab Holdings, Inc., Initial Term Loan, 1st Lien
5.500%, VAR LIBOR + 4.500%, 01/29/2026 1,318 1,320
Graham Packaging Company Inc., Initial Term Loan (2021), 1st Lien
3.750%, VAR LIBOR + 3.000%, 08/04/2027 575 573
Gray Television, Inc., Term D Loan, 1st Lien3.099%, 10/27/2028 (H) 700 696
Great Outdoors Group, LLC, Term B-2 Loan, 1st Lien
4.500%, 03/05/2028 803 803Greystone Select, Term Loan, 1st Lien
5.302%, 06/16/2028 (E) 288 288Grifols Worldwide Operations Limited,
Dollar Tranche B Term Loan, 1st Lien2.104%, VAR LIBOR + 2.000%,
11/15/2027 435 428Grinding Media, Inc., Term Loan B, 1st Lien
4.750%, 09/21/2028 (H) 950 948Hayward Industries, Term Loan, 1st Lien
3.000%, VAR LIBOR + 2.500%, 05/28/2028 718 714
DescriptionFace Amount (Thousands)
Market Value ($ Thousands)
LOAN PARTICIPATIONS (continued)Hertz Corporation, The, Initial Term B Loan,
1st Lien3.750%, 06/30/2028 (H) $ 1,049 $ 1,049
Hertz Corporation, The, Initial Term C Loan, 1st Lien
3.750%, 06/30/2028 (H) 198 198Hillman Group, Term Loan, 1st Lien
3.250%, 07/14/2028 (H) 47 47Holley Inc., Delayed Draw Term Loan, 1st
Lien4.500%, 11/10/2028 (H) 164 164
Holley Inc., Initial Term Loan, 1st Lien4.500%, 11/10/2028 (H) 986 982
Hornblower, Term Loan, 1st Lien5.500%, 04/27/2025 (H) 660 620
Hoya Midco, LLC, Initial Term Loan, 1st Lien4.500%, VAR LIBOR + 3.500%,
06/30/2024 700 700Hudson River Trading LLC, Term Loan, 1st
Lien3.104%, VAR LIBOR + 3.000%,
03/20/2028 905 898Hunter Fan Company 5/8/2028Term Loan,
1st Lien5.750%, VAR LIBOR + 5.000%,
05/08/2028 1,147 1,147Icebox Holdco III, Inc., Initial Term Loan,
1st Lien4.250%, 12/15/2028 (H) 642 641
Icebox Holdco III, Inc., Initial Term Loan, 2nd Lien
7.250%, 12/14/2029 (H) 225 225Icon Public Limited Company, Lux Term
Loan, 1st Lien2.750%, 07/03/2028 1,024 1,023
Icon Public Limited Company, U.S. Term Loan, 1st Lien
2.750%, 07/03/2028 253 252Idera, Inc., Term B-1 Loan, 1st Lien
4.500%, VAR LIBOR + 3.750%, 03/02/2028 1,070 1,069
Idera, Term Loan, 2nd Lien7.500%, 03/02/2029 (E) 175 175
iHeartCommunications, Inc. (fka Clear Channel Communications, Inc.), New Term Loan, 1st Lien
3.104%, VAR LIBOR + 3.000%, 05/01/2026 (H) 81 81
INEOS Styrolution Group GmbH, 2026 Tranche B Dollar Term Loan, 1st Lien
3.250%, VAR LIBOR + 2.750%, 01/29/2026 349 348
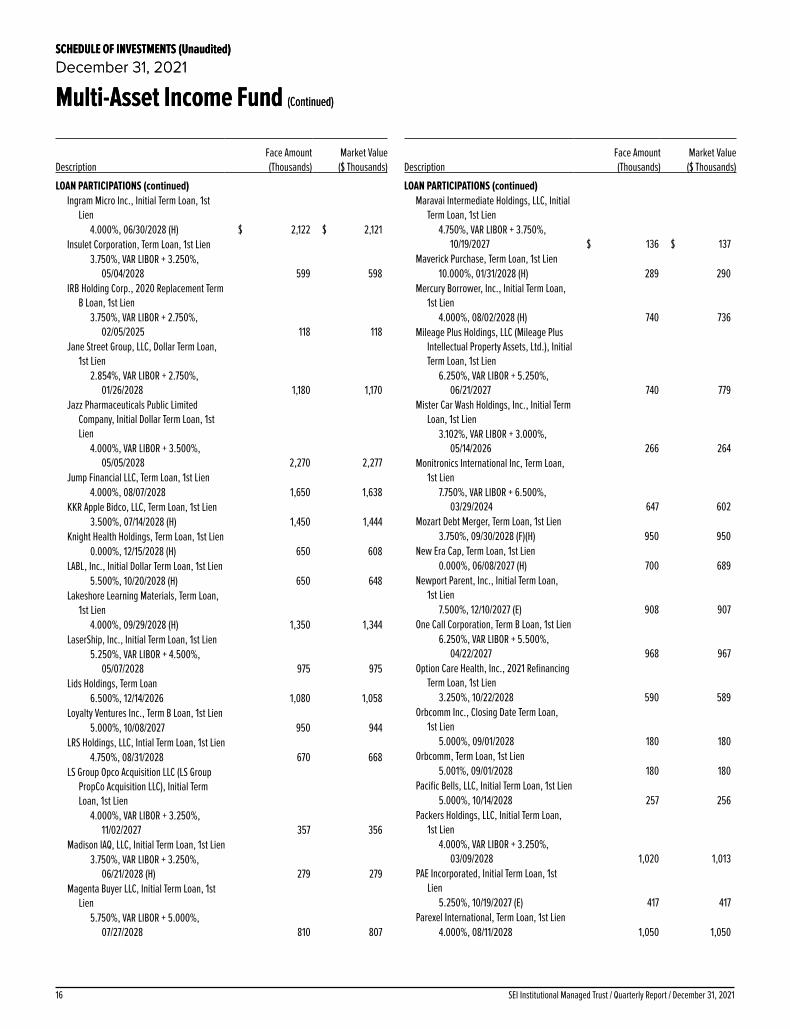
SEI Institutional Managed Trust / Quarterly Report / December 31, 202116
SCHEDULE OF INVESTMENTS (Unaudited)December 31, 2021
Multi-Asset Income Fund (Continued)
SCHEDULE OF INVESTMENTS (Unaudited)December 31, 2021
Multi-Asset Income Fund (Continued)
DescriptionFace Amount (Thousands)
Market Value ($ Thousands)
LOAN PARTICIPATIONS (continued)Ingram Micro Inc., Initial Term Loan, 1st
Lien4.000%, 06/30/2028 (H) $ 2,122 $ 2,121
Insulet Corporation, Term Loan, 1st Lien3.750%, VAR LIBOR + 3.250%,
05/04/2028 599 598IRB Holding Corp., 2020 Replacement Term
B Loan, 1st Lien3.750%, VAR LIBOR + 2.750%,
02/05/2025 118 118Jane Street Group, LLC, Dollar Term Loan,
1st Lien2.854%, VAR LIBOR + 2.750%,
01/26/2028 1,180 1,170Jazz Pharmaceuticals Public Limited
Company, Initial Dollar Term Loan, 1st Lien
4.000%, VAR LIBOR + 3.500%, 05/05/2028 2,270 2,277
Jump Financial LLC, Term Loan, 1st Lien4.000%, 08/07/2028 1,650 1,638
KKR Apple Bidco, LLC, Term Loan, 1st Lien3.500%, 07/14/2028 (H) 1,450 1,444
Knight Health Holdings, Term Loan, 1st Lien0.000%, 12/15/2028 (H) 650 608
LABL, Inc., Initial Dollar Term Loan, 1st Lien5.500%, 10/20/2028 (H) 650 648
Lakeshore Learning Materials, Term Loan, 1st Lien
4.000%, 09/29/2028 (H) 1,350 1,344LaserShip, Inc., Initial Term Loan, 1st Lien
5.250%, VAR LIBOR + 4.500%, 05/07/2028 975 975
Lids Holdings, Term Loan6.500%, 12/14/2026 1,080 1,058
Loyalty Ventures Inc., Term B Loan, 1st Lien5.000%, 10/08/2027 950 944
LRS Holdings, LLC, Intial Term Loan, 1st Lien4.750%, 08/31/2028 670 668
LS Group Opco Acquisition LLC (LS Group PropCo Acquisition LLC), Initial Term Loan, 1st Lien
4.000%, VAR LIBOR + 3.250%, 11/02/2027 357 356
Madison IAQ, LLC, Initial Term Loan, 1st Lien3.750%, VAR LIBOR + 3.250%,
06/21/2028 (H) 279 279Magenta Buyer LLC, Initial Term Loan, 1st
Lien5.750%, VAR LIBOR + 5.000%,
07/27/2028 810 807
DescriptionFace Amount (Thousands)
Market Value ($ Thousands)
LOAN PARTICIPATIONS (continued)Maravai Intermediate Holdings, LLC, Initial
Term Loan, 1st Lien4.750%, VAR LIBOR + 3.750%,
10/19/2027 $ 136 $ 137Maverick Purchase, Term Loan, 1st Lien
10.000%, 01/31/2028 (H) 289 290Mercury Borrower, Inc., Initial Term Loan,
1st Lien4.000%, 08/02/2028 (H) 740 736
Mileage Plus Holdings, LLC (Mileage Plus Intellectual Property Assets, Ltd.), Initial Term Loan, 1st Lien
6.250%, VAR LIBOR + 5.250%, 06/21/2027 740 779
Mister Car Wash Holdings, Inc., Initial Term Loan, 1st Lien
3.102%, VAR LIBOR + 3.000%, 05/14/2026 266 264
Monitronics International Inc, Term Loan, 1st Lien
7.750%, VAR LIBOR + 6.500%, 03/29/2024 647 602
Mozart Debt Merger, Term Loan, 1st Lien3.750%, 09/30/2028 (F)(H) 950 950
New Era Cap, Term Loan, 1st Lien0.000%, 06/08/2027 (H) 700 689
Newport Parent, Inc., Initial Term Loan, 1st Lien
7.500%, 12/10/2027 (E) 908 907One Call Corporation, Term B Loan, 1st Lien
6.250%, VAR LIBOR + 5.500%, 04/22/2027 968 967
Option Care Health, Inc., 2021 Refinancing Term Loan, 1st Lien
3.250%, 10/22/2028 590 589Orbcomm Inc., Closing Date Term Loan,
1st Lien5.000%, 09/01/2028 180 180
Orbcomm, Term Loan, 1st Lien5.001%, 09/01/2028 180 180
Pacific Bells, LLC, Initial Term Loan, 1st Lien5.000%, 10/14/2028 257 256
Packers Holdings, LLC, Initial Term Loan, 1st Lien
4.000%, VAR LIBOR + 3.250%, 03/09/2028 1,020 1,013
PAE Incorporated, Initial Term Loan, 1st Lien
5.250%, 10/19/2027 (E) 417 417Parexel International, Term Loan, 1st Lien
4.000%, 08/11/2028 1,050 1,050

17SEI Institutional Managed Trust / Quarterly Report / December 31, 2021
SCHEDULE OF INVESTMENTS (Unaudited)December 31, 2021
Multi-Asset Income Fund (Continued)
DescriptionFace Amount (Thousands)
Market Value ($ Thousands)
LOAN PARTICIPATIONS (continued)Particle Investment S.A.R.L. (WebPros),
Term Loan, 1st Lien5.750%, 02/18/2027 (E) $ 371 $ 370
PDS HoldCo Inc., Delayed Draw Term Loan, 1st Lien
5.250%, 08/18/2028 440 4405.200%, 08/18/2028 11 11
PDS Holdco Inc., Term Loan0.000%, 08/18/2028 6 6
PECF USS Intermediate Holding III Corporation, Initial Term Loan, 1st Lien
4.750%, 11/04/2028 (H) 570 570Peraton Corp., Term B Loan, 1st Lien
4.500%, VAR LIBOR + 3.750%, 02/01/2028 1,385 1,385
Peraton Corp., Term B-1 Loan, 2nd Lien8.500%, VAR LIBOR + 7.750%,
02/01/2029 600 607Petco Health and Wellness Company, Inc.,
Initial Term Loan, 1st Lien4.000%, VAR LIBOR + 3.250%,
03/03/2028 517 516PetSmart, LLC, Initial Term Loan, 1st Lien
4.500%, VAR LIBOR + 3.750%, 02/11/2028 658 659
Phoenix Guarantor Inc., Tranche B-1 Term Loan, 1st Lien
3.354%, VAR LIBOR + 3.250%, 03/05/2026 704 698
Pilot Travel Centers, LLC, Initial Tranche B Term Loan
2.104%, 08/04/2028 (H) 950 944Planview Parent, Inc., Closing Date Term
Loan, 1st Lien4.750%, VAR LIBOR + 4.000%,
12/17/2027 318 317Playa Resorts Holding, Term Loan B (2017)
3.750%, 04/29/2024 (E) 786 764Precision Medicine Group, LLC, Amendment
No. 1 Refinancing Term Loan, 1st Lien3.750%, VAR LIBOR + 3.000%,
11/18/2027 667 664Pretium Packaging, Term Loan, 1st Lien
4.500%, 09/22/2028 425 424Project Sky, Term Loan, 1st Lien
6.500%, 10/08/2029 (H) 390 3894.250%, 10/08/2028 (H) 2,095 2,087
Proofpoint, Term Loan, 1st Lien3.750%, 08/31/2028 610 607
Quikrete Holding, Term Loan B1, 1st Lien0.000%, 02/21/2028 (H) 670 668
DescriptionFace Amount (Thousands)
Market Value ($ Thousands)
LOAN PARTICIPATIONS (continued)Rackspace Technology Global, Inc., 2021
Term B Loan, 1st Lien3.500%, 02/15/2028 $ 965 $ 957
Radiology Partners, Inc., Term B Loan, 1st Lien
4.360%, 07/09/2025 295 2914.354%, 07/09/2025 345 339
RC Buyer, Inc., Initial Term Loan, 2nd Lien7.250%, 07/30/2029 300 299
Redstone HoldCo 2 LP, Initial Loan, 2nd Lien
8.500%, VAR LIBOR + 7.750%, 04/27/2029 910 836
Redstone Holdco, Term Loan, 1st Lien5.500%, VAR LIBOR + 4.750%,
04/27/2028 840 800Regionalcare Hospital Partners Holdings,
Inc., Term B Loan, 1st Lien3.852%, VAR LIBOR + 3.750%,
11/16/2025 190 190Resolute Investment Managers, Inc.,
Tranche C Term Loan, 1st Lien5.250%, 04/30/2024 307 307
Rough Country LLC, Term Loan, 1st Lien4.250%, 07/26/2028 700 698
Royal Caribbean Cruises, Term Loan, 1st Lien
9.000%, 07/27/2029 900 892Royal Carribbean Cruises, Term Loan, 1st
Lien0.000%, 04/05/2022 (H) 360 338
RVR Dealership Holdings, LLC, Term Loan, 1st Lien
4.751%, 02/08/2028 500 498Ryan Specialty Group, LLC, Initial Term
Loan, 1st Lien3.750%, VAR LIBOR + 3.000%,
09/01/2027 266 265Scientific Games International, Inc., Initial
Term B-5 Loan, 1st Lien2.854%, VAR LIBOR + 2.750%,
08/14/2024 741 739Sedgwick Claims Management Services,
Inc. (Lightning Cayman Merger Sub, Ltd.), 2020 Term Loan, 1st Lien
5.250%, VAR LIBOR + 4.250%, 09/03/2026 172 172
Sedgwick Claims Management Services, Inc. (Lightning Cayman Merger Sub, Ltd.), Initial Term Loan, 1st Lien
3.354%, VAR LIBOR + 3.250%, 12/31/2025 852 845
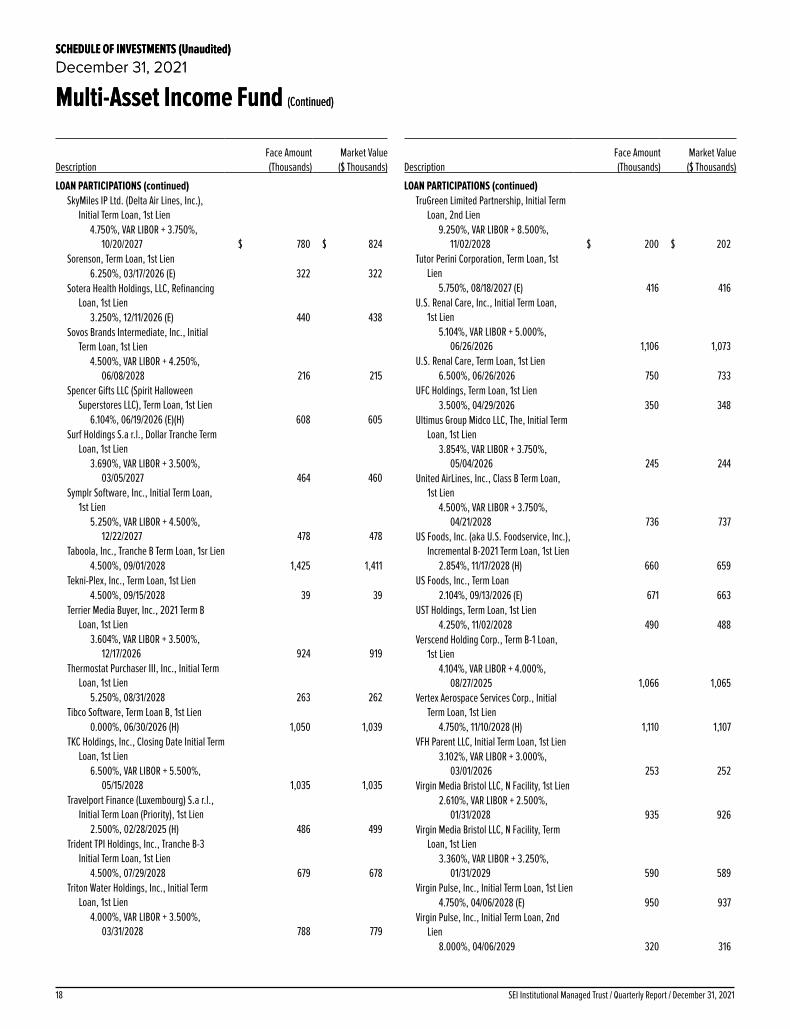
SEI Institutional Managed Trust / Quarterly Report / December 31, 202118
SCHEDULE OF INVESTMENTS (Unaudited)December 31, 2021
Multi-Asset Income Fund (Continued)
SCHEDULE OF INVESTMENTS (Unaudited)December 31, 2021
Multi-Asset Income Fund (Continued)
DescriptionFace Amount (Thousands)
Market Value ($ Thousands)
LOAN PARTICIPATIONS (continued)SkyMiles IP Ltd. (Delta Air Lines, Inc.),
Initial Term Loan, 1st Lien4.750%, VAR LIBOR + 3.750%,
10/20/2027 $ 780 $ 824Sorenson, Term Loan, 1st Lien
6.250%, 03/17/2026 (E) 322 322Sotera Health Holdings, LLC, Refinancing
Loan, 1st Lien3.250%, 12/11/2026 (E) 440 438
Sovos Brands Intermediate, Inc., Initial Term Loan, 1st Lien
4.500%, VAR LIBOR + 4.250%, 06/08/2028 216 215
Spencer Gifts LLC (Spirit Halloween Superstores LLC), Term Loan, 1st Lien
6.104%, 06/19/2026 (E)(H) 608 605Surf Holdings S.a r.l., Dollar Tranche Term
Loan, 1st Lien3.690%, VAR LIBOR + 3.500%,
03/05/2027 464 460Symplr Software, Inc., Initial Term Loan,
1st Lien5.250%, VAR LIBOR + 4.500%,
12/22/2027 478 478Taboola, Inc., Tranche B Term Loan, 1sr Lien
4.500%, 09/01/2028 1,425 1,411Tekni-Plex, Inc., Term Loan, 1st Lien
4.500%, 09/15/2028 39 39Terrier Media Buyer, Inc., 2021 Term B
Loan, 1st Lien3.604%, VAR LIBOR + 3.500%,
12/17/2026 924 919Thermostat Purchaser III, Inc., Initial Term
Loan, 1st Lien5.250%, 08/31/2028 263 262
Tibco Software, Term Loan B, 1st Lien0.000%, 06/30/2026 (H) 1,050 1,039
TKC Holdings, Inc., Closing Date Initial Term Loan, 1st Lien
6.500%, VAR LIBOR + 5.500%, 05/15/2028 1,035 1,035
Travelport Finance (Luxembourg) S.a r.l., Initial Term Loan (Priority), 1st Lien
2.500%, 02/28/2025 (H) 486 499Trident TPI Holdings, Inc., Tranche B-3
Initial Term Loan, 1st Lien4.500%, 07/29/2028 679 678
Triton Water Holdings, Inc., Initial Term Loan, 1st Lien
4.000%, VAR LIBOR + 3.500%, 03/31/2028 788 779
DescriptionFace Amount (Thousands)
Market Value ($ Thousands)
LOAN PARTICIPATIONS (continued)TruGreen Limited Partnership, Initial Term
Loan, 2nd Lien9.250%, VAR LIBOR + 8.500%,
11/02/2028 $ 200 $ 202Tutor Perini Corporation, Term Loan, 1st
Lien5.750%, 08/18/2027 (E) 416 416
U.S. Renal Care, Inc., Initial Term Loan, 1st Lien
5.104%, VAR LIBOR + 5.000%, 06/26/2026 1,106 1,073
U.S. Renal Care, Term Loan, 1st Lien6.500%, 06/26/2026 750 733
UFC Holdings, Term Loan, 1st Lien3.500%, 04/29/2026 350 348
Ultimus Group Midco LLC, The, Initial Term Loan, 1st Lien
3.854%, VAR LIBOR + 3.750%, 05/04/2026 245 244
United AirLines, Inc., Class B Term Loan, 1st Lien
4.500%, VAR LIBOR + 3.750%, 04/21/2028 736 737
US Foods, Inc. (aka U.S. Foodservice, Inc.), Incremental B-2021 Term Loan, 1st Lien
2.854%, 11/17/2028 (H) 660 659US Foods, Inc., Term Loan
2.104%, 09/13/2026 (E) 671 663UST Holdings, Term Loan, 1st Lien
4.250%, 11/02/2028 490 488Verscend Holding Corp., Term B-1 Loan,
1st Lien4.104%, VAR LIBOR + 4.000%,
08/27/2025 1,066 1,065Vertex Aerospace Services Corp., Initial
Term Loan, 1st Lien4.750%, 11/10/2028 (H) 1,110 1,107
VFH Parent LLC, Initial Term Loan, 1st Lien3.102%, VAR LIBOR + 3.000%,
03/01/2026 253 252Virgin Media Bristol LLC, N Facility, 1st Lien
2.610%, VAR LIBOR + 2.500%, 01/31/2028 935 926
Virgin Media Bristol LLC, N Facility, Term Loan, 1st Lien
3.360%, VAR LIBOR + 3.250%, 01/31/2029 590 589
Virgin Pulse, Inc., Initial Term Loan, 1st Lien4.750%, 04/06/2028 (E) 950 937
Virgin Pulse, Inc., Initial Term Loan, 2nd Lien
8.000%, 04/06/2029 320 316

19SEI Institutional Managed Trust / Quarterly Report / December 31, 2021
SCHEDULE OF INVESTMENTS (Unaudited)December 31, 2021
Multi-Asset Income Fund (Continued)
DescriptionFace Amount (Thousands)
Market Value ($ Thousands)
LOAN PARTICIPATIONS (continued)Virtusa, Term Loan
4.500%, 02/11/2028 $ 1,677 $ 1,681VT Topco, Inc., Term Loan, 1st Lien
4.500%, 08/01/2025 380 379VT Topco, Inc., Term Loan, 2nd Lien
7.500%, 07/31/2026 320 320W.R. Grace Holdings LLC, Initial Term Loan,
1st Lien4.250%, 08/11/2028 (H) 200 200
Whatabrands LLC, Initial Term B Loan, 1st Lien
3.750%, 08/03/2028 180 179WP CityMD Bidco LLC, First Amendment
Refinancing Term Loan, 1st Lien4.500%, VAR LIBOR + 3.750%,
08/13/2026 756 755WP CPP Holdings, LLC, Initial Term Loan,
1st Lien4.750%, VAR LIBOR + 3.750%,
04/30/2025 1 1WP CPP Holdings, Term B Loan
4.750%, VAR LIBOR + 3.750%, 04/30/2025 510 488
Wwex Uni TopCo Holdings LLC, Initial Term Loan, 1st Lien
5.000%, 07/26/2028 780 782
Total Loan Participations
(Cost $150,798) ($ Thousands) 151,194
SOVEREIGN DEBT — 12.1%
Abu Dhabi Government International Bond4.125%, 10/11/2047(A) 380 4553.875%, 04/16/2050(A) 1,630 1,898
Angolan Government International Bond9.375%, 05/08/2048 200 1959.125%, 11/26/2049(A) 1,170 1,1218.000%, 11/26/2029(A) 420 413
Ardagh Metal Packaging Finance USA3.000%, 09/01/2029 EUR 350 390
Argentine Republic Government International Bond
3.500%, 07/09/2022 $ 1,310 4621.500%, 07/09/2022 1,686 5401.000%, 07/09/2029 262 950.750%, 07/09/2023 3,760 1,3160.500%, 07/09/2029 EUR 6 20.125%, 07/09/2030 165 59
DescriptionFace Amount (Thousands)
Market Value ($ Thousands)
SOVEREIGN DEBT (continued)Armenia Government International Bond
3.950%, 09/26/2029(A) $ 290 $ 2813.600%, 02/02/2031(A) 1,300 1,211
Azerbaijan Government International Bond3.500%, 09/01/2032 1,360 1,376
Bahrain Government International Bond7.375%, 05/14/2030(A) 1,610 1,7855.625%, 05/18/2034(A) 940 891
Belarus Government International Bond6.875%, 02/28/2023 260 2576.200%, 02/28/2030 200 158
Benin Government International Bond4.875%, 01/19/2032 EUR 1,480 1,644
Brazil Government International Bond5.333%, 02/15/2028 $ 140 146
Brazil Notas do Tesouro Nacional10.000%, 01/01/2029 BRL 1,400 242
Brazil Notas do Tesouro Nacional, Ser F10.000%, 01/01/2027 2,791 489
Buenos Aires Government International Bond MTN
5.250%, 09/01/2022(A) $ 7,102 3,018Bundesrepublik Deutschland
Bundesanleihe-0.561%, 08/15/2026(I) EUR 360 419
CBB International Sukuk Programme SPC6.250%, 11/14/2024(A) $ 300 322
Cellnex Finance MTN1.250%, 01/15/2029 EUR 400 434
Ciudad Autonoma De Buenos Aires7.500%, 06/01/2027 $ 480 428
Colombia Government International Bond4.125%, 05/15/2051 630 5113.125%, 04/15/2031 730 655
Cordoba Government International Bond5.000%, 06/01/2027(A) 526 331
Country Garden Holdings8.000%, 01/27/2024 200 201
Dominican Republic International Bond7.450%, 04/30/2044 600 7096.850%, 01/27/2045 660 7286.500%, 02/15/2048(A) 1,270 1,3466.400%, 06/05/2049(A) 660 6936.000%, 07/19/2028(A) 1,300 1,4514.500%, 01/30/2030 550 559
Ecuador Government International Bond5.500%, 07/31/2022(A) 352 2911.500%, 07/31/2022(A) 1,128 6600.000%, 07/31/2030(A)(J) 329 185

SEI Institutional Managed Trust / Quarterly Report / December 31, 202120
SCHEDULE OF INVESTMENTS (Unaudited)December 31, 2021
Multi-Asset Income Fund (Continued)
SCHEDULE OF INVESTMENTS (Unaudited)December 31, 2021
Multi-Asset Income Fund (Continued)
DescriptionFace Amount (Thousands)
Market Value ($ Thousands)
SOVEREIGN DEBT (continued)Egypt Government International Bond
8.875%, 05/29/2050(A) $ 710 $ 6448.700%, 03/01/2049(A) 520 4618.500%, 01/31/2047 650 5757.903%, 02/21/2048(A) 360 3017.625%, 05/29/2032(A) 480 4547.600%, 03/01/2029(A) 510 5056.375%, 04/11/2031(A) EUR 330 3475.625%, 04/16/2030 1,560 1,6004.750%, 04/11/2025 100 1134.750%, 04/16/2026 680 747
Gabon Government International Bond7.000%, 11/24/2031(A) $ 1,120 1,095
Ghana Government International Bond8.125%, 01/18/2026 500 4618.125%, 03/26/2032(A) 950 776
Guatemala Government Bond6.125%, 06/01/2050(A) 530 6075.750%, 06/06/2022 500 5084.900%, 06/01/2030(A) 280 3014.875%, 02/13/2028 790 8484.500%, 05/03/2026(A) 770 8114.375%, 06/05/2027(A) 790 828
Hazine Mustesarligi Varlik Kiralama5.004%, 04/06/2023(A) 860 857
Honduras Government International Bond7.500%, 03/15/2024 660 698
Indonesia Government International Bond7.000%, 05/15/2027 IDR 96,424,000 7,2525.250%, 01/17/2042 $ 1,000 1,2523.850%, 10/15/2030 200 2253.500%, 01/11/2028 880 9492.850%, 02/14/2030 900 9381.100%, 03/12/2033 EUR 400 4390.900%, 02/14/2027 180 205
Iraq Government International Bond5.800%, 01/15/2028 $ 228 217
Israel Government International Bond3.375%, 01/15/2050 310 3352.750%, 07/03/2030 460 489
Ivory Coast Government International Bond6.625%, 03/22/2048 EUR 420 4746.125%, 06/15/2033 $ 650 6845.750%, 12/31/2032 211 2125.250%, 03/22/2030 EUR 390 4524.875%, 01/30/2032(A) 1,660 1,814
Jamaica Government International Bond7.875%, 07/28/2045 $ 740 1,024
Kazakhstan Government International Bond MTN
5.125%, 07/21/2025 720 811
DescriptionFace Amount (Thousands)
Market Value ($ Thousands)
SOVEREIGN DEBT (continued)Kenya Government International Bond
8.250%, 02/28/2048(A) $ 260 $ 2648.000%, 05/22/2032(A) 910 9927.000%, 05/22/2027(A) 250 264
Lebanon Government International Bond8.250%, 05/17/2034(B) 30 38.200%, 05/17/2033(B) 40 47.150%, 11/20/2031(B) 40 47.050%, 11/02/2035(B) 100 117.000%, 03/20/2028(B) 40 46.850%, 03/23/2027(B) 100 106.850%, 05/25/2029(B) 721 766.750%, 11/29/2027(B) 410 436.650%, 04/22/2024(B) 170 186.650%, 11/03/2028(B) 80 86.650%, 02/26/2030(B) 832 856.600%, 11/27/2026(B) 30 36.200%, 02/26/2025(B) 860 88
Mexican Bonos8.500%, 05/31/2029 MXN 9,520 4926.500%, 06/09/2022 5,740 281
Mexico Government International Bond4.750%, 03/08/2044 $ 440 4793.771%, 05/24/2061 520 4793.600%, 01/30/2025 323 3422.659%, 05/24/2031 1,120 1,092
Mongolia Government International Bond5.625%, 05/01/2023 200 206
Morocco Government International Bond3.000%, 12/15/2032(A) 730 6961.500%, 11/27/2031(A) EUR 290 302
Mozambique International Bond9.000%, 09/15/2023 $ 220 186
Nigeria Government International Bond8.747%, 01/21/2031 1,720 1,8027.696%, 02/23/2038(A) 690 637
Oman Government International Bond6.750%, 01/17/2048 200 2036.250%, 01/25/2031(A) 1,600 1,748
Pakistan Government International Bond8.250%, 09/30/2025 370 4006.875%, 12/05/2027 200 2016.000%, 04/08/2026(A) 540 539
Pakistan Water & Power Development Authority
7.500%, 06/04/2031 620 600Panama Government International Bond
4.500%, 04/01/2056 300 330Papua New Guinea Government
International Bond8.375%, 10/04/2028(A) 290 292

21SEI Institutional Managed Trust / Quarterly Report / December 31, 2021
SCHEDULE OF INVESTMENTS (Unaudited)December 31, 2021
Multi-Asset Income Fund (Continued)
DescriptionFace Amount (Thousands)
Market Value ($ Thousands)
SOVEREIGN DEBT (continued)Paraguay Government International Bond
6.100%, 08/11/2044 $ 700 $ 8605.600%, 03/13/2048(A) 560 6475.400%, 03/30/2050(A) 320 365
Perusahaan Penerbit SBSN Indonesia III4.550%, 03/29/2026(A) 530 5944.450%, 02/20/2029(A) 330 376
Peruvian Government International Bond2.783%, 01/23/2031 480 478
Qatar Government International Bond5.103%, 04/23/2048(A) 1,690 2,2874.817%, 03/14/2049(A) 1,130 1,4814.625%, 06/02/2046 280 3544.400%, 04/16/2050(A) 450 5593.750%, 04/16/2030(A) 200 224
Romanian Government International Bond5.125%, 06/15/2048(A) 200 2363.375%, 01/28/2050 EUR 230 2462.875%, 05/26/2028 650 7952.875%, 03/11/2029 1,490 1,8012.124%, 07/16/2031(A) 250 2712.000%, 12/08/2026(A) 590 7022.000%, 01/28/2032(A) 110 1162.000%, 04/14/2033(A) 900 932
Russian Government International Bond7.050%, 01/19/2028 RUB 444,542 5,5725.250%, 06/23/2047 $ 200 2535.100%, 03/28/2035(A) 200 2354.375%, 03/21/2029(A) 800 881
Saudi Government International Bond MTN4.500%, 04/22/2060(A) $ 1,070 1,3163.750%, 01/21/2055(A) 220 2363.250%, 10/22/2030(A) 430 461
Senegal Government International Bond5.375%, 06/08/2037(A) EUR 930 1,0014.750%, 03/13/2028(A) 740 853
Serbia Government International Bond1.500%, 06/26/2029(A) 500 548
South Africa Government International Bond
5.650%, 09/27/2047 $ 950 9104.850%, 09/27/2027 890 9374.300%, 10/12/2028 200 203
Sri Lanka Government International Bond7.550%, 03/28/2030(A) 910 4516.850%, 03/14/2024(A) 200 1046.850%, 11/03/2025 570 2926.825%, 07/18/2026(A) 250 1276.750%, 04/18/2028(A) 660 3316.200%, 05/11/2027(A) 380 191
Third Pakistan International SUKUK5.625%, 12/05/2022 630 641
DescriptionFace Amount (Thousands)
Market Value ($ Thousands)
SOVEREIGN DEBT (continued)Turkey Government International Bond
7.625%, 04/26/2029 $ 560 $ 5596.875%, 03/17/2036 60 566.500%, 09/20/2033 900 8166.000%, 01/14/2041 1,980 1,6445.200%, 02/16/2026 EUR 260 2934.250%, 04/14/2026 $ 530 474
Ukraine Government International Bond9.750%, 11/01/2028(A) 640 6468.994%, 02/01/2024 670 6687.750%, 09/01/2022 450 4457.750%, 09/01/2023 910 8897.750%, 09/01/2024 230 2237.750%, 09/01/2027 250 2367.375%, 09/25/2032(A) 200 1787.253%, 03/15/2033(A) 420 369
Uzbekistan Government International Bond MTN
4.750%, 02/20/2024(A) 340 3533.700%, 11/25/2030(A) 660 633
Virgin Money UK9.250%, VAR UK Govt Bonds 5 Year
Note Generic Bid Yield + 8.307%, 06/08/2170(C) GBP 300 452
Zambia Government International Bond5.375%, 09/20/2022(B) $ 760 567
Total Sovereign Debt (Cost $114,731) ($ Thousands) 111,228
Shares
COMMON STOCK — 8.9%
Communication Services — 0.9%Activision Blizzard Inc 1,547 103Alphabet Inc, Cl A * 608 1,761Alphabet Inc, Cl C * 565 1,635AT&T Inc 14,470 356Charter Communications Inc, Cl A * 248 162Comcast Corp, Cl A 9,256 466Discovery Inc, Cl A * 459 11Discovery Inc, Cl C * 586 14DISH Network Corp, Cl A * 574 19Electronic Arts Inc 556 73Fox Corp 1,195 43Interpublic Group of Cos Inc/The 934 35Live Nation Entertainment Inc * 279 33Lumen Technologies Inc 2,009 25Match Group Inc * 557 74Meta Platforms Inc, Cl A * 4,781 1,608Netflix Inc * 900 542News Corp, Cl A 784 18News Corp, Cl B 145 3

SEI Institutional Managed Trust / Quarterly Report / December 31, 202122
SCHEDULE OF INVESTMENTS (Unaudited)December 31, 2021
Multi-Asset Income Fund (Continued)
SCHEDULE OF INVESTMENTS (Unaudited)December 31, 2021
Multi-Asset Income Fund (Continued)
Description SharesMarket Value
($ Thousands)
COMMON STOCK (continued)Omnicom Group Inc 375 $ 27Take-Two Interactive Software Inc, Cl A * 244 43T-Mobile US Inc * 1,175 136Twitter Inc * 1,568 68Verizon Communications Inc 8,402 437ViacomCBS Inc, Cl B 1,335 40Walt Disney Co/The * 3,693 572
8,304Consumer Discretionary — 1.1%
Advance Auto Parts Inc 131 31Amazon.com Inc, Cl A * 882 2,941Aptiv PLC * 535 88AutoZone Inc * 45 94Bath & Body Works Inc 578 40Best Buy Co Inc 491 50Booking Holdings Inc * 83 199BorgWarner Inc 394 18Caesars Entertainment Inc * 471 44CarMax Inc * 360 47Carnival Corp * 1,863 38Chipotle Mexican Grill Inc, Cl A * 56 98Darden Restaurants Inc 246 37Dollar General Corp 464 109Dollar Tree Inc * 438 62Domino's Pizza Inc 79 45DR Horton Inc 705 76eBay Inc 1,235 82Etsy Inc * 275 60Expedia Group Inc * 321 58Ford Motor Co 7,879 164Gap Inc/The 525 9Garmin Ltd 321 44General Motors Co * 2,915 171Genuine Parts Co 270 38Hasbro Inc 263 27Hilton Worldwide Holdings Inc * 551 86Home Depot Inc/The 2,149 892Las Vegas Sands Corp * 806 30Lennar Corp, Cl A 515 60LKQ Corp 622 37Lowe's Cos Inc 1,403 363Marriott International Inc/MD, Cl A * 541 89McDonald's Corp 1,516 406MGM Resorts International 813 37Mohawk Industries Inc * 127 23Newell Brands Inc, Cl B 839 18NIKE Inc, Cl B 2,593 432Norwegian Cruise Line Holdings Ltd * 900 19NVR Inc * 7 41O'Reilly Automotive Inc * 133 94Penn National Gaming Inc * 253 13Pool Corp 88 50
Description SharesMarket Value
($ Thousands)
COMMON STOCK (continued)PulteGroup Inc 603 $ 35PVH Corp 104 11Ralph Lauren Corp, Cl A 119 14Ross Stores Inc 700 80Royal Caribbean Cruises Ltd * 465 36Starbucks Corp 2,385 279Tapestry Inc 639 26Target Corp, Cl A 984 228Tesla Inc * 1,644 1,737TJX Cos Inc/The 2,417 184Tractor Supply Co 243 58Ulta Beauty Inc * 117 48Under Armour Inc, Cl A * 407 9Under Armour Inc, Cl C * 448 8VF Corp 702 51Whirlpool Corp 130 31Wynn Resorts Ltd * 213 18Yum! Brands Inc 578 80
10,293Consumer Staples — 0.5%
Altria Group Inc 3,691 175Archer-Daniels-Midland Co 1,099 74Brown-Forman Corp, Cl B 384 28Campbell Soup Co 389 17Church & Dwight Co Inc 540 55Clorox Co/The 269 47Coca-Cola Co/The 7,892 467Colgate-Palmolive Co 1,687 144Conagra Brands Inc 1,030 35Constellation Brands Inc, Cl A 324 81Costco Wholesale Corp 897 509Estee Lauder Cos Inc/The, Cl A 465 172General Mills Inc 1,193 80Hershey Co/The 314 61Hormel Foods Corp 580 28J M Smucker Co/The 254 35Kellogg Co 549 35Kimberly-Clark Corp 667 95Kraft Heinz Co/The 1,491 53Kroger Co/The 1,278 58Lamb Weston Holdings Inc 325 21McCormick & Co Inc/MD 545 53Molson Coors Beverage Co, Cl B 401 19Mondelez International Inc, Cl A 2,805 186Monster Beverage Corp * 737 71PepsiCo Inc 2,808 488Philip Morris International Inc 3,149 299Procter & Gamble Co/The 4,925 806Sysco Corp, Cl A 1,010 79Tyson Foods Inc, Cl A 569 50Walgreens Boots Alliance Inc 1,410 74

23SEI Institutional Managed Trust / Quarterly Report / December 31, 2021
SCHEDULE OF INVESTMENTS (Unaudited)December 31, 2021
Multi-Asset Income Fund (Continued)
Description SharesMarket Value
($ Thousands)
COMMON STOCK (continued)Walmart Inc 2,884 $ 417
4,812Energy — 0.2%
APA Corp 773 21Baker Hughes Co, Cl A 1,668 40Chevron Corp 3,913 459ConocoPhillips 2,655 192Coterra Energy Inc 1,761 33Devon Energy Corp 1,183 52Diamondback Energy Inc, Cl A 322 35EOG Resources Inc 1,163 103Exxon Mobil Corp 8,601 526Halliburton Co 1,703 39Hess Corp 607 45Kinder Morgan Inc 3,691 58Marathon Oil Corp 1,785 30Marathon Petroleum Corp 1,183 76Noble Corp * 2,884 72Occidental Petroleum Corp 1,658 48ONEOK Inc 980 58Phillips 66 855 62Pioneer Natural Resources Co 448 81Schlumberger NV, Cl A 2,768 83Titan Energy LLC *(F)(K) 12,743 —Valero Energy Corp 773 58Williams Cos Inc/The 2,372 62
2,233Financials — 0.9%
Aflac Inc 1,193 70Allstate Corp/The 561 66American Express Co 1,264 207American International Group Inc 1,645 94Ameriprise Financial Inc 219 66Aon PLC, Cl A 440 132Arthur J Gallagher & Co 406 69Aspect *(F) 57 —Assurant Inc 133 21Bank of America Corp 14,647 652Bank of New York Mellon Corp/The 1,502 87Berkshire Hathaway Inc, Cl B * 3,695 1,105BlackRock Inc 289 265Brown & Brown Inc 485 34Capital One Financial Corp 850 123Cboe Global Markets Inc 221 29Charles Schwab Corp/The 3,037 255Chubb Ltd 865 167Cincinnati Financial Corp 268 31Citigroup Inc 4,006 242Citizens Financial Group Inc 898 42CME Group Inc 722 165Comerica Inc 279 24
Description SharesMarket Value
($ Thousands)
COMMON STOCK (continued)Discover Financial Services 574 $ 66Everest Re Group Ltd 91 25FactSet Research Systems Inc 83 40Fifth Third Bancorp 1,291 56First Republic Bank/CA 352 73Franklin Resources Inc 576 19Globe Life Inc 222 21Goldman Sachs Group Inc/The 686 262Hartford Financial Services Group Inc/The 746 52Huntington Bancshares Inc/OH 3,167 49Intercontinental Exchange Inc 1,130 154Invesco Ltd 758 17JPMorgan Chase & Co 5,960 944KeyCorp 2,108 49Lincoln National Corp 360 25Loews Corp 335 19M&T Bank Corp 282 43MarketAxess Holdings Inc 67 28Marsh & McLennan Cos Inc 1,015 176MetLife Inc 1,414 88Moody's Corp 323 126Morgan Stanley 2,904 285MSCI Inc, Cl A 164 100Nasdaq Inc, Cl A 251 53Noble Corp * 5,098 125Northern Trust Corp 440 53People's United Financial Inc 638 11PNC Financial Services Group Inc/The 849 170Principal Financial Group Inc, Cl A 539 39Progressive Corp/The 1,167 120Prudential Financial Inc 746 81Raymond James Financial Inc 403 40Regions Financial Corp 1,995 43S&P Global Inc 486 229Signature Bank/New York NY, Cl B 134 43State Street Corp 716 67SVB Financial Group, Cl B * 116 79Synchrony Financial 1,055 49T Rowe Price Group Inc 445 88Travelers Cos Inc/The 484 76Truist Financial Corp 2,677 157US Bancorp 2,705 152W R Berkley Corp 323 27Wells Fargo & Co 8,085 388Willis Towers Watson PLC 242 57Zions Bancorp NA 332 21
8,831Health Care — 1.2%
Abbott Laboratories 3,592 506AbbVie Inc 3,590 486ABIOMED Inc * 96 34Agilent Technologies Inc 600 96

SEI Institutional Managed Trust / Quarterly Report / December 31, 202124
SCHEDULE OF INVESTMENTS (Unaudited)December 31, 2021
Multi-Asset Income Fund (Continued)
SCHEDULE OF INVESTMENTS (Unaudited)December 31, 2021
Multi-Asset Income Fund (Continued)
Description SharesMarket Value
($ Thousands)
COMMON STOCK (continued)Align Technology Inc * 145 $ 95AmerisourceBergen Corp, Cl A 284 38Amgen Inc, Cl A 1,138 256Anthem Inc 489 227Baxter International Inc 989 85Becton Dickinson and Co 575 145Biogen Inc * 288 69Bio-Rad Laboratories Inc, Cl A * 46 35Bio-Techne Corp 84 43Boston Scientific Corp * 2,844 121Bristol-Myers Squibb Co 4,488 280Cardinal Health Inc 491 25Catalent Inc * 363 46Centene Corp * 1,158 95Cerner Corp 632 59Charles River Laboratories International
Inc * 110 41Cigna Corp 664 152Cooper Cos Inc/The, Cl A 104 44CVS Health Corp 2,668 275Danaher Corp, Cl A 1,290 424DaVita Inc * 156 18DENTSPLY SIRONA Inc 439 25Dexcom Inc * 193 104Edwards Lifesciences Corp, Cl A * 1,253 162Eli Lilly & Co 1,611 445Gilead Sciences Inc 2,523 183HCA Healthcare Inc 478 123Henry Schein Inc * 227 18Hologic Inc * 480 37Humana Inc 256 119IDEXX Laboratories Inc * 169 111Illumina Inc * 312 119Incyte Corp * 384 28Intuitive Surgical Inc * 721 259IQVIA Holdings Inc * 380 107Johnson & Johnson 5,361 917Laboratory Corp of America Holdings * 207 65McKesson Corp 293 73Medtronic PLC 2,721 281Merck & Co Inc 5,122 393Mettler-Toledo International Inc * 45 76Moderna Inc * 709 180Organon & Co 550 17PerkinElmer Inc 280 56Pfizer Inc 11,417 674Quest Diagnostics Inc 224 39Regeneron Pharmaceuticals Inc * 211 133ResMed Inc 287 75STERIS PLC 213 52Stryker Corp 675 181Teleflex Inc 98 32
Description SharesMarket Value
($ Thousands)
COMMON STOCK (continued)Thermo Fisher Scientific Inc 801 $ 534UnitedHealth Group Inc 1,918 963Universal Health Services Inc, Cl B 188 24Vertex Pharmaceuticals Inc * 506 111Viatris Inc, Cl W * 2,801 38Waters Corp * 131 49West Pharmaceutical Services Inc 161 76Zimmer Biomet Holdings Inc 459 58Zoetis Inc, Cl A 955 233
10,865Industrials — 0.7%
3M Co 1,161 206A O Smith Corp 291 25Alaska Air Group Inc * 341 18Allegion plc 208 28American Airlines Group Inc * 1,366 25AMETEK Inc 440 65Boeing Co/The * 1,114 224Carrier Global Corp 1,716 93Caterpillar Inc, Cl A 1,091 226CH Robinson Worldwide Inc 225 24Cintas Corp 173 77Copart Inc * 464 70CSX Corp 4,453 167Cummins Inc 313 68Deere & Co 568 195Delta Air Lines Inc, Cl A * 1,378 54Dover Corp 310 56Eaton Corp PLC 797 137Emerson Electric Co 1,190 111Equifax Inc 233 68Expeditors International of Washington Inc 356 48Fastenal Co, Cl A 1,101 71FedEx Corp 488 126Fortive Corp 672 51Fortune Brands Home & Security Inc 286 31Generac Holdings Inc * 136 48General Dynamics Corp 459 96General Electric Co 2,213 209Honeywell International Inc 1,392 290Howmet Aerospace Inc 802 26Huntington Ingalls Industries Inc, Cl A 79 15IDEX Corp 137 32IHS Markit Ltd 793 105Illinois Tool Works Inc 572 141Ingersoll Rand Inc 870 54Jacobs Engineering Group Inc 245 34JB Hunt Transport Services Inc 173 35Johnson Controls International plc 1,411 115L3Harris Technologies Inc 387 83Leidos Holdings Inc 291 26Lockheed Martin Corp 493 175

25SEI Institutional Managed Trust / Quarterly Report / December 31, 2021
SCHEDULE OF INVESTMENTS (Unaudited)December 31, 2021
Multi-Asset Income Fund (Continued)
Description SharesMarket Value
($ Thousands)
COMMON STOCK (continued)Masco Corp 523 $ 37Nielsen Holdings PLC 682 14Norfolk Southern Corp 487 145Northrop Grumman Corp 297 115Old Dominion Freight Line Inc, Cl A 177 63Otis Worldwide Corp 834 73PACCAR Inc 656 58Parker-Hannifin Corp, Cl A 255 81Pentair PLC 385 28Quanta Services Inc 253 29Raytheon Technologies Corp 3,024 260Republic Services Inc 456 64Robert Half International Inc 262 29Rockwell Automation Inc 229 80Rollins Inc 442 15Roper Technologies Inc 210 103Snap-on Inc 107 23Southwest Airlines Co, Cl A * 1,321 57Stanley Black & Decker Inc 308 58Textron Inc 477 37Trane Technologies PLC 471 95TransDigm Group Inc * 114 73Union Pacific Corp 1,302 328United Airlines Holdings Inc * 565 25United Parcel Service Inc, Cl B 1,476 316United Rentals Inc * 156 52Verisk Analytics Inc, Cl A 308 70Waste Management Inc 768 128Westinghouse Air Brake Technologies Corp 385 35WW Grainger Inc 91 47Xylem Inc/NY 386 46
6,332Information Technology — 2.6%
Accenture PLC, Cl A 1,283 532Adobe Inc * 967 548Advanced Micro Devices Inc * 2,448 352Akamai Technologies Inc * 307 36Amphenol Corp, Cl A 1,188 104Analog Devices Inc 1,081 190ANSYS Inc * 171 69Apple Inc 31,544 5,601Applied Materials Inc 1,827 288Arista Networks Inc * 480 69Autodesk Inc, Cl A * 439 123Automatic Data Processing Inc 849 209Broadcom Inc 837 557Broadridge Financial Solutions Inc 222 41Cadence Design Systems Inc * 551 103CDW Corp/DE 255 52Ceridian HCM Holding Inc * 251 26Cisco Systems Inc/Delaware 8,570 543Citrix Systems Inc 251 24
Description SharesMarket Value
($ Thousands)
COMMON STOCK (continued)Cognizant Technology Solutions Corp, Cl A 1,040 $ 92Corning Inc, Cl B 1,646 61DXC Technology Co * 491 16Enphase Energy Inc * 298 55EPAM Systems Inc * 112 75F5 Inc, Cl A * 125 31Fidelity National Information Services
Inc, Cl B 1,217 133Fiserv Inc, Cl A * 1,186 123FleetCor Technologies Inc * 170 38Fortinet Inc * 269 97Gartner Inc * 154 51Global Payments Inc 571 77Hewlett Packard Enterprise Co 2,490 39HP Inc 2,226 84Intel Corp 8,252 425International Business Machines Corp 1,810 242Intuit Inc 574 369IPG Photonics Corp * 66 11Jack Henry & Associates Inc 154 26Juniper Networks Inc 729 26Keysight Technologies Inc * 362 75KLA Corp 303 130Lam Research Corp 284 204Mastercard Inc, Cl A 1,764 634Microchip Technology Inc 1,101 96Micron Technology Inc 2,254 210Microsoft Corp 15,194 5,110Monolithic Power Systems Inc 95 47Motorola Solutions Inc 334 91NetApp Inc 490 45NortonLifeLock Inc 1,376 36NVIDIA Corp 5,050 1,485NXP Semiconductors NV 531 121Oracle Corp, Cl B 3,262 285Paychex Inc 634 87Paycom Software Inc * 102 42PayPal Holdings Inc * 2,385 450PTC Inc * 223 27Qlik *(F) 3,600 —Qlik, Cl A *(F) 56 57Qlik, Cl B *(F) 13,812 —Qorvo Inc * 243 38QUALCOMM Inc 2,272 416salesforce.com Inc * 1,989 505Seagate Technology Holdings PLC 454 51ServiceNow Inc * 402 261Skyworks Solutions Inc 363 56SolarEdge Technologies Inc * 115 32Synopsys Inc * 304 112TE Connectivity Ltd 649 105Teledyne Technologies Inc * 102 45

SEI Institutional Managed Trust / Quarterly Report / December 31, 202126
SCHEDULE OF INVESTMENTS (Unaudited)December 31, 2021
Multi-Asset Income Fund (Continued)
SCHEDULE OF INVESTMENTS (Unaudited)December 31, 2021
Multi-Asset Income Fund (Continued)
Description SharesMarket Value
($ Thousands)
COMMON STOCK (continued)Teradyne Inc 356 $ 58Texas Instruments Inc 1,871 353Trimble Inc * 554 48Tyler Technologies Inc * 90 48VeriSign Inc * 206 52Visa Inc, Cl A 3,412 739Western Digital Corp * 566 37Xilinx Inc 493 105Zebra Technologies Corp, Cl A * 116 69
23,900Materials — 0.3%
Air Products and Chemicals Inc 443 135Albemarle Corp 254 59Amcor PLC 2,886 35Arctic Canadian Diamond Company Ltd.
*(F) 824 —Avery Dennison Corp 149 32Ball Corp 702 68Celanese Corp, Cl A 238 40CF Industries Holdings Inc 504 36Corteva Inc 1,390 66Dow Inc 1,459 83DuPont de Nemours Inc 1,022 83Eastman Chemical Co 290 35Ecolab Inc 497 117FMC Corp 272 30Freeport-McMoRan Inc, Cl B 2,931 122International Flavors & Fragrances Inc 488 73International Paper Co 852 40Linde PLC 1,039 360LyondellBasell Industries NV, Cl A 585 54Martin Marietta Materials Inc, Cl A 133 59Mosaic Co/The 856 34Newmont Corp 1,581 98Nucor Corp 559 64Packaging Corp of America 195 26PPG Industries Inc 468 81Sealed Air Corp 334 22Sherwin-Williams Co/The, Cl A 484 170Vulcan Materials Co 282 58Westrock Co 546 24
2,104Real Estate — 0.3%
Alexandria Real Estate Equities Inc ‡ 305 68American Tower Corp, Cl A ‡ 920 269AvalonBay Communities Inc ‡ 267 68Boston Properties Inc ‡ 252 29CBRE Group Inc, Cl A * 657 71Crown Castle International Corp ‡ 869 181Digital Realty Trust Inc, Cl A ‡ 563 100Duke Realty Corp ‡ 733 48
Description SharesMarket Value
($ Thousands)
COMMON STOCK (continued)Equinix Inc ‡ 180 $ 152Equity Residential ‡ 730 66Essex Property Trust Inc ‡ 143 50Extra Space Storage Inc ‡ 290 66Federal Realty Investment Trust ‡ 140 19Healthpeak Properties Inc ‡ 977 35Host Hotels & Resorts Inc *‡ 1,656 29Iron Mountain Inc ‡ 599 31Kimco Realty Corp ‡ 1,243 31Mid-America Apartment Communities Inc ‡ 250 57Prologis Inc ‡ 1,493 251Public Storage ‡ 304 114Realty Income Corp ‡ 1,088 78Regency Centers Corp ‡ 350 26SBA Communications Corp, Cl A ‡ 215 84Simon Property Group Inc ‡ 653 104UDR Inc ‡ 644 39Ventas Inc ‡ 864 44Vornado Realty Trust ‡ 297 13Welltower Inc ‡ 833 72Weyerhaeuser Co ‡ 1,627 67
2,262Utilities — 0.2%
AES Corp/The 1,399 34Alliant Energy Corp 531 33Ameren Corp 551 49American Electric Power Co Inc 996 89American Water Works Co Inc 346 65Atmos Energy Corp 303 32CenterPoint Energy Inc 1,408 39CMS Energy Corp 546 36Consolidated Edison Inc 668 57Dominion Energy Inc 1,617 127DTE Energy Co 426 51Duke Energy Corp 1,543 162Edison International 820 56Entergy Corp 440 50Evergy Inc 488 33Eversource Energy 747 68Exelon Corp 1,946 112FirstEnergy Corp 1,194 50NextEra Energy Inc 3,976 371NiSource Inc 886 24NRG Energy Inc 400 17Pinnacle West Capital Corp 217 15PPL Corp 1,695 51Public Service Enterprise Group Inc 988 66Sempra Energy 630 83Southern Co/The 2,122 146WEC Energy Group Inc 685 66
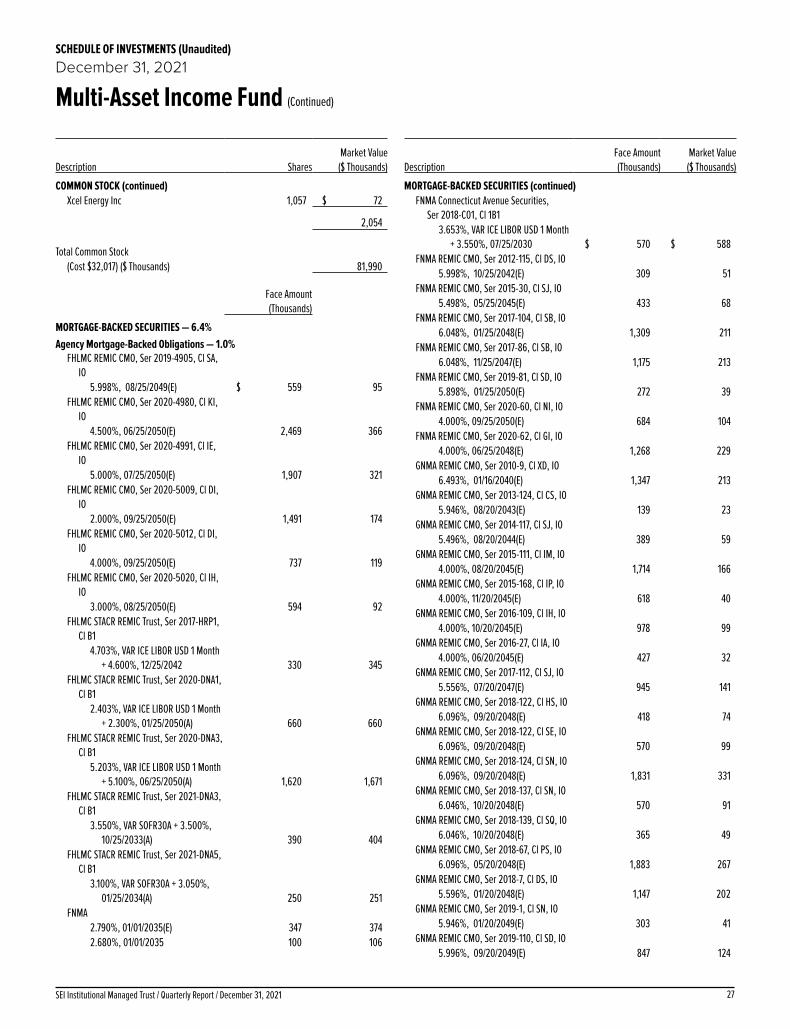
27SEI Institutional Managed Trust / Quarterly Report / December 31, 2021
SCHEDULE OF INVESTMENTS (Unaudited)December 31, 2021
Multi-Asset Income Fund (Continued)
Description SharesMarket Value
($ Thousands)
COMMON STOCK (continued)Xcel Energy Inc 1,057 $ 72
2,054
Total Common Stock
(Cost $32,017) ($ Thousands) 81,990
Face Amount (Thousands)
MORTGAGE-BACKED SECURITIES — 6.4%Agency Mortgage-Backed Obligations — 1.0%
FHLMC REMIC CMO, Ser 2019-4905, Cl SA, IO
5.998%, 08/25/2049(E) $ 559 95FHLMC REMIC CMO, Ser 2020-4980, Cl KI,
IO4.500%, 06/25/2050(E) 2,469 366
FHLMC REMIC CMO, Ser 2020-4991, Cl IE, IO
5.000%, 07/25/2050(E) 1,907 321FHLMC REMIC CMO, Ser 2020-5009, Cl DI,
IO2.000%, 09/25/2050(E) 1,491 174
FHLMC REMIC CMO, Ser 2020-5012, Cl DI, IO
4.000%, 09/25/2050(E) 737 119FHLMC REMIC CMO, Ser 2020-5020, Cl IH,
IO3.000%, 08/25/2050(E) 594 92
FHLMC STACR REMIC Trust, Ser 2017-HRP1, Cl B1
4.703%, VAR ICE LIBOR USD 1 Month + 4.600%, 12/25/2042 330 345
FHLMC STACR REMIC Trust, Ser 2020-DNA1, Cl B1
2.403%, VAR ICE LIBOR USD 1 Month + 2.300%, 01/25/2050(A) 660 660
FHLMC STACR REMIC Trust, Ser 2020-DNA3, Cl B1
5.203%, VAR ICE LIBOR USD 1 Month + 5.100%, 06/25/2050(A) 1,620 1,671
FHLMC STACR REMIC Trust, Ser 2021-DNA3, Cl B1
3.550%, VAR SOFR30A + 3.500%, 10/25/2033(A) 390 404
FHLMC STACR REMIC Trust, Ser 2021-DNA5, Cl B1
3.100%, VAR SOFR30A + 3.050%, 01/25/2034(A) 250 251
FNMA2.790%, 01/01/2035(E) 347 3742.680%, 01/01/2035 100 106
DescriptionFace Amount (Thousands)
Market Value ($ Thousands)
MORTGAGE-BACKED SECURITIES (continued)FNMA Connecticut Avenue Securities,
Ser 2018-C01, Cl 1B13.653%, VAR ICE LIBOR USD 1 Month
+ 3.550%, 07/25/2030 $ 570 $ 588FNMA REMIC CMO, Ser 2012-115, Cl DS, IO
5.998%, 10/25/2042(E) 309 51FNMA REMIC CMO, Ser 2015-30, Cl SJ, IO
5.498%, 05/25/2045(E) 433 68FNMA REMIC CMO, Ser 2017-104, Cl SB, IO
6.048%, 01/25/2048(E) 1,309 211FNMA REMIC CMO, Ser 2017-86, Cl SB, IO
6.048%, 11/25/2047(E) 1,175 213FNMA REMIC CMO, Ser 2019-81, Cl SD, IO
5.898%, 01/25/2050(E) 272 39FNMA REMIC CMO, Ser 2020-60, Cl NI, IO
4.000%, 09/25/2050(E) 684 104FNMA REMIC CMO, Ser 2020-62, Cl GI, IO
4.000%, 06/25/2048(E) 1,268 229GNMA REMIC CMO, Ser 2010-9, Cl XD, IO
6.493%, 01/16/2040(E) 1,347 213GNMA REMIC CMO, Ser 2013-124, Cl CS, IO
5.946%, 08/20/2043(E) 139 23GNMA REMIC CMO, Ser 2014-117, Cl SJ, IO
5.496%, 08/20/2044(E) 389 59GNMA REMIC CMO, Ser 2015-111, Cl IM, IO
4.000%, 08/20/2045(E) 1,714 166GNMA REMIC CMO, Ser 2015-168, Cl IP, IO
4.000%, 11/20/2045(E) 618 40GNMA REMIC CMO, Ser 2016-109, Cl IH, IO
4.000%, 10/20/2045(E) 978 99GNMA REMIC CMO, Ser 2016-27, Cl IA, IO
4.000%, 06/20/2045(E) 427 32GNMA REMIC CMO, Ser 2017-112, Cl SJ, IO
5.556%, 07/20/2047(E) 945 141GNMA REMIC CMO, Ser 2018-122, Cl HS, IO
6.096%, 09/20/2048(E) 418 74GNMA REMIC CMO, Ser 2018-122, Cl SE, IO
6.096%, 09/20/2048(E) 570 99GNMA REMIC CMO, Ser 2018-124, Cl SN, IO
6.096%, 09/20/2048(E) 1,831 331GNMA REMIC CMO, Ser 2018-137, Cl SN, IO
6.046%, 10/20/2048(E) 570 91GNMA REMIC CMO, Ser 2018-139, Cl SQ, IO
6.046%, 10/20/2048(E) 365 49GNMA REMIC CMO, Ser 2018-67, Cl PS, IO
6.096%, 05/20/2048(E) 1,883 267GNMA REMIC CMO, Ser 2018-7, Cl DS, IO
5.596%, 01/20/2048(E) 1,147 202GNMA REMIC CMO, Ser 2019-1, Cl SN, IO
5.946%, 01/20/2049(E) 303 41GNMA REMIC CMO, Ser 2019-110, Cl SD, IO
5.996%, 09/20/2049(E) 847 124

SEI Institutional Managed Trust / Quarterly Report / December 31, 202128
SCHEDULE OF INVESTMENTS (Unaudited)December 31, 2021
Multi-Asset Income Fund (Continued)
SCHEDULE OF INVESTMENTS (Unaudited)December 31, 2021
Multi-Asset Income Fund (Continued)
DescriptionFace Amount (Thousands)
Market Value ($ Thousands)
MORTGAGE-BACKED SECURITIES (continued)GNMA REMIC CMO, Ser 2019-110, Cl SE, IO
5.996%, 09/20/2049(E) $ 836 $ 110GNMA REMIC CMO, Ser 2019-151, Cl NI, IO
3.500%, 10/20/2049(E) 2,837 237GNMA REMIC CMO, Ser 2019-6, Cl SA, IO
5.946%, 01/20/2049(E) 240 36GNMA REMIC CMO, Ser 2019-69, Cl S, IO
3.166%, 06/20/2049(E) 271 22GNMA REMIC CMO, Ser 2019-78, Cl SE, IO
5.996%, 06/20/2049(E) 198 27GNMA REMIC CMO, Ser 2020-78, Cl DI, IO
4.000%, 06/20/2050(E) 1,009 104
9,068Non-Agency Mortgage-Backed Obligations — 5.4%
ACE Securities Home Equity Loan Trust, Ser 2004-HE3, Cl M1
1.032%, VAR ICE LIBOR USD 1 Month + 0.930%, 11/25/2034 460 460
Alternative Loan Trust, Ser 2005-81, Cl A10.662%, VAR ICE LIBOR USD 1 Month
+ 0.560%, 02/25/2037 542 473Barclays Commercial Mortgage Trust,
Ser 2019-C5, Cl A43.063%, 11/15/2052 870 924
Benchmark Mortgage Trust, Ser 2019-B11, Cl XA, IO
1.043%, 05/15/2052(E) 10,879 662BX Commercial Mortgage Trust, Ser 2018-
BIOA, Cl D1.431%, VAR ICE LIBOR USD 1 Month +
1.321%, 03/15/2037(A) 629 627BX Commercial Mortgage Trust, Ser 2019-
IMC, Cl E2.260%, VAR ICE LIBOR USD 1 Month
+ 2.150%, 04/15/2034(A) 1,970 1,943BX Commercial Mortgage Trust, Ser XL2,
Cl J4.000%, VAR ICE LIBOR USD 1 Month
+ 3.890%, 10/15/2038(A) 500 497BX Trust, Ser 2018-GWMZ, Cl MC
5.598%, VAR ICE LIBOR USD 1 Month + 5.488%, 05/15/2037(A) 1,100 1,017
Capmark Military Housing Trust, Ser 2007-AET2, Cl A
6.063%, 10/10/2052(A) 931 942CFK Trust, Ser 2020-MF2, Cl E
3.458%, 03/15/2039(A)(E) 500 484CGMS Commercial Mortgage Trust,
Ser 2017-MDRA, Cl C3.752%, 07/10/2030(A)(E) 1,620 1,609
DescriptionFace Amount (Thousands)
Market Value ($ Thousands)
MORTGAGE-BACKED SECURITIES (continued)Connecticut Avenue Securities Trust,
Ser 2018-R07, Cl 1B14.452%, VAR ICE LIBOR USD 1 Month
+ 4.350%, 04/25/2031(A) $ 460 $ 474Connecticut Avenue Securities Trust,
Ser 2019-R05, Cl 1B14.203%, VAR ICE LIBOR USD 1 Month
+ 4.100%, 07/25/2039(A) 640 651Connecticut Avenue Securities Trust,
Ser 2021-R01, Cl 1B13.150%, VAR SOFR30A + 3.100%,
10/25/2041(A) 670 677Connecticut Avenue Securities Trust,
Ser 2021-R03, Cl 1B12.800%, VAR SOFR30A + 2.750%,
12/25/2041(A) 680 680Credit Suisse European Mortgage Capital,
Ser 2019-1OTF, Cl A3.032%, VAR ICE LIBOR USD 3 Month
+ 2.900%, 08/09/2024(A) 960 931Credit Suisse Mortgage Trust, Ser 2019-
RIO, Cl B8.000%, VAR ICE LIBOR USD 1 Month
+ 7.000%, 12/15/2022(A) 1,440 1,395CSMC Trust, Ser 2014-USA, Cl E
4.373%, 09/15/2037(A) 320 285CSMC Trust, Ser 2017-RPL1, Cl M2
2.988%, 07/25/2057(A)(E) 1,190 1,188CSMC Trust, Ser 2019-UVIL, Cl A
3.160%, 12/15/2041(A) 950 994First Franklin Mortgage Loan Trust,
Ser 2006-FF15, Cl A50.262%, VAR ICE LIBOR USD 1 Month
+ 0.160%, 11/25/2036 859 850GS Mortgage Securities II, Ser 2018-SRP5,
Cl C4.110%, VAR ICE LIBOR USD 1 Month +
4.000%, 09/15/2031(A) 1,889 608GS Mortgage Securities Trust, Ser 2017-
STAY, Cl E2.760%, VAR ICE LIBOR USD 1 Month
+ 2.650%, 07/15/2032(A) 1,000 997GS Mortgage Securities Trust, Ser 2020-
DUNE, Cl F3.360%, VAR ICE LIBOR USD 1 Month
+ 3.250%, 12/15/2036(A) 595 579GS Mortgage Securities Trust, Ser 2020-
DUNE, Cl A1.210%, VAR ICE LIBOR USD 1 Month
+ 1.100%, 12/15/2036(A) 1,830 1,828

29SEI Institutional Managed Trust / Quarterly Report / December 31, 2021
SCHEDULE OF INVESTMENTS (Unaudited)December 31, 2021
Multi-Asset Income Fund (Continued)
DescriptionFace Amount (Thousands)
Market Value ($ Thousands)
MORTGAGE-BACKED SECURITIES (continued)GS Mortgage Securities Trust, Ser LUAU,
Cl G4.560%, VAR ICE LIBOR USD 1 Month
+ 4.450%, 11/15/2032(A) $ 500 $ 499HarborView Mortgage Loan Trust,
Ser 2006-10, Cl 2A1B0.344%, VAR ICE LIBOR USD 1 Month
+ 0.240%, 11/19/2036 1,841 1,847Impac CMB Trust, Ser 2005-4, Cl 1M1
0.747%, VAR ICE LIBOR USD 1 Month + 0.430%, 05/25/2035 863 852
JPMorgan Chase Commercial Mortgage Securities Trust, Ser 2018-WPT, Cl FFL
3.251%, VAR ICE LIBOR USD 1 Month + 3.150%, 07/05/2033(A) 1,790 1,773
JPMorgan Chase Commercial Mortgage Securities Trust, Ser 2019-BKWD, Cl E
2.710%, VAR ICE LIBOR USD 1 Month + 2.600%, 09/15/2029(A) 1,730 1,676
JPMorgan Chase Commercial Mortgage Securities Trust, Ser HTL5, Cl F
4.375%, VAR ICE LIBOR USD 1 Month + 4.265%, 11/15/2038(A) 710 703
Legacy Mortgage Asset Trust, Ser 2021-GS1, Cl A2
3.844%, 10/25/2066(A) 660 663Morgan Stanley Re-REMIC Trust, Ser 2010-
R5, Cl 4B2.422%, 06/26/2036(A) 258 240
Multifamily Connecticut Avenue Securities Trust, Ser 2019-01, Cl M10
3.352%, VAR ICE LIBOR USD 1 Month + 3.250%, 10/15/2049(A) 530 523
Multifamily Connecticut Avenue Securities Trust, Ser 2020-01, Cl M10
3.852%, VAR ICE LIBOR USD 1 Month + 3.750%, 03/25/2050(A) 480 487
Natixis Commercial Mortgage Securities Trust, Ser 2019-TRUE, Cl A
3.511%, VAR ICE LIBOR USD 1 Month + 2.011%, 04/18/2024(A) 870 861
NewRez Warehouse Securitization Trust, Ser 2021-1, Cl F
5.352%, VAR ICE LIBOR USD 1 Month + 5.250%, 05/25/2055(A) 430 429
Nomura Asset Acceptance Alternative Loan Trust, Ser 2003-A1, Cl M
6.663%, 05/25/2033(E) 680 478Nomura Resecuritization Trust, Ser 2015-
4R, Cl 5A12.197%, VAR ICE LIBOR USD 1 Month +
0.430%, 03/26/2036(A) 386 382
DescriptionFace Amount (Thousands)
Market Value ($ Thousands)
MORTGAGE-BACKED SECURITIES (continued)PMT Credit Risk Transfer Trust, Ser 2019-
3R, Cl A2.802%, VAR ICE LIBOR USD 1 Month
+ 2.700%, 10/27/2022(A) $ 290 $ 290Radnor, Ser 2020-1, Cl M1C
1.852%, VAR ICE LIBOR USD 1 Month + 1.750%, 01/25/2030(A) 1,830 1,810
RALI Series Trust, Ser 2006-QO2, Cl A20.642%, VAR ICE LIBOR USD 1 Month
+ 0.540%, 02/25/2046 1,320 366RALI Series Trust, Ser 2007-QO2, Cl A1
0.252%, VAR ICE LIBOR USD 1 Month + 0.150%, 02/25/2047 859 415
Seasoned Credit Risk Transfer Trust, Ser 2018-1, Cl M
4.750%, 05/25/2057(E) 1,720 1,765Seasoned Credit Risk Transfer Trust,
Ser 2018-3, Cl M4.750%, 08/25/2057(A)(E) 1,125 1,159
Seasoned Credit Risk Transfer Trust, Ser 2019-4, Cl M
4.500%, 02/25/2059(A)(E) 1,720 1,753Seasoned Credit Risk Transfer Trust,
Ser 2020-1, Cl M4.250%, 08/25/2059(A)(E) 2,230 2,278
Seasoned Credit Risk Transfer Trust, Ser 2020-2, Cl M
4.250%, 11/25/2059(A)(E) 830 848Seasoned Credit Risk Transfer Trust,
Ser 2020-3, Cl M4.250%, 05/25/2060(A)(E) 640 659
Shops at Crystals Trust, Ser 2106-CSTL, Cl D3.731%, 07/05/2036(A)(E) 885 819
Soho Trust, Ser 2021-SOHO, Cl D2.697%, 08/10/2038(A)(E) 440 389
Tharaldson Hotel Portfolio Trust, Ser 2018-THL, Cl E
3.584%, VAR ICE LIBOR USD 1 Month + 3.480%, 11/11/2034(A) 1,742 1,698
Tharaldson Hotel Portfolio Trust, Ser 2018-THL, Cl F
4.357%, VAR ICE LIBOR USD 1 Month + 4.252%, 11/11/2034(A) 583 563
Towd Point Mortgage Trust, Ser 2019-4, Cl B1B
3.500%, 10/25/2059(A)(E) 640 646WaMu Mortgage Pass-Through Certificates
Trust, Ser 2006-AR16, Cl 2A22.381%, 12/25/2036(E) 626 597
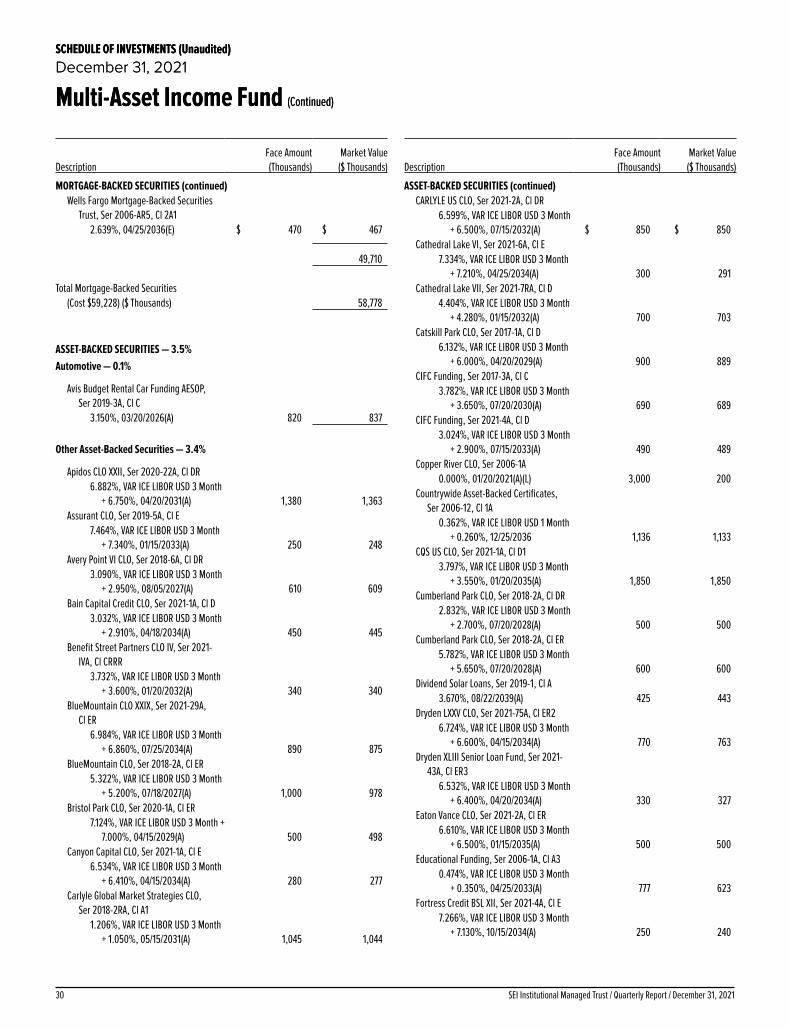
SEI Institutional Managed Trust / Quarterly Report / December 31, 202130
SCHEDULE OF INVESTMENTS (Unaudited)December 31, 2021
Multi-Asset Income Fund (Continued)
SCHEDULE OF INVESTMENTS (Unaudited)December 31, 2021
Multi-Asset Income Fund (Continued)
DescriptionFace Amount (Thousands)
Market Value ($ Thousands)
MORTGAGE-BACKED SECURITIES (continued)Wells Fargo Mortgage-Backed Securities
Trust, Ser 2006-AR5, Cl 2A12.639%, 04/25/2036(E) $ 470 $ 467
49,710
Total Mortgage-Backed Securities
(Cost $59,228) ($ Thousands) 58,778
ASSET-BACKED SECURITIES — 3.5%Automotive — 0.1%
Avis Budget Rental Car Funding AESOP, Ser 2019-3A, Cl C
3.150%, 03/20/2026(A) 820 837
Other Asset-Backed Securities — 3.4%
Apidos CLO XXII, Ser 2020-22A, Cl DR6.882%, VAR ICE LIBOR USD 3 Month
+ 6.750%, 04/20/2031(A) 1,380 1,363Assurant CLO, Ser 2019-5A, Cl E
7.464%, VAR ICE LIBOR USD 3 Month + 7.340%, 01/15/2033(A) 250 248
Avery Point VI CLO, Ser 2018-6A, Cl DR3.090%, VAR ICE LIBOR USD 3 Month
+ 2.950%, 08/05/2027(A) 610 609Bain Capital Credit CLO, Ser 2021-1A, Cl D
3.032%, VAR ICE LIBOR USD 3 Month + 2.910%, 04/18/2034(A) 450 445
Benefit Street Partners CLO IV, Ser 2021-IVA, Cl CRRR
3.732%, VAR ICE LIBOR USD 3 Month + 3.600%, 01/20/2032(A) 340 340
BlueMountain CLO XXIX, Ser 2021-29A, Cl ER
6.984%, VAR ICE LIBOR USD 3 Month + 6.860%, 07/25/2034(A) 890 875
BlueMountain CLO, Ser 2018-2A, Cl ER5.322%, VAR ICE LIBOR USD 3 Month
+ 5.200%, 07/18/2027(A) 1,000 978Bristol Park CLO, Ser 2020-1A, Cl ER
7.124%, VAR ICE LIBOR USD 3 Month + 7.000%, 04/15/2029(A) 500 498
Canyon Capital CLO, Ser 2021-1A, Cl E6.534%, VAR ICE LIBOR USD 3 Month
+ 6.410%, 04/15/2034(A) 280 277Carlyle Global Market Strategies CLO,
Ser 2018-2RA, Cl A11.206%, VAR ICE LIBOR USD 3 Month
+ 1.050%, 05/15/2031(A) 1,045 1,044
DescriptionFace Amount (Thousands)
Market Value ($ Thousands)
ASSET-BACKED SECURITIES (continued)CARLYLE US CLO, Ser 2021-2A, Cl DR
6.599%, VAR ICE LIBOR USD 3 Month + 6.500%, 07/15/2032(A) $ 850 $ 850
Cathedral Lake VI, Ser 2021-6A, Cl E7.334%, VAR ICE LIBOR USD 3 Month
+ 7.210%, 04/25/2034(A) 300 291Cathedral Lake VII, Ser 2021-7RA, Cl D
4.404%, VAR ICE LIBOR USD 3 Month + 4.280%, 01/15/2032(A) 700 703
Catskill Park CLO, Ser 2017-1A, Cl D6.132%, VAR ICE LIBOR USD 3 Month
+ 6.000%, 04/20/2029(A) 900 889CIFC Funding, Ser 2017-3A, Cl C
3.782%, VAR ICE LIBOR USD 3 Month + 3.650%, 07/20/2030(A) 690 689
CIFC Funding, Ser 2021-4A, Cl D3.024%, VAR ICE LIBOR USD 3 Month
+ 2.900%, 07/15/2033(A) 490 489Copper River CLO, Ser 2006-1A
0.000%, 01/20/2021(A)(L) 3,000 200Countrywide Asset-Backed Certificates,
Ser 2006-12, Cl 1A0.362%, VAR ICE LIBOR USD 1 Month
+ 0.260%, 12/25/2036 1,136 1,133CQS US CLO, Ser 2021-1A, Cl D1
3.797%, VAR ICE LIBOR USD 3 Month + 3.550%, 01/20/2035(A) 1,850 1,850
Cumberland Park CLO, Ser 2018-2A, Cl DR2.832%, VAR ICE LIBOR USD 3 Month
+ 2.700%, 07/20/2028(A) 500 500Cumberland Park CLO, Ser 2018-2A, Cl ER
5.782%, VAR ICE LIBOR USD 3 Month + 5.650%, 07/20/2028(A) 600 600
Dividend Solar Loans, Ser 2019-1, Cl A3.670%, 08/22/2039(A) 425 443
Dryden LXXV CLO, Ser 2021-75A, Cl ER26.724%, VAR ICE LIBOR USD 3 Month
+ 6.600%, 04/15/2034(A) 770 763Dryden XLIII Senior Loan Fund, Ser 2021-
43A, Cl ER36.532%, VAR ICE LIBOR USD 3 Month
+ 6.400%, 04/20/2034(A) 330 327Eaton Vance CLO, Ser 2021-2A, Cl ER
6.610%, VAR ICE LIBOR USD 3 Month + 6.500%, 01/15/2035(A) 500 500
Educational Funding, Ser 2006-1A, Cl A30.474%, VAR ICE LIBOR USD 3 Month
+ 0.350%, 04/25/2033(A) 777 623Fortress Credit BSL XII, Ser 2021-4A, Cl E
7.266%, VAR ICE LIBOR USD 3 Month + 7.130%, 10/15/2034(A) 250 240
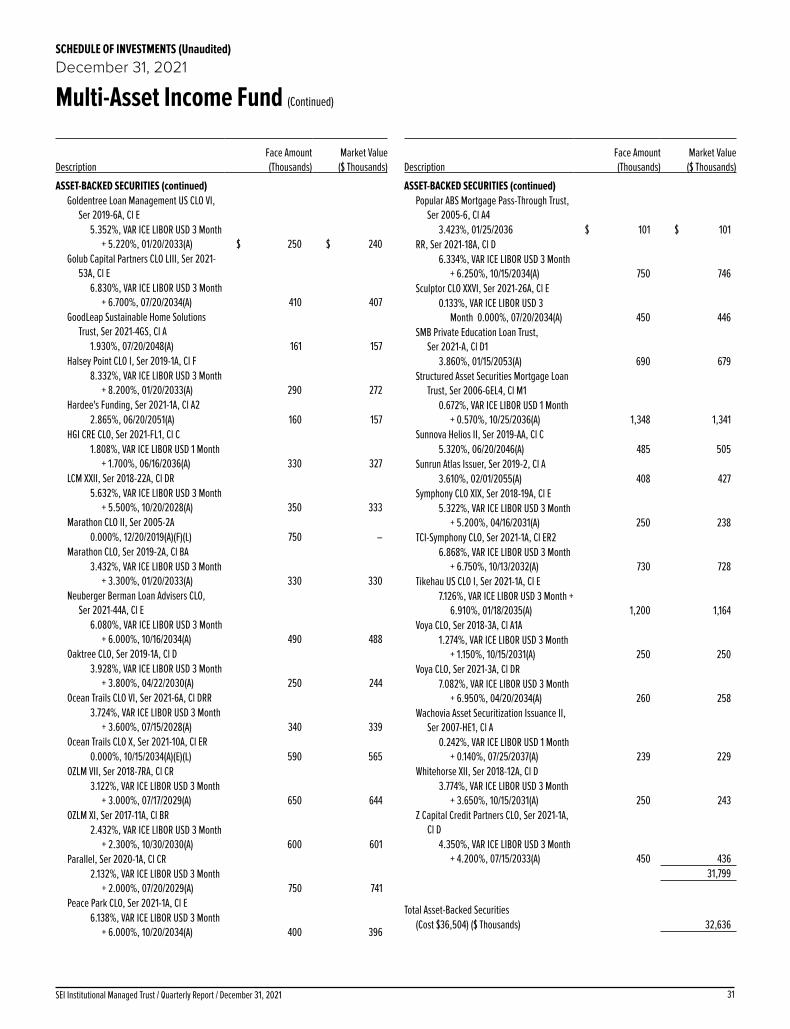
31SEI Institutional Managed Trust / Quarterly Report / December 31, 2021
SCHEDULE OF INVESTMENTS (Unaudited)December 31, 2021
Multi-Asset Income Fund (Continued)
DescriptionFace Amount (Thousands)
Market Value ($ Thousands)
ASSET-BACKED SECURITIES (continued)Goldentree Loan Management US CLO VI,
Ser 2019-6A, Cl E5.352%, VAR ICE LIBOR USD 3 Month
+ 5.220%, 01/20/2033(A) $ 250 $ 240Golub Capital Partners CLO LIII, Ser 2021-
53A, Cl E6.830%, VAR ICE LIBOR USD 3 Month
+ 6.700%, 07/20/2034(A) 410 407GoodLeap Sustainable Home Solutions
Trust, Ser 2021-4GS, Cl A1.930%, 07/20/2048(A) 161 157
Halsey Point CLO I, Ser 2019-1A, Cl F8.332%, VAR ICE LIBOR USD 3 Month
+ 8.200%, 01/20/2033(A) 290 272Hardee's Funding, Ser 2021-1A, Cl A2
2.865%, 06/20/2051(A) 160 157HGI CRE CLO, Ser 2021-FL1, Cl C
1.808%, VAR ICE LIBOR USD 1 Month + 1.700%, 06/16/2036(A) 330 327
LCM XXII, Ser 2018-22A, Cl DR5.632%, VAR ICE LIBOR USD 3 Month
+ 5.500%, 10/20/2028(A) 350 333Marathon CLO II, Ser 2005-2A
0.000%, 12/20/2019(A)(F)(L) 750 –Marathon CLO, Ser 2019-2A, Cl BA
3.432%, VAR ICE LIBOR USD 3 Month + 3.300%, 01/20/2033(A) 330 330
Neuberger Berman Loan Advisers CLO, Ser 2021-44A, Cl E
6.080%, VAR ICE LIBOR USD 3 Month + 6.000%, 10/16/2034(A) 490 488
Oaktree CLO, Ser 2019-1A, Cl D3.928%, VAR ICE LIBOR USD 3 Month
+ 3.800%, 04/22/2030(A) 250 244Ocean Trails CLO VI, Ser 2021-6A, Cl DRR
3.724%, VAR ICE LIBOR USD 3 Month + 3.600%, 07/15/2028(A) 340 339
Ocean Trails CLO X, Ser 2021-10A, Cl ER0.000%, 10/15/2034(A)(E)(L) 590 565
OZLM VII, Ser 2018-7RA, Cl CR3.122%, VAR ICE LIBOR USD 3 Month
+ 3.000%, 07/17/2029(A) 650 644OZLM XI, Ser 2017-11A, Cl BR
2.432%, VAR ICE LIBOR USD 3 Month + 2.300%, 10/30/2030(A) 600 601
Parallel, Ser 2020-1A, Cl CR2.132%, VAR ICE LIBOR USD 3 Month
+ 2.000%, 07/20/2029(A) 750 741Peace Park CLO, Ser 2021-1A, Cl E
6.138%, VAR ICE LIBOR USD 3 Month + 6.000%, 10/20/2034(A) 400 396
DescriptionFace Amount (Thousands)
Market Value ($ Thousands)
ASSET-BACKED SECURITIES (continued)Popular ABS Mortgage Pass-Through Trust,
Ser 2005-6, Cl A43.423%, 01/25/2036 $ 101 $ 101
RR, Ser 2021-18A, Cl D6.334%, VAR ICE LIBOR USD 3 Month
+ 6.250%, 10/15/2034(A) 750 746Sculptor CLO XXVI, Ser 2021-26A, Cl E
0.133%, VAR ICE LIBOR USD 3 Month 0.000%, 07/20/2034(A) 450 446
SMB Private Education Loan Trust, Ser 2021-A, Cl D1
3.860%, 01/15/2053(A) 690 679Structured Asset Securities Mortgage Loan
Trust, Ser 2006-GEL4, Cl M10.672%, VAR ICE LIBOR USD 1 Month
+ 0.570%, 10/25/2036(A) 1,348 1,341Sunnova Helios II, Ser 2019-AA, Cl C
5.320%, 06/20/2046(A) 485 505Sunrun Atlas Issuer, Ser 2019-2, Cl A
3.610%, 02/01/2055(A) 408 427Symphony CLO XIX, Ser 2018-19A, Cl E
5.322%, VAR ICE LIBOR USD 3 Month + 5.200%, 04/16/2031(A) 250 238
TCI-Symphony CLO, Ser 2021-1A, Cl ER26.868%, VAR ICE LIBOR USD 3 Month
+ 6.750%, 10/13/2032(A) 730 728Tikehau US CLO I, Ser 2021-1A, Cl E
7.126%, VAR ICE LIBOR USD 3 Month + 6.910%, 01/18/2035(A) 1,200 1,164
Voya CLO, Ser 2018-3A, Cl A1A1.274%, VAR ICE LIBOR USD 3 Month
+ 1.150%, 10/15/2031(A) 250 250Voya CLO, Ser 2021-3A, Cl DR
7.082%, VAR ICE LIBOR USD 3 Month + 6.950%, 04/20/2034(A) 260 258
Wachovia Asset Securitization Issuance II, Ser 2007-HE1, Cl A
0.242%, VAR ICE LIBOR USD 1 Month + 0.140%, 07/25/2037(A) 239 229
Whitehorse XII, Ser 2018-12A, Cl D3.774%, VAR ICE LIBOR USD 3 Month
+ 3.650%, 10/15/2031(A) 250 243Z Capital Credit Partners CLO, Ser 2021-1A,
Cl D4.350%, VAR ICE LIBOR USD 3 Month
+ 4.200%, 07/15/2033(A) 450 436 31,799
Total Asset-Backed Securities
(Cost $36,504) ($ Thousands) 32,636

SEI Institutional Managed Trust / Quarterly Report / December 31, 202132
SCHEDULE OF INVESTMENTS (Unaudited)December 31, 2021
Multi-Asset Income Fund (Continued)
SCHEDULE OF INVESTMENTS (Unaudited)December 31, 2021
Multi-Asset Income Fund (Continued)
Description SharesMarket Value
($ Thousands)
PREFERRED STOCK — 0.5%
Energy — 0.5%MPLX, 8.462% *(C)(F)(K) 70,655 $ 2,473Targa Resources, 9.500% *(C) 1,570 1,690
4,163Financials — 0.0%
B Riley Financial, 5.500% 15,750 398
Total Preferred Stock (Cost $4,339) ($ Thousands) 4,561
Face Amount (Thousands)
CONVERTIBLE BONDS — 0.5%Alarm.com CV to 6.7939
0.000% , 01/15/2026(A)(J) 57 51Cheesecake Factory CV to 12.755
0.375% , 06/15/2026 138 124Chegg CV to 9.2978
0.000% , 09/01/2026(J) 80 66DISH Network CV to 15.343
3.375% , 08/15/2026 610 577DraftKings CV to 10.543
1.660% , 03/15/2028(A)(J) 640 482Gannett CV to 200
6.000% , 12/01/2027 240 304Granite Point Mortgage Trust CV to 51.994
5.625% , 12/01/2022(A) 580 577Halozyme Therapeutics CV to 12.958
0.250% , 03/01/2027(A) 390 347Liberty Latin America CV to 48.432
2.000% , 07/15/2024 140 138NIO CV to 10.7458
0.500% , 02/01/2027(A) 1,350 1,141Spirit Airlines CV to 20.3791
1.000% , 05/15/2026 560 483
Total Convertible Bonds(Cost $4,392) ($ Thousands) 4,290
MUNICIPAL BOND — 0.0%Illinois — 0.0%
Illinois State, Build America Bonds, GO
7.350%, 07/01/2035 $ 225 $ 283
Total Municipal Bond
(Cost $249) ($ Thousands) 283
DescriptionFace Amount (Thousands)
Market Value ($ Thousands)
U.S. TREASURY OBLIGATION — 0.0%U.S. Treasury Bond
2.000%, 11/15/2041 $ 80 $ 81
Total U.S. Treasury Obligation(Cost $81) ($ Thousands) 81
Number of Warrants
WARRANTS — 0.0%Noble Corp, Expires 02/05/2028
Strike Price $0.01 * 5,574 59
Total Warrants(Cost $13) ($ Thousands) 59
Total Investments in Securities — 94.5%(Cost $820,720) ($ Thousands) $ 868,286
ContractsPURCHASED OPTIONS* — 0.0%Total Purchased Options (M)
(Cost $573) ($ Thousands) 2,090,173 $ 196
PURCHASED SWAPTION** — 0.0% Total Purchased Swaption (N)
(Cost $15) ($ Thousands) 3,400,000 $ 13
WRITTEN OPTIONS* — (0.4)%Total Written Options (M)
(Premiums Received $2,663) ($ Thousands) (4,460,352) $ (3,521)
WRITTEN SWAPTION* — 0.0%Total Written Swaption (N)
(Premiums Received $20) ($ Thousands) (3,400,000) $ (3)

33SEI Institutional Managed Trust / Quarterly Report / December 31, 2021
SCHEDULE OF INVESTMENTS (Unaudited)December 31, 2021
Multi-Asset Income Fund (Continued)
A list of the open exchange traded options contracts held by the Fund at December 31, 2021 is as follows:
Description Number of ContractsNotional Amount
(Thousands)†† Exercise Price Expiration DateValue
(Thousands)
PURCHASED OPTIONS — 0.0%
Put OptionsMarch 2022, S&P 500 E-mini Option* 20 $ 74 $4,300.00 3/19/2022 $ 46February 2022, S&P 500 E-mini 3rd Week Option* 63 218 4,300.00 2/19/2022 74February 2022, S&P 500 E-mini 3rd Week Option* 29 110 4,200.00 2/19/2022 26February 2022, S&P 500 E-mini 3rd Week Option* 35 70 4,100.00 2/19/2022 24January 2022, S&P 500 E-mini 3rd Week Option* 26 70 4,200.00 1/22/2022 6USD Put/ MXN Call* 260,000 4 21.24 2/19/2022 8USD Put/ RUB Call* 1,830,000 27 73.00 2/19/2022 12
– –
– – – –
– – – –
Total Purchased Options $ 573 $ 196WRITTEN OPTIONS — ((0.4))%
Put OptionsMarch 2022, S&P 500 E-mini Option* (20) $ (40) 4,000.00 03/19/22 $ (24)January 2022, S&P 500 E-mini 3rd Week Option* (26) (37) 3,900.00 01/22/22 (3)February 2022, S&P 500 E-mini 3rd Week Option* (68) (135) 4,000.00 02/19/22 (37)USD Put/ RUB Call* (1,290,000) (9) 70.83 01/22/22 –
– – – –
(221) (64)
Call OptionsSPX US Index Option* (119) $ (1,111) 4,685.00 01/22/22 $ (1,439)SPX US Index Option* (119) (1,284) 4,625.00 01/22/22 (1,998)USD Call/ BRL Put* (1,080,000) (16) 6.23 01/22/22 –USD Call/ MXN Put* (260,000) (5) 22.38 02/19/22 –USD Call/ RUB Put* (1,830,000) (26) 78.00 02/19/22 (20)
– – – –
(2,442) (3,457)
Total Written Options $ (2,663) $ (3,521)
††Represents Cost

SEI Institutional Managed Trust / Quarterly Report / December 31, 202134
SCHEDULE OF INVESTMENTS (Unaudited)December 31, 2021
Multi-Asset Income Fund (Continued)
SCHEDULE OF INVESTMENTS (Unaudited)December 31, 2021
Multi-Asset Income Fund (Continued)
A list of the open OTC swaption contracts held by the Fund at December 31, 2021 is as follows:
Description CounterpartyNumber of Contracts/
Notional Amount Exercise Price Expiration DateValue
(Thousands)
PURCHASED SWAPTION — 0.0%
Call SwaptionsSwaption Receiver* Bank of America Merrill Lynch 3,400,000 $109.00 01/22/2022 $ 13
WRITTEN SWAPTION — 0.0%
Put SwaptionsSwaption Payer* Bank of America Merrill Lynch (3,400,000) $106.00 01/22/2022 $ (3)
A list of the open futures contracts held by the Fund at December 31, 2021 is as follows:
Type of ContractNumber of Contracts
Expiration Date
Notional Amount (Thousands) Value (Thousands)
Unrealized Appreciation/ (Depreciation) (Thousands)
Long Contracts90-Day Euro$ 586 Dec-2023 $ 144,612 $ 144,171 $ (442)Australian 10-Year Bond 21 Mar-2022 2,087 2,125 1Euro-Bob 5 Mar-2022 757 758 (7)S&P 500 Index E-MINI 109 Mar-2022 25,611 25,934 323U.S. 2-Year Treasury Note 595 Apr-2022 129,925 129,812 (113)U.S. 10-Year Treasury Note 19 Mar-2022 2,347 2,479 132U.S. Long Treasury Bond 92 Mar-2022 14,536 14,760 224U.S. Ultra Long Treasury Bond 138 Mar-2022 26,745 27,203 458Ultra 10-Year U.S. Treasury Note 21 Mar-2022 3,059 3,075 16
349,679 350,317 592Short Contracts
Euro-Bund (39) Mar-2022 $ (7,635) $ (7,600) $ 98U.S. 5-Year Treasury Note (150) Apr-2022 (18,220) (18,147) 74
(25,855) (25,747) 172 $ 323,824 $ 324,570 $ 764
A list of the open forward foreign currency contracts held by the Fund at December 31, 2021 is as follows:
Counterparty Settlement DateCurrency to Deliver
(Thousands)Currency to Receive
(Thousands)
Unrealized Appreciation
(Depreciation) (Thousands)
BNP Paribas 01/18/22 USD 563 RUB 41,789 $ (7)
BNP Paribas 01/18/22 USD 780 AUD 1,050 (17)
BNP Paribas 01/18/22 CAD 1,910 USD 1,534 21
BNP Paribas 01/18/22 EUR 2,080 USD 2,412 46
BNP Paribas 01/18/22 EUR 1,400 USD 1,591 (1)
BNP Paribas 01/18/22 USD 7,141 NOK 62,489 (55)
BNP Paribas 01/18/22 MXN 15,200 USD 727 (13)
BNP Paribas 01/18/22 NOK 22,290 USD 2,637 110
Citigroup 01/18/22 USD 187 IDR 2,663,340 —
Citigroup 01/18/22 USD 197 RUB 14,600 (3)
Citigroup 01/18/22 USD 428 BRL 2,430 7Citigroup 01/18/22 - 01/24/22 USD 1,127 MXN 23,451 16
Citigroup 01/18/22 CAD 1,170 USD 930 4
Citigroup 01/18/22 CAD 38 USD 29 —
Citigroup 01/18/22 CNY 2,870 USD 441 (10)
Citigroup 01/18/22 EUR 2,023 USD 2,346 44
Citigroup 01/18/22 EUR 1,920 USD 2,176 (8)

35SEI Institutional Managed Trust / Quarterly Report / December 31, 2021
SCHEDULE OF INVESTMENTS (Unaudited)December 31, 2021
Multi-Asset Income Fund (Continued)
Counterparty Settlement DateCurrency to Deliver
(Thousands)Currency to Receive
(Thousands)
Unrealized Appreciation
(Depreciation) (Thousands)
Citigroup 01/18/22 MXN 5,300 USD 252 $ (7)
Citigroup 01/18/22 USD 1,701 CAD 2,175 21
Citigroup 01/18/22 USD 3,970 CAD 4,980 (27)
Citigroup 01/18/22 JPY 84,400 USD 747 14
Citigroup 01/18/22 IDR 108,900,950 USD 7,543 (102)
Deutsche Bank 02/10/22 EUR 23,271 USD 26,302 (181)
Goldman Sachs 01/18/22 NZD 410 USD 294 13
Goldman Sachs 01/18/22 USD 511 AUD 690 (10)
Goldman Sachs 01/18/22 USD 393 CAD 504 6
Goldman Sachs 01/18/22 USD 329 CAD 410 (5)
Goldman Sachs 01/18/22 AUD 850 USD 638 20
Goldman Sachs 01/18/22 EUR 410 USD 479 12
Goldman Sachs 01/18/22 EUR 1,450 USD 1,648 (2)
Goldman Sachs 01/18/22 GBP 2,310 USD 3,176 47
Goldman Sachs 01/18/22 USD 2,605 NOK 22,258 (81)
Goldman Sachs 01/18/22 USD 1,032 RUB 77,920 6
Goldman Sachs 01/18/22 USD 2,069 RUB 154,420 (11)
Goldman Sachs 01/18/22 USD 3,471 MXN 73,940 132
Goldman Sachs 01/18/22 CAD 3,520 USD 2,824 38
Goldman Sachs 01/18/22 MXN 47,540 USD 2,285 (32)
Goldman Sachs 01/18/22 JPY 110,440 USD 972 12
Goldman Sachs 01/18/22 RUB 347,866 USD 4,689 54
JPMorgan Chase Bank 01/13/22 SAR 14,390 USD 3,835 2
JPMorgan Chase Bank 01/18/22 USD 455 RUB 34,510 4
JPMorgan Chase Bank 01/18/22 AUD 1,220 USD 905 18
JPMorgan Chase Bank 01/18/22 AUD 630 USD 451 (7)
JPMorgan Chase Bank 01/18/22 USD 736 AUD 1,050 27
JPMorgan Chase Bank 01/18/22 USD 4,302 AUD 5,897 (15)
JPMorgan Chase Bank 01/21/22 GBP 1,354 USD 1,865 31
JPMorgan Chase Bank 02/10/22 EUR 365 USD 412 (3)
Morgan Stanley 01/18/22 JPY 3 USD 0 —
Morgan Stanley 01/18/22 USD 67 BRL 390 2
Morgan Stanley 01/18/22 EUR 590 USD 688 17
Morgan Stanley 01/18/22 USD 721 JPY 80,570 (21)
Morgan Stanley 01/18/22 USD 1,207 MXN 25,460 34
Morgan Stanley 01/18/22 NZD 1,490 USD 1,069 49
Morgan Stanley 01/18/22 USD 2,009 RUB 146,934 (51)
Morgan Stanley 01/18/22 USD 2,288 EUR 1,980 (36)
Morgan Stanley 01/18/22 AUD 2,230 USD 1,671 50
Morgan Stanley 01/18/22 AUD 400 USD 287 (4)
Morgan Stanley 01/18/22 CAD 2,220 USD 1,793 35
Morgan Stanley 01/18/22 CAD 500 USD 389 (7)
Morgan Stanley 01/18/22 USD 3,365 NZD 4,839 (54)
Morgan Stanley 01/18/22 USD 792 NOK 7,030 5
Morgan Stanley 01/18/22 USD 2,882 NOK 24,879 (61)
Morgan Stanley 01/18/22 USD 1,634 CAD 2,080 13
Morgan Stanley 01/18/22 USD 4,523 CAD 5,686 (22)
Morgan Stanley 01/18/22 BRL 6,676 USD 1,204 10
Morgan Stanley 01/18/22 MXN 8,310 USD 394 (10)

SEI Institutional Managed Trust / Quarterly Report / December 31, 202136
SCHEDULE OF INVESTMENTS (Unaudited)December 31, 2021
Multi-Asset Income Fund (Continued)
SCHEDULE OF INVESTMENTS (Unaudited)December 31, 2021
Multi-Asset Income Fund (Continued)
Counterparty Settlement DateCurrency to Deliver
(Thousands)Currency to Receive
(Thousands)
Unrealized Appreciation
(Depreciation) (Thousands)
Morgan Stanley 01/18/22 NOK 20,050 USD 2,384 $ 111
Morgan Stanley 02/17/22 RUB 83,577 USD 1,116 9 $ 177
A list of the open centrally cleared swap agreements held by the Fund at December 31, 2021 is as follows:
Credit Default Swaps
Reference Entity/ ObligationBuy/Sell
Protection(Pays)/
Receives RatePayment
Frequency Termination DateNotional Amount
(Thousands)Value
(Thousands)
Upfront Payments/ Receipts
(Thousands)
Net Unrealized Appreciation
(Depreciation) (Thousands)
CDS-DAIGR Sell 1.00% Quarterly 12/20/2024 (1,290) $ 24 $ 9 $ 15CDS-DAIGR Buy 1.00% Quarterly 12/20/2024 1,290 (30) (17) (13)
CDS-DIS Buy 1.00% Quarterly 06/20/2026 660 (20) (17) (3)CDS-F Sell 5.00% Quarterly 06/20/2026 (1,450) 220 188 32
CDS-GM Buy 5.00% Quarterly 06/20/2026 1,450 (255) (253) (2)CDS-VIAC Buy 1.00% Quarterly 06/20/2026 660 (8) (9) 1
CDX.NA.HY .3712 Buy 5.00% Quarterly 12/20/2026 3,853 (354) (352) (2)CDX.NA.HY.30 Sell 5.00% Quarterly 06/20/2023 (15,916) 721 356 365CDX.NA.HY.34 Sell 5.00% Quarterly 06/25/2025 (6,092) 495 (163) 658
CDX.NA.IG.34-V1 Sell 1.00% Quarterly 06/20/2025 (26,200) 498 274 224ICE CD Boeing Company Sell 1.00% Quarterly 06/20/2024 (525) 3 6 (3)
ICE CD CDXIG Sell 1.00% Quarterly 12/20/2024 (2,375) 43 37 6ICE CD Chile Sell 1.00% Quarterly 06/20/2024 (410) 7 6 1
ICE CD Columbia Sell 1.00% Quarterly 06/20/2024 (1,840) (14) 7 (21)ICE CD General Electric Company Sell 1.00% Quarterly 06/20/2026 (1,175) 19 17 2ICE CD Kingdom of Saudi Arabia Sell 1.00% Quarterly 06/20/2024 (5,490) 97 27 70
ICE CD Mexico Sell 1.00% Quarterly 12/20/2026 (1,160) 5 5 –ICE CD Peru Sell 1.00% Quarterly 12/20/2024 (980) 16 13 3
ICE CD Philippines Sell 1.00% Quarterly 12/20/2023 (740) 11 1 10ICE CD Qatar Sell 1.00% Quarterly 06/20/2024 (400) 8 5 3ICE CD Qatar Sell 1.00% Quarterly 12/20/2024 (860) 19 12 7
ICE CD Transocean Buy 1.00% Quarterly 12/20/2022 235 31 18 13 $ 1,536 $ 170 $ 1,366
Interest Rate Swaps
Fund Pays Fund ReceivesPayment
Frequency Termination Date Currency
Notional Amount
(Thousands)Value
(Thousands)
Upfront Payments/
Receipts (Thousands)
Net Unrealized Appreciation
(Depreciation) (Thousands)
BZDIOVRA 5.80% Monthly 01/02/2023 BRL 11,150 $ 111 $ 6 $ 105WIBR6M 3.50% Semi-Annually 03/16/2032 PLN 3,325 36 (2) 38
7.6% JIBA3M Quarterly 03/16/2032 ZAR 9,000 3 – 3SOFRRATE 1.50% Annually 03/16/2032 USD 890 (13) (17) 4
GBP @ 0.75% GBP SONIO 1Y Annually 03/16/2032 GBP 550 15 – 15EUR006M .25% Semi-Annually 03/16/2032 EUR 5,130 45 (64) 109MXIBTIIE 7.40% Monthly 03/03/2032 MXN 8,050 5 (1) 6KWCDC 1.75% Quarterly 09/15/2031 KRW 790,531 6 21 (15)
EUR006M 0.00% Semi-Annually 03/16/2029 EUR 4,270 55 (2) 573.25% WIBR6M Semi-Annually 03/16/2027 PLN 5,325 32 17 15
EUR006M (.25)% Semi-Annually 03/16/2027 EUR 1,630 28 14 14MXIBTIIE 7.40% Monthly 03/10/2027 MXN 53,010 11 (6) 172.50% CNY-CNREPOFIX Quarterly 12/15/2026 CNY 4,170 4 (4) 81.52% USD-SOFR-OIS Annually 11/20/2026 USD 4,830 (21) (9) (12)
USA-CPI-U 3.37% Annually 11/18/2026 USD 4,250 35 44 (9)CNY-CNREPOFIX Q CNY @ 2.75% Quarterly 09/15/2026 CNY 11,830 31 11 20
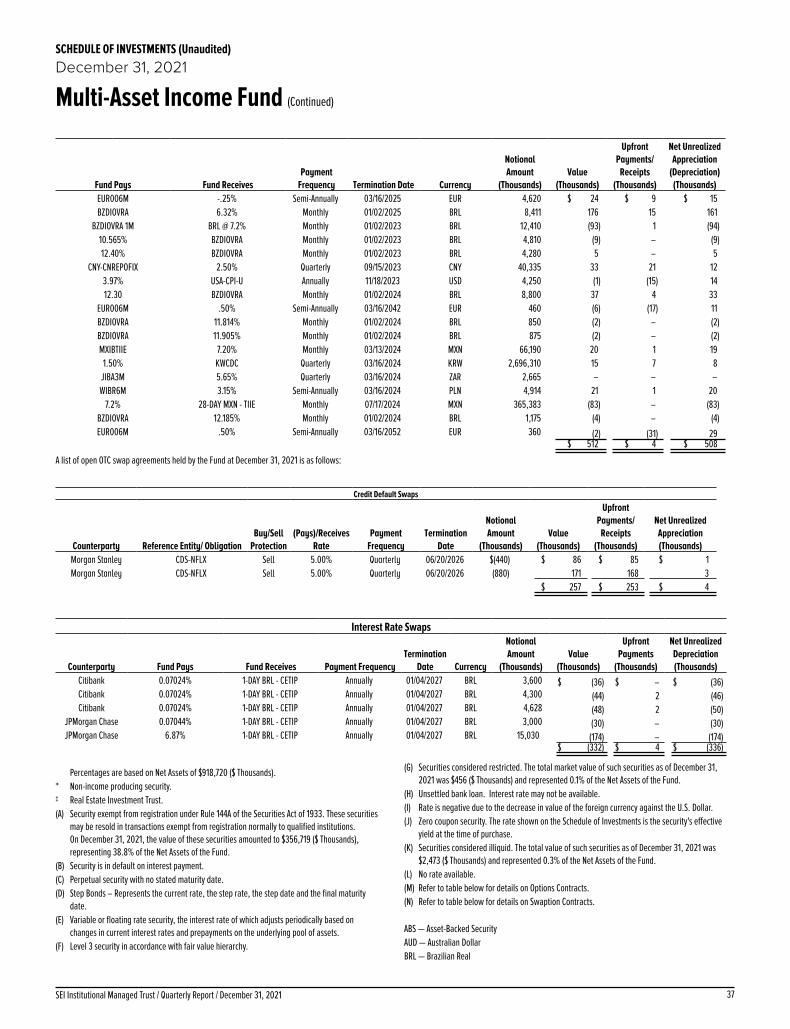
37SEI Institutional Managed Trust / Quarterly Report / December 31, 2021
SCHEDULE OF INVESTMENTS (Unaudited)December 31, 2021
Multi-Asset Income Fund (Continued)
Fund Pays Fund ReceivesPayment
Frequency Termination Date Currency
Notional Amount
(Thousands)Value
(Thousands)
Upfront Payments/
Receipts (Thousands)
Net Unrealized Appreciation
(Depreciation) (Thousands)
EUR006M -.25% Semi-Annually 03/16/2025 EUR 4,620 $ 24 $ 9 $ 15BZDIOVRA 6.32% Monthly 01/02/2025 BRL 8,411 176 15 161
BZDIOVRA 1M BRL @ 7.2% Monthly 01/02/2023 BRL 12,410 (93) 1 (94)10.565% BZDIOVRA Monthly 01/02/2023 BRL 4,810 (9) – (9)12.40% BZDIOVRA Monthly 01/02/2023 BRL 4,280 5 – 5
CNY-CNREPOFIX 2.50% Quarterly 09/15/2023 CNY 40,335 33 21 123.97% USA-CPI-U Annually 11/18/2023 USD 4,250 (1) (15) 1412.30 BZDIOVRA Monthly 01/02/2024 BRL 8,800 37 4 33
EUR006M .50% Semi-Annually 03/16/2042 EUR 460 (6) (17) 11BZDIOVRA 11.814% Monthly 01/02/2024 BRL 850 (2) – (2)BZDIOVRA 11.905% Monthly 01/02/2024 BRL 875 (2) – (2)MXIBTIIE 7.20% Monthly 03/13/2024 MXN 66,190 20 1 19
1.50% KWCDC Quarterly 03/16/2024 KRW 2,696,310 15 7 8JIBA3M 5.65% Quarterly 03/16/2024 ZAR 2,665 – – –WIBR6M 3.15% Semi-Annually 03/16/2024 PLN 4,914 21 1 20
7.2% 28-DAY MXN - TIIE Monthly 07/17/2024 MXN 365,383 (83) – (83)BZDIOVRA 12.185% Monthly 01/02/2024 BRL 1,175 (4) – (4)EUR006M .50% Semi-Annually 03/16/2052 EUR 360 (2) (31) 29
$ 512 $ 4 $ 508
A list of open OTC swap agreements held by the Fund at December 31, 2021 is as follows:
Credit Default Swaps
Counterparty Reference Entity/ ObligationBuy/Sell
Protection(Pays)/Receives
RatePayment
FrequencyTermination
Date
Notional Amount
(Thousands)Value
(Thousands)
Upfront Payments/
Receipts (Thousands)
Net Unrealized Appreciation (Thousands)
Morgan Stanley CDS-NFLX Sell 5.00% Quarterly 06/20/2026 $(440) $ 86 $ 85 $ 1Morgan Stanley CDS-NFLX Sell 5.00% Quarterly 06/20/2026 (880) 171 168 3
$ 257 $ 253 $ 4
Interest Rate Swaps
Counterparty Fund Pays Fund Receives Payment FrequencyTermination
Date Currency
Notional Amount
(Thousands)Value
(Thousands)
Upfront Payments
(Thousands)
Net Unrealized Depreciation (Thousands)
Citibank 0.07024% 1-DAY BRL - CETIP Annually 01/04/2027 BRL 3,600 $ (36) $ – $ (36)Citibank 0.07024% 1-DAY BRL - CETIP Annually 01/04/2027 BRL 4,300 (44) 2 (46)Citibank 0.07024% 1-DAY BRL - CETIP Annually 01/04/2027 BRL 4,628 (48) 2 (50)
JPMorgan Chase 0.07044% 1-DAY BRL - CETIP Annually 01/04/2027 BRL 3,000 (30) – (30)JPMorgan Chase 6.87% 1-DAY BRL - CETIP Annually 01/04/2027 BRL 15,030 (174) – (174)
$ (332) $ 4 $ (336)
Percentages are based on Net Assets of $918,720 ($ Thousands).* Non-income producing security.‡ Real Estate Investment Trust.(A) Security exempt from registration under Rule 144A of the Securities Act of 1933. These securities
may be resold in transactions exempt from registration normally to qualified institutions. On December 31, 2021, the value of these securities amounted to $356,719 ($ Thousands), representing 38.8% of the Net Assets of the Fund.
(B) Security is in default on interest payment.(C) Perpetual security with no stated maturity date.(D) Step Bonds – Represents the current rate, the step rate, the step date and the final maturity
date.(E) Variable or floating rate security, the interest rate of which adjusts periodically based on
changes in current interest rates and prepayments on the underlying pool of assets.(F) Level 3 security in accordance with fair value hierarchy.
(G) Securities considered restricted. The total market value of such securities as of December 31, 2021 was $456 ($ Thousands) and represented 0.1% of the Net Assets of the Fund.
(H) Unsettled bank loan. Interest rate may not be available.(I) Rate is negative due to the decrease in value of the foreign currency against the U.S. Dollar.(J) Zero coupon security. The rate shown on the Schedule of Investments is the security's effective
yield at the time of purchase.(K) Securities considered illiquid. The total value of such securities as of December 31, 2021 was
$2,473 ($ Thousands) and represented 0.3% of the Net Assets of the Fund.(L) No rate available.(M) Refer to table below for details on Options Contracts.(N) Refer to table below for details on Swaption Contracts.
ABS — Asset-Backed SecurityAUD — Australian DollarBRL — Brazilian Real
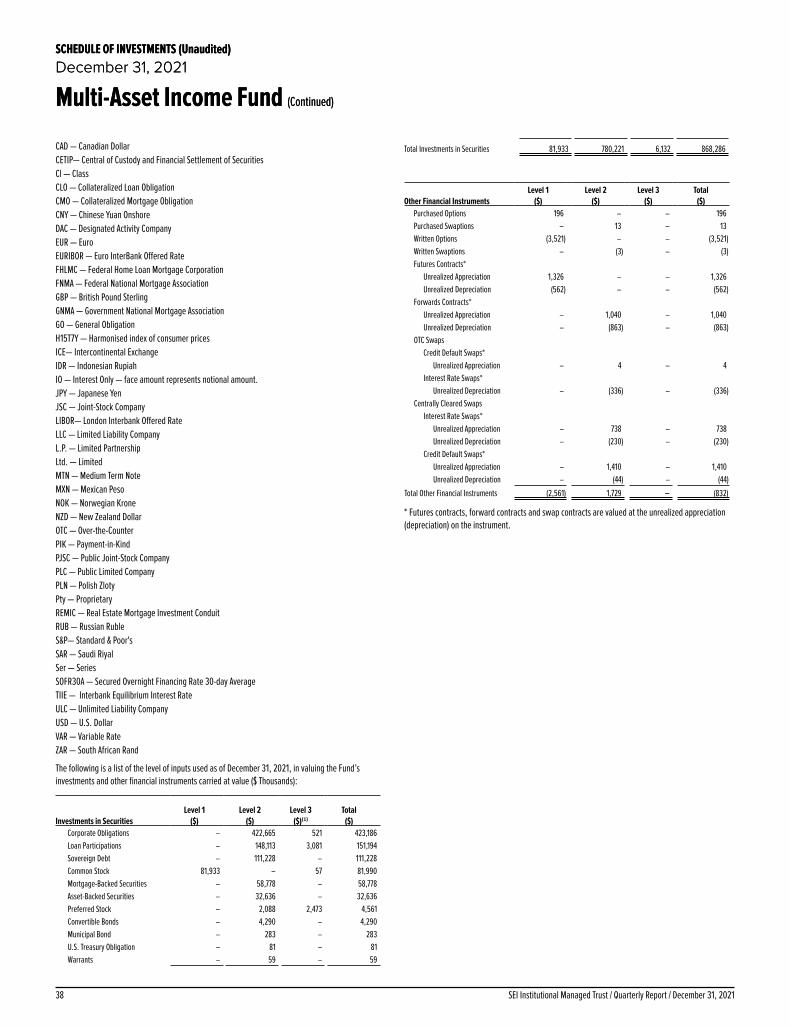
SEI Institutional Managed Trust / Quarterly Report / December 31, 202138
SCHEDULE OF INVESTMENTS (Unaudited)December 31, 2021
Multi-Asset Income Fund (Continued)
SCHEDULE OF INVESTMENTS (Unaudited)December 31, 2021
Multi-Asset Income Fund (Continued)
CAD — Canadian DollarCETIP— Central of Custody and Financial Settlement of SecuritiesCl — ClassCLO — Collateralized Loan ObligationCMO — Collateralized Mortgage ObligationCNY — Chinese Yuan Onshore DAC — Designated Activity CompanyEUR — EuroEURIBOR — Euro InterBank Offered RateFHLMC — Federal Home Loan Mortgage CorporationFNMA — Federal National Mortgage AssociationGBP — British Pound SterlingGNMA — Government National Mortgage AssociationGO — General ObligationH15T7Y — Harmonised index of consumer pricesICE— Intercontinental ExchangeIDR — Indonesian RupiahIO — Interest Only — face amount represents notional amount.JPY — Japanese YenJSC — Joint-Stock CompanyLIBOR— London Interbank Offered RateLLC — Limited Liability CompanyL.P. — Limited PartnershipLtd. — LimitedMTN — Medium Term NoteMXN — Mexican PesoNOK — Norwegian KroneNZD — New Zealand DollarOTC — Over-the-CounterPIK — Payment-in-KindPJSC — Public Joint-Stock CompanyPLC — Public Limited CompanyPLN — Polish ZlotyPty — ProprietaryREMIC — Real Estate Mortgage Investment ConduitRUB — Russian RubleS&P— Standard & Poor'sSAR — Saudi RiyalSer — SeriesSOFR30A — Secured Overnight Financing Rate 30-day AverageTIIE — Interbank Equilibrium Interest RateULC — Unlimited Liability CompanyUSD — U.S. DollarVAR — Variable RateZAR — South African Rand
The following is a list of the level of inputs used as of December 31, 2021, in valuing the Fund’s investments and other financial instruments carried at value ($ Thousands):
Investments in SecuritiesLevel 1
($)Level 2
($)Level 3
($)(1)Total
($)Corporate Obligations – 422,665 521 423,186Loan Participations – 148,113 3,081 151,194Sovereign Debt – 111,228 – 111,228Common Stock 81,933 – 57 81,990Mortgage-Backed Securities – 58,778 – 58,778Asset-Backed Securities – 32,636 – 32,636Preferred Stock – 2,088 2,473 4,561Convertible Bonds – 4,290 – 4,290Municipal Bond – 283 – 283U.S. Treasury Obligation – 81 – 81Warrants – 59 – 59
Total Investments in Securities 81,933 780,221 6,132 868,286
Other Financial InstrumentsLevel 1
($)Level 2
($)Level 3
($)Total
($)Purchased Options 196 – – 196Purchased Swaptions – 13 – 13Written Options (3,521) – – (3,521)Written Swaptions – (3) – (3)Futures Contracts*
Unrealized Appreciation 1,326 – – 1,326Unrealized Depreciation (562) – – (562)
Forwards Contracts*Unrealized Appreciation – 1,040 – 1,040Unrealized Depreciation – (863) – (863)
OTC SwapsCredit Default Swaps*
Unrealized Appreciation – 4 – 4Interest Rate Swaps*
Unrealized Depreciation – (336) – (336)Centrally Cleared Swaps
Interest Rate Swaps*Unrealized Appreciation – 738 – 738Unrealized Depreciation – (230) – (230)
Credit Default Swaps*Unrealized Appreciation – 1,410 – 1,410Unrealized Depreciation – (44) – (44)
Total Other Financial Instruments (2,561) 1,729 – (832)
* Futures contracts, forward contracts and swap contracts are valued at the unrealized appreciation (depreciation) on the instrument.

39SEI Institutional Managed Trust / Quarterly Report / December 31, 2021
SCHEDULE OF INVESTMENTS (Unaudited)December 31, 2021
Multi-Asset Income Fund (Continued)
The following is a reconciliation of the investments in which significant unobservable inputs (Level 3) were used in determining value ($ Thousands):
Investments in Corporate Obligations
Investments in Loan
ParticipationsInvestments in Common Stock
Investments in Preferred Stock
Balance as of October 1, 2021 $ 522 $ 760 $ 57 $ 2,332Accrued discounts/premiums – – – –Realized gain/(loss) – – – –Change in unrealized appreciation/
(depreciation) (1) – – –Purchases – – – 141Sales – – – –Net transfer into Level 3 – 2,321 – –Net transfer out of Level 3 – – – –Ending Balance as of December
31, 2021 $ 521 $ 3,081 $ 57 $ 2,473Changes in unrealized gains/(losses)
included in earnings related to securities still held at reporting date $ (1) $ 15 $ – $ –
For the period ended December 31, 2021, there were transfers into/out of Level 3 assets and liabilities due to the availability of observable inputs to determine fair value.
Amounts designated as “—” are either $0 or have been rounded to $0.
For information regarding the Fund’s policy regarding valuation of investments and other significant accounting policies, please refer to the Fund’s most recent semi-annual and annual financial statements.
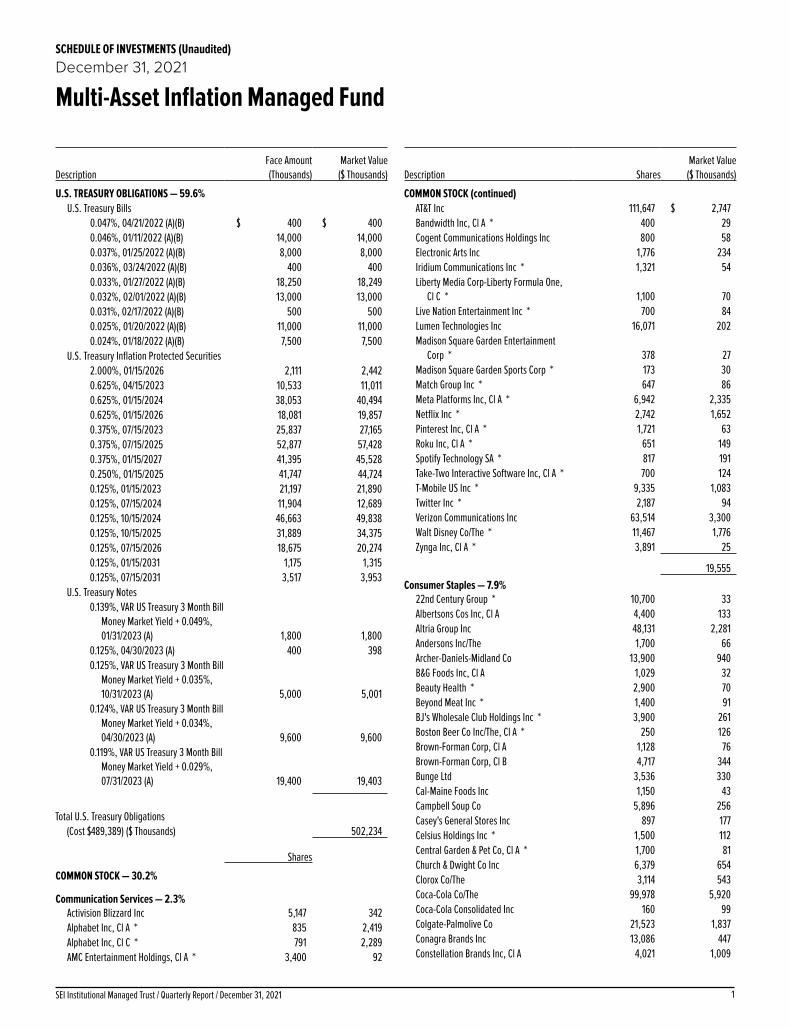
1SEI Institutional Managed Trust / Quarterly Report / December 31, 2021
SCHEDULE OF INVESTMENTS (Unaudited)December 31, 2021
Multi-Asset Inflation Managed Fund
DescriptionFace Amount (Thousands)
Market Value ($ Thousands)
U.S. TREASURY OBLIGATIONS — 59.6%U.S. Treasury Bills
0.047%, 04/21/2022 (A)(B) $ 400 $ 4000.046%, 01/11/2022 (A)(B) 14,000 14,0000.037%, 01/25/2022 (A)(B) 8,000 8,0000.036%, 03/24/2022 (A)(B) 400 4000.033%, 01/27/2022 (A)(B) 18,250 18,2490.032%, 02/01/2022 (A)(B) 13,000 13,0000.031%, 02/17/2022 (A)(B) 500 5000.025%, 01/20/2022 (A)(B) 11,000 11,0000.024%, 01/18/2022 (A)(B) 7,500 7,500
U.S. Treasury Inflation Protected Securities 2.000%, 01/15/2026 2,111 2,4420.625%, 04/15/2023 10,533 11,0110.625%, 01/15/2024 38,053 40,4940.625%, 01/15/2026 18,081 19,8570.375%, 07/15/2023 25,837 27,1650.375%, 07/15/2025 52,877 57,4280.375%, 01/15/2027 41,395 45,5280.250%, 01/15/2025 41,747 44,7240.125%, 01/15/2023 21,197 21,8900.125%, 07/15/2024 11,904 12,6890.125%, 10/15/2024 46,663 49,8380.125%, 10/15/2025 31,889 34,3750.125%, 07/15/2026 18,675 20,2740.125%, 01/15/2031 1,175 1,3150.125%, 07/15/2031 3,517 3,953
U.S. Treasury Notes 0.139%, VAR US Treasury 3 Month Bill
Money Market Yield + 0.049%, 01/31/2023 (A) 1,800 1,800
0.125%, 04/30/2023 (A) 400 3980.125%, VAR US Treasury 3 Month Bill
Money Market Yield + 0.035%, 10/31/2023 (A) 5,000 5,001
0.124%, VAR US Treasury 3 Month Bill Money Market Yield + 0.034%, 04/30/2023 (A) 9,600 9,600
0.119%, VAR US Treasury 3 Month Bill Money Market Yield + 0.029%, 07/31/2023 (A) 19,400 19,403
Total U.S. Treasury Obligations
(Cost $489,389) ($ Thousands) 502,234
Shares
COMMON STOCK — 30.2%
Communication Services — 2.3%Activision Blizzard Inc 5,147 342Alphabet Inc, Cl A * 835 2,419Alphabet Inc, Cl C * 791 2,289AMC Entertainment Holdings, Cl A * 3,400 92
Description SharesMarket Value
($ Thousands)
COMMON STOCK (continued)AT&T Inc 111,647 $ 2,747Bandwidth Inc, Cl A * 400 29Cogent Communications Holdings Inc 800 58Electronic Arts Inc 1,776 234Iridium Communications Inc * 1,321 54Liberty Media Corp-Liberty Formula One,
Cl C * 1,100 70Live Nation Entertainment Inc * 700 84Lumen Technologies Inc 16,071 202Madison Square Garden Entertainment
Corp * 378 27Madison Square Garden Sports Corp * 173 30Match Group Inc * 647 86Meta Platforms Inc, Cl A * 6,942 2,335Netflix Inc * 2,742 1,652Pinterest Inc, Cl A * 1,721 63Roku Inc, Cl A * 651 149Spotify Technology SA * 817 191Take-Two Interactive Software Inc, Cl A * 700 124T-Mobile US Inc * 9,335 1,083Twitter Inc * 2,187 94Verizon Communications Inc 63,514 3,300Walt Disney Co/The * 11,467 1,776Zynga Inc, Cl A * 3,891 25
19,555Consumer Staples — 7.9%
22nd Century Group * 10,700 33Albertsons Cos Inc, Cl A 4,400 133Altria Group Inc 48,131 2,281Andersons Inc/The 1,700 66Archer-Daniels-Midland Co 13,900 940B&G Foods Inc, Cl A 1,029 32Beauty Health * 2,900 70Beyond Meat Inc * 1,400 91BJ's Wholesale Club Holdings Inc * 3,900 261Boston Beer Co Inc/The, Cl A * 250 126Brown-Forman Corp, Cl A 1,128 76Brown-Forman Corp, Cl B 4,717 344Bunge Ltd 3,536 330Cal-Maine Foods Inc 1,150 43Campbell Soup Co 5,896 256Casey's General Stores Inc 897 177Celsius Holdings Inc * 1,500 112Central Garden & Pet Co, Cl A * 1,700 81Church & Dwight Co Inc 6,379 654Clorox Co/The 3,114 543Coca-Cola Co/The 99,978 5,920Coca-Cola Consolidated Inc 160 99Colgate-Palmolive Co 21,523 1,837Conagra Brands Inc 13,086 447Constellation Brands Inc, Cl A 4,021 1,009

SEI Institutional Managed Trust / Quarterly Report / December 31, 20212
SCHEDULE OF INVESTMENTS (Unaudited)December 31, 2021
Multi-Asset Inflation Managed Fund (Continued)
Description SharesMarket Value
($ Thousands)
COMMON STOCK (continued)Costco Wholesale Corp 11,228 $ 6,374Coty Inc, Cl A * 10,465 110Darling Ingredients Inc * 4,236 294Edgewell Personal Care Co 634 29elf Beauty Inc * 2,200 73Energizer Holdings Inc 2,113 85Estee Lauder Cos Inc/The, Cl A 6,003 2,222Flowers Foods Inc 5,007 138Freshpet Inc * 1,200 114General Mills Inc 15,595 1,051Grocery Outlet Holding Corp * 2,000 57Hain Celestial Group Inc/The * 2,234 95Herbalife Nutrition Ltd * 2,408 99Hershey Co/The 3,694 715Hormel Foods Corp 7,739 378Hostess Brands Inc, Cl A * 3,770 77Ingredion Inc 1,882 182Inter Parfums Inc 400 43J & J Snack Foods Corp 227 36J M Smucker Co/The 2,814 382John B Sanfilippo & Son Inc 500 45Kellogg Co 6,912 445Keurig Dr Pepper Inc 17,946 662Kimberly-Clark Corp 8,758 1,252Kraft Heinz Co/The 16,918 607Kroger Co/The 18,936 857Lamb Weston Holdings Inc 4,105 260Lancaster Colony Corp 550 91McCormick & Co Inc/MD 6,446 623Medifast Inc 354 74Molson Coors Beverage Co, Cl B 4,474 207Mondelez International Inc, Cl A 35,504 2,354Monster Beverage Corp * 9,321 895National Beverage Corp, Cl A 600 27Nu Skin Enterprises Inc, Cl A 1,143 58PepsiCo Inc 34,892 6,061Performance Food Group Co * 4,595 211Philip Morris International Inc 40,289 3,827Pilgrim's Pride Corp * 1,078 30Post Holdings Inc * 1,772 200PriceSmart Inc 600 44Primo Water Corp (C) 4,125 73Procter & Gamble Co/The 61,714 10,095Reynolds Consumer Products Inc 1,500 47Sanderson Farms Inc 601 115Seaboard Corp 7 28Simply Good Foods Co/The * 1,900 79Spectrum Brands Holdings Inc 1,066 108Sprouts Farmers Market Inc * 3,028 90Sysco Corp, Cl A 12,329 968TreeHouse Foods Inc * 1,231 50Tyson Foods Inc, Cl A 7,658 667
Description SharesMarket Value
($ Thousands)
COMMON STOCK (continued)United Natural Foods Inc * 1,600 $ 79US Foods Holding Corp * 5,956 207USANA Health Sciences Inc * 500 51Vector Group Ltd 1,429 16Walgreens Boots Alliance Inc 18,215 950Walmart Inc 36,328 5,256WD-40 Co 361 88
66,312Energy — 7.3%
Antero Midstream Corp 15,600 151Antero Resources Corp * 14,847 260APA Corp 18,448 496Arch Resources Inc 700 64Archrock Inc 9,200 69Aspen Aerogels Inc * 1,400 70Baker Hughes Co, Cl A 34,710 835Brigham Minerals Inc, Cl A 1,483 31Bristow Group Inc * 1,600 51Cactus Inc, Cl A 2,400 91California Resources 4,500 192Callon Petroleum * 1,900 90Centennial Resource Development Inc/
DE, Cl A * 9,000 54Centrus Energy Corp, Cl A * 900 45ChampionX Corp * 9,838 199Cheniere Energy Inc 11,232 1,139Chesapeake Energy Corp 5,000 323Chevron Corp 92,709 10,880Civitas Resources 2,807 137Clean Energy Fuels Corp * 7,200 44CNX Resources Corp * 11,260 155Comstock Resources * 3,200 26ConocoPhillips 65,402 4,721CONSOL Energy Inc * 1,900 43Continental Resources Inc/OK, Cl A 2,993 134Coterra Energy Inc 39,458 750Crescent Energy, Cl A 2,300 29Delek US Holdings Inc * 3,533 53Denbury * 2,700 207Devon Energy Corp 33,448 1,473DHT Holdings Inc 8,700 45Diamondback Energy Inc, Cl A 8,578 925DMC Global Inc * 1,200 47Dorian LPG Ltd 3,800 48Dril-Quip Inc * 2,488 49DT Midstream Inc 5,216 250Energy Fuels Inc/Canada * 7,500 57EOG Resources Inc 28,098 2,496EQT Corp 15,698 342Equitrans Midstream Corp 21,222 219Expro Group Holdings * 2,200 32

3SEI Institutional Managed Trust / Quarterly Report / December 31, 2021
SCHEDULE OF INVESTMENTS (Unaudited)December 31, 2021
Multi-Asset Inflation Managed Fund (Continued)
Description SharesMarket Value
($ Thousands)
COMMON STOCK (continued)Exxon Mobil Corp 205,769 $ 12,591Frontline Ltd 7,686 54Gevo * 11,600 50Golar LNG Ltd * 5,677 70Green Plains Inc * 1,900 66Halliburton Co 42,569 974Helix Energy Solutions Group Inc * 6,412 20Helmerich & Payne Inc 6,538 155Hess Corp 13,120 971HollyFrontier Corp 6,831 224International Seaways Inc 2,700 40Kinder Morgan Inc 95,687 1,518Kosmos Energy Ltd * 17,700 61Laredo Petroleum * 600 36Liberty Oilfield Services Inc, Cl A * 4,870 47Magnolia Oil & Gas Corp, Cl A 7,409 140Marathon Oil Corp 36,262 596Marathon Petroleum Corp 30,704 1,965Matador Resources Co 5,600 207Murphy Oil Corp 7,823 204Nabors Industries Ltd * 500 40New Fortress Energy Inc, Cl A 1,700 41NexTier Oilfield Solutions Inc * 9,300 33Northern Oil and Gas 2,400 49NOV Inc 22,223 301Oasis Petroleum Inc 900 113Occidental Petroleum Corp 39,809 1,154Oceaneering International Inc, Cl A * 7,177 81ONEOK Inc 21,254 1,249Ovintiv Inc 12,370 417Par Pacific Holdings Inc * 3,495 58Patterson-UTI Energy Inc 11,759 99PBF Energy Inc, Cl A * 5,520 72PDC Energy Inc, Cl A 4,514 220Peabody Energy Corp * 4,200 42Phillips 66 21,174 1,534Pioneer Natural Resources Co 10,572 1,923ProPetro Holding Corp * 2,694 22Range Resources Corp * 12,957 231Renewable Energy Group Inc * 1,700 72REX American Resources Corp * 307 29Schlumberger NV, Cl A 67,198 2,013Scorpio Tankers Inc 3,188 41SFL Corp Ltd 5,683 46SM Energy Co 6,400 189Southwestern Energy Co * 38,222 178Targa Resources Corp 10,559 552Tellurian * 17,300 53Texas Pacific Land Corp 300 375Uranium Energy * 16,300 55US Silica Holdings Inc * 4,400 41Valero Energy Corp 19,147 1,438
Description SharesMarket Value
($ Thousands)
COMMON STOCK (continued)Whiting Petroleum Corp * 2,300 $ 149Williams Cos Inc/The 60,544 1,577World Fuel Services Corp 3,440 91
61,889Health Care — 5.9%
10X Genomics Inc, Cl A * 922 137Abbott Laboratories 14,102 1,985AbbVie Inc 14,191 1,922ABIOMED Inc * 324 116Acadia Healthcare Co Inc, Cl A * 1,266 77ACADIA Pharmaceuticals Inc * 3,200 75Adaptive Biotechnologies Corp * 1,146 32Agilent Technologies Inc 2,398 383Agios Pharmaceuticals Inc * 800 26Align Technology Inc * 681 448Allakos Inc * 300 3Alnylam Pharmaceuticals Inc * 1,073 182Amedisys Inc * 200 32AmerisourceBergen Corp, Cl A 1,333 177Amgen Inc, Cl A 4,680 1,053Amicus Therapeutics Inc * 3,023 35AMN Healthcare Services Inc * 600 73Amphastar Pharmaceuticals Inc * 1,493 35Anthem Inc 1,963 910Apellis Pharmaceuticals * 1,200 57Apollo Medical Holdings Inc * 500 37Arena Pharmaceuticals Inc * 1,141 106Arrowhead Pharmaceuticals Inc * 926 61Arvinas Inc * 600 49Avanos Medical Inc * 858 30Avantor Inc * 5,306 224Baxter International Inc 4,157 357Beam Therapeutics * 400 32Becton Dickinson and Co 2,535 638Biogen Inc * 1,192 286Biohaven Pharmaceutical Holding Co Ltd * 500 69BioMarin Pharmaceutical Inc * 1,543 136Bio-Rad Laboratories Inc, Cl A * 142 107Bio-Techne Corp 328 170Bioxcel Therapeutics Inc * 1,100 22Blueprint Medicines Corp * 540 58Boston Scientific Corp * 12,493 531Bridgebio Pharma Inc * 1,050 18Bristol-Myers Squibb Co 18,057 1,126Bruker Corp 1,024 86Cardinal Health Inc 2,475 127CareDx Inc * 600 27Cassava Sciences Inc * 600 26Catalent Inc * 1,429 183Centene Corp * 4,650 383Cerner Corp 2,781 258

SEI Institutional Managed Trust / Quarterly Report / December 31, 20214
SCHEDULE OF INVESTMENTS (Unaudited)December 31, 2021
Multi-Asset Inflation Managed Fund (Continued)
Description SharesMarket Value
($ Thousands)
COMMON STOCK (continued)Change Healthcare Inc * 1,100 $ 24Charles River Laboratories International
Inc * 453 171Chemed Corp 150 79Cigna Corp 2,821 648CONMED Corp 400 57Cooper Cos Inc/The, Cl A 372 156CorVel Corp * 300 62Covetrus Inc * 1,935 39CVS Health Corp 10,478 1,081Cytokinetics Inc * 1,200 55Danaher Corp, Cl A 5,137 1,690DaVita Inc * 658 75Denali Therapeutics Inc * 800 36DENTSPLY SIRONA Inc 1,904 106Dexcom Inc * 807 433Editas Medicine Inc, Cl A * 800 21Edwards Lifesciences Corp, Cl A * 6,241 809Elanco Animal Health Inc * 4,300 122Eli Lilly & Co 6,922 1,912Emergent BioSolutions Inc * 700 30Enanta Pharmaceuticals Inc * 500 37Encompass Health Corp 978 64Ensign Group Inc/The 379 32Envista Holdings Corp * 1,700 77Exact Sciences Corp * 1,839 143Exelixis Inc * 2,304 42Fate Therapeutics Inc * 800 47Gilead Sciences Inc 10,594 769Globus Medical Inc, Cl A * 900 65Guardant Health Inc * 534 53Haemonetics Corp * 628 33Halozyme Therapeutics Inc * 1,268 51HCA Healthcare Inc 2,059 529Health Catalyst Inc * 1,000 40HealthEquity Inc * 600 27HealthStream Inc * 1,500 40Henry Schein Inc * 1,103 86Hologic Inc * 1,817 139Humana Inc 1,056 490iBio * 39,000 21ICU Medical Inc * 224 53IDEXX Laboratories Inc * 676 445Illumina Inc * 1,193 454Inari Medical Inc * 600 55Incyte Corp * 1,843 135Insmed Inc * 855 23Inspire Medical Systems Inc * 300 69Insulet Corp * 510 136Integer Holdings Corp * 500 43Integra LifeSciences Holdings Corp * 728 49Intellia Therapeutics Inc * 400 47
Description SharesMarket Value
($ Thousands)
COMMON STOCK (continued)Intra-Cellular Therapies Inc, Cl A * 1,200 $ 63Intuitive Surgical Inc * 2,799 1,006Invitae Corp * 648 10Ionis Pharmaceuticals Inc * 1,376 42Iovance Biotherapeutics Inc * 1,500 29IQVIA Holdings Inc * 1,482 418iRhythm Technologies Inc * 500 59Ironwood Pharmaceuticals Inc, Cl A * 2,400 28Johnson & Johnson 21,669 3,707Karuna Therapeutics Inc * 100 13Kodiak Sciences Inc * 400 34Laboratory Corp of America Holdings * 833 262LHC Group Inc * 400 55Ligand Pharmaceuticals Inc * 278 43Maravai LifeSciences Holdings Inc, Cl A * 600 25Masimo Corp * 492 144McKesson Corp 1,139 283Medpace Holdings Inc * 300 65Merck & Co Inc 19,793 1,517Merit Medical Systems Inc * 600 37Mesa Laboratories Inc 102 33Mettler-Toledo International Inc * 198 336Mirati Therapeutics Inc * 366 54Moderna Inc * 2,909 739ModivCare Inc * 205 30Molina Healthcare Inc * 438 139Natera Inc * 641 60Nektar Therapeutics, Cl A * 2,584 35Neogen Corp, Cl B * 938 43NeoGenomics Inc * 1,022 35Neurocrine Biosciences Inc * 928 79Nevro Corp * 200 16NextGen Healthcare Inc * 3,016 54Novavax Inc * 538 77Novocure Ltd * 900 68NuVasive Inc * 600 31Oak Street Health Inc * 800 27Omnicell Inc * 350 63Option Care Health Inc * 2,300 65Organon & Co 2,239 68Owens & Minor Inc 1,200 52Pacific Biosciences of California Inc * 1,400 29Pacira BioSciences Inc * 800 48Patterson Cos Inc 777 23Penumbra Inc * 250 72PerkinElmer Inc 1,022 205Pfizer Inc 44,235 2,612Phreesia * 800 33Premier Inc, Cl A 600 25Progyny Inc * 1,000 50PTC Therapeutics * 800 32QIAGEN NV * 2,604 145

5SEI Institutional Managed Trust / Quarterly Report / December 31, 2021
SCHEDULE OF INVESTMENTS (Unaudited)December 31, 2021
Multi-Asset Inflation Managed Fund (Continued)
Description SharesMarket Value
($ Thousands)
COMMON STOCK (continued)Quest Diagnostics Inc 933 $ 161Quidel Corp * 200 27Reata Pharmaceuticals Inc, Cl A * 300 8Regeneron Pharmaceuticals Inc * 823 520Repligen Corp * 488 129ResMed Inc 1,014 264Sage Therapeutics Inc * 897 38Sarepta Therapeutics Inc * 609 55Scholar Rock Holding Corp * 1,000 25Seagen Inc * 1,352 209Select Medical Holdings Corp 1,400 41Shockwave Medical Inc * 300 53STAAR Surgical Co * 180 16Stryker Corp 2,831 757Syneos Health Inc, Cl A * 1,173 120Tandem Diabetes Care Inc * 400 60Teladoc Health Inc * 1,461 134Teleflex Inc 392 129Tenet Healthcare Corp * 1,100 90TG Therapeutics Inc * 1,500 29Thermo Fisher Scientific Inc 3,227 2,153Twist Bioscience Corp * 400 31Ultragenyx Pharmaceutical Inc * 476 40United Therapeutics Corp * 461 100UnitedHealth Group Inc 7,640 3,836Universal Health Services Inc, Cl B 498 65Veeva Systems Inc, Cl A * 1,070 273Veracyte Inc * 1,100 45Vertex Pharmaceuticals Inc * 2,228 489Viatris Inc, Cl W * 8,940 121Vir Biotechnology * 800 33Waters Corp * 501 187West Pharmaceutical Services Inc 570 267Xencor Inc * 1,609 65Zentalis Pharmaceuticals * 600 50Zimmer Biomet Holdings Inc 1,746 222Zoetis Inc, Cl A 3,743 913
49,778Information Technology — 2.0%
Adobe Inc * 1,201 681Akamai Technologies Inc * 600 70Amdocs Ltd 953 71ANSYS Inc * 154 62Aspen Technology Inc * 476 72Autodesk Inc, Cl A * 463 130Automatic Data Processing Inc 1,240 306Avalara Inc * 300 39Bill.com Holdings Inc * 200 50Black Knight Inc * 400 33Block Inc, Cl A * 970 157Bottomline Technologies DE Inc * 717 40
Description SharesMarket Value
($ Thousands)
COMMON STOCK (continued)Broadridge Financial Solutions Inc 400 $ 73Cadence Design Systems Inc * 682 127Cass Information Systems Inc 800 31CDK Global Inc 1,165 49Ceridian HCM Holding Inc * 600 63Citrix Systems Inc 300 28Cloudflare Inc, Cl A * 600 79Cognizant Technology Solutions Corp, Cl A 1,545 137CommVault Systems Inc * 400 28Coupa Software Inc * 200 32Crowdstrike Holdings Inc, Cl A * 500 102Datadog Inc, Cl A * 675 120DocuSign Inc, Cl A * 500 76Dynatrace Inc * 900 54Elastic NV * 300 37EPAM Systems Inc * 102 68Fidelity National Information Services
Inc, Cl B 1,518 166Fiserv Inc, Cl A * 1,600 166Five9 Inc * 300 41FleetCor Technologies Inc * 205 46Fortinet Inc * 350 126Gartner Inc * 300 100Genpact Ltd 700 37Global Payments Inc 862 117Globant SA * 110 35Guidewire Software Inc, Cl Z * 500 57HubSpot Inc * 100 66International Business Machines Corp 2,250 301Intuit Inc 613 394Jack Henry & Associates Inc 351 59Manhattan Associates Inc * 314 49Mastercard Inc, Cl A 2,202 791Microsoft Corp 18,234 6,132MicroStrategy Inc, Cl A * 55 30MongoDB Inc, Cl A * 160 85NortonLifeLock Inc 1,406 37Nuance Communications Inc * 1,126 62Okta Inc, Cl A * 300 67Oracle Corp, Cl B 4,396 383PagerDuty Inc * 1,465 51Palantir Technologies Inc, Cl A * 3,800 69Palo Alto Networks Inc * 296 165Paychex Inc 1,075 147Paycom Software Inc * 101 42Paylocity Holding Corp * 200 47PayPal Holdings Inc * 2,877 543PTC Inc * 600 73RingCentral Inc, Cl A * 200 37salesforce.com Inc * 2,403 611ServiceNow Inc * 482 313Snowflake Inc, Cl A * 500 169

SEI Institutional Managed Trust / Quarterly Report / December 31, 20216
SCHEDULE OF INVESTMENTS (Unaudited)December 31, 2021
Multi-Asset Inflation Managed Fund (Continued)
Description SharesMarket Value
($ Thousands)
COMMON STOCK (continued)Splunk Inc * 458 $ 53SS&C Technologies Holdings Inc 560 46Synopsys Inc * 361 133Trade Desk Inc/The, Cl A * 1,000 92Twilio Inc, Cl A * 400 105Tyler Technologies Inc * 110 59Unity Software Inc * 500 72Verint Systems Inc * 600 32VeriSign Inc * 300 76Visa Inc, Cl A 4,187 907VMware Inc, Cl A 573 66Vonage Holdings Corp * 1,700 35WEX Inc * 200 28Workday Inc, Cl A * 451 123Zendesk Inc * 700 73Zoom Video Communications Inc, Cl A * 552 102Zscaler Inc * 160 51
16,482Real Estate — 3.2%
Agree Realty Corp ‡ 900 64Alexandria Real Estate Equities Inc ‡ 2,314 516American Campus Communities Inc ‡ 2,670 153American Homes 4 Rent, Cl A ‡ 5,294 231American Tower Corp, Cl A ‡ 6,827 1,997Americold Realty Trust ‡ 5,700 187Apartment Income REIT Corp ‡ 2,522 138Apartment Investment and Management
Co, Cl A ‡ 3,422 26Apple Hospitality Inc ‡ 2,514 41AvalonBay Communities Inc ‡ 1,953 493Boston Properties Inc ‡ 2,432 280Brandywine Realty Trust ‡ 1,921 26Brixmor Property Group Inc ‡ 5,385 137Broadstone Net Lease Inc, Cl A ‡ 3,600 89Camden Property Trust ‡ 1,403 251CareTrust REIT Inc ‡ 2,600 59CBRE Group Inc, Cl A * 5,176 562Corporate Office Properties Trust ‡ 1,815 51Cousins Properties Inc ‡ 2,828 114Crown Castle International Corp ‡ 6,504 1,358CubeSmart ‡ 3,181 181CyrusOne Inc ‡ 1,936 174DiamondRock Hospitality Co *‡ 6,600 63Digital Realty Trust Inc, Cl A ‡ 4,357 771DigitalBridge Group *‡ 8,366 70Douglas Elliman ‡ 715 8Douglas Emmett Inc ‡ 2,869 96Duke Realty Corp ‡ 6,165 405EastGroup Properties Inc ‡ 817 186Empire State Realty Trust Inc, Cl A ‡ 5,128 46EPR Properties, Cl A ‡ 1,053 50
Description SharesMarket Value
($ Thousands)
COMMON STOCK (continued)Equinix Inc ‡ 1,388 $ 1,174Equity LifeStyle Properties Inc ‡ 2,700 237Equity Residential ‡ 5,884 532Essential Properties Realty Trust Inc ‡ 1,802 52Essex Property Trust Inc ‡ 931 328eXp World Holdings Inc ‡ 500 17Extra Space Storage Inc ‡ 1,981 449Federal Realty Investment Trust ‡ 1,319 180First Industrial Realty Trust Inc ‡ 2,630 174Forestar Group Inc *‡ 2,200 48Four Corners Property Trust Inc ‡ 2,300 68Franklin Street Properties Corp ‡ 8,100 48Gaming and Leisure Properties Inc ‡ 3,901 190Getty Realty Corp ‡ 1,500 48Global Net Lease Inc ‡ 1,447 22Healthcare Realty Trust Inc ‡ 2,804 89Healthcare Trust of America Inc, Cl A ‡ 4,341 145Healthpeak Properties Inc ‡ 9,721 351Highwoods Properties Inc ‡ 2,151 96Host Hotels & Resorts Inc *‡ 10,788 188Howard Hughes Corp/The *‡ 1,009 103Hudson Pacific Properties Inc ‡ 2,482 61Independence Realty Trust ‡ 2,400 62Industrial Logistics Properties Trust ‡ 1,400 35Innovative Industrial Properties Inc, Cl A ‡ 300 79Invitation Homes Inc ‡ 9,712 440Iron Mountain Inc ‡ 4,836 253JBG SMITH Properties ‡ 2,100 60Jones Lang LaSalle Inc *‡ 824 222Kennedy-Wilson Holdings Inc ‡ 1,545 37Kilroy Realty Corp ‡ 1,928 128Kimco Realty Corp ‡ 8,281 204Kite Realty Group Trust ‡ 1,364 30Lamar Advertising Co, Cl A ‡ 1,184 144Life Storage Inc ‡ 1,450 222LXP Industrial Trust, Cl B ‡ 5,988 93Macerich Co/The ‡ 4,197 72Marcus & Millichap Inc *‡ 600 31Medical Properties Trust Inc ‡ 10,558 249Mid-America Apartment Communities Inc ‡ 1,719 394Monmouth Real Estate Investment Corp,
Cl A ‡ 2,406 50National Health Investors Inc ‡ 941 54National Retail Properties Inc ‡ 3,300 159National Storage Affiliates Trust ‡ 1,843 127Newmark Group Inc, Cl A ‡ 3,459 65Omega Healthcare Investors Inc ‡ 3,974 117Opendoor Technologies Inc *‡ 8,400 123Outfront Media Inc ‡ 2,922 78Park Hotels & Resorts Inc *‡ 4,754 90Pebblebrook Hotel Trust ‡ 2,977 67Physicians Realty Trust ‡ 3,578 67

7SEI Institutional Managed Trust / Quarterly Report / December 31, 2021
SCHEDULE OF INVESTMENTS (Unaudited)December 31, 2021
Multi-Asset Inflation Managed Fund (Continued)
Description SharesMarket Value
($ Thousands)
COMMON STOCK (continued)PotlatchDeltic Corp ‡ 1,163 $ 70Prologis Inc ‡ 11,495 1,935PS Business Parks Inc ‡ 302 56Public Storage ‡ 2,215 830Rayonier Inc ‡ 3,008 121Realty Income Corp ‡ 6,805 487Redfin Corp *‡ 1,609 62Regency Centers Corp ‡ 2,649 200Retail Opportunity Investments Corp ‡ 1,900 37Rexford Industrial Realty Inc ‡ 2,128 173RLJ Lodging Trust ‡ 4,599 64Ryman Hospitality Properties Inc *‡ 972 89Sabra Health Care Inc ‡ 3,595 49Saul Centers Inc ‡ 834 44SBA Communications Corp, Cl A ‡ 1,715 667Service Properties Trust ‡ 2,918 26Simon Property Group Inc ‡ 4,931 788SITE Centers Corp ‡ 3,200 51SL Green Realty Corp ‡ 953 68Spirit Realty Capital Inc ‡ 2,141 103St Joe Co/The ‡ 1,367 71STAG Industrial Inc ‡ 3,378 162STORE Capital Corp ‡ 5,355 184Sun Communities Inc ‡ 1,752 368Sunstone Hotel Investors Inc *‡ 6,306 74Terreno Realty Corp ‡ 1,178 100UDR Inc ‡ 4,288 257Uniti Group Inc ‡ 4,762 67Universal Health Realty Income Trust ‡ 400 24Urban Edge Properties ‡ 3,148 60Ventas Inc ‡ 6,283 321Veris Residential ‡ 3,324 61VICI Properties Inc ‡ 10,400 313Vornado Realty Trust ‡ 3,078 129Welltower Inc ‡ 7,156 614Weyerhaeuser Co ‡ 12,592 518WP Carey Inc ‡ 2,979 244Xenia Hotels & Resorts Inc *‡ 2,300 42Zillow Group Inc, Cl A *‡ 1,200 75Zillow Group Inc, Cl C *‡ 2,900 185
26,964Utilities — 1.6%
AES Corp/The 7,642 186Alliant Energy Corp 2,728 168Ameren Corp 2,854 254American Electric Power Co Inc 5,679 505American States Water Co 600 62American Water Works Co Inc 2,159 408Atmos Energy Corp 1,173 123Black Hills Corp, Cl A 1,000 71Brookfield Infrastructure, Cl A 655 45
Description SharesMarket Value
($ Thousands)
COMMON STOCK (continued)Brookfield Renewable Corp, Cl A 1,400 $ 51California Water Service Group, Cl A 400 29CenterPoint Energy Inc 6,808 190Clearway Energy Inc, Cl C 1,319 47CMS Energy Corp 3,304 215Consolidated Edison Inc 4,444 379Dominion Energy Inc 9,407 739DTE Energy Co 2,133 255Duke Energy Corp 8,523 894Edison International 3,980 272Entergy Corp 2,193 247Essential Utilities Inc 2,403 129Evergy Inc 2,501 172Eversource Energy 3,982 362Exelon Corp 10,962 633FirstEnergy Corp 7,022 292Hawaiian Electric Industries Inc 1,328 55IDACORP Inc, Cl A 700 79MDU Resources Group Inc 3,045 94MGE Energy Inc 600 49Middlesex Water Co 300 36National Fuel Gas Co 1,000 64New Jersey Resources Corp 1,400 57NextEra Energy Inc 21,744 2,030NiSource Inc 4,246 117NRG Energy Inc 3,305 142OGE Energy Corp 1,715 66ONE Gas Inc 494 38Ormat Technologies Inc 400 32PG&E Corp * 15,661 190Pinnacle West Capital Corp 1,650 116PNM Resources Inc 752 34Portland General Electric Co 1,076 57PPL Corp 9,216 277Public Service Enterprise Group Inc 6,237 416Sempra Energy 3,384 448SJW Group 900 66Southern Co/The 12,024 825Sunnova Energy International Inc * 1,100 31UGI Corp 1,847 85Unitil Corp 600 28Via Renewables Inc, Cl A 3,500 40Vistra Corp 7,078 161WEC Energy Group Inc 3,615 351Xcel Energy Inc 5,774 391
13,103
Total Common Stock
(Cost $152,594) ($ Thousands) 254,083

SEI Institutional Managed Trust / Quarterly Report / December 31, 20218
SCHEDULE OF INVESTMENTS (Unaudited)December 31, 2021
Multi-Asset Inflation Managed Fund (Continued)
DescriptionFace Amount (Thousands)
Market Value ($ Thousands)
CORPORATE OBLIGATIONS — 11.5%Communication Services — 0.8%
AT&T 4.300%, 12/15/2042 $ 231 $ 2613.500%, 09/15/2053 214 216
Baidu 3.425%, 04/07/2030 201 2111.625%, 02/23/2027 385 374
Cable One 4.000%, 11/15/2030 (D) 387 379
CCO Holdings 4.500%, 08/15/2030 (D) 63 654.500%, 06/01/2033 (D) 219 224
DISH DBS 5.250%, 12/01/2026 (D) 1,007 1,023
Lorca Telecom Bondco SAU 4.000%, 09/18/2027 EUR 237 274
Lumen Technologies 4.500%, 01/15/2029 (D) $ 596 577
Netflix 5.875%, 11/15/2028 812 976
Sirius XM Radio 4.000%, 07/15/2028 (D) 565 568
T-Mobile USA 3.400%, 10/15/2052 (D) 605 6023.375%, 04/15/2029 (D) 73 742.875%, 02/15/2031 374 3692.625%, 02/15/2029 123 121
Weibo 3.375%, 07/08/2030 1,395 1,381
7,695
Consumer Discretionary — 1.6%1011778 BC ULC / New Red Finance Inc
3.500%, 02/15/2029 (D) 813 804Adient Global Holdings
3.500%, 08/15/2024 EUR 122 140Advance Auto Parts
3.900%, 04/15/2030 $ 922 1,006Alibaba Group Holding
2.125%, 02/09/2031 1,209 1,167Altice Financing
3.000%, 01/15/2028 EUR 237 255Booking Holdings
4.625%, 04/13/2030 $ 1,080 1,262Carnival
4.000%, 08/01/2028 (D) 605 600Clarios Global
4.375%, 05/15/2026 (D) EUR 155 181Expedia Group
6.250%, 05/01/2025 (D) $ 24 274.625%, 08/01/2027 251 279
DescriptionFace Amount (Thousands)
Market Value ($ Thousands)
CORPORATE OBLIGATIONS (continued)General Motors
6.800%, 10/01/2027 $ 201 $ 2476.125%, 10/01/2025 145 167
Globo Comunicacao e Participacoes 4.875%, 01/22/2030 (D) 413 401
Harley-Davidson Financial Services 3.350%, 06/08/2025 (D) 1,308 1,370
Kimberly-Clark de Mexico 2.431%, 07/01/2031 (D) 300 296
Las Vegas Sands 3.900%, 08/08/2029 722 727
Levi Strauss 3.500%, 03/01/2031 (D) 401 409
Marriott International 5.750%, 05/01/2025 68 77
Mattel 3.750%, 04/01/2029 (D) 226 234
MDC Holdings 6.000%, 01/15/2043 389 492
MercadoLibre 2.375%, 01/14/2026 200 194
Newell Brands 4.700%, 04/01/2026 236 257
Nissan Motor 4.345%, 09/17/2027 (D) 1,086 1,172
Nobel Bidco BV 3.125%, 06/15/2028 EUR 106 118
Ross Stores 4.700%, 04/15/2027 $ 842 951
Royal Caribbean Cruises 11.500%, 06/01/2025 (D) 343 384
Summer BC Holdco B SARL 5.750%, 10/31/2026 EUR 237 280
Time Warner Cable 4.500%, 09/15/2042 $ 330 360
Wynn Macau 5.625%, 08/26/2028 (D) 348 322
14,179
Consumer Staples — 0.9%Albertsons
3.500%, 03/15/2029 (D) 408 409Altria Group
4.800%, 02/14/2029 167 1883.400%, 05/06/2030 745 771
BAT Capital 4.700%, 04/02/2027 475 5222.726%, 03/25/2031 521 5062.259%, 03/25/2028 1,337 1,303
BRF GmbH 4.350%, 09/29/2026 299 302

9SEI Institutional Managed Trust / Quarterly Report / December 31, 2021
SCHEDULE OF INVESTMENTS (Unaudited)December 31, 2021
Multi-Asset Inflation Managed Fund (Continued)
DescriptionFace Amount (Thousands)
Market Value ($ Thousands)
CORPORATE OBLIGATIONS (continued)Cencosud
5.150%, 02/12/2025 $ 724 $ 782InRetail Consumer
3.250%, 03/22/2028 (D) 321 318Natura Cosmeticos
4.125%, 05/03/2028 (D) 322 316Virgolino de Oliveira Finance
10.500%, 01/28/2018 (D)(E) 660 5
5,422
Energy — 1.2%BP Capital Markets America
2.939%, 06/04/2051 1,261 1,210Cenovus Energy
4.400%, 04/15/2029 1,334 1,4764.250%, 04/15/2027 52 57
Continental Resources 2.268%, 11/15/2026 (D) 1,050 1,042
Enbridge Energy Partners 7.375%, 10/15/2045 688 1,073
Energy Transfer 6.250%, 04/15/2049 413 540
Eni 4.250%, 05/09/2029 (D) 900 1,012
Marathon Petroleum 6.500%, 03/01/2041 175 2415.125%, 12/15/2026 227 258
Oleoducto Central 4.000%, 07/14/2027 (D) 438 436
ONEOK 6.350%, 01/15/2031 128 161
ONEOK Partners 6.125%, 02/01/2041 63 79
Petroleos Mexicanos MTN 6.750%, 09/21/2047 302 268
Tengizchevroil Finance International 3.250%, 08/15/2030 (D) 262 262
TransCanada PipeLines 6.100%, 06/01/2040 915 1,268
Transocean Poseidon 6.875%, 02/01/2027 (D) 294 284
9,667
Financials — 3.8%ABN AMRO Bank
4.750%, 07/28/2025 (D) 269 293Aircastle
5.250%, 08/11/2025 (D) 456 5014.250%, 06/15/2026 62 664.125%, 05/01/2024 181 1892.850%, 01/26/2028 (D) 904 909
DescriptionFace Amount (Thousands)
Market Value ($ Thousands)
CORPORATE OBLIGATIONS (continued)Alleghany
3.625%, 05/15/2030 $ 931 $ 1,009Aviation Capital Group
5.500%, 12/15/2024 (D) 455 4984.875%, 10/01/2025 (D) 182 1974.375%, 01/30/2024 (D) 161 1694.125%, 08/01/2025 (D) 6 63.500%, 11/01/2027 (D) 165 1691.950%, 01/30/2026 (D) 480 4681.950%, 09/20/2026 (D) 153 149
Banco de Credito del Peru MTN 3.125%, VAR US Treas Yield Curve
Rate T Note Const Mat 5 Yr + 3.000%, 07/01/2030 (D) 755 745
Banco Santander 7.500%, VAR USD ICE Swap 11:00 NY
5 Yr + 4.989%(F) 600 645Bank of America
6.500%, VAR ICE LIBOR USD 3 Month + 4.174%(F) 362 396
6.300%, VAR ICE LIBOR USD 3 Month + 4.553%(F) 233 262
1.734%, VAR United States Secured Overnight Financing Rate + 0.960%, 07/22/2027 1,198 1,189
Bank of New York Mellon 4.700%, VAR US Treas Yield Curve
Rate T Note Const Mat 5 Yr + 4.358%(F) 203 217
BNP Paribas 2.871%, VAR United States Secured
Overnight Financing Rate + 1.387%, 04/19/2032 (D) 806 817
CDBL Funding 1 MTN 3.500%, 10/24/2027 620 647
Charles Schwab 5.375%, VAR US Treas Yield Curve
Rate T Note Const Mat 5 Yr + 4.971%(F) 409 446
4.000%, VAR US Treas Yield Curve Rate T Note Const Mat 5 Yr + 3.168%(F) 756 771
Citigroup 5.950%, VAR ICE LIBOR USD 3 Month
+ 4.068%(F) 311 3204.075%, VAR ICE LIBOR USD 3 Month
+ 1.192%, 04/23/2029 334 3684.000%, VAR US Treas Yield Curve
Rate T Note Const Mat 5 Yr + 3.597%(F) 359 362
3.980%, VAR ICE LIBOR USD 3 Month + 1.338%, 03/20/2030 227 251

SEI Institutional Managed Trust / Quarterly Report / December 31, 202110
SCHEDULE OF INVESTMENTS (Unaudited)December 31, 2021
Multi-Asset Inflation Managed Fund (Continued)
DescriptionFace Amount (Thousands)
Market Value ($ Thousands)
CORPORATE OBLIGATIONS (continued)Credit Suisse Group
7.500%, VAR USD Swap Semi 30/360 5 Yr Curr + 4.598%(D)(F) $ 200 $ 216
7.500%, VAR USD Swap Semi 30/360 5 Yr Curr + 4.600%(F) 645 682
6.375%, VAR US Treas Yield Curve Rate T Note Const Mat 5 Yr + 4.822%(D)(F) 365 394
4.194%, VAR United States Secured Overnight Financing Rate + 3.730%, 04/01/2031 (D) 427 471
3.091%, VAR United States Secured Overnight Financing Rate + 1.730%, 05/14/2032 (D) 798 812
Deutsche Bank NY 3.961%, VAR United States Secured
Overnight Financing Rate + 2.581%, 11/26/2025 315 333
2.129%, VAR United States Secured Overnight Financing Rate + 1.870%, 11/24/2026 347 346
Discover Bank 4.682%, VAR USD Swap Semi 30/360
5 Yr Curr + 1.730%, 08/09/2028 475 497Discover Financial Services
6.125%, VAR US Treas Yield Curve Rate T Note Const Mat 5 Yr + 5.783%(F) 1,308 1,442
Fifth Third Bancorp 4.500%, VAR US Treas Yield Curve
Rate T Note Const Mat 5 Yr + 4.215%(F) 247 262
Goldman Sachs Group 4.125%, VAR US Treas Yield Curve
Rate T Note Const Mat 5 Yr + 2.949%(F) 328 333
2.615%, VAR United States Secured Overnight Financing Rate + 1.281%, 04/22/2032 805 811
2.383%, VAR United States Secured Overnight Financing Rate + 1.248%, 07/21/2032 238 234
Guardian Life Insurance of America 4.850%, 01/24/2077 (D) 145 189
HSBC Holdings 4.583%, VAR ICE LIBOR USD 3 Month
+ 1.535%, 06/19/2029 555 6224.292%, VAR ICE LIBOR USD 3 Month
+ 1.348%, 09/12/2026 261 282ING Groep
1.726%, VAR United States Secured Overnight Financing Rate + 1.005%, 04/01/2027 1,191 1,183
DescriptionFace Amount (Thousands)
Market Value ($ Thousands)
CORPORATE OBLIGATIONS (continued)JPMorgan Chase
3.599%, VAR ICE LIBOR USD 3 Month + 3.470%(F) $ 349 $ 351
2.580%, VAR United States Secured Overnight Financing Rate + 1.250%, 04/22/2032 805 815
JPMorgan Chase & Co 3.932%, VAR ICE LIBOR USD 3 Month
+ 3.800%(F) 289 2893.534%, VAR ICE LIBOR USD 3 Month
+ 3.320%(F) 171 172Lincoln National
4.200%, 03/15/2022 355 358Metropolitan Life Global Funding I
3.875%, 04/11/2022 (D) 275 278Morgan Stanley
3.734%, VAR ICE LIBOR USD 3 Month + 3.610%(F) 84 84
NatWest Group 2.544%, VAR ICE LIBOR USD 3 Month
+ 2.320%(F) 600 597OEC Finance
7.125%cash/0% PIK, 12/26/2046 (D) 251 10Santander Holdings USA
4.400%, 07/13/2027 405 444SLM
4.200%, 10/29/2025 699 731Standard Chartered
7.750%, VAR USD Swap Semi 30/360 5 Yr Curr + 5.723%(D)(F) 200 212
6.000%, VAR US Treas Yield Curve Rate T Note Const Mat 5 Yr + 5.661%(D)(F) 552 589
1.639%, VAR ICE LIBOR USD 3 Month + 1.510%(D)(F) 400 386
Swiss Re Finance Luxembourg 5.000%, VAR US Treas Yield Curve
Rate T Note Const Mat 5 Yr + 3.582%, 04/02/2049 600 671
Synchrony Financial 4.500%, 07/23/2025 548 5922.875%, 10/28/2031 328 327
Truist Financial 5.100%, VAR US Treas Yield Curve
Rate T Note Const Mat 10 Yr + 4.349%(F) 829 926
UniCredit 3.127%, VAR US Treas Yield Curve
Rate T Note Const Mat 1 Yr + 1.550%, 06/03/2032 (D) 201 199
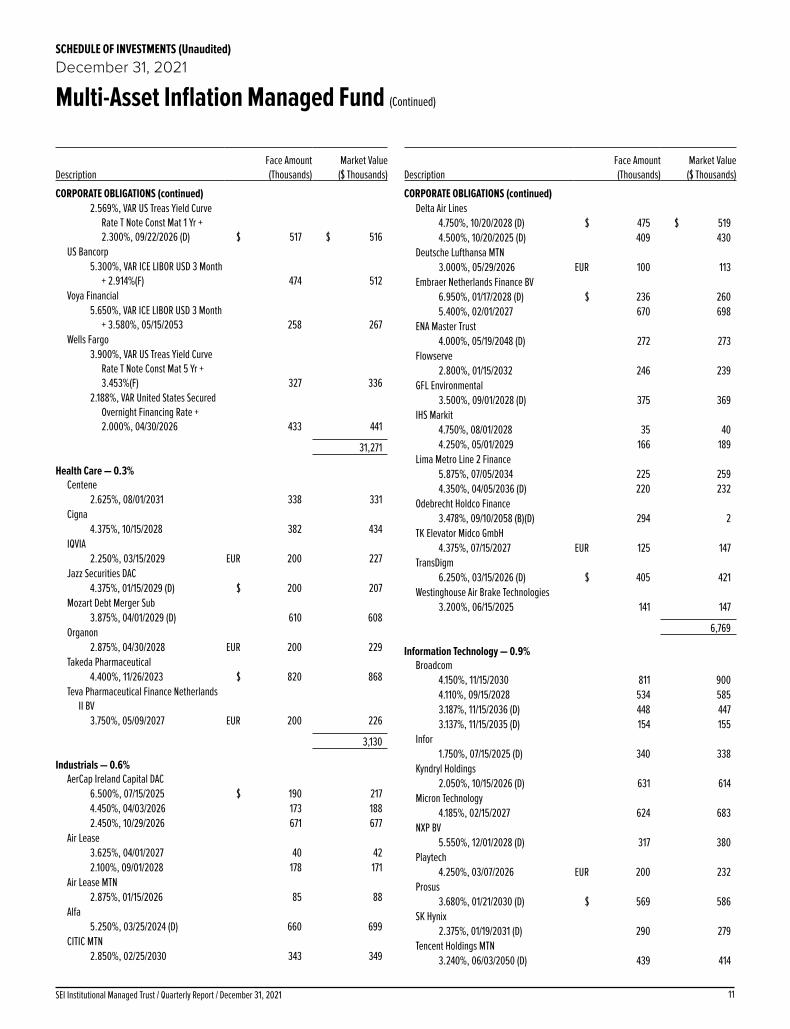
11SEI Institutional Managed Trust / Quarterly Report / December 31, 2021
SCHEDULE OF INVESTMENTS (Unaudited)December 31, 2021
Multi-Asset Inflation Managed Fund (Continued)
DescriptionFace Amount (Thousands)
Market Value ($ Thousands)
CORPORATE OBLIGATIONS (continued)2.569%, VAR US Treas Yield Curve
Rate T Note Const Mat 1 Yr + 2.300%, 09/22/2026 (D) $ 517 $ 516
US Bancorp 5.300%, VAR ICE LIBOR USD 3 Month
+ 2.914%(F) 474 512Voya Financial
5.650%, VAR ICE LIBOR USD 3 Month + 3.580%, 05/15/2053 258 267
Wells Fargo 3.900%, VAR US Treas Yield Curve
Rate T Note Const Mat 5 Yr + 3.453%(F) 327 336
2.188%, VAR United States Secured Overnight Financing Rate + 2.000%, 04/30/2026 433 441
31,271
Health Care — 0.3%Centene
2.625%, 08/01/2031 338 331Cigna
4.375%, 10/15/2028 382 434IQVIA
2.250%, 03/15/2029 EUR 200 227Jazz Securities DAC
4.375%, 01/15/2029 (D) $ 200 207Mozart Debt Merger Sub
3.875%, 04/01/2029 (D) 610 608Organon
2.875%, 04/30/2028 EUR 200 229Takeda Pharmaceutical
4.400%, 11/26/2023 $ 820 868Teva Pharmaceutical Finance Netherlands
II BV 3.750%, 05/09/2027 EUR 200 226
3,130
Industrials — 0.6%AerCap Ireland Capital DAC
6.500%, 07/15/2025 $ 190 2174.450%, 04/03/2026 173 1882.450%, 10/29/2026 671 677
Air Lease 3.625%, 04/01/2027 40 422.100%, 09/01/2028 178 171
Air Lease MTN 2.875%, 01/15/2026 85 88
Alfa 5.250%, 03/25/2024 (D) 660 699
CITIC MTN 2.850%, 02/25/2030 343 349
DescriptionFace Amount (Thousands)
Market Value ($ Thousands)
CORPORATE OBLIGATIONS (continued)Delta Air Lines
4.750%, 10/20/2028 (D) $ 475 $ 5194.500%, 10/20/2025 (D) 409 430
Deutsche Lufthansa MTN 3.000%, 05/29/2026 EUR 100 113
Embraer Netherlands Finance BV 6.950%, 01/17/2028 (D) $ 236 2605.400%, 02/01/2027 670 698
ENA Master Trust 4.000%, 05/19/2048 (D) 272 273
Flowserve 2.800%, 01/15/2032 246 239
GFL Environmental 3.500%, 09/01/2028 (D) 375 369
IHS Markit 4.750%, 08/01/2028 35 404.250%, 05/01/2029 166 189
Lima Metro Line 2 Finance 5.875%, 07/05/2034 225 2594.350%, 04/05/2036 (D) 220 232
Odebrecht Holdco Finance 3.478%, 09/10/2058 (B)(D) 294 2
TK Elevator Midco GmbH 4.375%, 07/15/2027 EUR 125 147
TransDigm 6.250%, 03/15/2026 (D) $ 405 421
Westinghouse Air Brake Technologies 3.200%, 06/15/2025 141 147
6,769
Information Technology — 0.9%Broadcom
4.150%, 11/15/2030 811 9004.110%, 09/15/2028 534 5853.187%, 11/15/2036 (D) 448 4473.137%, 11/15/2035 (D) 154 155
Infor 1.750%, 07/15/2025 (D) 340 338
Kyndryl Holdings 2.050%, 10/15/2026 (D) 631 614
Micron Technology 4.185%, 02/15/2027 624 683
NXP BV 5.550%, 12/01/2028 (D) 317 380
Playtech 4.250%, 03/07/2026 EUR 200 232
Prosus 3.680%, 01/21/2030 (D) $ 569 586
SK Hynix 2.375%, 01/19/2031 (D) 290 279
Tencent Holdings MTN 3.240%, 06/03/2050 (D) 439 414

SEI Institutional Managed Trust / Quarterly Report / December 31, 202112
SCHEDULE OF INVESTMENTS (Unaudited)December 31, 2021
Multi-Asset Inflation Managed Fund (Continued)
DescriptionFace Amount (Thousands)
Market Value ($ Thousands)
CORPORATE OBLIGATIONS (continued)2.390%, 06/03/2030 $ 320 $ 3131.810%, 01/26/2026 (D) 649 648
Western Digital 2.850%, 02/01/2029 132 133
6,707
Materials — 0.8%Alpek
4.250%, 09/18/2029 (D) 203 2163.250%, 02/25/2031 (D) 483 482
Ardagh Metal Packaging Finance USA 3.250%, 09/01/2028 (D) 538 532
Axalta Coating Systems 3.375%, 02/15/2029 (D) 648 627
Cemex 3.875%, 07/11/2031 (D) 610 608
CSN Resources 4.625%, 06/10/2031 (D) 291 277
GUSAP III 4.250%, 01/21/2030 (D) 675 716
Indonesia Asahan Aluminium Persero 4.750%, 05/15/2025 (D) 342 364
Industrias Penoles 4.750%, 08/06/2050 (D) 295 323
INEOS Quattro Finance 2 2.500%, 01/15/2026 (D) EUR 333 376
Ingevity 3.875%, 11/01/2028 (D) $ 537 523
Inversiones CMPC 4.375%, 05/15/2023 389 401
Suzano Austria GmbH 3.750%, 01/15/2031 173 1762.500%, 09/15/2028 923 891
Volcan Cia Minera SAA 4.375%, 02/11/2026 (D) 170 164
Yamana 2.630%, 08/15/2031 (D) 697 669
7,345
Real Estate — 0.1%Host Hotels & Resorts
4.000%, 06/15/2025 434 4603.500%, 09/15/2030 142 1462.900%, 12/15/2031 236 227
Vornado Realty 2.150%, 06/01/2026 403 403
1,236
Telecommunication Services — 0.0%Altice France
3.375%, 01/15/2028 EUR 117 129
DescriptionFace Amount (Thousands)
Market Value ($ Thousands)
CORPORATE OBLIGATIONS (continued)Utilities — 0.5%
AES Panama Generation Holdings SRL 4.375%, 05/31/2030 (D) $ 304 $ 316
Chile Electricity PEC 3.011%, 01/25/2028 (B)(D) 523 426
Comision Federal de Electricidad 3.348%, 02/09/2031 (D) 687 672
Duke Energy Carolinas NC Storm Funding 2.617%, 07/01/2041 403 407
Engie Energia Chile 3.400%, 01/28/2030 390 395
Terraform Global Operating 6.125%, 03/01/2026 (D) 74 75
Vistra 7.000%, VAR US Treas Yield Curve
Rate T Note Const Mat 5 Yr + 5.740%(D)(F) 286 290
Vistra Operations 4.375%, 05/01/2029 (D) 605 606
3,187
Total Corporate Obligations
(Cost $95,780) ($ Thousands) 96,737
MORTGAGE-BACKED SECURITIES — 8.2%Agency Mortgage-Backed Obligations — 2.6%
FHLMC CMO, Ser 2017-4693, Cl SL, IO6.040%, 06/15/2047(G) 1,361 252
FHLMC CMO, Ser 2020-4981, Cl HS, IO5.998%, 06/25/2050(G) 2,984 475
FHLMC CMO, Ser 2020-5015, Cl BI, IO4.000%, 09/25/2050(G) 1,911 325
FHLMC Multifamily Structured Credit Risk, Ser MN1, Cl M1
2.050%, VAR SOFR30A + 2.000%, 01/25/2051(D) 144 143
FHLMC STACR Debt Notes, Ser 2017-DNA3, Cl M2
2.603%, VAR ICE LIBOR USD 1 Month + 2.500%, 03/25/2030 447 456
FHLMC STACR Debt Notes, Ser 2017-HQA2, Cl M2B
2.753%, VAR ICE LIBOR USD 1 Month + 2.650%, 12/25/2029 649 665
FHLMC STACR Debt Notes, Ser 2017-HQA2, Cl M2
2.753%, VAR ICE LIBOR USD 1 Month + 2.650%, 12/25/2029 223 229
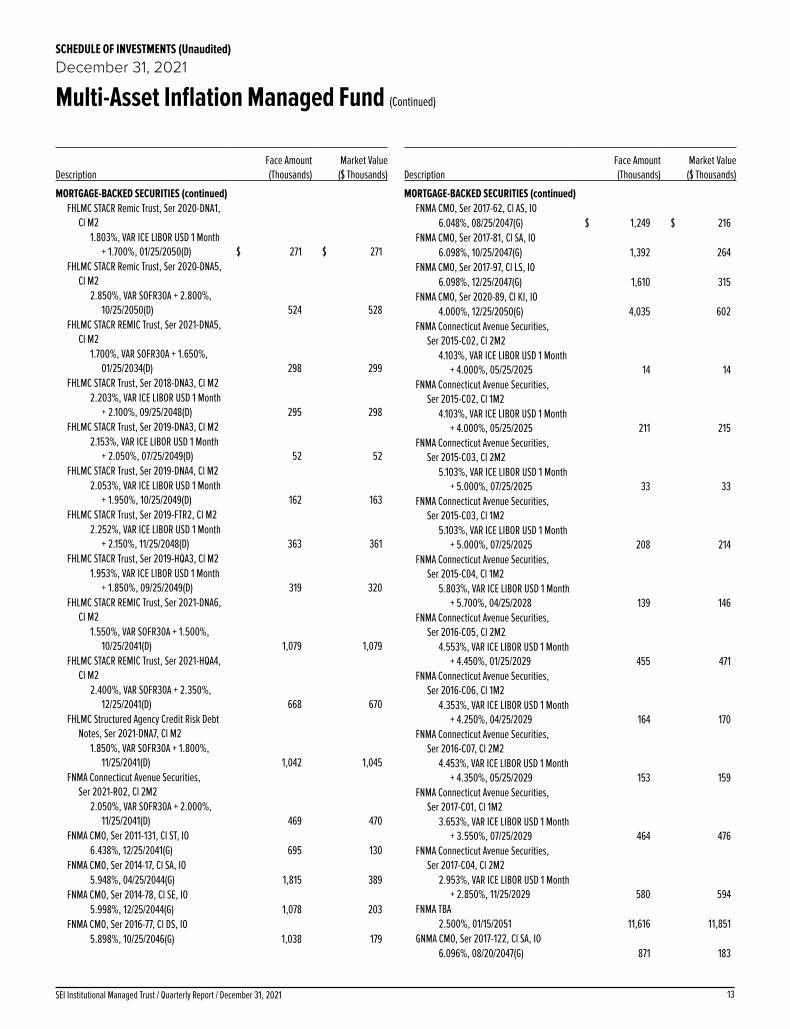
13SEI Institutional Managed Trust / Quarterly Report / December 31, 2021
SCHEDULE OF INVESTMENTS (Unaudited)December 31, 2021
Multi-Asset Inflation Managed Fund (Continued)
DescriptionFace Amount (Thousands)
Market Value ($ Thousands)
MORTGAGE-BACKED SECURITIES (continued)FHLMC STACR Remic Trust, Ser 2020-DNA1,
Cl M21.803%, VAR ICE LIBOR USD 1 Month
+ 1.700%, 01/25/2050(D) $ 271 $ 271FHLMC STACR Remic Trust, Ser 2020-DNA5,
Cl M22.850%, VAR SOFR30A + 2.800%,
10/25/2050(D) 524 528FHLMC STACR REMIC Trust, Ser 2021-DNA5,
Cl M21.700%, VAR SOFR30A + 1.650%,
01/25/2034(D) 298 299FHLMC STACR Trust, Ser 2018-DNA3, Cl M2
2.203%, VAR ICE LIBOR USD 1 Month + 2.100%, 09/25/2048(D) 295 298
FHLMC STACR Trust, Ser 2019-DNA3, Cl M22.153%, VAR ICE LIBOR USD 1 Month
+ 2.050%, 07/25/2049(D) 52 52FHLMC STACR Trust, Ser 2019-DNA4, Cl M2
2.053%, VAR ICE LIBOR USD 1 Month + 1.950%, 10/25/2049(D) 162 163
FHLMC STACR Trust, Ser 2019-FTR2, Cl M22.252%, VAR ICE LIBOR USD 1 Month
+ 2.150%, 11/25/2048(D) 363 361FHLMC STACR Trust, Ser 2019-HQA3, Cl M2
1.953%, VAR ICE LIBOR USD 1 Month + 1.850%, 09/25/2049(D) 319 320
FHLMC STACR REMIC Trust, Ser 2021-DNA6, Cl M2
1.550%, VAR SOFR30A + 1.500%, 10/25/2041(D) 1,079 1,079
FHLMC STACR REMIC Trust, Ser 2021-HQA4, Cl M2
2.400%, VAR SOFR30A + 2.350%, 12/25/2041(D) 668 670
FHLMC Structured Agency Credit Risk Debt Notes, Ser 2021-DNA7, Cl M2
1.850%, VAR SOFR30A + 1.800%, 11/25/2041(D) 1,042 1,045
FNMA Connecticut Avenue Securities, Ser 2021-R02, Cl 2M2
2.050%, VAR SOFR30A + 2.000%, 11/25/2041(D) 469 470
FNMA CMO, Ser 2011-131, Cl ST, IO6.438%, 12/25/2041(G) 695 130
FNMA CMO, Ser 2014-17, Cl SA, IO5.948%, 04/25/2044(G) 1,815 389
FNMA CMO, Ser 2014-78, Cl SE, IO5.998%, 12/25/2044(G) 1,078 203
FNMA CMO, Ser 2016-77, Cl DS, IO5.898%, 10/25/2046(G) 1,038 179
DescriptionFace Amount (Thousands)
Market Value ($ Thousands)
MORTGAGE-BACKED SECURITIES (continued)FNMA CMO, Ser 2017-62, Cl AS, IO
6.048%, 08/25/2047(G) $ 1,249 $ 216FNMA CMO, Ser 2017-81, Cl SA, IO
6.098%, 10/25/2047(G) 1,392 264FNMA CMO, Ser 2017-97, Cl LS, IO
6.098%, 12/25/2047(G) 1,610 315FNMA CMO, Ser 2020-89, Cl KI, IO
4.000%, 12/25/2050(G) 4,035 602FNMA Connecticut Avenue Securities,
Ser 2015-C02, Cl 2M24.103%, VAR ICE LIBOR USD 1 Month
+ 4.000%, 05/25/2025 14 14FNMA Connecticut Avenue Securities,
Ser 2015-C02, Cl 1M24.103%, VAR ICE LIBOR USD 1 Month
+ 4.000%, 05/25/2025 211 215FNMA Connecticut Avenue Securities,
Ser 2015-C03, Cl 2M25.103%, VAR ICE LIBOR USD 1 Month
+ 5.000%, 07/25/2025 33 33FNMA Connecticut Avenue Securities,
Ser 2015-C03, Cl 1M25.103%, VAR ICE LIBOR USD 1 Month
+ 5.000%, 07/25/2025 208 214FNMA Connecticut Avenue Securities,
Ser 2015-C04, Cl 1M25.803%, VAR ICE LIBOR USD 1 Month
+ 5.700%, 04/25/2028 139 146FNMA Connecticut Avenue Securities,
Ser 2016-C05, Cl 2M24.553%, VAR ICE LIBOR USD 1 Month
+ 4.450%, 01/25/2029 455 471FNMA Connecticut Avenue Securities,
Ser 2016-C06, Cl 1M24.353%, VAR ICE LIBOR USD 1 Month
+ 4.250%, 04/25/2029 164 170FNMA Connecticut Avenue Securities,
Ser 2016-C07, Cl 2M24.453%, VAR ICE LIBOR USD 1 Month
+ 4.350%, 05/25/2029 153 159FNMA Connecticut Avenue Securities,
Ser 2017-C01, Cl 1M23.653%, VAR ICE LIBOR USD 1 Month
+ 3.550%, 07/25/2029 464 476FNMA Connecticut Avenue Securities,
Ser 2017-C04, Cl 2M22.953%, VAR ICE LIBOR USD 1 Month
+ 2.850%, 11/25/2029 580 594FNMA TBA
2.500%, 01/15/2051 11,616 11,851GNMA CMO, Ser 2017-122, Cl SA, IO
6.096%, 08/20/2047(G) 871 183

SEI Institutional Managed Trust / Quarterly Report / December 31, 202114
SCHEDULE OF INVESTMENTS (Unaudited)December 31, 2021
Multi-Asset Inflation Managed Fund (Continued)
DescriptionFace Amount (Thousands)
Market Value ($ Thousands)
MORTGAGE-BACKED SECURITIES (continued)GNMA CMO, Ser 2017-134, Cl SE, IO
6.096%, 09/20/2047(G) $ 748 $ 119
25,044Non-Agency Mortgage-Backed Obligations — 5.6%
Alternative Loan Trust, Ser 2005-20CB, Cl 3A6
5.500%, 07/25/2035 52 45Alternative Loan Trust, Ser 2006-24CB,
Cl A165.750%, 08/25/2036 268 202
Alternative Loan Trust, Ser 2006-28CB, Cl A14
6.250%, 10/25/2036 197 140Alternative Loan Trust, Ser 2006-J1, Cl 1A13
5.500%, 02/25/2036 118 106Ashford Hospitality Trust, Ser 2018-KEYS,
Cl A1.110%, VAR ICE LIBOR USD 1 Month +
1.000%, 06/15/2035(D) 526 526BAMLL Commercial Mortgage Securities
Trust, Ser 2013-WBRK, Cl D3.534%, 03/10/2037(D)(G) 365 332
BAMLL Commercial Mortgage Securities Trust, Ser 2017-SCH, Cl AF
1.110%, VAR ICE LIBOR USD 1 Month + 1.000%, 11/15/2033(D) 1,610 1,605
BBCMS Mortgage Trust, Ser 2020-BID, Cl A2.250%, VAR ICE LIBOR USD 1 Month
+ 2.140%, 10/15/2037(D) 779 781BCP Trust, Ser 330N, Cl A
0.909%, VAR ICE LIBOR USD 1 Month + 0.799%, 06/15/2038(D) 152 150
Bellemeade Re, Ser 2018-3A, Cl M1B1.953%, VAR ICE LIBOR USD 1 Month
+ 1.850%, 10/25/2028(D) 311 311Bellemeade Re, Ser 2019-1A, Cl M1B
1.852%, VAR ICE LIBOR USD 1 Month + 1.750%, 03/25/2029(D) 592 592
Bellemeade Re, Ser 2019-2A, Cl M1C2.102%, VAR ICE LIBOR USD 1 Month
+ 2.000%, 04/25/2029(D) 481 481Bellemeade Re, Ser 2019-3A, Cl M1C
2.052%, VAR ICE LIBOR USD 1 Month + 1.950%, 07/25/2029(D) 340 340
Bellemeade Re, Ser 2019-3A, Cl M1B1.702%, VAR ICE LIBOR USD 1 Month
+ 1.600%, 07/25/2029(D) 441 441Bellemeade Re, Ser 2019-4A, Cl M1B
2.102%, VAR ICE LIBOR USD 1 Month + 2.000%, 10/25/2029(D) 675 675
DescriptionFace Amount (Thousands)
Market Value ($ Thousands)
MORTGAGE-BACKED SECURITIES (continued)Bellemeade Re, Ser 2020-2A, Cl M1B
3.292%, VAR ICE LIBOR USD 1 Month + 3.200%, 08/26/2030(D) $ 55 $ 55
Bellemeade Re, Ser 2020-4A, Cl M2A2.702%, VAR ICE LIBOR USD 1 Month
+ 2.600%, 06/25/2030(D) 55 55Bellemeade Re, Ser 2021-1A, Cl M1C
3.000%, VAR SOFR30A + 2.950%, 03/25/2031(D) 437 448
Bellemeade Re, Ser 2021-2A, Cl M1B1.550%, VAR SOFR30A + 1.500%,
06/25/2031(D) 704 703BFLD Trust, Ser FPM, Cl A
1.710%, VAR ICE LIBOR USD 1 Month + 1.600%, 06/15/2038(D) 1,189 1,188
BHMS, Ser 2018-ATLS, Cl A1.360%, VAR ICE LIBOR USD 1 Month
+ 1.250%, 07/15/2035(D) 774 774BX Commercial Mortgage Trust, Ser 2019-
IMC, Cl E2.260%, VAR ICE LIBOR USD 1 Month
+ 2.150%, 04/15/2034(D) 656 647BX Commercial Mortgage Trust, Ser 2019-
IMC, Cl D2.010%, VAR ICE LIBOR USD 1 Month
+ 1.900%, 04/15/2034(D) 162 160BX Trust, Ser 2018-EXCL, Cl A
1.198%, VAR ICE LIBOR USD 1 Month + 1.088%, 09/15/2037(D) 787 783
CFCRE Commercial Mortgage Trust, Ser 2016-C4, Cl A4
3.283%, 05/10/2058 670 704CGRBS Commercial Mortgage Trust,
Ser 2013-VN05, Cl A3.369%, 03/13/2035(D) 915 933
Chase Mortgage Finance Trust, Ser 2007-S5, Cl 1A17
6.000%, 07/25/2037 97 64Chase Mortgage Finance, Ser 2019-CL1,
Cl M32.202%, VAR ICE LIBOR USD 1 Month
+ 2.100%, 04/25/2047(D) 127 127CHL Mortgage Pass-Through Trust,
Ser 2006-10, Cl 1A86.000%, 05/25/2036 128 83
CHL Mortgage Pass-Through Trust, Ser 2006-13, Cl 1A19
6.250%, 09/25/2036 63 40Citigroup Commercial Mortgage Trust,
Ser 2013-GC11, Cl D4.418%, 04/10/2046(D)(G) 343 348
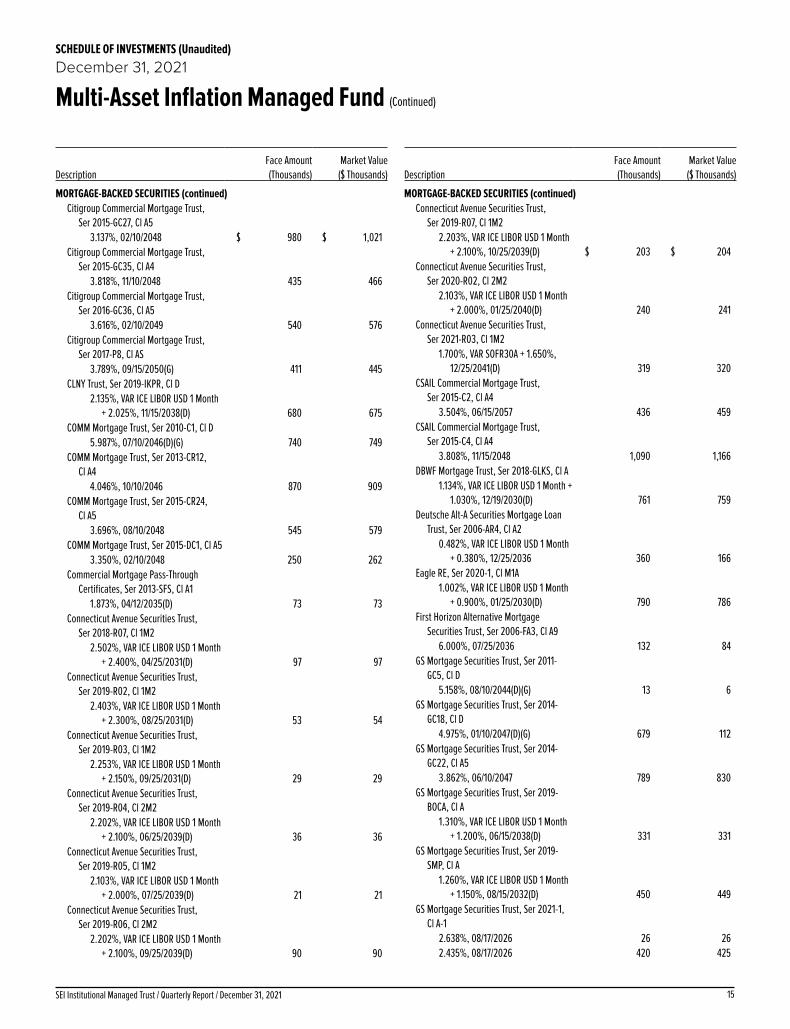
15SEI Institutional Managed Trust / Quarterly Report / December 31, 2021
SCHEDULE OF INVESTMENTS (Unaudited)December 31, 2021
Multi-Asset Inflation Managed Fund (Continued)
DescriptionFace Amount (Thousands)
Market Value ($ Thousands)
MORTGAGE-BACKED SECURITIES (continued)Citigroup Commercial Mortgage Trust,
Ser 2015-GC27, Cl A53.137%, 02/10/2048 $ 980 $ 1,021
Citigroup Commercial Mortgage Trust, Ser 2015-GC35, Cl A4
3.818%, 11/10/2048 435 466Citigroup Commercial Mortgage Trust,
Ser 2016-GC36, Cl A53.616%, 02/10/2049 540 576
Citigroup Commercial Mortgage Trust, Ser 2017-P8, Cl AS
3.789%, 09/15/2050(G) 411 445CLNY Trust, Ser 2019-IKPR, Cl D
2.135%, VAR ICE LIBOR USD 1 Month + 2.025%, 11/15/2038(D) 680 675
COMM Mortgage Trust, Ser 2010-C1, Cl D5.987%, 07/10/2046(D)(G) 740 749
COMM Mortgage Trust, Ser 2013-CR12, Cl A4
4.046%, 10/10/2046 870 909COMM Mortgage Trust, Ser 2015-CR24,
Cl A53.696%, 08/10/2048 545 579
COMM Mortgage Trust, Ser 2015-DC1, Cl A53.350%, 02/10/2048 250 262
Commercial Mortgage Pass-Through Certificates, Ser 2013-SFS, Cl A1
1.873%, 04/12/2035(D) 73 73Connecticut Avenue Securities Trust,
Ser 2018-R07, Cl 1M22.502%, VAR ICE LIBOR USD 1 Month
+ 2.400%, 04/25/2031(D) 97 97Connecticut Avenue Securities Trust,
Ser 2019-R02, Cl 1M22.403%, VAR ICE LIBOR USD 1 Month
+ 2.300%, 08/25/2031(D) 53 54Connecticut Avenue Securities Trust,
Ser 2019-R03, Cl 1M22.253%, VAR ICE LIBOR USD 1 Month
+ 2.150%, 09/25/2031(D) 29 29Connecticut Avenue Securities Trust,
Ser 2019-R04, Cl 2M22.202%, VAR ICE LIBOR USD 1 Month
+ 2.100%, 06/25/2039(D) 36 36Connecticut Avenue Securities Trust,
Ser 2019-R05, Cl 1M22.103%, VAR ICE LIBOR USD 1 Month
+ 2.000%, 07/25/2039(D) 21 21Connecticut Avenue Securities Trust,
Ser 2019-R06, Cl 2M22.202%, VAR ICE LIBOR USD 1 Month
+ 2.100%, 09/25/2039(D) 90 90
DescriptionFace Amount (Thousands)
Market Value ($ Thousands)
MORTGAGE-BACKED SECURITIES (continued)Connecticut Avenue Securities Trust,
Ser 2019-R07, Cl 1M22.203%, VAR ICE LIBOR USD 1 Month
+ 2.100%, 10/25/2039(D) $ 203 $ 204Connecticut Avenue Securities Trust,
Ser 2020-R02, Cl 2M22.103%, VAR ICE LIBOR USD 1 Month
+ 2.000%, 01/25/2040(D) 240 241Connecticut Avenue Securities Trust,
Ser 2021-R03, Cl 1M21.700%, VAR SOFR30A + 1.650%,
12/25/2041(D) 319 320CSAIL Commercial Mortgage Trust,
Ser 2015-C2, Cl A43.504%, 06/15/2057 436 459
CSAIL Commercial Mortgage Trust, Ser 2015-C4, Cl A4
3.808%, 11/15/2048 1,090 1,166DBWF Mortgage Trust, Ser 2018-GLKS, Cl A
1.134%, VAR ICE LIBOR USD 1 Month + 1.030%, 12/19/2030(D) 761 759
Deutsche Alt-A Securities Mortgage Loan Trust, Ser 2006-AR4, Cl A2
0.482%, VAR ICE LIBOR USD 1 Month + 0.380%, 12/25/2036 360 166
Eagle RE, Ser 2020-1, Cl M1A1.002%, VAR ICE LIBOR USD 1 Month
+ 0.900%, 01/25/2030(D) 790 786First Horizon Alternative Mortgage
Securities Trust, Ser 2006-FA3, Cl A96.000%, 07/25/2036 132 84
GS Mortgage Securities Trust, Ser 2011-GC5, Cl D
5.158%, 08/10/2044(D)(G) 13 6GS Mortgage Securities Trust, Ser 2014-
GC18, Cl D4.975%, 01/10/2047(D)(G) 679 112
GS Mortgage Securities Trust, Ser 2014-GC22, Cl A5
3.862%, 06/10/2047 789 830GS Mortgage Securities Trust, Ser 2019-
BOCA, Cl A1.310%, VAR ICE LIBOR USD 1 Month
+ 1.200%, 06/15/2038(D) 331 331GS Mortgage Securities Trust, Ser 2019-
SMP, Cl A1.260%, VAR ICE LIBOR USD 1 Month
+ 1.150%, 08/15/2032(D) 450 449GS Mortgage Securities Trust, Ser 2021-1,
Cl A-12.638%, 08/17/2026 26 262.435%, 08/17/2026 420 425
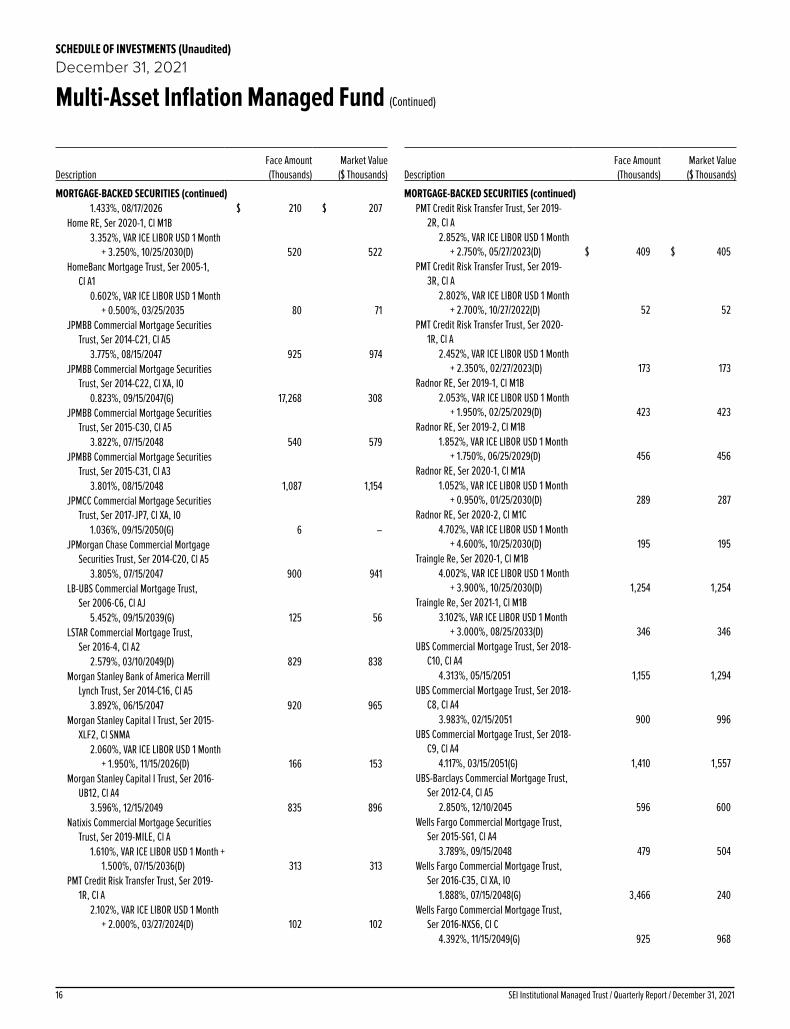
SEI Institutional Managed Trust / Quarterly Report / December 31, 202116
SCHEDULE OF INVESTMENTS (Unaudited)December 31, 2021
Multi-Asset Inflation Managed Fund (Continued)
DescriptionFace Amount (Thousands)
Market Value ($ Thousands)
MORTGAGE-BACKED SECURITIES (continued)1.433%, 08/17/2026 $ 210 $ 207
Home RE, Ser 2020-1, Cl M1B3.352%, VAR ICE LIBOR USD 1 Month
+ 3.250%, 10/25/2030(D) 520 522HomeBanc Mortgage Trust, Ser 2005-1,
Cl A10.602%, VAR ICE LIBOR USD 1 Month
+ 0.500%, 03/25/2035 80 71JPMBB Commercial Mortgage Securities
Trust, Ser 2014-C21, Cl A53.775%, 08/15/2047 925 974
JPMBB Commercial Mortgage Securities Trust, Ser 2014-C22, Cl XA, IO
0.823%, 09/15/2047(G) 17,268 308JPMBB Commercial Mortgage Securities
Trust, Ser 2015-C30, Cl A53.822%, 07/15/2048 540 579
JPMBB Commercial Mortgage Securities Trust, Ser 2015-C31, Cl A3
3.801%, 08/15/2048 1,087 1,154JPMCC Commercial Mortgage Securities
Trust, Ser 2017-JP7, Cl XA, IO1.036%, 09/15/2050(G) 6 –
JPMorgan Chase Commercial Mortgage Securities Trust, Ser 2014-C20, Cl A5
3.805%, 07/15/2047 900 941LB-UBS Commercial Mortgage Trust,
Ser 2006-C6, Cl AJ5.452%, 09/15/2039(G) 125 56
LSTAR Commercial Mortgage Trust, Ser 2016-4, Cl A2
2.579%, 03/10/2049(D) 829 838Morgan Stanley Bank of America Merrill
Lynch Trust, Ser 2014-C16, Cl A53.892%, 06/15/2047 920 965
Morgan Stanley Capital I Trust, Ser 2015-XLF2, Cl SNMA
2.060%, VAR ICE LIBOR USD 1 Month + 1.950%, 11/15/2026(D) 166 153
Morgan Stanley Capital I Trust, Ser 2016-UB12, Cl A4
3.596%, 12/15/2049 835 896Natixis Commercial Mortgage Securities
Trust, Ser 2019-MILE, Cl A1.610%, VAR ICE LIBOR USD 1 Month +
1.500%, 07/15/2036(D) 313 313PMT Credit Risk Transfer Trust, Ser 2019-
1R, Cl A2.102%, VAR ICE LIBOR USD 1 Month
+ 2.000%, 03/27/2024(D) 102 102
DescriptionFace Amount (Thousands)
Market Value ($ Thousands)
MORTGAGE-BACKED SECURITIES (continued)PMT Credit Risk Transfer Trust, Ser 2019-
2R, Cl A2.852%, VAR ICE LIBOR USD 1 Month
+ 2.750%, 05/27/2023(D) $ 409 $ 405PMT Credit Risk Transfer Trust, Ser 2019-
3R, Cl A2.802%, VAR ICE LIBOR USD 1 Month
+ 2.700%, 10/27/2022(D) 52 52PMT Credit Risk Transfer Trust, Ser 2020-
1R, Cl A2.452%, VAR ICE LIBOR USD 1 Month
+ 2.350%, 02/27/2023(D) 173 173Radnor RE, Ser 2019-1, Cl M1B
2.053%, VAR ICE LIBOR USD 1 Month + 1.950%, 02/25/2029(D) 423 423
Radnor RE, Ser 2019-2, Cl M1B1.852%, VAR ICE LIBOR USD 1 Month
+ 1.750%, 06/25/2029(D) 456 456Radnor RE, Ser 2020-1, Cl M1A
1.052%, VAR ICE LIBOR USD 1 Month + 0.950%, 01/25/2030(D) 289 287
Radnor RE, Ser 2020-2, Cl M1C4.702%, VAR ICE LIBOR USD 1 Month
+ 4.600%, 10/25/2030(D) 195 195Traingle Re, Ser 2020-1, Cl M1B
4.002%, VAR ICE LIBOR USD 1 Month + 3.900%, 10/25/2030(D) 1,254 1,254
Traingle Re, Ser 2021-1, Cl M1B3.102%, VAR ICE LIBOR USD 1 Month
+ 3.000%, 08/25/2033(D) 346 346UBS Commercial Mortgage Trust, Ser 2018-
C10, Cl A44.313%, 05/15/2051 1,155 1,294
UBS Commercial Mortgage Trust, Ser 2018-C8, Cl A4
3.983%, 02/15/2051 900 996UBS Commercial Mortgage Trust, Ser 2018-
C9, Cl A44.117%, 03/15/2051(G) 1,410 1,557
UBS-Barclays Commercial Mortgage Trust, Ser 2012-C4, Cl A5
2.850%, 12/10/2045 596 600Wells Fargo Commercial Mortgage Trust,
Ser 2015-SG1, Cl A43.789%, 09/15/2048 479 504
Wells Fargo Commercial Mortgage Trust, Ser 2016-C35, Cl XA, IO
1.888%, 07/15/2048(G) 3,466 240Wells Fargo Commercial Mortgage Trust,
Ser 2016-NXS6, Cl C4.392%, 11/15/2049(G) 925 968
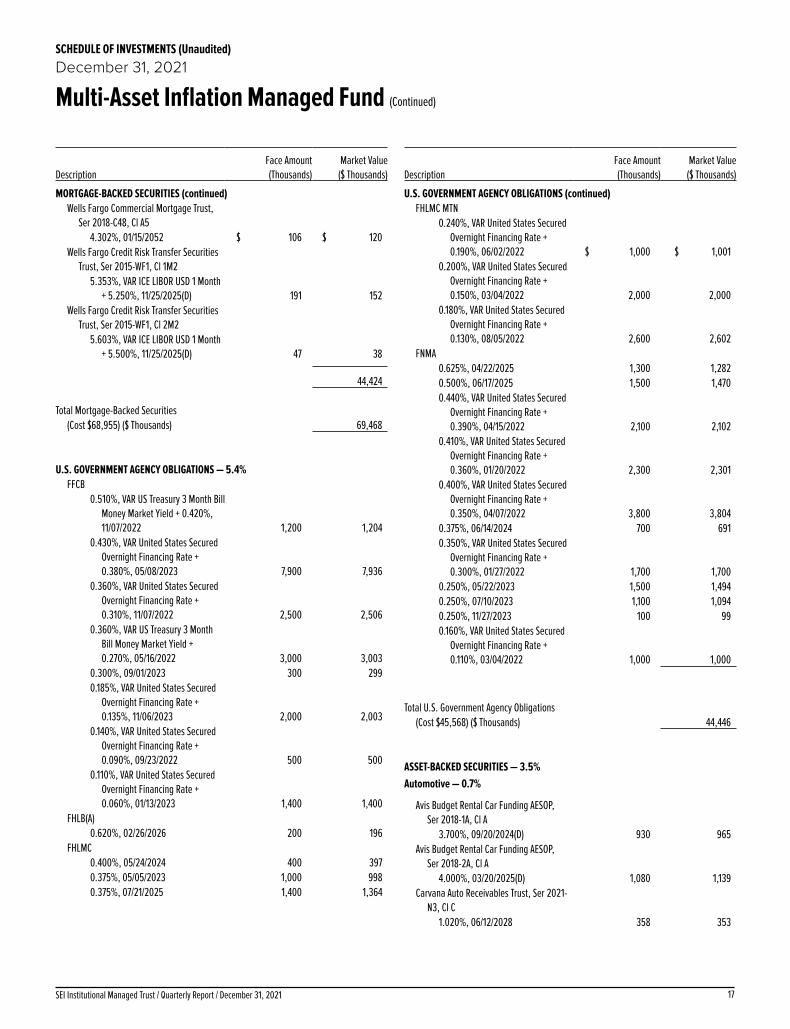
17SEI Institutional Managed Trust / Quarterly Report / December 31, 2021
SCHEDULE OF INVESTMENTS (Unaudited)December 31, 2021
Multi-Asset Inflation Managed Fund (Continued)
DescriptionFace Amount (Thousands)
Market Value ($ Thousands)
MORTGAGE-BACKED SECURITIES (continued)Wells Fargo Commercial Mortgage Trust,
Ser 2018-C48, Cl A54.302%, 01/15/2052 $ 106 $ 120
Wells Fargo Credit Risk Transfer Securities Trust, Ser 2015-WF1, Cl 1M2
5.353%, VAR ICE LIBOR USD 1 Month + 5.250%, 11/25/2025(D) 191 152
Wells Fargo Credit Risk Transfer Securities Trust, Ser 2015-WF1, Cl 2M2
5.603%, VAR ICE LIBOR USD 1 Month + 5.500%, 11/25/2025(D) 47 38
44,424
Total Mortgage-Backed Securities
(Cost $68,955) ($ Thousands) 69,468
U.S. GOVERNMENT AGENCY OBLIGATIONS — 5.4%FFCB
0.510%, VAR US Treasury 3 Month Bill Money Market Yield + 0.420%, 11/07/2022 1,200 1,204
0.430%, VAR United States Secured Overnight Financing Rate + 0.380%, 05/08/2023 7,900 7,936
0.360%, VAR United States Secured Overnight Financing Rate + 0.310%, 11/07/2022 2,500 2,506
0.360%, VAR US Treasury 3 Month Bill Money Market Yield + 0.270%, 05/16/2022 3,000 3,003
0.300%, 09/01/2023 300 2990.185%, VAR United States Secured
Overnight Financing Rate + 0.135%, 11/06/2023 2,000 2,003
0.140%, VAR United States Secured Overnight Financing Rate + 0.090%, 09/23/2022 500 500
0.110%, VAR United States Secured Overnight Financing Rate + 0.060%, 01/13/2023 1,400 1,400
FHLB(A)0.620%, 02/26/2026 200 196
FHLMC0.400%, 05/24/2024 400 3970.375%, 05/05/2023 1,000 9980.375%, 07/21/2025 1,400 1,364
DescriptionFace Amount (Thousands)
Market Value ($ Thousands)
U.S. GOVERNMENT AGENCY OBLIGATIONS (continued)FHLMC MTN
0.240%, VAR United States Secured Overnight Financing Rate + 0.190%, 06/02/2022 $ 1,000 $ 1,001
0.200%, VAR United States Secured Overnight Financing Rate + 0.150%, 03/04/2022 2,000 2,000
0.180%, VAR United States Secured Overnight Financing Rate + 0.130%, 08/05/2022 2,600 2,602
FNMA0.625%, 04/22/2025 1,300 1,2820.500%, 06/17/2025 1,500 1,4700.440%, VAR United States Secured
Overnight Financing Rate + 0.390%, 04/15/2022 2,100 2,102
0.410%, VAR United States Secured Overnight Financing Rate + 0.360%, 01/20/2022 2,300 2,301
0.400%, VAR United States Secured Overnight Financing Rate + 0.350%, 04/07/2022 3,800 3,804
0.375%, 06/14/2024 700 6910.350%, VAR United States Secured
Overnight Financing Rate + 0.300%, 01/27/2022 1,700 1,700
0.250%, 05/22/2023 1,500 1,4940.250%, 07/10/2023 1,100 1,0940.250%, 11/27/2023 100 990.160%, VAR United States Secured
Overnight Financing Rate + 0.110%, 03/04/2022 1,000 1,000
Total U.S. Government Agency Obligations
(Cost $45,568) ($ Thousands) 44,446
ASSET-BACKED SECURITIES — 3.5%Automotive — 0.7%
Avis Budget Rental Car Funding AESOP, Ser 2018-1A, Cl A
3.700%, 09/20/2024(D) 930 965Avis Budget Rental Car Funding AESOP,
Ser 2018-2A, Cl A4.000%, 03/20/2025(D) 1,080 1,139
Carvana Auto Receivables Trust, Ser 2021-N3, Cl C
1.020%, 06/12/2028 358 353

SEI Institutional Managed Trust / Quarterly Report / December 31, 202118
SCHEDULE OF INVESTMENTS (Unaudited)December 31, 2021
Multi-Asset Inflation Managed Fund (Continued)
DescriptionFace Amount (Thousands)
Market Value ($ Thousands)
ASSET-BACKED SECURITIES (continued)Carvana Auto Receivables Trust, Ser 2021-
N4, Cl D2.300%, 09/11/2028 $ 347 $ 347
Carvana Auto Receivables Trust, Ser 2021-P4, Cl D
2.610%, 09/11/2028 441 441FHF Trust, Ser 2021-2A, Cl A
0.830%, 12/15/2026(D) 347 345First Investors Auto Owner Trust, Ser 2020-
1A, Cl A1.490%, 01/15/2025(D) 62 62
Ford Credit Auto Owner Trust, Ser 2021-1, Cl D
2.310%, 10/17/2033(D) 605 597LAD Auto Receivables Trust, Ser 2021-1A,
Cl A1.300%, 08/17/2026(D) 743 742
Santander Consumer Auto Receivables Trust, Ser 2021-CA, Cl B
1.440%, 04/17/2028(D) 391 391 5,382
Credit Cards — 0.2%
Brex Commercial Charge Card Master Trust, Ser 2021-1, Cl A
2.090%, 07/15/2024(D) 437 438Mission Lane Credit Card Master Trust,
Ser 2021-A, Cl B2.240%, 09/15/2026(D) 175 174
World Financial Network Credit Card Master Trust, Ser 2019-B, Cl M
3.040%, 04/15/2026 770 779 1,391
Other Asset-Backed Securities — 2.6%
Affirm Asset Securitization Trust, Ser 2020-A, Cl A
2.100%, 02/18/2025(D) 552 553Affirm Asset Securitization Trust, Ser 2021-
Z1, Cl A1.070%, 08/15/2025(D) 284 284
Affirm Asset Securitization Trust, Ser 2021-Z2, Cl A
1.170%, 11/16/2026(D) 330 329AGL CLO 12, Ser 2021-12A, Cl A1
1.290%, VAR ICE LIBOR USD 3 Month + 1.160%, 07/20/2034(D) 970 970
Atalaya Equipment Leasing Trust, Ser 2021-1A, Cl A1
0.326%, 11/15/2022(D) 469 469
DescriptionFace Amount (Thousands)
Market Value ($ Thousands)
ASSET-BACKED SECURITIES (continued)Atalaya Equipment Leasing Trust, Ser 2021-
1A, Cl B2.080%, 02/15/2027(D) $ 185 $ 185
Balboa Bay Loan Funding, Ser 2021-1A, Cl A1.000%, 07/20/2034(D)(G) 589 589
Ballyrock CLO 15, Ser 2021-1A, Cl C3.224%, VAR ICE LIBOR USD 3 Month
+ 3.100%, 04/15/2034(D) 600 599Ballyrock CLO 16, Ser 2021-16A, Cl A1
1.265%, VAR ICE LIBOR USD 3 Month + 1.130%, 07/20/2034(D) 1,222 1,223
Cajun Global, Ser 2021-1, Cl A23.931%, 11/20/2051(D) 185 184
College Ave Student Loans, Ser 2021-C, Cl B2.720%, 07/26/2055(D) 232 232
Conn's Receivables Funding, Ser 2021-A, Cl A
1.050%, 05/15/2026(D) 1,374 1,373Diamond Issuer, Ser 2021-1A, Cl A
2.305%, 11/20/2051(D) 839 833Domino's Pizza Master Issuer, Ser 2021-1A,
Cl A2I2.662%, 04/25/2051(D) 462 464
Dryden 78 CLO, Ser 2020-78A, Cl C2.072%, VAR ICE LIBOR USD 3 Month
+ 1.950%, 04/17/2033(D) 620 624Dryden 78 CLO, Ser 2020-78A, Cl D
3.122%, VAR ICE LIBOR USD 3 Month + 3.000%, 04/17/2033(D) 320 321
Elevation CLO, Ser 2020-11A, Cl C2.324%, VAR ICE LIBOR USD 3 Month
+ 2.200%, 04/15/2033(D) 550 550Elmwood CLO IX, Ser 2021-2A, Cl D
3.089%, VAR ICE LIBOR USD 3 Month + 2.950%, 07/20/2034(D) 583 582
Flatiron CLO 21, Ser 2021-1A, Cl D3.051%, VAR ICE LIBOR USD 3 Month
+ 2.900%, 07/19/2034(D) 620 619GCI Funding I, Ser 2021-1, Cl A
2.380%, 06/18/2046(D) 314 311Goldentree Loan Management US CLO 7,
Ser 2021-7A, Cl AR1.202%, VAR ICE LIBOR USD 3 Month
+ 1.070%, 04/20/2034(D) 651 651Hardee's Funding, Ser 2018-1A, Cl A23
5.710%, 06/20/2048(D) 387 426Hardee's Funding, Ser 2020-1A, Cl A2
3.981%, 12/20/2050(D) 270 283HFX, Ser 2017-1A
3.647%, 03/15/2035 830 850
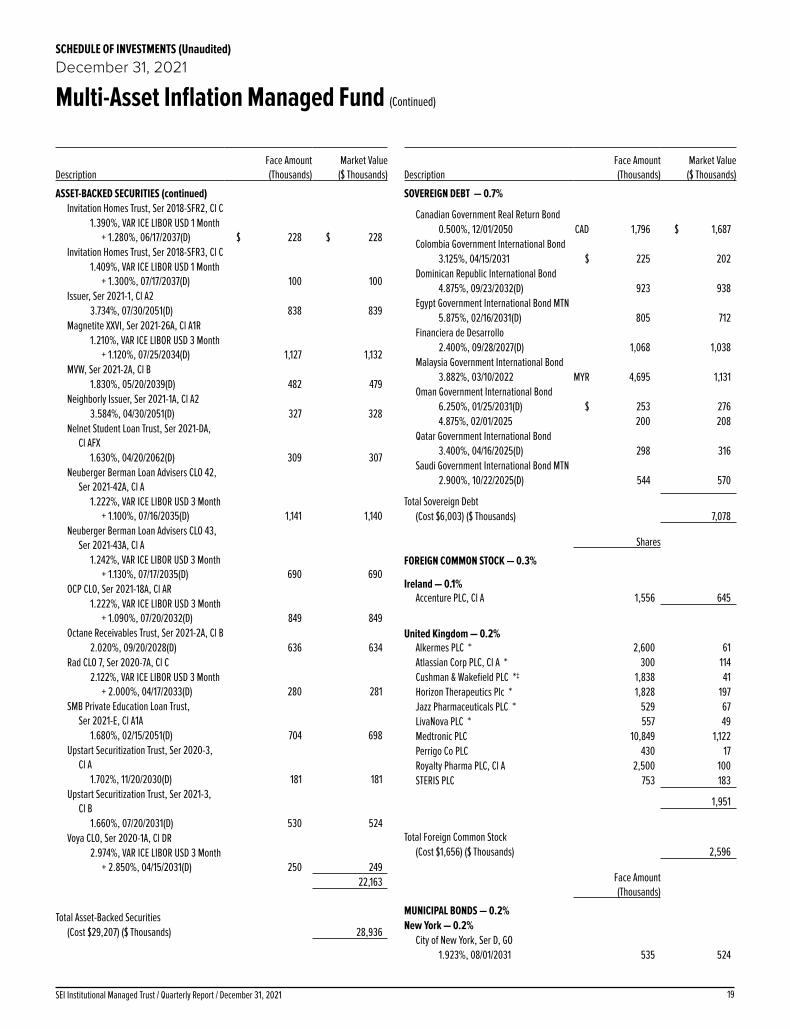
19SEI Institutional Managed Trust / Quarterly Report / December 31, 2021
SCHEDULE OF INVESTMENTS (Unaudited)December 31, 2021
Multi-Asset Inflation Managed Fund (Continued)
DescriptionFace Amount (Thousands)
Market Value ($ Thousands)
ASSET-BACKED SECURITIES (continued)Invitation Homes Trust, Ser 2018-SFR2, Cl C
1.390%, VAR ICE LIBOR USD 1 Month + 1.280%, 06/17/2037(D) $ 228 $ 228
Invitation Homes Trust, Ser 2018-SFR3, Cl C1.409%, VAR ICE LIBOR USD 1 Month
+ 1.300%, 07/17/2037(D) 100 100Issuer, Ser 2021-1, Cl A2
3.734%, 07/30/2051(D) 838 839Magnetite XXVI, Ser 2021-26A, Cl A1R
1.210%, VAR ICE LIBOR USD 3 Month + 1.120%, 07/25/2034(D) 1,127 1,132
MVW, Ser 2021-2A, Cl B1.830%, 05/20/2039(D) 482 479
Neighborly Issuer, Ser 2021-1A, Cl A23.584%, 04/30/2051(D) 327 328
Nelnet Student Loan Trust, Ser 2021-DA, Cl AFX
1.630%, 04/20/2062(D) 309 307Neuberger Berman Loan Advisers CLO 42,
Ser 2021-42A, Cl A1.222%, VAR ICE LIBOR USD 3 Month
+ 1.100%, 07/16/2035(D) 1,141 1,140Neuberger Berman Loan Advisers CLO 43,
Ser 2021-43A, Cl A1.242%, VAR ICE LIBOR USD 3 Month
+ 1.130%, 07/17/2035(D) 690 690OCP CLO, Ser 2021-18A, Cl AR
1.222%, VAR ICE LIBOR USD 3 Month + 1.090%, 07/20/2032(D) 849 849
Octane Receivables Trust, Ser 2021-2A, Cl B2.020%, 09/20/2028(D) 636 634
Rad CLO 7, Ser 2020-7A, Cl C2.122%, VAR ICE LIBOR USD 3 Month
+ 2.000%, 04/17/2033(D) 280 281SMB Private Education Loan Trust,
Ser 2021-E, Cl A1A1.680%, 02/15/2051(D) 704 698
Upstart Securitization Trust, Ser 2020-3, Cl A
1.702%, 11/20/2030(D) 181 181Upstart Securitization Trust, Ser 2021-3,
Cl B1.660%, 07/20/2031(D) 530 524
Voya CLO, Ser 2020-1A, Cl DR2.974%, VAR ICE LIBOR USD 3 Month
+ 2.850%, 04/15/2031(D) 250 249 22,163
Total Asset-Backed Securities
(Cost $29,207) ($ Thousands) 28,936
DescriptionFace Amount (Thousands)
Market Value ($ Thousands)
SOVEREIGN DEBT — 0.7%
Canadian Government Real Return Bond0.500%, 12/01/2050 CAD 1,796 $ 1,687
Colombia Government International Bond3.125%, 04/15/2031 $ 225 202
Dominican Republic International Bond4.875%, 09/23/2032(D) 923 938
Egypt Government International Bond MTN5.875%, 02/16/2031(D) 805 712
Financiera de Desarrollo2.400%, 09/28/2027(D) 1,068 1,038
Malaysia Government International Bond3.882%, 03/10/2022 MYR 4,695 1,131
Oman Government International Bond6.250%, 01/25/2031(D) $ 253 2764.875%, 02/01/2025 200 208
Qatar Government International Bond3.400%, 04/16/2025(D) 298 316
Saudi Government International Bond MTN2.900%, 10/22/2025(D) 544 570
Total Sovereign Debt (Cost $6,003) ($ Thousands) 7,078
Shares
FOREIGN COMMON STOCK — 0.3%
Ireland — 0.1%Accenture PLC, Cl A 1,556 645
United Kingdom — 0.2%Alkermes PLC * 2,600 61Atlassian Corp PLC, Cl A * 300 114Cushman & Wakefield PLC *‡ 1,838 41Horizon Therapeutics Plc * 1,828 197Jazz Pharmaceuticals PLC * 529 67LivaNova PLC * 557 49Medtronic PLC 10,849 1,122Perrigo Co PLC 430 17Royalty Pharma PLC, Cl A 2,500 100STERIS PLC 753 183
1,951
Total Foreign Common Stock
(Cost $1,656) ($ Thousands) 2,596
Face Amount (Thousands)
MUNICIPAL BONDS — 0.2%New York — 0.2%
City of New York, Ser D, GO 1.923%, 08/01/2031 535 524

SEI Institutional Managed Trust / Quarterly Report / December 31, 202120
SCHEDULE OF INVESTMENTS (Unaudited)December 31, 2021
Multi-Asset Inflation Managed Fund (Continued)
DescriptionFace Amount (Thousands)
Market Value ($ Thousands)
MUNICIPAL BONDS (continued)Port Authority of New York & New Jersey,
Ser AAA, RB 1.086%, 07/01/2023 $ 515 $ 518
1,042
West Virginia — 0.0%Tobacco Settlement Finance Authority, RB
3.000%, 06/01/2035 497 509
Total Municipal Bonds(Cost $1,550) ($ Thousands) 1,551
Total Investments in Securities — 119.6%(Cost $890,702) ($ Thousands) $ 1,007,129
Shares
COMMON STOCK SOLD SHORT— (13.0)%Communication Services — (0.6)%
Altice USA Inc, Cl A * (2,400) (39)Cable One Inc (100) (176)Charter Communications Inc, Cl A * (1,334) (870)Comcast Corp, Cl A (43,789) (2,204)Discovery Inc, Cl A * (2,000) (47)Discovery Inc, Cl C * (3,000) (69)DISH Network Corp, Cl A * (2,248) (73)Fox Corp (1,500) (55)Interpublic Group of Cos Inc/The (2,965) (111)Liberty Broadband Corp, Cl A * (458) (74)Liberty Broadband Corp, Cl C * (1,175) (189)Liberty Media Corp-Liberty SiriusXM * (1,100) (56)Magnite Inc * (500) (9)New York Times Co/The, Cl A (2,500) (121)News Corp, Cl A (5,900) (132)Nexstar Media Group Inc, Cl A (154) (23)Omnicom Group Inc (2,241) (164)Sirius XM Holdings Inc (16,000) (101)TEGNA Inc (2,800) (52)ViacomCBS Inc, Cl B (5,020) (151)
(4,716)
Consumer Discretionary — (8.5)%2U Inc * (1,500) (30)Acushnet Holdings Corp (600) (32)Advance Auto Parts Inc (429) (103)Amazon.com Inc, Cl A * (1,714) (5,715)American Axle & Manufacturing Holdings
Inc * (2,857) (27)American Eagle Outfitters Inc (1,500) (38)Aramark (4,648) (171)Asbury Automotive Group Inc * (300) (52)
Description SharesMarket Value
($ Thousands)
COMMON STOCK SOLD SHORT (continued)AutoNation Inc * (500) $ (58)AutoZone Inc * (162) (340)Bally's Corp * (1,000) (38)Bath & Body Works Inc (1,981) (138)Best Buy Co Inc (2,199) (223)Bloomin' Brands Inc * (2,200) (46)Booking Holdings Inc * (802) (1,924)BorgWarner Inc (10,263) (463)Boyd Gaming Corp (1,781) (117)Bright Horizons Family Solutions Inc * (1,290) (162)Brinker International Inc * (1,041) (38)Brunswick Corp/DE (2,477) (250)Burlington Stores Inc * (663) (193)Caesars Entertainment Inc * (3,999) (374)Callaway Golf Co * (3,233) (89)Capri Holdings Ltd * (3,856) (250)CarMax Inc * (1,117) (145)Carnival Corp * (17,371) (349)Carter's Inc (1,151) (116)Carvana Co, Cl A * (612) (142)Cavco Industries Inc * (256) (81)Century Communities Inc (1,241) (101)Cheesecake Factory Inc/The * (800) (31)Chegg Inc * (2,800) (86)Chipotle Mexican Grill Inc, Cl A * (541) (946)Choice Hotels International Inc (998) (156)Churchill Downs Inc (900) (217)Columbia Sportswear Co (800) (78)Coursera * (1,600) (39)Cracker Barrel Old Country Store Inc (300) (39)Crocs Inc * (1,714) (220)Dana Inc (5,823) (133)Darden Restaurants Inc (2,360) (356)Dave & Buster's Entertainment Inc * (1,100) (42)Deckers Outdoor Corp * (754) (276)Dick's Sporting Goods Inc (600) (69)Dollar General Corp (1,888) (445)Dollar Tree Inc * (2,064) (290)Domino's Pizza Inc (729) (411)DoorDash Inc, Cl A * (1,000) (149)Dorman Products Inc * (1,352) (153)DR Horton Inc (9,059) (982)DraftKings Inc, Cl A * (5,400) (148)eBay Inc (5,045) (335)Etsy Inc * (1,000) (219)Everi Holdings Inc * (2,000) (43)Expedia Group Inc * (2,667) (482)Fisker Inc * (5,600) (88)Five Below Inc * (500) (103)Floor & Decor Holdings Inc, Cl A * (600) (78)Foot Locker Inc, Cl A (1,300) (57)Ford Motor Co (160,692) (3,338)

21SEI Institutional Managed Trust / Quarterly Report / December 31, 2021
SCHEDULE OF INVESTMENTS (Unaudited)December 31, 2021
Multi-Asset Inflation Managed Fund (Continued)
Description SharesMarket Value
($ Thousands)
COMMON STOCK SOLD SHORT (continued)Fox Factory Holding Corp * (1,722) $ (293)Frontdoor Inc * (1,400) (51)GameStop Corp, Cl A * (400) (59)Gap Inc/The (2,100) (37)Garmin Ltd (4,499) (613)General Motors Co * (57,274) (3,358)Gentex Corp (10,188) (355)Gentherm Inc * (1,500) (130)Genuine Parts Co (1,535) (215)G-III Apparel Group Ltd * (900) (25)Goodyear Tire & Rubber Co/The * (13,104) (279)Grand Canyon Education Inc * (455) (39)Group 1 Automotive Inc (300) (59)H&R Block Inc (3,400) (80)Hanesbrands Inc (9,891) (165)Harley-Davidson Inc, Cl A (6,277) (237)Hasbro Inc (4,010) (408)Helen of Troy Ltd * (864) (211)Hilton Grand Vacations Inc * (1,900) (99)Hilton Worldwide Holdings Inc * (5,311) (828)Home Depot Inc/The (8,179) (3,394)Houghton Mifflin Harcourt Co * (3,700) (60)Hyatt Hotels Corp, Cl A * (900) (86)Installed Building Products Inc (478) (67)International Game Technology PLC (1,900) (55)iRobot * (647) (43)Jack in the Box Inc (613) (54)KB Home (3,035) (136)Kohl's Corp (1,500) (74)Kontoor Brands Inc (1,300) (67)Las Vegas Sands Corp * (6,459) (243)La-Z-Boy Inc, Cl Z (377) (14)LCI Industries (1,212) (189)Lear Corp (2,564) (469)Leggett & Platt Inc (4,576) (188)Lennar Corp, Cl A (7,401) (860)Lennar Corp, Cl B (600) (57)LGI Homes Inc * (672) (104)Lithia Motors Inc, Cl A (200) (59)LKQ Corp (2,705) (162)Lowe's Cos Inc (5,396) (1,395)Lululemon Athletica Inc * (2,882) (1,128)M/I Homes Inc * (738) (46)Macy's Inc (2,700) (71)Malibu Boats Inc, Cl A * (400) (27)Marriott International Inc/MD, Cl A * (4,941) (816)Marriott Vacations Worldwide Corp (770) (130)Mattel Inc * (10,069) (217)McDonald's Corp (14,594) (3,912)MDC Holdings Inc (2,585) (144)Meritage Homes Corp * (1,203) (147)MGM Resorts International (7,287) (327)
Description SharesMarket Value
($ Thousands)
COMMON STOCK SOLD SHORT (continued)Mohawk Industries Inc * (1,666) $ (304)National Vision Holdings * (900) (43)Newell Brands Inc, Cl B (10,737) (234)NIKE Inc, Cl B (32,711) (5,452)Nordstrom Inc * (1,500) (34)Norwegian Cruise Line Holdings Ltd * (7,738) (160)NVR Inc * (90) (532)Ollie's Bargain Outlet Holdings Inc * (522) (27)O'Reilly Automotive Inc * (532) (376)Overstock.com * (100) (6)Oxford Industries Inc, Cl A (500) (51)Papa John's International Inc, Cl A (538) (72)Patrick Industries Inc (1,000) (81)Peloton Interactive Inc, Cl A * (7,861) (281)Penn National Gaming Inc * (3,039) (158)Penske Automotive Group Inc, Cl A (600) (64)Planet Fitness Inc, Cl A * (1,799) (163)Polaris Inc (1,713) (188)Pool Corp (390) (221)PulteGroup Inc (7,936) (454)Purple Innovation Inc, Cl A * (2,400) (32)PVH Corp (2,163) (231)QuantumScape Corp, Cl A * (8,400) (186)Qurate Retail Inc (1,700) (13)Ralph Lauren Corp, Cl A (1,250) (149)Red Rock Resorts Inc, Cl A (1,200) (66)Rent-A-Center Inc/TX (900) (43)RH * (160) (86)Ross Stores Inc (2,867) (328)Royal Caribbean Cruises Ltd * (4,053) (312)Scientific Games Corp, Cl A * (1,862) (124)SeaWorld Entertainment Inc * (900) (58)Service Corp International/US (3,326) (236)Shake Shack Inc, Cl A * (500) (36)Signet Jewelers Ltd (600) (52)Six Flags Entertainment Corp * (1,806) (77)Skechers USA Inc, Cl A * (3,608) (157)Skyline Champion Corp * (1,650) (130)Smith & Wesson Brands Inc (2,099) (37)Sonos Inc * (2,896) (86)Standard Motor Products Inc (1,195) (63)Starbucks Corp (22,405) (2,621)Steven Madden Ltd (2,500) (116)Stoneridge Inc * (1,630) (32)Strategic Education Inc (360) (21)Stride * (400) (13)Sturm Ruger & Co Inc (399) (27)Tapestry Inc (7,326) (297)Target Corp, Cl A (3,823) (885)Taylor Morrison Home Corp, Cl A * (3,441) (120)Tempur Sealy International Inc (5,044) (237)Tenneco Inc, Cl A * (2,537) (29)

SEI Institutional Managed Trust / Quarterly Report / December 31, 202122
SCHEDULE OF INVESTMENTS (Unaudited)December 31, 2021
Multi-Asset Inflation Managed Fund (Continued)
Description SharesMarket Value
($ Thousands)
COMMON STOCK SOLD SHORT (continued)Terminix Global Holdings Inc * (2,643) $ (120)Tesla Inc * (5,251) (5,549)Texas Roadhouse Inc, Cl A (1,228) (110)Thor Industries Inc (2,425) (252)TJX Cos Inc/The (9,775) (742)Toll Brothers Inc (3,549) (257)TopBuild Corp * (982) (271)Tractor Supply Co (817) (195)Travel + Leisure Co (2,439) (135)Tri Pointe Homes Inc * (4,220) (118)Tupperware Brands Corp * (1,800) (28)Ulta Beauty Inc * (388) (160)Under Armour Inc, Cl A * (4,425) (94)Under Armour Inc, Cl C * (6,679) (120)Vail Resorts Inc (847) (278)VF Corp (9,242) (677)Victoria's Secret & Co * (660) (37)Vista Outdoor Inc * (2,340) (108)Visteon Corp * (1,022) (114)Wayfair Inc, Cl A * (576) (109)Wendy's Co/The (4,028) (96)Whirlpool Corp (1,865) (438)Williams-Sonoma Inc (629) (106)Wingstop Inc, Cl A (600) (104)Winnebago Industries (1,503) (113)Wolverine World Wide Inc (2,146) (62)Workhorse Group Inc * (4,100) (18)WW International Inc * (1,400) (23)Wyndham Hotels & Resorts Inc (2,096) (188)Wynn Resorts Ltd * (1,949) (166)XPEL Inc * (600) (41)YETI Holdings Inc * (2,069) (171)Yum China Holdings Inc (7,782) (388)Yum! Brands Inc (5,598) (777)
(72,062)
Information Technology — (2.4)%Advanced Micro Devices Inc * (4,322) (622)Amphenol Corp, Cl A (2,784) (243)Analog Devices Inc (2,010) (353)Apple Inc (36,364) (6,457)Applied Materials Inc (3,532) (556)Arista Networks Inc * (1,136) (163)Arrow Electronics Inc, Cl A * (602) (81)Azenta Inc (500) (52)Broadcom Inc (1,542) (1,026)CDW Corp/DE (805) (165)Ciena Corp * (1,100) (85)Cisco Systems Inc/Delaware (17,247) (1,093)Cognex Corp (1,068) (83)Corning Inc, Cl B (3,802) (142)
Description SharesMarket Value
($ Thousands)
COMMON STOCK SOLD SHORT (continued)Dell Technologies Inc, Cl C * (1,424) $ (80)Enphase Energy Inc * (429) (78)Entegris Inc (600) (83)F5 Inc, Cl A * (397) (97)Fabrinet * (190) (23)First Solar Inc * (500) (44)Hewlett Packard Enterprise Co (6,754) (107)HP Inc (5,155) (194)II-VI Inc * (482) (33)Intel Corp (14,853) (765)Jabil Inc (722) (51)Keysight Technologies Inc * (853) (176)KLA Corp (622) (268)Lam Research Corp (538) (387)Marvell Technology Inc (3,395) (297)Microchip Technology Inc (2,286) (199)Micron Technology Inc (4,149) (386)MKS Instruments Inc (476) (83)Monolithic Power Systems Inc (212) (105)Motorola Solutions Inc (657) (179)NetApp Inc (954) (88)Novanta Inc * (200) (35)NVIDIA Corp (8,692) (2,556)NXP Semiconductors NV (1,000) (228)ON Semiconductor Corp * (1,723) (117)Pure Storage Inc, Cl A * (1,188) (39)Qorvo Inc * (461) (72)QUALCOMM Inc (4,120) (753)Skyworks Solutions Inc (700) (109)Super Micro Computer Inc * (1,052) (46)TD SYNNEX Corp (500) (57)Teledyne Technologies Inc * (200) (87)Teradyne Inc (729) (119)Texas Instruments Inc (3,507) (661)Trimble Inc * (1,124) (98)Universal Display Corp (154) (25)Western Digital Corp * (1,686) (110)Wolfspeed Inc * (600) (67)Xilinx Inc (896) (190)Zebra Technologies Corp, Cl A * (231) (137)
(20,350)
Materials — (1.5)%Air Products and Chemicals Inc (2,614) (795)Albemarle Corp (1,362) (318)Alcoa Corp (1,900) (113)Amyris Inc * (300) (2)AptarGroup Inc (900) (110)Arconic Corp * (1,800) (59)Avery Dennison Corp (1,028) (223)Avient Corp (1,300) (73)

23SEI Institutional Managed Trust / Quarterly Report / December 31, 2021
SCHEDULE OF INVESTMENTS (Unaudited)December 31, 2021
Multi-Asset Inflation Managed Fund (Continued)
Description SharesMarket Value
($ Thousands)
COMMON STOCK SOLD SHORT (continued)Axalta Coating Systems Ltd * (2,527) $ (84)Ball Corp (3,904) (376)Berry Global Group Inc * (2,102) (155)Celanese Corp, Cl A (1,272) (214)CF Industries Holdings Inc (3,041) (215)Chemours Co/The (2,300) (77)Cleveland-Cliffs Inc * (5,000) (109)Commercial Metals Co, Cl A (1,331) (48)Corteva Inc (8,128) (384)Crown Holdings Inc (1,663) (184)Dow Inc (8,384) (476)DuPont de Nemours Inc (5,693) (460)Eagle Materials Inc (500) (83)Eastman Chemical Co (1,391) (168)Ecolab Inc (2,921) (685)Element Solutions Inc (4,200) (102)FMC Corp (1,933) (212)Freeport-McMoRan Inc, Cl B (15,997) (668)Graphic Packaging Holding Co (2,560) (50)Huntsman Corp (1,331) (46)Innospec Inc (1,200) (108)International Flavors & Fragrances Inc (2,707) (408)International Paper Co (4,993) (235)Livent Corp * (2,100) (51)Louisiana-Pacific Corp (1,326) (104)LyondellBasell Industries NV, Cl A (3,115) (287)Martin Marietta Materials Inc, Cl A (873) (385)Mosaic Co/The (3,639) (143)MP Materials Corp * (400) (18)Newmont Corp (9,315) (578)Nucor Corp (3,365) (384)Olin Corp (2,100) (121)Packaging Corp of America (1,302) (177)PPG Industries Inc (2,762) (476)Reliance Steel & Aluminum Co (1,019) (165)Royal Gold Inc, Cl A (900) (95)RPM International Inc (2,128) (215)Scotts Miracle-Gro Co/The, Cl A (600) (97)Sealed Air Corp (1,752) (118)Sherwin-Williams Co/The, Cl A (2,612) (920)Sonoco Products Co (512) (30)Southern Copper Corp (1,175) (73)Steel Dynamics Inc (2,654) (165)Summit Materials Inc, Cl A * (1,600) (64)Tronox Holdings (2,500) (60)United States Steel Corp (3,100) (74)Valvoline Inc (3,600) (134)Vulcan Materials Co (1,221) (253)Westrock Co (3,554) (158)
Description SharesMarket Value
($ Thousands)
COMMON STOCK SOLD SHORT (continued)
(12,585)
Total Common Stock Sold Short
(Proceeds $77,710) ($ Thousands) $ (109,713)
FOREIGN COMMON STOCK SOLD SHORT— (0.3)%United Kingdom — (0.3)%
Adient PLC * (3,618) (173)Amcor PLC (22,368) (269)Aptiv PLC * (11,262) (1,858)
Total Foreign Common Stock Sold Short
(Proceeds $1,730) ($ Thousands) (2,300)
Total Investments Sold Short — (13.3)%(Proceeds $79,440) ($ Thousands) $ (112,013)
ContractsPURCHASED OPTIONS* — 0.0%Total Purchased Options (H)
(Cost $282) ($ Thousands) 128 $ 212
WRITTEN OPTIONS* — 0.0%Total Written Options (H)
(Premiums Received $142) ($ Thousands) (121) $ (42)

SEI Institutional Managed Trust / Quarterly Report / December 31, 202124
SCHEDULE OF INVESTMENTS (Unaudited)December 31, 2021
Multi-Asset Inflation Managed Fund (Continued)
A list of the open exchange traded options contracts held by the Fund at December 31, 2021, is as follows:
Description Number of ContractsNotional Amount
(Thousands)†† Exercise Price Expiration DateValue
(Thousands)
PURCHASED OPTIONS — 0.0%
Call OptionsMarch 2022, Crude Oil IPE Future*(A) 68 $ 81 $85.00 1/22/2022 $ 51March 2022, Wheat Future *(A) 60 201 725.00 2/19/2022 161
– –
– – – –
– – – –
Total Purchased Options $ 282 $ 212WRITTEN OPTIONS — 0.0%
Call OptionsMarch 2022, Crude Oil IPE Future*(A) (48) $ (21) 100.00 01/22/22 $ (2)March 2022, Natural Gas Future*(A) (13) (83) 3.85 02/19/22 (23)March 2022, Wheat Future*(A) (60) (38) 860.00 02/19/22 (17)
– – – –
Total Written Options $ (142) $ (42)
†† Represents cost.
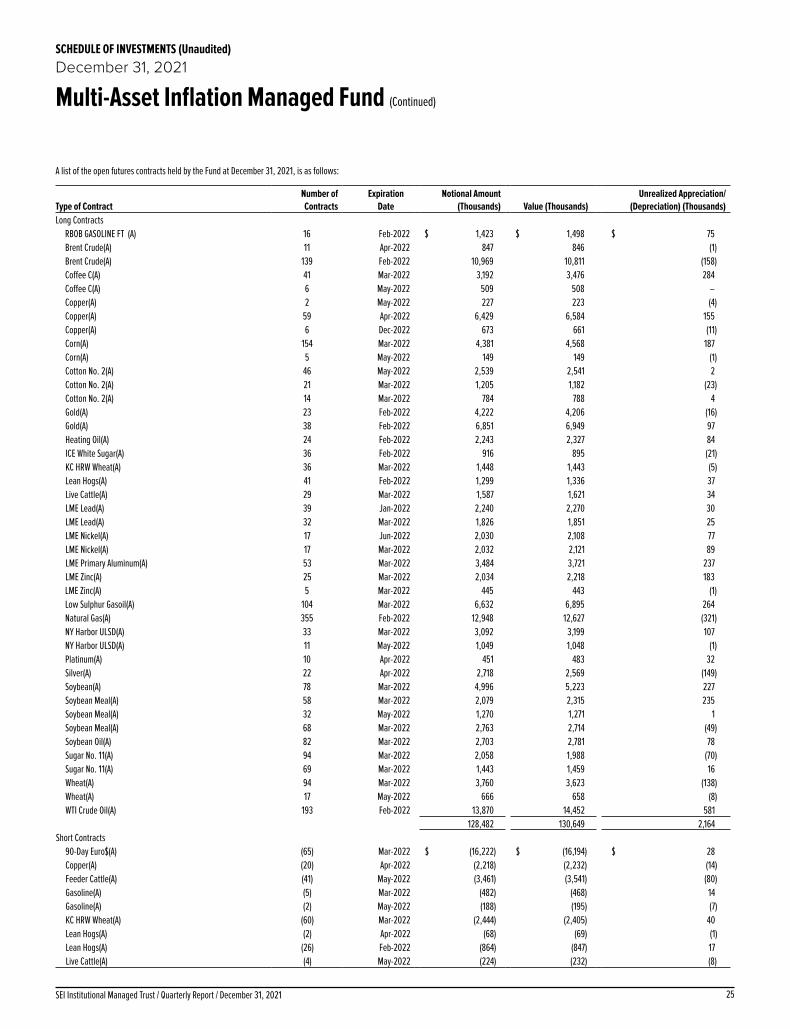
25SEI Institutional Managed Trust / Quarterly Report / December 31, 2021
SCHEDULE OF INVESTMENTS (Unaudited)December 31, 2021
Multi-Asset Inflation Managed Fund (Continued)
A list of the open futures contracts held by the Fund at December 31, 2021, is as follows:
Type of ContractNumber of Contracts
Expiration Date
Notional Amount (Thousands) Value (Thousands)
Unrealized Appreciation/ (Depreciation) (Thousands)
Long ContractsRBOB GASOLINE FT (A) 16 Feb-2022 $ 1,423 $ 1,498 $ 75Brent Crude(A) 11 Apr-2022 847 846 (1)Brent Crude(A) 139 Feb-2022 10,969 10,811 (158)Coffee C(A) 41 Mar-2022 3,192 3,476 284Coffee C(A) 6 May-2022 509 508 –Copper(A) 2 May-2022 227 223 (4)Copper(A) 59 Apr-2022 6,429 6,584 155Copper(A) 6 Dec-2022 673 661 (11)Corn(A) 154 Mar-2022 4,381 4,568 187Corn(A) 5 May-2022 149 149 (1)Cotton No. 2(A) 46 May-2022 2,539 2,541 2Cotton No. 2(A) 21 Mar-2022 1,205 1,182 (23)Cotton No. 2(A) 14 Mar-2022 784 788 4Gold(A) 23 Feb-2022 4,222 4,206 (16)Gold(A) 38 Feb-2022 6,851 6,949 97Heating Oil(A) 24 Feb-2022 2,243 2,327 84ICE White Sugar(A) 36 Feb-2022 916 895 (21)KC HRW Wheat(A) 36 Mar-2022 1,448 1,443 (5)Lean Hogs(A) 41 Feb-2022 1,299 1,336 37Live Cattle(A) 29 Mar-2022 1,587 1,621 34LME Lead(A) 39 Jan-2022 2,240 2,270 30LME Lead(A) 32 Mar-2022 1,826 1,851 25LME Nickel(A) 17 Jun-2022 2,030 2,108 77LME Nickel(A) 17 Mar-2022 2,032 2,121 89LME Primary Aluminum(A) 53 Mar-2022 3,484 3,721 237LME Zinc(A) 25 Mar-2022 2,034 2,218 183LME Zinc(A) 5 Mar-2022 445 443 (1)Low Sulphur Gasoil(A) 104 Mar-2022 6,632 6,895 264Natural Gas(A) 355 Feb-2022 12,948 12,627 (321)NY Harbor ULSD(A) 33 Mar-2022 3,092 3,199 107NY Harbor ULSD(A) 11 May-2022 1,049 1,048 (1)Platinum(A) 10 Apr-2022 451 483 32Silver(A) 22 Apr-2022 2,718 2,569 (149)Soybean(A) 78 Mar-2022 4,996 5,223 227Soybean Meal(A) 58 Mar-2022 2,079 2,315 235Soybean Meal(A) 32 May-2022 1,270 1,271 1Soybean Meal(A) 68 Mar-2022 2,763 2,714 (49)Soybean Oil(A) 82 Mar-2022 2,703 2,781 78Sugar No. 11(A) 94 Mar-2022 2,058 1,988 (70)Sugar No. 11(A) 69 Mar-2022 1,443 1,459 16Wheat(A) 94 Mar-2022 3,760 3,623 (138)Wheat(A) 17 May-2022 666 658 (8)WTI Crude Oil(A) 193 Feb-2022 13,870 14,452 581
128,482 130,649 2,164Short Contracts
90-Day Euro$(A) (65) Mar-2022 $ (16,222) $ (16,194) $ 28Copper(A) (20) Apr-2022 (2,218) (2,232) (14)Feeder Cattle(A) (41) May-2022 (3,461) (3,541) (80)Gasoline(A) (5) Mar-2022 (482) (468) 14Gasoline(A) (2) May-2022 (188) (195) (7)KC HRW Wheat(A) (60) Mar-2022 (2,444) (2,405) 40Lean Hogs(A) (2) Apr-2022 (68) (69) (1)Lean Hogs(A) (26) Feb-2022 (864) (847) 17Live Cattle(A) (4) May-2022 (224) (232) (8)

SEI Institutional Managed Trust / Quarterly Report / December 31, 202126
SCHEDULE OF INVESTMENTS (Unaudited)December 31, 2021
Multi-Asset Inflation Managed Fund (Continued)
Type of ContractNumber of Contracts
Expiration Date
Notional Amount (Thousands) Value (Thousands)
Unrealized Appreciation/ (Depreciation) (Thousands)
Live Cattle(A) (20) Mar-2022 $ (1,095) $ (1,118) $ (22)LME Primary Aluminum(A) (3) May-2022 (196) (210) (15)MSCI EAFE Index (111) Mar-2022 (12,536) (12,886) (350)NYMEX Cocoa(A) (115) Mar-2022 (2,826) (2,898) (72)Platinum(A) (2) Apr-2022 (97) (97) –Red Wheat(A) (5) Mar-2022 (253) (246) 7S&P 500 Index E-MINI (109) Mar-2022 (25,392) (25,934) (541)Silver(A) (23) Apr-2022 (2,731) (2,685) 45Soybean Oil(A) (6) May-2022 (188) (204) (15)Soybean Oil(A) (31) Mar-2022 (1,019) (1,051) (32)U.S. 2-Year Treasury Note (243) Apr-2022 (53,089) (53,016) 73U.S. 5-Year Treasury Note (234) Apr-2022 (28,302) (28,309) (6)U.S. Ultra Long Treasury Bond (21) Mar-2022 (4,043) (4,140) (97)Ultra 10-Year U.S. Treasury Note (4) Mar-2022 (586) (586) –
(158,524) (159,563) (1,036) $ (30,042) $ (28,914) $ 1,128
A list of the open forward foreign currency contracts held by the Fund at December 31, 2021 is as follows:
Counterparty Settlement DateCurrency to Deliver
(Thousands)Currency to Receive
(Thousands)
Unrealized Appreciation
(Depreciation) (Thousands)
Barclays PLC 03/02/22 USD 4,163 RUB 311,104 $ (54)
Brown Brothers Harriman 01/20/22 USD 401 SEK 3,441 (21)
Brown Brothers Harriman 01/20/22 SEK 3,053 USD 344 6
Brown Brothers Harriman 01/20/22 SEK 2,881 USD 316 (2)
Brown Brothers Harriman 02/08/22 USD 310 AUD 428 1
Brown Brothers Harriman 02/08/22 AUD 902 USD 645 (10)
Brown Brothers Harriman 02/10/22 USD 219 EUR 194 2
Brown Brothers Harriman 02/10/22 EUR 421 USD 477 (3)
Goldman Sachs 06/16/22 MYR 5,201 USD 1,225 (19)
HSBC 02/10/22 EUR 688 USD 796 13
JPMorgan Chase Bank 01/20/22 SEK 91,184 USD 10,424 349
Morgan Stanley 02/08/22 AUD 11,124 USD 8,224 137
Morgan Stanley 02/10/22 EUR 1,689 USD 1,904 (18)
Morgan Stanley 02/10/22 CAD 14,197 USD 11,279 38 $ 419
A list of open OTC swap agreements held by the Fund at December 31, 2021, are as follows:
Credit Default Swaps
Counterparty Reference Entity/ ObligationBuy/Sell
Protection(Pays)/Receives
RatePayment
FrequencyTermination
Date
Notional Amount
(Thousands)Value
(Thousands)
Upfront Payments/
Receipts (Thousands)
Net Unrealized Appreciation
(Depreciation) (Thousands)
Citibank CMBX.BBB.6 Buy 3.00% Monthly 09/17/2058 $245 $ 23 $ 16 $ 7Citibank CMBX.BBB.6 Buy 3.00% Monthly 09/17/2058 257 24 17 7Citibank CMBX.BBB.6 Buy 3.00% Monthly 09/17/2058 258 24 17 7Citibank CMBX.BBB.6 Sell 3.00% Monthly 05/11/2063 (33) (9) (4) (5)Citibank CMBX.BBB.6 Sell 3.00% Monthly 05/11/2063 (89) (25) (11) (14)Citibank CMBX.BBB.6 Sell 3.00% Monthly 05/11/2063 (32) (9) (4) (5)Citibank CMBX.BBB.6 Sell 3.00% Monthly 05/11/2063 (7) (2) (1) (1)Citibank CMBX.BBB.6 Sell 3.00% Monthly 05/11/2063 (20) (6) (2) (4)
Credit Suisse CMBX.BBB.6 Sell 3.00% Monthly 05/11/2063 (106) (30) (13) (17)Credit Suisse CMBX.BBB.6 Sell 3.00% Monthly 05/11/2063 (3) (1) — (1)
Deutsche Bank CMBX.BBB.6 Sell 3.00% Monthly 05/11/2063 (33) (9) (4) (5)Citibank CMBX.BBB.6 Sell 3.00% Monthly 05/11/2063 (45) (13) (5) (8)

27SEI Institutional Managed Trust / Quarterly Report / December 31, 2021
SCHEDULE OF INVESTMENTS (Unaudited)December 31, 2021
Multi-Asset Inflation Managed Fund (Continued)
Counterparty Reference Entity/ ObligationBuy/Sell
Protection(Pays)/Receives
RatePayment
FrequencyTermination
Date
Notional Amount
(Thousands)Value
(Thousands)
Upfront Payments/
Receipts (Thousands)
Net Unrealized Appreciation
(Depreciation) (Thousands)
Deutsche Bank CMBX.BBB.6 Sell 3.00% Monthly 05/11/2063 $(201) $ (56) $ (24) $ (32)Citibank CMBX.BBB.6 Sell 3.00% Monthly 05/11/2063 (28) (8) (3) (5)
Goldman Sachs CMBX.BBB.9 Buy 3.00% Monthly 09/17/2058 518 49 88 (39)Goldman Sachs CMBX.NA.BBB.6 Sell 3.00% Monthly 12/31/2049 (435) (122) (30) (92)Goldman Sachs CMBX.NA.BBB.6 Sell 3.00% Monthly 12/31/2049 (261) (73) (16) (57)Deutsche Bank CMBX.NA.BBB.6 Sell 3.00% Monthly 12/31/2049 (42) (12) (2) (10)Deutsche Bank CMBX.NA.BBB.6 Sell 3.00% Monthly 12/31/2049 (1,092) (306) (69) (237)Credit Suisse CMBX.NA.BBB.6 Sell 3.00% Monthly 12/31/2049 (227) (63) (14) (49)Credit Suisse CMBX.NA.BBB.6 Sell 3.00% Monthly 12/31/2049 (811) (227) (47) (180)
JPMorgan Chase CMBX.NA.BBB.6 Sell 3.00% Monthly 05/11/2063 (201) (56) (19) (37)Citibank CMBX.NA.BBB.6 Sell 3.00% Monthly 05/11/2063 (5) (1) (1) —Citibank CMBX.NA.BBB.6 Sell 3.00% Monthly 05/11/2063 (46) (13) (5) (8)Citibank CMBX.NA.BBB.6 Sell 3.00% Monthly 05/11/2063 (66) (18) (7) (11)Citibank CMBX.NA.BBB.6 Sell 3.00% Monthly 05/11/2063 (93) (26) (10) (16)
JPMorgan Chase CMBX.NA.BBB.6 Sell 3.00% Monthly 05/11/2063 (49) (14) (5) (9)JPMorgan Chase CMBX.NA.BBB.6 Sell 3.00% Monthly 05/11/2063 (46) (13) (4) (9)
Citibank CMBX.NA.BBB.6 Sell 3.00% Monthly 05/11/2063 (93) (26) (10) (16)Deutsche Bank CMBX.NA.BBB.6 Sell 3.00% Monthly 05/11/2063 (112) (31) (12) (19)Goldman Sachs CMBX.NA.BBB.6 Sell 3.00% Monthly 05/11/2063 (222) (62) (23) (39)Deutsche Bank CMBX.NA.BBB.6 Sell 3.00% Monthly 05/11/2063 (113) (32) (12) (20)Goldman Sachs CMBX.NA.BBB.6 Sell 3.00% Monthly 05/11/2063 (329) (92) (43) (49)Goldman Sachs CMBX.NA.BBB.6 Sell 3.00% Monthly 05/11/2063 (198) (55) (31) (24)Goldman Sachs CMBX.NA.BBB.6 Sell 3.00% Monthly 05/11/2063 (276) (77) (44) (33)Goldman Sachs CMBX.NA.BBB.6 Sell 3.00% Monthly 05/11/2063 (194) (54) (16) (38)Goldman Sachs CMBX.NA.BBB.6 Sell 3.00% Monthly 05/11/2063 (16) (4) (1) (3)Goldman Sachs CMBX.NA.BBB.6 Sell 3.00% Monthly 05/11/2063 (32) (9) (3) (6)Goldman Sachs CMBX.NA.BBB.6 Sell 3.00% Monthly 05/11/2063 (32) (9) (3) (6)
Citibank CMBX.NA.BBB.6 Sell 3.00% Monthly 05/11/2063 (21) (6) (2) (4)Citibank CMBX.NA.BBB.6 Sell 3.00% Monthly 05/11/2063 (18) (5) (2) (3)Citibank CMBX.NA.BBB.6 Sell 3.00% Monthly 05/11/2063 (60) (17) (7) (10)
Goldman Sachs CMBX.NA.BBB.6 Sell 3.00% Monthly 05/11/2063 (65) (18) (7) (11)JPMorgan Chase CMBX.NA.BBB.6 Sell 3.00% Monthly 05/11/2063 (503) (141) (59) (82)JPMorgan Chase CMBX.NA.BBB.6 Sell 3.00% Monthly 05/11/2063 (175) (49) (21) (28)
CGG CMBX.NA.BBB.6 Sell 3.00% Monthly 05/11/2063 (33) (9) (4) (5)Citibank CMBX.NA.BBB.6 Sell 3.00% Monthly 05/11/2063 (30) (8) (4) (4)
Morgan Stanley CMBX.NA.BBB-.9 Buy 3.00% Monthly 09/17/2058 553 52 111 (59)Citibank CMBX.NA.BBB-.9 Buy 3.00% Monthly 09/17/2058 553 52 109 (57)Citibank CMBX.NA.BBB-.9 Buy 3.00% Monthly 09/17/2058 553 52 109 (57)Citibank CMBX.NA.BBB-.9 Buy 3.00% Monthly 09/17/2058 1,782 167 354 (187)Citibank CMBX.NA.BBB-.9 Buy 3.00% Monthly 09/17/2058 891 84 174 (90)Citibank CMBX.NA.BBB-.9 Buy 3.00% Monthly 09/17/2058 45 4 9 (5)Citibank CMBX.NA.BBB-.9 Buy 3.00% Monthly 09/17/2058 43 4 9 (5)Citibank CMBX.NA.BBB-.9 Buy 3.00% Monthly 09/17/2058 523 50 40 10Citibank CMBX.NA.BBB-.9 Buy 3.00% Monthly 09/17/2058 1,045 98 72 26Citibank CMBX.NA.BBB-.9 Buy 3.00% Monthly 09/17/2058 594 56 40 16
JPMorgan Chase CMBX.NA.BBB-.9 Buy 3.00% Monthly 09/17/2058 184 17 36 (19)Morgan Stanley CMBX.NA.BBB-.9 Buy 3.00% Monthly 09/17/2058 276 26 52 (26)
Citibank CMBX.NA.BBB-.9 Buy 3.00% Monthly 09/17/2058 1,045 98 74 24Credit Suisse CMBX-A-.6 Sell 2.00% Monthly 05/11/2063 (1,305) (128) (28) (100)
$ (1,064) $ 695 $ (1,759)

SEI Institutional Managed Trust / Quarterly Report / December 31, 202128
SCHEDULE OF INVESTMENTS (Unaudited)December 31, 2021
Multi-Asset Inflation Managed Fund (Continued)
Total Return Swaps
CounterpartyReference Entity/
Obligation Fund Pays Fund ReceivesPayment
FrequencyTermination
Date Currency
Notional Amount
(Thousands)Value
( Thousands)
Upfront Payments/
Receipts (Thousands)
Net Unrealized Appreciation
(Depreciation) (Thousands)
Macquarie Bank Limited(A)
MACQUARIE COMMODITY PRODUCT 251E 0.33%
MACQUARIE COMMODITY PRODUCT 251E Monthly 01/08/2022 USD (3,256) $ 14 $ – $ 14
Macquarie Bank Limited(A) BLOOMBERG COMMODITY
INDEX TOTAL RETURN
US T-BILL HIGH DISCOUNT RATE +
9 BPS
BLOOMBERG COMMODITY INDEX
TOTAL RETURN Monthly 02/03/2022 USD (10,109) 402 – 402Merrill Lynch(A) BofA Merrill Lynch
Commodity MLBXCS3T Tot Ret
3-Month U.S. Treasury rate plus 18 BPS
BofA Merrill Lynch Commodity MLBXCS3T
Tot Ret Monthly 01/08/2022 USD (4,621) (33) – (33)Merrill Lynch(A)
BLOOMBERG COMMODITY INDEX TOTAL RETURN
US T-BILL HIGH DISCOUNT RATE +
11 BPS
BLOOMBERG COMMODITY INDEX
TOTAL RETURN Monthly 02/03/2022 USD (20,352) 807 – 807Merrill Lynch(A) BLOOMBERG COMMODITY
INDEX 2 MONTH FORWARD TR
US T-BILL HIGH DISCOUNT RATE +
12 BPS
BLOOMBERG COMMODITY INDEX 2 MONTH FORWARD TR Monthly 02/03/2022 USD (3,072) 121 – 121
Morgan Stanley IBOX $ LIQUID HIGH YIELD INDEX INDEX RETURN
IBOX $ LIQUID HIGH YIELD INDEX Annually 03/21/2022 USD 16,070 (164) – (164)
Societe Generale(A) SOCIETE GENERALE COMMODITIES CUSTOM
ALPHA 061 0.35%
SOCIETE GENERALE COMMODITIES CUSTOM
ALPHA 061 Monthly 01/08/2022 USD (6,298) 57 – 57Societe Generale(A)
BLOOMBERG COMMODITY INDEX TOTAL RETURN
US T-BILL HIGH DISCOUNT RATE +
11 BPS
BLOOMBERG COMMODITY INDEX
TOTAL RETURN Monthly 02/03/2022 USD (9,068) 360 – 360Societe Generale(A) BLOOMBERG COMMODITY
INDEX 2 MONTH FORWARD TR
US T-BILL HIGH DISCOUNT RATE +
14 BPS
BLOOMBERG COMMODITY INDEX 2 MONTH FORWARD TR Monthly 02/03/2022 USD (2,330) 91 – 91
$ 1,655 $ – $ 1,655
A list of open centrally cleared swap agreements held by the Fund at December 31, 2021, are as follows:
Credit Default Swaps
Reference Entity/ ObligationBuy/Sell
Protection(Pays)/
Receives RatePayment
Frequency Termination DateNotional Amount
(Thousands)Value
(Thousands)
Upfront Payments/ Receipts
(Thousands)
Net Unrealized Appreciation
(Depreciation) (Thousands)
China Buy 1.00% Quarterly 06/20/2026 21,400 $ (597) $ (621) $ 24China Sell 1.00% Quarterly 06/20/2026 (21,400) 597 580 17China Buy 1.00% Quarterly 12/20/2026 21,400 (614) (589) (25)
Malaysia Buy 1.00% Quarterly 06/20/2026 39,000 (1,008) (956) (52)Malaysia Sell 1.00% Quarterly 06/20/2026 (39,000) 1,008 905 103Malaysia Buy 1.00% Quarterly 12/20/2026 39,000 (1,022) (907) (115)Malaysia Buy 1.00% Quarterly 12/20/2026 79,410 (1,753) (1,756) 3
$ (3,389) $ (3,344) $ (45)

29SEI Institutional Managed Trust / Quarterly Report / December 31, 2021
SCHEDULE OF INVESTMENTS (Unaudited)December 31, 2021
Multi-Asset Inflation Managed Fund (Continued)
Interest Rate Swaps
Fund Pays Fund ReceivesPayment
Frequency Termination Date Currency
Notional Amount
(Thousands)Value
(Thousands)
Upfront Payments/
Receipts (Thousands)
Net Unrealized Appreciation
(Depreciation) (Thousands)
-0.0165% 3-MONTH SEK - STIBOR Annually 08/30/2024 SEK 153,850 $ (266) $ – $ (266)3-MONTH USD - LIBOR 2.631% Quarterly 11/10/2035 USD 1,190 (146) – (146)
USD CPI USD @ 2.519% Annually 09/07/2031 USD 7,390 360 – 3603 MONTH USD- LIBOR 1.6165 Quarterly 05/21/2031 USD 18,720 (105) – (105)3-MONTH USD - LIBOR 1.593% Quarterly 09/27/2029 USD 2,230 (16) – (16)3-MONTH USD - LIBOR 2.1495% Quarterly 06/04/2029 USD 4,220 (201) – (201)3-MONTH USD - LIBOR 2.3545 Quarterly 07/12/2027 USD 1,075 (56) – (56)3-MONTH USD - LIBOR 0.5575% Quarterly 06/05/2027 USD 15,800 688 – 688
CAD @ 2.297% CDOR 3-Month Semi-Annually 03/03/2051 CAD 592 (22) – (22)3-MONTH USD - LIBOR 2.44 Quarterly 04/04/2027 USD 10,400 (566) – (566)3-MONTH USD - LIBOR 1.67 Quarterly 11/09/2026 USD 1,490 (23) – (23)3-MONTH USD - LIBOR 1.66 Quarterly 11/08/2026 USD 1,490 (22) – (22)3-MONTH USD - LIBOR 1.60% Quarterly 10/25/2026 USD 6,110 (75) – (75)3-MONTH USD - LIBOR 2.293% Quarterly 08/04/2025 USD 2,717 (101) – (101)3-MONTH USD - LIBOR 2.49 Quarterly 06/09/2025 USD 1,710 (73) – (73)
2.31% 3 MONTH USD - LIBOR Quarterly 05/18/2025 USD 2,820 (103) – (103)3-MONTH USD - LIBOR 1.99% Quarterly 04/21/2025 USD 2,760 (71) – (71)
USD @ 3.146 USD CPI Annually 01/15/2027 USD 6,000 325 – 325CAD @ 2.3325% CDOR 3-Month Semi-Annually 03/04/2051 CAD 1,870 (83) – (83)
$ (556) $ – $ (556)
A list of the reverse repurchase agreements outstanding as of December 31, 2021 was as follows:
Multi-Asset Real Return FundPrincipal Amount ($ Thousands) Counterparty Value ($ Thousands) $ (5,492) 0.11 % $ (5,492) (5,813) 0.11 % (5,813) (9,496) 0.11 % (9,496) (11,475) 0.11 % (11,475) (21,229) 0.11 % (21,229) (31,250) 0.11 % (31,250) (50,929) 0.11 % (50,929) (40,366) 0.13 % (40,366)
$ (176,050)
Percentages are based on Net Assets of $842,200 ($ Thousands).* Non-income producing security.‡ Real Estate Investment Trust.(A) Security, or a portion thereof, is held by the Accumulation Commodity Strategy Subsidiary, Ltd. as
of December 31, 2021.(B) Zero coupon security. The rate shown on the Schedule of Investments is the security's effective
yield at the time of purchase.(C) Securities considered illiquid. The total value of such securities as of December 31, 2021 was $73
($ Thousands) and represented 0.0% of the Net Assets of the Fund.(D) Security exempt from registration under Rule 144A of the Securities Act of 1933. These securities
may be resold in transactions exempt from registration normally to qualified institutions. On December 31, 2021, the value of these securities amounted to $98,043 ($ Thousands), representing 11.6% of the Net Assets of the Fund.
(E) Security is in default on interest payment.(F) Perpetual security with no stated maturity date.(G) Variable or floating rate security, the interest rate of which adjusts periodically based on changes
in current interest rates and prepayments on the underlying pool of assets.(H) Refer to table below for details on Options Contracts.
AUD — Australian Dollar
CAD — Canadian DollarCDOR — Canadian Dollar Offered RateCl — ClassCLO — Collateralized Loan ObligationCMBX — Commercial Mortgage-Backed IndexCMO — Collateralized Mortgage ObligationCPI — Consumer Price IndexDAC — Designated Activity CompanyEAFE — Europe, Australasia and Far EastEUR — EuroFFCB — Federal Farm Credit BankFHLB — Federal Home Loan BankFHLMC — Federal Home Loan Mortgage CorporationFNMA — Federal National Mortgage AssociationGNMA — Government National Mortgage AssociationGO — General ObligationHRW— Hard Red WinterICE— Intercontinental ExchangeIO — Interest Only — face amount represents notional amountLIBOR— London Interbank Offered RateLME — London Metal ExchangeLtd. — LimitedMSCI — Morgan Stanley Capital InternationalMTN — Medium Term NoteMYR — Malaysian RinggitOTC — Over The CounterPIK — Payment-in-KindPLC — Public Limited CompanyRB — Revenue BondREMIC — Real Estate Mortgage Investment ConduitRUB — Russian RubleS&P— Standard & Poor'sSEK — Swedish Krona
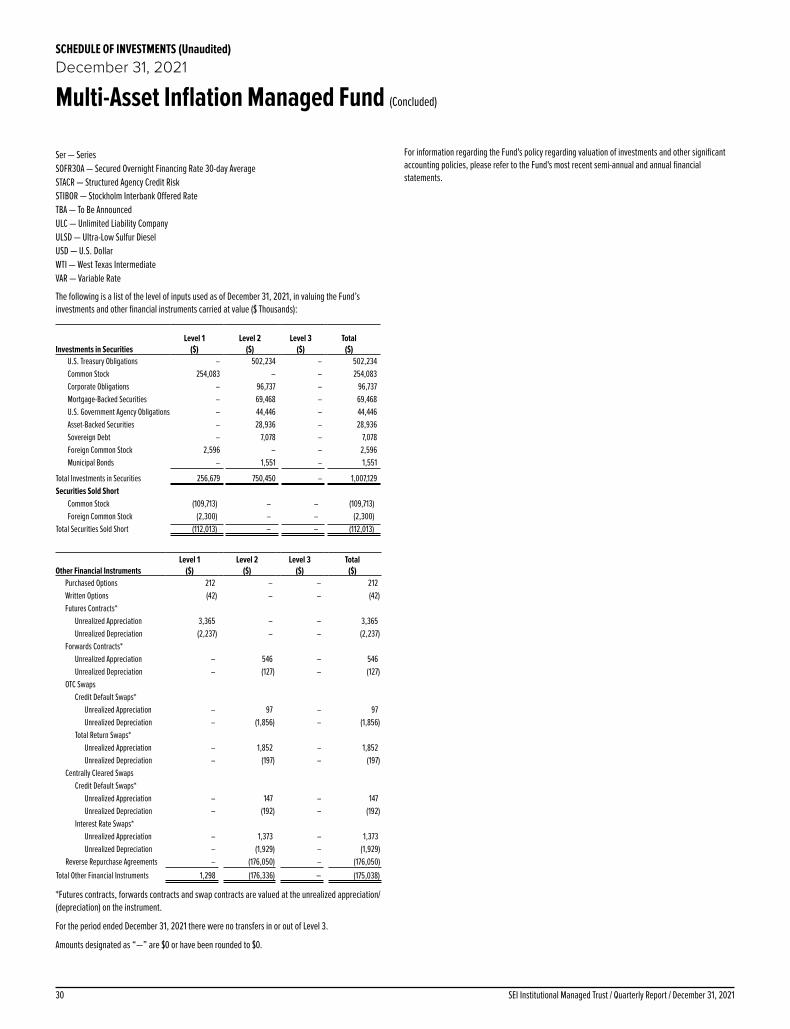
SEI Institutional Managed Trust / Quarterly Report / December 31, 202130
SCHEDULE OF INVESTMENTS (Unaudited)December 31, 2021
Multi-Asset Inflation Managed Fund (Concluded)
Ser — SeriesSOFR30A — Secured Overnight Financing Rate 30-day AverageSTACR — Structured Agency Credit RiskSTIBOR — Stockholm Interbank Offered RateTBA — To Be AnnouncedULC — Unlimited Liability CompanyULSD — Ultra-Low Sulfur DieselUSD — U.S. DollarWTI — West Texas IntermediateVAR — Variable Rate
The following is a list of the level of inputs used as of December 31, 2021, in valuing the Fund’s investments and other financial instruments carried at value ($ Thousands):
Investments in SecuritiesLevel 1
($)Level 2
($)Level 3
($)Total
($)U.S. Treasury Obligations – 502,234 – 502,234Common Stock 254,083 – – 254,083Corporate Obligations – 96,737 – 96,737Mortgage-Backed Securities – 69,468 – 69,468U.S. Government Agency Obligations – 44,446 – 44,446Asset-Backed Securities – 28,936 – 28,936Sovereign Debt – 7,078 – 7,078Foreign Common Stock 2,596 – – 2,596Municipal Bonds – 1,551 – 1,551
Total Investments in Securities 256,679 750,450 – 1,007,129Securities Sold Short
Common Stock (109,713) – – (109,713)Foreign Common Stock (2,300) – – (2,300)
Total Securities Sold Short (112,013) – – (112,013)
Other Financial InstrumentsLevel 1
($)Level 2
($)Level 3
($)Total
($)Purchased Options 212 – – 212Written Options (42) – – (42)Futures Contracts*
Unrealized Appreciation 3,365 – – 3,365Unrealized Depreciation (2,237) – – (2,237)
Forwards Contracts*Unrealized Appreciation – 546 – 546Unrealized Depreciation – (127) – (127)
OTC SwapsCredit Default Swaps*
Unrealized Appreciation – 97 – 97Unrealized Depreciation – (1,856) – (1,856)
Total Return Swaps*Unrealized Appreciation – 1,852 – 1,852Unrealized Depreciation – (197) – (197)
Centrally Cleared SwapsCredit Default Swaps*
Unrealized Appreciation – 147 – 147Unrealized Depreciation – (192) – (192)
Interest Rate Swaps*Unrealized Appreciation – 1,373 – 1,373Unrealized Depreciation – (1,929) – (1,929)
Reverse Repurchase Agreements – (176,050) – (176,050)
Total Other Financial Instruments 1,298 (176,336) – (175,038)
*Futures contracts, forwards contracts and swap contracts are valued at the unrealized appreciation/(depreciation) on the instrument.
For the period ended December 31, 2021 there were no transfers in or out of Level 3.
Amounts designated as “—” are $0 or have been rounded to $0.
For information regarding the Fund's policy regarding valuation of investments and other significant accounting policies, please refer to the Fund's most recent semi-annual and annual financial statements.
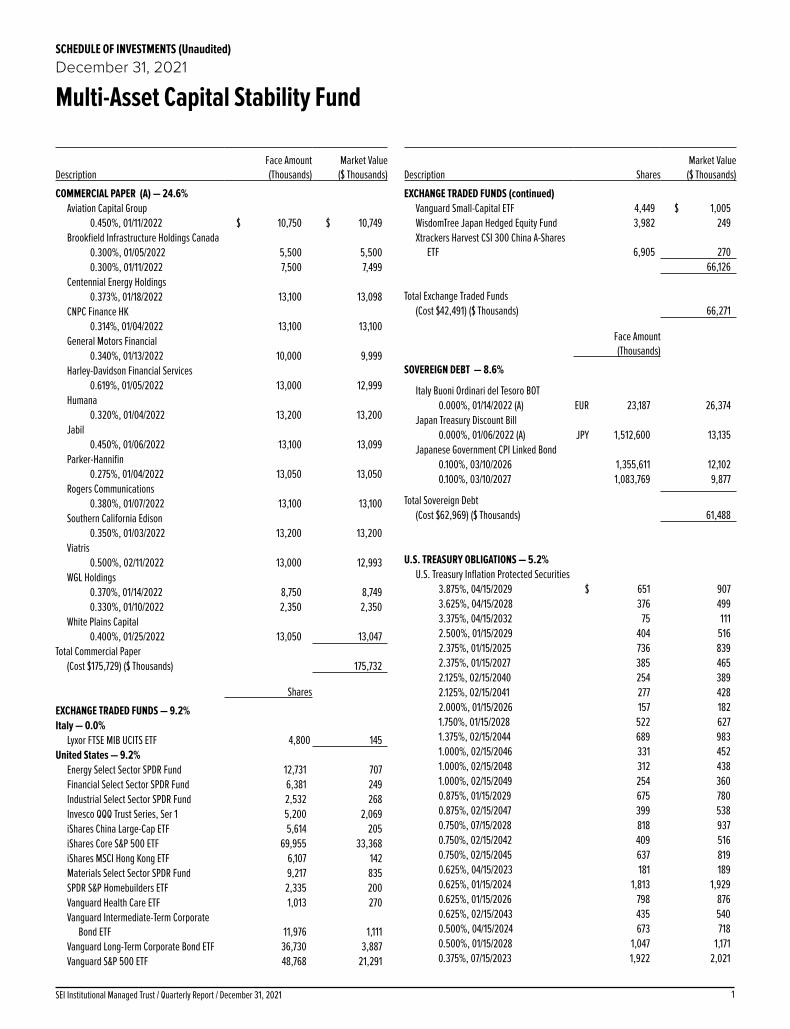
1SEI Institutional Managed Trust / Quarterly Report / December 31, 2021
SCHEDULE OF INVESTMENTS (Unaudited)December 31, 2021
Multi-Asset Capital Stability Fund
DescriptionFace Amount (Thousands)
Market Value ($ Thousands)
COMMERCIAL PAPER (A) — 24.6%Aviation Capital Group
0.450%, 01/11/2022 $ 10,750 $ 10,749Brookfield Infrastructure Holdings Canada
0.300%, 01/05/2022 5,500 5,5000.300%, 01/11/2022 7,500 7,499
Centennial Energy Holdings0.373%, 01/18/2022 13,100 13,098
CNPC Finance HK0.314%, 01/04/2022 13,100 13,100
General Motors Financial0.340%, 01/13/2022 10,000 9,999
Harley-Davidson Financial Services0.619%, 01/05/2022 13,000 12,999
Humana0.320%, 01/04/2022 13,200 13,200
Jabil0.450%, 01/06/2022 13,100 13,099
Parker-Hannifin0.275%, 01/04/2022 13,050 13,050
Rogers Communications0.380%, 01/07/2022 13,100 13,100
Southern California Edison0.350%, 01/03/2022 13,200 13,200
Viatris0.500%, 02/11/2022 13,000 12,993
WGL Holdings0.370%, 01/14/2022 8,750 8,7490.330%, 01/10/2022 2,350 2,350
White Plains Capital0.400%, 01/25/2022 13,050 13,047
Total Commercial Paper (Cost $175,729) ($ Thousands) 175,732
Shares
EXCHANGE TRADED FUNDS — 9.2%Italy — 0.0%
Lyxor FTSE MIB UCITS ETF 4,800 145United States — 9.2%
Energy Select Sector SPDR Fund 12,731 707Financial Select Sector SPDR Fund 6,381 249Industrial Select Sector SPDR Fund 2,532 268Invesco QQQ Trust Series, Ser 1 5,200 2,069iShares China Large-Cap ETF 5,614 205iShares Core S&P 500 ETF 69,955 33,368iShares MSCI Hong Kong ETF 6,107 142Materials Select Sector SPDR Fund 9,217 835SPDR S&P Homebuilders ETF 2,335 200Vanguard Health Care ETF 1,013 270Vanguard Intermediate-Term Corporate
Bond ETF 11,976 1,111Vanguard Long-Term Corporate Bond ETF 36,730 3,887Vanguard S&P 500 ETF 48,768 21,291
Description SharesMarket Value
($ Thousands)
EXCHANGE TRADED FUNDS (continued)Vanguard Small-Capital ETF 4,449 $ 1,005WisdomTree Japan Hedged Equity Fund 3,982 249Xtrackers Harvest CSI 300 China A-Shares
ETF 6,905 270 66,126
Total Exchange Traded Funds
(Cost $42,491) ($ Thousands) 66,271
Face Amount (Thousands)
SOVEREIGN DEBT — 8.6%
Italy Buoni Ordinari del Tesoro BOT0.000%, 01/14/2022 (A) EUR 23,187 26,374
Japan Treasury Discount Bill0.000%, 01/06/2022 (A) JPY 1,512,600 13,135
Japanese Government CPI Linked Bond0.100%, 03/10/2026 1,355,611 12,1020.100%, 03/10/2027 1,083,769 9,877
Total Sovereign Debt (Cost $62,969) ($ Thousands) 61,488
U.S. TREASURY OBLIGATIONS — 5.2%U.S. Treasury Inflation Protected Securities
3.875%, 04/15/2029 $ 651 9073.625%, 04/15/2028 376 4993.375%, 04/15/2032 75 1112.500%, 01/15/2029 404 5162.375%, 01/15/2025 736 8392.375%, 01/15/2027 385 4652.125%, 02/15/2040 254 3892.125%, 02/15/2041 277 4282.000%, 01/15/2026 157 1821.750%, 01/15/2028 522 6271.375%, 02/15/2044 689 9831.000%, 02/15/2046 331 4521.000%, 02/15/2048 312 4381.000%, 02/15/2049 254 3600.875%, 01/15/2029 675 7800.875%, 02/15/2047 399 5380.750%, 07/15/2028 818 9370.750%, 02/15/2042 409 5160.750%, 02/15/2045 637 8190.625%, 04/15/2023 181 1890.625%, 01/15/2024 1,813 1,9290.625%, 01/15/2026 798 8760.625%, 02/15/2043 435 5400.500%, 04/15/2024 673 7180.500%, 01/15/2028 1,047 1,1710.375%, 07/15/2023 1,922 2,021

SEI Institutional Managed Trust / Quarterly Report / December 31, 20212
SCHEDULE OF INVESTMENTS (Unaudited)December 31, 2021
Multi-Asset Capital Stability Fund (Continued)
DescriptionFace Amount (Thousands)
Market Value ($ Thousands)
U.S. TREASURY OBLIGATIONS (continued)0.375%, 07/15/2025 $ 1,065 $ 1,1570.375%, 01/15/2027 1,202 1,3220.375%, 07/15/2027 1,006 1,1160.250%, 01/15/2025 1,260 1,3500.250%, 07/15/2029 899 1,0070.250%, 02/15/2050 427 5160.125%, 07/15/2024 1,129 1,2040.125%, 10/15/2024 1,379 1,4730.125%, 04/15/2025 1,117 1,1940.125%, 10/15/2025 233 2510.125%, 10/15/2025 729 7860.125%, 04/15/2026 442 4770.125%, 07/15/2026 994 1,0790.125%, 10/15/2026 559 6080.125%, 01/15/2030 1,130 1,2540.125%, 07/15/2030 1,052 1,1770.125%, 01/15/2031 1,151 1,2880.125%, 07/15/2031 1,071 1,2040.125%, 02/15/2051 381 452
Total U.S. Treasury Obligations
(Cost $34,701) ($ Thousands) 37,145
U.S. GOVERNMENT AGENCY OBLIGATION — 2.7%FHLB
1.375%, 02/17/2023 18,990 19,193
Total U.S. Government Agency Obligation (Cost $19,238) ($ Thousands) 19,193
Shares
COMMON STOCK — 1.4%Canada — 0.1%
Bank of Montreal 1,023 110Bank of Nova Scotia 840 60Barrick Gold 6,184 118Kinross Gold 19,236 112
400India — 0.0%
ICICI Bank ADR 2,993 59United Kingdom — 0.0%
Aon PLC, Cl A 188 56AstraZeneca PLC ADR 1,031 60Horizon Therapeutics Plc * 1,088 117Medtronic PLC 519 54Royalty Pharma PLC, Cl A 1,426 57
344United States — 1.3%Communication Services — 0.2%
Alphabet Inc, Cl A * 39 113Fox Corp, Cl A 1,551 57
Description SharesMarket Value
($ Thousands)
COMMON STOCK (continued)Interpublic Group of Cos Inc/The 1,595 $ 60Meta Platforms Inc, Cl A * 1,215 409Netflix Inc * 137 82Verizon Communications Inc 1,092 57Walt Disney Co/The * 3,411 528World Wrestling Entertainment Inc, Cl A 6,681 330
1,636Consumer Discretionary — 0.3%
Amazon.com Inc, Cl A * 81 270Caesars Entertainment Inc * 1,744 163Carnival Corp * 10,860 218General Motors Co * 6,817 400Genuine Parts Co 427 60MGM Resorts International 9,936 446Norwegian Cruise Line Holdings Ltd * 18,661 387Service Corp International/US 1,649 117
2,061Consumer Staples — 0.1%
Coca-Cola Co/The 1,042 62J M Smucker Co/The 429 58Kellogg Co 1,772 114Mondelez International Inc, Cl A 928 61PepsiCo Inc 343 60Unilever PLC ADR 1,080 58Walmart Inc 407 59
472Energy — 0.0%
Williams Cos Inc/The 4,084 106Financials — 0.2%
AGNC Investment Corp ‡ 3,607 54American International Group Inc 1,027 58Arthur J Gallagher & Co 671 114Berkshire Hathaway Inc, Cl B * 199 60Canadian Imperial Bank of Commerce 510 59Credit Suisse Group ADR 11,562 112Fidelity National Financial Inc 1,103 58Goldman Sachs Group Inc/The 288 110HSBC Holdings PLC ADR 3,883 117JPMorgan Chase & Co 346 55KeyCorp 2,430 56Northern Trust Corp 469 56S&P Global Inc 120 57UBS Group 3,152 56US Bancorp 986 55Wells Fargo & Co 8,121 390
1,467Health Care — 0.1%
Amgen Inc, Cl A 552 124BioNTech ADR * 380 98Bristol-Myers Squibb Co 988 62Merck & Co Inc 760 58

3SEI Institutional Managed Trust / Quarterly Report / December 31, 2021
SCHEDULE OF INVESTMENTS (Unaudited)December 31, 2021
Multi-Asset Capital Stability Fund (Continued)
Description SharesMarket Value
($ Thousands)
COMMON STOCK (continued)Pfizer Inc 1,042 $ 61United Therapeutics Corp * 295 64Vertex Pharmaceuticals Inc * 272 60Viatris Inc, Cl W * 316 4
531Industrials — 0.1%
Delta Air Lines Inc, Cl A * 4,974 195Huntington Ingalls Industries Inc, Cl A 309 58Lockheed Martin Corp 167 59Northrop Grumman Corp 156 60Old Dominion Freight Line Inc, Cl A 156 56Oshkosh Corp 509 57Raytheon Technologies Corp 680 59Southwest Airlines Co, Cl A * 2,146 92
636Information Technology — 0.2%
Apple Inc 3,282 583Dropbox Inc, Cl A * 4,596 113Fidelity National Information Services
Inc, Cl B 537 59Hewlett Packard Enterprise Co 3,605 57Intel Corp 1,123 58International Business Machines Corp 469 63Taiwan Semiconductor Manufacturing Co
Ltd ADR 464 56United Microelectronics ADR 4,560 53Visa Inc, Cl A 283 61Zebra Technologies Corp, Cl A * 187 111
1,214Materials — 0.0%
Martin Marietta Materials Inc, Cl A 267 117Newmont Corp 2,090 130Nutrien 1,619 122
369Real Estate — 0.0%
CBRE Group Inc, Cl A * 555 60STAG Industrial Inc ‡ 2,564 123
183Utilities — 0.1%
American Water Works Co Inc 659 124National Grid ADR 1,678 121Pinnacle West Capital Corp 849 60WEC Energy Group Inc 623 61Xcel Energy Inc 1,725 117
483 9,158
Description SharesMarket Value
($ Thousands)
COMMON STOCK (continued)
Total Common Stock
(Cost $8,705) ($ Thousands) $ 9,961
Total Investments in Securities — 51.7%(Cost $343,833) ($ Thousands) $ 369,790

SEI Institutional Managed Trust / Quarterly Report / December 31, 20214
SCHEDULE OF INVESTMENTS (Unaudited)December 31, 2021
Multi-Asset Capital Stability Fund (Continued)
A list of the open futures contracts held by the Fund at December 31, 2021, is as follows:
Type of ContractNumber of Contracts
Expiration Date
Notional Amount (Thousands) Value (Thousands)
Unrealized Appreciation/ (Depreciation) (Thousands)
Long ContractsAdd AUS 3YR BOND FUT MAR22 to SEI_Futures Rule 112 Mar-2022 $ 9,106 $ 9,295 $ (7)Add NASD100 MICRO EMINMAR22 to SEI_Futures Rule 26 Mar-2022 836 849 13Amsterdam Index 4 Jan-2022 700 726 20Australian 10-Year Bond 4 Mar-2022 399 405 (3)CAC40 10 Euro Index 4 Jan-2022 311 325 12Canadian 10-Year Bond 91 Mar-2022 10,041 10,275 194DAX Index 2 Mar-2022 871 902 22Euro STOXX 50 46 Mar-2022 2,170 2,243 54FTSE 100 Index 5 Mar-2022 497 496 (4)FTSE 100 Index 4 Mar-2022 380 397 8FTSE MIB Index 3 Mar-2022 447 465 14IBEX 4 Jan-2022 376 395 15Long Gilt 10-Year Bond 32 Apr-2022 5,379 5,413 (23)MSCI EAFE Index 110 Mar-2022 12,585 12,770 185MSCI Emerging Markets 91 Mar-2022 5,642 5,580 (63)MSCI Emerging Markets 57 Mar-2022 3,453 3,495 42MSCI Singapore Index 33 Jan-2022 824 833 6NASDAQ 100 Index E-MINI 8 Mar-2022 2,572 2,611 39Nikkei 225 Index 75 Mar-2022 1,896 1,878 3Nikkei 225 Index 9 Mar-2022 1,267 1,300 33OMX Stockholm 30 61 Jan-2022 1,526 1,630 89Russell 2000 Index E-MINI 32 Mar-2022 3,483 3,588 106S&P 500 Index E-MINI 8 Mar-2022 1,859 1,903 44S&P Mid Cap 400 Index E-MINI 15 Mar-2022 4,146 4,256 110S&P TSX 60 Index 19 Mar-2022 3,696 3,853 92SPI 200 Index 14 Mar-2022 1,810 1,869 22U.S. 2-Year Treasury Note 155 Apr-2022 33,835 33,817 (18)U.S. 5-Year Treasury Note 227 Apr-2022 27,462 27,462 –U.S. 5-Year Treasury Note 48 Apr-2022 5,783 5,807 24U.S. 10-Year Treasury Note 166 Mar-2022 21,410 21,658 248U.S. Ultra Long Treasury Bond 1 Mar-2022 194 197 3
164,956 166,693 1,280Short Contracts
Euro STOXX 50 (7) Mar-2022 $ (326) $ (341) $ (12)Hang Seng Index (9) Jan-2022 (1,336) (1,354) (17)Japanese 10-Year Bond (11) Mar-2022 (14,751) (14,489) 45OMX Stockholm 30 (48) Jan-2022 (1,284) (1,283) (1)S&P 500 Index E-MINI (73) Mar-2022 (17,126) (17,369) (242)S&P TSX 60 Index (4) Mar-2022 (803) (811) (1)SPI 200 Index (6) Mar-2022 (807) (801) 8
(36,433) (36,448) (220) $ 128,523 $ 130,245 $ 1,060
A list of the open forward foreign currency contracts held by the Fund at December 31, 2021 is as follows:
Counterparty Settlement DateCurrency to Deliver
(Thousands)Currency to Receive
(Thousands)
Unrealized Appreciation
(Depreciation) (Thousands)
Bank of America 01/20/22 EUR 815 NOK 8,224 $ 5
Bank of America 01/27/22 PHP 112,534 USD 2,237 49
Barclays PLC 01/07/22 USD 2,494 INR 186,467 11
Barclays PLC 01/07/22 INR 77,644 USD 1,031 (13)
Barclays PLC 01/13/22 USD 279 MXN 5,965 12

5SEI Institutional Managed Trust / Quarterly Report / December 31, 2021
SCHEDULE OF INVESTMENTS (Unaudited)December 31, 2021
Multi-Asset Capital Stability Fund (Continued)
Counterparty Settlement DateCurrency to Deliver
(Thousands)Currency to Receive
(Thousands)
Unrealized Appreciation
(Depreciation) (Thousands)
Barclays PLC 01/19/22 EUR 622 USD 706 $ (2)
Barclays PLC 01/19/22 USD 709 AUD 983 6
Barclays PLC 01/19/22 USD 3,407 CAD 4,360 45
Barclays PLC 01/19/22 USD 3,852 SEK 34,978 13
Barclays PLC 01/20/22 USD 1,134 NZD 1,665 5
Barclays PLC 01/20/22 KRW 541,759 USD 462 7
Barclays PLC 01/27/22 USD 371 PHP 18,529 (10)
Barclays PLC 01/27/22 USD 2,019 IDR 29,177,542 30
Barclays PLC 01/27/22 PHP 96,378 USD 1,891 16
Barclays PLC 01/27/22 IDR 2,181,618 USD 152 (1)
Barclays PLC 02/17/22 USD 870 HUF 284,491 5
Barclays PLC 06/16/22 MYR 2,220 USD 520 (11)
BNP Paribas 02/10/22 HKD 22,121 USD 2,841 3
BNP Paribas 02/17/22 USD 987 PLN 4,039 12
Brown Brothers Harriman 01/13/22 USD 228 MXN 4,918 12
Brown Brothers Harriman 01/13/22 CHF 356 USD 388 (3)
Brown Brothers Harriman 01/13/22 CHF 409 EUR 391 (4)Brown Brothers Harriman 01/13/22 - 02/10/22 USD 596 EUR 525 2
Brown Brothers Harriman 01/13/22 MXN 4,918 USD 236 (4)
Brown Brothers Harriman 01/14/22 USD 469 SGD 632 —
Brown Brothers Harriman 01/19/22 USD 374 CAD 480 6
Brown Brothers Harriman 01/19/22 NZD 636 USD 433 (2)
Brown Brothers Harriman 01/25/22 ZAR 6,720 USD 424 4
Brown Brothers Harriman 01/25/22 ZAR 6,625 USD 412 (2)
Brown Brothers Harriman 02/08/22 USD 1,134 AUD 1,573 9
Brown Brothers Harriman 02/09/22 USD 344 JPY 39,190 (4)
Brown Brothers Harriman 02/10/22 USD 386 CAD 495 6
Brown Brothers Harriman 02/10/22 CAD 1,303 USD 1,022 (9)
Brown Brothers Harriman 02/17/22 USD 638 HUF 208,428 2
Brown Brothers Harriman 02/17/22 USD 648 PLN 2,671 13
Brown Brothers Harriman 02/17/22 CZK 5,872 USD 260 (7)
Brown Brothers Harriman 02/17/22 HUF 134,527 USD 410 (4)
Brown Brothers Harriman 03/10/22 USD 1,714 THB 57,272 1
Brown Brothers Harriman 03/10/22 THB 127,433 USD 3,782 (32)
Citigroup 02/10/22 EUR 731 USD 845 14
Citigroup 02/10/22 USD 3,083 CAD 3,881 (9)
Citigroup 03/02/22 USD 1,943 RUB 145,096 (27)
Credit Suisse First Boston 01/13/22 USD 276 MXN 5,965 15
Credit Suisse First Boston 01/13/22 MXN 11,929 USD 580 (1)
Deutsche Bank 01/07/22 INR 114,500 USD 1,513 (25)
Deutsche Bank 01/20/22 USD 2,819 KRW 3,324,676 (26)
Deutsche Bank 01/20/22 KRW 601,888 USD 508 2
Deutsche Bank 01/21/22 USD 1,010 PEN 4,120 25
Deutsche Bank 01/21/22 PEN 10,617 USD 2,628 (37)
Deutsche Bank 01/21/22 CLP 493,660 USD 605 27
Deutsche Bank 01/21/22 COP 11,589,085 USD 2,972 129
Deutsche Bank 01/27/22 USD 529 PHP 26,680 (11)
Deutsche Bank 02/17/22 CZK 17,220 USD 762 (23)

SEI Institutional Managed Trust / Quarterly Report / December 31, 20216
SCHEDULE OF INVESTMENTS (Unaudited)December 31, 2021
Multi-Asset Capital Stability Fund (Continued)
Counterparty Settlement DateCurrency to Deliver
(Thousands)Currency to Receive
(Thousands)
Unrealized Appreciation
(Depreciation) (Thousands)
Goldman Sachs 01/13/22 USD 604 MXN 12,470 $ 4
Goldman Sachs 01/19/22 USD 709 SEK 6,437 2
Goldman Sachs 01/19/22 USD 943 GBP 706 13
Goldman Sachs 01/19/22 NOK 8,613 USD 969 (8)
Goldman Sachs 01/20/22 TWD 9,297 USD 335 (1)
Goldman Sachs 01/20/22 KRW 1,066,021 USD 902 7
Goldman Sachs 01/21/22 USD 547 CLP 468,707 2
Goldman Sachs 01/21/22 PEN 1,542 USD 378 (9)
Goldman Sachs 01/21/22 CLP 585,969 USD 710 24
Goldman Sachs 01/25/22 ZAR 18,505 USD 1,162 6
Goldman Sachs 01/27/22 USD 2,122 PHP 106,718 (47)
Goldman Sachs 01/27/22 IDR 27,591,256 USD 1,925 (13)
Goldman Sachs 02/02/22 USD 2,222 BRL 12,618 25
Goldman Sachs 02/10/22 CAD 1,335 USD 1,056 (1)
Goldman Sachs 02/17/22 USD 754 HUF 247,262 6
Goldman Sachs 02/17/22 USD 909 CZK 20,075 6
Goldman Sachs 02/17/22 PLN 2,347 USD 575 (5)
Goldman Sachs 03/02/22 RUB 103,623 USD 1,377 9
Goldman Sachs 06/16/22 USD 3,701 MYR 15,711 58
Goldman Sachs 06/16/22 MYR 5,201 USD 1,212 (33)
HSBC 01/19/22 CHF 1,335 USD 1,450 (16)
HSBC 01/19/22 USD 1,457 NOK 13,208 40
HSBC 01/19/22 NZD 4,943 USD 3,338 (45)
HSBC 01/19/22 JPY 137,552 USD 1,213 18
HSBC 01/20/22 USD 459 KRW 541,759 (4)
HSBC 01/20/22 USD 697 NOK 5,961 (21)
HSBC 01/20/22 USD 938 TWD 25,944 (1)
HSBC 01/21/22 USD 1,629 CLP 1,319,475 (84)
HSBC 01/27/22 IDR 9,772,195 USD 682 (5)
Montgomery/Bank of America 01/19/22 AUD 3,842 USD 2,736 (57)
Montgomery/Bank of America 01/21/22 PEN 722 USD 178 (3)
Morgan Stanley 01/20/22 NOK 6,071 EUR 594 (12)
Morgan Stanley 01/20/22 NZD 7,415 USD 5,140 67
Morgan Stanley 01/20/22 TWD 25,944 USD 927 (11)
Morgan Stanley 02/08/22 AUD 3,377 USD 2,497 42
Morgan Stanley 02/09/22 JPY 10,934,248 USD 96,035 1,039
RBS 01/20/22 NOK 5,961 USD 714 38
Standard Bank 01/13/22 EUR 802 CHF 835 4
Standard Bank 02/09/22 USD 680 JPY 76,769 (13)
Standard Chartered 01/07/22 INR 52,615 USD 707 —
Standard Chartered 01/19/22 GBP 1,184 USD 1,567 (36)
Standard Chartered 01/27/22 USD 716 IDR 10,289,278 6
Standard Chartered 01/27/22 USD 1,756 PHP 88,475 (36)
UBS 01/04/22 USD 2,236 BRL 12,618 27
UBS 01/20/22 NOK 8,224 EUR 798 (24)
UBS 01/20/22 SEK 8,233 EUR 805 6
UBS 01/20/22 TWD 27,066 USD 976 (2)

7SEI Institutional Managed Trust / Quarterly Report / December 31, 2021
SCHEDULE OF INVESTMENTS (Unaudited)December 31, 2021
Multi-Asset Capital Stability Fund (Continued)
Counterparty Settlement DateCurrency to Deliver
(Thousands)Currency to Receive
(Thousands)
Unrealized Appreciation
(Depreciation) (Thousands)
UBS 02/17/22 CZK 41,469 USD 1,833 $ (57) $ 1,124
A list of the open OTC swap agreements held by the Fund at December 31, 2021, is as follows:
Variance Swaps
CounterpartyReference Entity/
Obligation Volatility Strike PricePayment
FrequencyTermination
Date Currency
Notional Amount
(Thousands)Value
( Thousands)
Upfront Payments/
Receipts (Thousands)
Net Unrealized Appreciation
(Depreciation) (Thousands)
Bank of America Merrill Lynch
USDJPY VARSWAP Long6.85% Quarterly 4/16/2022 USD 35 $ (33) $ – $ (33)
Bank of America Merrill Lynch
USDJPY VARSWAP Long6.85% Quarterly 4/16/2022 USD 120 (114) – (114)
$ (147) $ – $ (147)
Total Return Swaps
CounterpartyReference Entity/
Obligation Fund Pays Fund ReceivesPayment
FrequencyTermination
Date Currency
Notional Amount
(Thousands)Value
(Thousands)
Upfront Payments/
Receipts (Thousands)
Net Unrealized Appreciation
(Depreciation) (Thousands)
Morgan Stanley NEGATIVE PRICE RETURN POSITVE PRICE RETURN Annual 03/18/2022 USD (867) $ 31 $ – $ 31
$ 31 $ – $ 31
A list of the open centrally cleared swap agreements held by the Fund at December 31, 2021, is as follows:
Credit Default Swaps
Reference Entity/ ObligationBuy/Sell
Protection(Pays)/
Receives RatePayment
Frequency Termination DateNotional Amount
(Thousands)Value
(Thousands)
Upfront Payments/ Receipts
(Thousands)
Net Unrealized Appreciation
(Depreciation) (Thousands)
CDX.NA.HY.S36V1-5Y Sell 5.00% Quarterly 06/20/2026 (660) $ 60 $ 55 $ 5CDX.NA.HY.S37V1-5Y Sell 5.00% Quarterly 12/20/2026 (4,610) 424 414 10CDX.NA.IG.S36V1-5Y Sell 1.00% Quarterly 06/20/2026 (480) 12 11 1CDX.NA.IG.S37V1-5Y Sell 1.00% Quarterly 12/20/2026 (3,970) 97 93 4
ITRAXX.XOVER.S35V1-5Y Sell 5.00% Quarterly 06/20/2026 (210) 27 27 –ITRAXX.XOVER.S36V1-5Y Sell 5.00% Quarterly 12/20/2026 (700) $ 94 $ 92 $ 2
$ 714 $ 692 $ 22
Interest Rate Swaps
Fund Pays Fund ReceivesPayment
Frequency Termination Date Currency
Notional Amount
(Thousands)Value
(Thousands)
Upfront Payments/
Receipts (Thousands)
Net Unrealized Appreciation
(Depreciation) (Thousands)
6-MONTH AUD - BBSW 1.322 Semi-Annual 07/22/2031 USD 230 $ (9) $ – $ (9)3-MONTH NZD - BKBM 1.754 Semi-Annual 07/23/2031 USD 720 (37) – (37)6-MONTH AUD - BBSW 1.336 Semi-Annual 07/26/2031 USD 1,210 (49) – (49)3-MONTH NZD -BKBM 1.795 Semi-Annual 07/27/2031 USD 970 (48) – (48)6-MONTH AUD - BBSW 1.3065 Semi-Annual 07/28/2031 USD 860 (36) – (36)3-MONTH NZD - BKBM 1.8015 Semi-Annual 07/29/2031 USD 780 (38) – (38)6-MONTH AUD - BBSW 1.31 Semi-Annual 08/03/2031 USD 920 (47) – (47)3-MONTH NZD - BKBM 1.8125 Semi-Annual 08/03/2031 USD 900 (35) – (35)
NZD @ 2.105% NZD BKBM 3M Semi-Annual 09/22/2031 USD 1,570 (54) – (54)AUD @ 1.4385% AUD BBSW 6M Semi-Annual 09/23/2031 USD 1,230 (39) – (39)AUD @ 1.9975% AUD BBSW 6M Semi-Annual 11/10/2031 USD 2,160 4 – 4NZD @ 2.6715 NZD BKBM 3M Semi-Annual 11/11/2031 USD 1,860 5 – 5

SEI Institutional Managed Trust / Quarterly Report / December 31, 20218
SCHEDULE OF INVESTMENTS (Unaudited)December 31, 2021
Multi-Asset Capital Stability Fund (Continued)
Fund Pays Fund ReceivesPayment
Frequency Termination Date Currency
Notional Amount
(Thousands)Value
(Thousands)
Upfront Payments/
Receipts (Thousands)
Net Unrealized Appreciation
(Depreciation) (Thousands)
6-MONTH AUD - BBSW 2.067 Semi-Annual 11/15/2031 USD 2,130 $ 13 $ – $ 133-MONTH NZD - BKBM 2.695 Semi-Annual 11/16/2031 USD 1,840 8 – 86-MONTH AUD - BBSW 2.074 Semi-Annual 11/22/2031 USD 1,510 10 – 103-MONTH NZD - BKBM 2.8 Semi-Annual 11/23/2031 USD 1,340 14 – 14
$ (338) $ – $ (338)
t
Percentages are based on Net Assets of $714,815 ($ Thousands).* Non-income producing security.(A) Zero coupon security. The rate shown on the Schedule of Investments is the security's effective
yield at the time of purchase.
AUD — Australian DollarBRL — Brazilian RealCAD — Canadian DollarCHF — Swiss FrancCl — ClassCLP — Chilean PesoCNH — Chinese Yuan OffshoreCOP — Colombian PesoCZK — Czech KorunaDAX — German Stock IndexEAFE — Europe, Australasia and Far EastETF — Exchange-Traded FundEUR — EuroFHLB — Federal Home Loan BankFTSE— Financial Times Stock ExchangeGBP — British Pound SterlingHKD — Hong Kong DollarHUF — Hungarian ForintIBEX — International Business ExchangeIDR — Indonesian RupiahINR — Indian RupeeJPY — Japanese YenKRW — Korean WonLtd. — LimitedMIB — Milano Indice di BorsaMSCI — Morgan Stanley Capital InternationalMXN — Mexican PesoMYR — Malaysian RinggitNASDAQ – National Association of Securities Dealers and Automated QuotationsNOK — Norwegian KroneNZD — New Zealand DollarOMX — Option Market IndexPEN — Peruvian SolPHP — Philippine PesoPLC — Public Limited CompanyPLN — Polish zlotyRUB — Russian RubleS&P— Standard & Poor'sSer — Series
SEK — Swedish KronaSGD — Singapore DollarSPDR — Standard & Poor's Depository ReceiptSPI — Share Price IndexTHB — Thai Baht
TSX — Toronto Stock ExchangeTWD — Taiwan Dollar
UCITS — Undertakings for the Collective Investment in Transferable SecuritiesUSD — U.S. DollarZAR — South African Rand
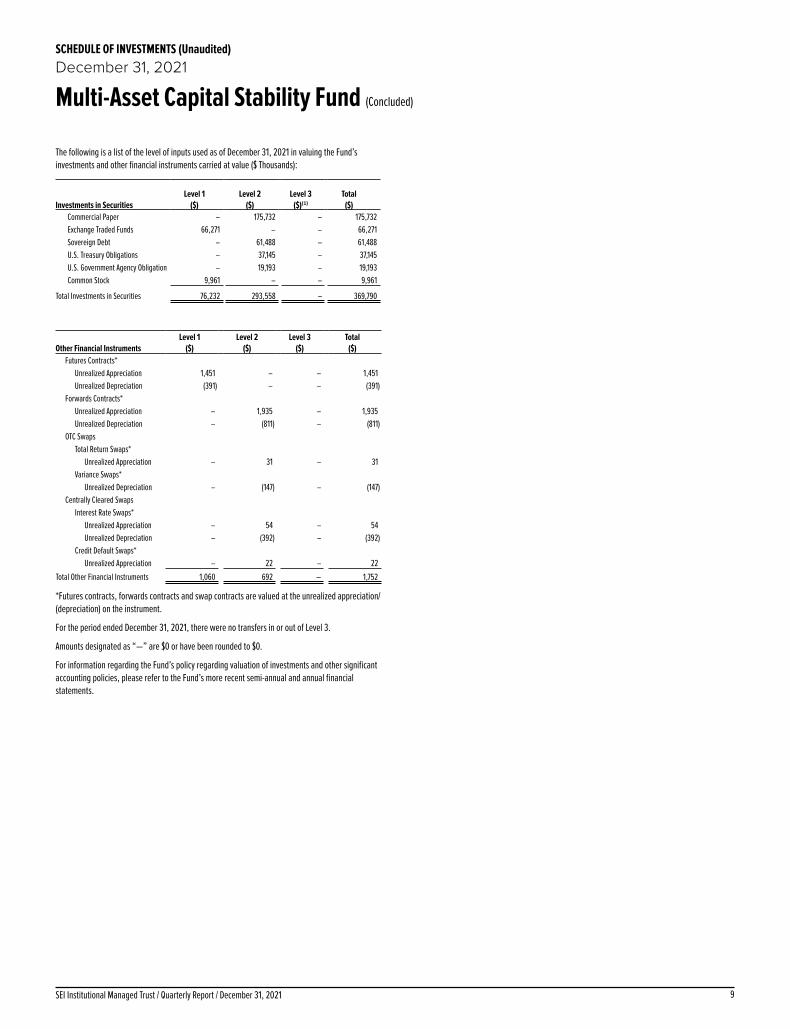
9SEI Institutional Managed Trust / Quarterly Report / December 31, 2021
SCHEDULE OF INVESTMENTS (Unaudited)December 31, 2021
Multi-Asset Capital Stability Fund (Concluded)
The following is a list of the level of inputs used as of December 31, 2021 in valuing the Fund’s investments and other financial instruments carried at value ($ Thousands):
Investments in SecuritiesLevel 1
($)Level 2
($)Level 3
($)(1)Total
($)Commercial Paper – 175,732 – 175,732Exchange Traded Funds 66,271 – – 66,271Sovereign Debt – 61,488 – 61,488U.S. Treasury Obligations – 37,145 – 37,145U.S. Government Agency Obligation – 19,193 – 19,193Common Stock 9,961 – – 9,961
Total Investments in Securities 76,232 293,558 – 369,790
Other Financial InstrumentsLevel 1
($)Level 2
($)Level 3
($)Total
($)Futures Contracts*
Unrealized Appreciation 1,451 – – 1,451Unrealized Depreciation (391) – – (391)
Forwards Contracts*Unrealized Appreciation – 1,935 – 1,935Unrealized Depreciation – (811) – (811)
OTC SwapsTotal Return Swaps*
Unrealized Appreciation – 31 – 31Variance Swaps*
Unrealized Depreciation – (147) – (147)Centrally Cleared Swaps
Interest Rate Swaps*Unrealized Appreciation – 54 – 54Unrealized Depreciation – (392) – (392)
Credit Default Swaps*Unrealized Appreciation – 22 – 22
Total Other Financial Instruments 1,060 692 – 1,752
*Futures contracts, forwards contracts and swap contracts are valued at the unrealized appreciation/(depreciation) on the instrument.
For the period ended December 31, 2021, there were no transfers in or out of Level 3.
Amounts designated as “—” are $0 or have been rounded to $0.
For information regarding the Fund’s policy regarding valuation of investments and other significant accounting policies, please refer to the Fund’s more recent semi-annual and annual financial statements.
Related Documents


