1 Lao PDR Development Report 2010 Natural Resource Management for Sustainable Development BACKGROUND NOTE The challenges of exporting from a landlocked Least Developed Country This note was prepared by Richard Record and Konesawang Nghardsaysone. The views expressed are those of the authors and do not necessarily represent those of the World Bank, its Executive Directors, or member countries. TABLE OF CONTENTS SUMMARY ............................................................................................................................................ 3 TRANSPORT COSTS IN A LANDLOCKED ECONOMY ................................................................. 3 CROSSING BORDERS ......................................................................................................................... 6 SANITARY AND PHYTOSANITARY MEASURES .......................................................................... 8 THE REGULATORY BURDEN FACED BY EXPORTERS ............................................................. 11 REFERENCES ..................................................................................................................................... 14

Welcome message from author
This document is posted to help you gain knowledge. Please leave a comment to let me know what you think about it! Share it to your friends and learn new things together.
Transcript
1
Lao PDR Development Report 2010 Natural Resource Management for Sustainable Development BACKGROUND NOTE The challenges of exporting from a landlocked Least Developed Country
This note was prepared by Richard Record and Konesawang Nghardsaysone. The views expressed are those of the authors and do not necessarily represent those of the World Bank, its Executive Directors, or member
countries.
TABLE OF CONTENTS SUMMARY ............................................................................................................................................ 3 TRANSPORT COSTS IN A LANDLOCKED ECONOMY ................................................................. 3 CROSSING BORDERS ......................................................................................................................... 6 SANITARY AND PHYTOSANITARY MEASURES .......................................................................... 8 THE REGULATORY BURDEN FACED BY EXPORTERS ............................................................. 11 REFERENCES ..................................................................................................................................... 14
2
List of Figures Figure 1. Logistics performance has modestly improved in recent years... ............................................ 4Figure 2. …but Laos still lags behind its key regional competitors ........................................................ 4Figure 3. Laos’ logistics performance is at a level expected in a country with its level of development
................................................................................................................................................................ 4Figure 4. Averages times for key import clearance steps (in hours) ....................................................... 8Figure 5. Exporters are more likely than non-exporters to describe key regulatory constraints as “major” or “very severe” ...................................................................................................................... 12Figure 6. Exporters spend much more time than non-exporters dealing with regulatory procedures, although the number of inspections is similar ...................................................................................... 12Figure 7. The manufacturing sectors with the heaviest burden in terms of number of tax inspections…
.............................................................................................................................................................. 12Figure 8. …are not necessarily the sectors where firms spend the most time dealing with regulation 12
List of Tables Table 1. LPI scores for Lao PDR and comparator countries, 2007 and 2009 ......................................... 5Table 2. Exporting a standard 20ft container from Laos incurs a significant cost and time premium compared to Thailand ............................................................................................................................. 6Table 3. Border clearance times vary significantly across checkpoints .................................................. 7Table 4. If additional clearances are required, the clearance time increases significantly ...................... 7Table 5. Summary of key gaps and recommendations in the context of the WTO SPS principles ...... 10Table 6. Regression analysis confirms the extent of the regulatory burden imposed on exporters ...... 13
3
SUMMARY Accessing key trade corridors in Lao PDR involves very high transportation costs. Despite major infrastructure investments and improvements in border procedures, the country still suffers from a high “landlocked premium” that undermines the competitiveness of its exporters. A lack of competition among transport service providers on the key Vientiane-Bangkok corridor and a complex web of restrictions both raise the costs of trucking. Customs procedures are not the binding constraint at the border. However, as trade volumes grow, the absence of a risk based border management approach will become a binding constraint, and transportation delays and costs may rise. The need for goods to be cleared by non-customs border agencies adds significant time to the process, and the performance of border agencies varies dramatically by location. Lao PDR’s comparative advantage lies in exporting agricultural products, but a weak regulatory framework for managing sanitary and phytosanitary risks prevents the country from taking full advantage of its abundant natural resources and regional market opportunities. Accession to the WTO is driving reform of the SPS legal framework, but only by introducing risk-based procedures that take into account the country’s long and porous borders will the SPS system both facilitate exports and safeguard plant, animal and human health. While key reforms have been made to the business environment, the private sector (including exporters) still suffers from high regulatory costs. Major pieces of legislation have been enacted, but key gaps remain at the implementation level and in terms of a lack of subsidiary legislation and day-to-day procedures.
TRANSPORT COSTS IN A LANDLOCKED ECONOMY
Standardized measures of logistics suggest that the performance of the international trade logistics supply chain in Lao PDR has shown modest improvement. The country’s overall performance indicator under the Logistics Performance Index (LPI) has improved from 2.25 in 2007 to 2.45 in 2009, on a scale of 1 to 5. Improvements have been seen in the ease with which competitively priced international shipments can be arranged (up from 2.40 to 2.70), in the ability to track and trace consignments (up from 1.89 to 2.45), and in the frequency with which shipments reach the consignee within the scheduled or expected time (up from 2.83 to 3.23). Such improvements may well be accounted for by the increased level of openness in Lao PDR as the country integrates more fully into the regional economy and into cross-border supply chains. The LPI provides a means of comparing the overall logistics environment across countries. It is constructed from data from a survey of freight forwarders and express carriers worldwide, providing feedback on the logistical “friendliness” of the countries in which they operate and with which they trade. These operators handle the movement of goods across borders, from factory to warehouse to port, from port to overland transit, and, through one or more borders, to the destination. Each link in the chain tests a country’s logistics infrastructure.
A more modest improvement was recorded in the efficiency of the country’s customs and border clearance processes (up from 2.08 to 2.17). Greater improvements in this area are likely to be seen when the government’s new customs IT system (ASYCUDA World) is installed in Lao border posts. Measures of the quality of trade-related and transport-related infrastructure and perceptions of the competence and quality of logistics services both declined during the period 2007 to 2009 (infrastructure falling from 2.00 to 1.95 and logistics competence falling from 2.29 to 2.14). This underlines the continuing need to upgrade facilities and to build the capacity of trade and transport service providers.
4
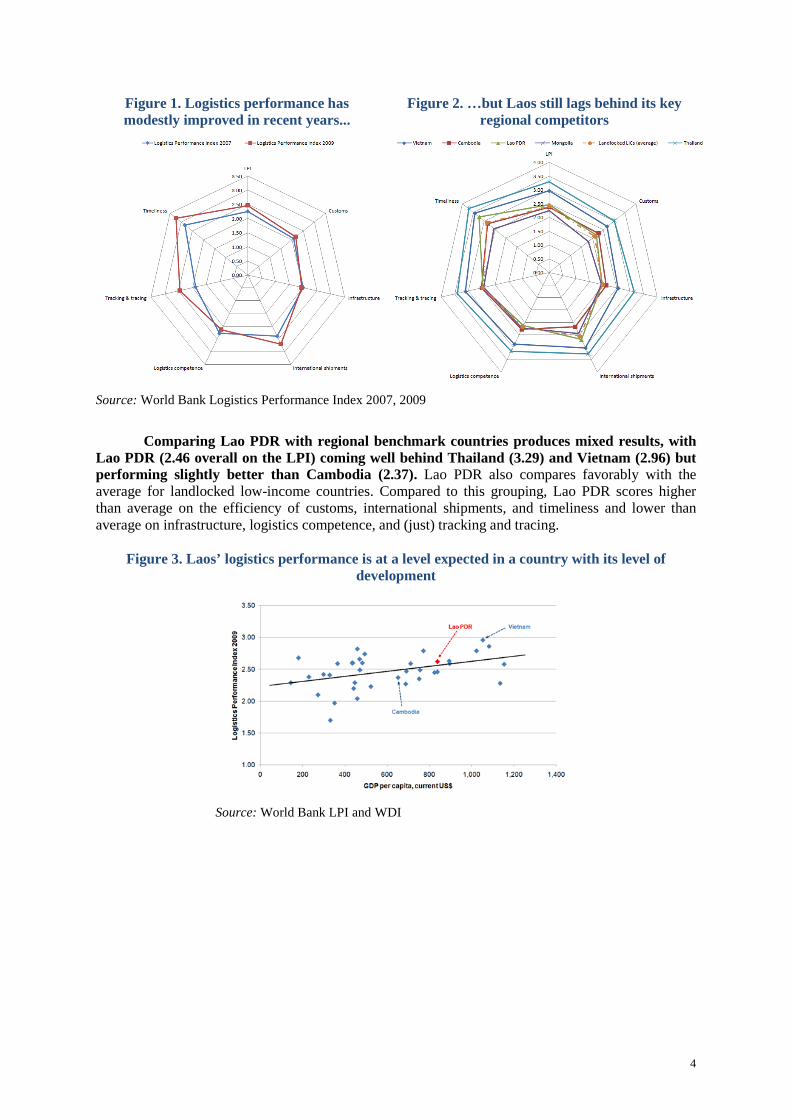
Figure 1. Logistics performance has modestly improved in recent years...
Figure 2. …but Laos still lags behind its key regional competitors
Source: World Bank Logistics Performance Index 2007, 2009
Comparing Lao PDR with regional benchmark countries produces mixed results, with
Lao PDR (2.46 overall on the LPI) coming well behind Thailand (3.29) and Vietnam (2.96) but performing slightly better than Cambodia (2.37). Lao PDR also compares favorably with the average for landlocked low-income countries. Compared to this grouping, Lao PDR scores higher than average on the efficiency of customs, international shipments, and timeliness and lower than average on infrastructure, logistics competence, and (just) tracking and tracing.
Figure 3. Laos’ logistics performance is at a level expected in a country with its level of development
Source: World Bank LPI and WDI
5
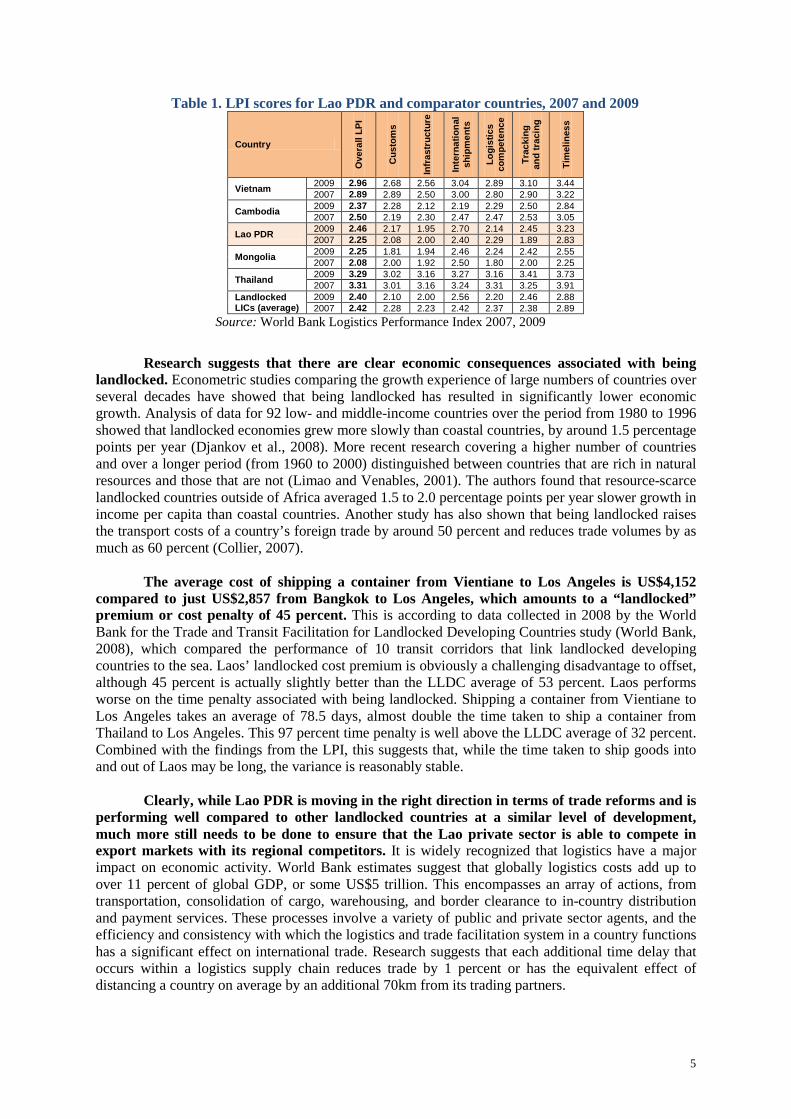
Table 1. LPI scores for Lao PDR and comparator countries, 2007 and 2009
Country
Ove
rall
LPI
Cus
tom
s
Infr
astr
uctu
re
Inte
rnat
iona
l sh
ipm
ents
Logi
stic
s co
mpe
tenc
e
Trac
king
an
d tr
acin
g
Tim
elin
ess
Vietnam 2009 2.96 2.68 2.56 3.04 2.89 3.10 3.44 2007 2.89 2.89 2.50 3.00 2.80 2.90 3.22
Cambodia 2009 2.37 2.28 2.12 2.19 2.29 2.50 2.84 2007 2.50 2.19 2.30 2.47 2.47 2.53 3.05
Lao PDR 2009 2.46 2.17 1.95 2.70 2.14 2.45 3.23 2007 2.25 2.08 2.00 2.40 2.29 1.89 2.83
Mongolia 2009 2.25 1.81 1.94 2.46 2.24 2.42 2.55 2007 2.08 2.00 1.92 2.50 1.80 2.00 2.25
Thailand 2009 3.29 3.02 3.16 3.27 3.16 3.41 3.73 2007 3.31 3.01 3.16 3.24 3.31 3.25 3.91
Landlocked LICs (average)
2009 2.40 2.10 2.00 2.56 2.20 2.46 2.88 2007 2.42 2.28 2.23 2.42 2.37 2.38 2.89
Source: World Bank Logistics Performance Index 2007, 2009
Research suggests that there are clear economic consequences associated with being
landlocked. Econometric studies comparing the growth experience of large numbers of countries over several decades have showed that being landlocked has resulted in significantly lower economic growth. Analysis of data for 92 low- and middle-income countries over the period from 1980 to 1996 showed that landlocked economies grew more slowly than coastal countries, by around 1.5 percentage points per year (Djankov et al., 2008). More recent research covering a higher number of countries and over a longer period (from 1960 to 2000) distinguished between countries that are rich in natural resources and those that are not (Limao and Venables, 2001). The authors found that resource-scarce landlocked countries outside of Africa averaged 1.5 to 2.0 percentage points per year slower growth in income per capita than coastal countries. Another study has also shown that being landlocked raises the transport costs of a country’s foreign trade by around 50 percent and reduces trade volumes by as much as 60 percent (Collier, 2007).
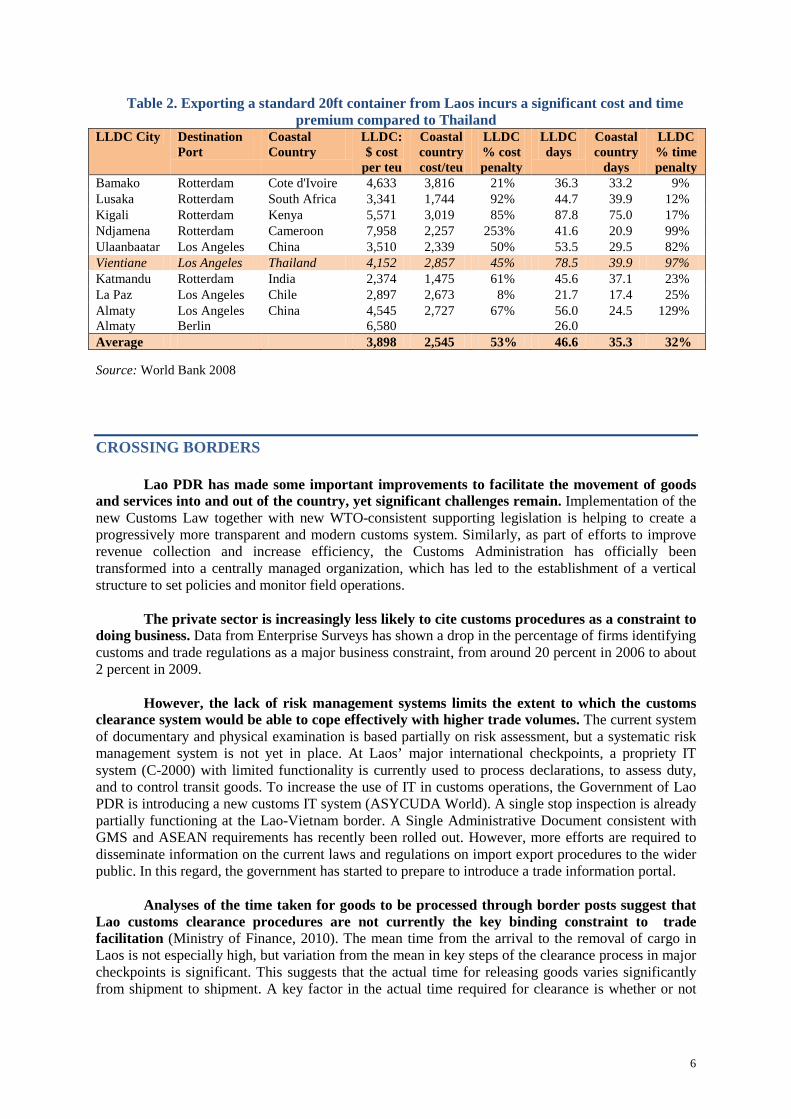
The average cost of shipping a container from Vientiane to Los Angeles is US$4,152 compared to just US$2,857 from Bangkok to Los Angeles, which amounts to a “landlocked” premium or cost penalty of 45 percent. This is according to data collected in 2008 by the World Bank for the Trade and Transit Facilitation for Landlocked Developing Countries study (World Bank, 2008), which compared the performance of 10 transit corridors that link landlocked developing countries to the sea. Laos’ landlocked cost premium is obviously a challenging disadvantage to offset, although 45 percent is actually slightly better than the LLDC average of 53 percent. Laos performs worse on the time penalty associated with being landlocked. Shipping a container from Vientiane to Los Angeles takes an average of 78.5 days, almost double the time taken to ship a container from Thailand to Los Angeles. This 97 percent time penalty is well above the LLDC average of 32 percent. Combined with the findings from the LPI, this suggests that, while the time taken to ship goods into and out of Laos may be long, the variance is reasonably stable.
Clearly, while Lao PDR is moving in the right direction in terms of trade reforms and is performing well compared to other landlocked countries at a similar level of development, much more still needs to be done to ensure that the Lao private sector is able to compete in export markets with its regional competitors. It is widely recognized that logistics have a major impact on economic activity. World Bank estimates suggest that globally logistics costs add up to over 11 percent of global GDP, or some US$5 trillion. This encompasses an array of actions, from transportation, consolidation of cargo, warehousing, and border clearance to in-country distribution and payment services. These processes involve a variety of public and private sector agents, and the efficiency and consistency with which the logistics and trade facilitation system in a country functions has a significant effect on international trade. Research suggests that each additional time delay that occurs within a logistics supply chain reduces trade by 1 percent or has the equivalent effect of distancing a country on average by an additional 70km from its trading partners.
6
Table 2. Exporting a standard 20ft container from Laos incurs a significant cost and time premium compared to Thailand
LLDC City Destination Port
Coastal Country
LLDC: $ cost
per teu
Coastal country cost/teu
LLDC % cost penalty
LLDC days
Coastal country
days
LLDC % time penalty
Bamako Rotterdam Cote d'Ivoire 4,633 3,816 21% 36.3 33.2 9% Lusaka Rotterdam South Africa 3,341 1,744 92% 44.7 39.9 12% Kigali Rotterdam Kenya 5,571 3,019 85% 87.8 75.0 17% Ndjamena Rotterdam Cameroon 7,958 2,257 253% 41.6 20.9 99% Ulaanbaatar Los Angeles China 3,510 2,339 50% 53.5 29.5 82% Vientiane Los Angeles Thailand 4,152 2,857 45% 78.5 39.9 97% Katmandu Rotterdam India 2,374 1,475 61% 45.6 37.1 23% La Paz Los Angeles Chile 2,897 2,673 8% 21.7 17.4 25% Almaty Almaty
Los Angeles Berlin
China 4,545 6,580
2,727 67% 56.0 26.0
24.5 129%
Average 3,898 2,545 53% 46.6 35.3 32% Source: World Bank 2008
CROSSING BORDERS
Lao PDR has made some important improvements to facilitate the movement of goods and services into and out of the country, yet significant challenges remain. Implementation of the new Customs Law together with new WTO-consistent supporting legislation is helping to create a progressively more transparent and modern customs system. Similarly, as part of efforts to improve revenue collection and increase efficiency, the Customs Administration has officially been transformed into a centrally managed organization, which has led to the establishment of a vertical structure to set policies and monitor field operations.
The private sector is increasingly less likely to cite customs procedures as a constraint to doing business. Data from Enterprise Surveys has shown a drop in the percentage of firms identifying customs and trade regulations as a major business constraint, from around 20 percent in 2006 to about 2 percent in 2009.
However, the lack of risk management systems limits the extent to which the customs clearance system would be able to cope effectively with higher trade volumes. The current system of documentary and physical examination is based partially on risk assessment, but a systematic risk management system is not yet in place. At Laos’ major international checkpoints, a propriety IT system (C-2000) with limited functionality is currently used to process declarations, to assess duty, and to control transit goods. To increase the use of IT in customs operations, the Government of Lao PDR is introducing a new customs IT system (ASYCUDA World). A single stop inspection is already partially functioning at the Lao-Vietnam border. A Single Administrative Document consistent with GMS and ASEAN requirements has recently been rolled out. However, more efforts are required to disseminate information on the current laws and regulations on import export procedures to the wider public. In this regard, the government has started to prepare to introduce a trade information portal.
Analyses of the time taken for goods to be processed through border posts suggest that Lao customs clearance procedures are not currently the key binding constraint to trade facilitation (Ministry of Finance, 2010). The mean time from the arrival to the removal of cargo in Laos is not especially high, but variation from the mean in key steps of the clearance process in major checkpoints is significant. This suggests that the actual time for releasing goods varies significantly from shipment to shipment. A key factor in the actual time required for clearance is whether or not
7
additional permits or licenses are required by other agencies, such as for public health, licensing or duty exemptions.
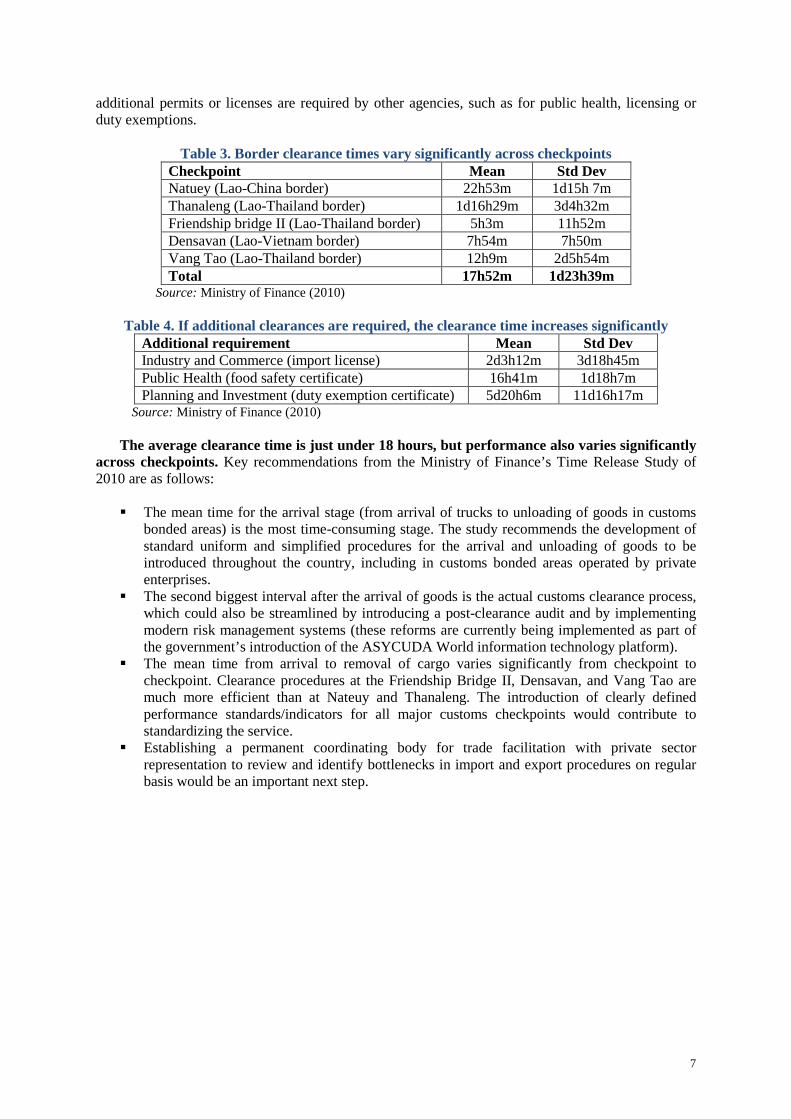
Table 3. Border clearance times vary significantly across checkpoints
Checkpoint Mean Std Dev Natuey (Lao-China border) 22h53m 1d15h 7m Thanaleng (Lao-Thailand border) 1d16h29m 3d4h32m Friendship bridge II (Lao-Thailand border) 5h3m 11h52m Densavan (Lao-Vietnam border) 7h54m 7h50m Vang Tao (Lao-Thailand border) 12h9m 2d5h54m Total 17h52m 1d23h39m
Source: Ministry of Finance (2010)
Table 4. If additional clearances are required, the clearance time increases significantly Additional requirement Mean Std Dev Industry and Commerce (import license) 2d3h12m 3d18h45m Public Health (food safety certificate) 16h41m 1d18h7m Planning and Investment (duty exemption certificate) 5d20h6m 11d16h17m
Source: Ministry of Finance (2010)
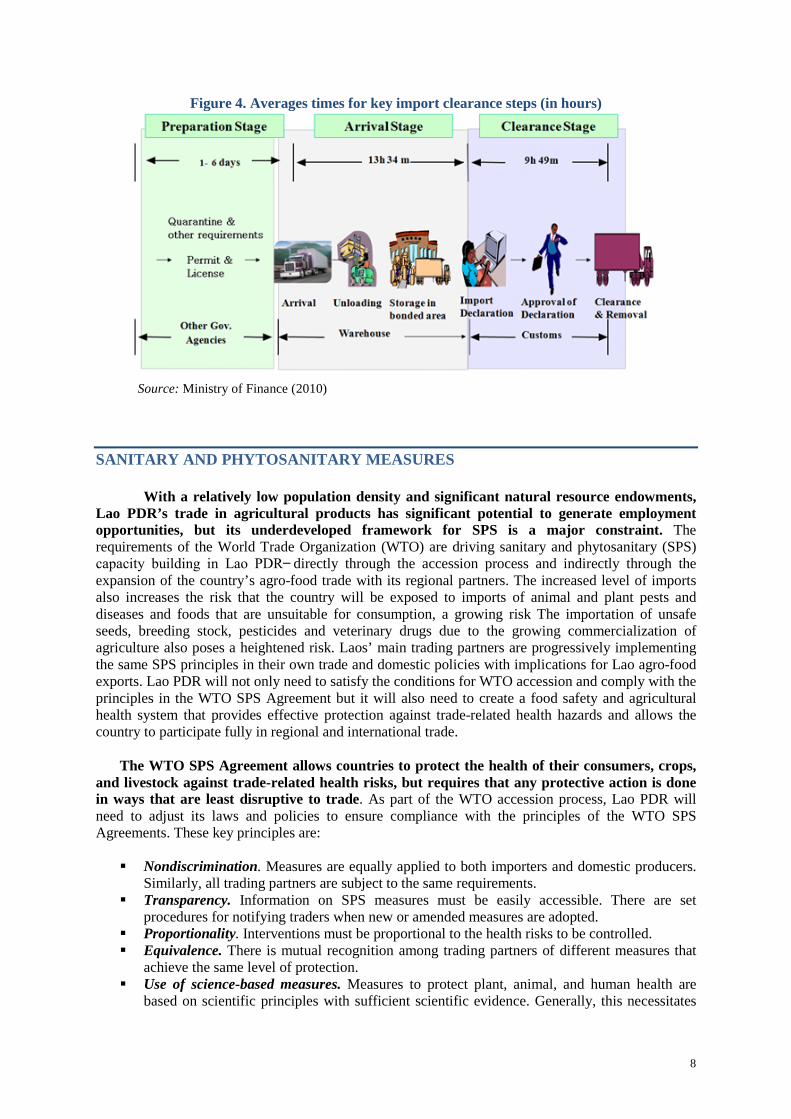
The average clearance time is just under 18 hours, but performance also varies significantly across checkpoints. Key recommendations from the Ministry of Finance’s Time Release Study of 2010 are as follows:
The mean time for the arrival stage (from arrival of trucks to unloading of goods in customs
bonded areas) is the most time-consuming stage. The study recommends the development of standard uniform and simplified procedures for the arrival and unloading of goods to be introduced throughout the country, including in customs bonded areas operated by private enterprises.
The second biggest interval after the arrival of goods is the actual customs clearance process, which could also be streamlined by introducing a post-clearance audit and by implementing modern risk management systems (these reforms are currently being implemented as part of the government’s introduction of the ASYCUDA World information technology platform).
The mean time from arrival to removal of cargo varies significantly from checkpoint to checkpoint. Clearance procedures at the Friendship Bridge II, Densavan, and Vang Tao are much more efficient than at Nateuy and Thanaleng. The introduction of clearly defined performance standards/indicators for all major customs checkpoints would contribute to standardizing the service.
Establishing a permanent coordinating body for trade facilitation with private sector representation to review and identify bottlenecks in import and export procedures on regular basis would be an important next step.
8
Figure 4. Averages times for key import clearance steps (in hours)
Source: Ministry of Finance (2010)
SANITARY AND PHYTOSANITARY MEASURES
With a relatively low population density and significant natural resource endowments, Lao PDR’s trade in agricultural products has significant potential to generate employment opportunities, but its underdeveloped framework for SPS is a major constraint. The requirements of the World Trade Organization (WTO) are driving sanitary and phytosanitary (SPS) capacity building in Lao PDR ̶ directly through the accession process and indirectly through the expansion of the country’s agro-food trade with its regional partners. The increased level of imports also increases the risk that the country will be exposed to imports of animal and plant pests and diseases and foods that are unsuitable for consumption, a growing risk The importation of unsafe seeds, breeding stock, pesticides and veterinary drugs due to the growing commercialization of agriculture also poses a heightened risk. Laos’ main trading partners are progressively implementing the same SPS principles in their own trade and domestic policies with implications for Lao agro-food exports. Lao PDR will not only need to satisfy the conditions for WTO accession and comply with the principles in the WTO SPS Agreement but it will also need to create a food safety and agricultural health system that provides effective protection against trade-related health hazards and allows the country to participate fully in regional and international trade.
The WTO SPS Agreement allows countries to protect the health of their consumers, crops, and livestock against trade-related health risks, but requires that any protective action is done in ways that are least disruptive to trade. As part of the WTO accession process, Lao PDR will need to adjust its laws and policies to ensure compliance with the principles of the WTO SPS Agreements. These key principles are:
Nondiscrimination. Measures are equally applied to both importers and domestic producers.
Similarly, all trading partners are subject to the same requirements. Transparency. Information on SPS measures must be easily accessible. There are set
procedures for notifying traders when new or amended measures are adopted. Proportionality. Interventions must be proportional to the health risks to be controlled. Equivalence. There is mutual recognition among trading partners of different measures that
achieve the same level of protection. Use of science-based measures. Measures to protect plant, animal, and human health are
based on scientific principles with sufficient scientific evidence. Generally, this necessitates
9
assessment of the risks involved and the definition of a level of risk that is acceptable. Regionalization. The principle recognizes the possibility of disease- or pest-affected countries
having disease- or pest-free areas or regions and allowing exports from such disease- or pest-free areas or regions.
Countries are encouraged to harmonize their regulations with international SPS standards and measures but they are allowed to apply stricter requirements as long as these measures are based on scientific justification that includes an assessment of risks.
Increased SPS capacities are imperative for the successful export of plant products (including forest products) . Several countries that might otherwise import Lao agricultural goods have requirements that the current Lao SPS regulations do not meet. In particular, China is becoming increasingly strict in applying a system of first-time import permits based on risk assessment, which requires surveillance data and criteria that cannot be met with the present capacities in Lao PDR. Consequently, Laos’ trade with China is restricted to small crop amounts in border trade under special allowances. Fruit, vegetables, rice, and any potential new crops cannot be formally exported. Although Thailand and Vietnam have similar legal requirements (in the case of new products or first-time exporters of processed food to these countries), these are often waived in the case of Lao PDR since the pest situation in Lao PDR is considered to be similar to that of Thailand and Vietnam. However, in the case of plant pest or disease incidents, these requirements may suddenly be enforced at short notice. In comparison, the exports of processed food from Lao PDR are small, and their safety and quality depend mainly on the capacities of exporting firms. The formal export of livestock products from Lao PDR is difficult because of endemic contagious livestock diseases and formal quarantine requirements in destination countries.
Lao PDR’s SPS measures are not yet fully compliant with WTO principles. In the Lao PDR, SPS responsibilities are devolved to the provincial level, including plant and animal quarantine border controls, the issuance of phytosanitary and veterinary certificates, conducting related inspections, and the collection of fees. However, the existing legal framework leaves plenty of room for provincial governors to adopt their own regulations and operational guidelines. According to WTO principles, there should be one authority that can promulgate trade policies, for example, one National Plant Protection Office in charge of plant quarantine and one veterinary authority. Decentralization of authority in this case lacks transparency and does not promote the uniformity of SPS measures in accordance with WTO principles. Overcoming this will require attention from policymakers and changes in the legal and regulatory system, particularly with regard to decentralization policies.
The current SPS system in Lao PDR does not provide adequate protection against potential health hazards in imports, putting at risk the health of consumers, crops, and livestock. The controls on international and local border crossings need to be strengthened and unified. However, border controls are, in many cases, not the most important element in health control systems. Effective health control systems should be based on monitoring and surveillance of the prevalence of pests, diseases, and health hazards, providing the data needed not only by the country’s trade partners but also by health risk managers.
The current inadequate SPS system adds to the costs of doing business for the private sector, particularly via the imposition of unnecessary requirements. Several unnecessary SPS requirements are imposed on exporters and importers because the authorities either lack the knowledge for proper implementation or need to raise revenues. This negatively affects the business climate, and, in the case of imports, it can violate the WTO principles that SPS measures should be science-based and proportionate to the health risks.
The lack of scientific expertise in Lao PDR constrains the country in defending its legitimate rights under the WTO SPS Agreement. At present, Lao PDR also lacks information on what pests and risks exist at home and in the countries of destination. It is virtually impossible for
10
policymakers to ask questions about the scientific legitimacy of measures imposed by its trading partners, such as market access constraints and treatment requirements, or to propose modifications to those measures on the basis of equivalence.
Lao PDR’s relatively weak capacity for SPS risk management has negative implications not only for domestic economy but also for the food safety, agricultural production, and exports of its neighbors. If an alien pest were to enter and establish itself in Lao PDR, this could eventually affect the entire region. Various cooperative arrangements between the countries of the Greater Mekong Subregion are based on the understanding that they share risks and are mutually dependent in trying to effectively control health hazards. Bilateral working groups are effective tools for policy dialogue, setting a joint agenda for cooperation, and identifying priorities for technical assistance.
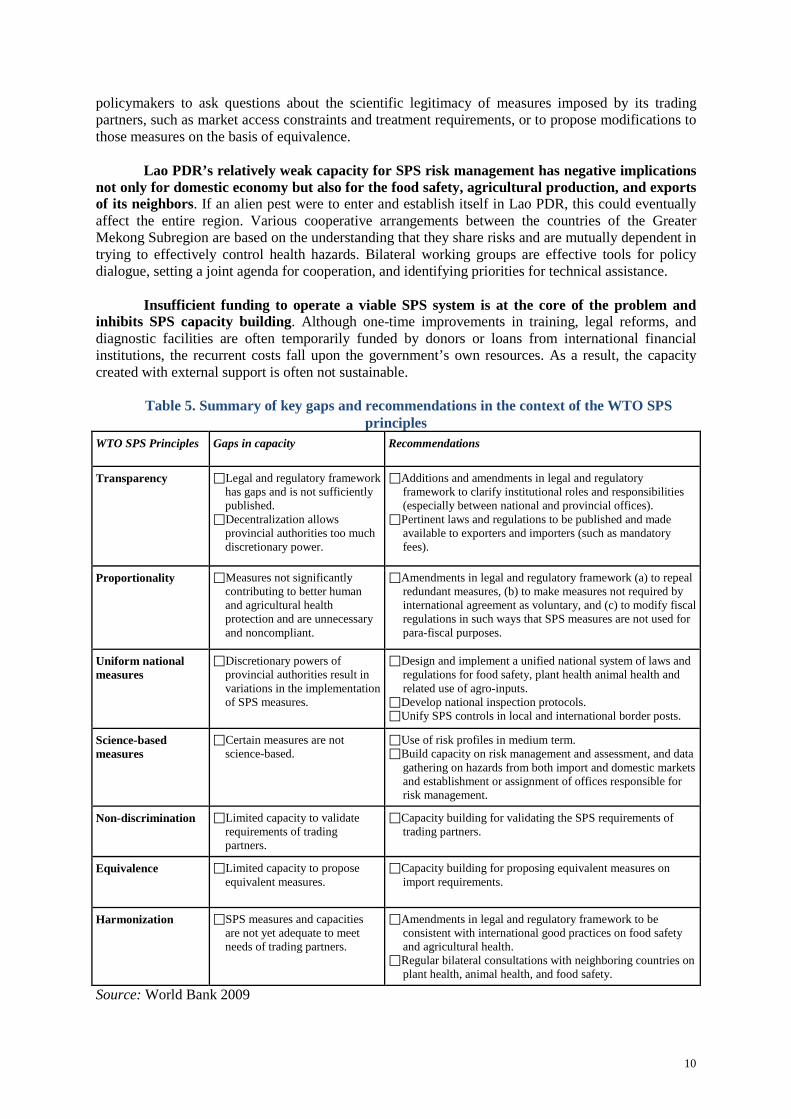
Insufficient funding to operate a viable SPS system is at the core of the problem and inhibits SPS capacity building. Although one-time improvements in training, legal reforms, and diagnostic facilities are often temporarily funded by donors or loans from international financial institutions, the recurrent costs fall upon the government’s own resources. As a result, the capacity created with external support is often not sustainable.
Table 5. Summary of key gaps and recommendations in the context of the WTO SPS principles
WTO SPS Principles Gaps in capacity Recommendations
Transparency Legal and regulatory framework has gaps and is not sufficiently published.
Decentralization allows provincial authorities too much discretionary power.
Additions and amendments in legal and regulatory framework to clarify institutional roles and responsibilities (especially between national and provincial offices).
Pertinent laws and regulations to be published and made available to exporters and importers (such as mandatory fees).
Proportionality Measures not significantly contributing to better human and agricultural health protection and are unnecessary and noncompliant.
Amendments in legal and regulatory framework (a) to repeal redundant measures, (b) to make measures not required by international agreement as voluntary, and (c) to modify fiscal regulations in such ways that SPS measures are not used for para-fiscal purposes.
Uniform national measures
Discretionary powers of provincial authorities result in variations in the implementation of SPS measures.
Design and implement a unified national system of laws and regulations for food safety, plant health animal health and related use of agro-inputs.
Develop national inspection protocols. Unify SPS controls in local and international border posts.
Science-based measures
Certain measures are not science-based.
Use of risk profiles in medium term. Build capacity on risk management and assessment, and data
gathering on hazards from both import and domestic markets and establishment or assignment of offices responsible for risk management.
Non-discrimination Limited capacity to validate requirements of trading partners.
Capacity building for validating the SPS requirements of trading partners.
Equivalence Limited capacity to propose equivalent measures.
Capacity building for proposing equivalent measures on import requirements.
Harmonization SPS measures and capacities are not yet adequate to meet needs of trading partners.
Amendments in legal and regulatory framework to be consistent with international good practices on food safety and agricultural health.
Regular bilateral consultations with neighboring countries on plant health, animal health, and food safety.
Source: World Bank 2009
11
THE REGULATORY BURDEN FACED BY EXPORTERS
The First Lao Investment Climate Assessment carried out jointly by the Asian Development Bank and the World Bank drawing on data from an enterprise survey conducted in 2005 found evidence that exporters face a heavier regulatory burden than non-exporters (ADB and World Bank, 2007). The study indicated that senior managers in exporting firms spend more time dealing with government regulations that their equivalents in non-exporters (4.9 percent and 3.6 percent respectively), and that exporters also reported a higher number of inspections (29.1 per year versus 13.0 percent for non-exporters). The study also found that, while exporters reported more customs inspections that non-exporters (an average of 5.6 percent per year compared to 3.8 per year), this difference was not sufficient to account for the full difference in the number of total inspections. The report concluded that a greater regulatory burden was being imposed on exporters.
This finding has prompted the government to make a series of changes in its policies and undertake new investments. The government has been progressively reforming the trade environment, trade facilitation, and customs procedures with the aim of streamlining and simplifying the environment in which exporters operate. Similarly a number of investments by the World Bank and other donors in areas such as customs modernization and trade facilitation are financing the government’s program.
A recent enterprise survey fielded in mid-2009 has provided an opportunity to revisit this issue and answer the question: do exporters still face a heavier regulatory burden than non-exporters? The new Lao dataset contains detailed productivity and performance information, as well as detailed information on firms’ perceptions of business environment constraints collected from 360 firms (including 147 manufacturers) in four urban centers. .
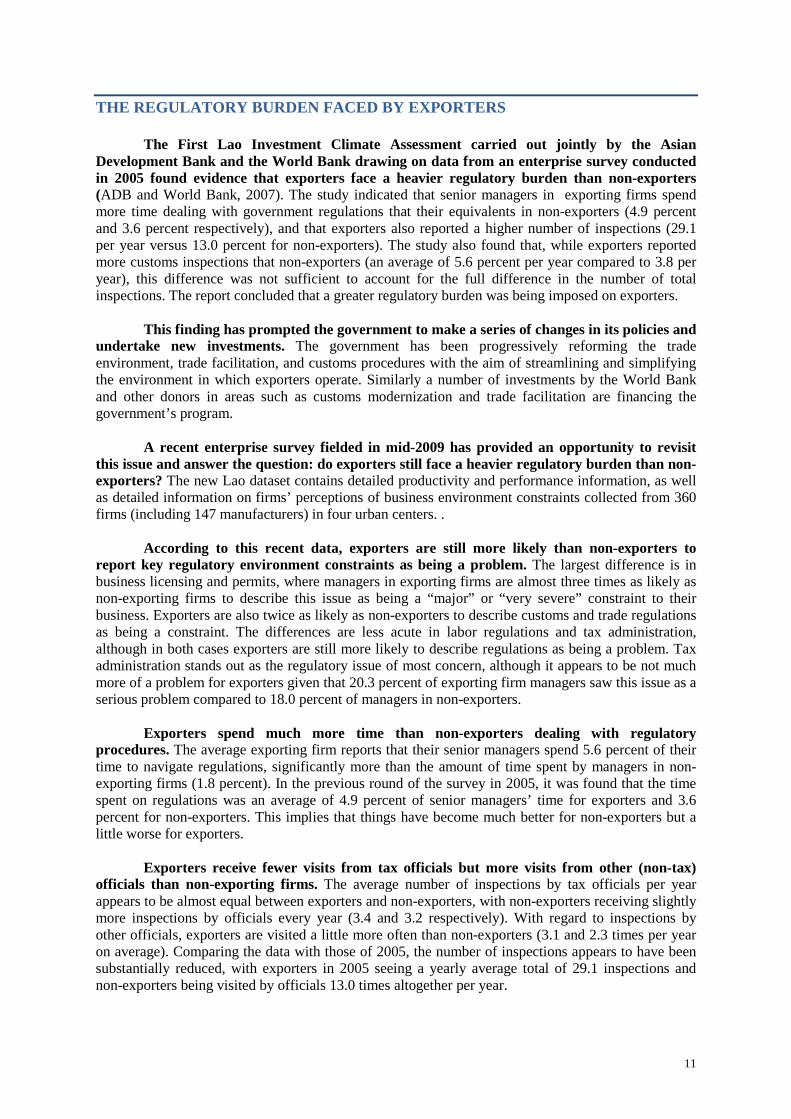
According to this recent data, exporters are still more likely than non-exporters to report key regulatory environment constraints as being a problem. The largest difference is in business licensing and permits, where managers in exporting firms are almost three times as likely as non-exporting firms to describe this issue as being a “major” or “very severe” constraint to their business. Exporters are also twice as likely as non-exporters to describe customs and trade regulations as being a constraint. The differences are less acute in labor regulations and tax administration, although in both cases exporters are still more likely to describe regulations as being a problem. Tax administration stands out as the regulatory issue of most concern, although it appears to be not much more of a problem for exporters given that 20.3 percent of exporting firm managers saw this issue as a serious problem compared to 18.0 percent of managers in non-exporters.
Exporters spend much more time than non-exporters dealing with regulatory procedures. The average exporting firm reports that their senior managers spend 5.6 percent of their time to navigate regulations, significantly more than the amount of time spent by managers in non-exporting firms (1.8 percent). In the previous round of the survey in 2005, it was found that the time spent on regulations was an average of 4.9 percent of senior managers’ time for exporters and 3.6 percent for non-exporters. This implies that things have become much better for non-exporters but a little worse for exporters.
Exporters receive fewer visits from tax officials but more visits from other (non-tax) officials than non-exporting firms. The average number of inspections by tax officials per year appears to be almost equal between exporters and non-exporters, with non-exporters receiving slightly more inspections by officials every year (3.4 and 3.2 respectively). With regard to inspections by other officials, exporters are visited a little more often than non-exporters (3.1 and 2.3 times per year on average). Comparing the data with those of 2005, the number of inspections appears to have been substantially reduced, with exporters in 2005 seeing a yearly average total of 29.1 inspections and non-exporters being visited by officials 13.0 times altogether per year.
12
Figure 5. Exporters are more likely than non-exporters to describe key regulatory constraints as “major” or “very severe”
Figure 6. Exporters spend much more time than non-exporters dealing with regulatory
procedures, although the number of inspections is similar
Figure 7. The manufacturing sectors with the
heaviest burden in terms of number of tax inspections…
Figure 8. …are not necessarily the sectors where firms spend the most time dealing with
regulation
Source: World Bank Enterprise Survey for Laos 2009
The burden of regulation also appears to vary substantially depending on which sector
of manufacturing is concerned. For all manufacturing firms, the average number of inspections by officials per year is 3.3 and the amount of senior managers’ time spent dealing with regulation on a yearly basis is 3.6 percent. Firms making construction materials (primarily serving the domestic market) report a lower than average number of inspections, but appear to spend much more time than average dealing with regulatory requirements. Perhaps unsurprisingly given the growing challenges of meeting international sanitary and phytosanitary standards, agro-industrial manufacturers receive a higher than average number of inspections and spend more time on regulations. Wood processing firms (a key export sector) also receive a large number of inspections but report a lower than average amount of management time. Finally in the garment sector, which exports a very high proportion of its production, the number of official visits and the amount of management time spent on regulation is reported as being slightly below the average for all manufacturers.
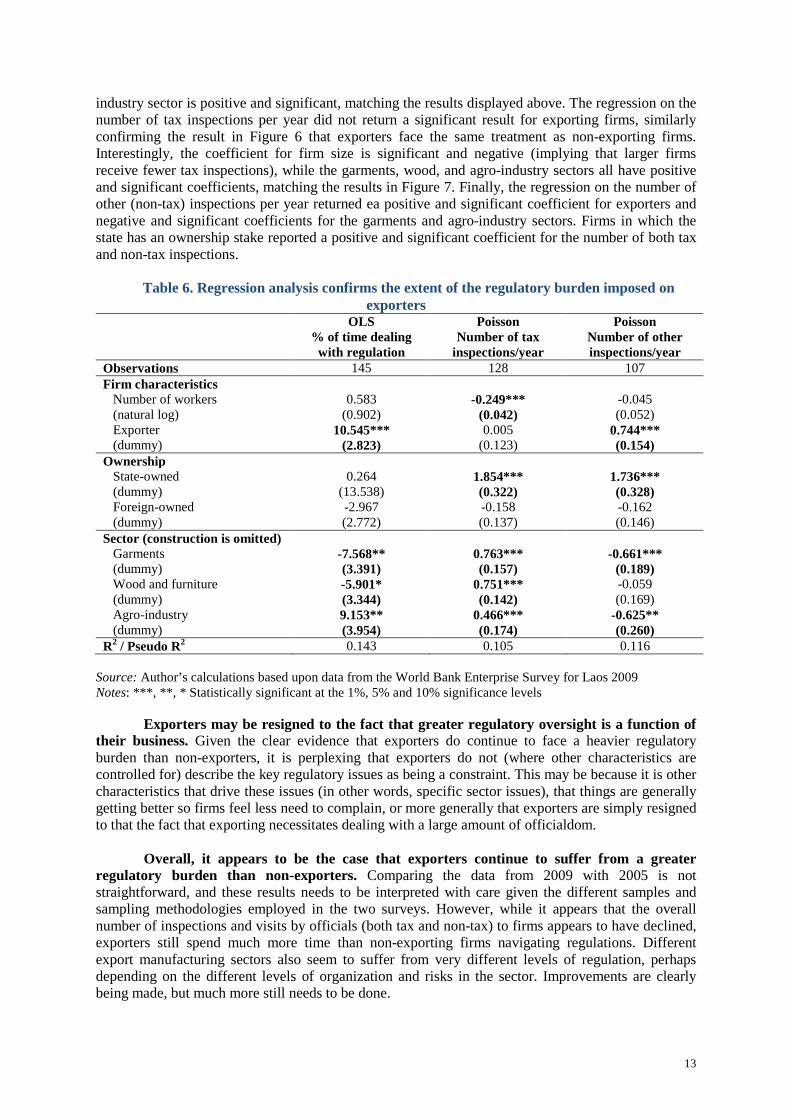
Regression analysis confirms that exporters continue to face a heavier regulatory burden, even after controlling for firm characteristics such as size, ownership, and sector. Exporters in Lao PDR tend to be disproportionately in the garments and wood products sectors, which are large in terms of the number of their workers and are more likely to be foreign-owned. Regression analysis on the amount of management time spent dealing with regulations confirms that exporters face a heavier burden than non-exporters. Interestingly, however, the coefficients for the garments and wood sectors are negative and significant, implying that the burden is less demanding in these two sectors (although the net impact is still greater than zero as the size of the positive exporter coefficient for exporters is larger than the negative garments and wood coefficients). The coefficient for the agro-
13
industry sector is positive and significant, matching the results displayed above. The regression on the number of tax inspections per year did not return a significant result for exporting firms, similarly confirming the result in Figure 6 that exporters face the same treatment as non-exporting firms. Interestingly, the coefficient for firm size is significant and negative (implying that larger firms receive fewer tax inspections), while the garments, wood, and agro-industry sectors all have positive and significant coefficients, matching the results in Figure 7. Finally, the regression on the number of other (non-tax) inspections per year returned ea positive and significant coefficient for exporters and negative and significant coefficients for the garments and agro-industry sectors. Firms in which the state has an ownership stake reported a positive and significant coefficient for the number of both tax and non-tax inspections.
Table 6. Regression analysis confirms the extent of the regulatory burden imposed on exporters
OLS Poisson Poisson % of time dealing
with regulation Number of tax
inspections/year Number of other inspections/year
Observations 145 128 107 Firm characteristics Number of workers 0.583 -0.249*** -0.045 (natural log) (0.902) (0.042) (0.052) Exporter 10.545*** 0.005 0.744*** (dummy) (2.823) (0.123) (0.154) Ownership State-owned 0.264 1.854*** 1.736*** (dummy) (13.538) (0.322) (0.328) Foreign-owned -2.967 -0.158 -0.162 (dummy) (2.772) (0.137) (0.146) Sector (construction is omitted) Garments -7.568** 0.763*** -0.661*** (dummy) (3.391) (0.157) (0.189) Wood and furniture -5.901* 0.751*** -0.059 (dummy) (3.344) (0.142) (0.169) Agro-industry 9.153** 0.466*** -0.625** (dummy) (3.954) (0.174) (0.260) R2 / Pseudo R2 0.143 0.105 0.116
Source: Author’s calculations based upon data from the World Bank Enterprise Survey for Laos 2009 Notes: ***, **, * Statistically significant at the 1%, 5% and 10% significance levels
Exporters may be resigned to the fact that greater regulatory oversight is a function of their business. Given the clear evidence that exporters do continue to face a heavier regulatory burden than non-exporters, it is perplexing that exporters do not (where other characteristics are controlled for) describe the key regulatory issues as being a constraint. This may be because it is other characteristics that drive these issues (in other words, specific sector issues), that things are generally getting better so firms feel less need to complain, or more generally that exporters are simply resigned to that the fact that exporting necessitates dealing with a large amount of officialdom.
Overall, it appears to be the case that exporters continue to suffer from a greater regulatory burden than non-exporters. Comparing the data from 2009 with 2005 is not straightforward, and these results needs to be interpreted with care given the different samples and sampling methodologies employed in the two surveys. However, while it appears that the overall number of inspections and visits by officials (both tax and non-tax) to firms appears to have declined, exporters still spend much more time than non-exporting firms navigating regulations. Different export manufacturing sectors also seem to suffer from very different levels of regulation, perhaps depending on the different levels of organization and risks in the sector. Improvements are clearly being made, but much more still needs to be done.
14
REFERENCES ADB and World Bank (2007). Lao PDR Private Sector and Investment Climate Assessment: Reducing Investment Climate Constraints to Higher Growth
, Asian Development Bank, Manila and World Bank, Washington DC.
Collier, Paul (2007). “Africa’s Economic Growth: Opportunities and Constraints.” African Development Review Vol. 19 No. 1. African Development Bank, Tunis. Djankov, Simeon, Caroline Freund, and Cong S. Pham (2008). “Trading on Time.” World Bank Policy Research Working Paper No.3909, World Bank, Washington DC. Limão, Nuno and Anthony J. Venables (2001). “Infrastructure, Geographical Disadvantage, Transport Costs, and Trade.” The World Bank Economic Review Vol 15 No. 3. World Bank, Washington DC. The World Bank. Ministry of Finance (2010). “Time Release Study.”, Draft manuscript prepared by the Lao Customs Department, Vientiane [check]. . World Bank (2010). Connecting to Compete 2010: Trade Logistics in the Global Economy – The Logistics Performance Index and its Indicators
, World Bank, Washington DC.
World Bank (2009). “Lao People's Democratic Republic: Sanitary and Phytosanitary Measures – Enhancing Trade, Food Safety, and Agricultural Health.” Report No. 48802, East Asia and the Pacific Region, World Bank, Washington DC. World Bank (2008). Trade and Transit Facilitation for Landlocked Developing Countries
, World Bank, Washington DC.
Related Documents