The feasibility and potential impacts of free human mobility Lant Pritchett Harvard Kennedy School and Center for Global Development Feb. 24, 2015 At OECD first expert group meeting: Perspectives on Global Development International Migration and Development

Lant Pritchett's presentation - OECD - PGD Expert Meeting
Jul 16, 2015
Welcome message from author
This document is posted to help you gain knowledge. Please leave a comment to let me know what you think about it! Share it to your friends and learn new things together.
Transcript

The feasibility and potential impacts of free human mobility
Lant PritchettHarvard Kennedy School and Center for Global Development
Feb. 24, 2015At
OECD first expert group meeting:Perspectives on Global Development
International Migration and Development

Outline
• What would we expect the impact to be? A dizzying and dazzling tour of caricatures of different theories of cross-national income
• What do we find the marginal impact to be:– Micro-economic estimates
– Macro-economic estimates
• How does labor mobility affect the “A” of growth theories?

Massive cross national inequality: incomes from all of modern history exists in countries today

More inequality, and more of it dues to location

The (statistically) rich of poor countries are poorer than the poor of rich
countries

Branko Milanovic’s 21st century trilemma
We are connected instantaneously by internet and cell phone with, and are only a 6 ½ hour flight from Paris to, countries with levels of per capita income last experienced in the West in the Middle Ages—even a country like Morocco has a level of income lower than prior to the Franco-Prussian war.

What we expect the impact of human mobility to be? Depends on our explanation of why incomes are
different
Manna from Heaven (Modern) economic production
Endowed with natural resources that yield income—either concentrated (oil, diamonds, gold, copper) or diffuse (wheat, rubber)—with just sector specific institutions (e.g. enclave) and effort (fixed assets—e.g. holes in the ground)
Example: Kuwait is rich because it has low marginal cost oil
Stuff (K, HK) plus A as “technical knowledge
“A” as “institutions” or “capabilities”—tacit, non-transferrable, augmentersof productivity
(Augmented) Solow model with “capital” and “human capital” and an “A” term interpreted as “technology” or “blueprints” or “codifiedknowledge”
“Institutions” (of the right,creative destruction inclusive market supporting) type are the causal key to prosperity (e.g. AJR, NWW, RS)
A large number of “Capabilities” as non-tradable collective inputs that require tacit knowledge is key to prosperity (Hausmann)

In rich “manna” countries migration welcome—as long as no manna for (most) migrants
On mover On host country On sending country
Mover gets access to manna
Moves to more manna—better off
Less manna per person—worse off
More manna per person—better off
Mover has access to manna in home country does not get access to manna in host country
Mover only moves if wages/incomes are higher in modern sector are higher
Doesn’t have to share manna—depends on impact on modern sector, if manna is abundant (manna/person>reservation wage) then host better off, indeed rely on migrant labor (e.g. Gulf States) for both unskilled and skilled labor
More manna per person—better off (or with only consequences on modern sector)

General approach of augmented Solow-Swan or “neo-classical” growth model
• A is T—the “A” of the production function was “knowledge” that was common to all countries (e.g. laws of physics) and/or would diffuse rapidly across borders so technical progress was a global externality
• K and HK as stocks had to be accumulated by savings/investment today for higher stocks tomorrow and hence growth dynamics were driven by capital(s) accumulation dynamics
• Wage differences across countries driven by HK differences did not lead to migration motivation (“skill price” equalized across countries with same A and K/L
• If K/L drove higher wages then migration had “dilution” effects as workers arriving with no capital drove down average K/L.
• If A(T) converged and capital markets worked then incomes and wages should converge (with dynamics driven by investment) and no need for labor mobility to equalized incomes.
• (Plus models with trade and “factor price equalization” by exchanging goods which embody different K/L ratios equalize w and r via trade)

Nearly everything about neoclassical model as model of “development” is wrong
• There hasn’t been (much) convergence across countries and over the long-horizon massive divergence (Pritchett 1997, Milanovic 2012, Bourginonand Morrison 2002)
• This is in spite of massive convergence in K and HK (Grier and Grier 2007)—so rather than A(T) rapidly converging and convergence dynamics limited by K and HK dynamics A (measured as residual) has been (until perhaps recently) diverging (e.g. Bosworth and Collins ).
• Empirical growth decompositions find that K and HK account for a quarter to at best a third of cross-national differences even as proximate determinants (Casselli 2005, Inklaar and Timmer 2013) (and if K and HK are endogenous to A(I) or A(C) then causally even less)
• The price dynamics of interest rates are wildly inconsistent with equalized A and K dynamics (King and Rebelo 1989) and MPK appears to be already equalized (Casselli and Feyrer 2007)
• Factors flow to rich areas (Easterly and Levine 2001)

Two new models of what the “A” is that makes equivalent L, K and HK more productive
“Institutions” (A is I) • “Institutions” (Acemoglu,
Johnson, Robinson (2000), North, Wallis, Weingast (2012) or “social infrastructure” (Hall and Jones 1999) account for the bulk of the differences in cross-national income
• “Institutions” are “norms” or “patterns of behavior” that structure relationships among actors and “market supporting” institutions that are restraining on the “grabbing hand” and “inclusive enough” for creative destruction are needed
“Capabilities” (A is C)• “Capabilities” (Hausmann and
Hidalgo 2009, Hausmann et al 2011) are the key to prosperity
• “Capabilities” can be generated from a product specific Leontief production function with many inputs and “simple” products require few inputs and “complex” products many inputs so countries with many available inputs—including collectively produced inputs (like public goods, infrastructure, rule of law, specific policies)—are able to produce complex products

Levels of GDP per capita and “institutions”

Higher “economic complexity” as a measure of the countries sophistication of exports in the product
space is highly correlated with level of GDP
Source: Hausmann et al 2011
“Manna” countries(nat’l resource exports>10% of GDP)
Non-resourceexporters
GDP per capita
Economic Complexity of Exports

What would we expect to see at the margin if A as I or A as C explained most cross-national
income/labor productivity/wage dispersion?
Growth model ofA as I or A as C drives levels
For movers For host countries For sending countries
A (I or C driven) is place/countrySpecific, determines the productivity of all factors, and is fixed at the margin
Massive wage gains for movers as their labor productivity (for given HK) is place dependent and the additional productivity is “in the air” (of I and C) and hence rapid and near complete wage convergence for given skills (including language)
Almost no impact at all as at the margin “A” as I or C is fixed and public good (non-rival and non-excludable)Some relative price impacts on types of L and HK and K depending on whether migrants are substitutes or complements
Almost no impact at all, for the same reason.

What properties the new A as “institutions” or “capabilities” has to have (versus the old A as T)
Properties of the new A• “A” does not diffuse rapidly
across national borders (perhaps not even regionally if “capabilities” are place specific due to IRS)
• “A” has a dynamics in which “poverty traps” are possible (lower A leads to less growth of A)—versus “advantages of backwardness” dynamics
• “A” capable of reversals within countries in which “A” deteriorates
Facts to accomodate• Long-run historical and post
war divergence across countries not due to factors
• Countries in long-run poverty/slow growth traps
• Massive and sustained reversals in output per worker at same (or rising) K and HK inputs (Liberia, Venezuela, Cote d’Ivoire, Zambia (‘67-’94))

We see in the data exactly what we expect to see based on A as I or A as C macroeconomic
theories of income (or manna)
• Microeconomic estimates of wage gains
– Data on observational equivalent workers
– Data on differences across occupations
– Experiments (and quasi-experiments)
• Macroeconomic
– Modeling
– Experiences

Wages of observationally equivalent workers between USA and 41 other
countriesWages
Worker characteristics(e.g. schooling, residence, age)
USA born, educatedWorkers in USA
Foreign born, foreign educated workers in USA (wage profile estimated with US Census)
Foreign born, foreign educated workers in foreign country (estimated with country data)
Place premium: Same worker characteristics (for all available observables) just different places
X

Estimated average wage differences of observationally equivalent low skill (9 years schooling), urban, male, formal
sector, young (35 year old) workers between USA and source country is (PPP adjusted) $15,000 a year
Simple arithmetic for 35 year old, male, urban, formal sector, 9 years of schooling:
Wage in Haiti: 80 cents/hrWage in USA: $8.25 /hrAnnual hours 8hrs/day,
22/days month, 12 months year:
(8.25-.80)*(8*22*12)=$15,738
Average (of 41 countries):Wage in foreign: $2.53Wage in USA: $9.83Annual wage gap:
$15,411
0
5000
10000
15000
20000
25000
Haiti
Ghana
Indon
esia
Bang
ladesh
Guatemala
An
nu
al e
an
rin
gs
(in
PP
P)
In home
In USA

Wage gap is absolutely higher the more education (if the proportionate return to schooling is the same in both markets)
Table 1: Estimates of the annual gain in earnings from moving to the USA for a typical
male wage earner from a sample of 41 developing countries
Estimates 9 years 12 years (assuming 10
percent Mincer return)
Observationally equivalent, 100 percent of
spending in USA (PPP adjusted)
$15,298 $20,361
Observationally equivalent, adjust “real”
consumption wage upward for 40 percent of
spending in home (remittances or savings) at lower
prices $23,130 $30,785
Adjust downward by 1.25 (maximum empirically
demonstrated positive selection of low skill
migrants on unobserved characteristics) with 40
percent spent at home$18,504 $24,628
Source: Based on Clemens, Montenegro and Pritchett 2008

The observed wage gap across countries for workers in the same occupation is higher for medium skill (construction workers) than low
skill (waiters)
$13,111
$34,824
$0
$5,000
$10,000
$15,000
$20,000
$25,000
$30,000
$35,000
$40,000
$45,000
Waiters Construction workers
An
nu
aliz
ed
ear
nin
gs, i
n P
PP
Wage in bottom 30 reporting countries inOWW (in PPP)
USA reported wages
Gap between bottom 30 and USA
Source: Pritchett and Smith, forthcoming, based on OWW data (Oostendorp, 2013)

Gains from temporary Tonga-New Zealand migration for agriculture—using lottery to
control of selection
$7,509
$26,381
$18,872
$0
$5,000
$10,000
$15,000
$20,000
$25,000
$30,000
Applicants earnings in Tonga Estimated earnings (using lotteryoutcome for identification)
Migrant gain (corrected for selection)
An
nu
aliz
ed
(5
2 w
ee
k) e
arn
ings
in U
S$
McKenzie, Gibson and Stillman, 2010
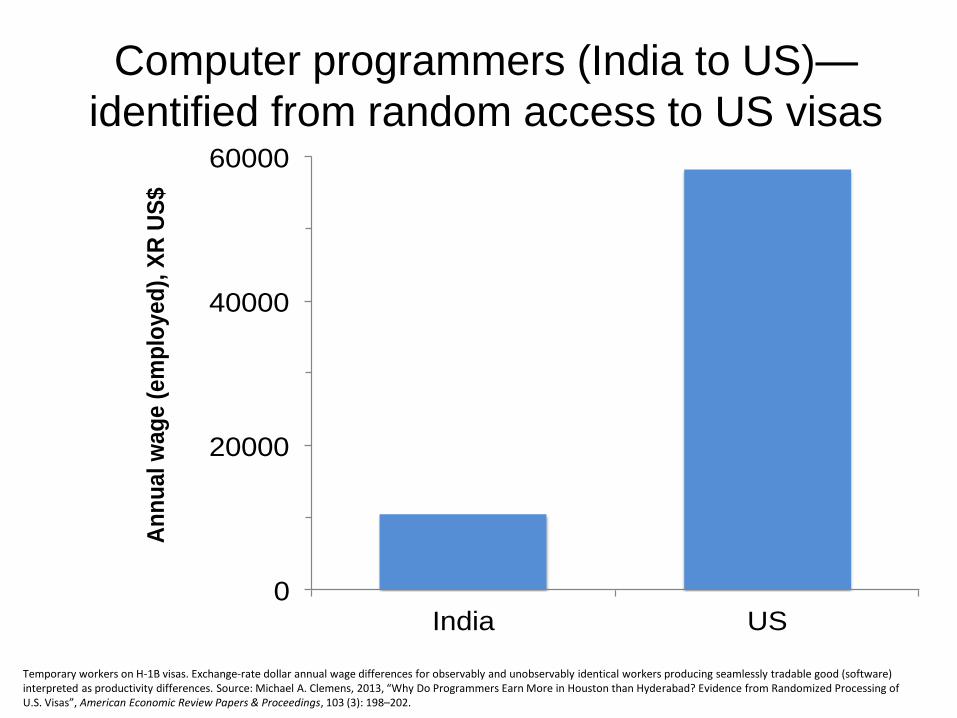
Temporary workers on H-1B visas. Exchange-rate dollar annual wage differences for observably and unobservably identical workers producing seamlessly tradable good (software) interpreted as productivity differences. Source: Michael A. Clemens, 2013, “Why Do Programmers Earn More in Houston than Hyderabad? Evidence from Randomized Processing of U.S. Visas”, American Economic Review Papers & Proceedings, 103 (3): 198–202.
Computer programmers (India to US)—
identified from random access to US visas
0
20000
40000
60000
India US
An
nu
al
wa
ge
(e
mp
loy
ed
), X
R U
S$

Temporary workers on 3-year labor card. Exchange-rate dollar annual wage differences for observably and unobservably identical workers, who remit about 85% of these earnings to India, spent at Indian prices. Source: Michael A. Clemens (2015), “Household effects of temporary low-skill work visas: Evidence from the India-Gulf corridor”, Working Paper, Washington, DC: Center for Global Development.
Construction workers (India to Gulf)
0
1000
2000
3000
4000
5000
India UAE
An
nu
al
wa
ge
(e
mp
loy
ed
), X
R U
S$

Experiment: Tonga-New Zealand seasonal mobility for agricultural work with applicants
chosen by lottery
$7,509
$26,381
$18,872
$0
$5,000
$10,000
$15,000
$20,000
$25,000
$30,000
Applicants earnings in Tonga Estimated earnings (using lotteryoutcome for identification)
Migrant gain (corrected for selection)
An
nu
aliz
ed
(5
2 w
ee
k) e
arn
ings
in U
S$

What should be completely uncontested at this point based on our “best available” theories and
evidence• Macro/growth: Most of (upwards of 2/3) of differences in
productivity per worker across countries in the world are driven by “in the air” elements at the national level which diffuse only slowly and can be stuck or reverse
• Micro/wages: The annual wage/labor productivity gain to a low skill (<=12 years schooling) worker from moving from a poor country to rich country of unskilled laborers is P$10,000-P$30,000 per worker—factor multiples (4 to 5) of earnings in their home country—and higher for richer workers
• Legal barriers to mobility imposed by rich countries prevent people from moving in response to these potential gains.
• At the margin (e.g. “A” unchanged) labor mobility has small net positive impacts on the recipient countries with also small distributional impacts on citizens—and possibly, depending on structure, eligibility, etc. some fiscal issues.

Open Borders and the Pushback to Open Borders
• One can do calculations of the total gains from free labor mobility
• If one assumes that country “A” is unaffected by population mobility the gains are in the tens of trillions—a rough doubling of global GDP
109.25
1.20
20
40
60
80
100
120
Median of 4 estimatesof complete labor
mobility
Median of 7 estimatesof policy barriers tomerchandise trade
Gai
n a
s p
erc
en
t o
f w
orl
d G
DP
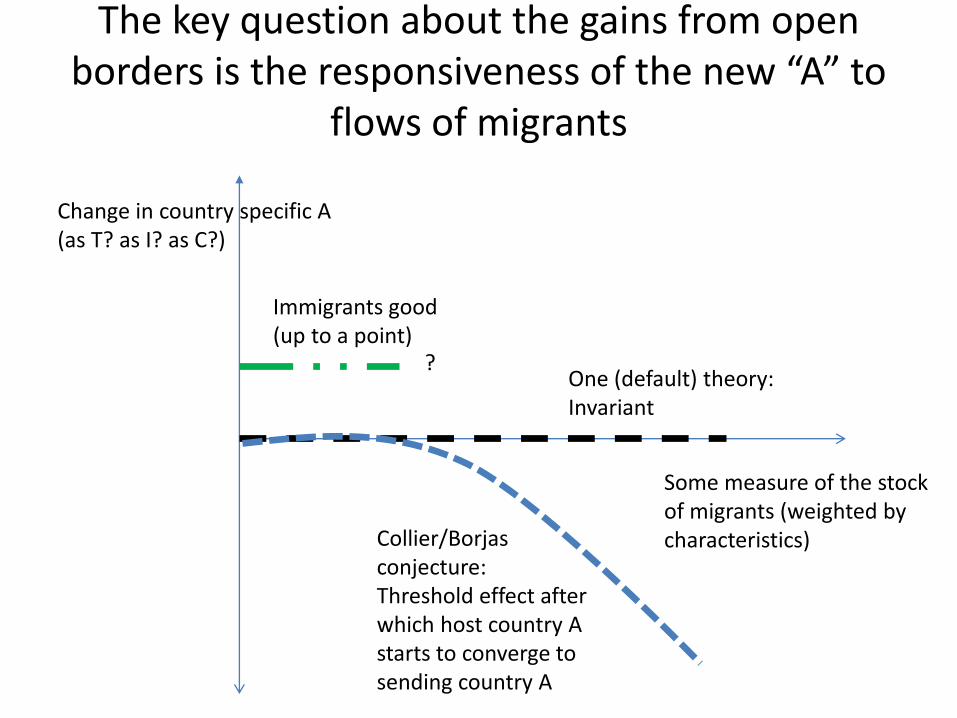
The key question about the gains from open borders is the responsiveness of the new “A” to
flows of migrants
Change in country specific A(as T? as I? as C?)
Some measure of the stock of migrants (weighted by characteristics)
One (default) theory: Invariant
Collier/Borjasconjecture:Threshold effect after which host country A starts to converge to sending country A
?
Immigrants good(up to a point)

What is a red herring and what is a red flag?
• For marginal increases in the rate of labor mobility this is a complete red herring—unless and until one is at the threshold—and there is no evidence there is a threshold, much less than any OECD country is near it
• For “temporary” schemes this is a red herring—the Gulf states and Singapore have migrant/citizen ratios over 1 (>50 percent migrants) and have not detectable impact on A
• The argument: “a stock of politically and institutionally relevant migrants that passes a threshold may deteriorate the market supporting institutions that create high productivity hence estimates of ‘open borders’ are exaggerated” has ceded the day to all policy relevant arguments as no one is talking about “open borders” as a near term policy or political agenda—just “relaxation” of existing controls.

High immigration OECD countries are at levels of 20 percent or more
0
5
10
15
20
25
30
Fore
ign
bo
rn a
s p
erc
en
t o
f p
op
ula
tio
n
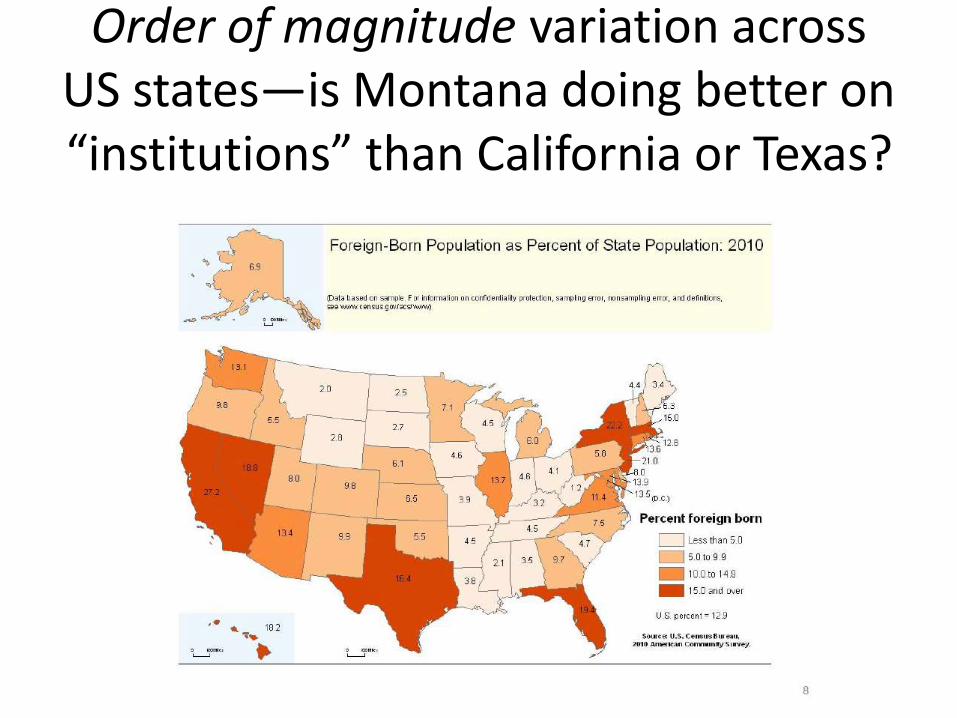
Order of magnitude variation across US states—is Montana doing better on “institutions” than California or Texas?

Lets distinguish sophisticated economic arguments from garden variety xenophobia
(which may be politically powerful)
Cultural norms
• How people dress , worship, celebrate New Years, marry, socialize
• What actions are “honorable” or “dishonorable”
• How “inside” and “outside” the relevant social unit are treated
Market supporting norms
• Restraints on arbitrary action of governments—including ‘rule of law”
• Legal arrangements that allow making and enforcing private contracts and “thick” financial sectors
• “Markets” that allow liberty people and firms to engage in arms-length transactions

“Culture” as determinant of incomes: Largely Claptrap
North and South Korea at night: culture?
Why “culture” doesn’t work well to explain per capita income differences
• Argued as barrier against many countries—just before they have dramatic acceleration: Japan (Meiji), Russia (pre-revolution), China (pre-Deng)
• Measures like “trust” are endogenous and culture adapts (e.g. Fiji)
• Migrant communities succeed even while host country is poor: Indians, Chinese
• Clear examples of common culture, different outcomes
• Singapore higher GDP per capita than any (non-manna) Western country

Elements of a model of “threshold” impact of stock of migrants on “A”
• Norms are properties of places, not individuals, and individuals understand that.
• Not “cultural” norms by “market supporting norms”—the entire point of market supporting norms, especially norms formalized into organizations and laws, is to allow people to transact who don’t share cultural norms.

Elements of the “immigrants erode institutions” argument
• People who choose to move may seek out places with the desire to adopt the new norms
• People who move may choose to adopt compliance with the “market supporting” norms—even perhaps internalized them—if not immediately then over time—the speed of “assimilation” (not “cultural” but “market supporting”)
• If people move from lots of different norms this may not create any impetus to switch to a new norm

A theory about “A as I” needs to reflect the “pressure on I” from migrants, not “migrants”
Threshold of “pressure”
Stock of migrants,Pressure on A from stock
Rapid expansion, little assimilation/internalization, concentrated migrants
Pressure on market support institutions that sustain high productivity
Time

A theory about “A as I” needs to reflect the “pressure on I” from migrants, not “migrants”
Threshold of “pressure”
Stock of migrants,Pressure on A from stock Slower increase in stock
Depending on pace of immigration versus assimilation/internalization, initial gap, concentration, etc. even huge stocks of “foreign born” are compatible with never reaching threshold pressure on institutions
Time

It’s the stupid politics stupid
• The economics of the benefits of greater labor mobility are, at this stage, largely uncontested: at the margin gaps in “A” that are “in the air” produce massive (PPP$10,000 to 30,000 per mover) gains in labor productivity with little impact on citizens (on aggregate, positive)
• The push back on “general equilibrium” effects on A: (1) cedes the field on the policy relevant issues, (2) is, at this stage, a completely empirically unsupported conjecture
• The politics of migration hinge almost entirely on cultural arguments, which have enormous political traction but which are enormously intellectually problematic as “just” or “legitimate” grounds for discrimination
Related Documents


