Landscape scale effects of disturbance on riparian vegetation BIRGITTA MALM RENO ¨ FA ¨ LT AND CHRISTER NILSSON Landscape Ecology Group, Department of Ecology and Environmental Science, Uminova Science Park, Umea ˚ University, SE-901 87 Umea ˚, Sweden SUMMARY 1. Differing responses in riparian species richness and composition to disturbance have been reported as a possible explanation for the differences along and between rivers. This paper explores the role of physical disturbance in shaping landscape-scale patterns of species distribution in riparian vegetation along a free-flowing river in northern Sweden. 2. To test whether sensitivity to disturbance varies across large landscapes, we experimentally disturbed riparian vegetation along an entire, free-flowing river by scouring the soil and the vegetation turf, cutting vegetation, applying waterborne plant litter, and after a period of recovery we measured vegetation responses. The experiment was repeated for two consecutive years. 3. We found no significant effect of disturbance on species composition, but all three forms of disturbance significantly reduced species richness. There was no downstream variation in community responses to disturbance but morphological groups of species responded differently to different kinds of disturbance. Graminoids were most resistant, suppressed only by litter burial. All forms of disturbance except cutting reduced the density of herbaceous species, and species density of trees + shrubs and dwarf shrubs was negatively affected by both scouring and cutting. We also evaluated the effects of disturbance in relation to varying levels of species richness. In nearly all cases, responses were significantly negatively correlated with control plot species richness, and relative responses indicated that species-rich plots were less resistant to scouring and cutting. 4. Our results suggest that although all disturbance treatments had an effect on species richness, variation in sensitivity to disturbance is not the most important factor shaping landscape-scale patterns of riparian plant species richness along rivers. Keywords: disturbance, experimental, landscape patterns, riparian vegetation, river Introduction Free-flowing rivers generally have species-rich riparian vegetation (Junk, Bayley & Sparks, 1989; Tabacchi, Planty-Tabacchi & De ´camps, 1990; Nilsson et al., 1994; Planty-Tabacchi et al., 1996), and in some rivers the highest densities of plant species have been found in the middle reaches (e.g. Nilsson et al., 1989, 1991a; Planty- Tabacchi et al., 1996). There is so far no unequivocal explanation for this humped pattern, but a number of variables have been suggested, such as substrate heterogeneity, disturbance, plant dispersal, and a mid-domain effect (Nilsson et al., 1989, 1994; Ward, 1998; Dunn, Colwell & Nilsson, 2006). The mid-domain effect implies that physiographical and physiological boundaries in relation to range-size distributions lead to mid-domain richness peaks even without environ- mental gradients (Colwell & Lees, 2000). However, Reno ¨fa ¨lt, Merritt & Nilsson (2007) found the temporal variability in patterns of species richness along a Correspondence: Birgitta Malm Reno ¨fa ¨lt, Landscape Ecology Group, Department of Ecology and Environmental Science, Uminova Science Park, Umea ˚ University, SE-901 87 Umea ˚, Sweden. E-mail: [email protected] Freshwater Biology (2008) 53, 2244–2255 doi:10.1111/j.1365-2427.2008.02057.x 2244 Ó 2008 The Authors, Journal compilation Ó 2008 Blackwell Publishing Ltd

Welcome message from author
This document is posted to help you gain knowledge. Please leave a comment to let me know what you think about it! Share it to your friends and learn new things together.
Transcript
Landscape scale effects of disturbance on riparianvegetation
BIRGITTA MALM RENOFALT AND CHRISTER NILSSON
Landscape Ecology Group, Department of Ecology and Environmental Science, Uminova Science Park, Umea University, SE-901
87 Umea, Sweden
SUMMARY
1. Differing responses in riparian species richness and composition to disturbance have been
reported as a possible explanation for the differences along and between rivers. This paper
explores the role of physical disturbance in shaping landscape-scale patterns of species
distribution in riparian vegetation along a free-flowing river in northern Sweden.
2. To test whether sensitivity to disturbance varies across large landscapes, we
experimentally disturbed riparian vegetation along an entire, free-flowing river by
scouring the soil and the vegetation turf, cutting vegetation, applying waterborne plant
litter, and after a period of recovery we measured vegetation responses. The
experiment was repeated for two consecutive years.
3. We found no significant effect of disturbance on species composition, but all three
forms of disturbance significantly reduced species richness. There was no downstream
variation in community responses to disturbance but morphological groups of species
responded differently to different kinds of disturbance. Graminoids were most resistant,
suppressed only by litter burial. All forms of disturbance except cutting reduced the
density of herbaceous species, and species density of trees + shrubs and dwarf shrubs was
negatively affected by both scouring and cutting. We also evaluated the effects of
disturbance in relation to varying levels of species richness. In nearly all cases, responses
were significantly negatively correlated with control plot species richness, and relative
responses indicated that species-rich plots were less resistant to scouring and cutting.
4. Our results suggest that although all disturbance treatments had an effect on species
richness, variation in sensitivity to disturbance is not the most important factor shaping
landscape-scale patterns of riparian plant species richness along rivers.
Keywords: disturbance, experimental, landscape patterns, riparian vegetation, river
Introduction
Free-flowing rivers generally have species-rich riparian
vegetation (Junk, Bayley & Sparks, 1989; Tabacchi,
Planty-Tabacchi & Decamps, 1990; Nilsson et al., 1994;
Planty-Tabacchi et al., 1996), and in some rivers the
highest densities of plant species have been found in the
middle reaches (e.g. Nilsson et al., 1989, 1991a; Planty-
Tabacchi et al., 1996). There is so far no unequivocal
explanation for this humped pattern, but a number of
variables have been suggested, such as substrate
heterogeneity, disturbance, plant dispersal, and a
mid-domain effect (Nilsson et al., 1989, 1994; Ward,
1998; Dunn, Colwell & Nilsson, 2006). The mid-domain
effect implies that physiographical and physiological
boundaries in relation to range-size distributions lead
to mid-domain richness peaks even without environ-
mental gradients (Colwell & Lees, 2000). However,
Renofalt, Merritt & Nilsson (2007) found the temporal
variability in patterns of species richness along a
Correspondence: Birgitta Malm Renofalt, Landscape Ecology
Group, Department of Ecology and Environmental Science,
Uminova Science Park, Umea University, SE-901 87 Umea,
Sweden.
E-mail: [email protected]
Freshwater Biology (2008) 53, 2244–2255 doi:10.1111/j.1365-2427.2008.02057.x
2244 � 2008 The Authors, Journal compilation � 2008 Blackwell Publishing Ltd
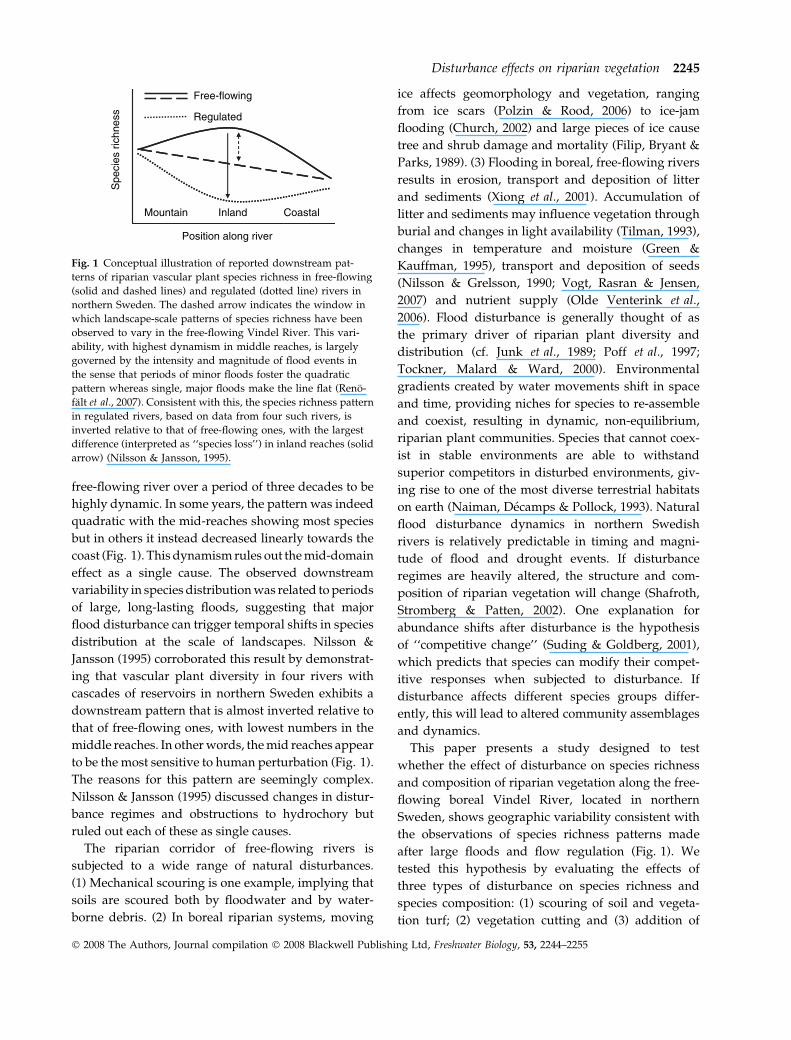
free-flowing river over a period of three decades to be
highly dynamic. In some years, the pattern was indeed
quadratic with the mid-reaches showing most species
but in others it instead decreased linearly towards the
coast (Fig. 1). This dynamism rules out the mid-domain
effect as a single cause. The observed downstream
variability in species distribution was related to periods
of large, long-lasting floods, suggesting that major
flood disturbance can trigger temporal shifts in species
distribution at the scale of landscapes. Nilsson &
Jansson (1995) corroborated this result by demonstrat-
ing that vascular plant diversity in four rivers with
cascades of reservoirs in northern Sweden exhibits a
downstream pattern that is almost inverted relative to
that of free-flowing ones, with lowest numbers in the
middle reaches. In other words, the mid reaches appear
to be the most sensitive to human perturbation (Fig. 1).
The reasons for this pattern are seemingly complex.
Nilsson & Jansson (1995) discussed changes in distur-
bance regimes and obstructions to hydrochory but
ruled out each of these as single causes.
The riparian corridor of free-flowing rivers is
subjected to a wide range of natural disturbances.
(1) Mechanical scouring is one example, implying that
soils are scoured both by floodwater and by water-
borne debris. (2) In boreal riparian systems, moving
ice affects geomorphology and vegetation, ranging
from ice scars (Polzin & Rood, 2006) to ice-jam
flooding (Church, 2002) and large pieces of ice cause
tree and shrub damage and mortality (Filip, Bryant &
Parks, 1989). (3) Flooding in boreal, free-flowing rivers
results in erosion, transport and deposition of litter
and sediments (Xiong et al., 2001). Accumulation of
litter and sediments may influence vegetation through
burial and changes in light availability (Tilman, 1993),
changes in temperature and moisture (Green &
Kauffman, 1995), transport and deposition of seeds
(Nilsson & Grelsson, 1990; Vogt, Rasran & Jensen,
2007) and nutrient supply (Olde Venterink et al.,
2006). Flood disturbance is generally thought of as
the primary driver of riparian plant diversity and
distribution (cf. Junk et al., 1989; Poff et al., 1997;
Tockner, Malard & Ward, 2000). Environmental
gradients created by water movements shift in space
and time, providing niches for species to re-assemble
and coexist, resulting in dynamic, non-equilibrium,
riparian plant communities. Species that cannot coex-
ist in stable environments are able to withstand
superior competitors in disturbed environments, giv-
ing rise to one of the most diverse terrestrial habitats
on earth (Naiman, Decamps & Pollock, 1993). Natural
flood disturbance dynamics in northern Swedish
rivers is relatively predictable in timing and magni-
tude of flood and drought events. If disturbance
regimes are heavily altered, the structure and com-
position of riparian vegetation will change (Shafroth,
Stromberg & Patten, 2002). One explanation for
abundance shifts after disturbance is the hypothesis
of ‘‘competitive change’’ (Suding & Goldberg, 2001),
which predicts that species can modify their compet-
itive responses when subjected to disturbance. If
disturbance affects different species groups differ-
ently, this will lead to altered community assemblages
and dynamics.
This paper presents a study designed to test
whether the effect of disturbance on species richness
and composition of riparian vegetation along the free-
flowing boreal Vindel River, located in northern
Sweden, shows geographic variability consistent with
the observations of species richness patterns made
after large floods and flow regulation (Fig. 1). We
tested this hypothesis by evaluating the effects of
three types of disturbance on species richness and
species composition: (1) scouring of soil and vegeta-
tion turf; (2) vegetation cutting and (3) addition of
Free-flowing
RegulatedS
peci
es r
ichn
ess
Position along river
Mountain Inland Coastal
Fig. 1 Conceptual illustration of reported downstream pat-
terns of riparian vascular plant species richness in free-flowing
(solid and dashed lines) and regulated (dotted line) rivers in
northern Sweden. The dashed arrow indicates the window in
which landscape-scale patterns of species richness have been
observed to vary in the free-flowing Vindel River. This vari-
ability, with highest dynamism in middle reaches, is largely
governed by the intensity and magnitude of flood events in
the sense that periods of minor floods foster the quadratic
pattern whereas single, major floods make the line flat (Reno-
falt et al., 2007). Consistent with this, the species richness pattern
in regulated rivers, based on data from four such rivers, is
inverted relative to that of free-flowing ones, with the largest
difference (interpreted as ‘‘species loss’’) in inland reaches (solid
arrow) (Nilsson & Jansson, 1995).
Disturbance effects on riparian vegetation 2245
� 2008 The Authors, Journal compilation � 2008 Blackwell Publishing Ltd, Freshwater Biology, 53, 2244–2255
waterborne plant litter on river reaches located along
the entire river. We also tested the effect on morpho-
logical species groups, thus separating between
trees + shrubs, dwarf shrubs, herbs and graminoids
in order to evaluate whether groups differed in their
ability to resist disturbance, and whether their
responses differed with type of disturbance. Further-
more, we asked whether there is any correlation
between species richness and the resilience of vege-
tation to disturbance. For example, can the inverted
pattern of species richness found in the mid reaches of
regulated rivers result from a proportionally greater
loss in initially more species-rich areas? Finally, we
assessed whether responses to disturbance correlate
with environmental attributes and species richness of
the reach.
Methods
Study site
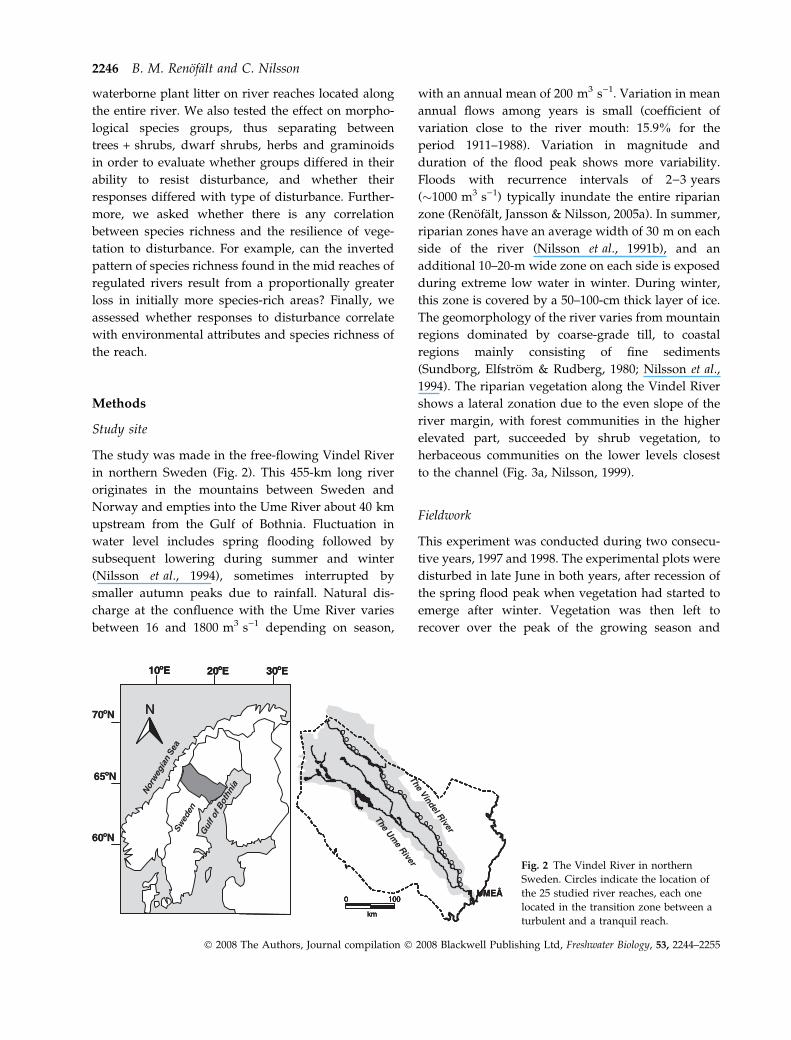
The study was made in the free-flowing Vindel River
in northern Sweden (Fig. 2). This 455-km long river
originates in the mountains between Sweden and
Norway and empties into the Ume River about 40 km
upstream from the Gulf of Bothnia. Fluctuation in
water level includes spring flooding followed by
subsequent lowering during summer and winter
(Nilsson et al., 1994), sometimes interrupted by
smaller autumn peaks due to rainfall. Natural dis-
charge at the confluence with the Ume River varies
between 16 and 1800 m3 s)1 depending on season,
with an annual mean of 200 m3 s)1. Variation in mean
annual flows among years is small (coefficient of
variation close to the river mouth: 15.9% for the
period 1911–1988). Variation in magnitude and
duration of the flood peak shows more variability.
Floods with recurrence intervals of 2)3 years
(�1000 m3 s)1) typically inundate the entire riparian
zone (Renofalt, Jansson & Nilsson, 2005a). In summer,
riparian zones have an average width of 30 m on each
side of the river (Nilsson et al., 1991b), and an
additional 10–20-m wide zone on each side is exposed
during extreme low water in winter. During winter,
this zone is covered by a 50–100-cm thick layer of ice.
The geomorphology of the river varies from mountain
regions dominated by coarse-grade till, to coastal
regions mainly consisting of fine sediments
(Sundborg, Elfstrom & Rudberg, 1980; Nilsson et al.,
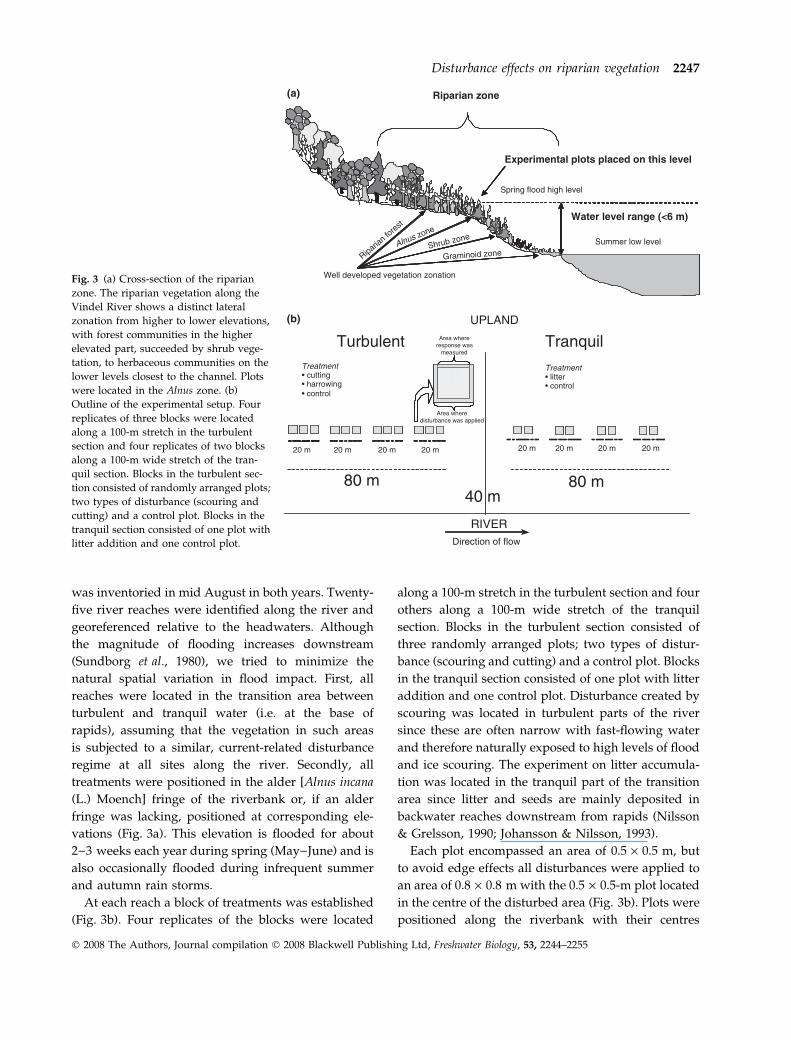
1994). The riparian vegetation along the Vindel River
shows a lateral zonation due to the even slope of the
river margin, with forest communities in the higher
elevated part, succeeded by shrub vegetation, to
herbaceous communities on the lower levels closest
to the channel (Fig. 3a, Nilsson, 1999).
Fieldwork
This experiment was conducted during two consecu-
tive years, 1997 and 1998. The experimental plots were
disturbed in late June in both years, after recession of
the spring flood peak when vegetation had started to
emerge after winter. Vegetation was then left to
recover over the peak of the growing season and
km
0 100 UMEÅ
n e d e w
S
n a i g e w
r o
N
a e S
a i n h t o B
f o f l u
G
20 o E 30 o E 10 o E
65 o N
60 o N
70 o N N
km
0 100
km
0 100 0 100 UMEÅ
UMEÅ
The Vindel River
The Ume River
Swed
en
Nor
weg
ian
Sea
Gul
f of B
othn
ia
20 o E 20 o E 30 o E 30 o E 10 o E 10 o E
65 o N
60 o N
70 o N N N
Fig. 2 The Vindel River in northern
Sweden. Circles indicate the location of
the 25 studied river reaches, each one
located in the transition zone between a
turbulent and a tranquil reach.
2246 B. M. Renofalt and C. Nilsson
� 2008 The Authors, Journal compilation � 2008 Blackwell Publishing Ltd, Freshwater Biology, 53, 2244–2255
was inventoried in mid August in both years. Twenty-
five river reaches were identified along the river and
georeferenced relative to the headwaters. Although
the magnitude of flooding increases downstream
(Sundborg et al., 1980), we tried to minimize the
natural spatial variation in flood impact. First, all
reaches were located in the transition area between
turbulent and tranquil water (i.e. at the base of
rapids), assuming that the vegetation in such areas
is subjected to a similar, current-related disturbance
regime at all sites along the river. Secondly, all
treatments were positioned in the alder [Alnus incana
(L.) Moench] fringe of the riverbank or, if an alder
fringe was lacking, positioned at corresponding ele-
vations (Fig. 3a). This elevation is flooded for about
2)3 weeks each year during spring (May)June) and is
also occasionally flooded during infrequent summer
and autumn rain storms.
At each reach a block of treatments was established
(Fig. 3b). Four replicates of the blocks were located
along a 100-m stretch in the turbulent section and four
others along a 100-m wide stretch of the tranquil
section. Blocks in the turbulent section consisted of
three randomly arranged plots; two types of distur-
bance (scouring and cutting) and a control plot. Blocks
in the tranquil section consisted of one plot with litter
addition and one control plot. Disturbance created by
scouring was located in turbulent parts of the river
since these are often narrow with fast-flowing water
and therefore naturally exposed to high levels of flood
and ice scouring. The experiment on litter accumula-
tion was located in the tranquil part of the transition
area since litter and seeds are mainly deposited in
backwater reaches downstream from rapids (Nilsson
& Grelsson, 1990; Johansson & Nilsson, 1993).
Each plot encompassed an area of 0.5 · 0.5 m, but
to avoid edge effects all disturbances were applied to
an area of 0.8 · 0.8 m with the 0.5 · 0.5-m plot located
in the centre of the disturbed area (Fig. 3b). Plots were
positioned along the riverbank with their centres
Riparian zone
Spring flood high level
Riparian fo
rest
Alnus zone
Summer low level
Graminoid zone
Water level range (<6 m)
Shrub zone
Well developed vegetation zonation
Experimental plots placed on this level
Turbulent Tranquil
40 m
Treatment • cutting• harrowing• control
Treatment • litter• control
Direction of flow
80 m
20 m 20 m 20 m 20 m
80 m
20 m 20 m 20 m 20 m
Area where response was
measured
RIVER
UPLAND
Area where disturbance was applied
(a)
(b)
Fig. 3 (a) Cross-section of the riparian
zone. The riparian vegetation along the
Vindel River shows a distinct lateral
zonation from higher to lower elevations,
with forest communities in the higher
elevated part, succeeded by shrub vege-
tation, to herbaceous communities on the
lower levels closest to the channel. Plots
were located in the Alnus zone. (b)
Outline of the experimental setup. Four
replicates of three blocks were located
along a 100-m stretch in the turbulent
section and four replicates of two blocks
along a 100-m wide stretch of the tran-
quil section. Blocks in the turbulent sec-
tion consisted of randomly arranged plots;
two types of disturbance (scouring and
cutting) and a control plot. Blocks in the
tranquil section consisted of one plot with
litter addition and one control plot.
Disturbance effects on riparian vegetation 2247
� 2008 The Authors, Journal compilation � 2008 Blackwell Publishing Ltd, Freshwater Biology, 53, 2244–2255
6.5 m apart, leaving a 20-m wide margin at each side
closest to the riparian transition. In this transition part
four undisturbed plots were positioned, 6.5 m apart.
These plots were used to measure small-scale dissim-
ilarity in vegetation composition in the riparian
corridor.
Scouring was performed by raking (10 replicate
strokes with a metal garden rake at each site), cutting
implied that all aboveground vegetation (approxi-
mately 1 cm above ground level) was cut and
removed, and litter burial was carried out by evenly
distributing 2.5 kg of partly dried, waterborne litter
(room dry weight = 575 g) from the lower reaches of
the Vindel River on top of the emerging vegetation.
The level of applied disturbance approximated to that
of a flood with a recurrence interval of 2)3 years.
All experimental and control plots were inventoried
for species presence or absence. Species nomenclature
follows Krok & Almquist (1994). The taxa Salix
myrsinifolia Salisb. + S. phylicifolia L. were treated as
one species as these species often hybridize. This was
also the case for Carex juncella (Fr.) Th.Fr. + C. nigra
(L.) Reichard. Hieracium L. spp., Taraxacum F. H.
Wigg. spp. and Alchemilla L. spp. were identified only
to genus level.
In addition, total species richness and environmen-
tal variables were recorded on the surrounding 200-m
river reach in 1998. Data collected included: river
margin width (mean width of five measurements
equally distributed along the reach); area (mean width
of the five measurements · length of reach); riverbank
height [height between the spring flood high, i.e. the
highest level attained at least once every 2 years, and
summer low levels (Fig. 3a) where the top of the
riverbank was judged equivalent to the lower end of
continuous occurrences of flood intolerant species
such as Vaccinium myrtillus L., measured in middle of
the reach]; substrate heterogeneity (number of sub-
strates per reach); substrate fineness (substrates clas-
sified using the Wentworth grain sizes clay, silt, sand,
gravel, pebbles, cobbles and boulders; Chorley,
Schumm & Sugden, 1984), supplemented by peat
and bedrock (see Nilsson et al., 1991b for further
details); substrate fineness (F values calculated by
weighing log2-transformed values of mean particle
size by percentage composition of the river margin
substrate; Wright et al., 1984; Nilsson et al., 1989) and
percent cover of plants (trees + shrubs, dwarf shrubs,
herbs and graminoids).
Data analyses
Dissimilarity in floristic composition between treated
and control plots, and small-scale natural dissimilar-
ity in floristic composition among undisturbed plots
were tested using Jaccard’s index of similarity (SI),
which is calculated as
SI ¼ all matches=(all matches + all non-matches);
where a match is any occurrence of the same species
in the two plots or sites being compared and a non-
match is an occurrence of a species only in one or the
other plot. The obtained values range between 0 and
1, where 0 means that all species in the paired plots
are different, and 1 that they are all the same. The
inverted similarity value expresses dissimilarity in
floristic composition. A treatment effect for the reach
was calculated as the mean dissimilarity between
treatment and control of all four replicates. The
treatment effect was compared with natural dissim-
ilarity in floristic composition of the reach calculated
as the mean dissimilarity among the four undisturbed
control plots. The mean dissimilarity of the treat-
ment–control pairs was compared with the mean
dissimilarity of undisturbed plots using a paired-
sample t-test. This analysis was made for each of the
treatments.
To test if the effects of disturbance on species
composition varied along the river corridor and
differed from the longitudinal pattern of natural
dissimilarity in floristic composition, we related
floristic dissimilarity between controls and treatments
and floristic dissimilarity between control plots to
distance along the river. All relationships were tested
with linear and polynomial regressions. We tested
whether the slopes of treatment effects differed from
the slope of natural dissimilarity in floristic composi-
tion using analysis of covariance (ANCOVAANCOVA).
The effect of disturbance on species richness was
calculated as the difference in mean species richness
between treated and control plots. We could not assess
the pre-disturbance species richness of the treated plot
since all treatments were carried out in spring,
immediately after the recession of the spring flood
peak, when the riparian vegetation had only begun to
emerge after winter dormancy and accurate species
richness levels could not be obtained. Therefore, we
used species richness of control plots as an estimate of
pre-disturbance plot species richness. We tested
2248 B. M. Renofalt and C. Nilsson
� 2008 The Authors, Journal compilation � 2008 Blackwell Publishing Ltd, Freshwater Biology, 53, 2244–2255
whether undisturbed vegetation differed in species
richness between plots by comparing mean
species richness of control plots 1 and 2 with mean
species richness of control plots 3 and 4. This was done
for control plots in both tranquil and turbulent
sections. We tested if species richness was significantly
lowered by disturbance by comparing mean species
richness of control plots with mean species richness of
disturbed plots. We also tested the effects of distur-
bance between treatment and control plots separately
for morphological groups; trees + shrubs, dwarf shrubs,
herbs and graminoids (1998 data only). All of these
tests were conducted using paired-sample t-tests.
To test if the effects of disturbance on species
richness varied along the river corridor we related the
difference in species richness between treated and
control plots to the location along the river and
applied linear and polynomial regression analyses.
We also tested using ANCOVAANCOVA if the relationship
between species richness and location, both on the
treated and the control plots differed from each other.
In addition, we evaluated the relationship between
the effect of disturbance in terms of species loss
(absolute and relative) and control plot species rich-
ness using linear and polynomial regression analyses.
We also correlated disturbance effects with environ-
mental variables [river margin width, river margin
height, substrate heterogeneity, substrate and percent
cover of plants (trees + shrubs, dwarf shrubs, herbs,
and graminoids)] and species richness of the reach.
All statistical tests were made using the statistical
software SPSSSPSS version 11.0 (SPSS Inc., Chicago, IL,
USA) and Sigmaplot 7.0.
Results
Effects on floristic composition
Floristic composition was not affected by disturbance.
Mean dissimilarity between treatment and control
plots and mean dissimilarity among control plots only
were not significantly different for any of the treat-
ments. Natural dissimilarity in floristic composition
and effects of disturbance did not show significant
downstream patterns for any of the years (P > 0.05,
linear and polynomial regressions). In addition, there
was no significant difference between the regression
lines of the natural heterogeneity versus location,
and of the treatment–control versus location for any
of the treatments (P > 0.05, ANCOVAANCOVA, two-tailed
probability).
Effects on species richness
In several cases, species richness was affected by
disturbance. Species richness in the disturbed plots
was significantly lower than in control plots for all
treatments (Table 1). When species were divided into
morphological groups and treated plots were tested
against control plots, the effect varied with treatment
(Table 2). Scouring had a significant effect on
Table 1. Difference in species richness between pairs of
treated and control plots (paired sample t-test, two-tailed
probability; significant differences boldfaced) along the Vindel
River
Treatment
Treated plots Control plots
PMean SD Mean SD
1997
Scouring
1997 (n = 25) 10.35 3.08 12.11 3.51 0.002
1998 (n = 25) 9.53 3.16 10.83 3.06 0.007
Cutting
1997 (n = 25) 10.77 2.48 12.11 3.51 0.003
1998 (n = 25) 9.63 3.39 10.83 3.06 <0.001
Litter deposition
1997 (n = 25) 10.12 3.33 11.83 3.18 0.008
1998 (n = 24) 8.08 2.48 9.78 2.95 0.001
Table 2 Differences in absolute species richness for morpho-
logical groups between treated and control plots (paired
sample t-test, two-tailed probability; significant differences
boldfaced) along the Vindel River
Treatment
Treated plots Control plots
PMean SD Mean SD
Scouring
Trees + shrubs 0.43 0.42 0.66 0.46 0.006
Dwarf shrubs 0.94 0.75 1.14 0.88 0.043
Herbs 5.06 2.33 5.87 2.46 0.004
Graminoids 2.90 1.03 3.16 1.00 0.243
Cutting
Trees + shrubs 0.38 0.37 0.66 0.46 0.003
Dwarf shrubs 0.73 0.75 1.14 0.88 <0.001
Herbs 5.47 2.36 5.87 2.46 0.066
Graminoids 2.85 0.84 3.16 1.00 0.098
Litter addition
Trees + shrubs 0.52 0.38 0.67 0.44 0.164
Dwarf shrubs 0.51 0.70 0.76 0.89 0.062
Herbs 4.61 2.21 5.47 2.17 0.009
Graminoids 2.27 0.79 3.16 1.00 <0.001
Data stem from 1998.
Disturbance effects on riparian vegetation 2249
� 2008 The Authors, Journal compilation � 2008 Blackwell Publishing Ltd, Freshwater Biology, 53, 2244–2255
trees + shrubs and herbs, but not on graminoids.
Cutting reduced numbers of tree + shrub species but
numbers of herbs and graminoids were not signifi-
cantly reduced. The effect of litter addition was
opposite to that of cutting, with a significant decrease
of herb and graminoid species richness, but not of
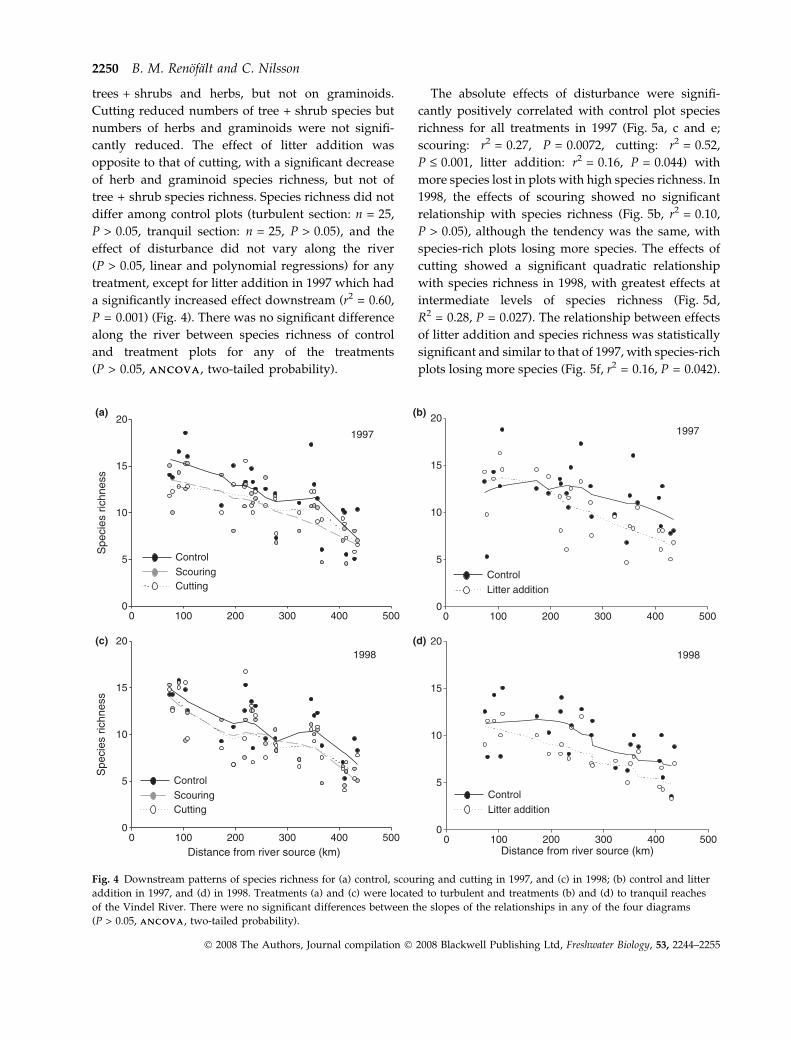
tree + shrub species richness. Species richness did not
differ among control plots (turbulent section: n = 25,
P > 0.05, tranquil section: n = 25, P > 0.05), and the
effect of disturbance did not vary along the river
(P > 0.05, linear and polynomial regressions) for any
treatment, except for litter addition in 1997 which had
a significantly increased effect downstream (r2 = 0.60,
P = 0.001) (Fig. 4). There was no significant difference
along the river between species richness of control
and treatment plots for any of the treatments
(P > 0.05, ANCOVAANCOVA, two-tailed probability).
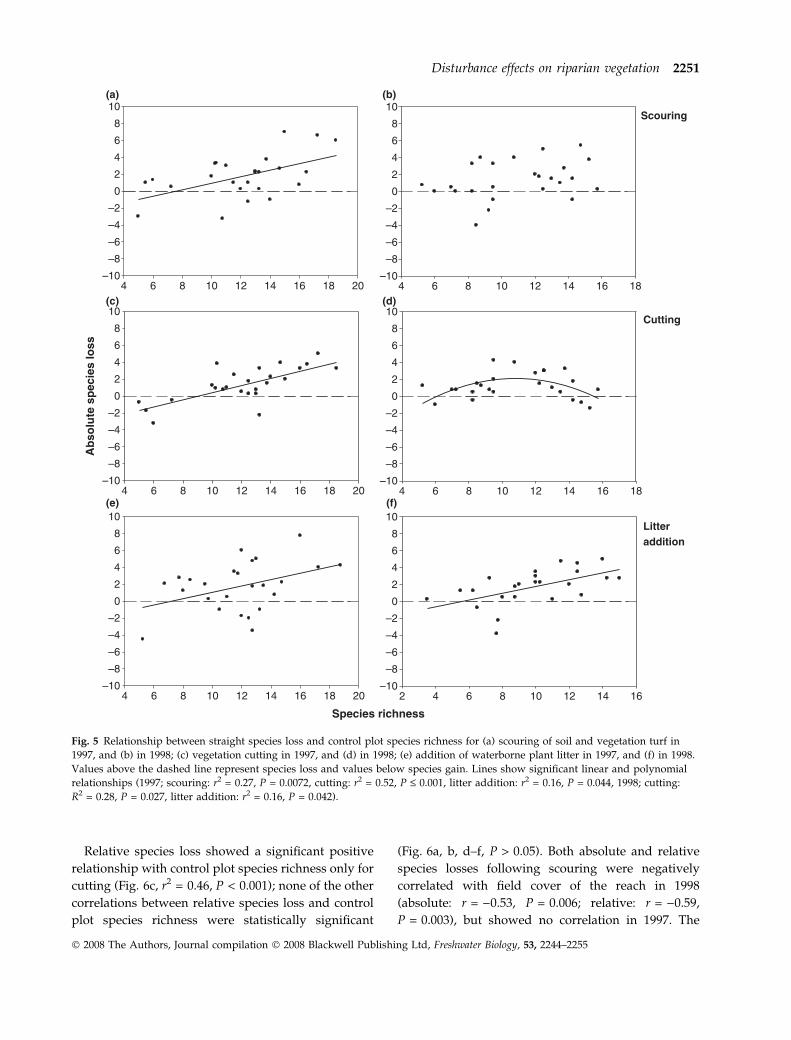
The absolute effects of disturbance were signifi-
cantly positively correlated with control plot species
richness for all treatments in 1997 (Fig. 5a, c and e;
scouring: r2 = 0.27, P = 0.0072, cutting: r2 = 0.52,
P £ 0.001, litter addition: r2 = 0.16, P = 0.044) with
more species lost in plots with high species richness. In
1998, the effects of scouring showed no significant
relationship with species richness (Fig. 5b, r2 = 0.10,
P > 0.05), although the tendency was the same, with
species-rich plots losing more species. The effects of
cutting showed a significant quadratic relationship
with species richness in 1998, with greatest effects at
intermediate levels of species richness (Fig. 5d,
R2 = 0.28, P = 0.027). The relationship between effects
of litter addition and species richness was statistically
significant and similar to that of 1997, with species-rich
plots losing more species (Fig. 5f, r2 = 0.16, P = 0.042).
0 100 200 300 400 500
S
peci
es r
ichn
ess
0
5
10
15
20
0 100 200 300 400 500 0
5
10
15
20
Distance from river source (km) 0 100 200 300 400 500
S
peci
es r
ichn
ess
0
5
10
15
20
Distance from river source (km) 0 100 200 300 400 500
0
5
10
15
20
1997 1997
1998 1998
Control Scouring Cutting
Control Scouring Cutting
Control Litter addition
Control
Litter addition
(a) (b)
(d) (c)
Fig. 4 Downstream patterns of species richness for (a) control, scouring and cutting in 1997, and (c) in 1998; (b) control and litter
addition in 1997, and (d) in 1998. Treatments (a) and (c) were located to turbulent and treatments (b) and (d) to tranquil reaches
of the Vindel River. There were no significant differences between the slopes of the relationships in any of the four diagrams
(P > 0.05, A N C O V AA N C O V A, two-tailed probability).
2250 B. M. Renofalt and C. Nilsson
� 2008 The Authors, Journal compilation � 2008 Blackwell Publishing Ltd, Freshwater Biology, 53, 2244–2255
Relative species loss showed a significant positive
relationship with control plot species richness only for
cutting (Fig. 6c, r2 = 0.46, P < 0.001); none of the other
correlations between relative species loss and control
plot species richness were statistically significant
(Fig. 6a, b, d–f, P > 0.05). Both absolute and relative
species losses following scouring were negatively
correlated with field cover of the reach in 1998
(absolute: r = )0.53, P = 0.006; relative: r = )0.59,
P = 0.003), but showed no correlation in 1997. The
4 6 8 10 12 14 16 18–10
–8
–6
–4
–2
0
2
4
6
8
10
2 4 6 8 10 12 14 16–10
–8
–6
–4
–2
0
2
4
6
8
10
4 6 8 10 12 14 16 18 20–10
–8
–6
–4
–2
0
2
4
6
8
10
4 6 8 10 12 14 16 18 20–10
–8
–6
–4
–2
0
2
4
6
8
10
Species richness
Ab
solu
te s
pec
ies
loss
Scouring
Cutting
Litter addition
4 6 8 10 12 14 16 18 20–10
–8
–6
–4
–2
0
2
4
6
8
10
4 6 8 10 12 14 16 18–10
–8
–6
–4
–2
0
2
4
6
8
10(a)
(c)
(e) (f)
(d)
(b)
Fig. 5 Relationship between straight species loss and control plot species richness for (a) scouring of soil and vegetation turf in
1997, and (b) in 1998; (c) vegetation cutting in 1997, and (d) in 1998; (e) addition of waterborne plant litter in 1997, and (f) in 1998.
Values above the dashed line represent species loss and values below species gain. Lines show significant linear and polynomial
relationships (1997; scouring: r2 = 0.27, P = 0.0072, cutting: r2 = 0.52, P £ 0.001, litter addition: r2 = 0.16, P = 0.044, 1998; cutting:
R2 = 0.28, P = 0.027, litter addition: r2 = 0.16, P = 0.042).
Disturbance effects on riparian vegetation 2251
� 2008 The Authors, Journal compilation � 2008 Blackwell Publishing Ltd, Freshwater Biology, 53, 2244–2255
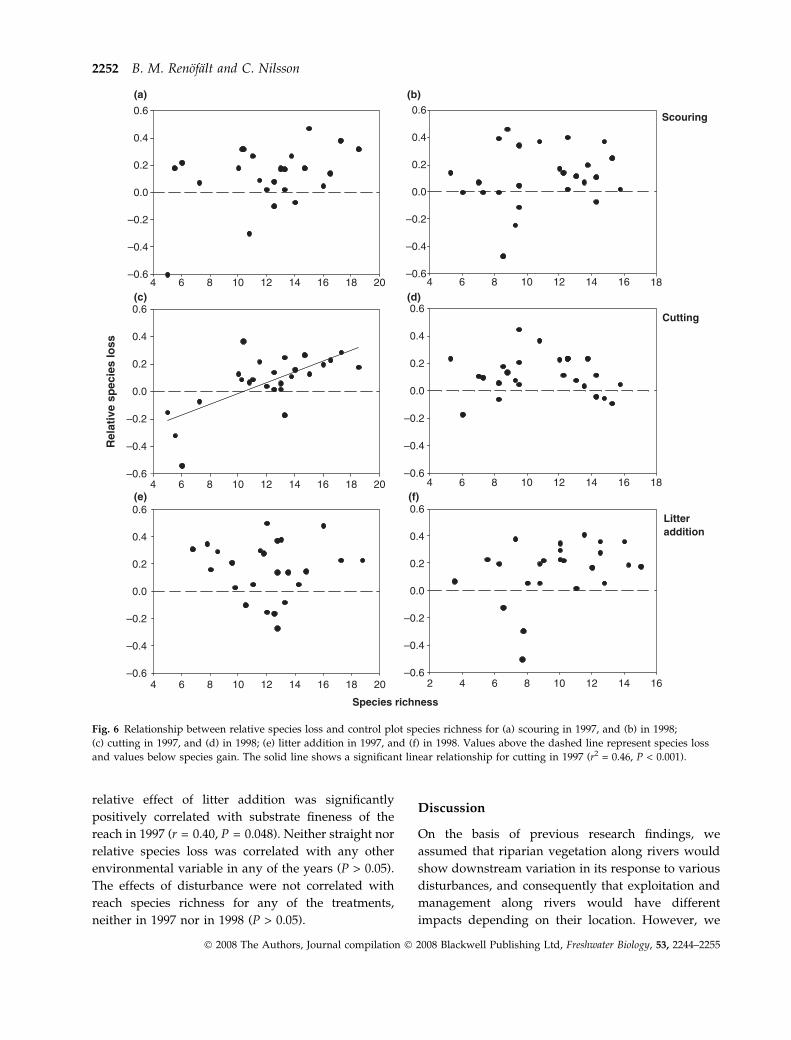
relative effect of litter addition was significantly
positively correlated with substrate fineness of the
reach in 1997 (r = 0.40, P = 0.048). Neither straight nor
relative species loss was correlated with any other
environmental variable in any of the years (P > 0.05).
The effects of disturbance were not correlated with
reach species richness for any of the treatments,
neither in 1997 nor in 1998 (P > 0.05).
Discussion
On the basis of previous research findings, we
assumed that riparian vegetation along rivers would
show downstream variation in its response to various
disturbances, and consequently that exploitation and
management along rivers would have different
impacts depending on their location. However, we
4 6 8 10 12 14 16 18 20
4 6 8 10 12 14 16 18 20
4 6 8 10 12 14 16 18 20
–0.6
–0.4
–0.2
0.0
0.2
0.4
0.6
–0.6
–0.4
–0.2
0.0
0.2
0.4
0.6
–0.6
–0.4
–0.2
0.0
0.2
0.4
0.6
–0.6
–0.4
–0.2
0.0
0.2
0.4
0.6
–0.6
–0.4
–0.2
0.0
0.2
0.4
0.6
–0.6
–0.4
–0.2
0.0
0.2
0.4
0.6
4 6 8 10 12 14 16 18
4 6 8 10 12 14 16 18
2 4 6 8 10 12 14 16
Scouring
Cutting
Litter addition
Species richness
Rel
ativ
e sp
ecie
s lo
ss
(a) (b)
(d) (c)
(e) (f)
Fig. 6 Relationship between relative species loss and control plot species richness for (a) scouring in 1997, and (b) in 1998;
(c) cutting in 1997, and (d) in 1998; (e) litter addition in 1997, and (f) in 1998. Values above the dashed line represent species loss
and values below species gain. The solid line shows a significant linear relationship for cutting in 1997 (r2 = 0.46, P < 0.001).
2252 B. M. Renofalt and C. Nilsson
� 2008 The Authors, Journal compilation � 2008 Blackwell Publishing Ltd, Freshwater Biology, 53, 2244–2255
did not find any clear support for our main hypothesis
that vegetation in the middle reaches of the river is
least resistant to disturbance. In fact, species richness
was affected by all types of disturbance that were
applied along the entire river, and treatment effects
did not vary with downstream position (Fig. 4). Litter
addition in 1997 formed an exception, but a rain-
induced flood that removed some of the added litter
in the upper reaches of the river probably contributed
to the observed trend of increasing effects down-
stream. One factor that might affect the interpretation
of this study is the fact that the large-scale, hump-
shaped pattern of species richness is more unstable
than was previously believed, and that long-lasting
floods can even remove it, at least temporarily
(Renofalt et al., 2007). The record flood in 1995, with
a maximum discharge twice as high as the mean
annual flood peak (Swedish Meteorological and
Hydrological Institute), caused such a shift. Therefore,
even though we operated on a smaller scale, the
responses to our experimentally applied disturbance
could have been hampered because the system was
too recently disturbed.
The results do not support the hypothesis that
disturbance would affect species composition (Suding
& Goldberg, 2001; Shafroth et al., 2002). Since riparian
vegetation is naturally adapted to flood disturbance
(Wintle & Kirkpatrick, 2007), disturbance with a larger
magnitude than ours could have been required to
produce an effect. Also, natural dissimilarity in
floristic composition was large at the reach level
(mean dissimilarity = 0.70), and probably large
enough to mask any effect of disturbance on plant
community composition. An alternative study
approach would have been to sample the experimen-
tal plot in the previous growing season (i.e. before
disturbance). However, annual species turnover along
the Vindel River riparian corridor was also relatively
high (mean dissimilarity of the control plots between
1997 and 1998 = 0.53, inverted Jaccard’s similarity
index). This implies that the natural disturbances of
riparian corridors most likely sustain high spatial and
temporal heterogeneity in floristic composition at
small scales. Studies comparing the vegetation
dynamics at several scales could potentially provide
more insight into these patterns.
Sparse vegetation would be expected to be more
vulnerable to scouring than dense vegetation because
the soil would be more exposed and fewer roots
would be available to stabilize the soil (Pettit &
Naiman, 2007). The fact that the effect of scouring was
negatively correlated with field cover of the reach in
1998 is therefore not surprising. However, the nega-
tive correlation between the effect of litter addition
and substrate fineness in 1997 (the finer the substrate,
the less the effect) is difficult to interpret. One possible
explanation is that, since fine-grained soils have larger
water holding capacity, increased moisture at fine-
grained sites could enhance litter breakdown (Wil-
liams et al., 2006). The finding by Renofalt, Nilsson &
Jansson (2005b) that substrate heterogeneity (number
of substrates per reach) peaked in the middle reaches
of the Vindel River where substrate was coarsest on
average does not match this result. Once again,
mechanisms might have differed between plot and
reach scales.
In contrast to other morphological groups grami-
noids resisted disturbance, except in the case of litter
addition. Many graminoids in the riparian zone were
tuft-forming and resistant to scouring, such as
Deschampsia cespitosa (L.) P. Beauv., Molinia caerulea
(L.) Moench and Carex juncella + nigra. Graminoids
also have a unique ability to grow after having been
cut since their leaves grow from the base. Each
internode on the stem has meristematic tissue (inter-
calary meristem) that stimulates regrowth after the
grass has been damaged (Salisbury & Ross, 1969).
Xiong et al. (2001) studied a floodplain site in the
Vindel River to determine the responses of riparian
plants to litter accumulation. They found that litter
addition reduced biomass for all graminoid species
included in the study. For some species, such as
Deschampsia cespitosa, the relative loss of biomass was
almost 100% within a growing season. In our study,
we added an amount of litter that exceeded those of
Xiong et al. (2001), so treatment effects would have
been even larger than those of Xiong et al. (2001).
If longitudinal variation in the general sensitivity to
disturbance does not explain the responses following
regulation, what then causes the inverted patterns of
species richness along regulated rivers, and the
different sensitivity to megaflooding in free-flowing
rivers? Several possible factors that might have
changed downstream can be considered, such as (1)
kinds, intensities and magnitudes of disturbance, (2)
recruitment of new plants and (3) disruption of
dispersal. Furthermore, it is not possible to say
whether the middle reaches of those regulated rivers
Disturbance effects on riparian vegetation 2253
� 2008 The Authors, Journal compilation � 2008 Blackwell Publishing Ltd, Freshwater Biology, 53, 2244–2255
investigated previously had high pre-regulation rich-
ness because the rivers were only very briefly inven-
toried, if at all, before impoundment.
In conclusion, we have provided evidence that
disturbance plays a role in shaping riparian vegeta-
tion, but our results also suggest that it is not the
most important factor in explaining the differences
in the distribution of plant species density between
free-flowing and regulated rivers. Many steps
remain to be taken before the patterns of species
richness along entire rivers can be more fully
disentangled. Until then, we predict that environ-
mental, biological and geographical (e.g. mid-do-
main effects) all work together in governing this
vegetation which belongs among the most complex
in the world.
Acknowledgements
We thank two journal reviewers for constructive
comments on a previous version of the manuscript
and K. Berggren, J. Bergsten, A. Duerden, V. Gahlman,
N. Hager and A. Wenngren for assisting in the
fieldwork. The study was supported by grants
from the Swedish World Wide Fund for Nature (to
C. Nilsson).
References
Chorley R.J., Schumm S.A. & Sugden D.E. (1984)
Geomorphology. Methuen and Company, New York,
USA.
Church M. (2002) Geomorphic thresholds in riverine
landscapes. Freshwater Biology, 47, 541–557.
Colwell R.K. & Lees D.C. (2000) The mid-domain effect:
geometric constraints on the geography of species
richness. Trends in Ecology and Evolution, 15, 70–76.
Dunn R.R., Colwell R.K. & Nilsson C. (2006) The river
domain: why are there more species halfway up the
river? Ecography, 29, 251–259.
Filip G.M., Bryant L.D. & Parks C.A. (1989) Mass
movement of river ice causes severe tree wounds
along the Grande-Ronde River in northeastern Oregon.
Northwest Science, 63, 211–213.
Green D.M. & Kauffman J.B. (1995) Succession and
livestock grazing in a northeastern Oregon riparian
ecosystem. Journal of Range Management, 48, 307–313.
Johansson M.E. & Nilsson C. (1993) Hydrochory, popu-
lation-dynamics and distribution of the clonal aquatic
plant Ranunculus lingua. Journal of Ecology, 81, 81–91.
Junk W.J., Bayley P.B. & Sparks R.E. (1989) The flood
pulse concept in river-floodplain systems. Canadian
Journal of Fisheries and Aquatic Sciences, 106, 110–127.
Krok T.O.B.N. & Almquist S. (1994) Svensk Flora. Fan-
erogamer och Ormbunksvaxter, 27th edn. Liber Utbild-
ning, Stockholm, Sweden.
Naiman R.J., Decamps H. & Pollock M. (1993) The role of
riparian corridors in maintaining regional biodiversity.
Ecological Applications, 3, 209–212.
Nilsson C. (1999) Rivers and streams. Acta Phytogeo-
graphica Suecica, 84, 135–148.
Nilsson C. & Grelsson G. (1990) The effects of litter
displacement on riverbank vegetation. Canadian Journal
of Botany, 68, 735–741.
Nilsson C. & Jansson R. (1995) Floristic differences
between riparian corridors of regulated and free-
flowing boreal rivers. Regulated Rivers: Research and
Management, 11, 55–66.
Nilsson C., Grelsson G., Johansson M.E. & Sperens U.
(1989) Patterns of plant species richness along river-
banks. Ecology, 70, 77–84.
Nilsson C., Grelsson G., Dynesius M., Johansson M.E. &
Sperens U. (1991a) Small rivers behave like large
rivers: effects of postglacial history on plant-species
richness along riverbanks. Journal of Biogeography, 18,
533–541.
Nilsson C., Ekblad A., Gardfjell M. & Carlberg B. (1991b)
Long-term effects of river regulation on river margin
vegetation. Journal of Applied Ecology, 28, 963–987.
Nilsson C., Ekblad A., Dynesius M., Backe S., Gardfjell
M., Carlberg B., Hellqvist S. & Jansson R. (1994)
Comparison of species richness and traits of riparian
plants between a main river channel and its tributaries.
Journal of Ecology, 82, 281–295.
Olde Venterink H., Vermaat J.E., Pronk M., Wiegman F.,
van der Lee G.E.M., van den Hoorn M.W., Higler
L.W.G.B. & Verhoeven J.T.A. (2006) Importance of
sediment deposition and denitrification for nutrient
retention in floodplain wetlands. Applied Vegetation
Science, 9, 163–174.
Pettit N.E. & Naiman R.J. (2007) Fire in the riparian
zone: characteristics and ecological consequences. Eco-
systems, 10, 673–687.
Planty-Tabacchi A.-M., Tabacchi E., Naiman R.J., DeFer-
rari C. & Decamps H. (1996) Invasibility of species rich
communities in riparian zones. Conservation Biology, 10,
598–607.
Poff N.L., Allan J.D., Bain M.B., Karr J.R., Prestegaard
K.L., Richter B.D., Sparks R.E. & Stromberg J.C. (1997)
The natural flow regime. BioScience, 47, 769–784.
Polzin M.L. & Rood S.B. (2006) Effective disturbance:
seedling safe sites and patch recruitment of riparian
2254 B. M. Renofalt and C. Nilsson
� 2008 The Authors, Journal compilation � 2008 Blackwell Publishing Ltd, Freshwater Biology, 53, 2244–2255
cottonwoods after a major flood of a mountain river.
Wetlands, 26, 965–980.
Renofalt B.M., Jansson R. & Nilsson C. (2005a) Spatial
patterns of plant invasiveness in a riparian corridor.
Landscape Ecology, 20, 165–176.
Renofalt B.M., Nilsson C. & Jansson R. (2005b) Spatial
and temporal patterns of species richness in a riparian
landscape. Journal of Biogeography, 32, 2025–2037.
Renofalt B.M., Merritt D.M. & Nilsson C. (2007) Con-
necting variation in vegetation and stream flow: the
role of geomorphic context in vegetation response to
large floods along boreal rivers. Journal of Applied
Ecology, 44, 147–157.
Salisbury F.B. & Ross C. (1969) Plant Physiology. Wads-
worth Publishing Company, Belmont, California, USA.
Shafroth P.B., Stromberg J.C. & Patten D.T. (2002)
Riparian vegetation response to altered disturbance
and stress regimes. Ecological Applications, 12, 107–
123.
Suding K.N. & Goldberg D. (2001) Do disturbances alter
competitive hierarchies? Mechanisms of change fol-
lowing gap creation Ecology, 82, 2133–2149.
Sundborg A., Elfstrom A. & Rudberg S. (1980) Pitealven,
Laisalven and Vindelalven. Environmental Effects of River
Diversions and Hydropower Development. Department of
Physical Geography, Uppsala University, Uppsala,
Sweden.
Tabacchi E., Planty-Tabacchi A-M. & Decamps O. (1990)
Continuity and discontinuity of the riparian vegetation
along a fluvial corridor. Landscape Ecology, 5, 9–20.
Tilman D. (1993) Species richness of experimental pro-
ductivity gradients: how important is colonization
limitation? Ecology, 74, 2179–2191.
Tockner K., Malard F. & Ward J.V. (2000) An extension of
the flood pulse concept. Hydrological Processes, 14,
2861–2883.
Vogt K., Rasran L. & Jensen K. (2007) Seed deposition in
drift lines: opportunity or hazard for species establish-
ment? Aquatic Botany, 86, 385–392.
Ward J.V. (1998) Riverine landscapes: biodiversity pat-
terns, disturbance regimes, and aquatic conservation.
Biological Conservation, 83, 269–278.
Williams D.G., Scott R.L., Huxman T.E., Goodrich D.C. &
Lin G. (2006) Sensitivity of riparian ecosystems in arid
and semiarid environments to moisture pulses. Hydro-
logical Processes, 20, 3191–3205.
Wintle B.C. & Kirkpatrick J.B. (2007) The response of
riparian vegetation to flood-maintained habitat heter-
ogeneity. Austral Ecology, 32, 592–599.
Wright J.F., Moss D., Armitage P.D. & Furse M.T. (1984)
A preliminary classification of running-water sites in
Great Britain based on macro-invertebrate species and
the prediction of community type using environmental
data. Freshwater Biology, 14, 221–256.
Xiong S., Nilsson C., Johansson M.E. & Jansson R. (2001)
Responses of riparian plants to accumulation of silt
and plant litter: the importance of plant traits. Journal of
Vegetation Science, 12, 481–490.
(Manuscript accepted 03 June 2008)
Disturbance effects on riparian vegetation 2255
� 2008 The Authors, Journal compilation � 2008 Blackwell Publishing Ltd, Freshwater Biology, 53, 2244–2255
Related Documents