DOCUMENT RESUME ED 379 160 SE 055 777 AUTHOR Huinker, DeAnn; And Others TITLE Landscape of Mathematics and Science Education in Milwaukee. A Study of the Milwaukee Public Schools. INSTITUTION Wisconsin Univ., Milwaukee. Center for Mathem-1:ics and Science Education Research. SPONS AGENCY National Science Foundation, Washington, D.C. PUB DATE Jan 95 CONTRACT OSR-9350093 NOTE 170p. PUB TYPE Reports Research/Technical (143) Tests /Evaluation Instruments (160) EDRS PRICE MF01/PC07 Plus Postage. DESCRIPTORS Administrator Attitudes; Educational Change; Elementary Secondary Education; Interviews; *Mathematics Instruction; *Mathematics Teachers; Observation; *Principals; Public Schools; Science Education; *Science Instruction; *Science Teachers; *Student Attitudes; Surveys; Teacher Attitudes IDENTIFIERS *Milwaukee Public Schools WI ABSTRACT This document is a report of an intensive study of the K-12 mathematics and science programs in Milwaukee (Wisconsin) public schools (n=40) based on classroom observations, interviews, surveys, and focus group discussions. Results showed that students want practical experiences, less teacher talk, and more studellt talk. Teacher interviews indicated that staff development needs are greatest in practical instructional methods, integrated curriculum, and use of technology. Principals interviewed believed that barriers to effective instruction include time constraints, few resources, and reduced central office support for principals. Observations of 190 mathematics and science classes showed that: (1) About half of the observed classes at all levels were traditional in format; (2) Only about five percent of the teachers made any attempt to connect lessons to real life; (3) Computers were ra-ely used at any level; (4) Calculators were seldom used in elementary classes and in only about one-third of the high school classes; (5) Race and ethnic but not gender inequities were found in advanced mathematics and science class enrollments; (6) Diverse grouping arrangements in elementary classes encouraged student interaction regardless of race, ethnicity, or gender; (7) High school science classes had the most opportunity for student interaction; high school mathematics classes, the least; and (8) Many elementary and middle school classrooms were overcrowded. Teachers identified the following major obstacles to teaching mathematics and science effectively: student apathy and fear of mathematics; poor stuuent background or skills; absenteeism and student mobility; lack of parental support; poor student behavior; lack of adequate time for planning; lack of student interest; large class sizes; and limited or no access to technology and current textbooks. Appendices include a guide to site visits and data collection, survey instruments, and focus group questions. (MKR)

Welcome message from author
This document is posted to help you gain knowledge. Please leave a comment to let me know what you think about it! Share it to your friends and learn new things together.
Transcript

DOCUMENT RESUME
ED 379 160 SE 055 777
AUTHOR Huinker, DeAnn; And OthersTITLE Landscape of Mathematics and Science Education in
Milwaukee. A Study of the Milwaukee PublicSchools.
INSTITUTION Wisconsin Univ., Milwaukee. Center for Mathem-1:icsand Science Education Research.
SPONS AGENCY National Science Foundation, Washington, D.C.PUB DATE Jan 95
CONTRACT OSR-9350093NOTE 170p.
PUB TYPE Reports Research/Technical (143)Tests /Evaluation Instruments (160)
EDRS PRICE MF01/PC07 Plus Postage.DESCRIPTORS Administrator Attitudes; Educational Change;
Elementary Secondary Education; Interviews;*Mathematics Instruction; *Mathematics Teachers;Observation; *Principals; Public Schools; ScienceEducation; *Science Instruction; *Science Teachers;*Student Attitudes; Surveys; Teacher Attitudes
IDENTIFIERS *Milwaukee Public Schools WI
ABSTRACTThis document is a report of an intensive study of
the K-12 mathematics and science programs in Milwaukee (Wisconsin)public schools (n=40) based on classroom observations, interviews,surveys, and focus group discussions. Results showed that studentswant practical experiences, less teacher talk, and more studellt talk.Teacher interviews indicated that staff development needs aregreatest in practical instructional methods, integrated curriculum,and use of technology. Principals interviewed believed that barriersto effective instruction include time constraints, few resources, andreduced central office support for principals. Observations of 190mathematics and science classes showed that: (1) About half of theobserved classes at all levels were traditional in format; (2) Onlyabout five percent of the teachers made any attempt to connectlessons to real life; (3) Computers were ra-ely used at any level;(4) Calculators were seldom used in elementary classes and in onlyabout one-third of the high school classes; (5) Race and ethnic butnot gender inequities were found in advanced mathematics and scienceclass enrollments; (6) Diverse grouping arrangements in elementaryclasses encouraged student interaction regardless of race, ethnicity,or gender; (7) High school science classes had the most opportunityfor student interaction; high school mathematics classes, the least;and (8) Many elementary and middle school classrooms wereovercrowded. Teachers identified the following major obstacles toteaching mathematics and science effectively: student apathy and fearof mathematics; poor stuuent background or skills; absenteeism andstudent mobility; lack of parental support; poor student behavior;lack of adequate time for planning; lack of student interest; largeclass sizes; and limited or no access to technology and currenttextbooks. Appendices include a guide to site visits and datacollection, survey instruments, and focus group questions. (MKR)

"PERMISSION TO REPRODUCE THISMATERIAL HAS BEEN GRANTED BY
TO THE EDUCATIONAL RESOURCESINFORMATION CENTER (ERIC)."
Landscape of
Mathematicsand
ScienceEDUCATIONAL RESOURCES INFORMATION Education
U.S. DEPARTMENT OF EDUCATIONOffice of Educational Research bird Improvement
.0"7......"CENTER IERICI
)This document has been reproduced asreceived from the person or Mani Wienoriginating It
0 Minor changes have been made to omprovereproduction quality
OERI positron or policy in Milwaukeepoonts of yleye necessarilynioS stated on this docu-ment do not necesri represent Oficial
toeo't ee,
04'P4 0446 0°"Sit
...vS4
0
4400.,0 ,7/7.!BEST COPY AVAILABLE 2
DeAnn Huinker
Lynn H. Doyle
Gretchen E. Pearson
Centel for Mathematics andSci2nce Education Research
University ofWisconsin-Milwaukee
LANDSCAPE OFMATHEMATICS
ANDSCIENCE
EDUCATIONIN MILWAUKEE
De Ann Huinker
Lynn H. Doyle
Gretchen E. Pearson
Center for Mathematics and Science Education ResearchUniversity of Wisconsin-MilwaukeeEnderis Hall, Room 265Milwaukee, WI 53201-0413
phone: 414-229-6646fax: 414-229-4855email: [email protected]
A Study of theMilwaukee Public Schools
January 1995
This material is based upon work supported by the National Science Foundation under Grant No.OSR-9350093. Any opinions, findings, and conclusions or recommendations expressed in this materialare those of the authors and do not necessarily reflect the views of the National Science Foundation.
3

CONTENTS
Acknowledgements iii
CHAPTER 1. BACKGROUND 1
NSF Urban Systemic Initiative 1
Milwaukee Public Schools 2
MPS Mathematics and Science Self-Study 4Summary 10
References 10
CHAPTER 2. DESIGN OF THE STUDY 11
Site Visits 11
Surveys 14
Focus Groups 15
Summary 16
CHAPTER 3. INTERVIEW RESULTS 17
Student Group Interviews 17
Teacher Group Interviews 31
Principal Interviews 38
Summary 51
CHAPTER 4. CLASSROOM OBSERVATION RESULTS 53
Elementary School Mathematics 53
Elementary School Science 58
Middle School Mathematics 62
Mid le School Science 66High School Mathematics 70High School Science 74Summary 77
4
CHAPTER 5. SURVEY RESULTS 79
Elementary School 79
Middle School and High School 96
Summary 112
CHAPTER 6. FOCUS GROUP RESULTS 115
Community Focus Groups 115
Parent Focus Group 119
Summary 124
APPENDICES 125
ii
Appendix A. Members of the Working Group 125
Appendix B. Site Visit Guide and Data Collection Instruments 127
Appendix C. Survey Instruments 147
Appendix D. Focus Group Participants 159
Appendix E. Focus Group Question Guides 161
5

ACKNOWLEDGMENTS
To create a landscape painting is an extensive undertaking. This portrait ofmathematics and science education in the Milwaukee Public Schools (MPS) was acollaborative work which required the help of many individuals. Without their timeand effort, the study could never have been accomplished.
Members of the Working Group helped plan, investigate, and dream of what couldexist. (See Appendix A for a listing of the members.) They provided wonderfulinsights and suggestions by breaking from old perspectives and suggesting innovativealternatives. They viewed mathematics and science education in new lights.
Over half of the Working Group gave additional time to collect data during the sitevisits. These included Stephen Adams, Jeffrey Anderson, Pat Barry, Carmen Baxter,Conni Blomberg, Marva Bredendick, Sallie Brown, Dave Caruso, Greg Coffman,David De Bruin, Mike Endress, Liz Freeman, Becky Guerrero, David Guerrero,Karleen Haberichter, Mary Henry, Judy Heine, Pat Kenner, Steve Kreklow, JimKurtz, Darlene Liston, Dan Lotesto, Hazel Luckett, Connie Manke, Ed Mooney,Mary Morris, Nile Mahoney, Vince O'Connor, Cyntha Pattison, Cynthia Pierson,Judith Pokrop, Bill Raw les, Jerry Schnoll, Fred Schroedl, Katrina Simmons, KarenVillwock, Ella Washington, Charles Wickenhauser, Catherine Washabaugh, JimWojtech, and Blaine Wiesniewski.Special thanks to several members, Jeffrey Anderson, Greg Coffman, Jim Wojtech,and Blaine Wiesniewski, who went far beyond by giving additional time to conductsite visits. An extra special thank you goes to Cynthia Pierson who always camethrough during moments of crisis. We also appreciate the efforts of severalindividuals who, although not members of the working group, volunteered theirservices to conduct site visits: Karen Boyle, Norma Cleary, Diane Colby, SoniaDi Salvo, Georgia Mc Guff, Tracy Posnanski, and Irma Villegas.
Preparing for the site visits meant coordination, reorganized schedules, and flexibilityon the part of the site visit schools. Principals, assistant principals, learningcoordinators, and implementors more than met the challenge. Their welcome mats andcoffee were appreciated by all. Interviewed teachers enthusiastically painted picturesof mathematics and science instruction and were gracious, often giving up planning orbreak time. Some of our most poignant observations and comments were from thestudents who eagerly provided their ideas of what instruction is and could be.
Without the input of members of the community and parents, our landscape wouldhave been incomplete. Representatives from business, industry, post-secondaryeducation, community and government agencies, and parents (see Appendix C)provided another outlook. This broad sharIng of views made the self-study truly acollaborative effort between the University of Wisconsin-Milwaukee, the MilwaukeePublic Schools, and the Milwaukee community. The Overall support fromMilwaukee's mayor, John Norquist, and assistance from his staff, particulary JoanneAnton, helped obtain this valuable community component.
The University of Wisconsin-Milwaukee (UWM) helped facilitate this work. Dr. GailSchneider, Interim Dean of the School of Education, communicated full support ofthis effort with encouragement and use of time and facilities. In the UWM Center forMathematics and Science Education Research (CMSER), Dr. Larry Enochs, Director,sowed seeds of innovation through his extensive background and theoretical
iii
6

frameworks; Tracy Posnanski, Assistant to the Director, cultivated those seeds withhis cheerful flexibility especially as deadline pressures increased, and Bill Raw lescompiled data and contributed insightful comments and reflections on the text.
Transcribing and tallying data can be a thankless task, but CMSER staff, Patti Bauer,Kristi Clark, Kelli Clark, Dottie Mehan, Amy Schuster, Shelly Schuster, JulieDietzen, and Tricia Winkler pitched right in.
Finally, a thank you goes to MPS staff, Carol Frankiewicz and Pat Haller, whoprovided the day to day assistance we needed to get the job done, and to CarmenBaxter, Science Curriculum Specialist, who added insights and perspective. VinceO'Connor, Mathematics Curriculum Specialist, and Cynthia Ellwood, Director ofCurriculum and Instruction, were the frame that held our landscape painting in place.Howard Fuller, Superintendent, continually provided the heart and inspiration to seekthe best education for our students.
IV
7
CHAPTER 1
BACKGROUND
Science and math will be used in daily life activities and in knowing the environment.You need science and math in your career for solving problems.
--MPS High School Student
I like my teacher; she makes science fun. She makes me learn 'cause we do hands-onthings and research. It makes me learn.
--MPS Middle School Student
You need mathematics and science for college. That's the best part of school becauseyou can learn a lot, for example, how to clean up the earth.
--MPS Elementary School Student
These quotes from students in the Milwaukee Public Schools (MPS) reflect the seedsof reform that MPS change agents have been nurturing over the last several years. Toprovide a panoramic view of mathematics and science education in MPS, a study wasconducted in 1993-94 with funding from the National Science Foundation's UrbanSystemic Initiative. The landscape was the school district. The artists who created thepainting were MPS students, teachers, and principals, and representatives from thebroader Milwaukee community. This report is the result of that study; it is a landscapeportrait of mathematics and science education in the Milwaukee Public Schools.
NSF URBAN SYSTEMIC INITIATIVE
The Urban Systemic Initiative (USI) is a new venture of the National ScienceFoundation (NSF). Its aim is to enable large cities to make substantial and long-lasting improvements in mathematics and science education for all students. The USIis making awards available to the 25 cities with the largest number of school-agechildren (ages 5-17) living in economic poverty as determined by the 1990 census.Milwaukee is one of those 25 cities.
The cities are challenged to develop plans for systemic reform to improve studentlearning in grades K-12 in mathematics, science, and technology. "Systemic reform ofscience and mathematics education refers to fundamental, comprehensive, andcoordinated changes which will result in improved outcomes for all students as wellas in the development of broad based community partnerships" (NSF, 1993, p. 2).Cooperation among teachers, administrators, families, business and industry,government agencies, and cultural agencies is needed to bring about systemic reform.
Background 1
8
Although the program is aimed at improving mathematics and science education, it isexpected that the reform of these subjects will force comprehensive change across theentire curriculum. The NSF has established goals and expectations consideredessential to systemic programs. The goals of the USI are:
To improve the scientific and mathematical literacy of all students in urbancommunities;To provide the mathematics and science fundamentals which will permit allstudents to participate fully in a technological society; andTo enable a significantly greater number of these students to pursue careers inmathematics, science, engineering, and technology (p. 3).
The expectations of the USI are that each school district present an implementationplan which demonstrates:
A broadly shared community vision for mathematics, science, and technologylearning outcomes that benefits all children;A comprehensive and systematic plan that addresses mathematics, science, andtechnology learning from kindergarten through twelfth grade;A redirectionof school district resources that incorporates the USIimplementation plan within the regular school budget; andA new science and mathematics education paradigm that becomes part of theexisting system rather than an appendage to it and that is institutionalized overthe life of the initiative (p. 3).
MILWAUKEE PUBLIC SCHOOLS
In 1993, MPS served approximately 100 000 students. The student populationconsisted of approximately 75% minority students-50 percent African American, 11percent Hispanic, one percent Native American, 11 percent Asian, 24 percentCaucasian, and one percent other. Sixty-five percent of the students received freelunch and the high school dropout rate was 15.4 percent. The district employed a totalof 9246 full time staff positions of which 6339 were teachers. The district had 155schools in this school year-111 elementary schools, 21 middle schools, 15 highschools, and 8 alternative schools (MPS, 1994a).
The district has pursued an aggressive reform agenda in recent years affecting allaspects of the system includi'ig academic standards, strategies for teaching andlearning, approaches to staff development, assessment, shared decision making, andschool-based management and budgeting. Two critical reform agendas espouse thevision of the school district: the "K-12 Teaching and Learning Goals" and "School-To-Work."
MPS K-12 TEACHING AND LEARNING GOALS
The K-12 Teaching and Learning Goals (see figure 1-1) center on rigorous standardsfor all children (Ellwood, Jasna, & Fuller, 1991). The goals were established in 1991through a process involving over 1000 teachers, principals, parents, business people,community activist, post-secondary representatives, and students. These ten goals aimto offer all children an equitable, multicultural education, and to teach all children tothink deeply, critically, and creatively.
2 Landscape of Mathematics and Science Education in Milwaukee
9

The district is working to meet these goals by rethinking and restructuring thedecision-making processes, the curriculum, the delivery of instruction, and themethods of assessment used in all K-12 classrooms. Iii addition, the goals E.....empt tocapitalize on school-level innovation and mobilize all segments of the broaderMilwaukee community en behalf of children. Administrators, teachers, and staff inthe MPS school district recognize that not everything children learn is learned inschool--experiences at home and in the community make a significant contribution.The teaching and learning goals are based on the philosophy that:
Curriculum is the sum-total of what is taught and learned in schools throughoutthe system;The curriculum must be student-centered;The curriculum must promote equity;The curriculum must promote deep thinking for all students; andCurriculum development must be an ongoing process in which all members ofthe MPS family participate.
Fi ure 1-1 MPS K-12 Teaching and Learning Goals
K-12 Teaching and Learning Goals
1. Students will project anti-racist, anti-biased attitudes through their participation in a multi-lingual, multi-ethnic, culturally diverse curriculum.
2. Students will participate and gain knowledge in all the arts (visual arts, dance, theater, literature,music), developing personal vehicles for self expression reinforced in an integrated curriculum.
3. Students will demonstrate positive attitudes toward life, living, and learning through anunderstanding and respect of self and others.
4. Students will make responsible decisions, solve problems, and think critically.
5. Students will demonstrate responsible citizenship and an understanding of globalinterdependence.
6. Students will use technological resources capably, actively, and responsibly.
7. Students will think logically and abstractly, applying mathematical and scientific principles ofinquiry to solve problems, create new solutions, and communicate new ideas and relationshipsto real world experiences.
8. Students will communicate knowledge, ideas, thoughts, feelings, concepts, opinions, and needseffectively and creatively using varied modes of expression.
9. Students will learn strategies to cope with the challenges of daily living and will establishpractices which promote health, fitness, and safety.
10. Students will set short and long-term goals, will develop an awareness of career opportunities,and will be motivated to actualize their potential.
(Ellwood, Jasna, & Fuller, 1991, p. 4)
SCHOOL TO WORK
In January 1993, Dr. Howard Fuller, Superintendent of the Milwaukee PublicSchools, formed the School to Work Task Force to address national and localconcerns regarding the effectiveness of secondary education in MPS. The chargegiven to the Task Force was to develop recommendations for restructuring schools toimprove student achievement, to link students to the world of work, and to focus thedistrict's efforts to improve education and effective use of resources.
Background
1 0

The School To Work vision has emerged as the guide to a learning process thatcreates a workable and productive relationship among K-12 schools, post-secondaryschools, workplaces, and the community (MPS, 1993a, 1993b, 1994b). The conceptof School To Work "means that educational decisions are guided by a significantexpected final outcome of the whole educational processsuccess in the workplace"(MPS, 1993a, p. 2). The MPS plan aims to prepare all students for post-secondaryeducation, whether they choose it immediately upon graduation or later, and toprepare all students to enter the world of work. A major goal of School To Work is toprovide students with educational experiences in which they learn and apply ideasand concepts in realistic situations that reflect the complexity of real-life problemsolving. Adoption of School To Work in Milwaukee intends to change "the wayschool is done."
A set of principles serve as the guide for developing and implementing the policies,practices, and programs of School To Work (MPS, 1994b, p. 3). Milwaukee's SchoolTo Work principles are:
Prepare all students to successfully pursue post-secondary education andemployment.All levels of educationkindergarten through collegeshould embrace SchoolTo Work in a manner appropriate to the learning level.The educational process should include experiences in the community andworkplace as well as in the classroom.Useful knowledge and skills are best learned in an integrated curriculum inwhich students and teachers work cooperatively.Students learn best when they see what they are learning is connected to whatthey aspire to be in "real life."Gender, race, ethnicity and handicapping conditions should not limit studentcareer options.Goals and valued results should be explicit and reward should follow effort andachievement.Accurate information and careful guidance must be available to parents andstudents so that reasoned, judicious choices can be made.Training in cooperative, integrated education techniques consistent with SchoolTo Work objectives should be ongoing for all instructorsschool based orcommunity /workplace based.Assessment of student performance in the classroom, workplace, or communityshould be broadly based, at all levels, and continuous.
MPS MATHEMATICS AND SCIENCE SELF-STUDY
The Milwaukee Public Schools, in consultation with the University of Wisconsin-Milwaukee (UWM), received a planning grant for the 1993-94 school year from theNational Science Foundation's Urban Systemic Initiative. The planning grant allowedMPS and UWM to join in a collaborative effort to conduct the MPS Mathematics andScience Self-Study. Guided by the K-12 Goals and the School To Work principles,the purpose of the study was to examine the current status of the K-12 mathematicsand science programs throughout the district. The information gained from the studyprovided input into the development of a systemic implementation plan to improvemathematics and science learning for all students.
4 Landscape of Mathematics and Science Education in Milwaukee
11
SYNOPSIS
A core planning team was formed to supervise the study. The Core Planning Teamwas comprised of the co-principal investigators of the study and the districtmathematics and science curriculum specialists. The co-principal investigators for thestudy were Dr. Howard Fuller, Superintendent of the Milwaukee Public Schools, Dr.Cynthia Ellwood, Director of Curriculum and Instruction for the Milwaukee PublicSchools, and Dr. De Ann Huinker, Associate Director of the Center for Mathematicsand Science Education Research at the University of Wisconsin-Milwaukee. Theother members of the Core Planning Team were Mr. Vince O'Connor, the MPSMathematics Curriculum Specialist, and Ms. Carmen Baxter, the MPS ScienceCurriculum Specialist. Two additional members joined the Core Planning Team asthe study progressed, Ms. Gretchen Pearson and Ms. Lynn Doyle, research associatesfrom the Center for Mathematics and Science Education Research at the University ofWisconsin-Milwaukee. Dr. De Ann Huinker and the two research associates served asthe lead researchers for this study.
A working group was formed to give direction and input for the study, to serve as aforum for discussion, to participate in data collection, and to provide guidance in thedevelopment of a plan for systemic reform. The Working Group was comprised of 60representatives from MPS (teachers and administrators), Milwaukee(business/industry, cultural agencies, city and county government, parents), and post-secondary institutions. A listing of the Working Group members is given in AppendixA. The Core Planning Team members were also members of the Working Group.
The Working Group met for several intensive, all day planning sessions incommunity centers including the Italian Community Center, the Zoofaf .onferenceCenter, and the Milwaukee County Museum. Additional meetings were scheduled asneeded to write mathematics and science program standards, plan for site visits,develop data collection instrumentation and guides, synthesize findings, and makerecommendations.
In Fall 1993, the primary task of the Working Group was to build a vision formathematics and science learning in MPS with broad community consensus. Thevision emerged through the development of program standards for mathematics andscience education. In December of 1993 and January of 1994, the Working Groupdeveloped a plan for assessing the current status of mathematics and scienceeducation in MPS. The collection of data was to involve (1) site visits to 40 schools toconduct classroom observations and interviews with students, teachers, andprincipals; (2) surveys of elementary, middle, and high school mathematics andscience, teachers; (3) community and parent focus groups; and (4) collection ofexisting documents. Data collection was conducted during Spring 1994.
A forum was held at the MPS Central Office with several hundred stakeholders in thestudy and interested community members on 7 February 1994. This forum stimulatedexcitement for systemic reform in the broader Milwaukee community and set th tonefor data collection. The key speakers at the forum were Mayor John Norquist,Superintendent Howard Fuller, Dr. Cynthia Ellwood the Director of MPS Curriculumand Instruction, Dr. De Ann Huinker from the University of Wisconsin-Milwaukee,and Dr. Joseph Danek from the National Science Foundation. The forum providedopportunities for the participants to make verbal and/or written suggestions forimproving mathematics and science learning. The initial accomplishments of theWorking Group were also presented, and the plan for data collection was outlined.
Backgrou,4
12
MATHEMATICS AND SCIENCE PROGRAM STANDARDS
Throughout the self-study, the Working Group sought formal and informal input fromcommunity members in social agencies, business, industry, government, andeducation. Combining this input with the MPS K-12 Teaching and Learning Goalsand the Schcol To Work Initiative, the Working Group developed a set ofMathematics and Science Program Standards for MPS. The standards are broadstatements in seven focus areas; (1) Equity and Access, (2) Curriculum, (3)Assessment, (4) Collaboration, (5) Governance, (6) Staffing and Other Resources, and(7) Staff Development.
Equity and Access. Quality educational programs must be made available to allstudents, not just a few. As equity and access are increased, the need for studentsupport systems changes. Measure of school and program success must include afocus on the opportunities which are available, on the degree to which thoseopportunities are being taken, and on the ultimate success of the participants.Disaggregated data are essential to this analysis. The program standards for equityand access are:1. All schools provide varied curricular opportunities that are accessible to all
students.2. All schools provide a support network for each student to achieve the highest
possible success.3. Students take an active part in the decision making process in they schools, both
at the classroom level and school-wide.4. Graduation, promotion, and admission requirements at all levels reflect the
importance of mathematics and science for success in a technological society.5. Students of all gender, ethnic, and socio-economic backgrounds enroll in
advanced mathematics and science courses.6. Students of all gender, ethnic, and socio-economic backgrounds succeed in
advanced mathematics and science courses.
Curriculum. The mathematics and science curricula are under constant review anddevelopment, ensuring that educational opportunities throughout the city are meetingcurrent and future needs at all levels, pre-school through adult. Through integration,relevance, and involvement in heterogeneous grog )s, the mathematics and sciencecurricula must enable students to make a successful school-to-work transition.Curriculum includes all phases of teaching and learning, that is, the content goals,instructional approaches, materials of instruction, grouping strategies, courseofferings, student outcomes, and so on. All curricula must work together to addressdistrict goals as articulated in the K-12 Teaching and Learning document. Theprogram standards for curriculum are:1. All students regularly participate in hands-on investigations, including student
initiated independent research, to develop the knowledge, discipline, and skillsinherent in science and mathematics.
2. Mathematics and science concepts are connected and used throughout the schoolday and across the curriculum.
3. Students of varying abilities work together and have access to the full program.4. Curriculum is connected with students' lives and with what is happening in the
wider world.5. Students communicate mathematical and scientific knowledge, ideas, thoughts,
feelings, concepts, opinions, and needs effectively and creatively using variedmodes of expression.
6 Landscape of Mathematics and Science Education in Milwaukee
13
I
11111111016
6. The science and mathematics curricula provide opportunities for students to usemultiple intelligences (e.g., creative, analytic, kinesthetic, etc.).
7. Students develop logical and abstract thinking by applying mathematical andscientific principles of inquiry to identify alternatives, solve problems, and createnew ideas related to life.
8. The district has in place a statement of goals and benchmarks for student learning(skills, knowledge, abilities, and attitudes) which guides teachers, parents, andadministrators in planning and assessing programs at each level (elementary,middle; and high school).
9. The diStrict has a systematic procedure for the ongoing evaluation and refinementof its curriculum in mathematics and science.
10. The mathematics and science curricula at every level involves students in theactive, appropriate, capable, ethical, and responsible use of technologicalresources.
11. The student's prior knowledge and experiences are built upon in planning andimplementing mathematics and science programs at all levels.
12. The mathematics and science curriculum integrates the development of socialand group interaction skills.
13. Students are recognized and rewarded for accomplishments in mathematics andscience.
Assessment. Assessment plays a dual role in mathematics and science instruction. Onthe one hand, assessment must occur as an ongoing component of instruction toprovide feedback to the students, teachers, and parents, and so, becomes the guide toinstructional planning. On the other hand, assessment must also inform the largercommunity about the success of schools and programs in meeting the needs ofstudents. In that role, assessment can point out needs and serve to stimulate change. Inboth roles, assessment must be consistent with current goals and instructionalpractice. The program standards for assessment are:1. Assessment reflects curriculum goals and instructional practices.2. A variety of assessments is used at the classroom, school, and district levels.3. Assessments measure higher order thinking skills which includes use of
processes, concepts, problem solving, and application.4. Assessment involves the application of mathematics and science tools and
resources.5. Assessment reflects change and growth over time, recognizing the developmental
continuum of the learning process, including social, cognitive, and affectivedomains.
6. Students engage in regular self-assessments which focus on the quality of theeducational program and on the student's own responsibilities for learning.
7. School and program assessments include an array of evidence (demographicdata, scores, surveys, and student work products) which reflect both quality ofopportunities and achievements.
Collaboration. The involvement of the greater community in planning, supporting,and participating in the mathematics and science education process is essential to thesuccess of the community. Family, business and industry, government, education(alternative, higher, technical), cultural agencies (zoo, museum, library) must bejoined in the goals of educating the youth of this community to prepare them for theopportunities and challenges of an increasingly technological society. The programstandards for collaboration are:
Background 7

1. Interactive communication among schools, parents, employers/employees,agencies, and other community resources is easy and reciprocal.
2. There is an effective system in place enabling all schools, industry, culturalagencies, business, and other community resources to connect with each other.
3. Curriculum is developed and evaluated collaboratively with all segments of theCommunity.
4. The Community and schools demonstrate flexibility in dealing with parental,family, school, and work needs.
5. School/community collaborations are based on mutual benefit.6. Faknilies and parents are accepted, accommodated, and respected at school.7. Parents are provided the training and resources to support/reinforce their
children's learning at school and at home.8. Mathematics and science teachers (Kadult) participate in regularly scheduled
discussions which enable multi-level groups to focus on program developmentand perceived needs.
9. The development of new mathematics and science projects is guided byestablished goals and identified needs and is coordinated through a broadly-basedadvisory commission.
10. Staff collaborate to apply for and receive grants associated with mathematics andscience education.
Governance. The policies and procedures of the school district with regard to theongoing development, implementation, and assessment of mathematics and scienceprograms are crucial to the acceptance and success of those programs. Of concern arethe extent to which the mathematics and science leadership includes all segments ofthe community in decision making and the extent to which the district's policies andpractices promote systemic development (broad coordination and collaboration) andavoid fragmentation or unnecessary duplication of effort. The program standards forgovernance are:1. A broadly based advisory group provides stimulus for the development,
implementation, assessment, and dissemination of mathematics and sciencelearning opportunities, KAdult.
2. New initiatives are considered in relation to established goals, current programs,and identified needs.
3. Collective bargaining teams and program planners are engaged in dialogue whichinforms and improves both processes.
4. The budget development process is sensitive to both physical and humanresource needs (e.g., planning time, mandatory staff development, teacherinvolvement in decision making, extended year contracts, student release).
5. School and program assessments include qualitative and quantitative measuresaligned with district goals and meaningful benchmarks.
Staffing and Other Resources. The importance that is placed on an instructionalprogram is reflected in the resources that are devoted to achieving the goals of thatprogram. Resources include staff, materials of instruction, facilities, equipment andsupplies, time, and dollars. Staff includes both regular classroom teachers and avariety of support personnel, both paid and volunteer. Certain intangible elements,such as scheduling practices and accessibility, are also important to this focus as theyimpact the use and effectiveness of staff and other resources. The program standardsfor staffing and other resources are:
8 Landscape of Mathematics and Science Education in Milwaukee

1. Adequate time for planning and collaboration in the teaching of mathematics andscience occurs on an ongoing basis at all levels.
2. Class sizes are limited to provide an effective learning environment.3. Support personnel (implementor, teaching assistants, resource specialists,
mentors, etc.) are available on a regular basis.4. The mathematics and science curricula are designed, planned, and implemented
with an adult-to-child ratio that leads to safe and effective learning environmentsat all levels.
5. Educational staff work together as a professional community to develop andteach an integrated curriculum.
6. Educational staff teaching science and mathematics have adequate experienceand educational background.
7. Up-to-date technological resources are used by students and teachers to enhancelearning in mathematics and science.
8. Technology is used to extend learning opportunities beyond the walls of theclassroom/school (e.g., telecommunication, distance learning).
9. The district is committed to the investigation of new technologies and to theacquisition and use of those technologies to expand opportunities in mathematicsand science.
10. Adequate materials, supplies, and facilities are available at all schools toeffectively support curriculum.
Staff Development. The success of the mathematics and science programs isdependent on the involvement of dedicated, well prepared, and knowledgeable staff,both in the t'- aching ranks and among the many administrative and support staff,including Dc.:.ents and other community volunteers, who play important roles in theteaching and learning process. Mathematics and science are dynamic fields oflearning which require continual renewal on the part of educational staff. Theprogram standards for staff development are:1. All staff members demonstrate the belief that all students can achieve in
mathematics and science at high levels.2. Staff members are enthusiastic toward mathematics and science and model
appropriate problem solving behaviors.3. Educational staff are provided adequate time and support to develop and share
skills, ideas, and strategies in implementing curriculum and assessing programeffectiveness.
4. Collaborative efforts PAgage school and community resources to plan andprovide staff devel ipment (e.g., training, mentoring and modeling, demonstrationprograms).
5. Systematic planning and evaluation ensure that staff development efforts targetidentified needs and are effective in reaching agreed upon goals.
6. All staff participate in ongoing staff development in the areas of mathematics andscience.
7. Teachers participate in ongoing staff development activities to enhance multi-cultural understandings which facilitate work with students, families, colleagues,and community.
8. Educational staff are recognized and rewarded for innovative contributions tomathematics and science education.
Background 918
SUMMARY
The NSF Urban Systemic Initiative supports comprehensive change by makingsubstantial awards directly to school districts which focus on improving mathematicsand science education. To appropriately plan for this initiative, MPS needed a pictureof the current status of its mathematics and science programs. This report summarizesthe processes and results of the MPS Mathematics and Science Self-Study whichprovided that picture.
The first step was to form two groups: the Core Plann..ig Team which supervised thestudy and the Working Group which provided direction, input, and grass rootsassistance. Throughout the study, these groups looked to the reform efforts alreadyunderway in the district, specifically, the MPS K-12 Teaching and Learning Goalsand the School To Work Principles. Both reflect educational ideologies that fostercreativity, critical thinking, and student-centered problem solving throughinvolvement of the entire Milwaukee community. Using ongoing community inputcombined with these current reform efforts, the Working Group developed programstandards in seven focus areas for mathematics and science education. The next stepwas to design the study and instrumentation for data collection.
REFERENCES
Ellwood, C. M., Jasna, R., & Fuller, H. (1991). K-12 teaching and learning: Aworking document. Milwaukee, WI: Milwaukee Public Schools.
Milwaukee Public Schools. (1993a). Learning for life: A report of the School ToWork transition task force. Milwaukee, WI: Milwaukee Public Schools.
Milwaukee Public Schools. (1993b). School To Work implementation plan.Milwaukee, WI: Milwaukee Public Schools.
Milwaukee Public Schools. (1994a). Annual report to the community: The MilwaukeePublic Schools. Milwaukee, WI: Milwaukee Public Schools.
Milwaukee Public Schools. (1994b). Learning for life: A guide for school andcommunity partners about School To Work. Milwaukee, WI: Milwaukee PublicSchools.
National Science Foundation. (1993). Urban systemic initiatives in science,mathematics and technology education: A new paradigm for urban education reform.Arlington, VA: NSF.
10 Landscape of Mathematics and Science Education in Milwaukee
.17

CHAPTER 2
DESIGN OF THE STUDY
The Mathematics and Science Self-Study sought to answer the question, "What are thestrengths and weaknesses of mathematics and science education in the MilwaukeePublic Schools (MPS)?" To create a landscape picture of mathematics and scienceeducation, the research needed to seek patterns of similarities and differences acrossthe entire MPS terrain. To accomplish this, a research design was developed whichincorporated both qualitative and quantitative data. Data collection methods weretriangulated across multiple sites with the input from numerous and varied informants.
The four major components of the research design were (a) interviews, (b) classroomobservations, (c) district-wide surveys of teachers, and (d) community and parentfocus groups. During site visits, students, teachers, and principals told interviewerstheir stories, and observers recorded what was happening in MPS mathematics andscience classrooms. A survey across the entire school district ensured therepresentation of teachers who were not included in the site visits. To broaden theperspective, focus groups were held with community members and parents. Thefollowing is a depiction of each of the research design components.
SITE VISITS
Site visits were conducted at 40 (27 percent) of the 157 MPS schools: 22 elementaryschools, 12 middle schools, and six high schools. Criteria for site selection included;(a) diversity of geographic location, (b) feeder patterns to middle and high schools,(c) diversity of representation according to level and type (specialty and non-specialtyschools), and (d) proximity for site visit scheduling.
Data was collected by site visit teams. Each team was comprised of three individuals,in most cases two educators and one community member. The team members variedfrom site to site. Of the 60 members of the Working Group, approximately 35participated in the site visits. Additional site visitors were selected from within MPSand the community. This varied team composition provided multiple perspectives ofeach site visit and helped build constituencies for future planning and implementationfor systemic change.
To manage the logistics of the visits, a team leader was designated for each team. Sitevisit teams spent one half day at each site collecting data, through observations andinterviews. Teams collected data through the following activities: (a) an interviewwith a group of six teachers, (b) interviews with two groups of students (six studentsper group), (c) an interview with the principal, and (d) observations of six classes,three mathematics and three science. Teams met following each site visit to debrief.This involved checking the accuracy of their data and writing a summary of theircoordinated impression of mathematics and science education in each school.
Data collection instruments were developed by the lead researchers in collaborationwith members of the Working Group. Directions and instruments were compiled intoa Site Visit Guide (see Appendix B). Site visit teams received a two hour training
Design of the Study
1811

session in the use of the instruments and guides through observing video recordingsof classrooms and role playing of interviews. Approximately two-thirds of the sitevisitors had prior experience in classroom observations and/or interviewing.
INTERVIEWS
Interviews were conducted during the site visits to MPS elementary, middle, and highschools. The students and teachers shared their thoughts and ideas with interviewersin a group setting (gene ally three to six individuals per group); the principals relatedtheir thoughts and reactions individually.
Data Sources. Fifty-five groups of students were interviewed for a total of 260students who contributed to the landscape. It was only possible to schedule onestudent group interview in several of the schools. Of these 260 students, 136 werefrom elementary schools, 80 were from middle schools, and 32 students were fromhigh schools. The grade level for 12 students was not recorded. Of the 260 studentsinterviewed, 50 percent were females and 50 percent were males. Fifty-three percentof the students were African American, 30 percent were Caucasian, seven percentwere Hispanic, seven percent were Asian, one percent was Native American, and twopercent were from other ethnic groups.Forty-two groups of teachers were interv'twed. A total of 188 teachers provided theirviews; 91 were elementary school teachers, 63 were middle school teachers, and 34were high school teachers. Twenty-nine percent of the teachers were males and 71percent were females. Seventy percent of the teachers were Caucasian, 21 percentwere African American, five percent were Hispanic, and five percent were from otherethnic groups.
Twenty-six principals enhanced the landscape by providing the administrativeperspective. Sixteen were elementary school principals, six were principals of middleschools, and four were principals of high schools. Thirty-eight percent of theprincipals were male and 62 percent were female. Fifty percent of the principals wereAfrican American, 46 percent were Caucasian, and four percent were Hispanic.
Data Collection and Analysis. The interview guides (see Appendix B, pp. 140-145)consisted predominately of open-ended questions using six a priori categoriesidentified by the Working Group. These were content, instruction, equity, climate,and resources and technology. Interviews were recorded on audiotape. Someinterviewers also took notes which were included as data.
Interviews held with students, teachers, and principals were approximately thirty-fiveto forty-five minutes long. In some sites, either the principal and/or a group ofstudents or teachers was unavailable which accounts for the discrepancy between thenumbers interviewed and the number of sites visited.
Summarizing data from the interviews involved several stages. The audiotapes fromthe interviews were transcribed and/or summarized. Next, several readings of allinterview data were made by the lead researchers. This provided an overview of thesites investigated. Data were then re read and summarized for each question from theinterview guides.
CLASSROOM OBSERVATIONS
Observations of mathematics classes and science classes were conducted during thesite visits to elementary, middle, and high schools. The classroom observationsprovided detail to the evolving sketch of mathematics and science learning in MPS.
12MN&
Landscape of Mathematics and Science Education in Milwaukee
19
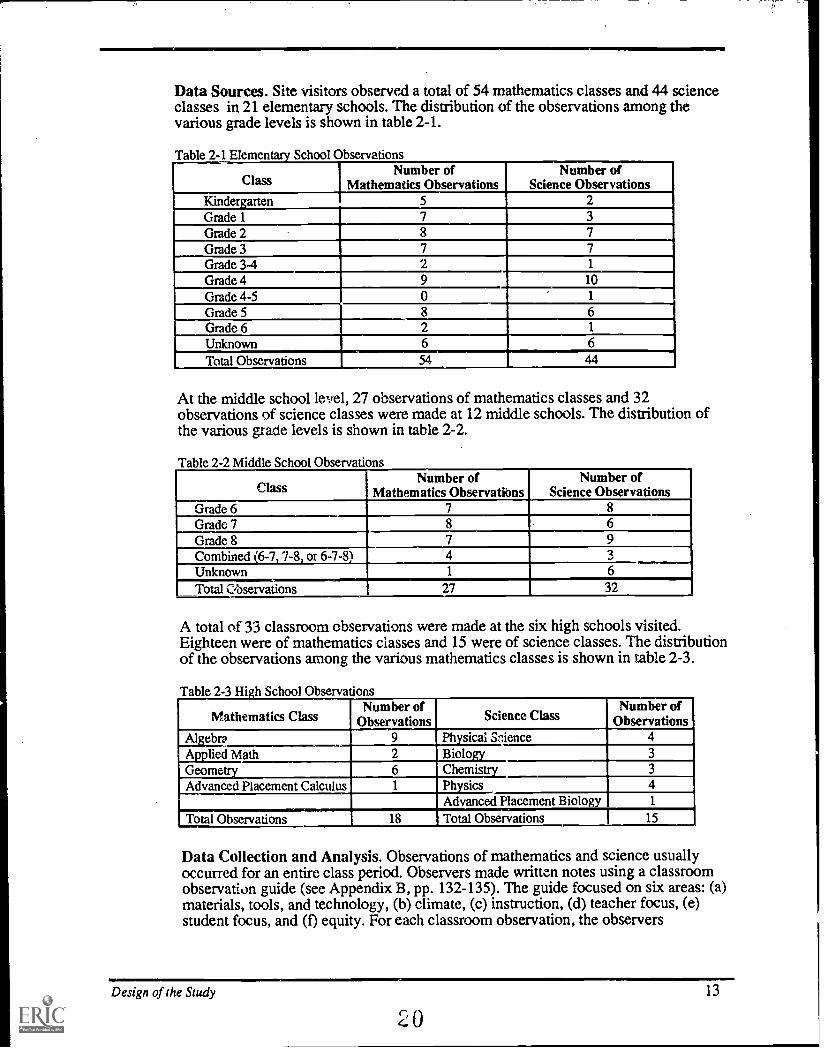
Data Sources. Site visitors observed a total of 54 mathematics classes and 44 scienceclasses in 21 elementary schools. The distribution of the observations among thevarious grade levels is shown in table 2-1.
Table 2-1 Elementary School Observations
ClassNumber of
Mathematics ObservationsNumber of
Science ObservationsKindergartenGrade 1Grade 2Grade 3 7 7Grade 3-4 2 1
Grade 4 9 10
Grade 4 -5 0 1
Unknown 6
Total Observations 54 44
At the middle school level, 27 observations of mathematics classes and 32observations of science classes were made at 12 middle schools. The distribution ofthe various grade levels is shown in table 2-2.
Table 2-2 Middle School Observations
ClassNumber of
Mathematics ObservationsNumber of
Science ObservationsGrade 6 7 8
Grade 7 8 6Grade 8 7 9Combined (6-7, 7-8, or 6-7-8) 4 3Unknown 1 6Total Observations 27 32
A total of 33 classroom observations were made at the six high schools visited.Eighteen were of mathematics classes and 15 were of science classes. The distributionof the observations among the various mathematics classes is shown in table 2-3.
Table 2-3 High School Observations
Mathematics ClassNumber of
Observations Science ClassNumber of
ObservationsAlgebra 9 Physical Snience 4--Applied Math 2 Biology 3
Geometry 6 Chemistry 3
Advanced Placement Calculus 1 Physics 4Advanced Placement Biology`Total Observations
1
Total Observations 18 15
Data Collection and Analysis. Observations of mathematics and science usuallyoccurred for an entire class period. Observers made written notes using a classroomobservation guide (see Appendix B, pp. 132-135). The guide focused on six areas: (a)materials, tools, and technology, (b) climate, (c) instruction, (d) teacher focus, (e)student focus, and (0 equity. For each classroom observation, the observers
Design of the Study
r; fl4 V
13
77;

responded to the questions on the guide and provided additional information throughnarratives and overall impression ratings.
Several readings of the completed observation forms were made by the leadresearchers. The forms were then separated into elementary, middle, and high schoollevels and then further separated by content area. Matrices were used to summarizethe data for each level by subject area and to look for emerging themes.
SURVEYS
The purpose of the surveys was to determine perceptions of elementary, middle, andhigh school teachers across MPS regarding (a) adequacy of factors affectingmathematics and science teaching, such as resources, time, and class size, (b)instructional and assessment practices in mathematics and science, and (c) attitudesregarding teaching mathematics and science.
Teachers surveyed differed across content areas and levels of instruction. Toaccommodate their varied needs, three different survey instruments were utilized: (a)elementary school mathematics and science, (b) middle school and high schoolmathematics, and (c) middle school and high school science. The survey instrumentswere developed by the lead researchers in collaboration with other members of theWorking Group. Copies of the survey instruments are included in Appendix C.
ELEMENTARY SCHOOL
One version of the survey was given to elementary school teachers in MPS. Theelementary school survey included questions regarding the teaching of bothmathematics and science.
Data Sources. The elementary survey was distributed to a random sample of 475elementary teachers in MPS. Of these, 232 teachers (49 percent) returned surveys.Most of the respondents, 85 percent, were female and the other 14 percent were male.Ninety-one percent of the teachers were Caucasian, three percent were African-American, three percent were Hispanic, one percent was Asian, and one percent wasfrom other ethnic groups. The mean number of years of teaching for these elementaryteachers was 14 (SD=10) with a range from 1 to 43 years.
Data Collection and Analysis. MPS was responsible for the distribution and collectionof the elementary survey, including the identification of the random sample of teachers.The surveys were distributed and returned using MPS interdepartmental mail.
The UWM Center for Mathematics and Science Education Research and the UWMSchool of Education Research Department compiled and analyzed the results of theelementary survey. Scaled responses were analyzed using the SPSS softwareprogram. Open-ended responses were coded and summarized according to themes.
MIDDLE SCHOOL AND HIGH SCHOOL
Two versions of the surveys were given to middle and high school teachers in MPS.One survey was given to mathematics teachers and another survey was given toscience teachers.
Data Sources. The middle and high school mathematics survey was distributed to allcertified mathematics teachers which included both middle and high school teachers.The mathematics survey was distributed to 298 teachers of which 124 (42 percent)
14 Landscape of Mathematics and Science Education in Milwaukee
21

were returned. Of those returning the mathematics survey, 82 percent taught. at thehigh school level and 18 percent taught at the middle school level. Fifty-one percentof the mathematics teachers were female and 49 percent were male; 88 percent wereCaucasian, six percent were African-American, two percent were Asian, one percentwas Native American, and four percent were from other ethnic groups. The meannumber of years of teaching for middle and high school mathematics teachers was 17(SD=10) with a raoge from 1 to 40 years.
The middle and high school science survey was distributed to all certified scienceteachers which included both middle and high school teachers. The science surveywas distributed to 194 teachers with 75 (39 percent) being returned. Of thosereturning the science survey, 69 percent taught at the high school level and 31 percenttaught at the middle school level. Thirty-five percent of the science teachers werefemale and 61 percent were male; 90 percent were Caucasian, seven percent wereAfrican-American, and three percent were Asian. The mean number of years ofteaching for middle and high school science teachers was 20 (SD=10) with a rangefrom 1 to 35 years.
Data Collection and Analysis. MPS was responsible for the distribution andcollection of the surveys, as well as the identification of the teachers to be surveyed.The surveys were distributed and returned using MPS interdepartmental mail.
The UWM Center for Mathematics and Science Education Research and the UWMSchool of Education Research Department compiled and analyzed the results of thesurveys. Scaled responses were analyzed using the SPSS software program. Open-ended responses were coded and summarized according to themes.
FOCUS GROUPS
To obtain the Milwaukee community's impressions of mathematics and scienceprograms in MPS and to invite suggestions for improvement, four focus groups wereheld. Three of these were held with a broad representation of community membersand parents and the fourth with MPS parents. A listing of the participants for all fourfocus groups is given in Appendix D.
COMMUNITY FOCUS GROUPS
The three community focus groups were held at a community center in Milwaukee.An experienced consultant was hired to facilitate the discussion of the focus groups.After a brief welcome and introductions, the groups were provided with backgroundinformation including the goals and expectations of the Urban Systemic Initiative, theMPS K-12 Goals, and an overview of School To Work.
Data Sources. Of the 91 people invited, 27 individuals participated in the communityfocus groups. Participants represented business and industry, cultural agencies,parents of MPS children, parent organizations, community organizations, universitiesand colleges, city government, the state department of education, and the statedepartment of natural resources.
Data Collection and Analysis. Participants chose the most convenient time, earlymorning, lunch, or early evening. Each focus group discussion lasted two hours. Thefacilitator provided the focus groups with a purpose and structure which allowed forflexibility in questioning. The same structured questions were used for all of the focusgroups although different paths were taken by each group as the discussionsprogressed. The questions are listed in Appendix E.
Design of the Study
22
15

Sessions were not audio recorded since it was felt this might interfere with thespontaneity and openness of the sessions. Three recorders took extensive field notescontaining numerous quotations and comments made during each of the focus groups.
A meeting was held with the consultant and the lead researchers. The purpose of thismeeting was to summarize observations and provide an overview of themes whichemerged from the focus groups. The field notes taking during the focus groups werethen analyzed for recurring themes and patterns and synthesized for perspectives onthe current situation, key points and examples, and suggestions for improvingmathematics and science education in MPS.
PARENT FOCUS GROUP
A focus group was held with parents of MPS students to concentrate on the importantrole parents play in their children's education. The parent focus group was held at acommunity center in Milwaukee. A consultant was hired to facilitate the parent focusgroup discussion. This consultant was a MPS parent and former teacher withexperience working with MPS families. After a brief welcome and introductions, theparents were provided with background information including the goals andexpectations of the Urban Systemic Initiative.
Data Sources. Of the 42 parents invited, nine parents participated in the parent focusgroup. They represented four high school students, three middle school students, andsix elementary students in MPS. Several parents also had grown children who hadattended MPS.
Data Collection and Analysis. The focus group discussion lasted two hours. Thefacilitator used the questions listed in Appendix E to guide the discussion, butallowed for flexibility in questioning and responding. The session was not audiorecorded since it was felt this might interfere with the spontaneity and openness of thediscussion. The facilitator took field notes throughout the discussion.
The consultant and lead researchers met to debrief after the parent focus group for thepurpose of summarizing observations and emergent themes. The field notes were thenanalyzed for recurring themes and patterns and synthesized for perspectives on thecurrent situation, key points and examples, and suggestions for improvingmathematics and science education in MPS.
SUMMARY
To investigate the strengths and weaknesses of mathematics and science education inthe Milwaukee Public Schools, data was collected through multiple methods andincorporated the perspectives of many. The design consisted of four majorcomponents: (a) interviews with students, teachers, and principals, (b) classroomobservations of mathematics and science, (c) a district-wide survey of teachers, and(d) focus group discussions with community representatives and parents.
Data sources included students, teachers, principals, parents, and a widerepresentation from the Milwaukee community. Data collection was accomplished bymembers of the Working Group and other volunteers. Instrumentation utilized fordata collection was developed by the lead researchers in collaboration with membersof the Working Group. The Center for Mathematics/Science Education Research atthe University of Wisconsin-Milwaukee assisted in collating and analyzing the data.Through thematic data analysis, a panoramic view of mathematics and seenceeducation in the Milwaukee Public Schools was created.
16 Landscape of Mathematics and Science Education in Milwaukee
23

CHAFFER 3
INTERVIEW RESULTS
Some of the richest data for the landscape of mathematics and science education inthe Milwaukee Public Schools (MPS) came from personal interviews with students,teachers, and principals. Together they painted a pizture of mathematics and scienceeducation with each group adding its unique hue and style. When blended, these threeperspectives created an impression of an educational program with not only strengths,but also some need for systemic reform.
The intervi, e conducted during 40 site visits to elementary, middle, and highschools in ne students and teachers told their stories to interviewers in a groupsetting; the principals related their stories individually. Interviews were recorded onaudiotape and later transcribed and/or summarized. Interviewer notes were alsoincluded.
The three sets of interview summariesstudents, teachers, and principalsareorganized around the questions from the interview guides (see Appendix B). Eachquestion is presented with a summary and illustrative examples of comments from thestudents, teachers, and principals.
STUDENT GROUP INTERVIEWS
A total of 55 groups of students were interviewed. Altogether 260 studentscontributed to the landscape; 136 were from elementary schools, 80 from middleschools, and 32 students were from high schools. The grade level for 12 students wasnot recorded. Of the 260 students interviewed, 50 percent were females and 50percent were males. Fifty-three percent of the students were African American, 30percent were Caucasian, seven percent were Hispanic, seven percent were Asian, onepercent were Native American, and two percent were from other ethnic groups.
The interview questions are stated below. Each inter, iew question is followed by asummary and representative student comments. Because the interviews wereconducted in small groups, each bullet is a compilation of comments from severalstudents.
MATH CLASS
I am going to show you something and then I'm going to ask you to tell me whatcame to your mind when you saw that. Ready? (Wait a moment, then show the cardwith "math class" written on it.) What did you think of when I showed you the cardwith math class written on it?
Students frequently gave single word responses. The ,cord heard most frequently was"boring." When students thought of math class, they thought of problems, boardwork, and worksheets. They often listed content areas, such as, addition, subtraction,multiplication, and division. Only a few students said it was interesting or described itas an interesting or exciting challenge.
Interviews
2 4
17

Elementary School CommentsSort of boring, but I still listen because it's educational. Studying. Falling asleep.It comes easily. It is boring, but I want to pass. The teacher explains things fortwenty minutes which is too long. Things should be explain d to those who don'tunderstand, not everyone.Don't like it there are too many hard questions. I hate it. It is confusing whenplus and minus are mixed up. There is not enough time to finish the work.Multiplication and division. My math book. It is fun. It is hard work. Divisionwith the dot. It is interesting. Learning. I think of how to do it.We count, play with shapes and money. We do math on a board, measure shapesand lines. We do times tables and value places.Interviewer notes: The students thought of addition, subtraction, times tables,division, and work in their math books.
Middle School CommentsMath is complicated but it puts my brain to work.Interviewer notes: The students identified mathematical topics: addition,subtraction, geometry, numbers, algebra, rule of numbers, roots, and angles. Somesaid that they loved mathit was their favorite subject; it was challenging, easyto do, and fun to do. Others said it was boring.
High School CommentsBoring. Problems. Math is hard, but it gets easier when we get good instructions.Lots of homework and tests.Interviewer notes: Students thought of numbers, particular teac' ers, and algebra.Some said it was fun because they could talk during class.
SCIENCE CLASS
I am going to show you something else, and then I'm going to again ask you totell me what comes to your mind when you see this word. What did you think ofwhen I showed the card with science class written on it?"Experiments" was the word that was used by most students when asked what theythought of when they saw the words, "science class." The responses for this item weremore positive than those for math in the previous question. They included such wordsas, fun, explosions, learning, and testing things out. Many students wanted to havescience more frequently than they did. Most said they hau science class twice a week;others three times. Rarely did any elementary student report having science moreoften than this.
Elementary School CommentsThe science teacher teaches you about animals, stuff under water, stuffunderground like ants. We color and make wave bottles. We get to see whatdissolves like sugar and hot cocoa. We went in a submarine and had flashlights,and we learned about fish and salt and fresh water. Science class is fun; we draw;we make pictures; we play with ice and water and test it out. We learn aboutbones and what food has too much sugar in it.It is stupid; I don't like it 'cause I can't touch other animals during show and tell.Some of the pages in the textbook are good, and some are bad. I like to learnabout things. I need more time to finish my work.
18 Landscape of Mathematics and Science Education in Milwaukee
25

Interviewer notes: The students mentioned dissecting, projects, a science book,fun, hard work, learning new things, water, how to change dirty water into cleanwater, volcanoes, and animals.Interviewer notes: Students said it was fun. They have experiments, dissect things,work with magnets, explosions, and catching animals. A few said it was boring.Interviewer notes: The children's first response was that they did not havescience, but then they said they did make kool-aid where they used scales, spoons,and cups. They also worked with cartoons.
Middle School CommentsChemicals, hands-on things, research. It makes me learn. I like my teacher; shemakes science fun. I like the summer course at UWM.Interviewer notes: The students named several areas of science including animalstudies, DNA, and astronomy. They felt they were finding out how things work ina lab setting. "In the lab, you work with test tubes and do experiments."
High School CommentsInterviewer notes: The students mentioned dissecting, biology, labs, physicswhich they said this was stupid, and chemistrywhich they said was good.Interviewer notes: The students responded by stating a specific teacher's name, alot of work, study of life, dissection, and the word of the day activity.
IDEAL MATH CLASS
I would like to pretend that you are in control of your math class. You can decidewhat is taught and how it is taught. You are still in the class, but you make theplans for this ideal math class.If students had control of their mathematics classes, they would "play games." But,by this, most did not mean they wanted to simply play in school, but rather, theywanted mathematics presented through stimulating and interesting challenges. Theydescribed how they love math when, on special days, their teachers "play" mathgames with them. Others recalled certain teachers who were their favorites or weregood teachers because they made math fun.
According to these students, teachers should be helping students individually and notdoing whole group instruction. They said that teachers went too fast and just wantedto get "through the material" rather than taking pride in individual student learning.They described ideal classrooms as communities of learners in which studentscollaborated in small groups and did self teaching with the teacher as facilitator.Instruction would be practical and would involve the community of work outside ofthe school through projects and guest speakers.
This question contained a series of five prompts. Students' comments are listed belowfor each of the specific prompts.
If you could describe your ideal math class, what would you be doing?Elementary School Comments
I would play math games. This would make it fun. Students should learn to playthe game. If they are able to dr ten problems right, then they are able to play. Butthey are able to quit when they want.
Interviews
2619

We would be counting candy, and then when we are done and have the answers,we could eat it. We do problems with puzzles and then get candy when we aredone. We also do value places with candy or toys for a reward.Easy math. Give more time, not so many problems, and don't mix plus and takeaway.Sitting down, write down page, and then let them go. Explain for five minutes; geta book that explains what to do.Interviewer notes: Students would be in groups and work on sheets and mathbooks that could be written in. Children could also work on the board.
Middle School CommentsWe would like to play games with math problems. We could do this with music,use a sense of humor, and math jokes. Math should be taught by explaining itslow and take time to go over details.Interviewer notes: In an ideal math class the students noted that the work wouldbe more advanced. More hands on experiences would be included. This wouldalso include more games.
High Scho91 CommentsApply math to every day life. Explain in ways everyone could understand.Students help other students. Take it slower and involve everyone.Students would help other students. If one student gets their work done fast, theywould help slower students. Interacting with other students by working in groups.In physics, kids help each other.Students would work in groups to help other students who need help. Teachmnemonic devices. Do brain teaser problems. Assign no homework.
What would your teacher be doing in your ideal math class?
Elementary School CommentsAsking questions like, "Do you understand, or am I talking too loud?" Teachersshould be helping kids who do not understand.The teachers would sit at their own desk and do something else. Teachers shouldnot interrupt; mostly students are teaching themselves.Showing us how to make hard things like a radio or a building.Teachers should be helping other children.
Middle School CommentsDifferent levels all in one class, also pre-algebra and math. The teacher shouldhelp others. Sitting in with groups.The teacher would get prepared. Replace the text book with teaching her own wayso students could understand and use more hands-on stuff.
High School CommentsTeachers would help students individually and make it fun. They would take thestudents on trips to learn to scale buildings. Make sure everyone participates. Askthem if they need help, make sure everyone knows what they are doing. Agreewith everyone else, make learning fun.
20 Landscape of Mathematics and Science Education in Milwaukee
27

Teachers should give life examples. They should walk around helping, givinghints, supervising. Explain things to students. Teach students to interact with theclass. Breakdown the work and use lots of examples to help with problems.
What would you study or learn about in your ideal math class?
Elementary School CommentsShould study about telling time.No pluses or minuses because they are too easy. Instead do multiplication anddivision.
Middle School CommentsMaking patterns and working with maps.Interviewer notes: Students noted that they would focus on different areas of mathincluding geometry and algebra. Basic aL.,, advanced math would be also studied.
High School CommentsDesigns. How to make scale models of buildings to help in designing airplanes.Basic math along with life math. Work with formulas to be able to use computers.Make it based on real life stuff.Learn more useful math applications and more general life things. Learn someshort cuts. Relate to what people are interested in by using projects and examples.
What kinds of activities would you be doing in your ideal math class?
Elementary SchoolJumping while counting. We could have high school students help us with hardmath problems.Interviewer notes: Students wanted to do times tables and fractions. Also studentswould work on the chalkboard.
Middle School CommentsWe would be doing critical thinking, math games, and stories with prizes.Interviewer notes: Students wanted more field trips so they experience math in thereal world rather than just from a book.
High School CommentsUse visual aids and hands on. Ask kids in the class what interests them. Takestudents on field trips more often, maybe to MSOE. Bring in career speakers. Domore word problems, reports, and use objects. Slow down and use more specificexamples. Do more one on one. Bring people in to talk about careers.We would take trips and see how math is used in different jobs. We could getspeakers about math and math careers.
How does your ideal math class differ from what typically happens in your mathclass?
Elementary School CommentsNow we have to sit quietly and do our math problems. We want to jump andmove around more.
Interviews
2821

Class now has too many problems. Teacher laughs behind students backs, andteachers talk out in the hall and disrupt students.
Middle School CommentsThey could take assignments out of the book, I suppose, but also make up some ofthe problems. Take everything a lot slower. Do not do everything the same. Theyshould change their teaching and relate problems to what you are doing.Classes would not be boring; there would be more advanced classes.
High School CommentsNow they work out of book instead of creating stuff. They just do what they haveto do, but do not explain application. Teachers in trig help everybody. Teachersdo not know how to take pride in students' progress. Teachers should combineand review work.My teacher does not ask questions. Groups are too crowded. Groups do not workat times because friends just want to visit. Teachers just talk; they should slowdown. Some teachers are just interested in wanting to get through the material.Students need time to learn it. Teachers need to walk around and help. Someteachers get off the subject. More field trips.
IDEAL SCIENCE CLASS
This time I would like you to pretend that you are in control of you science class.You can decide what is taught and how it is taught. You are still in the class, butyou make the plans for this ideal science class.As with the question regarding ideal mathematics classes, students want to do hands-on learning in science. They want to learn through practical experience especiallythrough experimentation. If given control of their classes they would set upexperiments and take field trips. These were not elaborate field trips involving longbus rides, but rather could simply involve going outside more or taking walks toexamine what was around the school.Elementary students want science taught more frequently. Most students could notspecify when or how often they had science adding that they just did it when therewas extra time. A few said that was once a week; most said it was two or three timesper week. Students were more specific if there was a science teacher in their school.However, in those cases, science instruction fell to the science teacher with littleincorporation by the classroom teacher according to the students interviewed. Again,students said that teachers should present material more slowly making sure that eachstudent is able to learn.
This question contained a series of five prompts. Students' comments are listed belowfor each of the specific prompts.
If you could describe your ideal science class, what would you be doing?
Elementary School CommentsTo make the class more interesting, it should be taught in a way that makes it funfor the students. There are too many kids in the classroom.Experience. Lots of experiments.I like experiments like making a volcano, cleaning water, using dirt, beakers, foodcoloring cups, pie tin, baking soda.
22 Landscape of Mathematics and Science Education in Milwaukee
2J

We'd make all kinds of new things like cut out your body. While we were sittingdown and working we might get a sticker. We'd make books, color, make ajournal, or write about insects, water, and stuff.We would make mummies and do something else besides teeth. Our teacherwouldn't treat us like we were in kindergarten.We would work with animals like frogs. We would work with clay to makehouses.
Middle School CommentsI'd like to do more experiments, work with the microscopes, and dissect animals.Learning from the book is boring, and there should be no science labs. Theclassroom is the science room.Interviewer notes: Students feel that participating in more field trips is important.Also, hands on activities would be included.
High School CommentsMore labs should be included, for instance, one a week. Notes taken during classshould be cut down. Relating what we learn in class to how we're going to use iton the job would be helpful. Physics should have more labs, and there should Leoral practical labs.There should be hands-on experiments, more dissections, more discussion, andnot so many things going on at once. Do more experiments and show how theyrelate to real life. More experiments to see how chemistry works. Also, thereshould be lab projects, more field trips, and more hands on stuff.
What would your teacher be doing in your ideal science class?
Elementary School CommentsOur teacher could get books about experiments, and we could pick out which oneswe wanted to do. Teachers would help with research and get the materialsorganized so the students can work.The teacher would help students with their work.The teachers would help with projects and give instructions. They would give outchemicals for experiments and tell us what to mix together.
Middle School CommentsMy teacher wouldn't change anything about what she was doing.The teachers would help with projects and give instructions. They would give outchemicals for experiments and tell us what to mix together.Interviewer notes: The students wanted the teachers to teach more math andscience because those were their favorite subjects. Students liked attending fairs,buying their own supplies, and picking topics they wanted to learn about.
High School CommentsThe teacher would help the kids understand, make sure they do things right, showexamples, and do the experiments themselves before the students do them.The teacher would not talk about his/her family. He/she would bring theequipment in, help students learn, and also be safe.The teacher would be active in the classroom by directing students, working withstudents, and participating with the students.
Interviews 23
30

What would you study or learn about in your ideal science class?
Elementary School CommentsWe would learn about spiders and mummies.We would learn about sounds.We would learn about the weather and electronics.
Middle School CommentsWe would learn about space, animals, elements, and matter.We'd learn about lots of different things like, how machines work, how remotecontrols work, how light comes from a switch, and how a T.V. gets its signalwithout an antenna.
High School CommentsWe would study about the earth and the environment. We would learn more abouthow chemistry and physics affects our life, the sky, and more about the thingsaround us and how they affect us.We should have more chemical experiences, more hands on experience, likebuilding and launching rockets, and more dissecting, and looking into real life.
What kinds of activities would you be doing your ideal science class?
Elementary School CommentsWe would use computers, VCR's, do things with live animals, play games thatyou would learn a lot from, and have a science show with projects.We would do hands on activities.
Middle School CommentsWe would do experiments and dissect animals.
High School Comments
We would do experiments with objects from every day. More labs and morescience field trips should be done.DNA experiments should be conducted, and more dissections.
How does your ideal science class differ from what typically happens in yourscience class?
Elementary School CommentsNow we use worksheets. We don't do many experiments. We would like to domore experiments. All we do in science is activities with cards and work out ofthe science book.
Interviewer notes: Students were confused about what would be different.
Middle School CommentsOur teacher would be more active in the classroom instead of just sitting.We always have to take notes and watch stupid movies. We read the chapter andthen answer questions. The experiments that are done are kindergarten ones.
24 Landscape of Mathematics and Science Education in Milwaukee
31.

Interviewer notes: Students wanted to participate more in the planning of whatthey study. Also, more hands on activities would be included.
High School CommentsNow teachers are the ones who mostly talk; they should ask for more opinionsfrom the students.We do not interact; we just learn the formulas and subjects.There should be more field trips; we haven't had one in four years.
INDIVIDUAL WORK OR GROUP WORK
In math or science class, if you could choose, would you rather work in groups oralone? Why?
Although more students preferred to work in groups, there were a large number whowanted to work individually. Most often the students who preferred workingindividually were those students who were achieving. One middle school group inparticular felt that they were being held back by having to work collaboratively andhaving to help other students.
Elementary School CommentsGroups, because groups go faster and you can get help and give help to others.It 41 depends on the subject, for instance, science should be worked on alonewhile math should be worked on in groups. Sometimes cheating occurs in groups&o then people should work in pairs, not big groups.I like working with a group and by myself. Because you want to work with allyour friends, when you work with all your friends it's easier because they canhelp you. You also have more people and they can help you understand.Other people disturb me. I can't get my work done because other people ask methings. Other kids can confuse you. Some kids mess up and also talk so then theirgroup doesn't get a sticker. But, in groups there will be somebody to help you andhelp you get all the answers where you might not have working alone.Interviewer notes: Students liked working in groups and alone. The studentsresponded that they get help in groups but working alone makes it easier toconcentrate and it is also quieter.
Middle School CommentsWorking in groups is more fun and you can learn from others. You can also getmore done, share, learn faster, learn to work together, and get everyone's opinion.The only bad thing about working in groups is that sometimes people get off thesubject. That's why groups should be limited to two or three people.Interviewer notes: Most of the students like working in groups to share their ideas.They like working alone when students in their group did not share the work.
High School CommentsThere are advantages to both. Working alone is less disruptive, but group work ismore supportive.Math should be done alone to enable students to solve the problems bythemselves. Science is a more interactive subject and should be done in groups. Itmakes science easier to understand.
Interviews 25
32

WHY STUDY MATH AND SCIENCE
A lot of kids wonder why they have to study math and science in school. How will ithelp you with anything outside of school? Can you give me some examples?Students saw the practical need for mathematics instruction primarily for daily lifeskills rather than job skills. For example, most students thought mathematics wouldhelp them count their money, cash payroll checks, and write checks to buy things.
Overall, students had more difficulty expressing the value of science education.Almost all responses reflected a use in the future; students did not relate theirmathematics and science education to their current lives.
Elementary School CommentsYou need these subjects for college. That's the best part of school because youcan learn a lot, for example, how to clean up the earth. If you grow up and havechildren you want to be able to help them with their science and math.You need science and math to get a good education. You also need them to learnhow to use money, dividing things, dividing dirt, raking your yard, making agarden for seeds, figuring out how fast you go when you rake your yard, or howto count money so people don't rip you off.Almost every day in your life you need to use math somehow. For instance,getting a discount in the shopping mall. I want to be a marine biologist so I needscience. On the other hand, a lawyer would need math for his profession.It will help in college. You will be able to answer your own kids questions.Interviewer notes: Some children said they did use math when using money. Theyfelt that science was not needed. Overall, they had mixed responses.
Middle School CommentsYou need to know math in order to "get big money." You have to use basic mathin order to "get a job." You don't really need science as much as you need math.Different people need different things.Interviewer notes: The students felt math and science were important in getting ajob. They gave the following examples of how math is used: purchasing ofitemsknowing whether or not you get the correct change, and working in a shoestoreknowing how to arrange boxes.
High School CommentsScience and math will be used in daily life activities and in knowing theenvironment. Science and math will be used in your college career and for solvingproblems, using formulas, and converting temperatures. You can use science andmath to help your own children learn when you have a family.Math will help you get a better job, and after you have the job it will help youhandle the money you receive. Science can also help you get a better job. Sciencehelps in living your life: like just understanding weather changes.
MATERIALS, TOOLS, AND TECHNOLOGY
What kinds of special things-things like materials, tools, toys, equipment, andmachines-do you use in your math and science classes?Do you ever use calculators or computers in math or science class? How often doyou get to use them? or Would you like to use them? Why? What types of things do(would) you use them for?
26 Landscape of Mathematics and Science Education in Milwaukee
33
The most frequently used classroom materials and equipment are paper, pencils,chalkboards, and overhead projeck...s. When students elaborated on special equipmentused, it usually related to special projects they had done especially in science classes.This use of special equipment more often appeared to be the exception rather than therule.
When asked specifically about calculators, elementary student informants painted apicture of classrooms where calculators are used for specific unit instruction ratherthan daily use. On the other hand, high school students used calculators on a dailybasis. Use of computers varied on a school by school basis depending a great deal onthe resources of the school. Computer usage in elementary schools was higher inclassrooms which had multiple computers. Students tended to describe use ofcomputers as an isolated activity most often associated with computer labs rather thanintegrated into overall classroom learning.
Elementary School CommentsSometimes calculators are used, but not science equipment.In science class we use blocks, beakers, measuring cups, plastic cups, paper cups,water, cubes, rulers, papers, pencils, chalkboards, calculators, and computers. Wevery seldom use calculators to check answers, maybe about three times a year. Weuse the computer for circus math.In science and math we use computers and calculators, we also used sheets ofpaper and rocks. Some teachers would be upset if we used calculators.
Middle School CommentsInterviewer notes: The students reported using a variety of materials, such ascolored counters, straws, calculators, and computers. The students felt that theyused calculators about the right amount of time.Interviewer notes: The students reported using compasses, protractors, algebra labgear, geoboards, and calculators. Students said that there are no computers in theclassrooms, but that there is a computer room for course study only, computersare not used in math and science class. Science classes use more equipment thanmath. There are no animals in the lab except fish.
High School CommentsMore science equipment should be brought in.Interviewer notes: Students did report using computers to study math and science.Some students stated, "Everyone is required to have a scientific calculator inAlgebra; the students are not allowed to share." Students also reported usingtelescopes and other science equipment.
WHO IS GOOD IN MATH
Think of someone in you class who is good in math. Why did you pick that person?Students perceive someone who is good in math as one who gets good grades, doestheir homework, and works hard. Good students are often quick. Few studentsexpanded their responses beyond traditional measures of academic achievement.Several high school students saw the good student as one who solved problems andwas more of a critical thinker.
Elementary School CommentsI'm good at math because we took a math test and I got a 100 percent. Johnbecause he knows all the answers and he has all stars. Our teachers because they
.11111111
Interviews
34
27

finished school. Mary knows how to read a lot of big words, and she knows mathand blurts out answers.
They know how to do division, do problems right the first time, and do timestables quickly.
Because he is my best friend. When he helps me with my math, I get an A. She'sfast and gets the right answers. He helps me to learn. He does his work real fast.A person good in math works fast, knows all the answers, and gets good scores onpapers.
Middle School CommentsInterviewer notes: The students responded that individuals who are selected forspecial activities are good in math. They also felt that students that get the rightanswers and can do it quickly are good in math.
Interviewer notes: The students responded that students good in math "back up"their answers, always give the right answers, ask questions to make sure theyknow the answers, are enthusiastic about participating, and always do theirhomework.
High School CommentsThe good math student participates in class. They set goals for themselves..Interviewer notes: The students responded that good students have a goodunderstanding of math, never give up on a problem, think logically, work harder,and work things out. The good student is also more helpful than the teacher,always answers the teacher's questions, catches on quickly, helps others, andsolves brain teasers.
WHO IS GOOD IN SCIENCE
Think of someone in your class who is 'good' in science. Why didyou pick thatperson?Student responses for being good in science were similar to the responses for beinggood in mathematics. Students perceived someone who is good in science as one whogets good grades and works hard, as well as understands, remembers everything, andis able to help other students.
Elementary School CommentsThe good student listens and understands, is fast and right, can be fast and wrong,and gets work done.
A good student works quickly.She learns a lot of stuff. He is good in science because he can make a volcano. Hehelps me finish earlier.She is good because she gets a reward or treat. He is good because he does hiswork. There are a lot of kids in my class that are good at Science because they sitdown, be quiet, and raise their hand politely.
Middle School CommentsA good student works out experiments and works to get answers or conclusions.They are good at figuring out questions. They are leaders and they enjoy scienceand like to figure out answers.
Interviewer notes: Many of the students identified students as good in sciencebecause they could help others when they have problems.
28 Landscape of Mathematics and Science Education in Milwaukee

High School CommentsHe is a good student because he knows and understands. People who keep up orfinish quickly are good at science. Good students are intelligent, make it morefun, remember everything, know more than other people, will major in science,and don't mess around a lot.The good student works on their own and puts in extra effort. They do outsidereadings.
WHO HELPS YOU
Sometimes people find math or science difficult. Tell us what you do when math orscience is hard for you. Does anyone at home ever help you with your math orscience work?When students have difficulty with their mathematics or science work, they mostfrequently turn to a family member for help. Students said their mothers and oldersiblings help them; fathers were rarely mentioned. The students also ask friends, butwith less frequency. Although several students stressed the need for students to not beafraid to ask questions of their teachers, one group of middle school age students saidit is difficult to get help from teachers because of limited time. Often, students whoare bussed arrive too late in the morning for help, and, according to these students,their teachers were unavailable at lunch and left immediately at the end of the schoolday.
Elementary Schools CommentsMy brotiter helps me. My older cousin because she gives me all the answers. Mysister and my mom help me. Our niece helps.My mom, brother, and friends help me.You can't be afraid to ask questions to say "I don't get it." My sister and my momhelp me.
Middle Schools CommentsInterviewer notes: The students stated that they ask for help at school becausethey don't get help at homethe parents have not used the skills and don'tremember how to do the work.Interviewer notes: Some students ask an older sister or other family member tohelp them. Some students look in the book for a related problem to help themfigure out the problem they are working on. One student's father helps when heknows the answer.
High School CommentsI ask the person next to me in class for help. Ask a family member at home forhelp. Ask the teacher questions in class or stay after class for extra help. Ask afriend.Interviewer notes: Some students suggested that when problems are hard studentsshould brainstorm and consider all the options. Another student commented, thatif he/she finds something interesting he/she tries to persevere and figure it out, if itis not interesting they "just forget it."
Interviews 29
36

TEACHERS' ATTITUDES
Do you think your teachers like math or science? How can you tell?
A great deal of variability occurred in the students' responses to this question. By andlarge, students felt their teachers liked mathematics and science because they hadenthusiasm and wanted students to learn. But, these students also perceived that theirteachers like mathematics better than science. They based this on the fact that theirteachers teach mathematics every day, whereas science is taught infrequently.
Elementary School CommentsYes I think my teachers like math and science. The teachers talk to each other anddo things before the students come to class. The teachers learned it and now theywant to teach it to us. The teachers smile a lot.The teachers help students with assignments. They must enjoy it because theyteach math everyday.No. My teacher is mean. The teachers want students to get answers wrong. Theteacher doesn't know math herself, she has to look in the book for answers.Yes, the teachers enjoy math and science as much as we do. Bob likes science andimportant history facts. The teachers make learning games. The teachers may likemath and science, but hate when they have to keep explaining things. Teaching toBob is like a big game, nice and funny, but we are still learning.Yes the teachers like math and science because they make it fun.
Middle School CommentsInterviewer notes: The students felt the teachers liked math because they teachthat subject.Interviewer notes: The students thought the teachers liked what they teachbecause they were eager for the students to learn it and they work hard to help thestudents understand.
High School CommentsMy math teacher likes math, but my science teacher is burnt out so he/she doesn'tlike it. It is necessary to like the subject you teach in order to teach it. All myteachers like it. My teachers like it because they chose that profession. They like itbecause they spend all their spare time talking about it and learning more aboutscience. It would be hard to teach if you didn't like it.The teachers like teaching. You can tell 'cause they have enthusiasm and arehelpful and interested in students. They are like your friend or your "dad inschool."
OTHER STUDENT COMMENTS
Is there anything the you'd like to tell us about your math or science classes?
Elementary School CommentsIf we didn't have math and science, our principal would feel sad and unhappy thatkids couldn't learn math and science. The school would have to get tore down.Teachers should be nice! We should have science every day. I like to learn abouteverything. Studying dinosaurs is fun.
Middle School CommentsMy teacher always has a smile on her face.
30 Landscape of Mathematics and Science Education in Milwaukee
37

We wish we had equipment so our teachers didn't have to skip chapters becausethey don't have microscopes.Our teacher lets us do experiments instead of using books all the time.Math and science can be boring if the teachers just give the students worksheetsor if it is not challenging.My teacher was a college professor and has -11 of these degrees. He says class isso rowdy, but he sticks with it anyway.
High School CommentsThe classes should be smaller so that there would be more individual help. I thinkthey should only have 15 to 20 students in our classes.I really enjoy my classes. My teachers are always willing to help. The classdepends on how interesting the teacher makes it.
STUDENT QUESTIONS
Is there anything you would like to ask us?
Elementary School QuestionsWhy did you come here?Do you have any children? They might make friends with us some day.What are you going to do with the tape?
High School QuestionsWhat kind of math and science did you have? Did they have the books? What isthis grant you're working on all about? Where would the money go?
TEACHER GROUP INTERVIEWS
GOALS
Forty-two groups of teachers were interviewed for a total of 188 teachers. Ninety-onewere elementary school teachers, 63 were middle school teachers, and 34 were highschool teachers. Twenty-nine percent of the teachers were males and 71 percent werefemales. Seventy percent of the teachers were Caucasian, 21 percent were AfricanAmerican, five percent were Hispanic, and five percent were from other ethnicgroups.
The interview questions are stated below. Each interview question is followed by asummary and an illustrative list of teacher comments. Because the interviews wereconducted in small groups, each bullet is a compilation of comments from severalteachers.
Let's begin by talking about your goals for teaching mathematics or science. I'dlike a few of you to talk about one or two of your goals, and then have the rest ofyou comment on how your goals are similar or different or describe additionalgoals.
The comments of teachers indicated that they strove toward goals for more practical,hands-on instruction in classrooms. They wanted to teach mathematics and scienceusing a problem solving approach which was more applicable to everyday life.
Interviews
38
31

Although several teachers viewed their goals as transmission of curriculum content,most strove for broader goals of critical thinking and problem solving for students.Computer literacy was also mentioned frequently.
Our philosophy is to stress the science and math specialty of the school. But theDistrict places emphasis on reading and writing and computation and mathnotproblem solving, so the message to teachers is science isn't as important. Theschool district stresses tracking and rote memorization. The kids need problemsolving. We need to teach how to get the information.
To increase the interest level of kids by making them aware that math and scienceare a part of their everyday life.
Our goals for math include: counting, shapes, adding, subtracting, fractions, sizes,patterning, and money. For science our goals include: bodies, animals, foodgroups, and the environment.My goal is to get the youngsters to handle math and problem solving situationswhen they have a problem, knowing how they can go about attacking it.
Our goal is problem solving and meeting the five Chapter I areas. This involvesproblem solving where the children can explain what they do when they solve aproblem and are able to use different strategies. In that same line, I decided Iwanted to focus in on relationships to involve critical thinking and problemsolving skills. For the fourth grade, team problem solving is also our goal.
To become more comfortable with computers and prepared for high school. Wewant students to see the connection between math, science, and the real-world.
To get computers in the classroom, implement more science programs and sciencethemes such as nutrition, college, and the environment.
NEEDED RESOURCES
What do you feel is the most important resource needed to truly make a positivechange in your mathematics or science program?Time and materials are what the teachers cited most often. Time is particularly needed
for planning and staff development. Teachers feel they need more manipulative typematerials especially for science. They would like science rooms, equipment,computers, and materials. They also felt that they need more support, such as, fromadministrators and staff development programs. This was most evident when teachersdiscussed integrating their curriculum.
We need inservice within schools and money for subs so that staff developmentcould occur at the school site during the day.The most important resources needed are more hands-on experiences and morescience manipulatives. Science is not integrated into the curriculum well enough.We need inservice time.We had a lot of hf;-4 from the Central office and we no longer have that. There isnot that help of a supervisor. You have to figure out your own methods. I finallyfigured out that ev:Ty method is good. They are all wonderful. Different childrencan learn under different methods. The problem is that I cannot separate thechildren. Sometimes manipulatives are mixed together in the classroom.
We don't have a science room. We don't have very much science equipment and
computers. Over the years, I have seen a decline in the use of materials. We don'thave that kind of money.Sufficient manipulatives for each child to have their hands on something. I thinkwe need a sufficient amount of manipulatives.
32 Landscape of Mathematics and Science Education in Milwaukee
39
We need more "things" and more places in which to store them. We also needproper space in which to use them. We should have one science kit set for eachschool.Materials now are shared and not easily used. In order to make a lot of thismeaningful and time this all correctly, we may be correlating this with a languagearts units. All of a sudden you realize all your needed materials will beunavailable. Trying to do a holistic integrated approach complicates this evenmore.With poor materials, we then digress to the old books.
BARRIERS TO EFFECTIVE INSTRUCTION
A lot of things can get in the way of effective mathematics and science instruction.What are the biggest barriers to effective mathematics and science instruction?What factors or conditions make it possible or difficult for each of you regularlyengage your students in hand:-on investigations or in small group work?Teachers found an insufficient amount of time was their greatest barrier to effectivemathematics and science instruction. They wanted more time for planning, teaching,integrating, collaborating with other teachers, and for their own professionaldevelopment. A lack of adequate materials was also a serious barrier to effectiveinstruction. Teachers feel there should be enough materials for each student to handletheir own manipulatives during classes. Other barriers discussed included teacherattitudes, lack of familiarity with content, assessment, parent apathy, and large classsize. Teachers said that many of them and their colleagues needed to be open tochange and less apprehensive regarding hands-on instructional methods. They neededto know their content better and present it in a more practical manner. It was alsomentioned that parents needed to be more involved and needed to understand that use
_ of methods which stress problem solving are more accurately measured throughperformance and authentic assessment methods.
We need materials, planning time, equipment, and training time. The self esteemand interest of the kids is there; it's just that extra effort of both the teachers andthe students is needed to get a unit completed. This is both time consuming andfrustrating.Barriers to effective instruction are poor materials and lack of planning time.Class sizes are too large, and we have no teacher aides.Emphasis is placed on standardized tests over performance tests. Teachers arereluctant and apprehensive of hands-on methodswe need more staffdevelopment. Some teachers have a lack of familiarity with content.Performance is not accurately measured. Social expectations differ from currentreality, especially as perpetuated by decision and policy makers.Parents' negative attitudes is a barrier, for example on conference day when theparents say "I was never good at Math."This school is very large yet there are far too many kids. They are packed to thegills. It was built for 500 kids and they have more than 800.
Interviews
4033

TECHNOLOGY
What are the strengths or needs of your school related to the use of technology forteaching mathematics or science?Comments covered a vast range. Some teachers were quite satisfied with thetechnological equipment in their schools. Others felt they had sufficient calculators,but needed more computers and advanced technology, while others felt they wereinadequately supplied in all areas. Teachers, particularly resource teachers, mentionedthe need to improve their own skills in using technology.
We have a computer lab. There is a good mix of reading and science programsnot just word processing. We do integrate technology, but we could be doingmore.There is literally no technology here; we have very limited computers, both innumbers and usage.We have lots of computers and manipulatives. We need money for the newesttechnological advances, packages, and so on.In the sixth and seventh grades, it is set up that every kid has a calculator. In thefirst grade, they have them, but they have to share. The eighth graders have nicegraphics calculators.In the eighth grade, teachers are comfortable using calculators, but the other ones(K-7) aren't used to it yet. We want to make sure the kids get the basic idea ofmath and use the calculators for the problem solving.We have lots of calculators. Interactive videodisc players were just shipped in lastweek. One of the drawbacks I find is that they have to be used by someone who isactively into teaching science, but with our new curriculum and lack of space andtime, they may never be used adequately.We have a limited number of computers, opportunities to explore other materials,and to share with other teachers.There is a computer program and we have calculators, but we need many morecomputers and labs.
ASSESSMENT STRATEGIES
Let's talk about monitoring students' progress and understanding in mathematicsand science. What kinds of assessment strategies do you use in your classrooms?The most frequently mentioned innovative assessment procedure was portfolios.Teachers ranged in their feeling about portfolio assessment from feeling verycomfortable to apprehensive. Although use of portfolios was more common in otherareas of the curriculum, their use in mathematics and science assessment appeared tobe increasing. In many situations, portfolios were being ini.Lited and used incombination with other assessment measures, many of which continued to be moretraditionally based, such as tests and checklists. Observation was also seen as avaluable assessment strategy.
We use a combination of grades, observation, and are beginning to use portfolios.We are already beginning to use video portfolios.We use some testing, observations, projects, reports, and portfolios.The assessment strategies we use are individual observation, science and mathjournals, and we are learning how to do portfolios.
34 Landscape of Mathematics and Science Education in Milwaukee
41
Our assessment strategies include checklists, observation, and oral and writtenwork.We use more performance assessment level now, with math particularly. I don'tthink that testing is necessary at the first grade level. We see if students can makethe generalizations that they have discovered. It's more performance oriented.Teachers make up the tests on their own. It's not coming from the book anymore.Well, I use a math journal, students record different thingsin there. I use aportfolio in writing and reading, but not in science. I think some teachers do, andthey look at them every six weeks.We use portfolios as part of Chapter 1. I do them with another teacher who getsinvolved with performance assessments. I don't even have a grade book; I pull theportfolios to justify my collaboration on the grading.We have assessments on the computers of math and science concepts. My mathevaluation is all done on performance assessments, a lot of them being pictorialthings put into portfolios. In math problem solving, they must show the five stepsand explain them. My assessments are mostly written with some boardperformance and spot checks.
PERFORMANCE GAP
Why do you think there is a performance gap between White students andminorities in mathematics and science?According to most of the teachers interviewed, low socioeconomic status was cited asthe primary reason for the performance gap between White and Black students.Teachers mentioned that students from low socioeconomic environments do not havethe exposure and educational opportunities that higher socioeconomic level studentsdo. It was also noted that parents are sometimes unable or do not understand the needfor early educational experiences for their children. Several teachers also mentioneddiscrimination in assessment, different learning styles, poor teacher-studentcommunication, and low expectations as possible causes for this achievement gapalong racial lines, but low socioeconomic status was the strongest perceptionidentified by these teachers.
Exposure. All parents don't take their kids places. Most Black parents don't taketheir kids exploring things on weekends. They just don't do it, maybe they don'thave the money to do it. I'm amazed what students have never been exposed to.I think it's the status of poverty of the children rather than if they are Black orWhite. Parents don't know what they should be doing for their children beforethey get to school. Statisticians have found that more children are raised fromsingle families. Being if they are White, Jewish, or Black, they just don't have themoney. What single parent would have the money to take their child out? Theydon't even go out to their yard and discover what is out there. They would ratherwatch T.V. There is no conversation going on, especially with the young parents.Even if we sent home materials for them to work with, they don't know how touse them. I often ask myself, "What kind of homes do these children go hometo?"Socio-eeonomics. It relates to the education level of mothers.For all minority students, we must change assessment strategies to better assessstudents in ways they are able to relate.The ITBS is 15 years old. There is discrimination in standardized testing.
Interviews 35
42
Black students learn differently. They learn by doing; they're more mobile andphysical.Students are influenced by their home, uneducated parents, low socio-economicbackgrounds, and lack of teacher-student communication. Teachers need moremulticultural education.Minority kids don't see what their life in school has to do with real life. The"cultural expectations" support minority kids not attempting to succeed.
STAFF DEVELOPMENT
What, if anything, could be done differently with respect to your staff developmentthat could improve your ability to implement your mathematics and scienceprograms more effectively?The MPS teachers interviewed said they want more staff development specifically inhands-on instruction for using manipulatives in problem solving. Several complainedthat, although the amount of staff development has been adequate, the quality andappropriateness was not. They said they were often required to attend programs whichwere not matched to their needs. They do not want lectures, but practical instructionthat will enable them to use these methods effectively in their classrooms. Theteachers also expressed a need for further professional development in computerskills. Some admitted that they do not use computers or calculators in their teachingbecause they do not understand them well-enough themselves.
Need to address teacher reluctance and apprehension for hands-on learning.We need more staff development and inservices, not more meetings and lectures,but more time for collective planning.I think when they brought this in, what two years ago, many of the teachers didn'thave enough training. I try to talk to some of them about it, but they are oftenreluctant about using them.We didn't do much with the materials because time is the most important thing.Your trying to get everything in and you don't do all of it. I tried to get everythingfrom the book, but it is difficult and we need staff development for manipulatives.One goal of the computer lab is to help teachers try to meet their goals, a sort ofresource for them.We need additional equipment, inservice time, computer purchases, materialpurchases, and laser disk inservice.Teachers don't know how to work all of the calculators. It's new to them. Theyneed training so they can use them in their classrooms.
OPPORTUNITIES FOR TEACHERS TO INTERACT
What opportunities are there for you as a mathematics or science teacher to discussor share ideas and resources with teachers of similar or other curricular areas?Most teachers reported that they do not have a formal structure built into theirworkday for collaboration and cooperative planning with other staff members.Whatever efforts are made are left to the discretion of individual staff members.Several faculties as a whole reported trying to encourage their members to devoteextra time beyond their working day toward this effort, but again, this is at thediscretion of each teacher. According to teachers, few or no opportunities for sharingand collaboration on a district wide basis exist.
We take initiatives on our own. There is no opportunity otherwise.
36 Landscape of Mathematics and Science Education in Milwaukee
43

It's very rare. We are trying to get teachers to come to school early to workingtogether on planning themes and integrated learning experiences.We always make an effort but it's difficult to execute because of time and classcoverage interference.
INT 3RATION OF SUBJECTS
It's often difficult to integrate mathematics and science with other subject areas.What successes have you had in doing so?
Many teachers interviewed felt that they should be integrating their instruction withother curricular areas and with other grade levels, but they were not. They reportedbeing unable to do this because they had inadequate time to plan cooperatively. Theyalso felt the structure of the school and schedule was not conducive to integration. Forexample, groups were not organized around instruction, but rather isolated to gradelevel classrooms; materials were not readily available to foster flexible integratedinstruction.
Some integration is being done through the math and science resource teacher.Integration is a goal that needs much more work.Science is not integrated into the curriculum well enough. We need inservice andtime for discussion between grade levels and different subjects.I can do anything I like. I ca. go with another teacher and team teach or just skipit. It's up to the initiative of teachers, but we don't have enough time to plan forany of that, and we don't have many groups at the same level.We used to integrate reading, but not science or math. I think it's encouraged. Ourclub program is certainly integrating between all the grades. We have many clubsthat meet four times a semester and are mixed with all grades. We have bowling,drama, illustrations, and so onIn order to make a lot of this instruction meaningful, we need to time everythingcorrectly. We may be correlating instruction with a language arts unit, and all of asudden you realize all your needed materials will be unavailable. That's whathappens when you're trying to do a holistic integrated approach.
FAMILY INVOLVEMENT
Could you describe the level of family involvement in your school?
Perceptions of family involvement varied from school to school ranging from verystrong to poor. Those with poor family involvement cited several primary causesincluding, (a) parent's lack of time primarily due to work, (b) parent's unawareness ofthe importance, (c) transportation problems, and (d) poor parental attitudes. Teachersfelt that their schools should be doing more to foster family participation and bettercommunication.
Participation fluctuates. We have many working parents, and because we are acity-wide school, we have transportation problems.Our level of family involvement is average.I think parental involvement is the one resource we don't have.Not enough. Our PTA consists of two or three people. Some parents respond toconference day, but it is not consistent, and that is what we need. Parents comeonce a year.
Interviews 37

You need that parent to take that kid to an outing. So many of our kids just don'thave experiences with going to the zoo or outside to view plants. It's amazing thatparents just don't have the time to educate them. Both parents work. Parents don'tknow the importance. We have so many young parents, and they don't know whatto do.Single families don't have the time. They have negative attitudes. The textbooksshould have experiments that are easy to do at home with stuff everybody has.That's how our math homework is, but that's how it should also be in science.Our parent involvement is very strong, but we still always need to develop waysof reaching out to those parents that are unable to participate or communicate withteachers regularly.Efforts to increase our level of family involvement have been unsuccessful. Someparents work with children on homework and come to open houses. Not muchmore though.
COMMUNITY SUPPORT
Could you describe the level of support from business and industry, culturalagencies, and other community organizations for mathematics and science in yourschool?Teachers frequently did not know if they had a business partner and often referred topast business relationships. Of those that knew their current business partner, mostdescribed benefits that were in the form of tangible rewards. A few teachers describedbusiness relationships which were collaborative where members of the businessparticipated in the school itself.
We have an active SBM [site-based-management] group. The community isgenerous at times, but our local community is not vested in the children. We had abusiness partner, but we're not even sure who that is right now.Target is our business sponsor. This just meets general sponsorship needs and isnot specifically for math and science.We work with the Catholic home. We ud to get tutors from the YMCA, but wehaven't got that kind of support from business. We do get support in that theyoffer the kids rewards, For example, Wendy's and The Chancery give prizes forthe kids. The YMCA, before it went out of business downtown, used to support uswith tutoring, swimming, and basketball, or whatever. They offered studentrewards, and it worked great, but we don't have that anymore.We have two business partners, one is the local vocational college and the other asmall, local business which helped with our career days. They also do in schoolvisits and sponsor workshops and field trips.
PRINCIPAL INTERVIEWS
Twenty-six principals enhanced the landscape picture of mathematics and science inMPS by providing the administrative perspective. Sixteen were elementary schoolprincipals, six were principals of middle schools, and four were principals of highschools. Thirty-eight percent of the principals were male and 62 percent were female.Fifty percent of the principals wens African American, 46 percent were Caucasian,and four percent were Hispanic.
38 Landscape of Mathematics and Science Education in Milwaukee
45
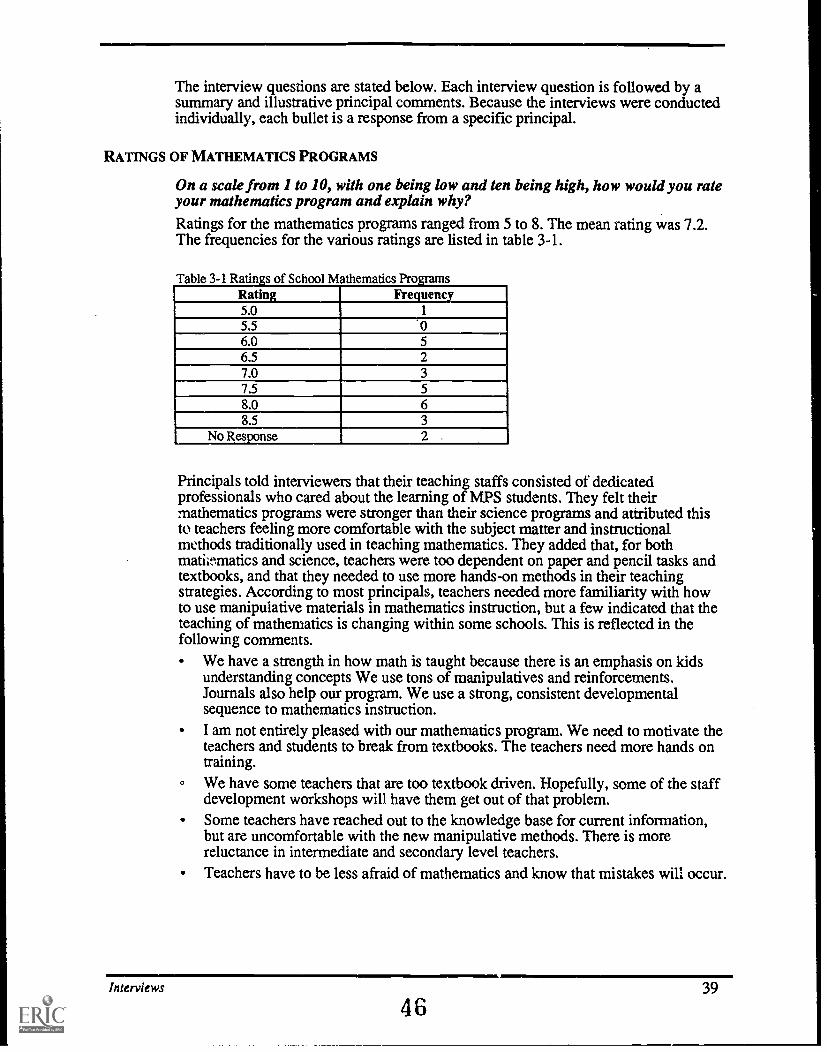
The interview questions are stated below. Each interview question is followed by asummary and illustrative principal comments. Because the interviews were conductedindividually, each bullet is a response from a specific principal.
RATINGS OF MATHEMATICS PROGRAMS
On a scale from 1 to 10, with one being low and ten being high, how would you rateyour mathematics program and explain why?
Ratings for the mathematics programs ranged from 5 to 8. The mean rating was 7.2.The frequencies for the various ratings are listed in table 3-1.
Table 3-1 Ratings of School Mathematics ProgramsRating Frequency5.0 1
5.56.06.5 27.0 37.5 58.0 68.5 3
No Response 2
Principals told interviewers that their teaching staffs consisted of dedicatedprofessionals who cared about the learning of MPS students. They felt theirmathematics programs were stronger than their science programs and attributed thisto teachers feeling more comfortable with the subject matter and instructionalmethods traditionally used in teaching mathematics. They added that, for bothmathmiatics and science, teachers were too dependent on paper and pencil tasks andtextbooks, and that they needed to use more hands-on methods in their teachingstrategies. According to most principals, teachers needed more familiarity with howto use manipulative materials in mathematics instruction, but a few indicated that theteaching of mathematics is changing within some schools. This is reflected in thefollowing comments.
We have a strength in how math is taught because there is an emphasis on kidsunderstanding concepts We use tons of manipulatives and reinforcements.Journals also help our program. We use a strong, consistent developmentalsequence to mathematics instruction.I am not entirely pleased with our mathematics program. We need to motivate theteachers and students to break from textbooks. The teachers need more hands ontraining.We have some teachers that are too textbook driven. Hopefully, some of the staffdevelopment workshops will have them get out of that problem.Some teachers have reached out to the knowledge base for current information,but are uncomfortable with the new manipulative methods. There is morereluctance in intermediate and secondary level teachers.Teachers have to be less afraid of mathematics and know that mistakes will occur.
Interviews 39
46
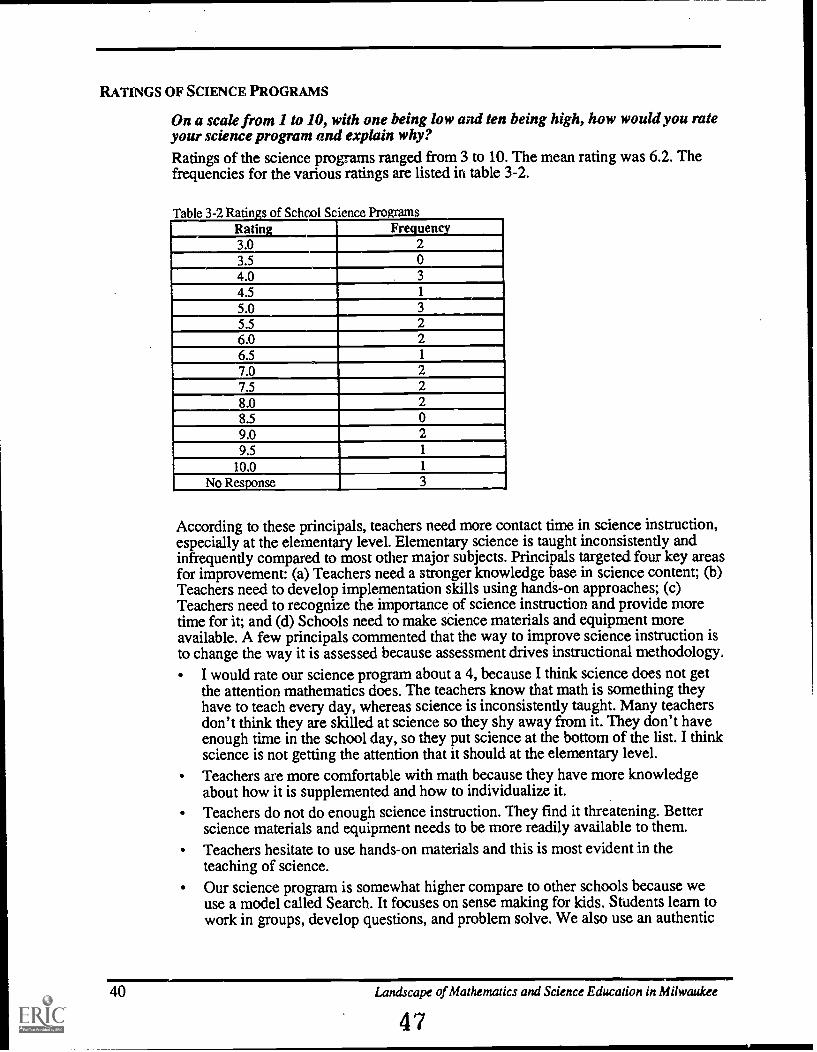
RATINGS OF SCIENCE PROGRAMS
On a scale from 1 to 10, with one being low and ten being high, how would you rateyour science program and explain why?Ratings of the science programs ranged from 3 to 10. The mean rating was 6.2. Thefrequencies for the various ratings are listed in table 3-2.
Table 3-2 Ratings of School Science Programs, Rating Frequency3.0 23.54.0 3
4.5 1
5.0 3
5.5 26.0 26.5 1
7.0 27.5 28.0 28.5 09.0 29.5 1
10.0 1
No Response 3
According to these principals, teachers need more contact time in science instruction,especially at the elementary level. Elementary science is taught inconsistently andinfrequently compared to most other major subjects. Principals targeted four key areasfor improvement: (a) Teachers need a stronger knowledge base in science content; (b)Teachers need to develop implementation skills using hands-on approaches; (c)Teachers need to recognize the importance of science instruction and provide moretime for it; and (d) Schools need to make science materials and equipment moreavailable. A few principals commented that the way to improve science instruction isto change the way it is assessed because assessment drives instructional methodology.
I would rate our science program about a 4, because I think science does not getthe attention mathematics does. The teachers know that math is something theyhave to teach every day, whereas science is inconsistently taught. Many teachersdon't think they are skilled at science so they shy away from it. They don't haveenough time in the school day, so they put science at the bottom of the list. I thinkscience is not getting the attention that it should at the elementary level.Teachers are more comfortable with math because they have more knowledgeabout how it is supplemented and how to individualize it.Teachers do not do enough science instruction. They find it threatening. Betterscience materials and equipment needs to be more readily available to them.Teachers hesitate to use hands-on materials and this is most evident in theteaching of science.Our science program is somewhat higher compare to other schools because weuse a model called Search. It focuses on sense making for kids. Students learn towork in groups, develop questions, and problem solve. We also use an authentic
40 Landscape of Mathematics and Science Education in Milwaukee
47
assessment model which is ability based assessment. Since assessment drivesteaching behavior, this is the primary motive to change teachers.I rated the science program low [rating of 4] because the focal point of this schoolis reading and language arts. We don't emphasize mathematics and scienceThe teachers rely too heavily on the science lab and therefore their own teachingmethods are inconsistent.
TEACHER COMFORT LEVELS
In your judgment, how comfortable are teachers with the mathematics and scienceprograms that they are implementing and why?Principals do 11",)t think teachers are comfortable with new methodology particularly inscience, and therefore, continue to be textbook driven. They stated that there are toomany who continue to use traditional methods, and added that teachers understandwhat needs to be done, but do not implement this in their classrooms. Severalprincipals used new staff members and recent university graduates as catalysts forchanging those teachers amenable to it, but they lamented that changing instruction istoo slow.
Several teachers are experts and the others are dependent on those. Some of theteachers in this school are still wishing for strict textbook methods which tell themwhat to do step by step.We have university students come in and our teachers have said how they learn somuch from them as far as new ideas and demonstrationsNew, recent graduates are another help. We got a new person on the staff; this isher second year out of the University, and she is bringing in the "hands-on"experience our school needs. Little by little other teachers who work with her on ateam are changing.Teachers are not comfortable with math and science. They are reluctant to give upthe textbooks and move to more innovative, supplementary types of teachingmethods and materials. The newer teachers out of college are more comfortable.There is a big leap from learning the mechanical aspects of instruction to actuallyimplementing it .
SUPPORT SYSTEMS
What support systems are available in your school to help teachers implement theirmathematics and science programs?Only a few principals mentioned innovative support activities that showed acommitment to supporting new methodology. The support methods for teachers thatprincipals mentioned most frequently were inservice programs and seminars. Othersupport activities were scheduled meeting times, informal meetings, resourcepersonnel, and mathematics and/or science labs. Reasons cited for inadequate supportwere lack of time and resources due to district level policies.
They are encouraged to share amongst themselves.We have mathematics and science technology resource personnel on staff who aresupportive to teachers.Teachers participate in inservices and serve on committees.
Interviews
4841

Our mathematics and science labs focus on providing the teachers with all thematerials they need. We also have a block of time in the school schedule devotedto meeting and discussing implementation of programs.The school district implemented a new science series for elementary schools. Thedistrict was supposed to provide materials kits designed for hands-on scienceinstruction. The teachers said the program cannot be implemented without thesekits, but the kits never arrived.Our teachers meet once a month with the resource person to share and discussproblems. On occasion, this is done across grade levels.There is more district level support. There is on-going staff development throughmany of the district level initiatives. The math and science curriculum specialistsfrom the central office push our district and support teachers towards a differenttype of instruction, more hands-on. At this school, the teachers network with oneanother and support is done that way. Our learning coordinator tries to supportthem too on an informal basis.The university needs to take a whole new approach for how teachers are beingprepared. There should be a middle school certification for teachers so that wedon't put people with high school or elementary (K-8) certification in middleschools because there simply wasn't a place for them at their certification level.There are many support programs, most based on income of students, such as,Chapter 1, but we don't get that kind of support.We have poor support systems at the school level.
OPPORTUNITIES FOR TEACHERS TO INTERACT
What opportunities do teachers have for sharing ideas and resources related tomathematics and science instruction?Are there any opportunities for teachers of different grade levels to get together towork on program development or address areas of concern or need?To encourage teachers to integrate their curricula, several principals said theyprovided opportunities for common planning time and scheduled meetings for sharingideas, but most were through informal methods initiated by teachers. The mostfrequently mentioned barrier to sharing was lack of time.
Sharing is limited due to teachers lack of common planning time. They reallydon't have the time to do those things. I would love to see the day when teacherscould have some time in the day to help each other and have common planning.Some ways that we have teachers share is through our resource personnel. Theseindividuals facilitate having our teachers bank time, develop assessments, andcollaborate on curriculum.Our teachers meet according to grade level committees. They also share throughcommittees which work with me. We also share during our inservice andseminars.Our structure for sharing is informal. Teachers network whenever they can. Theyhave opportunities during inservice programs.At the high school level, you might have several different grade levels in aparticular math class, so you have that integration already. The only one we don'thave set up like that is our ninth grade. We have a certain math class just for them.Teachers also have informal networks with other schools. But, the only formalcontact we have had is with our middle school down the street. We have had
42 Landscape of Mathematics and Science Education in Milwaukee
40

inservices with both of the schools to inform teachers what classes they shouldrecommend for students.I think the most informal conversation that teachers have is in the morning. Irequire teachers to stand outside their classrooms in the morning and a lot of timethe teachers will be sharing. Because my teachers are grouped in a certain spot inthe building, they are also able to converse with each other, not only beforeschool, but during class time and lunch time. We require teachers to have monthlydepartment meetings and sometimes more often. I do have what is called anacademic committee which is made up of department chairpersons and others inthe building.
USE OF MAMPULATIVES AND MATERIALS
To what extent do classroom activities include the use of mathematicsmanipulatives or science materials to enhance understanding? Why do you thinkthis is the case?Principals reported that classroom activities usually do not include hands-oninstruction. They noted that the majority of teachers use traditional methods.Principals mentioned that staff members need to change their attitudes, beliefs, andmotivation in order to affect a change in the classrooms. Many also cited examples ofhow their schools and the school district are moving in that direction. One principalwas concerned that the school district has over-emphasized hands-on instruction.
We need to motivate teachers. They are not happy with not having textbooks, andthey need hands-on training. Many are still using traditional methods and do notwant to change or adapt.Changing beliefs and changing assessments will help change teaching behavior.Teachers helping other teachers is also an excellent avenue for us to change theway teachers teach. This is badly needed.Obviously hands-on instruction is the wave of the future in education. Clintoneven mentioned this in his state of the nation, so I believe we are attempting toaddress this. It's what the systemic initiative is dealing with, to see how theacademic skills of the urban population are going to be enhanced and make themmore employable. Its what the School To Work Program is all about. The schoolwithin a school type phenomena has picked up with the more hands-on type ofinstruction. I think in this building, the staff members are doing everything in theirpower with the resources that they have to go in that direction. There ismomentum and it will grow if support comes from the central office. We need toget the curriculum end of it pulled together so that people are clear as to why thisis being requested. I think it will continue to grow. There is a solid core headed inthat direction from this school.Our school has headed toward more hands-on instruction through our relationshipwith oi)r business partner. They are strong in implementing hands-on experiencesfor chiictitn. Primary teachers use them more than intermediate ones.Large class size is a negative to hands-on instruction. The students needindividual attention.When you start to say what kids should and should not learn, this will causeproblems in the curriculum. I think all areas of learning are important and todiscredit one is a great shame. I think we've gone overboard with themanipulatives, which are important, but I think boys and girls need to knowcertain mathematical facts and skills.
Interviews 43
50

CALCULATORS AND COMPUTERS
Could you talk about the availability and use of calculators and computers formathematics and science instruction?Principals varied in their views on the adequacy of the technological equipment intheir schools. Some reported it as very inadequate, and others noted it was excellent.Most said they had a sufficient number of calculators. They felt a greater problem wasthat teachers did not have the technological skills to teach computer skills to theirstudents.
In this school we have adequate resources. There is a calculator for every studentand a computer in every classroom. We have a variety from Apples to Macs toIBMs. There are CD-ROMs in our mathematics and science labs.My primary people have an Apple computer in each classroom. We have acomputer lab with 20 Tandys and 15 Apples. We are one of the poorest schoolswith the lowest funding. My problem is the staff is not highly computer literate.We have a computer network with four IBM's in each classroom; our computerlab has Apples. We need to buy more calculators because our supply seems tohave "walked away."Through Equity 2000, all seventh and eighth graders have a calculator to takehome with them, but we don't have them for all our lower grades. The teachersdon't have computers in the classroom; they schedule time, one day per week, inthe computer lab.The school is well stocked with calculators. I've just added a computer lab that isstrictly for teacher and student use. We also have a computer lab in the basementof the graphics department. We are constantly purchasing computers; there arecertainly computers throughout the building. We have calculators stocked in thebookstore, and we have around 300 stocked on reserve in the math department.Some of our teachers are not that skilled in computer use. Some of them aretaking training. I think only about a third of my staff has a computer at home.I would describe our technology resources as typical or above average. We have afair number of computers, many calculators, and expanded our media resourcecenter. We hope to tie our media resource center to our library.In our middle school, it is my understanding that there are not enough calculatorsto allow the students to take them home. There is some confusion on districtpolicy. A bigger problem though is computers. Our Apple Its are very old. Weobtained them from PTA pizza sales money. Others were loaned from a localcollege because one of our teachers knows one of the deans there. That is not theway this district should be providing adequate technological resources for itsstudents. It's frustrating for my faculty because they hear that other schools havethem.
STAFF DEVELOPMENT
Have mathematics or science been the focus of any staff development so far thisyear?Responses varied considerably for this question. Those principals respondingnegatively often had provided more general staff development programs, such asinstructional methodology. Several related the benefits of these programs tomathematics and/or science. Principals also expressed frustration with their inabilityto reach more teachers with less financial resources.
Landscape of Mathematics and Science Education in Milwaukee
51

We haven't focused specifically on mathematics and science. Much of our focushas been on trying to get teachers to think about reforming the way they teach andstarting to think about hands-on instruction.Math or science has not directly been our focus, but indirectly I would say it hasbecause we are restructuring our content teaching. We started out withrestructuring our Social Studies and English departments because we felt it wasthe easiest. We have touched on, but we have not gotten into the sciencedepartment at this point.We have university students come in and our teachers have said how they learn somuch from them. The students bring new ideas and demonstrations with differenttechniques.Teachers are encouraged to work amongst themselves. We have extensiveinservices to make them more comfortable with using manipulatives.We are a mathscience specialty school, so, yes, our focus has been on thosesubject areas for our staff development. We are also concentrating on the SchoolTo Work initiative.I had some money to send one teacher to a workshop out of state. It was excellentfor her, but then we didn't have a way to continue in a supportive role for the restof the staff. This teacher had a one shot deal which was very costly to us, and thenthere was no follow up or cohesi,-eness because of lack of funding. That is sooften the case.
AREAS FOR INSTRUCTIONAL IMPROVEMENT
What are the most important things you see your staff needing to work on in theareas of mathematics or science?Hands-on instructional methods was the most frequently cited need followed byimproved technological skills. Other areas of concern were developmental and gradelevel expectations, improved attendance, at risk student needs, and integratedcurriculum. Middle school principals felt that teachers needed to improve instructionof algebra especially in light of new graduation requirements in the school district.
The teachers need to learn more about hands-on instructional methods. This isparticularly true for science.The staff needs to better understand grade level expectations and the skills thateach student needs at each developmental level.Computers. Some of the teachers are receiving training, but many more needtraining because they are not that skillful in computers.I think our greatest needs are for ninth grade teachers to concentrate on at riskstudents and improving attendance.Teaming and being able to teach integrated math and science. I think this is themost important area for teachersfor them to feel comfortable enough to workalong with another teacher.
FAMILY INVOLVEMENT
Could you describe the level of family involvement in your school?
A few principals reported that their schools have large numbers of parents who areextremely involved in school activities, but this was the exception. Most principalsexpressed dissatisfaction with their parent participation citing parents' lack of time,job commitments, and attitudes as barriers. Specialty and non-specialty school
Interviews 45
52

principals were split; half reported adequate or high parent participation, the otherhalf did not. Many schools were attempting innovative programs and activities withvaried success rates. One principal found great success with the parent coordinator atthe school.
Our parent involvement is tremendous. At PTO meetings we average 50 parents.We have a parent coordinator position which has improved things considerably.This person holds meetings to promote parent involvementNot very good. This is an area we are working on. Our Open House is verysparsely attended; we have a student body of 800, but less than 10 parents showedup. We have open meetings on Saturdays which are poorly attended.I would say our parent involvement is average or somewhat below. Our parentsupport consists of just getting the child to school and help with homework. Mostparents don't have the time because of their jobs.We have a high level of parent involvement. They work on the school council,curriculum committee, and with Chapter 1.Very little. About half of our school is bused so distance may be a problem. Theyear 1994-95 is designated as the year of the parent to promote involvement.Some are extremely involved. They run the realm of levels of involvement. Wehave many opportunities for them to be involved, such as special enrichmentdays. We encourage home support of learning.In high school, you will find there are a number of ways that parents are involved,for example, athletics. We have parent night for all sports. We also have otherprograms, such as a renaissance program where we have a pancake breakfast. Wesponsor parent workshops, monthly meetings for parents of special educationstudents, and others for band parents. We have parent volunteers in our schoolduring the day and a Booster Club.I think a lot of parents are wondering how they can help. I think the only wayparents can help is providing the right kind of atmosphere for the child to study.As far as the content itself, I think there are very few parents who are able to helptheir children. Most of them are out of touch with it, except at the grade schoollevel. But at the high school level, I think it is difficult for most parents to helptheir children.We are trying to make our school an extended family learning center where wehave a lighted school house. I find that when you ask parents to come, they willcome. But trying to get parents to come in on their own and volunteer, they won't.We get a very good turn out on parent-teacher conference days and at OpenHouse, but during the rest of the year, we get the same set of parents every time.So, there is a definite need to get their involvement.
COMMUNITY SUPPORT
Could you describe the level of support from business and industry, culturalagencies, and other community organizations for mathematics and science in yourschool?Frequently, principals reflected on better days when business partners first began andthere was more enthusiasm. Now, many of them do not have business partners. Thosewith community participation described involvement which was sporadic and/ rrelated to one specific activity. Most frequently, participation involved providing asmall portion of the school's resources. Several school principals, however, wereexperiencing successful business partnerships and provided some interestingexamples.
46 Landscape of Mathematics and Science Education in Milwaukee

We don't have any business partners now. This school had them in the past, butthe interest fell off. We need to pursue this more.Formerly we GE Associates was our partner, but now we don't have one. They setup our science lab for us. Now all we have is a group of grandparents whovolunteer.My support is from First Star Bank. Our first set of calculators were purchased bythis bank. They also contribute some resources, such as paper, which might beused by the science department.Coopers and Lybrand, an accounting firm, are our business partner. They tutorstudents in math. They are instrumental in terms of arranging our career day.There were achievement initiatives that they assisted with that also dealt withmath. MATC, which is another business partner, is involved in the career day.MATC had offered students use of their math lab, but it became too difficult toschedule. So, they are always trying to assist us especially with this School ToWork program.For math and science we haven't had too much. Most of ours have been forreading and arts. The only one I can think of that works on a specific area is theYMCA. They tutor the kids in any subject area. We have some businesspartnerships, but they are not geared towards math and science. We have anenvironmental club and we have the community awareness club. The kids get togo to the symphony, and I guess math and science can fit into music. We focus onart more. With science, I can't think of anything.Our business partner is Advanced Learning Systems, a software company. Theyhelped us with a reading program and provided technical support in readingmaterials.Wepco and Harley are our partners and they help with school projects, run fundraisers, help with field trips, and mentor math and science.We have one or two businesses that help us. We also have a resource person atUWM, but many of the helpers are scared of our school community.We have two partners. The Boys and Girls Club which funds memberships for ourkids and provides boots, socks, mittens, and so on. The Kiwanis Club runs theadopt a classroom program in which 22 members are paired with a teacher andclassroom.
IMPACT ON STUDENTS
What evidence have you seen that the mathematics and science instruction ishaving an effect on students?The most frequent response by principals was school test scores. Almost everyprincipal alluded to them in one manner or another. If favorable, this was the primaryway principals evaluated the effect of mathematics and science instruction on theirstudents. If the scores were unfavorable, many principals commented how educatorsneed alternative assessments. Other ways principals judged the effect of instruction onstudents were student enthusiasm, interest, and number participating in otheractivities, such as clubs. One principal elaborated on the increased number of studentsenrolled in advanced mathematics classes since algebra was now a districtrequirement for all students.
Students enjoy the science labs; they ask questions and are really involved. Samewith math, and our test scores aren't bad.
Interviews 47
54

Our average GPA is 2.89 and we have 90% attendance. Our students are abovethe city standard and are doing well in math and further education.It's dependent upon the child. Our test scores are not showing it, but somestudents are real interested and enthusiastic. It's frustrating.The number of students that sign up for extra activities related to science andmath have increased. They love the science lab.Definitely there is an effect. I see it when I look at my ACT scores and comparethe number of kids taking advanced classes each year. With my minority students,this number is increasing, and I am proud to say that. Right now I think we havetwo sections of calculus. We have several sections of physics. The school systemis becoming a system of minority students, and when you have an increase inthose classes it is a good sign. With that and my ACT scores in the math areaabove the city average and one point below the state, we are making progress.Math has the highest attendance of all classes, and I don't know where science fitsinto that, but certainly we will explore and find that out.Aside from classroom observations, which are impressive, I will wait for testresults to make an educational level statement.We have some students who are very interested in math and science. Sometimesour students of the week write that their favorite subject is math or science. Wetested the children in math and they did improve somewhat.More of our kids are continuing their education and pursuing careers.Our school continues to rank in the top three. We were involved in the futurecities and that was only three students but it was an opportunity for them. Now wedidn't get any top awards, but it still is a small indication that something is goingon there.
PERFORMANCE GAP
Why do you think there is a performance gap between White students and minoritystudents in mathematics and science?
Most principals attributed the problem to parents and families, highlighting economicand social status as causes, Others blamed it on low teacher and communityexpectations and said students then responded accordingly. Barriers included lowsocio-economic status and/or lack of stimulation. One principal linked the problem tothe community and lack of reinforcement in the workplace which in turn loweredmotivation.
I don't think that gap is just in math and science; it's in other areas as well. I thinkthat economics play a part in it. Our Caucasian students aren't doing any betterthen the Black kids coming in. It just happens that we have more Black kids in thecity. I have found that the Black kids that come from parents who have a value ineducation do well. These parents get their kids involved in education. They do justas well as the White kids. We have more children who come from poor, deprivedbackgrounds; they come with a lot of social and personal baggage that are barriersto achievement.It's due to the social aspect of kids lives. They are stronger in math than inreading or science because of environmental influences. Society labels kids; theexpectations for Black students is lower than of White students. White kids havemore support at home. Kids bring a lot with 'hem to school that hinders learning.Some kids are raising themselves.
48 Landscape of Mathematics and Science Education in Milwaukee

I can list a number of reasons, but ability would not be one. A lot of it has to dowith instruction. I have noticed that there are teachers with different expectationsfor different children. It's been very interesting this year with our Equity 2000program placing all children in Algebra to see how the thinking of some theinstructors has changed. Inservices have helped staff members open their eyes tosay that these kids can achieve, and they can learn this math. Our failure rate forAlgebra is around 30%. Our failure rate for ninth graders last year was higher thanthat. So, it tells you something when teachers change to believe that these kids canlearn. Once you get the children believing that they can learn, they will learn it.That is just one way. The gap also exists because of lack of parental involvementand coaching with some children. I think some children have a need to achieveand others don't because they don't have that kind of exposure.Some of it is due to cultural influences. The expectations of staff are not highenough.There may be a gap between White students and Black students, but the gap is notas great in math as it is in reading.Value differences. What's happening in the home contributes to the achievementgapstudents go to empty houses instead of to educational homes.I think it's due to the lack of socio-economic opportunities. It becomes an issue ofthe importance of education. It involves the whole motivational or hope aspect,like the School To Work program. The kids will see through this very quickly ifwe expose them to a lot of career options, and they don't personally believe thatthose careers will mean anything to them. Again, that whole motivational beliefsystem needs to be increased. I don't think a person like Fuller, as dynamic as hecan be, or people within the school saying to students that this is wonderful andyou need to believe this and you need to try, will work. There needs to be more ofthat in the community, and the business community needs to help put some teethbehind it. Universities need to accept these students if indeed they did achieve at acertain level. It shouldn't become isolated within a school district. We need toexpand out to have these kids believe that it is going to lead to a future that theywant.
ASSESSMENT STRATEGIES
Do you have any initiatives going on at the moment in the area of using alternativeassessments in mathematics and science? If so, please describe.
As a group, the principals were excited to talk about alternative assessments. Manyhad initiatives beginning in their schools. Most principals described their progresstoward alternative assessment as "in the early stages" with development ofperformance assessment tneastires, particularly portfolios. Several other innovativemethods were mentioned, such as, videotaping, recording observations, and otherinformal .essment.
We use portfolios in everything. We try new ways to assess our kids as the yeargoes by.The teachers are now keeping "dump portfolios." The students get a sense ofwhere they started at the beginning of sixth grade, for example, and at the end ofsixth grade. Then they have pieces in there where they can see themselves as whatkind of learners they are.The lower grades use math portfolios. I believe in authentic assessment, so we aredoing math videotaping for parents home viewing.
Interviews 49
We use an authentic assessment model which is ability based assessment. Sinceassessment drives teaching behavior, this is the primary motive to changeteachers.The assessments we have done this year were strictly with instruction versusanalysis of grades and attendance. That's how we determined that attendance washigher in math. We've done a lot of observing. We also used more informassessment by teachers and administrators.We use a writing component to see if critical thinking skills are being taught.Certainly the essay portion on the math exam is one way to see that. Naturally thatfollows one of our school board goals. That is, all kids will be able to thinkcritically and solve problems.We use portfolios. We are currently designing assessment tests for specific gradelevels and use informal testing.Teachers are into portfolio assessment. They are becoming more comfortable withperformance assessments.
STAFF ENTHUSIASM
How would you characterize your staff's enthusiasm toward mathematics andscience?Overall, almost all principals expressed pride in their staffs, some more strongly thanothers. They said that their staffs were dedicated with the interest of children at heart.A few principals commented that the faculties needed more enthusiasm andmotivation to change.
In this middle school, those that are teaching mathematics are very enthusiastic. Alot of teachers feel very uncomfortable with math, such as social studies teachers.I think that math has always been a subject that has frightened a number ofteachers. I think it is changing somewhat because of the integrating efforts.Good. This is a school focused on low achievement, so there is no choice but tobe enthusiastic to promote growth.These teachers see math as a real challenge for them. They know that it isimportant for students to do math, and they try really hard to make sure thechildren meet the expectations by the time they leave our school. That is the onearea teachers really work hard on.It's heartwarming to see so many of them spending money for the students out oftheir own pockets.The enthusiasm of my staff is not as high as it could be. We need more mathdevelopment and computer usage. Our new science teacher should also promotesome enthusiasm.I think they want to do more in science, but they feel that they don't have theknowledge, materials, or time to do it. The teachers want to focus on one topicand bring in all the subjects with that one thing. Then the children would get moremeaning from that. They will see the relationship between all the subjects better.We do have some teachers who are interested in doing that.
50 Landscape of Mathematics and Science Education in Milwaukee
57

OTHER
Is there anything else that you would like to tell us about your mathematics andscience programs?
I just wish I had more resources for the teachers to use, or training for theteachers. The large class size is negative, students need more individual attention.Class size should be around 20 and 25. Twenty would be good for first grade, 27at the highest for the other grades. We have over 30 sometimes.We just need more time to improve. We can't just have one person be the drivingforce. We are trying to introduce new techniques. Our staff is excellent, and if wecan get the money, we can clear some of these hurdles out of the way.
SUMMARY
Students, teachers, and principals from elementary, middle and high schools wereinterviewed to provide multiple perspectives on mathematics and science education inMPS. Together, they described not only what mathematics and science educationcurrently is, but also what it could- be. Their ideal scene depicts students and teacherslearning together solving real life problems. Instruction is integrated acrossdisciplines and incorporates technology in a purposeful manner. Schools are the hubof learning for the community where teachers and students interact with parents,business, industry, agencies, and other organizations. But students, teachers, andprincipals agree that the ideal is not the reality in MPS. The following is a summaryof the views from students, teachers, and principals on mathematics and scienceeducation.
STUDENT INTERVIEWS
Students want practical experiences using "everyday things."Field trips can help make instruction more real even if the trip is only a walkthrough the neighborhood.Lessons should be more creative. Learning should be fun through more use ofgames and experiments.More computers in classrooms are needed. Students want to be able to usecalculators more often.Mathematics and science classes are boring and dull because there are too manyworksheets, too much use of chalkboards and overhead projectors, and too fewexperiments.In elementary schools, science is taught inconsistently and infrequent! j.Teachers talk too much; students talk too little.
TEACHER INTERVIEWS
Teachers believe curriculum should stress critical thinking and problem solving.Instructional methods should be practical with extensive use of manipulatives.Curriculum should be integrated across subject areas.There should be more progressive teaching methods and less traditional teaching.
Interviews 51
53

Staff development needs are greatest in practical instructional methods, integratedcurriculum, and use of technology.The greatest barrier to effective teaching is insufficient time and inflexiblescheduling. Other barriers include inadequate administrative support, materials,supplies, facilities, and equipment, including computers and calculators.A large discrepancy exists between schools in their level of parent involvement.Instruction is fragmented due to excessive interruptions and non-teachingexpectations.
PRINCIPAL INTERVIEWS
Principals believe instruction should emphasize problem solving skills usingextensive hands-on activities.The curriculum should be integrated across disciplines.More collaboration should occur among staff.Principals perceive the quality of the teaching staff as good, but staff developmentis needed especially to increase content knowledge.Barriers to effective instruction include time constraints, few resources, materialsand supplies, and reduced central office support for principals.Successful business partnerships are few for most MPS schools.Parent involvement is a critical need for most schools.Class size is too large.
52 Landscape of Mathematics and Science Education in Milwaukee
59

CHAPTER 4
CLASSROOM OBSERVATION RESULTS
Although the outline of mathematics and science education in the Milwaukee PublicSchools (MPS) has been sketched, the canvas still has large unpainted areas.Observations of mathematics and science classrooms at elementary, middle, and highschool levels enhanced the scene. The observations took place during site visits to 40schools in MPS.Using a Classroom Observation guide (see Appendix B), observers focused on sixareas: (a) materials, tools, and technology, (b) climate, (c) instruction, (d) teacherfocus, (e) student focus, and (f) equity. The observers also provided additionalinformation through field notes which included comments, narratives, and overallimpression ratings. Completed observation forms were analyzed according to thesecategories.
Summaries of the classroom observations are given for each levelelementary,middle, and high schoolby subject area. The two major organizing themes for thesummaries are learning environment and instruction. Illustrative examples of observercomments are provided to support the summaries.
ELEMENTARY SCHOOL MATHEMATICS
A total of 54 classroom observations of mathematics were made at 21 elementaryschools. The distribution among the various grade levels is shown in table 4-1.
Table 4-1 Elementary School Mathematics ObservationsClass Number of Observations
Kindergarten 5
Grade 1 7Grade 2 8Grade 3 7Grades 3-4 2Grade 4 9Grade 5 8Grade 6 2Unknown 6
LEARNING ENVIRONMENT
Student Grouping Arrangements. The classroom observations revealed that 33percent of the elementary school mathematics classes had students sitting in rows and67 percent had students sitting in either pairs or small groups. In 47 percent of theobservations, students had opportunities to work in pairs or small groups during theobserved mathematics lessons. Observers reported that the classrooms were crowdedin 27 percent of the observations.
Classroom Observations
6053
Equity. The ethnicity/race distribution of the students in the observed classesreflected the diversity of the students in the school. Within each class, observationswere made of the diversity of student seating arrangement and pair or groupmembership. In six percent of the classes, student grouping arrangements weresegregated by gender. Observers commented that this occurred by student choice andnot by teacher direction, as the students were allowed to choose their own groupmembers.
In general, student-teacher interaction was equitable with teachers interacting with allstudents regardless of ethnicity/race or gender. A few exceptions did exist.
In a fourth grade class, the boys were called on five times and girls just once.In a fifth grade class, the teacher only called on the students who raised theirhands. The students who raised their hands were boys. Throughout the classperiod, the same students were called upon to answerall boys and no girls.
Materials, Tools, and Technology. Although there was some variety in the materialsand tools utilized across all observations, in 41 percent of observations students onlyused paper and pencil. Teachers used overhead projectors (15 percent of theobservations), chalkboards (20 percent of the observations), or both (four percent ofthe observations), as well as a variety of other materials. In one class, the studentsalso used the overhead projector to present their solutions to their class members.
In 52 percent of the elementary school mathematics observations, students used sometype of hands-on materials. For example, students used counters, place value blocks,tape measures, tangrams, geoboards, square tiles, square pieces of paper, candy,scales, miniature clocks, and coins. In six percent of the classes, students wereobserved using calculators. A computer was used in one class.
INSTRUCTION
Instructional Format. The instructional formats in the observed elementary schoolmathematics classes varied. Some classes (33 percent) were very traditional andteacher-centeredthe teacher delivered the information and the students listenedpassively. In other classes (17 percent), the atmosphere was very student-centeredwith students actively engaged in figuring things out for themselves and with teachersguiding and questioning. The remaining classes (50 percent) fell somewhere inbetween these two extremes.Thirty-three percent of the observed lessons could be characterized as very traditional.The teacher did most of the talking in a lecture format and the students listenedpassively followed by individual student work. The following are illustrated examplesas stated by observers.
In a fifth grade class, the teacher lectured to the students at the beginning of thelesson and then directed the students to complete some pages from their textbook.The students worked individually on the exercises from the textbook.In a second grade class, the students started by solving the math problems theteacher had wiitten on the boardadding and subtracting four-digit numbers.Students explained the procedures for solving the computation problems. Thenstudents recited poems and chants about the seasons and multiplication facts.In a third grade class, the teacher presented information and led a discussion onmetric measures of distance and area. The teacher used the chalkboard fordrawing illustrations and a meter stick for making comparisons. Then the studentsworked independently on a worksheet in which they were to choose theappropriate type of measurement for different circumstances.
54 Landscape of Mathematics and Science Education in Milwaukee
61.

In a fifth grade class, the teacher walked from the back of her desk to the front ofher desk as she lectured. She never changed the tone of her voice. The teacher didalmost all of the talking. Very little opportunity existed for students to respondand no opportunity for student interaction.In a second grade class, everything was done by reciting backwards and forwardsin unison. Students counted by twos forward and backward and then themultiplication facts with two as a factor and then those with three as a factor.Students also recited the days of the week and months of the year.
Many of the classes (50 percent) had some components that could be characterized astraditional and other aspects that were student-centered. The students in many of theseclasses were given materials or tools to use but the materials were used in a veryteacher-directed manner, and students usually worked independently.
A second grade class was set up as three groups with an adult supervising eachgroup. One adult monitored students working at the computer on additioncomputation exercises. Another adult monitored a reading group. The teacherworked with the third group on measurement. The observer noted that the teacherand not the students did the weighing. Even with this smaller group working onmeasurement, each individual student had a worksheet to complete, and there wasnot much student to student interaction.A fourth grade class investigated the number of teeth that fourth graders have. Theobserver noted that it was a great activity but that the teacher maintained a role ofdistant director and did not take advantage of time during pair work to engagestudents. The class also made a class graph of the teeth, and each sty lent wasrequired to make an individual graph as well. Other than counting teeth, thestudents did not interact except for off task behavior.In a fifth grade class, each student was given a cup of candies. They were asked tocount the number of candies in their set and to record this as the denominator of afraction. The teacher than told each student to count the number of orange candiesin their set and record this as the numerator. This was then repeated for the othercolors with the teacher directing each step of counting and recording. The studentsdid get to handle the candies, but no thinking or reasoning was required by thestudents. They worked independently and just needed to follow the teacher'sdirections and respond to her closed-ended questions which only required a oneword response.A fourth grade class was studying multiplication. The students used manipulativesto model various multiplication facts, such as "9 x 6." The class discussed how touse the materials to show each problem. The students worked individually. Theclass ended with the students taking a three r rinute timed test on multiplication.
Seventeen percent of the observed classes were student-centered. These lessonsplaced the teacher in the role of facilitator and emphasized thinking and reasoning bythe students. The students often worked in small groups or pairs and used hands-onmaterials to assist them in making sense of mathematics.
In a fourth grade class, the students worked in pairs and used square tiles in theirinvestigation of division. The teacher often asked students for differentapproaches to solving the problems.A first grade class had almost total engagement of the students throughout thelesson. The students were to purchase items to decorate a kit. The studentsplanned what items to use and then counted money to purchase their items. Thelesson was very meaningful as the students had a purpose for counting.
Classroom Observations 55
62

A fifth grade class used geoboards to investigate polygons. The students did mostof the talking throughout the lesson. The teacher was a facilitator as the studentsworked in small collaborative groups.In a third grade class, the students were using square tiles to explore area andperimeter. The students drew diagrams on graph paper and took turnsdemonstrating at the overhead. The observer noted, "The students were so excitedand engaged. They couldn't wait for a turn at the overhead." The emphasisthroughout the lesson was on discovering all different possible solutions.A first grade class was studying fractions. They were to each bring in one half ofsomething from home. Some of the items included one half of a sandwich, cookie,cracker, apple, and paper. The students reported what happened to them at homewhen they were working with their parent to find one half of something. The classalso cut fruit which the teacher had brought to school into fractional parts, such asa banana into thirds, an apple into eighths, and an orange into fourths.
Student Interaction. In 54 percent of the elementary school mathematics classes, thestudents worked independently. In some of the classes the students sat in groups orpairs, but they did not interact during the lesson.
In a sixth grade class, there was no student interaction other than glances now andthen among the students.In a second grade class, the students listened and watched the teacher andresponded by writing on individual chalkboards and holding them up for theteacher to see. Then the students were given a worksheet to work on individually.In a third grade class, there was no interaction among the students except for aboy throwing paper wads at the person in front of himsix times.In a first grade class, the students worked at tables that sat six students. Howeverthe students worked individually on an assigned worksheet.
Thirty-nine percent of the classes had planned opportunities for the students tointeract with each other in small groups or pairs. In seven percent of the classes, thestudents were told that if they wanted to they could work with and help each other.
In a fifth grade class, the students were to discuss answers and then put their ideason a group recording sheet.In fourth grade class, each pair was to reach a common solution on some divisionproblems. The students were using materials to act out the problems.In a first grade class, the students worked in groups as they talked to each otherabout what items to purchase and jointly counted money.
Real-World Connections. The presence of real-life connections in the observedelementary school mathematics lessons varied, but were generally weak or non-existent. In 54 percent of the lessons, no real-life connections were evident.
In 30 percent of the lessons, the teachers referred to a real-world situation as anexample or to provide some reason for studying specific mathematics content. Forexample, the teacher mentioned pizza, candy bars, and recipes when studyingfractions in a third grade classroom, and a fifth grade teacher referred to real objectsto give examples of metric measures.
In seven percent of the classes, the real-world connection provided the context formathematics learning. For example, students purchased items to decorate a kit in afirst grade classroom and prepared food in a different first grade classroomdoublingthe recipe and measuring ingredients.
56 Landscape of Mathematics and Science Education in Milwaukee
63

GENERAL IMPRESSION RATINGS
The observers rated their perception of each elementary mathematics class on fourdimensions: (a) student-centeredness, (b) negotiation among students to make senseof the ideas examined, (c) efforts to help students build upon prior knowledge, and (d)student autonomy. Figure 4-1 shows how the observers rated the elementarymathematics classes in terms of the four dimensions. The percents given are based onthe reported ratings. The actual frequencies are listed in table 4-2.
Figure 4-1 General Impressions of Elementary Mathematics Classes (percent of reported ratings)
40
30
c 20e
10->x II s
I ;AI et,......, ,i....
.4..0, %,
',4,
Student-centered Negotiation Prior Knowledge 1 Student Autonomy
Very Often
III Often
Sometimes
El Seldom
III Never
The observers rated about half of the observations as often or very often building onstudents' prior knowledge. About one third of the classes were characterized asstudent-centered. In many of the observations, students had few or no opportunities tonegotiate meaning or work together to investigate problems. Approximately the samenumber of classrooms promoted student autonomy as those that did not.
Table 4-2 General Impressions of Elementary Mathematics ClassesVeryOften
Often Sometimes
Seldom Never Notreported
The lesson was student- centered. 7 13 18 8 6 2Students interacted with each otherto make sense of ideas and tohelping each other investigate.
9 6 11 17 10 1
Teacher helped students build uponprior knowledge and experiences. " 15 8 6 8 4
Students were given responsibilityand control over their learning andencouraged to think independently.
lu 12 12 12 6 2
Classroom Observations
64
57
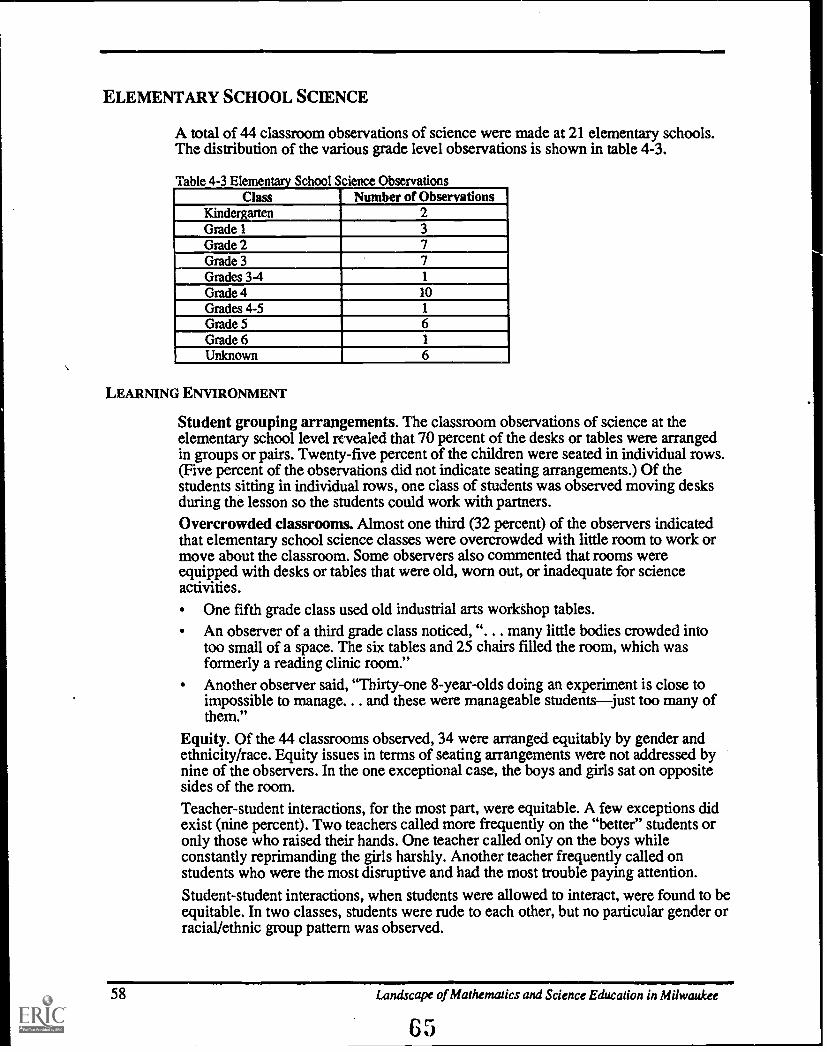
ELEMENTARY SCHOOL SCIENCE
A total of 44 classroom observations of science were made at 21 elementary schools.The distribution of the various grade level observations is shown in table 4-3.
Table 4-3 Elementary School Science ObservationsClass Number of Observations
Kindergarten 2Grade 1 3Grade 2 7Grade 3 7Grades 3-4 1
Grade 4 10Grades 4-5 1
Grade 5 6Grade 6 1
Unknown 6
LEARNING ENVIRONMENT
Student grouping arrangements. The classroom observations of science at theelementary school level revealed that 70 percent of the desks or tables were arrangedin groups or pairs. Twenty-five percent of the children were seated in individual rows.(Five percent of the observations did not indicate seating arrangements.) Of thestudents sitting in individual rows, one class of students was observed moving desksduring the lesson so the students could work with partners.Overcrowded classrooms. Almost one third (32 percent) of the observers indicatedthat elementary school science classes were overcrowded with little room to work ormove about the classroom. Some observers also commented that rooms wereequipped with desks or tables that were old, worn out, or inadequate for scienceactivities.
One fifth grade class used old industrial arts workshop tables.An observer of a third grade class noticed, ". . . many little bodies crowded intotoo small of a space. The six tables and 25 chairs filled the room, which wasformerly a reading clinic room."Another observer said, "Thirty-one 8-year-olds doing an experiment is close toimpossible to manage. . . and these were manageable studentsjust too many ofthem."
Equity. Of the 44 classrooms observed, 34 were arranged equitably by gender andethnicity/race. Equity issues in terms of seating arrangements were not addressed bynine of the observers. In the one exceptional case, the boys and girls sat on oppositesides of the room.Teacher-student interactions, for the most part, were equitable. A few exceptions didexist (nine percent). Two teachers called more frequently on the "better" students oronly those who raised their hands. One teacher called only on the boys whileconstantly reprimanding the girls harshly. Another teacher frequently called onstudents who were the most disruptive and had the most trouble paying attention.
Student-student interactions, when students were allowed to interact, were found to beequitable. In two classes, students were rude to each other, but no particular gender orracial/ethnic group pattern was observed.
58 Landscape of Mathematics and Science Education in Milwaukee
65

Materials, tools, and technology. Computers were observed in half the classrooms,but were not used during any of the observations. Calculators were used in one class.Use of manipulatives, science materials, and equipment was reported in 5- percent ofthe elementary school science classes. The remaining 43 percent of the childrenobserved used other materials as described below or no materials.
The children in four classes worked with paper or worksheets and pencils.
One class was observed using old elementary science textbooks even though thedistrict had adopted a new science program the previous year which had nostudent texts.
Nine classes of children had nothing in their hands.
Five classes were using art supplies
INSTRUCTION
Instructional format. For those elementary school science classrooms in which theinstructional format was reported, the instruction varied from traditional and teacher-centered to student-centered. Seven percent of the observers did not comment onclassroom instructional format.Forty-five percent of the science lessons were traditional. The teacher did most of thetalking and, in a few cases, demonstrated an activity while the students listened andwatched passively. During these classes, the students read aloud or worked on aworksheet, but always individually with no collaboration among the students.
One observer noted while watching a third grade class, "How frustrating for thesethird graders. The teacher had all the fun doing a demo, and the kids wereamazingly well behaved and quiet as they only watched."Another class was very controlled. The teacher was "entertaining," and the kidswere the "viewing audience."Another teacher stood in front of the class, posed questions she thought wereimportant and guided the children's answers to what she wanted. The observernoted, "This was like I remembered science classactually quite boring."Journals were used for drawing observations in a fifth grade class. The studentshad to listen to the dictation of the teacher and write what she said.
Fourteen percent of the classes had a combination of teacher-centered and student-centered instructional activities. In these classes, the teachers would give directions,demonstrate, or explain something to the students. The students were then allowed towork in pairs or small groups and were usually given materials to use. In some ofthese classes, whole group discussions occurred with lively interactions betweenteacher and students and between students and students. In one of the classes, theteacher did most of the talking during the first part of the class. Then during thesecond part of the activity, the students talked more as the teacher facilitated theactivity.
Thirty-four percent of the classes were student-centered with students sharing,collaborating, guiding and directing each other, problem solving, and generally beingresponsible for their own learning. Teachers were seen as coaches and resources forthe students.
In one combination class of first and second grade students, the teacher acted asthe facilitator for each group. She asked questions that required furtherinvestigations. She encouraged group problem solving with the types of questionsshe asked.
Classroom Observations 59
66

In another class (no grade reported), the students were helping each other tounderstand buoyancy and the relationship between solids.and liquids. Positivesupport was provided by the teacher to encourage students to explore and developindependent thought processes.A fourth grade lesson was the first in a new unit on rocks. The groups of studentswere given the opportunity to identify the questions they wanted to answer duringthe unit.
Student interaction. Although most elementary school science classrooms hadstudents sitting in groups or pairs (70 percent of the observed classes), thesearrangements did not ensure that cooperative learning or student-to-studentinteractions were actually taking place. Those students sitting in rows (30 percent ofthe observed classes) displayed little to no student-to-student interaction and onlysome teacher interaction. This interaction consisted mostly of teacher questions andindividual student answers or student questions with the teacher giving answers.Of the 31 classes arranged in groups or pairs, only fifteen (34 percent of the totalobserved classes) exhibited true cooperative learning, verbal sharing, collaboration,and problem solving within the groups.
One observer of a second grade class noted, "The students are doing most of thetalking amongst themselves. They try to solve problems first. Only if stumped dothey involve the teacher. Each child had a role to play in the lesson."Some first grade students were working in small groups with excellent interaction.Most of the talking was done by the students. They were engaged in cooperativeactivities.
In the other classes (36 percent of the total observed classes), students workedindividually with materials or showed a minimum of collaboration with their peers,even though they were grouped with other students. One observer of a second gradeclass commented "The children seem to work independently in groups . . . yes, this iswhat I meant to say." The students were physically seated in groups, but neverworked jointly on a task or discussed their individual work with each other.
Real-world connections. The presence of real-life connections varied in the observedelementary school science classes. No real-life connections were observed in 37percent of the classes. (Two percent of the observers did not report on this item.)
In 50 percent of the observed science classes, the teacher made some kind of verbalreference to a real-world example to connect a science concept with the lives of thechildren. This was accomplished by the teacher making suggestions, or asking thechildren for examples that represented the concept.
The teacher of a fifth grade class made connections to density by talking aboutsalad dressings, foods, and liquids familiar to the students.A third grade teacher used probing throughout the whole class discussion andquestioning about germs and diseases related to their own experiences.A kindergarten teacher used the analogy, "On the outside of the seed is a shell; ona person, it is the skin."
In the remaining 11 percent of the science classes, the teachers used real-worldconnections to provide a meaningful context for students to engage in hands-oninvestigations. These contexts helped students connect the concepts with their lives.
Some third graders were given a number of objects that had reflective qualitiesand were told to examine them, describe them, and tell how they could be used.Some fourth graders were summarizing two weeks of research into rocks. Thestudents brought in their own rocks and talked about them.
60 Landscape of Mathematics and Science Education in Milwaukee
67

During a second grade lesson about the benefits of brushing teeth and effects ofsugar and vinegar on eggshells, the teacher had the studentv, count their partner'steeth. They discussed the names of teeth they have.The teacher kept referring to the fourth grade students as "scientists."
GENERAL IMPRESSION RATINGS
Figure 4-2 shows how the observers rated the elementary school science classes interms of four dimensions: (a) student-centeredness, (b) negotiation among students tomake sense of the ideas examined, (d) efforts to help students build upon priorknowledge, and (d) student autonomy. The percents given are based on the reportedratings. Tlr actual frequencies are listed in table 4-4.
Figure 4-2 General Impressions of Elementary Science Classes (percent of reported ratings)
40
30
Pe
c 20e
10-
0Student-centered Negotiation
I.
Prior Knowledge Student Autonomy
IlVery Often
II Often
Sometimes
Seldom
Never
The observers reported that more classrooms were student-centered than were notstudent-centered and that more classes had opportunities for students to negotiate ormake sense of the ideas being studied by interacting with other students than did nothave these experiences. However, in 18 percent of the classes observed, there were noopportunities for students to negotiate meaning, and in 22 percent of the classes therewas no student autonomy.
Table 4-4 General Impressions of Elementary Science ClassesVeryOften
Often Sometimes
Seldom Never Notreported
The lesson was student-centered. 9 12 6 7 3 7
Students interacted with each otherto make sense of ideas and tohelping each other investigate.
5 12 8 6 7 6
Teacher helped students build uponPrior knowledge and experiences. 12 6 13 6 1 6
Students were given responsibilityand control over their learning andencouraged to think independently.
8 10 7 4 8 7
Classroom Observations
63
61
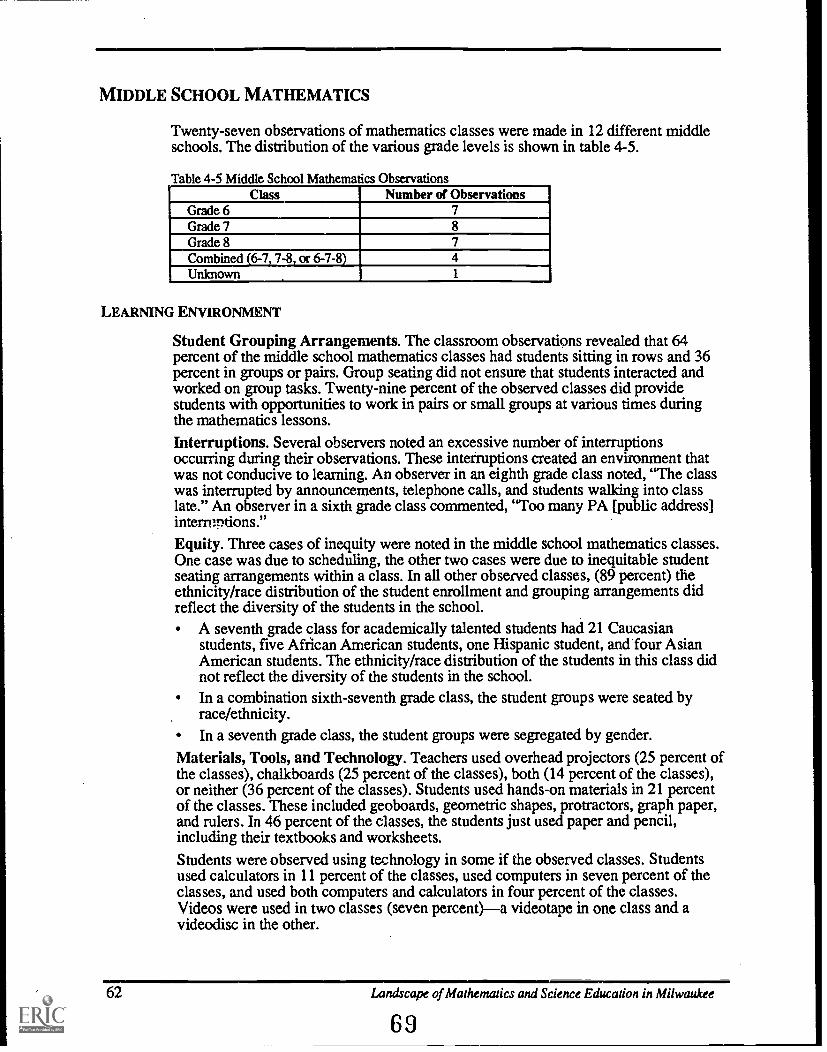
MIDDLE SCHOOL MATHEMATICS
Twenty-seven observations of mathematics classes were made in 12 different middleschools. The distribution of the various grade levels is shown in table 4-5.
Table 4-5 Middle School Mathematics ObservationsClass Number of Observations
Grade 6 7Grade 7 8Grade 8 7Combined (6-7, 7-8, or 6-7-8) 4Unknown 1
LEARNING ENVIRONMENT
Student Grouping Arrangements. The classroom observations revealed that 64percent of the middle school mathematics classes had students sitting in rows and 36percent in groups or pairs. Group seating did not ensure that students interacted andworked on group tasks. Twenty-nine percent of the observed classes did providestudents with opportunities to work in pairs or small groups at various times duringthe mathematics lessons.Interruptions. Several observers noted an excessive number of interruptionsoccurring during their observations. These interruptions created an environment thatwas not conducive to learning. An observer in an eighth grade class noted, "The classwas interrupted by announcements, telephone calls, and students walking into classlate." An observer in a sixth grade class commented, "Too many PA [public address]intermntions."Equity. Three cases of inequity were noted in the middle school mathematics classes.One case was due to scheduling, the other two cases were due to inequitable studentseating arrangements within a class. In all other observed classes, (89 percent) theethnicity/race distribution of the student enrollment and grouping arrangements didreflect the diversity of the students in the school.
A seventh grade class for academically talented students had 21 Caucasianstudents, five African American students, one Hispanic student, and four AsianAmerican students. The ethnicity/race distribution of the students in this class didnot reflect the diversity of the students in the school.In a combination sixth-seventh grade class, the student groups were seated byrace/ethnicity.In a seventh grade class, the student groups were segregated by gender.
Materials, Tools, and Technology. Teachers used overhead projectors (25 percent ofthe classes), chalkboards (25 percent of the classes), both (14 percent of the classes),or neither (36 percent of the classes). Students used hands-on materials in 21 percentof the classes. These included geoboards, geometric shapes, protractors, graph paper,and rulers. In 46 percent of the classes, the students just used paper and pencil,including their textbooks and worksheets.
Students were observed using technology in some if the observed classes. Studentsused calculators in 11 percent of the classes, used computers in seven percent of theclasses, and used both computers and calculators in four percent of the classes.Videos were used in two classes (seven percent)a videotape in one class and avideodisc in the other.
62 Landscape of Mathematics and Science Education in Milwaukee
69
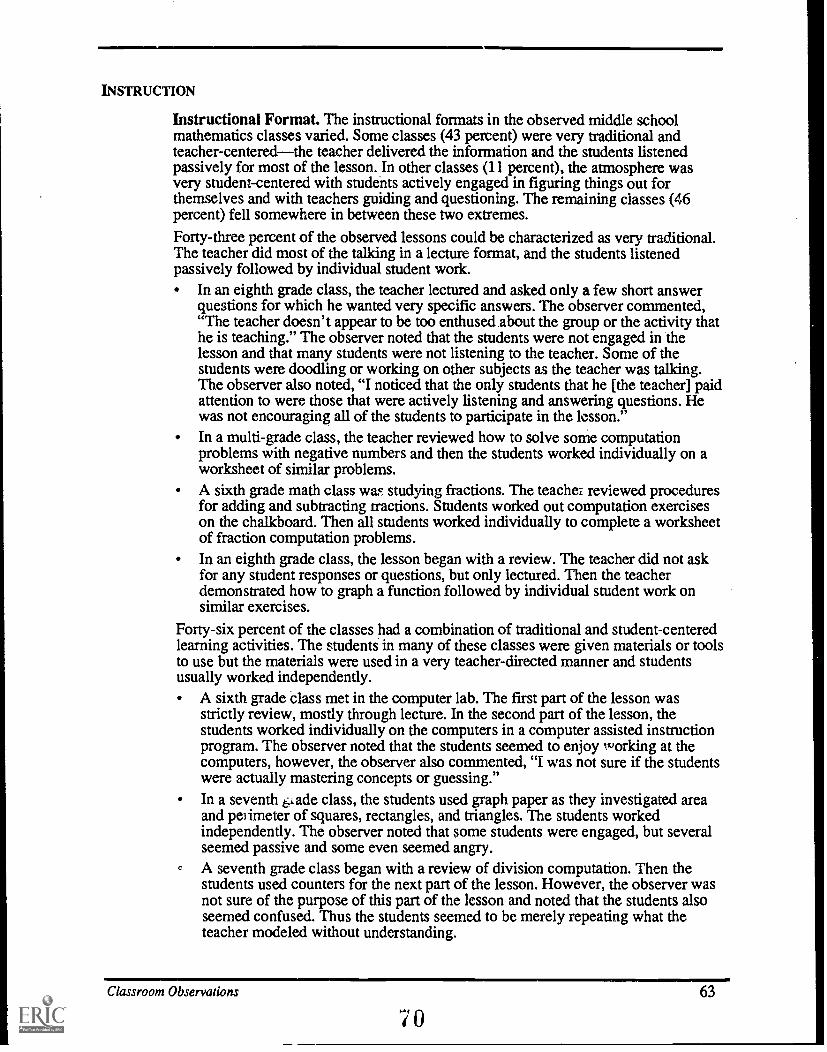
INSTRUCTION
Instructional Format. The instructional formats in the observed middle schoolmathematics classes varied. Some classes (43 percent) were very traditional andteacher-centeredthe teacher delivered the information and the students listenedpassively for most of the lesson. In other classes (11 percent), the atmosphere wasvery student-centered with students actively engaged in figuring things out forthemselves and with teachers guiding and questioning. The remaining classes (46percent) fell somewhere in between these two extremes.
Forty-three percent of the observed lessons could be characterized as very traditional.The teacher did most of the talking in a lecture format, and the students listenedpassively followed by individual student work.
In an eighth grade class, the teacher lectured and asked only a few short answerquestions for which he wanted very specific answers. The observer commented,"The teacher doesn't appear to be too enthused.about the group or the activity thathe is teaching." The observer noted that the students were not engaged in thelesson and that many students were not listening to the teacher. Some of thestudents were doodling or working on other subjects as the teacher was talking.The observer also noted, "I noticed that the only students that he [the teacher] paidattention to were those that were actively listening and answering questions. Hewas not encouraging all of the students to participate in the lesson.In a multi-grade class, the teacher reviewed how to solve some computationproblems with negative numbers and then the students worked individually on aworksheet of similar problems.A sixth grade math class was studying fractions. The teacher reviewed proceduresfor adding and subtracting tractions. Students worked out computation exerciseson the chalkboard. Then all students worked individually to complete a worksheetof fraction computation problems.In an eighth grade class, the lesson began with a review. The teacher did not askfor any student responses or questions, but only lectured. Then the teacherdemonstrated how to graph a function followed by individual student work onsimilar exercises.
Forty-six percent of the classes had a combination of traditional and student-centeredlearning activities. The students in many of these classes were given materials or toolsto use but the materials were used in a very teacher-directed manner and studentsusually worked independently.
A sixth grade class met in the computer lab. The first part of the lesson wasstrictly review, mostly through lecture. In the second part of the lesson, thestudents worked individually on the computers in a computer assisted instructionprogram. The observer noted that the students seemed to enjoy working at thecomputers, however, the observer also commented, "I was not sure if the studentswere actually mastering concepts or guessing."In a seventh &ade class, the students used graph paper as they investigated areaand perimeter of squares, rectangles, and triangles. The students workedindependently. The observer noted that some students were engaged, but severalseemed passive and some even seemed angry.A seventh grade class began with a review of division computation. Then thestudents used counters for the next part of the lesson. However, the observer wasnot sure of the purpose of this part of the lesson and noted that the students alsoseemed confused. Thus the students seemed to be merely repeating what theteacher modeled without understanding.
Classroom Observations 63
70

A small number of observed classes (11 percent) could be characterized as student-centered. These lessons placed the teacher in the role of facilitator and emphasizedthinking and reasoning by the students. The students often worked in small groups orpairs and used hands-on materials to assist them in making sense of mathematics.
In an eighth grade class, the students worked in groups and used tangrams toexplore congruency and geometric properties. The students cooperated well intheir groups. The teacher encouraged the students while allowing them to discovertheir solutions. The observer noted, "The class demonstrated a lot of rapport andrespect for her [the teacher] as they stayed on task and reacted positively."A seventh grade class was studying geometry. During a whole class discussion,the teacher asked many higher-level questions requesting that students explaintheir thinking and even form conjectures. Some of the questions the teacher askedincluded, "What's going on here? .. . Give me an example. . . . Why would amathematician give the same thing two different names? . . . Give me the answerand how do you know. ... What would be another way?" Evidence of risk takingand openness was evident in this class as one student was not afraid to admit shedid not know. The teacher encouraged and assisted the student in thinking it outwhich resulted in success for the student. At one point in the lesson the teacherstated, "I see the same hands." The teacher made a concerted effort to engage allstudentsshe called on those who did and did not raise their hands.
Student Interaction. Twenty-nine percent of the middle school mathematics classesobserved had planned opportunities for the students to interact with each other insmall groups or pairs. In seven percent of the observed classes, the students were toldthat, if they wanted to, they could work with and help each other.
In a sixth grade class, each small group of students was given a set of directionson cards to create a "silent picture." The students had to cooperate without talkingto construct a geometric design.In an eighth grade class, the students sat in pairs and were allowed to worktogether if they wanted. Each student was to complete his or her own set ofproblems. Some groups were observed talking to each other, some on task andsome off task discussions. Some pairs did not talk at all.
In 64 percent of the classes the students worked independently with no student-to-student interaction.
In a multi-grade class, the students worked independently to complete aworksheet containing 21 computations with negative numbers.An eighth grade class was seated in pairs, but the students were not to interact asthey worked individually on their assignment.In a seventh grade class, a student told the observer that the students were notsupposed to help each other.
Real-World Connections. Few real-life connections were observed in middle schoolmathematics classes. In 75 percent of the lessons, no real-life connections wereevident. In the other 25 percent of the le.;sons, the teachers referred to a real-worldsituation to provide an example or reason for studying specific mathematics content.For example, a seventh grade teacher showed a picture of a house to illustrate parallellines; an eighth grade class discussed the fairness of a dart game in their study ofprobability; data on rental property was used to provide information for writingequations in an eighth grade class; and pizza toppings were used to illustratecombinations in a multi-grade level class.
Landscape of Mathematics and Science Education in Milwaukee
71

GENERAL IMPRESSION RATINGS
Figure 4-3 shows how the observers rated their perception of the middle schoolmathematics classes on four dimensions: (a) student-centeredness, (b) negotiationamong students to make sense of the ideas examined, (c) efforts to help students buildupon prior knowledge, and (d) student autonomy. The percents given are based on thereported ratings. The actual frequencies are listed in table 4-6.
Figure 4-3 General Impressions of Middle School Mathematics Classes (percent of reported ratings)
40
30
p
c 20
tos's
0Student-centered Negotiation Prior Knowledge Student Autonomy
111 Very Often
ill Often
E3 Sometimes
[I Seldom
Never
Thirty-eight percent of the classrooms were rated as not providing students with anyopportunity to negotiate meaning or work together to investigate problems. Only afew classrooms (eight percent) were rated as providing students with lots of thesetypes of experiences. Ratings for the other three dimensions were approximately evenwith about the same number of classes being rated favorably as negatively.
Table 4-6 General Im ressiims of Middle School Mathematics ClassesVeryOften
Often Sometimes
Seldom Never Notreported
The lesson was student-centered. 7 5 4 5 5 2Students interacted with each otherto make sense of ideas and tohelping each other investigate.
2 4 7 3 10 2
Teacher helped students build uponprior knowledge and experiences. 6 6 3 5 2
Students were given responsibilityand control over their learning andencouraged to think independently.
4 7 5 3 6 3
11VIMIMIN=11Classroom Observations
(2
65

MIDDLE SCHOOL SCIENCE
A total of 32 classroom observations of science were maae at 12 middle schools. Thedistribution of the observations among the various grade levels is shown in table 4-'7.
Table 4-7 Middle School Science ObservationsClass Number of Observations
Grade 6 8Grade 7 6Grade 8 9Grades 6-7-8 3Unknown 6
LEARNING ENVIRONMENT
Student grouping arrangements. Seventy-eight percent of the observed scienceclasses at the middle school level had students seated at tables or desks in groups orpairs. Sixteen percent of the classes had students seated in desks arranged in rows.The seating arrangements were not recorded for two of the observed classes.
Overcrowded classrooms. Forty-four percent of the middle school scienceobservations included descriptions of overcrowded classrooms due to inadequaterooms and/or large numbers of students. Some observers commented that the studentsand the teachers functioned well in spite of the conditions.
One sixth grade classroom was originally a home economics roomlong andvery narrow.One observer of a seventh grade class wrote, "If this class is confined to thisroom, there are big limitations placed on what activities will occur. The roomlacks tables, water access, hook-ups for electricity, and storage space."Another classroom for eighth graders is much too small for 39 students. They ranout of space to work on their projects so some students were working in the halland the library.A class of eighth graders is in a small room with seven rowsa total of 45 desks.There is little to no space to move between the rows.Another observer of a sixth grade class wrote, "Excited, engaged students ofscience were observed in this classroom. There were no incidents of poor orinappropriate behavior. I was impressed with the quality of instruction, despite thepoor science facilities. This requires an extra effort and dedication to students'learning on the part of the teacher who made due with less than should beexpected."
Interruptions. One interesting occurrence emerged from 16 percent of theobservations of middle school science classes. Observers noted numerousinterruptions during single class periods interfering with instruction. Theseinterruptions seemed equally detrimental to lesson delivery whether the lesson wasstudent or teacher-centered. Interruptions included: public address announcements,late students, a father picking up his son's science fair project, other adults enteringthe room to talk to the teacher or to the students, intra-school phone calls, and others.Observers reported that students were very distracted by these interruptions.
Equity. Observations of seating arrangements revealed that 69 percent of the scienceclasses at the middle school level exhibited diversity in the seating and groupingarrangements of students with regards to both gender and ethnicity/race. Six percentof the observations did not report equity. In the other 29 percent of the observed
66 Landscape of Mathematics and Science Education in Milwaukee
73

classes, student grouping arrangements showed evidence of segregation by gender orethnicity/race, by both gender and ethnicity, or by unspecified segregation.
In nine percent of the classes, groups or pairs or individuals were segregated bygender.In 13 percent of the classes, groups or pairs or individuals were segregated byrace.
In three percent of the classes, groups or pairs or individuals were segregated byboth race and gender.
All observers reported that teachers interacted with all students regardless ofethnicity/race or gender, giving groups and individual students equal opportunities toanswer questions, ask questions, or discuss activities with the teacher. An observercommented that the teacher "corrected all students equally."Materials, tools, and technology. Availability and use of tools, technology,materials, and equipment varied widely in the middle school science classes. Seventy-eight percent of the classrooms were well supplied with science materials andequipment, such as microscopes, and with other science related tools, such as plants,rocks, animals, and models. The other 22 percent of the classes had little or no sciencematerials or equipment visible during class time. One observer noted that the roomwas so small, it was hard to tell where any equipment could be stored. Some otherrooms had cabinets and cupboards, so it was assumed that materials were inside. Twoother observers wrote about classrooms they visited:
In a seventh grade class, it was noticed that, "Both teacher and assistant are doingan excellent job in helping the students understand what's going on in theirexperiments, in spite of the crowded class and limited resources."An observer of an eighth grade class wrote, "The small crowded room with noscience or math manipulatives observable was depressing. Discussing abstractconcepts with no visuals, concrete materialsnot even a chalk boardwasdisturbing."
Sixteen percent of the classes had one or more computers available to the students.Only one class used computers during an observation. One class had calculatorsvisibly available for the students, however, they were not using them at the time.Thirty-one percent of the classes had one or more of the following in their rooms:VCR, TV, videodisc player, and overhead projector. Most of this equipment,however, was not used during the observations.
INSTRUCTION
Instructional format. The instructional formats in the middle school science classeswere characterized as teacher-centered, student-centered, or a combination of both.Over half of the teachers (58 percent) exhibited a more traditional approach toteaching, that of teacher-centered lectures, question and answer periods, and studentsworking independently on assignments.
The topic in a seventh grade class was metric conversions. The teacher lectured,directed, and disciplined the students. The students copied notes from the boardinto their notebooks, wrote answers individually on the chalkboard, gave roteanswers, and displayed little enthusiasm.Another observer wrote, "This eighth grade teacher was a director. She called onpeople to read; she asked the questions; she stated the facts. The topic wasminerals and the students read the goals and things to learn from the book. Theyread about atomic structure. The teacher would pause in the reading to ask factual
Classroom Observations
7467

questions for clarification. No models, diagrams, or visuals were used tosupplement the atomic structure. This was reading in the science content."Another class had students who were quiet and well-behaved. They read aloud,taking turns, and they wrote down definitions and listened to the teacher, but theyseemed bored and tired.Another observer of a sixth grade class described the instructional format as "Theold-fashioned way" of teaching. "This pleasant teacher was very much in chargeof distributing information. The students recited memorized or written answers.This teacher enjoys what he's doing, but his enthusiasm wasn't transferred to thekids. What he could do with some hands-on training!"
One fourth of the classes were, for the most part, student-centered, allowing thestudents opportunities for inquiry, interaction, sharing, and creativity. The teachers'roles were that of facilitators, coaches, and guides.
In one combined sixth, seventh, and eighth grade class, the students weresurrounded with an extremely positive learning environment. The studentsappeared to be very enthused and involved in learning about the digestive system.The use of the students to teach and develop written exercises went over very wellThe use of audiovisual equipment by the students for a special news break waseffective. The teacher's role as facilitator worked well. The students were stillaware of her role as the teacher, even though she was in the background for themost part. There was good cooperation among the students to help each otherlearn the material. The observer noted, "Overall, this lesson was effective andpositive. This is what school should be about everyday and everywhere in MPS."In a sixth grade class, the teacher was a facilitatora roving eye-witness,encourager, question answerer. This instructor was comfortable with theexcitement and noise level genertted by the activityDuring an adaptation of some lessons from the JASON Project, the teacher of acombined sixth, seventh and eighth grade class had students integrate science withart, poetry, music, mathematics, and language arts by working in small groups onpresentations to the rest of the class. Each group had a problem to solve.
An even smaller number of classes (13 percent) displayed a mixture of both teacher-centered and student-centered instruction. Two typical examples follow:
Initially the teacher did most of the talking in this seventh grade class. After theexplanation, the students did most of the taking. They first listened to the teacher,then worked in groups on a hands-on problem solving activity, then explainedtheir reasoning to the rest of the group.In an eighth grade class, the students initially corrected homework which wasfollowed by a brief question and answer session with the whole group, and finallya hands-on session of rock characteristics.
One sixth grade class could not be placed in any of the above instructional formats.As the observer noted, "In general, the lack of an organized lesson was theoutstanding observation. It seemed that the class period was wasted and unproductive.I thought I was in a homebase where students were passing the time with a worksheetwhile they socialized and waited to eat lunch. This teacher was aware that someonewould be visiting on this date."Student interaction. Sixty-three percent of the middle school science classesprovided minimal or no opportunities for the students to interact. When they wereallowed to interact, the students only engaged in social discussions. Six percent of theobservations did not report on student interaction.
68 Landscape of Mathematics and Science Education in Milwaukee
75

Thirty-one percent of the classes indicated opportunities for the students to answereach others' questions, communicate about the topic, cooperate and collaborate witheach other, and brainstorm solutions to problems.
The cooperative lesson in an eighth grade class showed how the ability of onegroup to describe rocks well, directly influenced the ability of the second group tomatch descriptions with particular rocks.A lab activity for some sixth graders involved dissecting owl pellets. The pairs ofstudents were actively engaged. Each team made discoveries and could be heardhypothesizing on these. Students were able to share knowledge and the process inwhich they were involved. The verbal communication between students was taskoriented. Some students moved to other groups to see their discoveries. All of thiswas appropriate behavior. The students were sharing space, tools, and owl pellets.Taking turns was accomplished among the students with no hassles. The teachersmiled and encouraged the students with positive statements.One observer noticed an interesting twist to student interactions in a sixth gradeclass. The students were asked to use a worksheet to do an activity showing howmuch of a leaf an insect would eat. The teacher distributed the sheets, scissors,and paper. The students then looked to each other for help in ascertaining what thetask was and what they were supposed to do.
Real-world connections, No real-life connections were observed in 53 percent of thescience classes observed at the middle school level. One lesson involved studentslooking at a transparency of planaria and copying down information in theirnotebooks. The observer wrote, "The instructor could have had the class engagedwhen he caught their interest for a moment upon mt.. 'oning planaria regeneratingtwo or more heads. His lesson was boring. Why not experiment with real worms ofallkinds?" Twelve percent of the observations did not report on this area.
In 32 percent of the classes, the teachers referred to real-life examples of scienceconcepts. An example of this kind of connection was from a class studying types ofrocks; the teacher reviewed the use of stones as construction material over history. Inthe remaining three percent of the classes, real-life connections were used as thecontexts for providing hands-on experiences to help students connect the lesson withtheir lives.
The teacher used a newsroom format with a group of sixth, seventh and eighthgraders who were learning about the digestive system.The activity was finding the pulse rate of an earthworm for a combined gradegroup. The students worked in pairs. They had to make calculations and find theaverage of multiple readings. Then they took their own pulse rates and comparedthem to the earthworms' rates.
GENERAL IMPRESSION RATINGS
The observers rated their perception of each middle school science class on fourdimensions: (a) student-centeredness, (b) negotiation among students, (c) efforts tobuild upon prior knowledge, and (d) student autonomy. Figure 4-4 shows how theobservers rated the classes in terms of the four dimensions. The percents given arebased on the reported ratings. The actual frequencies are listed in table 4-8.Forty-eight percent of the classrooms were rated as only sometimes makingconnections to prior knowledge. Thirty percent of the classes were rated as neverproviding opportunities for student autonomy. Ratings on student-centeredness andnegotiation were approximately even with about the same number of classes beingrated favorably as negatively.
Classroom Observations 69
76

Figure 4-4 General Impressions of Middle School Science Classes (percent of reported ratings)
50
40
p
30
20
10
0'4`
Student - centered Negotiation Prior Knowledge Student Autonomy
111 Very Often
Often
Sometimes
Seldom
II Never
Table 4-8 General Impressions of Middle School Science ClassesVeryOften
Often Sometimes
Seldom Never Notreported
The lesson was student-centered. 7 6 3 4 7 5Students interacted with each otherto make sense of ideas and tohelping each other investigate.
4 9 2 8 4 5
Teacher helped students build uponprior knowledge and experiences. 4 13 4 2 5
Students were given responsibilityand control over their learning andencouraged to think independently.
7 7 1 8 5
HIGH SCHOOL MATHEMATICS
A total of 18 obse:vations of mathematics classes were made at six high schools. Thedistribution of the observations among the various classes is shown in table 4-9.
Table 4-9 High School Mathematics ObservationsClass Number of Observations
Agl ebra 9 ,
Applied Math-
2Geometry 6Advanced Placement Calculus 1
LEARNING ENVIRONMENT
Student Grouping Arrangements. The classroom observations revealed that 78percent of the high school mathematics classrooms had students sitting in rows.Twenty-eight percent of the observations showed that students did have opportunitiesto work in pairs or small groups at various times during the mathematics lessons.
70 Landscape of Mathematics and Science Education in Milwaukee
7'7

Equity. Enrollment of students in the observed high school mathematics classes wasnoted for patterns of diversity in race/ethnicity and gender. Evidence of inequity wasobserved in two of the advanced mathematics classes. The AP Calculus class had 13Caucasian students and one African American student. A junior level geometry classhad 21 Caucasian students and three African American students. The ethnicity/racedistribution of the students in these two advanced classes did not reflect the diversityof the students in the school. In all other classes, the ethnicity/race distribution of thestudents did reflect the diversity of the students in the school. The observed highschool mathematics classes were equitable in terms of gender. Approximately thesame number of males and females were observed in all classes.
Observations were also made of the diversity of student seating arrangement and pairor group membership. In 72 percent of the observed classes, students sat with andworked with each other regardless of ethnicity/race or gender. In 28 percent of theclasses, patterns of inequity occurred in student groups. It was usually noted that thisoccurred by student choice and not by teacher direction, as the students were allowedto choose their own group members.
In 11 percent of the classes, student groups were segregated by race/ethnicity.In 17 percent of the classes, student groups were segregated by gender.
Regarding student- student and teacher-student interaction during a lesson, observersnoted that, in general, student-student and student-teacher interaction was equitable.Students sat with and worked with each other regardless of ethnicity/race or genderand teachers interacted with all students regardless of ethnicity/race or gender. Anobserver noted, "The teacher called on students who were and were not volunteeringso that almost everyone got involved somewhat in the lesson." A few exceptions didexist.
In one of the classes with a majority of Caucasian students, an African - Americanfemale sat at a table by herself in the front of the room. No interaction wasobserved between her and the other students. This student watched what theteacher was doing, but did not participate.In one advanced mathematics class, the teacher allowed students to call outanswers rather than calling on individual students by name. Thus, the teacherinteracted mainly with the students who were calling out and, in almost everycase, this was a male studenteight of the 14 students in the class were female.
Materials, Tools, and Technology. Little variety occurred in the materials and toolsutilized by the teachers and the students during the high school mathematicsobservations. Teachers used overhead projectors (44 percent of the observations) orchalkboards (39 percent of the observations) or both (17 percent of the observations).
Students used graph paper and rulers in two classes. Other than this, the teachers andstudents were not observed using any other types of materials besides paper andpencil. Students used paper and pencil only, including textbooks and worksheets, in56 percent of the classes.
In 33 percent of the classes, students were seen using scientific calculators orgraphing calculators. In one class, a computer was used to organize data in aspreadsheet.
INSTRUCTION
Instructional Format. The instructional formats in the observed high schoolmathematics classes showed little variety. Most classes (83 percent) could becharacterized as very traditional and teacher-centeredfor the most part, the teacherdelivered the information, and the students listened passively.
laniremireara
Classroom Observations 71
73

In a ninth grade algebra class, most students were passive and not engaged. Theteacher has a quiet pleasant manner, but didn't "turn-on" the kids. The teacher didmost of the talking. The students who did respond only gave short answers withno explanations. The class did a few examples of solving linear equations togetheras a whole class, and then students worked independently on an assignment whilethe teacher circulated around the room.In a different ninth grade algebra class, the interaction between the teacher and thestudents was warm, friendly, and encouraging. The teacher walked the studentsthrough some sample problemssetting up equations for some word problems.Little or no discussion occurred as to why the equations were set up in a particularway. Then the students did the other problems on their own.In a geometry class, the teacher led a review for 15 minutes, preparing studentsfor the test. The teacher then gave the students a ten item true-false test ongeometry vocabulary such as parallel and perpendicular lines and planes.A geometry class was mostly a lecture on proofs and how to take notes. Most ofthe hour was spent listening to the teacher. Some students volunteered answers tothe teacher's questions. Homework was assigned near the end of the period.A different geometry class seemed to be going through the motions. All thestudents did what they were supposed to do, but with little to no enthusiasm orinterest. The teacher directed the students and did most of the talldng. Thestudents answered the questions when the teacher called on them.
In some classes (17 percent), the instructional format was mixed with somecomponents that were traditional and other components that were more student-centered. These classes tended to engage students in more thinking and reasoning andfiguring problems out for themselves with teachers guiding and questioning.
In a ninth grade algebra class, the teacher encouraged responses and participationfrom all students. He asked the students if they agreed with answers that weregiven. The class investigated disagreements about any of the solutions. Theteacher did a lot of the talldng but it was designed to engage students and to getthem to respond and explain their thinking.In an AP calculus class, the teacher told the students not to rely on memorizationof the formulas, but rather to visualize them by sketching and then deriving them.A student asked the teacher, "Do we need that part?" The teacher replied, "Well,let's try it and see?" There was some, but not much student-student interactionduring the lesson, and even with the enthusiasm of the teacher, two students weresleeping on and off.
Student Interaction. In 72 percent of the high school mathematics classes, thestxlents worked independently with no opportunities for them to interact with each todiscuss mathematics. In 22 percent of the classes, the students were told that theycould work with and help each other. In six percent of the classes, the studentsworked in groups on a joint task that required them to interact and work together.
In a geometry class, the teacher did most of the talking. The students answeredquestions when called on. The students did not interact with each other during thelesson except for casual conversation.In an algebra class, the students worked mainly by themselves. Some students didask each other opinions about what to do to solve the problems.In another algebra class, the teacher did most of the talking. There was no studentinteraction.
72 Landscape of Mathematics and Science Education in Milwaukee
79

In a different algebra class, a friendly interchange with mutual respect occurredbetween the teacher and the students. Then the students worked independently onthe text assignment. The teacher told the students that they could work together,but very few did so.
Real-World Connections. Very few connections were made to real-life situations inthe high school mathematics classes. In 72 percent of the classes, no real-lifeconnections were evident. In 22 percent of the classes, the teachers merely referred toa real-world situation to provide an example or reason for studying specificmathematics content. For example, reference was made to cheese being in the shapeof a rectangular prism in a geometry class and to population centering in a differentgeometry class. In a calculus class, connections were made to the solar system modeland static electricity. The teacher in this class also asked, "Suppose you're anengineer wanting to devise shock absorbers for a car?"
GENERAL IMPRESSION RATINGS
The observers rated their perception of each high school mathematics class on fourdimensions: (a) student-centeredness, (b) negotiation among students to make senseof the ideas examined, (c) efforts to help students build upon prior knowledge, and(d) student autonomy. Figure 4-5 shows how the observers rated the classes. The.percents given are based on the reported ratings. The actual frequencies are listed intable 4-10.
Figure 4-5 General Impressions of High School Mathematics Classes (percent of reported ratings)
50
e 30
20
10
Student-centered Negotiation Prior Knowledge 'Student Autonomy
II Very Often
III Often
Sometimes
ate,IIII Never
No classes were rated "very often" in providing a student-centered environment oropportunities for student negotiation. In fact, 76 percent of the high schoolmathematics classes were rated as seldom or never being student-centered, and 82percent were rated as seldom or never providing opportunities for student negotiation.Although all classes were rated as making connections to prior knowledge, fewprovided opportunities for student autonomy.
Classroom Observations
60
73

Table 4-10 General Impressions of High School Mathematics ClassesVeryOften
Often Sometimes
Seldom Never Notreported
The lesson was student-centered. 0 1 3 7 6 1
Students interacted with each otherto make sense of ideas and tohelping each other investigate.
0 2 1 7 7 1
Teacher helped students build uponprior knowledge and experiences. 3 2 5 7 0 1
Students were given responsibilityand control over their learning andencouraged to think independently.
1 2 2 6 4 3
HIGH SCHOOL SCIENCE
A total of 15 classroom observations of science were made at five high schools. Thedistribution of the observations among the various science classes is shown in table 4-11. Most classes met for 45 to 50 minutes per day, a typical period, except for theadvanced placement (AP) biology class which met for two hours each day.
Table 4-11 Hi h School Science ObservationsClass Number of Observations
sical Science 4_tillBiology 3Chemistry 3Physics 4Advanced Placement Biology 1
LEARNING ENVIRONMENT
Student Grouping Arrangements. The classroom ob.servations revealed that 87percent of the high school science classrooms had students sitting in rows. Inapproximately half (54 percent) of the classes, students had opportunities to work inpairs or small groups at various times during the science lessons.Equity. Patterns of inequity were observed. The ethnicity/race distribution of thestudents in the more advanced science classes (chemistry, physics, and AP biology)did not reflect the diversity of the students in the school. Sixty-three percent of theobservations of advanced science classes revealed a lack of diversity. In the lower-level science classes (physical science and biology), the ethnicity/race distribution ofthe students did reflect the diversity of the students in the school.
An advanced placement biology course had 12 students present on the day of theobservation. Eleven of these students were Caucasian and one was Hispanic.In a chemistry class, 16 of the 25 students were Caucasian, seven were African-American, and two were Hispanic.In another chemistry class, 12 of the 21 students were Caucasian, eight wereAfrican American, and one was Asian.In a physics class, 12 of the 14 students were Caucasian, one was Asian, and onewas Hispanic. In another physics class, 16 of the 26 students were Caucasian,seven were African-American, and three were Hispanic.
41111.1111MOIMMV
74 Landscape of Mathematics and Science Education in Milwaukee
81
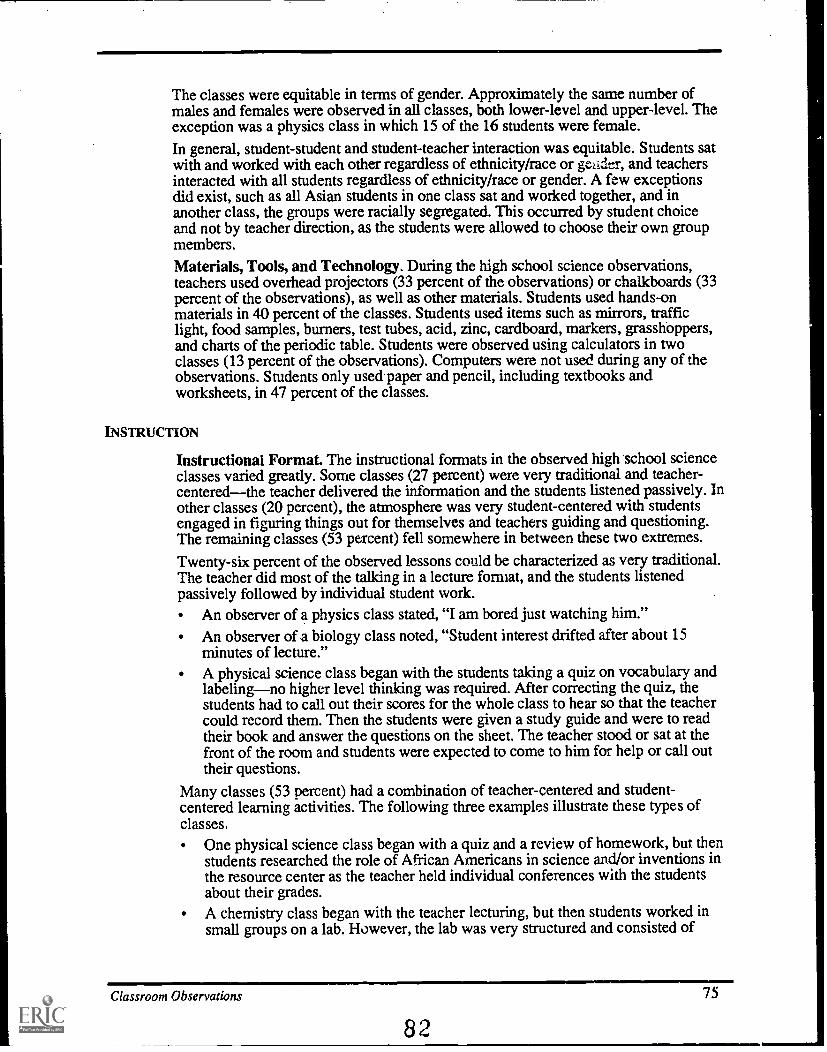
The classes were equitable in terms of gender. Approximately the same number ofmales and females were observed in all classes, both lower-level and upper-level. Theexception was a physics class in which 15 of the 16 students were female.
In general, student-student and student-teacher interaction was equitable. Students satwith and worked with each other regardless of ethnicity/race or gezider, and teachersinteracted with all students regardless of ethnicity/race or gender. A few exceptionsdid exist, such as all Asian students in one class sat and worked together, and inanother class, the groups were racially segregated. This occurred by student choiceand not by teacher direction, as the students were allowed to choose their own groupmembers.Materials, Tools, and Technology. During the high school science observations,teachers used overhead projectors (33 percent of the observations) or chalkboards (33percent of the observations), as well as other materials. Students used hands-onmaterials in 40 percent of the classes. Students used items such as mirrors, trafficlight, food samples, burners, test tubes, acid, zinc, cardboard, markers, grasshoppers,and charts of the periodic table. Students were observed using calculators in twoclasses (13 percent of the observations). Computers were not used during any of theobservations. Students only used paper and pencil, including textbooks andworksheets, in 47 percent of the classes.
INSTRUCTION
Instructional Format. The instructional formats in the observed high school scienceclasses varied greatly. Some classes (27 percent) were very traditional and teacher-centeredthe teacher delivered the information and the students listened passively. Inother classes (20 percent), the atmosphere was very student-centered with studentsengaged in figuring things out for themselves and teachers guiding and questioning.The remaining classes (53 percent) fell somewhere in between these two extremes.
Twenty-six percent of the observed lessons could be characterized as very traditional.The teacher did most of the talking in a lecture format, and the students listenedpassively followed by individual student work.
An observer of a physics class stated, "I am bored just watching him."An observer of a biology class noted, "Student interest drifted after about 15minutes of lecture."A physical science class began with the students taking a quiz on vocabulary andlabelingno higher level thinking was required. After correcting the quiz, thestudents had to call out their scores for the whole class to hear so that the teachercould record them. Then the students were given a study guide and were to readtheir book and answer the questions on the sheet. The teacher stood or sat at thefront of the room and students were expected to come to him for help or call outtheir questions.
Many classes (53 percent) had a combination of teacher-centered and student-centered learning activities. The following three examples illustrate these types ofclasses.
One physical science class began with a quiz and a review of homework, but thenstudents researched the role of African Americans in science and/or inventions inthe resource center as the teacher held individual conferences with the studentsabout their grades.A chemistry class began with the teacher lecturing, but then students worked insmall groups on a lab. However, the lab was very structured and consisted of
Classroom Observations
82
75

4111111=1111111
students following directions with no opportunities for them to pose their ownquestions.In a physical science class, the students were studying the properties of mirrors.They were to follow a set of written directions and answer a series of questions.The observer noted that the students were generally passive as they workedindividually to answer questions.
Twenty percent of the observed classes were student-centered. These lessons placedthe teacher in the role of facilitator.
In a physics class, the teacher often answered questions by asking questions. Heoften asked students "why" and encouraged them to look up the neededinformation rather than answering the questions himself.In a different physics class, the students did most of the talking and the teacherwas a facilitator. When students asked questions, the teacher was there to help butnot to answer the questions. She often asked, "How did you come up with theanswer?" The students explained how they arrived at their answers.In a biology class, students learned how to test foods for carbohydrates and wereto bring in foods to be tested. The observer noted, "The students were to reasonout what results should occur in the testing" and "One student was so curiousabout the tests that he got part of his lunch to see how it would test."
Student Interaction. Fifty-four percent of the high school science classes observedhad planned opportunities for the students to interact with each other in small groupsor pairs. Thus, in 46 percent of the classes students just worked individually.
The teacher allowed the students to work together in a physical science class, butmost just socialized and did not actually work cooperatively.In a biology class, the students worked individually. Some informal interactionamong the students occurred, but generally nonproductive off-task behavior.In a different chemistry class, there was some talking to among the students, butonly about non-related subjects.In a chemistry class, the students interacted very well with each other. Lots oflearning communication occurred. The students were involved in cooperativework and seemed to enjoy working together.In a biology class, as the students dissected grasshoppers, they showed great teamwork, attentive work, excitement of experience, and sense of accomplishment.
Real-World Connections. The presence of real-life connections in the observed highschool science lessons were generally weak or non-existent. In 47 percent of thelessons, no real-life connections were evident. In 40 percent of the lessons, theteachers merely referred to a real-world example. For example, reference was made tofireworks and car combustion in a chemistry class and a teacher mentioned electricitybills in a physical science class. In a chemistry class, the teacher asked students tothink about and discuss "Why is this useful?" In 13 percent of the lessons, the real-life connection became the focus for student investigation. A biology class discussedthe carbohydrates in the foods the students eat, made conjectures about the contents,and then tested the foods. An AP biology class discussed and collected data onstudents' genetic traits.
GENERAL IMPRESSION RATINGS
The observers rated their perception of each high school science class on fourdimensions: (a) student-centeredness, (b) negotiation among students, (c) efforts tobuild upon prior knowledge, and (d) student autonomy. Figure 4-6 shows how the
76 Landscape of Mathematics and Science Education in Milwaukee
83

observers rated the classes in terms of the four dimensions. The percents given arebased on the reported ratings. The actual frequencies are listed in table 4-12.
Figure 4-6 General Impressions of High School Science Classes (percent of reported ratings)
The observers rated 46 percent of the classes as providing students with opportunitiesto negotiate meaning and to work with each other to investigate problems, while 46percent of the classes seldom or never provided these types of experiences. Seventy-six percent of the teachers were observed often or very often helping students build ontheir prior knowledge and experiences.
Table 4-12 General Impressions of High School Science Classes (frequenciesVeryOften
Often Sometimes
Seldom Never Notreported
The lesson was student-centered. 4 5 0 1 3 2Students interacted with each otherto make sense of ideas and tohelping each other investigate.
6 1 0 5 1 2
Teacher helped students build uponprior knowledge and experiences. 5 5 1 1 1 2Students were given responsibilityand control over their learning andencouraged to think independently.
4 4 2 0 3 2
SUMMARY
Observations of 190 mathematics and science classes were conducted during sitevisits to MPS elementary, middle, and! igh schools. These observations helped toanswer the question, "What does mathematics and science education currently looklike in MPS?" Upon analyzing the data from the classroom observations, someinteresting comparisons were made and several consistencies were evident. Thefollowing is a summary of some of the major findings from the observations ofmathematics and science classes in MPS.
Classroom Observations
8477
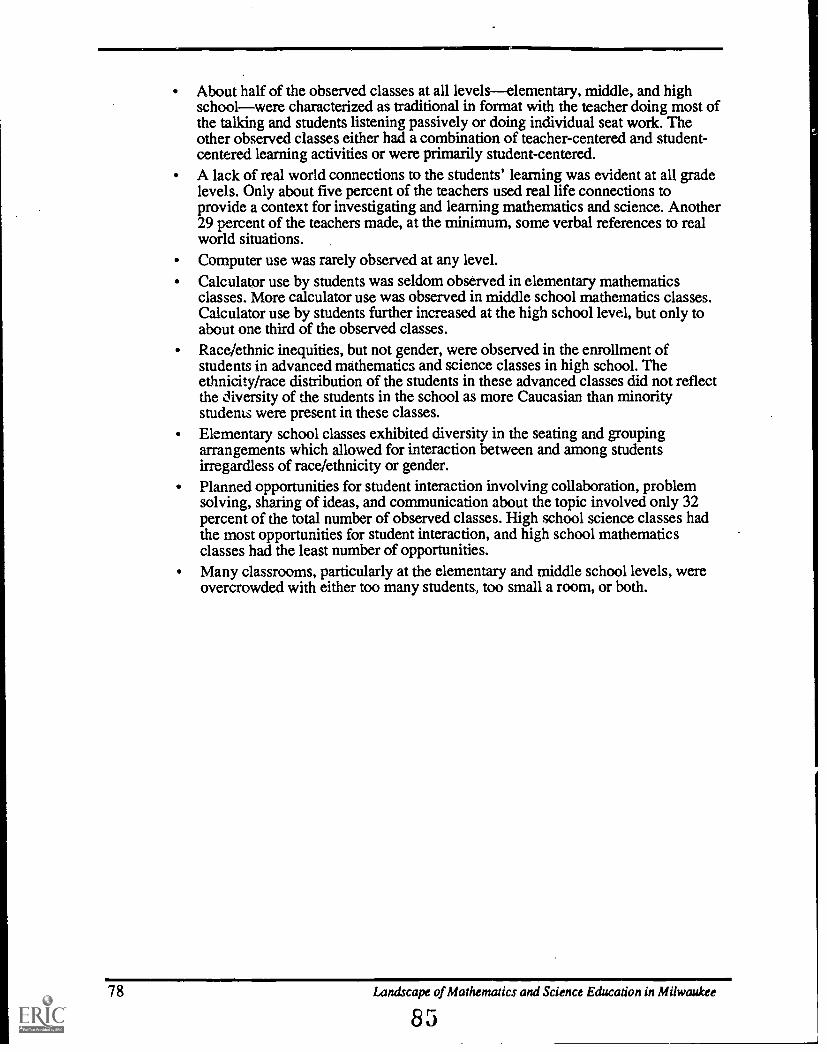
About half of the observed classes at all levelselementary, middle, and highschoolwere characterized as traditional in format with the teacher doing most ofthe talking and students listening passively or doing individual seat work. Theother observed classes either had a combination of teacher-centered and student-centered learning activities or were primarily student-centered.A lack of real world connections to the students' learning was evident at all gradelevels. Only about five percent of the teachers used real life connections toprovide a context for investigating and learning mathematics and science. Another29 percent of the teachers made, at the minimum, some verbal references to realworld situations.Computer use was rarely observed at any level.Calculator use by students was seldom observed in elementary mathematicsclasses. More calculator use was observed in middle school mathematics classes.Calculator use by students further increased at the high school level, but only toabout one third of the observed classes.Race/ethnic inequities, but not gender, were observed in the enrollment ofstudents in advanced mathematics and science classes in high school. Theethnicity/race distribution of the students in these advanced classes did not reflectthe diversity of the students in the school as more Caucasian than minoritystudent; were present in these classes.Elementary school classes exhibited diversity in the seating and groupingarrangements which allowed for interaction between and among studentsirregardless of race/ethnicity or gender.Planned opportunities for student interaction involving collaboration, problemsolving, sharing of ideas, and communication about the topic involved only 32percent of the total number of observed classes. High school science classes hadthe most opportunities for student interaction, and high school mathematicsclasses had the least number of opportunities.Many classrooms, particularly at the elementary and middle school levels, wereovercrowded with either too many students, too small a room, or both.
Landscape of Mathematics and Science Education in Milwaukee
8'
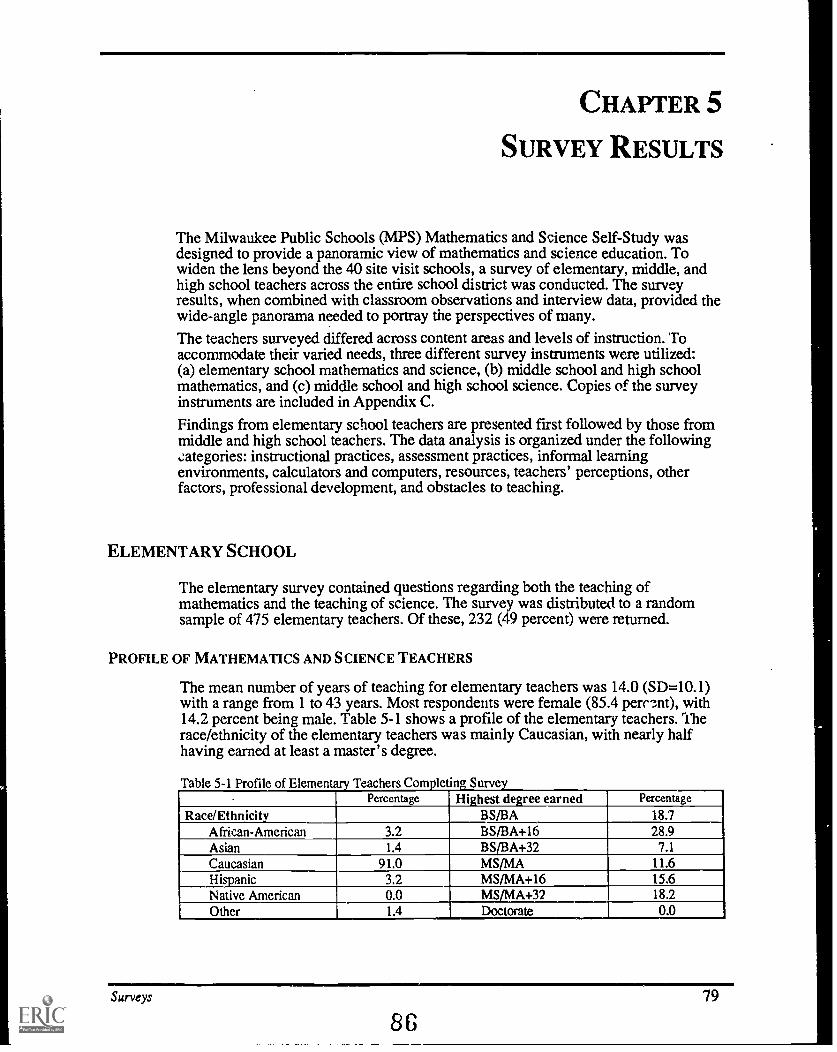
CHAPTER 5
SURVEY RESULTS
The Milwaukee Public Schools (MPS) Mathematics and Science Self-Study wasdesigned to provide a panoramic view of mathematics and science education. Towiden the lens beyond the 40 site visit schools, a survey of elementary, middle, andhigh school teachers across the entire school district was conducted. The surveyresults, when combined with classroom observations and interview data, provided thewide-angle panorama needed to portray the perspectives of many.
The teachers surveyed differed across content areas and levels of instruction. Toaccommodate their varied needs, three different survey instruments were utilized:(a) elementary school mathematics and science, (b) middle school and high schoolmathematics, and (c) middle school and high school science. Copies of the surveyinstruments are included in Appendix C.
Findings from elementary school teachers are presented first followed by those frommiddle and high school teachers. The data analysis is organized under the following,ategories: instructional practices, assessment practices, informal learningenvironments, calculators and computers, resources, teachers' perceptions, otherfactors, professional development, and obstacles to teaching.
ELEMENTARY SCHOOL
The elementary survey contained questions regarding both the teaching ofmathematics and the teaching of science. The survey was distributed to a randomsample of 475 elementary teachers. Of these, 232 (49 percent) were returned.
PROFILE OF MATHEMATICS AND SCIENCE TEACHERS
The mean number of years of teaching for elementary teachers was 14.0 (SD=10.1)with a range from 1 to 43 years. Most respondents were female (85.4 perr-.-,nt), with14.2 percent being male. Table 5-1 shows a profile of the elementary teachers. Therace/ethnicity of the elementary teachers was mainly Caucasian, with nearly halfhaving earned at least a master's degree.
Table 5-1 Profile of Elementary Teachers Completing SurvePercentage Highest degree earned Percentage
Race/Ethnicity BS/BA 18.7African-American 3.2 BS/BA+16 28.9Asian 1.4 BS/BA+32 7.1Caucasian 91.0 MS/MA 11.6Hispanic 3.2 MS/MA+16 15.6Native American 0.0 2%.ISaikt -32
Doctorate18.2
Other 1.4 0.0
Surveys
8679

INSTRUCTIONAL PRACTICES
Figure 5-1 and table 5-2 show that while almost half of the teachers spent five ormore hours teaching mathematics each week, only 5.4 percent of the teachers devotedthat much time to science. Over half of the elementary teachers taught science for twoor fewer hours each week.
Figure 5-1 Amount of Instruction Time Each Week
50
40
e 30
20
10 10
0 hours 1 hour 2 hours 3 hours 4 hours 5 or more
II Mathematics
III Science
Table 5 -2 Amount f Time for Mathematics and Science Each WeekMathematics
PercentageScience
Percentage
None 3.1 5.41 hour 4.4 28.52 hours 8.8 34.83 hours 12.8 19.54 horns 25.2 6.35 or more hours 45.6 5.4
Teachers were asked which of the statements listed in table 5-3 best described howmathematics and science were taught in their classrooms. About half of the teachersreported integrating mathematics and science with each other or with other subjects.
Table Description of Elementary Mathematics and Science InstructionPercenta e
Integrated with each other 11.5late ted with other subjects 40.4Taught se tely 44.0Other 4.1
Figure 5-2 and table 5-4 indicate the frequency of use for a variety of instructionalmethods. On a daily basis, whole group discussion was used from three to five timesas often as small group or pair work. A few teachers reported that they never havetheir students work in small groups or pairs.
80 Landscape of Mathematics and Science Education in Milwaukee
87

Figure 5-2 Small Group Work
50
40
e 30 _r
e 20n
t
10
Almost daly Weeidy FOnce a month' Rarely Never
Mathematics
11 Science
Table 5-4 Frequency of Small and Large Group Activities
Almost dailyPercentage
At leastweekly
Percentage
At leastonce a month
PercentageRarely
PercentageNever
Percentage
Small group workMathematics 23.6 41.0 21.2 13.2 0.9Science 13.4 36.6 33.2 12.4 4.5
Students working in pairsMathematics 25.0 47.0 17.0 9.9 0.5Science 8.0 38.7 21.2 19.1 3.0
Whole-group discussionsMathematics 81.3 10.7 3.3 3.3 1.4
Science 42.0 47.2 8.5 0.9 1.4
Teachers were asked to report on the frequency that the instructional practices listedin table 5-5 occurred in their teaching of mathematics and science. Teachers explainor demonstrate often in both mathematics and science. About 40 percent of theteachers indicated that their students do not use textbooks in either mathematics orscience. About one third of the students use worksheets daily in learningmathematics.
Teachers also reported on the use of materials such as manipulatives or equipmentand on the occurrence of students doing experiments. Forty percent of the teachersreported infrequent or no use of manipulatives or equipment in science, and about 20percent of the teachers reported infrequent or no use of manipulatives or equipment inmathematics. About one fourth of the teachers stated that students rarely or never doexperiments in science with 40.1 percent of the teachers indicating that students doexperiments about once a month.
Surveys
8881

82
Table 5-5 Freuuencv of Instructional Practices in Elementary School
Almost dailyPercentage
At leastweekly
Percentage
At leastonce a month
PercentageRarely
PercentageNever
Percentage
Teacher explains/dint:mimesMathematics 87.3 10.9 1.4 0.0 0.4Science 36.6 50.7 10.3 1.4 0.9
Students use textbooksMathematics. 32.1 13.4 2.4 10.5 41.6Science 4.0 13.4 15.4 23.4 43.8
Students use worksheetsMathematics 31.6 33.5 10.4 17.9 6.6Science 3.0 22.0 25.5 32.0 17.5
Students use manipulativesor other equipment
Mathematics 37.6 40.7 14.9 5.9 0.9Science 16.8 43.3 26.0 10.1 3.9
Learning center useMathematics 17.8 21.6 14.9 25.0 20.7Science 11.3 19.6 26.5 30.9 11.8
Students do reference work*Science 1.0 18.4 27.9 35.8 16.9
Students do ex § riments*Science 8.2 28.5 40.1 18.4 4.8
*The question was not asked for mathematics.
Table 5-6 summarizes teachers' self-perceptions of their strengths and weaknessesusing three different instructional strategies. Each strategy was considered a strengthby more than 62 percent of the teachers for both mathematics and science.
Table 5-6 Perceived Strengths and Weaknesses for Selected Instructional StrategiesStrong Adequate Weak
5Percentage
4Percentage
3Percentage
2Percentage
1
Percentage
Conducting demonstrationsMathematics 36.4 43.2 17.7 2.7 0.0Science 24.1 40.2 26.6 4.2 2.8
Facilitating hands-onMathematics 36.7 43.9 14.5 4.5 0.5Science 23.3 39.1 22.8 10.2 2.8
Making connections to lifeMathematics 31.9 36.6 20.4 5.1 0.9Science 27.9 40.4 25.5 5.3 1.0
Over half of the mathematics teachers were more than satisfied with their currentteaching strategies. The corresponding figure for science teachers was only 33.5percent as shown in table 5-7 and figure 5-3.
Table 5-7 Satisfaction with Current Teaching StrategiesMore than satisfied Satisfied Less than satisfied5 4
Percentage Percentage3
Percentage
27.7
2Percentage
5.9
1
Percentage2.3Mathematics 22.7 41.4
Science 9.9 23.6 33.0 20.8 12.7
Landscape of Mathematics and Science Education in Milwaukee
89

Figure 5-3 Satisfaction with Current Teaching Strategies
ASSESSMENT PRACTICES
Figure 5-4 and table 5-8 show the assessment practices used by teachers. They wereasked to check all that apply. In mathematics and science, observation andperformance tasks are the assessment methods used by the most teachers. A third ofthe elementary teachers also use portfolios in mathematics and about a fourth inscience. Journals are used by close to half of the teachers in science and by about afourth of the teachers in mathematics.
Figure 5-4 Assessment Practices in Elementary School
100
90
80
70
60rc 50
e 40nt 30
20
10-0-
MU0
Journals Portloks Tasks 'Checklists Anecdotes 'Observation' Tdw tests 'TO* tests
MIthemalics
SCienC4)
Surveys 83
00

Table 5-8 Assessment Practices in Elementary SchoolMathematics
PercentageScience
Percentage
Journals/LeamingLogs 25.1 45.8Portfolios 37.2 23.9Performance Tasks 76.8 64.0Checklists 35.7 27.8Anecdotal Records 35.2 28.2Observation 91.7 84.7Teacher-developed tests 57.9 41.7Textbook tests 58.8 13.6
More than half of the teachers felt strong in their ability to assess student learning asshown in figure 5-5 and table 5-9. Twenty percent of the teachers, however, felt it wasa weakness in mathematics and 12.7 percent felt this way about science.
Figure 5-5 Ability to Assess Student Learning
70
60
P 50
r 40
e 30
20
10
0Strong Adequate Weak
II Mathematics
III Science
Table 5-9 Perceived Strengths and Weaknesses for Assessing Student LearninStrong Adequate Weak
5Percentage
23.7
4Percentage
36.3
3Percentage
20.0
2Percentage
1
Percentage_7.4Mathematics 12.6
Science 19.3 33.5 34.4 8.5 4.2
INFORMAL LEARNING ENVIRONMENTS
As shown in table 5-10 and figure 5-6, less than 20 percent of teachers used abusiness or industry as an informal learning environment. Over half of the teachersutilize the zoo and parks for student learning.
Table 5-10 Use of Informal Learning Environments in Elementary SchoolPercentage
Business/Industry 18.1
Zoo 59.5Milwaukee Public Museum 38.3Nature Center 43.2Parks 52.9Disc Imp, Museum 21.6
84 Landscape of Mathematics and Science Education in Milwaukee
91
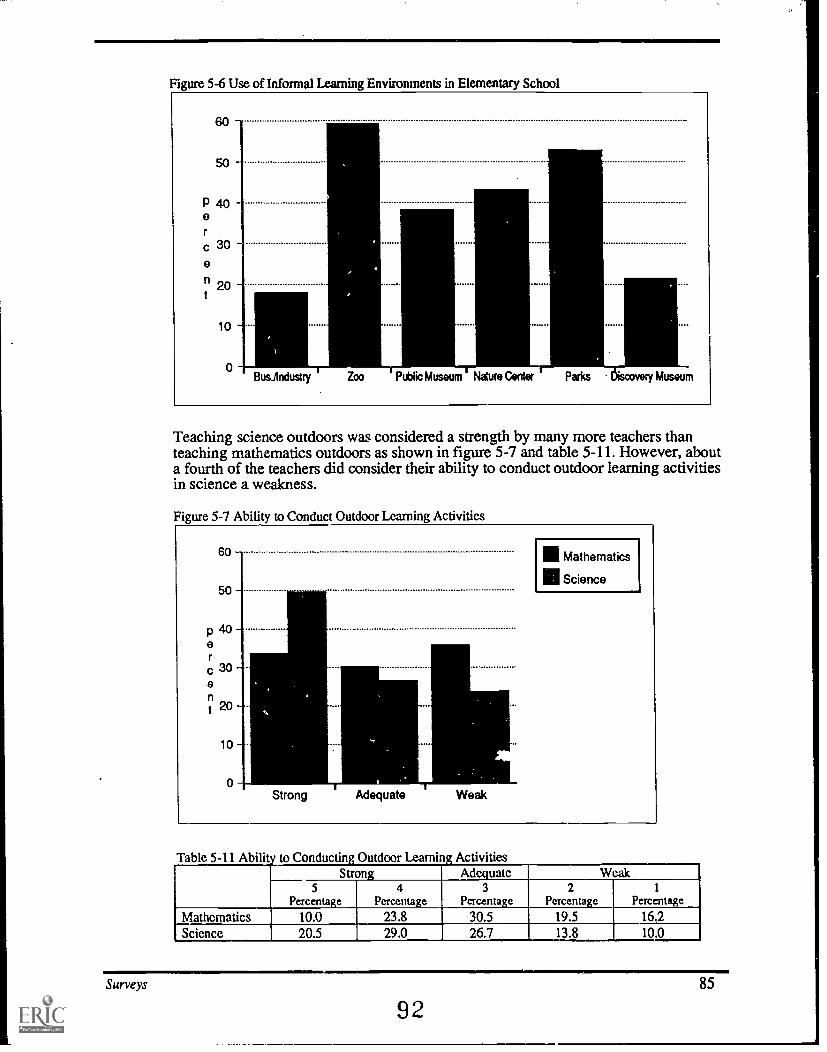
Figure 5-6 Use of Informal Learning Environments in Elementary School
60
50
P 40e
c 30e
20
10
0Susi 'Industry I Zoo ' Public Museum' Nature Center Parks discovery Museum
Teaching science outdoors was considered a strength by many more teachers thanteaching mathematics outdoors as shown in figure 5-7 and table 5-11. However, abouta fourth of the teachers did consider their ability to conduct outdoor learning activitiesin science a weakness.
Figure 5-7 Ability to Conduct Outdoor Learning Activities
60
50
Strong Adequate Weak
III Mathematics
III Science
Table 5-11 Ability to Conducting Outdoor Learning ActivitiesStrong
4Percentage
Adequate3
Percentage
Weak2
Percentage1
Percentage5
PercentageMathematics 10.0 23.8 30.5 19.5 16.2Science 20.5 29.0 26.7 13.8 10.0
Surveys
9285

CALCULATORS AND COMPUTERS
Table 5-12 indicates that half of the elementary teachers had access to computers intheir classrooms. Teachers who had computers available in the classroom had a meanof 2.7 computers (SD=5.7) with range from 1 to 30. About a third of the teachersindicated that computers were available in their school but that they were difficult toaccess for mathematics and science learning activities.
Table 5-12 Availability of Computers in Elementary SchoolPercentage
Available within the classroom 54.4Available but difficult to access 32.3Not available 13.4
Frequency of computer and calculator use is shown in table 5-13 and figures 5-8 and5-9. Computers were used more frequently than calculators for mathematics orscience. However, 40.1 percent of the teachers reported that they never use computersfor science and 26.2 percent stated that they never use calculators for mathematics.
Table 5-13 Frequency of Calculator and Computer Use in Elementary School
Almost dailyPercentage
At leastweekly
Percentage
At leastonce a month
PercentageRarely
PercentageNever
Percentage
CalculatorsMathematics 1.9 15.5 28.2 28.2 26.2Science 2.0 5.5 12.0 26.5 54.0
ComputersMathematics 23.4 41.6 10.3 15.4 9.3Science 5.9 16.3 12.4 25.2 40.1
Figure 5-8 Frequency of Calculator Use in Elementary School
60
50
40p
c 30
t 20
10
0Almost daily Weekly 'Once a month' Rarely ' Never
II Mathematics
Science
86 Landscape of Mathematics and Science Education in Milwaukee
93

Figure 5-9 Frequency of Computer Use in Elementary School
50
40
e 30
C
n 20
10
0
1Almost daily Weekly Once a month Rarely Never
lAathemarics
a Science
While 80.3 percent of students had access to school calculators for mathematics, only10.2 percent were allowed unrestricted use of them as shown in table 5-14. Someteachers indicated that students were allowed to use calculators on tests andencouraged their use for homework.
Table 5-14 Policies on Calculator Use in Elementary School MathematicsPercentage Responding 'Yes'
Do students have access to calculators owned by the school? 80.3Are students allowed to use calculators on tests? 15.1Are students encouraged to use calculators for homework? 21.4Are students permitted unrestricted use of calculators inclass?
10.2
Teachers were asked to rate their ability to use computers and calculators in theirteaching (see table 5-15 and figures 5-10 and 5-11). Using calculators to teachmathematics was viewed as a weakness by 38 percent of the teachers. Usingcomputers to teach mathematics was considered a strength by about half of theteachers. Computer use for science was considered a weakness by 44.9 percent of theteachers.
Table 5-15 Ability to Use Calculators and Computers for Teaching in Elementary SchoolStrong Adequate Weak
5Percentage
4Percentage
3Percentage
2Percentage
1
PercentageUsitgt calculators
Mathematics 15.6 19.0 27.3 14.6 23.4Science 9.2 10.8 20.0 23.6 36.4
Using computersMathematics 22.3 30.7 25.6 10.7 10.7Science 11.8 18.7 24.6 21.7 23.2
Surveys
9487

Figure 5-10 Ability to Use Calculators for Teaching in Elementary School
70
60
P50er40
20
e 30
t
10
0Strong A..flquate Weak
$ Mathematics
Science
Figure 5-11 Ability to Use Computers for Teaching in Elementary School
70
60
P 50er 40
e 30
20
10
0Strong Adequate Weak
Mathematics
$ Science
RESOURCES
88
Teachers were asked to indicate the adequacy of planning time for teachingmathematics and science in their school. Between 62 and 72 percent of teachers ratedthe adequacy of individual and collaborative planning time for mathematics andscience as unsatisfactory as shown in table 5-16 and figures 5-12 and 5-13.
Table 5-16 Adequacy of Planning Time in Elementary SchoolExcellent
PercentageGood
PercentageSatisfactoryPercentage
UnsatisfactoryPercentage
Not applicablePercentage
Individual planning timeMathematics 1.4 10.0 24.9 62.0 1.8
Science 1.9 7.9 20.9 67.4 1.9
Collaborative planning timeMathematics 1.4 5.9 16.7 71.5 4.5
Science 0.9 4.7 17.2 72.1 5.2
Landscape of Mathematics and Science Education in Milwaukee
95

Figure 5-12 Adequacy of Individual Planning Time in Elementary School
70
60
50
ao
e 30n
20
10
Excelent Good Satisfactory Unsatisfactory Not applicable
Mathematics
1. Science
Figure 5-13 Adequacy of Collaborative Planning Time in Elementary School
Teachers were asked to comment on the adequacy of class size, class time, space forstudents to work, and space for storage in its relationship to the teaching ofmathematics and science. Table 5-17 reveals that over half of the teachers indicatedthat mathematics and science class sizes are unsatisfactory. About one third of theteachers also noted that class time for science was not satisfactory. Storage space wasunsatisfactory for many teachers for both science and mathematics.
Surveys
96
89

Table 5-17 Adeuuacv of Class Size Time, and Space in Elementary SchoolExcellent
PercentageGood
PercentageSatisfactoryPercentage
UnsatisfactoryPercentage
Not applicablePercentage
Class sizeMathematics 3.6 10.8 32.0 53.2 0.5Science 3.2 7.9 33.3 33.2 2.4
Class timeMathematics 3.6 19.0 59.9 12.9 0.0Science 2.3 12.1 50.0 34.1 1.3
Space for students to workMathematics 15.8 42.5 29.0 12.7 0.0Science 12.0 22.7 33.8 28.4 0.8
Space for storageMathematics 7.7 18.8 32.0 41.0 0.5Science 3.7 12.0 27.8 54.6 1.9
Teachers were asked to rate the adequacy of equipment and consumable materials forteaching mathematics and science. The results are displayed in table 5-18 and figures5-14 and 5-15. About half of the elementary teachers indicated that science equipmentwas unsatisfactory. About half of the teachers for science and close to half of theteachers for mathematics also viewed the adequacy of consumable materials asunsatisfactory.
Table 5-18 Adeauacv of Equipment and Materials in Elementary SchoolExcellent
PercentageGood
PercentageSatisfactoryPercentage
UnsatisfactoryPercentage
Not applicablePercentage
EquipmentMathematics 10.6 24.3 45.0 20.2 0.0Science 4.7 13.0 29.3 51.2 1.9
ConsumablesMathematics 3.3 14.0 30.7 42.8 9.3Science 2.9 6.7 28.7 52.6 9.1
Figure 5-14 Adequacy of Equipment in Elementary School
60
50
p 40
c 30o
t 20
10
0 =MIExcelent Satisfactory Unsatisfactory' Not applicable
111 Mathematics
111 Science
90 Landscape of Mathematics and Science Education in Mi!waukee
9'7

Figure 5-15 Adequacy of Consumable Materials in Elementary School
60
so
P`°
c30
t 20
10
0
tip
II Mathematics
III Science
Table 5-19 reveals that over 60 percent of teachers view availability of consumablesupplies as less than adequate in teaching both science and mathematics. Over half ofthe teachers indicated that non-consumable supplies were more than adequate formathematics, and about one third felt they were less than adequate for science.
Table 5-19 Availability of Consumable and Non-Consumable suppliesMore than adequate
(All or Most)Adequate
(Some)Less than adequate
(Few or None)5
Percentage4
Percentage3
Percentage2
Percentage1
Percentage
Consumable supplies areregularly purchased forstudent use
Mathematics 7.4 8.3 22.1 21.7 40.6Science 7.2 7.7 16.4 21.3 47.3
Non-consumable supplies areavailable for student use
Mathematics 28.9 33.9 21.1 9.6 5.1
Science 13.0 22.2 29.5 19.3 15.9
TEACHERS' PERCEPTIONS
On a 5-point scale, with 5 being high, teachers were asked to indicate their degree ofagreement with the statements shown in table 5-20. While over 80 percent of teachersperceived themselves as having a strong mathematics background, only 62.4 percentof teachers viewed themselves as having a strong science background. Teachersenthusiasm was higher for mathematics than for science. Teachers also felt thatmathematics was more highly valued in their schools than science. In fact, about onefifth of the teachers felt that science was not valued in their schools.
Surveys
9391

Table 5-20 Perceptions of Students, School, and SelfHigh Neutral Low
5
Percentage4
Percentage3
Percentage2
Percentage1
Percentage
MathematicsStrong agreement that allstudents can learnmathematics
81.0 15.0 3.5 0.0 0.4Strong disagreement thatall students can learnmathematics
High perceived value ofmathematics in one'sschool
58.8 28.8 10.2 1.8 0.4No perceived value ofmathematics in one'sschool
Stung (self) backgroundknowledge in matherraitio 43.0 40.3 14.9 1.4 0.5
Weak (self) backgroundknowledge in mithenatics
Strong (self) enthusiasmfor mathematics 40.0 34.0 19.1 2.3 4.7
Weak (self) enthusiasmfor mathematics
ScienceStrong agreement that allstudents can learn science 81.4 15.8 2.3 0.0 0.5
Strong disagreement thatall students can learnscience
High perceived value ofscience in one's school 30.2 27.5 22.5 14.9 5.0
No perceived value ofscience in one's school
Strong (self) backgroundknowledge in science 26.2 36.2 22.0 7.8 2.2
Weak (self) backgroundknowledge in science
Strong (self) enthusiasmfor science 23.3 39.1 22.8 10.2 2.8
Weak (self) enthusiasmfor science
Table 5-21 shows that elementary teachers are more comfortable teachingmathematics than science. Teachers also felt that mathematics was more enjoyableand satisfying to teach than science. A slightly greater percentage, however, felt thatscience was more exciting to teach than mathematics.
Table 5-21 Elementary Teacher's Feelings Towards Teaching Mathematics and ScienceHigh Neutral Low
5Percentage
4Percentage
3Percentage
2Percentage
1
Percentage
MathematicsEnjoyable 53.0 32.0 14.2 0.9 0.0 Not EnjoyableExciting 37.9 35.6 23.3 3.2 0.0 BoringSatisfying 38.5 36.2 21.1 3.2 0.9 FrustratingRewarding 38.7 36.4 19.4 5.1 0.5 Unfulfilling
StressfulComfortable 45.0 32.3 17.7 3.6 1.4
ScienceEnjoyable 36.0 37.0 19.0 6.6 1.4 Not EnjoyableExciting 40.5 33.3 21.0 4.3 0.5 BoringSatisfying 28.4 34.1 28.4 7.7 1.4 FrustratingRewarding 33.2 31.7 28.4 5.8 1.0 UnfulfillingComfortable 27.8 31.1 30.1 9.1 1.9 Stressful
OTHER FACTORS
Teachers were asked to rate the adequacy of administrative support, teacher comfortlevel, and student reading skills. The results are displayed in table 5-22. Elementaryteachers indicated that about one third of their students have reading skills that areunsatisfactory. Teachers felt that administrative support, as well as teachers' comfortlevels, was stronger for mathematics than for science.
92 Landscape of Mathematics and Science Education in Milwaukee
99

Table 5-22 Adequacy of Support, Comfort Level, and Reading Skills in Elementary SchoolExcellent
PercentageGood
PercentageSatisfactoryPercentage
UnsatisfactoryPercentage
Not applicablePercentage
Administrative SupportMathematics 21.2 26.6 38.8 9.5 2.3Science 19.8 21.2 42.5 13.7 2.9
Teacher comfort levelMathematics 20.4 41.2 31.7 6.3 0.5Science 12.1 33.2 41.1 12.6 1.0
Reading skills of studentsMathematics 1.8 14.1 46.8 30.5 6.8Science 0.9 12.2 43.7 34.7 8.5 1
Table 5-23 displays the teachers' perceptions of parent involvement. Over 80 percentof the teachers felt that parent involvement in mathematics and science in elementaryschools was low to non-existent.
Table 5 -23 Parent Involvement in Mathematics and Science in Elementary SchoolHigh Neutral Low
5Percentage
4Percentage
3Percentage
2Percentage
1
PercentageHigh involvement ofparents inmathematics andscience programs
0.9/ 2.6 14.1 23.8 58.6No involvement ofParents inmathematics andsciencemgrams
PROFESSIONAL DEVELOPMENT
Table 5-24 shows the number of hours of professional development for mathematicsand science. Nearly three fourths of the elementary teachers had 10 or fewer hours ofprofessional development in either subject area in the last three years.
le 5 -24 Professional Development in Last Three Years for Elementary TeachersMathematics Science
0 hours 28.4 24.41-5 hours 27.0 28.76-10 hours 17.8 20.711-15 hours 7.2 9.1
16-20 hours 6.2 4.321-30 hours 6.3 4.431-40 hours 2.4 4.341 or more hours 5.0 4.4
OBSTACLES TO TEACHING
An open-ended item on the survey asked teachers to identify the major obstacles toteaching mathematics and science effectively. Many teachers listed two or moreobstacles for a total of 340 responses. Of these responses, nine categories emerged asmajor areas of concern, with ten or more responses for each area. Illustrativecomments from the teachers are included for each major area of concern.
Lack of Adequate Materials, Supplies, Resources, and Equipment. Twenty-sixpercent of the responses mentioned lack of needed materials. A few teachers notedthat they needed more manipulatives, calculators, tables instead of desks, andconsumable materials.
Surveys
10093

Develop a MPS math and science equipment catalog to be distributed at everyschool. Allow teachers to phone in requests.
We have no science equipment in our school. We used to have a lot of things, butthen the store room was turned into the art room and all of the items weredisposed of because no one had room to store them in their classrooms.
Lack of Planning Time. Fifteen percent of the responses stated that individualplanning time or team planning time was inadequate.
There's not enough time to dig deeper into subjects because of additions to thecurriculum.We need collaborative planning time with other grade level teachers.
More individual planning timeNOT more meetings.There are days when I have only the 15 minutes before school starts. If a parent orcolleague needs me at that time, I have nothing. Sometimes I hurry or skip lunch,but I shouldn't have to do that daily. Other professionals don't.
Large Class Sizes. Twelve percent of the responses stated that large classes sizeswere an obstacle to effective instruction.
You cannot implement hands on curriculum with the class sizes we presentlyhave, unless we have specialists or, at the very least, science rooms.
I would prefer teaching math in small groups but I do not have an assistant.
Classes have too many students. Furthermore, there is a wide range of ability andskill. It would be helpful to teach math to students at their level of need andsuccess. Grouping for a large variance of skills works well in science but not inmath,
It is difficult to use manipulPfives in a large class without additional help.
Not Enough Class Time. Seven percent of the responses indicated there is notenough class time.
It takes a longer time for children to use manipulative tools and to sharediscoveries. There are too many activities, programs, and curricula to explore, andtoo many special things going on that one thing or another needs to be left out.Unfortunately, sometimes it's math.My class has three levels in math making it very difficult to spend much qualitysmall group or one-on-one time with my students.
I wish I could work one-on-one with students who are below grade level. Timeconstraints and the inability to leave the remainder of the class unattendedprevents me from doing so.There are too many other curriculum demands for reading, writing, and non-curriculum demands, such as violence prevention.
Though an integrated approach is used, there never seems to be enough time to doas much as one would like.
Lack of Adequate Staff Development and Inservice. Six percent of the responsescentered on the need for more staff development. Specific areas included bringingteachers up to speed with the mathematics program, the new science curriculum, theuse of manipulatives, and hands-on strategies.
No age appropriate training and materials.
A single inservice is not enough information.
94 Landscape of Mathematics and Science Education in Milwaukee
101
I wish I knew more about integrating science and math.Provide on-site inservice in current math and science activities, philosophi4 andtechniques.
Lack of Student Skills. Five percent of the responses stated that the range of studentskills is too wide and that students lack prior experiences.
Students have not mastered skills needed to enter the grade I teach.
Reading comprehension can greatly affect story problems in math.
Students lack skills. This includes: listening to directions so that an activity canproceed, reading ability sufficient to read any grade-level or near grade-leveldirections, social skills to stop arguing or blaming long enough to work in agroup, basic math facts so that we can measure, estimate, and so on.
They do not know how to work in groups or share materials.
Poor Textbooks or Lack of Textbooks. Three percent of the responses stated thatthe textbooks were poor or that they were not available.
The teacher's manual is not user friendly. I spend most time in language arts area.I wish to develop an integrated approach in my teaching.
The science textbook is terrible.Hands-on is a philosophy that doesn't face the reality of class size or emotionalmake up of many kids. It's the frosting on the cake, a good basic text is stillneeded.
The Mathematics Program. Four percent of the responses commented that themathematics program is an obstacle to effective instruction.
Math series is too vague and is frustrating to teach.The math program is horrible. No one I know uses it. We make up our own.
I feel first graders should have consumable workbooks.
Lack of worksheetsThe New Science Curriculum. Three percent of the responses commented that thescience program is an obstacle to effective instruction.
Don't like new series, need a text for background knowledge, impossible to dohands-on activities daily.A good program but not easily adaptable to a regular classroom.Curriculum should have been given to teachers with inservice prior to the yearimplemented. MPS was not ready with materials and expected teachers to bewhen the program was thrown at us after school started.
I feel children need some type of textbook or every school needs a sciencespecialist.
Other Obstacles. The following responses were mentioned five to nine times each:(a) no access or little access to computers, (b) not enough classroom space, (c) needmore manipulatives, (d) lack of teacher background knowledge, (e) lack of parentalsupport, (f) poor student behavior, and (g) not enough storage space.
Other obstacles that were mentioned four or fewer times included: (a) lack ofcooperation from other teachers, (b) lack of volunteers, (c) lack of money for fieldtrips, (d) not having my own room, (e) need for realistic assessment, (f) lack ofmaterials allowing for integrating subject areas, and (g) need for real life situations.
Surveys
10295

MIDDLE SCHOOL AND HIGH SCHOOL
The middle and high school surveys were distributed to all certified mathematics andscience teachers. This included both middle and high school teachers. Themathematics survey was given to 298 teachers of which 124 (41.6 percent) werereturned. The science survv.,y was distributed to 194 teachers with 75 (38.7 percent)being returned.
PROFILE OF MATHEMATICS AND SCIENCE TEACHERS
Of those returning the mathematics survey, 82.0 percent taught at the high schoollevel and 18.0 percent taught at the middle school level. The mean number of years ofteaching for mathematics teachers was 16,9 (SD=10.0) with a range from 1 to 40years. About half (51.2 percent) of the mathematics teachers percent were female, and48.8 percent were male.
Of those returning the science survey, 68.9 percent taught at the high school level and31.1 percent taught at the middle school level. The mean number of years of teachingfor science teachers was 19.7 (SD=9.9) with a range from 1 to 35 years. About a third(34.7 percent) of the science teachers were female, and 61.3 percent were male.Table 5-25 shows a profile of the middle school and high school teachers for bothmathematics and science. The teachers in both subject areas were mainly Caucasian.About half of the mathematics teachers and science teachers had earnedat least amaster's degree.
Table 5-25 Profile of Middle and High School Teachers Completing SurveMathematics
PercentageScience
PercentageMathematics
PercentageScience
PercentageRace/Ethnicity Highest degree
earnedAfrican-American 5.8 7.2 BS/BA 19.7 6.7Asian 1.7 2.9 3S/BA+16 9.8 16.0Caucasian 87.5 89.9 BS/BA+32 23.8 18.7Hispanic 0.0 0.0 MS/MA 7.4 5.3Native American 0.8 0.0 MS/MA+16 14.8 12.0Other 4.2 0.0 MS/MA+32 23.8 40.0
Doctorate 0.8 1.3
INSTRUCTIONAL PRACTICES
Teachers were asked to indicate the frequency of use for a variety of instructionalmethods. Table 5-26 shows that mathematics and science were often taught separatelyfrom other subject areas.
Table 5-26 Description of Middle and High School Mathematics and Science Ir3tructionMathematics
PercentageScience
PercentageIntegrated with other sub'cts 31.9 42.3Taught separately 56.3 45.1Other 11.8 12.7
96 Landscape of Mathematics and Science Education in Milwaukee
103

Small group work is used more in science than in mathematics at the middle and highschool levels as shown in figure 5-16 and table 5-27. However, about 60 percent ofthe teachers used small group work at least once a week when teaching mathematicsor science. More than 70 percent of teachers had students work in pairs at least once aweek when they learned mathematics or science. Whole group discussions occur onalmost a daily basis in about 40 percent of both the mathematics classes and thescience classes.
Figure 5-16 Small Group Work in Middle and High School
50
40
p
° 30
e 20n
10
1111 Mathematics
1111 Science
-27 n Practices in Middle. and High School
Almost dailyPercentage
At leastweekly
Percentage
At leastonce a month
PercentageRarely
PercentageNever
Percentage
Small group workMathematics 27.3 35.5 22.3 12.4 2.5Science 24.3 42.9 28.6 2.9 1.4
Students working in pairsMathematics 34.2 38.3 15.0 11.7 0.8Science 33.3 39.1 21.7 4.3 1.4
Whole-group discussionsMathematics 47.1 29.8 12.4 10.7 0.0Science 44.9 44.9 4.3 4.3 1.4
Table 5-28 shows that while 71.0 percent of teachers reported that students used atextbook in mathematics on an almost daily basis, only 43.7 percent of scienceteachers used a textbook that often. Students have many more opportunities to usematerials or equipment in science than in mathematics; 81.1 percent of the teachersindicated that students use materials on an almost daily or weekly basis in sciencecompared to 33.9 percent in mathematics. Sixty percent of the science teachersreported that students do experiments on a weekly basis and 18.6 reported thatstudents do experiments almost daily.
Surveys
10497
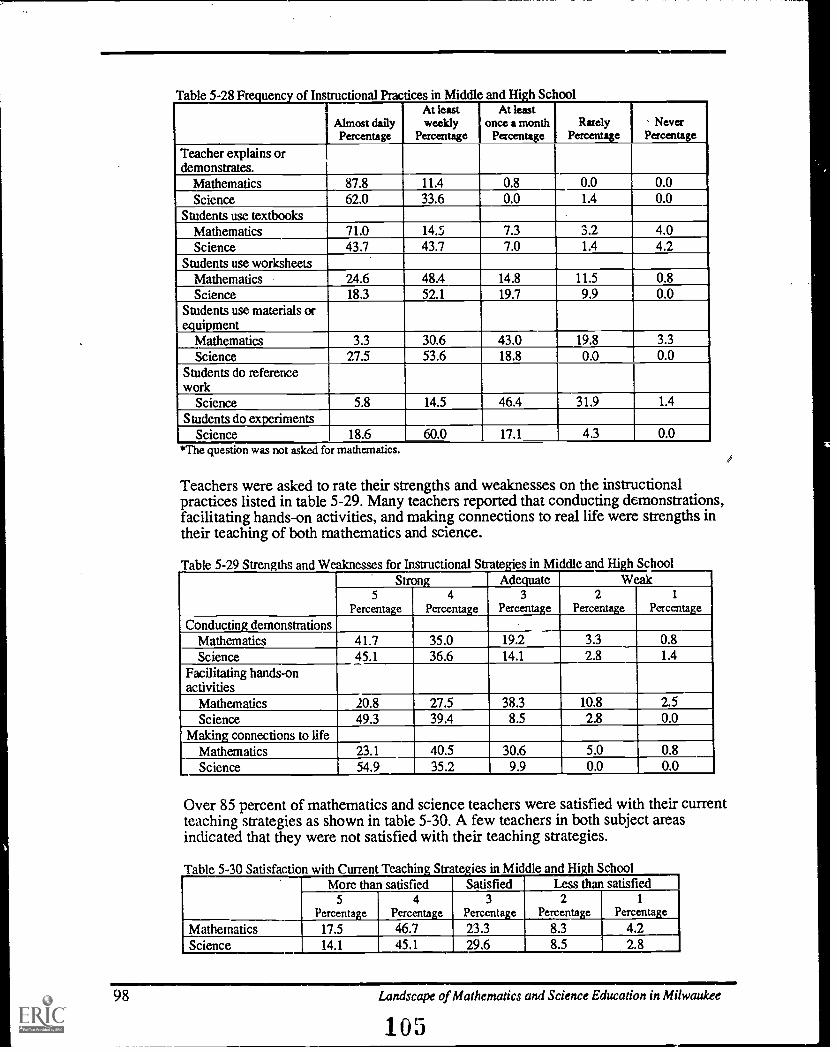
Table 5-28 Freauencv of Instructional Practices in Middle and High School
Almost dailyPercentage
At leastweekly
Percentage
At leastonce a month
PercentageRarely
PercentageNever
Percentage
Teacher explains ordemonstrates.
Mathematics 87.8 11.4 0.8 0.0 0.0Science 62.0 33.6 0.0 1.4 0.0
Students use textbooksMathematics 71.0 14.5 7.3 3.2 4.0Science 43.7 43.7 7.0 1.4 4.2
Students use worksheetsMathematics 24.6 48.4 14.8 11.5 0.8Science 18.3 52.1 19.7 9.9 0.0
Students use materials orequipment
Mathematics 3.3 30.6 43.0 19.8 3.3Science 27.5 53.6 18.8 0.0 0.0
Students do referencework
Science 5.8 14.5 46.4 31.9 1.4
Students do experimentsScience 18.6 60.0 17.1 4.3 0.0
*The question was not asked for mathematics.
Teachers were asked to rate their strengths and weaknesses on the instructionalpractices listed in table 5-29. Many teachers reported that conducting demonstrations,facilitating hands-on activities, and making connections to real life were strengths intheir teaching of both mathematics and science.
-29 for Instructional Strategies in Middle and High SchoolStrong Adequate Weak
5
Percentage4
Percentage3
Percentage2
Percentage1
Percentage
Conducting demonstrationsMathematics 41.7 35.0 19.2 3.3 0.8Science 45.1 36.6 14.1 2.8 1.4
Facilitating hands-onactivities
Mathematics 20.8 27.5 38.3 10.8 2.5Science 49.3 39.4 8.5 2.8 0.0
Making connections to lifeMathematics 23.1 40.5 30.6 5.0 0.8Science 54.9 35.2 9.9 0.0 0.0
Over 85 percent of mathematics and science teachers were satisfied with their currentteaching strategies as shown in table 5-30. A few teachers in both subject areasindicated that they were not satisfied with their teaching strategies.
Table 5 -30 Satisfaction with Current Teaching Strategies in Middle and High SchoolMore than satisfied Satisfied Less than satisfied
5Percentage
17.5
4Percentage46.7
3Percentage23.3
2Percentage
8.3
1
Percentage4.2Mathematics
Science 14.1 45.1 29.6 8.5 2.8
98 Landscape of Mathematics and Science Education in Milwaukee
105

ASSESSMENT PRACTICES
Teachers were told to indicate which assessment practices they use for matlmaticsand science from those listed in figure 5-17 and table 5-31. Performance tasks,observations, and teacher tests were the dominant assessment practices in bothmathematics and science. About one third of the teachers used journals in science andabout one fourth used them in mathematics.
Figure 5-17 Assessment Practices ir. Middle and High School
100
90
80
70
e 60
c 50
e 40n
t 30
20
10
0Journals Portfolios Tasks 1-Checklists Anecdotes 'Observation' Tchr tests Txtbk tests
III Mathematics
Science
Table 5-31 Assessment Practices in Middle and High SchoolMathematics
PercentageScience
Percentage
Journals/Learning Logs 23.820.5
35.621.9Portfolios
Performance Tasks 81.1 90.4
Checklists 18.9 23.3
Anecdotal Records 17.2 13.7
Observation 90.2 84.9Teacher-developed tests 96.7 91.8
Textbook tests 47.5 49.3
Teachers rated their ability to assess student learning as shown in table 3-32.Approximately three-fourths of the mathematics and science teachers perceivedthemselves as strong in their ability to assess student learning.
Table 5-32 Ability to Assess Student Learning for Middle and High School TeachersStrong Adequate Weak
5
Percentage4
Percentage3
Percentage2
Percentage1
Percentage
Mathematics 31.4 43.0 23.1 2.5 0.0
Science 35.7 42.9 20.0 1.4 0.0
Surveys
10699

INFORMAL LEARNING ENVIRONMENTS
Teachers were asked to indicate which informal learning environments their studentsexperienced as part of their mathematics and science programs. The results aredisplayed in figure 5-18 and table 5-33. Far more science teachers than mathematicsteachers utilized informal learning environments. Businesses and industries were themost widely used informal environment for mathematics.
Figure 5-18 Use of Informal Learning Environments in Middle and High School
30
P 20
n 10-
0Busilixiusby Public Museum Nature Center Parks EIJiscovery Museum
II Mathematics
Science
-33 Learning Environments in Middle and High SchoolMathematics
PercentageScience
Percentage
Business/Industry 19.0 16.2
Zoo 5.0 18.7
Milwaukee Public Museum 2.5 16.2
Nature Center 4.1 10.8
Parks 2.5 23.0Discovery Museum 3.3 13.5
CALCULATORS AND COMPUTERS
Teachers who had computers available in their classroom for mathematics had a meanof 9.0 computers (SD=7.2) with a range from 1 to 20. Teachers who had computersavailable in the classroom for science had a mean of 4.0 computers (SD=3.5) with arange from 1 to 15. More than 80 percent of mathematics and science teachers haddifficult or no access to computers as shown in table 5-34 and figure 5-19.
-34 m in Middle and High SchoolMathematics
PercentageScience
Percentage
Available within the classroom 15.3 19.4
Available but difficult to access 71.2 54.2
Not available 13.6 26.4
100 Landscape of Mathematics and Science Education in Milwaukee
1 0'7

Figure 5-19 Availability of Computers in Middle and High School
80
70
60
e 50
c40
n 30
20
10
Available in classroom Difficult to access Not available
III Mathematics
Science
Teachers reported on the frequency of calculator use and computer use formathematics and science. The results are shown in figures 5-20 and 5-21 and table 5-35. While 71.3 percent of mathematics teachers used calculators almost daily, only14.1 percent of science teachers did so. Only a few mathematics teachers reported thattheir students rarely or never used calculators.More teachers use computers in mathematics than in science. However, only a smallnumber of teachers use computers on a regular basis in mathematics and very few inscience. Half of the mathematics teachers and 68.1 percent of science teachersreported that they rarely or never used computers during their teaching.
Figure 5-20 Frequency of Calculator Use in Middle and High School
80
70
60
P 50
c40
n 30
20
10
0Almost daily Weekly Once a month Rarely Never
a Mathematics
Science
Survey.
103101

Figure 5-21 Frequency of Computer Use in Middle and High School
50
40
e 30
n 20
10
0Almost daily Weekly Once a month' Rarely ' Never
II Mathematics
II Science
Table 5-35 Fr um, y of Calculator and Computer Use in Middle and Hi h School
Almost dailyPercentage
At leastweekly
Percentage
At leastonce a month
PercentageRarely
PercentageNever
Percentage
CalculatorsMathematics 71.3 19.7 4.9 2.5 1.6
Science 14.1 16.9 26.8 29.6 12.7
ComputersMathematics 9.0 24.6 1C.4 33.6 16.4
Science 1.4 4.3 26.1 42.0 26.1
Table 5-36 reveals that teachers use a very flexi policy of calculator use inmathematics at the middle and high school levels. Almost all teachers allow studentsto use calculators on tests and encourage students to use calculators for homework.About 80 percent of the teachers allow students the unrestricted use of calculators inclass, and close to 90 percent of the students have access to calculators owned by theschools. Teachers also noted the type of calculator used in their classes which rangedfrom basic four function calculators to scientific calculators to graphing calculators.Most teachers reported using scientific calculators, but many also noted access tographing calculators.
Table 5-36 Policies on Calculator Use in Middle and High School MathematicsPercentage Responding 'Yes'
Do students have access to calculators ownedby the school? 87.4
Are students allowed to use calculators on tests? 95.8Arc students encouraged to use calculators forhomework? 94.2Are students permitted the unrestricted use ofcalculators in class? 79.3
102 Landscape of Mathematics and Science Education in Milwaukee
109

Teachers were asked to rate the degree of strength or weakness in their ability to usecomputers and calculators in their teaching. Only 41.9 percent of mathematicsteachers and 31.4 percent of science teachers felt strong in their ability to usecomputers for teaching as shown in figure 5-22 and table 5-37. About 40 percent ofthe teachers in both mathematics and science felt their ability to use computers intheir teaching of these subject areas was weak. Most teachers perceived their ability touse calculators in their mathematics teaching as strong.
Figure 5-22 Ability to Use Computers for Teaching in Middle and High School
-37 Use Calculators and Computers for Teaching in Middle and High School,Strong Adequate Weak
5Percentage
4Percentage
3Percentage
2Percentage
1
Percentage
Using calculators*Mathematics 46.3 37.2 11.6 2.5 2.5
Using computersMathematics 23.1 18.8 20.5 18.8 18.8
Science J 17.1 14.3 27.1 17.1 24.3* This question was not asked for science.
RESOURCES
Teachers were asked to indicate the adequacy of individual and collaborativeplanning time for teaching mathematics or science in their school. The results aredisplayed in figures 5-23 and 5-24 and table 5-38. About one third of the mathematicsteachers and close to half of the science teachers stated that the adequacy ofindividual planning time was unsatisfactory. Over half of both the mathematicsteachers and the science teachers reported that time for collaborative planning wasunsatisfactory.
Surveys
110103

Figure 5-23 Adequacy of Individual Planning Time in Middle and High School
50
40
pe 30
20
10
0Excellent Satisfactory Unsatisfactory' Not applicable
Mathematics
III Science
Figure 5-24 Adequacy of Collaborative Planning Time in Middle and High School
70
60
50p
40
e 30n
20
10
0Excellent Good Satisfactory Unsatisfactory NO applicable
Mathematics
SCiefICO
Table 5-38 Adequacy of Planning Time in Middle and High SchoolExcellentPercentage
GoodPercentage
SatisfactoryPercentage
UnsatisfactoryPercentage
Not applicablePercentage
Individual planning timeMathematics 7.4 25.4 36.1 30.3 0.8
Science 5.7 22.7 27.1 44.3 0.0
Collaborative planning timeMathematics 3.3 14,8 20.5 56.6 4.9
Science 1.4 14.5 11.6 60.9 11.6
.1111
104 Landscape of Mathematics and Science Education in Milwaukee
111

Teachers were asked to comment on the adequacy of class size, class time, space forstudents to work, and space for storage in its relationship to the teaching ofmathematics and science. The results are shown in figure 5-25 and table 5-39. Manyteachers were not satisfied with the adequacy of class time for either mathematics orscience, and especially so for science. Class size was viewed as unsatisfactory by athird of the mathematics teachers and close to half of the science teachers. Mostteachers reported that space for students to work was satisfactory. About one third ofthe teachers in both subject areas indicated that storage space was not satisfactory.
Figure 5-25 Adequacy of Class Time in Middle and High School
50
40
e 30
20
10-
0 memExcelent ' Good Satisfactory Urtsalistadoty' Not applicable
II Mathematics
11 Science
Table 5-39 Adeauacv of Class Size. Time, and Space in Middle and High SchoolExcellent
PercentageGood
PercentageSatisfactoryPercentage
UnsatisfactoryPercentage
Not applicablePercentage
Class sizeMathematics 10.7 18.2 35.5 35.5 0.0Science 5.6 12.7 31.0 49.3 1.4
Class timeMathematics 6.6 26.4 44.6 22.3 0.0
Science 7.0 16.9 42.3 32.4 1.4
Space for students to workMathematics 31.1 36.9 19.7 12.3 0.0
Science 13.3 27.5 20.3 18.8 0.0Space for storage
16.4 23.8 29.5 28.7 1.6MathematicsScience 20.0 18.6 25.7 35.7 0.0
Teachers also indicated the adequacy of equipment and materials for mathematics andscience as shown in table 5-40. About 25 percent of the mathematics teachers and32.4 percent of the science teachers stated that the equipment was unsatisfactory.Most teachers reported that consumable materials were adequate.
Surveys112
105

Table 5-40 Adequacy of Equipment and Materials in Middle and H h SchoolExcellent
PercentageGood
PercentageSatisfactoryPercentage
UnsatisfactoryPercentage
Not applicablPercentage
EquipmentMathematics 5.7 21.3 47.5 25.4Science 8.5 33.8 25.4 32.4
Consumable MaterialsMathematics 4.2 18.3 51.7 21.7 4.2Science 14.1 29.6 40.8 15.5 0.0 I
Teachers reported on the availability of consumable and non-consumable supplies.The results are displayed in figure 5-26 and table 5- 41. Over half of the scienceteachers stated that the availability of consumable supplies was more than adequate.Conversely, over half of the mathematics teachers stated that the availability ofconsumable supplies was less than adequate. Most teachers indicated that theavailability of non-consumable supplies was adequate.
Figure 5-26 Availability of Consumable Supplies in Middle and High School
111 Mathematics
111 Science
Table 5-41 Availability of Consumable & Non-Consumable Supplies in Middle and High SchoolMore than adequate
(All or Most)Adequate(Some)
Less than adequate(Few or None)
5Percentage
4Percentage
3Percentage
2Percentage
1
Percentage
Consumable supplies areregularly purchased forstudent use
Mathematics 7.6 15.3 24.6 22.9 29.7
Science 27.8 30.6 26.4 11.1 4.2
Non-consumable supplies areavailable for student use
Mathematics 17.8 25.4 33.9 14.4 8.5
Science 16.9 25.4 38.0 12.7 7.0
106 Landscape of Mathematics and Science Education in Milwaukee
113

TEACHERS' PERCEPTIONS
Teachers indicated their degree of agreement with the statements shown in table 5-42.Nearly 90 percent of mathematics and science teachers believe strongly that allstudents can learn the subject they teach. Almost all teachers in both areas perceivetheir background knowledge and enthusiasm as strong. Some mathematics andscience teachers perceived their subject area as receiving little value in their schools.
Table 5.42 Perceptions of Students. School, and SelfHilt'
4Percentage
Neutral Low5
Percenta .e3
Percentage2
Percentage1
Percentage
MathematicsStrong agreement that allstudents can learnmathematics
59.7 28.2 8.1 3.2 0.8Strong disagreement thatall students can learnmathematics
High perceived value ofmathematics in one'sschool
20.2 29.0 34.7 10.5 5.6No perceived value ofmathematics in one'sschr,o1
Strong (self) backgroundknowledge in rnabenztics 65.0 28.3 5.8 0.8 0.0
Weak (self) backgroundknowledge in mattrustics
Strong (self) enthusiasmfor mathematics 70.2 24.8 4.9 0.0 0.0
Weak (self) enthusiasmfor mathematics
ScienceStrong agreement that allstudents can learn science 69.9 19.2 5.5 5.5 0.0
Strong disagreemtnt thatall studmts can learnscience
High perceived value ofscience in one's school 25.0 29.2 29.2 11.1 5.6
No perceived value ofscience in one's school
Strong (self) backgroundknowledge in science 67.6 29.6 1.4 1.4 0.0
Weak (self) backgroundknowledge in science
Strong (self) enthusiasmfor science 78.9 18.3 2.8 0.0 0.0
Weak (self) enthusiasmfor science
Over half of he mathematics and science teachers find teaching their subject isenjoyable, eAciting, satisfying, rewarding, and comfortable as shown in table 5-43.About 10 percent of the mathematics teachers felt their teaching was very stressful, andabout 10 percent of the science teachers noted that their teaching was very unfulfilling.
Table 5-43 Middle & High School Teacher's Feelings owards Teaching Mathematics & ScienceHigh Neutral Low
5Percentage
4Percentage
3Percentage
2Percentage
1
Percentage
MathematicsEnjoyable 52.9 35.5 5.8 4.1 1.7 Not EnjoyableExciting 40.0 35.0 22.5 2.5 0.0 BoringSatisfying 32.2 30.6 22.3 5.8 9.1 FrustratingRewarding 29.8 29.8 29.8 7.4 3.3 Unfulfilling
StressfulComfortable 33.3 27.5 15.0 13.3 10.8
Science 64.3 21.4 12.9 1.4 0.0Enjoyable 47.1 41.4 10.0 1.4 0.0 Not Enjoyable
BoringExciting 29.0 33.3 21.7 8.7 7.2Satisfying 27.5 29.0 33 3 8.7 1.4 FrustratingRewarding 33.3 29.0 23.2 4.3 10.1 UnfulfillingComfortable 27.8 31.1 30.1 9.1 1.9 Stressful
Surveys
114 BEST COPY AVAILABLE
107
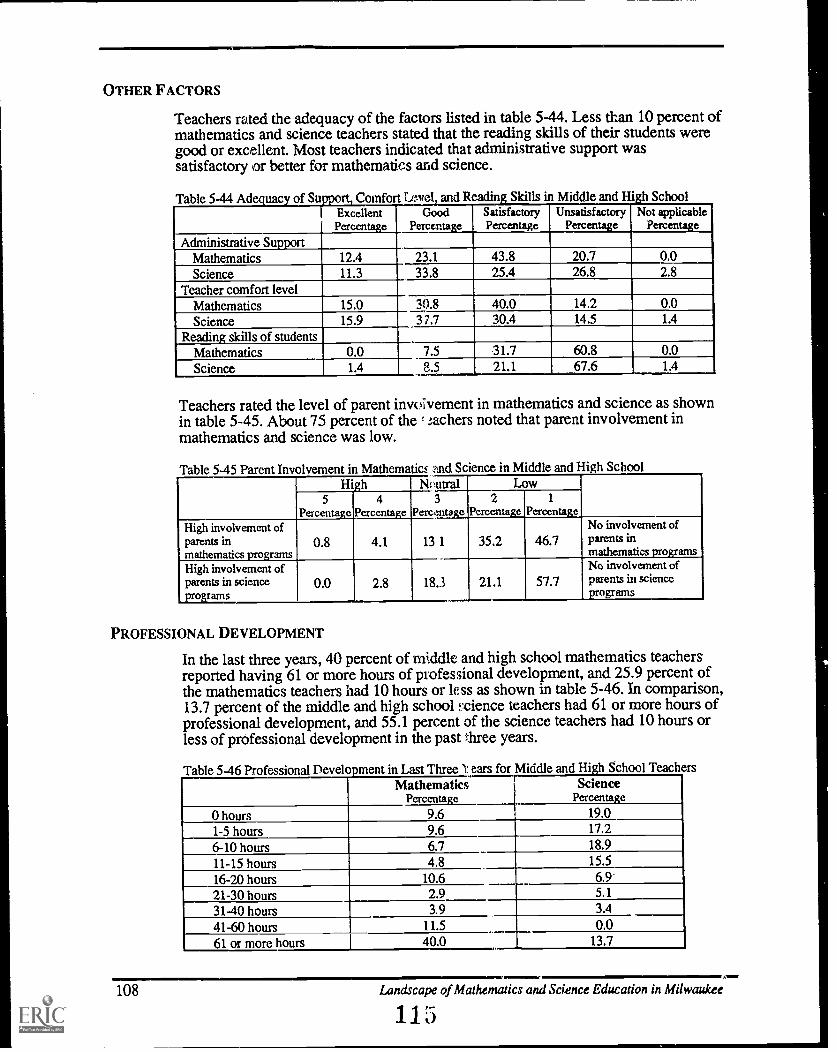
OTHER FACTORS
Teachers rated the adequacy of the factors listed in table 5-44. Less than 10 percent ofmathematics and science teachers stated that the reading skills of their students weregood or excellent. Most teachers indicated that administrative support wassatisfactory or better for mathematics and science.
Table 5-44 Adequacy of Support, omfo vel and Reading Skills in Middle and High SchoolExcellentPercentage
GoodPercentage
SatisfactoryPercentage
UnsatisfactoryPercentage
Not applicablePercentage_
Administrative SupportMathematics 12.4 23.1 43.8 20.7 0.0
Science 11.3 33.8 25.4 26.8 2.8
Teacher comfort levelMathematics 15.0 30.8 40.0 14.2 0.0
Science 15.9 37,7 30.4 14.5 1.4
Reading skills of studentsMathematics 0.0 7.5 31.7 60.8 0.0
Science 1.4 8.5 21.1 67.6 1.4
Teachers rated the level of parent involvement in mathematics and science as shownin table 5-45. About 75 percent of the t :.achers noted that parent involvement inmathematics and science was low.
Table 5-45 Parent Involvement in Mathematics and Science in Middle and High SchoolHigh Ntmtral Low
5Percentage
4Percentage
3Percentage
2Percentage
1
PercentageHigh involvement ofparents inmathematics programs
0.8 4.1 13 1 35.2 46.7No involvement ofParents inmathematics programs
High involvement ofparents in scienceprograms
0.0 2.8 18.3 21.1 57.7No involvement ofparents in scienceprograms
PROFESSIONAL DEVELOPMENT
In the last three years, 40 percent of middle and high school mathematics teachersreported having 61 or more hours of professional development, and 25.9 percent ofthe mathematics teachers had 10 hours or less as shown in table 5-46. In comparison,13.7 percent of the middle and high school ..cience teachers had 61 or more hours ofprofessional development, and 55.1 percent of the science teachers had 10 hours orless of ptofessional development in the past three years.
Table 5-46 Professional Development in Last Three ears for Middle and High School TeachersMathematics
PercentageScience
Percentage
0 hours 9.6 19.0
1-5 hours 9.6 17.2
6-10 hours 6.7 18.9
11-15 hours 4.8 15.5
16-20 hours 10.6 6.9
21-30 hours 2.9 5.1
31-40 hours 3.9 3.4
41-60 hours 11.5 0.061 or more hours 40.0 13.7
108 Landscape of Mathematics and Science Education in Milwaukee
115

OBSTACLES TO TEACHING MATHEMATICS
An open-ended item on the survey asked teachers to identify the major obstacles toteaching mathematics effectively. A total of 244 separate responses were given forthis question. Several teachers listed more than one obstacle. Seven major areas ofconcern emerged, with 12 or more individuals identifying each as an obstacle.Illustrative comments from the teachers are included for each major area of concern.
Apathy, Poor Student Attitude, and Fear of Mathematics. Twenty-one percent ofthe responses (51 individual responses) commented that student apathy and attitude orstudent fear of mathematics were obstacles.
Student willingness to put blame for their failures on others. They don't takepersonal responsibility.No future vision of students.Irresponsible students who come to class without any pencil, pen, or paper.
Lack of involvement by students.Lack of understanding of realistic value for long-term success.
Many students do not have the time or will not take the time to do any workoutside of class.Many with past failures are fearful of math.
Poor Student Background or Skills and Poor Class Placement. Twenty percent ofthe responses (48 individual responses) stated that students have a poor mathematicsbackground or were placed in inappropriate classes.
Students are programmed above their level. They have failed so often that theydon't want to be there.Skill level of entering students in high school. Also, as they pass a class in highschool, they are sometimes not adequately prepared for the next subject level, andit keeps them further behind.Most have trouble with the four basic operations of arithmetic:
It's hard to teach algebra to students who cannot read and/or add integers.
Lack of preparation of students in lower levels.
Lack of basic arithmetic skills.
Lack of background knowledge.
More than two-step problems causes mutiny.
Poor or uneven preparation in mathematics.Absenteeism and Student Mobility. Eleven percent of the responses (28 individualresponses) commented on poor student attendance and on student mobility.
Horrible attendance of all studentsin a P.A.T. algebra class of 26, 16 alreadyhave poor attendance.Student mobility. In my Algebra class this year, I've had 66 students added to mylist ana 44 dropped.
Large Class Sizes. Seven percent of the responses (17 individual responses) statedthat large class sizes were an obstacle to effective instruction in mathematics.
Classes are too large.
Too many students in a class.
Surveys
116109

Lack of Parental Support. Six percent of the responses (14 individual responses)stated that parents lack knowledge and skill in mathematics to assist their childrenwith homework.
No support from a home where little emphasis is placed on the importance oflearning.Inadequate parent support with lower level students.
Poor student behavior. Five percent of the responses (13 individual responses)stated that disruptive students were an obstacle.
Class disruptions by poorly behaved students.Massive dumping of 'reform school' types of students.
Peer support and conflict.Lack of administrative support. Five percent of the responses (12 individualresponses) stated that the central office, principals, department heads, and otheradministrators did not provide enough support.
No support for discipline.District wants us to do projects with the students but gives us no project ideas.Many directives, little support.School goals are not important to all staff and administration.Insufficient administrative guidance and support.
Little school department leadership.Not enough administrative support in enforcement of high expectations.
Little departmental cohesiveness.Mandates which reduce flexibility in working with students.
Other obstacles. The following responses were mentioned four to 11 times each: (a)outside influences such as TV, videos, home life, neighborhood violence, poverty,lack of role models, and community lack of support for education;. (b) not enoughplanning time; (c) not enough class time for students to understand concepts becausethe class periods are too short; (d) lack of computers, calculators, or other equipment;and (e) problems with the curriculum, such as lack of clarity, not always integrated,too much material to cover, and lack of applications.Other obstacles that were mentioned three times or fewer times include: (a)inadequate textbooks; (b) lack of materials; (c) teachers resistant to change; (d) needfor staff development, (e) need to apply mathematics to real life situations in the waystudents can understand; (f) classroom interruptions; (g) paperwork; (h) lack of fieldrip opportunities; (i) school building is dirty and old; and (j) unprofessional, staff
unwilling to change.
OBSTACLES TO TEACHING SCIENCE
A total of 197 separate responses were identified as major obstacles to teachingscience effectively. Several teachers listed more than one obstacle. Eight major areasof concern emerged, with 13 or more individuals identifying each as an obstacle.Illustrative comments from the teachers are included for each major area of concern.
Lack of Adequate Time for Planning. Eighteen percent of the responses (25individual responses) stated that time for lab set-up, preparation, staff development,and shared time with other teachers was inadequate.
110 Landscape of Mathematics and Science Education in Milwaukee
117

Very limited time to do the job even adequately; this means being a leader for thedepartment and an exemplary teacher.We need to have sufficient planning time. Right now we spend most of ourplanning time, including lunch and homeroom, helping absent students catch up.
Not enough time to create new materials.Lack of sta:f development time to integrate science and allow science teachers toshare techni. Ines, ideas, and information.
Lack of Student Interest, Poor Attitude, Motivation, and Curiosity. Twelvepercent of the responses (23 individual responses) refer to students.
Students have so few experiences and knowledge of the world; it's hard to discussanything.Reduced chances of financial success for students. There are few good payingjobs after leaving school.Students don't care. Society doesn't place value on science.Many students have agendas other than schoolgangs, parenting, sportS.Student background. Students have poor study habits, poor motivation, lack ofparental support, poor math skills, and are working.
Large Class Sizes. Eleven percent of the responses (22 individual responses) statedthat class sizes are too large.
Classes of 35 are not conducive to lab or group work. I lose a lot ofpersonalization.
My class sizes are larger than the number of laboratory work stations.Too many students in a class and no enough time to give individual attentionduring a periments. The students become frustrated.
Limited or No Access to Technology and Current Textbooks. Eleven percent ofthe responses (21 individual responses) stated that they had limited or no access tocomputers, software, videodisc players, TV monitors, VCRs, overhead projectors, andtextbooks. Many also stated that equipment and textbooks were outdated.
Unable to have students network via computer.We have Macintosh computers, but only sixteen with little or no software. Ourfloppy disks are one per package, not 25 in a class set or site license.
Our book is approaching seven plus years. Science/Biology is ever changing andthe concepts and discoveries are on-going. We cannot teach from old books whendaily there are exciting, controversial issues that students are wanting to address.
Poorly Prepared Students. Nine percent of the responses (18 individual responses)stated with that students had low basic skills.
We need to challenge the advanced students more and do more involved work inBiology. We are spending too much time in enrichment and remedial work.
Levels are extremely low in ability to read and understand simple directions.
Lack of Supplies. Nine percent of the responses (18 individual responses) stated thatthey lack needed consumables or that budgets were inadequate zo purchase supplies.
Supplies, supplies, supplies!Not being able to use chemicals other than household supplies, not enough moneyper classroom to purchase supplies.
SurveysANIMIMMi
118111
Fronting money for supplies and waiting to be reimbursed.Poor student behavior. Eight percent of the responses (16 individual responses)commented that student disruptive student behavior was a major obstacle.
I spend too much t.me with disruptive students, while the well-behaved studentslose out. This makes me less patient to help those students with special needs. Itmakes teaching very exhausting.I would like to be able to allow my students to do more lab work, but I can'talways trust them.The few disruptive students in each class who poison the progress of the rest.
Inadequate rooms. Seven percent of the responses (13 individual responses) statedthat storage space and work space were inadequate and that they lacked access towater and tables.
Poor facilitiestwo or three teachers share the same classroom. Can't set updemonstrations and leave it all day. Moving to different classrooms.
Science taught in non-science rooms.Other obstacles. The following responses were mentioned six to 11 times each:(a) poor student attendance (11 responses); (h) lack of support from administrators,other teachers, central office, or others (8 responses); and (c) rigid class schedules,short class periods, and lack of flexible scheduling (6 responses).Other obstacles that were mentioned five times or fewer included: (a) lack of trainingfor the new textbook adoption in middle school, (b) little or no parent involvement,(c) non-science certified teachers at the middle school level, and (d) lack of laboratoryassistants.
SUMMARY
Elementary, middle, and high school teachers from across the entire school districtwere surveyed to enhance the view of mathematics and science education in theMilwaukee Public Schools. Three different survey instruments were used: (a)elementary school mathematics and science, (b) middle school and high schoolmathematics, and (c) middle school and high school science. The following is asummary of some of the major findings from the surveys of mathematics and science.
About half of the elementary teachers reported that they integrate mathematicsand science with each other or with other subject areas.Many teachers at all levels and in both subject areas indicated that they use smallgrog p or pair work on a daily or weekly basis.Teachers reported that students rarely use materials or equipment on a daily basisin middle school and high school mathematics.Over 80 percent of the teachers at all levels indicated that they explain ordemonstrate on a daily basis during mathematics instruction.
More middle and high school teachers than elementary teachers reported havingstudents do science experiments on a weekly basis.Elementary teachers indicated that their background knowledge was stronger inmathematics than in science.
112 Landscape of Mathematics and Science Education in Milwaukee
119

Elementary teachers felt more comfortable and were more enthusiastic teachingtoathematics than science, spent more time engaging students in mathematicslearning, and were more satisfied with their teaching strategies for mathematicsthan for science.Most middle and high school mathematics and science teachers were satisfiedwith their current teaching strategies and were comfortable teaching theirrespective subject areas.Teachers at all levels reported using a variety of assessment practices, includingportfolios and journals, with textbook and teacher tests being dominantassessment practices.Teachers indicated that calculator use by students in elementary classrooms wasinfrequent for mathematics and even more infrequent for science.
Most middle and high school mathematics teachers stated that their students usecalcuI Almost daily, while most science teachers indicated that studentsseldom alculators in their classes.Teachers indicated that computers were used by students more frequently thancalculators in elementary classes, particularly for mathematics.Teachers reported that computers were rarely used by students in middle and highschool science classes.Middle and high school mathematics teachers felt their ability to use calculatorsfor teac:_ing was strong.
Many elementary teachers felt their ability to use calculators for mathematicsteaching was weak.About 40 percent of the middle and high school mathematics and science teachersfelt their ability to use computers for teaching was weak.
Many elementary teachers felt their ability to use computers was adequate formathematics but weak for science.Most teachers at all levels indicated that both individual and collaborativeplanning time available to teachers was unsatisfactory.
About one third of the elementary school teachers felt that class time for sciencewas inadequate.
About half of the middle and high school science teachers indicated that classtime for science was unsatisfactory, and about mie third of the mathematicsteachers felt class time for mathematics was unsatisfactory.Most elementary teachers were dissatisfied with the availability of equipment andconsumable supplies for science.Most middle and high school science teachers were satisfied with the availabilityof equipment and supplies. Middle and high school mathematics teachers werealso satisfied with the availability of equipment, but felt the availability ofconsumable supplies was inadequate.Teachers at all grade levels reported low to no parent involvement in theirmathematics and science programs.
Teachers identified the following major obstacle.. to teaching mathematicsand science effectively at the elementary level: (a) lack of adequate materials,supplies, resources, and equipment; (b) lack of adequate time for planning;(c) large class sizes; (d) not enough class time; and (e) lack of adequate staffdevelopment and inservice.
Surveys 113
120

Teachers identified the following major obstacles to :caching mathematics andscience effectively at the middle school and high school levels: (a) student apathy,poor attitude, and fear of mathematics; (b) poor student background or skills andpoor class placement; (c) absenteeism and student mobility; (d) lack of parentalsupport; (e) poor student behavior.
Teachers identified the following major obstacles to teaching mathematics andscience effectively at the middle school and high school levels: (a) lack ofadequate time for planning; (b) lack of student interest, or poor attitude,Motivation, and curiosity; (c) large class sizes; (d) limited or no access totechnology and current textbooks; and (e) poorly prepared students.
114 Landscape of Mathematics and Science Education in Milwaukee
121

CHAPTER 6
Focus GROUP RESULTS
Without the input of community members and parents, the landscape would beunfinished. Their reflections, when combined with the in-depth focus obtained f iminterviews, classroom observations, and survey results, produced a wide angle viewthat represented all stakeholders.Through a focus group format, representatives from a broad spectrum of Milwaukee'sbusinesses, industries, agencies, and other institutions added their shadings to theMPS portrait. Three focus groups were held with community members and parents. Afourth focus group was held with MPS parents.
The community focus groups were held at a community center in Milwaukee. Anexperienced consultant was hired to facilitate the discussion of the three communityfocus groups, while a parent ar.d former teacher with experience working with MPSfamilies facilitated the parent group. Observers took extensive field notes containingnumerous quotations and comments made during the focus group discussions. Thesenotes were synthesized for perspectives on the current situation, key points andexamples, and suggestions for improving mathematics and science education in MPS.
COMMUNITY FOCUS GROUPS
Twenty-seven individuals participated in the community focus groups. Participantsrepresented business and industry, cultural agencies, parents of MPS children, parentorganizations, community organizations, univeysities and colleges, city government,the state department of education, and the state department of natural resources.
The following themes and summaries of current situations emerged through the focusgroup process. Key points, examples, and suggestions illustrate comments from thefocus group participants.
THEME: PARADIGM SHIFTS ARE NECESSARY TO ENSURE TRUE CHANGE AND REFORM
Current Situation. Most schools are still operating on one teacherone class forone academic year paradigm. Students need more access and exposure to role modelsin science and mathematics to see how it is used outside the classroom. Science andmathematics are too often taught as separate subjects and students do not see the linksbetween mathematics, science, and other subjects to the skills needed after highschool graduation.
Key Points and ExamplesSecondary schools have fifty minute classes and then the students move toanother class, another teacher, another subject.Students do not get enough i rie in the real world to apply what they have learnedin the classrooms.
Focus Groups
122115

SuggestionsAdministration needs to free teachers to change, not for fear but from innovation.Integrate science and mathematics with other subjects throughout the system.Schools need to adopt more flexible scheduling and be open other hours of the day.Expand the idea of informal education agencies as additional learningopportunities and classrooms, not just field trips.Change the format of how mathematics and science learning is delivered.Change the teacher contract to allow for more teaching and time flexibility.
THEME: ENTIRE COMMUNITY OWNS THE RESPONSIBILITY FOR EDUCATING ITS CHILDREN
Current Situation. The community sees education as the job of the schools, but thecommunity needs to reclaim the schoolseveryone owns the responsibility.Key Points and Examples
Historically, schools did not educate children, the community always did. We allneed to function in a bottom line environmentHoward Fuller can't do it alone;we neAd community support.Drive past a school. It's locked from 8:00 to 3:00. The community can't get in andthe children don't get out. Teacher conferences are only a nice step.I'm in industry and would like to be involved if my involvement is focused.Collaboration must involve mutual recognition of the problem and solutions.
SuggestionsAll parts of the community need planned time to create solutions.Decisions must be made horizontally and vertically.Schools need to be open more hours for community participation and learning.People other than parents need to visit schools on a regular basis.Identify the role of every person in the school or who visits the 'school, so that allknow where their resources would be most usefulEach school must come to the community with its specific needs.Make it a community process to translate the vision.Employers must be sensitive to parents' needs. If time is needed to go to a child'sschool, parents should get that time.Once all segments of the community understand and focus on a common goal,they can work together toward reaching that goal.Invite the community to help asses student outcomes.
THEME: COMMUNICATION AMONG PARENTS, SCHOOLS, DISTRICT, AND THE COMMUNITY
Current Situation. Not all segments of the community have input into school reformor know what is being reformed or why. The number of people attending schoolevents is declining. The Milwaukee Public Schools often has a negative image in theeyes of the public.
Key Points and ExamplesStudents who succeed have a vision of where they want to be and where theywant to go. Too often the rug is pulled out from under them after they leaveschool. Involve the whole community to provide for these outcomes.
116 Landscape of Mathematics and Science Education in Milwaukee
123

Parents, students, teachers, and staff must realize they need each other and mustask each other for help.Being proficient in mathematics and science often promotes a negative imageamong students.Negative attitudes and beliefs toward mathematics and science need to be changedby parents, teachers, administrators, and the rest of the community so all can helpstudents form their own visions and reach their goals.Milwaukee needs to be proud of its facilities compared to other cities.
SuggestionsSpend more time with focus groups, like this, so that everyone is touched. Thenall segments of the community will understand reform and be involved.All groups need to participate in the planning. Make it a community process totranslate the vision and help others to understand what forming a vision means.Provide a system for community feedbz.-x.Allow students to create and produce marketing strategies for change.Promote not only what staff and students are doing, but what families are doing.Churches and community organizations can assist in communicating what ishappening in the schools to parents and the community. They can also act aschange agents for school image and school success.
THEME: LEARNING CAN BE CHANGED THROUGH SYSTEMIC EFFORTS
Current Situation. The distribution of technology between the schools is inequitable.We have thrown all resources at a few schools and still they fail. Innovation byteachers and schools is often hampered or stopped by contract restrictions. Womenand ethnic and racial minorities are not represented as mathematics and science rolemodels in significant numbers.Key Points and Examples
In a large organization, everyone has his or her own turf and change meanscrossing into others' turf. Collaboration demands that people give up a piece ofthe pie to work toward a larger vision. It's possible, but it's still a threat.The word "systemic" puts the burden of change on everyone.The success of MPS is related directly to the success or failure of Milwaukee as acity.Right now, principals really only have time for crowd control and are not directlyparticipating in mathematics and science programs.
SuggestionsUSI needs to address gender, racial, and ethnic equity through role models in theschools and in the community, as well as changes in image.Resources must be allocated more equitably. For example, several schools cancollaborate and share the salary of one technology trainer to rotate among theschools to train the staff.Define success and allow failures to flow toward success.Provide rewards and support for successful programs.Mathematics and science must be integrated into all subjects and be relevant tostudent lives.
Focus Groups 117
124

Work with the union to lift restrictions and policies to allow innovation. Breakdown some barriers so the union will help develop the courage to innovate.Prepare the community to understand the realities of the change processit bringsdiscomfort and takes a long time. Establish a realistic time frame for change.Each school needs to develop its own vision.Break schools down into smaller units so students aren't just numbers.Have administrators participate in education programs to improve their own skillsin mathematics and science.Good things happen in all schools. What can you bring to the table that is thebest? This is the first step to changethe buy-in to get everyone there.
THEME: PARENTS ARE IMPORTANT TOTHE "-VHOLE PROCESS OF SYSTEMIC CHANGE
Current Situation. Parents are expected to help their children with school work,however, they often do not have the skills themselves. Parents often feel intimidatedby the schools. Employment responsibilities sometimes restrict parental involvementin the schools.
Key Points and ExamplesParents need to be more demanding and students need to see the roles parents canplay in the schools.Our paradigm as parents is self-preservation; don't show the school what youdon't know.
SuggestionsInclude parents as part of the USI planning as well as being recipients of support,involvement, empowerment, skill development ,and encouragement.Expand opportunities for parents, teachers, administrators, and students to learntogether on a regular basis. Children and adults can learn together.If parents are in the schools and classrooms regularly, school becomes lessthreatening for them.
Get teachers into the homes.
THEME: STAFF DEVELOPMENT AND SUPPORT IS CRITICAL
Current Situation. Many teachers do not know how to use state-of-the-art technology.Teachers need to get out into other work environments. Teachers are asked to do moreand more, but are not given the time or opportunities to learn themselves.
Key Points and ExamplesColleges and unersities are traditional and traditional methods turn off ourstudents. Where do we see instructors still using lectures, chalk, and chalkboards?There is nothing like a college to show how far behind we are.For greater understanding, business needs to be in the classrooms and teachersneed to see what is happening in the workplace and what skills are needed.
SuggestionsOpportunities must be made available for teachers to be learners and role modelsfor their students.Provide not only new technology, but also the time and opportunities for teachersto learn how to use it.
118 Landscape of Mathematics and Science Education in Milwaukee
125

Provide more planning and collaborative time for teachers.Involve teachers in deciding what their own needs are.Work with colleges and universities to improve teacher preparation programs inmathematics and science.Pay more attention to the research on education and learning.Support teachers as primary role models
THEME: ACCOUNTABILITY IS NEEDED
Current Situation. We are in a loopstandards are articulated on local, state, andnational levels, but they are not clear. When things are not working, we change thecurriculum, and when things still do not work, we change the curriculum again. Thesystem of accountability needs to be changed.
Key Points and ExamplesThe foundation of accountability is support for the people who need to producethe education. Not enough support is offered to enough people at one time.I, as an engineer, have to go through a performance review. What is the reviewprocess for teachers? What are the criteria? What are the corrective actions? Also,in manufacturing, there's a product. What is the product evaluation in educati
SuggestionsMPS must be held accountable for mathematics and science proficiency, not justcompetency, for all students.The process needs evaluation. Learner outcomes are needed and a way to assessactivities. We need to learn how to assess: What do we want? How can we get it?What are we getting? How can we help the person who is doing it to get there?We need to set up a model of assessment and convince unions to lift policies.
PARENT FOCUS GROUP
Nine parents participated in the parent focus group. They represented four high schoolstudents, three middle school students, and six elementary students in MPS. Severalparents also had grown children who had attended MPS.The following themes and summaries of current situations emerged through the focusgroup process. Key points, examples, and suggestions illustrate comments from thefocus group participants.
THEME: IMPROVE COMMUNICATION BETWEEN SCHOOL AND HOME
Current Situation. Many parents do not know what occurs in classrooms, schools,and in the district. Little uniformity in parent-school communication exists. Parentsneed greater access to schools and need to feel welcomed.
Key Points and ExamplesMy high school daughter has trouble with math. I helped her the way I did it incollege. I got a note from her teacher not to do it this way.
Focus Groups
126119
Parents need to be involved, but sometimes the definition of parent involvementoften is the teachers want us to do what they want. The ideal situation is thatparents and schools are team players, not competitors.Right now, my role as a parent at school is an adversarial thing. Teachers andparents are a threat to each other.Access of parents to the system should not be one of superior and subordinate.Parents need equal access and equal partnership in their children's education.Parents should not need permission to come to school, but they should freelycome to sit in on the classrooms. (While some focus group parents said they neverhad a problem with access to school, others had different experiences.) Someparents have been told they are coming too much.A concern exists that some parents have access to schools and then choose not todo anything about it.Parents need to learn the new education "buzz words."
SuggestionsReforms such as USI need to be marketed. We can't depend on the children orschool counselors to get the information to parents.Some of the USI funding should be used to get information to parents.More dialogue needs to existnot just sharing of information.Use direct mail.The parent Academy with Equity 2000 is already in place. Use it.Announcements and information can be passed on through churches. Most haveeducation committees.Use public service announcements.Communicate through PTOs and PTAs.More information about schools should be passed on through the MPS radiostation. WMYS is severely underused. USI could use the radio station. A petpeeve of mine is that MPS can't see the forest for the trees. The radio station isn'tused as an integral part of the school system.Employ a parent to work in the school on parent relations and communication.This person can call parents at home and be a liaison between other parents andthe school. This parent would not be asked to do anything else in school but workwith parents and communication.Develop mentoring relationships among parents which would spread the subtlemessage that parents are the foundation in their children's' education.Teachers should provide parents with a syllabus of what will be taught.
THEME: PARENTS ARE LEARNERS
Current Situation. Parents need more access to schools and programs that assistthem with overcoming their own mathematics and science anxieties, that help themactively participant in their children's education, and that help them continue theirown advancement and learning. Many parents would need initiatives to takeadvantage of such programs.
Key Points and ExamplesChildren often learn things their parents cannot do or do not understand.
Adults can learn from children.
120 Landscape of Mathematics and Science Education in Milwaukee
.127
Some elementary schools have Family Math and Family Science programs in theevening and Saturdays. The children bring the parents to school and they dothings together. This also provides an opportunity for teachers and staff to speakdirectly to parents.Teachers as well as parents need to feel less afraid of mathematics and science.This fear or lack of understanding is communicated to their children. Offerinservice for parents and teachers together.
SuggestionsGive the initiative and help to parents who want to continue their own education.If the parents value education, then their children will.Provide projects where parents learn with their childrenlearning goes up,discipline problems go down.Some USI funding could go to a few schools to create models for parentinvolvement and education and then use the models city-wide.Send home parent involvement assignments with each child of each class. Oneactivity a week for each subject for parents and students to do together. Have it onthe homework hot-lines. Have a procedure for parents on how to repeat things athome that have been taught at school.
7IEME: TEACHERS ARE LEARNERS
Current Situation. MPS needs to equip and support teachers to effectively teachmathematics and science.
Key Points and ExamplesTo be a teacher you have to be a learner.All students need to take Algebra by the ninth grade. This is going to be a roughyear for the students and the teachers. People who are teaching now are productsof learning mathematics differently. The teachers need more training and staffdevelopment so they are comfortable with it themselves.Children need to experience anxiety free mathematics and science at an early age.
The teachers need to know how to use manipulatives.Great mathematicians do not make good mathematics teachers. The teachers needto be educators. Children need to be involved.
SuggestionsHow about Eisenhower funds for teaching assistants? The importance of para-professionals and aids needs to be emphasized. Teaching assistants should havepaid inservice in mathematics and science like the teachers.Teachers need to have a choice of where they teach. This does not happen now.
More training needs to occur for new teachers at the new teacher orientation.Everyone gets different training in college. It would be great to have parents atthis orientation to welcome these new teachers. This would help make MPS morefriendly to new teachers. These new teachers are often lost at first. They needmore support and someone to take them under their wing. A nucleus of parentscould help support new teachers.MATC has a Pre-Teacher Organization (PTO). Future teachers do mentoring andtutoring with one child They get out with the children and deal with some of theproblems before they become teachers. This program is just getting started. MPScould support more programs like this at colleges and universities.
Focus Groups
128121

THEME: THE SCHOOL IS A COMMUNITY, NOT JUST CHILDREN AND TEACHERS
Current Situation. New initiatives and reforms need parent input in the early stagesof planning, not after the fact.
Key Points and ExamplesMore activities should involve parents, teachers, and students. At the SaturdayAcademy (attended by a parent and her child), mathematics and science wereintegrated. The parents and their children were in the same room doing problemsolving. This allowed the parents to feel how their children feel. A parent noted,"We felt great because we accomplished something. It waa a great experience."How do I feel about reforms and initiatives? We need to be creative on how wesell this to people and who will implement it so it doesn't stay status quo. Getparents involved in the beginning of the process. Parents can act as implementorsat schools where they are familiar with the staff and the programs.Parents need to be brought in more and right at the beginning. Too often it is"we'll call you when we need you" messages. Parents need to do the planning andhave a decision making capacity. If you're a stakeholder, you should be there.School to Work sent the wrong message to me. Only business was involved, atleast that's what it looked like to me. Parents got the implementation plan at themeeting. The planning was all over by then. It was insulting to parents.A problem exists for parents who are not informed. A parent commented, "I wentto a two-day School to Work conference and still had questions. Parents need lotsof information and need to be able to visits the sites. When I visited a site forSchool to Work, I saw a classroom there that the students would be using. I couldembrace the idea more after seeing where the children would be."The interaction outside of the classroom would be good. The students need thework experience, and then they need to come back together.Taking children out of the classroom should not infringe on other programs.Students should not work without getting paid.
SuggestionsMany pre-college programs exist, but they need to become more accessible to allstudents. Statewide programs, such as Science World, are difficult for students toget into, so perhaps these types of programs could be developed in this area. Someprograms should also be developed for younger children.We need tutors, both parents and children. Sometimes a parent is the worst personto tutor his or her own child. Other resources are needed. Create a peer tutorprogram and show how it can work. College students are under-utilized in thisrespect. High school students could be given time to work with younger children.The community-school concept is good. Everything we do separates the familyand the school. Everyone can go to school at night and be introduced to the manythings we've been talking about here. Children go to 10 different schools in myblock. If a school were open to the community, these children and their parentscould do things together in the neighborhood in which they live.The students need lots and lots of person to person time. We need to help peopleunderstand that education does not just happen in the classroom.The cost of the buses to get to places is too much. I worked with a plan in NewYork. Each teacher got a special sheet that allowed them to take students on thesubway or the city bus at reduced prices. It was cheap public transportation. Wecould work out something like this with the transportation department. This would
122 Landscape of Mathematics and Science Education in Milwaukee
129

teach people to ride public transportation more. It would also open up moreopportunities for smaller groups and impromptu situations.How about using the space behind the O'Donnell Park building for a mathematicsand science center. I think it's empty and it looks great. It's also a transit systemhook-up. Everyone could take the bus there!I, as a parent, have always experienced good flexibility on the part of myemployer to attend functions at my children's schools.Other visitors should have access to the schools. It will give the message that allchildren are our children.
THEME: CHANGES IN CURRICULUM AND INSTRUCTION ARE NEEDED
Current Situation. Smaller class sizes or assistants are needed to help teachers. MPSneeds to integrate the curriculum more, especially in high school, and provide formore flexible scheduling. Mathematics and science need to be applied to real life.
Key Points and ExamplesStudents need to learn how to learn. They need to know the tools of learning.Students need to see the mathematics connections from early on.
SuggestionsHands-on science and mathematics should begin with the very young children,while they are still excited about learning.Older students could work with younger children to teach them science andmathematics. Allow students to take responsibility for other students.Perhaps some programs could feed off of one another. For example, a geometryclass could design half time shows for the marching band.A cross section of all teachers should be involved in this mathematics and scienceinitiativethe arts, language, physical education.Instead of "she just doesn't understand what I'm teaching here," teachers need tothink, "How can I impart this information in a better way?" Teachers need tostimulate and challenge the children. With excitement, they will learn.They need to know what it really means to do mathematics and apply it in variousways as in real life. I believe in education being relevant to whatever is going onin the world. Children are not the future, they're the present.Children learn by doing, not by what we do. Some children just hear it and learn.Others are visual learners. Others are hands-on learners. Some are a combination.It's different for different people. Schools need to address all learning styles, aswell as peer learning, cooperative learning, and collaborative learning.Better connections need to occur between schools and the private sector. Aconnection is needed between things such as drafting, databases, andspreadsheets. The computer does not put people out of work, it is just a tool.
THEME: PARENT LIAISONS AND VOLUNTEERS ARE CRITICAL TO SCHOOL REFORM
Current Situation. Some parents do not feel welcome in the schools or they feeluncomfortable.
Key Points and ExamplesHospitality is an important issue . The parents must feel welcome. Parents must beacknowledged and not be mistreated. I'm sure teachers are taken for granted in the
Focus Groups 123
1 30

same way. People need to see the benefits of visiting the school and becomingfamiliar with the staff and programs.Sometimes the administration is fearful to tell the volunteer what to doit mightscare them off. These stereotypes need to be changed.
SuggestionsPerhaps there could be a paid parent position. This person would work with thestaff and parents as a liaison. He or she could teach parents they have a right to bein that school and be an ambassador for the parent that does not feel comfortablecommunicating with the staff. This person would help parents see the school staffnot as the enemy but as a team member. Some parents are afraid, perhaps,because of their own school experiences when they were young. We need moretime for teachers to spend with parents and their children. This person may be theone who works the longer day to contact parents and to set up tutoring.
Volunteers need a job description. They could be called "Volunteer Staff."
Volunteer parents in the schools need to know the people who are there. This is akey. The children also need to be familiar with the volunteers.
SUMMARY
Focus groups were held with community members and parents to broaden thelandscape perspective of mathematics and science education in MPS. Three focusgroups were held with individuals from a broad representation of Milwaukee'sbusinesses, industries, agencies, and other institutions, and a fourth focus group washeld with MPS parents. The following is a summary of the common concerns andsuggestions that surfaced from the four focus groups.
The entire community is responsible for a child's education.Children's learning should take place in the community as well as the classroom.
The schools need to be open to the community and parents for visiting andlearning during regular school hours, evenings, and weekends.To gain a better understanding of what the community can offer, teachers andstudents need to get into the workplace. Individuals from the community alsoneed to get into the schools.A variety of resources should be put into place to allow for clearer and bettercommunication between schools, parents, and the Milwaukee community.
Mathematics and science learning needs to be integrated, hands-on, and related tochildren's lives.School day scheduling needs to be more flexible.Parents need to be part of reform planning from the very beginning.
Learning opportunities should be provided for parents, teachers, andadministrators, as well as for the children.Opportunities should exist for parents and teachers to become more comfortablewith science and mathematics skills and content.Colleges, universities, and MPS should work more closely together in teacherpreparation in mathematics and science.
124 Landscape of Mathematics and Science Education in Milwaukee
131

APPENDIX A
MEMBERS OF THE WORKING GROUP
Stephen Adams
Jeffrey Anderson
Ed Anhalt
Joanne Anton
Patricia Barry
Carmen Baxter
Conni Blomberg
Marva Bredendick
Sallie Brown
David Caruso
Greg Coffman
Ramon Cruz
David Detsruin
Lynn Doyle
Cynthia Ellwood
Michael Endress
Larry Enochs
Elizabeth Freeman
Howard Fuller
David Guerrero
Rebecca Guerrero
Karleen Haberichter
Janie Hatton
Judy Heine
Mary Henry
De Ann Huinker
Bob Jasna
Jared Johnson
Patricia Kenner
Steven Kreklow
Jim Kurtz
City of Milwaukee-DPW
Vincent High School
Greater Milwaukee Education Trust
Office of the Mayor
Wright Multi language Middle School
Milwaukee Public Schools
Ronald E. McNair School
J.W. Riley School
Trowbridge Street School
Custer High School
Downey, Inc.
Morgandale School
MPS Board of School Directors
University of Wisconsin-Milwaukee
Milwaukee Public Schools
Grand Avenue Middle School
University of Wisconsin-Milwaukee
Edison Middle School
Milwaukee Public Schools
Milwaukee Area Technical College
Parent
Milwaukee Public Schools
Milwaukee Trade and Tech. H.S.
Milwaukee Public Schools
Milwaukee Public Schools
University of Wisconsin-Milwaukee
Milwaukee Public Schools
MPS Board of School Directors
Douglass School
Budget and Management Division
Milwaukee Public Schools
City Representative
Teacher
Community
City Representative
Teacher
Curriculum Specialist
Teacher
Teacher
Elementary Principal
Teacher
Community
Elementary Principal
Community
Project Assistant
Director, Educ. Services
Teacher
Post Secondary
Teacher
Superintendent
Post Secondary
Parent
K-5 Coordinator
Principal
Chapter 1 Supervisor
Equity 2000 Coordinator
Post Secondary
Deputy Superintendent
School Board Director
Teacher
City Representative
Chapter 1 Supervisor
Appendix A 125
132

Darlene Liston
Dan Lotesto
Hazel Luckett
Michael Mahoney
Connie Manke
Edward Mooney
Mary Morris
Floyd Mosley
Diane Neicheril
Vince O'Connor
Corey Odom, Jr.
Martin Ordinans
Jacqueline Patterson
Cyntha Pattison
Gretchen Pearson
Eric Peli
Cynthia Pierson
Judith Pokrop
Bill Raw les
Annie Rheams
Barry Rosen
Jerry Schnoll
Fred Schroedl
Katrina Simmons
Rhulene Swanigan
Karen Villwock
Catherine Washabaugh
Ella Washington
Charles Wikenhauser
Blaine Wisniewski
James Wojtech
Kay Zupko
Milwaukee Public Schools
Riverside University High School
Kagel School
Park Bank, East Office
Bay View High School
Wright Multi language Middle School
Parent
Milwaukee Public Schools
Clarke St. School
Milwaukee Public Schools
Milwaukee Area Technical College
Milwaukee Public Schools
Milwaukee Education Center
Department of Public Instruction
Parent
Milwaukee Public Schools
Parkview School
Milwaukee School Of Engineering
South Division High School
Marquette University
Milwaukee Public Museum
Zablocki Elementary School
Milwaukee Public Schools
J.W. Riley Elementary School
Kluge Science Center
Milwaukee Public Schools
Hartford Avenue School
Milwaukee Public Schools
Milwaukee County Zoo
Riverside University High School
Stuart School
Lloyd Street School
Supervisor
Teacher
Teacher
Community
Teacher
Teacher
Community & Parent
Ex. Ed. Program Adm.
Principal
Curriculum Specialist
Post Secondary
Supervisor
Principal
DPI Representative
Parent
Supervisor
Parent
Post Secondary
Mathematics Teacher
Post Secondary
Community
Teacher
Curriculum Specialist
Teacher
Teacher
Chapter 1 Supervisor
Principal
Chapter I Supervisor
Community
Teacher
Teacher
Teacher
126 Landscape of Mathematics and Science Education in Milwaukee
133
APPENDIX B
SITE VISIT GUIDEAND
DATA COLLECTION INSTRUMENTS

Mathematics and Science Education
Site Visit Guide
De Ann Huinker
Acknowledgments. Contributors to this guide include: Lynn Doyle, Gretchen Pearson,Karleen Haberichter, Karen Villwock, Cynthia Pierson, Greg Coffman, Patricia Kenner,Charles Wikenhauser, James Wojtech, Elizabeth Freeman, Dan Lotesto, David Guerrero,Darlene Liston, Blaine Wisniewski, David Caruso, and Mary Henry.
Center for Mathematics and Science Education Research2400 E. Hartford Ave 265 Enderis Hall
University of Wisconsin-MilwaukeeMilwaukee, WI 53201-0413
February 1994
128 Landscape of Mathematics and Science Education in Milwaukee
135
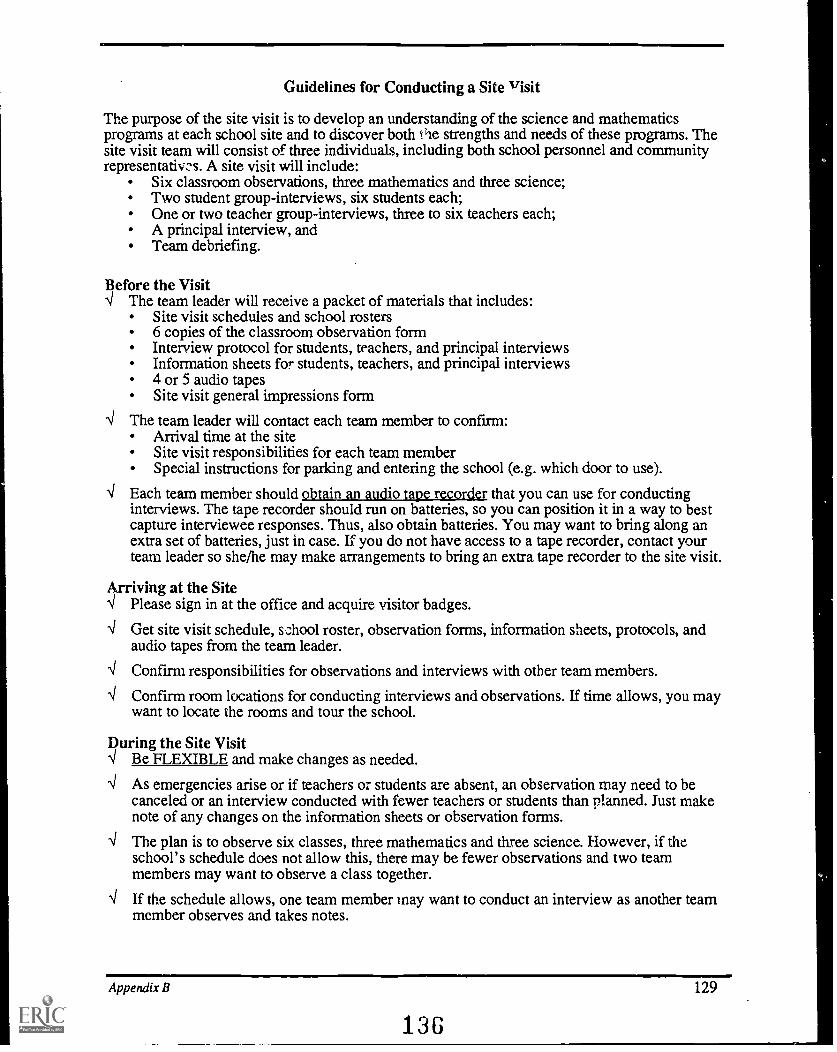
Guidelines for Conducting a Site visit
The purpose of the site visit is to develop an understanding of the science and mathematicsprograms at each school site and to discover both the strengths and needs of these programs. Thesite visit team will consist of three individuals, including both school personnel and communityrepresentatives. A site visit will include:
Six classroom observations, three mathematics and three science;Two student group-interviews, six students each;One or two teacher group-interviews, three to six teachers each;A principal interview, andTeam debriefing.
Before the Visit4 The team leader will receive a packet of materials that includes:
Site visit schedules and school rosters6 copies of the classroom observation formInterview protocol for students, teachers, and principal interviewsInformation sheets for students, teachers, and principal interviews4 or 5 audio tapesSite visit general impressions form
The team leader will contact each team member to confirm:Arrival time at the siteSite visit responsibilities for each team memberSpecial instructions for parking and entering the school (e.g. which door to use).
-4 Each team member should obtain an audio tape recorder that you can use for conductinginterviews. The tape recorder should run on batteries, so you can position it in a way to bestcapture interviewee responses. Thus, also obtain batteries. You may want to bring along anextra set of batteries, just in case. If you do not have access to a tape recorder, contact yourteam leader so she/he may make arrangements to bring an extra tape recorder to the site visit.
Arriving at the Site4 Please sign in at the office and acquire visitor badges.
4 Get site visit schedule, school roster, observation forms, information sheets, protocols, andaudio tapes from the team leader.
Confirm responsibilities for observations and interviews with other team members.
4 Confirm room locations for conducting interviews and observations. If time allows, you maywant to locate the rooms and tour the school.
During the Site Visit4 Be FLEXIBLE and make changes as needed.
-4 As emergencies arise or if teachers 07 students are absent, an observation may need to becanceled or an interview conducted with fewer teachers or students than planned. Just makenote of any changes on the information sheets or observation forms.
4 The plan is to observe six classes, three mathematics and three science. However, if theschool's schedule does not allow this, there may be fewer observations and two teammembers may want to observe a class together.
If the schedule allows, one team member may want to conduct an interview as another teammember observes and takes notes.
Appendix B
136
129

Conducting Classroom Observations4 Introduce yourself to the teacher. Thank her or him for the opportunity to observe the class.
4 Position yourself towards the back or side of the classroom.
4 If non-obtrusive, feel free to move about the room during the observation to better hear whatstudents are saying as they work in pairs or small groups or to better see what students areworking on or writing.
4 Record your observations directly on the observation form, or if you prefer you may recordyour observations on other paper and then transfer your notes to the form later. You will haveto decide what is most comfortable for youyou may want to do a combination of both.
Conducting Interviews (More information on conducting interviews is given later.)4 It is important that the room in which the interviews are conducted allow for privacy. The
door should be closed. You may want to put a sign on the door which states, "Interview inprogress, do not disturb."
4 For group interviews, it is best if all interviewees sit around the same table with theinterviewer. This puts each person at the same level. Then the tape recorder can be positionedin the center of the table. If the interviewees are sitting at desks, rearrange them into a circleand find an appropriate place to position the tape recorder.
4 If teachers or the principal refers to any specific school documents, try to obtain a copy ofthese documents and return them with the site visit materials.
Reflecting on the Site Visit4 After the completion of classroom observations and interviews, the site visit team should
find a place (with privacy) where they can discuss and reflect on the events of the visit.Someone should record the team's general impressions of the school's mathematics andscience programs. A recording form is provided in the team leader's packet of materials.
After the Site Visit4 The team leader should collect the following materials:
Classroom observation forms from all team members. (If team members need time torewrite or finalize their observational notes, they may return the information themselves.)Principal interview audio tape recording and information sheet.Teacher group-interview audio tape recording and information sheet.Student group-interview information sheets.Site visit team general impressions.Any other information or documents that were gathered.
4 Summary Reports of Student Interviews: Members of the site visit team are asked to summarizethe information from the student interviews. Please listen to the tape recording from eachinterview and summarize the students' responses to each questior You do not need totranscribe direct quotes unless you feel a response is particularly insightful, interesting, orimportant for the purpose of understanding the student perspective of the school's mathematicsand science programs. Forms for recording your summaries are provided in the team leader'spacket of materials.
Return all materials to your Site Visit Team Leader or to:U.S. Mail Vince O'Connor Deliveries Vince O'Connor
Curriculum & Instruction Central Administration Bldg, rm 265Milwaukee Public Schools Milwaukee Public SchoolsPO Box 2181 5225 West Vliet StreetMilwaukee, WI 53201 Milwaukee, WI 53208-2698
130 Landscape of Mathematics and Science Education in Milwaukee
137

Site Visit Team Leader Information
Prior to the Site VisitYou will receive a packet of materials for each school visit that includes:
3 site visit schedules and 3 school rosters6 copies of the classroom observation formStudent group-interview protocol and information sheets (2 copies)Teacher group-interview protocol and information sheet (1 or 2 copies)Principal interview protocol and information sheet4 or 5 audio tapesSite visit general impressions form2 copies of the student group-interview summary report form
4 Contact the site visit school to confirm site visit appointment and arrangements.4 Contact each team member to confirm:
Arrival time at the site.Assignment of site visit responsibilities for each team member.Availability of tape recorders.Special instructions for parking and entering the school (e.g. which door to use).
Arrange for audio tape recorders for yourself and any team members that may need one.
Arriving at the Site4 Confirm the site visit schedule with the principal and make arrangements for a room where
the site visit team can meet after the visit to discuss and reflect on the events of the visit.4 Confirm responsibilities for observations and interviews with other team members.
Distribute materials to team members: site visit schedule, school roster, observation forms,information sheets, protocols, and audio tapes.
During the Site VisitBe FLEXIBLE and make changes as needed.
4 If time constraints become a problem, attempt to complete activities as prioritized below:Classroom ObservationsTeacher interviewsStudent interviewsPrincipal interviews
Reflecting on the Site Visit4 Gather the team together to reflect on the events of the visit. Someone should record the
general impressions and comments made during this discussion. A recording form is provided.
After the Site Visit4 If any changes occurred to the original site visit schedule, please make note of them on the
schedule. This should be returned along with the other materials.4 Check to see that all audio tapes are labeled properly.4 Identify who will prepare summaries of the student interviews. Members of the site visit team
are asked to summarize this information to assist with the analysis of the data. Give thoseindividuals should be given the audio tape recordings from the student group-interviews.
4 Collect the following materials from the team:Classroom observation forms from all team members. (If team members want torewrite or need to finalize their observation notes, they may return the information toVince.)Principal interview audio tape recording and information sheet.Teacher group-interview audio tape recording and information sheet.Student group-interviews information sheets.Site visit team general impressions.Any other information or documents that was gathered and is relevant to the self-study.
Appendix B
133131

Classroom Observation Guide
School
Date
Name of Observer
Time Observation: began
ended
Grade level /Course
Subject area: mathematics or science
Student Informationtotal number of studentsmales Hispanics
females Asian-Am.
African-Am. Native Am.
Caucasians Others
Teacher InformationGender Ethnicity/Race i
Materials, Tools, Technology1. What materials are readily available? (e.g. computers,
calculators, math manipulatives, science supplies,animals, plants, rocks, microscopes, etc.)
2. What materials are the students and teacher using?
Students:
Teacher:
3. Other comments.
Classroom Climate
Seating anangement: Rows Groups
Pairs
1. Does the classroom seem crowded?
Are furniture and space appropriate and adequate forinstructional purposes?Describe.
2. Imagine you are a student. Does the room lookinviting? Give examples. (e.g. What is on the walls?bulletin boards?)
3. Characterize and describe student engagement andenthusiasm (e.g. engaged, active, passive, goingthrough the motions). Give examples.
4. Characterize the teacher's enthusiasm and excitementfor the subject area. Give examples.
5. Other comments.
132 Landscape of Mathematics and Science Education in Milwaukee
139

Instruction1. Describe the content focus of the lesson and the
methods of instruction. (e.g. What are studentslearning about or investigating? How are theylearning this? Through lecture, whole classdiscussion, individual inquiry, small group, etc.)
2. Describe connections made to students' every daylives? to careers? to other disciplines/subject areas?
3. Other comments.
Teacher Focus1. Describe the teacher's role in the classroom (e.g.
lecturer, director, facilitator, coach, etc.)? Giveexamples.
2. What is the teacher stressing? Give examples.
Understanding:
Problem Solving:
Risk Taking:
Following Directions:
Memorization:
Other:
3. Other comments.
Appendix B
140133

Student Focus1. What are the students doing? (e.g. listening to the
teacher; working in groups; doing lab or hands-onactivities; doing workbook or text exercises;explaining their reasoning; participating in classdiscussions; etc.)?
2. Describe how the students interact with the teacher.(e.g. Who does most of the talking?)
3. Describe how the students interact with each other.
4. Were the students engaged in cooperative orcompetitive activities? Give examples.
(Student Focus continued.)
5. Describe evidence of student self-assessment (teacheror student initiated; e.g. journal writing, summaries,etc.)
6. Other comments.
Equity1. Comment on the diversity of gender/race/ethnicity
among small groups or pairs of students and seatingarrangements.
2. Does the teacher seem to equally engage, encourage,and interact with all students regardless of gender /ethnicity / race? Give examples.
3. Other comments on evidence of or lack of equity.
134 Landscape of Mathematics and Science Education in Milwaukee
141

Other Descriptions, Examples, and CommentsDescribe any episodes that made an impression on you, positive or negative, or comment on other observations.
General Impressions
Circle the number that corresponds to your perception of this lesson for each item according to this rating scale.
5=Very Often 4=Often 3= Sometimes 2=Seldom 1=NeverVery Often Never
1. The lesson was student-centered (e.g. opportunities existed for studentsto investigate problems of interest).
2. Students talked with each other and interacted for the purpose of makingsense of the ideas being examined and for helping each other investigate problems.
3. The teacher helped the students build upon their prior knowledge and experiences(e.g. asked students to think about important ideas from past lessons).
4. Students were given responsibility and control over their learning and were encouragedto think independently (e.g. to use their own ideas and ways of investigating problems).
5
5
5
5
4
4
4
4
3
3
3
3
2
2
2
2
1
Note: Collect copies of any handouts or worksheets and attach them to this report.
Appendix B
142135

Guidelines for Conducting Interviews
Preparation for the Interview
4 Review the interview questions.
4 Check the cassette player and batteries. Also, check for clarity of recording by playing backthe introductory remarks (listed below).
4 Record the following information on the audio tape:Type of interview: Teacher, Principal, or Student.SchoolDateName of interviewer
For example, "This is a student group-interview at Hi-Mount Elementary School. Today isFebruary 23, 1994. The interviewer is (your name)."
.4 The above information should also be written on the label on the tape.
Conducting the Interview
.4 Before the tape recorder is turned on, you must state the purpose of the interview and inform theinterviewee(s) of the fact that confidentiality will be preserved. See statement on the protocol.
4 Fill out the information sheet, record gender and ethnicity/race for each interviewee, as wellas grade level for students and teaching position for each teacher.
4 As you conduct the interview, be careful not to get into a discussion with the interviewees.Simply pose the question. Then use mainly nonverbal cues to encourage the interviewees toelaborate and verbalize (e.g. nod your head, remain silent when the person stops talking, etc.).However, do probe the interviewees when needed to get more responses and more detail. Forexample, here are some probes you might want to use:
Does anyone else have something to add? (with a long pause)What do you think?Would you elaborate on that? or Tell me more about that.Could you give an example?What you are saying is very important. It would help if you would say more about that.
4 Listen carefully to the interviewees' responses. You may need to make adjustments in questionformat or repeat questions based on the characteristics of comments made.
Shallow responses: Ask them to elaborate.Off-target responses: Rephrase the question to focus attention.Rambling/unfocused responses: Let me stop you there for a moment.... rephrase question.
4 In the event that the tape recorder fails at some point during an interview, (1) attempt to quicklyfind another tape recorder; or (2) re-schedule the interview if possible; or (3) write notes tocapture as much of the interview as possible.
After the Interview
4 Be sure the information sheet has been filled out.
4 Punch out the two tabs at the back of the cassette to prevent it from being accidentally erased.
For teacher and principal interviews, give information sheet and audio tape to the team leader tobe returned. For student interviews, give the information sheet to the team leader to be returnedand give the audio tape to the individual who has volunteered to summarize the interview.
136 Landscape of Mathematics and Science Education in Milwaukee
143

Student Group-InterviewInformation Sheet
School Date
Interview Conducted by:
Gender* Ethnicity/Race** Grade Level
Student 1
Student 2
Student 3
Student 4
Student 5
Student 6
*M: male; F: female
**AA: African-Am.; H: Hispanic; C: Caucasian; AS: Asian-Am.; NA: Native Am.;0: Other (please indicate ethnicity/race if possible)
Comments
Appendix B
144137

Teacher Group-InterviewInformation Sheet
School Date
Interview Conducted by:
Gender* Ethnicity/Race** Teaching Position
Teacher 1
Tea Cher 2
Teacher 3
Teacher 4
Teacher 5
Teacher 6
*M: male; F: female
**AA: African-Am.; H: Hispanic; C: Caucasian; AS: Asian-Am.; NA: Native Am.;0: Other (please indicate ethnicity/race if possible)
Comments
138 Landscape of Mathematics and Science Education in Milwaukee
145

Principal InterviewInformation Sheet
School Date
Interview Conducted by:
Principal Information
Gender (circle one): Male Female
Ethnicity/Race: African-American Hispanic Caucasian
Asian-American Native American
Other (please indicate)
Comments
Appendix B 139
146

Student Group-Interview Protocol
(Introduce yourself and explain the purpose of the interview. Here is an example introduction.)
Hi. My name is and I'm visiting your school today with two other people. We've beenobserving some math and science classes, as well as talking with some of your teachers and withyour principal. The reason I wanted to talk with you is because we think that students can teach us alot about how math and science can be made more meaningful and interesting.
We are interested in your opinions. There are no right or wrong answers. I'm going to run a taperecorder because I can't write fast enough to get everything down on paper that you'll be saying.Don't worry, no one here at the school will listen to the tapenot your teacher, not the principal,not anyone. We want you to tell us what you think and how you feel.
(Turn on the tape recorder. Position it in the center of the group.)
For elementary and middle level students:I'd like for each of you to tell me what grade you are in.
For high school students:I'd like for each of you to tell me what grade you are in and what math and science classes youare taking right now.
We're going to start out with some brainstorming. How many of you have done brainstormingbefore? What is it?
1. I am going to show you something and then I'm going to ask you to tell me what came to yourmind when you saw that. Ready? (Wait a moment, then show the card with "math class"written on it. Pause a moment longer.) What did you think of when I showed you math class?
(Be sure to get at least one response from every student. Probe interesting responses.)Probes: What do you think? What else comes to mind? What do you mean by that?
2. I am going to show you something else and then I'm going to again ask you to tell me whatcomes to your mind when you see this word. Ready? (Wait a moment, then show the card with"science class" written on it. Pause a moment longer.) What did you think of when I showedyou science class?
(Be sure to get at least one response from every student. Probe interesting responses.)Probes: What do you think? What else comes to mind? What do you mean by that?
3. I would like you to pretend that you are in control of your math class. You can decide whatis taught and how it is taught. You are still in the class, but you make the plans for this idealmath class.
a. If you could describe your ideal math class, what would you be doing?
b. What would your teacher be doing?
c. What would you study or learn about?
d. What kinds of activities would you be doing?
e. How does this differ from what typically happens in your math class?
140 Landscape of Mathematics and Science Education in Milwaukee
147

4. This time I would like you to pretend that you are in control of your science class. You candecide what is taught and how it is taught. You are still in the class, but you make the plans forthis ideal science class.
a. If you could describe your ideal science class, what would you be doing?
b. What would your teacher be doing?
c. What would you study or learn about?
d. What kinds of activities would you be doing?
e. How does this differ from what typically happens in your science class?
5. In math or science class, if you could choose, would you rather work in groups or alone?Why?
6. A lot of kids wonder why they have to study math and science in school.How will it help you with anything outside of school?Can you give me some examples?
7. What kinds of special thingsthings like materials, tools, toys, equipment, and machinesdoyou use in your math and science classes?
Probes: Do you ever use calculators or computers in math or science class?How often do you get to use them? or Would you like to use them? Why?What types of things do (would) you use them for?
8. Think of someone in your class who is 'good' in math. (Wait a few seconds.) Why did youpick that person?
9. Think of someone in your class who is 'good' in science. (Wait a few seconds.) Why did youpick that person?
10. Sometimes people find math or science difficult. Tell us what you do when math or scienceis hard for you.
Probes: Does anyone at home ever help you with your math or science work?Who helps you?
11. Do you think your teachers like math or science? How can you tell?
Or you may prefer to phrase the question this way for middle and high school students:
Do you think your math teacher likes math? How can you tell?Do you think your science teacher likes science? How can you tell?
12. Is there anything else you'd like to tell us about your math or science classes?
13. Is there anything you would like to ask us?
Almommln
Appendix B 141
148

Teacher Group-Interview Protocol
(Introduce yourself and explain the purpose of the interview. Here is an example introduction.)
I really appreciate your willingness to participate in this interview about your mathematics andscience programs. We are grateful for the opportunity to observe some of the mathematics andscience classes in this school, to talk with your principal and some students, and to talk with you.
I will be audio taping the interview so that I can be free to concentrate on what we are talkingabout, rather than having to take extensive notes. The recording will be kept confidential. Noindividual names, or even the name of the school, will be associated with any of your comments.
(Turn on the tape recorder. Position it in the center of the group.)
1. I'd like for each of you to state your position in this school and briefly describe yourresponsibilities in the areas of mathematics and science.
Probes: What grade level? What subject area? How many classes do you teach?
2. Let's begin by talking about your goals for teaching mathematics or science. I'd like a fewof you to talk about one or two of your goals, and then have the rest of you comment onhow your goals are similar or different or describe additional goals.
3. What do you feel is the most important resource needed to truly make a positive change inyour mathematics or science program?
Probes: What about additional materials? equipment? time? staff? money? inservice?
4. A lot of things can get in the way of effective mathematics and science instruction. Whatare the biggest barriers to effective mathematics and science instruction?
Probes: What can be done to reduce or eliminate these barriers?
5. What are the strengths or needs of your school related to the use of technology for teachingmathematics or science?
6. What factors or conditions make it possible or difficult for each of you to regularly engageyour students in hands-on investigations or in small group work?
142 Landscape of Mathematics and Science Education in Milwaukee
149

7. Let's talk about monitoring students' progress and understanding in mathematics andscience. What kinds of assessment strategies do you use in your classrooms?
Probes: Do you use any special strategies to encourage student self-assessment of theirmathematics and science learning?
8. Why do you think there is a performance gap between white (or Caucasian) students andminorities in mathematics and science?
9. What, if anything, could be done differently with respect to your staff development thatcould improve your ability to implement your mathematics and science programs moreeffectively?
Probes: What do you see as the priority for staff development in your school?Who decides the content of staff development programs?
10. What opportunities are there for you as a mathematics or science teacher to discuss or shareideas and resources with teachers of similar or other curricular areas?
Probes: What opportunities exist within your school? (at same and different grade levels)What opportunities exist within the district? (at same and different school levels)
11. It's often difficult to integrate mathematics and science with other subject areas. Whatsuccesses have you had in doing this?
12. Could you describe the level of family involvement in your school?
Probes: To what extent are families involved in mathematics and science?What kinds of activities are families involved in?What activities occur to support families in assisting their children'smathematics and science learning at home?
13. Could you describe the level of support from business and industry, cultural agencies, andother community organizations for mathematics and science in your school?
Probes: What kinds of support have you received (or would you like to receive)?What opportunities exist for student participation in out-of-school activitiesrelated to mathematics and science (e.g. outdoor activities, field trips, campingtrips, career shadowing experiences)?
14. Is there anything else you would like us to tell us about your mathematics or scienceprograms?
Appendix B 143
150

Principal Interview Protocol
(Introduce yourself and explain the purpose of the interview. Here is an example introduction.)
I really appreciate your willingness to participate in this interview about your mathematics andscience programs. We are grateful for the opportunity to observe some of the mathematics andscience classes, to talk with some of the teachers and some students, and to talk with you.
I will be audio taping the interview so that I can be free to concentrate on what we are talkingabout, rather than having to take extensive notes. The recording will be kept confidential.
(Turn on the tape recorder.)
1. On a scale from 1 to 10, with one being low and ten being high, how would you rate yourmathematics program?
Probes: Why did you rate it aWhat is your school doing well in regards to its mathematics program?What needs to happen for your mathematics program to improve?What have you seen that concerns you?
2. This time on a scale from 1 to 10, how world you rate your science program?
Probes: Why did you rate it aWhat is your school doing well in regards to its science program?What needs to happen for your science program to improve?What have you seen that concerns you?
3. In your judgment, how comfortable are the teachers with the mathematics and scienceprograms that they are implementing? Why do you say that?
4. What support systems are available in your school to help teachers implement theirmathematics and science programs?
5. What opportunities do teachers have for sharing ideas and resources related to mathematicsand science instruction?
Probes: How effective are these opportunities?Is your school typical in this area? If not, what accounts for the differences?
6. To what extent do classroom activities include the use of mathematics manipulatives orscience materials to enhance understanding? Why do you think this is the case?
Probes: For elementary and middle school principals :Your teachers were recently given a math manipulative kit, to what extent are theteachers using these materials? Why do you think this is the case?
7. Could you talk about the availability and use of calculators and computers for mathematicsand science instruction.
Probes: Do you have any plans or hopes for enhancing the technological resourcesavailable to teachers in this building?
144 Landscape of Mathematics and Science Education in Milwaukee
151

8. Have mathematics or science been the focus of any staff development so far this year?
Probes: What kinds of programs have been offered?How effective have they been?
9. What are the most important things you see your staff needing to work on in the areas ofmathematics or science?
10. Are there any opportunities for teachers of different grade levels to get together to work onprogram development or address areas of concern or need?
Probes: What opportunities exist within your school?What opportunities exist with other schools at the same level?What opportunities exist with schools at other levels (e.g. elementary and middle;middle and high; high and college)?
11. Could you describe the level of family involvement in your school?
Probes: What kinds of activities are families involved in?What activities occur to support families in assisting their children'smathematics and science learning at home?
12. Could you describe the level of support from business and industry, cultural agencies, andother community organizations for mathematics and science in your school?
Probes: What kinds of support have you received (or would you like to receive)?What opportunities exist for student participation in out-of-school activitiesrelated to mathematics and science (e.g. outdoor activities, field trips, campingtrips, career shadowing experiences)?
13. What evidence have you seen that the mathematics and science instruction is having aneffect on students?
14. Why do you think there is a performance gap between white (or Caucasian) students andminority students in mathematics and science?
15. Do you have any initiatives going on at the moment in the area of using alternativeassessments in the area of mathematics and science? If so, please describe.
16. How would you characterize your staff's enthusiasm toward mathematics and science?
17. Is there anything else that you would like to tell us about your mathematics and scienceprograms?
Appendix B
152145

Site Visit General Impressions
School Date
Site Visit Team Members:
After the completion of classroom observations and interviews, the site visit team shouldfind some time to discuss and reflect on the events of the visit. Use this sheet to record someof the team's general impressions of the school's mathematics and science programs.
146 Landscape of Mathematics and Science Education in Milwaukee
153

APPENDIX C
SURVEY INSTRUMENTS
Appendix C
154
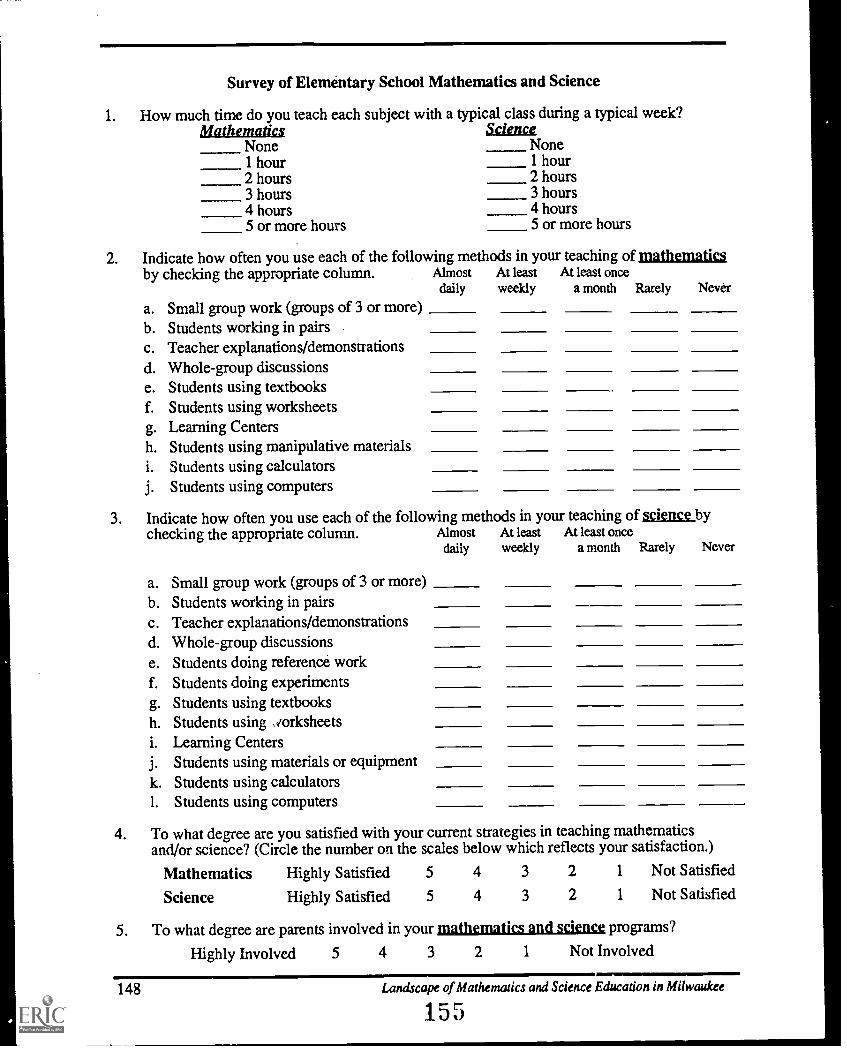
Survey of Elementary School Mathematics and Science
1. How much time do you teach each subject with a typical class during a typical week?Mathematics Science
None None1 hour 1 hour2 hours 2 hours3 hours 3 hours4 hours 4 hours5 or more hours 5 or more hours
2. Indicate how often you use each of the following methods in your teaching of jnathematiesby checking the appropriate column. Almost At least At least once
daily weekly a month Rarely Never
a. Small group work (groups of 3 or more)b. Students working in pairsc. Teacher explanations/demonstrationsd. Whole-group discussionse. Students using textbooksf. Students using worksheetsg. Learning Centersh. Students using manipulative materialsi. Students using calculatorsj. Students using computers
3. Indicate how often you use each of the following methods in your teaching of science bychecking the appropriate column. Almost At least At least once
daily weekly a month Rarely Never
a. Small group work (groups of 3 or more)b. Students working in pairsc. Teacher explanations/demonstrationsd. Whole-group discussionse. Students doing reference workf. Students doing experimentsg. Students using textbooksh. Students using orksheetsi. Learning Centersj. Students using materials or equipmentk. Students using calculators1. Students using computers
4. To what degree are you satisfied with your current strategies in teaching mathematicsand/or science? (Circle the number on the scales below which reflects your satisfaction.)
Mathematics Highly Satisfied 5 4 3 2 1 Not Satisfied
Science Highly Satisfied 5 4 3 2 1 Not Satisfied
5. To what degree are parents involved in your mathematics and scienct programs?
Highly Involved 5 4 3 2 1 Not Involved
148 Landscape of Mathematics and Science Education in Milwaukee
155

6. To what degree are consumable supplies regularly purchased by your school for studentuse? (Circle a number on each scale below.)
Mathematics All are Purchased 5 4 3 2 1 None are PurchasedScience All are Purchased 5 4 3 2 1 None are Purchased
7. To what degree are non-consumable supplies available in sufficient quantity for studentuse? (Circle a number on each scale below.)
Mathematics All are Available 5 4 3 2 1 None are AvailableScience All are Available 5 4 3 2 1 None are Available
8. To what degree do you agree with each of these statements:a. All students can learn mathematics.
Strongly Agree 5 4 3 2 1 Strongly Disagree
b. All students can learn science.Strongly Agree 5 4 3 2 1 Strongly Disagree
9. To what degree do you perceive mathematics and/or science to be valued in your school?
Mathematics Highly Valued 5 4 3 2 1 Not Valued
Science Highly Valued 5 4 3 2 1 Not Valued
10. How do you evaluate your students' performance in mathematics and/or science?(Check all that apply.) Mathematics Sciencea. Textbook testsb. Teacher-developed testsc. Teacher observationd. Portfoliose. Journals/Learning Logsf. Performance Tasksg. Checklistsh. Anecdotal Recordsi. Other. Please list and indicate whether it is used for mathematics (M), science (S), or
both (B).
11. What do you feel are your own strengths and weaknesses in teaching mathematics and/orscience?(Circle the number on each scale which reflects the degree of strength or weakness.)
StrengthMathematics
StrengthScience
WeaknessWeakness
a. Background knowledge 5 4 3 2 1 5 4 3 2 1
b. Conducting demonstrations 5 4 3 2 1 5 4 3 2 1
c. Facilitating hands-on activitiesand experiments
5 4 3 2 1 5 4 3 2 1
d. Assessing student learning 5 4 3 2 1 5 4 3 2 1
e. Enthusiasm for subject 5 4 3 2 1 5 4 3 2 1
f. Making connections to real life 5 4 3 2 1 5 4 3 2 1
g. Conducting outdoor activities 5 4 3 2 1 5 4 3 2 1
h. Using computers 5 4 3 2 1 5 4 3 2 1
i. Using calculators 5 4 3 2 1 5 4 3 2 1
Appendix C
156149
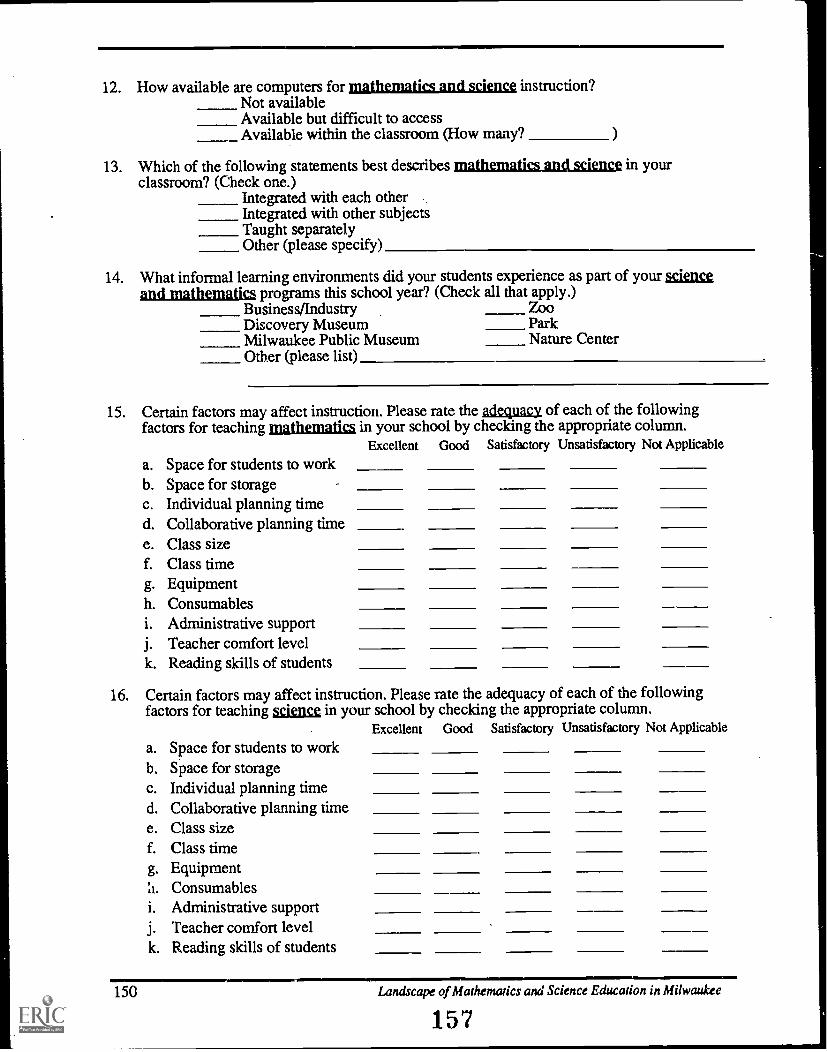
12. How available are computers for mathematics and science instruction?Not availableAvailable but difficult to accessAvailable within the classroom (How many?
13. Which of the following statements best describes mathematics and science in yourclassroom? (Check one.)
Integrated with each otherIntegrated with other subjectsTaught separatelyOther (please specify)
14. What informal learning environments did your students experience as part of your scienceand mathematics programs this school year? (Check all that apply.)
Business/Industry ZooDiscovery Museum ParkMilwaukee Public Museum Nature CenterOther (please list)
15. Certain factors may affect instruction. Please rate the adequacy of each of the followingfactors for teaching mathematics in your school by checking the appropriate column.
Excellent Good Satisfactory Unsatisfactory Not Applicable
a. Space for students to workb. Space for storagec. Individual planning timed. Collaborative planning timee. Class sizef. Class timeg. Equipmenth. Consumablesi. Administrative supportj. Teacher comfort levelk. Reading skills of students
16. Certain factors may affect instruction. Please rate the adequacy of each of the followingfactors for teaching science in your school by checking the appropriate column.
Excellent Good Satisfactory Unsatisfactory Not Applicable
a. Space for students to workb. Space for storagec. Individual planning timed. Collaborative planning timee. Class sizef. Class timeg. Equipment
Consumablesi. Administrative supportj. Teacher comfort levelk. Reading skills of students
150 Landscape of Mathematics and Science Education in Milwaukee
157

17. Policies and practices for calculator use in mathematics:
a. Do your students have access to calculators owned by the school? yes no
If yes, what kind of calculators and how many?
b. Are students allowed to use calculators on your tests? yes no
c. Do you encourage students to use calculators for homework? yes no
d. Do you permit students the unrestricted use of calculators in class? yes no
18. Circle the number on each scale below which reflects your feeling about teachingjnathematio:a. Enjoyable 5 4 3 2 1 Not Enjoyable
b. Exciting 5 4 3 2 1 Boring
c. Satisfying 5 4 3 2 1 Frustrating
d. Rewarding 5 4 3 2 1 Unfulfilling
e. Comfortable 5 4 3 2 1 Stressful
19. Circle the number on each scale belowa. Enjoyableb. Excitingc. Satisfyingd. Rewardinge. Comfortable
55555
44444
3
3
333
which reflects your feeling about teaching science:2 Not Enjoyable2 Boring2 Frustrating2 Unfulfilling2 Stressful
1
1
1
1
20. Within the last three years, about how many hours of staff development in mathematicsand/or science have you participated in?
Hours in Mathematics Hours in Science
21. List below the factors which you feel are major obstacles to teaching mathematics andscience effectively. Identify whether each factor is for mathematics (M), science (S), orboth (B).
22. What grade level(s) do you teach?
23. What position do you currently hold?
24. How many years have you been teaching?
25. Indicate the highest degree you have earned:BS/BA BS/I3A+16 BS/BA+32
MS/MA MS/MA+16 MS/MA+32Doctorate
26. Indicate your sex: Female Male
27. Indicate your ethnicity/race:African-AmericanAsianNative-American
HispanicCaucasianOther (please specify)
Thank you for completing this survey. Your contribution to this effort is greatly appreciated.
Appendix C
158151

Survey of Middle School and High School Mathematics
1. How many mathematics classes do you teach in a typical week? (Please list.)
2. What other subjects do you regularly teach besides mathematics?
3. Indicate how often you use each of the following methods in your teaching of mathematicsby checking the appropriate column. Almost At least At least once
daily weekly a month Rarely Never
a. Small group work (groups of 3 or more)b. Students working in pairsc. Teacher explanations/demonstrationsd. Whole-group discussionse. Students using textbooksf. Students using worksheetsg. Students using manipulative materialsh. Students using calculatorsi. Students using computers
4. To what degree are you satisfied with your current strategies in teaching mathematics?(Circle the number on the scale below which reflects your satisfaction.)
Highly Satisfied 5 4 3 2 1 Not Satisfied
5. To what degree are consumable supplies regularly purchased by your school for student usein mathematics? (Circle a number on the scale below.)
All are Purchased 5 4 3 2 1 None are Purchased
6. To what degree are non-consumable mathematics supplies available in sufficient quantityfor student use? (Circle a number on the scale below.)
All are Available 5 4 3 2 1 None are Available
7. To what degree do you agree with this statement: "All students can learn mathematics."
Strongly Agree 5 4 3 2 1 Strongly Disagree
8. To what degree are parents involved in your mathematics program?
Highly Involved 5 4 3 2 1 Not Involved
9. To what degree do you perceive mathematics to be valued in your school?
Highly Valued 5 4 3 2 1 Not Valued
152 Landscape of Mathematics and Science Education in Milwaukee
159

10. How do you evaluate your students' performance in mathematics? (Check all that apply.)a. Textbook testsb. Teacher-developed testsc. Teacher observationd. Portfoliose. Journals/Learning Logsf. Performance Tasksg. Checklistsh. Anecdotal Recordsi. Other (please list )
11. What do you feel are your own strengths and weaknesses in teaching mathematics? (Circlethe number on each scale which reflects the degree of strangth or weakness.)
Strength Weakness
a. Background knowledge 5 4 3 2 1
b. Conducting demonstrations 5 4 3 2 1
c. Facilitating hands on activities 5 4 3 2 1
d. Assessing student learning 5 4 3 2 1
e. Enthusiasm for subject 5 4 3 2 1
f. Making connections to real life 5 4 3 2 1
g. Using computers 5 4 3 2 1
h. Using calculators 5 4 3 2 1
12. How available are computers for mathematics instruction?Not availableAvailable but difficult to accessAvailable within the classroom (How many? )
13. Which of the following statements best describes mathematics in your classroom? (Checkone.)
Integrated with other subjectsTaught separatelyOther (please specify)
14. What informal mathematics learning environments did your students experience as part ofyour mathematics program this school year? (Check all that apply.)
Business/Industry ZooDiscovery Museum ParkMilwaukee Public Museum Nature CenterOther (please list)
15. Policies and practices for calculator use in mathematics:a. Do students have access to calculators in your classroom? yes no
If yes, what kind of calculators and how many?
b. Are students allowed to use calculators on your tests? yes no
c. Do you encourage students to use calculators for homework? yes no
d. Do you permit students the unrestricted use of calculators in class? yes no
Appendix C
160153
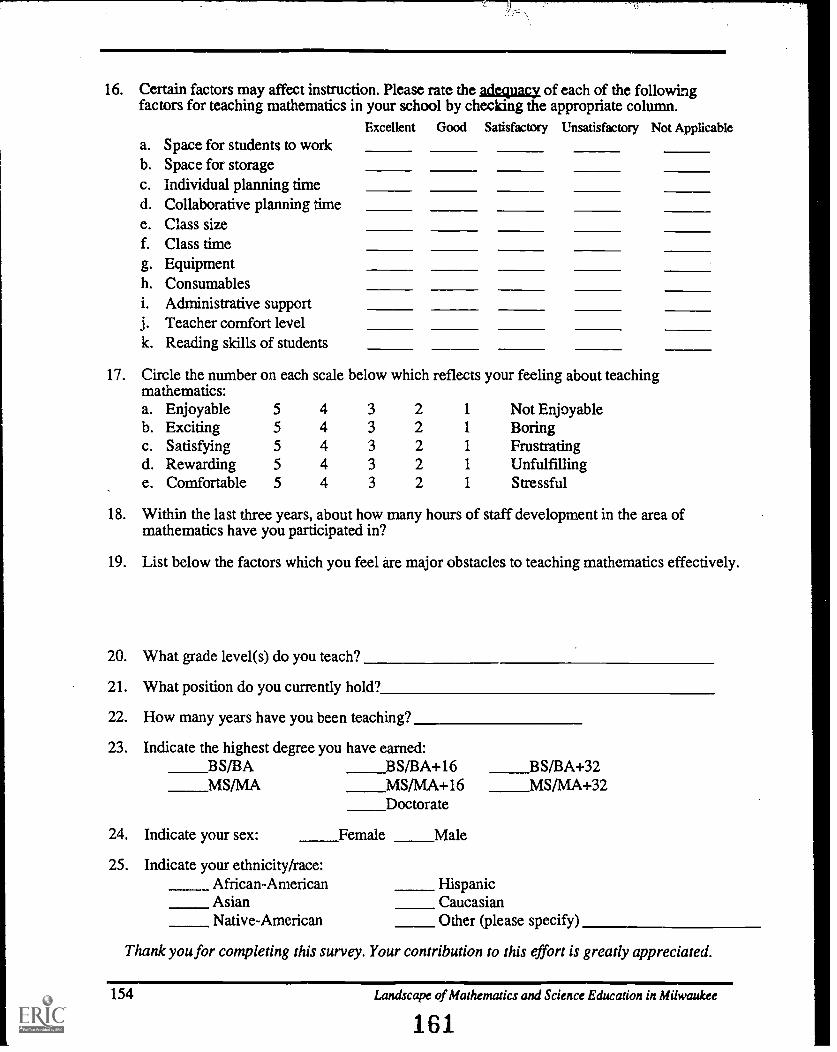
16. Certain factors may affect instruction. Please rate the adequacy of each of the followingfactors for teaching mathematics in your school by checking the appropriate column.
Excellent Good Satisfactory Unsatisfactory Not Applicablea. Space for students to workb. Space for storagec. Individual planning timed. Collaborative planning timee. Class sizef. Class timeg. Equipmenth. Consumablesi. Administrative supportj. Teacher comfort levelk. Reading skills of students
17. Circle the number on each scale below which reflects your feeling about teachingmathematics:a. Enjoyable 5 4 3 2 1 Not Enjoyableb. Exciting 5 4 3 2 1 Boringc. Satisfying 5 4 3 2 1 Frustratingd. Rewarding 5 4 3 2 1 Unfulfillinge. Comfortable 5 4 3 2 1 Stressful
18. Within the last three years, about how many hours of staff development in the area ofmathematics have you participated in?
19. List below the factors which you feel are major obstacles to teaching mathematics effectively.
20. What grade level(s) do you teach?
21. What position do you currently hold?
22. How many years have you been teaching?
23. Indicate the highest degree you have earned:BS/BA BS/BA+16MS/MA MS/MA+16
Doctorate
BS/BA+32MS/MA+32
24. Indicate your sex: Female Male
25. Indicate your ethnicity/race:African-American HispanicAsian CaucasianNative-American Other (please specify)
Thank you for completing this survey. Your contribution to this effort is greatly appreciated.
154 Landscape of Mathematics and Science Education in Milwaukee
161
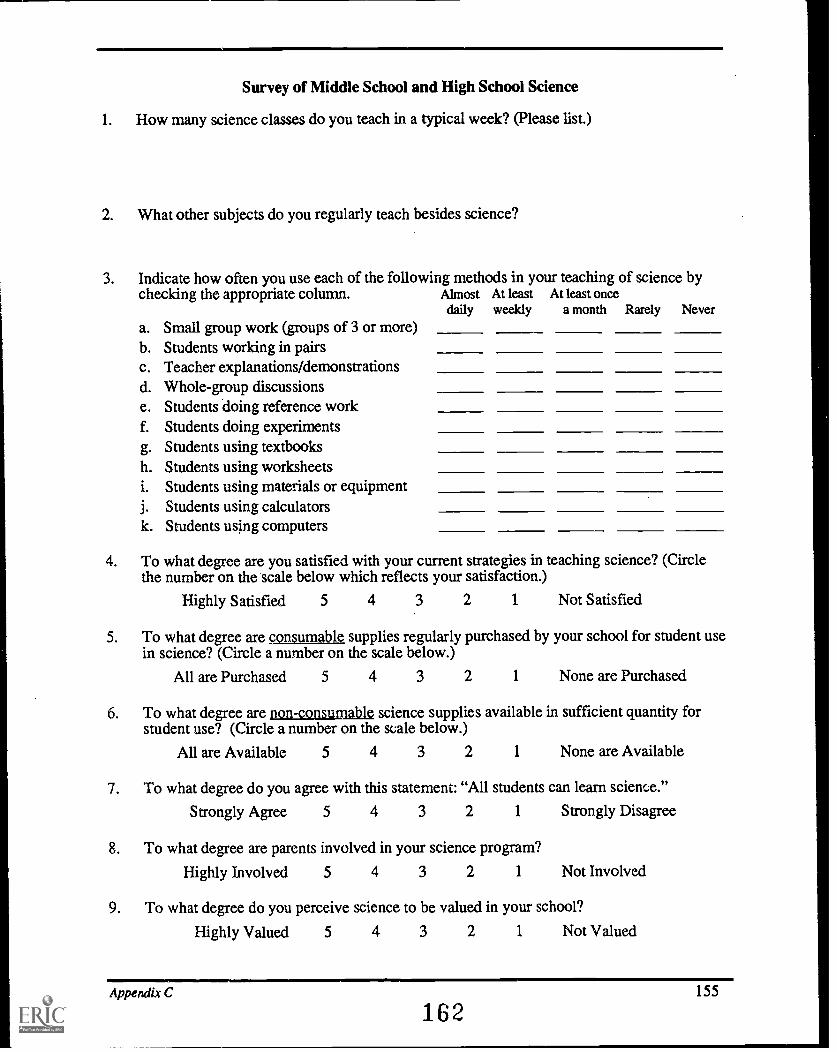
Survey of Middle School and High School Science
1. How many science classes do you teach in a typical week? (Please list.)
2. What other subjects do you regularly teach besides science?
3. Indicate how often you use each of the following methods in your teaching of science bychecking the appropriate column. Almost At least At least once
daily weekly a month Rarely Never
a. Small group work (groups of 3 or more)b. Students working in pairsc. Teacher explanations/demonstrationsd. Whole-group discussionse. Students doing reference workf. Students doing experimentsg. Students using textbooksh. Students using worksheetsi. Students using materials or equipmentj. Students using calculatorsk. Students using computers
4. To what degree are you satisfied with your current strategies in teaching science? (Circlethe number on the scale below which reflects your satisfaction.)
Highly Satisfied 5 4 3 2 1 Not Satisfied
5. To what degree are consumable supplies regularly purchased by your school for student usein science? (Circle a number on the scale below.)
All are Purchased 5 4 3 2 1 None are Purchased
6. To what degree are non-consumable science supplies available in sufficient quantity forstudent use? (Circle a number on the scale below.)
All are Available 5 4 3 2 1 None are Available
7. To what degree do you agree with this statement: "All students can learn science."
Strongly Agree 5 4 3 2 1 Strongly Disagree
8. To what degree are parents involved in your science program?
Highly Involved 5 4 3 2 1 Not Involved
9. To what degree do you perceive science to be valued in your school?
Highly Valued 5 4 3 2 1 Not Valued
Appendix C 155
162

10. How do you evaluate your students' performance in science? (Check all that apply.)a. Textbook testsb. Teacher-developed testsc. Teacher observationd. Portfoliose. Journals/Learning Logsf. Performance Tasksg. Checklistsh. Anecdotal Recordsi. Other (please list )
11. What do you feel are your own strengths and weaknesses in teaching science?(Circle thenumber on each scale which reflects the degree of strength or weakness.)
Strength Weakness
a. Background knowledge 5 4 3 2 1
b. Conducting demonstrations 5 4 3 2 1
c. Facilitating hands on activities 5 4 3 2 1
d. Assessing student learning 5 4 3 2 1
e. Enthusiasm for subject 5 4 3 2 1
f. Making connections to real life 5 4 3 2 1
g. Using computers 5 4 3 2 1
12. Which of the following statements best describes science in your classroom? (Check one.)Integrated with other subjectsTaught separatelyOther (please specify)
13. How available are computers for science instruction?Not availableAvailable but difficult to accessAvailable within the classroom (How many?
14. Certain factors may affect instruction. Please rate the adequacy of each of the followingfactors for teaching science in your school by checking the appropriate column.
Excellent Good Satisfactory Unsatisfactory Not Applicable
a. Space for students to workb. Space for storagec. Individual planning timed. Collaborative planning timee. Class sizef. Class timeg. Equipmenth. Consumablesi. Administrative supportj. Teacher comfort levelk. Reading skills of students
156 Landscape of Mathematics and Science Education in Milwaukee
163

15. What informal science learning environments did your students experience as part of yourscience program this school year? (Check all that apply.)
Business/Industry ZooDiscovery Museum ParkMilwaukee Public Museum Nature CenterOther (please list)
16. Circle the number ov each scale below which reflects your feeling about teaching science:a. Enjoyable .5 4 3 2 1 Not Enjoyableb. Exciting 5 4 3 2 1 Boringc. Satisfying 5 4 3 2 1 Frustratingd. Rewarding 5 4 3 2 1 Unfulfillinge. Comfortable 5 4 3 2 1 Stressful
17. Within the last three years, about how many hours of staff development in science have youparticipated in?
18. List below the factors which you feel are major obstacles to teaching science effectively.
19. What grade level(s) do you teach?
20. What position do you currently hold?
21. How many years have you been teaching?
22. Indicate the highest degree you have earned:BS/BA BS/BA+16 BS/BA+32MS/MA MS/MA+16 MS/MA, 32
Doctorate
23. Indicate your sex: Female Male
24. Indicate your ethnicity/race:African-AmericanAsianNative-American
HispanicCaucasianOther (please specify)
Thank you for completing this survey. Your contribution to this effort is greatly appreciated.
Appendix C
161157

158 Landscape of Mathematics and Science Education in Milwaukee
165

APPENDIX D
FOCUS GROUP PARTICIPANTS
Essie Allen, United WayFran Bartley, GE MedicalLinda Bell, MilwaukeeWalter Brame, Urban LeagueCharles Causier, HNTB CorporationFelmers Chaney, NAACPTyrone Dumas, City of MilwaukeeMiguel de Jesus, MilwaukeeEdith Fmlayson, Greater Milwaukee Education TrustBeverly Greenberg, Warner CableDaniel Grego, NOVA, Shalom High SchoolMary Glass, MilwaukeeLori Hammond, Milwaukee
Delorse Harrington, Private Industry CouncilKate Huston, Milwaukee Library
Laveme Jackson-HarveyJon Jensen, Marquette UniversityRolf Johnson, Milwaukee MuseumCaroline Joyce, JASON ProjectPam Krajenka,MilwaukeeVanessa Kuehner, MilwaukeeCarol Miller, Health Education CenterJane Moore, Milwaukee FoundationSteve O'Connell, Milwaukee Spectrum, Inc.Jeffrey Osborne, Wisconsin Medical CollegeJudy Pokrop, Milwaukee School of EngineeringMary Quilling, Department of Public InstructionAnnie Rheams, Marquette School of EducationDavid Riemer, Mayor's Office
Thelma Sias, Wisconsin Gas CompanyLinda Simmons, Cardinal Stritch CollegeJoyce Staten, MilwaukeeAl Stenstrup, Department of Natural ResourcesDebbie Stewart, Center for Education ResearchFran Swigart, Future Milwaukee
Edith Adekle Wilson, MilwaukeeWalter Zoller, Parents' Legislative Network
Appendix D 159
166

160 Landscape of Mathematics and Science Education in Milwaukee
167
APPENDIX E
Focus GROUP QUESTION GUIDES
Appendix E
168161

COMMUNITY FOCUS GROUP QUESTIONS
The Current SituationIn the areas of mathematics and science, what are the current challenges facingour society, students, and the workforce?What do you need and want in your incoming workforce (skills, abilities, values)?What's positive in this view? What are the gaps between what is needed and whatis happening now?
The FutureBreaking Out of Old ParadigmsWhat could schools do differently to better equip students and our entryworkforce in the areas of mathematics and science? What changes could be madein these areas to benefit students and the community at large?What might the transformed mathematics/science learning environment look like?
Focus on CollaborationThe Milwaukee Urban Systemic Initiative has a basic assumption underlying it'seffortsthat the involvement of the greater community in planning, supporting, andparticipating in the mathematics and science education process is essential to thesuccess of the community.
How can all the parts of Milwaukee's educational systemcommunity, teachers,parents, administratorscollaborate to sustain quality mathematics, science, andtechnology education for all of Milwaukee's students?A goal of the initiative is to promote reciprocity (benefiting both the schools andthe community). Considering new paradigms, what might this reciprocity looklike?
Communicating the VisionHow can these changes be communicated throughout the community?How can the community be prepared for these changes?How can positive support be promoted for these changes?
4111111.
162 Landscape of Mathematics and Science Education in Milwaukee
169

PARENT FOCUS GROUP QUESTIONS
Parent Involvement in the SchoolsHow comfortable are you in your child's school? How comfortable do you feelother parents are?What kinds of communication do you experience between parents and school?Do you see connections between the school and the rest of the community?How do you feel about teachers preparation to teach mathematics and science?What is your knowledge of the mathematics and science curricula being taught inyou child's school?
InstructionWhat does a good science class or mathematics class look like?How familiar are you with the various reforms in education here in Milwaukee,such as integrated curriculum, authentic and alternative assessment, cooperativelearning?What are some experiences you have had in your children's mathematics andscience education?How do you feel about student shadowing and apprenticeships in industry andbusiness?
Attitudes and Satisfaction with Own Mathematics and Science AbilitiesHow comfortable are parents with helping their children with mathematics andscience homework?How do you think parents feel about their own abilities with technology?What do you envision as your role in mathematics/science/technology educationfor your children?
Parent and Community InvolvementWhat do you see as barriers to your involvement with your child's school andwith the district in regard to mathematics and science education?What do you see as barriers to community involvement in mathematics andscience education?
Changes in the Schools and in the CommunityWhat are some ideas on how your vision of mathematics and science educationcan be realized in MPS?What changes will need to take place in the community to bring about systemicreform?How can the Urban Systemic Initiative communicate to parents to keep theminformed on what is happening?
Appendix E
170163
Related Documents


![Eric Katz Department of Mathematics arXiv:math/0610878v3 ... · Eric Katz Department of Mathematics University of Texas ... Caetano Veloso [41] Abstract We give an introduction to](https://static.cupdf.com/doc/110x72/5c651a3309d3f2b26e8c2e79/eric-katz-department-of-mathematics-arxivmath0610878v3-eric-katz-department.jpg)

