LANDMARK UNIVERSITY, OMU-ARAN LECTURE NOTE 1 COLLEGE: COLLEGE OF SCIENCE AND ENGINEERING DEPARTMENT: MECHANICAL ENGINEERING Course code: GEC216 Course title: GENERAL ENGENEERING LABORAATORY I Credit unit: 3 UNITS. Course status: compulsory ENGR. ALIYU, S.J Course Content :– Laboratory investigations and report submission on selected experiments and projects drawn from introduction to electrical Engineering, Materials science, Applied Mechanics, Applied computer Programming II, and Workshop Technology courses. LABORATORY POLICY. Groups Students will be formed into groups of three or four on the first lab day. Once a student has signed up with a group, he or she may not change groups without prior approval of the instructor. Small groups develop teamwork and cooperative learning skills, and promote student interactions that allow students with experience and knowledge in specific areas to lead or share with other students. Lab Reports You will perform the experiment in group, and turn in ONE REPORT PER GROUP. Your report should be self-contained, i.e. an engineering technologist should be able to perform the experiment and duplicate your results by reading your report. DO NOT "adjust" your data to make them fit what you believe to be an acceptable value. Your report should be an accurate description of the experiment. If your results differ significantly from reference values you should check your settings carefully (calibration, wrong units, wrong calculations, etc.), and do the experiment again. Try to explain any discrepancies but do not "adjust" your data. Report Format The report must be typewritten. A report should include the following in order A. A title page, which includes the following information, in order: 1. Course Number and Section Number 2. Experiment Title 3. Names of the Group Members (who contributed to do the lab/report) 4. Due Date B. Objective or purpose of the experiment work. C. Theoretical aspect of the experiment. D. Experimental procedure that explains briefly the procedure of how the experiment was performed and all the equipment used. E. Experimental and /or calculated results. (Include all data you have taken, a sample calculation, and the results) The result table must be presented in tabular form. Also, all calculations and graphical work (e.g. graph) must be hand written/drawn. F. Discussion of results in light of the theoretical “predictions”. Include an error analysis. Quantify the errors whenever possible. G. Conclusions, wherein you write what you learned from the experiment. Your conclusions must summarize your report and must be based on your experimental results

Welcome message from author
This document is posted to help you gain knowledge. Please leave a comment to let me know what you think about it! Share it to your friends and learn new things together.
Transcript

LANDMARK UNIVERSITY, OMU-ARAN
LECTURE NOTE 1
COLLEGE: COLLEGE OF SCIENCE AND ENGINEERING
DEPARTMENT: MECHANICAL ENGINEERING Course code: GEC216
Course title: GENERAL ENGENEERING LABORAATORY I
Credit unit: 3 UNITS.
Course status: compulsory
ENGR. ALIYU, S.J
Course Content :–
Laboratory investigations and report submission on selected experiments and projects drawn from
introduction to electrical Engineering, Materials science, Applied Mechanics, Applied computer
Programming II, and Workshop Technology courses.
LABORATORY POLICY.
Groups Students will be formed into groups of three or four on the first lab day. Once a student has signed up with a group, he
or she may not change groups without prior approval of the instructor. Small groups develop teamwork and
cooperative learning skills, and promote student interactions that allow students with experience and knowledge
in specific areas to lead or share with other students.
Lab Reports You will perform the experiment in group, and turn in ONE REPORT PER GROUP. Your report should be
self-contained, i.e. an engineering technologist should be able to perform the experiment and duplicate your
results by reading your report. DO NOT "adjust" your data to make them fit what you believe to be an
acceptable value. Your report should be an accurate description of the experiment. If your results differ
significantly from reference values you should check your settings carefully (calibration, wrong units, wrong
calculations, etc.), and do the experiment again. Try to explain any discrepancies but do not "adjust" your data.
Report Format The report must be typewritten. A report should include the following in order
A. A title page, which includes the following information, in order:
1. Course Number and Section Number
2. Experiment Title
3. Names of the Group Members (who contributed to do the lab/report)
4. Due Date
B. Objective or purpose of the experiment work.
C. Theoretical aspect of the experiment.
D. Experimental procedure that explains briefly the procedure of how the experiment was performed and all the
equipment used.
E. Experimental and /or calculated results. (Include all data you have taken, a sample calculation, and the
results) The result table must be presented in tabular form. Also, all calculations and graphical work (e.g. graph)
must be hand written/drawn.
F. Discussion of results in light of the theoretical “predictions”. Include an error analysis. Quantify the errors
whenever possible.
G. Conclusions, wherein you write what you learned from the experiment. Your conclusions must summarize
your report and must be based on your experimental results
Lab reports are due at the beginning of next lab. Late lab reports will not be accepted.
Note: In order to get a good grade in the lab, please follow the instructions listed below:
1. Read about the lab prior to the beginning of the lab. Do each lab with an attitude of learning.
2. Please bring your lab manual to the lab. Each group should have at least one lab manual with them.
3. Students are advised to bring blank and graph papers to the lab, on which you can do calculations and
draw graphs.
**Remember, the lab grade is 40% of your final grade. Doing well in lab will help you in getting a good overall
course grade. Remember,
―Nothing worthwhile will ever be achieved without deep thought and hard work‖
Attendance
Attendance will be taken at the beginning of every lab session. Make up lab activities will be scheduled only for
University approved absences or unless the HOD gives prior approval.
Students with challenges
If a student have any form of challenge, such a student must show the clearance absenting him/her from the lab
to the coordinator of the programme/technologist.
Strength of Materials Lab Policy
We want to maintain the high quality conditions of this lab for the students in future years. Thus, it is necessary
for you to adhere to the established policy of NO BEVERAGES, FOOD, NEWS PAPERS, MAGAZINES,
TOBACCO PRODUCTS AND ANIMALS within the Strength of Materials lab.
Safety
For your own safety, please wear the pants and shoes that cover toes for this Lab. The safety goggle will
be needed for several labs.
LAB NO--–
NAME OF EXP…. Point Bending Test on (NAME OF EQUIPMENTUSED)
Time: ______/______/_2016/17_
Group Name: _________________
Member #1:___________________
Member #2:___________________
Member #3:___________________
Member #4:___________________
Member #5:___________________
Objective: To understand the importance of beam deflection and perform a 3 point-bending test on an aluminum beam.
Theory: The axis of a beam deflects from its initial position under action of applied forces. Accurate values of these
beam deflections are sought in many practical cases, e.g., elements of machines must be of sufficient rigidity to
prevent misalignment and to maintain dimensional accuracy under load; in buildings, floor beams cannot deflect
excessively to avoid the undesirable psychological effect of flexible floors on occupants and to minimize or
prevent distress in brittle-finish materials. Likewise, information on deformation characteristics of members is
essential in the study of vibrations of machines as well as of stationary and flight structures. Deflections are also
used in analyses of statically indeterminate problems. In short, an understanding of how to compute beam
deflections is important.
For a simply-supported beam with a point load P at its center, maximum deflection is given by:

Where,
P = load in lbs. (N)
L= Span Length (mm)
E= modulus of Elasticity (N/mm2
)
I= Moment of Inertia of the cross of the beam. (mm4
)
Note: The product of E and I is called Beam Stiffness.
Experiment United SFM Test System applies a controlled load on a specimen slowly and steadily, thereby bending it. The
user specifies test parameters such as type of test, units, preload, crosshead speed, and extensometer while the
computer controls most of the testing process, including recording the applied load, deflection and the load-
deflection curve.
Procedure There are five steps involved in each tensile test:
1. Specimen preparation
2. Setting test parameters
3. Running the 3 point bending test
4. Collecting load-deflection data 25
5. Evaluating experimental results.
Steps for operating the computer 1. Switch on the computer
2. Click on the UNITED TESTING icon.
3. Now click on the DATUM 2.7 icon. After clicking on this icon you will come to a table written as MAIN
MENU. You will have different options like Specimen Preparation, Testing, Data and Reports etc
4. Click on Specimen Preparation.
5. You will see different tests listed. Double click on #110 D790 Test. Note that the hardware set for the test is
30000 lb load cell
6. Put the customer name, Operator name, span and then click on MEASUREMENTS
7. On the next screen enter the SPECIMEN ID and then width and thickness of the specimen you have
measured. Click on the area button and then on EXIT to exit the screen
8. Next screen will be the TESTING screen. Place the specimen on the supports. The other options on this
screen can be exercised by pressing the letter, which is highlighted. For example, to go to SCALES press L.
Again type L to get load cell information and select 30000 lbs load cell application. Press L again and then type
E and select 920516-type extensometer.
9. Press Z key to zero. Then click the T key twice to start the test. The load cell will exert load till the specimen
fractures at its outer surface or it reaches the maximum strain. Hit O twice if there are no changes to be made in
the graph. Hit Q to exit the test screen.
10. On the next screen you will see the tests results. Click on the GRAPH to view the graph of Deflection vs.
Load for the specimen you broke.
11. Click on REPORT to observe report and graph. Print the report.
Required: Each student is required to submit the following:
1. Experimental load vs. deflection curve for the specimen
2. Use the formula
for the deflection. Calculate the deflection at the middle of the beam, as a
function of load P and find out the maximum deflection taking maximum load. Also calculate the value of beam
stiffness.
3. Plot a theoretical deflection vs. load curve, taking 10 data points. That is, for loads choose your own values
ranging from 0 to maximum load (which you can get from the experimental graph) and for deflections (by the
formula). Take E = 10*106
psi.
4. Compare the theoretical graph with the experimental graph.
GRAPH
GEC 216 Lab Report
Lab NO—
NAME OF EXP….. Determination of Modulus of Elasticity and Poisson’s Ratio
Time: ______/______/_2016/17_
Group Name: _________________
Member #1:___________________
Member #2:___________________
Member #3:___________________
Member #4:___________________
Member #5:___________________
Objective: To determine the Modulus of Elasticity and Poison’s ratio of Aluminum, the specimen being a cantilever beam,
and compare them with theoretical values.
Theory:
1. Modulus of Elasticity Modulus of elasticity (E) of a material is determined by the slope of the straight-line potion of its stress strain
curve. It is the ratio of change of stress to the corresponding change of strain. E is a definite property of a
material and is an index of the stiffness of that material. It means that a material having a higher slope on its
stress-strain curve will be stiffer and will deform less under load than a material having a smaller slope.
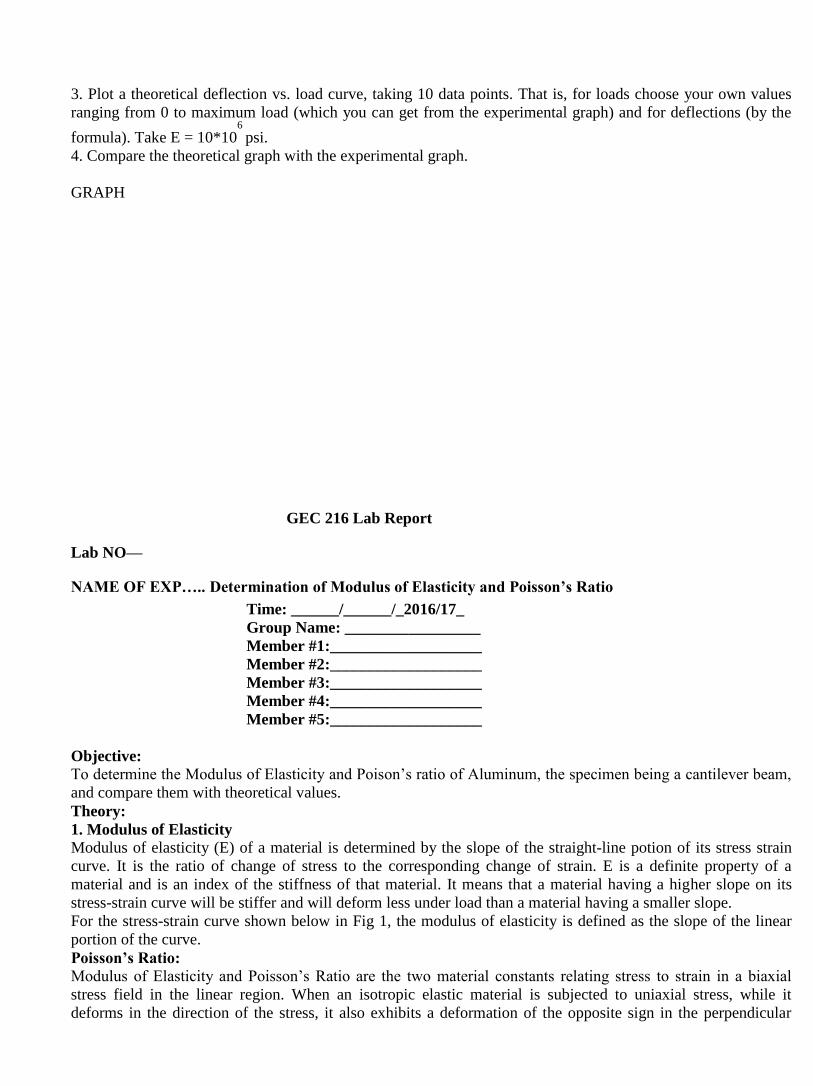
For the stress-strain curve shown below in Fig 1, the modulus of elasticity is defined as the slope of the linear
portion of the curve.
Poisson’s Ratio: Modulus of Elasticity and Poisson’s Ratio are the two material constants relating stress to strain in a biaxial
stress field in the linear region. When an isotropic elastic material is subjected to uniaxial stress, while it
deforms in the direction of the stress, it also exhibits a deformation of the opposite sign in the perpendicular
direction. Poisson’s Ratio is the absolute value of the ratio of transverse strain to the axial strain in a uniaxially
stressed member (Fig 2).
FIG-1 Stress-Strain Diagram showing Modulus of Elasticity

Fig 2 - Poisson's Ratio
Experiment: A cantilever beam is a common structural element. Examples include airplane wings, overhanging roofs, and
front wheel spindles of automobiles. A cantilever beam is a beam built-in and supported only on one end. In this
experiment the modulus of elasticity of a material will be determined by implementing the setup shown in Fig 3.
Fig 3 - Cantilever beam with assumed uniform stress distribution (nominal stress)
A cantilever beam with a strain gauge attached in the axial direction on the top of the beam and a strain gauge
attached on the bottom of the beam in the transverse direction can be used to determine the Poisson's ratio of a
material. A parallel-sided, constant cross-section beam loaded statically may be used. The stress in the beam is
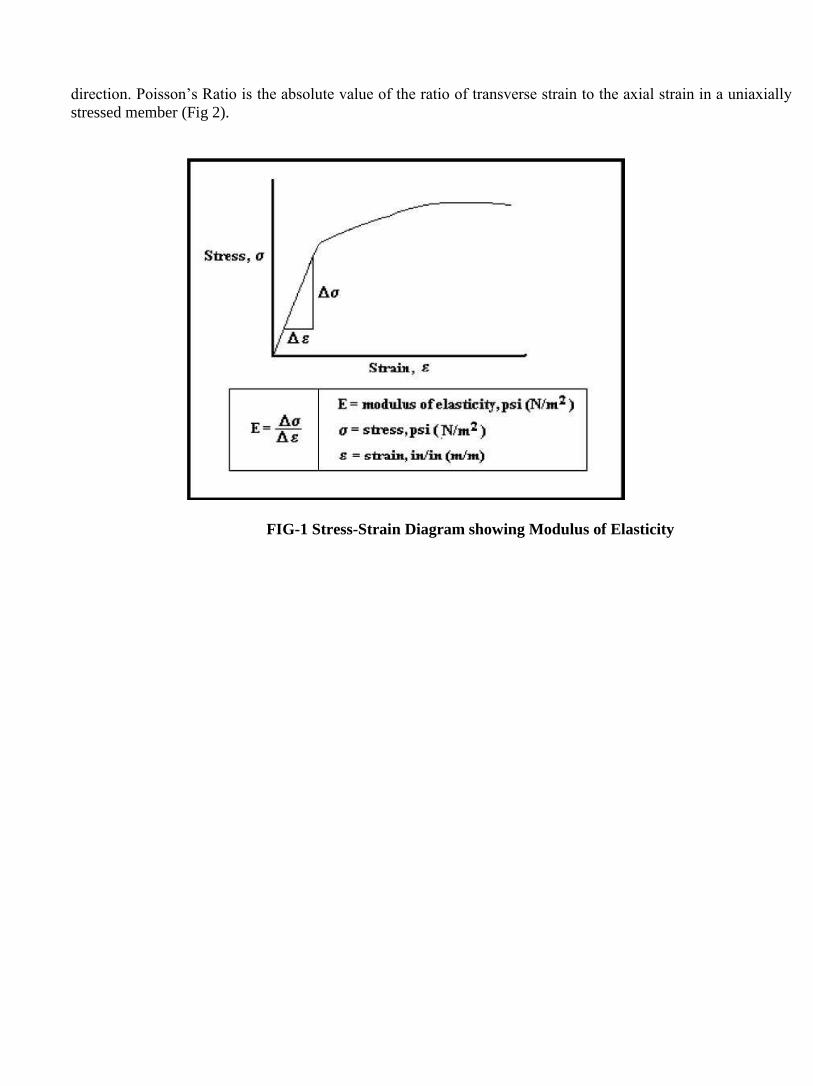
uniaxial everywhere on the beam surface except in the immediate vicinity of the load. The absolute value of the
ratio of the experimental values from the transversely oriented gauge to the values from the axially oriented
gauge will give an experimental Poisson’s Ratio.
Fig-4 Experimental Setup
Connections: 1. The connections between strain indicator and balance unit are as the above photo
2. Strain gage #1 (on top of the beam), single wire goes to RED terminal at CH#9, two ground wires go to the
WHITE & YELLOW terminals.
3. Strain gage #2 (on bottom of the beam), single wire goes to RED terminal at CH#10, two ground wires go to
the WHITE & YELLOW terminals.
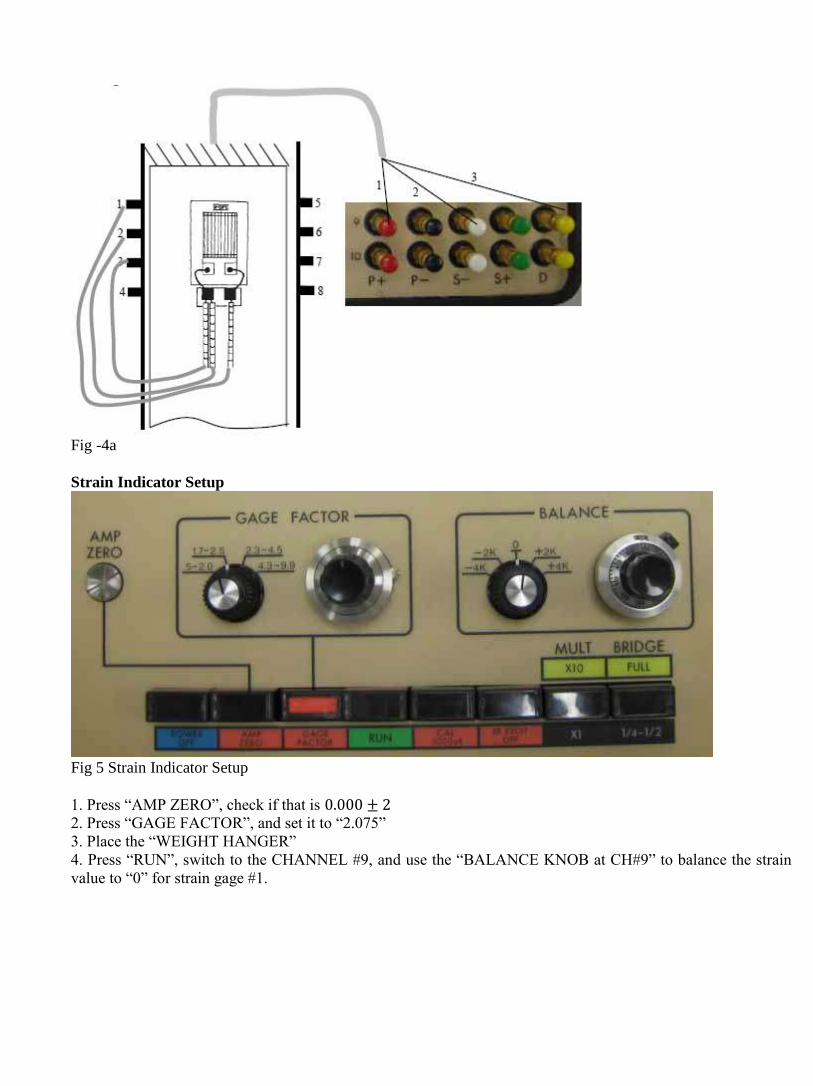
Fig -4a
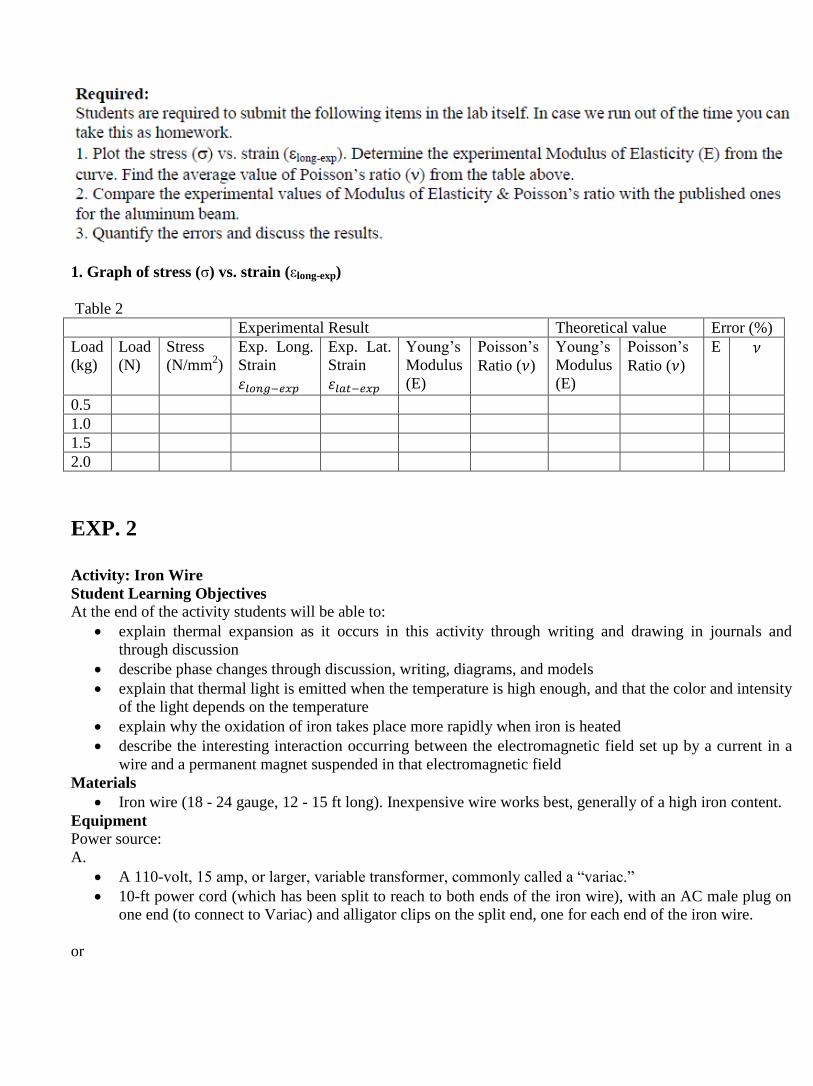
Strain Indicator Setup
Fig 5 Strain Indicator Setup
1. Press “AMP ZERO”, check if that is
2. Press “GAGE FACTOR”, and set it to “2.075”
3. Place the “WEIGHT HANGER”
4. Press “RUN”, switch to the CHANNEL #9, and use the “BALANCE KNOB at CH#9” to balance the strain
value to “0” for strain gage #1.

Fig 5a
5. Switch to the CHANNEL #10, and use the “BALANCE KNOB at CH#10” to balance the strain value to
“0” for strain gage #2.
6. Add weights and take down the strain reading. (NOTE that the reading is in ) 1
Data Sheet: 1. Material: Aluminum
2. Theoretical Modulus of Elasticity, E = 10*106 psi or 69 Gpa .
3. Theoretical Poisson’s Ratio,
4. Gauge factor of the gauge = 2.075
Observation Table:
Taking readings for four different loads. Increase the load in steps of 0.5 kg. Remember all the strain values are
in micro strain.
Table 1
Load
(kg)
Load
(N)
Stress
(N/mm2)
Experimental
Longitudinal
Strain
Experimental
Lateral Strain
Poisson’s
Ratio ( )
0.5
1.0
1.5
2.0
Calculations:
Bending Stress,
1. Graph of stress (σ) vs. strain (εlong-exp)
Table 2
Experimental Result Theoretical value Error (%)
Load
(kg)
Load
(N)
Stress
(N/mm2)
Exp. Long.
Strain
Exp. Lat.
Strain
Young’s
Modulus
(E)
Poisson’s
Ratio ( )
Young’s
Modulus
(E)
Poisson’s
Ratio ( )
E
0.5
1.0
1.5
2.0
EXP. 2
Activity: Iron Wire
Student Learning Objectives
At the end of the activity students will be able to:
explain thermal expansion as it occurs in this activity through writing and drawing in journals and
through discussion
describe phase changes through discussion, writing, diagrams, and models
explain that thermal light is emitted when the temperature is high enough, and that the color and intensity
of the light depends on the temperature
explain why the oxidation of iron takes place more rapidly when iron is heated
describe the interesting interaction occurring between the electromagnetic field set up by a current in a
wire and a permanent magnet suspended in that electromagnetic field
Materials
Iron wire (18 - 24 gauge, 12 - 15 ft long). Inexpensive wire works best, generally of a high iron content.
Equipment
Power source:
A.
A 110-volt, 15 amp, or larger, variable transformer, commonly called a “variac.”
10-ft power cord (which has been split to reach to both ends of the iron wire), with an AC male plug on
one end (to connect to Variac) and alligator clips on the split end, one for each end of the iron wire.
or
B.
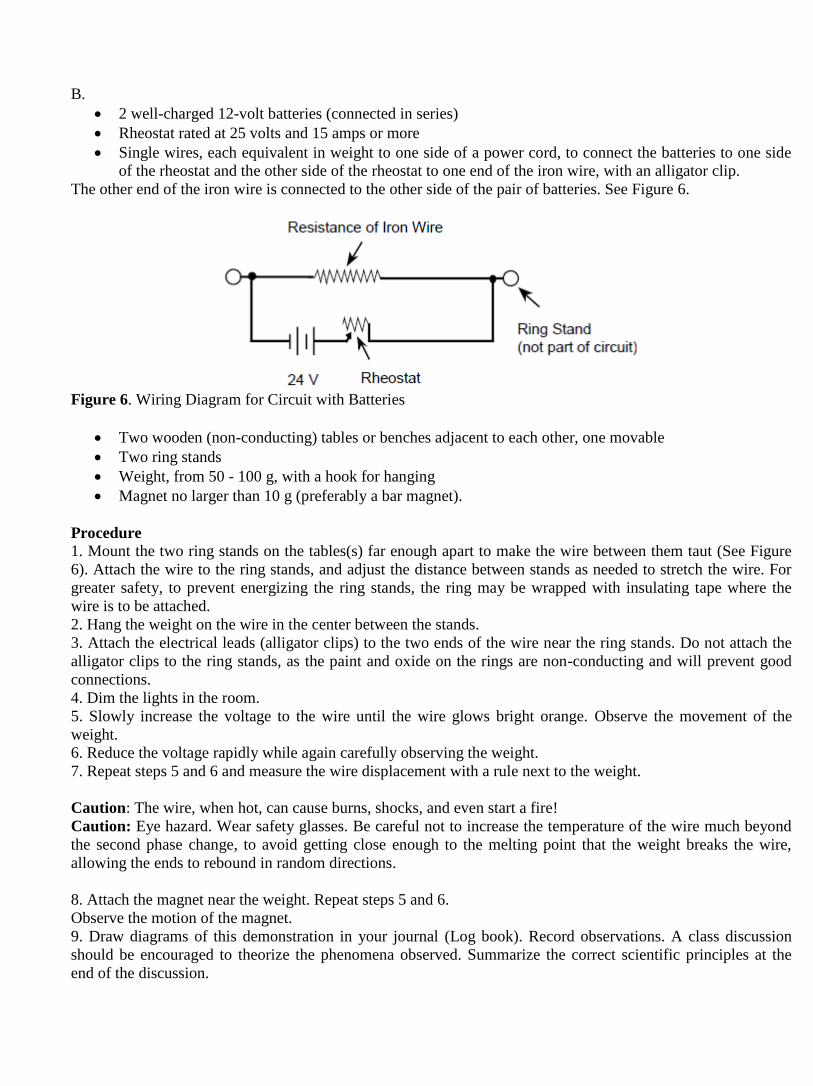
2 well-charged 12-volt batteries (connected in series)
Rheostat rated at 25 volts and 15 amps or more
Single wires, each equivalent in weight to one side of a power cord, to connect the batteries to one side
of the rheostat and the other side of the rheostat to one end of the iron wire, with an alligator clip.
The other end of the iron wire is connected to the other side of the pair of batteries. See Figure 6.
Figure 6. Wiring Diagram for Circuit with Batteries
Two wooden (non-conducting) tables or benches adjacent to each other, one movable
Two ring stands
Weight, from 50 - 100 g, with a hook for hanging
Magnet no larger than 10 g (preferably a bar magnet).
Procedure
1. Mount the two ring stands on the tables(s) far enough apart to make the wire between them taut (See Figure
6). Attach the wire to the ring stands, and adjust the distance between stands as needed to stretch the wire. For
greater safety, to prevent energizing the ring stands, the ring may be wrapped with insulating tape where the
wire is to be attached.
2. Hang the weight on the wire in the center between the stands.
3. Attach the electrical leads (alligator clips) to the two ends of the wire near the ring stands. Do not attach the
alligator clips to the ring stands, as the paint and oxide on the rings are non-conducting and will prevent good
connections.
4. Dim the lights in the room.
5. Slowly increase the voltage to the wire until the wire glows bright orange. Observe the movement of the
weight.
6. Reduce the voltage rapidly while again carefully observing the weight.
7. Repeat steps 5 and 6 and measure the wire displacement with a rule next to the weight.
Caution: The wire, when hot, can cause burns, shocks, and even start a fire!
Caution: Eye hazard. Wear safety glasses. Be careful not to increase the temperature of the wire much beyond
the second phase change, to avoid getting close enough to the melting point that the weight breaks the wire,
allowing the ends to rebound in random directions.
8. Attach the magnet near the weight. Repeat steps 5 and 6.
Observe the motion of the magnet.
9. Draw diagrams of this demonstration in your journal (Log book). Record observations. A class discussion
should be encouraged to theorize the phenomena observed. Summarize the correct scientific principles at the
end of the discussion.

EXP. 3
Activity: Light Bulb Filament
Student Learning Objectives
At the end of the activity students will be able to:
• label the parts of an incandescent light bulb on an appropriate drawing
• describe through writing and discussion the purpose of a light bulb’s envelope and filament
• explain through writing and discussion the changes in the properties of the tungsten filament when it is
exposed to air.
Materials
• Light bulbs, standard base, 110 volt
• Water
Equipment
• Hammer
• Towel
• No. 10 can
• Safety glasses
• Safety face shield
• Leather gloves
• Glass cutter or file
• Bunsen burner
• 110 volt socket with plug (see Figure 7)
Procedure
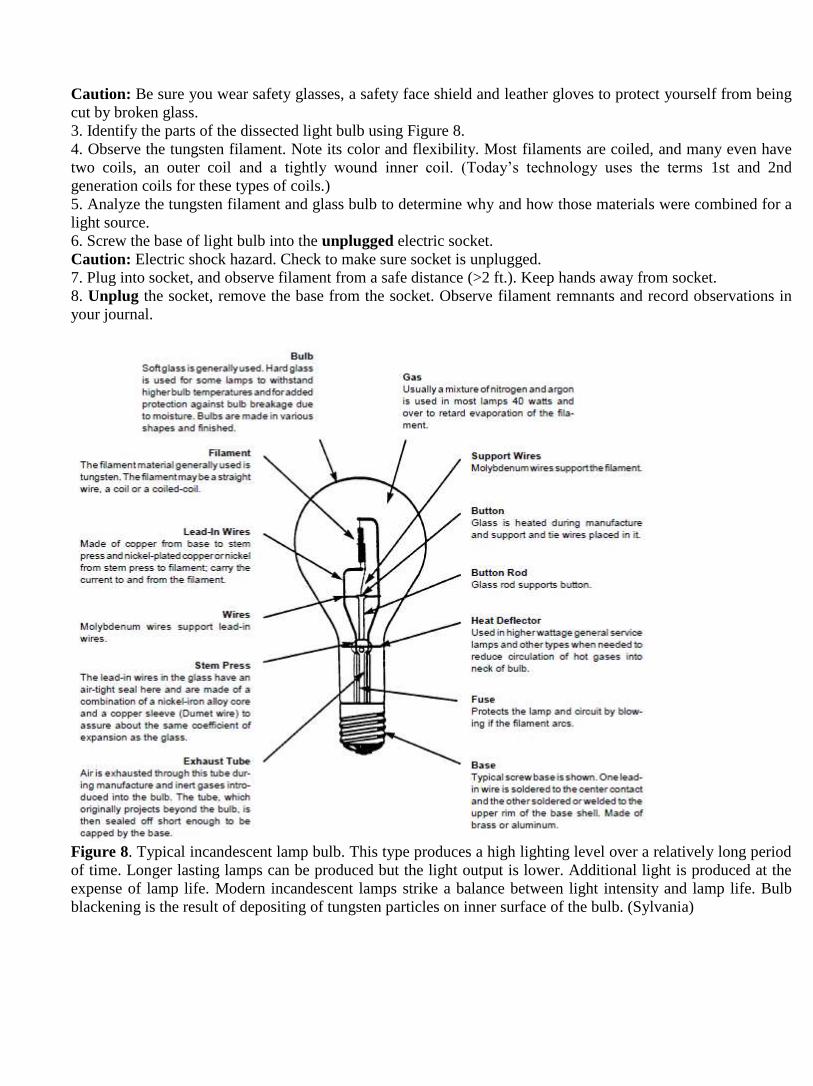
1. Study Figure 8, which is labeled with the correct terminology for a typical incandescent lamp.
2. Carefully remove the glass bulb (envelope) from the lamp using one of the following methods:
a. Wrap the bulb with a towel and hit it with a hammer lightly to break only the glass envelope.
or
b. Use a glass scriber to etch around the base of bulb. Tap etching to crack open the bulb.
or
c. Heat bulb in bunsen burner flame. When it is hot, plunge into
No. 10 can of water.
Figure 7. Typical Incandescent Lamp
Caution: Be sure you wear safety glasses, a safety face shield and leather gloves to protect yourself from being
cut by broken glass.
3. Identify the parts of the dissected light bulb using Figure 8.
4. Observe the tungsten filament. Note its color and flexibility. Most filaments are coiled, and many even have
two coils, an outer coil and a tightly wound inner coil. (Today’s technology uses the terms 1st and 2nd
generation coils for these types of coils.)
5. Analyze the tungsten filament and glass bulb to determine why and how those materials were combined for a
light source.
6. Screw the base of light bulb into the unplugged electric socket.
Caution: Electric shock hazard. Check to make sure socket is unplugged.
7. Plug into socket, and observe filament from a safe distance (>2 ft.). Keep hands away from socket.
8. Unplug the socket, remove the base from the socket. Observe filament remnants and record observations in
your journal.
Figure 8. Typical incandescent lamp bulb. This type produces a high lighting level over a relatively long period
of time. Longer lasting lamps can be produced but the light output is lower. Additional light is produced at the
expense of lamp life. Modern incandescent lamps strike a balance between light intensity and lamp life. Bulb
blackening is the result of depositing of tungsten particles on inner surface of the bulb. (Sylvania)
Related Documents