Vol.61 No. 3 09.2011 Landbauforschung vTI Agriculture and Forestry Research

Welcome message from author
This document is posted to help you gain knowledge. Please leave a comment to let me know what you think about it! Share it to your friends and learn new things together.
Transcript
5,22LBF_Vol. 61 3_U4 LBF_Vol. 61 3_U1
LandbauforschungvTI Agriculture andForestry Research
Vol.61 No. 3 09.2011
Preis /Price 8 €
ISSN 0458-6859
Vol.61 No. 3 09.2011
LandbauforschungvTI Agriculture andForestry Research
5,22LBF_Vol. 61 3_U2 LBF_Vol. 61 3_U3
Gutachtergremium Editorial Board
PD Dr. Martin Banse, Institut für Marktanalyse und Agrarhandelspolitik, vTIDr. Jürgen Bender, Institut für Biodiversität, vTIDr. Jutta Berk, Institut für Tierschutz und Tierhaltung, FLIProf. Dr. FranzJosef Bockisch, Institut für Anwendungstechnik, JKIDr. Herwart Böhm, Institut für Ökologischen Landbau, vTIProf. Dr. Andreas Bolte, Institut für Waldökologie und Waldinventuren, vTIDr. Ulrich Dämmgen, Institut für Agrarrelevante Klimaforschung, vTIPD Dr. Sven Dänicke, Institut für Tierernährung, FLIDr. habil. Bernd Degen, Institut für Forstgenetik, vTIPD Dr. Matthias Dieter, Institut für Ökonomie der Forst und Holzwirtschaft, vTIPD Dr. habil. Bettina EichlerLöbermann, Universität RostockDr. Peter Elsasser, Institut für Ökonomie der Forst und Holzwirtschaft, vTIProf. Dr. Andreas Fangmeier, Universität HohenheimPD Dr. Matthias Fladung, Institut für Forstgenetik, vTIProf. Dr. Heinz Flessa, Institut für Agrarrelevante Klimaforschung, vTIProf. Dr. Ulrike GrabskiKieron, Universität MünsterPD Dr. JörgMichael Greef, Institut für Pflanzenbau und Bodenkunde, JKIProf. Dr. Konrad Hagedorn, HumboldtUniversität BerlinPD Dr. Ingrid Halle, Institut für Tierernährung, FLIDr. Silvia Haneklaus, Institut für Pflanzenbau und Bodenkunde, JKIProf. Dr. Eberhard Hartung, Universität KielProf. Dr. Roland Herrmann, Universität GießenProf. Dr. habil. Pierre Ibisch, Hochschule für nachhaltige Entwicklung, HNEEDipl. Ing.Agr. Robert Kaufmann, Forschungsanstalt Agroscope ReckenholzTänikon ART, SchweizDr. Jörg Kleinschmit, Nordwestdeutsche Forstliche VersuchsanstaltProf. Dr. Luit de Kok, Universität Groningen, NiederlandeProf. Dr. Uwe LataczLohmann, Universität KielDr. Oliver von Ledebur, Institut für Marktanalyse und Agrarhandelspolitik, vTIProf. Dr. Bernd Linke, Institut für Agrartechnik Bornim e.V.Dipl. Met. FranzJosef Löpmeier, Agrarmeteorologische Forschung des Deutschen WetterdienstesProf. Dr. Udo Mantau, Universität HamburgProf. Dr. Axel Munack, Institut für Agrartechnologie und Biosystemtechnik, vTIDr. Hiltrud Nieberg, Institut für Betriebswirtschaft, vTIDr. Rainer Oppermann, Institut für Ökologischen Landbau, vTIProf. Dr. Herbert Oberbeck, TU BraunschweigDr. Jürgen Puls, Institut für Holztechnologie und Holzbiologie, vTIProf. Dr. Gerold Rahmann, Institut für Ökologischen Landbau, vTIProf. Dr. Detlef Rath, Institut für Nutztiergenetik, FLIDr. Thomas Schneider, Institut für Weltforstwirtschaft, vTIProf. Dr. Dr. Ewald Schnug, Institut für Pflanzenbau und Bodenkunde, JKIDr. Lars Schrader, Institut für Tierschutz und Tierhaltung, FLIProf. Dr. Andreas Susenbeth, Universität KielProf. Dr. Friedhelm Taube, Universität KielProf. Dr. KlausDieter Vorlop, Institut für Agrartechnologie und Biosystemtechnik, vTIProf. Dr. Dr. habil. Drs. h.c. Gerd Wegener, TU MünchenProf. Dr. HansJoachim Weigel, Institut für Biodiversität, vTIProf. Dr. Peter Weingarten, Institut für Ländliche Räume, vTIDr. Nicole Wellbrock, Institut für Waldökologie und Waldinventuren, vTI
Landbauforschung
Landbauforschung (vTI Agriculture and Forestry Research) ist ein wissenschaftliches Publikations organ des Johann Heinrich von ThünenInstituts (vTI), Bundesforschungsinstitut für Ländliche Räume, Wald und Fischerei. Die Zeitschrift wird vom vTI heraus gegeben und erscheint vierteljährlich. Die Sprache der Beiträge ist deutsch und englisch. Sonderhefte erscheinen nach Bedarf.
In der Zeitschrift werden Forschungsergebnisse aus der Ressortforschung des BMELV mit Bezug zur Land und Forstwirtschaft und den ländlichen Räumen veröffentlicht, einschließlich Forschungs ergebnissen aus Kooperationsprojekten, an denen das vTI beteiligt ist.
Die Landbauforschung ist eine multidisziplinär ausgerichtete Zeitschrift, die die verschiedenen Facetten der Agrar und Forstwissenschaften einschließt und besonderes Augenmerk auf deren interdisziplinäre Verknüpfung legt.
Englischsprachige Beiträge sind erwünscht, damit die Forschungsergebnisse einem möglichst breiten wissenschaftlichen Diskurs zugeführt werden können.
Für den Inhalt der Beiträge sind die Autoren ver antwortlich. Eine Haftungsübernahme durch die Redaktion erfolgt nicht.
Mit der Einsendung von Manuskripten geben die Verfasser ihre Einwilligung zur Veröffentlichung. Die von den Autoren zu beachtenden Richtlinien zur Einreichung der Beiträge sind unter www.vti.bund.de oder bei der Geschäftsführung erhältlich. Das exklusive Urheber und Verwertungsrecht für angenommene Manuskripte liegt beim vTI. Es darf kein Teil des Inhalts ohne schriftliche Genehmigung der Geschäftsführung in irgendeiner Form vervielfältigt oder verbreitet werden.
Indexiert in: CAB International, Science Citation Index Expanded, Current Contents Agriculture, Biology & Environmental Sciences
Herausgeber
Johann Heinrich von ThünenInstitut (vTI)
Gutachtergremium
Siehe 3. Umschlagseite
Schriftleitung
Prof. Dr. Folkhard Isermeyer
Geschäftsführung
Dr. Matthias Rütze Tel. 040 . 739 62 247 Leuschnerstraße 91 21031 Hamburg, Germany [email protected] www.vti.bund.de
ISSN 04586859
Alle Rechte vorbehalten.
vTI Agriculture and Forestry Research
Landbauforschung (vTI Agriculture and Forestry Research) is a scientific journal of the Johann Heinrich von Thünen Institute (vTI), Federal Research Institute for Rural Areas, Forestry and Fisheries. The journal is published quarterly by the vTI. The articles appear in either German or English. Special issues are published as required.
The journal publishes research results under the auspices of the German Ministry of Food, Agriculture and Consumer Protection (BMELV). Articles bear relevance to agriculture and forestry, as well as to rural areas, and include research results from cooperative projects involving the vTI.
vTI Agriculture and Forestry Research is a multidis ciplinary journal, encompassing the various facets of this field of research and placing a particular emphasis on interdisciplinary linkages.
English language contributions are desired so that the research results can achieve as broad a scientific discourse as possible.
The authors are responsible for the content of their papers. The publishers cannot assume responsibility for the accuracy of articles published.
With the submission of a manuscript, the author grants his or her permission for publication. Authors are requested to follow the guidelines for submission found at www.vti.bund.de or available from the management. The vTI retains exclusive copy and usage rights for accepted manuscripts. No portion of the content may be duplicated or distributed in any form without the written permission of the publisher.
Indexed in: CAB International, Science Citation Index Expanded, Current Contents Agriculture, Biology & Environmen
tal Sciences
Publisher Johann Heinrich von Thünen Institute (vTI)
Editorial Board Directors of vTIInstitutes
Editor in Chief Prof. Dr. Folkhard Isermeyer
Managing Editor Dr. Matthias Rütze Phone + 49 40 . 739 62 247 Leuschnerstraße 91 21031 Hamburg, Germany [email protected] www.vti.bund.de
ISSN 0458 – 6859
All rights reserved.
LandbauforschungvTI Agriculture and Forestry Research i
Vol. 61 No. 3 09.2011
StefanNeumeierundKimPollermann
Ländlicher Tourismus als Chance? Möglichkeiten und Grenzen der Förderung von ländlichem Tourismus am Beispiel eines Modellvorhabens Ruraltourismasachance?Opportunitiesandlimitationsforthepromotionofruraltourismusingtheexampleofa161 pilotproject
ReinerPlankl
Regionale Verteilung finanzieller Staatshilfen für den Agrarsektor – Sind die Nutznießer die ländlichen Räume?175 Regionaldistributionofstatefinancialaidsfortheagriculturalsector–Arethewinnerstherualareas?
GeroldRahmann
Biodiversity and Organic farming: What do we know?189 BiodiversitätundÖkologischerLandbau–Waswissenwir?
HansMartenPaulsen
Improving green-house gas balances of organic farms by the use of straight vegetable oil from mixed cropping as farm own fuel and its competition to food production VerbesserungderTreibhausgasbilanzenökologischerBetriebedurchdieNutzungvonPflanzenölausdemMischfrucht-209 anbaualshofeigenenBiokraftstoffunddieKonkurrenzzurNahrungsmittelproduktion
Hans-DieterHaenel,UlrichDämmgen,PetraLaubach,andClausRösemann
Update of the calculation of metabolizable energy requirements for pigs in the German agricultural emission inventory AktualisierungderBerechnungdesBedarfsanumsetzbarerEnergievonSchweinenimdeutschenlandwirtschaftlichen217 Emissionsinventar
Hans-DieterHaenel,UlrichDämmgen,andClausRösemann
Estimating numbers of piglets, weaners and fattening pigs for the German agricultural emission inventory229 AbleitungderTierzahlenvonSaugferkeln,AufzuchtferkelnundMastschweinenfürdasdeutscheEmissionsinventar
Anna-LenaGiesert,Wolf-TiloBalke,andGerhardJahns
Probabilistic analysis of coughs in pigs to diagnose respiratory infections237 ProbabilistischeAnalysevonHustengeräuschenzurDiagnosevonAtemwegserkrankungenbeiSchweinen
TorstenHinz,TatjanaWinter,FlorianZander,andStefanLinke
PM and ammonia in small group keeping – emissions and air quality in a German system for laying hens StaubundAmmoniakinderKleingruppenhaltung–EmissionenundLuftgütebeieinemdeutschenHaltungssystem243 fürLegehennen
FraukeGodlinski,Marc-OliverAust,GregTravis,XiyingHao,SörenThiele-Bruhn,TimA.McAllister,andPeterLeinweber
Phosphorus and trace metal distribution under confined cattle feeding operations in Southern Alberta249 VerteilungvonPhosphorundSchwermetalleninBödenunterhalbintensiverRinderhaltungimsüdlichenAlberta,Kanada
UlfPrüße,SebastianHeidinger,andChristineBaatz
Catalytic conversion of renewables: Kinetic and mechanistic aspects of the gold-catalyzed liquid-phase glucose oxidation KatalytischeKonversionnachwachsenderRohstoffe:KinetischeundmechanistischeAspektedergoldkatalytisierten261 GlucoseoxidationinderFlüssigphase

S. Neumeier, K. Pollermann / Landbauforschung - vTI Agriculture and Forestry Research 3 2011 (61)161-174 161
Ländlicher Tourismus als Chance? Möglichkeiten und Grenzen der Förderung von ländlichem Tourismus am Beispiel eines Modellvorhabens
StefanNeumeierundKimPollermann*1
*1 Johann Heinrich von Thünen-Institut (vTI), Bundesforschungsinstitut fürLändlicheRäume,WaldundFischerei, Institut fürLändlicheRäume,Bun-desallee50,38116Braunschweig,Email:[email protected]
Zusammenfassung
TourismusalsFaktorderRegionalentwicklungwirdim-merwiederalsOptionzurEntwicklungländlicherRäumegenannt. Ein 1993 initiiertes Modellvorhaben „Einkom-menssicherungdurchDorftourismus“desBundesministe-riumsfürErnährung,LandwirtschaftundForsten(BMELF)hattezumZiel,exemplarisch infünfperipherenostdeut-schenländlichenRegionentouristischeKonzeptezurländ-lichen Entwicklung zu fördern. Diewesentlichen Inhalteder Konzeptewaren dabei die Etablierung eines tragfä-higen ländlichen Tourismus, wobei die Modellregionenbewusst nicht über eine besondere touristische Eignungverfügten.Vor diesem Hintergrund widmet sich der Artikel der
Frage, in wieweit eine Förderung der ländlichen Regio-nalentwicklungdurch Tourismus in peripherenRegionenohneentsprechendetouristischeAlleinstellungsmerkmalemöglichistundwelcheLehrenausdemModellvorhabenfürdieAusgestaltungzukünftiger Förderungengezogenwerdenkönnen.AlsErgebniswirdaufgezeigt,dassderländlicheTouris-
musalsFaktorderländlichenEntwicklunginteressantePo-tenzialeindiesenRegionenbietet,sofernnichtnurökono-mischeAspektealsMesslattedienen.ZwarstelltensichdieökonomischenWirkungenimSinneeiner„Einkommens-sicherung“alssehrgeringheraus,demgegenüberwarenjedochpositiveWirkungenimBereichFreizeitinfrastruktur/Naherholung, eine verbesserte raumbezogene IdentitätsowiedieAktivierunglokalerAkteurefestzustellen.So kann die Beschäftigung mit ländlichem Tourismus
auchinRegionen,diesicheigentlichnichtbesondersfüreine touristische Inwertsetzung eignen (z. B. aufgrundschlechter Erreichbarkeit, fehlender Alleinstellungsmerk-male),ImpulsezurländlichenEntwicklunggeben.
Schlüsselwörter: Tourismus, Regionalentwicklung, länd-lich, Förderprogramm, Modellprojekt
Abstract
Rural tourism as a chance? Opportunities and limita-tions for the promotion of rural tourism using the example of a pilot project
Tourism as means of regional development is consis-tentlycitedasoneoptionfordevelopingruralregions.Inthisspirit,theGermanMinistryforFood,AgricultureandForestryinitiatedthemodelproject“incomemaintenancethrough village tourism” in 1993. Themain aim of themodelprojectwastofostersustainableconceptsofruraldevelopmenttakingfiveeasternGermanruralregionsasanexample.Thecruxoftheprojectwastoestablishstablerural tourism in rural regionswithout unique tourist at-tractions.Againstthisbackgroundthearticleaddressestheques-
tionoftheextenttowhichregionaldevelopmentcanbebroughtforwardbytourisminregionswithoutanyuniquetourist sellingpropositionsandwhatcanbe learnt fromthemodelprojectfortheshapingofsimilarsupportactivi-tiesinthefuture.As result it is shown that the successof rural tourism
shouldnotbeconsideredfromapurelyeconomicperspec-tiveand reveals that tourism,as factorof ruraldevelop-ment,hasthepotentialtotriggerotherimportantdevel-opment impulses.Thoughtheeconomic impact– inthesenseof„incomemaintenance“--wasverysmall,positiveimpacts like leisure infrastructure/local recreation, place-related identity and the activation of local actors couldbeidentified.Thus,sothereasoning,tourismhasthepo-tential tobeusedasafactorofruraldevelopmentevenin regionsactuallynotvery suitable for tourismsuchas,forexample,poorlyaccessibleperipheralregionswithnouniquesellingpropositions.
Keywords: tourism, regional development, rural, funding sheme, pilot project
162
1 Einleitung und Problemhintergrund
Um die Regionalentwicklung in strukturschwachenRegionenzu fördern,wirdoftmalseine touristischeEnt-wicklungalsLösungsansatzpostuliert(vgl.Mundt,2001;McAreaveyundMcDonagh,2010),wassichbeispielswei-seauchandemhohenStellenwertdesTourismusindenländlichenEntwicklungsprogrammenzeigt(z.B.dasEPLRM-V (Ministerium für Landwirtschaft Umwelt und Ver-braucherschutz des Landes Mecklenburg-Vorpommern,2009)).DerGrunddafür ist,dasshiernochamehestenPotenzialevermutetwerden,umArbeitsplätzezuschaffenundEinkommeninderRegionzuerwirtschaften.Außer-demwirddavonausgegangen,dassderTourismuspositivewirtschaftlicheImpulseindenihmvor-undnachgelager-ten Branchen auslöst (vgl. Benthien, 1995; Cawley undGillmor,2008;Deller,2009).UmdieNutzungdiesbezüglicherChancenfürperiphere
RegioneninOstdeutschlandzuunterstützen,initiiertedasBundesministerium für Ernährung, Landwirtschaft undForsten (BMELF) 1993 dasModellprojekt „Einkommens-sicherungdurchDorftourismus“1.GrundsätzlicherAnsatzdesModellvorhabenswar,amBeispieldesDorftourismus2nachhaltige,tragfähigeKonzeptezurländlichenEntwick-lung in Problemregionen auszuarbeiten. Die Umsetzungsollte inEigeninitiativeunterAkquirierungdesbestehen-denFörderangebotsderLändererfolgen,wobeieineex-terne Beratung finanziert, jedoch keine eigenen Förder-gelderbereitgestelltwurden.DieAuswirkungendesModellvorhabenswurdeninzwei
Phasen(1995bis1998und2005bis2009)amInstitutfürLändlicheRäume3des JohannHeinrichvonThünen-Insti-tuts inBraunschweigerforscht.Dazuerfolgteeineerste,zum Teil parallele Begleitforschung (vgl. Fink und Plankl1998)sowieeinezweite,aufdielangfristigenWirkungendesModellvorhabensfokussierteNachuntersuchung(vgl.Neumeieretal.,2011).ImvorliegendenArtikelwirdderAspekt„Förderungvon
Tourismusals FaktorderEntwicklung ländlicherRäume“diskutiert.DasHauptaugenmerkliegtdabeiaufderFrage,inwieweiteineFörderungderRegionalentwicklungdurchländlichen Tourismus überhauptmöglich ist undwelche
1 DieFinanzierungerfolgtegemeinsammitdemWirtschaftsministeriumdesBundessowiedenWirtschafs-undLandwirtschaftsministerienderbeteilig-tenBundesländer.
2 ZielwaresindenModellregioneneinen„sanften“,andiejeweiligenGege-ZielwaresindenModellregioneneinen„sanften“,andiejeweiligenGege-benheitenderRegionenangepasstenländlichenTourismusals„UrlaubaufdemLande“alsPendantzudemModell„UrlaubaufdemBauernhof“zuetablieren.DerBegriff„Dorftourismus“wurdeimModellvorhabensynonymfür diesen „Urlaub auf dem Lande“ verwendet.Weder „Urlaub auf demLande“noch„Dorftourismus“wurdenimModellvorhabenselbstoderderBegleitforschung1995bis1998exaktdefiniert.
3 bzw.dessenVorgängerinstitution
LehrenausdemModellprojekt füreineoptimaleAusge-staltungzukünftigerProjektemitähnlicher Intentionge-zogenwerdenkönnen.Dazuwerdennacheinereinleiten-den theoretischen Betrachtung des ländlichen TourismusalsFaktorderRegionalentwicklung(Kapitel2)dasModell-vorhaben(Kapitel3)unddasmethodischenVorgehenderNachuntersuchung(Kapitel4)charakterisiert.ImAnschlussdaran werden ausgewählte empirische Ergebnisse zurtouristischen Entwicklung in den Modellregionen vorge-stellt(Kapitel5)unddaraufaufbauendMöglichkeitenundGrenzenderFörderungperiphererRegionenohnebeson-deretouristischeAlleinstellungsmerkmaledurchländlichenTourismusdiskutiert(Kapitel6).NachHinweisen,wieunterBerücksichtigungder Literatur zu Planungsprozessen,dievorhandenenChancenamehestengenutztwerdenkön-nen(Kapitel7),werdenSchlussfolgerungenzurAusgestal-tungexternerFörderungengezogen(Kapitel8).
2 Ländlicher Tourismus als Faktor der Regionalent-wicklung
2.1 Was ist ländlicher Tourismus?
UmsichmitdemländlichenTourismusunddessenBei-tragzurRegionalentwicklungbefassenzukönnen, isteszunächstnotwendigzuklären,wasüberhauptunterdemBegriff„ländlicherTourismus“zuverstehenist.Dies istkeinganz leichtesUnterfangen,dabereitsdie
Definition des Tourismusbegriffs recht problematisch istundverschiedeneSichtweisendazuexistieren (vgl. John-stonet.al.,2000).ImRahmendesArtikelswirdTourismusinAnlehnungandieDefinitionderOECDverstandenalsalleAktivitätenvonPersonen,diesichfürlängereZeitanOrteaußerhalb ihresArbeits-,Wohn-oderVersorgungs-standortsbegebenundsichdortnichtlängeralseinJahrzuFreizeit-,Geschäfts-undanderenZweckenaufhalten,wobeiderHauptreisezweckeinanderer istalsdieAusü-bungeinerTätigkeit,dievombesuchtenOrtausvergütetwird(vgl.OECD,2002;Leseretal.,1993).InengerAusle-gungzählenBerufs-undEinkaufsreiseverkehrebensowieNaherholung mit nicht mindestens einer ÜbernachtungsomitnichtzumTourismusimeigentlichenSinn(vgl.Leseretal.,1993).Ebenfallsschwerabzugrenzenist,wasunter„ländlichen
Tourismus“ zu verstehen ist, da dieser ebenso wie dieländlichenRäume,indenenerstattfindet,sehrfacetten-reichist(Lane,1994:9f).AmeinenEndedesSpektrumsvon Definitionsmöglichkeiten werden unter „ländlichemTourismus“alletouristischenAktivitätenverstanden,dieinländlichenRäumenstattfinden.AmanderenEndeerfolgteineEingrenzungaufsehrspezifischeFormenbzw.Aus-prägungenwie z.B.„UrlaubaufdemBauernhof“oder„Naturtourismus“ (vgl. Oppermann, 1996). Dabei weist
S. Neumeier, K. Pollermann / Landbauforschung - vTI Agriculture and Forestry Research 3 2011 (61)161-174 163
Lane (1994) darauf hin, dass es aber zu einfach wäre,ländlichenTourismuslediglichalsTourismusinländlichenRäumenzu verstehen (Lane,1994)underdeshalbähn-lichwiedieländlichenRäume,indenenerstattfindet,alsKontinuumzukonzeptionalisierenist(Lane,1994).InderNähezuVerdichtungsräumenweistder ländlicheTouris-mus z. B. urbane Charakteristika auf, basiert z. T. auchaufNaherholungund kannhoheGästeankünfte (Tages-undÜbernachtungstourismus)verzeichnen.InperipherenRegionen hingegen überwiegen andere, eher ländlichgeprägtetouristischeSchwerpunkteunddieGästezahlensindi.d.R.deutlichgeringer,fallsdieRegionenkeineau-ßergewöhnlichen touristischen Alleinstellungsmerkmaleaufweisen(vgl.Lane,1994;SharpleyundRoberts,2004).DieseFeststellungenzumTourismusinsolchenperipherenRegionen sind auch für den angestrebten „Dorftouris-mus“indenModellregionenzutreffend.DaLanes(1994)VerständnisvonländlichemTourismus
denverschiedenenAusprägungentouristischerAktivitätenin ländlichenRäumenunsererAnsichtnachbesserRech-nung trägt als engereDefinitionen, liegt den folgendenAusführungen Lanes (1994) Konzeptionalisierung des„ländlichenTourismus“zugrunde.
2.2 Wie kann Tourismus zur Regionalentwicklung bei-tragen?
TourismusgiltalseinerderdynamischstenWirtschafts-zweigeüberhaupt(Garbe,2003;Mundt,2001).DerAuf-schwung,dendieserindenletztenJahrzehntenerfahrenhat,setztsichglobalgeseheninnurwenigabgeschwäch-ter Form auch weiterhin fort. Tourismusexperten gehenauchdavonaus,dassderTourismuseingroßesPotenzialbesitzt,einenBeitragzur regionalenWirtschaftsentwick-lungleistenzukönnen(vgl.Jobetal.,2004,Wilsonetal.,2001, Jensen-Butler et al., 2007). Wie UntersuchungenzumTourismusalsFaktorderRegionalentwicklunggezeigthaben,kannTourismusinperipherenRegionenprinzipielldieFunktioneinesWachstumspols4übernehmen,voraus-gesetzt diese Regionen eignen sich für eine touristischeInwertsetzung(vgl.Neumeier,2002;Scherer,2005).
4 So kannGeld, das von den Touristen innerhalb einer Region ausgege-So kannGeld, das von den Touristen innerhalb einer Region ausgege-benwird,indemTourismusvor-undnachgelagerteWirtschaftsbereichefließenunddas regionaleökonomischeWachstumaktivieren– voraus-gesetztdieBetreibertouristischerEinrichtungenbeziehendievonihnenbenötigtenWaren undDienstleistungen auf den lokalenMärkten (vgl.Lübben,1995).DastheoretischeKonzept,dashinterderwirtschaftlichenBedeutungdesTourismusfürdieRegionalentwicklungalsWachstumspolsteht, basiert also auf demGrundgedanken der Import-Export-Theorie(vgl.SummersundField,2000,S.21).
Um eine periphere Region, die entsprechende touri-stischePotenzialebesitzt,Erfolgversprechendzuerschlie-ßen, ist es notwendig, ein attraktives, zeitgemäßes und
konkurrenzfähiges regionsspezifisches Tourismusprofilzuentwickeln.5
5 DasTourismusprofilsollteausderRegionselbstherausentwickeltwerden,damitesbeiEinheimischenundTouristengleichermaßenAkzeptanzfindet(vgl.Benthien,1995).WeiterePunkte,dieeszuberücksichtigengilt,findensichz.B.beiFinkundPlankl(1998).
EinewesentlicheVoraussetzung füreinelangfristig erfolgreiche Tourismusentwicklung in länd-lichenRäumen isteineattraktiveund intakteLandschaft(vgl. Scherer, 2005; Schemel et al., 2001). Neben dennatur- und kulturlandschaftlichen Gegebenheiten einerRegion sind für einen erfolgreichen Tourismus dieMen-ge sowie die Qualität der verschiedenen Angebote desFremdenverkehrsgewerbes,dervorhandenenInfrastrukturunddieDienstleistungsbereitschaftderBevölkerungaus-schlaggebend(vgl.Bernard,2001;Hauglandetal.,2011).Dabei ist auch zu beachten, dass potenzielle Gäste vondenLeistungsträgerneingewissesNiveauanAngebotsdif-ferenzierung und -diversifizierung erwarten. Das bedeu-tet,RegionenbraucheneinentsprechendgroßesMindest-angebotantouristischerInfrastrukturundAttraktivitäten,damit der Tourismus tatsächlich einenBeitrag zur regio-nalenEntwicklungleistenkann.OhnediesesMindestan-gebotkönneni.d.R.keinenennenswertenWachstums-impulsefürdieRegionvomTourismusausgehen(Scherer,2005).DasbedeutetinKonsequenzaberauch,dassesnurdannSinnmacht,aufdenTourismusalsFaktorderRegionalent-wicklungzusetzen,fallseineRegionauchentsprechendattraktiveVoraussetzungensowieeineentsprechendetou-ristischeInfra-undSuprastrukturbzw.dasPotenzial,diesezu entwickeln, besitzt, die sich touristisch „vermarkten“lassen.Heimatmuseen,Gemeindecenter,Naturlehrpfade,Backhäuser,Outdoor-SchachundKräuterspiralen,umnureinigeBeispielezunennen,diegeradeinperipherenländ-lichen Regionen im Rahmen der ländlichen Entwicklungim Hinblick auf eine touristische Inwertsetzung immerwiederangedachtwerden,gehörenabereherzur(intra-regionalen) Naherholungsinfrastruktur. Von einem reinökonomischenBlickwinkelausbesitzendiesenichtdasPo-tenzial,alsregionaletouristischeAlleinstellungsmerkmalebzw.überdieRegionhinausgehende„Aushängeschilder“zu fungieren und in einem signifikanten AusmaßGästevonaußerhalbindieRegionzubringen(vgl.Neumeieretal.,2011).Generell hat auch die Ausrichtung des Tourismus Ein-
flussaufdieEntwicklungschancen,insbesonderemussdieAusrichtung zu den angesprochenen touristischen Ziel-gruppenpassen.ImHinblickaufdenTourismusalsFaktorderRegional-
entwicklungfürländlicheRäumeweisenBenthien(1995)undMundt (2001)außerdemeinschränkenddaraufhin,dass vordemHintergrunddeszubeobachtendensozio-
164
ökonomischen Strukturwandels in ländlichen RäumenTourismusinderPraxiszwarlokalundindividuelldazubei-tragen kann, Einkommensalternativen zu eröffnen, abernicht entsprechend flächendeckend und von derartigermakroökonomischerBedeutung,dasserdenproduktivenSektorersetzenoderseinenRückgangkompensierenkann(vgl.Benthien,1995;Mundt,2001).SoerklärtTerluinzurwirtschaftlichenEntwicklung im ländlichenRaum (2003,S.338):“Thepatternofemploymentgrowthshowsthattourism,whichisoftenoneofthemainpillarsinruralde-velopmentprogrammes,isnottheonlypotentialsourceofruralemploymentgrowth,butoneamongstmanyotherbranches”. Zur Rolle des Tourismus als HoffnungsträgerverwiesenMcAreavey undMcDonagh (2010, S. 13) da-rauf,dassesparadoxsei“toreplaceonevulnerableactivi-ty(agriculture)withanother(tourism)”.EinegenerelleFrageist,wer inderRegion(Pikeetal.,
2007) vom Tourismus profitiert. So kann die Gründungeines touristischen Betriebes ein ausreichend hohes Zu-satzeinkommen bedeuten und sich auch gut in die Le-bensplanung der Familien dieses Tourismusbetriebeseinpassen.DiesistaberkeineOptionfürökonomischbe-sondersschlechtgestellteAkteure,dadiese inderRegelkeinenZugangzuKapitalfürdieGründungeinessolchenBetriebeshaben (IorioundCorsale,2010).Allgemein istauchdieoftmalsgeringeQualitättouristischerArbeitsplät-zezuberücksichtigen(z.B.schlechteBezahlung,Saisonar-beit(vgl.Deller,2010)).Diese Erkenntnisse relativieren die Möglichkeiten des
Tourismusals FaktorderRegionalentwicklungbesondersimHinblickaufperiphereländlicheRäumeohneentspre-chend inwertsetzbare touristische Alleinstellungsmerk-maledeutlich(unddieseRelativierungistauchfürdieMo-dellregionenvollzutreffend).Zudem beeinflusst der Tourismus auch soziale, kultu-
relle und ökologische Aspekte, wobei jeweils positiveaberauchnegativeWirkungenmöglichsind(Pollermann,2004;CawleyundGillmor,2008;McAreaveyundMcDo-nagh,2010).Esistaberauchdaranzuerinnern,dassfürdieökonomischeEntwicklungeinerRegionnichtnurpri-märökonomischeFaktorenrelevantsind.Sospielendies-bezüglich auch soziale Beziehungen und Netzwerke einwichtige Rolle (Agarwal et al., 2009). Somit ist für eineBewertungderPotenzialedesTourismusauchzubetrach-tenwietouristischeAktivitätenundPlanungenaufdiere-gionaleVernetzungunddieKooperationsbereitschaftvonunterschiedlichenAkteursgruppenwirken(auchalsFormvon „DestinationGovernance“ im Sinne eines koopera-tivenNetzwerkeszurEntwicklungeinertouristischenDe-stination,vgl.Pollermann,2011).HiersindauchWechsel-wirkungenzwischenKooperationenundraumbezogenenIdentitätenzubeachten:“cooperationfacilatesthecreati-onandmaintenanceofnetworksandpublic/privatepart-
nershipsandmayresultinlocalsynergy[…]Inaddition,acultural-territorialidentitymayalsoserveasamaincatalystin raising localconsciousness towardscooperation” (Ter-luin,2003,S.342).
3 Charakterisierung des Modellprojektes und Ein-ordnung in die Förderpolitik
ZieldesModellprojekteswaresaufzuzeigen,wieindenneuen Bundesländern über die Entwicklung eines Dorf-tourismus„zusätzlicheEinkommensquellenfürdieLand-wirtschaft und die ländliche Bevölkerung in peripherenländlichenGebietenderneuenBundesländererschlossenwerdenkönnen,umaufdieseWeiseeinenBeitragzurSta-bilisierungländlicherRäumeindenneuenBundesländernzuleisten“(FinkundPlankl,1998,S.3ff).Des Weiteren sollten die Motivation der Bevölkerung
vor Ort zum eigenverantwortlichen Engagement undihre Befähigung zum Aufbau und Erhalt langfristig sta-bilerExistenzengefördertwerden.AngestrebtesErgebniswaren Angebote zu „Urlaub auf dem Lande“ mit ent-sprechenden Freizeitangeboten im Sinne eines „sanftenTourismus“ (vgl. Schilling, 1997). Die Entwicklung desTourismussolltedurcheinesinnvolleVerknüpfungvonbe-stehendenFördermöglichkeitendieZusammenarbeitregi-onaler kommunaler und privater DienstleistungsanbieterunterstütztwerdensowiedieAktivierungundKoordinie-rungvonMaßnahmenbestehenderInstitutionenzurFör-derungdesLandtourismuserreichen(vgl.FinkundPlankl,1998,S.3ff).Da es einAnliegendes Projekteswar, dass dessen Er-
kenntnisse einen möglichst hohen Allgemeingültigkeits-charakterhaben,solltenMöglichkeitenundGrenzenderEntwicklung des ländlichen Tourismus in „Allerweltsdör-fern“aufgezeigtwerden(vgl.FinkundPlankl,1998).BeiderAuswahlderModellregionenwurdedaherdaraufge-achtet,Gemeindenmitunterschiedlicher,abernichtbeson-ders herausragender touristischer Eignung auszuwählen,dienichtübereinenbereitsstärkerentwickeltenTourismusverfügten(vgl.Schilling,1997).Dadurchsolltegewährlei-stetwerden,dassderAusbaudesTourismusohneBeein-flussungdurchbereitsvorliegendeErfahrungenundStruk-turenerfolgenkann(vgl.FinkundPlankl,1998).FürjedesderneuenBundesländerwurdeeinefürdasBundeslandtypischeRegion indasModellvorhabeneinbezogen (vgl.FinkundPlankl,1998).TypischistdabeiindemSinnezuverstehen,dasseineProjektregionausgewähltwurde,diekeinebesonderenAlleinstellungsmerkmale innerhalbdesBundeslandesaufweistundvonderStrukturbeispielhaftfür einen Großteil der Gemeinden, Ämter oder Verwal-tungsgemeinschafteninnerhalbdesBundeslandesist.AlsModellregionenwurdenrelativkleineGebieteabgegrenzt.SomitbeziehtsichdasModellprojekteheraufdie lokale
S. Neumeier, K. Pollermann / Landbauforschung - vTI Agriculture and Forestry Research 3 2011 (61)161-174 165
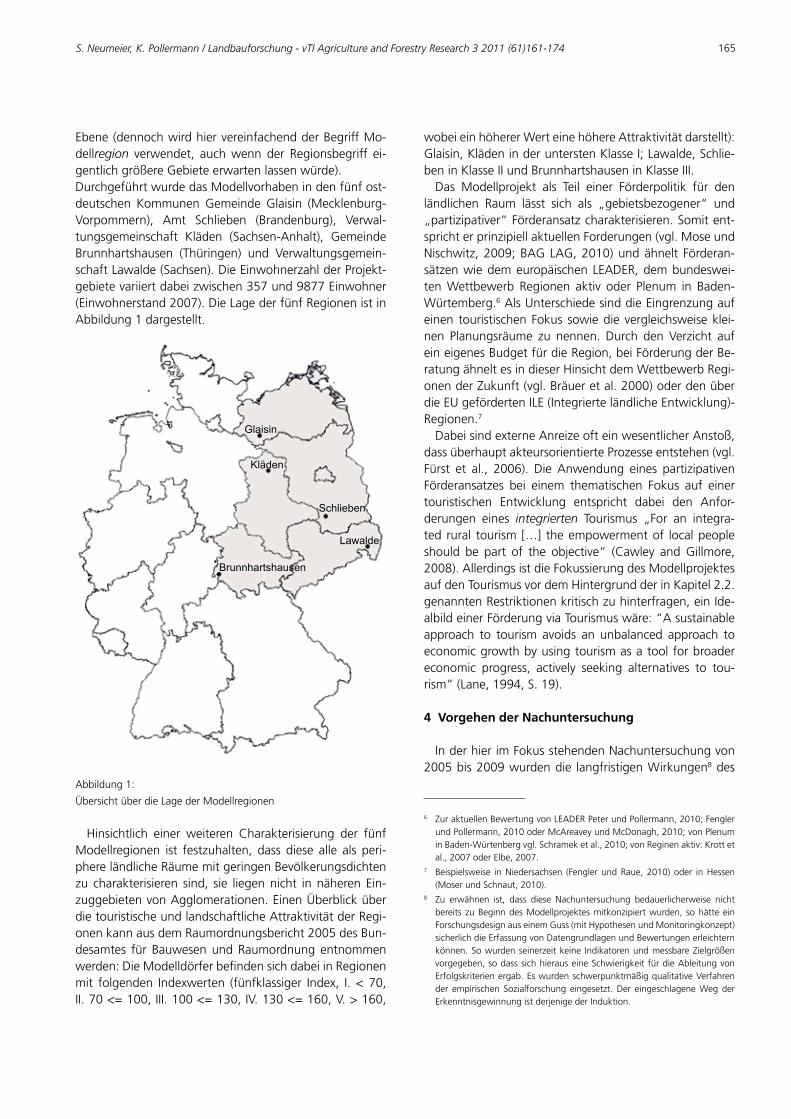
Ebene(dennochwirdhiervereinfachendderBegriffMo-dellregion verwendet, auchwenn der Regionsbegriff ei-gentlichgrößereGebieteerwartenlassenwürde).DurchgeführtwurdedasModellvorhabenindenfünfost-deutschen KommunenGemeindeGlaisin (Mecklenburg-Vorpommern), Amt Schlieben (Brandenburg), Verwal-tungsgemeinschaft Kläden (Sachsen-Anhalt), GemeindeBrunnhartshausen (Thüringen) und Verwaltungsgemein-schaftLawalde(Sachsen).DieEinwohnerzahlderProjekt-gebietevariiertdabeizwischen357und9877Einwohner(Einwohnerstand2007).DieLagederfünfRegionenistinAbbildung1dargestellt.
Glaisin
Kläden
Schlieben
Lawalde
Brunnhartshausen
Abbildung1:
ÜbersichtüberdieLagederModellregionen
Hinsichtlich einer weiteren Charakterisierung der fünfModellregionen ist festzuhalten, dass diese alle als peri-phereländlicheRäumemitgeringenBevölkerungsdichtenzu charakterisieren sind, sie liegennicht innäherenEin-zuggebietenvonAgglomerationen.EinenÜberblicküberdietouristischeundlandschaftlicheAttraktivitätderRegi-onenkannausdemRaumordnungsbericht2005desBun-desamtes für BauwesenundRaumordnungentnommenwerden:DieModelldörferbefindensichdabeiinRegionenmit folgenden Indexwerten (fünfklassiger Index, I. <70,II.70<=100,III.100<=130,IV.130<=160,V.>160,
wobeieinhöhererWerteinehöhereAttraktivitätdarstellt):Glaisin,KlädeninderunterstenKlasseI;Lawalde,Schlie-beninKlasseIIundBrunnhartshauseninKlasseIII.Das Modellprojekt als Teil einer Förderpolitik für den
ländlichen Raum lässt sich als „gebietsbezogener“ und„partizipativer“Förderansatzcharakterisieren.Somitent-sprichterprinzipiellaktuellenForderungen(vgl.MoseundNischwitz,2009;BAGLAG,2010)undähnelt Förderan-sätzenwiedemeuropäischenLEADER,dembundeswei-tenWettbewerb Regionen aktiv oder Plenum in Baden-Würtemberg.6
6 ZuraktuellenBewertungvonLEADERPeterundPollermann,2010;FenglerundPollermann,2010oderMcAreaveyundMcDonagh,2010;vonPlenuminBaden-Würtenbergvgl.Schrameketal.,2010;vonReginenaktiv:Krottetal.,2007oderElbe,2007.
AlsUnterschiedesinddieEingrenzungaufeinen touristischenFokus sowiedie vergleichsweiseklei-nen Planungsräume zu nennen. Durch den Verzicht aufeineigenesBudgetfürdieRegion,beiFörderungderBe-ratungähneltesindieserHinsichtdemWettbewerbRegi-onenderZukunft(vgl.Bräueretal.2000)oderdenüberdieEUgefördertenILE(IntegrierteländlicheEntwicklung)-Regionen.7
7 Beispielsweise inNiedersachsen (FenglerundRaue,2010)oder inHessen(MoserundSchnaut,2010).
DabeisindexterneAnreizeofteinwesentlicherAnstoß,dassüberhauptakteursorientierteProzesseentstehen(vgl.Fürst et al., 2006). Die Anwendung eines partizipativenFörderansatzes bei einem thematischen Fokus auf einertouristischen Entwicklung entspricht dabei den Anfor-derungen eines integrierten Tourismus „For an integra-ted rural tourism […] theempowermentof localpeopleshould be part of the objective“ (Cawley andGillmore,2008).AllerdingsistdieFokussierungdesModellprojektesaufdenTourismusvordemHintergrundderinKapitel2.2.genanntenRestriktionenkritischzuhinterfragen,einIde-albildeinerFörderungviaTourismuswäre:“Asustainableapproach to tourism avoids an unbalanced approach toeconomicgrowthbyusingtourismasatoolforbroadereconomic progress, actively seeking alternatives to tou-rism”(Lane,1994,S.19).
4 Vorgehen der Nachuntersuchung
InderhierimFokusstehendenNachuntersuchungvon2005bis2009wurdendie langfristigenWirkungen8
8 Zu erwähnen ist, dass diese Nachuntersuchung bedauerlicherweise nichtbereits zuBeginndesModellprojektesmitkonzipiertwurden, sohätteeinForschungsdesignauseinemGuss(mitHypothesenundMonitoringkonzept)sicherlichdieErfassungvonDatengrundlagenundBewertungenerleichternkönnen.Sowurdenseinerzeitkeine IndikatorenundmessbareZielgrößenvorgegeben,sodasssichhierauseineSchwierigkeitfürdieAbleitungvonErfolgskriterienergab.EswurdenschwerpunktmäßigqualitativeVerfahrender empirischen Sozialforschung eingesetzt.Der eingeschlageneWegderErkenntnisgewinnungistderjenigederInduktion.
des
166
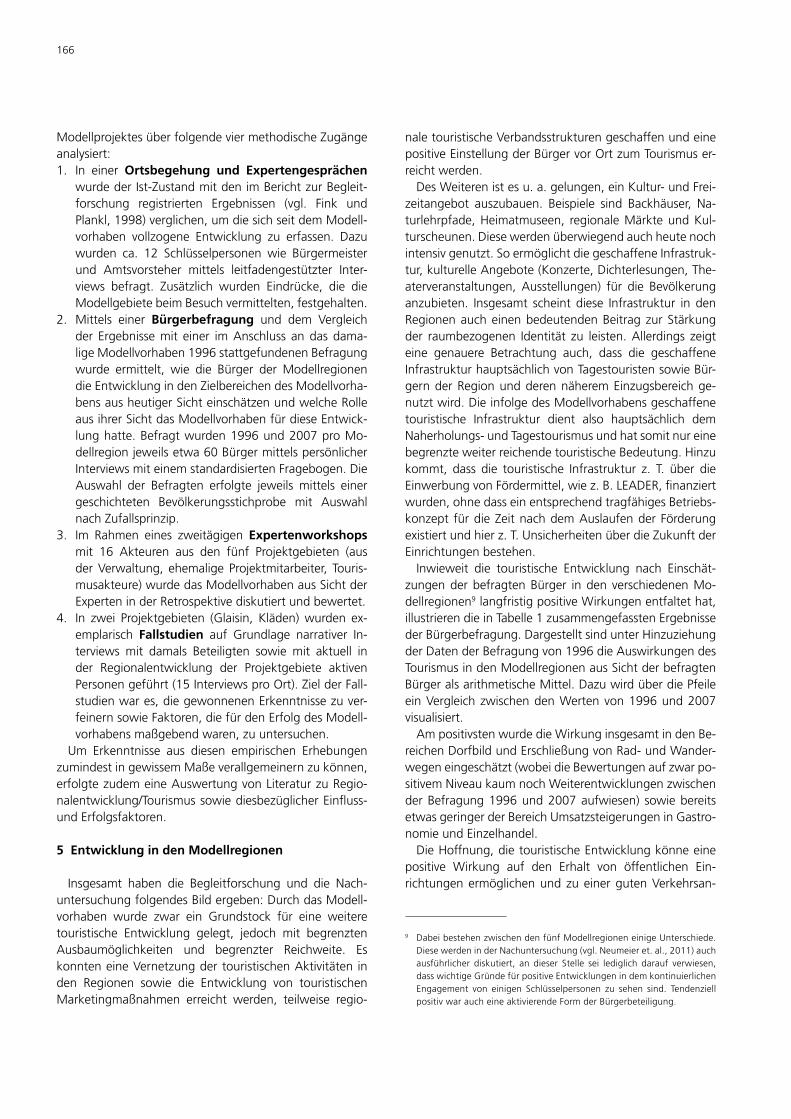
ModellprojektesüberfolgendeviermethodischeZugängeanalysiert:1. In einerOrtsbegehung und Expertengesprächen wurdederIst-ZustandmitdenimBerichtzurBegleit-forschung registrierten Ergebnissen (vgl. Fink undPlankl,1998)verglichen,umdiesichseitdemModell-vorhaben vollzogene Entwicklung zu erfassen. Dazuwurden ca. 12 Schlüsselpersonen wie Bürgermeisterund Amtsvorsteher mittels leitfadengestützter Inter-views befragt. Zusätzlich wurden Eindrücke, die dieModellgebietebeimBesuchvermittelten,festgehalten.
2. Mittels einer Bürgerbefragung und dem Vergleichder Ergebnissemit einer imAnschluss andasdama-ligeModellvorhaben1996stattgefundenenBefragungwurde ermittelt, wie die Bürger der ModellregionendieEntwicklungindenZielbereichendesModellvorha-bensausheutigerSichteinschätzenundwelcheRolleausihrerSichtdasModellvorhabenfürdieseEntwick-lunghatte.Befragtwurden1996und2007proMo-dellregionjeweilsetwa60BürgermittelspersönlicherInterviewsmiteinemstandardisiertenFragebogen.DieAuswahl der Befragten erfolgte jeweils mittels einergeschichteten Bevölkerungsstichprobe mit AuswahlnachZufallsprinzip.
3. Im Rahmen eines zweitägigen Expertenworkshopsmit 16 Akteuren aus den fünf Projektgebieten (ausderVerwaltung, ehemaligeProjektmitarbeiter, Touris-musakteure)wurdedasModellvorhabenausSichtderExperteninderRetrospektivediskutiertundbewertet.
4. In zwei Projektgebieten (Glaisin, Kläden)wurden ex-emplarisch Fallstudien auf Grundlage narrativer In-terviews mit damals Beteiligten sowie mit aktuell inder Regionalentwicklung der Projektgebiete aktivenPersonengeführt(15InterviewsproOrt).ZielderFall-studienwares,diegewonnenenErkenntnissezuver-feinernsowieFaktoren,diefürdenErfolgdesModell-vorhabensmaßgebendwaren,zuuntersuchen.Um Erkenntnisse aus diesen empirischen Erhebungen
zumindestingewissemMaßeverallgemeinernzukönnen,erfolgtezudemeineAuswertungvonLiteraturzuRegio-nalentwicklung/TourismussowiediesbezüglicherEinfluss-undErfolgsfaktoren.
5 Entwicklung in den Modellregionen
Insgesamt haben die Begleitforschung und die Nach-untersuchungfolgendesBildergeben:DurchdasModell-vorhaben wurde zwar ein Grundstock für eine weiteretouristische Entwicklung gelegt, jedoch mit begrenztenAusbaumöglichkeiten und begrenzter Reichweite. EskonnteneineVernetzungdertouristischenAktivitäteninden Regionen sowie die Entwicklung von touristischenMarketingmaßnahmen erreicht werden, teilweise regio-
naletouristischeVerbandsstrukturengeschaffenundeinepositiveEinstellungderBürgervorOrtzumTourismuser-reichtwerden.DesWeiterenistesu.a.gelungen,einKultur-undFrei-
zeitangebot auszubauen. Beispiele sind Backhäuser, Na-turlehrpfade,Heimatmuseen, regionaleMärkteundKul-turscheunen.Diesewerdenüberwiegendauchheutenochintensivgenutzt.SoermöglichtdiegeschaffeneInfrastruk-tur,kulturelleAngebote(Konzerte,Dichterlesungen,The-aterveranstaltungen, Ausstellungen) für die Bevölkerunganzubieten. Insgesamt scheint diese Infrastruktur in denRegionenaucheinenbedeutendenBeitragzurStärkungder raumbezogenen Identität zu leisten.Allerdings zeigteine genauere Betrachtung auch, dass die geschaffeneInfrastrukturhauptsächlichvonTagestouristensowieBür-gernderRegionundderennäheremEinzugsbereichge-nutztwird.DieinfolgedesModellvorhabensgeschaffenetouristische Infrastruktur dient also hauptsächlich demNaherholungs-undTagestourismusundhatsomitnureinebegrenzteweiterreichendetouristischeBedeutung.Hinzukommt, dass die touristische Infrastruktur z. T. über dieEinwerbungvonFördermittel,wiez.B.LEADER,finanziertwurden,ohnedasseinentsprechendtragfähigesBetriebs-konzept fürdieZeitnachdemAuslaufenderFörderungexistiertundhierz.T.UnsicherheitenüberdieZukunftderEinrichtungenbestehen.Inwieweit die touristische Entwicklung nach Einschät-
zungenderbefragtenBürger inden verschiedenenMo-dellregionen9
9 DabeibestehenzwischendenfünfModellregioneneinigeUnterschiede.DiesewerdeninderNachuntersuchung(vgl.Neumeieret.al.,2011)auchausführlicher diskutiert, an dieser Stelle sei lediglich darauf verwiesen,dasswichtigeGründefürpositiveEntwicklungenindemkontinuierlichenEngagement von einigen Schlüsselpersonen zu sehen sind. TendenziellpositivwaraucheineaktivierendeFormderBürgerbeteiligung.
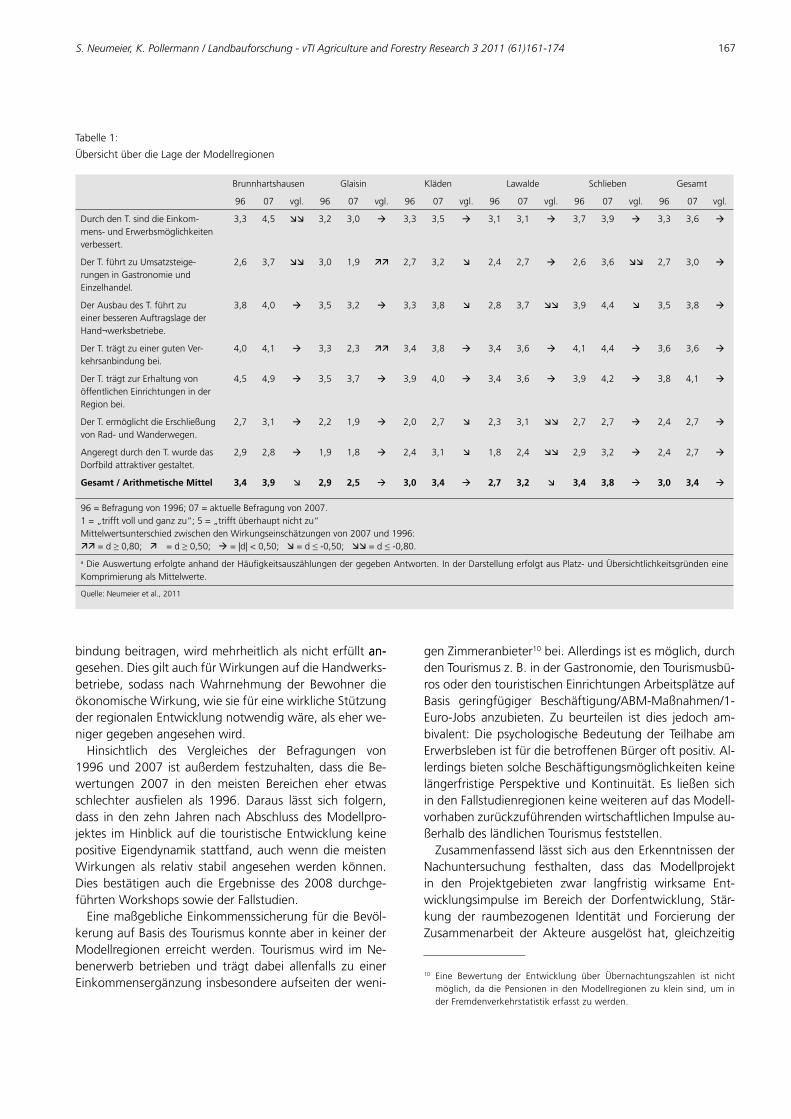
langfristigpositiveWirkungenentfaltethat,illustrierendieinTabelle1zusammengefasstenErgebnissederBürgerbefragung.DargestelltsindunterHinzuziehungderDatenderBefragungvon1996dieAuswirkungendesTourismusindenModellregionenausSichtderbefragtenBürgeralsarithmetischeMittel.DazuwirdüberdiePfeileeinVergleichzwischendenWertenvon1996und2007visualisiert.AmpositivstenwurdedieWirkunginsgesamtindenBe-
reichenDorfbildundErschließungvonRad-undWander-wegeneingeschätzt(wobeidieBewertungenaufzwarpo-sitivemNiveaukaumnochWeiterentwicklungenzwischenderBefragung1996und2007aufwiesen) sowiebereitsetwasgeringerderBereichUmsatzsteigerungeninGastro-nomieundEinzelhandel.DieHoffnung,dietouristischeEntwicklungkönneeine
positive Wirkung auf den Erhalt von öffentlichen Ein-richtungenermöglichenundzueinergutenVerkehrsan-
S. Neumeier, K. Pollermann / Landbauforschung - vTI Agriculture and Forestry Research 3 2011 (61)161-174 167
bindungbeitragen,wirdmehrheitlichalsnichterfülltan-an-gesehen.DiesgiltauchfürWirkungenaufdieHandwerks-betriebe, sodass nachWahrnehmung der Bewohner dieökonomischeWirkung,wiesiefüreinewirklicheStützungderregionalenEntwicklungnotwendigwäre,alseherwe-nigergegebenangesehenwird.Hinsichtlich des Vergleiches der Befragungen von
1996und2007 ist außerdem festzuhalten,dassdieBe-wertungen 2007 in den meisten Bereichen eher etwasschlechter ausfielen als 1996. Daraus lässt sich folgern,dass indenzehn JahrennachAbschlussdesModellpro-jektes imHinblickaufdie touristischeEntwicklungkeinepositiveEigendynamikstattfand,auchwenndiemeistenWirkungen als relativ stabil angesehenwerden können.Dies bestätigen auch die Ergebnisse des 2008 durchge-führtenWorkshopssowiederFallstudien.EinemaßgeblicheEinkommenssicherungfürdieBevöl-
kerungaufBasisdesTourismuskonnteaberinkeinerderModellregionen erreichtwerden. Tourismuswird imNe-benerwerb betrieben und trägt dabei allenfalls zu einerEinkommensergänzunginsbesondereaufseitenderweni-
Tabelle1:
ÜbersichtüberdieLagederModellregionen
Brunnhartshausen Glaisin Kläden Lawalde Schlieben Gesamt
96 07 vgl. 96 07 vgl. 96 07 vgl. 96 07 vgl. 96 07 vgl. 96 07 vgl.
DurchdenT.sinddieEinkom-mens-undErwerbsmöglichkeitenverbessert.
3,3 4,5 3,2 3,0 3,3 3,5 3,1 3,1 3,7 3,9 3,3 3,6
DerT.führtzuUmsatzsteige-rungeninGastronomieundEinzelhandel.
2,6 3,7 3,0 1,9 2,7 3,2 2,4 2,7 2,6 3,6 2,7 3,0
DerAusbaudesT.führtzueinerbesserenAuftragslagederHand¬werksbetriebe.
3,8 4,0 3,5 3,2 3,3 3,8 2,8 3,7 3,9 4,4 3,5 3,8
DerT.trägtzueinergutenVer-kehrsanbindungbei.
4,0 4,1 3,3 2,3 3,4 3,8 3,4 3,6 4,1 4,4 3,6 3,6
DerT.trägtzurErhaltungvonöffentlichenEinrichtungeninderRegionbei.
4,5 4,9 3,5 3,7 3,9 4,0 3,4 3,6 3,9 4,2 3,8 4,1
DerT.ermöglichtdieErschließungvonRad-undWanderwegen.
2,7 3,1 2,2 1,9 2,0 2,7 2,3 3,1 2,7 2,7 2,4 2,7
AngeregtdurchdenT.wurdedasDorfbildattraktivergestaltet.
2,9 2,8 1,9 1,8 2,4 3,1 1,8 2,4 2,9 3,2 2,4 2,7
Gesamt / Arithmetische Mittel 3,4 3,9 2,9 2,5 3,0 3,4 2,7 3,2 3,4 3,8 3,0 3,4
96=Befragungvon1996;07=aktuelleBefragungvon2007.1=„trifftvollundganzzu“;5=„trifftüberhauptnichtzu“MittelwertsunterschiedzwischendenWirkungseinschätzungenvon2007und1996:=d≥0,80; =d≥0,50; =|d|<0,50; =d≤-0,50; =d≤-0,80.
aDieAuswertungerfolgteanhandderHäufigkeitsauszählungendergegebenAntworten.InderDarstellungerfolgtausPlatz-undÜbersichtlichkeitsgründeneineKomprimierungalsMittelwerte.
Quelle:Neumeieretal.,2011
genZimmeranbieter10bei.Allerdingsistesmöglich,durchdenTourismusz.B.inderGastronomie,denTourismusbü-rosoderdentouristischenEinrichtungenArbeitsplätzeaufBasis geringfügiger Beschäftigung/ABM-Maßnahmen/1-Euro-Jobs anzubieten. Zu beurteilen ist dies jedoch am-bivalent:DiepsychologischeBedeutungderTeilhabeamErwerbslebenistfürdiebetroffenenBürgeroftpositiv.Al-lerdingsbietensolcheBeschäftigungsmöglichkeitenkeinelängerfristige Perspektive undKontinuität. Es ließen sichindenFallstudienregionenkeineweiterenaufdasModell-vorhabenzurückzuführendenwirtschaftlichenImpulseau-ßerhalbdesländlichenTourismusfeststellen.ZusammenfassendlässtsichausdenErkenntnissender
Nachuntersuchung festhalten, dass das Modellprojektin den Projektgebieten zwar langfristig wirksame Ent-wicklungsimpulse im Bereich der Dorfentwicklung, Stär-kung der raumbezogenen Identität und Forcierung derZusammenarbeit der Akteure ausgelöst hat, gleichzeitig
10 Eine Bewertung der Entwicklung über Übernachtungszahlen ist nichtmöglich,dadie Pensionen indenModellregionen zuklein sind,um inderFremdenverkehrstatistikerfasstzuwerden.
168
sich jedoch die mit der Entwicklung des DorftourismusverbundeneneigentlichenErwartungenaneineEinkom-menssicherung und Etablierung eines tragfähigen länd-lichenTourismusnichterfüllthaben.
6 Möglichkeiten und Grenzen der Förderung durch touristische Entwicklung im Modellvorhaben
WennmandievorgestelltenErgebnissezurEntwicklungeinesländlichenTourismusindenModellregionenmitdenkonzeptionellen Zielen desModellprojekts vergleicht,wirddeutlich,dassdasModellprojekt inökonomischerHinsichtkeineweiterreichendennachhaltigenEffekteausgelösthat,dadasHauptzielderEinkommenssicherungundStabilisie-rungderregionalenWirtschaftüberdenTourismusinkeinerModellregionerreichtwerdenkonnte.Zusammenmitdenliteraturgestützten Überlegungen in Kapitel 2 zeigen sichsomit enge Grenzen für ökonomische Wirkungen. DabeihatauchderbreiteBeteiligungsansatzkaumeinenEinflussaufdieEntwicklungtouristischerUnternehmengenommen,auchwenndasThemaTourismuseinebreiteDiskussioner-fahrenhat,wasvordemHintergrundderVielschichtigkeitvonAnforderungendesTourismus(u.a.positiveEinstellungderBevölkerung)tendenziellpositivzuwertenist.Im Lauf der Zeit haben sich die Erwartungen aufsei-
tenderRegionenauch relativiert.DieChancender tou-ristischenMöglichkeiten werden in denModellregionenheutedurchwegrealistischereingeschätzt,wassichletzt-lichzunächstalsErnüchterungzeigte,nunaberaucheinepragmatischeHerangehensweisefördernkann.BezüglichandererMöglichkeitenistdasModellvorhaben
alserfolgreicherzubeurteilen:sowurdeninallenModell-regionen Bürgerbeteiligungsprozesse angestoßen und zurStärkung der Identifizierung der Bürger mit der eigenenRegionbeigetragen.HierzuzeigendieErörterungeninKa-pitel2dasdieseskeinSelbstzweckist,sondernverbesserteKooperationsbedingungen sowie gesteigerte Identitätenweitere positive Wirkungen haben können. So hat dasModellvorhaben fürdieweitere EntwicklungbedeutsamesoziokulturelleundsoziopolitischeEffekteausgelöst.Dieso-ziokulturellenEffekteentstehendurcheineverbesserteso-ziale Infrastruktur,dieKommunikationsowieverbessertenKultur- und Erholungsangebote ermöglicht.Als soziopoli-tischeAspektesinddieAktivierungderBetroffenenundeinverändertesVerständnisvonPartizipationzunennen.Aller-dingsistdieZustimmungzupartizipativenVerfahrenzwarpositivzubewerten,einesolcheZustimmunghatabernurdanneinennachhaltigenEffekt,wennweiterepartizipativeBeteiligungsansätzezurAnwendungkommen.Das Modellvorhaben nur anhand der ökonomischen
Wirkungenzubeurteilen ist jedenfallszukurzgegriffen.Auch wenn in solchen Regionen in ökonomischer Hin-sicht über den Tourismusnurwenig zu erreichen ist, so
hat die Nachuntersuchung auch gezeigt, dass sich dortvielversprechendeMöglichkeitenbieten,überdas„Vehi-kel“ Tourismus eine Förderung der RegionalentwicklungzuerreichenunddieRegionenfürihreBewohnerattrak-tiver zumachen. Prinzipiell sindauchandereVehikel alsnurTourismusmöglich,Tourismuseignetsichjedochbe-sonders füreineSuchenachregionalenPotenzialenundeinerVerbesserungderraumbezogenenIdentität,dasichgezeigthat,dassdieBeteiligungsbereitschaftundInteres-seanDiskussionenüberTourismusi.d.R.großist.Wennesalsogelingt,überDiskursezumTourismusBürgerbetei-ligungsprozesse zu initiierenund zumNachdenkenüberalternative,regionsspezifischeEntwicklungsmöglichkeitenanzuregen,dannkannderTourismusauchinsolchenRe-gionenalseinFaktorderländlichenEntwicklungdienen.DabeikommtihmeineRollealsAuslöserfürEntwicklungs-impulseund-bemühungenzu.Gleichzeitig bestätigen die Erkenntnisse aus demMo-
dellvorhabendieTheseLanes(1994)vomländlichenTou-rismus als Kontinuumundgeben einenHinweis darauf,dassNaherholung,diegemäßderallgemeinenTourismus-definition (vgl.Kapitel 2.1) nicht zumTourismusgezähltwird,imRahmendesländlichenTourismusindieDefiniti-onmiteinzuschließenist.DennwieamBeispielderMo-dellregionengezeigt,kannländlicherTourismusebenauchhauptsächlichNaherholungstourismussein.Somit sind dieGrenzen, aber auchMöglichkeiten des
Tourismus als Faktor der Regionalentwicklung deutlichundesstelltsichdaherdieFrage,wiediesevorOrtopti-malgenutztwerdenkönnenundwieeineFörderungvonaußendiesunterstützenkann.
7 Chancen nutzen: Ergebnisse des Modellprojekts im Spiegel der Literatur zu regionalen Entwicklungspro-zessen
Die Interpretationen der unterschiedlichen Entwick-lungen in den verschiedenen Modellregionen sowieeine Literaturrecherche zu Erfolgsfaktoren können zuErfolgspotenzialen für regionale Entwicklungsprozessezusammengefasstwerden.11
11 EineausführlicheBegründungenzurHerleitungderErfolgspotenziale(und
zumErfolgsbegriff)findetsichbeiPollermann(2004),einevollständigeListe
vonErfolgsfaktorenauseinerLiteraturauswertungvon13QuellenbeiNeu-
meieretal.(2011).BezugwarenverschiedenekooperativePlanungsansätze
zuintegrierterländlicherEntwicklung(LEADER,Regionenaktiv)undtouristi-
scheEntwicklungskonzepte.TrotzunterschiedlicherHerkünftederLiteratur
undempirischenGrundlagensinddieErfolgspotenzialerelativuniversellund
passensomitgutaufdieAufgabenstellung,einetouristischeEntwicklungin
peripherenRegionenzufördern.
WerdendieseErfolgspoten-zialeindenProzessenvorOrtgenutztundlangfristigaus-
S. Neumeier, K. Pollermann / Landbauforschung - vTI Agriculture and Forestry Research 3 2011 (61)161-174 169
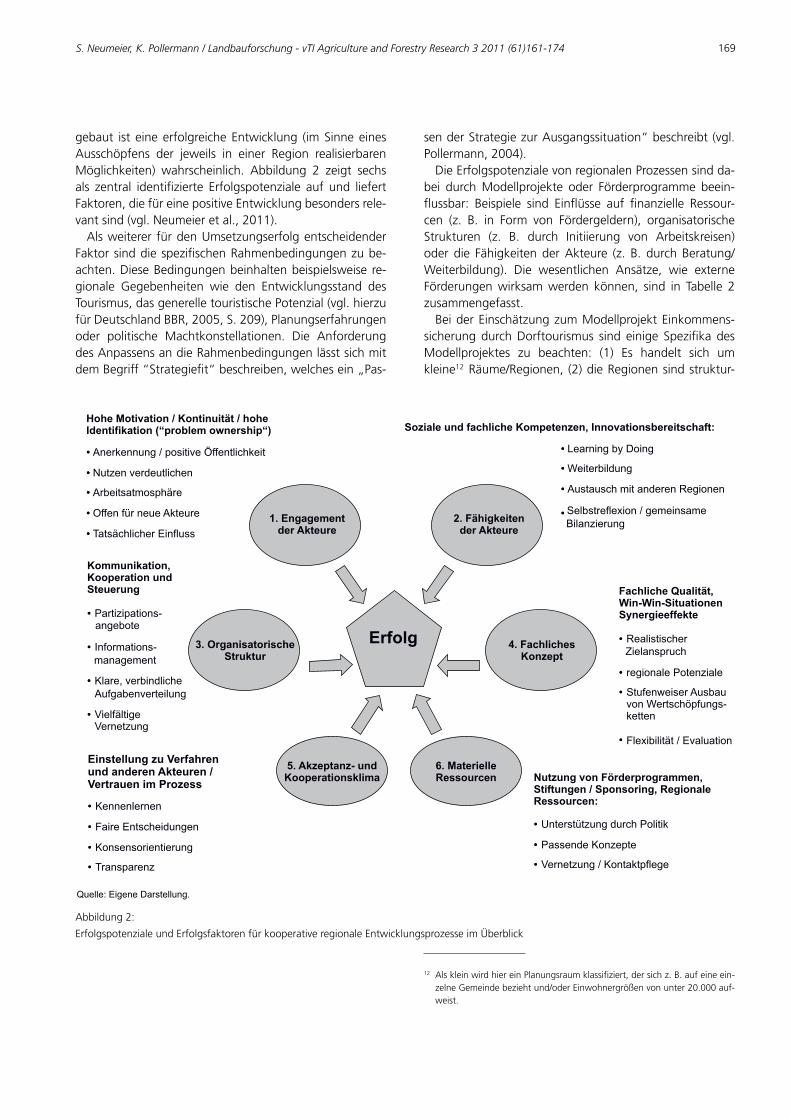
gebaut ist eineerfolgreicheEntwicklung (imSinneeinesAusschöpfens der jeweils in einer Region realisierbarenMöglichkeiten) wahrscheinlich. Abbildung 2 zeigt sechsals zentral identifizierte Erfolgspotenziale auf und liefertFaktoren,diefüreinepositiveEntwicklungbesondersrele-vantsind(vgl.Neumeieretal.,2011).
Erfolg
Hohe Motivation / Kontinuität / hoheIdentifikation (“problem ownership“)
• Anerkennung / positive Öffentlichkeit
• Nutzen verdeutlichen
• Arbeitsatmosphäre
• Offen für neue Akteure
• Tatsächlicher Einfluss
• Learning by Doing
• Weiterbildung
• Austausch mit anderen Regionen
• Selbstreflexion / gemeinsame
Bilanzierung
Einstellung zu Verfahrenund anderen Akteuren /Vertrauen im Prozess
• Kennenlernen
• Faire Entscheidungen
• Konsensorientierung
• Transparenz
Fachliche Qualität,Win-Win-SituationenSynergieeffekte
• Realistischer
Zielanspruch
• regionale Potenziale
• Stufenweiser Ausbau
von Wertschöpfungs-
ketten
• Flexibilität / Evaluation
Nutzung von Förderprogrammen,Stiftungen / Sponsoring, RegionaleRessourcen:
• Unterstützung durch Politik
• Passende Konzepte
• Vernetzung / Kontaktpflege
Kommunikation,Kooperation undSteuerung
• Partizipations-
angebote
• Informations-
management
• Klare, verbindliche
Aufgabenverteilung
• Vielfältige
Vernetzung
Soziale und fachliche Kompetenzen, Innovationsbereitschaft:
•
•
•
•
•
•
•
•
•
•
•
•
•
•
•
•
•
•
•
•
•
•
•
•
2. Fähigkeitender Akteure
4. FachlichesKonzept
6. MaterielleRessourcen
5. Akzeptanz- undKooperationsklima
1. Engagementder Akteure
3. OrganisatorischeStruktur
Quelle: Eigene Darstellung.
Abbildung2:
ErfolgspotenzialeundErfolgsfaktorenfürkooperativeregionaleEntwicklungsprozesseimÜberblick
Alsweiterer fürdenUmsetzungserfolgentscheidenderFaktorsinddiespezifischenRahmenbedingungenzube-achten.DieseBedingungenbeinhaltenbeispielsweisere-gionale Gegebenheiten wie den Entwicklungsstand desTourismus,dasgenerelletouristischePotenzial(vgl.hierzufürDeutschlandBBR,2005,S.209),Planungserfahrungenoder politische Machtkonstellationen. Die AnforderungdesAnpassensandieRahmenbedingungenlässtsichmitdemBegriff“Strategiefit“beschreiben,welchesein„Pas-
senderStrategiezurAusgangssituation“beschreibt(vgl.Pollermann,2004).DieErfolgspotenzialevonregionalenProzessensindda-
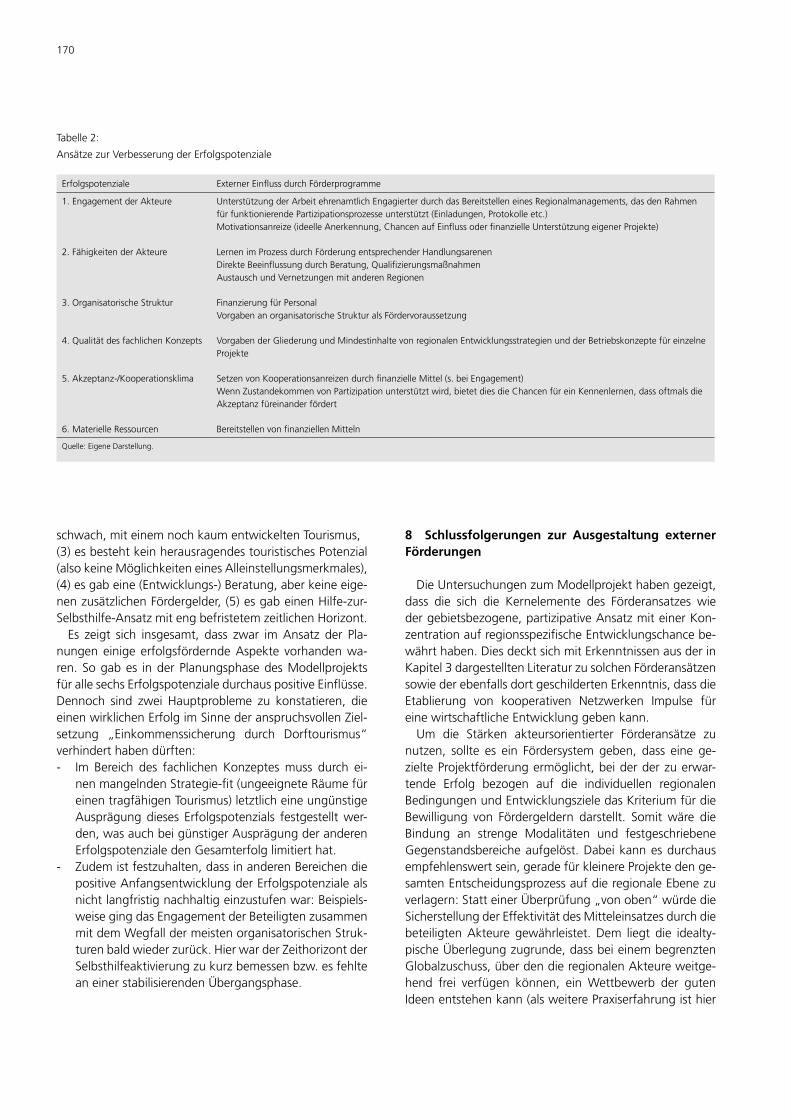
bei durchModellprojekte oder Förderprogramme beein-flussbar: Beispiele sind Einflüsse auf finanzielle Ressour-cen (z. B. in Form von Fördergeldern), organisatorischeStrukturen (z. B. durch Initiierung von Arbeitskreisen)oder die FähigkeitenderAkteure (z. B. durchBeratung/Weiterbildung). Die wesentlichen Ansätze, wie externeFörderungenwirksamwerden können, sind in Tabelle 2zusammengefasst.BeiderEinschätzungzumModellprojektEinkommens-
sicherungdurchDorftourismus sind einige Spezifika desModellprojektes zu beachten: (1) Es handelt sich umkleine12
12 AlskleinwirdhiereinPlanungsraumklassifiziert,dersichz.B.aufeineein-zelneGemeindebeziehtund/oderEinwohnergrößenvonunter20.000auf-weist.
Räume/Regionen,(2)dieRegionensindstruktur-
170
schwach,miteinemnochkaumentwickeltenTourismus,(3)esbestehtkeinherausragendestouristischesPotenzial(alsokeineMöglichkeiteneinesAlleinstellungsmerkmales),(4)esgabeine(Entwicklungs-)Beratung,aberkeineeige-nenzusätzlichenFördergelder,(5)esgabeinenHilfe-zur-Selbsthilfe-AnsatzmitengbefristetemzeitlichenHorizont.Es zeigt sich insgesamt, dass zwar imAnsatz der Pla-
nungeneinige erfolgsförderndeAspekte vorhandenwa-ren.Sogabes inderPlanungsphasedesModellprojektsfürallesechsErfolgspotenzialedurchauspositiveEinflüsse.Dennoch sind zwei Hauptprobleme zu konstatieren, dieeinenwirklichenErfolgimSinnederanspruchsvollenZiel-setzung „Einkommenssicherung durch Dorftourismus“verhinderthabendürften:- Im Bereich des fachlichen Konzeptesmuss durch ei-nenmangelndenStrategie-fit(ungeeigneteRäumefüreinentragfähigenTourismus)letztlicheineungünstigeAusprägungdieses Erfolgspotenzials festgestelltwer-den,wasauchbeigünstigerAusprägungderanderenErfolgspotenzialedenGesamterfolglimitierthat.
- Zudemistfestzuhalten,dassinanderenBereichendiepositiveAnfangsentwicklungderErfolgspotenzialealsnichtlangfristignachhaltigeinzustufenwar:Beispiels-weisegingdasEngagementderBeteiligtenzusammenmitdemWegfalldermeistenorganisatorischenStruk-turenbaldwiederzurück.HierwarderZeithorizontderSelbsthilfeaktivierungzukurzbemessenbzw.esfehlteaneinerstabilisierendenÜbergangsphase.
Tabelle2:
AnsätzezurVerbesserungderErfolgspotenziale
Erfolgspotenziale ExternerEinflussdurchFörderprogramme
1.EngagementderAkteure UnterstützungderArbeitehrenamtlichEngagierterdurchdasBereitstelleneinesRegionalmanagements,dasdenRahmenfürfunktionierendePartizipationsprozesseunterstützt(Einladungen,Protokolleetc.)Motivationsanreize(ideelleAnerkennung,ChancenaufEinflussoderfinanzielleUnterstützungeigenerProjekte)
2.FähigkeitenderAkteure LernenimProzessdurchFörderungentsprechenderHandlungsarenenDirekteBeeinflussungdurchBeratung,QualifizierungsmaßnahmenAustauschundVernetzungenmitanderenRegionen
3.OrganisatorischeStruktur FinanzierungfürPersonalVorgabenanorganisatorischeStrukturalsFördervoraussetzung
4.QualitätdesfachlichenKonzepts VorgabenderGliederungundMindestinhaltevonregionalenEntwicklungsstrategienundderBetriebskonzeptefüreinzelneProjekte
5.Akzeptanz-/Kooperationsklima SetzenvonKooperationsanreizendurchfinanzielleMittel(s.beiEngagement)WennZustandekommenvonPartizipationunterstütztwird,bietetdiesdieChancenfüreinKennenlernen,dassoftmalsdieAkzeptanzfüreinanderfördert
6.MaterielleRessourcen BereitstellenvonfinanziellenMitteln
Quelle:EigeneDarstellung.
8 Schlussfolgerungen zur Ausgestaltung externer Förderungen
DieUntersuchungenzumModellprojekthabengezeigt,dass die sich die Kernelemente des Förderansatzes wiedergebietsbezogene,partizipativeAnsatzmiteinerKon-zentrationaufregionsspezifischeEntwicklungschancebe-währthaben.DiesdecktsichmitErkenntnissenausderinKapitel3dargestelltenLiteraturzusolchenFörderansätzensowiederebenfallsdortgeschildertenErkenntnis,dassdieEtablierung von kooperativen Netzwerken Impulse füreinewirtschaftlicheEntwicklunggebenkann.Um die Stärken akteursorientierter Förderansätze zu
nutzen, sollte es ein Fördersystem geben, dass eine ge-zielteProjektförderungermöglicht,beiderderzuerwar-tende Erfolg bezogen auf die individuellen regionalenBedingungenundEntwicklungszieledasKriteriumfürdieBewilligung von Fördergeldern darstellt. Somit wäre dieBindung an strenge Modalitäten und festgeschriebeneGegenstandsbereicheaufgelöst.Dabeikannesdurchausempfehlenswertsein,geradefürkleinereProjektedenge-samtenEntscheidungsprozessaufdieregionaleEbenezuverlagern:StatteinerÜberprüfung„vonoben“würdedieSicherstellungderEffektivitätdesMitteleinsatzesdurchdiebeteiligtenAkteure gewährleistet.Dem liegt die idealty-pischeÜberlegungzugrunde,dassbeieinembegrenztenGlobalzuschuss,überdendieregionalenAkteureweitge-hend frei verfügen können, ein Wettbewerb der gutenIdeenentstehenkann(alsweiterePraxiserfahrungisthier
S. Neumeier, K. Pollermann / Landbauforschung - vTI Agriculture and Forestry Research 3 2011 (61)161-174 171
aufdiegegenwärtigeLEADER-Förderungzuverweisen:esgilteigentlichein„bottomup“-Prinzip,durchzuengeFör-dermodalitätenwirddiesabergeschwächt,vgl.BAG-LAG2010).Allerdings sindnachuntenabgegebenEntscheidungs-
prozesse in gewissenMaße anfällig gegenüber der Ein-flussnahme von lokalen Machtkonstellationen, sodassdie Sinnhaftigkeit solcher Versuche auch von der Breiteund Transparenz der Beteiligungsprozesse abhängt, dasodieGefahrvonweniginnovativen,als„Beutegemein-schaften“ agierendenAkteurskonstellationen vermindertwird. Somit sollten gerade auch potenziell kritische Ak-teure aus der Zivilgesellschaft eingebunden und für alleoffeneBeteiligungsangeboteetabliertwerden.ZurErhö-hungder Transparenzbieten sichweiterhinan,u. a. imInternet die Einladungen und Protokolle zugänglich zumachen.DieUntersuchungenzumModellprojektbestätigtenauch
diefolgendenProbleme,diedurchentsprechendeAusge-staltungderFörderpolitikabgemildertwerdenkönnen:- Bei externen Förderungen ist immer zuhinterfragen,inwieweit dauerhaft eigenständige Prozesse entste-henund/oder inwieweit die externe Förderungwirk-licheinereffektivenZielerreichungdient.ProjekteundMaßnahmen sollten auch nach Auslaufen einer wieauchimmergeartetenUnterstützung(fachlich,perso-nell,finanziell)ohnegroßeProblemeoderEinschnittetragfähig bleiben. Um mit regionalen Entwicklungs-maßnahmeneinennachhaltigenEntwicklungsprozessanzustoßen ist es notwendig, vor Umsetzung vonKonzepten undMaßnahmen diese auf ihr Potenzial,auch langfristig tragfähig zu sein, zu prüfen und imZweifelsfalldasKonzeptzumodifizierenoderadactazu legen. Daher sollte die Vorlage eines fundiertenKonzeptes, das insbesondere auch die FortführungimAnschlussandieeigentlicheProjektförderungab-deckt, für entsprechende Maßnahmen und ProjekteeinegrundlegendeVoraussetzungsein.
- Obwohl im Rahmen des Modellvorhabens keine ei-genen Fördermittel bereitgestellt wurden, sonderndieModellregionen und Akteure vor Ort „lediglich“überFördermöglichkeiten informiert/beratenwurden,gibtesHinweiseaufeineArt„Fördermentalität“.Dasbedeutet, dass Maßnahmen insbesondere nicht nureherumgesetztwerden,wennesdafüreineentspre-chendeFörderunggibt, sondernauchdasFördermit-tel auch für weniger dringende Projekte beantragtwerden, eben weil diese gefördert werden. Zudemkönnen Fehldimensionierungen begünstigt werden.DieBereitschaftzurEigeninitiative,d.h.Nutzungvor-handener endogener Möglichkeiten zur Umsetzungvon Entwicklungsmaßnahmen, kann zurückgehen.UmdiesabzumildernsindwiederumpartizipativeAn-
sätzegeeignet,könnendochauchhier insbesonderekritischeAkteureausder Zivilgesellschaft einKorrek-tiv beispielsweise gegenüber Fehldimensionierungendarstellen (vgl. FenglerundPollermann2010,S.87).Gleichzeitig wurde eine Förderberatung wie imMo-dellvorhabenbetriebenvondenWorkshopteilnehmernsehrbegrüßt,dadieFördermöglichkeitenund–moda-litäten in der Regionalentwicklung laut Aussage derWorkshopteilnehmer inzwischen derart unübersicht-lich und bürokratisch sind, dass eine entsprechendeBeratungundHilfestellungsowohlbeiderAntragstel-lung als auch der Abrechnung eine große Hilfe undEntlastung der (Kommunal-)Verwaltungen darstellenwürde. Hieraus lassen sich wiederum zweierlei An-forderungenableiten:einerseits solltenBestrebungenerfolgendieFörderbedingungeneinfacherundtrans-parenter zu machen, anderseits Beratungsangeboteüber kontinuierlich bestehende Stellen etabliert wer-den(dieseFunktionerfüllenjetztz.T.dieüberLEADEReingerichteten Regionalmanagements). Eine transpa-renteFördermittelberatungkannauchdazubeitragen,dassauchneueAkteureaktiviertwerdenundsichdasFördermittelgeschäftnichtnurindaraufeingespielten„innerenZirkeln“abspielt.
9 Fazit
FürdenErfolgvonModellprojektenhinsichtlichihrerei-gentlichenAufgabe-nämlichmodellhafteErkenntnissezuliefern-istdabeidiekonkreteZielerreichungvorOrtnureinTeilaspekt.Soisteszumeinenwichtig,dassdieüberModellprojekte aktivierten Akteure nach Ende der Vor-habennicht alleingelassenwerden. Zumanderen ist eswesentlich,dassdieWirkungszusammenhänge–geradeauchbeigeringenZielerreichungen–festgestelltwerdenunddarausKonsequenzenfürdiePlanungspraxisunddieFörderpolitikabgeleitetwerden.Generell sollteeineent-sprechendeVor-undNachbereitungvonModellprojektensowohldieWissensgenerierungoptimierenalsauchdenWissenstransferindiePraxissicherstellen.Die Nachuntersuchung zum Modellvorhaben hat ge-
zeigt, dassdie„Förderung vonTourismus als FaktorderEntwicklungländlicherRäume“differenziertzusehenist,wobeiimRahmendesArtikelskeinetouristischenGunst-regionen betrachtet wurden. In solchen bestehen, auchinperipherenRegionen,sicherlichganzandereMöglich-keiten. Für periphere Regionen ohne besondere touri-stischeQualitäten(„Allerweltsregionen“)istabernachEr-kenntnissenausdemModellprojekteherdavorzuwarnen,größere ökonomische Hoffnungen auf eine touristischeEntwicklungzusetzen.AngesichtsderHerausforderungendes demographischen Wandels sowie des sozialen undökonomischenStrukturwandelssinddieMöglichkeitenzu
172
einerökonomischenStabilisierungsolcherRegionenüberden Tourismus begrenzt. Das Modellvorhaben hat aberauchgezeigt,dassmithilfedesVehikels„Tourismus“viel-versprechende Möglichkeiten und Anknüpfungspunktegeschaffenwerdenkönnen,dieregionaleEntwicklungzuunterstützensowiedieAttraktivitätvonRegionenfürihreBürgerundpotenzielleGästezuerhöhen.EinerderGrün-dedafürist,dassderAspekt„Tourismus“vorOrti.d.R.aufgroßesInteressestößt,wassichinderBereitschaftderBürgerundGemeindevertreter,sichinentsprechendeDis-kussionenundProjekteeinzubringen,widerspiegelt.Falls es gelingt, über den Faktor Tourismus ländliche
Entwicklungsprozesse anzustoßen, Entwicklungsbestre-bungenstringentaufeinanderabzustimmenoderdieRe-flexion über unterschiedliche Entwicklungsperspektivenanzuregen, kann Tourismus auch in Regionen, die sichnichtfüreineökonomischnachhaltigetouristischeInwert-setzung eignen, einenwirksamenBeitrag zur ländlichenEntwicklungleisten–undzwaralsInitiatorfürsozio-poli-tischenWandel.Vorraussetzungdazuisteinpartizipativer,gebietsbezogenerundintegrierterFörder-undPlanungs-ansatz.UnterstütztwerdenkanneinsolcherProzessüberdiedargestelltenErfolgspotenziale.DabeiistderTourismussicherlich nicht der einzigmögliche Anknüpfungspunkt,sondernesistaucheindirekterFokusaufdieLebensquali-tätderBevölkerungoderandererregionsspezifischerAuf-gabensinnvoll.EintouristischerFokusbietetaberinvielenRegionenChancen, zumindest kleine Erfolge im ökono-mischenBereichmiteinerallgemeinenländlichenEntwick-lungzuverknüpfen.
Literatur
AgarwalS,RahmanS,ErringtonA(2009)Measuringthedeterminantsofre-lativeeconomicperformanceofruralareas.JRuralStudies25(3):309–321
BAG LAG (2010) Positionspapier zur zukünftigen Förderung der ländlichenRäume [online]. Zu finden in <http://www.netzwerk-laendlicher-raum.de//fileadmin/sites/ELER/Dateien/02_Regionen/Materialien/BAGLAG-Positi-on-4-3-2010.pdf>[zitiertam08.06.2011]
BenthienB(1995)TouristischeEntwicklungsmöglichkeitenderneuenBundes-länder.MaterialienangewGeographie24:105-115
BernardT(2001)MöglichkeiteneinerRekrutierungtouristischerNachfragerimländlichenRaumausSichtderLeistungsanbieter.BayreutherKontaktstudi-umGeographie1:211-219
Bundesamt für Bauwesen und Raumordnung (2005) Raumordnungsbericht2005.Bonn:BBR
BräuerR,HöherC,LucasR,MolitorR,NischwitzG,StevensG,WittekS(2000)GuteBeispieleeinernachhaltigenregionalenRaum-undSiedlungsentwick-lung:Handbuch.Bonn:BBR,193p,Werkstatt:Praxis2000/1
BütowM(1995)RegionalentwicklungundTourismus.GreifswalderBeitrRekre-ationsgeographie/Freizeit-Tourismusforsch6:12-24
CawleyM,GillmorD(2008)Integratedruraltourism:conceptsandpractice.AnnTourismRes35(2):316-337
DellerS (2010)Ruralpoverty, tourismand spatialheterogenity.AnnTourismRes37(1):180-205
Elbe S (2007) Die Voraussetzungen der erfolgreichen Steuerung integrierterAnsätzedurchFörderprogramme:untersuchtamBeispieldesModellvor-habensRegionenAktiv.Aachen:Shaker,300,39p
FenglerB,PollermannK(2010)Kapitel13;IntegrierteländlicheEntwicklung(ILE/A) ; Lokale Aktionsgruppen (AktivRegionen) ; In: Halbzeitbewertungdes ZPLR Schleswig-Holstein im Rahmen der 7-Länder-Bewertung : Zu-kunftsprogrammLändlicherRaum;Bd2.Braunschweig:vTI,128,45p
FenglerB,RaueP(2010)Kapitel16;ILEundLEADER.In:HalbzeitbewertungimRahmender7-Länder-Bewertung:PROFILNiedersachsen;Bd2.Braun-schweig:vTI,159p
FinkM,PlanklR(1998)WissenschaftlicheBegleituntersuchungzumModellvor-haben „Einkommenssicherung durch Dorftourismus“ : Abschlussbericht.Bonn:Köllen,114p,AngewandteWissenschaft472
FürstD,LahnerM,PollermannK(2006)EntstehungundFunktionsweisevonRegionalGovernancebeidemGemeinschaftsgutNaturundLandschaft :AnalysenzuPlace-makingundGovernance-ProzesseninBiosphärenreser-vateninDeutschlandundGroßbritannien.Hannover:InstUmweltplanung,228p,BeitrräumlichenPlanung82
GarbeC(2003)TourismusunddasÜbereinkommenüberdieBiologischeVielfalt(CBD):Rückblick,PerspektiveundElementedesCBD-RichtlinienentwurfsfürnachhaltigenTourismus.JbNaturschutzLandschaftspflege54:289-297
HauglandS,NessH,GroensethB-O,Aarstad J (2011)Developmentof tour-ism destinations : an integratedmultilevel perspective. Ann Tourism Res38(1):268-290
IorioM,CorsaleA(2010)RuraltourismandlivelihoodstrategiesinRomania.JRuralStudies26(2):152-162
Jensen-ButlerC,MadsenB,ZhangJ(2007)Regionaleconomicimpactsoftour-ism:thecaseofDenmark.RegionalStudies41(6):839-853
JobH,HarrerB,MetzlerD,Hajizadeh-AlmadryD(2005)ÖkonomischeEffektevonGroßschutzgebieten:UntersuchungderBedeutungvonGroßschutz-gebietenfürdenTourismusunddiewirtschaftlicheEntwicklungderRegion.Bonn:BundesamtNaturschutz,BfNSkript135
Johnston RJ, Gregory D, Pratt G,WattsW (2000) The dictionary of humangeography.Malden:Blackwell,880p
KrottM,BöcherM,TränknerS(2007)Regionenaktiv–LandgestaltetZukunft:Begleitforschung2004-2006 ;EndberichtdesModuls5 ;ErfolgsfaktorenundRahmenbedingungen[online].Zufindenin<http://www.nova-institut.de/ra-attach/17815/B2_Modul5_Endbericht11062007.pdf> [zitiert am09.06.2011]
LaneB(1994)Whatisruraltourism?JSustainableTourism2(1&2):7-21LeserH,HaasD,MosimannT,PaeslerR(1993)Diercke-Wörterbuchderallge-
meinenGeographie:Bd1,A-M.München:DtTaschenbuch-Verl,422pLübbenC(1995)InternationalerTourismusalsFaktorderRegionalentwicklung
in Indonesien :untersuchtamBeispielder InselLombok.Berlin :Reimer,178p
McAreaveyR,McDonaghJ(2010)Sustainableruraltourism:lessonsforruraldevelopment.SociologiaRuralis51(2):175-194
Ministerium für Landwirtschaft Umwelt und Verbraucherschutz des LandesMecklenburg-Vorpommern (2009) Entwicklungsprogramm für den länd-lichen RaumMecklenburg-Vorpommern 2007 bis 2013 (EPLRM-V) [on-line].Zufindenin<http://www.europa-mv.de/docs/download/10095/EPLR-Programm_2007-2013.pdf>[zitiertam09.06.2011]
MoseI,NischwitzG(2009)AnforderungenaneineregionaleEntwicklungspo-litik für strukturschwache ländlicheRäume [online]. Zufinden in<http://shop.arl-net.de/media/direct/pdf/e-paper_der_arl_nr7.pdf> [zitiert am08.06.2011]
MoserA,SchnautG(2011)HalbzeitbewertungdesEPLRHessen:TeilII-Kapitel10;LändlicheEntwicklung-LEADER.In:InstitutfürLändlicheRäume(ed)HalbzeitbewertungdesEPLRHessenimRahmender7-LänderBewertung:EntwicklungsplanfürdenländlichenRaum2007-2013.Braunschweig:vTI,144,47p
MundtJW(2001)EinführungindenTourismus.München:Oldenbourg,572pNeumeierS (2002)RegionalewebbasierteGIS imFremdenverkehr :aktueller
StandundPotentiale.OffenbachaM:GISnetNeumeierS,PollermannK,JägerR(2011)ÜberprüfungderNachhaltigkeitdes
Modellprojekts Einkommenssicherung durch Dorftourismus. Endbericht(VeröffentlichungalsSonderheftinderLandbauforschunginVorbereitung)
OECD (2002)Glossaryof statistical terms [online].Zufinden in<http://stats.oecd.org/glossary/index.htm>[zitiertam08.06.2011]

S. Neumeier, K. Pollermann / Landbauforschung - vTI Agriculture and Forestry Research 3 2011 (61)161-174 173
OppermannM (1996)Rural tourism in southernGermany.AnnTourismRes23(1):86-102
PeterH,PollermannK(2010)Kapitel12;ILEundLEADER;In:InstitutfürLänd-licheRäume(ed)HalbzeitbewertungdesEPLRMecklenburg-VorpommernimRahmender7-Länder-Bewertung:Bd2.Braunschweig:vTI,p142
PikeA,Rodriguez-PoseA,TomaneyJ(2007)Whatkindoflocalandregionaldevelopmentandforwhom.RegionalStudies41(9):1253-1269
PollermannK(2004)PlanungsstrategienzurUmsetzungvonintegriertenUm-weltschutzkonzeptenfürdieLandnutzungdurchTourismus,LandwirtschaftundNaturschutz:eineEvaluationderUmsetzungserfolgeinBeispielgebie-ten und dieAbleitung vonHandlungsempfehlungen zurGestaltung vonkooperativenPlanungsprozessen.Hannover:InstLandschaftspflegeNatur-schutz,341p,BeitrräumlPlanung77
PollermannK(2011)DestinationGovernanceausempirischerSicht:Analysevon tourismusbezogenen Governance-Arrangements und Schlussfolge-rungenfürdiePraxis. In:SaretzkiA,WöhlerKH(eds)DestinationGover-nance:neueAnsätzederSteuerungvonTourismusdestinationen.Berlin:Schmidt
SchemelHJ,LaßbergDvon,MeyerG,MeyerW,VielhaberA(2001)Kommu-nikationundUmweltimTourismus:empirischeGrundlagenundKonzept-bausteine für ein nachhaltiges Verbraucherverhalten im Urlaub. Berlin :Schmidt,199p,Berichte/Umweltbundesamt2001/2
SchererR(2005)AktuelleTrendsimTourismus:dieKonsequenzfürdieKultur-landschaft[online].Zufindenin<https://www.alexandria.unisg.ch/Publika-tionen/21023>[zitiertam09.06.2011]
Schramek J (2010)Halbzeitbewertung „Maßnahmen- und EntwicklungsplanLändlicherRaumBaden-Würtemberg2007-2013(MEPL II)“ [online].Zufinden in<http://www.landwirtschaft-mlr.baden-wuerttemberg.de/servlet/PB/show/1315018/Kapitel%201%20-%205.pdf>[zitiertam08.06.2011]
SchillingR(1997)KommunaleKonzeptefürdieEntwicklungvonLandtouris-mus :Modellvorhaben Einkommenssicherung durchDorftourismus.Wis-senschaftlDiskussionspapiere/BIBB27:64-68
Sharpley R, Roberts L (2004) Rural tourism : 10 years on. Int J Tourism Res6:119-124
SummersG,FieldD(2000)Ruraldevelopment:meaningandpracticeintheUnitedStates.In:MachlisGE,FieldDR(eds)Nationalparksandruraldevel-opment:practiceandpolicyintheUnitedStates.WashingtonDC:IslandPr,pp15-32
Terluin I (2003)Differences ineconomicdevelopment in rural regionsofad-vancedcountries:anoverviewandcriticalanalysisoftheories.JRuralStu-JRuralStu-dies19(3):327–344
WilsonS,FesenmaierR,FesenmaierJ,EsJvan(2001)Factorsforsuccessinruraltourismdevelopment.JTravelRes40(2):132-138

174
R. Plankl / Landbauforschung - vTI Agriculture and Forestry Research 3 2011 (61)175-188 175
Regionale Verteilung finanzieller Staatshilfen für den Agrarsektor – Sind die Nutznießer die ländlichen Räume?
ReinerPlankl*1
*1 Johann Heinrich von Thünen-Institut (vTI), Bundesforschungsinstitut fürLändlicheRäume,WaldundFischerei, Institut fürLändlicheRäume,Bun-desalle50,38116Braunschweig,Email:[email protected]
Zusammenfassung
DieregionaleVerteilungderfinanziellenStaatshilfenfürdenAgrarsektorstelltsichbezüglichderErfassungderPo-litikmaßnahmen, der Verfügbarkeit von ZeitreihendatensowieregionaldisaggregiertenDatenimmernochalssehrlückenhaftdar.DervorliegendeBeitragsollzumehrTrans-parenzbeitragen.DazuwirdderUmfangdervierbedeu-tendstenfinanziellenStaatshilfenfürdenAgrarsektor(1.+2.SäulederGAP,AgrardieselverbilligungundagrarsozialesSicherungssystem) zunächst hinsichtlich ihresMittelvolu-mens abgeschätzt. Darüber hinauswerden dieMittel inBeziehung zuweiteren raumwirksambedeutendenAus-gabengesetztundeswerdendieregionalenUnterschiedeinderFörderintensitätfürdiefinanziellenStaatshilfendesAgrarsektorsinsgesamtsowiefürdieMaßnahmender2.SäulederGAPbeschrieben.EszeigensichdeutlichhöhereFörderungenjeEinwohnerindenländlichenimVergleichzudennicht ländlichenRäumenmitUnterschiedenzwi-schen alten und neuen Bundesländern. Die Ergebnisseder formalen regionalen Inzidenz deuten auf eine nichtzuunterschätzendegesamtwirtschaftlicheBedeutungderAgrarhilfenfürdieländlichenRäumehin.FüreinegenaueAbschätzungsindu.a.auchdiesektoralenundregionalenVerflechtungendesAgrarsektorszuberücksichtigen.
Schlüsselwörter: Finanzielle Staatshilfen, regionale Vertei-lungsunterschiede, Förder intensität, Landwirtschaft
Summary
Regional distribution of state financial aids for the agricultural sector – Are the winners the rual areas?
The regional distribution of state financial aid for theagriculturalsectorremainsveryincompletewithregardtothedocumentationofthepolicymeasures,theavailabilityoftimeseriesaswellasregionaldisaggregateddata.Thisarticleintendstoincreasetransparency.Forthispurpose,thevolumeofthefourmostimportantfinancialstateaidsfor the agricultural sector (first and second pillar of theCAP;agriculturalfuelsubsidiesandtheagriculturalsocialsecuritysystem)willfirstbeestimated.Inaddition,thesefundswillbeplacedinthecontextofotherspatiallyrel-evantstateexpenses.Regionaldifferencesinthetotalfi-nancialsupportoftheagricultureaswellas inmeasuresof thesecondpillarof theCAParedescribed.Higherfi-nancialaidsper capitaare found in ruralasopposed tonon-ruralareaswithdifferencesbetweentheformerandnewGermanFederalStates.Theresultsoftheformalre-gionalincidenceseemstoindicatethattheagriculturalaidcontributessubstantiallytotheeconomicwealth inruralareas.Toestimatethetotalincreaseineconomicwealth,amongothersthesectoralandregionalintertwiningoftheagriculturalsectormustalsobeconsidered.
Keywords: financial assistance, spatial distribution of fi-nancial aids, promotion intensity, agricultural
176
1 Problemstellung
Über finanzielle Staatshilfen beeinflusst der Staat aufdirektem und indirektem Wege das wirtschaftliche Ge-schehen ineinerVolkswirtschaftundnimmtEinflussaufsektorale und regionalwirtschaftliche Entwicklungspro-zesse.Die Intensitätder Interventionistdabeimeistsehrunterschiedlich. Da der Agrarsektor als ein stark von fi-nanziellen Staatshilfen abhängiger Sektor gilt, lastet aufdemSektor einbesondereröffentlicherRechtfertigungs-druckbezüglichderVerwendungderihmgewährtenöf-fentlichenHilfen.Beider inWissenschaftundPolitikge-führtenkontroversenordnungspolitischenDiskussionumdieNotwendigkeitundZweckmäßigkeitdesUmfangsanfinanziellenStaatshilfensindZiel-undWirkungsanalysen,insbesondere regional differenzierte Inzidenzanalysen,sehr hilfreich, erfordern jedoch hohe Ansprüche an diemethodischeVorgehensweiseundandieempirischeDa-tengrundlage(Färber,2007).Das Bild der regionalen Verteilung der finanziellen
StaatshilfenfürdenAgrarsektoristtrotzeinigerjüngererUntersuchungen (Hansen, 2005; Harsche, 2009) nochsehrlückenhaft.ÜberfinanziellbedeutendeBereichederAgrarpolitik,angefangenbeidenMaßnahmender„Ge-meinschaftsaufgabe zur Verbesserung der AgrarstrukturunddesKüstenschutzes“(GAK)bishinzudenverschie-denenFlächen-undTierprämien,denBundeszuschüssenüberdasagrarsozialeSicherungssystemunddieVerwen-dung der Agrardieselvergünstigungen, ist meist nur dieVerwendung derMittel bis auf die regionale Ebene derBundesländer bekannt. In jüngsten Untersuchungen zurregionalen Inzidenz von raumwirksamen Maßnahmenwerden dieAgrarfördermittelmeist nur nachrangig undnicht mit der notwendigen regionalen Differenziertheitdargestellt(Färber,2007;Mäding,2009)oderdasAusmaßder regionalen Verteilungsunterschiede beschränkt sichaufausgewähltefinanzielleStaatshilfendesAgrarsektorsfüreinBundeslandalsBeispielregion(Harsche,2009;Fär-ber,2007).MitderOffenlegungderunternehmensbezo-genenEU-Direktzahlungender1.SäulederGemeinsamenAgrarpolitik (GAP), denDaten aus demMonitoring undden Bewertungsberichten der 2. Säule-Maßnahmen derGAPwurde fürbedeutendeTeilederfinanziellenStaats-hilfen des Agrarsektors inzwischen ein wichtiger Schrittin Richtung mehr Transparenz bezüglich der regionalenVerteilung vollzogen.Damitwirdes in Zukunftmöglich,die Darstellung und Analyse der raumwirksamenMittelundderenBedeutungfürdiewirtschaftlicheEntwicklungumwesentlicheTeilederfinanziellenStaatshilfenfürdenAgrarsektorzuvervollständigen.DerfolgendeBeitragnimmtdiefinanziellenStaatshilfen
fürdenAgrarsektorindenFokusundwilldurcheinere-trospektiveBeschreibungderregionalenVerteilungdieser
MittelfürmehrTransparenzsorgen.UmeineVorstellungvomUmfangundvonderrelativenBedeutungderfinan-ziellenStaatshilfendesAgrarsektorszubekommen,wirdzunächstdasAusgabevolumenfürDeutschlandinsgesamtquantifiziert und die relative Bedeutung der finanziellenStaatshilfendesAgrarsektorszuweiterenraumwirksamenFinanzhilfen abgeschätzt. Im Zentrum stehen die viergroßenAusgabenbereichederAgrarpolitik:dieausdemEuropäischenGarantiefondsfürLandwirtschaft(EGFL)ge-währtenDirektzahlungen der 1. Säule derGAP, die ausden Mitteln des Europäischen Landwirtschaftsfonds fürdie Entwicklung des ländlichen Raumes (ELER) und denBundes- und Landesmitteln finanzierten Maßnahmender 2. Säule der GAP, die im Bundeshaushalt verbuch-tenAusgabenfürAgrardieselverbilligungsowiedieBun-deszuschüsse für das agrarsoziale Sicherungssystem. AlsUntersuchungszeitraumwurdendieJahre1995bis2008gewählt.Die regionalenVerteilungsunterschiedewerden fürdie
vier finanziellen Staatshilfen des Agrarsektors insgesamtsowie für die Ausgaben der Maßnahmen zur Entwick-lung der ländlichen Räume (2. Säule der GAP) mithilfevon Karten auf der Ebene der Landkreise beschriebenundeswerdendieUnterschiedezwischendenverschie-denen ländlichen und nicht ländlichen Kreisen im Sinneder siedlungsstrukturellen Kreistypen des BundesamtesfürBauwesenundRaumordnung (BBR,2008) indenal-tenundneuenBundesländernanalysiert.AufderEbenederländlichenundnichtländlichenKreisewirdzudemdierelativeBedeutungdereinzelnenfinanziellenStaatshilfendesAgrarsektorsbeschrieben.DaindemBeitragnichtdieflächen-bzw.betriebsbezogeneAgrarförderintensitätUn-tersuchungsgegenstand ist1,
1 ZursektoralenBedeutungderfinanziellenStaatshilfenvgl.Plankl(2011).
sonderndieAgrarförderunghinsichtlichihrerBedeutungfürdieregionaleundräumlichwirtschaftlicheEntwicklungbeschriebenwerdensoll,wer-den die finanziellen Staatshilfen auf die Einwohner nor-miert.DurchdieNormierungwirdesauchmöglich,einenVergleich mit anderen raumwirksamen Förderbereichendurchzuführen. In einem abschließenden Resümee wirdaufeinigeAspektederBedeutungderAgrarförderungfürdieländlichenRäumeeingegangen.
2 Finanzielle Staatshilfen für den Agrarsektor
Durch finanzielle Staatshilfen in Form von Subventi-onen, Steuervergünstigungen und Beiträgen für sozialeLeistungenfließendemAgrarsektordirekteundindirekteEinkommenstransferszu,durchwelchenichtnurdieEin-kommenslage und soziale Lage der Landwirte, ihrer Fa-milienangehörigenundderimAgrarsektorBeschäftigten
R. Plankl / Landbauforschung - vTI Agriculture and Forestry Research 3 2011 (61)175-188 177
unmittelbar verbessert werden, sondern vielmehr kannesdurcheine vermehrteKonsum-und Investitionsgüter-nachfragejenachregionalerbzw.überregionalerVerwen-dungderEinnahmenzuAusstrahlungseffektenaufandereBranchensowieaufdieinderRegionlebendenMenschenkommen.DieEffekteaufdieregionalewirtschaftlicheEnt-wicklungsinddabeisehrvielfältigundhängenu.a.vonder regionaleneffektiven Inzidenzder einzelnenfinanzi-ellen Staatshilfen ab. DieMessung der effektiven regio-nalenWirkungen stellt hohe Ansprüche an die Metho-de und an dasDatenmaterial.DieUntersuchung erhebtnichtdenAnspruch,dieeffektivenWirkungenzumessen,sonderneswirdeineausführliche,regionaldifferenzierteDarstellungderfinanziellenStaatshilfendesAgrarsektorsvorgenommen.DerBegriffderfinanziellenStaatshilfendesAgrarsektors
wirdinderLiteraturnichteinheitlichdefiniert.2
2 ZumBegriffderfinanziellenStaatshilfenfürdenAgrarsektorundderhisto-ZumBegriffderfinanziellenStaatshilfenfürdenAgrarsektorundderhisto-rischgewachsenenBedeutungvgl.Hansmeyer(1963).
Orientiertman sich bei der Ermittlung an der landwirtschaftlichenGesamtrechnung(LGR),dannsetzensichdiedortalsSub-ventionenbezeichnetenfinanziellenStaatshilfenausdenProduktsubventionen(FlächenzahlungenundTierprämien(ab2005Betriebsprämien))unddenSonstigenSubventi-onen (Ausgleichszulage, Investitionsbeihilfen, Agrarum-weltmaßnahmen, Agrardieselerstattung) zusammen. Für2006betragendieSubventionenfürdenengerenSektorLandwirtschaft(ohnedieBereicheForstundFischerei)rd.6,4Mrd.Euro(BMELV,2007a).DerSubventionsbegriffderLGR ist im Vergleich zu anderen Definitionen eher engabgegrenzt. So werden öffentliche Hilfen für die Land-wirtschafti.S.vonstaatlichenAusgabenfürdieAgrarso-zialpolitik,vergleichbarzudenstaatlichenAufwendungenfüranderesozialeSicherungssysteme inderallgemeinenvolkswirtschaftlichen Gesamtrechnung (VGR), nicht alsSubventionen definiert.Dadurch bleiben rund. 3,8Mrd.Eurounberücksichtigt.GreiftmanfürdieErfassungderfinanziellenStaatshilfen
des Agrarsektors auf die Daten des 21. Subventionsbe-richtsderBundesregierungzurück(BMF,2008),soerrech-net sich für das entsprechende Jahr 2006 ein Gesamt-subventionsvolumeninHöhevon9,57Mrd.Euro.HierinenthaltensinddieFinanzhilfendesBundes,dieSteuerver-günstigungen des Bundes und der Länder sowie die imSubventionsberichtnachrangigausgewiesenenFinanzhil-fender Länderunddie EU-Marktordnungsausgaben. ImSubventionsbericht werden auch die Fördermaßnahmender GAK berücksichtigt; allerdings werden jene GAK-Fördermaßnahmen,diederAllgemeinheitzugutekommenwie Dorferneuerung, Küstenschutz und die Hälfte derwasserwirtschaftlichenMaßnahmen,nichtalsFinanzhilfen
für die Landwirtschaft eingestuft. Da die außerhalb derGAK-Maßnahmen angebotenen Fördermaßnahmen zurEntwicklung des ländlichen Raums (2. Säule-Zahlungen)fehlen,kommteszueiner leichtenUnterschätzung.An-dererseits werden im Subventionsbericht die AusgabendesBundesfürdieLandwirtschaftlicheUnfallversicherung(LUV) und die Steuervergünstigungen als Subventionenerfasst.ZueineranderenSummeanfinanziellenStaatshilfenfür
denSektorLandwirtschaft,ForstenundFischereikommtderalternativeSubventionsberichtdesKieler Instituts fürWeltwirtschaft (Boss und Rosenschon, 2008). Für 2007werdendortangesamtenSubventionenfürdenAgrarsek-tor10,74Mrd.Euroausgewiesen;10,12Mrd.Euroentfal-lenaufdieöffentlichenFinanzhilfenund0,62Mrd.EuroaufSteuervergünstigungen.ZueinemvergleichbarenNi-veaukommtderRaumordnungsberichtderBundesregie-rung.FürdieFörderperiode1999bis2003weistdiesereinjahresdurchschnittliches Mittelvolumen für MaßnahmenderAgrarpolitikinHöhevon10,55Mrd.Euroaus;dabeisinddieAusgabendesBundesfürdasagrarsozialeSiche-rungssystem,nichtjedochdieSteuervergünstigungen,be-rücksichtigt(BBR,2005).Eigenen Berechnungen zufolge liegen die finanziellen
Staatshilfen für den Agrarsektor aus EU-, Bundes- undLandesmittel bei Berücksichtigung der Maßnahmen der2.SäulederGAP(einschließlichArtikel-89-Maßnahmen),den Bundeszuschüssen für das gesamte agrarsoziale Si-cherungssystem,denEGFL-DirektzahlungenunddenSon-stigenEGFL-ZahlungenderGAPsowiedenAusgabenfürAgrardieselverbilligungimJahresdurchschnittfürdenUn-tersuchungszeitraum1995bis2008bei11,7Mrd.Euro.DienichtimmerstringenteZurechnungvonEU-,Bundes-undLandesmittelnsowiedieunterschiedlicheBerücksich-tigungderMaßnahmenderGAKunddes agrarsozialenSicherungssystemssindnebenderunterschiedlichenAb-grenzungdesPrimärsektorsdieHauptgründefürdieVa-rianzindenfinanziellenStaatshilfenfürdenAgrarsektor.FürdieregionalwirtschaftlicheEntwicklungbemisstsich
dieBedeutungderfinanziellenStaatshilfenfürdieLand-wirtschaft nicht ausschließlich an ihrer absoluten Höhe,sondernvielmehrauchamrelativenBeitrag imVergleichzuanderensektoralenundregionalenraumwirksamenFi-nanzmitteln.AuchhieristdieAbgrenzungundstatistischeErfassung der raumwirksamen Finanzmittel von Bedeu-tung.BeieineminDeutschlandgeschätztenjahresdurch-schnittlichen Gesamtvolumen an regionalwirtschaftlichbedeutenden finanziellen Staatshilfen inHöhe von rund87Mrd.Euro imUntersuchungszeitraum1995bis2008machendieMitteldesAgrarsektorsrund13,5%aus(vgl.
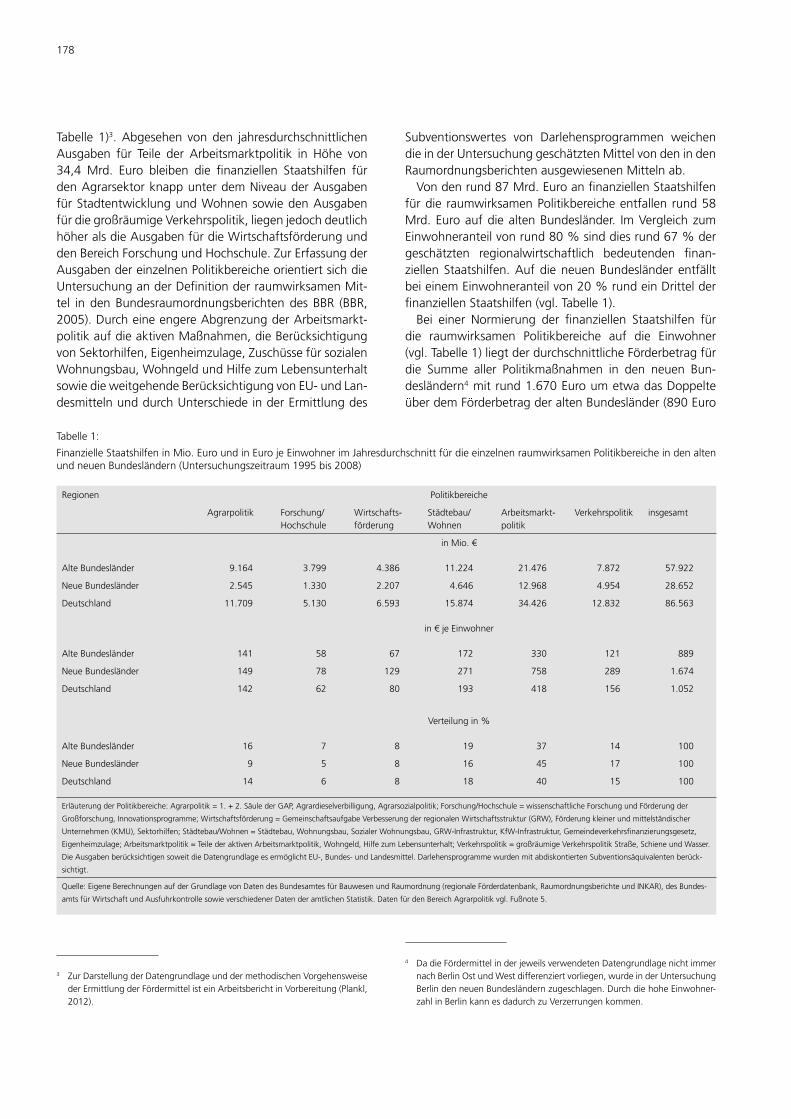
178
Tabelle 1)3.Abgesehen vonden jahresdurchschnittlichenAusgaben für Teile der Arbeitsmarktpolitik in Höhe von34,4 Mrd. Euro bleiben die finanziellen Staatshilfen fürdenAgrarsektorknappunterdemNiveauderAusgabenfürStadtentwicklungundWohnensowiedenAusgabenfürdiegroßräumigeVerkehrspolitik,liegenjedochdeutlichhöheralsdieAusgabenfürdieWirtschaftsförderungunddenBereichForschungundHochschule.ZurErfassungderAusgabendereinzelnenPolitikbereicheorientiertsichdieUntersuchunganderDefinitionderraumwirksamenMit-tel indenBundesraumordnungsberichtendesBBR (BBR,2005).DurcheineengereAbgrenzungderArbeitsmarkt-politikaufdieaktivenMaßnahmen,dieBerücksichtigungvonSektorhilfen,Eigenheimzulage,ZuschüssefürsozialenWohnungsbau,WohngeldundHilfezumLebensunterhaltsowiedieweitgehendeBerücksichtigungvonEU-undLan-desmittelnunddurchUnterschiedeinderErmittlungdes
3 ZurDarstellungderDatengrundlageunddermethodischenVorgehensweisederErmittlungderFördermittelisteinArbeitsberichtinVorbereitung(Plankl,2012).
Subventionswertes von Darlehensprogrammen weichendieinderUntersuchunggeschätztenMittelvondenindenRaumordnungsberichtenausgewiesenenMittelnab.Vondenrund87Mrd.EuroanfinanziellenStaatshilfen
fürdie raumwirksamenPolitikbereicheentfallenrund58Mrd.EuroaufdiealtenBundesländer. ImVergleichzumEinwohneranteilvonrund80%sinddiesrund67%dergeschätzten regionalwirtschaftlich bedeutenden finan-ziellenStaatshilfen.AufdieneuenBundesländer entfälltbeieinemEinwohneranteilvon20%rundeinDrittelderfinanziellenStaatshilfen(vgl.Tabelle1).Bei einer Normierung der finanziellen Staatshilfen für
die raumwirksamen Politikbereiche auf die Einwohner(vgl.Tabelle1)liegtderdurchschnittlicheFörderbetragfürdie Summe aller Politikmaßnahmen in den neuen Bun-desländern4mitrund1.670EuroumetwadasDoppelteüberdemFörderbetragderaltenBundesländer(890Euro
4 DadieFördermittelinderjeweilsverwendetenDatengrundlagenichtimmernachBerlinOstundWestdifferenziertvorliegen,wurdeinderUntersuchungBerlindenneuenBundesländernzugeschlagen.DurchdiehoheEinwohner-zahlinBerlinkannesdadurchzuVerzerrungenkommen.
Tabelle1:
FinanzielleStaatshilfeninMio.EuroundinEurojeEinwohnerimJahresdurchschnittfürdieeinzelnenraumwirksamenPolitikbereicheindenaltenundneuenBundesländern(Untersuchungszeitraum1995bis2008)
Regionen Politikbereiche
Agrarpolitik Forschung/Hochschule
Wirtschafts-förderung
Städtebau/Wohnen
Arbeitsmarkt-politik
Verkehrspolitik insgesamt
inMio.€
AlteBundesländer 9.164 3.799 4.386 11.224 21.476 7.872 57.922
NeueBundesländer 2.545 1.330 2.207 4.646 12.968 4.954 28.652
Deutschland 11.709 5.130 6.593 15.874 34.426 12.832 86.563
in€jeEinwohner
AlteBundesländer 141 58 67 172 330 121 889
NeueBundesländer 149 78 129 271 758 289 1.674
Deutschland 142 62 80 193 418 156 1.052
Verteilungin%
AlteBundesländer 16 7 8 19 37 14 100
NeueBundesländer 9 5 8 16 45 17 100
Deutschland 14 6 8 18 40 15 100
ErläuterungderPolitikbereiche:Agrarpolitik=1.+2.SäulederGAP,Agrardieselverbilligung,Agrarsozialpolitik;Forschung/Hochschule=wissenschaftlicheForschungundFörderungder
Großforschung,Innovationsprogramme;Wirtschaftsförderung=GemeinschaftsaufgabeVerbesserungderregionalenWirtschaftsstruktur(GRW),Förderungkleinerundmittelständischer
Unternehmen(KMU),Sektorhilfen;Städtebau/Wohnen=Städtebau,Wohnungsbau,SozialerWohnungsbau,GRW-Infrastruktur,KfW-Infrastruktur,Gemeindeverkehrsfinanzierungsgesetz,
Eigenheimzulage;Arbeitsmarktpolitik=TeilederaktivenArbeitsmarktpolitik,Wohngeld,HilfezumLebensunterhalt;Verkehrspolitik=großräumigeVerkehrspolitikStraße,SchieneundWasser.
DieAusgabenberücksichtigensoweitdieDatengrundlageesermöglichtEU-,Bundes-undLandesmittel.DarlehensprogrammewurdenmitabdiskontiertenSubventionsäquivalentenberück-
sichtigt.
Quelle:EigeneBerechnungenaufderGrundlagevonDatendesBundesamtesfürBauwesenundRaumordnung(regionaleFörderdatenbank,RaumordnungsberichteundINKAR),desBundes-
amtsfürWirtschaftundAusfuhrkontrollesowieverschiedenerDatenderamtlichenStatistik.DatenfürdenBereichAgrarpolitikvgl.Fußnote5.
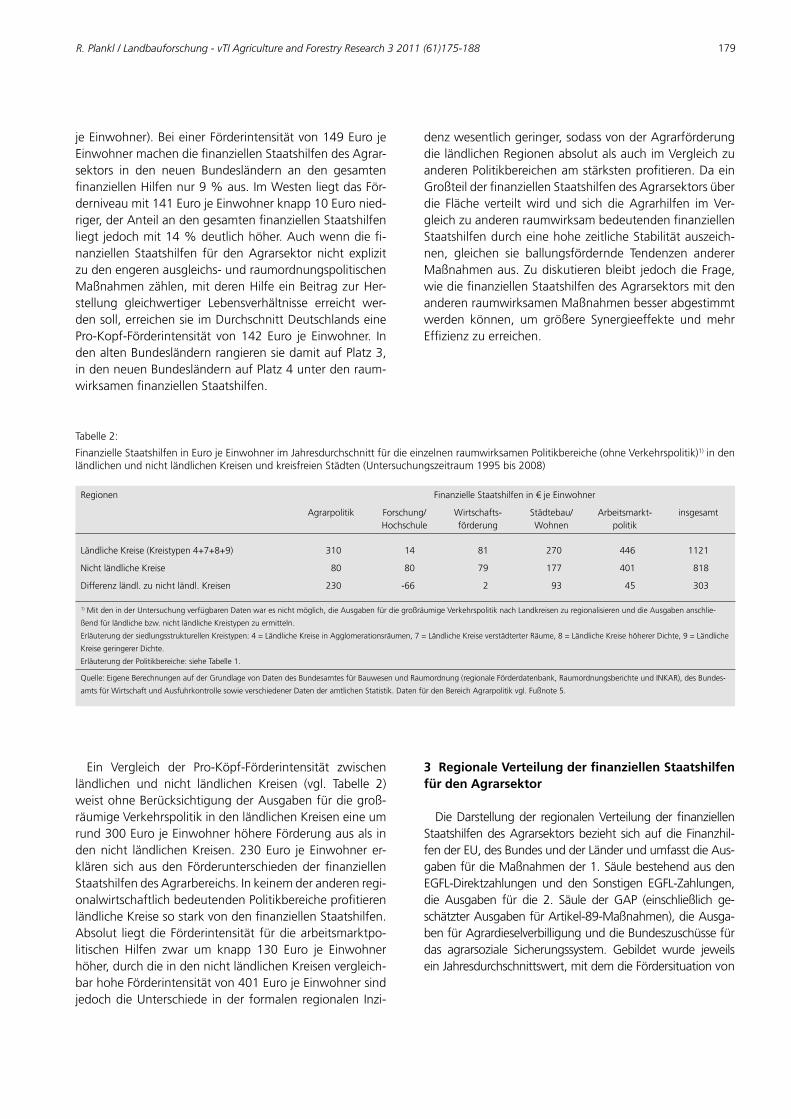
R. Plankl / Landbauforschung - vTI Agriculture and Forestry Research 3 2011 (61)175-188 179
jeEinwohner).BeieinerFörderintensitätvon149EurojeEinwohnermachendiefinanziellenStaatshilfendesAgrar-sektors in den neuen Bundesländern an den gesamtenfinanziellenHilfennur9%aus.ImWestenliegtdasFör-derniveaumit141EurojeEinwohnerknapp10Euronied-riger,derAnteilandengesamtenfinanziellenStaatshilfenliegtjedochmit14%deutlichhöher.Auchwenndiefi-nanziellen Staatshilfen für denAgrarsektor nicht explizitzudenengerenausgleichs-undraumordnungspolitischenMaßnahmenzählen,mitderenHilfeeinBeitragzurHer-stellung gleichwertiger Lebensverhältnisse erreicht wer-densoll,erreichensieimDurchschnittDeutschlandseinePro-Kopf-Förderintensität von142Euro je Einwohner. IndenaltenBundesländernrangierensiedamitaufPlatz3,indenneuenBundesländernaufPlatz4unterdenraum-wirksamenfinanziellenStaatshilfen.
Tabelle2:
FinanzielleStaatshilfeninEurojeEinwohnerimJahresdurchschnittfürdieeinzelnenraumwirksamenPolitikbereiche(ohneVerkehrspolitik)1)indenländlichenundnichtländlichenKreisenundkreisfreienStädten(Untersuchungszeitraum1995bis2008)
Regionen FinanzielleStaatshilfenin€jeEinwohner
Agrarpolitik Forschung/Hochschule
Wirtschafts-förderung
Städtebau/Wohnen
Arbeitsmarkt-politik
insgesamt
LändlicheKreise(Kreistypen4+7+8+9) 310 14 81 270 446 1121
NichtländlicheKreise 80 80 79 177 401 818
Differenzländl.zunichtländl.Kreisen 230 -66 2 93 45 303
1)MitdeninderUntersuchungverfügbarenDatenwaresnichtmöglich,dieAusgabenfürdiegroßräumigeVerkehrspolitiknachLandkreisenzuregionalisierenunddieAusgabenanschlie-
ßendfürländlichebzw.nichtländlicheKreistypenzuermitteln.
ErläuterungdersiedlungsstrukturellenKreistypen:4=LändlicheKreiseinAgglomerationsräumen,7=LändlicheKreiseverstädterterRäume,8=LändlicheKreisehöhererDichte,9=Ländliche
KreisegeringererDichte.
ErläuterungderPolitikbereiche:sieheTabelle1.
Quelle:EigeneBerechnungenaufderGrundlagevonDatendesBundesamtesfürBauwesenundRaumordnung(regionaleFörderdatenbank,RaumordnungsberichteundINKAR),desBundes-
amtsfürWirtschaftundAusfuhrkontrollesowieverschiedenerDatenderamtlichenStatistik.DatenfürdenBereichAgrarpolitikvgl.Fußnote5.
Ein Vergleich der Pro-Köpf-Förderintensität zwischenländlichen und nicht ländlichen Kreisen (vgl. Tabelle 2)weistohneBerücksichtigungderAusgabenfürdiegroß-räumigeVerkehrspolitikindenländlichenKreiseneineumrund300EurojeEinwohnerhöhereFörderungausalsindennicht ländlichenKreisen.230Euro jeEinwohnerer-klären sichausden FörderunterschiedenderfinanziellenStaatshilfendesAgrarbereichs.Inkeinemderanderenregi-onalwirtschaftlichbedeutendenPolitikbereicheprofitierenländlicheKreisesostarkvondenfinanziellenStaatshilfen.Absolut liegtdieFörderintensität fürdiearbeitsmarktpo-litischen Hilfen zwar um knapp 130 Euro je Einwohnerhöher,durchdieindennichtländlichenKreisenvergleich-barhoheFörderintensitätvon401EurojeEinwohnersindjedochdieUnterschiede inder formalenregionalen Inzi-
denzwesentlichgeringer,sodassvonderAgrarförderungdieländlichenRegionenabsolutalsauchimVergleichzuanderenPolitikbereichenamstärkstenprofitieren.DaeinGroßteilderfinanziellenStaatshilfendesAgrarsektorsüberdie Fläche verteiltwird und sich dieAgrarhilfen imVer-gleichzuanderenraumwirksambedeutendenfinanziellenStaatshilfendurcheinehohezeitlicheStabilitätauszeich-nen, gleichen sie ballungsfördernde Tendenzen andererMaßnahmenaus.Zudiskutierenbleibt jedochdieFrage,wiediefinanziellenStaatshilfendesAgrarsektorsmitdenanderenraumwirksamenMaßnahmenbesserabgestimmtwerden können, um größere Synergieeffekte undmehrEffizienzzuerreichen.
3 Regionale Verteilung der finanziellen Staatshilfen für den Agrarsektor
DieDarstellungder regionalenVerteilungderfinanziellenStaatshilfendesAgrarsektorsbezieht sichaufdieFinanzhil-fenderEU,desBundesundderLänderundumfasstdieAus-gabenfürdieMaßnahmender1.SäulebestehendausdenEGFL-Direktzahlungen und den Sonstigen EGFL-Zahlungen,die Ausgaben für die 2. Säule der GAP (einschließlich ge-schätzterAusgabenfürArtikel-89-Maßnahmen),dieAusga-benfürAgrardieselverbilligungunddieBundeszuschüssefürdas agrarsoziale Sicherungssystem. Gebildet wurde jeweilseinJahresdurchschnittswert,mitdemdieFördersituationvon
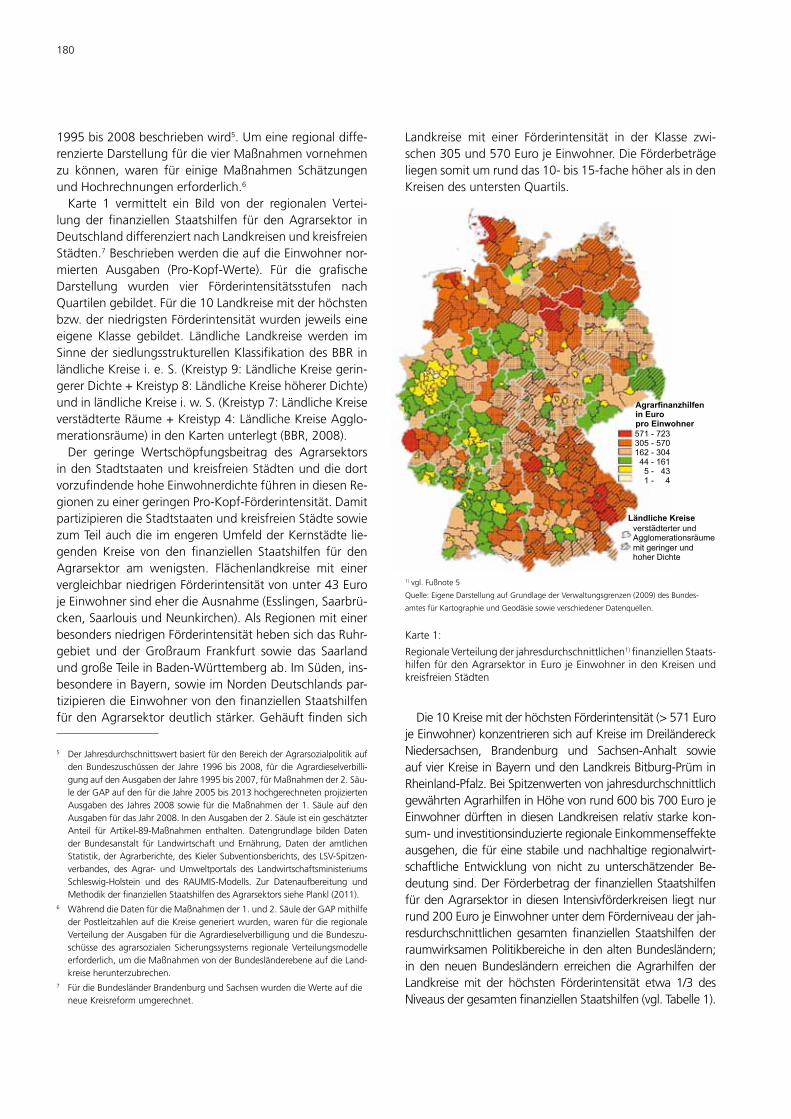
180
1995bis2008beschriebenwird5.
5 DerJahresdurchschnittswertbasiertfürdenBereichderAgrarsozialpolitikaufdenBundeszuschüssender Jahre1996bis2008, fürdieAgrardieselverbilli-gungaufdenAusgabenderJahre1995bis2007,fürMaßnahmender2.Säu-lederGAPaufdenfürdieJahre2005bis2013hochgerechnetenprojiziertenAusgabendesJahres2008sowiefürdieMaßnahmender1.SäuleaufdenAusgabenfürdasJahr2008.IndenAusgabender2.SäuleisteingeschätzterAnteil für Artikel-89-Maßnahmen enthalten. Datengrundlage bilden Datender Bundesanstalt für Landwirtschaft und Ernährung, Daten der amtlichenStatistik,derAgrarberichte,desKielerSubventionsberichts,desLSV-Spitzen-verbandes, des Agrar- und Umweltportals des LandwirtschaftsministeriumsSchleswig-Holstein und des RAUMIS-Modells. Zur Datenaufbereitung undMethodikderfinanziellenStaatshilfendesAgrarsektorssiehePlankl(2011).
Umeineregionaldiffe-renzierteDarstellungfürdievierMaßnahmenvornehmenzu können, waren für einigeMaßnahmen SchätzungenundHochrechnungenerforderlich.6
6 WährenddieDatenfürdieMaßnahmender1.und2.SäulederGAPmithilfederPostleitzahlenaufdieKreisegeneriertwurden,warenfürdieregionaleVerteilungderAusgabenfürdieAgrardieselverbilligungunddieBundeszu-schüssedesagrarsozialenSicherungssystems regionaleVerteilungsmodelleerforderlich,umdieMaßnahmenvonderBundesländerebeneaufdieLand-kreiseherunterzubrechen.
Karte 1 vermittelt ein Bild von der regionalen Vertei-lungder finanziellen Staatshilfen für denAgrarsektor inDeutschlanddifferenziertnachLandkreisenundkreisfreienStädten.7
7 FürdieBundesländerBrandenburgundSachsenwurdendieWerteaufdieneueKreisreformumgerechnet.
BeschriebenwerdendieaufdieEinwohnernor-mierten Ausgaben (Pro-Kopf-Werte). Für die grafischeDarstellung wurden vier Förderintensitätsstufen nachQuartilengebildet.Fürdie10Landkreisemitderhöchstenbzw.derniedrigstenFörderintensitätwurdenjeweilseineeigene Klasse gebildet. Ländliche Landkreise werden imSinnedersiedlungsstrukturellenKlassifikationdesBBRinländlicheKreisei.e.S.(Kreistyp9:LändlicheKreisegerin-gererDichte+Kreistyp8:LändlicheKreisehöhererDichte)undinländlicheKreisei.w.S.(Kreistyp7:LändlicheKreiseverstädterteRäume+Kreistyp4:LändlicheKreiseAgglo-merationsräume)indenKartenunterlegt(BBR,2008).Der geringe Wertschöpfungsbeitrag des Agrarsektors
indenStadtstaatenundkreisfreienStädtenunddiedortvorzufindendehoheEinwohnerdichteführenindiesenRe-gionenzueinergeringenPro-Kopf-Förderintensität.DamitpartizipierendieStadtstaatenundkreisfreienStädtesowiezumTeilauchdieimengerenUmfeldderKernstädtelie-genden Kreise von den finanziellen Staatshilfen für denAgrarsektor am wenigsten. Flächenlandkreise mit einervergleichbarniedrigenFörderintensitätvonunter43EurojeEinwohnersindeherdieAusnahme(Esslingen,Saarbrü-cken,SaarlouisundNeunkirchen).AlsRegionenmiteinerbesondersniedrigenFörderintensitäthebensichdasRuhr-gebiet und der Großraum Frankfurt sowie das SaarlandundgroßeTeileinBaden-Württembergab.ImSüden,ins-besondereinBayern,sowieimNordenDeutschlandspar-tizipierendieEinwohnervondenfinanziellenStaatshilfenfürdenAgrarsektordeutlichstärker.Gehäuftfindensich
Landkreise mit einer Förderintensität in der Klasse zwi-schen305und570EurojeEinwohner.DieFörderbeträgeliegensomitumrunddas10-bis15-fachehöheralsindenKreisendesunterstenQuartils.
Agrarfinanzhilfenin Europro Einwohner571 - 723
305 - 570
162 - 304
44 - 161
5 - 43
1 - 4
verstädterter und
Agglomerationsräume
mit geringer und
hoher Dichte
Ländliche Kreise
1)vgl.Fußnote5
Quelle:EigeneDarstellungaufGrundlagederVerwaltungsgrenzen(2009)desBundes-
amtesfürKartographieundGeodäsiesowieverschiedenerDatenquellen.
Karte1:
RegionaleVerteilungderjahresdurchschnittlichen1)finanziellenStaats-hilfenfürdenAgrarsektorinEurojeEinwohnerindenKreisenundkreisfreienStädten
Die10KreisemitderhöchstenFörderintensität(>571EurojeEinwohner)konzentrierensichaufKreiseimDreiländereckNiedersachsen, Brandenburg und Sachsen-Anhalt sowieaufvierKreiseinBayernunddenLandkreisBitburg-PrüminRheinland-Pfalz.BeiSpitzenwertenvonjahresdurchschnittlichgewährtenAgrarhilfeninHöhevonrund600bis700EurojeEinwohnerdürften indiesenLandkreisenrelativstarkekon-sum-undinvestitionsinduzierteregionaleEinkommenseffekteausgehen,diefüreinestabileundnachhaltigeregionalwirt-schaftliche Entwicklung von nicht zu unterschätzender Be-deutungsind.DerFörderbetragderfinanziellenStaatshilfenfürdenAgrarsektorindiesenIntensivförderkreisenliegtnurrund200EurojeEinwohnerunterdemFörderniveauderjah-resdurchschnittlichengesamtenfinanziellen StaatshilfenderraumwirksamenPolitikbereicheindenaltenBundesländern;in den neuen Bundesländern erreichen die Agrarhilfen derLandkreisemit der höchsten Förderintensität etwa 1/3 desNiveausdergesamtenfinanziellenStaatshilfen(vgl.Tabelle1).
R. Plankl / Landbauforschung - vTI Agriculture and Forestry Research 3 2011 (61)175-188 181
Tabelle3:
Die20Landkreise(ohnekreisfreieStädteundohneKernstädte)mitdenhöchstenbzw.niedrigstenjahresdurchschnittlichen1)finanziellenStaatshilfenfürdenAgrarsektorinEurojeEinwohner
Name finanzielleStaatshilfenin€jeEinwohner“
Siedlungs-strukturellerKreistyp
Bundesland
LandkreisemitHöchstförderung
Lüchow-Dannenberg 723 9 NI
EifelkreisBitburg-Prüm 698 7 RP
Nordfriesland 698 9 SH
Prignitz 672 9 BB
Straubing-Bogen 644 8 BY
AltmarkkreisSalzwedel 601 9 ST
Rottal-Inn 592 9 BY
Neustadta.d.Aisch-BadW.
585 9 BY
Wittmund 581 7 Ni
Dingolfing-Landau 575 8 BY
Ostallgäu 549 8 BY
Cham 546 7 BY
Cloppenburg 539 7 NI
Ansbach 529 8 BY
Stendal 525 9 ST
Müritz 521 9 MV
Rotenburg(Wümme) 520 4 NI
Tirschenreuth 515 9 BY
Emsland 487 8 NI
Unterallgäu 480 7 BY
LandkreisemitNiedrigstförderung
Rhein-Sieg-Kreis 58 2 NW
Ludwigsburg 56 2 BW
Böblingen 55 2 BW
Saarpfalz-Kreis 55 2 SL
MärkischerKreis 49 2 NW
Rastatt 47 2 BW
Rhein-Erft-Kreis 47 2 NW
Aachen 47 2 NW
Groß-Gerau 46 2 HE
Saarlouis 45 2 SL
München 45 2 BY
Rhein-KreisNeuss 42 2 NW
Unna 41 2 NW
Hochtaunuskreis 41 2 HE
Rheinisch-BergischerKreis 34 2 NW
Recklinghausen 32 2 NW
Neunkirchen 32 2 SL
Esslingen 32 2 BW
Ennepe-Ruhr-Kreis 30 2 NW
Main-Taunus-Kreis 28 2 HE
1)VergleicheFußnote5.
ErläuterungdersiedlungsstrukturellenKreistypen:2=hochverdichteteKreise,4=Länd-
licheKreiseinAgglomerationsräumen,7=LändlicheKreiseverstädterterRäume,
8=LändlicheKreisehöhererDichte,9=LändlicheKreisegeringererDichte.
ErläuterungderAbkürzungen:BB=Brandenburg,BW=Baden-Württemberg,BY=
Bayern,HE=Hessen,MV=Mecklenburg-Vorpommern,NI=Niedersachsen,NW=
Nordrhein-Westfalen,RP=Rheinland-Pfalz,SH=Schleswig-Holstein,SL=Saarland,
ST=Sachsen-Anhalt.
Quelle:EigeneBerechnungen.
InTabelle3sinddie20Flächenlandkreisemitderhöch-sten bzw. der niedrigsten Pro-Kopf-Agrarförderung ge-genübergestellt. Bei den 20 Kreisenmit der niedrigstenFörderunghandeltessichausschließlichumhochverdich-teteKreise:neunKreiseausNordrhein-Westfalen,vierausBaden-Württemberg,abernureinLandkreisausBayern.BeidenförderintensivenLandkreisensindeszumVergleichneunKreiseausBayern.Dierestlichen11KreiseverteilensichaufsechsBundesländer,jeweilsdreineueunddreialteBundesländer.OhneAusnahmehandeltessichausschließ-lich um ländliche Kreise und bei den ländlichen KreisenüberwiegendieLändlichenKreisemithoherundgeringerDichte(Kreistypen8+9).VierIntensivförderkreise,Salzwe-del,Müritz,StendalundPrignitzkommenausdenneuenBundesländern.BeidenKreisenmitniedrigerFörderinten-sitätistkeinerausdenneuenBundesländernvertreten.Um die Unterschiede in der Förderintensität zwischen
ländlichen und nicht ländlichenKreisen deutlicher als inderKartendarstellungerkennenzukönnenundgleichzei-tig der Frage nachzugehen, ob die im ländlichen RaumlebendeBevölkerungstärkervondenfinanziellenStaats-hilfendesAgrarsektorsprofitiert,wurdeeinenachaltenundneuensowienachnördlichenundsüdlichenBundes-länderndifferenzierteAuswertungdurchgeführt (vgl.Ta-belle4)8.
8 NördlichealteBundesländer:Schleswig-Holstein,Niedersachsen,Hamburg,Bremen und Nordrhein-Westfalen; südliche alte Bundesländer: Hessen,Rheinland-Pfalz,Saarland,BayernundBaden-Württemberg.
Danachwirddeutlich,dasssowohlinderSum-me aller ländlichen Kreise der alten als auch der neuenBundesländerdieFörderintensitätdeutlichhöheristalsindennichtländlichenLandkreisen.IndenaltenBundeslän-dernliegtdieFörderintensitätetwaviermal,indenneuenBundesländernsogarfünfmalsohoch. IndenländlichenKreisen der alten Bundesländer ist die Förderintensitätknapp100EurojeEinwohnerhöheralsindenneuenBun-desländern.BeidennichtländlichenKreisenliegtderUn-terschiedbei30Euro.LändlicheKreisei.e.S.(Kreistypen8+9)weiseneinehöhereFörderintensitätaufalsdieländ-lichenKreisederAgglomerationsräumeundverstädtertenRäume (Kreistypen 4+7). DerUnterschied in der Förder-intensität fällt dabei in den alten Bundesländernmit 27EurojeEinwohnerimVergleichzu50EurojeEinwohnerindenneuenBundesländerndeutlichergeringeraus.DamitprofitierenindenneuenBundesländerndieEinwohnerderländlichenKreisei.e.S.relativstärkervondenfinanziellenStaatshilfendesAgrarsektors. InsgesamtentsprechendieErgebnisse den Erwartungen: Je ländlicher, desto höherdieFörderungproEinwohner.DergeringeAnteilannichtländlichenKreisenverhindert
in den neuen Bundesländern einen Nord-Süd-Vergleich.DerNord-Süd-VergleichindenaltenBundesländernzeigtfürdie ländlichenKreistypen8+9einNord-Süd-undfür
182
die ländlichenKreistypen4+7sowiedienicht ländlichenKreiseeinSüd-Nord-GefälleinderFörderintensität.Insge-samtmachendie Ergebnissedeutlich, dass esdurchdiestaatlichenFinanzhilfenfürdenAgrarsektorzueinerregi-onalenUmverteilungkommt,ausderdieEinwohnerderländlichenKreiseimDurchschnitteinengrößerenNutzenimSinnevonhöherenfinanziellenStaatshilfenziehen.IndenaltenBundesländern ist jedochzubeobachten,dassaucheinigenichtländlicheLandkreisefinanzielleStaatshil-fenproKopferzielen,diedasNiveauderländlichenKreiseerreichen(vgl.Karte1).InBayerntrifftdiesaufdenLand-kreisPfaffenhofen,inRheinland-PfalzaufdieKreiseSüd-licheWeinstrasseundAlzey-Worms,inSchleswig-HolsteinaufRendsburg-EckernfördeundinNiedersachsenaufdieLandkreise Friesland,Aurich, Ammerland, Vechta,Osna-brückundStadezu.LändlicheKreisemiteinervergleichs-weisegeringenFörderintensitätfindensichmitAusnahmevon Freudenstadt verstärkt indenneuenBundesländernBrandenburg, Sachsen und Thüringen. Die beiden Bun-desländer,Mecklenburg-VorpommernundBrandenburg,die ausschließlich über ländliche Kreise verfügen, unter-scheiden sich insofern, als Mecklenburg-Vorpommerneine vergleichsweise hohe undwenig differenzierte För-derintensitätausweist,während inBrandenburgdieFör-derintensität sehr stark zwischenden Landkreisen streutundmit Entfernung zumAgglomerationszentrum BerlintendenzielldieFörderintensitätzunimmt.Die nach ländlichen Regionen differenzierten Auswer-
tungen(vgl.Tabelle4)unterstreichendenbereitsausKar-te1gewonnenenEindruck,dassdieAgrarförderunginderSumme aller vier berücksichtigten Maßnahmenbereicheder im ländlichenRaum lebendenBevölkerung verstärktzugutekommt.AbgesehenvonderAusgleichszulagenför-derunginbenachteiligtenGebietenunddenMaßnahmen
Tabelle4:
Jahresdurchschnittliche1)finanzielleStaatshilfenfürdenAgrarsektorinEurojeEinwohnerinländlichenundnichtländlichenKreisenundkreisfreienStädtenderneuenundaltenBundesländer
Regionen FinanzielleStaatshilfenfürdenAgrarsektorin€jeEinwohner
LändlicheKreise NichtländlicheKreise insgesamt
Kreistypen8+9 Kreistypen4+7 insgesamt
AlteBundesländer-Nord 399 315 348 79 118
AlteBundesländer-Süd 344 341 342 91 161
AlteBundesländerinsgesamt 358 331 344 85 141
NeueBundesländerinsgesamt 276 226 250 55 149
Deutschlandinsgesamt 328 293 310 80 142
1)VergleicheFußnote5.
ErläuterungdersiedlungsstrukturellenKreistypen:sieheTabelle2.
Quelle:EigeneBerechnungen.
derSchwerpunkte3und4der2.SäulederGAP,beiwel-chenessicheinerseitsumeinegebietsspezifischeFörde-rung handelt und andererseits die Maßnahmen gezieltdemländlichenRaumzugeführtwerden,kommtesdurchdie auf die landwirtwirtschaftlich genutzte Fläche bzw.BetriebebezogenenAgrarfördermaßnahmensowiedurchdieimländlichenRaumgeringereEinwohnerdichtezuei-nerhöheren Förderintensität in ländlichgeprägtenRegi-onen.DaessichbeiderDarstellungderFörderintensitätumdieaufdieEinwohnerbezogeneFörderintensitäthan-delt, ist entsprechend dem Verbleib an regionalen Kon-sum- und Investitionsausgaben davon auszugehen, dassauchdieindiesenRäumenlebendenMenschenaußerhalbdesAgrarsektorsindirektvondenfinanziellenStaatshilfendesAgrarsektorsprofitieren.
4 Regionale Verteilung der Ausgaben für Maßnah-men der 2. Säule
Mitder2.SäulederGAPsollendieländlichenRegionenunter Berücksichtigung ihrer unterschiedlichen Entwick-lungspotenziale als Lebens- und Wirtschaftsräume er-haltenund entwickeltwerden.Dabei soll die Förderungzur Erreichunggleichwertiger Lebensverhältnisse inallenTeilenDeutschlandsmehr als bisher aufdie spezifischenregionalen Erfordernisse eingehen (BMELV, 2007b). Ge-mäßdieserZielsetzung richtet sichdiemit EU-,Bundes-und Landesmittel finanzierte Förderung der 2. Säule anländliche Regionen. Um die Ausrichtung der Politik zurEntwicklung ländlicherRäume inDeutschland insgesamtüberprüfen zu können, bedarf es einer für Deutschlandflächendeckenden und nach ländlichen und nicht länd-lichenLandkreisendifferenziertenSituationsbeschreibungderregionalenInanspruchnahmederFördermaßnahmen.
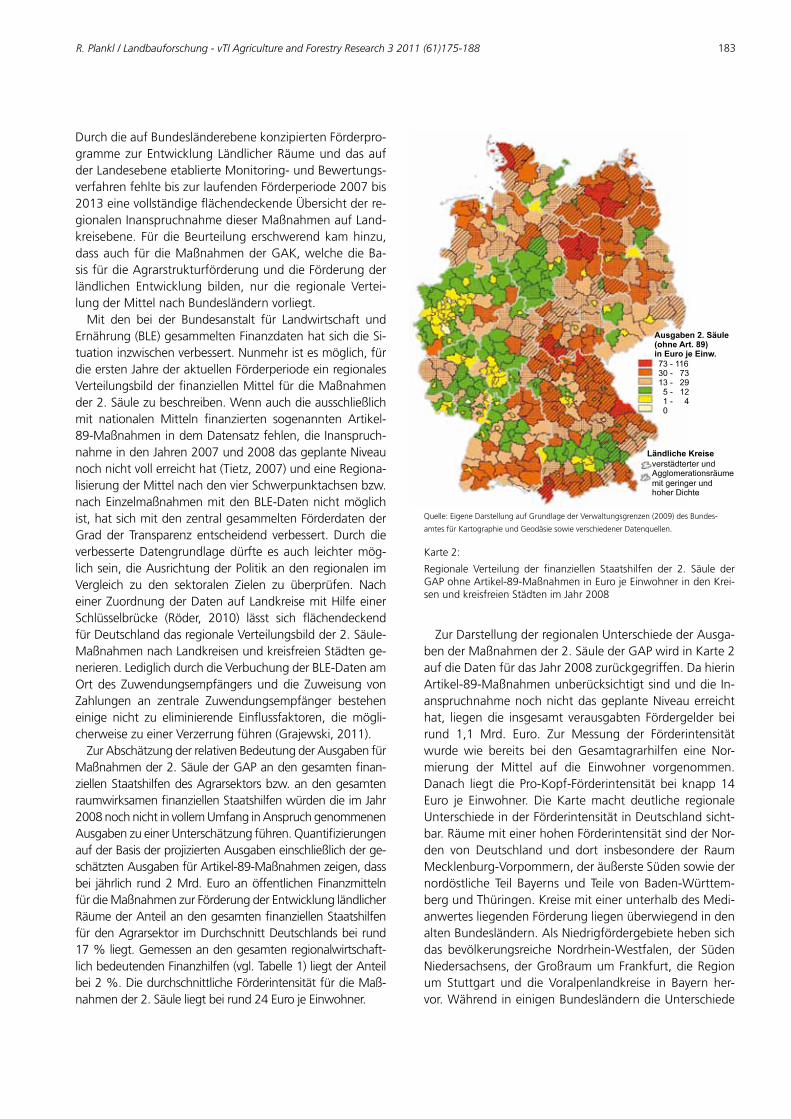
R. Plankl / Landbauforschung - vTI Agriculture and Forestry Research 3 2011 (61)175-188 183
DurchdieaufBundesländerebenekonzipiertenFörderpro-grammezurEntwicklungLändlicherRäumeunddasaufderLandesebeneetablierteMonitoring-undBewertungs-verfahrenfehltebiszurlaufendenFörderperiode2007bis2013einevollständigeflächendeckendeÜbersichtderre-gionalenInanspruchnahmedieserMaßnahmenaufLand-kreisebene. FürdieBeurteilungerschwerendkamhinzu,dassauchfürdieMaßnahmenderGAK,welchedieBa-sisfürdieAgrarstrukturförderungunddieFörderungderländlichen Entwicklung bilden, nur die regionale Vertei-lungderMittelnachBundesländernvorliegt.Mit den bei der Bundesanstalt für Landwirtschaft und
Ernährung(BLE)gesammeltenFinanzdatenhatsichdieSi-tuationinzwischenverbessert.Nunmehristesmöglich,fürdieerstenJahrederaktuellenFörderperiodeeinregionalesVerteilungsbildderfinanziellenMittelfürdieMaßnahmender2.Säulezubeschreiben.Wennauchdieausschließlichmit nationalen Mitteln finanzierten sogenannten Artikel-89-MaßnahmenindemDatensatzfehlen,dieInanspruch-nahmeindenJahren2007und2008dasgeplanteNiveaunochnichtvollerreichthat(Tietz,2007)undeineRegiona-lisierungderMittelnachdenvierSchwerpunktachsenbzw.nachEinzelmaßnahmenmitdenBLE-Datennichtmöglichist,hatsichmitdenzentralgesammeltenFörderdatenderGradder Transparenz entscheidend verbessert.DurchdieverbesserteDatengrundlagedürfte es auch leichtermög-lichsein,dieAusrichtungderPolitikandenregionalenimVergleich zu den sektoralen Zielen zu überprüfen. NacheinerZuordnungderDatenaufLandkreisemitHilfeeinerSchlüsselbrücke (Röder, 2010) lässt sich flächendeckendfürDeutschlanddasregionaleVerteilungsbildder2.Säule-MaßnahmennachLandkreisenundkreisfreienStädtenge-nerieren.LediglichdurchdieVerbuchungderBLE-DatenamOrt des Zuwendungsempfängers und die Zuweisung vonZahlungen an zentrale Zuwendungsempfänger besteheneinige nicht zu eliminierende Einflussfaktoren, diemögli-cherweisezueinerVerzerrungführen(Grajewski,2011).ZurAbschätzungderrelativenBedeutungderAusgabenfür
Maßnahmender2.SäulederGAPandengesamtenfinan-ziellenStaatshilfendesAgrarsektorsbzw.andengesamtenraumwirksamenfinanziellenStaatshilfenwürdendieimJahr2008nochnichtinvollemUmfanginAnspruchgenommenenAusgabenzueinerUnterschätzungführen.QuantifizierungenaufderBasisderprojiziertenAusgabeneinschließlichderge-schätztenAusgabenfürArtikel-89-Maßnahmenzeigen,dassbei jährlich rund2Mrd.EuroanöffentlichenFinanzmittelnfürdieMaßnahmenzurFörderungderEntwicklungländlicherRäumederAnteilandengesamtenfinanziellenStaatshilfenfürdenAgrarsektor imDurchschnittDeutschlandsbei rund17%liegt.Gemessenandengesamtenregionalwirtschaft-lichbedeutendenFinanzhilfen(vgl.Tabelle1)liegtderAnteilbei2%.DiedurchschnittlicheFörderintensitätfürdieMaß-nahmender2.Säuleliegtbeirund24EurojeEinwohner.
verstädterter und
Agglomerationsräume
mit geringer und
hoher Dichte
Ländliche Kreise
Ausgaben 2. Säule(ohne Art. 89)in Euro je Einw.73 - 116
30 - 73
13 - 29
5 - 12
1 - 4
0
Quelle:EigeneDarstellungaufGrundlagederVerwaltungsgrenzen(2009)desBundes-
amtesfürKartographieundGeodäsiesowieverschiedenerDatenquellen.
Karte2:
Regionale Verteilung der finanziellen Staatshilfen der 2. Säule derGAPohneArtikel-89-MaßnahmeninEurojeEinwohnerindenKrei-senundkreisfreienStädtenimJahr2008
ZurDarstellungderregionalenUnterschiedederAusga-benderMaßnahmender2.SäulederGAPwirdinKarte2aufdieDatenfürdasJahr2008zurückgegriffen.DahierinArtikel-89-MaßnahmenunberücksichtigtsindunddieIn-anspruchnahmenochnichtdasgeplanteNiveauerreichthat, liegendie insgesamt verausgabten Fördergelderbeirund 1,1 Mrd. Euro. Zur Messung der Förderintensitätwurde wie bereits bei den Gesamtagrarhilfen eine Nor-mierung der Mittel auf die Einwohner vorgenommen.Danach liegt die Pro-Kopf-Förderintensität bei knapp14Euro je Einwohner. Die Kartemacht deutliche regionaleUnterschiedeinderFörderintensitätinDeutschlandsicht-bar.RäumemiteinerhohenFörderintensitätsindderNor-den von Deutschland und dort insbesondere der RaumMecklenburg-Vorpommern,deräußersteSüdensowiedernordöstliche Teil Bayerns und Teile von Baden-Württem-bergundThüringen.KreisemiteinerunterhalbdesMedi-anwertesliegendenFörderungliegenüberwiegendindenaltenBundesländern.AlsNiedrigfördergebietehebensichdas bevölkerungsreiche Nordrhein-Westfalen, der SüdenNiedersachsens,derGroßraumumFrankfurt,dieRegionum Stuttgart und die Voralpenlandkreise in Bayern her-vor.WährendineinigenBundesländerndieUnterschiede
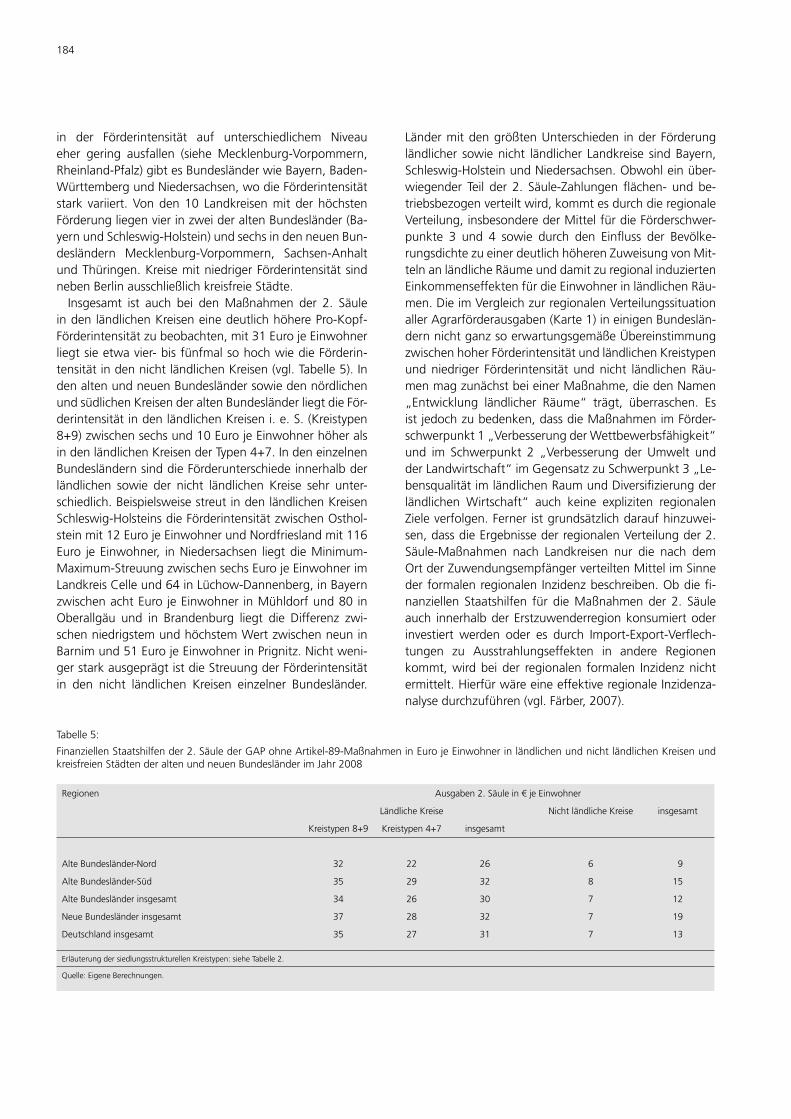
184
in der Förderintensität auf unterschiedlichem Niveaueher gering ausfallen (siehe Mecklenburg-Vorpommern,Rheinland-Pfalz)gibtesBundesländerwieBayern,Baden-WürttembergundNiedersachsen,wodieFörderintensitätstark variiert.Vonden10 Landkreisenmit derhöchstenFörderungliegenvierinzweideraltenBundesländer(Ba-yernundSchleswig-Holstein)undsechsindenneuenBun-desländern Mecklenburg-Vorpommern, Sachsen-AnhaltundThüringen.KreisemitniedrigerFörderintensitätsindnebenBerlinausschließlichkreisfreieStädte.Insgesamt ist auch bei denMaßnahmen der 2. Säule
indenländlichenKreiseneinedeutlichhöherePro-Kopf-Förderintensitätzubeobachten,mit31EurojeEinwohnerliegtsieetwavier-bisfünfmalsohochwiedieFörderin-tensitätindennichtländlichenKreisen(vgl.Tabelle5).IndenaltenundneuenBundesländersowiedennördlichenundsüdlichenKreisenderaltenBundesländerliegtdieFör-derintensitätindenländlichenKreiseni.e.S.(Kreistypen8+9)zwischensechsund10EurojeEinwohnerhöheralsindenländlichenKreisenderTypen4+7.IndeneinzelnenBundesländernsinddieFörderunterschiedeinnerhalbderländlichen sowie der nicht ländlichen Kreise sehr unter-schiedlich.BeispielsweisestreutindenländlichenKreisenSchleswig-HolsteinsdieFörderintensitätzwischenOsthol-steinmit12EurojeEinwohnerundNordfrieslandmit116Euro jeEinwohner, inNiedersachsen liegtdieMinimum-Maximum-StreuungzwischensechsEurojeEinwohnerimLandkreisCelleund64inLüchow-Dannenberg,inBayernzwischenachtEuro jeEinwohner inMühldorfund80 inOberallgäu und in Brandenburg liegt die Differenz zwi-schenniedrigstemundhöchstemWertzwischenneuninBarnimund51EurojeEinwohnerinPrignitz.Nichtweni-gerstarkausgeprägtistdieStreuungderFörderintensitätin den nicht ländlichen Kreisen einzelner Bundesländer.
LändermitdengrößtenUnterschieden inderFörderungländlicher sowienicht ländlicher Landkreise sindBayern,Schleswig-HolsteinundNiedersachsen.Obwohleinüber-wiegender Teil der 2. Säule-Zahlungenflächen- undbe-triebsbezogenverteiltwird,kommtesdurchdieregionaleVerteilung,insbesonderederMittelfürdieFörderschwer-punkte 3 und 4 sowie durch den Einfluss der Bevölke-rungsdichtezueinerdeutlichhöherenZuweisungvonMit-telnanländlicheRäumeunddamitzuregionalinduziertenEinkommenseffektenfürdieEinwohnerinländlichenRäu-men.DieimVergleichzurregionalenVerteilungssituationallerAgrarförderausgaben(Karte1)ineinigenBundeslän-dernnichtganzsoerwartungsgemäßeÜbereinstimmungzwischenhoherFörderintensitätundländlichenKreistypenundniedriger Förderintensität undnicht ländlichenRäu-menmagzunächstbeieinerMaßnahme,diedenNamen„Entwicklung ländlicher Räume“ trägt, überraschen. Esistjedochzubedenken,dassdieMaßnahmenimFörder-schwerpunkt1„VerbesserungderWettbewerbsfähigkeit“und im Schwerpunkt 2 „Verbesserung der Umwelt undderLandwirtschaft“imGegensatzzuSchwerpunkt3„Le-bensqualitätimländlichenRaumundDiversifizierungderländlichen Wirtschaft“ auch keine expliziten regionalenZieleverfolgen.Ferneristgrundsätzlichdaraufhinzuwei-sen,dassdieErgebnissederregionalenVerteilungder2.Säule-Maßnahmen nach Landkreisen nur die nach demOrtderZuwendungsempfängerverteiltenMittelimSinnederformalenregionalen Inzidenzbeschreiben.Obdiefi-nanziellen Staatshilfen für dieMaßnahmender 2. Säuleauch innerhalbderErstzuwenderregionkonsumiertoderinvestiert werden oder es durch Import-Export-Verflech-tungen zu Ausstrahlungseffekten in andere Regionenkommt,wirdbeider regionalen formalen Inzidenznichtermittelt.HierfürwäreeineeffektiveregionaleInzidenza-nalysedurchzuführen(vgl.Färber,2007).
Tabelle5:
FinanziellenStaatshilfender2.SäulederGAPohneArtikel-89-MaßnahmeninEurojeEinwohnerinländlichenundnichtländlichenKreisenundkreisfreienStädtenderaltenundneuenBundesländerimJahr2008
Regionen Ausgaben2.Säulein€jeEinwohner
LändlicheKreise NichtländlicheKreise insgesamt
Kreistypen8+9 Kreistypen4+7 insgesamt
AlteBundesländer-Nord 32 22 26 6 9
AlteBundesländer-Süd 35 29 32 8 15
AlteBundesländerinsgesamt 34 26 30 7 12
NeueBundesländerinsgesamt 37 28 32 7 19
Deutschlandinsgesamt 35 27 31 7 13
ErläuterungdersiedlungsstrukturellenKreistypen:sieheTabelle2.
Quelle:EigeneBerechnungen.
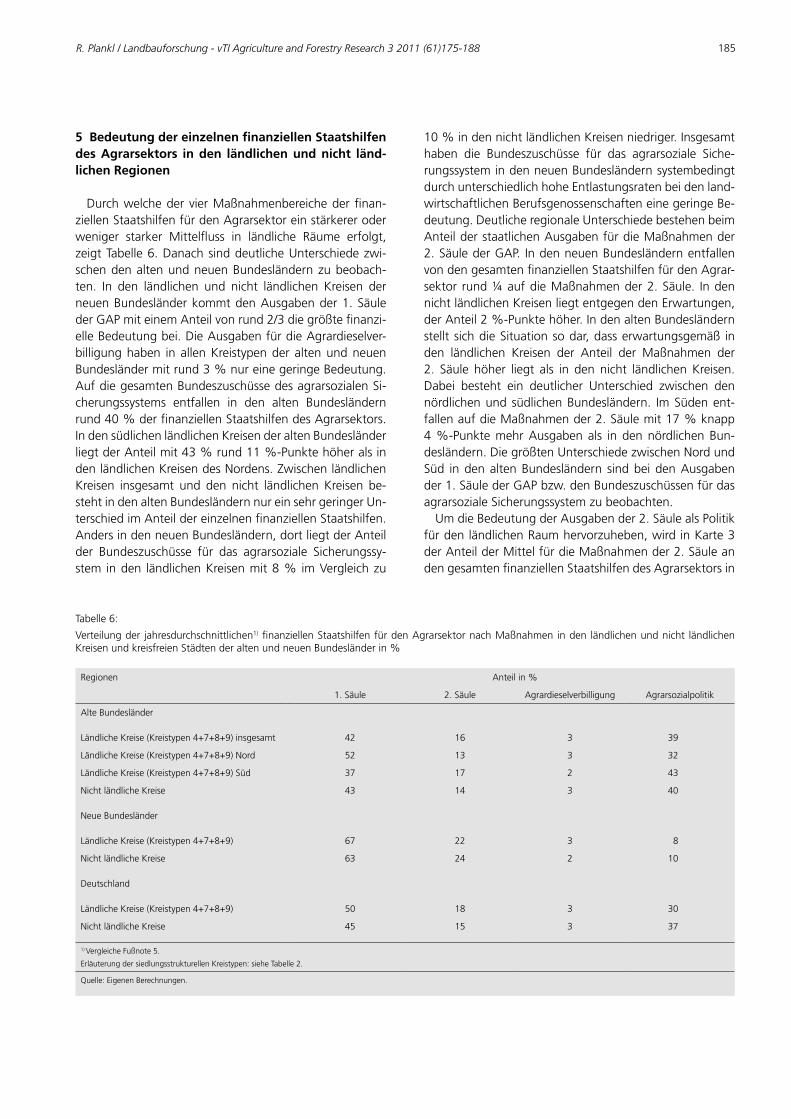
R. Plankl / Landbauforschung - vTI Agriculture and Forestry Research 3 2011 (61)175-188 185
5 Bedeutung der einzelnen finanziellen Staatshilfen des Agrarsektors in den ländlichen und nicht länd-lichen Regionen
DurchwelchedervierMaßnahmenbereichederfinan-ziellenStaatshilfenfürdenAgrarsektoreinstärkereroderweniger starker Mittelfluss in ländliche Räume erfolgt,zeigtTabelle6.DanachsinddeutlicheUnterschiedezwi-schendenaltenundneuenBundesländernzubeobach-ten. In den ländlichen und nicht ländlichen Kreisen derneuenBundesländerkommtdenAusgabender1.SäulederGAPmiteinemAnteilvonrund2/3diegrößtefinanzi-elleBedeutungbei.DieAusgabenfürdieAgrardieselver-billigunghaben inallenKreistypender altenundneuenBundesländermitrund3%nureinegeringeBedeutung.AufdiegesamtenBundeszuschüssedesagrarsozialenSi-cherungssystems entfallen in den alten Bundesländernrund40%derfinanziellenStaatshilfendesAgrarsektors.IndensüdlichenländlichenKreisenderaltenBundesländerliegtderAnteilmit43%rund11%-PunktehöheralsindenländlichenKreisendesNordens.ZwischenländlichenKreisen insgesamt und den nicht ländlichen Kreisen be-stehtindenaltenBundesländernnureinsehrgeringerUn-terschiedimAnteildereinzelnenfinanziellenStaatshilfen.AndersindenneuenBundesländern,dortliegtderAnteilder Bundeszuschüsse für das agrarsoziale Sicherungssy-stem inden ländlichenKreisenmit8% imVergleichzu
10%indennichtländlichenKreisenniedriger.Insgesamthaben die Bundeszuschüsse für das agrarsoziale Siche-rungssystemindenneuenBundesländernsystembedingtdurchunterschiedlichhoheEntlastungsratenbeidenland-wirtschaftlichenBerufsgenossenschafteneinegeringeBe-deutung.DeutlicheregionaleUnterschiedebestehenbeimAnteilderstaatlichenAusgabenfürdieMaßnahmender2.SäulederGAP. IndenneuenBundesländernentfallenvondengesamtenfinanziellenStaatshilfenfürdenAgrar-sektor rund¼aufdieMaßnahmender2.Säule. IndennichtländlichenKreisenliegtentgegendenErwartungen,derAnteil2%-Punktehöher.IndenaltenBundesländernstellt sichdieSituationsodar,dasserwartungsgemäß inden ländlichen Kreisen der Anteil der Maßnahmen der2. Säule höher liegt als in den nicht ländlichenKreisen.Dabei besteht ein deutlicher Unterschied zwischen dennördlichenund südlichenBundesländern. ImSüdenent-fallenaufdieMaßnahmender2.Säulemit17%knapp4%-PunktemehrAusgabenals indennördlichenBun-desländern.DiegrößtenUnterschiedezwischenNordundSüd indenaltenBundesländern sindbeidenAusgabender1.SäulederGAPbzw.denBundeszuschüssenfürdasagrarsozialeSicherungssystemzubeobachten.UmdieBedeutungderAusgabender2.SäulealsPolitik
fürdenländlichenRaumhervorzuheben,wirdinKarte3derAnteilderMittelfürdieMaßnahmender2.SäuleandengesamtenfinanziellenStaatshilfendesAgrarsektorsin
Tabelle6:
Verteilungder jahresdurchschnittlichen1)finanziellenStaatshilfenfürdenAgrarsektornachMaßnahmeninden ländlichenundnicht ländlichenKreisenundkreisfreienStädtenderaltenundneuenBundesländerin%
Regionen Anteilin%
1.Säule 2.Säule Agrardieselverbilligung Agrarsozialpolitik
AlteBundesländer
LändlicheKreise(Kreistypen4+7+8+9)insgesamt 42 16 3 39
LändlicheKreise(Kreistypen4+7+8+9)Nord 52 13 3 32
LändlicheKreise(Kreistypen4+7+8+9)Süd 37 17 2 43
NichtländlicheKreise 43 14 3 40
NeueBundesländer
LändlicheKreise(Kreistypen4+7+8+9) 67 22 3 8
NichtländlicheKreise 63 24 2 10
Deutschland
LändlicheKreise(Kreistypen4+7+8+9) 50 18 3 30
NichtländlicheKreise 45 15 3 37
1)VergleicheFußnote5.
ErläuterungdersiedlungsstrukturellenKreistypen:sieheTabelle2.
Quelle:EigenenBerechnungen.
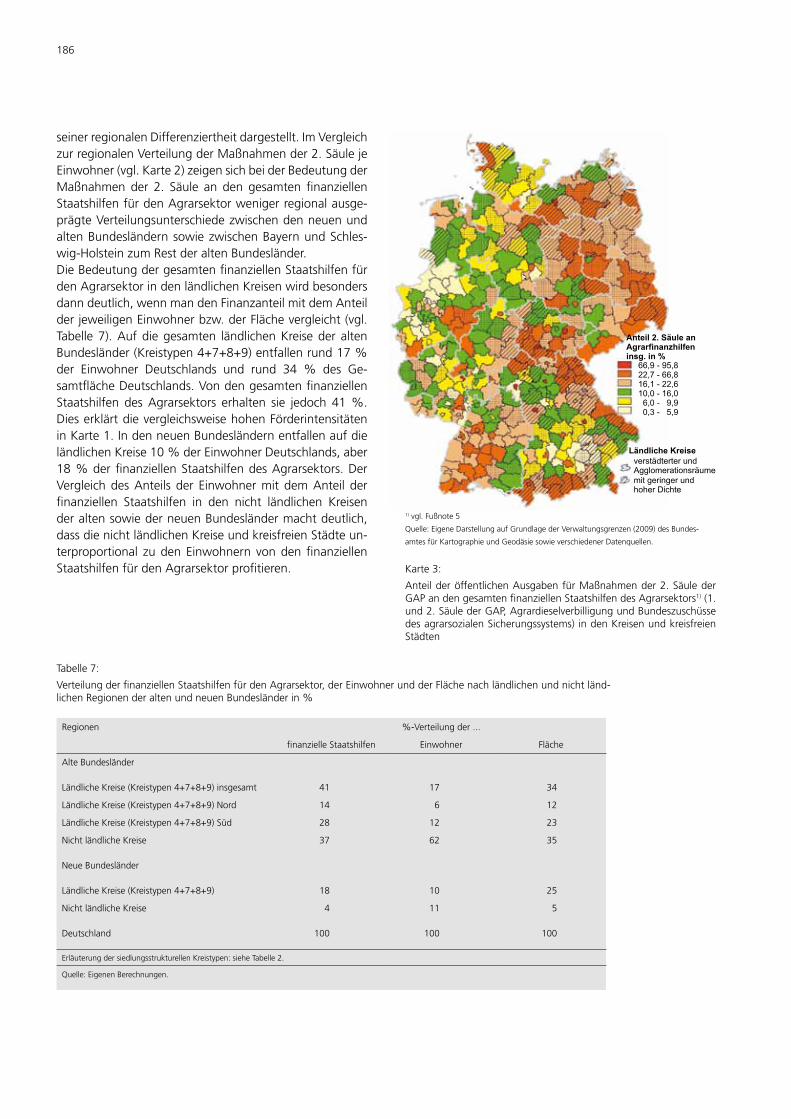
186
seinerregionalenDifferenziertheitdargestellt.ImVergleichzurregionalenVerteilungderMaßnahmender2.SäulejeEinwohner(vgl.Karte2)zeigensichbeiderBedeutungderMaßnahmen der 2. Säule an den gesamten finanziellenStaatshilfenfürdenAgrarsektorwenigerregionalausge-prägteVerteilungsunterschiedezwischendenneuenundaltenBundesländernsowiezwischenBayernundSchles-wig-HolsteinzumRestderaltenBundesländer.DieBedeutungdergesamtenfinanziellenStaatshilfenfürdenAgrarsektorindenländlichenKreisenwirdbesondersdanndeutlich,wennmandenFinanzanteilmitdemAnteilderjeweiligenEinwohnerbzw.derFlächevergleicht(vgl.Tabelle7).Aufdiegesamten ländlichenKreiseder altenBundesländer(Kreistypen4+7+8+9)entfallenrund17%der Einwohner Deutschlands und rund 34 % des Ge-samtflächeDeutschlands.VondengesamtenfinanziellenStaatshilfen desAgrarsektors erhalten sie jedoch 41%.DieserklärtdievergleichsweisehohenFörderintensitäteninKarte1.IndenneuenBundesländernentfallenaufdieländlichenKreise10%derEinwohnerDeutschlands,aber18%derfinanziellenStaatshilfendesAgrarsektors.DerVergleichdesAnteils der EinwohnermitdemAnteil derfinanziellen Staatshilfen in den nicht ländlichen KreisenderaltensowiederneuenBundesländermachtdeutlich,dassdienichtländlichenKreiseundkreisfreienStädteun-terproportional zudenEinwohnern vondenfinanziellenStaatshilfenfürdenAgrarsektorprofitieren.
Anteil 2. Säule anAgrarfinanzhilfeninsg. in %
66,9 - 95,8
22,7 - 66,8
16,1 - 22,6
10,0 - 16,0
6,0 - 9,9
0,3 - 5,9
verstädterter und
Agglomerationsräume
mit geringer und
hoher Dichte
Ländliche Kreise
1)vgl.Fußnote5
Quelle:EigeneDarstellungaufGrundlagederVerwaltungsgrenzen(2009)desBundes-
amtesfürKartographieundGeodäsiesowieverschiedenerDatenquellen.
Karte3:
AnteilderöffentlichenAusgabenfürMaßnahmender2.SäulederGAPandengesamtenfinanziellenStaatshilfendesAgrarsektors1)(1.und2.SäulederGAP,AgrardieselverbilligungundBundeszuschüssedesagrarsozialenSicherungssystems)indenKreisenundkreisfreienStädten
Tabelle7:
VerteilungderfinanziellenStaatshilfenfürdenAgrarsektor,derEinwohnerundderFlächenachländlichenundnichtländ-lichenRegionenderaltenundneuenBundesländerin%
Regionen %-Verteilungder...
finanzielleStaatshilfen Einwohner Fläche
AlteBundesländer
LändlicheKreise(Kreistypen4+7+8+9)insgesamt 41 17 34
LändlicheKreise(Kreistypen4+7+8+9)Nord 14 6 12
LändlicheKreise(Kreistypen4+7+8+9)Süd 28 12 23
NichtländlicheKreise 37 62 35
NeueBundesländer
LändlicheKreise(Kreistypen4+7+8+9) 18 10 25
NichtländlicheKreise 4 11 5
Deutschland 100 100 100
ErläuterungdersiedlungsstrukturellenKreistypen:sieheTabelle2.
Quelle:EigenenBerechnungen.
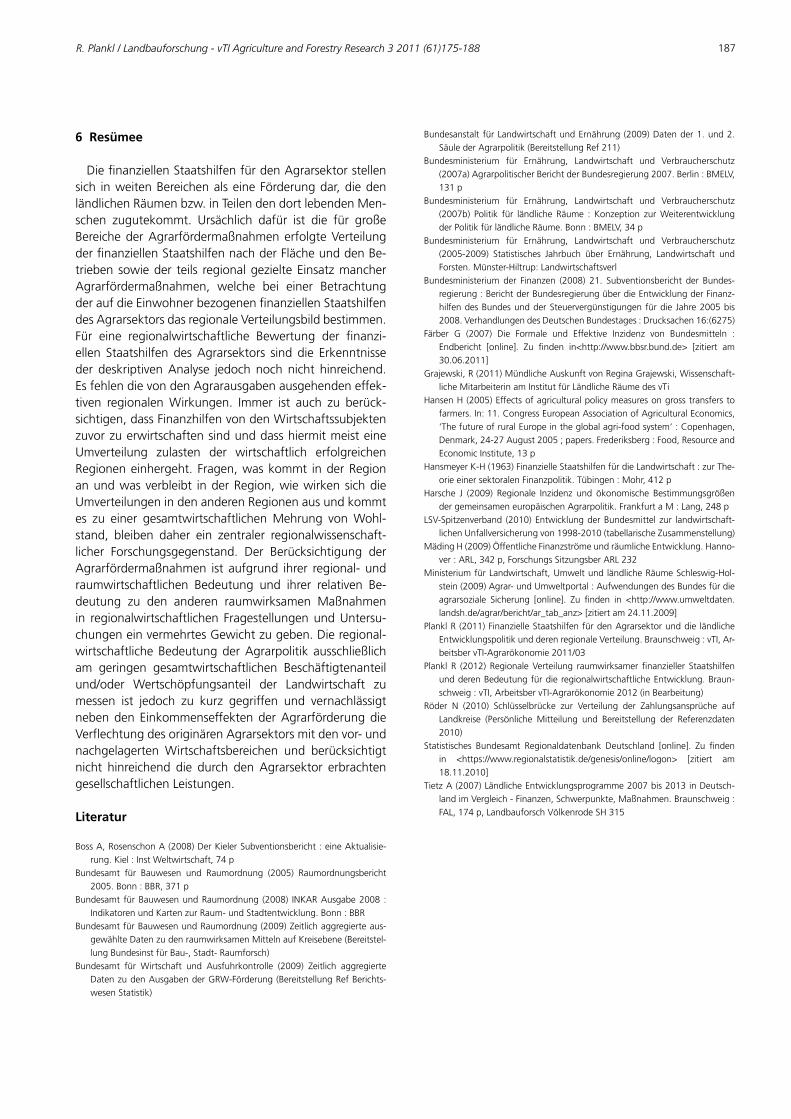
R. Plankl / Landbauforschung - vTI Agriculture and Forestry Research 3 2011 (61)175-188 187
6 Resümee
DiefinanziellenStaatshilfenfürdenAgrarsektorstellensich inweitenBereichenalseineFörderungdar,diedenländlichenRäumenbzw.inTeilendendortlebendenMen-schen zugutekommt. Ursächlich dafür ist die für großeBereichederAgrarfördermaßnahmenerfolgteVerteilungderfinanziellenStaatshilfennachderFlächeunddenBe-triebensowieder teils regionalgezielteEinsatzmancherAgrarfördermaßnahmen, welche bei einer BetrachtungderaufdieEinwohnerbezogenenfinanziellenStaatshilfendesAgrarsektorsdasregionaleVerteilungsbildbestimmen.Für eine regionalwirtschaftliche Bewertung der finanzi-ellen StaatshilfendesAgrarsektors sinddie Erkenntnisseder deskriptivenAnalyse jedochnochnicht hinreichend.EsfehlendievondenAgrarausgabenausgehendeneffek-tiven regionalenWirkungen. Immer ist auch zu berück-sichtigen,dassFinanzhilfenvondenWirtschaftssubjektenzuvorzuerwirtschaftensindunddasshiermitmeisteineUmverteilung zulasten der wirtschaftlich erfolgreichenRegioneneinhergeht.Fragen,waskommt inderRegionanundwasverbleibt inderRegion,wiewirkensichdieUmverteilungenindenanderenRegionenausundkommtes zu einer gesamtwirtschaftlichenMehrung vonWohl-stand, bleiben daher ein zentraler regionalwissenschaft-licher Forschungsgegenstand. Der Berücksichtigung derAgrarfördermaßnahmen ist aufgrund ihrer regional-undraumwirtschaftlichen Bedeutung und ihrer relativen Be-deutung zu den anderen raumwirksamen Maßnahmenin regionalwirtschaftlichen FragestellungenundUntersu-chungeneinvermehrtesGewichtzugeben.Dieregional-wirtschaftlicheBedeutungderAgrarpolitik ausschließlicham geringen gesamtwirtschaftlichen Beschäftigtenanteilund/oder Wertschöpfungsanteil der Landwirtschaft zumessen ist jedoch zu kurz gegriffen und vernachlässigtnebendenEinkommenseffektenderAgrarförderungdieVerflechtungdesoriginärenAgrarsektorsmitdenvor-undnachgelagerten Wirtschaftsbereichen und berücksichtigtnicht hinreichend die durch denAgrarsektor erbrachtengesellschaftlichenLeistungen.
Literatur
BossA,RosenschonA(2008)DerKielerSubventionsbericht:eineAktualisie-rung.Kiel:InstWeltwirtschaft,74p
Bundesamt für Bauwesen und Raumordnung (2005) Raumordnungsbericht2005.Bonn:BBR,371p
Bundesamt fürBauwesenundRaumordnung (2008) INKARAusgabe2008 :IndikatorenundKartenzurRaum-undStadtentwicklung.Bonn:BBR
BundesamtfürBauwesenundRaumordnung(2009)Zeitlichaggregierteaus-gewählteDatenzudenraumwirksamenMittelnaufKreisebene(Bereitstel-lungBundesinstfürBau-,Stadt-Raumforsch)
Bundesamt für Wirtschaft und Ausfuhrkontrolle (2009) Zeitlich aggregierteDatenzudenAusgabenderGRW-Förderung(BereitstellungRefBerichts-wesenStatistik)
Bundesanstalt fürLandwirtschaftundErnährung(2009)Datender1.und2.SäulederAgrarpolitik(BereitstellungRef211)
Bundesministerium für Ernährung, Landwirtschaft und Verbraucherschutz(2007a)AgrarpolitischerBerichtderBundesregierung2007.Berlin:BMELV,131p
Bundesministerium für Ernährung, Landwirtschaft und Verbraucherschutz(2007b) Politik für ländliche Räume : Konzeption zurWeiterentwicklungderPolitikfürländlicheRäume.Bonn:BMELV,34p
Bundesministerium für Ernährung, Landwirtschaft und Verbraucherschutz(2005-2009) Statistisches Jahrbuch über Ernährung, Landwirtschaft undForsten.Münster-Hiltrup:Landwirtschaftsverl
Bundesministerium der Finanzen (2008) 21. Subventionsbericht der Bundes-regierung:BerichtderBundesregierungüberdieEntwicklungderFinanz-hilfendesBundesundderSteuervergünstigungenfürdieJahre2005bis2008.VerhandlungendesDeutschenBundestages:Drucksachen16:(6275)
Färber G (2007) Die Formale und Effektive Inzidenz von Bundesmitteln :Endbericht [online]. Zu finden in<http://www.bbsr.bund.de> [zitiert am30.06.2011]
Grajewski,R(2011)MündlicheAuskunftvonReginaGrajewski,Wissenschaft-licheMitarbeiterinamInstitutfürLändlicheRäumedesvTi
HansenH(2005)Effectsofagriculturalpolicymeasuresongrosstransferstofarmers.In:11.CongressEuropeanAssociationofAgriculturalEconomics‚‘ThefutureofruralEuropeintheglobalagri-foodsystem‘:Copenhagen,Denmark,24-27August2005;papers.Frederiksberg:Food,ResourceandEconomicInstitute,13p
HansmeyerK-H(1963)FinanzielleStaatshilfenfürdieLandwirtschaft:zurThe-orieeinersektoralenFinanzpolitik.Tübingen:Mohr,412p
Harsche J (2009) Regionale Inzidenz und ökonomische BestimmungsgrößendergemeinsameneuropäischenAgrarpolitik.FrankfurtaM:Lang,248p
LSV-Spitzenverband (2010)EntwicklungderBundesmittel zur landwirtschaft-lichenUnfallversicherungvon1998-2010(tabellarischeZusammenstellung)
MädingH(2009)ÖffentlicheFinanzströmeundräumlicheEntwicklung.Hanno-ver:ARL,342p,ForschungsSitzungsberARL232
MinisteriumfürLandwirtschaft,UmweltundländlicheRäumeSchleswig-Hol-stein(2009)Agrar-undUmweltportal:AufwendungendesBundesfürdieagrarsoziale Sicherung [online]. Zu finden in <http://www.umweltdaten.landsh.de/agrar/bericht/ar_tab_anz>[zitiertam24.11.2009]
PlanklR(2011)FinanzielleStaatshilfenfürdenAgrarsektorunddie ländlicheEntwicklungspolitikundderenregionaleVerteilung.Braunschweig:vTI,Ar-beitsbervTI-Agrarökonomie2011/03
Plankl R (2012) RegionaleVerteilung raumwirksamerfinanzieller StaatshilfenundderenBedeutungfürdieregionalwirtschaftlicheEntwicklung.Braun-schweig:vTI,ArbeitsbervTI-Agrarökonomie2012(inBearbeitung)
Röder N (2010) Schlüsselbrücke zur Verteilung der Zahlungsansprüche aufLandkreise (Persönliche Mitteilung und Bereitstellung der Referenzdaten2010)
Statistisches Bundesamt Regionaldatenbank Deutschland [online]. Zu findenin <https://www.regionalstatistik.de/genesis/online/logon> [zitiert am18.11.2010]
TietzA(2007)LändlicheEntwicklungsprogramme2007bis2013inDeutsch-landimVergleich-Finanzen,Schwerpunkte,Maßnahmen.Braunschweig:FAL,174p,LandbauforschVölkenrodeSH315

188
G. Rahmann / Landbauforschung - vTI Agriculture and Forestry Research 3 2011 (61)189-208 189
Biodiversity and Organic farming: What do we know?
GeroldRahmann*1
*1 JohannHeinrichvonThünen Institute (vTI), FederalResearch Institute forRuralAreas,ForestryandFisheries,InstituteofOrganicFarming,Trenthorst32,23847Westerau,Germany,[email protected]
Abstract
Thenumberofstudiesonorganicfarmingandbiodiver-sityincreasedsignificantlywithinthelastyears.Meanwhileorganicfarminghasbeenrecognisedasafieldwithscientificrelevance.About19,000publicationswere found in theWebofScience(www.isiknowledge.com)usingEndnote®softwarewiththewording“organicfarming”,andoutofthese about 1,200werepublishedbyGerman scientists(6%).Intotal766publicationsofthesepaperscontainedalsotheword“biodiversity”(3.5%).Halfofthemwerepublished during the last five years, and aremostly au-thoredbyEuropeans.Ameta-dataanalysisofthese766scientificpapershasbeencarriedouttoanswertheques-tionwhetherorganic farminghasanadvantageforbio-diversityincomparisontoconventionalfarmingsystems.327outof396relevantresultsfoundahigherdegree
ofbiodiversityinorganicfarmingwhencomparedtocon-ventionalfarming.In56papers(14%)nodifferencewasverified, and in 13 contributions (3%) organic farmingyieldedlessbiodiversity(7ofthemforsoilinvertebrates).Thusitmaybeconcludedthatorganicfarmingproduces
morebiodiversity.Researchgapsstillexist for theunder-standingoffunctionalbiodiversityandecosystemimpactwhichcomprisesoilbiota,landscape(ecosystemandhabi-tat)andgeneticbiodiversityonagriculturallandinnaturalhabitats. Inaddition,moreinformationisrequiredaboutbiodiversityoffarmingsystemsinnon-Europeanregions,particularlyinthetropicsandsub-tropics.
Keywords: Agri-environmental schemes, organic farming, biodiversity, integration, long-term field studies, segrega-tion
Zusammenfassung:
Biodiversität und Ökologischer Landbau – Was wis-sen wir?
IndenletztenJahrensindeineVielzahlvonneuenStu-dienzumÖkologischenLandbauundBiodiversitätveröf-fentlichtworden.DerÖkologische Landbau hat alswis-senschaftlichesObjektanBedeutunggewonnen.Imwebof science (www.isiknowledge.com) wurden mit demQuellenrechercheprogramm Endnote® unter dem Stich-wort “organic farming” 19.000 Quellen gefunden, da-von1.200 (6%)ausDeutschland.MitderergänzendenEinschränkung“biodiversity”warenes immernoch766Quellen(3,5%),wovondieHälfteerstindenletztenfünfJahrenveröffentlichtwurde,vorwiegendausEuropa.Inei-nerMetaanalysewurdendiese766QuellenaufihreAus-sagenbezüglichderBedeutungdesÖkologischenLand-bausfürdieBiodiversitätuntersucht.Eskonnten396Bewertungenverwendetwarden.327
(83%) der Bewertungen stellten fest, dass der Ökolo-gischeLandbaumehrBiodiversitätaufweisstalsderkon-ventionelleLandbau.Weitere56(14%)derBewertungenwarenindifferentundnur13(3%;davon7alleineimBe-reichdesBodenlebens)stelltenfest,dassdieBiodiversitätimÖkologischenLandbauniedrigeralsimkonventionellenLandbauist.Zusammenfassend kann aus dieser Metaanalyse ge-
schlossenwerden,dassderÖkologischeLandbauförder-lich für die Biodiversität ist. DiewissenschaftlicheArbeitsolltesichverstärktumdieLückendesWissenszurfunk-tionellen Biodiversität und landwirtschaftliche Systemekümmern. Das Bodenleben, die Landschaft (Ökosystem,Habitate)sowiediegenetischeagro-undnatürlicheBiodi-versitätsinddabeihervorzuheben.AuchfehltesanWis-senüberdieWirkungdesÖkolandbausaufdieBiodiver-sitättropischerodersub-tropischerAgrozonen(vorallemaußerhalbvonEuropa).
Schlüsselworte: Agrarumweltmaßnahmen, Ökologischer Landbau, Biodiversität, Integration, Langzeit Feldstudien, Segregation
190
1 Introduction
Biodiversity isoneof themost important resourcesonearth,andhumanactivitiesendangerthetotalnumberofspecies.Largenumbersarealreadyextinctorclosetobe-ingerased.AttheRio-conference1992,theUnitedNationsagreedtoreducebiodiversity lossestozero in2010.Thegoalshavenotbeenreached.Farming(intensificationandlandusechange)aremainreasonsforbiodiversitylosses,butagriculturecanalsoprotectandenhancebiodiversity.Several strategies havebeendeveloped to produce foodandprotectbiodiversity.Organicfarmingisconsideredanenvironmentally-friendlyformoffoodproductionandre-ceivesagri-environmentalpayments for theprotectionofbiodiversity.Butdoesorganicfarmingliveuptothisexpec-tation?Alotofscientificeffortshavebeenmadetoanswerthisquestion.Thepresentedmeta-dataanalysiswasmadetogiveanup-to-dateevaluationofthestateoftheart.
2 The background
Biodiversityisdefinedasthevariabilityamonglivingor-ganisms from all sources including, inter alia, terrestrial,marine,andotheraquaticecosystems,andtheecologicalcomplexesofwhich they arepart; this includesdiversitywithinspecies,betweenspeciesandofecosystems(Refer-ence).Thisbiodiversity isthreatenedbyhumanactivities.Landusechanges,degradation,pollution,climatechange,anddesertificationandlastbutnot leasthumanpopula-tiongrowthenforcedthelossofbiodiversitybyfactor100to1,000whencomparedtonaturalextinction. In1992,the United Nations agreed to rescue the world’s biodi-versity.TheConventionofBiologicalDiversity (CBD:192countriesandtheEuropeanUnion)isoneofthethreeRioconventions. “The target agreedby theworld’sGovern-mentsin2002[Rio+10summitinJohannesburg;GR],“to achieve by 2010 a significant reduction of the current rate of biodiversity loss at the global, regional and national level as a contribution to poverty alleviation and to the benefit of all life on Earth”, hasnot beenmet. This disappoint-ingconclusionistheintroductionofthe“GlobalBiodiver-sityoutlook3oftheUnitedNationsin2010”,theyearofbiodiversity.Thisfatalsituationneedstobefacedthoughmorethan170countries(87%ofthePartiestotheCon-vention,includingGermanyandtheEuropeanUnion)im-plementednationalbiodiversitystrategiesandactionplans(ConventionofBiologicalDiversity(CBD),2010).It is a fact that theworld’sbiodiversity is still decreas-
ing.TheglobalLivingPlanetIndex(LPI)1
1 TheLivingPlanetIndextracksnearly4,000populationsof241fish,83am-TheLivingPlanetIndextracksnearly4,000populationsof241fish,83am-phibian,40reptile,811birdand302mammalspecies(WWF,2010).
(WWF,2010)has
declinedbymorethan30%since1970.WhiletheTropi-calLPIdeclinedbyalmost60%,theTemperateLPI[includ-LPIdeclinedbyalmost60%,theTemperateLPI[includ-ingGermany] increasedby15%.Obviously, the effortstoprotectenvironmentandnatureintemperateclimates(mainlydeveloped countriesof thewesternworld) havebeen successful after substantial declines in the past.About1.75million species aredescribedworldwidebuttheyareprobablyonlyasmallshareofthetruetotalnum-ber(estimatesprovideanumberofupto13millionspe-cies;CBD,2010).InGermany,48,000animalspeciesaredescribed(Anon-
ymous,2011a),and3,600differentplantscanbefoundofwhich2,800areindigenous(BundesamtfürNaturschutz(BfN) ,2007). These figures include 77 tree species; 111shrubs;33,305insects;4,000bacteria(estimationsare1million bacteria species exist); 703 vertebrateswith 100mammals;256birdspecies;14reptiles,and21amphib-ians.Mostof the3001higherplant andanimal speciesareendangeredbecauseoflandusechangesandlanduseintensification (Rahmann, 2000). Among the Europeancountries, losses in biodiversity are highest in Germany.About28%of theflora speciesandevenmoreanimalspecies(44%ofthebirds,51%ofthemammals,61%of ants, and 52% of bees) are extinct or endangered(Anonymous,2011b;BfN,2008).Agro-biodiversityisanimportantpartoftheworldbio-
diversity. From the 250,000 worldwide described plantspecies, about 30,000 are edible, and about 7,000 arecurrentlyused for consumption.Notmore than30 spe-ciescomprisemorethan95%ofthefoodcomposition.Anditisonlythreespecies(rice,wheat,corn)whichsupplymorethan50%oftoday’shumanfood(BundesanstaltfürLandwirtschaftundErnährung(BLE-BEKO),2008).About75% of the genetic diversity of cultivated plants is al-readyextinct(geneticerosion).Particularlyfruitsandveg-etablesspeciesandvarietiesareendangered(Anonymous,2011c).Cropproductiondominatesthelanduseofmanycountriesoftheworld.InGermanymorethan50%ofthelandsurfaceisusedforagriculture.Onlyasmallnumberofdifferentcropspeciesareplanted:Atotalof27%ofthearablelandisusedforwheat,17%forbarley,15%forcorn,12%foroilseedrape,4%forryesothatonlyaquarterof the land is cultivatedwithanyotherplant.Counterproductiveintermsofbiodiversityisthatcropsareregularlycultivatedinmonoculture.Theuseofpesticidescausesachangeofthehabitatandreduce/eradicatewildplantsandwildanimalbiodiversityonaregionalscale.Asimilartrendcanbeobservedinpens.Morethan25
animalspeciesaredomesticatedbutonly11ofthemareof economic relevance. Human selection has created alargenumberofdifferentbreeds.Many livestockbreedsareendangered,especiallysheepandgoatbreeds(Sam-braus, 1999; www.g-e-h.de).The FAO registered more
G. Rahmann / Landbauforschung - vTI Agriculture and Forestry Research 3 2011 (61)189-208 191
than7,600differentbreedsworldwide(FAO,2007),andmorethan1,500ofthemareendangered.The protection and backing of biodiversity is one of
themainchallengesoffarming.Evenbeforepublic lawsenforced protection ofwild plants and animals, organicfarminghaddeclaredtheaimtoprotecttheenvironmentandbiodiversity in thefirstversionofprinciples (IFOAM,1980;www.ifoam.org).Oneofthefourprinciplesoforganicfarmingisdefined
by the International Federation of Organic AgriculturalMovement (IFOAM, 2007): “The Principle of Ecology: Organic Agriculture should be based on living ecological systems and cycles, work with them, emulate them and help sustain them. […] Organic agriculture should attain ecological balance through the design of farming systems, establishment of habitats and maintenance of genetic and agricultural diversity. Those who produce, process, trade, or consume organic products should protect and benefit the common environment including landscapes, climate, habitats, biodiversity, air and water.”ThepreambleoftheEUregulation834/2007confirms
the IFOAM principle: “Organic production is an overallsystem of farmmanagement and food production thatcombinesbestenvironmentalpractices,ahighlevelofbio-diversity,thepreservationofnaturalresources,theappli-cationofhighanimalwelfarestandardsandaproductionmethodinlinewiththepreferenceofcertainconsumersforproductsproducedusingnaturalsubstancesandpro-cesses.”InArticle3(Objectivesandprinciplesfororganicproduction)isfixedthat“Organicproductionshallpursuethefollowinggeneralobjectives:(a)establishasustainablemanagementsystemforagriculture that: (i) respectsna-ture’ssystemsandcyclesandsustainsandenhances thehealthofsoil,water,plantsandanimalsandthebalancebetweenthem;(ii)contributestoahighlevelofbiologicaldiversity;” This includes soil and aquatic biodiversity (ar-ticle5 (a) (n)aswellasfarmcropand livestockdiversity(889/2008introduction(8)).Incontrasttothesegregationstrategyofconventional
farming (production or protection), biodiversity is an in-tegral component of organic farming (production andprotection) (Rahmann et al 2006; Schnug et al., 2008).Thereforewildplants, livestockandagriculturalbiodiver-sityarefoundasco-productsofthefarmingactivity.Theuseofherbicides(butalsootherpesticides) isprohibitedwhichprotectsthenaturalfloraandfauna.Onlymanual,mechanical and heat measures are permitted for weedcontrol.Wildfaunasuchasinsects,snails,beetles,andspi-derscanbecontrolledthroughbiotechnologicalmeasures(traps, lime, etc.) and natural insecticides (Annex II of889/2008/EU)(Kühneetal.,2006).Organicfarming isbasedonnormswhichare inforce
worldwide(IFOAM,2005).Organicproductionisexpand-
ingcontinuouslyandispracticedinmorethan160coun-tries(ofatotalof195countries;intheyear2000only86countriesweredocumentedwithorganicproduction). In2007,morethan1,800,000farms(677,000organicfarmsonlyinIndia)manageabout38millionhectaresfarmlandorganicallywith certification (0.9%of total agriculturalfarmland;plus42millionhectarewildcollectionarea).2/3oftheworld’sorganicfarmlandisgrassland(Willeretal.,2011).Europe was and is the most driving continent in the
developmentandestablishmentoforganicfarming.Onequarter of the world’s organic farm land is in Europe(200,000farms,7.8millionhectares,1.9%shareoftotalfarmland). IntheEuropeanUnion(EU27)about180,000farmsmanage7.2millionhectareslandorganically(4%ofthetotalfarmland;2007)andgenerateproduceworth16.8 billion Euros (2008).With 5.9 billion Euros (2010),Germanyhasthebiggestorganicmarket inEurope.Themarket share of organic products in the German foodmarket is about 3%, about half of the Danishmarketsharewith6.7%,andAustriawith5.7%.Theworldor-ganic purchases are 6 Euro per capita and year (2009).IntheUSA,about50Euroc-1yr-1werespentin2008percapita.With26Euroc-1yr-1theorganicpurchasesarelessin the EU27. Danish citizens purchase about 132 Euroc-1yr-1,whileGermanyisinthemiddlefieldwithabout71Euroc-1yr-1(AMI,2010).94%oftheGermanconsumersbuyorganicfoodbutonly3%ofallGermanconsumersarerelevantfor39%ofallorganicsales.Theseintensivebuyersspendabout730Europeryearandhouseholdonorganicfoodproducts.Thisis39%oftotalfoodpurchaseofthesehouseholds(BÖLW,2011).TheSecondNationalNutritionStudyofGermany(MRI,2008)foundthatorgan-icfrequentconsumershaveahealthierlifestylecomparedwithnon-organicconsumers.CurrentlytheGermanfarmersdeliverabout50%ofthe
organicproductsfortheGermanmarket,theotherhalfisimported,mainlyfromotherEUcountries(BÖLW,2011).Thefarmersgetabout20%ofthemarketsales.Thatmeans,that80%ofthevalueoforganicproducts(finalconsumerspending)isearnedintransport,processingandtrade.Thisiscomparabletoconventionalfamers(AMI,2010).The implementation of official standards and regula-
tionsintheEUin1992(2092/91/EEC,834/2007/ECandrelated regulations; http://ec.europa.eu/agriculture/or-ganic/home_en)andthepoliticalsupport–Europeanac-tionplanfororganicfoodandfarming(since2004)andnationalprogrammesliketheGermanBundespropgrammÖkologischer Landbau (www.bundesprogramm-oeko-landbau.de)withmore than 75million Euro R&D fundsince2002–wereandare themaindriving forces.TheGerman speaking countries (DE, CH, AT) comprise themostrelevantorganicfarmingresearchintheworld.
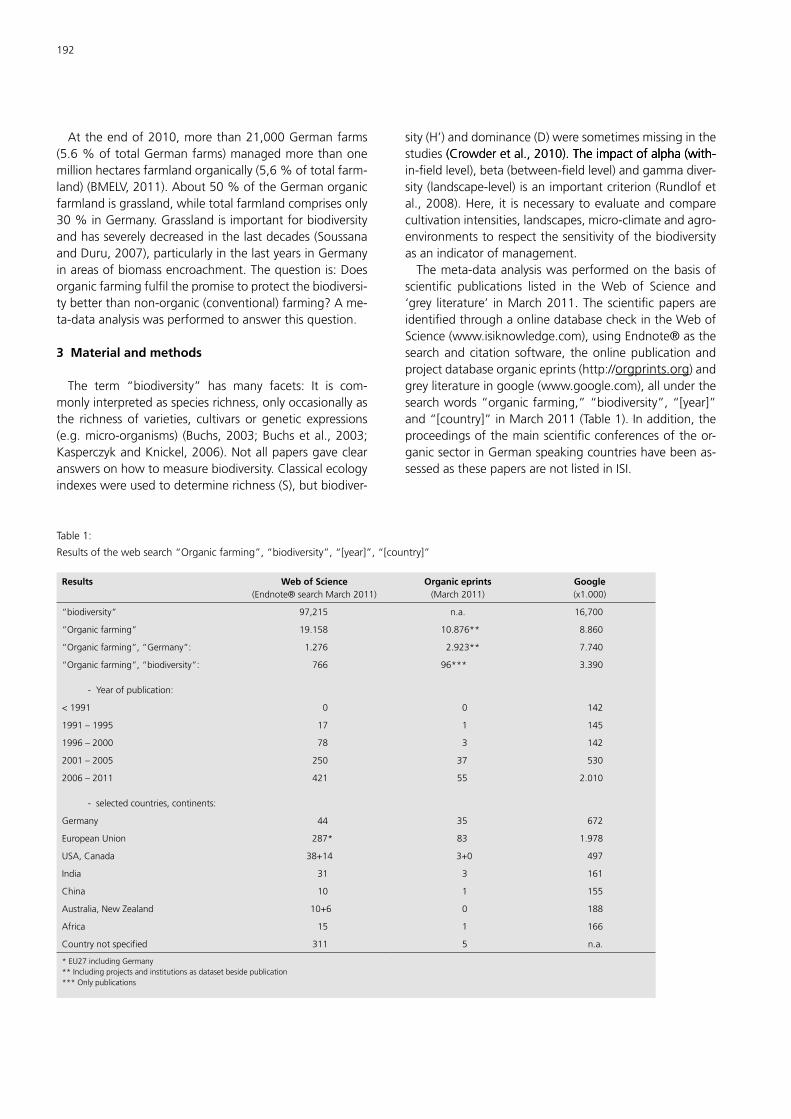
192
Attheendof2010,morethan21,000Germanfarms(5.6%oftotalGermanfarms)managedmorethanonemillionhectaresfarmlandorganically(5,6%oftotalfarm-land)(BMELV,2011).About50%oftheGermanorganicfarmlandisgrassland,whiletotalfarmlandcomprisesonly30%inGermany.Grasslandisimportantforbiodiversityandhasseverelydecreasedinthelastdecades(SoussanaandDuru,2007),particularlyinthelastyearsinGermanyinareasofbiomassencroachment.Thequestionis:Doesorganicfarmingfulfilthepromisetoprotectthebiodiversi-tybetterthannon-organic(conventional)farming?Ame-ta-dataanalysiswasperformedtoanswerthisquestion.
3 Material and methods
The term “biodiversity” has many facets: It is com-monlyinterpretedasspeciesrichness,onlyoccasionallyasthe richness of varieties, cultivars or genetic expressions(e.g.micro-organisms) (Buchs,2003;Buchsetal.,2003;KasperczykandKnickel,2006).Notallpapersgaveclearanswersonhowtomeasurebiodiversity.Classicalecologyindexeswereusedtodeterminerichness(S),butbiodiver-
sity(H’)anddominance(D)weresometimesmissinginthestudies(Crowderetal.,2010).Theimpactofalpha(with-(Crowderetal.,2010).Theimpactofalpha(with-.Theimpactofalpha(with-in-fieldlevel),beta(between-fieldlevel)andgammadiver-sity(landscape-level)isanimportantcriterion(Rundlofetal.,2008).Here, it isnecessarytoevaluateandcomparecultivationintensities,landscapes,micro-climateandagro-environmentstorespectthesensitivityofthebiodiversityasanindicatorofmanagement.Themeta-dataanalysiswasperformedonthebasisof
scientific publications listed in theWeb of Science and‘grey literature’ inMarch2011.ThescientificpapersareidentifiedthroughaonlinedatabasecheckintheWebofScience(www.isiknowledge.com),usingEndnote®asthesearchandcitation software, theonlinepublicationandprojectdatabaseorganiceprints(http://orgprints.org)andgreyliteratureingoogle(www.google.com),allunderthesearchwords“organicfarming,”“biodiversity”,“[year]”and“[country]”inMarch2011(Table1).Inaddition,theproceedingsofthemainscientificconferencesoftheor-ganicsectorinGermanspeakingcountrieshavebeenas-sessedasthesepapersarenotlistedinISI.
Table1:
Resultsofthewebsearch“Organicfarming”,“biodiversity”,“[year]”,“[country]”
Results Web of Science(Endnote®searchMarch2011)
Organic eprints(March2011)
Google(x1.000)
“biodiversity” 97,215 n.a. 16,700
“Organicfarming” 19.158 10.876** 8.860
“Organicfarming”,“Germany”: 1.276 2.923** 7.740
“Organicfarming”,“biodiversity”: 766 96*** 3.390
-Yearofpublication:
<1991 0 0 142
1991–1995 17 1 145
1996–2000 78 3 142
2001–2005 250 37 530
2006–2011 421 55 2.010
-selectedcountries,continents:
Germany 44 35 672
EuropeanUnion 287* 83 1.978
USA,Canada 38+14 3+0 497
India 31 3 161
China 10 1 155
Australia,NewZealand 10+6 0 188
Africa 15 1 166
Countrynotspecified 311 5 n.a.
*EU27includingGermany**Includingprojectsandinstitutionsasdatasetbesidepublication***Onlypublications
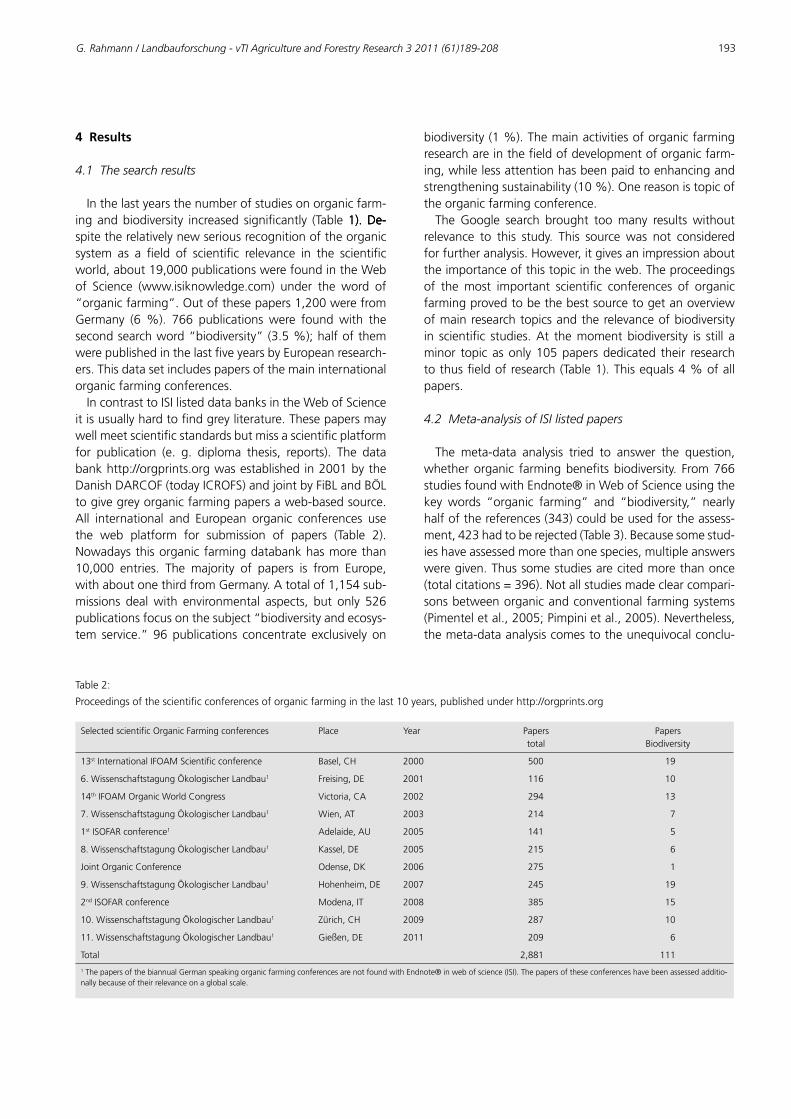
G. Rahmann / Landbauforschung - vTI Agriculture and Forestry Research 3 2011 (61)189-208 193
4 Results
4.1 The search results
Inthelastyearsthenumberofstudiesonorganicfarm-ingandbiodiversity increased significantly (Table1).De-1).De-).De-spitetherelativelynewseriousrecognitionoftheorganicsystem as a field of scientific relevance in the scientificworld,about19,000publicationswerefoundintheWebof Science (www.isiknowledge.com) under the word of“organicfarming”.Outofthesepapers1,200werefromGermany (6%). 766 publications were foundwith thesecondsearchword“biodiversity”(3.5%);halfofthemwerepublishedinthelastfiveyearsbyEuropeanresearch-ers.Thisdatasetincludespapersofthemaininternationalorganicfarmingconferences.IncontrasttoISIlisteddatabanksintheWebofScience
itisusuallyhardtofindgreyliterature.Thesepapersmaywellmeetscientificstandardsbutmissascientificplatformfor publication (e. g. diploma thesis, reports). The databankhttp://orgprints.orgwasestablishedin2001bytheDanishDARCOF(todayICROFS)andjointbyFiBLandBÖLtogivegreyorganicfarmingpapersaweb-basedsource.All international and European organic conferences usethe web platform for submission of papers (Table 2).Nowadaysthisorganicfarmingdatabankhasmorethan10,000 entries. The majority of papers is from Europe,withaboutonethirdfromGermany.Atotalof1,154sub-missions dealwith environmental aspects, but only 526publicationsfocusonthesubject“biodiversityandecosys-tem service.” 96publications concentrate exclusively on
Table2:
Proceedingsofthescientificconferencesoforganicfarminginthelast10years,publishedunderhttp://orgprints.org
SelectedscientificOrganicFarmingconferences Place Year Paperstotal
PapersBiodiversity
13stInternationalIFOAMScientificconference Basel,CH 2000 500 19
6.WissenschaftstagungÖkologischerLandbau1 Freising,DE 2001 116 10
14thIFOAMOrganicWorldCongress Victoria,CA 2002 294 13
7.WissenschaftstagungÖkologischerLandbau1 Wien,AT 2003 214 7
1stISOFARconference1 Adelaide,AU 2005 141 5
8.WissenschaftstagungÖkologischerLandbau1 Kassel,DE 2005 215 6
JointOrganicConference Odense,DK 2006 275 1
9.WissenschaftstagungÖkologischerLandbau1 Hohenheim,DE 2007 245 19
2ndISOFARconference Modena,IT 2008 385 15
10.WissenschaftstagungÖkologischerLandbau1 Zürich,CH 2009 287 10
11.WissenschaftstagungÖkologischerLandbau1 Gießen,DE 2011 209 6
Total 2,881 111
1ThepapersofthebiannualGermanspeakingorganicfarmingconferencesarenotfoundwithEndnote®inwebofscience(ISI).Thepapersoftheseconferenceshavebeenassessedadditio-nallybecauseoftheirrelevanceonaglobalscale.
biodiversity(1%).Themainactivitiesoforganicfarmingresearchareinthefieldofdevelopmentoforganicfarm-ing,whilelessattentionhasbeenpaidtoenhancingandstrengtheningsustainability(10%).Onereasonistopicoftheorganicfarmingconference.TheGoogle search brought toomany results without
relevance to this study. This source was not consideredforfurtheranalysis.However,itgivesanimpressionabouttheimportanceofthistopicintheweb.Theproceedingsof themost important scientific conferences of organicfarmingprovedtobethebestsourcetogetanoverviewofmainresearchtopicsandtherelevanceofbiodiversityin scientific studies.At themomentbiodiversity is still aminor topicasonly105papersdedicated their researchtothusfieldofresearch(Table1).Thisequals4%ofallpapers.
4.2 Meta-analysis of ISI listed papers
The meta-data analysis tried to answer the question,whetherorganic farmingbenefitsbiodiversity. From766studiesfoundwithEndnote®inWebofScienceusingthekey words “organic farming” and “biodiversity,” nearlyhalfofthereferences(343)couldbeusedfortheassess-ment,423hadtoberejected(Table3).Becausesomestud-ieshaveassessedmorethanonespecies,multipleanswersweregiven.Thussomestudiesarecitedmorethanonce(totalcitations=396).Notallstudiesmadeclearcompari-sonsbetweenorganicandconventionalfarmingsystems(Pimenteletal.,2005;Pimpinietal.,2005).Nevertheless,themeta-dataanalysiscomestotheunequivocalconclu-
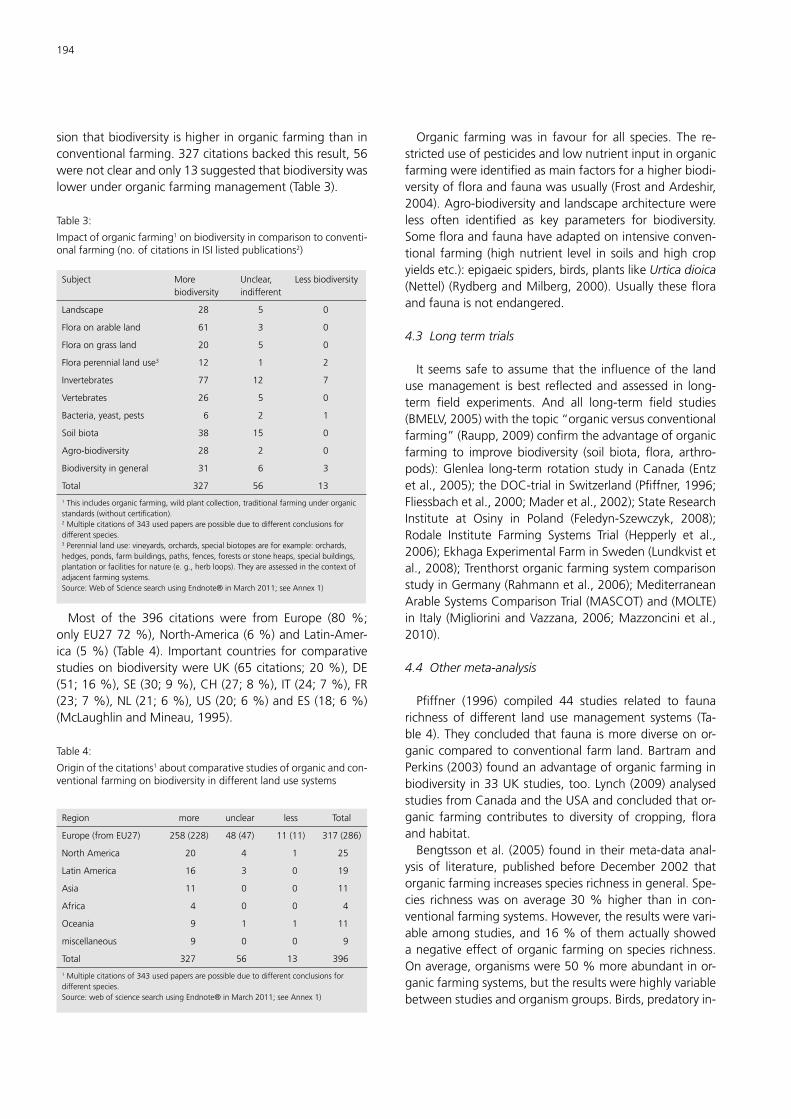
194
sionthatbiodiversityishigherinorganicfarmingthaninconventionalfarming.327citationsbackedthisresult,56werenotclearandonly13suggestedthatbiodiversitywaslowerunderorganicfarmingmanagement(Table3).
Table3:
Impactoforganicfarming1onbiodiversityincomparisontoconventi-onalfarming(no.ofcitationsinISIlistedpublications2)
Subject Morebiodiversity
Unclear,indifferent
Lessbiodiversity
Landscape 28 5 0
Floraonarableland 61 3 0
Floraongrassland 20 5 0
Floraperenniallanduse3 12 1 2
Invertebrates 77 12 7
Vertebrates 26 5 0
Bacteria,yeast,pests 6 2 1
Soilbiota 38 15 0
Agro-biodiversity 28 2 0
Biodiversityingeneral 31 6 3
Total 327 56 13
1Thisincludesorganicfarming,wildplantcollection,traditionalfarmingunderorganicstandards(withoutcertification).2Multiplecitationsof343usedpapersarepossibleduetodifferentconclusionsfordifferentspecies.3Perenniallanduse:vineyards,orchards,specialbiotopesareforexample:orchards,hedges,ponds,farmbuildings,paths,fences,forestsorstoneheaps,specialbuildings,plantationorfacilitiesfornature(e.g.,herbloops).Theyareassessedinthecontextofadjacentfarmingsystems.Source:WebofSciencesearchusingEndnote®inMarch2011;seeAnnex1)
Most of the 396 citations were from Europe (80%;onlyEU2772%),North-America(6%)andLatin-Amer-ica (5%) (Table4). Important countries for comparativestudiesonbiodiversitywereUK(65citations;20%),DE(51;16%),SE(30;9%),CH(27;8%),IT(24;7%),FR(23;7%),NL(21;6%),US(20;6%)andES(18;6%)(McLaughlinandMineau,1995).
Table4:
Originofthecitations1aboutcomparativestudiesoforganicandcon-ventionalfarmingonbiodiversityindifferentlandusesystems
Region more unclear less Total
Europe(fromEU27) 258(228) 48(47) 11(11) 317(286)
NorthAmerica 20 4 1 25
LatinAmerica 16 3 0 19
Asia 11 0 0 11
Africa 4 0 0 4
Oceania 9 1 1 11
miscellaneous 9 0 0 9
Total 327 56 13 396
1Multiplecitationsof343usedpapersarepossibleduetodifferentconclusionsfordifferentspecies.Source:webofsciencesearchusingEndnote®inMarch2011;seeAnnex1)
Organic farmingwas in favour for all species. The re-stricteduseofpesticidesandlownutrientinputinorganicfarmingwereidentifiedasmainfactorsforahigherbiodi-versityoffloraandfaunawasusually(FrostandArdeshir,2004).Agro-biodiversityandlandscapearchitecturewereless often identified as key parameters for biodiversity.Somefloraandfaunahaveadaptedonintensiveconven-tional farming (highnutrient level in soilsandhighcropyieldsetc.):epigaeicspiders,birds,plantslikeUrtica dioica(Nettel)(RydbergandMilberg,2000).Usuallythesefloraandfaunaisnotendangered.
4.3 Long term trials
Itseemssafetoassumethattheinfluenceofthelandusemanagement isbest reflectedandassessed in long-term field experiments. And all long-term field studies(BMELV,2005)withthetopic“organicversusconventionalfarming”(Raupp,2009)confirmtheadvantageoforganicfarming to improve biodiversity (soil biota, flora, arthro-pods):Glenlea long-termrotationstudy inCanada (Entzetal.,2005);theDOC-trialinSwitzerland(Pfiffner,1996;Fliessbachetal.,2000;Maderetal.,2002);StateResearchInstitute at Osiny in Poland (Feledyn-Szewczyk, 2008);Rodale Institute Farming Systems Trial (Hepperly et al.,2006);EkhagaExperimentalFarminSweden(Lundkvistetal.,2008);TrenthorstorganicfarmingsystemcomparisonstudyinGermany(Rahmannetal.,2006);MediterraneanArableSystemsComparisonTrial(MASCOT)and(MOLTE)in Italy (MiglioriniandVazzana,2006;Mazzoncinietal.,2010).
4.4 Other meta-analysis
Pfiffner (1996) compiled 44 studies related to faunarichness of different land usemanagement systems (Ta-ble4).Theyconcludedthatfaunaismorediverseonor-ganiccomparedtoconventional farmland.BartramandPerkins(2003)foundanadvantageoforganicfarminginbiodiversityin33UKstudies,too.Lynch(2009)analysedstudiesfromCanadaandtheUSAandconcludedthator-ganic farming contributes to diversity of cropping, floraandhabitat.Bengtssonetal. (2005)foundintheirmeta-dataanal-
ysis of literature, published before December 2002 thatorganicfarmingincreasesspeciesrichnessingeneral.Spe-cies richnesswasonaverage30%higher than in con-ventionalfarmingsystems.However,theresultswerevari-ableamongstudies,and16%ofthemactuallyshowedanegativeeffectoforganicfarmingonspeciesrichness.Onaverage,organismswere50%moreabundantinor-ganicfarmingsystems,buttheresultswerehighlyvariablebetweenstudiesandorganismgroups.Birds,predatoryin-
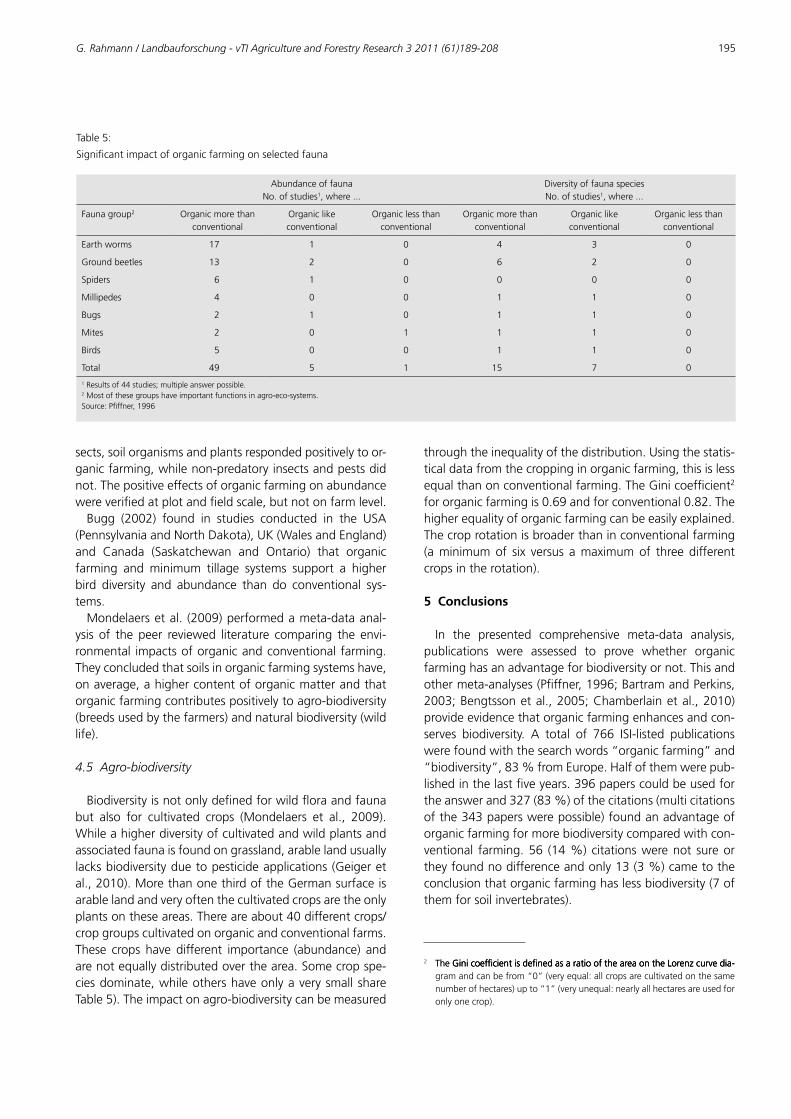
G. Rahmann / Landbauforschung - vTI Agriculture and Forestry Research 3 2011 (61)189-208 195
Table5:
Significantimpactoforganicfarmingonselectedfauna
AbundanceoffaunaNo.ofstudies1,where...
DiversityoffaunaspeciesNo.ofstudies1,where...
Faunagroup2 Organicmorethanconventional
Organiclikeconventional
Organiclessthanconventional
Organicmorethanconventional
Organiclikeconventional
Organiclessthanconventional
Earthworms 17 1 0 4 3 0
Groundbeetles 13 2 0 6 2 0
Spiders 6 1 0 0 0 0
Millipedes 4 0 0 1 1 0
Bugs 2 1 0 1 1 0
Mites 2 0 1 1 1 0
Birds 5 0 0 1 1 0
Total 49 5 1 15 7 0
1Resultsof44studies;multipleanswerpossible.2Mostofthesegroupshaveimportantfunctionsinagro-eco-systems.Source:Pfiffner,1996
sects,soilorganismsandplantsrespondedpositivelytoor-ganicfarming,whilenon-predatoryinsectsandpestsdidnot.Thepositiveeffectsoforganicfarmingonabundancewereverifiedatplotandfieldscale,butnotonfarmlevel.Bugg (2002) found in studies conducted in the USA
(PennsylvaniaandNorthDakota),UK(WalesandEngland)and Canada (Saskatchewan and Ontario) that organicfarming and minimum tillage systems support a higherbird diversity and abundance than do conventional sys-tems.Mondelaersetal. (2009)performedameta-dataanal-
ysis of the peer reviewed literature comparing the envi-ronmental impactsoforganicandconventionalfarming.Theyconcludedthatsoilsinorganicfarmingsystemshave,onaverage,ahighercontentoforganicmatterandthatorganicfarmingcontributespositivelytoagro-biodiversity(breedsusedbythefarmers)andnaturalbiodiversity(wildlife).
4.5 Agro-biodiversity
Biodiversityisnotonlydefinedforwildfloraandfaunabut also for cultivated crops (Mondelaers et al., 2009).Whileahigherdiversityofcultivatedandwildplantsandassociatedfaunaisfoundongrassland,arablelandusuallylacksbiodiversityduetopesticideapplications(Geigeretal.,2010).MorethanonethirdoftheGermansurfaceisarablelandandveryoftenthecultivatedcropsaretheonlyplantsontheseareas.Thereareabout40differentcrops/cropgroupscultivatedonorganicandconventionalfarms.These crops have different importance (abundance) andarenotequallydistributedoverthearea.Somecropspe-ciesdominate,whileothershaveonlyaverysmallshareTable5).Theimpactonagro-biodiversitycanbemeasured
throughtheinequalityofthedistribution.Usingthestatis-ticaldatafromthecroppinginorganicfarming,thisislessequalthanonconventionalfarming.TheGinicoefficient2
2 TheGinicoefficientisdefinedasaratiooftheareaontheLorenzcurvedia-TheGinicoefficientisdefinedasaratiooftheareaontheLorenzcurvedia-GinicoefficientisdefinedasaratiooftheareaontheLorenzcurvedia-gramandcanbefrom“0”(veryequal:allcropsarecultivatedonthesamenumberofhectares)upto“1”(veryunequal:nearlyallhectaresareusedforonlyonecrop).
fororganicfarmingis0.69andforconventional0.82.Thehigherequalityoforganicfarmingcanbeeasilyexplained.Thecroprotationisbroaderthaninconventionalfarming(aminimumof six versus amaximumof three differentcropsintherotation).
5 Conclusions
In the presented comprehensive meta-data analysis,publications were assessed to prove whether organicfarminghasanadvantageforbiodiversityornot.Thisandothermeta-analyses(Pfiffner,1996;BartramandPerkins,2003;Bengtssonetal.,2005;Chamberlainetal.,2010)provideevidencethatorganicfarmingenhancesandcon-serves biodiversity. A total of 766 ISI-listed publicationswerefoundwiththesearchwords“organicfarming”and“biodiversity”,83%fromEurope.Halfofthemwerepub-lishedinthelastfiveyears.396paperscouldbeusedfortheanswerand327(83%)ofthecitations(multicitationsofthe343paperswerepossible)foundanadvantageoforganicfarmingformorebiodiversitycomparedwithcon-ventional farming.56 (14%)citationswerenot sureortheyfoundnodifferenceandonly13(3%)cametotheconclusionthatorganicfarminghaslessbiodiversity(7ofthemforsoilinvertebrates).
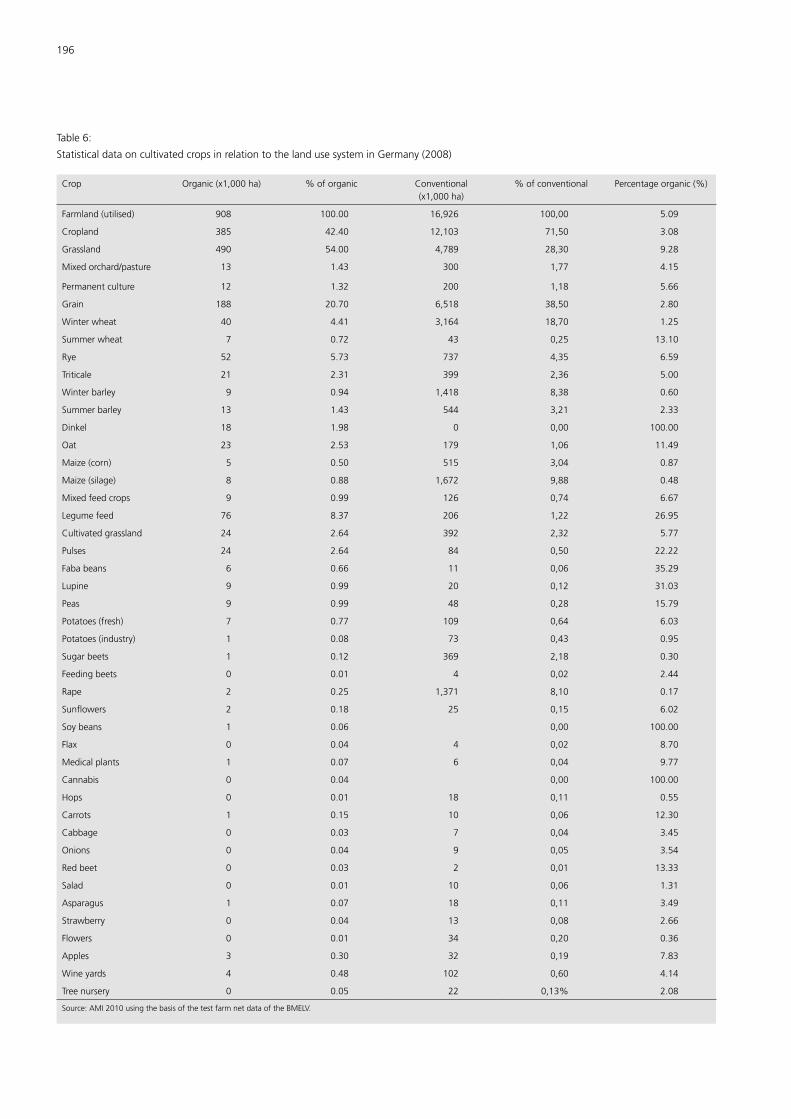
196
Table6:
StatisticaldataoncultivatedcropsinrelationtothelandusesysteminGermany(2008)
Crop Organic(x1,000ha) %oforganic Conventional(x1,000ha)
%ofconventional Percentageorganic(%)
Farmland(utilised) 908 100.00 16,926 100,00 5.09
Cropland 385 42.40 12,103 71,50 3.08
Grassland 490 54.00 4,789 28,30 9.28
Mixedorchard/pasture 13 1.43 300 1,77 4.15
Permanentculture 12 1.32 200 1,18 5.66
Grain 188 20.70 6,518 38,50 2.80
Winterwheat 40 4.41 3,164 18,70 1.25
Summerwheat 7 0.72 43 0,25 13.10
Rye 52 5.73 737 4,35 6.59
Triticale 21 2.31 399 2,36 5.00
Winterbarley 9 0.94 1,418 8,38 0.60
Summerbarley 13 1.43 544 3,21 2.33
Dinkel 18 1.98 0 0,00 100.00
Oat 23 2.53 179 1,06 11.49
Maize(corn) 5 0.50 515 3,04 0.87
Maize(silage) 8 0.88 1,672 9,88 0.48
Mixedfeedcrops 9 0.99 126 0,74 6.67
Legumefeed 76 8.37 206 1,22 26.95
Cultivatedgrassland 24 2.64 392 2,32 5.77
Pulses 24 2.64 84 0,50 22.22
Fababeans 6 0.66 11 0,06 35.29
Lupine 9 0.99 20 0,12 31.03
Peas 9 0.99 48 0,28 15.79
Potatoes(fresh) 7 0.77 109 0,64 6.03
Potatoes(industry) 1 0.08 73 0,43 0.95
Sugarbeets 1 0.12 369 2,18 0.30
Feedingbeets 0 0.01 4 0,02 2.44
Rape 2 0.25 1,371 8,10 0.17
Sunflowers 2 0.18 25 0,15 6.02
Soybeans 1 0.06 0,00 100.00
Flax 0 0.04 4 0,02 8.70
Medicalplants 1 0.07 6 0,04 9.77
Cannabis 0 0.04 0,00 100.00
Hops 0 0.01 18 0,11 0.55
Carrots 1 0.15 10 0,06 12.30
Cabbage 0 0.03 7 0,04 3.45
Onions 0 0.04 9 0,05 3.54
Redbeet 0 0.03 2 0,01 13.33
Salad 0 0.01 10 0,06 1.31
Asparagus 1 0.07 18 0,11 3.49
Strawberry 0 0.04 13 0,08 2.66
Flowers 0 0.01 34 0,20 0.36
Apples 3 0.30 32 0,19 7.83
Wineyards 4 0.48 102 0,60 4.14
Treenursery 0 0.05 22 0,13% 2.08
Source:AMI2010usingthebasisofthetestfarmnetdataoftheBMELV.
G. Rahmann / Landbauforschung - vTI Agriculture and Forestry Research 3 2011 (61)189-208 197
Long-termfieldstudieson“organicversusconventionalfarming” confirm the advantage of organic farming toimprovebiodiversityforsoilbiota,flora,arthropods(Pfiff-(Pfiff-ner,1996;Maderetal.,2002;Entzetal.,2005;Feledyn-Szewczyk,2008)andcontributetoabetterunderstand-andcontributetoabetterunderstand-ingoffunctionalbiodiversity(Wolfe,2002;Zhongetal.,2005). The impact can be found on the farm land andattachedareassuchashedges.Herbaceousfieldbounda-riesarerich inbiodiversityandcanbeusedasasepara-tionbetweenorganicandconventionalfields(Moonenetal.,2006;Gardarinetal.,2007).Ifthelocalbiodiversityisalreadypoorduetointensivefarminginthesurroundingarea,organicfarmingcannotcompensatethelossofbio-diversity.Thiswasforinstanceshownforflowervisitingin-sects(HopkinsandFeber,1997;Brittainetal.,2010).Seedbankswerenotinfluencedbymanagement(Hawesetal.,2010). It isnosuitablepoliticalsolutiontodefineprefer-. It isnosuitablepoliticalsolutiontodefineprefer-enceareasfororganic (remoteand lowproductivesoils)and conventional farming (high potential soils) as everyregionshouldhaveamixtureoforganicandconventionalfarmingsystems(Taubeetal.,2006).Conventional farming can have similar results in the
caseofcompulsoryset-asidefarmland(segregation).MacDonaldetal.(2007)andNemeceketal.(2006,2011a,b)foundadvantagesoforganicfarminginalpha-diversitybutstatethatset-asidelandonconventionalfarmscanequa-lizethisadvantage.Buton-farmsegregationlikeset-asidelandcanbeariskforlong-termbiodiversityprotection.AstheEUsettheobligationforset-asidefarmlandtozeroin2008,conventionalfarmershaveconvertedset-asidelandintocropland(Rundlofetal.,2010).Thishasbeenfollowedbylossesofbiodiversityonconventionalfarms.Agri-environmental schemes (AES) have a high im-
portance in biodiversity protection (Purtauf et al., 2005;Rund-lof et al., 2008; Taylor andMorecroft, 2009). Thiscanbecarriedoutasorganicfarming(paidundertheagri-environmentalschemes)orasapartofconventionalfarm-ing(natureprotectionareas)(Schaderetal.,2008).Goodfarmingpracticebecomesmoreimportanttoenhanceandimprovebiodiversityinorganicandconventionalfarming(RydbergandMilberg,2000;StrasserandRyffel,2010).Biodiversityassessmentisnotpartoftheinspectionproc-ess(889/2008/EC)sothatitispossiblethatitdependsonthe organic farm manager whether biodiversity will bepromotedorrepelled.Themainquestionistheantagonismbetweenfoodse-
curityandbiodiversity.Oneoptionstosolvethisproblemissegregation(conventional)andintegration(organic)(Ga-(Ga-brieletal.,2009).Differencesinbiodiversityhaveaposi-.Differencesinbiodiversityhaveaposi-tiveandanegativeimpact:Forexample,weeds,pestsandparasitesdominateinorganicfarming(morebiodiversity),are,however,negativeforcropyield,productqualityandanimalwelfare(Poetschetal.,2005;Meylingetal.,2010).
This has to be considered in the analysis of the impactofbiodiversity (LetourneauandGoldstein,2001;Letour-(LetourneauandGoldstein,2001;Letour-neauandBothwell,2008;Ryanetal.,2010).Biodiversityneedsequilibriumbetweenbiodiversityandfoodproduc-tion(Vandana,2000;Crowderetal.,2010;ChappellandLaValle,2011).Biomassproductionisanewchallengeforbiodiversityprotection,particularlyifmaizeisencroachingasamonoculture(Fritsche,2004).Inaddition,itshouldbedecided,if“organic-herbicides”areastrategy(additionaltomechanicalandtemperatureweedcontrolmeasures).Astrongargumentagainstsuchprocedureisthatorganicfarmingwould start togo conventionalwith the riskoflossofbiodiversityandlossofconsumerconfidence(Darn-(Darn-hoferetal.,2010).Holeetal. (2005) came to theconclusion, that“(1) It
remains unclear whether a ‘holistic’ whole-farm approach (i.e. organic) provides greater benefits to biodiversity than carefully targeted prescriptions applied to relatively small areas of cropped and/or non-cropped habitats within conventional agriculture (i.e. agri-environment schemes); (2) Many comparative studies encounter methodological problems, limiting their ability to draw quantitative conclu-sions; (3) Our knowledge of the impacts of organic farm-ing in pastoral and upland agriculture is limited; (4) There remains a pressing need for longitudinal, system-level studies in order to address these issues and to fill in the gaps in our knowledge of the impacts of organic farming, before a full appraisal of its potential role in biodiversity conservation in agro-ecosystems can be made”Thepresentedmeta-dataanalysisconfirmstheconclu-
sions of Hole et al. (2005). However, it is important toemphasisethefactthatnumerousstudiesfavourorganicfarmingforimprovingbiodiversityincomparisontocon-ventionalfarming.Yet,itneedstobetakenintoaccountthat farming systems (includingorganic) and farm func-tions change rapidly. Energy farming and agri-environ-mental schemes force science tounderstand the impactmorerapidlythaninpreviousyears.Forexample,biomassproduction can have a negative impact on biodiversity(maize domination) andbiogas-facilities are installed formanydecades.Infuture,theaspectsoffoodsecurityandfoodsafetywillgainincreasingimportanceirrespectiveofthelandusesystem.Putativesolutionstowardsmorebio-diversityistheuseofsetasidefarmlandforsegregationasitcanhavethesameorevenbetterimpactonbiodiver-sitythanintegratedmeasuressuchasorganicfarming.Amixtureofintensivefarmingwithsetaside,non-farmland,agri-environmental schemes and organic farmsmay de-liverahighrangeofbiodiversitythroughoutalllandscapes(Hollandetal.,2007).Aseparationofthesesystemsintospecific farmingareas (intensive/conventionalandexten-sive/organic)iscounter-productive.
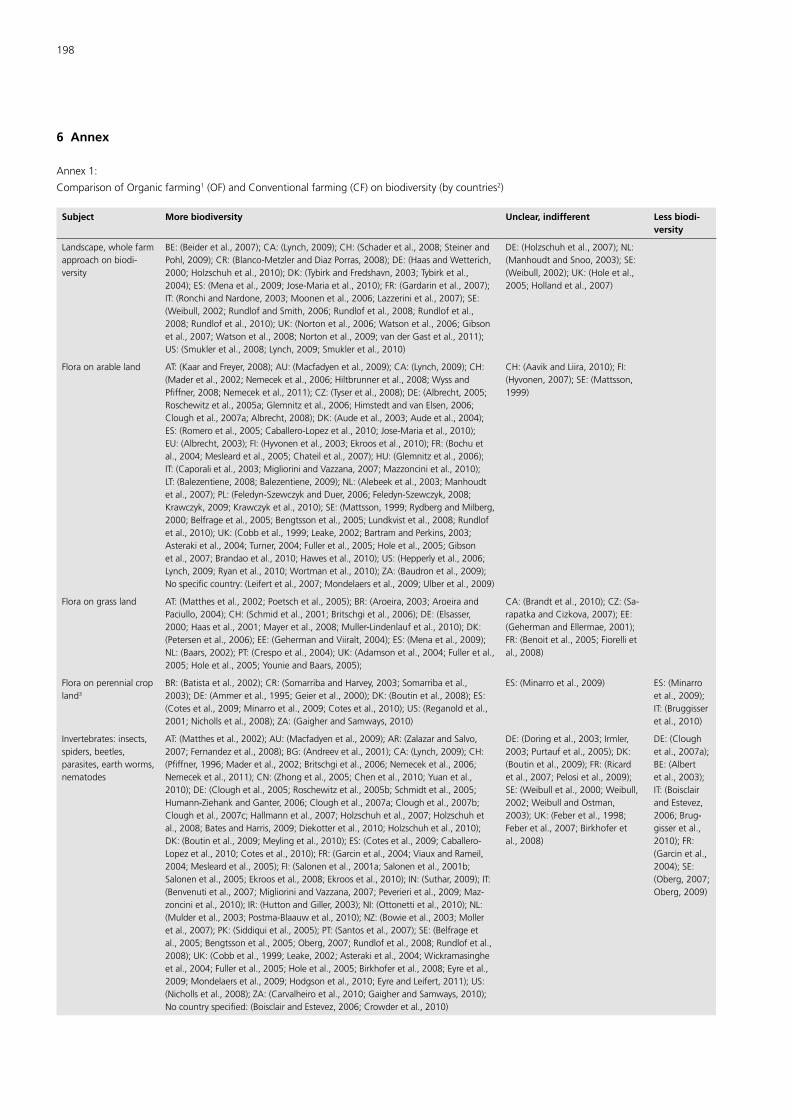
198
6 Annex
Annex1:
ComparisonofOrganicfarming1(OF)andConventionalfarming(CF)onbiodiversity(bycountries2)
Subject More biodiversity Unclear, indifferent Less biodi-versity
Landscape,wholefarmapproachonbiodi-versity
BE:(Beideretal.,2007);CA:(Lynch,2009);CH:(Schaderetal.,2008;SteinerandPohl,2009);CR:(Blanco-MetzlerandDiazPorras,2008);DE:(HaasandWetterich,2000;Holzschuhetal.,2010);DK:(TybirkandFredshavn,2003;Tybirketal.,2004);ES:(Menaetal.,2009;Jose-Mariaetal.,2010);FR:(Gardarinetal.,2007);IT:(RonchiandNardone,2003;Moonenetal.,2006;Lazzerinietal.,2007);SE:(Weibull,2002;RundlofandSmith,2006;Rundlofetal.,2008;Rundlofetal.,2008;Rundlofetal.,2010);UK:(Nortonetal.,2006;Watsonetal.,2006;Gibsonetal.,2007;Watsonetal.,2008;Nortonetal.,2009;vanderGastetal.,2011);US:(Smukleretal.,2008;Lynch,2009;Smukleretal.,2010)
DE:(Holzschuhetal.,2007);NL:(ManhoudtandSnoo,2003);SE:(Weibull,2002);UK:(Holeetal.,2005;Hollandetal.,2007)
Floraonarableland AT:(KaarandFreyer,2008);AU:(Macfadyenetal.,2009);CA:(Lynch,2009);CH:(Maderetal.,2002;Nemeceketal.,2006;Hiltbrunneretal.,2008;WyssandPfiffner,2008;Nemeceketal.,2011);CZ:(Tyseretal.,2008);DE:(Albrecht,2005;Roschewitzetal.,2005a;Glemnitzetal.,2006;HimstedtandvanElsen,2006;Cloughetal.,2007a;Albrecht,2008);DK:(Audeetal.,2003;Audeetal.,2004);ES:(Romeroetal.,2005;Caballero-Lopezetal.,2010;Jose-Mariaetal.,2010);EU:(Albrecht,2003);FI:(Hyvonenetal.,2003;Ekroosetal.,2010);FR:(Bochuetal.,2004;Mesleardetal.,2005;Chateiletal.,2007);HU:(Glemnitzetal.,2006);IT:(Caporalietal.,2003;MiglioriniandVazzana,2007;Mazzoncinietal.,2010);LT:(Balezentiene,2008;Balezentiene,2009);NL:(Alebeeketal.,2003;Manhoudtetal.,2007);PL:(Feledyn-SzewczykandDuer,2006;Feledyn-Szewczyk,2008;Krawczyk,2009;Krawczyketal.,2010);SE:(Mattsson,1999;RydbergandMilberg,2000;Belfrageetal.,2005;Bengtssonetal.,2005;Lundkvistetal.,2008;Rundlofetal.,2010);UK:(Cobbetal.,1999;Leake,2002;BartramandPerkins,2003;Asterakietal.,2004;Turner,2004;Fulleretal.,2005;Holeetal.,2005;Gibsonetal.,2007;Brandaoetal.,2010;Hawesetal.,2010);US:(Hepperlyetal.,2006;Lynch,2009;Ryanetal.,2010;Wortmanetal.,2010);ZA:(Baudronetal.,2009);Nospecificcountry:(Leifertetal.,2007;Mondelaersetal.,2009;Ulberetal.,2009)
CH:(AavikandLiira,2010);FI:(Hyvonen,2007);SE:(Mattsson,1999)
Floraongrassland AT:(Matthesetal.,2002;Poetschetal.,2005);BR:(Aroeira,2003;AroeiraandPaciullo,2004);CH:(Schmidetal.,2001;Britschgietal.,2006);DE:(Elsasser,2000;Haasetal.,2001;Mayeretal.,2008;Muller-Lindenlaufetal.,2010);DK:(Petersenetal.,2006);EE:(GehermanandViiralt,2004);ES:(Menaetal.,2009);NL:(Baars,2002);PT:(Crespoetal.,2004);UK:(Adamsonetal.,2004;Fulleretal.,2005;Holeetal.,2005;YounieandBaars,2005);
CA:(Brandtetal.,2010);CZ:(Sa-rapatkaandCizkova,2007);EE:(GehermanandEllermae,2001);FR:(Benoitetal.,2005;Fiorellietal.,2008)
Floraonperennialcropland3
BR:(Batistaetal.,2002);CR:(SomarribaandHarvey,2003;Somarribaetal.,2003);DE:(Ammeretal.,1995;Geieretal.,2000);DK:(Boutinetal.,2008);ES:(Cotesetal.,2009;Minarroetal.,2009;Cotesetal.,2010);US:(Reganoldetal.,2001;Nichollsetal.,2008);ZA:(GaigherandSamways,2010)
ES:(Minarroetal.,2009) ES:(Minarroetal.,2009);IT:(Bruggisseretal.,2010)
Invertebrates:insects,spiders,beetles,parasites,earthworms,nematodes
AT:(Matthesetal.,2002);AU:(Macfadyenetal.,2009);AR:(ZalazarandSalvo,2007;Fernandezetal.,2008);BG:(Andreevetal.,2001);CA:(Lynch,2009);CH:(Pfiffner,1996;Maderetal.,2002;Britschgietal.,2006;Nemeceketal.,2006;Nemeceketal.,2011);CN:(Zhongetal.,2005;Chenetal.,2010;Yuanetal.,2010);DE:(Cloughetal.,2005;Roschewitzetal.,2005b;Schmidtetal.,2005;Humann-ZiehankandGanter,2006;Cloughetal.,2007a;Cloughetal.,2007b;Cloughetal.,2007c;Hallmannetal.,2007;Holzschuhetal.,2007;Holzschuhetal.,2008;BatesandHarris,2009;Diekotteretal.,2010;Holzschuhetal.,2010);DK:(Boutinetal.,2009;Meylingetal.,2010);ES:(Cotesetal.,2009;Caballero-Lopezetal.,2010;Cotesetal.,2010);FR:(Garcinetal.,2004;ViauxandRameil,2004;Mesleardetal.,2005);FI:(Salonenetal.,2001a;Salonenetal.,2001b;Salonenetal.,2005;Ekroosetal.,2008;Ekroosetal.,2010);IN:(Suthar,2009);IT:(Benvenutietal.,2007;MiglioriniandVazzana,2007;Peverierietal.,2009;Maz-zoncinietal.,2010);IR:(HuttonandGiller,2003);NI:(Ottonettietal.,2010);NL:(Mulderetal.,2003;Postma-Blaauwetal.,2010);NZ:(Bowieetal.,2003;Molleretal.,2007);PK:(Siddiquietal.,2005);PT:(Santosetal.,2007);SE:(Belfrageetal.,2005;Bengtssonetal.,2005;Oberg,2007;Rundlofetal.,2008;Rundlofetal.,2008);UK:(Cobbetal.,1999;Leake,2002;Asterakietal.,2004;Wickramasingheetal.,2004;Fulleretal.,2005;Holeetal.,2005;Birkhoferetal.,2008;Eyreetal.,2009;Mondelaersetal.,2009;Hodgsonetal.,2010;EyreandLeifert,2011);US:(Nichollsetal.,2008);ZA:(Carvalheiroetal.,2010;GaigherandSamways,2010);Nocountryspecified:(BoisclairandEstevez,2006;Crowderetal.,2010)
DE:(Doringetal.,2003;Irmler,2003;Purtaufetal.,2005);DK:(Boutinetal.,2009);FR:(Ricardetal.,2007;Pelosietal.,2009);SE:(Weibulletal.,2000;Weibull,2002;WeibullandOstman,2003);UK:(Feberetal.,1998;Feberetal.,2007;Birkhoferetal.,2008)
DE:(Cloughetal.,2007a);BE:(Albertetal.,2003);IT:(BoisclairandEstevez,2006;Brug-gisseretal.,2010);FR:(Garcinetal.,2004);SE:(Oberg,2007;Oberg,2009)
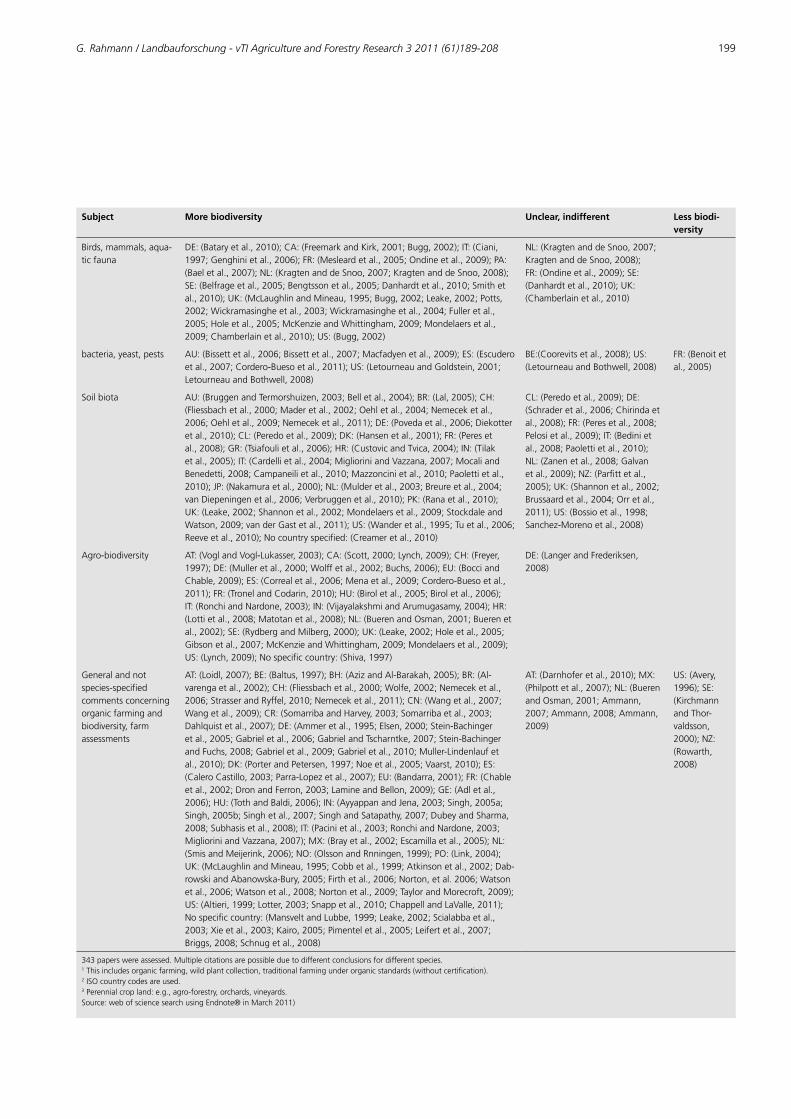
G. Rahmann / Landbauforschung - vTI Agriculture and Forestry Research 3 2011 (61)189-208 199
Subject More biodiversity Unclear, indifferent Less biodi-versity
Birds,mammals,aqua-ticfauna
DE:(Bataryetal.,2010);CA:(FreemarkandKirk,2001;Bugg,2002);IT:(Ciani,1997;Genghinietal.,2006);FR:(Mesleardetal.,2005;Ondineetal.,2009);PA:(Baeletal.,2007);NL:(KragtenanddeSnoo,2007;KragtenanddeSnoo,2008);SE:(Belfrageetal.,2005;Bengtssonetal.,2005;Danhardtetal.,2010;Smithetal.,2010);UK:(McLaughlinandMineau,1995;Bugg,2002;Leake,2002;Potts,2002;Wickramasingheetal.,2003;Wickramasingheetal.,2004;Fulleretal.,2005;Holeetal.,2005;McKenzieandWhittingham,2009;Mondelaersetal.,2009;Chamberlainetal.,2010);US:(Bugg,2002)
NL:(KragtenanddeSnoo,2007;KragtenanddeSnoo,2008);FR:(Ondineetal.,2009);SE:(Danhardtetal.,2010);UK:(Chamberlainetal.,2010)
bacteria,yeast,pests AU:(Bissettetal.,2006;Bissettetal.,2007;Macfadyenetal.,2009);ES:(Escuderoetal.,2007;Cordero-Buesoetal.,2011);US:(LetourneauandGoldstein,2001;LetourneauandBothwell,2008)
BE:(Coorevitsetal.,2008);US:(LetourneauandBothwell,2008)
FR:(Benoitetal.,2005)
Soilbiota AU:(BruggenandTermorshuizen,2003;Belletal.,2004);BR:(Lal,2005);CH:(Fliessbachetal.,2000;Maderetal.,2002;Oehletal.,2004;Nemeceketal.,2006;Oehletal.,2009;Nemeceketal.,2011);DE:(Povedaetal.,2006;Diekotteretal.,2010);CL:(Peredoetal.,2009);DK:(Hansenetal.,2001);FR:(Peresetal.,2008);GR:(Tsiafoulietal.,2006);HR:(CustovicandTvica,2004);IN:(Tilaketal.,2005);IT:(Cardellietal.,2004;MiglioriniandVazzana,2007;MocaliandBenedetti,2008;Campaneilietal.,2010;Mazzoncinietal.,2010;Paolettietal.,2010);JP:(Nakamuraetal.,2000);NL:(Mulderetal.,2003;Breureetal.,2004;vanDiepeningenetal.,2006;Verbruggenetal.,2010);PK:(Ranaetal.,2010);UK:(Leake,2002;Shannonetal.,2002;Mondelaersetal.,2009;StockdaleandWatson,2009;vanderGastetal.,2011);US:(Wanderetal.,1995;Tuetal.,2006;Reeveetal.,2010);Nocountryspecified:(Creameretal.,2010)
CL:(Peredoetal.,2009);DE:(Schraderetal.,2006;Chirindaetal.,2008);FR:(Peresetal.,2008;Pelosietal.,2009);IT:(Bedinietal.,2008;Paolettietal.,2010);NL:(Zanenetal.,2008;Galvanetal.,2009);NZ:(Parfittetal.,2005);UK:(Shannonetal.,2002;Brussaardetal.,2004;Orretal.,2011);US:(Bossioetal.,1998;Sanchez-Morenoetal.,2008)
Agro-biodiversity AT:(VoglandVogl-Lukasser,2003);CA:(Scott,2000;Lynch,2009);CH:(Freyer,1997);DE:(Mulleretal.,2000;Wolffetal.,2002;Buchs,2006);EU:(BocciandChable,2009);ES:(Correaletal.,2006;Menaetal.,2009;Cordero-Buesoetal.,2011);FR:(TronelandCodarin,2010);HU:(Biroletal.,2005;Biroletal.,2006);IT:(RonchiandNardone,2003);IN:(VijayalakshmiandArumugasamy,2004);HR:(Lottietal.,2008;Matotanetal.,2008);NL:(BuerenandOsman,2001;Buerenetal.,2002);SE:(RydbergandMilberg,2000);UK:(Leake,2002;Holeetal.,2005;Gibsonetal.,2007;McKenzieandWhittingham,2009;Mondelaersetal.,2009);US:(Lynch,2009);Nospecificcountry:(Shiva,1997)
DE:(LangerandFrederiksen,2008)
Generalandnotspecies-specifiedcommentsconcerningorganicfarmingandbiodiversity,farmassessments
AT:(Loidl,2007);BE:(Baltus,1997);BH:(AzizandAl-Barakah,2005);BR:(Al-varengaetal.,2002);CH:(Fliessbachetal.,2000;Wolfe,2002;Nemeceketal.,2006;StrasserandRyffel,2010;Nemeceketal.,2011);CN:(Wangetal.,2007;Wangetal.,2009);CR:(SomarribaandHarvey,2003;Somarribaetal.,2003;Dahlquistetal.,2007);DE:(Ammeretal.,1995;Elsen,2000;Stein-Bachingeretal.,2005;Gabrieletal.,2006;GabrielandTscharntke,2007;Stein-BachingerandFuchs,2008;Gabrieletal.,2009;Gabrieletal.,2010;Muller-Lindenlaufetal.,2010);DK:(PorterandPetersen,1997;Noeetal.,2005;Vaarst,2010);ES:(CaleroCastillo,2003;Parra-Lopezetal.,2007);EU:(Bandarra,2001);FR:(Chableetal.,2002;DronandFerron,2003;LamineandBellon,2009);GE:(Adletal.,2006);HU:(TothandBaldi,2006);IN:(AyyappanandJena,2003;Singh,2005a;Singh,2005b;Singhetal.,2007;SinghandSatapathy,2007;DubeyandSharma,2008;Subhasisetal.,2008);IT:(Pacinietal.,2003;RonchiandNardone,2003;MiglioriniandVazzana,2007);MX:(Brayetal.,2002;Escamillaetal.,2005);NL:(SmisandMeijerink,2006);NO:(OlssonandRnningen,1999);PO:(Link,2004);UK:(McLaughlinandMineau,1995;Cobbetal.,1999;Atkinsonetal.,2002;Dab-rowskiandAbanowska-Bury,2005;Firthetal.,2006;Norton,etal.2006;Watsonetal.,2006;Watsonetal.,2008;Nortonetal.,2009;TaylorandMorecroft,2009);US:(Altieri,1999;Lotter,2003;Snappetal.,2010;ChappellandLaValle,2011);Nospecificcountry:(MansveltandLubbe,1999;Leake,2002;Scialabbaetal.,2003;Xieetal.,2003;Kairo,2005;Pimenteletal.,2005;Leifertetal.,2007;Briggs,2008;Schnugetal.,2008)
AT:(Darnhoferetal.,2010);MX:(Philpottetal.,2007);NL:(BuerenandOsman,2001;Ammann,2007;Ammann,2008;Ammann,2009)
US:(Avery,1996);SE:(KirchmannandThor-valdsson,2000);NZ:(Rowarth,2008)
343paperswereassessed.Multiplecitationsarepossibleduetodifferentconclusionsfordifferentspecies.1Thisincludesorganicfarming,wildplantcollection,traditionalfarmingunderorganicstandards(withoutcertification).2ISOcountrycodesareused.3Perennialcropland:e.g.,agro-forestry,orchards,vineyards.Source:webofsciencesearchusingEndnote®inMarch2011)
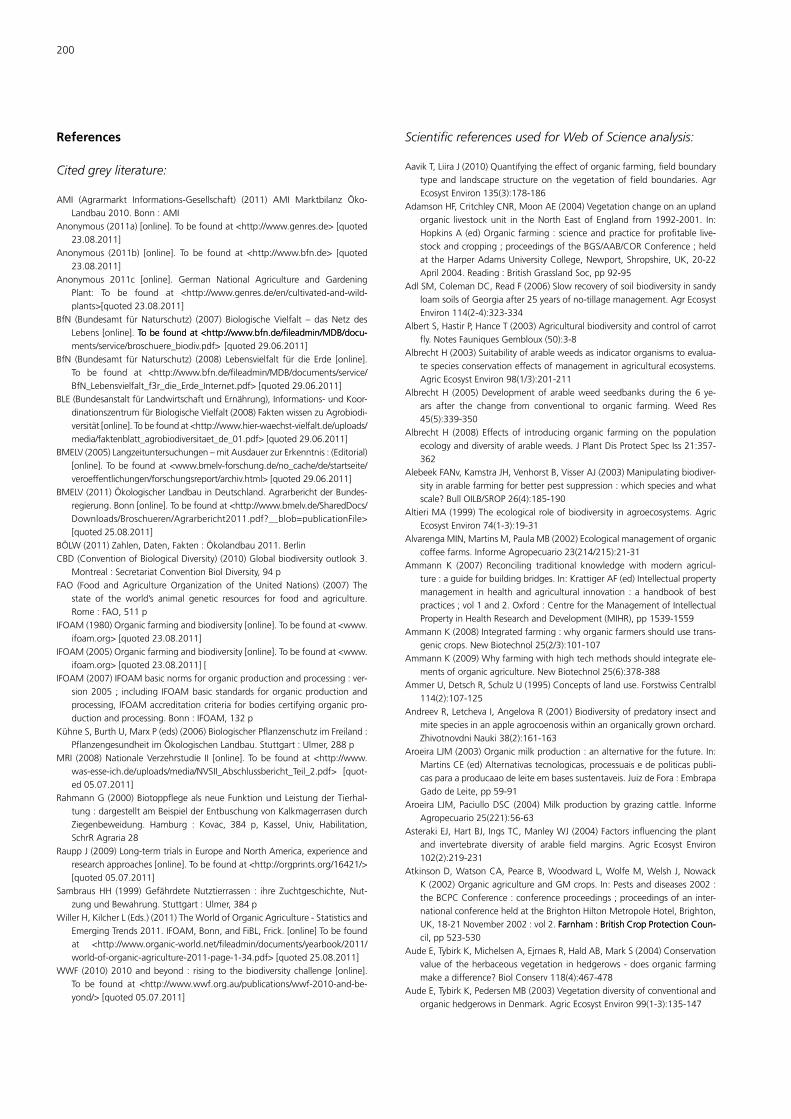
200
References
Cited grey literature:
AMI (Agrarmarkt Informations-Gesellschaft) (2011) AMI Marktbilanz Öko-Landbau2010.Bonn:AMI
Anonymous(2011a)[online].Tobefoundat<http://www.genres.de>[quoted23.08.2011]
Anonymous (2011b) [online]. To be found at <http://www.bfn.de> [quoted23.08.2011]
Anonymous 2011c [online]. German National Agriculture and GardeningPlant: To be found at <http://www.genres.de/en/cultivated-and-wild-plants>[quoted23.08.2011]
BfN (Bundesamt für Naturschutz) (2007) Biologische Vielfalt – das Netz desLebens[online].Tobefoundat<http://www.bfn.de/fileadmin/MDB/docu-Tobefoundat<http://www.bfn.de/fileadmin/MDB/docu-ments/service/broschuere_biodiv.pdf>[quoted29.06.2011]
BfN (Bundesamt für Naturschutz) (2008) Lebensvielfalt für die Erde [online].To be found at <http://www.bfn.de/fileadmin/MDB/documents/service/BfN_Lebensvielfalt_f3r_die_Erde_Internet.pdf>[quoted29.06.2011]
BLE(BundesanstaltfürLandwirtschaftundErnährung),Informations-undKoor-dinationszentrumfürBiologischeVielfalt(2008)FaktenwissenzuAgrobiodi-versität[online].Tobefoundat<http://www.hier-waechst-vielfalt.de/uploads/media/faktenblatt_agrobiodiversitaet_de_01.pdf>[quoted29.06.2011]
BMELV(2005)Langzeituntersuchungen–mitAusdauerzurErkenntnis:(Editorial)[online].Tobefoundat<www.bmelv-forschung.de/no_cache/de/startseite/veroeffentlichungen/forschungsreport/archiv.html>[quoted29.06.2011]
BMELV(2011)ÖkologischerLandbauinDeutschland.AgrarberichtderBundes-regierung.Bonn[online].Tobefoundat<http://www.bmelv.de/SharedDocs/Downloads/Broschueren/Agrarbericht2011.pdf?__blob=publicationFile>[quoted25.08.2011]
BÖLW(2011)Zahlen,Daten,Fakten:Ökolandbau2011.BerlinCBD(ConventionofBiologicalDiversity)(2010)Globalbiodiversityoutlook3.
Montreal:SecretariatConventionBiolDiversity,94pFAO (Food and Agriculture Organization of the United Nations) (2007) The
state of the world’s animal genetic resources for food and agriculture.Rome:FAO,511p
IFOAM(1980)Organicfarmingandbiodiversity[online].Tobefoundat<www.ifoam.org>[quoted23.08.2011]
IFOAM(2005)Organicfarmingandbiodiversity[online].Tobefoundat<www.ifoam.org>[quoted23.08.2011][
IFOAM(2007)IFOAMbasicnormsfororganicproductionandprocessing:ver-sion2005 ; including IFOAMbasic standards fororganicproductionandprocessing,IFOAMaccreditationcriteriaforbodiescertifyingorganicpro-ductionandprocessing.Bonn:IFOAM,132p
KühneS,BurthU,MarxP(eds)(2006)BiologischerPflanzenschutzimFreiland:PflanzengesundheitimÖkologischenLandbau.Stuttgart:Ulmer,288p
MRI (2008)NationaleVerzehrstudie II [online]. Tobe foundat<http://www.was-esse-ich.de/uploads/media/NVSII_Abschlussbericht_Teil_2.pdf> [quot-ed05.07.2011]
RahmannG(2000)BiotoppflegealsneueFunktionundLeistungderTierhal-tung:dargestelltamBeispielderEntbuschungvonKalkmagerrasendurchZiegenbeweidung. Hamburg : Kovac, 384 p, Kassel, Univ, Habilitation,SchrRAgraria28
RauppJ(2009)Long-termtrialsinEuropeandNorthAmerica,experienceandresearchapproaches[online].Tobefoundat<http://orgprints.org/16421/>[quoted05.07.2011]
SambrausHH (1999)GefährdeteNutztierrassen : ihre Zuchtgeschichte,Nut-zungundBewahrung.Stuttgart:Ulmer,384p
WillerH,KilcherL(Eds.)(2011)TheWorldofOrganicAgriculture-StatisticsandEmergingTrends2011.IFOAM,Bonn,andFiBL,Frick.[online]Tobefoundat <http://www.organic-world.net/fileadmin/documents/yearbook/2011/world-of-organic-agriculture-2011-page-1-34.pdf>[quoted25.08.2011]
WWF(2010)2010andbeyond: risingtothebiodiversitychallenge [online].To be found at <http://www.wwf.org.au/publications/wwf-2010-and-be-yond/>[quoted05.07.2011]
Scientific references used for Web of Science analysis:
AavikT,LiiraJ(2010)Quantifyingtheeffectoforganicfarming,fieldboundarytypeand landscape structureon the vegetationoffieldboundaries.AgrEcosystEnviron135(3):178-186
AdamsonHF,CritchleyCNR,MoonAE(2004)Vegetationchangeonanuplandorganic livestockunit in theNorth East of England from1992-2001. In:HopkinsA(ed)Organicfarming:scienceandpracticeforprofitable live-stockandcropping;proceedingsoftheBGS/AAB/CORConference;heldattheHarperAdamsUniversityCollege,Newport,Shropshire,UK,20-22April2004.Reading:BritishGrasslandSoc,pp92-95
AdlSM,ColemanDC,ReadF(2006)SlowrecoveryofsoilbiodiversityinsandyloamsoilsofGeorgiaafter25yearsofno-tillagemanagement.AgrEcosystEnviron114(2-4):323-334
AlbertS,HastirP,HanceT(2003)Agriculturalbiodiversityandcontrolofcarrotfly.NotesFauniquesGembloux(50):3-8
AlbrechtH(2003)Suitabilityofarableweedsasindicatororganismstoevalua-tespeciesconservationeffectsofmanagementinagriculturalecosystems.AgricEcosystEnviron98(1/3):201-211
AlbrechtH (2005)Developmentofarableweed seedbanksduring the6 ye-ars after the change from conventional to organic farming. Weed Res45(5):339-350
AlbrechtH (2008) Effects of introducingorganic farmingon thepopulationecologyanddiversityofarableweeds.JPlantDisProtectSpecIss21:357-362
AlebeekFANv,KamstraJH,VenhorstB,VisserAJ(2003)Manipulatingbiodiver-sityinarablefarmingforbetterpestsuppression:whichspeciesandwhatscale?BullOILB/SROP26(4):185-190
AltieriMA(1999)Theecologicalroleofbiodiversityinagroecosystems.AgricEcosystEnviron74(1-3):19-31
AlvarengaMIN,MartinsM,PaulaMB(2002)Ecologicalmanagementoforganiccoffeefarms.InformeAgropecuario23(214/215):21-31
Ammann K (2007) Reconciling traditional knowledge with modern agricul-ture:aguideforbuildingbridges.In:KrattigerAF(ed)Intellectualpropertymanagement inhealthandagricultural innovation : ahandbookofbestpractices;vol1and2.Oxford:CentrefortheManagementofIntellectualPropertyinHealthResearchandDevelopment(MIHR),pp1539-1559
AmmannK(2008)Integratedfarming:whyorganicfarmersshouldusetrans-geniccrops.NewBiotechnol25(2/3):101-107
AmmannK(2009)Whyfarmingwithhightechmethodsshouldintegrateele-mentsoforganicagriculture.NewBiotechnol25(6):378-388
AmmerU,DetschR,SchulzU(1995)Conceptsoflanduse.ForstwissCentralbl114(2):107-125
AndreevR,LetchevaI,AngelovaR(2001)Biodiversityofpredatoryinsectandmitespeciesinanappleagrocoenosiswithinanorganicallygrownorchard.ZhivotnovdniNauki38(2):161-163
AroeiraLJM(2003)Organicmilkproduction:analternativeforthefuture.In:MartinsCE(ed)Alternativastecnologicas,processuaisedepoliticaspubli-casparaaproducaaodeleiteembasessustentaveis.JuizdeFora:EmbrapaGadodeLeite,pp59-91
AroeiraLJM,PaciulloDSC (2004)Milkproductionbygrazingcattle. InformeAgropecuario25(221):56-63
AsterakiEJ,HartBJ,IngsTC,ManleyWJ(2004)Factorsinfluencingtheplantand invertebrate diversity of arable field margins. Agric Ecosyst Environ102(2):219-231
AtkinsonD,WatsonCA,PearceB,WoodwardL,WolfeM,WelshJ,NowackK(2002)OrganicagricultureandGMcrops.In:Pestsanddiseases2002:theBCPCConference:conferenceproceedings;proceedingsofaninter-nationalconferenceheldattheBrightonHiltonMetropoleHotel,Brighton,UK,18-21November2002:vol2.Farnham:BritishCropProtectionCoun-Farnham:BritishCropProtectionCoun-cil,pp523-530
AudeE,TybirkK,MichelsenA,EjrnaesR,HaldAB,MarkS(2004)Conservationvalueoftheherbaceousvegetationinhedgerows-doesorganicfarmingmakeadifference?BiolConserv118(4):467-478
AudeE,TybirkK,PedersenMB(2003)VegetationdiversityofconventionalandorganichedgerowsinDenmark.AgricEcosystEnviron99(1-3):135-147
G. Rahmann / Landbauforschung - vTI Agriculture and Forestry Research 3 2011 (61)189-208 201
AveryDT(1996)Thefarmers’pleatoenvironmentalists.JAgribusiness14(1):1-14
Ayyappan S, Jena JK (2003) Grow-out production of carps in India. J ApplAquacult13(3/4):251-282
AzizRATA,Al-BarakahFN(2005)Compostingtechnologyandthe impactof/icompost/onsoilbiochemicalproperties.ArabGulfJSciRes23(2):80-91
BaarsT(2002)Botanicaldiversityofconventionalandorganicpasturesinrela-tiontomineralinputs.GrasslandSciEurope7:760-761
BaelSAv,BichierP,OchoaI,GreenbergR(2007)BirddiversityincacaofarmsandforestfragmentsofwesternPanama.BiodiversConserv16(8):2245-2256
BalezentieneL(2008)Organicandintensivefarmingimpactonphytodiversity.Vagos(79):30-36
BalezentieneL(2009)Phytocenoticalapproachtosynanthropicspeciesinorga-nicfarm.Vagos(83):7-12
BaltusC (1997) Incentives for the conservationof genetic diversity for agri-culture1agriculturalprogrammes for the conservationofbiodiversity inBelgium.BASE:BiotechnolAgronSocieteEnvironnement1(3):178-186
BandarraNJ (2001)Theagri-environment in ruraldevelopmentplans (2000-2006).RevMarcheCommunUnionEurop(449):405-414
BartramH,PerkinsA(2003)Thebiodiversitybenefitsoforganicfarming. In:Organicagriculture:sustainability,marketsandpolicies:OECDworkshoponOrganicAgricultureheldon23-26September2002inWashington,DC.Paris:OECD,pp77-93
BataryP,MatthiesenT,TscharntkeT(2010)Landscape-moderatedimportanceofhedgesinconservingfarmlandbirddiversityoforganicvs.conventionalcroplandsandgrasslands.BiolConserv143(9):2020-2027
BatesFS,HarrisS(2009)Doeshedgerowmanagementonorganicfarmsbe-nefitsmallmammalpopulations?AgricEcosystEnviron129(1-3):124-130
BatistaDCP,AzevedoECGd,BernhardT(2002)Viabilidadedaproducaoecolig-icanointeriordeMontenegro,RS.CadernodePesquisaSerBiol14(2):7-15
BaudronF,CorbeelsM,MonicatF,GillerKE(2009)Cottonexpansionandbio-diversity loss inAfricansavannahs,opportunitiesandchallengesforcon-servationagriculture:areviewpaperbasedontwocasestudies.BiodiversConserv18(10):2625-2644
BediniS,CristaniC,AvioL,SbranaC,TurriniA,GiovannettiM(2008) Influ-enceoforganicfarmingonarbuscularmycorrhizalfungalpopulationsinaMediterraneanagro-ecosystem.In:NeuhoffD,HalsbergN,AlföldiT(eds)CultivatingtheFutureBasedonScience:vol1:Organiccropproduction;proceedingsoftheSecondScientificConferenceofthe InternationalSo-ciety ofOrganicAgriculture Research (ISOFAR), held at the 16th IFOAMOrganicWorldCongressinCooperationwiththeInternationalFederationofOrganicAgricultureMovements(IFOAM)andtheConsorzioModenaBio,18-20June2008inModena,Italy.Bonn:ISOFAR,pp172-175
BeiderE,EldersonJ,SchellingG(2007)EffectofthesurroundinglandscapeontheabundanceofcabbageaphidinBrusselssproutfields.BullOILB/SROP30(8):31-36
BelfrageK, Bjorklund J, Salomonsson L (2005) The effects of farm size andorganicfarmingondiversityofbirds,pollinators,andplantsinaSwedishlandscape.Ambio34(8):582-588
BellM,SeymourN,StirlingG,ZwietenLv,SuttonG,MoodyP(2004)ImpactofmanagementpracticesonactivityofsoilbiotaandproductivityconstraintsinVertosolsofthenortherngrainsregion.In:Lines-KellyR(ed)Soilbiologyinagriculture:proceedingsofaworkshoponcurrentresearchintosoilbiol-ogyinagricuture;TamworthSustainableFarmingCentre,Australia,11-12August2004.Orange:NSWAgriculture,pp18-24
BengtssonJ,AhnstromJ,WeibullAC(2005)Theeffectsoforganicagricultureonbiodiversityandabundance:ameta-analysis.JApplEcol42(2):261-269
BenoitM,HerveT, Jean-PierreD, JacquesC,SophieP (2005)Conversionofalambproductionsystemtoorganicfarming:howtomanage,forwhatresults?In:KöpkeU,NiggliU,NeuhoffD,CornishP,LockeretzW,WillerH(eds)Researchingsustainablesystems :proceedingsof theFirstScientificConference of the International Society ofOrganicAgriculture Research(ISOFAR),heldincooperationwiththeInternationalFederationofOrganicAgricultureMovements(IFOAM)andtheNationalAssociationforSustain-able Agriculture, Australia (NASAA), 21-23 September 2005, Adelaide,SouthAustralia.Bonn:ISOFAR,pp584-587
Benvenuti S, LoddoD,BasteriG,RussoA (2007) Insect-pollinatedweedsasindicator of the agroecosystem biodiversity. Agricoltura Mediterranea137(3/4):132-137
BirkhoferK,FliessbachA,WiseDH,ScheuS(2008)Generalistpredatorsinor-ganicallyandconventionallymanagedgrass-cloverfields:implicationsforconservationbiologicalcontrol.AnnApplBiol153(2):271-280
BirolE,SmaleM,GyovaiA(2005)ExplainingfarmerdemandforagriculturalbiodiversityinHungary‘stransitioneconomy.In:SmaleM(ed)Valuingcropbiodiversity : on-farm genetic resources and economic change.Walling-Walling-ford:CABI,pp119-145
BirolE,SmaleM,GyovaiA(2006)Usingachoiceexperimenttoestimatefar-mers’valuationofagrobiodiversityonHungariansmallfarms.EnvironRe-sourceEcon34(4):439-469
BissettA,BowmanJ,BurkeC(2006)Bacterialdiversityinorganically-enrichedfishfarmsediments.FemsMicrobiolEcol55(1):48-56
BissettA,BurkeC,CookPL,BowmanJP(2007)Bacterialcommunityshiftsinorganicallyperturbedsediments.EnvironMicrobiol9(1):46-60
Blanco-MetzlerH,DiazPorrasA(2008)Organizationofasustainableagrofo-restrymodelforsmallfarmersintheMontesdeOroRegion,Puntarenas,CostaRica.In:NeuhoffD,HalsbergN,AlföldiT(eds)CultivatingtheFutureBased on Science : vol 1:Organic crop production ; proceedings of theSecondScientificConferenceoftheInternationalSocietyofOrganicAgri-cultureResearch(ISOFAR),heldatthe16thIFOAMOrganicWorldCongressin Cooperationwith the International Federation of Organic AgricultureMovements(IFOAM)andtheConsorzioModenaBio,18-20June2008inModena,Italy.Bonn:ISOFAR,pp734-737
BocciR,ChableV(2009)PeasantseedsinEurope:stakesandprospects.JAgricEnvironInternatDevelop103(1/2):81-93
Bochu JL, Pointereau P, Ravier S, Doublet S (2004) Towards taking a betteraccountoftheenvironmentinarablecropsinMidi-Pyrenees.Courrierdel’Environnementdel’INRA(51):19-30
Boisclair J,EstevezB (2006) Insectpestmanagement inorganicagriculture :actinginharmonywithcomplexity.Phytoprotection87(2):83-90
BossioDA,ScowKM,GunapalaN,GrahamKJ(1998)Determinantsofsoilmi-crobialcommunities:effectsofagriculturalmanagement,season,andsoiltypeonphospholipidfattyacidprofiles.MicrobEcol36(1):1-12
BoutinC,BarilA,MartinPA (2008) Plantdiversity in cropfields andwoodyhedgerowsoforganicandconventional farms incontrasting landscapes.AgricEcosystEnviron123(1-3):185-193
BoutinC,MartinPA,BarilA(2009)Arthropoddiversityasaffectedbyagricul-turalmanagement(organicandconventionalfarming),plantspecies,andlandscapecontext.Ecoscience16(4):492-501
BowieM,WrattenS,TylianakisJ(2003)Anintroductiontoentomologicalre-searchonKowhaiFarm:theHeinzWattie‘sorganicfarmatLincolnUni-versity.Weta25:18-23
BrandaoM,CliftR,MilaiCanalsL,BassonL (2010)A life-cycleapproach tocharacterising environmental and economic impacts of multifunction-al land-use systems : an integrated assessment in the UK. Sustainability2(12):3747-3776
BrandtSA,ThomasAG,OlfertOO,LeesonJY,UlrichD,WeissR(2010)Design,rationale andmethodological considerations for a long term alternativecroppingexperimentintheCanadianplainregion.EurJAgron32(1):73-79
BrayDB,SanchezJLP,MurphyEC(2002)SocialdimensionsoforganiccoffeeproductioninMexico:lessonsforeco-labelinginitiatives.SocNatResour15(5):429-446
Breure AM,Mulder C, RutgersM, Schouten AJ,Wijnen HJv (2004) Below-groundbiodiversityasanindicatorforsustainabilityofsoiluse.GrasslandSciEurope9:195-197
BriggsS(2008)Organiccerealandpulseproduction:acompleteguide.Marl-borough:CrowoodPr,432p
BritschgiA,SpaarR,ArlettazR(2006)Impactofgrasslandfarmingintensifica-tiononthebreedingecologyofan indicator insectivorouspasserine, theWhinchatSaxicolarubetra : lessonsforoverallAlpinemeadowlandman-agement.BiolConserv130(2):193-205
202
BrittainC,BommarcoR,VighiM,SetteleJ,PottsSG(2010)Organicfarminginisolatedlandscapesdoesnotbenefitflower-visitinginsectsandpollination.BiolConserv143(8):1860-1867
Bruggen AHCv, Termorshuizen AJ (2003) Integrated approaches to root di-seasemanagement inorganic farmingsystems.AustralasianPlantPathol32(2):141-156
BruggisserOT,Schmidt-EntlingMH,BacherS (2010)Effectsof vineyardma-nagementonbiodiversityatthreetrophiclevels.BiolConserv143(6):1521-1528
BrussaardL,KuyperTW,DiddenWAM,GoedeRGMd,BloemJ(2004)Biologicalsoilqualityfrombiomasstobiodiversity:importanceandresiliencetoman-agementstressanddisturbance.In:SchjnningP,ElmholtS,ChristensenBT(eds)Managingsoilquality:challengesinmodernagriculture.Wallingford:CABI,pp139-161
BuchsW(2003)Biodiversityandagri-environmentalindicators:generalscopesandskillswithspecialreferencetothehabitatlevel.AgricEcosystEnviron98(1-3):35-78
BuchsW,HarenbergA,ZimmermannJ,WeissB (2003)Biodiversity, theulti-mateagri-environmentalindicator?Potentialandlimitsfortheapplicationoffaunisticelementsasgradualindicatorsinagroecosystems.AgricEcosystEnviron98(1-3):99-123
BuerenELv,OsmanA(2001)StimulatingGMO-freebreedingfororganicagri-culture:aviewfromEurope.Leisa17(4):12-14
BuerenETLv,StruikPC,JacobsenE(2002)Ecologicalconceptsinorganicfar-mingandtheirconsequences foranorganiccrop ideotype.Neth JAgricSci50(1):1-26
BuggRL(2002)Restorationecologyandconservationbiologyinagriculture:part II [online]. To be found at <http://www.sarep.ucdavis.edu/newsltr/v14n1/technical-1.htm>[quoted06.07.2011]
Caballero-LopezB,Blanco-MorenoJM,PerezN,Pujade-VillarJ,VenturaD,Oli-va F, Sans FX (2010)A functionalapproach toassessingplant-arthropodinteractioninwinterwheat.AgricEcosystEnviron137(3-4):288-293
CaleroCastilloC (2003) Ecologicalproductionkeyaspects.Agricultura (Ma-drid),72(849):200-204
CampaneiliG,FerrariV,BertoneA,LeteoF,MancinelliG,ScalzoRl,CesareLFd,Sgolastra F,Ramilli F,BurgioG (2010)Comparisonbetweenorganicandconventionalagriculturalecosystems.ItalusHortus17(2):36-38
CaporaliF,MancinelliR,CampigliaE(2003)Indicatorsofcroppingsystemdi-versityinorganicandconventionalfarmsincentralItaly.IntJAgricSustain-IntJAgricSustain-ability1(1):67-72
CardelliR,Levi-MinziR,SaviozziA,RiffaldiR(2004)Organicallyandconven-tionally managed soils : biochemical characteristics. J Sustainable Agric25(2):63-74
CarvalheiroLG,SeymourCL,VeldtmanR,NicolsonSW(2010)Pollinationser-vices declinewith distance from natural habitat even in biodiversity-richareas.JApplEcol47(4):810-820
ChableV,ChiffoleauY,ChittritJJ,DreyfusF,JaillardB,LagadecFl,ConseilM,JeuneBl,LeaR,MiossecR(2002)Biologicalvegetableculture:thevarietalchallenge example of cabbages and cauliflowers in Brittany. PHMRevueHorticole(443/Suppl):xiv-xvii
ChamberlainDE,JoysA,JohnsonPJ,NortonL,FeberRE,FullerRJ(2010)Doesorganicfarmingbenefitfarmlandbirdsinwinter?BiolLett6(1):82-84
ChappellMJ,LaValleLA(2011)Foodsecurityandbiodiversity :canwehaveboth?:anagroecologicalanalysis.AgricHumValues28(1):3-26
ChateilC,AbadieJC,GachetS,MachonN,PorcherE(2007)Canagri-environ-mentalmeasuresbenefitplantbiodiversity?Anexperimentaltestoftheef-fectsofChenYQ,LiQ,ChenYL,WangSM,YangYC(2010)Lac-production,arthropodbiodiversityandabundance,andpesticideuseinYunnanProvin-ce,China.TropEcol51(2):255-263
ChirindaN,OlesenJE,PorterJR(2008)Effectsoforganicmatterinputonsoilmicrobialpropertiesandcropyieldsinconventionalandorganiccroppingsystems. In:NeuhoffD,HalsbergN,AlföldiT (eds)CultivatingtheFutureBased on Science : vol 1:Organic crop production ; proceedings of theSecondScientificConferenceoftheInternationalSocietyofOrganicAgri-cultureResearch(ISOFAR),heldatthe16thIFOAMOrganicWorldCongress
in Cooperationwith the International Federation of Organic AgricultureMovements(IFOAM)andtheConsorzioModenaBio,18-20June2008inModena,Italy.Bonn:ISOFAR,pp56-59
Ciani F (1997) Problems and perspective for a correct zootechnic-faunisticmanagementofwildanddomesticanimalsinprotectedareas.ZootecNutrAnim23(5):65-68
CloughY,HolzschuhA,GabrielD,PurtaufT,KleijnD,KruessA,Steffan-De-wenterI,TscharntkeT(2007a)Alphaandbetadiversityofarthropodsandplantsinorganicallyandconventionallymanagedwheatfields.JApplEcol44(4):804-812
Clough Y, Kruess A, Kleijn D, Tscharntke T (2005) Spider diversity in cerealfields:comparingfactorsatlocal,landscapeandregionalscales.JBiogeogr32(11):2007-2014
CloughY,KruessA,TscharntkeT(2007b)Organicversusconventionalarablefarming systems : functional grouping helps understand staphylinid re-sponse.AgricEcosystEnviron118(1-4):285-290
CloughY,KruessA,TscharntkeT(2007c)Localandlandscapefactors indif-ferentlymanagedarablefieldsaffecttheinsectherbivorecommunityofanon-cropplantspecies.JApplEcol44(1):22-28
CobbD,FeberR,HopkinsA,StockdaleL,O’RiordanT,ClementsB,FirbankL,GouldingK, JarvisS,MacdonaldD (1999) Integrating theenvironmentalandeconomicconsequencesofconvertingtoorganicagriculture:evidencefromacasestudy.LandUsePolicy16(4):207-221
CoorevitsA,DeJongheV,VandroemmeJ,ReekmansR,HeyrmanJ,MessensW,DeVosP,HeyndrickxM(2008)Comparativeanalysisofthediversityofaerobicspore-formingbacteriainrawmilkfromorganicandconventionaldairyfarms.SystemApplMicrobiol31(2):126-140
Cordero-BuesoG,ArroyoT,SerranoA,Tello J,Aporta I,VelezMD,ValeroE(2011)Influenceofthefarmingsystemandvinevarietyonyeastcommu-nitiesassociatedwithgrapeberries.IntJFoodMicrobiol145(1):132-139
Correal E, RobledoA, Rios S, RiveraD (2006)Mediterraneandrylandmixedsheep-cerealsystems.GrasslandSciEurope11:14-26
CotesB,CamposM,PascualF,GarciaPA,RuanoF(2010)Comparingtaxono-miclevelsofepigealinsectsunderdifferentfarmingsystemsinAndalusianoliveagroecosystems.ApplSoilEcol44(3):228-236
CotesB,CastroJ,CardenasM,CamposM(2009)Responsesofepigealbeetlestotheremovalofweedcovercropsinorganicoliveorchards.BullInsectol62(1):47-52
Creamer RE, Brennan F, FentonO,HealyMG, Lalor STJ, LaniganGJ, ReganJT,GriffithsBS (2010) Implicationsoftheproposedsoil frameworkdirec-tiveonagriculturalsystemsinatlanticEurope:areview.SoilUseManage26(3):198-211
CrespoDG,BarradasAMC,SantosPV,CarneiroJPG(2004)Sustainableimpro-vementofMediterraneanpastures.GrasslandSciEurope9:840-842
CrowderDW,NorthfieldTD,StrandMR,SnyderWE(2010)Organicagriculturepromotesevennessandnaturalpestcontrol.Nature466(7302):109-112
Custovic H, TvicaM (2004) Organic agriculture and soil biodiversity. RadoviPoljoprivrednogFakultetaUniverzitetauSarajevu49(54(2)):143-155
DabrowskiZT,Abanowska-BuryD(2005)Extendedimpactsofecologicalfarm-ing:theUnitedKingdomexperience.NowosciWarzywnicze41:51-64
DahlquistRM,WhelanMP,WinowieckiL,PolidoroB,CandelaS,HarveyCA,Wulfhorst JD,McDaniel PA,Bosque-PerezNA (2007) Incorporating liveli-hoodsinbiodiversityconservation:acasestudyofcacaoagroforestrysys-temsinTalamanca,CostaRica.BiodiversConserv16(8):2311-2333
DanhardtJ,GreenM,LindstromA,RundlofM,SmithHG(2010)Farmlandasstopoverhabitatformigratingbirds:effectsoforganicfarmingandland-scapestructure.Oikos119(7):1114-1125
DarnhoferI,LindenthalT,Bartel-KratochvilR,ZollitschW(2010)Convention-alisation of organic farming practices : from structural criteria towardsanassessmentbasedonorganicprinciples ;areview.AgronSustainDev30(1):67-81
DiekotterT,WamserS,WoltersV,BirkhoferK(2010)Landscapeandmanage-menteffectson structureand functionof soil arthropodcommunities inwinterwheat.AgricEcosystEnviron137(1-2):108-112
Doring TF, Hiller A,Wehke S, Schulte G, Broll G (2003) Biotic indicators ofcarabidspeciesrichnessonorganicallyandconventionallymanagedarable
G. Rahmann / Landbauforschung - vTI Agriculture and Forestry Research 3 2011 (61)189-208 203
fields.AgricEcosystEnviron98(1/3):133-139DronD,FerronP(2003)Biologicaldiversityandagriculture:functionsandsta-
kes.DossiersEnvironnementINRA(23):153-178DubeyOP, SharmaOP (2008)Crop protection in organic agriculture : huge
potential.In:GoelSC(ed)Emergingtrendsofresearchesininsectpestman-agementandenvironmentalsafety.Muzaffarnagar:UttarPradeshZoologi-calSociety,InsectEnvironment8-9:17-22
EkroosJ,HyvonenT,TiainenJ,TiiraM(2010)Responsesinplantandcarabidcommunitiestofarmingpractisesinboreallandscapes.apes.AgricAgricEcosystEcosystEnviEnvi--ron135(4):288-293
Ekroos J, Piha M, Tiainen J (2008) Role of organic and conventional fieldboundaries on boreal bumblebees and butterflies. Agric Ecosyst Environ124(3-4):155-159
ElsasserM(2000)Theimpactofextensiveandintensivepasturesystemsonor-ganicmatterdigestibilityandforageintake.BerLandwirtsch78(3):437-453
ElsenTv (2000) Speciesdiversity as a task fororganic agriculture in Europe.AgricEcosystEnviron77(1/2):101-109
EntzM,Hoeppner JW,Wilson L, TenutaM, BamfordKC,HollidayN (2005)Influenceoforganicmanagementwithdifferentcroprotationsonselectedproductivityparametersinalong-termCanadianfieldstudy.In:KöpkeU,Niggli U,NeuhoffD,Cornish P, LockeretzW,WillerH (eds) Researchingsustainablesystems:proceedingsoftheFirstScientificConferenceoftheInternationalSocietyofOrganicAgricultureResearch(ISOFAR),heldinco-operationwiththeInternationalFederationofOrganicAgricultureMove-ments (IFOAM)and theNationalAssociation for SustainableAgriculture,Australia (NASAA), 21-23 September 2005, Adelaide, South Australia.Bonn:ISOFAR,pp206-209
EscamillaPE,RuizRO,DiazPG,LanderosSC,PlatasRDE,ZamarripaCA,Gonzal-ezHVA(2005)ThecoffeeagroecosysteminMexico.ManejoIntegradodePlagasyAgroecologia(76):5-16
EscuderoA,VilajeliuM,Batllori JL, FerragutF (2007)EffectofdifferentpestcontrolstrategiesonphytophagousandpredatorymitesinappleorchardsofGirona(NEofSpain).BulletinOILB/SROP30(4):75-75
EyreMD,Labanowska-BuryD,AvayanosJG,WhiteR,LeifertC(2009)Groundbeetles(Coleoptera,Carabidae)inanintensivelymanagedvegetablecroplandscapeineasternEngland.AgricEcosystEnviron131(3-4):340-346
EyreMD,LeifertC(2011)Cropandfieldboundary influencesontheactivityofawiderangeofbeneficialinvertebrategroupsonasplitconventional/organicfarminnorthernEngland.BullEntomolRes101(2):135-144
FeberRE,BellJ,JohnsonPJ,FirbankLG,MacdonaldDW(1998)Theeffectsoforganicfarmingonsurface-activespider(Araneae)assemblagesinwheatinsouthernEngland,UK.JArachnol26(2):190-202
FeberRE,JohnsonPJ,FirbankLG,HopkinsA,MacdonaldDW(2007)Acompa-risonofbutterflypopulationsonorganicallyandconventionallymanagedfarmland.JZool273(1):30-39
Feledyn-SzewczykB(2008)Thechangesofbiodiversityofweedflorainorganicsystemintheyears1996-2007.JResApplAgricEng53(3):63-68
Feledyn-SzewczykB,Duer I (2006)Thecomparisonofthestructureofweedcommunityinwinterwheatcultivatedindifferentcropproductionsystemsusingecologicalindices.FragmentaAgronomica23(4):79-93
FernandezDE,CichonLI,SanchezEE,GarridoSA,GittinsC (2008)Effectofdifferentcovercropsonthepresenceofarthropodsinanorganicapple(/iMalusdomestica/Borkh)orchard.JSustainableAgric32(2):197-211
FiorelliJL,CoquilX,GouttenoireL,GaujourE,BazardC,TrommenschlagerJM,MignoletC(2008)EvaluatinganorganiclowinputgrasslanddairysystemfarmingonpermanentpasturesineasternFrance(Vosgeslowland).GrassGrass--landSciEurope13:980-982
Firth C, Cubison S, Cross J (2006) The challenges and potential benefits ofperennialorganiccroppingsystems-exampleoforganictopfruit.AspApplBiol(79):97-101
FliessbachA,MäderP,DuboisD,GunstL(2000)Resultsfroma21yearoldfieldtrial:organicfarmingenhancessoilfertilityandbiodiversity.Frick:FiBL,15p,FiBLdossier1/2000
FreemarkKE,KirkDA(2001)BirdsonorganicandconventionalfarmsinOn-tario:partitioningeffectsofhabitatandpracticesonspeciescompositionandabundance.BiolConserv101(3):337-350
FreyerB(1997)Coefficientsofdurabilityof317arableecologicalagricultureenterprisesinSwitzerland,evaluatedonthebasisofinspectiondata.SchrRInstOrgLandbau4:103-108
FritscheUR(2004)Bioenergy :progress for ruralareas.EntwicklLändlRaum38(5):25-28
Frost D, Ardeshir D (2004) Monitoring the effects of the organic farmingschemeinWales:preliminaryfindings.In:HopkinsA(ed)Organicfarming:scienceandpracticeforprofitablelivestockandcropping;proceedingsoftheBGS/AAB/CORConferenceheldat theHarperAdamsUniversityCol-lege,Newport,Shropshire,UK,20-22April2004.Reading:BGS,pp23-26.BGSOccasionalSymposium/BGS37
FullerRJ,NortonLR,FeberRE,JohnsonPJ,ChamberlainDE,JoysAC,MathewsF,StuartRC,TownsendMC,ManleyWJ,WolfeMS,MacdonaldDW,FirbankLG(2005)Benefitsoforganicfarmingtobiodiversityvaryamongtaxa.BiolLett1(4):431-434
GabrielD,CarverSJ,DurhamH,KuninWE,PalmerRC,SaitSM,StaglS,BentonTG(2009)Thespatialaggregationoforganic farming inEnglandand itsunderlyingenvironmentalcorrelates.JApplEcol46(2):323-333
GabrielD,RoschewitzI,TscharntkeT,ThiesC(2006)Betadiversityatdifferentspatialscales:plantcommunitiesinorganicandconventionalagriculture.EcolAppl16(5):2011-2021
GabrielD,SaitSM,HodgsonJA,SchmutzU,KuninWE,BentonTG(2010)Scalematters:theimpactoforganicfarmingonbiodiversityatdifferentspatialscales.EcolLett13(7):858-869
GabrielD, Tscharntke T (2007) Insect pollinatedplants benefit fromorganicfarming.AgricEcosystEnviron118(1-4):43-48
GaigherR,SamwaysM(2010)Surface-activearthropodsinorganicvineyards,integratedvineyardsandnaturalhabitatintheCapeFloristicRegion.JIn-sectConserv14(6):595-605
GalvanGA,ParadiI,BurgerK,BaarJ,KuyperTW,ScholtenOE,KikC(2009)Moleculardiversityofarbuscularmycorrhizalfungiinonionrootsfromor-ganic and conventional farming systems in the Netherlands.Mycorrhiza19(5):317-328
GarcinA,DemarleO,SoldatiF(2004)Carabids,indicatorsofbiodiversityandgeneralistauxilaries.Infos-Ctifl(199):42-47
GardarinA,TremoyM,BretagnolleF,ChauvelB(2007)Distributionoftheweedfloraatthelandscapescale:ecologicalgradientofspecies.ConferenceduCOLUMA20:305-314
GehermanV,EllermaeO(2001)Biodiversityofconventionalandorganicgrass-landsandthecontentofplantnutrientsinsoil.TransactionsEstonianAgricUnivAgronomy(212):93-96
GehermanV,ViiraltR(2004)Comparisonoflegume-richleysinconventionalandorganicfarms.TransactionsEstonianAgricUnivAgronomy(219):148-150
GeierU,FriebenB,GutscheV,KöpkeU(2000)Ecobalanceofintegratedandecological apple cultivation in Hamburg. In: BoosM, Betz E (eds) 9. In-In: BoosM, Betz E (eds) 9. In-ternationaler Erfahrungsaustausch über Forschungsergebnisse zum Öko-logischenObstbau:BeiträgezurTagungvom01.bis02.02.2000anderStaatlichenLehr-undVersuchsanstalt fürWein-undObstbauWeinsberg(LVWO).Weinsberg:FördergemÖkolObstbau,pp130-134
Geiger F,Bengtsson J,BerendseF,WeisserWW,EmmersonM,MoralesMB,CeryngierP,LiiraJ,TscharntkeT,WinqvistC,EggersS,BommarcoR,PartT,BretagnolleV,PlantegenestM,ClementLW,DennisC,PalmerC,OnateJJ,Guerrero I, HawroV,Aavik T, ThiesC, FlohreA,Hanke S, FischerC,GoedhartPW,InchaustiP(2010)Persistentnegativeeffectsofpesticidesonbiodiversityandbiological controlpotentialonEuropean farmland.BasicApplEcol11(2):97-105
GenghiniM,GelliniS,GustinM (2006)Organicand integratedagriculture :theeffectsonbirdcommunitiesinorchardfarmsinnorthernItaly.BiodiversConserv15(9):3077-3094
GibsonRH,PearceS,MorrisRJ, SymondsonWOC,Memmott J (2007)Plantdiversityandlanduseunderorganicandconventionalagriculture:awhole-farmapproach.JApplEcol44(4):792-803
GlemnitzM,CzimberG,RadicsL,HoffmannJ(2006)Weedfloradiversityand
204
composition in different agriculturalmanagement systems : comparativeinvestigationsinHungary,GermanyandEurope.MagyarGyomkutatasesTechnologia7(1):83-100
HaasG,WetterichF(2000)Optimizingagri-environmentalprogramtoreducenegativeenvironmentalimpactintheAllgaeuregionusinglifecycleassess-ment.BerLandwirtsch78(1):92-105
HaasG,WetterichF,KopkeU(2001)Comparingintensive,extensifiedandor-ganicgrasslandfarminginsouthernGermanybyprocesslifecycleassess-ment.AgricEcosystEnviron83(1-2):43-53
Hallmann J, FrankenbergA, PaffrathA, Schmidt HS (2007)Occurrence andimportanceofplant-parasiticnematodes inorganic farming inGermany.Nematology9:869-879
HansenB,AlreHF,KristensenES(2001)Approachestoassesstheenvironmen-talimpactoforganicfarmingwithparticularregardtoDenmark.AgricEco-systEnviron83(1/2):11-26
HawesC, SquireGR,Hallett PD,WatsonCA,YoungM (2010)Arable plantcommunitiesasindicatorsoffarmingpractice.AgricEcosystEnviron138(1-2):17-26
HepperlyPR,DoudsDJr,SeidelR(2006)TheRodaleInstituteFarmingSystemsTrial1981to2005:long-termanalysisoforganicandconventionalmaizeandsoybeancroppingsystems.In:RauppJ,PekrunC,OltmannsM,KopkeU(eds)Long-termfieldexperimentsinorganicfarming.Berlin:Köster,pp15-31,ScientificSeries/ISOFAR
HiltbrunnerJ,ScherrerC,StreitB,JeanneretP,ZihlmannU,TschachtliR(2008)Long-termweedcommunitydynamicsinSwissorganicandintegratedfar-mingsystems.WeedRes48(4):360-369
Himstedt M, van Elsen T (2006) Vegetational analyses on organic fields inmiddleandnorthernGermany.JPlantDisProtect20:597-604
HodgsonJA,KuninWE,ThomasCD,BentonTG,GabrielD(2010)Comparingorganicfarmingandlandsparing:optimizingyieldandbutterflypopula-tionsatalandscapescale.EcolLett13(11):1358-1367
HoleDG,PerkinsAJ,WilsonJD,AlexanderIH,GriceF,EvansAD(2005)Doesorganicfarmingbenefitbiodiversity?BiolConserv122(1):113-130
HollandJM,OrsonJ,PowellW,StorkeyJ,ChamberlainD(2007)Managingun-croppedlandinordertoenhancebiodiversitybenefitsofthearablefarmedlandscape.AspApplBiol(81):255-260
Holzschuh A, Steffan-Dewenter I, Kleijn D, Tscharntke T (2007) Diversity offlower-visitingbees incerealfields:effectsoffarmingsystem, landscapecompositionandregionalcontext.JApplEcol44(1):41-49
HolzschuhA,Steffan-DewenterI,TscharntkeT(2008)Agriculturallandscapeswith organic crops support higher pollinator diversity.Oikos 117(3):354-361
HolzschuhA,Steffan-DewenterI,TscharntkeT(2010)Howdolandscapecom-position and configuration, organic farming and fallow strips affect thediversityofbees,waspsandtheirparasitoids?JAnimEcol79(2):491-500
HopkinsA,FeberRE(1997)Managementforplantandbutterflyspeciesdiver-sity on organically farmed grassland fieldmargins.Grassland Sci Europe2:69-73
Humann-ZiehankE,GanterM(2006)Preventiveanimalhealthinsmallrumi-nants : results of an interdisciplinaryworkshop ; part 3: Trace elements.TieraerztlUmsch61(3):148
HuttonSA,GillerPS(2003)Theeffectsoftheintensificationofagricultureonnortherntemperatedungbeetlecommunities.JApplEcol40(6):994-1007
HyvonenT(2007)Canconversiontoorganicfarmingrestorethespeciescom-positionofarableweedcommunities?BiolConserv137(3):382-390
HyvonenT,KetojaE,SalonenJ,JalliH,TiainenJ(2003)Weedspeciesdiversi-ty and community composition in organic and conventional croppingofspringcereals.AgricEcosystEnviron97(1-3):131-149
IrmlerU(2003)ThespatialandtemporalpatternofcarabidbeetlesonarablefieldsinnorthernGermany(Schleswig-Holstein)andtheirvalueasecologi-calindicators.AgricEcosystEnviron98(1/3):141-151
Jose-MariaL,ArmengotL,Blanco-MorenoJM,BassaM,SansFX(2010)Effectsof agricultural intensificationonplantdiversity inMediterraneandrylandcerealfields.JApplEcol47(4):832-840
KaarB,FreyerB(2008)Weedspeciesdiversityandcover-abundanceinorga-nicandconventionalwintercerealfieldsand15yearsago.In:NeuhoffD,
HalsbergN,AlföldiT(eds)CultivatingtheFutureBasedonScience:vol2:Livestock,socio-economyandcrossdisciplinaryresearchinorganicagricul-ture;proceedingsoftheSecondScientificConferenceoftheInternationalSocietyofOrganicAgricultureResearch(ISOFAR),heldatthe16thIFOAMOrganicWorldCongressinCooperationwiththeInternationalFederationofOrganicAgricultureMovements(IFOAM)andtheConsorzioModenaBio,18-20June2008inModena,Italy.Bonn:ISOFAR,pp686-689
KairoMTK(2005)Hunger,poverty,andprotectionofbiodiversity:opportuni-tiesandchallenges forbiological control. In:HoddleMS (ed)Second In-ternationalSymposiumonBiologicalControlofArthropods,Davos,Swit-zerland,12-16September,2005.Morgantown:USDA,pp228-236,USDAForestServicePublicationFHTET-2005-08
KasperczykN,KnickelK(2006)Environmentalimpactsoforganicfarming.In:KristiansenP,TajiA,ReganoldJ(eds)Organicagriculture:aglobalperspec-tive.Collingwood:CSIRO,pp259-294
KirchmannH,ThorvaldssonG(2000)Challengingtargetsforfutureagriculture.EurJAgron12(3-4):145-161
KragtenS,deSnooGR(2007)NestsuccessofLapwingsVanellusvanellusonorganicandconventionalarablefarmsintheNetherlands.Ibis149(4):742-749
KragtenS,deSnooGR(2008)Field-breedingbirdsonorganicandconventionalarablefarmsintheNetherlands.AgricEcosystEnviron126(3-4):270-274
KrawczykR (2009)Comparisonof segetalfloraofblue lupin (/i Lupinusan-gustifolius/L)inorganicandconventionalcultivationsystems.ProgrPlantProtect49(4):1799-1803
KrawczykR,MatysiakK,KierzekR,KaczmarekS,Horoszkiewicz-JankaJ(2010)Theeffectofweedinfestationofwinterwheatwithinconversiontoorganicfarming.JResApplicatAgricEng55(3):195-199
Lal R (2005) Soil carbon sequestration for sustaining agricultural productionandimprovingtheenvironmentwithparticularreferencetoBrazil.JSustainAgric26(4):23-42
LamineC,BellonS(2009)Conversiontoorganicfarming:amultidimensionalresearchobjectatthecrossroadsofagriculturalandsocialsciences:are-view.AgronSustainDev29(1):97-112
LangerV,FrederiksenP(2008)Diversityasakeyconceptfororganicagriculture.In:NeuhoffD,HalsbergN,AlföldiT(eds)CultivatingtheFutureBasedonScience:vol2:Livestock,socio-economyandcrossdisciplinaryresearchinorganicagriculture;proceedingsoftheSecondScientificConferenceoftheInternationalSocietyofOrganicAgricultureResearch(ISOFAR),heldatthe16thIFOAMOrganicWorldCongressinCooperationwiththeInternationalFederation ofOrganic AgricultureMovements (IFLazzerini G, CameraA,BenedettelliS,VazzanaC(2007)Theroleoffieldmarginsinagro-biodiver-sitymanagementatthefarmlevel.ItalJAgron2(2):127-134
LeakeAR(2002)Biodiversityindifferentfarmingsystems.In:Pestsanddiseases2002 : the BCPC conference ; conference proceedings ; proceedings ofan internationalconferenceheldattheBrightonHiltonMetropoleHotel,Brighton,UK, 18-21November 2002. Farnham : BritishCrop ProtectionCouncil,pp949-956
LeifertC,RembiakowskaE,NielsonJH,CooperJM,ButlerG,LueckL(2007)Effectsoforganicand‚lowinput‘productionmethodsonfoodqualityandsafety. In:NiggliU (ed) Improvingsustainability inorganicand low inputfoodproductionsystems:proceedingsofthe3rdInternationalCongressoftheEuropeanIntegratedProject„QualityLowInputFood“(QLIF),UniversityofHohenheim,Germany,20-23March,2007.Frick:ResearchInstituteofOrganicAgriculture(FiBL),pp75-95
LetourneauDK,BothwellSG(2008)Comparisonoforganicandconventionalfarms : challengingecologists tomakebiodiversity functional. FrontEcolEnviron6(8):430-438
LetourneauDK,Goldstein B (2001) Pest damage and arthropod communitystructureinorganicvs.conventionaltomatoproductioninCalifornia.JApplEcol38(3):557-570
LinkM(2004)BiodiversitychangesinCentralPoland.SpiegelForsch21(1/2):34-41LoidlF(2007)Thecontributionofagriculturetobiodiversity.In:Biodiversitatin
Österreich:welchenBeitragleistetdieLand-undForstwirtschaftinÖster-reich;28.Juni2007.Irdning:HBLFA,pp1-4
LotterDW(2003)Organicagriculture.JSustainAgric21(4):59-128
G. Rahmann / Landbauforschung - vTI Agriculture and Forestry Research 3 2011 (61)189-208 205
LottiC,Resta P, PavanS,MarzanoCF,MarcotrigianoAR, ZonnoV,RicciardiL (2008)Usefulnessofgeneticresources inorganicfarming:casestudiesrelativetothe‘SIAB’project.AgronomskiGlasnik70(4):355-363
LundkvistA,SalomonssonL,KarlssonL,GustavssoneAMD(2008)Effectsoforganicfarmingonweedfloracompositioninalongtermperspective.EurJAgron28(4):570-578
LynchD(2009)Environmentalimpactsoforganicagriculture:aCanadianper-spective.CanJPlantSci89(4):621-628
MacDonaldDW,TattersallFH,ServiceKM,FirbankLG,FeberRE(2007)Mam-mals,agri-environmentschemesandset-aside-whataretheputativebe-nefits?MammalRev37(4):259-277
MacfadyenS,GibsonR,RasoL,SintD,TraugottM,MemmottJ(2009)Parasi-toidcontrolofaphidsinorganicandconventionalfarmingsystems.AgricEcosystEnviron133(1-2):14-18
MaderP,FliessbachA,DuboisD,GunstL,FriedP,NiggliU(2002)Soilfertilityandbiodiversityinorganicfarming.Science296(5573):1694-1697
ManhoudtAGE,SnooGRd(2003)Aquantitativesurveyofsemi-naturalhabi-tatsonDutcharablefarms.AgricEcosystEnviron97(1/3):235-240
ManhoudtAGE,VisserAJ,deSnooGR(2007)Managementregimesandfar-mingpracticesenhancingplantspeciesrichnessonditchbanks.AgricEco-AgricEco-systEnviron119(3-4):353-358
Mansvelt JDv, LubbeMJvd (1999) Checklist for sustainable landscapeman-agement : final report of the EU concerted actionAIR-CT93-1210 ; thelandscapeandnatureproductioncapacityoforganic/sustainabletypesofagriculture.Amsterdam:Elsevier,181p
MatotanZ, SamoborV, ErhaticR (2008) Preservingbiodiversityof cultivatedvegetablespeciesinCroatia.AgronomskiGlasnik70(6):527-541
MatthesHD,KahlM,MohringH,PastushenkoV,MicklichD(2002)Influenceofkeepingoffarmanimalsonbiodiversityofgrasslandandsolutionofoppo-sitionbetweenlanduseandrequirementsofnatureandspeciesprotection.AngewandteWissenschaft494:136-146
MattssonB(1999)EnvironmentalLifeCycleAssessment(LCA)ofagriculturalfoodproduction.Uppsala :SLU/Repro,ActaUnivAgricSueciae :Agraria187
MayerF,HeinzS,KuhnG(2008)Effectsofagri-environmentschemesonplantdiversityinBavariangrasslands.CommunityEcol9(2):229-236
MazzonciniM,CanaliS,GiovannettiM,CastagnoliM,Tittarelli F,AntichiD,NannelliR,CristaniC,BarberiP(2010)Comparisonoforganicandconven-tionalstocklessarablesystems:amultidisciplinaryapproachtosoilqualityevaluation.ApplSoilEcol44(2):124-132
McKenzieAJ,WhittinghamMJ(2009)Whyarebirdsmoreabundantonorganicfarms?JFoodAgricEnviron7(2):807-814
McLaughlinA,MineauP(1995)Theimpactofagriculturalpracticesonbiodi-versity.AgricEcosystEnviron55(3):201-212
MenaY,NahedJ,RuizFA,CastelJM,LigeroM(2009)ProximitytotheorganicmodelofdairygoatsystemsintheAndalusianmountains(Spain).TropSub-tropAgroecosyst11(1):69-73
Mesleard F, Garnero S, Beck N, Rosecchi E (2005) Uselessness and indirectnegative effects of an insecticide on rice field invertebrates. C R Biol328(10/11):955-962
MeylingNV,Navntoft S, Eilenberg J (2010)Organic farming systemsbenefitbiodiversity and natural pest regulation inwhite cabbage. ICROFSNews(1):4-5
MiglioriniP,VazzanaC(2006)Evaluationofsustainability:resultsfromalongtermexperimentalarablesystemsinTuscany.AspApplBiol(79):175-179
MiglioriniP,VazzanaC(2007)Biodiversityindicatorsforsustainabilityevaluati-onofconventionalandorganicagro-ecosystems.ItalJAgron2(2):105-110
MinarroM,EspadalerX,MeleroVX,Suarez-AlvarezV (2009)Organicversusconventionalmanagementinanappleorchard:effectsoffertilizationandtree-rowmanagementonground-dwellingpredaceousarthropods.AgrForEntomol11(2):133-142
MocaliS,BenedettiA(2008)Microbialdiversityofsoilunderorganicmanage-ment. In:MarinariS,CaporaliF (eds)Soilcarbonsequestrationunderor-In:MarinariS,CaporaliF (eds)Soilcarbonsequestrationunderor-ganicfarminginthemediterraneanenvironment.Trivandrum:TransworldResNetwork,pp97-111
Moller H,Wearing A, Perley C, Rosin C, Blackwell G, Campbell H, Hunt L,
FairweatherJ,ManhireJ,BengeJ,EmanuelssonM,StevenD(2007)Bio-diversityonkiwifruitorchards:theimportanceofshelterbelts.ActaHortic(Wageningen)753(2):609-618
MondelaersK,AertsensJ,HuylenbroeckGv(2009)Ameta-analysisofthedif-ferencesinenvironmentalimpactsbetweenorganicandconventionalfar-ming.BrFoodJ111(10):1098-1119
MoonenC,RodasNC,BarberiP,PetacchiR(2006)Fieldmarginstructureandvegetationcompositioneffectsonbeneficialinsectdiversityatfarmscale:acasestudyonanorganicfarmnearPisa(Italy).BulletinOILB/SROP29(6):77-80
MulderC,DeZwartD,VanWijnenHJ,SchoutenAJ,BreureAM(2003)Obser-vationalandsimulatedevidenceofecologicalshiftswithinthesoilnemato-decommunityofagroecosystemsunderconventionalandorganicfarming.FunctEcol17(4):516-525
Muller-LindenlaufM,DeittertC,KopkeU(2010)Assessmentofenvironmentaleffects,animalwelfareandmilkqualityamongorganicdairyfarms.LivestSci128(1-3):140-148
NakamuraY,FujikawaT,FujitaM (2000)Long-termchanges in thesoilpro-pertiesandthesoilmacrofaunaandmesofaunaofanagriculturalfieldinnorthernJapanduringtransitionfromchemical-intensivefarmingtonaturefarming.JCropProd3(1):63-75
NemecekT,DuboisD,Huguenin-ElieO,GaillardG(2006)LifecycleassessmentofSwissorganicfarmingsystems.AspApplBiol(79):15-18
NemecekT,DuboisD,Huguenin-ElieO,GaillardG (2011a)Lifecycleassess-mentofSwissfarmingsystems: I. Integratedandorganicfarming.AgricSyst104(3):217-232
Nemecek T, Huguenin-Elie O, Dubois D, Gaillard G, Schaller B, Chervet A(2011b)LifecycleassessmentofSwissfarmingsystems:II.Extensiveandintensiveproduction.AgricSyst104(3):233-245
NichollsCI,AltieriMA,PontiL(2008)Enhancingplantdiversityforimprovedin-sectpestmanagementinnorthernCaliforniaorganicvineyards.ActaHortic(Wageningen)785:263-278
Noe E,HalbergN, Reddersen J (2005) Indicators of biodiversity and conser-vationalwildlifequalityondanishorganicfarmsforuseinfarmmanage-ment:amultidisciplinaryapproachtoindicatordevelopmentandtesting.JAgrEnvironEthic18(4):383-414
NortonL,JohnsonP,JoysA,StuartR,ChamberlainD,FeberR,FirbankL,Man-leyW,WolfeM,HartB,MathewsF,MacDonaldD,FullerRJ(2009)Conse-quencesoforganicandnon-organicfarmingpracticesforfield,farmandlandscapecomplexity.AgricEcosystEnviron129(1-3):221-227
NortonLR,FullerRJ,FeberRE,JohnsonPJ,ChamberlainDE,JoysAC,MathewsF,StuartRC,TownsendMC,ManleyWJ,WolfeMS,MacDonaldDW,Fir-bankLG(2006)Thebenefitsoforganicfarmingforbiodiversity.AspApplBiol(79):191-194
ObergS(2007)Diversityofspidersafterspringsowing-influenceoffarmingsystemandhabitattype.JApplEntomol131(8):524-531
ObergS(2009)Influenceoflandscapestructureandfarmingpracticeonbodyconditionandfecundityofwolfspiders.BasicApplEcol10(7):614-621
OehlF,SieverdingE,IneichenK,MaderP,WiemkenA,BollerT(2009)Distinctsporulationdynamicsofarbuscularmycorrhizal fungalcommunities fromdifferentagroecosystems in long-termmicrocosms.AgricEcosystEnviron134(3-4):257-268
OehlF,SieverdingE,MaderP,DuboisD,IneichenK,BollerT,WiemkenA(2004)Impactoflong-termconventionalandorganicfarmingonthediversityofarbuscularmycorrhizalfungi.Oecologia138(4):574-583
OlssonGA,RnningenK(1999)EnvironmentalvaluesintraditionalagriculturallandscapesinNorway.LandbruksökonomiskForum16(4):27-38
OndineFC,JeanC,RomainJ (2009)Effectsoforganicandsoilconservationmanagementonspecialistbirdspecies.AgricEcosystEnviron129(1-3):140-143
OrrCH,JamesA,LeifertC,CooperJM,CummingsSP(2011)Diversityandac-tivityoffree-livingnitrogen-fixingbacteriaandtotalbacteriainorganicandconventionallymanagedsoils.ApplEnvironMicrob77(3):911-919
OttonettiL,TucciL,FrizziF,ChelazziG,SantiniG(2010)Changesinground-foragingantassemblagesalongadisturbancegradientinatropicalagricu-lturallandscape.EtholEcolEvol22(1):73-86
206
PaciniC,WossinkA,GiesenG,VazzanaC,HuirneR(2003)Evaluationofsustai-nabilityoforganic,integratedandconventionalfarmingsystems:afarmandfield-scaleanalysis.AgricEcosystEnviron95(1):273-288
PaolettiMG,D’IncaA,ToninE,TononS,MiglioriniC,PetruzzelliG,PezzarossaB,GomieroT,SommaggioD(2010)Soil invertebratesasbio-indicatorsinanaturalareaconvertedfromagriculturaluse:thecasestudyofVallevec-chia-LugugnanainNorth-EasternItaly.JSustainAgric34(1):38-56
ParfittRL,YeatesGW,RossDJ,MackayAD,BuddingPJ(2005)Relationshipsbet-weensoilbiota,nitrogenandphosphorusavailability,andpasturegrowthunderorganicandconventionalmanagement.ApplSoilEcol28(1):1-13
Parra-LopezC,Calatrava-RequenaJ,De-Haro-GimenezT(2007)Amulti-criteriaevaluationoftheenvironmentalperformancesofconventional,organicandintegratedolive-growingsystemsinthesouthofSpainbasedonexperts’knowledge.RenewAgrFoodSyst22(3):189-203
PelosiC,BertrandM,Roger-Estrade J (2009) Earthwormcommunity in con-ventional,organicanddirectseedingwithlivingmulchcroppingsystems.AgronSustainDev29(2):287-295
PeredoSF,ParadaE,VegaM,BarreraCP(2009)Edaphicmesofaunacommu-nitystructureinorganicandconventionalmanagementofcranberry(Vac-ciniumSp.)plantations:anagroecologicalapproach.RCSueloNutrVeg9(3):236-244
PeresG,PironD,BellidoA,GoaterC,CluzeauD(2008)Earthwormsusedasindicatorsofagriculturalmanagements.FreseniusEnvirBull17(8b):1181-1189
PetersenS,AxelsenJA,TybirkK,AudeE,VestergaardP(2006)Effectsoforga-nicfarmingonfieldboundaryvegetationinDenmark.AgricEcosystEnviron113(1-4):302-306
PeverieriGS,SimoniS,GoggioliD,LiguoriM,CastagnoliM(2009)Effectsofvariety andmanagement practices onmite species diversity in Italian vi-neyards.BullInsectol62(1):53-60
PfiffnerL(1996)Whichfarmingmethodsenhancefaunaldiversity?Agrarforsch3(11/12):527-530
PhilpottSM,BichierP,RiceR,GreenbergR(2007)Field-testingecologicalandeconomicbenefitsofcoffeecertificationprograms.ConservBiol21(4):975-985
Pimentel D,Hepperly P, Hanson J, DoudsD, Seidel R (2005) Environmental,energetic,andeconomiccomparisonsoforganicandconventionalfarmingsystems.Bioscience55(7):573-582
PimpiniF,GianquintoG,SamboP(2005)Organicvegetableproduction:evo-lution,baseprinciplesandqualityofproducts.ItalusHortus12(4):31-44
PoetschEM,BlaschkaA,ReschR(2005)Impactofdifferentmanagementsy-stemsandlocationparametersonfloristicdiversityofmountainousgrass-land.GrasslandSciEurope10:315-318
PorterJR,PetersenEH(1997)Danishagricultureanditssustainability:aprofile.Ambio26(7):462-465
Postma-BlaauwMB,deGoedeRGM,BloemJ,FaberJH,BrussaardL(2010)Soilbiota community structure andabundanceunder agricultural intensifica-tionandextensification.Ecology91(2):460-473
PottsD(2002)Arablefarming:theoptionsforgameandwildlife.JRoyalAgricSocEngland163:72-82
PovedaK,Steffan-DewenterI,ScheuS,TscharntkeT(2006)Belowgroundef-fectsoforganicandconventionalfarmingonabovegroundplant-herbivoreandplant-pathogeninteractions.AgricEcosystEnviron113(1-4):162-167
PurtaufT,RoschewitzI,DauberJ,ThiesC,TscharntkeT,WoltersV(2005)Land-scapecontextoforganicandconventional farms : influencesoncarabidbeetlediversity.AgricEcosystEnviron108(2):165-174
Rahmann G, Paulsen HM, Hötker H, Jeromin K, Schrader S, Haneklaus S,SchnugE (2006)Contributionoforganic farming to conservingand im-proving biodiversity inGermany avi-fauna as an example.AspAppl Biol(79):187-190
RanaN,RanaSA,KhanHA,SohailA(2010)Assessmentofpossiblethreatstosoilmacro-invertebratesdiversityinwheatfieldsfromhighinputfarming.IntJAgricBiol12(6):801-808
ReeveJR,SchadtCW,Carpenter-BoggsL,KangS,ZhouJZ,ReganoldJP(2010)Effects of soil type and farmmanagement on soil ecological functional
genesandmicrobialactivities.IsmeJ4(9):1099-1107ReganoldJP,GloverJD,AndrewsPK,HinmanHR(2001)Sustainabilityofthree
appleproductionsystems.Nature410(6831):926-930RicardJM,GarcinA,Damian-PicolletS,BousquetL(2007)Soilarthropodbio-
diversity inoliveorchards : seekingpredators for theolivefly. Infos-Ctifl(229):25-30
RomeroA,ChamorroL,SansFX(2005)Weedvegetationoforganicandcon-ventionaldrylandcerealfields in theMediterraneanregion. In:KöpkeU,NiggliU,NeuhoffD,CornishP,LockeretzW,WillerH(eds)Researchingsus-tainablesystems:firstScientificConferenceoftheInternationalSocietyofOrganicAgricultureResearch(ISOFAR),21-23September,2005,Adelaide,SouthAustralia;proceedings.Bonn:ISOFAR,pp127-130
RonchiB,NardoneA(2003)Contributionoforganicfarmingtoincreasesus-tainabilityofMediterraneansmallruminantslivestocksystems.LivestProdSci80(1-2):17-31
RoschewitzI,GabrielD,TscharntkeT,ThiesC(2005a)Theeffectsoflandscapecomplexity on arableweed species diversity in organic and conventionalfarming.JApplEcol42(5):873-882
RoschewitzI,HuckerM,TscharntkeT,ThiesC(2005b)Theinfluenceofland-scapecontextandfarmingpracticesonparasitismofcerealaphids.AgricEcosystEnviron108(3):218-227
RowarthJS(2008)Agriculturalintensificationprotectsglobalbiodiversity.NZJAgricRes51(4):451-455
RundlofM,BengtssonJ,SmithHG(2008a)Localandlandscapeeffectsofor-ganic farming on butterfly species richness and abundance. J Appl Ecol45(3):813-820
RundlofM,EdlundM,SmithHG(2010)Organicfarmingatlocalandlandscapescalesbenefitsplantdiversity.ECO33(3):514-522
RundlofM,NilssonH,SmithHG(2008b)Interactingeffectsoffarmingpracticeandlandscapecontextonbumblebees.BiolConserv141(2):417-426
RundlofM,SmithHG(2006)Theeffectoforganicfarmingonbutterflydiversitydependsonlandscapecontext.JApplEcol43(6):1121-1127
RyanMR,MortensenDA,BastiaansL,TeasdaleJR,MirskySB,CurranWS,SeidelR,WilsonDO,HepperlyPR(2010)Elucidatingtheapparentmaizetolerancetoweedcompetitioninlong-termorganicallymanagedsystems.WeedRes50(1):25-36
RydbergNT,MilbergP(2000)AsurveyofweedsinorganicfarminginSweden.BiolAgricHort18(2):175-185
SalonenJ,HyvonenT,JalliH(2001a)Weedflora inorganicallygrownspringcerealsinFinland.AgricFoodSciFinland10(3):231-242
SalonenJ,HyvonenT,JalliH(2001b)WeedsinspringcerealfieldsinFinland-athirdsurvey.AgricFoodSciFinland10(4):347-364
SalonenJ,HyvonenT,JalliH(2005)WeedfloraandweedmanagementoffieldpeasinFinland.AgricFoodSci14(2):189-201
Sanchez-MorenoS,SmuklerS,FerrisH,O’GeenAT,JacksonLE(2008)Nema-todediversity, foodwebcondition,andchemicalandphysicalpropertiesindifferentsoilhabitatsofanorganicfarm.BiolFertilSoils44(5):727-744
SantosSAP,PereiraJA,TorresLM,NogueiraAJA(2007)Evaluationoftheef-fects,oncanopyarthropods,oftwoagriculturalmanagementsystemstocontrol pests in olive groves from north-east of Portugal. Chemosphere67(1):131-139
SarapatkaB,CizkovaS (2007)Grasslanddiversity inrelationtosubsidies. In:EkologiaTravnehoPorastuVII,BanskaBystrica,Slovakia,28-30November2007. Banska Bystrica : Vyskumny Ustav Travnych Porastov a HorskehoPol’nohospodarstva,pp114-117
SchaderC,PfiffnerL,SchlatterC,StolzeM(2008)Uptakeofagri-environmen-talmeasuresonorganicandconventionalfarmsinSwitzerland.AgrarforAgrarfor--schung15(10):506-511
SchmidK,KesperC,CalozG(2001)EcologyatSwissvegetablefarms.Agrar-forschung8(4):158-162
SchmidtMH,RoschewitzI,ThiesC,TscharntkeT(2005)Differentialeffectsoflandscapeandmanagementondiversityanddensityofground-dwellingfarmlandspiders.JApplEcol42(2):281-287
SchnugE,HaneklausS,WalkerKC,WalkerRL,RahmannG(2008)MöglicheSynergie-EffektezwischenLandwirtschaftundNaturschutzunterdenBe-dingungendesKlimawandels.Landbauforsch58(4):267-270
G. Rahmann / Landbauforschung - vTI Agriculture and Forestry Research 3 2011 (61)189-208 207
SchraderS,KiehneJ,AndersonT-H,PaulsenHM,RahmannG(2006)Develop-mentofcollembolansafterconversiontowardsorganicfarming.AspApplBiol(79):181-185
ScialabbaNEH,GrandiC,HenatschC(2003)Organicagricultureandgeneticresourcesforfoodandagriculture.In:Biodiversityandtheecosystemap-In:Biodiversityandtheecosystemap-proachinagriculture,forestryandfisheries:[satelliteeventontheoccasionoftheninthregularsessionoftheCommissiononGeneticREsourcesforFoodandAgriculture;Rome12-13October2002 ;proceedings.Rome :FAO,pp72-99
ScottJ(2000)WheatvarietiesfororganicproductionandprocessinginNewBrunswick,Canada.In:AlmekindersC,BoefWde(eds)Encouragingdiver-In:AlmekindersC,BoefWde(eds)Encouragingdiver-sity : theconservationanddevelopmentofplantgenetic resources.Lon-Lon-don:IntermediateTechnolPubl,pp85-89
ShannonD,SenAM,JohnsonDB(2002)Acomparativestudyofthemicrobi-ologyofsoilsmanagedunderorganicandconventionalregimes.SoilUseManage18:274-283
ShivaV(1997)Biodiversitytotalitarianism:IPRsasseedmonopolies.EconPolitWeekly32(41):2582-2585
SiddiquiMJI,RanaSA,NaureenR,AnjumS(2005)Biodiversityofinsectsinhighandlowinputwheat(/iTriticumaestivum/)fieldsagroecosystemsofPunjab.PakistanEntomologist27(2):25-28
SinghDRR(2005a)Studyofadoptionofnewtechnologiesforfurtheringbiodi-versityconservationcommerceandtradeofmedicinalandaromaticplantsofIndia.IndianForester131(3):308-315
SinghHP,SinghBP,GuliaSK(2007)Researchandapplicationimperativesforthesustainableproductionofphytomedicines.ActaHortic(756):25-31
SinghKA(2005b) Impactofforageresourcedevelopmentonsustained landuseandenvironmentinnortheasternhillsregionofIndia.RangeManageAgroforestry26(1):58-70
SinghRK, SatapathyKK (2007) Environment-friendly indigenous farming sy-stemsofNorthEastHillRegion.EnvironEcol25S(Special4):1170-1173
SmisMJ,MeijerinkG (2006)Contrasting interpretationsof sSmithHG,Dan-SmithHG,Dan-hardtJ,LindstromA,RundlofM(2010)Consequencesoforganicfarmingandlandscapeheterogeneityforspeciesrichnessandabundanceoffarm-landbirds.Oecologia162(4):1071-1079
Smukler SM, Jackson LE,Moreno SS, Fonte SJ, FerrisH, KlonskyK,O’GeenAT, Scow KM, Al-Cordova-Kreylos AL (2008) Enhancing biodiversity andmultifunctionalityofanorganicfarmscapeinCalifornia’sCentralValley.In:NeuhoffD,HalsbergN,AlföldiT(eds)CultivatingtheFutureBasedonSci-ence : vol 2: Livestock, socio-economy and cross disciplinary research inorganicagriculture;proceedingsoftheSecondScientificConferenceoftheInternationalSocietyofOrganicAgricultureResearch(ISOFAR),heldatthe16thIFOAMOrganicWorldCongressinCooperationwiththeInternationalFederationofOrganicAgricultureMovements(IFOAM)andtheConsorzioModenaBio,18-20June2008inModena,Italy.Bonn:ISOFAR,pp654-657
SmuklerSM,Sanchez-MorenoS,FonteSJ,FerrisH,KlonskyK,O’GeenAT,ScowKM,SteenwerthKL,JacksonLE(2010)Biodiversityandmultipleecosystemfunctionsinanorganicfarmscape.AgricEcosystEnviron139(1-2):80-97
SnappSS,GentryLE,HarwoodR(2010)Managementintensity-notbiodiver-sity-thedriverofecosystemservicesinalong-termrowcropexperiment.AgricEcosystEnviron138(3-4):242-248
SomarribaE,HarveyCA(2003)Howtointegratesustainableproductionandconservationofbiodiversityinindigenousorganiccocoaplantations?Agro-foresteriaenlasAmericas10(37/38):12-17
SomarribaE,TrivelatoM,VillalobosM,SuarezA,BenavidesP,MoranK,OrozcoL,LopezA(2003)DiagnosisofagroforestryinindigenousBribriandCabe-carsmallorganiccacaofarmsinTalamanca,CostaRica.AgroforesteriaenlasAmericas10(37/38):24-30
SoussanaJF,DuruM(2007)GrasslandscienceinEuropefacingnewchalleng-es:biodiversityandglobalenvironmentalchange.CABRev2(002):11
Stein-BachingerK,FuchsS(2008)Organicfarmingandbiodiversity-howtocreateaviablefarmbusinessincludingconservationissues.In:NeuhoffD,HalsbergN,AlföldiT(eds)CultivatingtheFutureBasedonScience:vol2:Livestock,socio-economyandcrossdisciplinaryresearchinorganicagricul-ture;proceedingsoftheSecondScientificConferenceoftheInternationalSocietyofOrganicAgricultureResearch(ISOFAR),heldatthe16thIFOAM
OrganicWorldCongressinCooperationwiththeInternationalFederationofOrganicAgricultureMovements(IFOAM)andtheConsorzioModenaBio,18-20June2008inModena,Italy.Bonn:ISOFAR,pp666-669
Stein-BachingerK,ZanderP,SchobertH,FrielinghausH(2005)Newwaysofincreasingbiodiversityonorganicfarmsandtheireffectsonprofitability:theNatureConservationFarmBrodowin. In:KöpkeU,NiggliU,NeuhoffD,CornishP,LockeretzW,WillerH(eds)Researchingsustainablesystems:firstScientificConferenceoftheInternationalSocietyofOrganicAgricul-tureResearch(ISOFAR),21-23September,2005,Adelaide,SouthAustralia;proceedings.Bonn:ISOFAR,pp468-471
SteinerRS,PohlC(2009)Isorganicfarmingreflectedinthelandscape?Acom-parisonoftheeffectsofdifferentfarmingtechniquesonrurallandscapes.Gaia18(1):41-48
StockdaleEA,WatsonCA(2009)Biologicalindicatorsofsoilqualityinorganicfarmingsystems.RenewableAgricFoodSyst24(4):308-318
StrasserF,RyffelT(2010)BiodiverserBiobetriebamStadtrand.ART-SchriftenR(14):59-63
SubhasisM,DattaKK,HoreDK, SuchitraM (2008)Biodiversity andorganicagriculture:opportunitiesandchallengesforthenorth-eastregionofIndiaandamodelfortheprinciplesinvolved.OutlookAgric37(2):87-94
SutharS(2009)Earthwormcommunitiesabioindicatorofarablelandmanage-mentpractices : a case study in semiarid regionof India. Ecol Indicators9(3):588-594
TaubeF,KelmM,LogesR,WachendorfM(2006)Resourceefficiencyasaregu-lationvariable for thepromotionof sustainableproductionsystems :aretherepriorityareasfororganicfarming?BerLandwirtsch84(1):73-105
TaylorME,MorecroftMD(2009)Effectsofagri-environmentschemesinalong-termecologicaltimeseries.AgricEcosystEnviron130(1-2):9-15
TilakKVBR,RanganayakiN,PalKK,DeR,SaxenaAK,NautiyalCS,MittalS,TripathiAK,JohriBN(2005)Diversityofplantgrowthandsoilhealthsup-portingbacteria.CurrSciIndia89(1):136-150
TothZ,BaldiA(2006)Theimpactoforganicfarmingonbiodiversity.Termeszet-vedelmiKozlemenyek(12):17-33
TronelC,Codarin S (2010)Organicallymanaged orchards : choice of applevarieties.Infos-Ctifl(264):22-25
TsiafouliMA,ArgyropoulouMD,StamouGP,SgardelisSP(2006)SoilnematodebiodiversityinorganicandconventionalagroecosystemsofNorthernGree-ce.RussJNematol14(2):159-169
TuC,LouwsFJ,CreamerNG,Mueller JP,BrownieC,FagerK,BellM,HuSJ(2006)ResponsesofsoilmicrobialbiomassandNavailabilitytotransitionstrategiesfromconventionaltoorganicfarmingsystems.AgricAgricEcosystEcosystEn-En-viron113(1-4):206-215
TurnerRJ (2004)Changes inabundanceanddiversityoftheweedseedbankinanorganicfield-scalevegetablesystem: fromconversion throughthefirstcourseofarotation.In:HopkinsA(ed)Organicfarming:scienceandpracticeforprofitablelivestockandcropping;proceedingsoftheBGS/AAB/CORConference,heldattheHarperAdamsUniversityCollege,Newport,Shropshire,UK,20-22April2004.Reading:BritishGrasslandSociety,pp240-243,OccasionalSymposium/BGS37
TybirkK,AlroeHF,FrederiksenP(2004)Naturequality inorganicfarming:aconceptualanalysisofconsiderationsandcriteriainaEuropeancontext.JAgricEnvironEthics17(3):249-274
TybirkK,FredshavnJ(2003)Naturequality inorganicfarming-conceptandpreliminaryresults.DJFRapportMarkbrug(89):189-198
TyserL,NovakovaK,HamouzP,NecasovaM(2008)Speciesdiversityofweedcommunities in conventional and organic farming systems in the CzechRepublic.JPlantDisProtect115:291-295
UlberL,SteinmannHH,KlimekS,IsselsteinJ(2009)Anon-farmapproachtoinvestigatetheimpactofdiversifiedcroprotationsonweedspeciesrichnessandcompositioninwinterwheat.WeedRes49(5):534-543
VaarstM(2010)Organicfarmingasadevelopmentstrategy:whoare inter-estedandwhoarenot?JSustainDev3(1):38-50
van der Gast CJ, Gosling P, Tiwari B, BendingGD (2011) Spatial scaling ofarbuscularmycorrhizalfungaldiversityisaffectedbyfarmingpractice.Envi-ronMicrobiol13(1):241-249
208
vanDiepeningenAD,deVosOJ,KorthalsGW,vanBruggenAHC(2006)Effectsof organic versus conventionalmanagement on chemical and biologicalparametersinagriculturalsoils.ApplSoilEcol31(1-2):120-135
Vandana,S.(2000).Insituconservationofagriculturalbiodiversityandorganicfarming-thebasisforfuturefoodsecurity.Zurich,vdfHochschulverlagAGanderETHZurich.
VerbruggenE,RolingWF,GamperHA,KowalchukGA,VerhoefHA,vanderHeijdenMG (2010) Positiveeffectsoforganic farmingonbelow-groundmutualists : large-scalecomparisonofmycorrhizal fungalcommunities inagriculturalsoils.NewPhytol186(4):968-979
ViauxP,RameilV(2004)Arthropodsinarablefarms.Phytoma(570):8-11VijayalakshmiK,ArumugasamyS(2004)Seedkeepers:organicfarmingand
indigenousseedconservationexperiencesfromTamilNadu,India. In:6thIFOAM-Asia Scientific Conference, Yangpyung, Korea, 7-11 September,2004:“Benignenvironmentandsafefood”.Yangpyung:Research Insti-tuteofOrganicAgriculture,pp76-86
VoglCR,Vogl-LukasserB(2003)Tradition,dynamicsandsustainabilityofplantspecies composition and management in homegardens on organic andnon-organic small scale farms inAlpine Eastern Tyrol,Austria. BiolAgricHortic21(4):349-366
WanderMM,HedrickDS,KaufmanD, Traina SJ, StinnerBR,Kehrmeyer SR,WhiteDC (1995)The functional significanceof themicrobialbiomass inorganicandconventionallymanagedsoils.PlantSoil170(1):87-97
WangC,WangG,WanS,QinP (2007)Effectsoforganicandconventionalfarmingsystemsonfarmlandbiodiversity.JEcolRuralEnviron23(1):75-80
WangS,YuanW,LiW,YangL(2009)Aplanfordevelopingtheecologicalag-riculturalzoneoftheChangjiangfarm.ActaAgricShanghai25(2):141-144
WatsonCA,ChamberlainDE,NortonLR, FullerRJ,AtkinsonCJ, FowlerSM,McCrackenDI,WolfeMS,WalkerRL (2006)Canorganic farmingdelivernaturalheritagegoalsintheUKuplands?AspApplBiol(79):5-8
WatsonCA,WalkerRL,StockdaleEA (2008)Research inorganicproductionsystems-past,presentandfuture.JAgrSci146:1-19
WeibullAC(2002)Higherbiodiversityinheterogeneouslandscapes.EntomolTidskr123(4):163-165
Weibull AC (2002) Diversity in the agricultural landscape : species richnessandcompositioninrelationtofarmmanagement,landscapestructureandhabitat.Uppsala:SverigesLantbruksuniv,43,69p,Actauniversitatisagri-culturaesueciae:agraria326
WeibullAC,BengtssonJ,NohlgrenE(2000)Diversityofbutterfliesintheagri-culturallandscape:theroleoffarmingsystemandlandscapeheterogene-ity.ECO23(6):743-750
Weibull AC,OstmanO (2003) Species composition in agroecosystems : theeffect of landscape, habitat, and farm management. Basic Appl Ecol4(4):349-361
Wickramasinghe LP, Harris S, Jones G, Jennings NV (2004) Abundance andspeciesrichnessofnocturnal insectsonorganicandconventionalfarms:effects of agricultural intensification on bat foraging. Conserv Biol18(5):1283-1292
WickramasingheLP,HarrisS,JonesG,VaughanN(2003)Batactivityandspe-cies richness on organic and conventional farms : impact of agriculturalintensification.JApplEcol40(6):984-993
WolfeMS (2002) The role of functional biodiversity inmanaging pests anddiseases inorganicproductionsystems. In:Pestsanddiseases2002:theBCPCconference;proceedingsofaninternationalconferenceheldattheBrighton HiltonMetropole Hotel, Brighton, UK, 18-21 November 2002.Farnham:BritishCropProtectionCouncil,pp531-538
WolffP,HethkeM,HammerK(2002)Historyof100yearsoftheWitzenhausengreenhousesforusefultropicalplants-fromacolonialplantcollectionto-wardsaresearchandeducationunit.Tropenlandwirt74:64
WortmanSE,LindquistJL,HaarMJ,FrancisCA(2010)Increasedweeddiversity,densityandabove-groundbiomassinlong-termorganiccroprotations.Re-newableAgricFoodSyst25(4):281-295
WyssE,PfiffnerL(2008)Biodiversityinorganichorticulture-anindicatorforsustainabilityandatoolforpestmanagement.ActaHortic(Wageningen)(767):75-80
XieB,WangX,DingZ,YangY(2003)Critical impactassessmentoforganicagriculture.JAgricEnvironEthics16(3):297-311
YounieD,BaarsT(2005)Organicgrassland:principles,practicesandpotential.In: Reynolds SG, Frame J (eds) Grasslands : developments,opportunities,perspectives.Enfield:SciencePubl,pp207-232
YuanW,LiuH,ZhangS,LiW(2010)EvaluationofcommunitiesofinsectpestsandnaturalenemiesinorganicricefieldsofChangjiangFarm.ActaAgricShanghai26(2):132-136
ZalazarL,SalvoA(2007)EntomofaunaassociatedtohorticulturalcropsunderorganicandconventionalpracticesinCordoba,Argentina.NeotropEnto-mol36(5):765-773
ZanenM,Bokhorst JG,KoopmansCJ (2008)Soil fertilityandbiodiversityef-fectsfromorganicamendmentsinorganicfarming.In:NeuhoffD,HalsbergN,AlföldiT(eds)CultivatingtheFutureBasedonScience:vol1:Organiccropproduction;proceedingsoftheSecondScientificConferenceoftheInternationalSocietyofOrganicAgricultureResearch(ISOFAR),heldatthe16thIFOAMOrganicWorldCongressinCooperationwiththeInternationalFederationofOrganicAgricultureMovements(IFOAM)andtheConsorzioModenaBio,18-20June2008inModena,Italy.Bonn:ISOFAR,pp94-97
ZhongP,LiangG,ZengL(2005)Biodiversityofmajornaturalenemiesinorga-nicfarmingricefields.ChineseJBiolControl21(3):155-158
H. M-Paulsen / Landbauforschung - vTI Agriculture and Forestry Research 3 2011 (61)209-216 209
Improving green-house gas balances of organic farms by the use of straight vegetable oil from mixed cropping as farm own fuel and its competition to food production
HansMartenPaulsen*
** JohannHeinrichvonThünen Institute (vTI), FederalResearch Institute forRuralAreas,ForestryandFisheries,InstituteofOrganicFarming,Trenthorst32,23847Westerau,Germany,[email protected]
Abstract
Mixed cropping is frequently used in organic farm-ing and recommendedworldwide in low external inputareas to increaseproductivity, yield security andproductdiversity. In trialswith different oil crops camelina (falseflax,Camelina sativa L.), linseed(Linum ustitatissivum L.), rape (Brassica napus L.), safflower (Carthamus tinctorius L.) or whitemustard(Sinapis alba L.)growntogetherwithgrain legumes or cereals on German sites the potentialof renewable fuel production parallel to food produc-tionwasevaluatedinorganicfarming.Dependingonthecrop-combinationbetween10to900kg/havegetableoilcouldbeproduced.Thiscouldcoverthefueldemandofagriculturalmachineryfor0.1to9hafarmland.Thefoodcropscombinedwithoilplantsinmixedcroppingmostlyhadrelativeyieldshigheras0.5,showingthatalsoyieldincreases in foodproduction are possible parallel to theproductionofrenewablefuel.Asexampleforanintroduc-tionofanon-commonoilcropinfarmcycles,researchre-sultsontheuseofstraightvegetableoilasfuelintractorsandofoil-cakeasfeedstuffforlivestockfromcamelinaaresummarised.BasedontheresultstheimportancefortheGHGemissionsoforganicfarmsisdiscussed.Whenmixedcroppingsystemswithoilcropsandtheuseofallproductsare consequently introduced, improvements in theGHGbalanceof farmscanbeexpectedbysavings inproduc-tionandyieldstabilisationinmixedcroppingaswellasbydirectsubstitutionofdieselfuelinagriculturalmachineryandbysubstitutionofimportedfeedcomponentsforlive-stock.
Keywords: Organic farming, feed components, food and biofuel, mixed cropping
Zusammenfassung
Verbesserung der Treibhausgasbilanzen ökologischer Betriebe durch die Nutzung von Pflanzenöl aus dem Mischfruchtanbau als hofeigenen Biokraftstoff und die Konkurrenz zur Nahrungsmittelproduktion
Mischfruchtanbau wird im Ökologischen Landbau undauchweltweitinAnbauregionenmitschlechtemZugangzuexternenBetriebsmittelnangewandt,umdieProduktivität,Ertragssicherheit und die Produktionsvielfalt abzusichernundzusteigern.InVersuchenmitverschiedenenÖlfrüchtenLeindotter(Camelina sativa L.), Öllein(Linum ustitatissivum L.), Raps (Brassica napus L.), Saflor (Färberdistel, Cartha-mus tinctorius L.) oder weißem Senf (Sinapis alba L.) imMischfruchtanbau mit Körnerleguminosen oder Getreidein Deutschlandwurde das Potential dieser AnbausystemezurBiokraftstofferzeugungparallel zurNahrungsmittelpro-duktionermittelt.AbhängigvonderFruchtartenkombinati-onkonntenimÖkologischenLandbauso10bis900kg/haPflanzenölerzeugtwerden.DieskönntedenTreibstoffbedarffürdieBewirtschaftungvon0,1bis9haLandabdecken.FürdiegleichzeitigproduziertenNahrungs-bzw.FutterpflanzenwurdenüberwiegendRelativerträgevongrößerals0,5er-mittelt.DerWertzeigt,dassnebenderErzeugungvonPflan-zenöl,z.B.zurNutzungalsBiotreibstoff,auchErtragssteige-rungenbeidenNahrungspflanzenerzieltwerdenkönnen.AlsBeispielfürdieEinführungeinerÖlfruchtindenKreislauflandwirtschaftlicherBetriebewerdenForschungsergebnissezumEinsatzvonreinemPflanzenölalsBiotreibstoffinTrak-torenundzurNutzungdesÖlkuchensvonLeindotter inder Nutztierfütterung beschrieben und deren Bedeutung fürdie Treibhausgas(THG)bilanz landwirtschaftlicher Betriebedargestellt.BeiEinführungvonMischfruchtanbausystemenmit Ölpflanzen und der konsequenten Nutzung aller er-zeugtenKomponenten imBetriebkönnenTHG-Emissions-minderungeninderlandwirtschaftlichenProduktion,durchdieErtragsstabilisierungdurchdenMischfruchtanbausowiedurchdiedirekteSubstitutionvonDieselkraftstoff in land-wirtschaftlichenFahrzeugenundvonsonstimportiertenFut-terkomponentenfürdieNutztiereerzieltwerden.
Schlüsselworte: Ökologischer Landbau, Futterkomponen-ten, Nahrung und Biokraftstoff, Mischfruchtanbau
210
1. Introduction
Mixed cropping is amanagement tool that is used inorganic farming in terms of efficient resource use andriskminimization (Jensen,2006;HofandRauber,2003).Averyspecialproduction line ismixedcroppingwithoilcrops(Paulsen,2007aand2008a;Carretal.,2003;Szu-migalskiandvanAcker,2005and2006).Duetoveryin-secureyieldsofoilcropsinorganicfarmsmixedcroppingcouldbeusedtosecureoilseedproductionatall if suit-ablecompanioncropsarefound.Specialyieldgoalsofthiscroppingtypecouldbedefinedforco-productionoffoodandrenewableenergy.Asstraightvegetableoilcanbedirectlyusedasfuelfor
farmmachinery(Ramadhas,2004;HasselandWichmann,2005)oilcropyieldfrommixedcroppingmustbeadaptedtothefueldemandofthefarmandfeedcropscouldbeproducedparallel(Paulsen,2008b;PaulsenandRahmann,2004).GHGloadsoforganicallyproducedvegetableoilcanbe
verylowduetothelowexternalenergyinputinorganicproduction(Cormack,2000).Oilcropscultivatedinmixedcropping systems have additional energy demands fortechnicalequipmentforseedingandseparatingtheseedsafterharvest.Furthermoreprobableyieldreductionofthemaincropwouldcauseloadsfortheoilcrope.g.inGHGbalances.Butalsopositiveyieldeffectsofcompanionoilcropsare reported.Thiswouldhave reducingeffectsontheGHGemissionofwholeproductionaswellastheuseof renewable energy. Additionally oil cake fromoil pro-ductioncanreplaceotherimportedfeedcomponentswithindifferentclimateloads(Steinfeld,2006).Mixedcroppingforenergyproductionwouldprobably
beneededinvariouselementsofacroprotationtosup-plysufficientfuelinorganicfarming.Thisimpliesaneedfortheuseofvegetableoilfromdifferentoilcropsinthemachinesandfortheuseofdifferentoil-cakesinanimalfeeding.Inthefollowingrecentownresearchresultsonyieldof
mixedcroppingsystemswithdifferentoilcropsinorgan-ic production, results on the use of camelina oil as fuelcomponent in agriculturalmachinery andonoil cake inchicken feedingare summarized.Basedon these resultstheeffectsoftheintroductionofthesemeasuresonthegreenhousegas(GHG)loadofproductionarediscussed.
2. Materials and Methods
Field trials
Fieldtrialsofmixedcroppingwithoilcropswereunder-takenatfoursitesinGermanywiththeoilcropscamelina(false flax,Camelina sativa L.), linseed (Linum ustitatissi-
vum L.), rape (Brassica napus L.), safflower (Carthamus tinctorius L.) and whitemustard(Sinapis alba L.).Theoilcropsweresownincompletelyrandomizedblockdesignswithfourrepetitionstogetherwithdifferentlegumes(pea-Pisum sativum L. orbluelupin-Lupinus angustifolius L.)orcereals(wheat-Triticum aestivum L.,barley-Hordeum vulgare L.orrye-Serale cereale L.).Inmixtureswithwinterrapewintervarietieswereusedascroppingcompanions(Table1).Alsothemixedcroppingoftwooilcrops–lin-seedtogetherwithcamelina – wastested. Inthefollowingtexttheintroducedoilcropsarefurthercalled‘oilcrops’.The other crops in the mixture are called ‘main crops’.Both crops were sown in separate rows and optimaldepthseach.Theseedrowdistanceswerekeptconstantinsoleandmixedcropping(12to12.5cm).Consequentlymostseedratesofoilcropsandmaincropswerereducedto75%or50%comparedtothesolecropping,accord-ingtoexistingfieldexperiences.ThetrialdesignisgiveninPaulsen(2007b).Yieldeffectscomparedtosolecroppingthereforecouldbeexpectedbyplantreductionperarea,bydifferentintrarowplantdistancesaswellasbyinterrowplantcompetitionofdifferentvarieties.Afterharvesttheseedsweredividedandweighedseparately.AdditionallyallcropsweregrowninpurestandtocalculatetheLandEquivalentRatio(LER)(MeadandWilley,1980).
Feeding trials with oil cakes
Camelina oilcake was takenasexampleforanovelcropwithspecialfattyacidcompositionanditsusabil-ity indiets forbroiler fattening.Camelinaoil cake as ingredient wascriticallydiscussedintermsofnegativeinfluencesonfatodourandtastewhenusedinpigorbroilernutrition(BöhmeandFlachowsky,2005).Since2008itisacceptedintheEUfeedlaw(Commissiondi-rective2008/76/EC). Inafeedingtrialonchickenfatten-ingenergyequalfeedrationswith0,2.5or5%cam-elina oil cake were used. Chicken were slaughtered,parameters of fattening performance, carcass quality,organweights and sensoricmeat qualitywere deter-mined(Weissmannetal.,2007).
Tests in straight vegetable oil driven tractors
Usability of mixed straight vegetable oils as fuels wasexemplarily examined in agricultural tractorswith enginesadaptedtotheuseofstraightrapeoil.Twomoderncom-monrailtractorswith150kWwerecomparedover1000hinoneyearinafieldtest.Onetractorwasdrivenwithcoldpressedrapeoilandonewithamixtureof30%camelinaoiland70%rapeoil.FuelqualitieswereexaminedaccordingtoDINV51605(2006).Motoroilsampleswerecontrolledonvegetableoilcontent,viscosityandcarbonresidues.
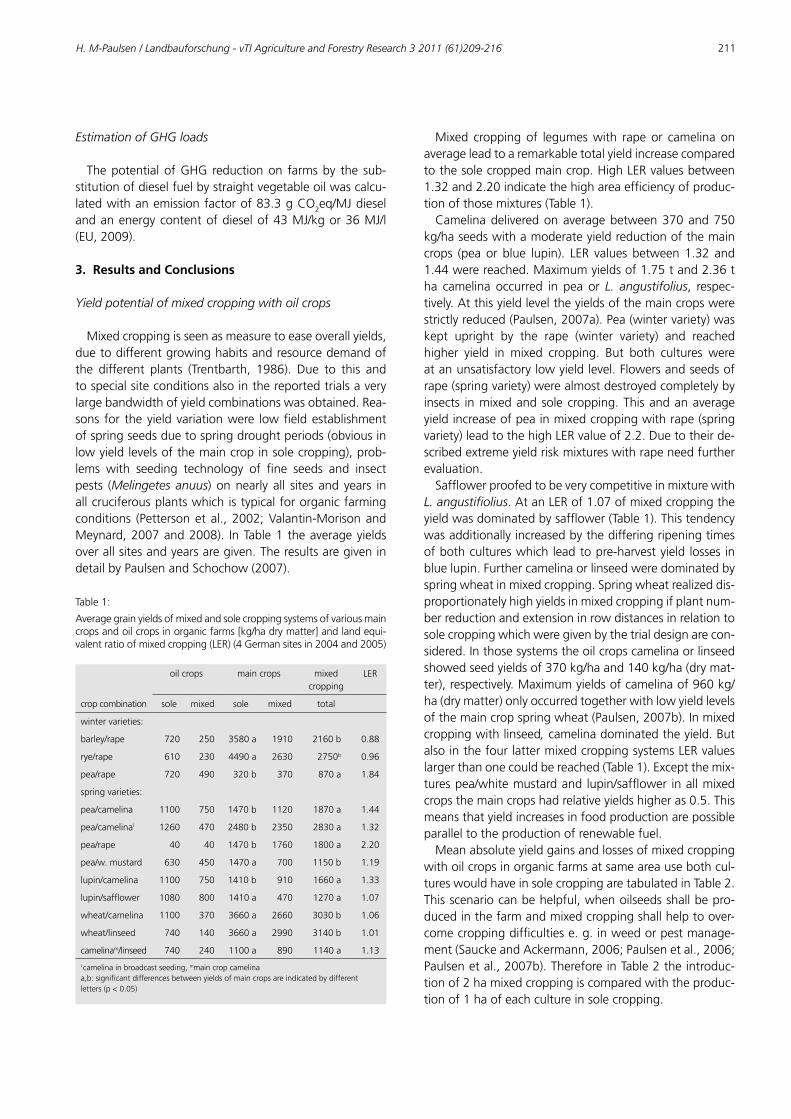
H. M-Paulsen / Landbauforschung - vTI Agriculture and Forestry Research 3 2011 (61)209-216 211
Estimation of GHG loads
ThepotentialofGHG reductionon farmsby the sub-stitutionofdieselfuelbystraightvegetableoilwascalcu-latedwithanemissionfactorof83.3gCO2eq/MJdieselandanenergycontentofdieselof43MJ/kgor36MJ/l(EU,2009).
3. Results and Conclusions
Yield potential of mixed cropping with oil crops
Mixedcroppingisseenasmeasuretoeaseoverallyields,duetodifferentgrowinghabitsandresourcedemandofthe different plants (Trentbarth, 1986). Due to this andtospecialsiteconditionsalsointhereportedtrialsaverylargebandwidthofyieldcombinationswasobtained.Rea-sons for theyieldvariationwere lowfieldestablishmentofspringseedsduetospringdroughtperiods(obviousinlowyieldlevelsofthemaincropinsolecropping),prob-lems with seeding technology of fine seeds and insectpests (Melingetes anuus) onnearly all sites and years inallcruciferousplantswhichistypicalfororganicfarmingconditions (Pettersonet al., 2002;Valantin-MorisonandMeynard,2007and2008). InTable1theaverageyieldsoverallsitesandyearsaregiven.TheresultsaregivenindetailbyPaulsenandSchochow(2007).
Table1:
Averagegrainyieldsofmixedandsolecroppingsystemsofvariousmaincropsandoilcropsinorganicfarms[kg/hadrymatter]andlandequi-valentratioofmixedcropping(LER)(4Germansitesin2004and2005)
oilcrops maincrops mixedcropping
LER
cropcombination sole mixed sole mixed total
wintervarieties:
barley/rape 720 250 3580a 1910 2160b 0.88
rye/rape 610 230 4490a 2630 2750b 0.96
pea/rape 720 490 320b 370 870a 1.84
springvarieties:
pea/camelina 1100 750 1470b 1120 1870a 1.44
pea/camelinaI 1260 470 2480b 2350 2830a 1.32
pea/rape 40 40 1470b 1760 1800a 2.20
pea/w.mustard 630 450 1470a 700 1150b 1.19
lupin/camelina 1100 750 1410b 910 1660a 1.33
lupin/safflower 1080 800 1410a 470 1270a 1.07
wheat/camelina 1100 370 3660a 2660 3030b 1.06
wheat/linseed 740 140 3660a 2990 3140b 1.01
camelinam/linseed 740 240 1100a 890 1140a 1.13
Icamelina inbroadcastseeding,mmaincropcamelinaa,b:significantdifferencesbetweenyieldsofmaincropsareindicatedbydifferentletters(p<0.05)
Mixed croppingof legumeswith rape or camelina onaverageleadtoaremarkabletotalyieldincreasecomparedtothesolecroppedmaincrop.HighLERvaluesbetween1.32and2.20indicatethehighareaefficiencyofproduc-tionofthosemixtures(Table1).Camelina deliveredonaveragebetween370and750
kg/haseedswithamoderateyieldreductionofthemaincrops (peaor blue lupin). LER values between1.32 and1.44werereached.Maximumyieldsof1.75tand2.36tha camelina occurred in pea or L. angustifolius, respec-tively.Atthisyieldleveltheyieldsofthemaincropswerestrictlyreduced(Paulsen,2007a).Pea(wintervariety)waskept upright by the rape (winter variety) and reachedhigher yield in mixed cropping. But both cultures wereatanunsatisfactorylowyieldlevel.Flowersandseedsofrape(springvariety)werealmostdestroyedcompletelybyinsects inmixedandsolecropping.Thisandanaverageyieldincreaseofpeainmixedcroppingwithrape(springvariety)leadtothehighLERvalueof2.2.Duetotheirde-scribedextremeyieldriskmixtureswithrapeneedfurtherevaluation.Safflowerproofedtobeverycompetitiveinmixturewith
L. angustifiolius.AtanLERof1.07ofmixedcroppingtheyieldwasdominatedbysafflower (Table1).Thistendencywasadditionallyincreasedbythedifferingripeningtimesofbothcultureswhichleadtopre-harvestyieldlossesinbluelupin.Furthercamelinaorlinseedweredominatedbyspringwheatinmixedcropping. Springwheat realizeddis-proportionatelyhighyieldsinmixedcroppingifplantnum-berreductionandextensioninrowdistancesinrelationtosolecroppingwhichweregivenbythetrialdesignarecon-sidered.Inthosesystemstheoilcropscamelinaorlinseedshowedseedyieldsof370kg/haand140kg/ha(drymat-ter),respectively.Maximumyieldsofcamelinaof960kg/ha(drymatter)onlyoccurredtogetherwithlowyieldlevelsofthemaincropspringwheat(Paulsen,2007b).Inmixedcroppingwithlinseed, camelina dominatedtheyield.ButalsointhefourlattermixedcroppingsystemsLERvalueslargerthanonecouldbereached(Table1).Exceptthemix-turespea/whitemustardandlupin/safflower inallmixedcropsthemaincropshadrelativeyieldshigheras0.5.Thismeansthatyieldincreasesinfoodproductionarepossibleparalleltotheproductionofrenewablefuel.Meanabsoluteyieldgainsandlossesofmixedcropping
withoilcropsinorganicfarmsatsameareausebothcul-tureswouldhaveinsolecroppingaretabulatedinTable2.Thisscenariocanbehelpful,whenoilseedsshallbepro-ducedinthefarmandmixedcroppingshallhelptoover-comecroppingdifficultiese.g.inweedorpestmanage-ment(SauckeandAckermann,2006;Paulsenetal.,2006;Paulsenetal.,2007b).ThereforeinTable2theintroduc-tionof2hamixedcroppingiscomparedwiththeproduc-tionof1haofeachcultureinsolecropping.
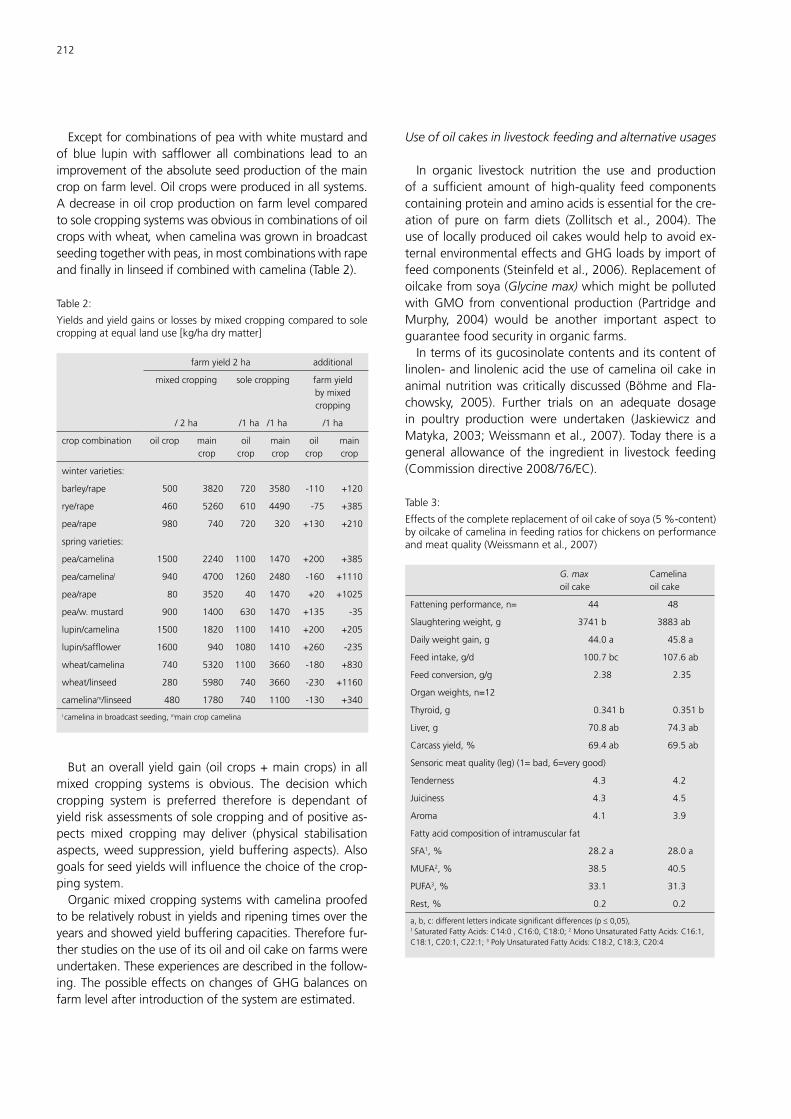
212
Exceptforcombinationsofpeawithwhitemustard andof blue lupinwith safflower all combinations lead to animprovementoftheabsoluteseedproductionofthemaincroponfarmlevel.Oilcropswereproducedinallsystems.Adecreaseinoilcropproductiononfarmlevelcomparedtosolecroppingsystemswasobviousincombinationsofoilcropswithwheat, whencamelinawasgrowninbroadcastseedingtogetherwithpeas,inmostcombinationswithrape andfinallyin linseed ifcombined with camelina (Table2).
Table2:
Yieldsandyieldgainsorlossesbymixedcroppingcomparedtosolecroppingatequallanduse[kg/hadrymatter]
farmyield2ha additional
mixedcropping solecropping farmyieldbymixedcropping
/2ha /1ha/1ha /1ha
cropcombination oilcrop maincrop
oilcrop
maincrop
oilcrop
maincrop
wintervarieties:
barley/rape 500 3820 720 3580 -110 +120
rye/rape 460 5260 610 4490 -75 +385
pea/rape 980 740 720 320 +130 +210
springvarieties:
pea/camelina 1500 2240 1100 1470 +200 +385
pea/camelinaI 940 4700 1260 2480 -160 +1110
pea/rape 80 3520 40 1470 +20 +1025
pea/w.mustard 900 1400 630 1470 +135 -35
lupin/camelina 1500 1820 1100 1410 +200 +205
lupin/safflower 1600 940 1080 1410 +260 -235
wheat/camelina 740 5320 1100 3660 -180 +830
wheat/linseed 280 5980 740 3660 -230 +1160
camelinam/linseed 480 1780 740 1100 -130 +340
Icamelina inbroadcastseeding,mmaincropcamelina
Butanoverallyieldgain (oilcrops+maincrops) inallmixed cropping systems is obvious. The decision whichcropping system is preferred therefore is dependant ofyieldriskassessmentsofsolecroppingandofpositiveas-pects mixed cropping may deliver (physical stabilisationaspects,weedsuppression,yieldbufferingaspects).Alsogoalsforseedyieldswillinfluencethechoiceofthecrop-pingsystem.Organicmixedcroppingsystemswithcamelinaproofed
toberelativelyrobustinyieldsandripeningtimesovertheyearsandshowedyieldbufferingcapacities.Thereforefur-therstudiesontheuseofitsoilandoilcakeonfarmswereundertaken.Theseexperiencesaredescribedinthefollow-ing.ThepossibleeffectsonchangesofGHGbalancesonfarmlevelafterintroductionofthesystemareestimated.
Use of oil cakes in livestock feeding and alternative usages
In organic livestock nutrition the use and productionof a sufficient amountof high-quality feed componentscontainingproteinandaminoacidsisessentialforthecre-ation of pure on farm diets (Zollitsch et al., 2004). Theuseoflocallyproducedoilcakeswouldhelptoavoidex-ternalenvironmentaleffectsandGHGloadsbyimportoffeedcomponents(Steinfeldetal.,2006).Replacementofoilcakefromsoya(Glycine max) whichmightbepollutedwithGMO from conventional production (Partridge andMurphy, 2004) would be another important aspect toguaranteefoodsecurityinorganicfarms.Intermsofitsgucosinolatecontentsanditscontentof
linolen-andlinolenicacidtheuseofcamelinaoilcakeinanimalnutritionwascriticallydiscussed (BöhmeandFla-chowsky, 2005). Further trials on an adequate dosagein poultry production were undertaken (Jaskiewicz andMatyka,2003;Weissmannetal.,2007).Todaythereisageneral allowance of the ingredient in livestock feeding(Commissiondirective2008/76/EC).
Table3:
Effectsofthecompletereplacementofoilcakeofsoya(5%-content)byoilcakeofcamelinainfeedingratiosforchickensonperformanceandmeatquality(Weissmannetal.,2007)
G. maxoilcake
Camelinaoilcake
Fatteningperformance,n= 44 48
Slaughteringweight,g 3741b 3883ab
Dailyweightgain,g 44.0a 45.8a
Feedintake,g/d 100.7bc 107.6ab
Feedconversion,g/g 2.38 2.35
Organweights,n=12
Thyroid,g 0.341b 0.351b
Liver,g 70.8ab 74.3ab
Carcassyield,% 69.4ab 69.5ab
Sensoricmeatquality(leg)(1=bad,6=verygood)
Tenderness 4.3 4.2
Juiciness 4.3 4.5
Aroma 4.1 3.9
Fattyacidcompositionofintramuscularfat
SFA1,% 28.2a 28.0a
MUFA2,% 38.5 40.5
PUFA3,% 33.1 31.3
Rest,% 0.2 0.2
a,b,c:differentlettersindicatesignificantdifferences(p≤0,05),1 SaturatedFattyAcids:C14:0,C16:0,C18:0;2MonoUnsaturatedFattyAcids:C16:1,C18:1,C20:1,C22:1;3PolyUnsaturatedFattyAcids:C18:2,C18:3,C20:4
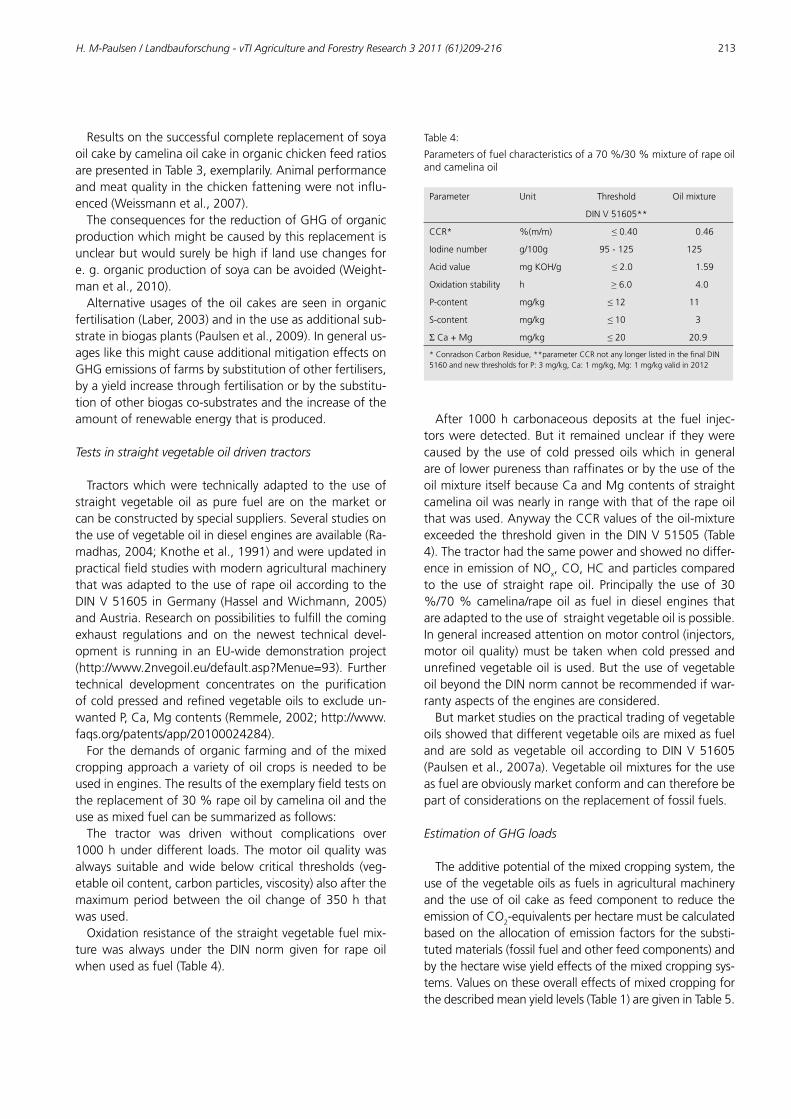
H. M-Paulsen / Landbauforschung - vTI Agriculture and Forestry Research 3 2011 (61)209-216 213
ResultsonthesuccessfulcompletereplacementofsoyaoilcakebycamelinaoilcakeinorganicchickenfeedratiosarepresentedinTable3,exemplarily.Animalperformanceandmeatqualityinthechickenfatteningwerenotinflu-enced(Weissmannetal.,2007).TheconsequencesforthereductionofGHGoforganic
productionwhichmightbecausedbythisreplacementisunclearbutwouldsurelybehighiflandusechangesfore.g.organicproductionofsoyacanbeavoided(Weight-manetal.,2010).Alternativeusagesoftheoilcakesareseen inorganic
fertilisation(Laber,2003)andintheuseasadditionalsub-strateinbiogasplants(Paulsenetal.,2009).Ingeneralus-ageslikethismightcauseadditionalmitigationeffectsonGHGemissionsoffarmsbysubstitutionofotherfertilisers,byayieldincreasethroughfertilisationorbythesubstitu-tionofotherbiogasco-substratesandtheincreaseoftheamountofrenewableenergythatisproduced.
Tests in straight vegetable oil driven tractors
Tractorswhichwere technically adapted to theuseofstraight vegetable oil as pure fuel are on themarket orcanbeconstructedbyspecialsuppliers.Severalstudiesontheuseofvegetableoilindieselenginesareavailable(Ra-madhas,2004;Knotheetal.,1991)andwereupdatedinpracticalfieldstudieswithmodernagriculturalmachinerythatwasadaptedtotheuseofrapeoilaccordingtotheDINV51605 inGermany (HasselandWichmann,2005)andAustria.Researchonpossibilitiestofulfillthecomingexhaust regulations and on the newest technical devel-opment is running inanEU-widedemonstrationproject(http://www.2nvegoil.eu/default.asp?Menue=93). Furthertechnical development concentrates on the purificationofcoldpressedandrefinedvegetableoilstoexcludeun-wantedP,Ca,Mgcontents(Remmele,2002;http://www.faqs.org/patents/app/20100024284).Forthedemandsoforganicfarmingandofthemixed
croppingapproachavarietyofoilcrops isneededtobeusedinengines.Theresultsoftheexemplaryfieldtestsonthereplacementof30%rapeoilbycamelinaoilandtheuseasmixedfuelcanbesummarizedasfollows:The tractor was driven without complications over
1000hunderdifferent loads.Themotoroilqualitywasalways suitable andwide below critical thresholds (veg-etableoilcontent,carbonparticles,viscosity)alsoafterthemaximumperiodbetween theoil changeof350h thatwasused.Oxidationresistanceofthestraightvegetablefuelmix-
turewas always under theDIN norm given for rape oilwhenusedasfuel(Table4).
Table4:
Parametersoffuelcharacteristicsofa70%/30%mixtureofrapeoilandcamelinaoil
Parameter Unit Threshold Oilmixture
DINV51605**
CCR* %(m/m) ≤0.40 0.46
Iodinenumber g/100g 95-125 125
Acidvalue mgKOH/g ≤2.0 1.59
Oxidationstability h ≥6.0 4.0
P-content mg/kg ≤ 12 11
S-content mg/kg ≤ 10 3
ΣCa+Mg mg/kg ≤20 20.9
*ConradsonCarbonResidue,**parameterCCRnotanylongerlistedinthefinalDIN5160andnewthresholdsforP:3mg/kg,Ca:1mg/kg,Mg:1mg/kgvalidin2012
After1000h carbonaceousdeposits at the fuel injec-torsweredetected.But itremainedunclear iftheywerecausedby theuseof coldpressedoilswhich ingeneralareoflowerpurenessthanraffinatesorbytheuseoftheoilmixtureitselfbecauseCaandMgcontentsofstraightcamelina oilwasnearlyinrangewiththatoftherapeoilthatwasused.AnywaytheCCRvaluesoftheoil-mixtureexceededthethresholdgiven intheDINV51505(Table4).Thetractorhadthesamepowerandshowednodiffer-enceinemissionofNOx,CO,HCandparticlescomparedto theuseof straight rapeoil. Principally theuseof 30%/70%camelina/rapeoil as fuel indiesel engines thatareadaptedtotheuseofstraightvegetableoilispossible.Ingeneralincreasedattentiononmotorcontrol(injectors,motoroilquality)mustbetakenwhencoldpressedandunrefinedvegetableoil isused.ButtheuseofvegetableoilbeyondtheDINnormcannotberecommendedifwar-rantyaspectsoftheenginesareconsidered.Butmarketstudiesonthepracticaltradingofvegetable
oilsshowedthatdifferentvegetableoilsaremixedasfuelandare soldas vegetableoil according toDINV51605(Paulsenetal.,2007a).Vegetableoilmixturesfortheuseasfuelareobviouslymarketconformandcanthereforebepartofconsiderationsonthereplacementoffossilfuels.
Estimation of GHG loads
Theadditivepotentialofthemixedcroppingsystem,theuseofthevegetableoilsasfuelsinagriculturalmachineryandtheuseofoilcakeasfeedcomponenttoreducetheemissionofCO2-equivalentsperhectaremustbecalculatedbasedontheallocationofemissionfactorsforthesubsti-tutedmaterials(fossilfuelandotherfeedcomponents)andbythehectarewiseyieldeffectsofthemixedcroppingsys-tems.Valuesontheseoveralleffectsofmixedcroppingforthedescribedmeanyieldlevels(Table1)aregiveninTable5.
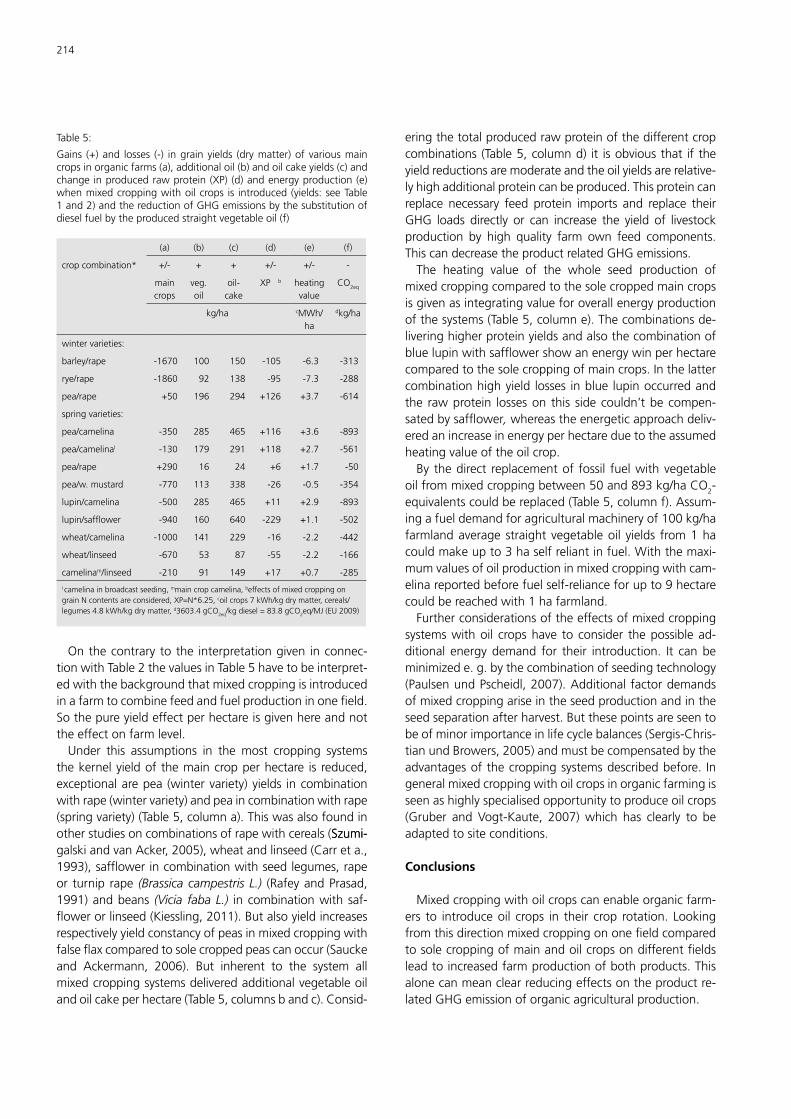
214
Table5:
Gains (+)and losses (-) ingrainyields (drymatter)of variousmaincropsinorganicfarms(a),additionaloil(b)andoilcakeyields(c)andchangeinproducedrawprotein(XP)(d)andenergyproduction(e)whenmixedcroppingwithoilcrops is introduced(yields:seeTable1and2)andthereductionofGHGemissionsbythesubstitutionofdieselfuelbytheproducedstraightvegetableoil(f)
(a) (b) (c) (d) (e) (f)
cropcombination* +/- + + +/- +/- -
maincrops
veg.oil
oil-cake
XPb heatingvalue
CO2eq
kg/ha cMWh/ha
dkg/ha
wintervarieties:
barley/rape -1670 100 150 -105 -6.3 -313
rye/rape -1860 92 138 -95 -7.3 -288
pea/rape +50 196 294 +126 +3.7 -614
springvarieties:
pea/camelina -350 285 465 +116 +3.6 -893
pea/camelinaI -130 179 291 +118 +2.7 -561
pea/rape +290 16 24 +6 +1.7 -50
pea/w.mustard -770 113 338 -26 -0.5 -354
lupin/camelina -500 285 465 +11 +2.9 -893
lupin/safflower -940 160 640 -229 +1.1 -502
wheat/camelina -1000 141 229 -16 -2.2 -442
wheat/linseed -670 53 87 -55 -2.2 -166
camelinam/linseed -210 91 149 +17 +0.7 -285
Icamelina inbroadcastseeding,mmaincropcamelina,beffectsofmixedcroppingongrainNcontentsareconsidered,XP=N*6.25,coilcrops7kWh/kgdrymatter,cereals/legumes4.8kWh/kgdrymatter,d3603.4gCO2eq/kgdiesel=83.8gCO2eq/MJ(EU2009)
Onthecontrarytothe interpretationgiven inconnec-tionwithTable2thevaluesinTable5havetobeinterpret-edwiththebackgroundthatmixedcroppingisintroducedinafarmtocombinefeedandfuelproductioninonefield.Sothepureyieldeffectperhectareisgivenhereandnottheeffectonfarmlevel.Under this assumptions in the most cropping systems
thekernelyieldofthemaincropperhectare is reduced,exceptionalarepea (wintervariety)yields incombinationwithrape(wintervariety)andpea incombination withrape(springvariety)(Table5,columna).Thiswasalsofoundinotherstudiesoncombinationsofrapewithcereals(Szumi-Szumi-galskiandvanAcker,2005),wheatandlinseed(Carreta.,1993),safflowerincombinationwithseedlegumes,rapeor turnip rape (Brassica campestris L.) (RafeyandPrasad,1991)andbeans (Vicia faba L.) incombinationwith saf-flowerorlinseed(Kiessling,2011).Butalsoyieldincreasesrespectivelyyieldconstancyofpeasinmixedcroppingwithfalseflaxcomparedtosolecroppedpeascanoccur(Sauckeand Ackermann, 2006). But inherent to the system allmixedcroppingsystemsdeliveredadditionalvegetableoilandoilcakeperhectare(Table5,columnsbandc).Consid-
eringthetotalproducedrawproteinofthedifferentcropcombinations (Table5,columnd) it isobviousthat if theyieldreductionsaremoderateandtheoilyieldsarerelative-lyhighadditionalproteincanbeproduced.Thisproteincanreplace necessary feed protein imports and replace theirGHG loads directly or can increase the yield of livestockproduction by high quality farm own feed components.ThiscandecreasetheproductrelatedGHGemissions.The heating value of the whole seed production of
mixedcroppingcomparedtothesolecroppedmaincropsisgivenasintegratingvalueforoverallenergyproductionofthesystems(Table5,columne).Thecombinationsde-liveringhigherproteinyieldsandalsothecombinationofbluelupinwith safflower showanenergywinperhectarecomparedtothesolecroppingofmaincrops.Inthelattercombinationhighyield losses inblue lupinoccurredandthe rawprotein losseson this sidecouldn’tbecompen-satedbysafflower,whereastheenergeticapproachdeliv-eredanincreaseinenergyperhectareduetotheassumedheatingvalueoftheoilcrop.By thedirect replacementof fossil fuelwithvegetable
oilfrommixedcroppingbetween50and893kg/haCO2-equivalentscouldbereplaced(Table5,columnf).Assum-ingafueldemandforagriculturalmachineryof100kg/hafarmlandaveragestraightvegetableoil yields from1hacouldmakeupto3haselfreliantinfuel.Withthemaxi-mumvaluesofoilproductioninmixedcroppingwithcam-elinareportedbeforefuelself-relianceforupto9hectarecouldbereachedwith1hafarmland.Furtherconsiderationsoftheeffectsofmixedcropping
systemswithoil cropshave toconsider thepossiblead-ditional energydemand for their introduction. It canbeminimizede.g.bythecombinationofseedingtechnology(PaulsenundPscheidl,2007).Additionalfactordemandsofmixedcroppingariseintheseedproductionandintheseedseparationafterharvest.Butthesepointsareseentobeofminorimportanceinlifecyclebalances(Sergis-Chris-tianundBrowers,2005)andmustbecompensatedbytheadvantagesofthecroppingsystemsdescribedbefore. Ingeneralmixedcroppingwithoilcropsinorganicfarmingisseenashighlyspecialisedopportunitytoproduceoilcrops(Gruber and Vogt-Kaute, 2007)which has clearly to beadaptedtositeconditions.
Conclusions
Mixedcroppingwithoilcropscanenableorganicfarm-ers to introduceoil crops in their crop rotation. Lookingfromthisdirectionmixedcroppingononefieldcomparedtosolecroppingofmainandoilcropsondifferentfieldsleadtoincreasedfarmproductionofbothproducts.Thisalonecanmeanclearreducingeffectsontheproductre-latedGHGemissionoforganicagriculturalproduction.
H. M-Paulsen / Landbauforschung - vTI Agriculture and Forestry Research 3 2011 (61)209-216 215
Mixedcroppingwithoilcropscanalsobeintroducedascroppingconcepttoproducestraightvegetableoilasfuelfor agriculturalmachinery. Yields of themain cropswillbereducedinthatcasebutarereplacedbyproductswithotherquantitiesandqualities.Thishastobeconsideredinfarmbalancesandintheirscenariodescriptions.Withstraightvegetableoilfrommixedcroppingwithoil
cropsfossilfuelcanbereplaced.Theco-productoilcakeandanincreasedproteinproductionperhectaremeananaddedvalueforlivestockproductivityandareductionofimported feed components can be expected. These as-pectsofferclearpotentialofthedescribedsystemtore-duceGHGemissionsoforganicfarms.Theproductionofbiofuelinthiswayhasonlymoderatecompetitiontofoodproduction.
References
BöhmeH,FlachowskyG(2005)ZurEignungvonLeindotterpresskuchenalsFut-termittelfürSchweine,WiederkäuerundGeflügel.LandbauforschVölken-LandbauforschVölken-rode55(3):157-162
CarrPM,SchatzBG,GardnerJC,ZwingerSF(1993)Grainyieldsandreturnsfromintercroppingwheatandflax.JProdAgric6(1):67-72
Commissiondirective2008/76/ECof25 July2008amendingAnnex I toDi-rective2002/32/ECoftheEuropeanParliamentandoftheCouncilonun-desirablesubstancesinanimalfeed[online].Tobefoundat<http://eur-lex.europa.eu/LexUriServ/LexUriServ.do?uri=OJ:L:2008:198:0037:0040:EN:PDF>[quoted06.06.2011]
CormackWF(2000)Energyuseinorganicfarmingsystems:FinalprojectreportOF0182ofADAStotheMinistryofAgriculture,FisheriesandFood,Lon-don.ADASConsultingLtd.Norfolk,21p,[online].Tobefoundat<http://orprints.org/8169>[quoted08.06.2011]
DINV51605(2006)Fuelsforvegetableoilcompatiblecombustionengines:fuelfromrapeseedoil;requirementsandtestmethods.Berlin:Beuth
EU(2009)Directive2009/28/ECoftheEuropeanParliamentandoftheCouncilof23April2009onthepromotionoftheuseofenergyfromrenewablesources and amending and subsequently repealing Directives 2001/77/EC and 2003/30/EC [online]. To be found at <http://eur-lex.europa.eu/LexUriServ/LexUriServ.do?uri=OJ:L:2009:140:0016:0062:en:PDF> [quoted06.06.2011]
GruberH,Vogt-KauteW(2007)AnbaubedeutungundÖkonomievonÖlsaatenimökologischenLandbau.LandbauforschVölkenrodeSH309:39-46
HasselE,WichmannV(2005)ErgebnissedesDemonstrationsvorhabens„Pra-xiseinsatzvonserienmäßigenneuen rapsöltauglichenTraktoren“ [online].To be found at <http://www.biotrieb.org/fileadmin/user_upload/biotrieb/pdf/100traktorenErgebnisse.pdf>[quoted31.05.2011]
Hof C, Rauber R (2003) Anbau von Gemengen im ökologischen Landbau.Bonn:GeschäftsstelleBundesprogrammÖkologischerLandbau,55p
Jaskiewicz T,Matyka S (2003) Application of Camelina sativa, its seeds, ex-trudateandoilcakeindietsforbroilerchickensandtheeffectonrearingindicesandcarcassquality.AnnAnimSciSuppl2:181-184
JensenES(2006)Intercroppingofcerealsandgrainlegumesforincreasedpro-duction,weedcontrol,improvedproductqualityandpreventionofN-lossesinEuropeanorganicfarmingsystems[online].Tobefoundat<http://www.intercrop.dk>[quoted31.05.2011]
KiesslingD (2011)Ackerbohnen-GemengemitÖlfrüchten : Saflor, SenfundÖllein.Berlin:Köster,116p,SchrRInstOrgLandbau34
KnotheG,DunnRO,BagbyMO (1997)Biodiesel : theuseof vegetableoilsandtheirderivatesasalternativedieselfuels.ACSSympSer666:172-208
LaberH(2003)N-FreisetzungausorganischenHandelsdüngern:Übersichtundeigene Versuchsergebnisse im ökologischen Gemüsebau. LandbauforschVölkenrodeSH259:17-20
MeadR,WilleyRW(1980)Theconceptsofalandequivalentratioandadvan-tagesinyieldfromintercropping.ExpAgric16:217-228
PaulsenHM(2007a)MischfruchtanbausystememitÖlpflanzenimökologischenLandbau:1.ErtragsstrukturdesMischfruchtanbausvonLeguminosenoderSommerweizenmitLeindotter(CamelinasativaL.Crantz).LandbauforschVölkenrode57(1):107-117
PaulsenHM(2007b)ForschungsprojektzumAnbauvonMischkulturenmitÖl-pflanzenzurVerbesserungderFlächenproduktivitätimökologischenLand-bau:HintergrundundProjektbeschreibung.LandbauforschVölkenrodeSH309:1-12
Paulsen HM (2008a) Mischfruchtanbausysteme mit Ölpflanzen im ökologi-schenAnbau:2.ErtragsstrukturdesMischfruchtanbausvonLein (LinumusitatissimumL.)mitSommerweizen,HaferoderLeindotter.Landbauforsch58(4):307-314
PaulsenHM(2008b)EnhancingGHGbalancesinorganicfarmsbyintegrationofnewbio-energycropconcepts[online].Tobefoundat<http://orgprints.org/17119/>[quoted31.05.2011]
PaulsenHM,PscheidlM(2007)DrilltechnikzurEtablierungvonMischfruchtan-bausystemen.LandbauforschVölkenrodeSH309:108-113
PaulsenHM,RahmannG (2004)Wie siehtderenergieautarkeHofmitopti-mierterNährstoffbilanz imJahr2025aus?LandbauforschVölkenrodeSH274:57-73
PaulsenHM,SchädlichO,OppermannR(2007a)DezentralePflanzenölerzeu-gungund-nutzungauchinökologischenBetrieben?In:ZikeliS,ClaupeinW,DabbertS(eds)ZwischenTraditionundGlobalisierung:Beiträgezur9.WissenschaftstagungÖkologischerLandbau;UniversitätHohenheim,20.-23.März2007;Bd.1.Berlin:Köster,pp409-412
Paulsen HM, Schochow M (2007) Erträge von MischfruchtanbausystemenmitÖlpflanzen imökologischen Landbau. LandbauforschVölkenrodeSH309:13-32
PaulsenHM,SchochowM,ReentsH-J (2007b)UnkrautvorkommenundUn-krautunterdrückunginMischfruchtanbausystemenmitÖlpflanzenimöko-logischenLandbau.LandbauforschVölkenrodeSH309:81-95
PaulsenHM,SchochowM,UlberB,KühneS,RahmannG(2006)Mixedcrop-pingsystemsforbiologicalcontrolofweedsandpests inorganicoilseedcrops.AspApplBiol79:215-219
PaulsenHM,XiaomingW,Yongming S, RahmannG, BöhmH (2009) Effectoffalseflaxoilcakeinthermophilicbiogasproduction.LandbauforschSH326:47-60
PartridgeM,Murphy DJ (2004) Detection of geneticallymodified soya in arangeoforganicandhealthfoodproducts:implicationsfortheaccuratelabelling of foodstuffs derived from potential GM crops, British Food J106(3):166-180
PettersonB,WallenhammarAC,SvarénA(2002)OrganicproductionofoilseedrapeinSweden.In:ThompsonR(ed)Cultivatingcommunities:14thIFOAMOrganicWorldCongress;proceedings.Ottawa:CanadianOrganicGrow-ers,p64
RafeyA,PrasadNK(1991)Biologicalpotentialandeconomicfeasibilityofin-tercropping oilseeds and pulseswith safflower (Carthamus tinctorius) indrylands.IndianJAgricSci61(12):893-897
RamadhasAS,JayarajS,MuraleedharanC(2004)UseofvegetableoilsasI.C.enginefuels:areview.RenewableEnergy29:727-742
RemmeleE(2002)ReinigungkaltgepressterPflanzenöleausdezentralenAnla-gen.München:BayerStaatsministLandwirtForsten,161p
SauckeH,AckermannK(2006)Weedsuppressioninmixedcroppedgrainpeasandfalseflax(Camelinasativa).WeedRes46:453–461
Sergis-Christian L, Brouwers J (2005) Dezentral hergestelltes, kaltgepresstesPflanzenölimökologischenVergleichmitDieselkraftstoff.Witzenhausen:AGLand-Regionalentwicklung,67p,ArbeitsergebnisseSH3
SteinfeldH,Gerber P,Wassenaar T, Castel V, RosalesM, deHaanC (2006)Lifestock‘slongshadow:environmentalissuesandoptions.Rome:FAO,390p
SzumigalskiA,vanAckerR(2005)Weedsuppressionandcropproductioninannualintercrops.WeedSci53:813-825
SzumigalskiA, vanAckerR (2006)Nitrogen yield and landuse efficiency inannualsolecropsandintercrops.AgronJ98:1030-1040
216
TrenbarthBR (1986)Resourceuseby intercrops. In: FrancisCA (ed)Multiplecroppingsystems.NewYork:Macmillan,pp57-81
Valantin-MorisonM,Meynard JM (2008)Diagnosis of limiting factors of or-ganic oilseed rape yield : a survey of farmers’ fields.Agron SustainDev28:527-539
Valantin-MorisonM,MeynardJM,DoreT(2007)Effectsofcropmanagementand surroundingfieldenvironmenton insect incidence inorganicwinteroilseedrape(BrassicanapusL.).CropProt26:1108-1120
WeightmanRM,CottrillBR,WiltshireJJJ,KindredDR,Sylvester-BradleyR(2010)Opportunities for avoidance of land-use change through substitution ofsoya beanmeal and cereals in European livestock dietswith bioethanolcoproducts.GCBBioenergy3(2):158-170
Weissmann F, Paulsen HM, Fischer K, Matthäus B, Bauer M, Pscheidl M,Vogt-KauteW(2007)ZumEinflussderFütterungaufdieSchlachtleistungvon Broilern aus ökologischerMast : Fütterungsversuchemit Leindotter-presskuchen imHinblick auf die Schlachtkörperqualität. Fleischwirtschaft87(4):206-210
ZollitschW,KristensenT,KrutzinnaC,MacNaeihdeF,YounieD(2004)Feedingforhealthandwelfare:thechallengeofformulatingwell-balancedrationsinorganiclivestockproduction.In:VaarstM,RoderickS,LundV,LockeretzW(eds)Animalhealthandwelfareinorganicagriculture.Wallingford:CABPubl,pp329-356
H.-D. Haenel, U. Dämmgen, P. Laubach, C. Rösemann / Landbauforschung - vTI Agriculture and Forestry Research 3 2011 (61)217-228 217
Update of the calculation of metabolizable energy requirements for pigs in the German agricultural emission inventory
Hans-DieterHaenel*,1 UlrichDämmgen*,PetraLaubach**,2andClausRösemann*
* JohannHeinrichvonThünenInstitute(vTI),InstituteforAgriculturalClimateResearch,Bundesallee50,38116Braunschweig,Germany
** Association for Technology and Structures in Agriculture (KTBL e.V.), Bartningstr.49,64289Darmstadt,Germany
Abstract
ThecalculationoftheenergyrequirementsofpigsusedintheGermanagriculturalemissioninventoryisupdatedonthebasisoftherecommendationsworkedoutbytheGermanSocietyofNutritionPhysiology(GfE).Atthesametime thenumeric solutions hitherto used in the calcula-tions of energy requirements of weaners and fatteningpigsintheemissioninventoriesarereplacedbyanalyticalsolutions.This results insimplifications in thecalculationprocedures.In the inventory this leads to reduced energy require-
ments for fattening pigs. However, the energy require-mentsforsows,weanersandboarsincrease.
Keywords: pigs, energy requirements, model, emission in-ventory
Zusammenfassung
Aktualisierung der Berechnung des Bedarfs an um-setzbarer Energie von Schweinen im deutschen land-wirtschaftlichen Emissionsinventar
DieBerechnungdesBedarfsanumsetzbarerEnergiefürSchweineimdeutschenlandwirtschaftlichenEmissionsin-ventarwirdaktualisiert.GrundlagesinddievomAusschussfürBedarfsnormenderGesellschaftfürErnährungsphysi-ologie(GfE)erarbeitetenRichtwerte.Gleichzeitigwerdendie bisher im Emissionsinventar üblichen numerischenLösungenderBerechnungendesEnergiebedarfsfürAuf-zuchtferkelundMastschweinedurchanalytischeLösungenersetztunddamitdieRechenverfahrenvereinfacht.ImInventarergebensichdarausfürMastschweineeine
VerringerungdesEnergiebedarfs,fürSauen,Aufzuchtfer-kelundZuchteberjedochErhöhungen.
Schlüsselwörter: Schweine, Energiebedarf, Modell, Emis-sionsinventar
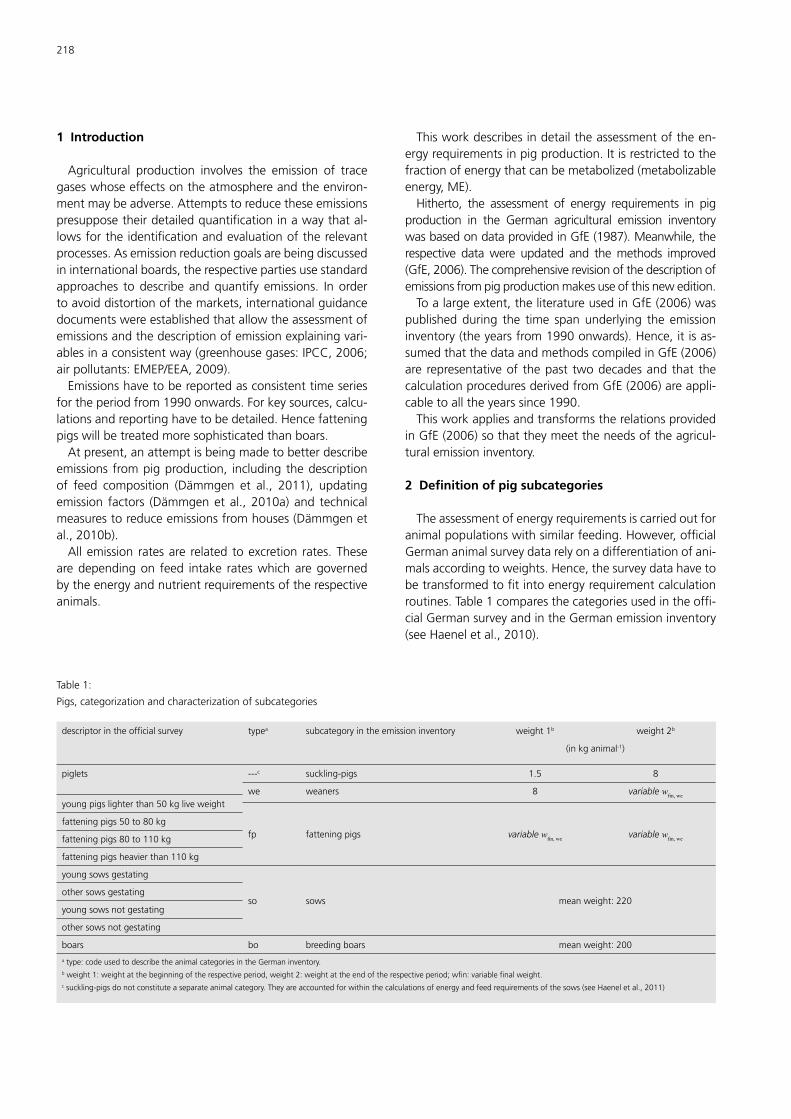
218
1 Introduction
Agricultural production involves the emission of tracegaseswhoseeffectsontheatmosphereandtheenviron-mentmaybeadverse.Attemptstoreducetheseemissionspresupposetheirdetailedquantificationinawaythatal-lowsfortheidentificationandevaluationoftherelevantprocesses.Asemissionreductiongoalsarebeingdiscussedininternationalboards,therespectivepartiesusestandardapproaches todescribe andquantify emissions. Inordertoavoiddistortionofthemarkets,internationalguidancedocumentswereestablishedthatallowtheassessmentofemissionsandthedescriptionofemissionexplainingvari-ablesinaconsistentway(greenhousegases:IPCC,2006;airpollutants:EMEP/EEA,2009).Emissionshavetobereportedasconsistenttimeseries
fortheperiodfrom1990onwards.Forkeysources,calcu-lationsandreportinghavetobedetailed.Hencefatteningpigswillbetreatedmoresophisticatedthanboars.Atpresent,anattemptisbeingmadetobetterdescribe
emissions frompigproduction, includingthedescriptionof feed composition (Dämmgen et al., 2011), updatingemission factors (Dämmgenet al., 2010a) and technicalmeasurestoreduceemissionsfromhouses(Dämmgenetal.,2010b).Allemission ratesare related toexcretion rates.These
aredependingon feed intake rateswhicharegovernedbytheenergyandnutrientrequirementsoftherespectiveanimals.
Thisworkdescribesindetailtheassessmentoftheen-ergyrequirementsinpigproduction.Itisrestrictedtothefractionofenergythatcanbemetabolized(metabolizableenergy,ME).Hitherto, the assessment of energy requirements in pig
production in the German agricultural emission inventorywasbasedondataprovidedinGfE(1987).Meanwhile,therespective datawere updated and themethods improved(GfE,2006).Thecomprehensiverevisionofthedescriptionofemissionsfrompigproductionmakesuseofthisnewedition.Toalargeextent,theliteratureusedinGfE(2006)was
publishedduring the time spanunderlying the emissioninventory(theyearsfrom1990onwards).Hence,itisas-sumedthatthedataandmethodscompiledinGfE(2006)are representativeof thepast twodecadesandthat thecalculationproceduresderivedfromGfE(2006)areappli-cabletoalltheyearssince1990.Thisworkappliesandtransformstherelationsprovided
inGfE(2006)sothattheymeettheneedsoftheagricul-turalemissioninventory.
2 Definition of pig subcategories
Theassessmentofenergyrequirementsiscarriedoutforanimalpopulationswithsimilarfeeding.However,officialGermananimalsurveydatarelyonadifferentiationofani-malsaccordingtoweights.Hence,thesurveydatahavetobetransformedtofitintoenergyrequirementcalculationroutines.Table1comparesthecategoriesusedintheoffi-cialGermansurveyandintheGermanemissioninventory(seeHaeneletal.,2010).
Table1:
Pigs,categorizationandcharacterizationofsubcategories
descriptorintheofficialsurvey typea subcategoryintheemissioninventory weight1b weight2b
(inkganimal-1)
piglets ---c suckling-pigs 1.5 8
we weaners 8 variablewfin, we
youngpigslighterthan50kgliveweight
fp fatteningpigs variablewfin, we variablewfin, we
fatteningpigs50to80kg
fatteningpigs80to110kg
fatteningpigsheavierthan110kg
youngsowsgestating
so sows meanweight:220othersowsgestating
youngsowsnotgestating
othersowsnotgestating
boars bo breedingboars meanweight:200
atype:codeusedtodescribetheanimalcategoriesintheGermaninventory.bweight1:weightatthebeginningoftherespectiveperiod,weight2:weightattheendoftherespectiveperiod;wfin:variablefinalweight.csuckling-pigsdonotconstituteaseparateanimalcategory.Theyareaccountedforwithinthecalculationsofenergyandfeedrequirementsofthesows(seeHaeneletal.,2011)
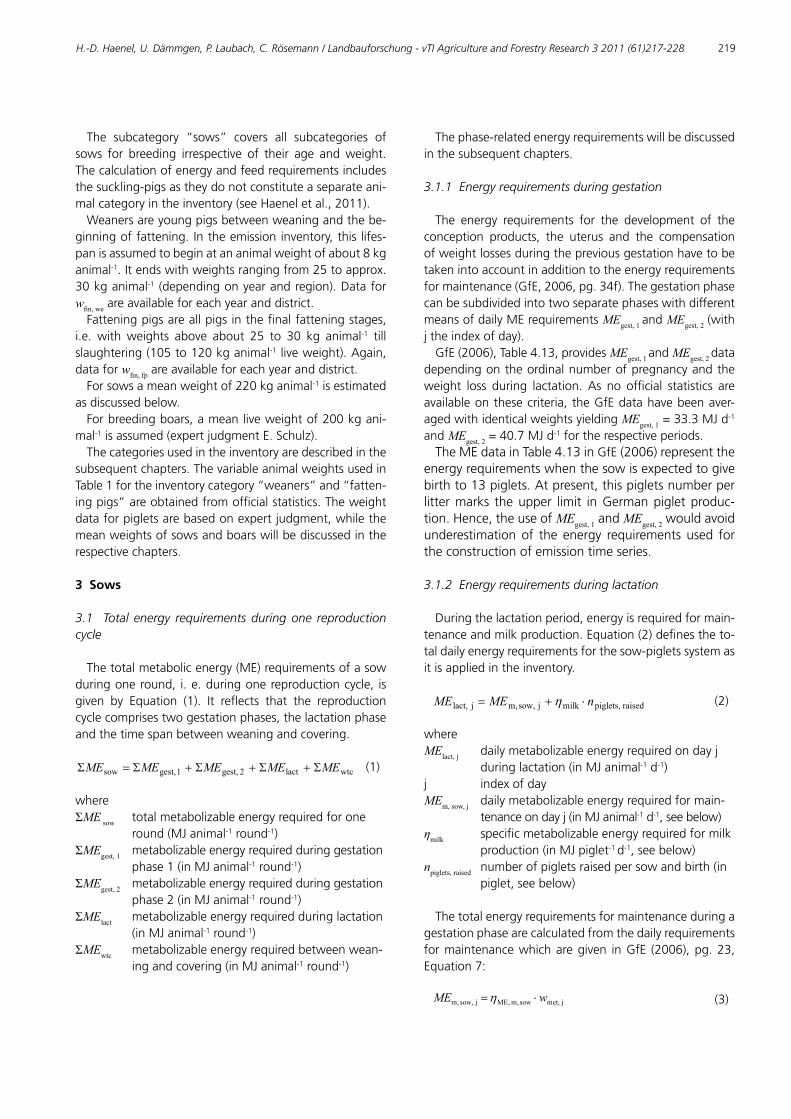
H.-D. Haenel, U. Dämmgen, P. Laubach, C. Rösemann / Landbauforschung - vTI Agriculture and Forestry Research 3 2011 (61)217-228 219
The subcategory “sows” covers all subcategories ofsows for breeding irrespective of their age andweight.Thecalculationofenergyandfeedrequirementsincludesthesuckling-pigsastheydonotconstituteaseparateani-malcategoryintheinventory(seeHaeneletal.,2011).Weanersareyoungpigsbetweenweaningandthebe-
ginningoffattening.Intheemissioninventory,thislifes-panisassumedtobeginatananimalweightofabout8kganimal-1.Itendswithweightsrangingfrom25toapprox.30kganimal-1 (dependingonyearandregion).Dataforwfin, weareavailableforeachyearanddistrict.Fatteningpigsareallpigsinthefinalfatteningstages,
i.e. with weights above about 25 to 30 kg animal-1 tillslaughtering(105to120kganimal-1liveweight).Again,dataforwfin, fpareavailableforeachyearanddistrict.Forsowsameanweightof220kganimal-1isestimated
asdiscussedbelow.Forbreedingboars,ameanliveweightof200kgani-
mal-1isassumed(expertjudgmentE.Schulz).Thecategoriesusedintheinventoryaredescribedinthe
subsequentchapters.ThevariableanimalweightsusedinTable1fortheinventorycategory“weaners”and“fatten-ingpigs”areobtainedfromofficialstatistics.Theweightdataforpigletsarebasedonexpertjudgment,whilethemeanweightsofsowsandboarswillbediscussedintherespectivechapters.
3 Sows
3.1 Total energy requirements during one reproduction cycle
Thetotalmetabolicenergy(ME)requirementsofasowduringoneround, i.e.duringonereproductioncycle, isgiven by Equation (1). It reflects that the reproductioncyclecomprisestwogestationphases,thelactationphaseandthetimespanbetweenweaningandcovering.
wtclact2 gest,1 gest,sow MEMEMEMEME
whereΣME sow totalmetabolizableenergyrequiredforone round(MJanimal-1round-1)ΣMEgest, 1 metabolizableenergyrequiredduringgestation phase1(inMJanimal-1round-1)ΣMEgest, 2 metabolizableenergyrequiredduringgestation phase2(inMJanimal-1round-1)ΣMElact metabolizableenergyrequiredduringlactation (inMJanimal-1round-1)ΣMEwtc metabolizableenergyrequiredbetweenwean- ingandcovering(inMJanimal-1round-1)
Thephase-relatedenergyrequirementswillbediscussedinthesubsequentchapters.
3.1.1 Energy requirements during gestation
The energy requirements for the development of theconception products, the uterus and the compensationofweightlossesduringthepreviousgestationhavetobetakenintoaccountinadditiontotheenergyrequirementsformaintenance(GfE,2006,pg.34f).ThegestationphasecanbesubdividedintotwoseparatephaseswithdifferentmeansofdailyMErequirementsMEgest, 1andMEgest, 2 (withjtheindexofday).GfE(2006),Table4.13,providesMEgest, 1andMEgest, 2data
dependingontheordinalnumberofpregnancyandtheweight loss during lactation. As no official statistics areavailableonthesecriteria, theGfEdatahavebeenaver-agedwithidenticalweightsyieldingMEgest, 1=33.3MJd
-1andMEgest, 2=40.7MJd
-1fortherespectiveperiods.TheMEdatainTable4.13inGfE(2006)representthe
energyrequirementswhenthesowisexpectedtogivebirthto13piglets.Atpresent,thispigletsnumberperlittermarks theupper limit inGermanpigletproduc-tion.Hence,theuseofMEgest, 1andMEgest, 2wouldavoidunderestimationof the energy requirements used fortheconstructionofemissiontimeseries.
3.1.2 Energy requirements during lactation
Duringthelactationperiod,energyisrequiredformain-tenanceandmilkproduction.Equation(2)definestheto-taldailyenergyrequirementsforthesow-pigletssystemasitisappliedintheinventory.
raisedpiglets,milkjsow, m,jlact, nMEME (2)
whereMElact, j dailymetabolizableenergyrequiredondayj duringlactation(inMJanimal-1d-1)j indexofdayMEm, sow, j dailymetabolizableenergyrequiredformain- tenanceondayj(inMJanimal-1d-1,seebelow)ηmilk specificmetabolizableenergyrequiredformilk production(inMJpiglet-1d-1,seebelow)npiglets, raised numberofpigletsraisedpersowandbirth(in piglet,seebelow)
Thetotalenergyrequirementsformaintenanceduringagestationphasearecalculatedfromthedailyrequirementsformaintenancewhicharegiven inGfE (2006),pg.23,Equation7:
j met,sow m,ME,jsow,m, wME (3)
(1)
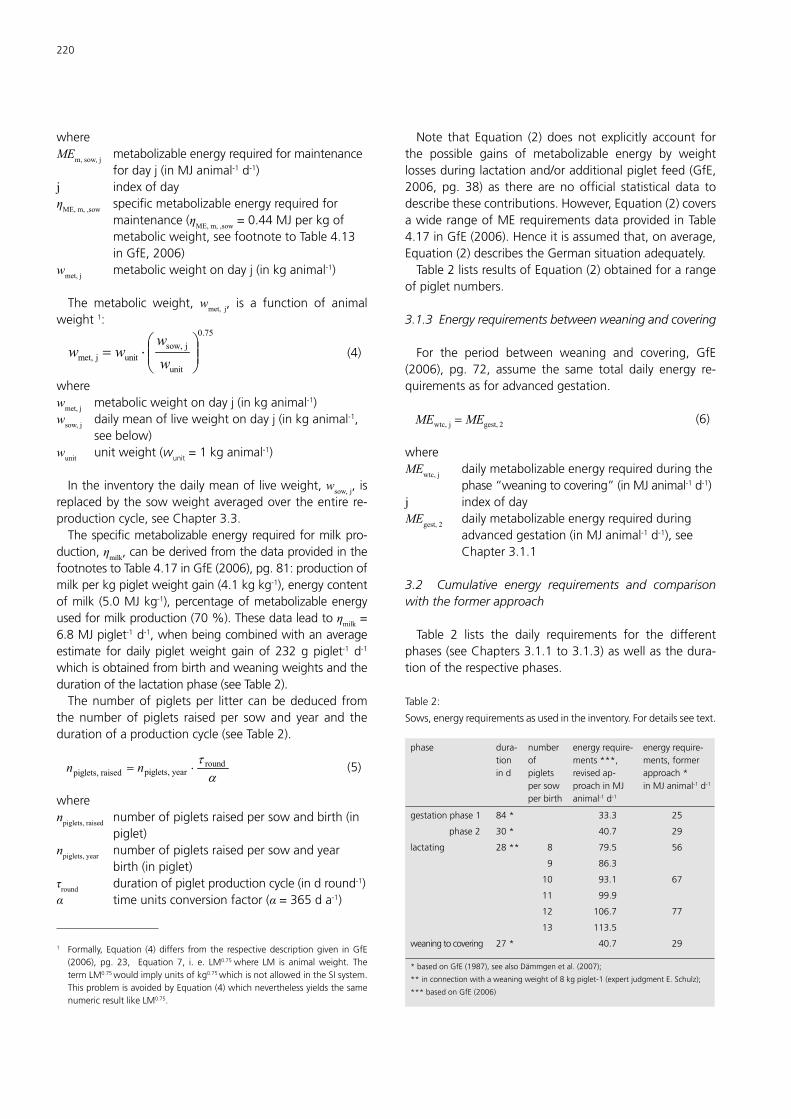
220
whereMEm, sow, j metabolizableenergyrequiredformaintenance fordayj(inMJanimal-1d-1)j indexofdayηME, m, ,sow specificmetabolizableenergyrequiredfor maintenance(ηME, m, ,sow=0.44MJperkgof metabolicweight,seefootnotetoTable4.13 inGfE,2006)wmet, j metabolicweightondayj(inkganimal-1)
The metabolic weight, wmet, j, is a function of animalweight1:
.0
unit
jsow,unitj met, w
www (4)
wherewmet, j metabolicweightondayj(inkganimal
-1)wsow, j dailymeanofliveweightondayj(inkganimal
-1, seebelow)wunit unitweight(wunit=1kganimal
-1)
Intheinventorythedailymeanofliveweight,wsow, j,isreplacedbythesowweightaveragedovertheentirere-productioncycle,seeChapter3.3.Thespecificmetabolizableenergyrequiredformilkpro-
duction,ηmilk,canbederivedfromthedataprovidedinthefootnotestoTable4.17inGfE(2006),pg.81:productionofmilkperkgpigletweightgain(4.1kgkg-1),energycontentofmilk (5.0MJkg-1),percentageofmetabolizableenergyusedformilkproduction(70%).Thesedataleadtoηmilk=6.8MJpiglet-1d-1,whenbeingcombinedwithanaverageestimate for daily pigletweight gain of 232 g piglet-1 d-1whichisobtainedfrombirthandweaningweightsandthedurationofthelactationphase(seeTable2).Thenumberofpigletsper litter canbededuced from
the number of piglets raised per sow and year and thedurationofaproductioncycle(seeTable2).
roundyearpiglets,raisedpiglets, nn (5)
wherenpiglets, raised numberofpigletsraisedpersowandbirth(in piglet)npiglets, year numberofpigletsraisedpersowandyear birth(inpiglet)τround durationofpigletproductioncycle(indround-1)α timeunitsconversionfactor(α =365da-1)
1 Formally, Equation (4)differs from the respectivedescriptiongiven inGfE(2006), pg. 23, Equation 7, i. e. LM0.75where LM is animalweight. ThetermLM0.75wouldimplyunitsofkg0.75whichisnotallowedintheSIsystem.ThisproblemisavoidedbyEquation(4)whichneverthelessyieldsthesamenumericresultlikeLM0.75.
Note that Equation (2) does not explicitly account forthe possible gains of metabolizable energy by weightlossesduringlactationand/oradditionalpigletfeed(GfE,2006, pg. 38) as there are no official statistical data todescribethesecontributions.However,Equation(2)coversawiderangeofMErequirementsdataprovidedinTable4.17inGfE(2006).Henceitisassumedthat,onaverage,Equation(2)describestheGermansituationadequately.Table2listsresultsofEquation(2)obtainedforarange
ofpigletnumbers.
3.1.3 Energy requirements between weaning and covering
For the period between weaning and covering, GfE(2006), pg. 72, assume the same total daily energy re-quirementsasforadvancedgestation.
2gest,jwtc, MEME (6)
whereMEwtc, j dailymetabolizableenergyrequiredduringthe phase“weaningtocovering”(inMJanimal-1d-1)j indexofdayMEgest, 2 dailymetabolizableenergyrequiredduring advancedgestation(inMJanimal-1d-1),see Chapter3.1.1
3.2 Cumulative energy requirements and comparison with the former approach
Table 2 lists the daily requirements for the differentphases(seeChapters3.1.1to3.1.3)aswellasthedura-tionoftherespectivephases.
Table2:
Sows,energyrequirementsasusedintheinventory.Fordetailsseetext.
phase dura-tionind
numberofpigletspersowperbirth
energyrequire-ments***,revisedap-proachinMJanimal-1d-1
energyrequire-ments,formerapproach*inMJanimal-1d-1
gestationphase1 84* 33.3 25
phase2 30* 40.7 29
lactating 28** 8 79.5 56
9 86.3
10 93.1 67
11 99.9
12 106.7 77
13 113.5
weaningtocovering 27* 40.7 29
*basedonGfE(1987),seealsoDämmgenetal.(2007);
**inconnectionwithaweaningweightof8kgpiglet-1(expertjudgmentE.Schulz);
***basedonGfE(2006)
H.-D. Haenel, U. Dämmgen, P. Laubach, C. Rösemann / Landbauforschung - vTI Agriculture and Forestry Research 3 2011 (61)217-228 221
Table 2 also allows for a comparison with the valueshithertousedwhichwerebasedonGfE(1987)(seeDäm-mgenetal.,2007)andconsiderablyfallbelowthoseob-tainedwiththenewapproach.The cumulative energy requirements, i. e. the total of
energyrequiredduringonereproductioncycle,isprovidedinTable3.
Table3:
Sows,totalofenergyrequiredduringonereproductioncycle(ΣME sow)
numberofpiglets 8 9 10 11 12 13
ΣMEsow(inMJanimal-1round-1)
7166 7331 7496 7661 7826 7992
3.3 Animal weights
3.3.1 Estimation of mean sow weight
Ingeneral,theliveweightofasowisnotaconstantdur-ingthereproductioncycle.Theweightgainduringgesta-tioncompensatestheweightlossduringlactationintheprecedent reproduction cycle and comprises theweightgainoftheconceptionproductsandthemammaryglandaswellastheweightgainofthesowitself.Table4showstypicalweightchangedata(takenfromTable4.13inGfE,2006).Aweightof255kganimal-1isconsideredatypicalfinalliveweight(DLG,2008,pg.13).
Table4:
Sows,animalweights(wsow)andweightchanges(Δwsow)asafunctionofthenumberofgravidity(ngr).Allweightdatainkganimal
-1.(Source:GfE,2006,Table4.13.)
Δwsow duringlactation
ngr 1 2 3 4
0wsowatcovering 140 185 225 255
Δwsowduringgravidity 70 65 55 25
-10wsowatcovering 140 185 225 255
Δwsowduringgravidity 80 75 65 35
-20wsowatcovering 185 225 255
Δwsowduringgravidity 85 75 45
However, theseweight changes cannot be accountedforintheinventoryasthetimespantakenbyonerepro-ductioncycleisshorterthantheinventorytimestepwhichisoneyear.Henceenergyconsiderationsfortheinventoryhavetobebasedonameansowweight.SimplyaveragingtheweightsatcoveringaslistedinTable4yields2.1∙102kganimal-1.Howeverasthisestimatemaybebiasedbyarelativeunder-representationoffullygrown-upsows,theinventoryassumesameansowweightof2.2∙102kgani-
mal-1,whichisthearithmeticmeanoftheweightsatcov-eringforthesecondandthefourthgestation. It ignoresthelowestweightinordertoroughlycompensatefortheunder-representedhighestweight.
3.3.2 Mean piglet weights at birth and weaning
Forpiglets,theinventoryisbasedonabirthweightof1.5kgpiglet-1.Thiscanbederivedfromfeedingrecom-mendations in DLG (2008), Table 4.1, where the pigletweightafterthefirstweekwithadailyweightgainof0.2kgpiglet-1d-1reaches2.9kgpiglet-1.According to expert judgment (E. Schulz) the typical
weaningweightisassumedtobe8kgpiglet-1inconnec-tionwithalactationphasedurationof28days(seeTable2).
4 Weaners
Forweaners, themetabolicenergy requirementscom-prisetherequirementsforbothmaintenanceandgrowth.TheyarecalculatedaccordingtotherecommendationsinGfE(2006).
finfin k
1jj we,g,day
k
1jj we,m,daywe MEMEME (7)
whereΣME we totalmetabolizableenergyrequired(MJanimal-1 round-1)j indexofdaykfin numberofthefinaldayoftheweaners’lifespanτday unittimeperiod(τday=1dround
-1)MEm, we, j metabolizableenergyrequiredformainte- nancefordayj(inMJanimal-1d-1)MEg, we, j metabolizableenergyrequiredforgrowthfor dayj(inMJanimal-1d-1)
4.1 Daily energy requirements
Dailyenergyrequirementsformaintenancewithwean-ersaredefinedasfollows(cf.discussionChapter3.1.2).
.0
unit
jwe,unitwem, ME,jwe,m, w
wwME (8)
whereMEm, we, j metabolizableenergyrequiredformaintenance fordayj(inMJanimal-1d-1)j indexofdayηME, m, we specificmetabolizableenergyrequiredfor maintenance(ηME, m, we=1.25∙0.44MJkg
-1d-1, GfE,2006,pg.23)wwe, j meanweanerliveweightondayj(inkganimal-1)wunit unitweight(wunit=1kganimal
-1)
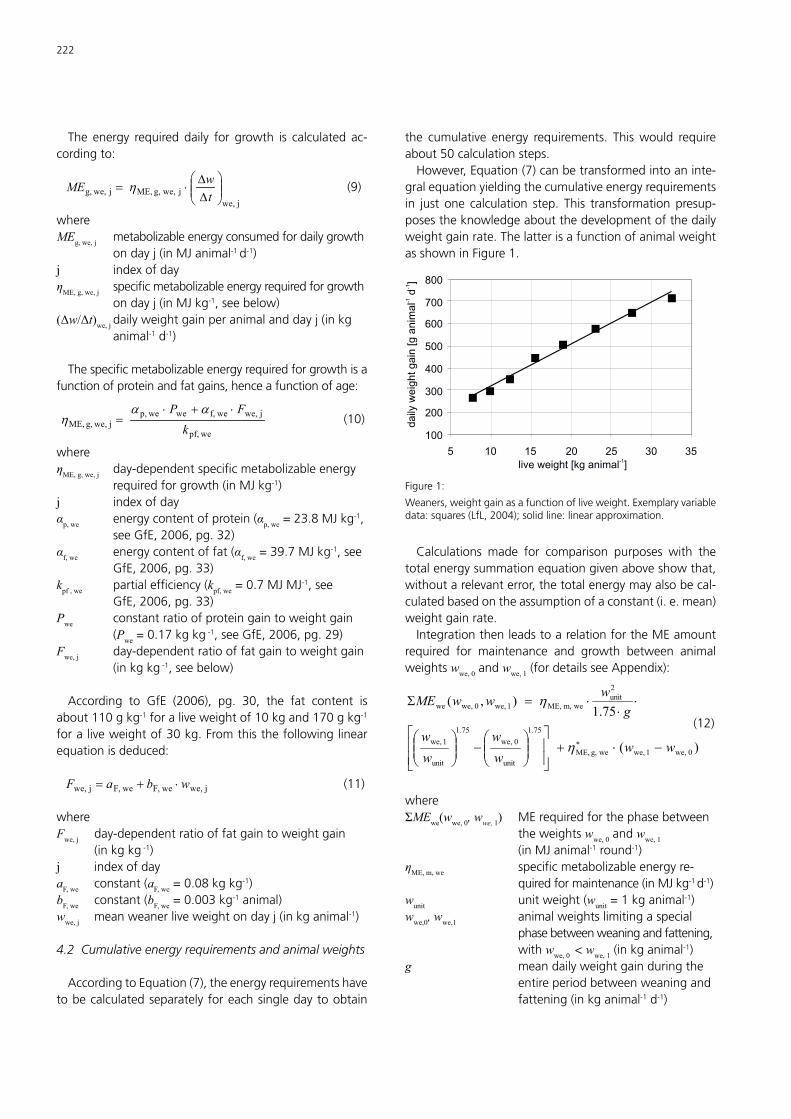
222
The energy requireddaily for growth is calculated ac-cordingto:
j we,jwe,g, ME,j we,g, t
wME (9)
whereMEg, we, j metabolizableenergyconsumedfordailygrowth ondayj(inMJanimal-1d-1)j indexofdayηME, g, we, j specificmetabolizableenergyrequiredforgrowth ondayj(inMJkg-1,seebelow)(Δw/Δt)we, jdailyweightgainperanimalanddayj(inkg animal-1d-1)
Thespecificmetabolizableenergyrequiredforgrowthisafunctionofproteinandfatgains,henceafunctionofage:
wepf,
jwe,wef,we wep,j we,g, ME, k
FP (10)
whereηME, g, we, j day-dependentspecificmetabolizableenergy requiredforgrowth(inMJkg-1)j indexofdayα energycontentofprotein(α =23.8MJkg-1p, we p, we , seeGfE,2006,pg.32)αf, we energycontentoffat(αf, we=39.7MJkg
-1,see GfE,2006,pg.33)kpf , we partialefficiency(kpf, we=0.7MJMJ
-1,see GfE,2006,pg.33)Pwe constantratioofproteingaintoweightgain (Pwe=0.17kgkg
-1,seeGfE,2006,pg.29)Fwe, j day-dependentratiooffatgaintoweightgain (inkgkg-1,seebelow)
According to GfE (2006), pg. 30, the fat content isabout110gkg-1foraliveweightof10kgand170gkg-1foraliveweightof30kg.Fromthisthefollowinglinearequationisdeduced:
j we,weF,weF,jwe, wbaF (11)
whereFwe, j day-dependentratiooffatgaintoweightgain (inkgkg-1)j indexofdayaF, we constant(aF, we=0.08kgkg
-1)b -1
F, we constant(bF, we=0.003kg animal)wwe, j meanweanerliveweightondayj(inkganimal
-1)
4.2 Cumulative energy requirements and animal weights
AccordingtoEquation(7),theenergyrequirementshavetobecalculatedseparatelyforeachsingledaytoobtain
(12)
the cumulative energy requirements. Thiswould requireabout50calculationsteps.However,Equation(7)canbetransformedintoaninte-
gralequationyieldingthecumulativeenergyrequirementsin just one calculation step. This transformationpresup-posestheknowledgeaboutthedevelopmentofthedailyweightgainrate.ThelatterisafunctionofanimalweightasshowninFigure1.
100
200
300
400
500
600
700
800
5 10 15 20 25 30 35
live weight [kg animal ]-1
daily w
eig
ht gain
[g a
nim
al
d]
-1-1
Figure1:
Weaners,weightgainasafunctionofliveweight.Exemplaryvariabledata:squares(LfL,2004);solidline:linearapproximation.
Calculations made for comparison purposes with thetotalenergysummationequationgivenaboveshowthat,withoutarelevanterror,thetotalenergymayalsobecal-culatedbasedontheassumptionofaconstant(i.e.mean)weightgainrate.IntegrationthenleadstoarelationfortheMEamount
required for maintenance and growth between animalweightswwe, 0andwwe, 1(fordetailsseeAppendix):
)(
1.),(
0we,1we,weg, ME,
.1
unit
0we,.1
unit
1we,
2unit
wem,ME,1we,0we,we
wwww
ww
gwwwME
whereΣMEwe(wwe, 0, wwe, 1) MErequiredforthephasebetween theweightswwe, 0and wwe, 1 (inMJanimal-1round-1)ηME, m, we specificmetabolizableenergyre- quiredformaintenance(inMJkg-1d-1)wunit unitweight(wunit=1kganimal
-1)wwe,0, wwe,1 animalweightslimitingaspecial phasebetweenweaningandfattening, withw -1
we, 0 < wwe, 1(inkganimal )g meandailyweightgainduringthe entireperiodbetweenweaningand fattening(inkganimal-1d-1)
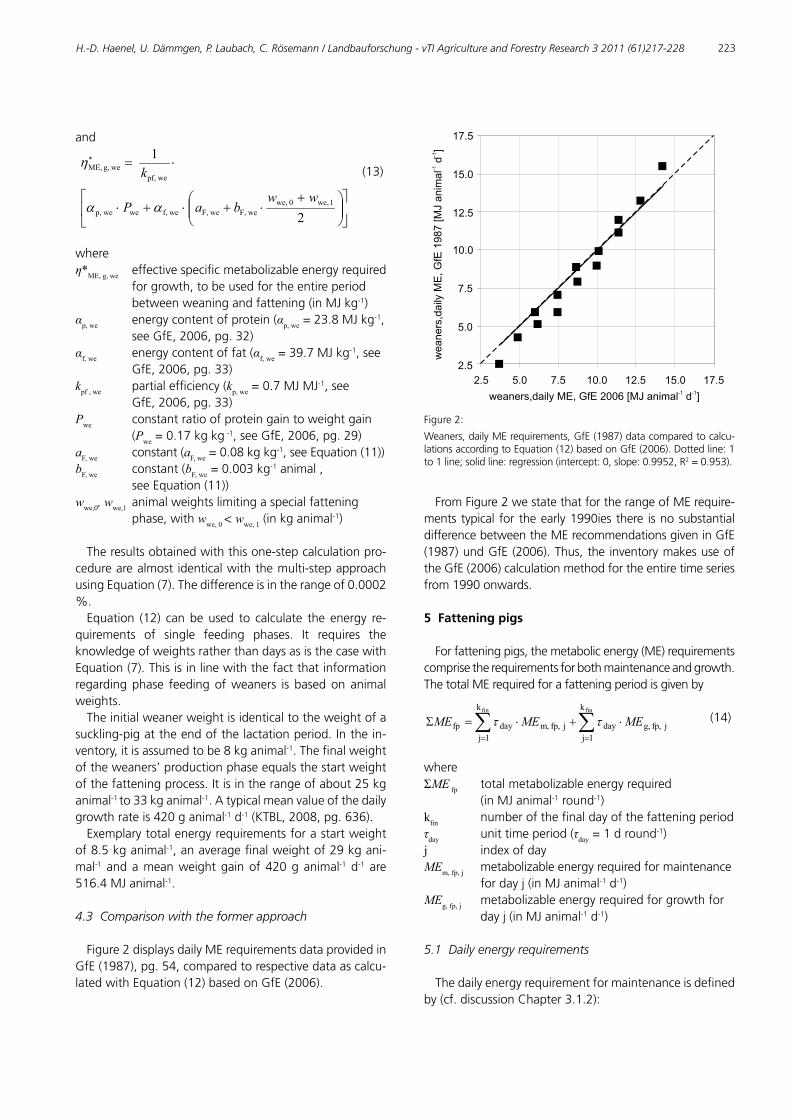
H.-D. Haenel, U. Dämmgen, P. Laubach, C. Rösemann / Landbauforschung - vTI Agriculture and Forestry Research 3 2011 (61)217-228 223
(13)
and
2
1
1we,0we,weF,weF,wef,wewep,
wepf, weg, ME,
wwbaP
k
whereη*ME, g, we effectivespecificmetabolizableenergyrequired forgrowth,tobeusedfortheentireperiod betweenweaningandfattening(inMJkg-1)αp, we energycontentofprotein(αp, we=23.8MJkg
-1, seeGfE,2006,pg.32)αf, we energycontentoffat(αf, we=39.7MJkg
-1,see GfE,2006,pg.33)kpf , we partialefficiency(kp, we=0.7MJMJ
-1,see GfE,2006,pg.33)Pwe constantratioofproteingaintoweightgain (Pwe=0.17kgkg
-1,seeGfE,2006,pg.29)aF, we constant(a -
F, we=0.08kgkg1,seeEquation(11))
bF, we constant(bF, we=0.003kg-1animal,
seeEquation(11))wwe,0, wwe,1 animalweightslimitingaspecialfattening phase,withwwe, 0< wwe, 1(inkganimal
-1)
Theresultsobtainedwiththisone-stepcalculationpro-cedurearealmostidenticalwiththemulti-stepapproachusingEquation(7).Thedifferenceisintherangeof0.0002%.Equation (12) canbeused to calculate theenergy re-
quirements of single feeding phases. It requires theknowledgeofweightsratherthandaysasisthecasewithEquation(7).Thisisinlinewiththefactthatinformationregardingphase feedingofweaners is basedon animalweights.Theinitialweanerweightisidenticaltotheweightofa
suckling-pigattheendofthelactationperiod.Inthein-ventory,itisassumedtobe8kganimal-1.Thefinalweightoftheweaners’productionphaseequalsthestartweightofthefatteningprocess.Itisintherangeofabout25kganimal-1to33kganimal-1.Atypicalmeanvalueofthedailygrowthrateis420ganimal-1d-1(KTBL,2008,pg.636).Exemplarytotalenergyrequirementsforastartweight
of8.5kganimal-1,anaveragefinalweightof29kgani-mal-1 andameanweightgainof420ganimal-1d-1 are516.4MJanimal-1.
4.3 Comparison with the former approach
Figure2displaysdailyMErequirementsdataprovidedinGfE(1987),pg.54,comparedtorespectivedataascalcu-latedwithEquation(12)basedonGfE(2006).
2.5
5.0
7.5
10.0
12.5
15.0
17.5
2.5 5.0 7.5 10.0 12.5 15.0 17.5
weaners
,daily M
E, G
fE 1
987 [M
J a
nim
al
d]
-1-1
weaners,daily ME, GfE 2006 [MJ animal d ]-1 -1
Figure2:
Weaners,dailyMErequirements,GfE(1987)datacomparedtocalcu-lationsaccordingtoEquation(12)basedonGfE(2006).Dottedline:1to1line;solidline:regression(intercept:0,slope:0.9952,R2=0.953).
FromFigure2westatethatfortherangeofMErequire-mentstypical fortheearly1990iesthere isnosubstantialdifferencebetweentheMErecommendationsgiveninGfE(1987)undGfE(2006).Thus,the inventorymakesuseoftheGfE(2006)calculationmethodfortheentiretimeseriesfrom1990onwards.
5 Fattening pigs
Forfatteningpigs,themetabolicenergy(ME)requirementscomprisetherequirementsforbothmaintenanceandgrowth.ThetotalMErequiredforafatteningperiodisgivenby
finfin k
1jjfp, g,day
k
1jjfp, m,dayfp MEMEME (14)
whereΣME fp totalmetabolizableenergyrequired (inMJanimal-1round-1)kfin numberofthefinaldayofthefatteningperiodτday unittimeperiod(τday=1dround
-1)j indexofdayMEm, fp, j metabolizableenergyrequiredformaintenance fordayj(inMJanimal-1d-1)MEg, fp, j metabolizableenergyrequiredforgrowthfor dayj(inMJanimal-1d-1)
5.1 Daily energy requirements
Thedailyenergyrequirementformaintenanceisdefinedby(cf.discussionChapter3.1.2):
224
.0
unit
jfp,unitfp m, ME,jfp, m, w
wwME (15)
whereMEm, fp, j metabolizableenergyrequiredformaintenance fordayj(inMJanimal-1d-1)ηME, m, fp specificmetabolizableenergyrequiredformainte- nance(inMJkg-1d-1,seebelow)wfp, j liveweightondayj(inkganimal-1)wunit unitweight(wunit=1kganimal
-1)
AccordingtoGfE(2006),pg.23,thespecificenergyformaintenancecanbedescribedby
BA
Bjfp,mmnfp, m, ME,fpm, ME, ww
wwba (16)
whereηME, m, fp specificmetabolizableenergyrequiredformainte- nance(inMJkg-1d-1)ηME, m, fp, n referencevalueofspecificmetabolizableenergy formaintenance(η -1
ME, m, fp, n=0.44MJkgd-1,
GfE,2006,pg.23)am constant(am=1.25MJMJ
-1)b constant(b =0.25MJMJ-1m m )wfp, j liveweightondayj(inkganimal-1)wA, wB thresholdsanimalweights(inkganimal-1,see below)
GfE(2006)usesw =30kganimal-1A andwB=100kgani-mal-1.GfE(2006)appliesEquation(16)alsotoanimalweightsfallingbelowwAandexceedingwB.Then,incaseofanimalweightssmallerthanwA,theterminbracketsissetequaltoam,whileforweightslargerthanwBitequalsam – bm.Theenergyrequiredforgrowthiscalculatedaccordingto:
jfp,jfp,g, ME,jfp, g, t
wME (17)
whereMEg, fp, j metabolizableenergyrequiredfordailygrowth ondayj(inMJanimal-1d-1)j indexofdayηME, g, fp, j specificmetabolizableenergyrequiredfor growthondayj(inMJkg-1,seebelow)(Δw/Δt)fp, j dailyweightgainperanimalanddayj(inkg animal-1d-1)
Thespecificenergyrequirementsforgrowth,ηME, g, fp, j,isafunctionofproteinandfatgains,whichmeans,itisalsoafunctionoflifetime:
j
f
fj
p
pj fp, g, ME, F
kP
k (18)
whereηME, g, fp, j specificmetabolizableenergyrequiredfor growthondayj(inMJkg-1)j indexofdayαp energycontentofprotein(αp=23.8MJkg
-1, seeGfE,2006,pg.32)αf energycontentoffat(αf=39.7MJkg
-1,see GfE,2006,pg.33)kp partialefficiency(kp=0.56MJMJ
-1,seeGfE, 2006,pg.33)kf partialefficiency(k -1
f=0.74MJMJ ,seeGfE, 2006,pg.33)Pj day-dependentratioofproteingaintoweight gain(inkgkg-1,seebelow)Fj day-dependentratiooffatgaintoweightgain (inkgkg-1,seebelow)
TherelativeproteingainP isobtainedfromtheEqua-tion(8)inGfE(2006)differentiatedwithrespecttoanimalweight.
j fp,PPj wbaP (19)
wherePj day-dependentratioofproteingaintoweight gain(inkgkg-1,seebelow)j indexofdayaP constant(aP=0.168kgkg
-1)b -1
P constant(bP=0.0001828kg animal)wfp, j liveweightondayj(inkganimal-1)
DifferentiationofEquation(9)inGfE(2006)withrespecttoanimalweightyieldstherelativefatgainF.Acorrectionfactorof0.94kgkg-1hastobetakenintoaccount(GfE,2006,pp.28and31).
)( j fp,FFFj wcbaF (20)
whereFj day-dependentratiooffatgaintoweightgain (inkgkg-1)j indexofdayaF constant(a -1
F=0.94kgkg )bF constant(bF=0.1162kgkg
-1)cF constant(cF=0.002778kg
-1animal)wfp, j liveweightondayj(inkganimal-1)
5.2 Cumulative energy requirements and animal weights
By analogy to the procedure used for weaners (seeChapter4.2)thesummationformula(14)istransformedintoanequation thatallows tocalculate thecumulativemetabolizableenergybyonesinglecalculationsteprather
H.-D. Haenel, U. Dämmgen, P. Laubach, C. Rösemann / Landbauforschung - vTI Agriculture and Forestry Research 3 2011 (61)217-228 225
than summing up daily energy requirementswithmorethanahundredsinglesteps(fordetailsofthetransforma-tionprocessseeAppendix).Inordertoaccountforthefactthatthespecificmetab-
olizableenergyηME, m isdefined separately for theanimalweightintervals“fallingbelow30kganimal-1“,“30to100kganimal-1“and“exceeding100kganimal-1“,thetransfor-mationhastobeperformedseparatelyfortheseintervals.
As for weaners, the transformation is performed un-dertheassumptionofaconstant(i.e.mean)weightgainrate (cf. also Dämmgen et al., 2009, pg. 178). Integra-tionthenleadstoanequationfortheamountofMEre-quired for the growth between animal weightsw0 andw1,wherew0andw1representwfp, 0andwfp, 1,respectively:
(21)
(22)
)(),,(),,,(),,(),( 01g ME,
B103BA102A101nm,ME,10fp ww
gwwwwwwwwwwwwME
whereMEfp(w0, w1) MErequiredforthefatteningphasebetweentheweightsw -1
0and w1(inMJanimal ME)ηME, m, n referencevalueofspecificmetabolizableenergyformaintenance(ηME, m, n=0.44MJkg
-1d-1,GfE,2006,pg.23)w0, w1 animalweightslimitingaspecialfatteningphase,withw0< w1(inkganimal
-1ME)wA, wB thresholdsofanimalweight(inkganimal-1,seeChapter5.1)g meandailyweightgainduringtheentirefatteningperiod(inkganimal-1d-1)
and
.1
unit
A0.1
unit
A12unitm
1),min(,min(
1. www
wwwwa
.2
unit
A0B.2
unit
B1A
AB
3unitm
.1
unit
A0B.1
unit
B1A
AB
Amm
2unit
2
)),max(,min()),min(,max(
)(2.
)),max(,min()),min((,max(1.
wwww
wwww
wwwb
wwww
wwww
ww
wba
w
.1
unit
B0.1
unit
B12unit
3),max(),max(
1. www
wwww
22
10FFF
f
f10PP
p
pg ME,
wwcbak
wwbak
whereφ φ φ functionsofw , w w ,andw (inkg2animal-21, 2, 3 0 1, A B )w0, w1 animalweightslimitingaspecialfatteningphase,withw0< w1(inkganimal
-1)wA, wB animalweightthresholds(inkganimal-1,seeChapter5.1)wunit unitweight(wunit=1kganimal
-1)am constant(am=1.25MJMJ
-1,GfE,2006,pg.23)bm constant(bm=0.25MJMJ
-1,GfE,2006,pg.23)η*ME, g meanspecificmetabolizableenergyrequiredforgrowth,seeabove(inMJkg-1)αp coefficient(αp =23.8MJkg
-1,seeGfE,2006,pg.32)kp coefficient(kp=0.56MJMJ
-1,seeGfE,2006,pg.33)aP constant(aP=0.168kgkg
-1,seeabove)
(23)
(24)
(25)
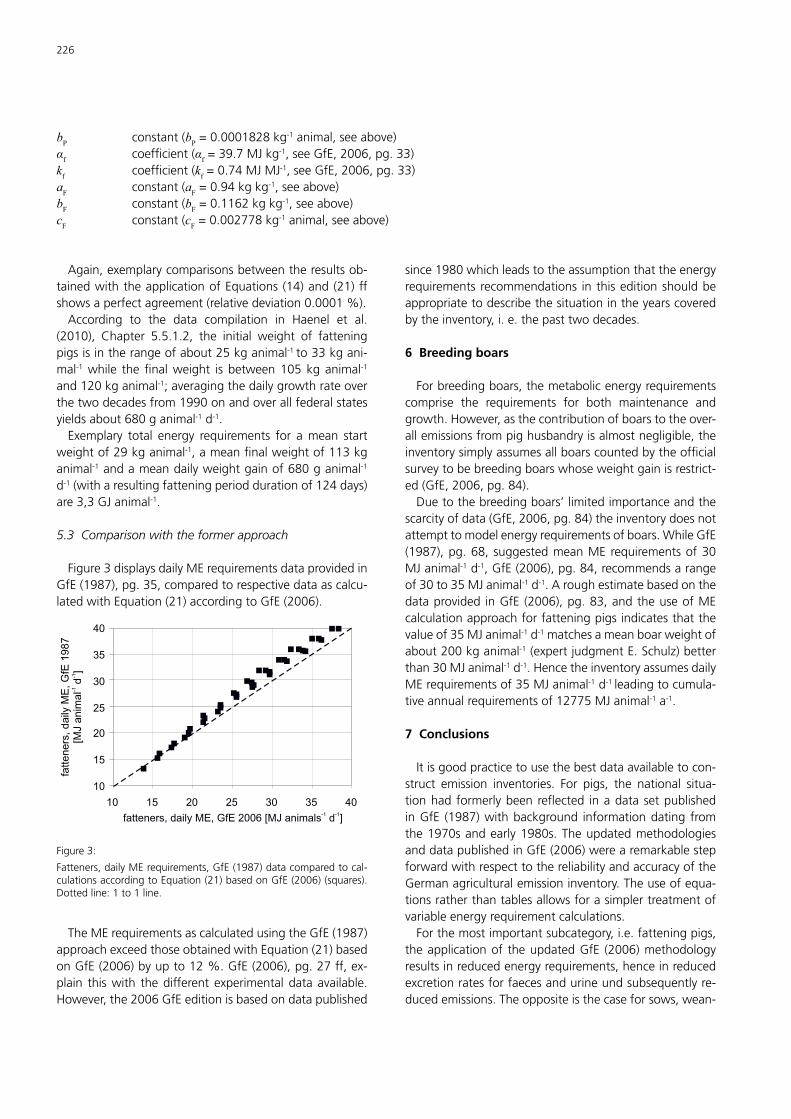
226
bP constant(bP=0.0001828kg-1animal,seeabove)
αf coefficient(αf=39.7MJkg-1,seeGfE,2006,pg.33)
kf coefficient(kf=0.74MJMJ-1,seeGfE,2006,pg.33)
aF constant(aF=0.94kgkg-1,seeabove)
bF constant(bF=0.1162kgkg-1,seeabove)
cF constant(cF=0.002778kg-1animal,seeabove)
Again,exemplarycomparisonsbetweentheresultsob-tainedwiththeapplicationofEquations(14)and(21)ffshowsaperfectagreement(relativedeviation0.0001%).According to the data compilation in Haenel et al.
(2010), Chapter 5.5.1.2, the initial weight of fatteningpigsisintherangeofabout25kganimal-1to33kgani-mal-1while thefinalweight is between105kganimal-1
and120kganimal-1;averagingthedailygrowthrateoverthetwodecadesfrom1990onandoverallfederalstatesyieldsabout680ganimal-1d-1.Exemplary total energy requirements for amean start
weightof29kganimal-1,ameanfinalweightof113kganimal-1andameandailyweightgainof680ganimal-1d-1(witharesultingfatteningperioddurationof124days)are3,3GJanimal-1.
5.3 Comparison with the former approach
Figure3displaysdailyMErequirementsdataprovidedinGfE(1987),pg.35,comparedtorespectivedataascalcu-latedwithEquation(21)accordingtoGfE(2006).
10
15
20
25
30
35
40
10 15 20 25 30 35 40
fatteners, daily ME, GfE 2006 [MJ animals d ]-1 -1
fatteners
, daily M
E, G
fE 1
987
[MJ a
nim
al
d]
-1-1
Figure3:
Fatteners,dailyMErequirements,GfE(1987)datacomparedtocal-culationsaccordingtoEquation(21)basedonGfE(2006)(squares).Dottedline:1to1line.
TheMErequirementsascalculatedusingtheGfE(1987)approachexceedthoseobtainedwithEquation(21)basedonGfE(2006)byupto12%.GfE(2006),pg.27ff,ex-plain thiswith thedifferentexperimentaldataavailable.However,the2006GfEeditionisbasedondatapublished
since1980whichleadstotheassumptionthattheenergyrequirementsrecommendations inthiseditionshouldbeappropriatetodescribethesituationintheyearscoveredbytheinventory,i.e.thepasttwodecades.
6 Breeding boars
Forbreedingboars,themetabolicenergyrequirementscomprise the requirements for both maintenance andgrowth.However,asthecontributionofboarstotheover-allemissionsfrompighusbandryisalmostnegligible,theinventorysimplyassumesallboarscountedbytheofficialsurveytobebreedingboarswhoseweightgainisrestrict-ed(GfE,2006,pg.84).Duetothebreedingboars’limitedimportanceandthe
scarcityofdata(GfE,2006,pg.84)theinventorydoesnotattempttomodelenergyrequirementsofboars.WhileGfE(1987),pg.68,suggestedmeanMErequirementsof30MJanimal-1d-1,GfE(2006),pg.84,recommendsarangeof30to35MJanimal-1d-1.Aroughestimatebasedonthedataprovided inGfE(2006),pg.83,andtheuseofMEcalculationapproachforfatteningpigsindicatesthatthevalueof35MJanimal-1d-1matchesameanboarweightofabout200kganimal-1(expertjudgmentE.Schulz)betterthan30MJanimal-1d-1.HencetheinventoryassumesdailyMErequirementsof35MJanimal-1d-1leadingtocumula-tiveannualrequirementsof12775MJanimal-1a-1.
7 Conclusions
Itisgoodpracticetousethebestdataavailabletocon-struct emission inventories. For pigs, the national situa-tionhadformerlybeenreflected inadatasetpublishedinGfE (1987)withbackground informationdating fromthe1970sandearly1980s.TheupdatedmethodologiesanddatapublishedinGfE(2006)werearemarkablestepforwardwithrespecttothereliabilityandaccuracyoftheGermanagriculturalemissioninventory.Theuseofequa-tionsratherthantablesallowsforasimplertreatmentofvariableenergyrequirementcalculations.Forthemostimportantsubcategory,i.e.fatteningpigs,
theapplicationof theupdatedGfE (2006)methodologyresultsinreducedenergyrequirements,henceinreducedexcretionratesforfaecesandurineundsubsequentlyre-ducedemissions.Theoppositeisthecaseforsows,wean-
H.-D. Haenel, U. Dämmgen, P. Laubach, C. Rösemann / Landbauforschung - vTI Agriculture and Forestry Research 3 2011 (61)217-228 227
ers andboars, but this is outweighedby the reductionsachievedforfatteningpigs.
Acknowledgement
The authors express their thanks to Dr Edgar Schulz,co-authorofGfE(2006)forhisdetailedandconstructivereview.
Appendix: Derivation of a closed mathematical descrip-tion of the cumulative ME requirements of weaners
Cumulative energy requirements can be calculated byaddingupdailyrequirementsoverthetimespanconsidered:
fink
1jjwe,daywe MEME (A1)
whereΣMEwe totalmetabolizableenergyrequiredbetween weaningandfattening(inMJanimal-1round-1ME)τday unittimeperiod(τday=1dround
-1)j indexofdaykfin numberofthefinaldayoftheweaners’lifespanMEwe, j metabolizableenergyrequiredformaintenance andgrowthondayj(inMJanimal-1d-1ME)
In the German agricultural inventory, equations hadbeenderivedusingdata inGfE (1987) that expressed asumlikeEquation(A1)inasingleequationusingafittedpower series (Dämmgenet al., 2007). The latterhad tobe replacedwith theuseofnewdataaccording toGfE(2006). Itwas decided to base the derivation of a newsingleequationonmathematicalintegrationinsteadoffit-tingpowerseries.Asapreparation for themathematical solution,Equa-
tion(A1)hastoberewrittenasdifferencequotient:
)()(
jwe,jwe,jwe wMEMEME
(A2)
whereΔ(ΣMEwe) incrementoftotalmetabolizableenergyrequired betweenweaningandfattening(inMJanimal-1 round-1ME)Δτ timeincrement(Δτ = τday =1dround
-1)j indexofdayMEwe, j metabolizableenergyrequiredformaintenance andgrowthondayj(inMJanimal-1d-1ME)wwe, j meanweanerliveweightondayj(inkganimal-1)
Itisplausiblethatthisprocedureisvalidnotonlyfordai-ly timestepsbutalso for infinitesimally small timesteps.Hencethedifferencequotientcanbetransformedinadif-
ferentialquotientforeachtimeτ’k.Here,τ’isacompart-mentalizedtimescale(insround-1)thatisconnectedtothetimescaleτ(indround-1)byatimeunitsconversionfactor.
)())((d
)(dkwe
1wek
fwMEME
(A3)
where(ΣMEwe) incrementoftotalmetabolizableenergyrequired betweenweaningandfattening(inMJanimal-1 round-1ME)τ’ time(insround-1)τ’ -1
k specifictime(insround )γ timeunitsconversionfactor(γ=86400sd-1)wwe(τ’k) meanweanerliveweightattimeτ’k(inkg animal-1)
and
gewdcwaf web
we1 )()( (A4)
wheref(τ’) metabolizableenergyrequiredperanimal andsecond(inMJanimal-1s-1ME)γ timeunitsconversionfactor(γ =86400sd-1)a, b, c, d, e, g seetextbelowwwe = wwe(τ’) timedependentmeanweanerliveweight (inkganimal-1)
Theentitiesa, b, c, d, eandgoriginatefromthecompari-sonoftheequationsdescribingtheenergyrequirementsformaintenanceandgrowth(Chapter4.1).Inparticular,g denotesaconstantgrowthrate.Integration of f(τ’) leads to the cumulative energy re-
quirements: 1
0wewe d))((wfME (A5)
whereΣMEwe totalmetabolizableenergyrequiredbetween weaningandfattening(inMJanimal-1round-1ME)τ’ time(insround-1)f(wwe(τ’)) metabolizableenergyrequiredperanimaland second(inMJanimal-1s-1ME)wwe(τ’) timedependentmeanweanerliveweight(in kganimal-1)
and
dayfin1 k (A6)
whereτ’1 timeoftheendoftheweaners’lifespan(in sround-1)
228
γ timeunitsconversionfactor(γ =86400sd-1)kfin numberofthefinaldayoftheweaners’lifespanτday unittimeperiod(τday=1dround
-1)
TheentitygcanbeusedinEquation(A5)tosubstitutetheindependentvariabletimebyweight 1we,
0we,
wewewe d)(w
w
wwfg
ME (A7)
whereΣMEwe totalmetabolizableenergyrequiredbetween weaningandfattening-period(inMJanimal-1 round-1ME)γ timeunitsconversionfactor(γ =86400sd-1)g animalweightgainperunittime(in kganimal-1d-1)f(wwe) metabolizableenergyrequiredperanimaland second(inMJanimal-1s-1ME)wwe meanweanerliveweight(inkganimal-1)wwe, 0 meanweanerliveweightatweaning(inkg animal-1)wwe, 1 meanweanerlivebeginattheendofthe fatteningperiod(inkganimal-1)
Executionoftheintegralandsubsequentre-substitutionoftheentitiesa, b, c, d, e and ginf(wwe)resultsinEquation(12)inChapter4.2.
References
DämmgenU,LüttichM,HaenelH-D,DöhlerH,Eurich-MendenB,OsterburgB(2007)CalculationsofemissionsfromGermanagriculture–NationalEmis-sionInventoryReport(NIR)2007for2005.MethodsandData(GAS-EM).Braunschweig:FAL,LandbauforschVölkenrodeSH304:9-243
DämmgenU,HaenelH-D,Rösemann,C,ConradJ,LüttchM,DöhlerH,Eurich-MendenB, LaubachP,Müller-LindenlaufM,OsterburgB (2009)Calcula-tionsofemissionsfromGermanagriculture–NationalEmissionInventoryReport(NIR)2009for2007.Braunschweig:vTI,LandbauforschSH324:9-385
DämmgenU,HaenelH-D,RösemannC,Eurich-MendenB,DöhlerH(2010a)Derivation of TAN related ammonia emission factors in pig production.Landbauforsch60(4):241-248
DämmgenU,Hahne J,HaenelH-D, RösemannC (2010b)DieModellierungderEmissionenvonStickstoffspezies,NMVOCundStaubausAbluftreini-gungsanlagen inderSchweinehaltung imdeutschen landwirtschaftlichenEmissionsinventar.GefahrstoffeReinhaltungderLuft70(10):437-442
DämmgenU,BradeW,SchulzJ,HaenelH-D,RösemannC(2011)EinflussvonFütterungsverfahrenaufdie EmissionenausderMastschweinehaltung inNiedersachsen.Züchtungskunde83(3):191-202
DLG–DeutscheLandwirtschafts-Gesellschaft (2008)EmpfehlungenzurSau-en-undFerkelfütterung.FrankfurtaM:DLG-verl,56p,DLG-Information1/2008
EMEP/EEAairpollutantemissioninventoryguidebook—2009(2009)PartB.4.B.Animalhusbandryandmanuremanagement[online].Tobefoundat<http://www.eea.europa.eu/publications/emep-eea-emission-inventory-guidebook-2009/part-b-sectoral-guidance-chapters/4-agriculture/4-b>[quoted22.07.2011]
GfE –Gesellschaft für Ernährungsphysiologie, Ausschuss für Bedarfsnormen(1987)EmpfehlungenzurEnergie-undNährstoffversorgungderSchweine.Energie-undNährstoffbedarflandwirtschaftlicherNutztiere4.FrankfurtaM:DLG-Verl,153p
GfE –Gesellschaft für Ernährungsphysiologie, Ausschuss für Bedarfsnormen(2006)EmpfehlungenzurEnergie-undNährstoffversorgungvonSchwei-nen2006.Energie-undNährstoffbedarflandwirtschaftlicherNutztiere10.FrankfurtaM:DLG-Verl,247p
HaenelH-D,RösemannC,DämmgenU,DöhlerH,Eurich-MendenB,LaubachP,Müller-LindenlaufM,OsterburgB(2010)CalculationsofemissionsfromGerman agriculture –National Emission Inventory Report (NIR) 2010 for2008.Methods andData (GAS-EM). Braunschweig : vTI, LandbauforschSH334:13-428
HaenelH-D,DämmgenU,RösemannC(2011)Estimatingnumbersofpiglets,weanersandfatteningpigsfortheGermanagriculturalemissioninventory.Landbauforsch61(3):229-236
IPCC–IntergovernmentalPanelonClimateChange(2006)2006IPCCguide-linesfornationalgreenhousegasinventories:Vol4:Agriculture,forestryandother landuse[online].Tobefoundat<http://www.ipcc-nggip.iges.or.jp/public/2006gl/vol4.htm>[quoted21.07.2011]
KTBL–KuratoriumfürTechnikundBauweseninderLandwirtschaft(2008)Be-triebsplanungLandwirtschaft2008/09.Münster:Landwirtschaftsverl,752p,KTBL-Datensammlung
LfL–BayerischeLandesanstaltfürLandwirtschaft(2004)FutterberechnungenfürSchweine[online].Tobefoundat<http://www.lfl.bayern.de/publikatio-nen/daten/informationen_url_1_27.pdf>[quoted21.07.2011]
H.-D. Haenel, U. Dämmgen, C. Rösemann / Landbauforschung - vTI Agriculture and Forestry Research 3 2011 (61)229-236 229
Estimating numbers of piglets, weaners and fattening pigs for the German agricultural emission inventory
Hans-DieterHaenel*, UlrichDämmgen*,andClausRösemann*
* JohannHeinrichvonThünenInstitute(vTI),InstituteforAgriculturalClimateResearch,Bundesallee50,38116Braunschweig,Germany
Abstract
Theestablishmentofemissioninventoriespresupposesanimal populations that are homogeneous with respecttofeedingandmanagement.Forweanersandfatteningpigs, the official surveys for pigs do notmeet these re-quirements.Hence, the official animal numbers have tobe redistributed to serve thispurpose. In thispaper, thealgorithmstoderivetheanimalcategoriesoftheemissioninventory(weaners,fatteningpigs)fromsurveydata(pig-letsbelow20kg,youngpigslighterthan50kg,fatteningpigs50to80kg,fatteningpigs80to110kg,fatteningpigsheavierthan110kg)aredefined.Also,thecalcula-tionofthemeanpopulationofsuckling-pigsneededfortheredistributionofofficialanimalnumbersisdescribed.The updated animal populations result in decreased
overallemissionsfrompighusbandryintheGermanemis-sioninventory.
Keywords: pigs, emission inventory
Zusammenfassung
Ableitung der Tierzahlen von Saugferkeln, Aufzucht-ferkeln und Mastschweinen für das deutsche Emissi-onsinventar
Die Erstellung von Emissionsinventaren setzt Tierpo-pulationen voraus, die hinsichtlich Fütterung und Hal-tunghomogensind.DieseEigenschaftweisendieindenamtlichen Tierzählungen verwendeten Schweinekatego-rien für Aufzuchtferkel undMastschweine nicht auf, sodassdie erhobenenTierzahlen fürdie Inventarerstellungerst nach einer Umverteilung zwischen den Kategorienverwendbar sind. DieAlgorithmen zurUmrechnung derSchweinekategorienderTierzählung(Ferkelunter20kg,Jungschweinebisunter50kg,Mastschweine50bis80kg,Mastschweine80bis110kg,Mastschweine110kgundmehr) in Kategorien des Emissionsinventars (Aufzucht-ferkel,Mastschweine)werden abgeleitet.Die zu diesemZweckerforderlicheBerechnungdermittlerenSaugferkel-populationwirdebenfallsbeschrieben.DieNeuberechnungderPopulationenderimdeutschen
EmissionsinventarverwendetenSchweinekategorienführtzuverringertenEmissionenausderSchweinehaltungins-gesamt.
Schlüsselwörter: Schweine, Emissionsinventar
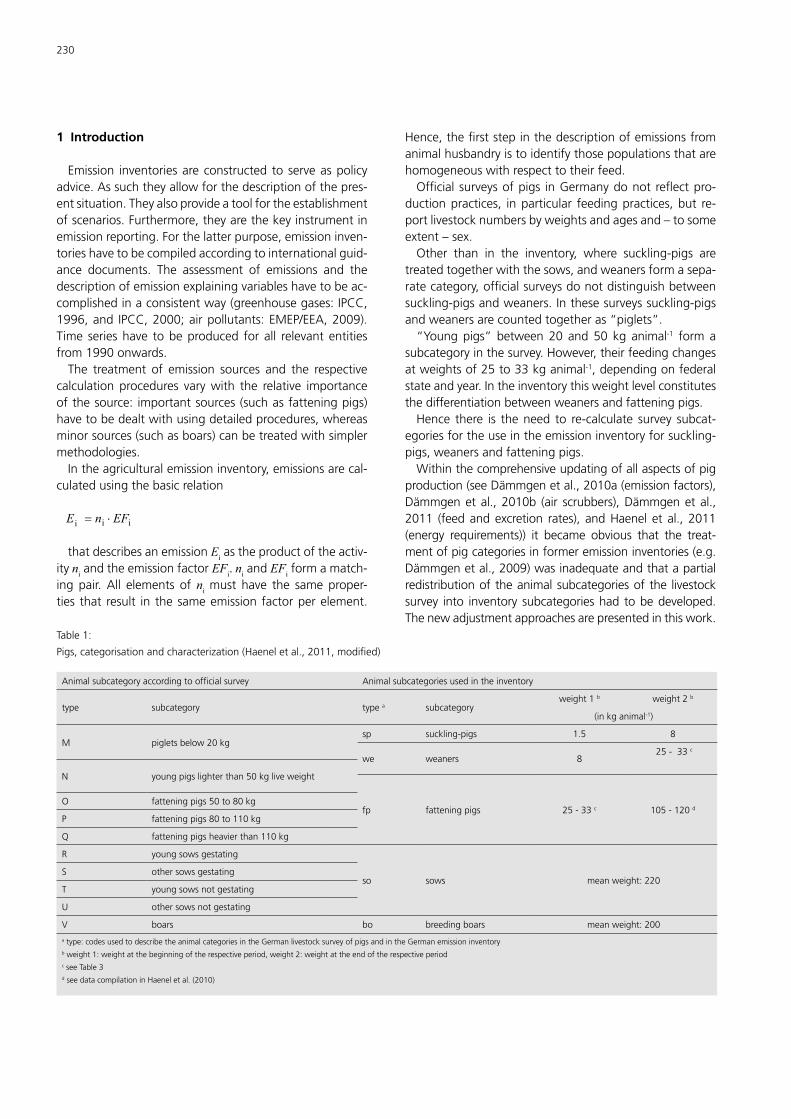
230
1 Introduction
Emission inventoriesareconstructed to serveaspolicyadvice.Assuchtheyallowforthedescriptionofthepres-entsituation.Theyalsoprovideatoolfortheestablishmentofscenarios.Furthermore,theyarethekeyinstrumentinemissionreporting.Forthelatterpurpose,emissioninven-torieshavetobecompiledaccordingtointernationalguid-ance documents. The assessment of emissions and thedescriptionofemissionexplainingvariableshavetobeac-complishedinaconsistentway(greenhousegases:IPCC,1996,and IPCC,2000;airpollutants:EMEP/EEA,2009).Time serieshave tobeproduced forall relevantentitiesfrom1990onwards.The treatment of emission sources and the respective
calculationprocedures varywith the relative importanceofthesource: importantsources(suchasfatteningpigs)havetobedealtwithusingdetailedprocedures,whereasminorsources(suchasboars)canbetreatedwithsimplermethodologies.Intheagriculturalemissioninventory,emissionsarecal-
culatedusingthebasicrelation
iii EFnE
thatdescribesanemissionEiastheproductoftheactiv-ity niandtheemissionfactorEFi. niandEFiformamatch-ing pair.All elements ofni must have the sameproper-ties that result in thesameemissionfactorperelement.
Hence,thefirststepinthedescriptionofemissionsfromanimalhusbandryistoidentifythosepopulationsthatarehomogeneouswithrespecttotheirfeed.Officialsurveysofpigs inGermanydonot reflectpro-
ductionpractices, inparticular feedingpractices,but re-portlivestocknumbersbyweightsandagesand–tosomeextent–sex.Other than in the inventory, where suckling-pigs are
treatedtogetherwiththesows,andweanersformasepa-ratecategory,officialsurveysdonotdistinguishbetweensuckling-pigsandweaners.Inthesesurveyssuckling-pigsandweanersarecountedtogetheras“piglets”.“Young pigs” between 20 and 50 kg animal-1 form a
subcategoryinthesurvey.However,theirfeedingchangesatweightsof25to33kganimal-1,dependingonfederalstateandyear.Intheinventorythisweightlevelconstitutesthedifferentiationbetweenweanersandfatteningpigs.Hence there is theneed to re-calculate survey subcat-
egoriesfortheuseintheemissioninventoryforsuckling-pigs,weanersandfatteningpigs.Withinthecomprehensiveupdatingofallaspectsofpig
production(seeDämmgenetal.,2010a(emissionfactors),Dämmgenet al., 2010b (air scrubbers),Dämmgenet al.,2011 (feedandexcretion rates), andHaenel et al., 2011(energy requirements)) it became obvious that the treat-mentofpigcategoriesinformeremissioninventories(e.g.Dämmgenetal.,2009)wasinadequateandthatapartialredistributionoftheanimalsubcategoriesofthe livestocksurvey into inventory subcategorieshad tobedeveloped.Thenewadjustmentapproachesarepresentedinthiswork.
Table1:
Pigs,categorisationandcharacterization(Haeneletal.,2011,modified)
Animalsubcategoryaccordingtoofficialsurvey Animalsubcategoriesusedintheinventory
type subcategory typea subcategoryweight1b weight2b
(inkganimal-1)
M pigletsbelow20kgsp suckling-pigs 1.5 8
we weaners 825-33c
N youngpigslighterthan50kgliveweight
fp fatteningpigs 25-33c 105-120dO fatteningpigs50to80kg
P fatteningpigs80to110kg
Q fatteningpigsheavierthan110kg
R youngsowsgestating
so sows meanweight:220S othersowsgestating
T youngsowsnotgestating
U othersowsnotgestating
V boars bo breedingboars meanweight:200
atype:codesusedtodescribetheanimalcategoriesintheGermanlivestocksurveyofpigsandintheGermanemissioninventorybweight1:weightatthebeginningoftherespectiveperiod,weight2:weightattheendoftherespectiveperiodcseeTable3dseedatacompilationinHaeneletal.(2010)
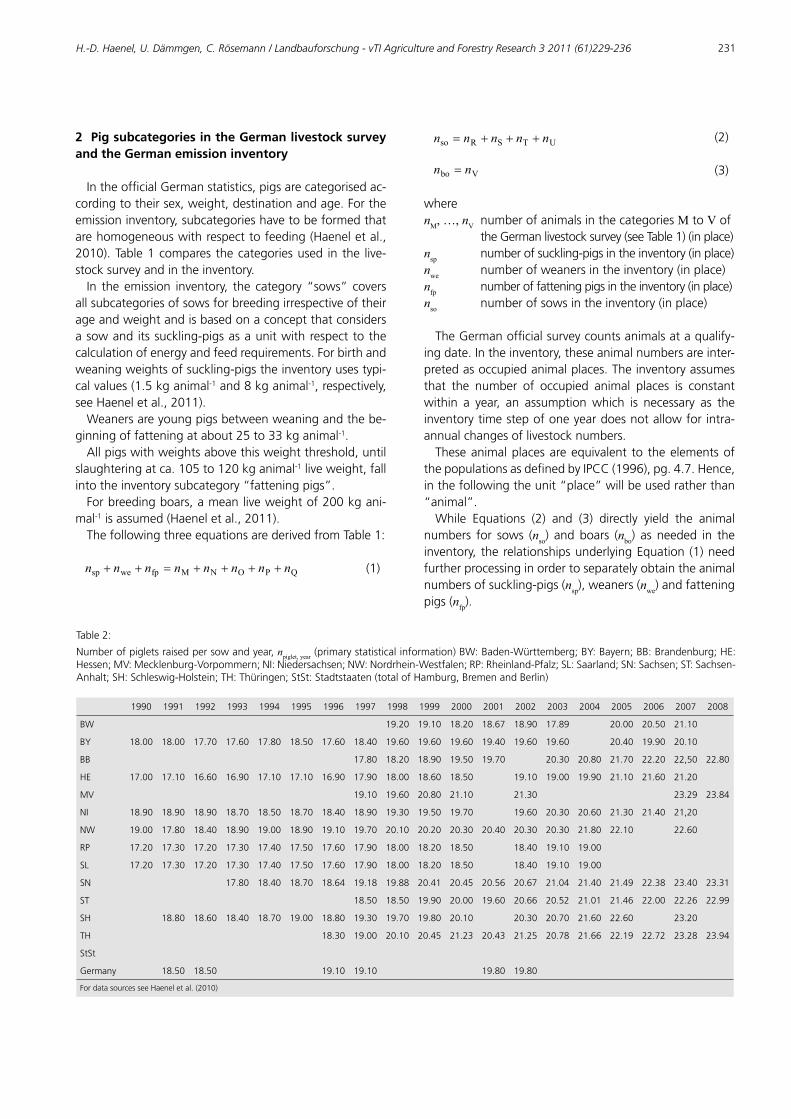
H.-D. Haenel, U. Dämmgen, C. Rösemann / Landbauforschung - vTI Agriculture and Forestry Research 3 2011 (61)229-236 231
2 Pig subcategories in the German livestock survey and the German emission inventory
IntheofficialGermanstatistics,pigsarecategorisedac-cordingtotheirsex,weight,destinationandage.Fortheemissioninventory,subcategorieshavetobeformedthatarehomogeneouswithrespecttofeeding(Haeneletal.,2010).Table1comparesthecategoriesused inthe live-stocksurveyandintheinventory.In theemission inventory, the category“sows”covers
allsubcategoriesofsowsforbreedingirrespectiveoftheirageandweightandisbasedonaconceptthatconsidersasowanditssuckling-pigsasaunitwithrespecttothecalculationofenergyandfeedrequirements.Forbirthandweaningweightsofsuckling-pigstheinventoryusestypi-calvalues(1.5kganimal-1and8kganimal-1,respectively,seeHaeneletal.,2011).Weanersareyoungpigsbetweenweaningandthebe-
ginningoffatteningatabout25to33kganimal-1.Allpigswithweightsabovethisweightthreshold,until
slaughteringatca.105to120kganimal-1liveweight,fallintotheinventorysubcategory“fatteningpigs”.Forbreedingboars,ameanliveweightof200kgani-
mal-1isassumed(Haeneletal.,2011).ThefollowingthreeequationsarederivedfromTable1:
QPONMfpwesp nnnnnnnn (1)
so nnnnn (2)
Vbo nn (3)
wherenM, …, nVnumberofanimalsinthecategoriesMtoVof theGermanlivestocksurvey(seeTable1)(inplace)nsp numberofsuckling-pigsintheinventory(inplace)nwe numberofweanersintheinventory(inplace)nfp numberoffatteningpigsintheinventory(inplace)nso numberofsowsintheinventory(inplace)
TheGermanofficialsurveycountsanimalsataqualify-ingdate.Intheinventory,theseanimalnumbersareinter-pretedasoccupiedanimalplaces.Theinventoryassumesthat the number of occupied animal places is constantwithin a year, an assumptionwhich is necessary as theinventorytimestepofoneyeardoesnotallowforintra-annualchangesoflivestocknumbers.Theseanimalplacesareequivalent to theelementsof
thepopulationsasdefinedbyIPCC(1996),pg.4.7.Hence,inthefollowingtheunit“place”willbeusedratherthan“animal”.While Equations (2) and (3) directly yield the animal
numbers for sows (nso) andboars (nbo) as needed in theinventory, therelationshipsunderlyingEquation (1)needfurtherprocessinginordertoseparatelyobtaintheanimalnumbersofsuckling-pigs(nsp),weaners(nwe)andfatteningpigs(nfp).
Table2:
Numberofpigletsraisedpersowandyear,npiglet, year(primarystatisticalinformation)BW:Baden-Württemberg;BY:Bayern;BB:Brandenburg;HE:Hessen;MV:Mecklenburg-Vorpommern;NI:Niedersachsen;NW:Nordrhein-Westfalen;RP:Rheinland-Pfalz;SL:Saarland;SN:Sachsen;ST:Sachsen-Anhalt;SH:Schleswig-Holstein;TH:Thüringen;StSt:Stadtstaaten(totalofHamburg,BremenandBerlin)
1990 1991 1992 1993 1994 1995 1996 1997 1998 1999 2000 2001 2002 2003 2004 2005 2006 2007 2008
BW 19.20 19.10 18.20 18.67 18.90 17.89 20.00 20.50 21.10
BY 18.00 18.00 17.70 17.60 17.80 18.50 17.60 18.40 19.60 19.60 19.60 19.40 19.60 19.60 20.40 19.90 20.10
BB 17.80 18.20 18.90 19.50 19.70 20.30 20.80 21.70 22.20 22,50 22.80
HE 17.00 17.10 16.60 16.90 17.10 17.10 16.90 17.90 18.00 18.60 18.50 19.10 19.00 19.90 21.10 21.60 21.20
MV 19.10 19.60 20.80 21.10 21.30 23.29 23.84
NI 18.90 18.90 18.90 18.70 18.50 18.70 18.40 18.90 19.30 19.50 19.70 19.60 20.30 20.60 21.30 21.40 21,20
NW 19.00 17.80 18.40 18.90 19.00 18.90 19.10 19.70 20.10 20.20 20.30 20.40 20.30 20.30 21.80 22.10 22.60
RP 17.20 17.30 17.20 17.30 17.40 17.50 17.60 17.90 18.00 18.20 18.50 18.40 19.10 19.00
SL 17.20 17.30 17.20 17.30 17.40 17.50 17.60 17.90 18.00 18.20 18.50 18.40 19.10 19.00
SN 17.80 18.40 18.70 18.64 19.18 19.88 20.41 20.45 20.56 20.67 21.04 21.40 21.49 22.38 23.40 23.31
ST 18.50 18.50 19.90 20.00 19.60 20.66 20.52 21.01 21.46 22.00 22.26 22.99
SH 18.80 18.60 18.40 18.70 19.00 18.80 19.30 19.70 19.80 20.10 20.30 20.70 21.60 22.60 23.20
TH 18.30 19.00 20.10 20.45 21.23 20.43 21.25 20.78 21.66 22.19 22.72 23.28 23.94
StSt
Germany 18.50 18.50 19.10 19.10 19.80 19.80
FordatasourcesseeHaeneletal.(2010)
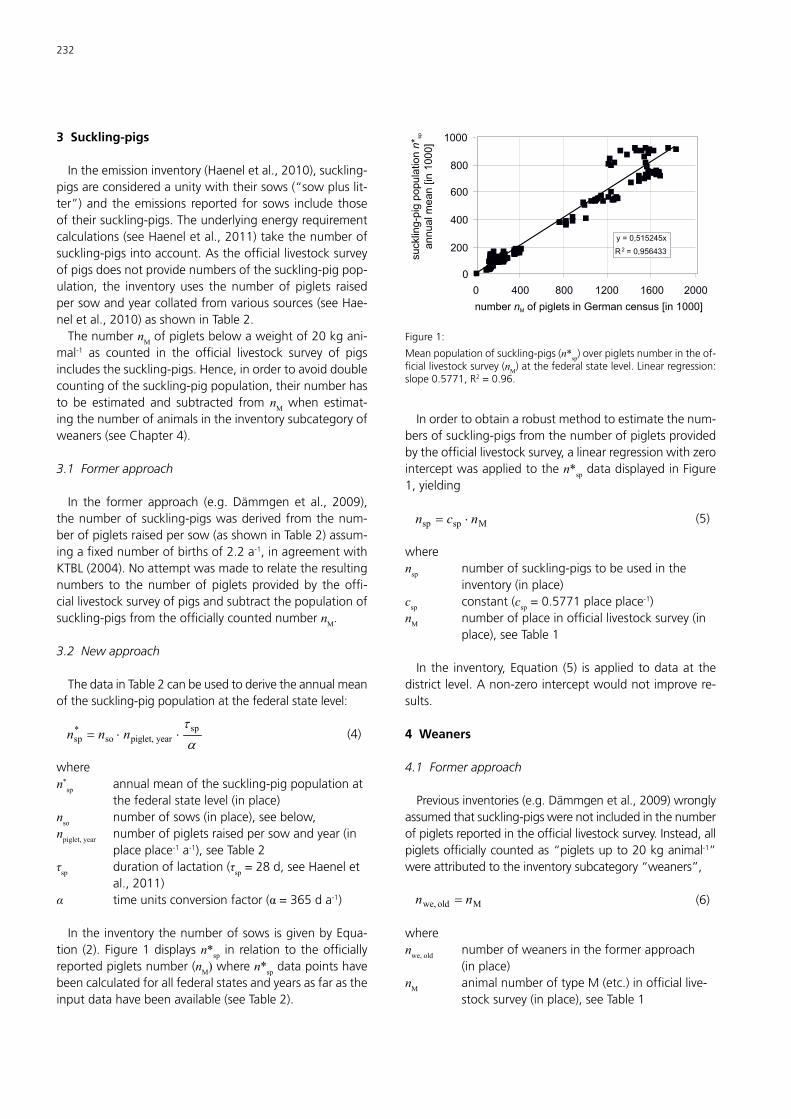
232
3 Suckling-pigs
Intheemissioninventory(Haeneletal.,2010),suckling-pigsareconsideredaunitywiththeirsows(“sowpluslit-ter”)and theemissions reported for sows include thoseoftheirsuckling-pigs.Theunderlyingenergyrequirementcalculations(seeHaeneletal.,2011)takethenumberofsuckling-pigsintoaccount.Astheofficiallivestocksurveyofpigsdoesnotprovidenumbersofthesuckling-pigpop-ulation, the inventory uses thenumber of piglets raisedpersowandyearcollatedfromvarioussources(seeHae-neletal.,2010)asshowninTable2.ThenumbernMofpigletsbelowaweightof20kgani-
mal-1 as counted in the official livestock survey of pigsincludesthesuckling-pigs.Hence,inordertoavoiddoublecountingofthesuckling-pigpopulation,theirnumberhasto be estimated and subtracted from nM when estimat-ingthenumberofanimalsintheinventorysubcategoryofweaners(seeChapter4).
3.1 Former approach
In the former approach (e.g. Dämmgen et al., 2009),thenumberofsuckling-pigswasderivedfromthenum-berofpigletsraisedpersow(asshowninTable2)assum-ingafixednumberofbirthsof2.2a-1,inagreementwithKTBL(2004).Noattemptwasmadetorelatetheresultingnumbers to thenumber of piglets providedby theoffi-ciallivestocksurveyofpigsandsubtractthepopulationofsuckling-pigsfromtheofficiallycountednumbernM.
3.2 New approach
ThedatainTable2canbeusedtoderivetheannualmeanofthesuckling-pigpopulationatthefederalstatelevel:
spyearpiglet,so
*sp nnn (4)
wheren*
sp annualmeanofthesuckling-pigpopulationat thefederalstatelevel(inplace)nso numberofsows(inplace),seebelow,npiglet, year numberofpigletsraisedpersowandyear(in placeplace-1a-1),seeTable2τsp durationoflactation(τsp=28d,seeHaenelet al.,2011)α timeunitsconversionfactor(α =365da-1)
IntheinventorythenumberofsowsisgivenbyEqua-tion (2).Figure1displaysn*sp in relation to theofficiallyreportedpigletsnumber(nM)wheren*spdatapointshavebeencalculatedforallfederalstatesandyearsasfarastheinputdatahavebeenavailable(seeTable2).
y = 0,515245x
R2 = 0,956433
0
200
400
600
800
1000
0 400 800 1200 1600 2000
suckling-p
ig p
opula
tion
*
annual m
ean [in
1000]n
sp
number of piglets in German census [in 1000]nM
Figure1:
Meanpopulationofsuckling-pigs(n*sp)overpigletsnumberintheof-ficiallivestocksurvey(nM)atthefederalstatelevel.Linearregression:slope0.5771,R2=0.96.
Inordertoobtainarobustmethodtoestimatethenum-bersofsuckling-pigsfromthenumberofpigletsprovidedbytheofficiallivestocksurvey,alinearregressionwithzerointerceptwasappliedtothen*spdatadisplayedinFigure1,yielding
Mspsp ncn (5)
wherensp numberofsuckling-pigstobeusedinthe inventory(inplace)csp constant(csp=0.5771placeplace
-1)nM numberofplaceinofficiallivestocksurvey(in place),seeTable1
Inthe inventory,Equation (5) isappliedtodataat thedistrictlevel.Anon-zerointerceptwouldnotimprovere-sults.
4 Weaners
4.1 Former approach
Previousinventories(e.g.Dämmgenetal.,2009)wronglyassumedthatsuckling-pigswerenotincludedinthenumberofpigletsreportedintheofficiallivestocksurvey.Instead,allpigletsofficiallycountedas“pigletsupto20kganimal-1”wereattributedtotheinventorysubcategory“weaners”,
Mold we, nn (6)
wherenwe, old numberofweanersintheformerapproach (inplace)nM animalnumberoftypeM(etc.)inofficiallive- stocksurvey(inplace),seeTable1
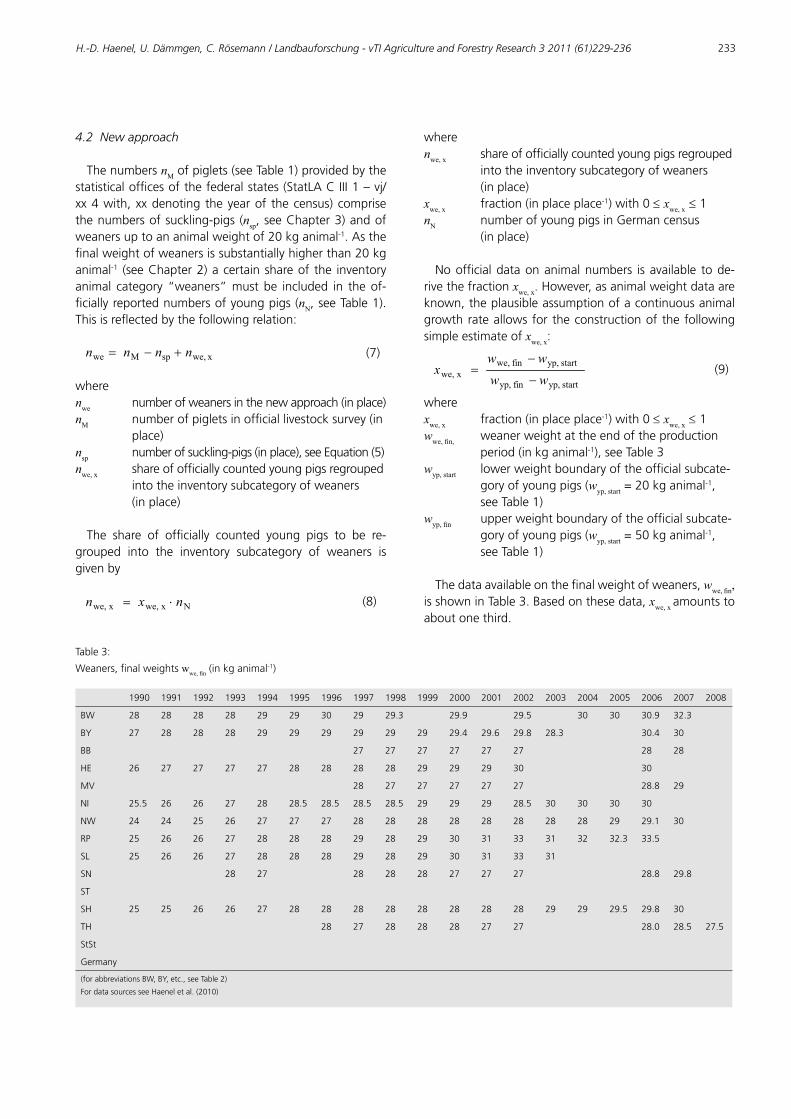
H.-D. Haenel, U. Dämmgen, C. Rösemann / Landbauforschung - vTI Agriculture and Forestry Research 3 2011 (61)229-236 233
4.2 New approach
ThenumbersnMofpiglets(seeTable1)providedbythestatisticalofficesofthefederalstates(StatLACIII1–vj/xx4with,xxdenoting theyearof thecensus)comprisethenumbersofsuckling-pigs (nsp,seeChapter3)andofweanersuptoananimalweightof20kganimal-1.Asthefinalweightofweanersissubstantiallyhigherthan20kganimal-1 (seeChapter2)acertainshareof the inventoryanimal category“weaners”mustbe included in theof-ficiallyreportednumbersofyoungpigs(nN,seeTable1).Thisisreflectedbythefollowingrelation:
x we,spMwe nnnn (7)
wherenwe numberofweanersinthenewapproach(inplace)nM numberofpigletsinofficiallivestocksurvey(in place)nsp numberofsuckling-pigs(inplace),seeEquation(5)nwe, x shareofofficiallycountedyoungpigsregrouped intotheinventorysubcategoryofweaners (inplace)
The share of officially counted young pigs to be re-grouped into the inventory subcategory of weaners isgivenby
Nxwe,xwe, nxn (8)
wherenwe, x shareofofficiallycountedyoungpigsregrouped intotheinventorysubcategoryofweaners (inplace)xwe, x fraction(inplaceplace-1)with0≤xwe, x≤1nN numberofyoungpigsinGermancensus (inplace)
Noofficialdataonanimalnumbers isavailable tode-rivethefractionxwe, x.However,asanimalweightdataareknown,theplausibleassumptionofacontinuousanimalgrowthrateallowsfortheconstructionofthefollowingsimpleestimateofxwe, x:
startyp,finyp,
startyp,finwe,xwe, ww
wwx (9)
wherexwe, x fraction(inplaceplace-1)with0≤xwe, x ≤1wwe, fin, weanerweightattheendoftheproduction period(inkganimal-1),seeTable3wyp, start lowerweightboundaryoftheofficialsubcate- goryofyoungpigs(wyp, start=20kganimal
-1, seeTable1)wyp, fin upperweightboundaryoftheofficialsubcate- goryofyoungpigs(wyp, start=50kganimal
-1, seeTable1)
Thedataavailableonthefinalweightofweaners,wwe, fin, isshowninTable3.Basedonthesedata,xwe, xamountstoaboutonethird.
Table3:
Weaners,finalweightswwe, fin(inkganimal-1)
1990 1991 1992 1993 1994 1995 1996 1997 1998 1999 2000 2001 2002 2003 2004 2005 2006 2007 2008
BW 28 28 28 28 29 29 30 29 29.3 29.9 29.5 30 30 30.9 32.3
BY 27 28 28 28 29 29 29 29 29 29 29.4 29.6 29.8 28.3 30.4 30
BB 27 27 27 27 27 27 28 28
HE 26 27 27 27 27 28 28 28 28 29 29 29 30 30
MV 28 27 27 27 27 27 28.8 29
NI 25.5 26 26 27 28 28.5 28.5 28.5 28.5 29 29 29 28.5 30 30 30 30
NW 24 24 25 26 27 27 27 28 28 28 28 28 28 28 28 29 29.1 30
RP 25 26 26 27 28 28 28 29 28 29 30 31 33 31 32 32.3 33.5
SL 25 26 26 27 28 28 28 29 28 29 30 31 33 31
SN 28 27 28 28 28 27 27 27 28.8 29.8
ST
SH 25 25 26 26 27 28 28 28 28 28 28 28 28 29 29 29.5 29.8 30
TH 28 27 28 28 28 27 27 28.0 28.5 27.5
StSt
Germany
(forabbreviationsBW,BY,etc.,seeTable2)
FordatasourcesseeHaeneletal.(2010)
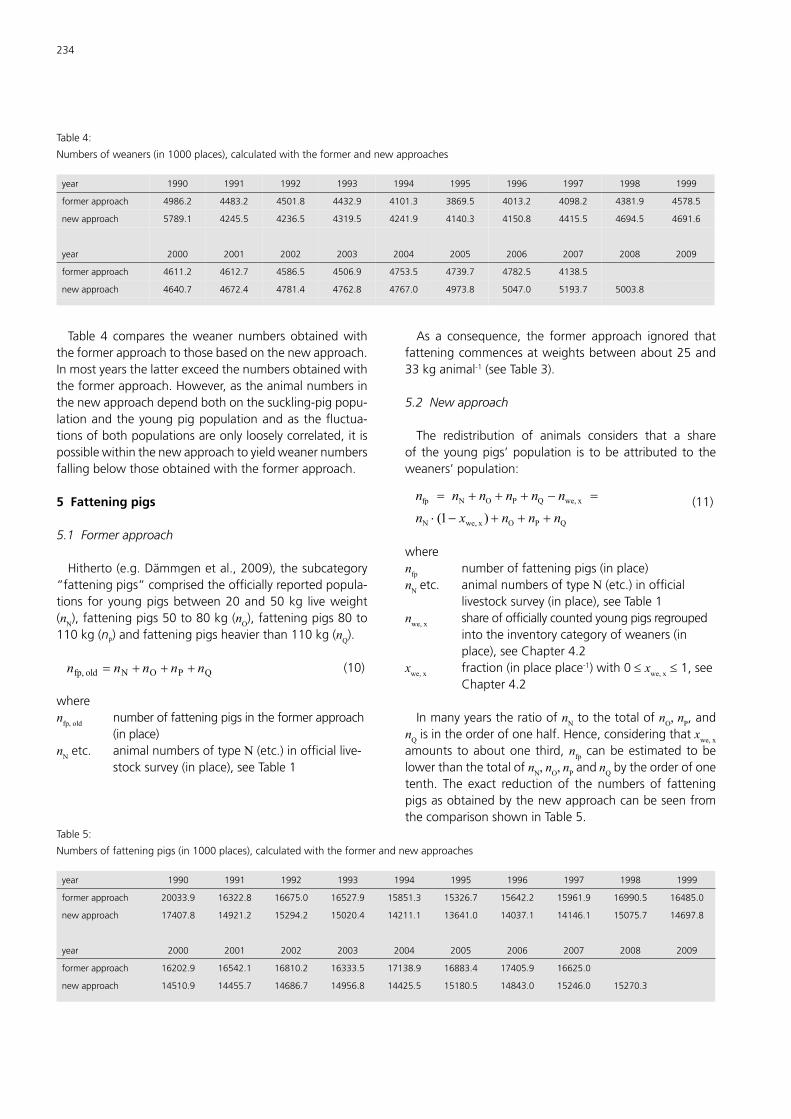
234
Table4:
Numbersofweaners(in1000places),calculatedwiththeformerandnewapproaches
year 1990 1991 1992 1993 1994 1995 1996 1997 1998 1999
former approach 4986.2 4483.2 4501.8 4432.9 4101.3 3869.5 4013.2 4098.2 4381.9 4578.5
new approach 5789.1 4245.5 4236.5 4319.5 4241.9 4140.3 4150.8 4415.5 4694.5 4691.6
year 2000 2001 2002 2003 2004 2005 2006 2007 2008 2009
former approach 4611.2 4612.7 4586.5 4506.9 4753.5 4739.7 4782.5 4138.5
new approach 4640.7 4672.4 4781.4 4762.8 4767.0 4973.8 5047.0 5193.7 5003.8
Table 4 compares theweaner numbers obtainedwiththeformerapproachtothosebasedonthenewapproach.Inmostyearsthelatterexceedthenumbersobtainedwiththeformerapproach.However,astheanimalnumbersinthenewapproachdependbothonthesuckling-pigpopu-lationandtheyoungpigpopulationandas thefluctua-tionsofbothpopulationsareonlylooselycorrelated,itispossiblewithinthenewapproachtoyieldweanernumbersfallingbelowthoseobtainedwiththeformerapproach.
5 Fattening pigs
5.1 Former approach
Hitherto(e.g.Dämmgenetal.,2009),thesubcategory“fatteningpigs“comprisedtheofficiallyreportedpopula-tions for youngpigsbetween20and50kg liveweight(nN),fatteningpigs50to80kg(nO),fatteningpigs80to110kg(nP)andfatteningpigsheavierthan110kg(nQ).
QPONold fp, nnnnn (10)
wherenfp, old numberoffatteningpigsintheformerapproach (inplace)nNetc. animalnumbersoftypeN(etc.)inofficiallive- stocksurvey(inplace),seeTable1
As a consequence, the former approach ignored thatfatteningcommencesatweightsbetweenabout25and33kganimal-1(seeTable3).
5.2 New approach
The redistribution of animals considers that a shareof theyoungpigs’population is tobeattributed to theweaners’population:
QPO xwe,N
xwe,QPONfp
)1( nnnxnnnnnnn (11)
wherenfp numberoffatteningpigs(inplace)nN etc. animalnumbersoftypeN(etc.)inofficial livestocksurvey(inplace),seeTable1nwe, x shareofofficiallycountedyoungpigsregrouped intotheinventorycategoryofweaners(in place),seeChapter4.2xwe, x fraction(inplaceplace-1)with0≤xwe, x≤1,see Chapter4.2
InmanyyearstheratioofnNtothetotalofnO, nP,andnQisintheorderofonehalf.Hence,consideringthatxwe, xamounts toaboutone third,nfp canbeestimated tobelowerthanthetotalofnN, nO, nPand nQbytheorderofonetenth. The exact reduction of the numbers of fatteningpigsasobtainedbythenewapproachcanbeseenfromthecomparisonshowninTable5.
Table5:
Numbersoffatteningpigs(in1000places),calculatedwiththeformerandnewapproaches
year 1990 1991 1992 1993 1994 1995 1996 1997 1998 1999
formerapproach 20033.9 16322.8 16675.0 16527.9 15851.3 15326.7 15642.2 15961.9 16990.5 16485.0
newapproach 17407.8 14921.2 15294.2 15020.4 14211.1 13641.0 14037.1 14146.1 15075.7 14697.8
year 2000 2001 2002 2003 2004 2005 2006 2007 2008 2009
formerapproach 16202.9 16542.1 16810.2 16333.5 17138.9 16883.4 17405.9 16625.0
newapproach 14510.9 14455.7 14686.7 14956.8 14425.5 15180.5 14843.0 15246.0 15270.3
H.-D. Haenel, U. Dämmgen, C. Rösemann / Landbauforschung - vTI Agriculture and Forestry Research 3 2011 (61)229-236 235
6 Summary and conclusions
Aconsistentapproachhasbeenderivedtoredistributeofficiallycountednumbersofpiglets,youngpigsandfat-teningpigsintotheanimalcategoriesoftheemissionin-ventory,i.e.weanersandfatteningpigs.Thenewmodelavoidsthedoublecountingofsuckling-
pigs in the former approach where suckling-pigs weretakenintoaccountwithintheunitsow/suckling-pigsbutalsointhecategoryofweaners.Italsoresultsinmodifiednumbersofweanersand,inanycase,reducednumbersoffatteningpigs,asshowninTables4and5.Clearly,eliminationofanimaldoublecountingreduces
thecalculatedemissions.Furtherreductionsofthecalcu-latedemissionsareachievedbyassigningashareof theofficially counted young pigs to theweaner subcatego-ry instead of the fattener subcategory as emissions perweaneraresmallerthanthoseperfatteningpig(seeHae-neletal,2010).
Acknowledgements
Theauthorswishtothankthereviewersfortheirvalu-ableandhelpfulcomments.
References
DämmgenU,HaenelH-D,Rösemann,C,ConradJ,LüttchM,DöhlerH,Eurich-MendenB,LaubachP,Müller-LindenlaufM,OsterburgB(2009)Calculati-onsof emissions fromGermanagriculture–National Emission InventoryReport(NIR)2009for2007.MethodsandData(GAS-EM).Braunschweig:vTI,LandbauforschSH324:9-385
DämmgenU,BradeW,SchulzJ,HaenelH-D,RösemannC(2011)EinflussvonFütterungsverfahrenaufdie EmissionenausderMastschweinehaltung inNiedersachsen.Züchtungskunde83(3):191-201
DämmgenU,HaenelH-D,RösemannC,Eurich-MendenB,DöhlerH(2010a)Derivation of TAN related ammonia emission factors in pig production.Landbauforsch60(4):241-248
DämmgenU,Hahne J,HaenelH-D, RösemannC (2010b)DieModellierungderEmissionenvonStickstoffspezies,NMVOCundStaubausAbluftreini-gungsanlagen inderSchweinehaltung imdeutschen landwirtschaftlichenEmissionsinventar.GefahrstoffeReinhaltungderLuft70(10):437-442
EMEP/EEAairpollutantemissioninventoryguidebook—2009(2009)PartB.4.B.Animalhusbandryandmanuremanagement[online].Tobefoundat<http://www.eea.europa.eu/publications/emep-eea-emission-inventory-guidebook-2009/part-b-sectoral-guidance-chapters/4-agriculture/4-b>[quoted22.07.2011]
HaenelH-D,DämmgenU,LaubachP,RösemannC(2011)Updateofthecalcu-lationofmetabolizableenergyrequirementsforpigsintheGermanagricu-lturalemissioninventory.Landbauforsch61(3):217-228
HaenelH-D,RösemannC,DämmgenU,DöhlerH,Eurich-MendenB,LaubachP,Müller-LindenlaufM,undOsterburgB(2010)CalculationsofemissionsfromGermanagriculture–NationalEmissionInventoryReport(NIR)2010for2008.MethodsandData(GAS-EM).Braunschweig:vTI,LandbauforschSH334:13-428
IPCC–IntergovernmentalPanelonClimateChange(1996)Revised1996IPCCguidelinesforgreenhousegas inventories :Vol3:Referencemanual (on-line].Tobefoundat<http://www.ipcc-nggip.iges.or.jp/public/gl/invs6.htm>[quoted25.07.2011]
IPCC–IntergovernmentalPanelonClimateChange(2000)Goodpracticeguid-anceanduncertaintymeasurementinnationalgreenhousegasinventories[online]. To be found at <http://www.ipcc-nggip.iges.or.jp/public/gp/eng-lish>[quoted25.07.2011]
KTBL – Kuratorium für Technik und Bauwesen in der Landwirtschaft (2004)BetriebsplanungLandwirtschaft2004/05:DatenfürdieBetriebsplanunginderLandwirtschaft.Darmstadt:KTBL,573p
StatLA–CIII1-vj4:StatistischeLandesämter,Viehbestand

236
A.-L. Giesert, W.-T. Balke, G. Jahns / Landbauforschung - vTI Agriculture and Forestry Research 3 2011 (61)237-242 237
Probabilistic analysis of coughs in pigs to diagnose respiratory infections
Anna-LenaGiesert*, Wolf-TiloBalke*,andGerhardJahns**
* Technische Universität Braunschweig, Institute for Information Systems,Mühlenpfordtstraße 23, 38106 Braunschweig, Germany, Email: balke@ ifis.cs.tu-bs.de
** JohannHeinrichvonThünenInstitute(vTI),FederalResearchInstituteforRural Areas, Forestry and Fisheries, Institute of Agricultural Technology and Biosystems Engineering, Bundesallee 50, 38116 Braunschweig, Germany,
Abstract
InGermanyalone,respiratoryinfectionsinpigsfatten-ingfarmscauselossesofmillionsofEuros.Theseeconomiclossesareattributedlesstototallossesduetothedeathofpigs,butmuchmoretocostsfortreatmentandindirectcostscausedbydiminishedmastundbreedingresults.Theearlierinfectedanimalsaredetected,themorepromisingtreatmentsandmeanstoreducetheriskofinfectionare.Therefore it is necessary to distinguish between coughsfromhealthypigs,simplethroatcleaning,andcoughsbyinfectedpigs.Thispapershowsthatthis isautomaticallypossible,andthateventhekindof infectioncanbedis-tinguished.Methods and procedures applied aremainlyadaptedfromthosewhichsuccessfullyhavebeenprovedinhumanspeechrecognition.
Keywords: Pigs, livestock breeding; respiratory diseases; bioacoustics; biosemiotic; signal analysis; Hidden Markov Models (HMM)
Zusammenfassung
Probabilistische Analyse von Hustengeräuschen zur Diagnose von Atemwegserkrankungen bei Schweinen
Infektiöse Atemwegserkrankungen führen allein inDeutschlandzuMillionenverlusteninderSchweinezucht.DieseökonomischenEinbußensindwenigerdurchTotal-verlusteinfolgedesVerendensderTierebedingt,sondernresultierenausindirektenVerlustendurchdieBeeinträchti-gungendesMast-undZuchterfolges.JefrühererkrankteTiereerkanntwerden,umsoerfolgversprechendersindderBehandlungserfolg und Maßnahmen zur VerminderungderAnsteckungsgefahr.Dazuistesabernotwendig,dasHusteneinesgesundenTieresvondemeineserkranktenzu unterscheiden. Der Beitrag zeigt, dass dies automa-tischmöglich ist, jadasssichsogardieArtder Infektionerkennenlässt.Dabeikommen,entsprechendangepasst,MethodenundVerfahrenzumEinsatz,wiesiesichinderSpracherkennungbewährthaben.
Schlüsselwörter: Schweine, Tierhaltung, Atemwegserkran-kungen, Bioakustik, Biosemiotik, Signalanalyse, Hidden-Markov-Modelle (HMM)
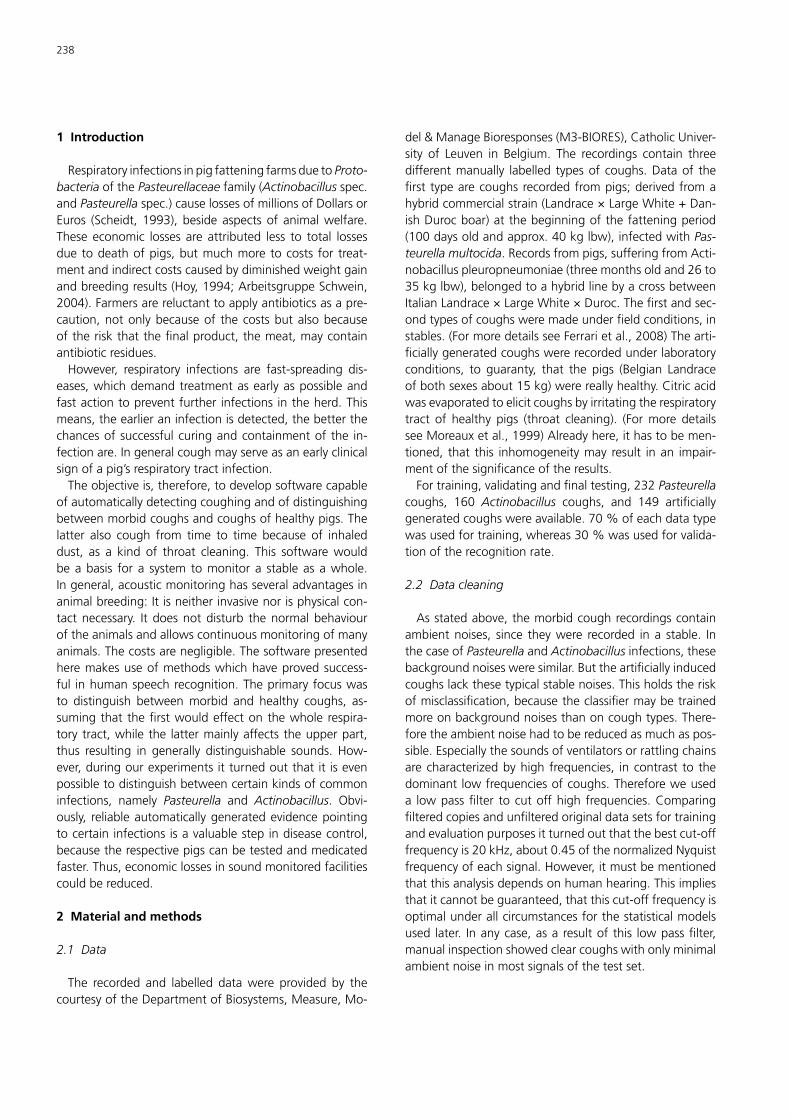
238
1 Introduction
RespiratoryinfectionsinpigfatteningfarmsduetoProto-bacteriaofthePasteurellaceae family(Actinobacillus spec.and Pasteurella spec.)causelossesofmillionsofDollarsorEuros (Scheidt, 1993), beside aspectsof animalwelfare.These economic losses are attributed less to total lossesduetodeathofpigs,butmuchmoretocosts for treat-mentandindirectcostscausedbydiminishedweightgainandbreedingresults(Hoy,1994;ArbeitsgruppeSchwein,2004).Farmersarereluctanttoapplyantibioticsasapre-caution,notonlybecauseof thecostsbutalsobecauseoftheriskthatthefinalproduct,themeat,maycontainantibioticresidues.However, respiratory infections are fast-spreading dis-
eases,whichdemandtreatmentasearlyaspossibleandfastactiontopreventfurther infectionsintheherd.Thismeans,theearlieraninfectionisdetected,thebetterthechancesofsuccessfulcuringandcontainmentof the in-fectionare.Ingeneralcoughmayserveasanearlyclinicalsignofapig’srespiratorytractinfection.Theobjectiveis,therefore,todevelopsoftwarecapable
ofautomaticallydetectingcoughingandofdistinguishingbetweenmorbidcoughsandcoughsofhealthypigs.Thelatter also cough from time to time because of inhaleddust, as a kind of throat cleaning. This softwarewouldbeabasis for a system tomonitora stableasawhole.Ingeneral,acousticmonitoringhasseveraladvantagesinanimalbreeding:Itisneitherinvasivenorisphysicalcon-tactnecessary. Itdoesnotdisturb thenormalbehaviouroftheanimalsandallowscontinuousmonitoringofmanyanimals.Thecostsarenegligible.Thesoftwarepresentedheremakesuseofmethodswhichhaveprovedsuccess-ful inhumanspeechrecognition.Theprimaryfocuswasto distinguish betweenmorbid and healthy coughs, as-sumingthat thefirstwouldeffectonthewholerespira-torytract,whilethe lattermainlyaffectstheupperpart,thus resulting in generally distinguishable sounds. How-ever,duringourexperimentsitturnedoutthatitisevenpossibletodistinguishbetweencertainkindsofcommoninfections, namely Pasteurella and Actinobacillus. Obvi-ously, reliableautomaticallygeneratedevidencepointingtocertaininfectionsisavaluablestepindiseasecontrol,becausetherespectivepigscanbetestedandmedicatedfaster.Thus,economiclossesinsoundmonitoredfacilitiescouldbereduced.
2 Material and methods
2.1 Data
The recorded and labelled datawere provided by thecourtesyoftheDepartmentofBiosystems,Measure,Mo-
del&ManageBioresponses(M3-BIORES),CatholicUniver-sity of Leuven in Belgium. The recordings contain threedifferentmanually labelled typesofcoughs.Dataof thefirsttypearecoughsrecordedfrompigs;derivedfromahybridcommercialstrain(Landrace×LargeWhite+Dan-ishDurocboar)atthebeginningofthefatteningperiod(100daysoldandapprox.40kglbw),infectedwithPas-teurella multocida.Recordsfrompigs,sufferingfromActi-nobacilluspleuropneumoniae(threemonthsoldand26to35kglbw),belongedtoahybridlinebyacrossbetweenItalianLandrace×LargeWhite×Duroc.Thefirstandsec-ondtypesofcoughsweremadeunderfieldconditions,instables.(FormoredetailsseeFerrarietal.,2008)Thearti-ficiallygeneratedcoughswererecordedunderlaboratoryconditions, to guaranty, that the pigs (Belgian Landraceofbothsexesabout15kg)werereallyhealthy.Citricacidwasevaporatedtoelicitcoughsbyirritatingtherespiratorytract of healthy pigs (throat cleaning). (Formore detailsseeMoreauxetal.,1999)Alreadyhere,ithastobemen-tioned, that this inhomogeneitymay result inan impair-mentofthesignificanceoftheresults.Fortraining,validatingandfinaltesting,232Pasteurella
coughs, 160 Actinobacillus coughs, and 149 artificiallygeneratedcoughswereavailable.70%ofeachdatatypewasusedfortraining,whereas30%wasusedforvalida-tionoftherecognitionrate.
2.2 Data cleaning
Asstatedabove,themorbidcoughrecordingscontainambientnoises, since theywere recorded ina stable. InthecaseofPasteurellaandActinobacillusinfections,thesebackgroundnoisesweresimilar.Buttheartificiallyinducedcoughslackthesetypicalstablenoises.Thisholdstheriskofmisclassification,becausetheclassifiermaybetrainedmoreonbackgroundnoisesthanoncoughtypes.There-foretheambientnoisehadtobereducedasmuchaspos-sible.Especiallythesoundsofventilatorsorrattlingchainsarecharacterizedbyhigh frequencies, incontrast to thedominantlowfrequenciesofcoughs.Thereforeweuseda lowpassfilter tocutoffhigh frequencies.Comparingfilteredcopiesandunfilteredoriginaldatasetsfortrainingandevaluationpurposesitturnedoutthatthebestcut-offfrequencyis20kHz,about0.45ofthenormalizedNyquistfrequencyofeachsignal.However,itmustbementionedthatthisanalysisdependsonhumanhearing.Thisimpliesthatitcannotbeguaranteed,thatthiscut-offfrequencyisoptimalunderallcircumstancesforthestatisticalmodelsused later. Inanycase,asaresultof this lowpassfilter,manualinspectionshowedclearcoughswithonlyminimalambientnoiseinmostsignalsofthetestset.
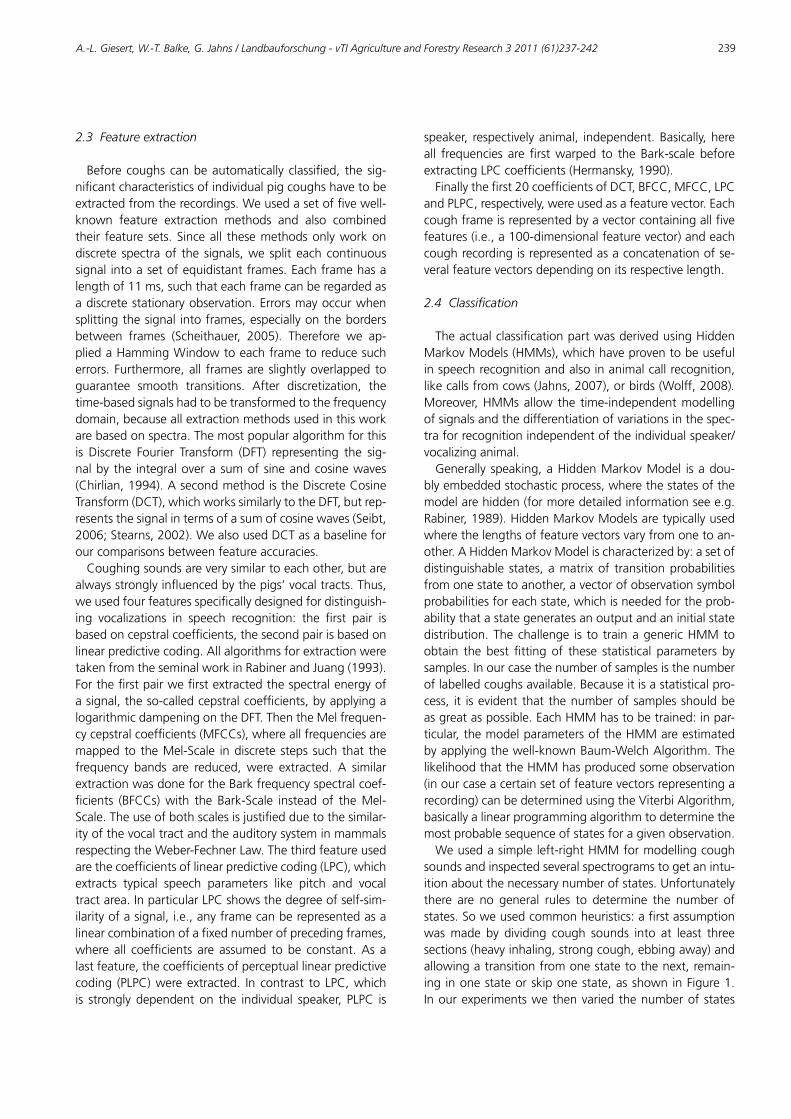
A.-L. Giesert, W.-T. Balke, G. Jahns / Landbauforschung - vTI Agriculture and Forestry Research 3 2011 (61)237-242 239
2.3 Feature extraction
Beforecoughscanbeautomaticallyclassified, thesig-nificantcharacteristicsofindividualpigcoughshavetobeextractedfromtherecordings.Weusedasetoffivewell-known feature extraction methods and also combinedtheir featuresets.Sinceall thesemethodsonlyworkondiscrete spectraof the signals,we split eachcontinuoussignalintoasetofequidistantframes.Eachframehasalengthof11ms,suchthateachframecanberegardedasadiscretestationaryobservation.Errorsmayoccurwhensplittingthesignalintoframes,especiallyonthebordersbetween frames (Scheithauer, 2005). Therefore we ap-pliedaHammingWindowtoeachframetoreducesucherrors.Furthermore,all framesareslightlyoverlappedtoguarantee smooth transitions. After discretization, thetime-basedsignalshadtobetransformedtothefrequencydomain,becauseallextractionmethodsusedinthisworkarebasedonspectra.Themostpopularalgorithmforthisis Discrete Fourier Transform (DFT) representing the sig-nalbythe integraloverasumofsineandcosinewaves(Chirlian,1994).AsecondmethodistheDiscreteCosineTransform(DCT),whichworkssimilarlytotheDFT,butrep-resentsthesignalintermsofasumofcosinewaves(Seibt,2006;Stearns,2002).WealsousedDCTasabaselineforourcomparisonsbetweenfeatureaccuracies.Coughingsoundsareverysimilartoeachother,butare
alwaysstronglyinfluencedbythepigs’vocaltracts.Thus,weusedfourfeaturesspecificallydesignedfordistinguish-ing vocalizations in speech recognition: the first pair isbasedoncepstralcoefficients,thesecondpairisbasedonlinearpredictivecoding.AllalgorithmsforextractionweretakenfromtheseminalworkinRabinerandJuang(1993).Forthefirstpairwefirstextractedthespectralenergyofasignal,theso-calledcepstralcoefficients,byapplyingalogarithmicdampeningontheDFT.ThentheMelfrequen-cycepstralcoefficients(MFCCs),whereallfrequenciesaremappedto theMel-Scale indiscretestepssuchthat thefrequency bands are reduced, were extracted. A similarextractionwasdonefortheBarkfrequencyspectralcoef-ficients (BFCCs)with the Bark-Scale instead of theMel-Scale.Theuseofbothscalesisjustifiedduetothesimilar-ityofthevocaltractandtheauditorysysteminmammalsrespectingtheWeber-FechnerLaw.Thethirdfeatureusedarethecoefficientsoflinearpredictivecoding(LPC),whichextracts typical speech parameters like pitch and vocaltractarea.InparticularLPCshowsthedegreeofself-sim-ilarityofasignal,i.e.,anyframecanberepresentedasalinearcombinationofafixednumberofprecedingframes,where all coefficients are assumed tobe constant.As alastfeature,thecoefficientsofperceptuallinearpredictivecoding (PLPC)wereextracted. In contrast to LPC,whichis stronglydependenton the individual speaker, PLPC is
speaker, respectivelyanimal, independent.Basically,hereall frequencies are firstwarped to theBark-scale beforeextractingLPCcoefficients(Hermansky,1990).Finallythefirst20coefficientsofDCT,BFCC,MFCC,LPC
andPLPC,respectively,wereusedasafeaturevector.Eachcoughframeisrepresentedbyavectorcontainingallfivefeatures(i.e.,a100-dimensionalfeaturevector)andeachcoughrecordingisrepresentedasaconcatenationofse-veralfeaturevectorsdependingonitsrespectivelength.
2.4 Classification
TheactualclassificationpartwasderivedusingHiddenMarkovModels(HMMs),whichhaveproventobeusefulinspeechrecognitionandalsoinanimalcallrecognition,likecallsfromcows(Jahns,2007),orbirds(Wolff,2008).Moreover,HMMsallow the time-independentmodellingofsignalsandthedifferentiationofvariationsinthespec-traforrecognitionindependentoftheindividualspeaker/vocalizinganimal.Generallyspeaking,aHiddenMarkovModel isadou-
blyembeddedstochasticprocess,wherethestatesofthemodelarehidden(formoredetailedinformationseee.g.Rabiner,1989).HiddenMarkovModelsaretypicallyusedwherethelengthsoffeaturevectorsvaryfromonetoan-other.AHiddenMarkovModelischaracterizedby:asetofdistinguishable states,amatrixof transitionprobabilitiesfromonestatetoanother,avectorofobservationsymbolprobabilitiesforeachstate,whichisneededfortheprob-abilitythatastategeneratesanoutputandaninitialstatedistribution.Thechallenge is to trainagenericHMMtoobtain thebest fittingof these statistical parameters bysamples.Inourcasethenumberofsamplesisthenumberoflabelledcoughsavailable.Becauseitisastatisticalpro-cess, it isevidentthatthenumberofsamplesshouldbeasgreataspossible.EachHMMhastobetrained:inpar-ticular,themodelparametersoftheHMMareestimatedbyapplyingthewell-knownBaum-WelchAlgorithm.ThelikelihoodthattheHMMhasproducedsomeobservation(inourcaseacertainsetoffeaturevectorsrepresentingarecording)canbedeterminedusingtheViterbiAlgorithm,basicallyalinearprogrammingalgorithmtodeterminethemostprobablesequenceofstatesforagivenobservation.Weusedasimpleleft-rightHMMformodellingcough
soundsandinspectedseveralspectrogramstogetanintu-itionaboutthenecessarynumberofstates.Unfortunatelythere are no general rules to determine the number ofstates.Soweusedcommonheuristics:afirstassumptionwasmade by dividing cough sounds into at least threesections(heavyinhaling,strongcough,ebbingaway)andallowingatransitionfromonestatetothenext,remain-inginonestateorskiponestate,asshowninFigure1.Inourexperimentswethenvariedthenumberofstates
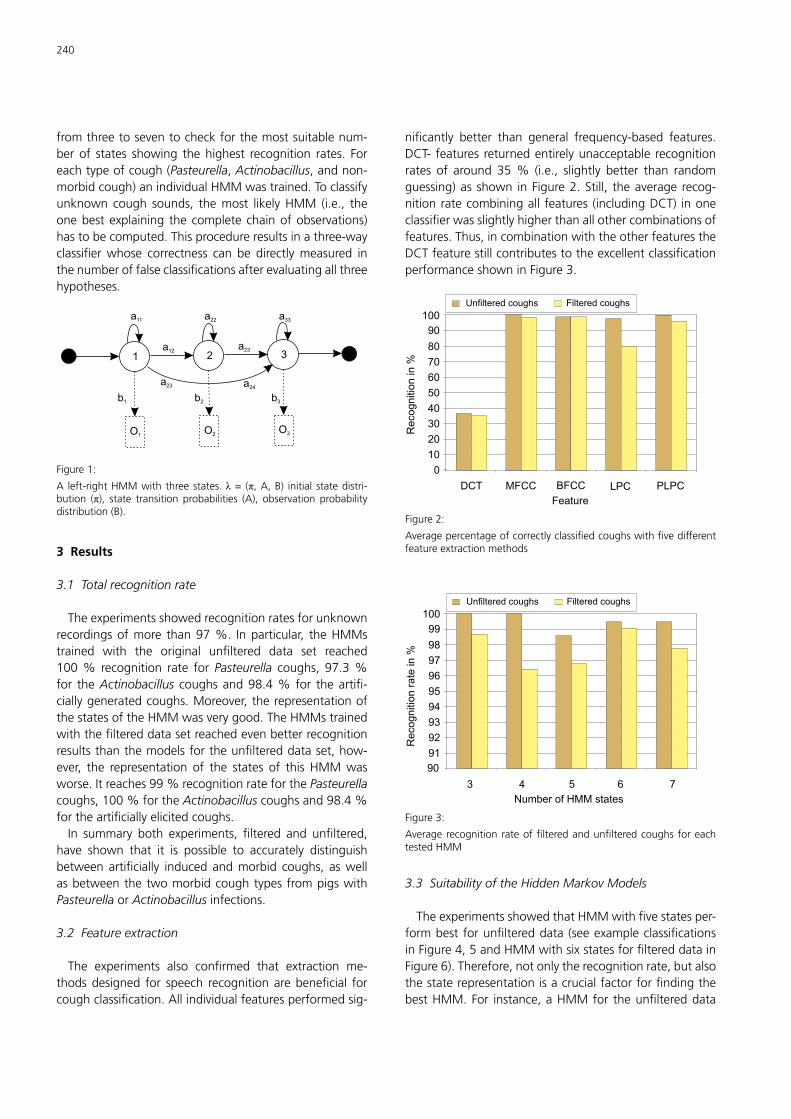
240
fromthreetoseventocheckforthemostsuitablenum-berof states showing thehighest recognition rates. Foreachtypeofcough(Pasteurella,Actinobacillus,andnon-morbidcough)anindividualHMMwastrained.Toclassifyunknown cough sounds, themost likelyHMM (i.e., theonebestexplaining thecompletechainofobservations)hastobecomputed.Thisprocedureresultsinathree-wayclassifierwhose correctness can be directlymeasured inthenumberoffalseclassificationsafterevaluatingallthreehypotheses.
1 2 3
a11
O1O2
O3
a12a23
a23 a24
b1 b2 b3
a22 a33
Figure1:
A left-rightHMMwiththreestates. λ= (π,A,B) initial statedistri-bution (π), state transition probabilities (A), observation probabilitydistribution(B).
3 Results
3.1 Total recognition rate
Theexperimentsshowedrecognitionratesforunknownrecordingsofmore than97%. Inparticular, theHMMstrained with the original unfiltered data set reached100% recognition rate forPasteurella coughs, 97.3%for theActinobacillus coughsand98.4% for theartifi-ciallygeneratedcoughs.Moreover,therepresentationofthestatesoftheHMMwasverygood.TheHMMstrainedwiththefiltereddatasetreachedevenbetterrecognitionresultsthanthemodelsfortheunfiltereddataset,how-ever, the representation of the states of this HMMwasworse.Itreaches99%recognitionrateforthePasteurellacoughs,100%fortheActinobacilluscoughsand98.4%fortheartificiallyelicitedcoughs.In summary both experiments, filtered and unfiltered,
have shown that it is possible to accurately distinguishbetweenartificially inducedandmorbid coughs, aswellasbetweenthetwomorbidcoughtypesfrompigswithPasteurellaorActinobacillusinfections.
3.2 Feature extraction
The experiments also confirmed that extraction me-thodsdesigned for speech recognitionarebeneficial forcoughclassification.Allindividualfeaturesperformedsig-
nificantly better than general frequency-based features.DCT- features returnedentirelyunacceptable recognitionrates of around 35% (i.e., slightly better than randomguessing)asshown inFigure2.Still, theaverage recog-nitionratecombiningall features(includingDCT) inoneclassifierwasslightlyhigherthanallothercombinationsoffeatures.Thus,incombinationwiththeotherfeaturestheDCTfeaturestillcontributestotheexcellentclassificationperformanceshowninFigure3.
100
90
80
70
60
50
40
30
20
10
0
DCT MFCC BFCC LPC PLPC
Feature
Recognitio
n in %
Unfiltered coughs Filtered coughs
Figure2:
Averagepercentageofcorrectlyclassifiedcoughswithfivedifferentfeatureextractionmethods
100
99
98
97
96
95
94
93
92
91
90
3 4 5 6 7
Number of HMM states
Recognitio
n r
ate
in %
Unfiltered coughs Filtered coughs
Figure3:
AveragerecognitionrateoffilteredandunfilteredcoughsforeachtestedHMM
3.3 Suitability of the Hidden Markov Models
TheexperimentsshowedthatHMMwithfivestatesper-formbestforunfiltereddata (seeexampleclassificationsinFigure4,5andHMMwithsixstatesforfiltereddatainFigure6).Therefore,notonlytherecognitionrate,butalsothestaterepresentationisacrucialfactorforfindingthebestHMM.For instance,aHMMfor theunfiltereddata
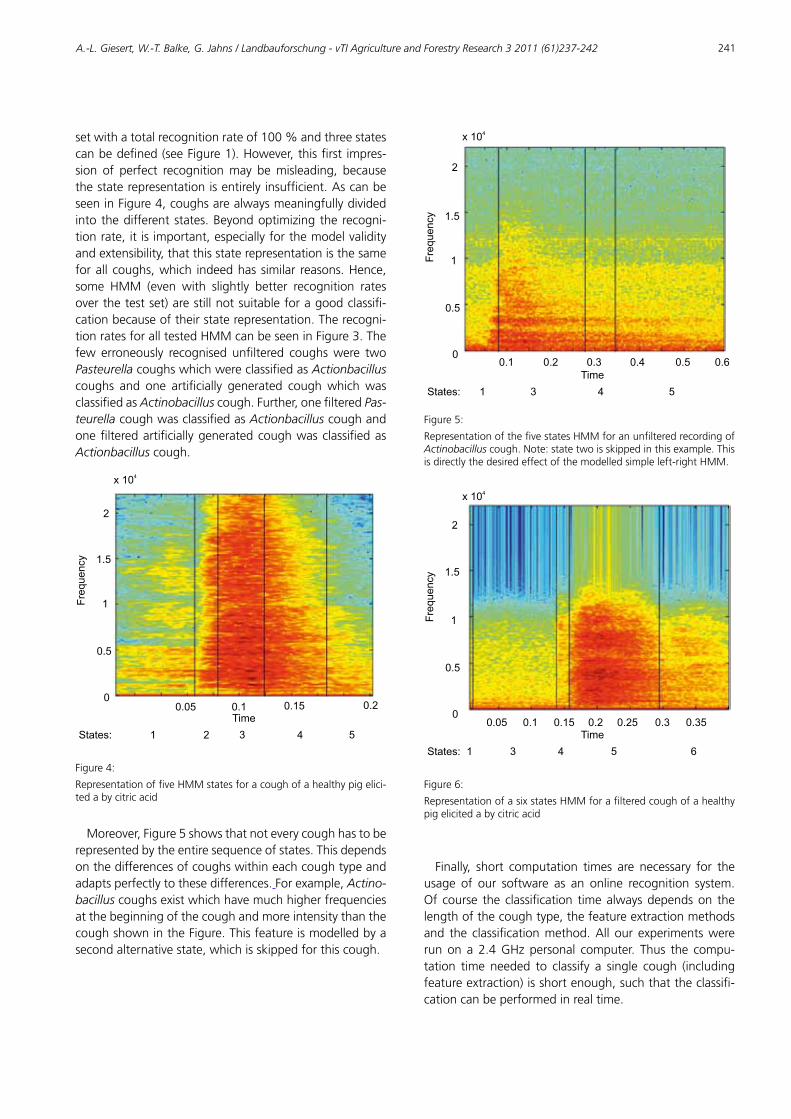
A.-L. Giesert, W.-T. Balke, G. Jahns / Landbauforschung - vTI Agriculture and Forestry Research 3 2011 (61)237-242 241
setwithatotalrecognitionrateof100%andthreestatescanbedefined(seeFigure1).However,thisfirst impres-sion of perfect recognitionmay bemisleading, becausethestaterepresentationisentirelyinsufficient.AscanbeseeninFigure4,coughsarealwaysmeaningfullydividedintothedifferentstates.Beyondoptimizingtherecogni-tionrate,itisimportant,especiallyforthemodelvalidityandextensibility,thatthisstaterepresentationisthesameforallcoughs,which indeedhassimilar reasons.Hence,some HMM (even with slightly better recognition ratesoverthetestset)arestillnotsuitableforagoodclassifi-cationbecauseoftheirstaterepresentation.Therecogni-tionratesforalltestedHMMcanbeseeninFigure3.Thefew erroneously recognised unfiltered coughswere twoPasteurellacoughswhichwereclassifiedasActionbacilluscoughs and one artificially generated coughwhichwasclassifiedasActinobacillus cough.Further,onefilteredPas-teurella coughwasclassifiedasActionbacilluscoughandonefilteredartificiallygeneratedcoughwasclassifiedasActionbacilluscough.
x 104
2
1.5
1
1 2 3 4 5
0.5
00.05 0.1 0.15 0.2
Fre
quency
Time
States:
Figure4:
RepresentationoffiveHMMstatesforacoughofahealthypigelici-tedabycitricacid
Moreover,Figure5showsthatnoteverycoughhastoberepresentedbytheentiresequenceofstates.Thisdependsonthedifferencesofcoughswithineachcoughtypeandadaptsperfectlytothesedifferences.Forexample,Actino-bacilluscoughsexistwhichhavemuchhigherfrequenciesatthebeginningofthecoughandmoreintensitythanthecoughshownintheFigure.Thisfeatureismodelledbyasecondalternativestate,whichisskippedforthiscough.
0.20.1 0.3 0.4 0.5 0.6
x 104
2
1.5
1
1 3 4 5
0.5
0
Fre
quency
Time
States:
Figure5:
RepresentationofthefivestatesHMMforanunfilteredrecordingofActinobacilluscough.Note:statetwoisskippedinthisexample.Thisisdirectlythedesiredeffectofthemodelledsimpleleft-rightHMM.
x 104
2
1.5
1
1 3 4 5 6
0.5
0
Fre
quency
Time
States:
0.250.1 0.15 0.3 0.350.20.05
Figure6:
RepresentationofasixstatesHMMforafilteredcoughofahealthypigelicitedabycitricacid
Finally, short computation times are necessary for theusage of our software as an online recognition system.Of course the classification timealwaysdependson thelengthofthecoughtype,thefeatureextractionmethodsand the classificationmethod.All our experimentswererunon a 2.4GHzpersonal computer. Thus the compu-tation time needed to classify a single cough (includingfeatureextraction)isshortenough,suchthattheclassifi-cationcanbeperformedinrealtime.
242
4 Discussion
Our results show that theclassificationwithHMMs incombination with feature extraction methods from theareaofspeechrecognitionworksfine.However,therearestillseveralproblemstobediscussed:• Fromspeechrecognitionitisknown,thatLPCissensi-tivetocharacteristicsoftheindividualvocaltract(age,genderetc.)whileespeciallyMFCCandBFCCarenot.This explains thebetterperformanceof the latter (s.Figure2).
• ThetotalrecognitionrateandstaterepresentationoftheHMMshowthatdatacleaningdoesnotimplybet-terresults.Thisdepends,ononehand,onourchosenfiltermethod, and on the other on variances of thefrequencybands.Havingonlyasinglefixedcut-offfre-quencyforallcoughtypeswasshowntoreducetherecognitionrate,i.e.,asimplelowpassfilterwillsome-timesalsoobviouslydestroyinformationimportantforcorrectclassifications.
• While the chosen feature extraction methods workwell,therearestilltwodisadvantages.Oneproblemisthatthesefeatureextractionmethodsareallbasedonfrequencyspectrawhichcouldbeadisadvantageforfault-tolerant classification when extending the clas-sification system. Furthermore the proposed featureextractioniscomplextocompute.Simplertime-basedextractionmethodsmightreachcomparableclassifica-tionaccuracywiththeadvantageoflowercomputati-ontime.
• Asignificantproblemisalsothesmallnumberofdataavailable.More data (either recorded in an identicalenvironmentorcoughsofthesametyperecordedindifferentenvironments)isneededtoensureaccuracy,robustnessandreliability.
• Andfinally,allexperimentsconductedherewereper-formed on manually cut and labelled recordings ofcoughing events. However, to automaticallymonitorbreeding facilities cough sounds have to be spottedwithinofacontinuoussoundstream,despitealloftheambientnoiseinastable.Tospotcoughsincontinuousrecordingsburiedinnoisewillbethenextproblemtobeaddressed.
5 Conclusions
Thispaperexplainshowtoclassifycoughingsoundsofpigs usingHiddenMarkovModels. Focusing onPasteu-rellaandActinobacillus infections,ascomparedtoartifi-cially inducedcoughs (e.g. inducedbydust),we investi-gatedthenecessarydatacleaning,featureextractionandmodel training. The results show that the classificationwithHMMs in combinationwith feature extractionme-
thods from the areaof speech recognitionworks excel-lently. Also, classification times even for such complexcomputationsare satisfactory. Thus, thismethod isdefi-nitelyacceptableforclassifyingpigcoughsusingamoni-toringsoftware.
References
ArbeitsgruppeSchwein(2004)ProgrammzurÜberwachungundBekämpfung
derprogressivenRhinitisatrophicansbeiZuchtschweinen.AmtlVeterinär-AmtlVeterinär-
nachr77(8)8:97-113
ChirlianPM(1994)Signalsandfilters.NewYork:VanNostrandReinhold,397p
FerrariS,SilvaM,GuarinoM,BerckmansD(2008)Analysisofcoughsoundfor
diagnosisofrespiration infections in intensivepigfarming.TransAmSoc
AgricBiolEng51(3):1051-1055
Hermansky H (1990) Preceptual linear predictive (plp) analysis of speech. J
AcoustSocAm87(4):1738-1752
HoyS(1994)ZudenAuswirkungenvonAtemwegserkrankungenaufdieMast-
undFruchtbarkeitsleistungenderSchweine.PraktTierarzt(2):121-127
JahnsG(2008)Callrecognitionto identifycowconditions:acall-recogniser
translatingcallstotext.ComputElectronAgric62(1):54-58
MoreauxB,BeerensD,GustinP(1999)Developmentofacoughinductiontest
inpigs:effectsofSR48968andenalapril.JVetPharmacolTher(22):387-
389MurphyK (2005)HiddenMarkovModel (HMM)toolboxforMatlab [online].
To be found at <http://people.cs.ubc.ca/~murphyk/Software/HMM/hmm.htm>[quoted31.05.2011]
RabinerL(1989)AtutorialonhiddenMarkovmodelsandselectedapplications
inspeechrecognition.ProceedingsIEEE77(2):257-286RabinerL,JuangB-H(1993)Fundamentalsofspeechrecognition.UpperSaddle
RiverNJ:PrenticeHallPTR,507p
SeibtP(2006)Algorithmicinformationtheory:mathematicsofdigitalinforma-
tionprocessing.Berlin:Springer,442pScheidt A (1993)Mycoplasmal pneumonia [online]. To be found at <http://
www.ncsu.edu/project/swine_extension/healthyhogs/book1993/scheidt1.htm>[quoted31.05.2011]
ScheithauerR(2005)SignaleundSysteme:GrundlagenfürdieMess-undRe-
gelungstechnikundNachrichtentechnik.Stuttgart:Teubner,436p
Stearns SD (2003)Digital signalprocessingwithexamples inMATLAB.Boca
Raton:CRCPr,336pWolffD(2008)Detectingbirdsoundsviaperiodicstructures:arobustpattern
recognition approach to unsupervised animalmonitoring [online]. To befound at <http://www-mmdb.iai.uni-bonn.de/download/Diplomarbeiten/Diplomarbeit_Daniel_Wolff.pdf>[quoted01.06.2011]
T. Hinz, T. Winter, F. Zander, S. Linke / Landbauforschung - vTI Agriculture and Forestry Research 3 2011 (61)243-248 243
PM and ammonia in small group keeping – emissions and air quality in a German system for laying hens
TorstenHinz*,TatjanaWinter*,FlorianZander*,andStefanLinke*
* JohannHeinrichvonThünen Institute (vTI), InstituteofAgriculturalTech-nologyandBiosystemsEngineering,Bundesallee50,38116Braunschweig,Germany,[email protected]
Abstract
Cagesfor layersarebannedinGermanysinceJanuary2010. Alternativesmust be found e.g. floor keeping oraviaries. In Germany a new system, the so called smallgroup keeping, is introduced.Groups of 28 to 60 hensareanimalfriendlyhousedwithscrapingarea,separatednestsforlayingandperchesforrestingonaspaceof890cm²foreachbird.Withviewtoairqualityinsideandemis-sionflowsincomparisonwithothersystemssmallgroupkeepinghasadvantagesforthestablesinvestigated.Am-moniaconcentrationisbelow10ppm(7.06mg/m³)andrespirabledustfractionbelow4mg/m³.
Keywords: Laying hens, keeping systems, small group, air quality, emissions, ammonia, PM
Staub und Ammoniak in der Kleingruppenhaltung – Emissionen und Luftgüte bei einem deutschen Hal-tungssystem für Legehennen
Zusammenfassung
Käfige für Legehennen sind seit Januar 2010 ausDeutschland verbannt. Alternativen müssen gefundenwerdenz.B.BodenhaltungoderdieHaltunginVolieren.In Deutschlandwurde die sogenannte Kleingruppenhal-tung eingeführt. Gruppen von 28 bis 60 Hennen lebentierfreundlichmitScharrflächen,separatenNesternzurEi-ablageundSitzstangenaufeinerFlächevon890cm³proHenne.HinsichtlichderLuftgüte imunddenEmissionenausdemStallweistdieKleingruppenhaltungimVergleichmitanderenHaltungssystemenVorteileauf.DieKonzen-trationen von Ammoniak liegen zumeist unterhalb von10ppm,diederalveolgängigenStaubfraktionunterhalbvon4mg/m³.
Schlüsselworte: Legehennen, Haltungssysteme, Kleingrup-pe, Luftgüte, Emissionen, Ammoniak, PM
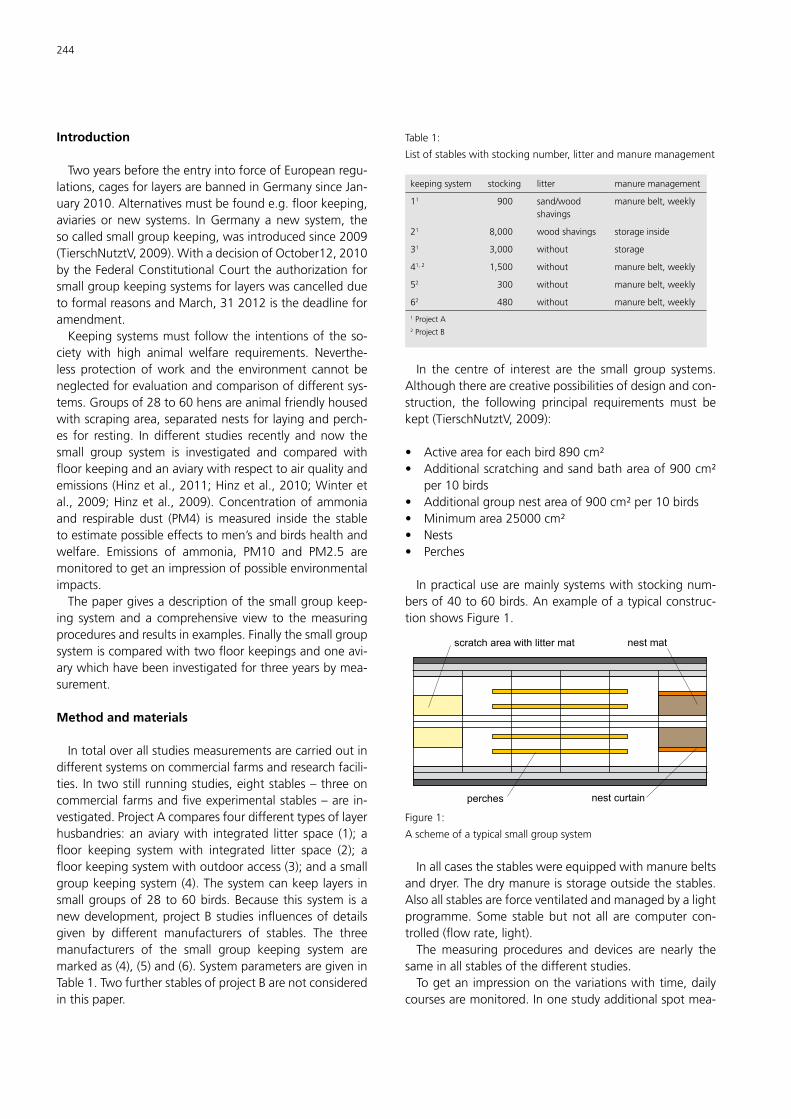
244
Introduction
TwoyearsbeforetheentryintoforceofEuropeanregu-lations,cagesforlayersarebannedinGermanysinceJan-uary2010.Alternativesmustbefounde.g.floorkeeping,aviariesornew systems. InGermanyanew system, thesocalledsmallgroupkeeping,wasintroducedsince2009(TierschNutztV,2009).WithadecisionofOctober12,2010bytheFederalConstitutionalCourttheauthorizationforsmallgroupkeepingsystemsforlayerswascancelledduetoformalreasonsandMarch,312012isthedeadlineforamendment.Keepingsystemsmustfollowthe intentionsoftheso-
ciety with high animal welfare requirements. Neverthe-less protectionofwork and the environment cannotbeneglectedforevaluationandcomparisonofdifferentsys-tems.Groupsof28to60hensareanimalfriendlyhousedwithscrapingarea,separatednestsforlayingandperch-es for resting. In different studies recently and now thesmall group system is investigated and compared withfloorkeepingandanaviarywithrespecttoairqualityandemissions(Hinzetal.,2011;Hinzetal.,2010;Winteretal.,2009;Hinzetal.,2009).Concentrationofammoniaand respirable dust (PM4) ismeasured inside the stabletoestimatepossibleeffectstomen’sandbirdshealthandwelfare. Emissions of ammonia, PM10 and PM2.5 aremonitoredtogetanimpressionofpossibleenvironmentalimpacts.Thepapergivesadescriptionofthesmallgroupkeep-
ing systemanda comprehensive view to themeasuringproceduresandresultsinexamples.Finallythesmallgroupsystemiscomparedwithtwofloorkeepingsandoneavi-arywhichhavebeeninvestigatedforthreeyearsbymea-surement.
Method and materials
Intotaloverallstudiesmeasurementsarecarriedoutindifferentsystemsoncommercialfarmsandresearchfacili-ties. Intwostillrunningstudies,eightstables–threeoncommercialfarmsandfiveexperimentalstables–are in-vestigated.ProjectAcomparesfourdifferenttypesoflayerhusbandries: anaviarywith integrated litter space (1); afloor keeping system with integrated litter space (2); afloorkeepingsystemwithoutdooraccess(3);andasmallgroupkeepingsystem(4).Thesystemcankeeplayersinsmallgroupsof28 to60birds.Because this system isanewdevelopment,projectBstudies influencesofdetailsgiven by different manufacturers of stables. The threemanufacturers of the small group keeping system aremarkedas(4),(5)and(6).SystemparametersaregiveninTable1.TwofurtherstablesofprojectBarenotconsideredinthispaper.
Table1:
Listofstableswithstockingnumber,litterandmanuremanagement
keepingsystem stocking litter manuremanagement
11 900 sand/woodshavings
manurebelt,weekly
21 8,000 woodshavings storageinside
31 3,000 without storage
41,2 1,500 without manurebelt,weekly
52 300 without manurebelt,weekly
62 480 without manurebelt,weekly
1ProjectA2ProjectB
In the centre of interest are the small group systems.Althoughtherearecreativepossibilitiesofdesignandcon-struction, the following principal requirements must bekept(TierschNutztV,2009):
• Activeareaforeachbird890cm²• Additionalscratchingandsandbathareaof900cm²per10birds
• Additionalgroupnestareaof900cm²per10birds• Minimumarea25000cm²• Nests• Perches
Inpracticalusearemainlysystemswithstockingnum-bersof40to60birds.Anexampleofatypicalconstruc-tionshowsFigure1.
scratch area with litter mat
perches nest curtain
nest mat
Figure1:
Aschemeofatypicalsmallgroupsystem
Inallcasesthestableswereequippedwithmanurebeltsanddryer.Thedrymanureisstorageoutsidethestables.Alsoallstablesareforceventilatedandmanagedbyalightprogramme. Some stable but not all are computer con-trolled(flowrate,light).Themeasuring procedures and devices are nearly the
sameinallstablesofthedifferentstudies.Togetanimpressiononthevariationswithtime,daily
coursesaremonitored.Inonestudyadditionalspotmea-
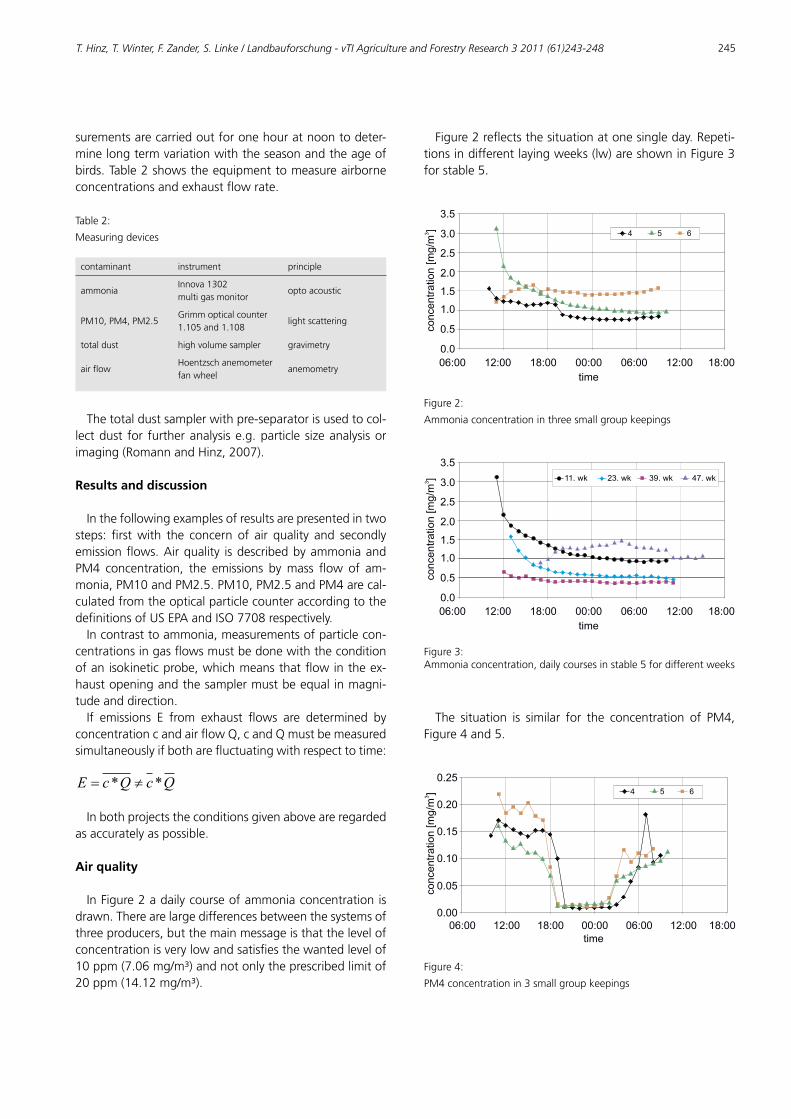
T. Hinz, T. Winter, F. Zander, S. Linke / Landbauforschung - vTI Agriculture and Forestry Research 3 2011 (61)243-248 245
surementsarecarriedoutforonehouratnoontodeter-minelongtermvariationwiththeseasonandtheageofbirds.Table2showstheequipmenttomeasureairborneconcentrationsandexhaustflowrate.
Table2:
Measuringdevices
contaminant instrument principle
ammoniaInnova1302multigasmonitor
optoacoustic
PM10,PM4,PM2.5Grimmopticalcounter1.105and1.108
lightscattering
totaldust highvolumesampler gravimetry
airflowHoentzschanemometerfanwheel
anemometry
Thetotaldustsamplerwithpre-separatorisusedtocol-lectdust for furtheranalysise.g.particle sizeanalysisorimaging(RomannandHinz,2007).
Results and discussion
Inthefollowingexamplesofresultsarepresentedintwosteps: firstwith the concern of air quality and secondlyemissionflows.Airquality isdescribedbyammoniaandPM4 concentration, the emissions bymass flow of am-monia,PM10andPM2.5.PM10,PM2.5andPM4arecal-culatedfromtheopticalparticlecounteraccordingtothedefinitionsofUSEPAandISO7708respectively.Incontrasttoammonia,measurementsofparticlecon-
centrationsingasflowsmustbedonewiththeconditionofanisokineticprobe,whichmeansthatflowintheex-haustopeningandthesamplermustbeequalinmagni-tudeanddirection.If emissions E from exhaust flows are determined by
concentrationcandairflowQ,candQmustbemeasuredsimultaneouslyifbotharefluctuatingwithrespecttotime:
QcQcE ** !"
Inbothprojectstheconditionsgivenaboveareregardedasaccuratelyaspossible.
Air quality
InFigure2adailycourseofammoniaconcentrationisdrawn.Therearelargedifferencesbetweenthesystemsofthreeproducers,butthemainmessageisthatthelevelofconcentrationisverylowandsatisfiesthewantedlevelof10ppm(7.06mg/m³)andnotonlytheprescribedlimitof20ppm(14.12mg/m³).
Figure2reflectsthesituationatonesingleday.Repeti-tionsindifferentlayingweeks(lw)areshowninFigure3forstable5.
0.0
0.5
1.0
1.5
2.0
2.5
3.0
3.5
concentr
ation [m
g/m
]3
06:00 12:00 18:00 00:00 06:00 12:00 18:00
time
4 5 6
Figure2:
Ammoniaconcentrationinthreesmallgroupkeepings
0.0
0.5
1.0
1.5
2.0
2.5
3.0
3.5
concentr
ation [m
g/m
]3
06:00 12:00 18:00 00:00 06:00 12:00 18:00
time
11. wk 23. wk 39. wk 47. wk
Figure3:Ammoniaconcentration,dailycoursesinstable5fordifferentweeks
The situation is similar for the concentration of PM4,Figure4and5.
0.00
0.05
0.10
0.15
0.20
0.25
06:00 12:00 18:00 00:00 06:00 12:00 18:00
time
concentr
ation [m
g/m
]3
4 5 6
Figure4:
PM4concentrationin3smallgroupkeepings
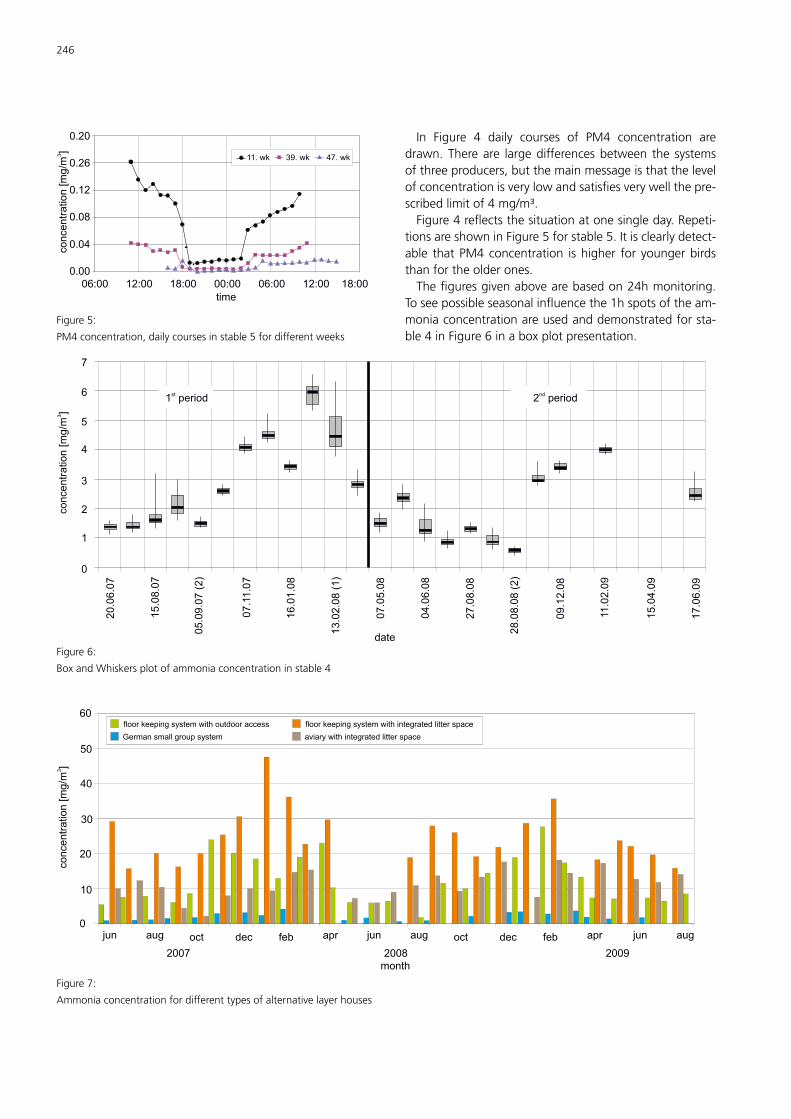
246
In Figure 4 daily courses of PM4 concentration aredrawn.Thereare largedifferencesbetween the systemsofthreeproducers,butthemainmessageisthatthelevelofconcentrationisverylowandsatisfiesverywellthepre-scribedlimitof4mg/m³.Figure4reflectsthesituationatonesingleday.Repeti-
tionsareshowninFigure5forstable5.Itisclearlydetect-able thatPM4concentration ishigher for youngerbirdsthanfortheolderones.Thefiguresgivenabovearebasedon24hmonitoring.
Toseepossibleseasonalinfluencethe1hspotsoftheam-moniaconcentrationareusedanddemonstratedforsta-ble4inFigure6inaboxplotpresentation.
0.00
0.04
0.08
0.12
0.26
0.20
06:00 12:00 18:00 00:00 06:00 12:00 18:00
time
concentr
ation [m
g/m
]3
11. wk 39. wk 47. wk
Figure5:
PM4concentration,dailycoursesinstable5fordifferentweeks
0
2
3
4
5
6
7
concentr
ation [m
g/m
]3
date
20.0
6.0
7
15.0
8.0
7
05.0
9.0
7 (
2)
07.1
1.0
7
16.0
1.0
8
13.0
2.0
8 (
1)
07.0
5.0
8
04.0
6.0
8
27.0
8.0
8
28
.08
.08
(2
)
09.1
2.0
8
11.0
2.0
9
15.0
4.0
9
17.0
6.0
9
1 periodst
2 periodnd
1
Figure6:
BoxandWhiskersplotofammoniaconcentrationinstable4
60
concentr
ation [m
g/m
]3
50
40
30
20
10
0
2007 2008
month
2009
jun jun junaug aug augoct octdec decfeb febapr apr
floor keeping system with outdoor access
German small group system
floor keeping system with integrated litter space
aviary with integrated litter space
Figure7:
Ammoniaconcentrationfordifferenttypesofalternativelayerhouses
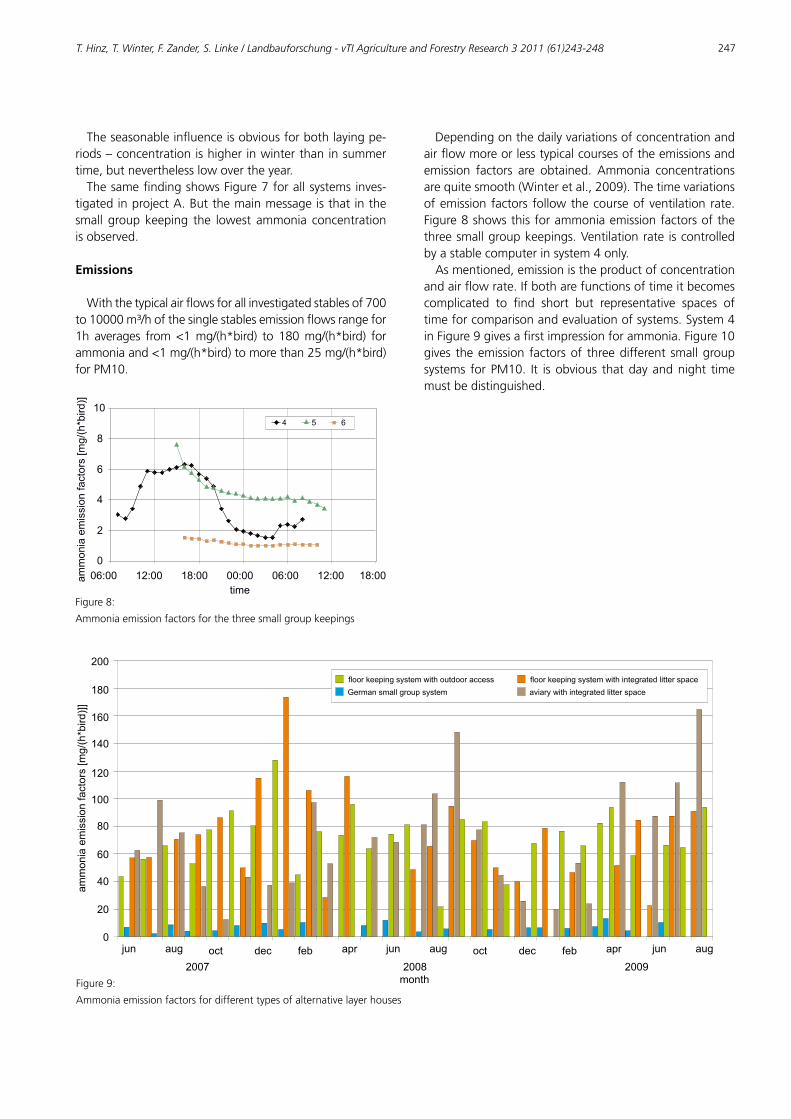
T. Hinz, T. Winter, F. Zander, S. Linke / Landbauforschung - vTI Agriculture and Forestry Research 3 2011 (61)243-248 247
Theseasonableinfluenceisobviousforbothlayingpe-riods–concentrationishigherinwinterthaninsummertime,butneverthelesslowovertheyear.ThesamefindingshowsFigure7forallsystemsinves-
tigatedinprojectA.Butthemainmessageisthatinthesmall groupkeeping the lowest ammonia concentrationisobserved.
Emissions
Withthetypicalairflowsforallinvestigatedstablesof700to10000m³/hofthesinglestablesemissionflowsrangefor1h averages from<1mg/(h*bird) to 180mg/(h*bird) forammoniaand<1mg/(h*bird)tomorethan25mg/(h*bird)forPM10.
am
monia
em
issio
n facto
rs [m
g/(
h*b
ird)]
06:00 12:00 18:00 00:00 06:00 12:00 18:00
time
4 5 6
0
2
4
6
8
10
Figure8:
Ammoniaemissionfactorsforthethreesmallgroupkeepings
60
140
am
monia
em
issio
n facto
rs [m
g/(
h*b
ird)]
]
100
180
40
120
200
20
80
160
0
2007 2008
month
2009
jun jun junaug aug augoct octdec decfeb febapr apr
floor keeping system with outdoor access
German small group system
floor keeping system with integrated litter space
aviary with integrated litter space
Figure9:
Ammoniaemissionfactorsfordifferenttypesofalternativelayerhouses
Dependingonthedailyvariationsofconcentrationandairflowmoreorlesstypicalcoursesoftheemissionsandemission factors are obtained. Ammonia concentrationsarequitesmooth(Winteretal.,2009).Thetimevariationsofemissionfactors followthecourseofventilationrate.Figure8showsthisforammoniaemissionfactorsofthethreesmallgroupkeepings.Ventilationrateiscontrolledbyastablecomputerinsystem4only.Asmentioned,emissionistheproductofconcentration
andairflowrate.Ifbotharefunctionsoftimeitbecomescomplicated to find short but representative spaces oftimeforcomparisonandevaluationofsystems.System4inFigure9givesafirstimpressionforammonia.Figure10gives theemission factorsof threedifferent smallgroupsystems forPM10. It isobvious thatdayandnight timemustbedistinguished.
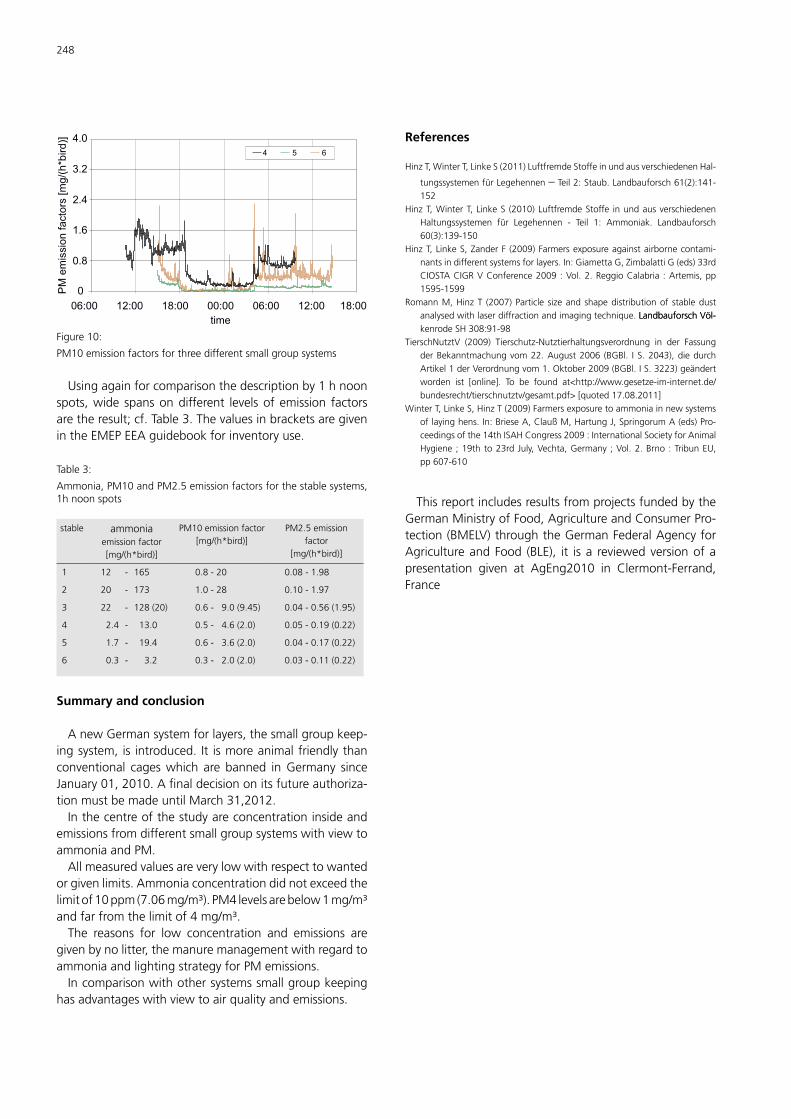
248P
M e
mis
sio
n facto
rs [m
g/(
h*b
ird)]
06:00 12:00 18:00 00:00 06:00 12:00 18:00
time
4 5 6
0
0.8
1.6
2.4
3.2
4.0
Figure10:
PM10emissionfactorsforthreedifferentsmallgroupsystems
Usingagainforcomparisonthedescriptionby1hnoonspots,wide spansondifferent levelsofemission factorsaretheresult;cf.Table3.ThevaluesinbracketsaregivenintheEMEPEEAguidebookforinventoryuse.
Table3:
Ammonia,PM10andPM2.5emissionfactorsforthestablesystems,1hnoonspots
stable ammoniaemissionfactor[mg/(h*bird)]
PM10emissionfactor[mg/(h*bird)]
PM2.5emissionfactor
[mg/(h*bird)]
1 12.0 - 165 0.8 - 20 0.08 - 1.98
2 20.0 - 173 1.0 - 28 0.10 - 1.97
3 22.0 - 128(20) 0.6 - 29.0(9.45) 0.04 - 0.56(1.95)
4 2.4 - 113.0 0.5 - 24.6(2.0) 0.05 - 0.19(0.22)
5 1.7 - 119.4 0.6 - 23.6(2.0) 0.04 - 0.17(0.22)
6 0.3 - 113.2 0.3- 22.0(2.0) 0.03 - 0.11(0.22)
Summary and conclusion
AnewGermansystemforlayers,thesmallgroupkeep-ingsystem, is introduced. It ismoreanimalfriendlythanconventional cageswhich are banned inGermany sinceJanuary01,2010.Afinaldecisiononitsfutureauthoriza-tionmustbemadeuntilMarch31,2012.Inthecentreofthestudyareconcentrationinsideand
emissionsfromdifferentsmallgroupsystemswithviewtoammoniaandPM.Allmeasuredvaluesareverylowwithrespecttowanted
orgivenlimits.Ammoniaconcentrationdidnotexceedthelimitof10ppm(7.06mg/m³).PM4levelsarebelow1mg/m³andfarfromthelimitof4mg/m³.The reasons for low concentration and emissions are
givenbynolitter,themanuremanagementwithregardtoammoniaandlightingstrategyforPMemissions.Incomparisonwithothersystemssmallgroupkeeping
hasadvantageswithviewtoairqualityandemissions.
References
HinzT,WinterT,LinkeS(2011)LuftfremdeStoffeinundausverschiedenenHal-
tungssystemenfürLegehennen–Teil2:Staub.Landbauforsch61(2):141-152
HinzT,WinterT,LinkeS (2010)LuftfremdeStoffe inundausverschiedenenHaltungssystemen für Legehennen - Teil 1: Ammoniak. Landbauforsch60(3):139-150
HinzT,LinkeS,ZanderF (2009)Farmersexposureagainstairbornecontami-nantsindifferentsystemsforlayers.In:GiamettaG,ZimbalattiG(eds)33rdCIOSTACIGRVConference2009:Vol.2.ReggioCalabria :Artemis,pp1595-1599
RomannM,HinzT (2007)Particle sizeandshapedistributionof stabledustanalysedwithlaserdiffractionandimagingtechnique.LandbauforschVöl-LandbauforschVöl-kenrodeSH308:91-98
TierschNutztV (2009) Tierschutz-Nutztierhaltungsverordnung in der FassungderBekanntmachungvom22.August2006 (BGBl. IS.2043),diedurchArtikel1derVerordnungvom1.Oktober2009(BGBl.IS.3223)geändertworden ist [online]. To be found at<http://www.gesetze-im-internet.de/bundesrecht/tierschnutztv/gesamt.pdf>[quoted17.08.2011]
WinterT,LinkeS,HinzT(2009)Farmersexposuretoammoniainnewsystemsoflayinghens.In:BrieseA,ClaußM,HartungJ,SpringorumA(eds)Pro-ceedingsofthe14thISAHCongress2009:InternationalSocietyforAnimalHygiene ;19thto23rdJuly,Vechta,Germany ;Vol.2.Brno:TribunEU,pp607-610
ThisreportincludesresultsfromprojectsfundedbytheGermanMinistryofFood,AgricultureandConsumerPro-tection(BMELV)throughtheGermanFederalAgencyforAgricultureandFood (BLE), it is a reviewedversionofapresentation given at AgEng2010 in Clermont-Ferrand,France
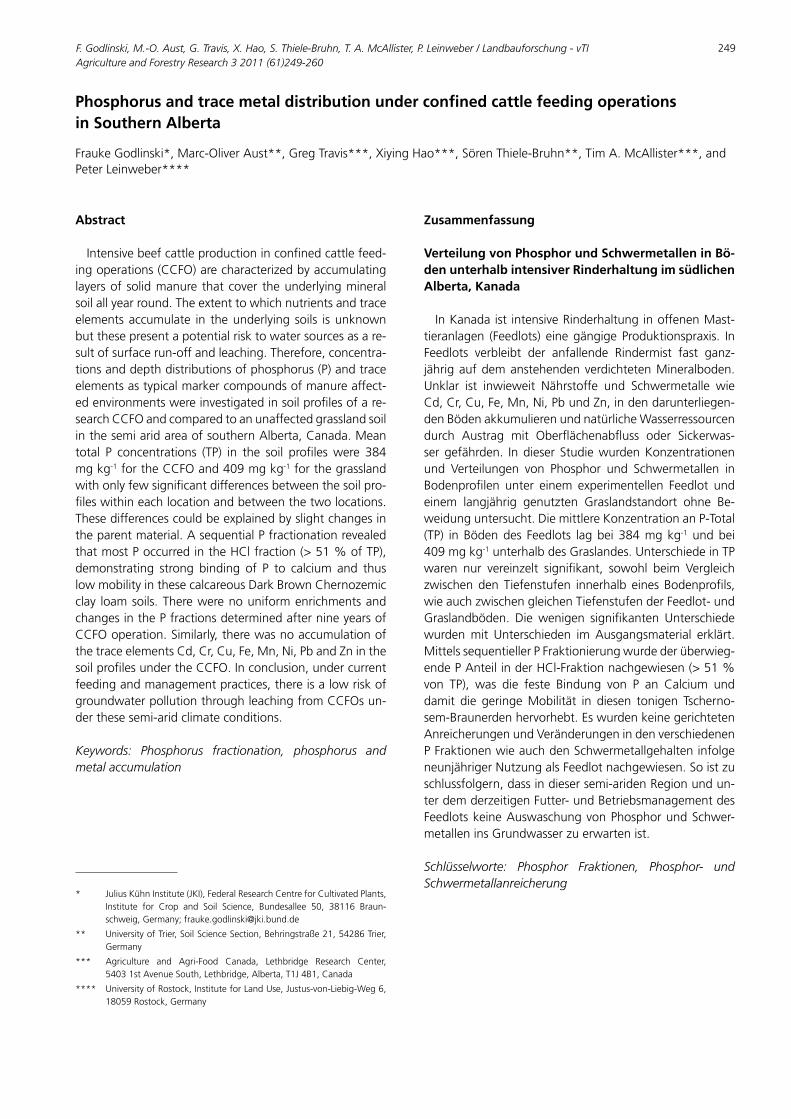
F. Godlinski, M.-O. Aust, G. Travis, X. Hao, S. Thiele-Bruhn, T. A. McAllister, P. Leinweber / Landbauforschung - vTI Agriculture and Forestry Research 3 2011 (61)249-260
249
Phosphorus and trace metal distribution under confined cattle feeding operations in Southern Alberta
FraukeGodlinski*,Marc-OliverAust**,GregTravis***,XiyingHao***,SörenThiele-Bruhn**,TimA.McAllister***,andPeterLeinweber****
** JuliusKühnInstitute(JKI),FederalResearchCentreforCultivatedPlants, Institute for Crop and Soil Science, Bundesallee 50, 38116 Braun- schweig,Germany;[email protected]
** UniversityofTrier,SoilScienceSection,Behringstraße21,54286Trier, Germany
*** Agriculture and Agri-Food Canada, Lethbridge Research Center, 54031stAvenueSouth,Lethbridge,Alberta,T1J4B1,Canada
**** UniversityofRostock,InstituteforLandUse,Justus-von-Liebig-Weg6, 18059Rostock,Germany
Abstract
Intensivebeefcattleproductioninconfinedcattlefeed-ingoperations(CCFO)arecharacterizedbyaccumulatinglayersofsolidmanure thatcover theunderlyingmineralsoilallyearround.Theextenttowhichnutrientsandtraceelementsaccumulate in theunderlying soils isunknownbutthesepresentapotentialrisktowatersourcesasare-sultofsurfacerun-offandleaching.Therefore,concentra-tionsanddepthdistributionsofphosphorus(P)andtraceelementsastypicalmarkercompoundsofmanureaffect-edenvironmentswereinvestigatedinsoilprofilesofare-searchCCFOandcomparedtoanunaffectedgrasslandsoilinthesemiaridareaofsouthernAlberta,Canada.Meantotal P concentrations (TP) in the soil profileswere 384mgkg-1fortheCCFOand409mgkg-1forthegrasslandwithonlyfewsignificantdifferencesbetweenthesoilpro-fileswithineachlocationandbetweenthetwolocations.Thesedifferencescouldbeexplainedbyslightchangesintheparentmaterial.AsequentialPfractionationrevealedthatmostPoccurredintheHClfraction(>51%ofTP),demonstrating strong binding of P to calcium and thuslowmobilityinthesecalcareousDarkBrownChernozemicclay loamsoils.TherewerenouniformenrichmentsandchangesinthePfractionsdeterminedafternineyearsofCCFOoperation.Similarly,therewasnoaccumulationofthetraceelementsCd,Cr,Cu,Fe,Mn,Ni,PbandZninthesoilprofilesundertheCCFO.Inconclusion,undercurrentfeedingandmanagementpractices,thereisalowriskofgroundwaterpollutionthroughleachingfromCCFOsun-derthesesemi-aridclimateconditions.
Keywords: Phosphorus fractionation, phosphorus and metal accumulation
Zusammenfassung
Verteilung von Phosphor und Schwermetallen in Bö-den unterhalb intensiver Rinderhaltung im südlichen Alberta, Kanada
InKanadaist intensiveRinderhaltunginoffenenMast-tieranlagen (Feedlots) einegängigeProduktionspraxis. InFeedlots verbleibt der anfallende Rindermist fast ganz-jährigaufdemanstehendenverdichtetenMineralboden.Unklar ist inwieweit Nährstoffe und Schwermetalle wieCd,Cr,Cu,Fe,Mn,Ni,PbundZn,indendarunterliegen-denBödenakkumulierenundnatürlicheWasserressourcendurch Austrag mit Oberflächenabfluss oder Sickerwas-sergefährden. Indieser StudiewurdenKonzentrationenund Verteilungen von Phosphor und Schwermetallen inBodenprofilen unter einem experimentellen Feedlot undeinem langjährig genutzten Graslandstandort ohne Be-weidunguntersucht.DiemittlereKonzentrationanP-Total(TP) inBödendes Feedlots lagbei384mgkg-1 undbei409mgkg-1unterhalbdesGraslandes.UnterschiedeinTPwaren nur vereinzelt signifikant, sowohl beim VergleichzwischendenTiefenstufen innerhalb einesBodenprofils,wieauchzwischengleichenTiefenstufenderFeedlot-undGraslandböden. Diewenigen signifikanten Unterschiedewurdenmit Unterschieden imAusgangsmaterial erklärt.MittelssequentiellerPFraktionierungwurdederüberwieg-endePAnteilinderHCl-Fraktionnachgewiesen(>51%von TP), was die feste Bindung von P an Calcium unddamit die geringeMobilität in diesen tonigen Tscherno-sem-Braunerdenhervorhebt.EswurdenkeinegerichtetenAnreicherungenundVeränderungenindenverschiedenenPFraktionenwieauchdenSchwermetallgehalteninfolgeneunjährigerNutzungalsFeedlotnachgewiesen.Soistzuschlussfolgern,dassindiesersemi-aridenRegionundun-terdemderzeitigenFutter-undBetriebsmanagementdesFeedlotskeineAuswaschungvonPhosphorundSchwer-metalleninsGrundwasserzuerwartenist.
Schlüsselworte: Phosphor Fraktionen, Phosphor- und Schwermetallanreicherung
250
Introduction
Confinedcattlefeedingoperations(CCFOs)areacom-mon practice for beef production in Canada with thehighest density occurring in southern Alberta. The con-struction andmanagementof theseCCFOs is regulatedbytheAlbertaAgriculturalOperationPracticesActguide-lines.Modernoperationsaresitedandmanagedaccord-ingtotheseguidelinesaimingtoprotecttheenvironmentbyminimizingadverse impactsonthesurrounding land-scapes andwatersheds (Olsen et al., 2005). The typicalCCFOsstructureincludesthenaturalsubsoilasthebase,fromwhichthetopsoilwasremoved intheconstructionphase.Duringoperationthesubsoil ismostlycoveredbyablacklayerofmixedorganicandmineralsoilthatformsinpensthroughcattleactivity.Thisblacklayeriscoveredbymanurewhichreachesupto60cm(Dantzmanetal.,1983).Themanure layercanbean important sourceofnutrientleachingandrunoff(Milleretal.,2006;Olsenetal.,2005).Inadditionitsphysicalpropertiesinfluencenu-trienttransportbyabsorbingupto25mmofanyprecipi-tationbeforerunoffoccurs(Milleretal.,2008).Previous studies focusing on the transport of nutrients,
especiallynitrate(NO3-)andphosphorus(P) (Schumanand
McCalla,1975),tothegroundwaterundersuchoperationsrevealedcontradictingresults.Although increasedconcen-trationsofNO3
-andsaltsinthesoilprofilesbeneathCCFOswerefound(CooteandHore,1979;Mielkeetal.,1974),theriskofelevatedPconcentrationsinthesoilswaslow(Camp-bellandRacz,1975;CooteandHore,1979).Studiesinves-tigatingthenutrientenrichmentunderCCFOsbuiltonloamsoils tended to revealonlyminimal leachingofNO3
- fromCCFO’soperatingforlessthan40yearsandnoleachingofPoperatingforupto100years(Vaillantetal.,2009;Zhuetal.,2004).Bycontrast,studiesexamininggroundwaterusu-allydetectedsomenutrientenrichmentunderCCFOs(Milleretal.,2004).Astudyoffive25-to35-yearoldCCFOs incentral Saskatchewan focusing on nutrient concentrationgroundwatershowedthat50to67%ofthegroundwatersampleshadelevatedsoluteconcentrationsduetotheac-cumulationofmanure(MauléandFonstad,2000,2002).Solute transport from the manure was attributed to
bothmatrixflowandpreferentialflowandcontaminatedshallowgroundwater 20moutside theCCFO (Miller etal.,2004).Also,inathreeyearoperatedCCFOthePcon-centrations inpenwells increased,whereassoilanalysesindicatedavailablePaccumulationsonlydownto0.15msoil depth,whichmay simply be a result ofmechanicalmixingbycattle(Olsonetal.,2005).Thesediscrepanciesbetweenthesoilandgroundwaterdatamaybetheresultofpossiblepreferentialflowinthesoil(Olsonetal.,2005).Forpredictingthemobility,bioavailabilityandpotential
ofPtransferknowledgeofthePdistributionandavailabil-
ityinsoilsbeneathmanurewithhighPconcentrationises-sential.AsequentialfractionationallowsaclassificationofthePinthesoilinpoolswithvaryingavailabilityforplants,leaching and the resulting environmental consequences(ThiessenandMoir,1993;NegassaandLeinweber,2009).ThisprocedureseparatesPintoplant-available(H2O-andNaHCO3-extractable;soiltestP(STP)),Al-andFe-hydroxideand oxide-associated (NaOH-extractable) and Ca-bound(HCl-extractable)forms(Hedleyetal.,1982).Researchhasshownthathighapplicationratesofcattlemanureonsur-roundingfieldscancauseanaccumulationandchangeofPdistributioninsoil (Haoetal.,2008)andmayincreaseconcentrations of P in surface runoff and groundwater.ThisraisesthequestionwhetherCCFOswithyearroundmanure accumulation leads to changes in P fractions inthesoil.Besides organic matter, manure also contains major
plantnutrientsandtraceelements,suchascadmium(Cd),chromium(Cr),copper (Cu), iron (Fe), lead (Pb),manga-nese (Mn),nickel (Ni),andzinc (Zn).With theexceptionofPb,CdandCr,traceelementsmaybeaddedasanimalfeedsupplementstothecattlediet, inordertopromotephysiologicalprocessesandmaintainanimalhealth(Nich-olson et al., 1999).Consequently, long-term applicationof such enriched manure to agriculture land increasedtheconcentrationofthesemetalsinthesoil(Benkeetal.,2008;ThieleandLeinweber,2001).ThismayalsobethecaseforsoilsbelowCCFOsthemselvesastheseareincon-tactwith trace elements-enrichedmanure for long timeperiods.Dependingmainlyontheelementssolubility,soilpHandbindingcapacity(Hesterberg,1998)metalsmaybetransportedbyleaching(LiandShuman,1997)orrunoff(Mooreetal.,1998)towaterresources.Leachingoftracemetalsmostlyoccuredinacidicandcoarsetexturedsoils(McBride,1995),underneutraltoalkalinesoilconditionsleaching is related tometal complexationwithdissolvedorganicmatter and preferential flow (Maeda and Berg-strom,2000;McBrideetal.,1997).Whereasthetransportofnutrientsmayresultinvisiblesignsofeutrophicationofwaterresources,theaccumulationandtransportoftraceelements from soils beneath CCFOs and their possibleenrichment in the food chain is relatively unknownandthereforeshouldbetakenintoconsiderationwhenassess-ingtheimpactofCCFOsontheenvironment.Therefore,inthisstudywedeterminedthePandtrace
element concentration and the P distribution inmanureandasoilofaCanadianresearchfeedingoperationandasacontrolinthesubsoilofanaturalgrassland.Wetestedthe hypothesis that after nine years of operation P andtracemetalsweretranslocatedandaccumulateinthesoilunderneaththemanureandthatthisresultedinachangeofPformsandthereforePavailabilityevenindeepersoillayers.
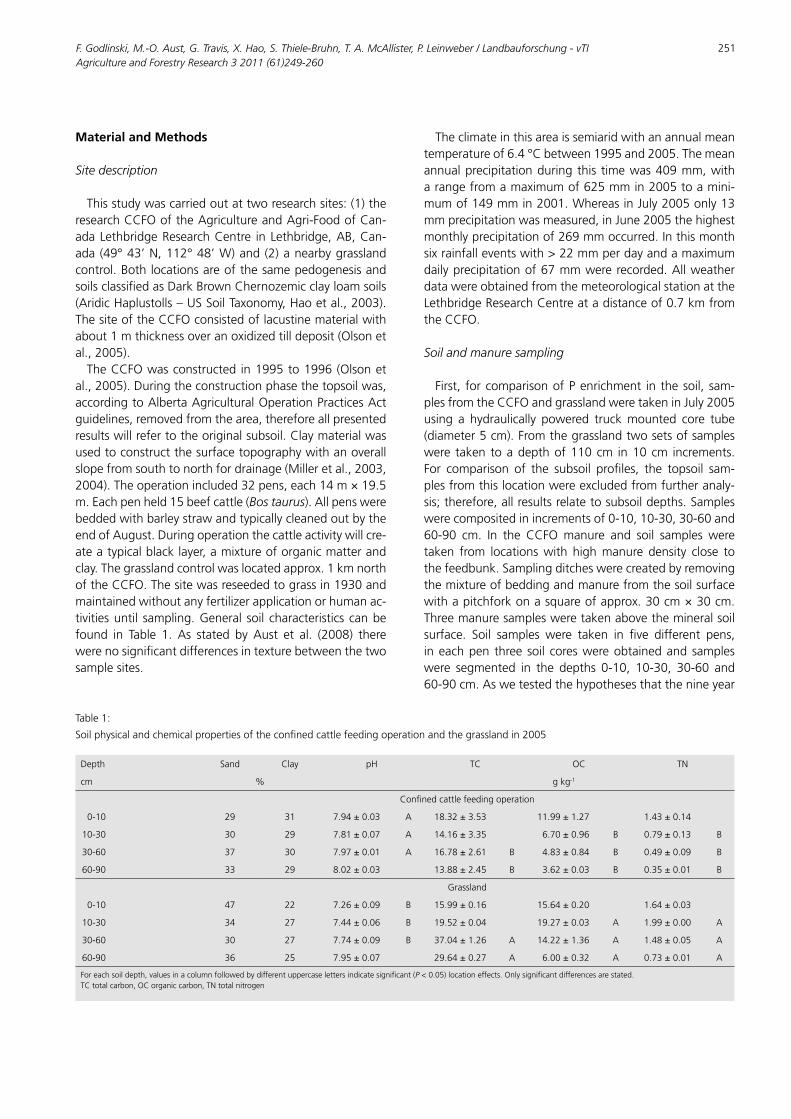
F. Godlinski, M.-O. Aust, G. Travis, X. Hao, S. Thiele-Bruhn, T. A. McAllister, P. Leinweber / Landbauforschung - vTI Agriculture and Forestry Research 3 2011 (61)249-260
251
Material and Methods
Site description
Thisstudywascarriedoutattworesearchsites:(1)theresearchCCFOoftheAgricultureandAgri-FoodofCan-adaLethbridgeResearchCentre inLethbridge,AB,Can-ada(49°43’N,112°48’W)and(2)anearbygrasslandcontrol.BothlocationsareofthesamepedogenesisandsoilsclassifiedasDarkBrownChernozemicclayloamsoils(AridicHaplustolls–USSoilTaxonomy,Haoetal.,2003).ThesiteoftheCCFOconsistedoflacustinematerialwithabout1mthicknessoveranoxidizedtilldeposit(Olsonetal.,2005).TheCCFOwasconstructed in1995to1996(Olsonet
al.,2005).Duringtheconstructionphasethetopsoilwas,accordingtoAlbertaAgriculturalOperationPracticesActguidelines,removedfromthearea,thereforeallpresentedresultswillrefertotheoriginalsubsoil.Claymaterialwasusedtoconstructthesurfacetopographywithanoverallslopefromsouthtonorthfordrainage(Milleretal.,2003,2004).Theoperationincluded32pens,each14m×19.5m.Eachpenheld15beefcattle(Bos taurus).AllpenswerebeddedwithbarleystrawandtypicallycleanedoutbytheendofAugust.Duringoperationthecattleactivitywillcre-ateatypicalblacklayer,amixtureoforganicmatterandclay.Thegrasslandcontrolwaslocatedapprox.1kmnorthoftheCCFO.Thesitewasreseededtograssin1930andmaintainedwithoutanyfertilizerapplicationorhumanac-tivitiesuntil sampling.General soil characteristicscanbefound in Table 1. As stated by Aust et al. (2008) therewerenosignificantdifferencesintexturebetweenthetwosamplesites.
Table1:
Soilphysicalandchemicalpropertiesoftheconfinedcattlefeedingoperationandthegrasslandin2005
Depth Sand Clay pH TC OC TN
cm % gkg-1
Confinedcattlefeedingoperation
0-10 29 31 7.94±0.03 A 18.32±3.53 11.99±1.27 1.43±0.14
10-30 30 29 7.81±0.07 A 14.16±3.35 6.70±0.96 B 0.79±0.13 B
30-60 37 30 7.97±0.01 A 16.78±2.61 B 4.83±0.84 B 0.49±0.09 B
60-90 33 29 8.02±0.03 13.88±2.45 B 3.62±0.03 B 0.35±0.01 B
Grassland
0-10 47 22 7.26±0.09 B 15.99±0.16 15.64±0.20 1.64±0.03
10-30 34 27 7.44±0.06 B 19.52±0.04 19.27±0.03 A 1.99±0.00 A
30-60 30 27 7.74±0.09 B 37.04±1.26 A 14.22±1.36 A 1.48±0.05 A
60-90 36 25 7.95±0.07 29.64±0.27 A 6.00±0.32 A 0.73±0.01 A
Foreachsoildepth,valuesinacolumnfollowedbydifferentuppercaselettersindicatesignificant(P<0.05)locationeffects.Onlysignificantdifferencesarestated.TCtotalcarbon,OCorganiccarbon,TNtotalnitrogen
Theclimateinthisareaissemiaridwithanannualmeantemperatureof6.4°Cbetween1995and2005.Themeanannualprecipitationduringthis timewas409mm,witharangefromamaximumof625mmin2005toamini-mumof149mmin2001.WhereasinJuly2005only13mmprecipitationwasmeasured,inJune2005thehighestmonthlyprecipitationof269mmoccurred.Inthismonthsixrainfalleventswith>22mmperdayandamaximumdailyprecipitationof67mmwererecorded.AllweatherdatawereobtainedfromthemeteorologicalstationattheLethbridgeResearchCentreatadistanceof0.7kmfromtheCCFO.
Soil and manure sampling
First, forcomparisonofPenrichment in thesoil, sam-plesfromtheCCFOandgrasslandweretakeninJuly2005using a hydraulically powered truckmounted core tube(diameter5cm).Fromthegrasslandtwosetsofsampleswere taken toadepthof110cm in10cm increments.For comparison of the subsoil profiles, the topsoil sam-plesfromthislocationwereexcludedfromfurtheranaly-sis;therefore,allresultsrelatetosubsoildepths.Sampleswerecompositedinincrementsof0-10,10-30,30-60and60-90 cm. In the CCFOmanure and soil samples weretaken from locationswith highmanure density close tothefeedbunk.Samplingditcheswerecreatedbyremovingthemixtureofbeddingandmanurefromthesoilsurfacewithapitchforkonasquareofapprox.30cm×30cm.Threemanuresamplesweretakenabovethemineralsoilsurface. Soil samples were taken in five different pens,ineachpen three soil coreswereobtainedandsampleswere segmented in the depths 0-10, 10-30, 30-60 and60-90cm.Aswetestedthehypothesesthatthenineyear
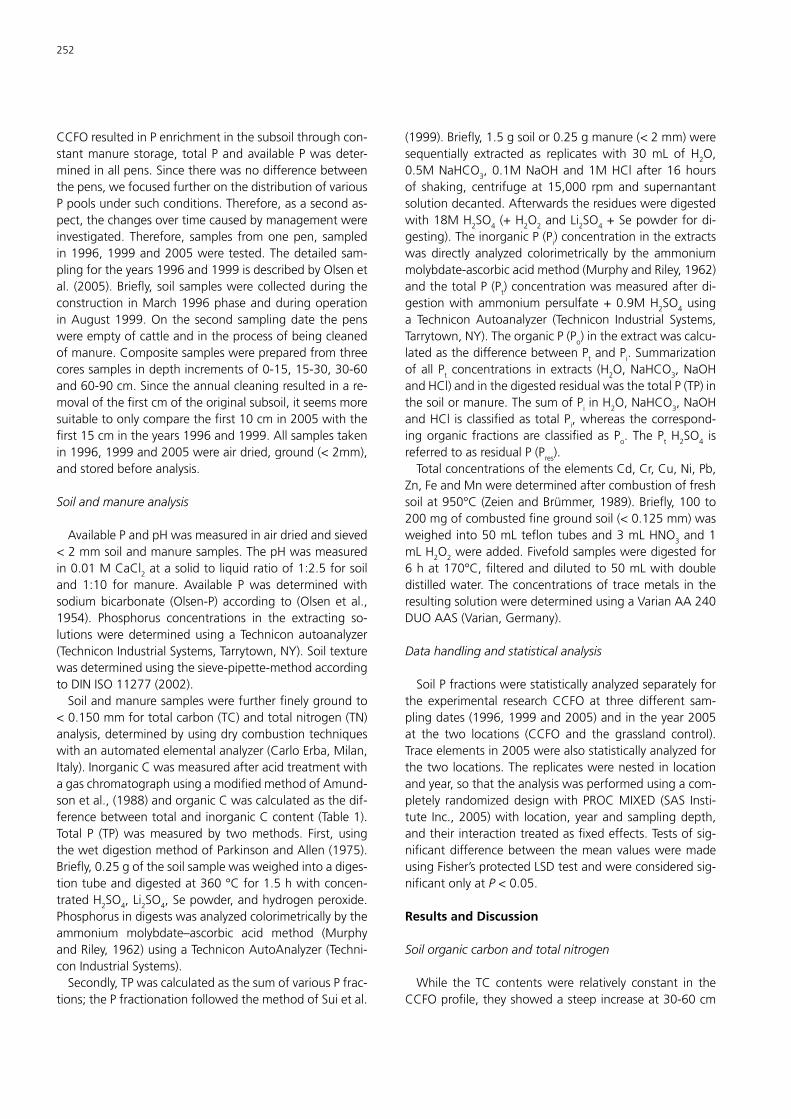
252
CCFOresultedinPenrichmentinthesubsoilthroughcon-stantmanurestorage, totalPandavailablePwasdeter-minedinallpens.Sincetherewasnodifferencebetweenthepens,wefocusedfurtheronthedistributionofvariousPpoolsundersuchconditions.Therefore,asasecondas-pect,thechangesovertimecausedbymanagementwereinvestigated.Therefore, samples fromonepen, sampledin1996,1999and2005weretested.Thedetailedsam-plingfortheyears1996and1999isdescribedbyOlsenetal. (2005).Briefly,soilsampleswerecollectedduringtheconstruction inMarch1996phaseandduringoperationinAugust1999.Onthesecondsamplingdate thepenswereemptyofcattleandintheprocessofbeingcleanedofmanure.Compositesampleswerepreparedfromthreecoressamplesindepthincrementsof0-15,15-30,30-60and60-90cm.Sincetheannualcleaningresultedinare-movalofthefirstcmoftheoriginalsubsoil,itseemsmoresuitabletoonlycomparethefirst10cmin2005withthefirst15cmintheyears1996and1999.Allsamplestakenin1996,1999and2005wereairdried,ground(<2mm),andstoredbeforeanalysis.
Soil and manure analysis
AvailablePandpHwasmeasuredinairdriedandsieved< 2mmsoilandmanuresamples.ThepHwasmeasuredin0.01MCaCl2atasolidtoliquidratioof1:2.5forsoiland 1:10 formanure. Available Pwas determinedwithsodiumbicarbonate (Olsen-P) according to (Olsenet al.,1954). Phosphorus concentrations in the extracting so-lutionsweredeterminedusingaTechniconautoanalyzer(TechniconIndustrialSystems,Tarrytown,NY).Soiltexturewasdeterminedusingthesieve-pipette-methodaccordingtoDINISO11277(2002).Soilandmanuresampleswerefurtherfinelygroundto
<0.150mmfortotalcarbon(TC)andtotalnitrogen(TN)analysis,determinedbyusingdrycombustiontechniqueswithanautomatedelementalanalyzer(CarloErba,Milan,Italy).InorganicCwasmeasuredafteracidtreatmentwithagaschromatographusingamodifiedmethodofAmund-sonetal.,(1988)andorganicCwascalculatedasthedif-ferencebetweentotalandinorganicCcontent(Table1).Total P (TP)wasmeasured by twomethods. First, usingthewetdigestionmethodofParkinsonandAllen(1975).Briefly,0.25gofthesoilsamplewasweighedintoadiges-tiontubeanddigestedat360°Cfor1.5hwithconcen-tratedH2SO4,Li2SO4,Sepowder,andhydrogenperoxide.Phosphorusindigestswasanalyzedcolorimetricallybytheammonium molybdate–ascorbic acid method (MurphyandRiley,1962)usingaTechniconAutoAnalyzer(Techni-conIndustrialSystems).Secondly,TPwascalculatedasthesumofvariousPfrac-
tions;thePfractionationfollowedthemethodofSuietal.
(1999).Briefly,1.5gsoilor0.25gmanure(< 2mm)weresequentially extracted as replicates with 30mL of H2O,0.5MNaHCO3,0.1MNaOHand1MHClafter16hoursof shaking, centrifuge at 15,000 rpmand supernantantsolutiondecanted.Afterwardstheresiduesweredigestedwith18MH2SO4(+H2O2andLi2SO4+Sepowderfordi-gesting).TheinorganicP(Pi)concentrationintheextractswas directly analyzed colorimetrically by the ammoniummolybdate-ascorbicacidmethod(MurphyandRiley,1962)andthetotalP(Pt)concentrationwasmeasuredafterdi-gestionwithammoniumpersulfate+0.9MH2SO4usinga Technicon Autoanalyzer (Technicon Industrial Systems,Tarrytown,NY).TheorganicP(Po)intheextractwascalcu-latedasthedifferencebetweenPtandPi.SummarizationofallPt concentrations inextracts (H2O,NaHCO3,NaOHandHCl)andinthedigestedresidualwasthetotalP(TP)inthesoilormanure.ThesumofPiinH2O,NaHCO3,NaOHandHCl isclassifiedastotalPi,whereasthecorrespond-ingorganic fractionsareclassifiedasPo.ThePtH2SO4 isreferredtoasresidualP(Pres).TotalconcentrationsoftheelementsCd,Cr,Cu,Ni,Pb,
Zn,FeandMnweredeterminedaftercombustionoffreshsoilat950°C(ZeienandBrümmer,1989).Briefly,100to200mgofcombustedfinegroundsoil(<0.125mm)wasweighedinto50mLteflontubesand3mLHNO3and1mLH2O2wereadded.Fivefoldsamplesweredigestedfor6hat170°C,filteredanddilutedto50mLwithdoubledistilledwater.Theconcentrationsoftracemetals intheresultingsolutionweredeterminedusingaVarianAA240DUOAAS(Varian,Germany).
Data handling and statistical analysis
SoilPfractionswerestatisticallyanalyzedseparatelyforthe experimental researchCCFO at three different sam-plingdates(1996,1999and2005)andintheyear2005at the two locations (CCFO and the grassland control).Traceelementsin2005werealsostatisticallyanalyzedforthetwolocations.Thereplicateswerenestedinlocationandyear,sothattheanalysiswasperformedusingacom-pletely randomizeddesignwithPROCMIXED (SAS Insti-tute Inc.,2005)with location,yearandsamplingdepth,andtheirinteractiontreatedasfixedeffects.Testsofsig-nificantdifferencebetweenthemeanvaluesweremadeusingFisher’sprotectedLSDtestandwereconsideredsig-nificantonlyatP <0.05.
Results and Discussion
Soil organic carbon and total nitrogen
While the TC contentswere relatively constant in theCCFOprofile,theyshowedasteepincreaseat30-60cm
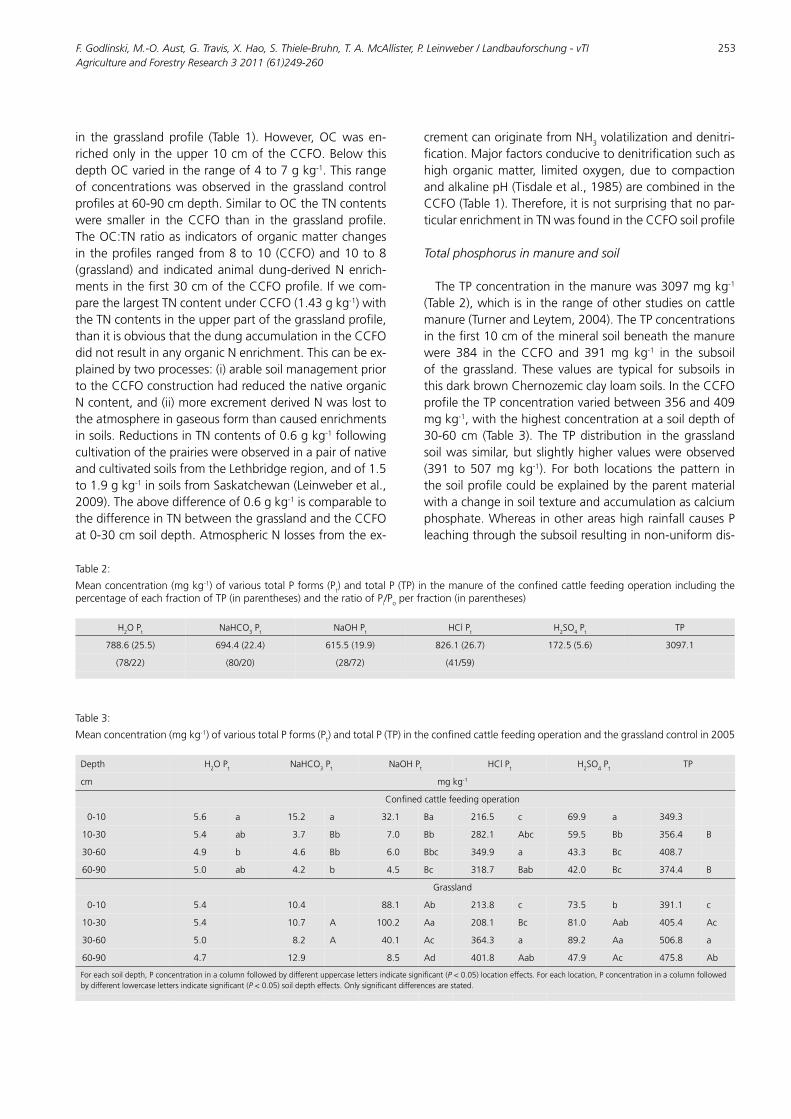
F. Godlinski, M.-O. Aust, G. Travis, X. Hao, S. Thiele-Bruhn, T. A. McAllister, P. Leinweber / Landbauforschung - vTI Agriculture and Forestry Research 3 2011 (61)249-260
253
in the grasslandprofile (Table 1).However,OCwas en-richedonly intheupper10cmoftheCCFO.BelowthisdepthOCvariedintherangeof4to7gkg-1.Thisrangeof concentrationswasobserved in thegrasslandcontrolprofilesat60-90cmdepth.SimilartoOCtheTNcontentswere smaller in theCCFO than in the grasslandprofile.TheOC:TNratioasindicatorsoforganicmatterchangesintheprofilesrangedfrom8to10(CCFO)and10to8(grassland) and indicatedanimaldung-derivedNenrich-mentsinthefirst30cmoftheCCFOprofile.Ifwecom-parethelargestTNcontentunderCCFO(1.43gkg-1)withtheTNcontentsintheupperpartofthegrasslandprofile,thanitisobviousthatthedungaccumulationintheCCFOdidnotresultinanyorganicNenrichment.Thiscanbeex-plainedbytwoprocesses:(i)arablesoilmanagementpriortotheCCFOconstructionhadreducedthenativeorganicNcontent,and(ii)moreexcrementderivedNwaslosttotheatmosphereingaseousformthancausedenrichmentsinsoils.ReductionsinTNcontentsof0.6gkg-1followingcultivationoftheprairieswereobservedinapairofnativeandcultivatedsoilsfromtheLethbridgeregion,andof1.5to1.9gkg-1insoilsfromSaskatchewan(Leinweberetal.,2009).Theabovedifferenceof0.6gkg-1iscomparabletothedifferenceinTNbetweenthegrasslandandtheCCFOat0-30cmsoildepth.AtmosphericNlossesfromtheex-
crementcanoriginatefromNH3volatilizationanddenitri-fication.Majorfactorsconducivetodenitrificationsuchashighorganicmatter, limitedoxygen,due to compactionandalkalinepH(Tisdaleetal.,1985)arecombinedintheCCFO(Table1).Therefore,itisnotsurprisingthatnopar-ticularenrichmentinTNwasfoundintheCCFOsoilprofile
Table2:
Meanconcentration(mgkg-1)ofvarioustotalPforms(Pt)andtotalP(TP)inthemanureoftheconfinedcattlefeedingoperationincludingthepercentageofeachfractionofTP(inparentheses)andtheratioofPi/Poperfraction(inparentheses)
H O P2 t NaHCO 3 Pt NaOH P t HCl P t H SO 2 4 Pt TP
788.6 (25.5) 694.4 (22.4) 615.5 (19.9) 826.1 (26.7) 172.5 (5.6) 3097.1
(78/22) (80/20) (28/72) (41/59)
Table3:
Meanconcentration(mgkg-1)ofvarioustotalPforms(Pt)andtotalP(TP)intheconfinedcattlefeedingoperationandthegrasslandcontrolin2005
Depth
cm
H O P2 t NaHCO 3 Pt NaOH P t
mg kg-1
HCl P t H SO 2 4 Pt TP
Confined cattle feeding operation
0-10 5.6 a 15.2 a 32.1 Ba 216.5 c 69.9 a 349.3
10-30 5.4 ab 3.7 Bb 7.0 Bb 282.1 Abc 59.5 Bb 356.4 B
30-60 4.9 b 4.6 Bb 6.0 Bbc 349.9 a 43.3 Bc 408.7
60-90 5.0 ab 4.2 b 4.5 Bc 318.7 Bab 42.0 Bc 374.4 B
Grassland
0-10 5.4 10.4 88.1 Ab 213.8 c 73.5 b 391.1 c
10-30 5.4 10.7 A 100.2 Aa 208.1 Bc 81.0 Aab 405.4 Ac
30-60 5.0 8.2 A 40.1 Ac 364.3 a 89.2 Aa 506.8 a
60-90 4.7 12.9 8.5 Ad 401.8 Aab 47.9 Ac 475.8 Ab
For each soil depth, P concentration in a column followed by different uppercase letters indicate significant (P < 0.05) location effects. For each location, P concentration in a column followed by different lowercase letters indicate significant (P < 0.05) soil depth effects. Only significant differences are stated.
Total phosphorus in manure and soil
TheTPconcentrationinthemanurewas3097mgkg-1(Table2),whichisintherangeofotherstudiesoncattlemanure(TurnerandLeytem,2004).TheTPconcentrationsinthefirst10cmofthemineralsoilbeneaththemanurewere 384 in the CCFO and 391mg kg-1 in the subsoilof thegrassland. These values are typical for subsoils inthisdarkbrownChernozemicclayloamsoils.IntheCCFOprofiletheTPconcentrationvariedbetween356and409mgkg-1,withthehighestconcentrationatasoildepthof30-60 cm (Table3). TheTPdistribution in thegrasslandsoilwassimilar,butslightlyhighervalueswereobserved(391 to 507mg kg-1). For both locations the pattern inthesoilprofilecouldbeexplainedbytheparentmaterialwithachangeinsoiltextureandaccumulationascalciumphosphate.WhereasinotherareashighrainfallcausesPleachingthroughthesubsoilresultinginnon-uniformdis-
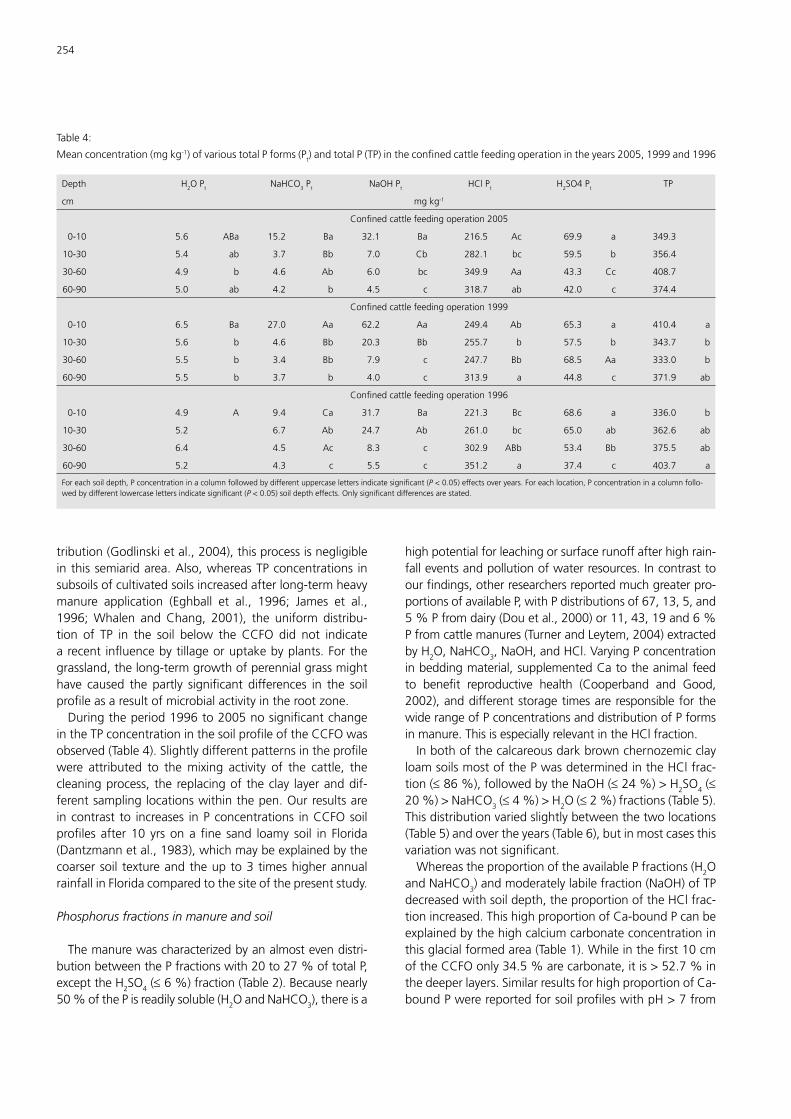
254
tribution(Godlinskietal.,2004),thisprocessisnegligibleinthissemiaridarea.Also,whereasTPconcentrations insubsoilsofcultivatedsoilsincreasedafterlong-termheavymanure application (Eghball et al., 1996; James et al.,1996;Whalen andChang, 2001), the uniform distribu-tion of TP in the soil below the CCFO did not indicatearecentinfluencebytillageoruptakebyplants.Forthegrassland,thelong-termgrowthofperennialgrassmighthave caused the partly significant differences in the soilprofileasaresultofmicrobialactivityintherootzone.Duringtheperiod1996to2005nosignificantchange
intheTPconcentrationinthesoilprofileoftheCCFOwasobserved(Table4).Slightlydifferentpatternsintheprofilewere attributed to themixing activity of the cattle, thecleaningprocess, thereplacingof theclay layeranddif-ferentsamplinglocationswithinthepen.Ourresultsareincontrast to increases inPconcentrations inCCFOsoilprofiles after10 yrsonafine sand loamy soil in Florida(Dantzmannetal.,1983),whichmaybeexplainedbythecoarsersoil textureandtheupto3timeshigherannualrainfallinFloridacomparedtothesiteofthepresentstudy.
Table4:
Meanconcentration(mgkg-1)ofvarioustotalPforms(Pt)andtotalP(TP)intheconfinedcattlefeedingoperationintheyears2005,1999and1996
Depth H2OPt NaHCO3Pt NaOHPt HClPt H2SO4Pt TP
cm mgkg-1
Confinedcattlefeedingoperation2005
0-10 5.6 ABa 15.2 Ba 32.1 Ba 216.5 Ac 69.9 a 349.3
10-30 5.4 ab 3.7 Bb 7.0 Cb 282.1 bc 59.5 b 356.4
30-60 4.9 b 4.6 Ab 6.0 bc 349.9 Aa 43.3 Cc 408.7
60-90 5.0 ab 4.2 b 4.5 c 318.7 ab 42.0 c 374.4
Confinedcattlefeedingoperation1999
0-10 6.5 Ba 27.0 Aa 62.2 Aa 249.4 Ab 65.3 a 410.4 a
10-30 5.6 b 4.6 Bb 20.3 Bb 255.7 b 57.5 b 343.7 b
30-60 5.5 b 3.4 Bb 7.9 c 247.7 Bb 68.5 Aa 333.0 b
60-90 5.5 b 3.7 b 4.0 c 313.9 a 44.8 c 371.9 ab
Confinedcattlefeedingoperation1996
0-10 4.9 A 9.4 Ca 31.7 Ba 221.3 Bc 68.6 a 336.0 b
10-30 5.2 6.7 Ab 24.7 Ab 261.0 bc 65.0 ab 362.6 ab
30-60 6.4 4.5 Ac 8.3 c 302.9 ABb 53.4 Bb 375.5 ab
60-90 5.2 4.3 c 5.5 c 351.2 a 37.4 c 403.7 a
Foreachsoildepth,Pconcentrationinacolumnfollowedbydifferentuppercaselettersindicatesignificant(P<0.05)effectsoveryears.Foreachlocation,Pconcentrationinacolumnfollo-wedbydifferentlowercaselettersindicatesignificant(P<0.05)soildeptheffects.Onlysignificantdifferencesarestated.
Phosphorus fractions in manure and soil
Themanurewascharacterizedbyanalmostevendistri-butionbetweenthePfractionswith20to27%oftotalP,excepttheH2SO4(≤6%)fraction(Table2).Becausenearly50%ofthePisreadilysoluble(H2OandNaHCO3),thereisa
highpotentialforleachingorsurfacerunoffafterhighrain-falleventsandpollutionofwaterresources.Incontrasttoourfindings,otherresearchersreportedmuchgreaterpro-portionsofavailableP,withPdistributionsof67,13,5,and5%Pfromdairy(Douetal.,2000)or11,43,19and6%Pfromcattlemanures(TurnerandLeytem,2004)extractedbyH2O,NaHCO3,NaOH,andHCl.VaryingPconcentrationinbeddingmaterial,supplementedCatotheanimalfeedto benefit reproductive health (Cooperband and Good,2002),anddifferentstoragetimesareresponsibleforthewiderangeofPconcentrationsanddistributionofPformsinmanure.ThisisespeciallyrelevantintheHClfraction.Inbothofthecalcareousdarkbrownchernozemicclay
loamsoilsmostofthePwasdeterminedintheHClfrac-tion(≤86%),followedbytheNaOH(≤24%)>H2SO4(≤20%)>NaHCO3(≤4%)>H2O(≤2%)fractions(Table5).Thisdistributionvariedslightlybetweenthetwolocations(Table5)andovertheyears(Table6),butinmostcasesthisvariationwasnotsignificant.WhereastheproportionoftheavailablePfractions(H2O
andNaHCO3)andmoderatelylabilefraction(NaOH)ofTPdecreasedwithsoildepth,theproportionoftheHClfrac-tionincreased.ThishighproportionofCa-boundPcanbeexplainedbythehighcalciumcarbonateconcentrationinthisglacialformedarea(Table1).Whileinthefirst10cmoftheCCFOonly34.5%arecarbonate,itis>52.7%inthedeeperlayers.SimilarresultsforhighproportionofCa-boundPwerereportedforsoilprofileswithpH>7from
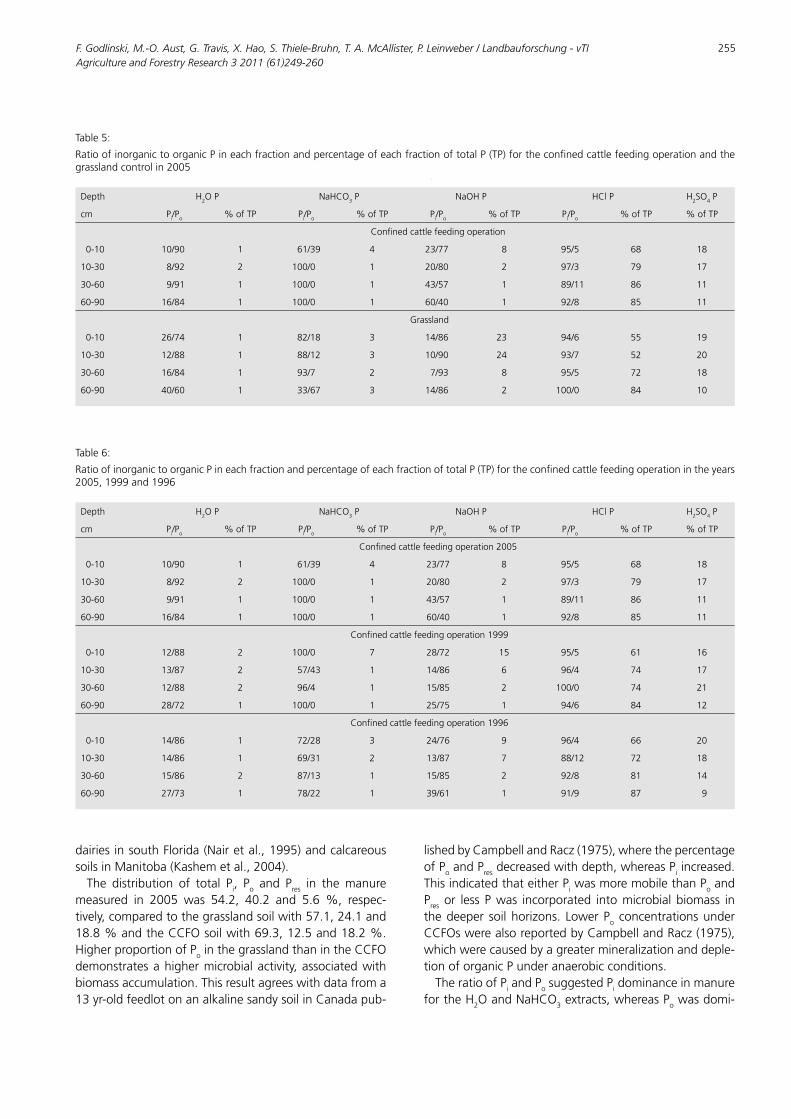
F. Godlinski, M.-O. Aust, G. Travis, X. Hao, S. Thiele-Bruhn, T. A. McAllister, P. Leinweber / Landbauforschung - vTI Agriculture and Forestry Research 3 2011 (61)249-260
255
Table5:
RatioofinorganictoorganicPineachfractionandpercentageofeachfractionoftotalP(TP)fortheconfinedcattlefeedingoperationandthegrasslandcontrolin2005
Depth H2OP NaHCO3P NaOHP HClP H2SO4P
cm Pi/Po %ofTP Pi/Po %ofTP Pi/Po %ofTP Pi/Po %ofTP %ofTP
Confinedcattlefeedingoperation
0-10 10/90 1 61/39 4 23/77 8 95/5 68 18
10-30 8/92 2 100/0 1 20/80 2 97/3 79 17
30-60 9/91 1 100/0 1 43/57 1 89/11 86 11
60-90 16/84 1 100/0 1 60/40 1 92/8 85 11
Grassland
0-10 26/74 1 82/18 3 14/86 23 94/6 55 19
10-30 12/88 1 88/12 3 10/90 24 93/7 52 20
30-60 16/84 1 93/7 2 7/93 8 95/5 72 18
60-90 40/60 1 33/67 3 14/86 2 100/0 84 10
Table6:
RatioofinorganictoorganicPineachfractionandpercentageofeachfractionoftotalP(TP)fortheconfinedcattlefeedingoperationintheyears2005,1999and1996
Depth H2OP NaHCO3P NaOHP HClP H2SO4P
cm Pi/Po %ofTP Pi/Po %ofTP Pi/Po %ofTP Pi/Po %ofTP %ofTP
Confinedcattlefeedingoperation2005
0-10 10/90 1 61/39 4 23/77 8 95/5 68 18
10-30 8/92 2 100/0 1 20/80 2 97/3 79 17
30-60 9/91 1 100/0 1 43/57 1 89/11 86 11
60-90 16/84 1 100/0 1 60/40 1 92/8 85 11
Confinedcattlefeedingoperation1999
0-10 12/88 2 100/0 7 28/72 15 95/5 61 16
10-30 13/87 2 57/43 1 14/86 6 96/4 74 17
30-60 12/88 2 96/4 1 15/85 2 100/0 74 21
60-90 28/72 1 100/0 1 25/75 1 94/6 84 12
Confinedcattlefeedingoperation1996
0-10 14/86 1 72/28 3 24/76 9 96/4 66 20
10-30 14/86 1 69/31 2 13/87 7 88/12 72 18
30-60 15/86 2 87/13 1 15/85 2 92/8 81 14
60-90 27/73 1 78/22 1 39/61 1 91/9 87 9
dairiesinsouthFlorida(Nairetal.,1995)andcalcareoussoilsinManitoba(Kashemetal.,2004).The distribution of total Pi, Po and Pres in themanure
measured in 2005 was 54.2, 40.2 and 5.6%, respec-tively,comparedtothegrasslandsoilwith57.1,24.1and18.8%andtheCCFOsoilwith69.3,12.5and18.2%.HigherproportionofPointhegrasslandthanintheCCFOdemonstratesahighermicrobialactivity,associatedwithbiomassaccumulation.Thisresultagreeswithdatafroma13yr-oldfeedlotonanalkalinesandysoilinCanadapub-
lishedbyCampbellandRacz(1975),wherethepercentageofPoandPresdecreasedwithdepth,whereasPiincreased.ThisindicatedthateitherPiwasmoremobilethanPoandPres or less Pwas incorporated intomicrobialbiomass inthedeeper soilhorizons. LowerPo concentrationsunderCCFOswerealsoreportedbyCampbellandRacz(1975),whichwerecausedbyagreatermineralizationanddeple-tionoforganicPunderanaerobicconditions.TheratioofPiandPosuggestedPidominanceinmanure
fortheH2OandNaHCO3extracts,whereasPowasdomi-
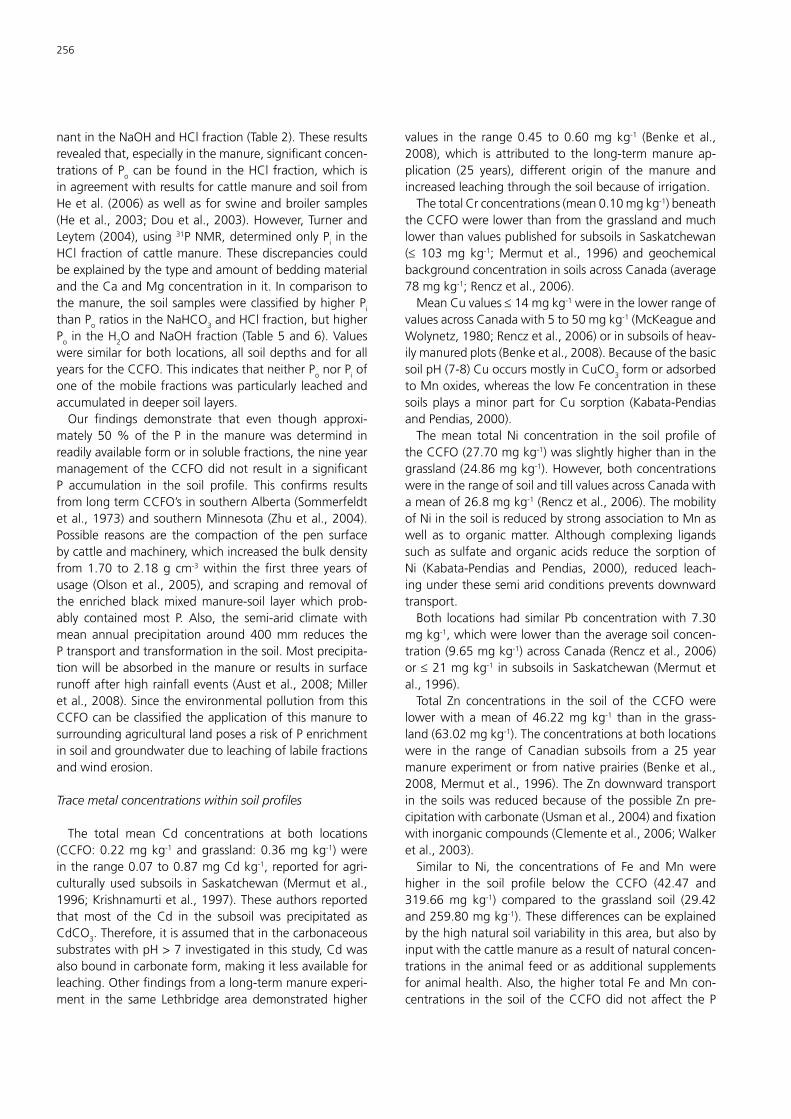
256
nantintheNaOHandHClfraction(Table2).Theseresultsrevealedthat,especiallyinthemanure,significantconcen-trationsofPocanbefound intheHClfraction,which isinagreementwithresultsforcattlemanureandsoilfromHeetal.(2006)aswellasforswineandbroilersamples(Heetal.,2003;Douetal.,2003).However,TurnerandLeytem(2004),using31PNMR,determinedonlyPi intheHClfractionofcattlemanure.ThesediscrepanciescouldbeexplainedbythetypeandamountofbeddingmaterialandtheCaandMgconcentrationinit.Incomparisontothemanure,thesoilsampleswereclassifiedbyhigherPithanPoratiosintheNaHCO3andHClfraction,buthigherPo intheH2OandNaOHfraction(Table5and6).Valuesweresimilarforbothlocations,allsoildepthsandforallyearsfortheCCFO.ThisindicatesthatneitherPonorPiofoneofthemobilefractionswasparticularly leachedandaccumulatedindeepersoillayers.Our findings demonstrate that even though approxi-
mately 50%of the P in themanurewas determind inreadilyavailableformorinsolublefractions,thenineyearmanagementof theCCFOdidnot result inasignificantP accumulation in the soil profile. This confirms resultsfromlongtermCCFO’sinsouthernAlberta(Sommerfeldtetal.,1973)andsouthernMinnesota(Zhuetal.,2004).Possible reasons are the compaction of the pen surfacebycattleandmachinery,whichincreasedthebulkdensityfrom1.70 to2.18g cm-3within thefirst three yearsofusage (Olsonetal.,2005),andscrapingandremovalofthe enrichedblackmixedmanure-soil layerwhich prob-ably containedmost P. Also, the semi-arid climatewithmean annual precipitation around 400mm reduces thePtransportandtransformationinthesoil.Mostprecipita-tionwillbeabsorbedinthemanureorresults insurfacerunoffafterhighrainfallevents(Austetal.,2008;Milleretal.,2008).SincetheenvironmentalpollutionfromthisCCFOcanbeclassifiedtheapplicationofthismanuretosurroundingagriculturallandposesariskofPenrichmentinsoilandgroundwaterduetoleachingoflabilefractionsandwinderosion.
Trace metal concentrations within soil profiles
The total mean Cd concentrations at both locations(CCFO:0.22mgkg-1andgrassland:0.36mgkg-1)wereintherange0.07to0.87mgCdkg-1,reportedforagri-culturallyused subsoils in Saskatchewan (Mermutet al.,1996;Krishnamurtietal.,1997).Theseauthorsreportedthat most of the Cd in the subsoil was precipitated asCdCO3.Therefore,itisassumedthatinthecarbonaceoussubstrateswithpH>7investigatedinthisstudy,Cdwasalsoboundincarbonateform,makingitlessavailableforleaching.Otherfindingsfromalong-termmanureexperi-ment in the same Lethbridge area demonstrated higher
values in the range 0.45 to 0.60mg kg-1 (Benke et al.,2008),which is attributed to the long-termmanure ap-plication (25 years), different origin of themanure andincreasedleachingthroughthesoilbecauseofirrigation.ThetotalCrconcentrations(mean0.10mgkg-1)beneath
theCCFOwerelowerthanfromthegrasslandandmuchlowerthanvaluespublishedforsubsoilsinSaskatchewan(≤ 103mg kg-1;Mermut et al., 1996) and geochemicalbackgroundconcentrationinsoilsacrossCanada(average78mgkg-1;Renczetal.,2006).MeanCuvalues≤14mgkg-1wereinthelowerrangeof
valuesacrossCanadawith5to50mgkg-1(McKeagueandWolynetz,1980;Renczetal.,2006)orinsubsoilsofheav-ilymanuredplots(Benkeetal.,2008).BecauseofthebasicsoilpH(7-8)CuoccursmostlyinCuCO3formoradsorbedtoMnoxides,whereasthelowFeconcentrationinthesesoilsplaysaminorpart forCu sorption (Kabata-PendiasandPendias,2000).Themean total Ni concentration in the soil profile of
theCCFO(27.70mgkg-1)wasslightlyhigherthaninthegrassland(24.86mgkg-1).However,bothconcentrationswereintherangeofsoilandtillvaluesacrossCanadawithameanof26.8mgkg-1(Renczetal.,2006).ThemobilityofNiinthesoilisreducedbystrongassociationtoMnaswell as to organicmatter. Although complexing ligandssuchassulfateandorganicacidsreducethesorptionofNi (Kabata-Pendias and Pendias, 2000), reduced leach-ingunderthesesemiaridconditionspreventsdownwardtransport.Both locationshad similar Pb concentrationwith7.30
mgkg-1,whichwerelowerthantheaveragesoilconcen-tration(9.65mgkg-1)acrossCanada(Renczetal.,2006)or≤21mgkg-1 insubsoils inSaskatchewan(Mermutetal.,1996).Total Zn concentrations in the soil of the CCFOwere
lowerwithameanof46.22mgkg-1 than in thegrass-land(63.02mgkg-1).Theconcentrationsatbothlocationswere in the range ofCanadian subsoils from a 25 yearmanureexperimentor fromnativeprairies (Benkeetal.,2008,Mermutetal.,1996).TheZndownwardtransportinthesoilswasreducedbecauseofthepossibleZnpre-cipitationwithcarbonate(Usmanetal.,2004)andfixationwithinorganiccompounds(Clementeetal.,2006;Walkeretal.,2003).Similar to Ni, the concentrations of Fe andMn were
higher in the soil profile below the CCFO (42.47 and319.66mg kg-1) compared to the grassland soil (29.42and259.80mgkg-1).Thesedifferencescanbeexplainedbythehighnaturalsoilvariabilityinthisarea,butalsobyinputwiththecattlemanureasaresultofnaturalconcen-trations in theanimal feedorasadditional supplementsforanimalhealth.Also,thehighertotalFeandMncon-centrations in the soil of theCCFOdidnot affect theP
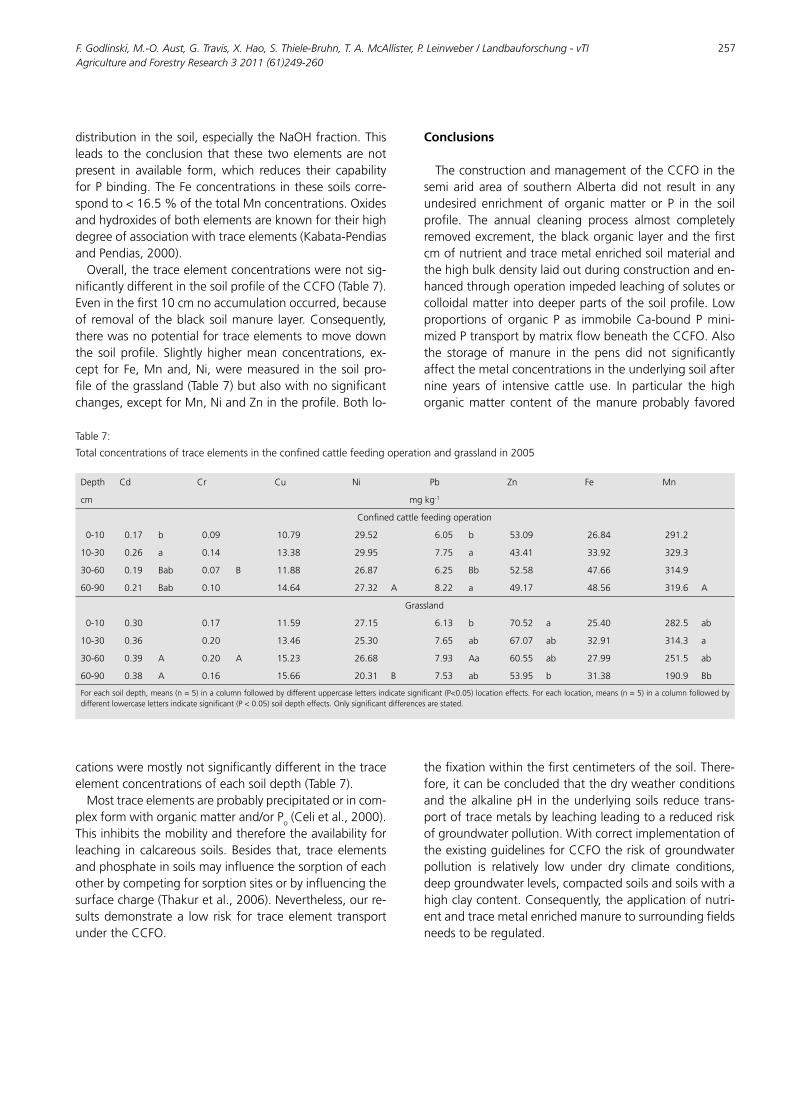
F. Godlinski, M.-O. Aust, G. Travis, X. Hao, S. Thiele-Bruhn, T. A. McAllister, P. Leinweber / Landbauforschung - vTI Agriculture and Forestry Research 3 2011 (61)249-260
257
distributioninthesoil,especiallytheNaOHfraction.Thisleadstotheconclusionthatthesetwoelementsarenotpresent in available form,which reduces their capabilityforPbinding.TheFeconcentrations inthesesoilscorre-spondto<16.5%ofthetotalMnconcentrations.Oxidesandhydroxidesofbothelementsareknownfortheirhighdegreeofassociationwithtraceelements(Kabata-PendiasandPendias,2000).Overall,thetraceelementconcentrationswerenotsig-
nificantlydifferentinthesoilprofileoftheCCFO(Table7).Eveninthefirst10cmnoaccumulationoccurred,becauseofremovaloftheblacksoilmanure layer.Consequently,therewasnopotentialfortraceelementstomovedownthe soil profile. Slightlyhighermean concentrations, ex-cept forFe,Mnand,Ni,weremeasured in thesoilpro-fileofthegrassland(Table7)butalsowithnosignificantchanges,exceptforMn,NiandZnintheprofile.Bothlo-
Table7:
Totalconcentrationsoftraceelementsintheconfinedcattlefeedingoperationandgrasslandin2005
Depth Cd Cr Cu Ni Pb Zn Fe Mn
cm mgkg-1
Confinedcattlefeedingoperation
0-10 0.17 b 0.09 10.79 29.52 6.05 b 53.09 26.84 291.2
10-30 0.26 a 0.14 13.38 29.95 7.75 a 43.41 33.92 329.3
30-60 0.19 Bab 0.07 B 11.88 26.87 6.25 Bb 52.58 47.66 314.9
60-90 0.21 Bab 0.10 14.64 27.32 A 8.22 a 49.17 48.56 319.6 A
Grassland
0-10 0.30 0.17 11.59 27.15 6.13 b 70.52 a 25.40 282.5 ab
10-30 0.36 0.20 13.46 25.30 7.65 ab 67.07 ab 32.91 314.3 a
30-60 0.39 A 0.20 A 15.23 26.68 7.93 Aa 60.55 ab 27.99 251.5 ab
60-90 0.38 A 0.16 15.66 20.31 B 7.53 ab 53.95 b 31.38 190.9 Bb
Foreachsoildepth,means(n=5)inacolumnfollowedbydifferentuppercaselettersindicatesignificant(P<0.05)locationeffects.Foreachlocation,means(n=5)inacolumnfollowedbydifferentlowercaselettersindicatesignificant(P<0.05)soildeptheffects.Onlysignificantdifferencesarestated.
cationsweremostlynotsignificantlydifferentinthetraceelementconcentrationsofeachsoildepth(Table7).Mosttraceelementsareprobablyprecipitatedorincom-
plexformwithorganicmatterand/orPo(Celietal.,2000).Thisinhibitsthemobilityandthereforetheavailabilityforleaching incalcareous soils.Besides that, traceelementsandphosphateinsoilsmayinfluencethesorptionofeachotherbycompetingforsorptionsitesorbyinfluencingthesurfacecharge(Thakuretal.,2006).Nevertheless,ourre-sultsdemonstratea low risk for traceelement transportundertheCCFO.
Conclusions
TheconstructionandmanagementoftheCCFOinthesemi arid areaof southernAlbertadidnot result in anyundesired enrichment of organicmatter or P in the soilprofile. The annual cleaning process almost completelyremovedexcrement,theblackorganiclayerandthefirstcmofnutrientandtracemetalenrichedsoilmaterialandthehighbulkdensitylaidoutduringconstructionanden-hancedthroughoperationimpededleachingofsolutesorcolloidalmatterintodeeperpartsofthesoilprofile.Lowproportions of organic P as immobileCa-bound Pmini-mizedPtransportbymatrixflowbeneaththeCCFO.Alsothe storage ofmanure in the pens did not significantlyaffectthemetalconcentrationsintheunderlyingsoilafternine years of intensive cattle use. In particular the highorganicmatter contentof themanureprobably favored
thefixationwithinthefirstcentimetersofthesoil.There-fore,itcanbeconcludedthatthedryweatherconditionsandthealkalinepH intheunderlyingsoils reducetrans-portoftracemetalsbyleachingleadingtoareducedriskofgroundwaterpollution.WithcorrectimplementationoftheexistingguidelinesforCCFOtheriskofgroundwaterpollution is relatively low under dry climate conditions,deepgroundwaterlevels,compactedsoilsandsoilswithahighclaycontent.Consequently,theapplicationofnutri-entandtracemetalenrichedmanuretosurroundingfieldsneedstoberegulated.
258
Acknowledgements
ThestudywassupportedbytravelgrantsfundedbytheEC/CanadaCooperationPrograminHigherEducationandTraining,projectAGROBIOTEC(2002-1345/001-001)andAgriculture and Agri-Food Canada. The authors wouldliketothankBarryM.Olsenforprovidingthesoilsamplesfrom1996and1999.TheworkofAllisonGoettelandSte-venVincett,andthehelpfulcommentsandsupervisioninthelaboratorybyPamelaCaffynandBrettHillaregrate-fullyacknowledged.ThankstoClarenceGilbertsonforthecarbonandnitrogenanalyses.SpecialthanksgoestoTobyEntzforstatisticalsupport.
References
AmundsonRG,TraskJ,PendallE(1988)Arapidmethodofsoilcarbonateana-lysisusinggaschromatography.SoilSciSocAmJ52:880-883
AustM,GodlinskiF,TravisGR,HaoX,McAllisterTA,LeinweberP,Thiele-BruhnS(2008)Distributionofthemobilefractionsofsulfamethazine,chlorotetra-cyclineandtylosininmanureandsoilofCanadianfeedlotsaftersubthera-peuticuseincattle.EnvironPollut1563:1243-1251
BenkeMB, IndraratneSP,HaoX,ChangC,GohTB (2008)Tracemetalsandboronchangesinsoilafterlong-termcattlemanureapplications.JEnvironQual37:798-807
CampbellLB,RaczGJ(1975)OrganicandinorganicPcontent,movementandmineralizationofPinsoilbeneathafeedlot.CanJSoilSci55:457-466
Celi L, LamacchiaS,BarberisE (2000) Interactionof inositolphosphatewithcalcite.NutrCyclAgroecosystems573:271-277
ClementeR,EscolarA,BernalMP(2006)Heavymetals fractionationandor-ganicmattermineralisationincontaminatedcalcareoussoilamendedwithorganicmaterials.BioresTechnol97:1894-1901
Cooperband LR,Good LW (2002) Biogenic phosphateminerals inmanure :implications for phosphorus loss to surface waters. Environ Sci Technol36:5075-5082
CooteDR,HoreFR(1979)Contaminationofshallowgroundwaterbyanunpa-vedfeedlot.CanJSoilSci59:401-412
DantzmanCL,RichterMF,MartinFG(1983)Chemicalelementsinsoilsundercattlepens.JEnvironQual12:164-168
DINISO11277(2002)Bodenbeschaffenheit–BestimmungderPartikelgrößen-verteilunginMineralböden–VerfahrenmittelsSiebungundSedimentation.Berlin:Beuth
DouZ,TothJD,GalliganDT,RambergCF,FergusonJD(2000)Laboratorypro-ceduresforcharacterizingmanurephosphorus.JEnvironQual29:508-514
DouZ,ZhangGY,StoutWL,TothJD,FergusonJD(2003)Efficacyofalumandcoalcombustionby-products instabilizingmanurephosphorus. JEnvironQual324:1490-1497
EghballB,BinfordGD,BaltenspergerD(1996)Phosphorusmovementandad-sorption ina soil receiving long-termmanureand fertilizer application. JEnvironQual256:1339-1343
GodlinskiF,LeinweberP,MeissnerR,SeegerJ(2004)Phosphorusstatusofsoilandleachinglosses:resultsfromoperatinganddismantledlysimetersafter15experimentalyears.NutrCyclAgroecosystems68:47-57
HaoX,ChangC,TravisGR,ZhangF(2003)Soilcarbonandnitrogenresponseto25annualcattlemanureapplication.JPlantNutrSoilSci166:239-245
HaoX,GodlinskiF,ChangC(2008)Distributionofphosphorusforms insoilfollowinglong-termcontinuousanddiscontinuouscattlemanureapplica-tions.SoilSciSocAmJ721:90-97
HeZ,FortunaA,SenwoZN,TazisongIA,HoneycuttCW,GriffinTS(2006)Hy-drochloricfractionsinhedleyfractionationmaycontaininorganicandorga-nicphosphates.SoilSciSocAmJ703:893-899
HeZ,HoneycuttCW,GriffinTS(2003)Enzymatichydrolysisoforganicphos-phorusinextractsandresuspensionsofswinemanureandcattlemanure.BiolFertilSoils38:78-83
HedleyMJ,StewartJWB,ChauhanBS(1982)Changesininorganicandorganicsoilphosphorusfractionsinducedbycultivationpracticesandbylaboratoryincubations.SoilSciSocAmJ46:970-976
HesterbergD(1998)Biogeochemicalcyclesandprocessesleadingtochangesinmobilityofchemicalsinsoils.AgricEcosystEnviron67:121-133
JamesDW,Kotuby-AmacherJ,AndersonGL,HuberDA(1996)Phosphorusmo-bilityincalcareoussoilsunderheavymanuring.JEnvironQual25:770-775
Kabata-PendiasA,PendiasH(2000)Traceelements insoilsandplants,BocaRaton:CRCPr,413p
KashemMA,AkinremiOO,RaczGJ(2004)Phosphorusfractionsinsoilamen-dedwithorganicandinorganicphosphorussources.CanJSoilSci84:83-90
KrishnamurtiGS,HuangPM,KozakLM,RostadHP,ReesKCJV(1997)Distribu-tionofcadmiuminselectedsoilprofilesofSaskatchewan,Canada:specia-tionandavailability.CanJSoilSci77:613–619
LarneyFJ,OlsonAF,Miller JJ,DeMaerePR,ZvomuyaF,McAllisterTA (2008)Physicalandchemicalchangesduringcompostingofwoodchip–beddedandstraw-beddedbeefcattlefeedlotmanure.JEnvironQual37:725-735
LeinweberP,WalleyF,KruseJ, JandlG,EckhardtK,BlythR,RegierT (2009)Cultivationaffectssoilorganicnitrogen:pyrolysis-massspectrometryandNK-edgeXANESevidence.SoilSciSocAmJ731:82-92
LiZ,ShumanL(1997)MobilityofZn,CdandPbinsoilsasaffectedbypoultrylitterextract:I.Leachinginsoilcolumns.EnvironPollut95:219-226
MaedaM,BergstromLF(2000)Leachingpatternofheavymetalsandnitrogenevaluatedwithamodifiedtanks-in-seriesmodel.JContamHydrol43:165-185
MauleCP,FonstadTA(2002)Soluteandmoisturefluxbeneathcattlefeedlotpens.TransactionsASAE451:73-81
MauleCP,FonstadTA(2000)Impactsofcattelpenningongroundwaterqualitybeneathfeetlots.CanAgricEng42:87-93
McBrideMB(1995)Toxicmetalaccumulationfromagriculturaluseofsludge:areUSEPAregulationsareprotective?JEnvironQual24:5-18
McBrideMB,RichardsBK,SteenhuisTS,RussoJJ,SauveS(1997)Mobilityandsolubilityoftoxicmetalsandnutrientsinsoilfifteenyearsaftersludgeap-plication.SoilSci1627:487-497
McKeague JA,WolynetzMS (1980)Background levelsofminorelements insomeCanadiansoils.Geoderma24:299-307
MermutAR,JainJC,SongL,KerrichR,KozakL,JanaS(1996)TraceelementconcentrationofselectedsoilsandfertilizersinSaskatewan,Canada.JEn-vironQual25:845-853
Mielke LN, SwansonNP,McCalla TM (1974) Soil profile conditions of cattlefeedlots.JEnvironQual31:14-17
Miller JJ,BeasleyBW,YankeLJ,LarneyFJ,McAllisterTA,OlsonBM,SelingerLB, Chanasyk DS, Hasselback P (2003) Bedding and seasonal effects onchemicalandbacterialpropertiesoffeedlotcattlemanure.JEnvironQual325:1887-1894
MillerJJ,CurtisT,LarneyFJ,McAllisterT,OlsonBM(2008)Physicalandchemicalpropertiesoffeedlotpensoilslocatedonmoderately-coarseandmodera-tely-finetexturedsoilsinSouthernAlberta.JEnvironQual37:1589-1598
MillerJJ,HanderekBP,BeasleyBW,OlsonECS,YankeLJ,LarneyFJ,McAllisterTA,OlsonBM,SelingerLB,ChanasykDS,HasselbackP(2004)QuantityandqualityofrunofffromabeefcattlefeedlotinSouthernAlberta.JEnvironQual333:1088-1097
Miller, JJ,OlsonECS,ChanasykD ,BeasleyBW,YankeLJ, LarneyFJ,McAlli-ster TA, Olson BM, Selinger LB (2006) Bedding andwithin-pen locationeffectson feedlotpen runoffqualityusinga rainfall simulator. J EnvironQual352:505-515
MooreJrP,DanielT,GilmourJ,ShreveBR,EdwardsD,WoodB(1998)Decrea-singmetalrunofffrompoultrylitterwithaluminumsulfate.JEnvironQual271:92-99
MurphyJ,RileyJR(1962)Amodifiedsinglesolutionmethodforthedetermina-tionofphosphateinnaturalwaters.AnalChimActa27:31-36
NairVD,GraetzDA, PortierKM (1995) Formsofphosphorus in soil profilesfromdairiesofSouthFlorida.SoilSciSocAmJ59:1244-1249
F. Godlinski, M.-O. Aust, G. Travis, X. Hao, S. Thiele-Bruhn, T. A. McAllister, P. Leinweber / Landbauforschung - vTI Agriculture and Forestry Research 3 2011 (61)249-260
259
NegassaW,LeinweberP(2009)HowdoestheHedleysequentialphosphorusfractionationreflectimpactsoflanduseandmanagementonsoilphospho-rus:areview.JPlantNutrSoilSci172:305-325
NicholsonF,ChambersB,WilliamsJ,UnwinR(1999)HeavymetalcontentsoflivestockfeedsandanimalmanuresinEnglandandWales.BioresTechnol70:23-31
OlsenSR,ColeCV,WatanabeFS,DeanLA(1954)Estimationofavailablephos-phorus in soils by extractionwith sodiumbicarbonate.Washington :USGovPrintOff,19p,Circular/UnitedStatesDepartmentofAgriculture939
OlsonBM,MillerJJ,RodvangSJ,YankeLJ(2005)Soilandgroundwaterqua-lityunderacattlefeedlot inSouthernAlberta.WaterQualResJCanada402:131–144
ParkinsonJA,AllenSE(1975)Awetoxidationproceduresuitableforthede-terminationofnitrogenandmineralnutrientsinbiologicalmaterial.CommSoilSciPlantAnal6:1-11
RenczAN,Garrett RG, Adcock SW, Bonham-CarterGF (2006)Geochemicalbackgroundinsoilandtill.Technicalreport,Ottawa:GeolSurveyCanada
SASInstitute(2005)SASOnlineDoc®9.1.3.Cary,NC:SASInstituteSchumanGE,McCallaTM(1975)Chemicalcharacteristicsoffeedlotsoilpro-
file.SoilSci119:113-118SommerfeldtTG,PittmanUJ,MilneRA(1973)Effectoffeedlotmanureonsoil
andwaterquality.JEnvironQual2:423-427SuiY,ThompsonML,ShangC(1999)Fractionationofphosphorusinamollisol
amendedwithbiosolids.SoilSciSocAmJ63:1174-1180ThakurSK,TomarNK,PandeyaSB(2006)Influenceofphosphateoncadmium
soptionbycalciumcarbonate.Geoderma130:240-249Thiele S, Leinweber P (2001) Parameterization of Freundlich adsorption iso-
thermsforheavymetalsinsoilsfromanareawithintensivelivestockpro-duction.JPlantNutrSoilSci164:623-629
TiessenH,MoirJO(1993)CharacterizationofavailablePbysequentialextrac-tion.In:CarterMR(ed)Soilsamplingandmethodsofanalysis.BocaRaton:LewisPubl,pp75-86
TisdaleSL,NelsonWL,BeatonJD(1985)Soilfertilityandfertilizers,NewYork:Macmillan,754p
TurnerBL,LeytemAB(2004)Phosphoruscompoundsinsequentialextractsofanimalmanures:chemicalspeciationandanovelfractionationprocedure.EnvironSciTechnol3822:6101-6108
UsmanARA,KuzyakovY,StahrK(2004)DynamicsoforganicCmineralizationandthemobilefractionofheavymetalsinacalcareoussoilincubatedwithorganicwaste.WaterAirSoilPollut158:401-418
VaillantGC,PierzynskiGM,HamJM,DeRoucheyJ(2009)Nutrientaccumulati-onbelowcattlefeedlotpensinKansas.JEnvironQual38:909-918
WalkerDJ,ClementeR,RoigA,BernalMP(2003)Theeffectsofsoilamend-ments on heavymetal bioavailability in two contaminatedMediterranensoils.EnvironPollut122:303-312
WhalenJK,ChangC(2001)Phosphorusaccumulationincultivatedsoilsfromlong-term annual applications of cattle feedlot manure. J Environ Qual30:229–237
ZeienH,BrümmerG(1989)ChemischeExtraktionzurBestimmungvonSchwer-metallbindungsformeninBöden.MittDtBodenkundlGes59:505-510
ZhuJ,LuoA,ZhouY,NdegwaP,SchmidtD(2004)Theageeffectofdairyfeed-lotsonmanurenutrientseepageinloamsoils.BiosystEng892:223-229

260
U. Prüße, S. Heidinger, C. Baatz / Landbauforschung - vTI Agriculture and Forestry Research 3 2011 (61)261-272 261
Catalytic conversion of renewables: Kinetic and mechanistic aspects of the gold-catalyzed liquid-phase glucose oxidation
UlfPrüße,SebastianHeidinger,andChristineBaatz*
** JohannHeinrichvonThünen Institute (vTI), FederalResearch Institute forRuralAreas,ForestryandFisheries,InstituteofAgriculturalTechnologyandBiosystemsEngineering,Bundesallee50,38116Braunschweig,Germany;
Correspondingauthor:Tel.:+495315964270;Fax:+495315964199. E-mailaddress:[email protected]
Abstract
Amongthestudiesaboutconversionof renewable re-sources,glucoseoxidationtogluconicacidreceivedverymuch attention in recent years. The present paper de-scribeskineticandmechanisticaspectsoftheliquid-phaseglucose oxidation. Therefore a 0.3% Au/Al2O3 catalystpreparedbytheincipientwetnessmethodwasused.Thereaction conditions were varied between 20 to 60 °C,pH7to10,catalystconcentrationsbetween50to1200mg l-1 and initial glucose concentrations between10 to1000mmoll-1.Theconcentrationofdissolvedoxygenwastrackedformostexperiments.AnincreasingactivitywasfoundwithincreasingpHvalueintherangebetweenpH7and10,andwith increasingtemperature in therangebetween 20 and 60 °C, whereas the selectivity to glu-conicacid remainedunchangedat>99%under theseconditions. The activation energywasdetermined tobe53kJmol-1.AnalysisofthereactionorderswithregardtoglucoseandoxygenleadstotheconclusionthattheEley-RidealmodelproposedbyBeltrameetal.(2006)shouldbediscardedforthegold-catalyzedglucoseoxidation.Hydro-genperoxideisformedasby-productinglucoseoxidationunderoxygenatmosphere,whereashydrogenatedprod-uctsareby-productsunderoxygen-freeconditions.Theseobservationshavebeenexplainedbyamodifiedoxidativedehydrogenationmechanism.
Keywords: conversion of renewables, gold catalyst, glu-cose oxidation, kinetics, mechanism
Zusammenfassung
Katalytische Konversion nachwachsender Rohstoffe: Kinetische und mechanistische Aspekte der goldka-talytisierten Glucoseoxidation in der Flüssigphase
ImBereichderkatalytischenKonversionnachwachsen-der Rohstoffe hat die goldkatalysierte GlucoseoxidationindenletztenJahrenbesondereAufmerksamkeiterlangt.Hierwerden kinetische undmechanistischeAspekte derGlucoseoxidationanhandeinesAluminiumoxid-geträger-ten 0,3%igen Goldkatalysators, der nach der incipientwetness-Methodehergestelltwurde,beschrieben.FürdiekinetischenUntersuchungenwurdenUntersuchungenbei20bis60°C,pH7bis10,einerKatalysatorkonzentrationvon50bis1200mgL-1undeinerAusgangsglucosekonzen-trationvon10bis1000mmolL-1durchgeführt.Zusätzlichwurde die Gelöstauerstoffkonzentration bei zahlreichenExperimentenverfolgt.MitsteigendempH-Wertundstei-genderTemperaturwurdeeineZunahmederAktivitätbeieinergleichbleibendhohenSelektivitätvon>99%fest-gestellt. Im untersuchten Temperaturbereich beträgt diescheinbareAktivierungsenergie 53KJmol-1.DieAnalysederReaktionsordnungen inBezugaufGlucoseundSau-erstoffzeigt,dasseinReaktionsverlaufderGlucoseoxida-tionnachdemEley-Rideal-Modell,wieervonBeltrameetal.(2006)fürdieseReaktionvorgeschlagenwurde,nichtzutreffend ist.Wasserstoffperoxid konnte als Nebenpro-dukt der Glucoseoxidation unter Sauerstoffatmosphärenachgewiesenwerden,wohingegenunterSauerstoffaus-schluss auch hydrierte Produkte gebildetwerden.DurcheinenmodifiziertenMechanismusderoxidativenDehydro-genierungkonntenbeideBeobachtungenerklärtwerden.
Schlüsselworte: Katalytische Konversion nachwachsender Rohstoffe, Goldkatalysator, Glucoseoxidation, Kinetik, Mechanismus
262
1. Introduction
Theconversionofrenewableresourcestovaluableprod-uctsofthechemicalindustryisanattractivewaytosavefossile resources and CO2 emissions endangering globalclimate.Amongthebiomasscarbohydratesglucoseisthemostabundantbio-feedstockforthispurpose.Inthisre-gard, themetal-catalyzed liquid-phase oxidation of glu-cose togluconicacidbygoldnanoparticleshas receivedmuchattentionduringveryrecentyears.AsfirstdescribedbyBiellaetal.(2002),goldnanoparticlesintherangeof2to5nmsupportedoncarbonshowamuchhigheractiv-ityundermild reactionconditions thantheconventionalplatinumandpalladiumbasedcatalystsappliedsofarforthisreaction.Furtheron,theAu/Ccatalystexhibitsanout-standingselectivityof100%towardsgluconicacid,afinechemicalwithanannualworldwideproductioncapacityofabout100,000tons(Lichtenthaler,2006),currentlyexclu-sivelyproducedbybiocatalyticglucoseoxidation.Themajority of the studies on gold-catalyzed glucose
oxidation used carbon-supported gold nanoparticlesoriginatingfrompreformedgoldsols(Biellaetal.,2002;Önal et al., 2004;Comotti et al., 2005;Comotti et al.,2006a and b), polymer-stabilized gold colloids (Mirescuand Prüße, 2006), glucose-stabilizedgold sols (Beltrameetal.,2006)orgoldcolloidsin“naked”form(Comottietal.,2004;Comottietal.,2006c). Insomeofthesestud-ies(Beltrameetal.,2006;Comottietal.,2004;Comottietal.,2006b)theactivityofthegoldnanoparticleshavebeendescribedaslowerbutcomparabletotheactivityoftheenzymeused in the technicalprocesses for thepro-duction of gluconic acid (Beltrame et al., 2004). Takingintoaccounttheoutstandingalmost100%selectivityofthegoldnanoparticles,whichsavesadditionalpurificationexpenses, an industrial gold-catalyzed glucose oxidationprocess seems to be within range. Unfortunately, goldcolloids, aswell as carbon-supportedgold nanoparticlesderived frompreformed sols, donot fulfil themajor re-quirementforacatalysttobeusedinanindustrialprocess:ahighlong-termstability.Thenakedcolloidsagglomerateafterafewminutessothatcompleteconversioncannotbereached(Comottietal.,2006c),andachitosan-stabi-lizedcolloidprecipitated inflakeshasbeendescribed toloseabout90%ofitsinitialactivityaftereightrepeatedbatches(MirescuandPrüße,2006).Alsothecarbon-sup-portedgoldnanoparticlesoriginatingfrompreformedsolsdonotperformmuchbetterastheyloseabout50%or60%oftheirinitialactivitywithin4or5repeatedbatches,respectively(Biellaetal.,2002;Comottietal.,2006b).However, highly active, almost 100 % selective and
long-termstablegoldcatalystsfortheliquid-phasecarbo-hydrateoxidationcanbeobtainedbyusingmetaloxidesassupportmaterial,e.g.Al2O3orTiO2preparedeitherby
deposition-precipitationwithNaOHorureaorbythein-cipientwetnessmethod(BaatzandPrüße,2007;Baatzetal.,2007;MirescuandPrüße,2007;Mirescuetal.,2007;Thieleckeetal.,2007aandb).Thesecatalystshavebeenusedfortheoxidationofglucoseandvariousotheraldos-estotheircorrespondingaldonicacidsinrepeatedbatchexperiments as well as partially under continuous-flowconditions. Nomatter which catalyst or reaction condi-tionswereapplied,themetaloxide-supportedgoldcata-lystsalwaysshowedahighactivity,nearly100%selectiv-ityand,asnoactivityandselectivitylossoccurred,ahighlong-termstablility.Hence,goldnanoparticlessupportedonmetaloxidesfulfilallnecessaryrequirementsfortheirapplicationinanindustrialcarbohydrateoxidationprocesstoproducevariousaldonicacids,e.g.gluconicacid.Knowledgeaboutthereactionkineticsofthegold-cata-
lyzedglucoseoxidationisveryimportantwithregardtoanup-scalingoftheprocesstoindustrialscale.Thusfar,onlyfewstudiesaboutglucoseoxidationreactionkineticswithgoldcatalystsareavailable(Beltrameetal.,2006;Önaletal.,2004). Inonestudycarbon-supportedgoldnanopar-ticles derived frompreformedgold sols havebeenused(Önaletal.,2004)whereasglucose-stabilizedgoldcolloidshavebeenusedintheotherone(Beltrameetal.,2006).Surprisingly, contrary results have been obtained in
thesetwostudies.Önaletal.(2006)reportedthatthere-actionfollowstheLangmuir-Hinshelwoodmodelinwhichbothglucoseandoxygenareadsorbed.Theyfoundonlya negligible increase of the initial reaction ratewith ris-inginitialglucoseconcentration,butadistinctselectivitydecrease. Beside glucose isomerisation products such asmannose and fructose, and degradation products suchas the oxygenated C3-bodies glycerolaldehyde or dihy-droxyacetone, also the hydrogenated product sorbitol,havebeenfound.Thelatterproductgivesstrongevidencethat the reaction follows the oxidative dehydrogenationmechanismwellknownfortheliquid-phasenoblemetal-catalyzedoxidationofalcoholsandaldehydes(BessonandGallezot,2001aandb;GallezotandBesson,1995;MallatandBaiker,1994).Incontrasttothesefindings,Beltrameetal.(2006)re-
portedaboutanincreaseoftheinitialreactionratewithrising initialglucoseconcentrationtendingtoanasymp-toteathigherglucoseconcentration.Thisresult,togetherwithanexperimentallyderivedreactionorderof1foroxy-gen,hasledtotheassumptionthattheglucoseoxidationfollows theEley-Ridealmodel inwhichdissolvedoxygenreactsfromtheliquidphasewithglucoseadsorbedatthecatalystsurface.However,theEley-Ridealmodelsuggest-edbyBeltrameetal.(2006)isincontradictiontoanotherstudyofthesamegroup.Comottietal.(2006c)proposedanew reactionmechanism forglucoseoxidation,whichis different from the oxidative dehydrogenationmecha-
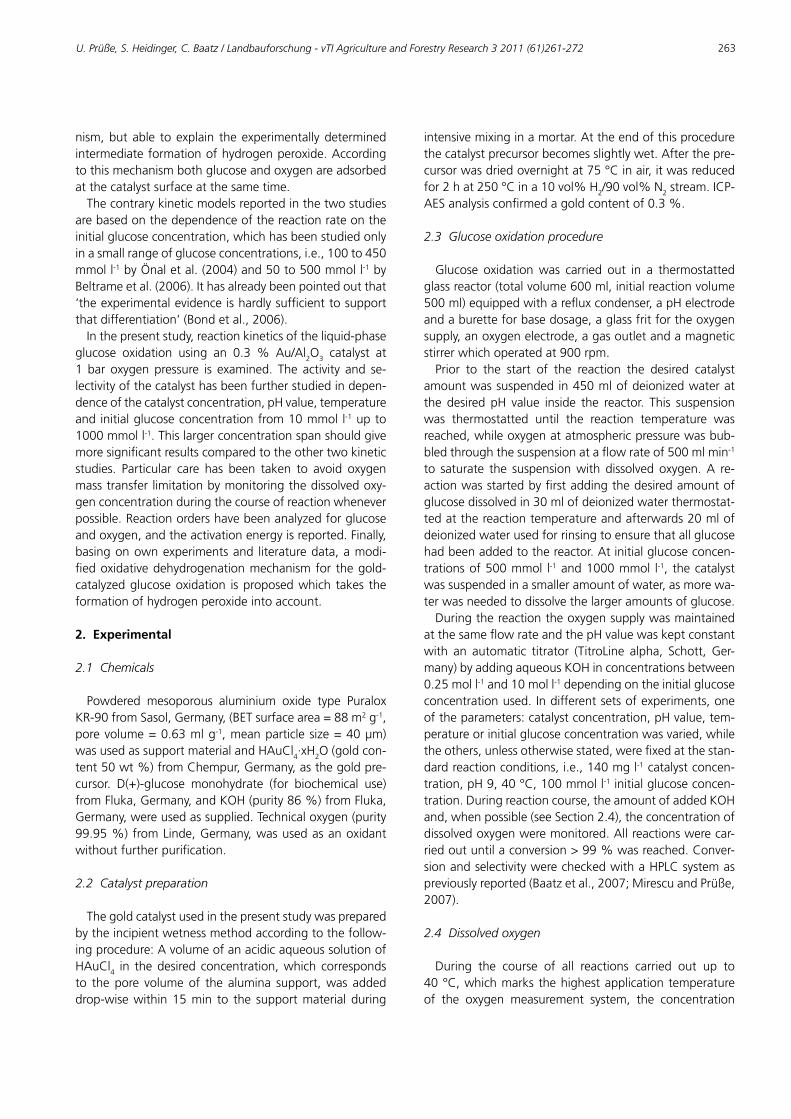
U. Prüße, S. Heidinger, C. Baatz / Landbauforschung - vTI Agriculture and Forestry Research 3 2011 (61)261-272 263
nism,butable toexplain theexperimentallydeterminedintermediateformationofhydrogenperoxide.Accordingtothismechanismbothglucoseandoxygenareadsorbedatthecatalystsurfaceatthesametime.Thecontrarykineticmodelsreportedinthetwostudies
arebasedonthedependenceofthereactionrateontheinitialglucoseconcentration,whichhasbeenstudiedonlyinasmallrangeofglucoseconcentrations,i.e.,100to450mmoll-1byÖnaletal.(2004)and50to500mmoll-1byBeltrameetal.(2006).Ithasalreadybeenpointedoutthat‘theexperimentalevidenceishardlysufficienttosupportthatdifferentiation’(Bondetal.,2006).Inthepresentstudy,reactionkineticsoftheliquid-phase
glucose oxidation using an 0.3 % Au/Al2O3 catalyst at1 bar oxygenpressure is examined. The activity and se-lectivityofthecatalysthasbeenfurtherstudiedindepen-denceofthecatalystconcentration,pHvalue,temperatureandinitialglucoseconcentrationfrom10mmol l-1upto1000mmoll-1.Thislargerconcentrationspanshouldgivemoresignificantresultscomparedtotheothertwokineticstudies. Particular care has been taken to avoid oxygenmasstransferlimitationbymonitoringthedissolvedoxy-genconcentrationduringthecourseofreactionwheneverpossible.Reactionordershavebeenanalyzedforglucoseandoxygen,andtheactivationenergyisreported.Finally,basingonownexperimentsand literaturedata,amodi-fiedoxidativedehydrogenationmechanismfor thegold-catalyzedglucoseoxidation isproposedwhich takes theformationofhydrogenperoxideintoaccount.
2. Experimental
2.1 Chemicals
Powdered mesoporous aluminium oxide type PuraloxKR-90fromSasol,Germany,(BETsurfacearea=88m2g-1,porevolume=0.63mlg-1,meanparticlesize=40µm)wasusedassupportmaterialandHAuCl4∙xH2O(goldcon-tent50wt%)fromChempur,Germany,asthegoldpre-cursor. D(+)-glucose monohydrate (for biochemical use)fromFluka,Germany,andKOH(purity86%)fromFluka,Germany,wereusedassupplied.Technicaloxygen(purity99.95%)fromLinde,Germany,wasusedasanoxidantwithoutfurtherpurification.
2.2 Catalyst preparation
Thegoldcatalystusedinthepresentstudywaspreparedbytheincipientwetnessmethodaccordingtothefollow-ingprocedure:AvolumeofanacidicaqueoussolutionofHAuCl4 in thedesired concentration,which correspondsto thepore volumeof the alumina support,was addeddrop-wisewithin15min to the supportmaterialduring
intensivemixinginamortar.Attheendofthisprocedurethecatalystprecursorbecomesslightlywet.Afterthepre-cursorwasdriedovernightat75°Cinair,itwasreducedfor2hat250°Cina10vol%H2/90vol%N2stream.ICP-AESanalysisconfirmedagoldcontentof0.3%.
2.3 Glucose oxidation procedure
Glucose oxidationwas carried out in a thermostattedglassreactor(totalvolume600ml,initialreactionvolume500ml)equippedwitharefluxcondenser,apHelectrodeandaburetteforbasedosage,aglassfritfortheoxygensupply,anoxygenelectrode,agasoutletandamagneticstirrerwhichoperatedat900rpm.Prior to the start of the reaction the desired catalyst
amountwassuspendedin450mlofdeionizedwateratthe desired pH value inside the reactor. This suspensionwas thermostatted until the reaction temperature wasreached,whileoxygenatatmosphericpressurewasbub-bledthroughthesuspensionataflowrateof500mlmin-1to saturate the suspensionwith dissolvedoxygen.A re-actionwasstartedbyfirstaddingthedesiredamountofglucosedissolvedin30mlofdeionizedwaterthermostat-tedatthereactiontemperatureandafterwards20mlofdeionizedwaterusedforrinsingtoensurethatallglucosehadbeenaddedtothereactor.Atinitialglucoseconcen-trationsof500mmol l-1and1000mmol l-1, thecatalystwassuspendedinasmalleramountofwater,asmorewa-terwasneededtodissolvethelargeramountsofglucose.Duringthereactiontheoxygensupplywasmaintained
atthesameflowrateandthepHvaluewaskeptconstantwith an automatic titrator (TitroLine alpha, Schott, Ger-many)byaddingaqueousKOHinconcentrationsbetween0.25moll-1and10moll-1dependingontheinitialglucoseconcentrationused.Indifferentsetsofexperiments,oneoftheparameters:catalystconcentration,pHvalue,tem-peratureorinitialglucoseconcentrationwasvaried,whiletheothers,unlessotherwisestated,werefixedatthestan-dardreactionconditions,i.e.,140mgl-1catalystconcen-tration,pH9,40°C,100mmoll-1initialglucoseconcen-tration.Duringreactioncourse,theamountofaddedKOHand,whenpossible(seeSection2.4),theconcentrationofdissolvedoxygenweremonitored.Allreactionswerecar-riedoutuntilaconversion>99%wasreached.Conver-sionandselectivitywerecheckedwithaHPLCsystemaspreviouslyreported(Baatzetal.,2007;MirescuandPrüße,2007).
2.4 Dissolved oxygen
During the course of all reactions carried out up to40°C,whichmarksthehighestapplicationtemperatureof the oxygen measurement system, the concentration
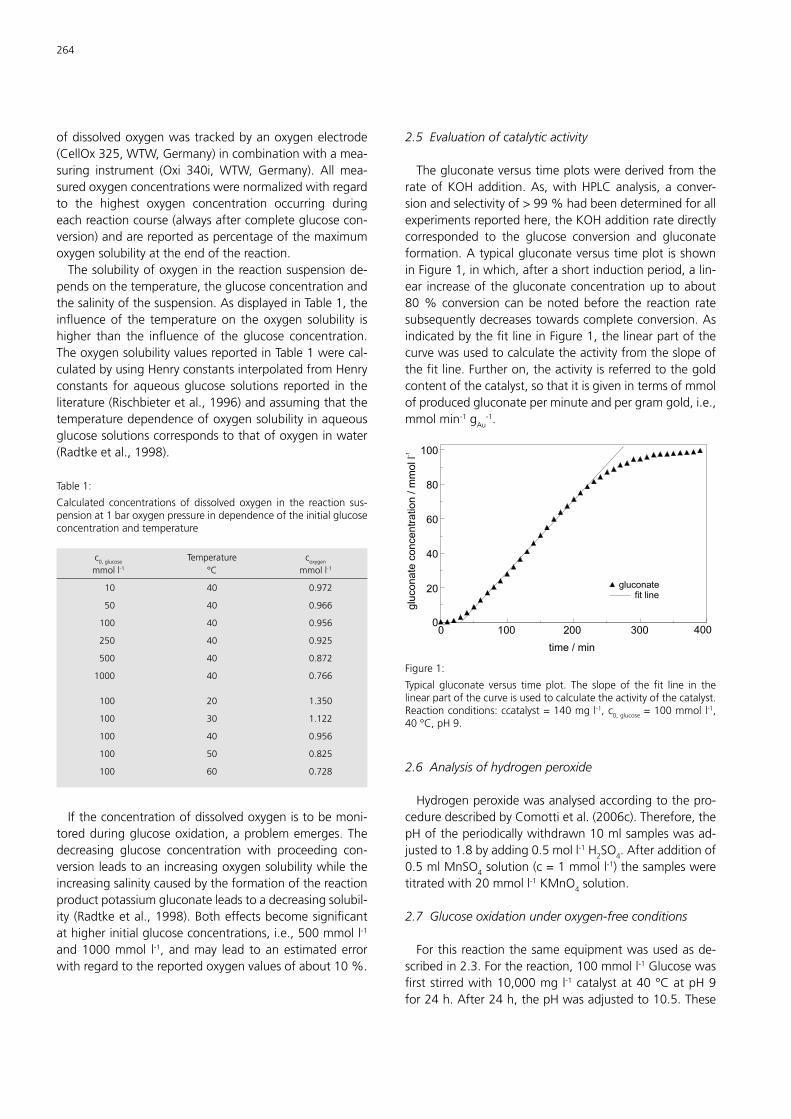
264
ofdissolvedoxygenwastrackedbyanoxygenelectrode(CellOx325,WTW,Germany)incombinationwithamea-suring instrument (Oxi 340i,WTW, Germany). All mea-suredoxygenconcentrationswerenormalizedwithregardto the highest oxygen concentration occurring duringeachreactioncourse(alwaysaftercompleteglucosecon-version)andarereportedaspercentageofthemaximumoxygensolubilityattheendofthereaction.Thesolubilityofoxygeninthereactionsuspensionde-
pendsonthetemperature,theglucoseconcentrationandthesalinityofthesuspension.AsdisplayedinTable1,theinfluenceof the temperatureon theoxygen solubility ishigher than the influence of the glucose concentration.TheoxygensolubilityvaluesreportedinTable1werecal-culatedbyusingHenryconstantsinterpolatedfromHenryconstants for aqueousglucose solutions reported in theliterature(Rischbieteretal.,1996)andassumingthatthetemperaturedependenceofoxygensolubilityinaqueousglucosesolutionscorrespondstothatofoxygeninwater(Radtkeetal.,1998).
Table1:
Calculated concentrations of dissolved oxygen in the reaction sus-pensionat1baroxygenpressureindependenceoftheinitialglucoseconcentrationandtemperature
c0,glucosemmoll-1
Temperature°C
coxygenmmoll-1
10 40 0.972
50 40 0.966
100 40 0.956
250 40 0.925
500 40 0.872
1000 40 0.766
100 20 1.350
100 30 1.122
100 40 0.956
100 50 0.825
100 60 0.728
Iftheconcentrationofdissolvedoxygenistobemoni-toredduringglucoseoxidation,aproblememerges.Thedecreasing glucose concentration with proceeding con-versionleadstoanincreasingoxygensolubilitywhiletheincreasingsalinitycausedbytheformationofthereactionproductpotassiumgluconateleadstoadecreasingsolubil-ity (Radtkeetal.,1998).Botheffectsbecomesignificantathigherinitialglucoseconcentrations,i.e.,500mmoll-1and1000mmol l-1, andmay lead toanestimatederrorwithregardtothereportedoxygenvaluesofabout10%.
2.5 Evaluation of catalytic activity
ThegluconateversustimeplotswerederivedfromtherateofKOHaddition.As,withHPLCanalysis, a conver-sionandselectivityof>99%hadbeendeterminedforallexperimentsreportedhere,theKOHadditionratedirectlycorresponded to the glucose conversion and gluconateformation.Atypicalgluconateversustimeplot isshowninFigure1,inwhich,afterashortinductionperiod,alin-ear increaseofthegluconateconcentrationuptoabout80%conversion canbenotedbefore the reaction ratesubsequentlydecreasestowardscompleteconversion.AsindicatedbythefitlineinFigure1,thelinearpartofthecurvewasusedtocalculatetheactivityfromtheslopeofthefitline.Furtheron,theactivityisreferredtothegoldcontentofthecatalyst,sothatitisgivenintermsofmmolofproducedgluconateperminuteandpergramgold,i.e.,mmolmin-1gAu
-1.
0 100 200 300 400
time / min
0
20
40
60
80
100
gluconate
fit line
glu
conate
concentr
ation / m
mol l-1
Figure1:
Typical gluconate versus time plot. The slope of the fit line in thelinearpartofthecurveisusedtocalculatetheactivityofthecatalyst.Reactionconditions:ccatalyst=140mgl-1,c0,glucose=100mmoll
-1,40°C,pH9.
2.6 Analysis of hydrogen peroxide
Hydrogenperoxidewasanalysedaccordingtothepro-ceduredescribedbyComottietal.(2006c).Therefore,thepHoftheperiodicallywithdrawn10mlsampleswasad-justedto1.8byadding0.5moll-1H2SO4.Afteradditionof0.5mlMnSO4solution(c=1mmoll
-1)thesamplesweretitratedwith20mmoll-1KMnO4solution.
2.7 Glucose oxidation under oxygen-free conditions
Forthisreactionthesameequipmentwasusedasde-scribedin2.3.Forthereaction,100mmoll-1Glucosewasfirststirredwith10,000mgl-1catalystat40°CatpH9for24h.After24h,thepHwasadjustedto10.5.These
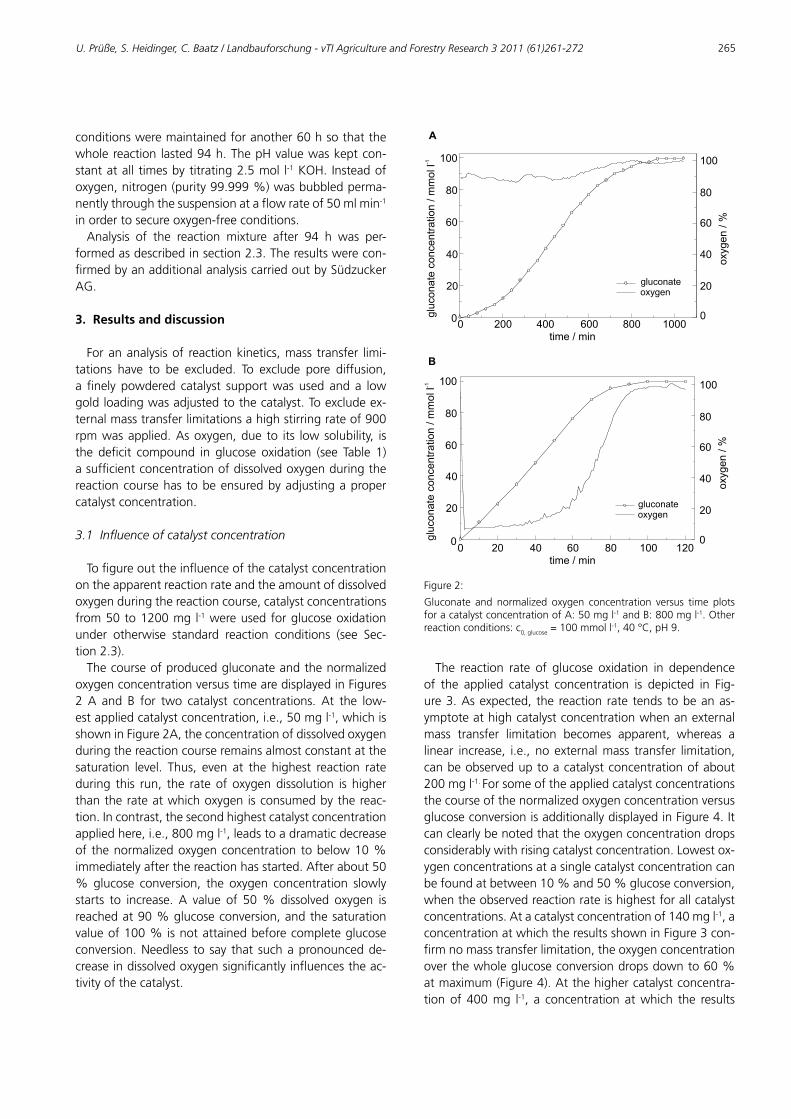
U. Prüße, S. Heidinger, C. Baatz / Landbauforschung - vTI Agriculture and Forestry Research 3 2011 (61)261-272 265
conditionsweremaintainedforanother60hsothatthewholereactionlasted94h.ThepHvaluewaskeptcon-stantatall timesbytitrating2.5mol l-1KOH. Insteadofoxygen,nitrogen(purity99.999%)wasbubbledperma-nentlythroughthesuspensionataflowrateof50mlmin-1inordertosecureoxygen-freeconditions.Analysis of the reaction mixture after 94 h was per-
formedasdescribedinsection2.3.Theresultswerecon-firmedbyanadditionalanalysiscarriedoutbySüdzuckerAG.
3. Results and discussion
Forananalysisof reactionkinetics,mass transfer limi-tations have to be excluded. To exclude pore diffusion,a finely powdered catalyst supportwasused and a lowgoldloadingwasadjustedtothecatalyst.Toexcludeex-ternalmasstransferlimitationsahighstirringrateof900rpmwasapplied.Asoxygen,due to its lowsolubility, isthe deficit compound in glucose oxidation (see Table 1)asufficientconcentrationofdissolvedoxygenduringthereactioncoursehas tobeensuredbyadjustingapropercatalystconcentration.
3.1 Influence of catalyst concentration
Tofigureouttheinfluenceofthecatalystconcentrationontheapparentreactionrateandtheamountofdissolvedoxygenduringthereactioncourse,catalystconcentrationsfrom50to1200mgl-1wereusedforglucoseoxidationunder otherwise standard reaction conditions (see Sec-tion2.3).Thecourseofproducedgluconateandthenormalized
oxygenconcentrationversustimearedisplayedinFigures2 A and B for two catalyst concentrations. At the low-estappliedcatalystconcentration,i.e.,50mgl-1,whichisshowninFigure2A,theconcentrationofdissolvedoxygenduringthereactioncourseremainsalmostconstantatthesaturation level. Thus, even at the highest reaction rateduring this run, the rateof oxygendissolution is higherthantherateatwhichoxygenisconsumedbythereac-tion.Incontrast,thesecondhighestcatalystconcentrationappliedhere,i.e.,800mgl-1,leadstoadramaticdecreaseof thenormalizedoxygenconcentrationtobelow10%immediatelyafterthereactionhasstarted.Afterabout50% glucose conversion, the oxygen concentration slowlystarts to increase. A value of 50% dissolved oxygen isreachedat90%glucoseconversion,andthesaturationvalueof100%isnotattainedbeforecompleteglucoseconversion.Needless to say that suchapronouncedde-creaseindissolvedoxygensignificantlyinfluencestheac-tivityofthecatalyst.
0
0
0
A
B
200
20
400
40
600
60
800
80
1000
100 120
time / min
time / min
0
gluconate
oxygen20 20
40 40
60 60
80 80
100 100
glu
conate
concentr
ation / m
mol l-1
oxygen / %
0
60
80
100
glu
conate
concentr
ation / m
mol l-1
0
20
40
60
80
100
oxygen / %
20
40
gluconate
oxygen
Figure2:
Gluconate and normalized oxygen concentration versus time plotsforacatalystconcentrationofA:50mgl-1andB:800mgl-1.Otherreactionconditions:c -1
0,glucose=100mmoll ,40°C,pH9.
The reaction rate of glucose oxidation in dependenceof the applied catalyst concentration is depicted in Fig-ure3.Asexpected, thereactionrate tendstobeanas-ymptoteathighcatalystconcentrationwhenanexternalmass transfer limitation becomes apparent, whereas alinear increase, i.e., noexternalmass transfer limitation,canbeobserveduptoacatalystconcentrationofabout200mgl-1.ForsomeoftheappliedcatalystconcentrationsthecourseofthenormalizedoxygenconcentrationversusglucoseconversionisadditionallydisplayedinFigure4.Itcanclearlybenotedthattheoxygenconcentrationdropsconsiderablywithrisingcatalystconcentration.Lowestox-ygenconcentrationsatasinglecatalystconcentrationcanbefoundatbetween10%and50%glucoseconversion,whentheobservedreactionrateishighestforallcatalystconcentrations.Atacatalystconcentrationof140mgl-1,aconcentrationatwhichtheresultsshowninFigure3con-firmnomasstransferlimitation,theoxygenconcentrationoverthewholeglucoseconversiondropsdownto60%atmaximum(Figure4).Atthehighercatalystconcentra-tionof400mg l-1, a concentration atwhich the results
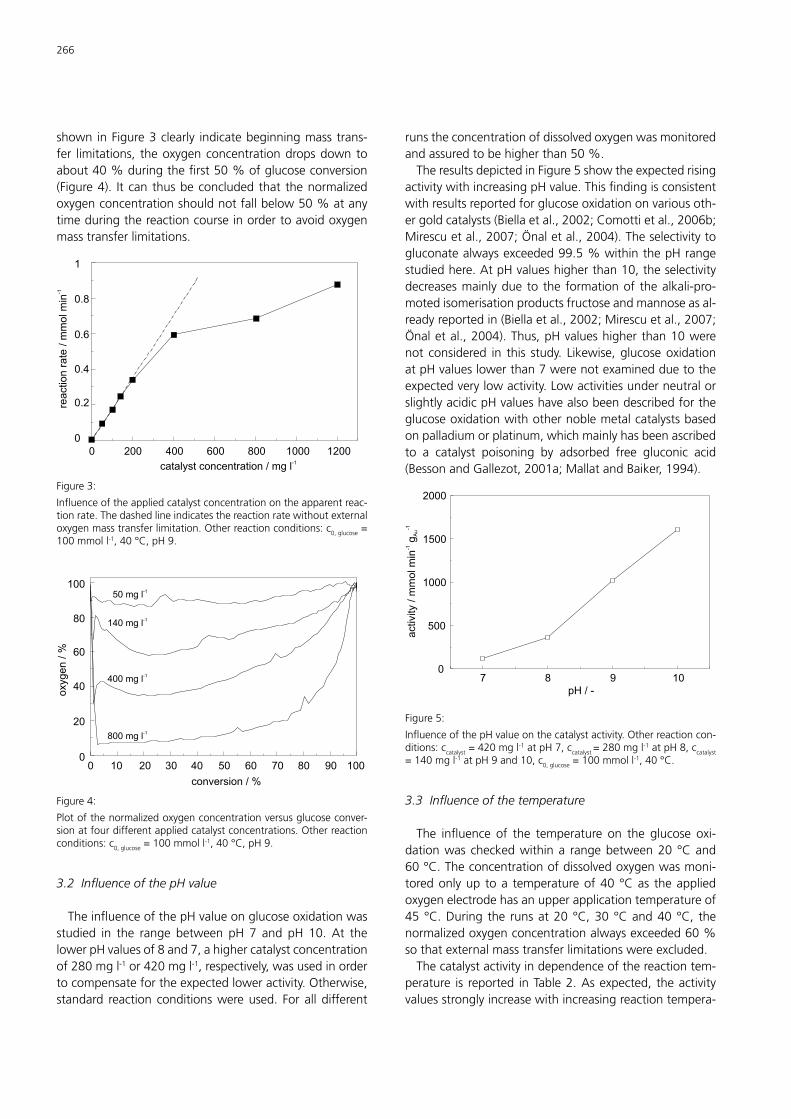
266
shown inFigure3clearly indicatebeginningmasstrans-fer limitations, theoxygenconcentrationdropsdowntoabout40%duringthefirst50%ofglucoseconversion(Figure4). Itcanthusbeconcludedthat thenormalizedoxygenconcentrationshouldnotfallbelow50%atanytimeduringthereactioncourseinordertoavoidoxygenmasstransferlimitations.
0 200 400 600 800 1000 1200
catalyst concentration / mg l-1
0
0.2
0.4
0.6
0.8
1
reaction r
ate
/ m
mol m
in-1
Figure3:
Influenceoftheappliedcatalystconcentrationontheapparentreac-tionrate.Thedashedlineindicatesthereactionratewithoutexternaloxygenmasstransferlimitation.Otherreactionconditions:c0,glucose=100mmoll-1,40°C,pH9.
Figure4:
Plotofthenormalizedoxygenconcentrationversusglucoseconver-sionatfourdifferentappliedcatalystconcentrations.Otherreactionconditions:c0,glucose=100mmoll
-1,40°C,pH9.
3.2 Influence of the pH value
TheinfluenceofthepHvalueonglucoseoxidationwasstudied in the range between pH 7 and pH 10. At thelowerpHvaluesof8and7,ahighercatalystconcentrationof280mgl-1or420mgl-1,respectively,wasusedinordertocompensatefortheexpectedloweractivity.Otherwise,standard reactionconditionswereused. Foralldifferent
0 10 20 30 40 50 60 70 80 90 100
conversion / %
50 mg l-1
0
20
40
60
80
100
oxygen / %
140 mg l-1
400 mg l-1
800 mg l-1
runstheconcentrationofdissolvedoxygenwasmonitoredandassuredtobehigherthan50%.TheresultsdepictedinFigure5showtheexpectedrising
activitywithincreasingpHvalue.Thisfindingisconsistentwithresultsreportedforglucoseoxidationonvariousoth-ergoldcatalysts(Biellaetal.,2002;Comottietal.,2006b;Mirescuetal.,2007;Önaletal.,2004).Theselectivitytogluconatealwaysexceeded99.5%withinthepHrangestudiedhere.AtpHvalueshigherthan10,theselectivitydecreasesmainlydue to the formationof thealkali-pro-motedisomerisationproductsfructoseandmannoseasal-readyreportedin(Biellaetal.,2002;Mirescuetal.,2007;Önaletal.,2004).Thus,pHvalueshigherthan10werenot considered in this study. Likewise,glucoseoxidationatpHvalueslowerthan7werenotexaminedduetotheexpectedverylowactivity.LowactivitiesunderneutralorslightlyacidicpHvalueshavealsobeendescribedfortheglucoseoxidationwithothernoblemetalcatalystsbasedonpalladiumorplatinum,whichmainlyhasbeenascribedto a catalyst poisoning by adsorbed free gluconic acid(BessonandGallezot,2001a;MallatandBaiker,1994).
Figure5:
InfluenceofthepHvalueonthecatalystactivity.Otherreactioncon-ditions:ccatalyst=420mgl
-1atpH7,ccatalyst=280mgl-1atpH8,ccatalyst
=140mgl-1atpH9and10,c0,glucose=100mmoll-1,40°C.
3.3 Influence of the temperature
The influence of the temperature on the glucose oxi-dationwascheckedwithina rangebetween20 °Cand60°C.Theconcentrationofdissolvedoxygenwasmoni-toredonlyup toa temperatureof40°Cas theappliedoxygenelectrodehasanupperapplicationtemperatureof45°C.During the runsat20°C,30°Cand40°C, thenormalizedoxygenconcentrationalwaysexceeded60%sothatexternalmasstransferlimitationswereexcluded.Thecatalystactivityindependenceofthereactiontem-
perature is reported inTable2.Asexpected, theactivityvaluesstronglyincreasewithincreasingreactiontempera-
7 8 9 10
pH / -
0
activity / m
mol m
ing
-1-1
Au
500
1000
1500
2000
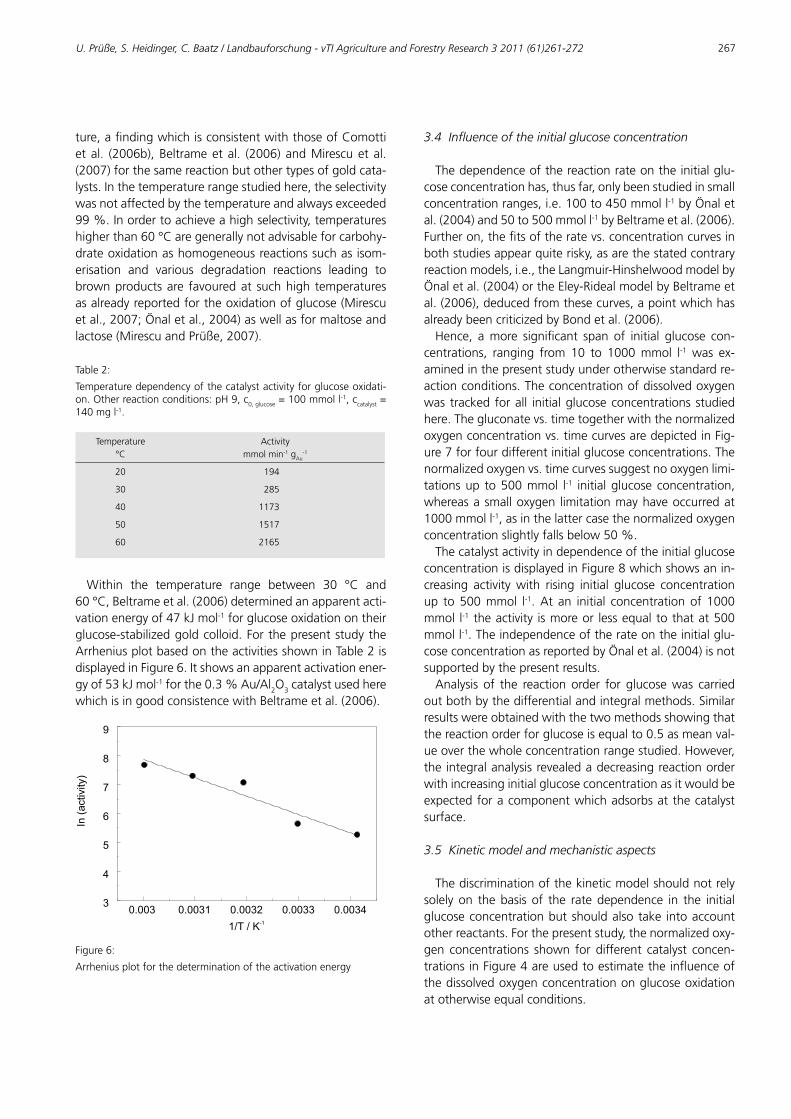
U. Prüße, S. Heidinger, C. Baatz / Landbauforschung - vTI Agriculture and Forestry Research 3 2011 (61)261-272 267
ture,afindingwhichisconsistentwiththoseofComottiet al. (2006b),Beltrameetal. (2006)andMirescuetal.(2007)forthesamereactionbutothertypesofgoldcata-lysts.Inthetemperaturerangestudiedhere,theselectivitywasnotaffectedbythetemperatureandalwaysexceeded99%.Inordertoachieveahighselectivity,temperatureshigherthan60°Caregenerallynotadvisableforcarbohy-drateoxidationashomogeneousreactionssuchasisom-erisation and various degradation reactions leading tobrownproductsare favouredat suchhigh temperaturesasalreadyreportedfortheoxidationofglucose(Mirescuetal.,2007;Önaletal.,2004)aswellasformaltoseandlactose(MirescuandPrüße,2007).
Table2:
Temperaturedependencyofthecatalystactivityforglucoseoxidati-on.Otherreactionconditions:pH9,c0,glucose=100mmoll
-1,ccatalyst=140mgl-1.
Temperature°C
Activitymmolmin-1gAu
-1
20 194
30 285
40 1173
50 1517
60 2165
Within the temperature range between 30 °C and60°C,Beltrameetal.(2006)determinedanapparentacti-vationenergyof47kJmol-1forglucoseoxidationontheirglucose-stabilizedgoldcolloid.ForthepresentstudytheArrheniusplotbasedontheactivitiesshowninTable2isdisplayedinFigure6.Itshowsanapparentactivationener-gyof53kJmol-1forthe0.3%Au/Al2O3catalystusedherewhichisingoodconsistencewithBeltrameetal.(2006).
0.003 0.0031 0.0032 0.0033 0.0034
1/T / K-1
3
4
5
6
7
8
9
In (
activity)
Figure6:
Arrheniusplotforthedeterminationoftheactivationenergy
3.4 Influence of the initial glucose concentration
Thedependenceofthereactionrateontheinitialglu-coseconcentrationhas,thusfar,onlybeenstudiedinsmallconcentrationranges,i.e.100to450mmoll-1byÖnaletal.(2004)and50to500mmoll-1byBeltrameetal.(2006).Furtheron,thefitsoftheratevs.concentrationcurvesinbothstudiesappearquiterisky,asarethestatedcontraryreactionmodels,i.e.,theLangmuir-HinshelwoodmodelbyÖnaletal.(2004)ortheEley-RidealmodelbyBeltrameetal.(2006),deducedfromthesecurves,apointwhichhasalreadybeencriticizedbyBondetal.(2006).Hence, amore significant span of initial glucose con-
centrations, ranging from 10 to 1000mmol l-1 was ex-aminedinthepresentstudyunderotherwisestandardre-actionconditions.Theconcentrationofdissolvedoxygenwas tracked forall initialglucoseconcentrationsstudiedhere.Thegluconatevs.timetogetherwiththenormalizedoxygenconcentrationvs.timecurvesaredepictedinFig-ure7forfourdifferentinitialglucoseconcentrations.Thenormalizedoxygenvs.timecurvessuggestnooxygenlimi-tationsup to500mmol l-1 initialglucose concentration,whereasasmalloxygen limitationmayhaveoccurredat1000mmoll-1,asinthelattercasethenormalizedoxygenconcentrationslightlyfallsbelow50%.Thecatalystactivityindependenceoftheinitialglucose
concentrationisdisplayedinFigure8whichshowsanin-creasing activitywith rising initial glucose concentrationup to500mmol l-1.At an initial concentrationof 1000mmol l-1 theactivity ismoreor lessequaltothatat500mmoll-1.Theindependenceoftherateontheinitialglu-coseconcentrationasreportedbyÖnaletal.(2004)isnotsupportedbythepresentresults.Analysis of the reaction order for glucosewas carried
outbothbythedifferentialandintegralmethods.Similarresultswereobtainedwiththetwomethodsshowingthatthereactionorderforglucoseisequalto0.5asmeanval-ueoverthewholeconcentrationrangestudied.However,theintegralanalysisrevealedadecreasingreactionorderwithincreasinginitialglucoseconcentrationasitwouldbeexpectedforacomponentwhichadsorbsatthecatalystsurface.
3.5 Kinetic model and mechanistic aspects
Thediscriminationofthekineticmodelshouldnotrelysolely on thebasis of the ratedependence in the initialglucoseconcentrationbutshouldalsotake intoaccountotherreactants.Forthepresentstudy,thenormalizedoxy-gen concentrations shown for different catalyst concen-trationsinFigure4areusedtoestimatetheinfluenceofthedissolvedoxygenconcentrationonglucoseoxidationatotherwiseequalconditions.
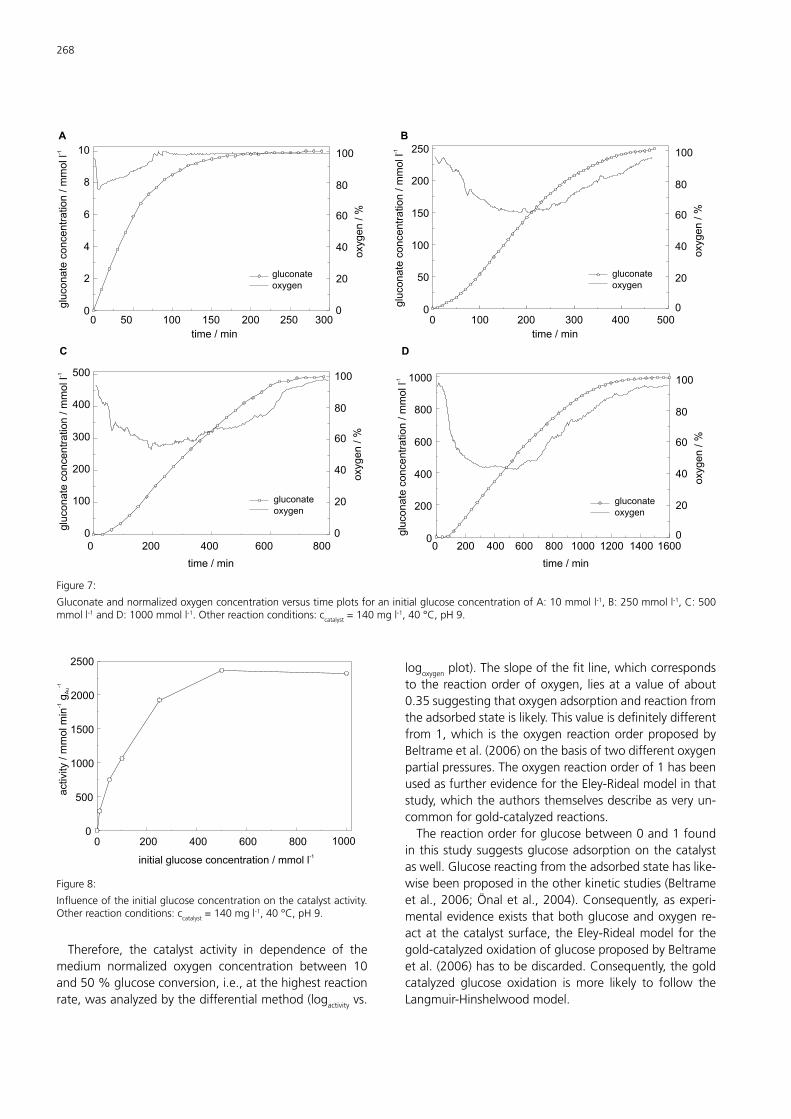
268
0
0
0
0
0 100 500200 300 400
time / min
time / min
0
0
200
50
400
100
600
150
800
200
1000
250
gluconate
gluconategluconate
gluconate
oxygen
oxygenoxygen
oxygen
glu
conate
concentr
ation / m
mol l-1
glu
conate
concentr
ation / m
mol l-1
0
0
20
20
40
40
60
60
80
80
100
100
oxygen / %
oxygen / %
time / min
20
40
60
80
100
oxygen / %
100
2
200
4
300
6
400
8
500
10
glu
conate
concentr
ation / m
mol l-1
glu
conate
concentr
ation / m
mol l-1
0
20
40
60
80
100
oxygen / %
50 150100 300200 250
time / min
A
C
B
D
0 200 1000400 1200600 1400800 16000 200 600400 800
Figure7:
GluconateandnormalizedoxygenconcentrationversustimeplotsforaninitialglucoseconcentrationofA:10mmoll-1,B:250mmoll-1,C:500mmoll-1andD:1000mmoll-1.Otherreactionconditions:ccatalyst=140mgl
-1,40°C,pH9.
0
activity / m
mol m
ing
-1-1
Au
initial glucose concentration / mmol l-1
200 400 600 800 10000
500
1000
1500
2000
2500
Figure8:
Influenceoftheinitialglucoseconcentrationonthecatalystactivity.Otherreactionconditions:ccatalyst=140mgl
-1,40°C,pH9.
Therefore, the catalyst activity in dependence of themedium normalized oxygen concentration between 10and50%glucoseconversion,i.e.,atthehighestreactionrate,wasanalyzedbythedifferentialmethod(logactivityvs.
logoxygenplot).Theslopeofthefitline,whichcorrespondstothereactionorderofoxygen, liesatavalueofabout0.35suggestingthatoxygenadsorptionandreactionfromtheadsorbedstateislikely.Thisvalueisdefinitelydifferentfrom1,which is theoxygenreactionorderproposedbyBeltrameetal.(2006)onthebasisoftwodifferentoxygenpartialpressures.Theoxygenreactionorderof1hasbeenusedasfurtherevidencefortheEley-Ridealmodelinthatstudy,whichtheauthorsthemselvesdescribeasveryun-commonforgold-catalyzedreactions.Thereactionorderforglucosebetween0and1found
inthisstudysuggestsglucoseadsorptiononthecatalystaswell.Glucosereactingfromtheadsorbedstatehaslike-wisebeenproposedintheotherkineticstudies(Beltrameetal.,2006;Önaletal.,2004).Consequently,asexperi-mentalevidenceexiststhatbothglucoseandoxygenre-actat thecatalystsurface, theEley-Ridealmodel for thegold-catalyzedoxidationofglucoseproposedbyBeltrameetal.(2006)hastobediscarded.Consequently,thegoldcatalyzed glucose oxidation is more likely to follow theLangmuir-Hinshelwoodmodel.
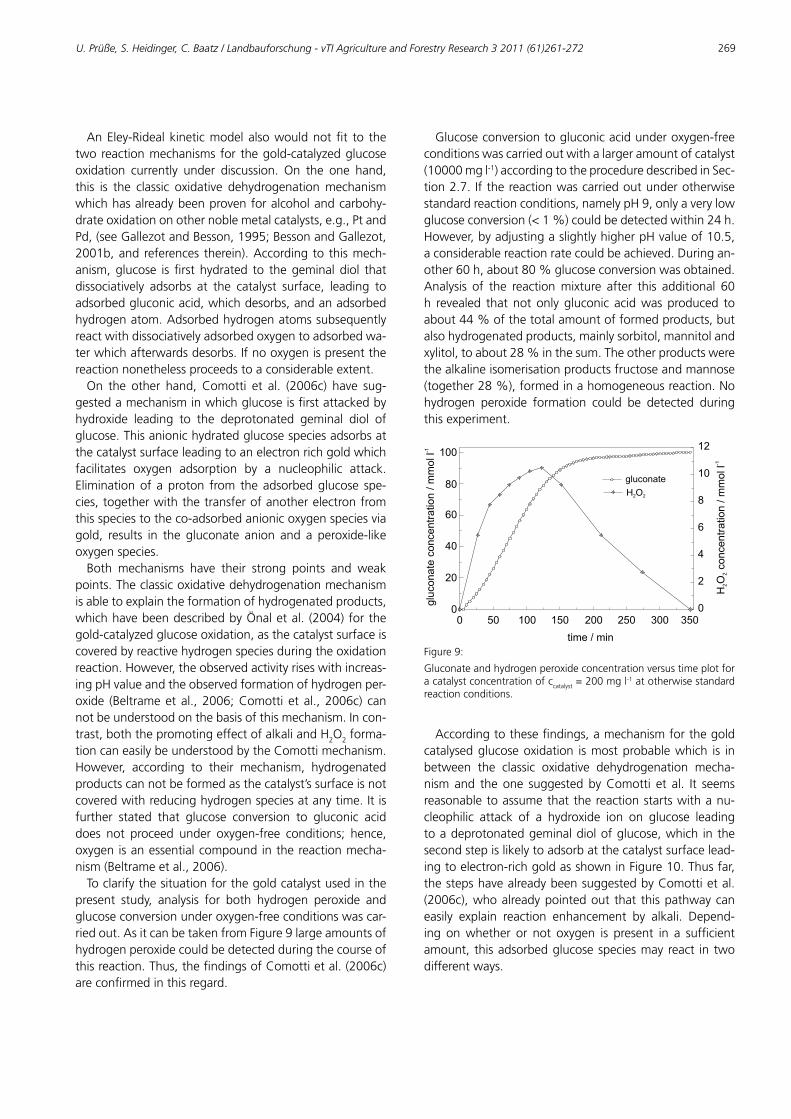
U. Prüße, S. Heidinger, C. Baatz / Landbauforschung - vTI Agriculture and Forestry Research 3 2011 (61)261-272 269
AnEley-Ridealkineticmodelalsowouldnotfit to thetworeactionmechanismsfor thegold-catalyzedglucoseoxidation currently under discussion. On the one hand,this is the classic oxidative dehydrogenationmechanismwhichhasalreadybeenprovenforalcoholandcarbohy-drateoxidationonothernoblemetalcatalysts,e.g.,PtandPd,(seeGallezotandBesson,1995;BessonandGallezot,2001b,andreferences therein).Accordingto thismech-anism,glucose isfirsthydrated to thegeminaldiol thatdissociatively adsorbs at the catalyst surface, leading toadsorbedgluconicacid,whichdesorbs,andanadsorbedhydrogenatom.Adsorbedhydrogenatomssubsequentlyreactwithdissociativelyadsorbedoxygentoadsorbedwa-terwhichafterwardsdesorbs.Ifnooxygenispresentthereactionnonethelessproceedstoaconsiderableextent.On the other hand, Comotti et al. (2006c) have sug-
gestedamechanisminwhichglucoseisfirstattackedbyhydroxide leading to the deprotonated geminal diol ofglucose.Thisanionichydratedglucosespeciesadsorbsatthecatalystsurfaceleadingtoanelectronrichgoldwhichfacilitates oxygen adsorption by a nucleophilic attack.Eliminationof aproton from theadsorbedglucose spe-cies,togetherwiththetransferofanotherelectronfromthisspeciestotheco-adsorbedanionicoxygenspeciesviagold, results in the gluconate anion and a peroxide-likeoxygenspecies.Both mechanisms have their strong points and weak
points.Theclassicoxidativedehydrogenationmechanismisabletoexplaintheformationofhydrogenatedproducts,whichhavebeendescribedbyÖnaletal. (2004)forthegold-catalyzedglucoseoxidation,asthecatalystsurfaceiscoveredbyreactivehydrogenspeciesduringtheoxidationreaction.However,theobservedactivityriseswithincreas-ingpHvalueandtheobservedformationofhydrogenper-oxide (Beltrameetal.,2006;Comotti et al.,2006c) cannotbeunderstoodonthebasisofthismechanism.Incon-trast,boththepromotingeffectofalkaliandH2O2forma-tioncaneasilybeunderstoodbytheComottimechanism.However, according to their mechanism, hydrogenatedproductscannotbeformedasthecatalyst’ssurfaceisnotcoveredwithreducinghydrogenspeciesatanytime.Itisfurther stated that glucose conversion to gluconic aciddoes not proceed under oxygen-free conditions; hence,oxygenisanessentialcompoundinthereactionmecha-nism(Beltrameetal.,2006).Toclarifythesituationforthegoldcatalystusedinthe
present study, analysis for both hydrogen peroxide andglucoseconversionunderoxygen-freeconditionswascar-riedout.AsitcanbetakenfromFigure9largeamountsofhydrogenperoxidecouldbedetectedduringthecourseofthisreaction.Thus,thefindingsofComottietal.(2006c)areconfirmedinthisregard.
Glucoseconversiontogluconicacidunderoxygen-freeconditionswascarriedoutwithalargeramountofcatalyst(10000mgl-1)accordingtotheproceduredescribedinSec-tion2.7.Ifthereactionwascarriedoutunderotherwisestandardreactionconditions,namelypH9,onlyaverylowglucoseconversion(<1%)couldbedetectedwithin24h.However,byadjustingaslightlyhigherpHvalueof10.5,aconsiderablereactionratecouldbeachieved.Duringan-other60h,about80%glucoseconversionwasobtained.Analysis of the reactionmixture after this additional 60h revealed thatnotonlygluconic acidwasproduced toabout44%ofthetotalamountofformedproducts,butalsohydrogenatedproducts,mainlysorbitol,mannitolandxylitol,toabout28%inthesum.Theotherproductswerethealkalineisomerisationproductsfructoseandmannose(together28%),formedinahomogeneousreaction.Nohydrogen peroxide formation could be detected duringthisexperiment.
0
2
4
6
8
10
12
0
time / min
gluconate
H O2 2
glu
conate
concentr
ation / m
mol l-1
HO
concentr
ation / m
mol l
22
-1
20
40
60
80
100
0 50 250100 300150 350200
Figure9:
Gluconateandhydrogenperoxideconcentrationversustimeplotforacatalystconcentrationofccatalyst=200mgl
-1atotherwisestandardreactionconditions.
Accordingtothesefindings,amechanismforthegoldcatalysedglucoseoxidation ismostprobablewhich is inbetween the classic oxidative dehydrogenation mecha-nismand theone suggestedbyComotti et al. It seemsreasonabletoassumethatthereactionstartswithanu-cleophilic attack of a hydroxide ion on glucose leadingtoadeprotonatedgeminaldiolofglucose,which inthesecondstepislikelytoadsorbatthecatalystsurfacelead-ingtoelectron-richgoldasshowninFigure10.Thusfar,thestepshavealreadybeensuggestedbyComottietal.(2006c),whoalreadypointedout that thispathwaycaneasily explain reaction enhancement by alkali. Depend-ing onwhether or not oxygen is present in a sufficientamount, thisadsorbedglucosespeciesmayreact intwodifferentways.
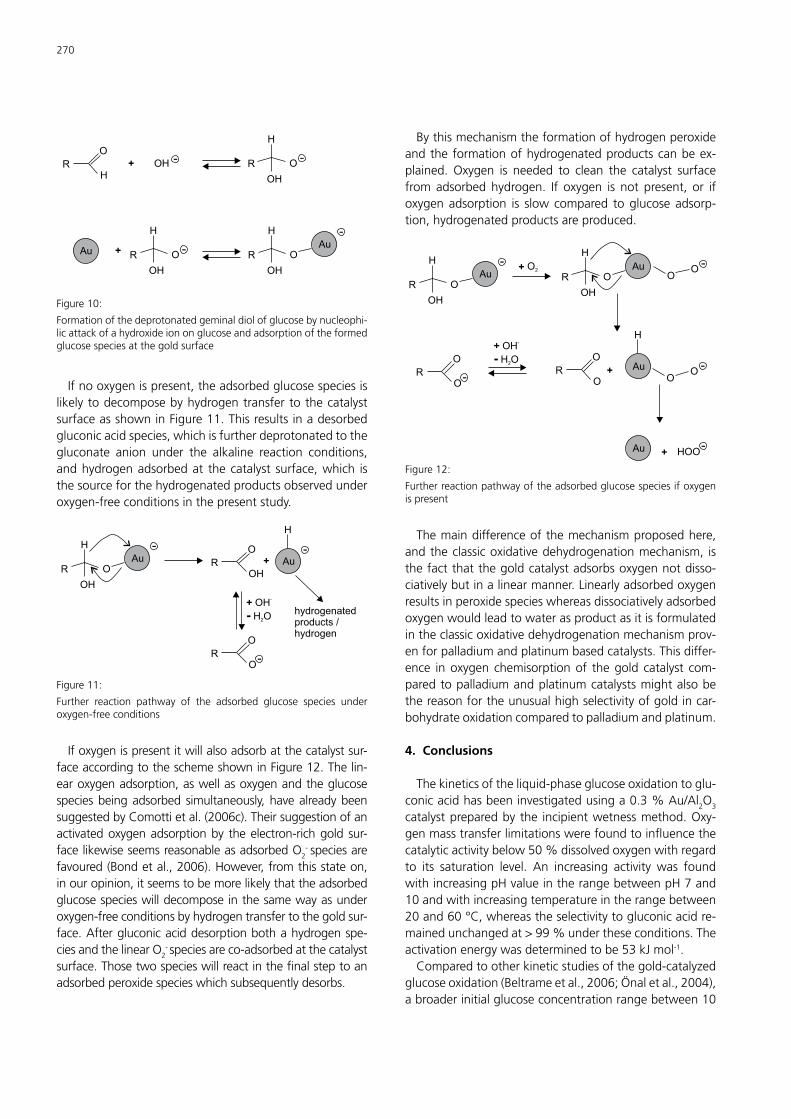
270
R
O
H
OH+
R
R
O
O
H
H
OH
OH
-
-
-
-
+AuAu
R O
H
OH
Figure10:
Formationofthedeprotonatedgeminaldiolofglucosebynucleophi-licattackofahydroxideiononglucoseandadsorptionoftheformedglucosespeciesatthegoldsurface
Ifnooxygenispresent,theadsorbedglucosespeciesislikelytodecomposebyhydrogentransfertothecatalystsurfaceasshowninFigure11.Thisresultsinadesorbedgluconicacidspecies,whichisfurtherdeprotonatedtothegluconate anion under the alkaline reaction conditions,andhydrogenadsorbedat thecatalyst surface,which isthesourceforthehydrogenatedproductsobservedunderoxygen-freeconditionsinthepresentstudy.
R
hydrogenated
products /
hydrogen
O
OH
--
-
+
+ OH
H O
-
- 2
AuAu
R O
H
H
OH
R
O
O
Figure11:
Further reaction pathway of the adsorbed glucose species underoxygen-freeconditions
Ifoxygenispresentitwillalsoadsorbatthecatalystsur-faceaccordingtotheschemeshowninFigure12.Thelin-earoxygenadsorption,aswellasoxygenandtheglucosespeciesbeingadsorbed simultaneously,havealreadybeensuggestedbyComottietal.(2006c).Theirsuggestionofanactivatedoxygenadsorptionby theelectron-richgold sur-facelikewiseseemsreasonableasadsorbedO2
-speciesarefavoured(Bondetal.,2006).However,fromthisstateon,inouropinion,itseemstobemorelikelythattheadsorbedglucosespecieswilldecomposeinthesamewayasunderoxygen-freeconditionsbyhydrogentransfertothegoldsur-face.Aftergluconicaciddesorptionbothahydrogenspe-ciesandthelinearO2
-speciesareco-adsorbedatthecatalystsurface.Thosetwospecieswillreactinthefinalsteptoanadsorbedperoxidespecieswhichsubsequentlydesorbs.
Bythismechanismtheformationofhydrogenperoxideandtheformationofhydrogenatedproductscanbeex-plained. Oxygen is needed to clean the catalyst surfacefromadsorbedhydrogen. If oxygen is not present, or ifoxygenadsorption is slowcompared toglucoseadsorp-tion,hydrogenatedproductsareproduced.
O
O
-
-
-
-
-
+
+
+
+ OH
H O
-
- 2Au
Au
AuAu R
RO
OO
O
O2
H
HH
HOO
OHOH
RR
OO
OO
Figure12:
Furtherreactionpathwayoftheadsorbedglucosespeciesifoxygenispresent
Themaindifferenceofthemechanismproposedhere,andtheclassicoxidativedehydrogenationmechanism, isthefactthatthegoldcatalystadsorbsoxygennotdisso-ciativelybutinalinearmanner.Linearlyadsorbedoxygenresultsinperoxidespecieswhereasdissociativelyadsorbedoxygenwouldleadtowaterasproductasitisformulatedintheclassicoxidativedehydrogenationmechanismprov-enforpalladiumandplatinumbasedcatalysts.Thisdiffer-ence inoxygenchemisorptionof thegold catalyst com-paredtopalladiumandplatinumcatalystsmightalsobethereasonfortheunusualhighselectivityofgoldincar-bohydrateoxidationcomparedtopalladiumandplatinum.
4. Conclusions
Thekineticsoftheliquid-phaseglucoseoxidationtoglu-conicacidhasbeeninvestigatedusinga0.3%Au/Al2O3catalystpreparedbythe incipientwetnessmethod.Oxy-genmasstransferlimitationswerefoundtoinfluencethecatalyticactivitybelow50%dissolvedoxygenwithregardto its saturation level. An increasing activity was foundwithincreasingpHvalueintherangebetweenpH7and10andwithincreasingtemperatureintherangebetween20and60°C,whereastheselectivitytogluconicacidre-mainedunchangedat>99%undertheseconditions.Theactivationenergywasdeterminedtobe53kJmol-1.Comparedtootherkineticstudiesofthegold-catalyzed
glucoseoxidation(Beltrameetal.,2006;Önaletal.,2004),abroaderinitialglucoseconcentrationrangebetween10
U. Prüße, S. Heidinger, C. Baatz / Landbauforschung - vTI Agriculture and Forestry Research 3 2011 (61)261-272 271
and1000mmoll-1wasinvestigatedinthepresentstudy.Analysisofthereactionorderswithregardtoglucoseandoxygen led to theconclusion that theEley-Ridealmodelshouldbediscardedforthegold-catalyzedglucoseoxida-tion.During glucose oxidation with oxygen, considerable
amounts of hydrogen peroxide are formed. The goldcatalyst isabletooxidiseglucosetogluconicacidunderoxygen-free conditions; considerable amounts of hydro-genatedproductsarealsoformedundertheseconditions.Bothobservationscanbeexplainedbyamodifiedoxida-tivedehydrogenationmechanism,inwhichhydrogenfromtheadsorbed sugar is transferred to thecatalyst surfacewhereitreactswithaco-adsorbedlinearoxygenmoleculeleadingtohydrogenperoxide.
Acknowledgements
TheauthorswouldliketothanktheFachagenturNach-wachsende Rohstoffe e.V. (FNR) and Südzucker AG forfinancial support, and Sasol Germany GmbH for kindlysupplyingthealuminasupport.Furthermore,wesincerelyappreciate Südzucker’s assistance in the HPLC and GCanalysisofonereactionmixture.
References
BaatzC,PrüßeU(2007)Preparationofgoldcatalystsforglucoseoxidationbyincipientwetness.JCatal249(1):34-40
BaatzC,ThieleckeN,PrüßeU(2007)Influenceofthepreparationconditionsonthepropertiesofgoldcatalystsfortheoxidationofglucose.ApplCatalB:Environ70(1-4):653-660
BeltrameP,ComottiM,DellaPinaC,RossiM(2004)Aerobicoxidationofglu-cose:I.Enzymaticcatalysis.JCatal228(2):282-287
BeltrameP,ComottiM,DellaPinaC,RossiM(2006)Aerobicoxidationofgluco-Aerobicoxidationofgluco-Aerobicoxidationofgluco-se:II.Catalysisbycolloidalgold.ApplCatalA:Gen297(1):1-7
BessonM,GallezotP (2001a)Oxidationofalcoholsandaldehydesonmetalcatalysts.In:SheldonRA,vanBekkumH(eds)Finechemicalsthroughhet-SheldonRA,vanBekkumH(eds)Finechemicalsthroughhet-Finechemicalsthroughhet-erogeneouscatalysis.Weinheim:Wiley-VCH,pp491-506
BessonM,GallezotP(2001b)Oxidationofcarbohydratesonmetalcatalysts.In:SheldonRA,vanBekkumH(eds)Finechemicalsthroughheterogeneouscatalysis.Weinheim:Wiley-VCH,pp507-518
BiellaS,PratiL,RossiM (2002)SelectiveoxidationofD-glucoseongoldca-talyst.JCatal206:242-247
BondGC,LouisC,ThompsonDT(2006)Catalysisbygold.London:ImperialCollegePr,384p
ComottiM,DellaPinaC,MatarreseR,RossiM(2004)Thecatalyticactivityof“Naked”goldparticles.AngewChem116(43):5936-5939
ComottiM,DellaPinaC,MatarreseR,RossiM,SianiA (2005)OxidationofalcoholsandsugarsusingAu/Ccatalysts :part2.Sugars.ApplCatalA:Gen291(1-2):204-209
ComottiM,DellaPinaC,RossiM(2006a)Mono-andbimetalliccatalystsforglucoseoxidation.JMolCatalA:Chem251(1-2):89-92
ComottiM,DellaPinaC,FallettaE,RossiM(2006b)Isthebiochemicalrouteal-waysadvantageous?Thecaseofglucoseoxidation.JCatal244(1):122-125
ComottiM,DellaPinaC,FallettaE,RossiM(2006c)Aerobicoxidationofgluco-sewithgoldcatalyst:hydrogenperoxideasintermediateandreagent.AdvSynthCatal348(3):313-316
GallezotP,BessonM(1995)Carbohydrateoxidationonmetalcatalysts.Carbo-hydrEurope13:5-10
LichtenthalerFW(2006)Thekeysugarsofbiomass:availability,presentnon-foodusesandpotentialfuturedevelopmentlines.In:KammB,GruberPR,KammM(eds)Biorefineries:industrialprocessesandproducts.Weinheim:Wiley-VCH,pp3-59
MallatT,BaikerA(1994)Oxidationofalcoholswithmolecularoxygenonplati-nummetalcatalystsinaqueoussolutions.CatalToday19:247-283
MirescuA,PrüßeU(2006)Selectiveglucoseoxidationongoldcolloids.CatalComm7(1):11-17
MirescuA,BerndtH,MartinA,PrüßeU(2007)Long-termstabilityofa0.45%Au/TiO2catalystintheselectiveoxidationofglucoseatoptimisedreactionconditions.ApplCatalA:Gen317(2):204-209
MirescuA,PrüßeU(2007)Anewenvironmentalfriendlymethodforthepre-parationofsugaracidsviacatalyticoxidationongoldcatalysts.ApplCatalB:Environ70(1-4):644-652
ÖnalY,SchimpfS,ClausP(2004)StructuresensitivityandkineticsofD-glucoseoxidationtoD-gluconicacidovercarbon-supportedgoldcatalysts.JCatal223:122-133
RadtkeDB,WhiteAF,Davis JV,WildeFD(1998)Dissolvedoxygen:USGeo-logicalSurveyTWRIBook9,ChapterA6,Section6.2,DO1[online].Tobefoundat<http://pubs.water.usgs.gov/twri9A/>[quoted09.06.2011]
RischbieterE,SchumpeA,WunderV(1996)Gassolubilitiesinaqueoussolu-tionsoforganicsubstances.JChemEngData41(4):809-812
ThieleckeN,AytemirM,PrüßeU(2007a)Selectiveoxidationofcarbohydrateswithgoldcatalysts:continuous-flowreactorsystemforglucoseoxidation.CatalToday121(1-2):115-120
ThieleckeN,VorlopK-D,PrüßeU(2007b)Long-termstabilityofanAu/Al2O3catalystpreparedby incipientwetness in continuous-flowglucoseoxida-tion.CatalToday122(3-4):266-269

272
LandbauforschungvTI Agriculture and Forestry Research
Lieferbare Sonderhefte / Special issues available
318 Yelto Zimmer, Stefan Berenz, Helmut Döhler, Folkhard Isermeyer, Ludwig Leible, Norbert Schmitz, 14,00 €Jörg Schweinle, Thore Toews, Ulrich Tuch, Armin Vetter, Thomas de Witte (2008)Klima- und energiepolitische Analyse ausgewählter Bioenergie-Linien
319 Ludger Grünhage and Hans-Dieter Haenel (2008) 10,00 €Detailed documentation of the PLATIN (PLant-ATmosphere Interaction) model
320 Gerold Rahmann und Ulrich Schumacher (Hrsg.) (2008) 14,00 €Praxis trifft Forschung — Neues aus der Ökologischen Tierhaltung 2008
321 Bernd Degen (Editor) (2008) 18,00 €Proceedings of the international workshop “Fingerprinting methods for the identification of timber origins”, Bonn, October 8-9 2007
322 Wilfried Brade, Gerhard Flachowsky, Lars Schrader (Hrsg) (2008) 12,00 €Legehuhnzucht und Eiererzeugung - Empfehlungen für die Praxis
323 Christian Dominik Ebmeyer (2008) 14,00 €Crop portfolio composition under shifting output price relations – Analyzed for selected locations in Canada and Germany –
324 Ulrich Dämmgen (Hrsg.) (2009) 8,00 €Calculations of Emissions from German Agriculture – National Emission Inventory Report (NIR) 2009 for 2007Berechnungen der Emissionen aus der deutschen Landwirtschaft – Nationaler Emissionsbericht (NIR) 2009 für 2007
324A Tables 8,00 €Tabellen
325 Frank Offermann, Martina Brockmeier, Horst Gömann, Werner Kleinhanß, Peter Kreins, Oliver von Ledebur, 8,00 €Bernhard Osterburg, Janine Pelikan, Petra Salamon (2009)vTI-Baseline 2008
326 Gerold Rahmann (Hrsg.) (2009) 8,00 €Ressortforschung für den Ökologischen Landbau 2008
327 Björn Seintsch, Matthias Dieter (Hrsg.) (2009) 18,00 €Waldstrategie 2020Tagungsband zum Symposium des BMELV, 10.-11. Dez. 2008, Berlin
328 Walter Dirksmeyer, Heinz Sourell (Hrsg.) (2009) 8,00 €Wasser im Gartenbau – Tagungsband zum Statusseminar am 9. und 10. Februar 2009 im Forum des vTI in Braunschweig. Organisiert im Auftrag des BMELV
329 Janine Pelikan, Martina Brockmeier, Werner Kleinhanß, Andreas Tietz, Peter Weingarten (2009) 8,00 €Auswirkungen eines EU-Beitritts der Türkei
330 Walter Dirksmeyer (Hrsg.) (2009) 14,00 €Status quo und Perspektiven des deutschen Produktionsgartenbaus
331 Frieder Jörg Schwarz, Ulrich Meyer (2009) 12,00 €Optimierung des Futterwertes von Mais und Maisprodukten
332 Gerold Rahmann und Ulrich Schumacher (Hrsg.) (2009) 8,00 €Praxis trifft Forschung — Neues aus der Ökologischen Tierhaltung 2009
333 Frank Offermann, Horst Gömann, Werner Kleinhanß, Peter Kreins, Oliver von Ledebur, Bernhard Osterburg, 10,00 €
Janine Pelikan, Petra Salamon, Jürn Sanders (2010)vTI-Baseline 2009 – 2019: Agrarökonomische Projektionen für Deutschland
334 Hans-Dieter Haenel (Hrsg.) (2010)Calculations of Emissions from German Agriculture - National Emission Inventory Report (NIR) 2010 for 2008Berechnung der Emissionen aus der deutschen Landwirtschaft - Nationaler Emissionsbericht (NIR) 2010 für 2008
12,00 €
335 Gerold Rahmann (Hrsg.) (2010)Ressortforschung für den Ökologischen Landbau 2009
8,00 €
336 Peter Kreins, Horst Behrendt, Horst Gömann, Claudia Heidecke, Ulrike Hirt, Ralf Kunkel, Kirsten Seidel, Björn Tetzlaff, Frank Wendland (2010)Analyse von Agrar- und Umweltmaßnahmen im Bereich des landwirtschaftlichen Gewässerschutzes vor dem Hintergrund der EG-Wasserrahmenrichtlinie in der Flussgebietseinheit Weser
22,00 €
337 Ulrich Dämmgen, Lotti Thöni, Ralf Lumpp, Kerstin Gilke, Eva Seitler und Marion Bullinger (2010)Feldexperiment zum Methodenvergleich von Ammoniak- und Ammonium-Konzentrationsmes-sungen in der Umgebungsluft, 2005 bis 2008 in Braunschweig
8,00 €
338 Janine Pelikan, Folkhard Isermeyer, Frank Offermann, Jürn Sanders und Yelto Zimmer (2010)Auswirkungen einer Handelsliberalisierung auf die deutsche und europäische Landwirtschaft
10,00 €
339 Gerald Schwarz, Hiltrud Nieberg und Jürn Sanders (2010)Organic Farming Support Payments in the EU
14,00 €
340 Shrini K. Upadhyaya, D. K. Giles, Silvia Haneklaus, and Ewald Schnug (Editors) (2010)Advanced Engineering Systems for Specialty Crops: A Review of Precision Agriculture for Water, Chemical, and Nutrient - Application, and Yield Monitoring
8,00 €
341 Gerold Rahmann und Ulrich Schumacher (Hrsg.) (2010)Praxis trifft Forschung — Neues aus der Ökologischen Tierhaltung 2010
8,00 €
342 Claus Rösemann, Hans-Dieter Haenel, Eike Poddey, Ulrich Dämmgen, Helmut Döhler, Brigitte Eurich-Menden, Petra Laubach, Maria Dieterle, Bernhard Osterburg (2011)Calculation of gaseous and particulate emissions from German agriculture 1990 - 2009Berechnung von gas- und partikelförmigen Emissionen aus der deutschen Landwirtschaft 1990 - 2009
12,00 €
343 Katja Oehmichen, Burkhard Demant, Karsten Dunger, Erik Grüneberg, Petra Hennig, Franz Kroiher, Mirko Neubauer, Heino Polley, Thomas Riedel, Joachim Rock, Frank Schwitzgebel, Wolfgang Stümer, Nicole Wellbrock, Daniel Ziche, Andreas Bolte (2011)Inventurstudie 2008 und Treibhausgasinventar Wald
16,00 €
344 Dierk Kownatzki, Wolf-Ulrich Kriebitzsch, Andreas Bolte, Heike Liesebach, Uwe Schmitt, Peter Elsasser (2011)Zum Douglasienanbau in Deutschland – Ökologische, waldbauliche, genetische und holzbiologischeGesichtspunkte des Douglasienanbaus in Deutschland und den angrenzenden Staaten aus naturwissen-schaftlicher und gesellschaftspolitischer Sicht
10,00 €
345 Daniel Heinrich Brüggemann (2011)Anpassungsmöglichkeiten der deutschen Rindermast an die Liberalisierung der Agrarmärkte
14,00 €
346 Gerold Rahmann (Hrsg.) (2011)Ressortforschung für den Ökologischen Landbau 2010
8,00 €
347 Hiltrud Nieberg, Heike Kuhnert und Jürn Sanders (2011)Förderung des ökologischen Landbaus in Deutschland – Stand, Entwicklung und internationale Perspektive – 2., überarbeitete und aktualisierte Auflage
12,00 €
348 Herwart Böhm (Hrsg.) (2011)Optimierung der ökologischen Kartoffelproduktion
12,00 €
5,22LBF_Vol. 61 3_U2 LBF_Vol. 61 3_U3
Landbauforschung (vTI Agriculture and Forestry Research) ist ein wissenschaftliches Publikations organ des Johann Heinrich von ThünenInstituts (vTI), Bundesforschungsinstitut für Ländliche Räume, Wald und Fischerei. Die Zeitschrift wird vom vTI heraus gegeben und erscheint vierteljährlich. Die Sprache der Beiträge ist deutsch und englisch. Sonderhefte erscheinen nach Bedarf.
In der Zeitschrift werden Forschungsergebnisse aus der Ressortforschung des BMELV mit Bezug zur Land und Forstwirtschaft und den ländlichen Räumen veröffentlicht, einschließlich Forschungs ergebnissen aus Kooperationsprojekten, an denen das vTI beteiligt ist.
Die Landbauforschung ist eine multidisziplinär ausgerichtete Zeitschrift, die die verschiedenen Facetten der Agrar und Forstwissenschaften einschließt und besonderes Augenmerk auf deren interdisziplinäre Verknüpfung legt.
Englischsprachige Beiträge sind erwünscht, damit die Forschungsergebnisse einem möglichst breiten wissenschaftlichen Diskurs zugeführt werden können.
Für den Inhalt der Beiträge sind die Autoren ver antwortlich. Eine Haftungsübernahme durch die Redaktion erfolgt nicht.
Mit der Einsendung von Manuskripten geben die Verfasser ihre Einwilligung zur Veröffentlichung. Die von den Autoren zu beachtenden Richtlinien zur Einreichung der Beiträge sind unter www.vti.bund.deoder bei der Geschäftsführung erhältlich. Das exklusive Urheber und Verwertungsrecht für angenommene Manuskripte liegt beim vTI. Es darf kein Teil des Inhalts ohne schriftliche Genehmigung der Geschäftsführung in irgendeiner Form vervielfältigt oder verbreitet werden.
Indexiert in:CAB International, Science Citation Index Expanded, Current Contents Agriculture, Biology & Environmental Sciences
Herausgeber
Johann Heinrich von ThünenInstitut (vTI)
Gutachtergremium
Siehe 3.Umschlagseite
Schriftleitung
Prof. Dr. Folkhard Isermeyer
Geschäftsführung
Dr. Matthias RützeTel. 040 . 739 62 247Leuschnerstraße 9121031 Hamburg, [email protected]
ISSN 04586859
Alle Rechte vorbehalten.
Landbauforschung vTI Agriculture and Forestry Research
Landbauforschung (vTI Agriculture and Forestry
Research) is a scientific journal of the Johann Heinrich
von Thünen Institute (vTI), Federal Research Institute
for Rural Areas, Forestry and Fisheries. The journal is
published quarterly by the vTI. The articles appear in
either German or English. Special issues are published as
required.
The journal publishes research results under the
auspices of the German Ministry of Food, Agriculture
and Consumer Protection (BMELV). Articles bear
relevance to agriculture and forestry, as well as to
rural areas, and include research results from cooperative
projects involving the vTI.
vTI Agriculture and Forestry Research is a multidis
ciplinary journal, encompassing the various facets
of this field of research and placing a particular
emphasis on interdisciplinary linkages.
English language contributions are desired so that
the research results can achieve as broad a scientific
discourse as possible.
The authors are responsible for the content of their
papers. The publishers cannot assume responsibility
for the accuracy of articles published.
With the submission of a manuscript, the author
grants his or her permission for publication. Authors
are requested to follow the guidelines for submission
found at www.vti.bund.de or available from the
management.
The vTI retains exclusive copy and usage rights for
accepted manuscripts. No portion of the content may
be duplicated or distributed in any form without the
written permission of the publisher.
Indexed in:
CAB International, Science Citation Index Expanded,
Current Contents Agriculture, Biology & Environmen
tal Sciences
Publisher
Johann Heinrich von Thünen Institute (vTI)
Editorial Board
Directors of vTIInstitutes
Editor in Chief
Prof. Dr. Folkhard Isermeyer
Managing Editor
Dr. Matthias Rütze
Phone + 49 40 .739 62 247
Leuschnerstraße 91
21031 Hamburg, Germany
www.vti.bund.de
ISSN 0458 – 6859
All rights reserved.
Gutachtergremium Editorial Board
PD Dr. Martin Banse, Institut für Marktanalyse und Agrarhandelspolitik, vTI Dr. Jürgen Bender, Institut für Biodiversität, vTI Dr. Jutta Berk, Institut für Tierschutz und Tierhaltung, FLI Prof. Dr. FranzJosef Bockisch, Institut für Anwendungstechnik, JKI Dr. Herwart Böhm, Institut für Ökologischen Landbau, vTI Prof. Dr. Andreas Bolte, Institut für Waldökologie und Waldinventuren, vTI Dr. Ulrich Dämmgen, Institut für Agrarrelevante Klimaforschung, vTI PD Dr. Sven Dänicke, Institut für Tierernährung, FLI Dr. habil. Bernd Degen, Institut für Forstgenetik, vTI PD Dr. Matthias Dieter, Institut für Ökonomie der Forst und Holzwirtschaft, vTI PD Dr. habil. Bettina EichlerLöbermann, Universität Rostock Dr. Peter Elsasser, Institut für Ökonomie der Forst und Holzwirtschaft, vTI Prof. Dr. Andreas Fangmeier, Universität Hohenheim PD Dr. Matthias Fladung, Institut für Forstgenetik, vTI Prof. Dr. Heinz Flessa, Institut für Agrarrelevante Klimaforschung, vTI Prof. Dr. Ulrike GrabskiKieron, Universität Münster PD Dr. JörgMichael Greef, Institut für Pflanzenbau und Bodenkunde, JKI Prof. Dr. Konrad Hagedorn, HumboldtUniversität Berlin PD Dr. Ingrid Halle, Institut für Tierernährung, FLI Dr. Silvia Haneklaus, Institut für Pflanzenbau und Bodenkunde, JKI Prof. Dr. Eberhard Hartung, Universität Kiel Prof. Dr. Roland Herrmann, Universität Gießen Prof. Dr. habil. Pierre Ibisch, Hochschule für nachhaltige Entwicklung, HNEE Dipl. Ing.Agr. Robert Kaufmann, Forschungsanstalt Agroscope ReckenholzTänikon ART, Schweiz Dr. Jörg Kleinschmit, Nordwestdeutsche Forstliche Versuchsanstalt Prof. Dr. Luit de Kok, Universität Groningen, Niederlande Prof. Dr. Uwe LataczLohmann, Universität Kiel Dr. Oliver von Ledebur, Institut für Marktanalyse und Agrarhandelspolitik, vTI Prof. Dr. Bernd Linke, Institut für Agrartechnik Bornim e.V. Dipl. Met. FranzJosef Löpmeier, Agrarmeteorologische Forschung des Deutschen Wetterdienstes Prof. Dr. Udo Mantau, Universität Hamburg Prof. Dr. Axel Munack, Institut für Agrartechnologie und Biosystemtechnik, vTI Dr. Hiltrud Nieberg, Institut für Betriebswirtschaft, vTI Dr. Rainer Oppermann, Institut für Ökologischen Landbau, vTI Prof. Dr. Herbert Oberbeck, TU Braunschweig Dr. Jürgen Puls, Institut für Holztechnologie und Holzbiologie, vTI Prof. Dr. Gerold Rahmann, Institut für Ökologischen Landbau, vTI Prof. Dr. Detlef Rath, Institut für Nutztiergenetik, FLI Dr. Thomas Schneider, Institut für Weltforstwirtschaft, vTI Prof. Dr. Dr. Ewald Schnug, Institut für Pflanzenbau und Bodenkunde, JKI Dr. Lars Schrader, Institut für Tierschutz und Tierhaltung, FLI Prof. Dr. Andreas Susenbeth, Universität Kiel Prof. Dr. Friedhelm Taube, Universität Kiel Prof. Dr. KlausDieter Vorlop, Institut für Agrartechnologie und Biosystemtechnik, vTI Prof. Dr. Dr. habil. Drs. h.c. Gerd Wegener, TU München Prof. Dr. HansJoachim Weigel, Institut für Biodiversität, vTI Prof. Dr. Peter Weingarten, Institut für Ländliche Räume, vTI Dr. Nicole Wellbrock, Institut für Waldökologie und Waldinventuren, vTI

5,22LBF_Vol. 61 3_U4 LBF_Vol. 61 3_U1
Vol.61 No. 3 09.2011
LandbauforschungvTI Agriculture andForestry Research
Landbauforschung vTI Agriculture andForestry Research
Vol.61 No. 3 09.2011
Preis /Price 8 €
ISSN 0458-6859
Related Documents


![VTI Glove Boxvti-glovebox.co.kr/vti-glovebox_kor_manual.pdf · 2016-03-12 · VTI Glove Box [Super] 사용자 1 1.VTI글로브박스소개 본사용자설명서의VTI글로브박스는최신기술이사용되어설계되고만들어졌습니다.](https://static.cupdf.com/doc/110x72/5f0ba21e7e708231d43176e4/vti-glove-boxvti-2016-03-12-vti-glove-box-super-1-1vtieeoeeoeeoeeoe.jpg)