United States Department of Agriculture Economic Research Service Economic Research Report Number 232 June 2017 Land Use, Land Cover, and Pollinator Health: A Review and Trend Analysis Daniel Hellerstein, Claudia Hitaj, David Smith, and Amélie Davis

Welcome message from author
This document is posted to help you gain knowledge. Please leave a comment to let me know what you think about it! Share it to your friends and learn new things together.
Transcript

United States Department of Agriculture
Economic Research Service
Economic Research Report Number 232
June 2017
Land Use, Land Cover, and Pollinator Health: A Review and Trend Analysis
Daniel Hellerstein, Claudia Hitaj, David Smith, and Amélie Davis

Economic Research Service www.ers.usda.gov
United States Department of Agriculture
Cover image: iStock
Use of commercial and trade names does not imply approval or constitute endorsement by USDA.
To ensure the quality of its research reports and satisfy government-wide standards, ERS requires that all research reports with substantively new material be reviewed by qualified technical research peers. This technical peer review process, coordinated by ERS' Peer Review Coordinating Council, allows experts who possess the technical background, perspective, and expertise to provide an objective and meaningful assessment of the output’s substantive content and clarity of communication during the publication’s review. For more information on the Agency’s peer review process, go to: http://www.ers.usda.gov/about-ers/peer-reviews.aspx
In accordance with Federal civil rights law and U.S. Department of Agriculture (USDA) civil rights regulations and policies, the USDA, its Agencies, offices, and employees, and institutions participating in or administering USDA programs are pro-hibited from discriminating based on race, color, national origin, religion, sex, gender identity (including gender expression), sexual orientation, disability, age, marital status, family/parental status, income derived from a public assistance program, political beliefs, or reprisal or retaliation for prior civil rights activity, in any program or activity conducted or funded by USDA (not all bases apply to all programs). Remedies and complaint filing deadlines vary by program or incident.
Persons with disabilities who require alternative means of communication for program information (e.g., Braille, large print, audiotape, American Sign Language, etc.) should contact the responsible Agency or USDA's TARGET Center at (202) 720-2600 (voice and TTY) or contact USDA through the Federal Relay Service at (800) 877-8339. Additionally, program information may be made available in languages other than English.
To file a program discrimination complaint, complete the USDA Program Discrimination Complaint Form, AD-3027, found online at How to File a Program Discrimination Complaint and at any USDA office or write a letter addressed to USDA and provide in the letter all of the information requested in the form. To request a copy of the complaint form, call (866) 632-9992. Submit your completed form or letter to USDA by: (1) mail: U.S. Department of Agriculture, Office of the Assis-tant Secretary for Civil Rights, 1400 Independence Avenue, SW, Washington, D.C. 20250-9410; (2) fax: (202) 690-7442; or (3) email: [email protected].
USDA is an equal opportunity provider, employer, and lender.
Access this report online: www.ers.usda.gov/publications/
Download the charts contained in this report:
• Gotothereport’sindex page www.ers.usda.gov/publications/
• Clickonthebulleteditem“DownloadERR232.zip”
• Openthechartyouwant,thensaveittoyourcomputer
Recommended citation format for this publication:
Hellerstein, Daniel, Claudia Hitaj, David Smith, and Amélie Davis. Land Use, Land Cover, and Pollinator Health: A Review and Trend Analysis, ERR-232, U.S. Department of Agriculture, Economic Research Service, June 2017.

United States Department of Agriculture
Economic Research Service
Economic Research Report Number 232
June 2017
AbstractAbout 35 percent of the world’s food crops depend on pollinators, including managed honey bees, to reproduce. However, pollinators face a number of stressors, such as parasites, poor nutrition, pesticides, and diseases. A literature review indicates that pollinators may benefit from landscapes richer in high-quality forage (pollen and nectar sources) and highlights the different needs of managed honey bees and native (unman-aged) pollinators. This study uses 30 years of data on U.S. land uses to calculate a polli-nator forage suitability index. When averaged across the Nation, the forage suitability index increased from 1982 to 2002 and declined slightly from 2002 to 2012—though in important honey bee regions (such as Central North and South Dakota), the decline from 2002 to 2012 is more pronounced. The study also analyzes the economics of providing better pollinator forage, such as assigning property rights for colony place-ment and voluntary government conservation programs to increase pollinator forage.
Keywords: Pollinators, honey bees, land use, land cover, forage, economics
AcknowledgmentsThe authors would like to thank the following individuals for technical peer reviews: Alisa Gallant, U.S. Geological Survey; Jeff Pettis, USDA, Agricultural Research Service; John Englert, USDA, Natural Resources Conservation Service; Joy Harwood, Skip Hyberg, and Alex Barbarika, USDA, Farm Service Agency; Jennifer Bond, USDA, Economic Research Service (ERS); and two reviewers who requested anonymity. We also thank John Weber and Cynthia A. Ray of ERS for editorial and design services.
About the authors Daniel Hellerstein, Claudia Hitaj, and David J. Smith are economists with USDA, Economic Research Service. Amélie Davis is an assistant professor at Miami University with a joint appointment in the Department of Geography and the Institute for the Environment and Sustainability.
Daniel Hellerstein, Claudia Hitaj, David Smith, and Amélie Davis
Land Use, Land Cover, and Pollinator Health: A Review and Trend Analysis

ii Land Use, Land Cover, and Pollinator Health: A Review and Trend Analysis, ERR-232
Economic Research Service/USDA
Contents
Summary . . . . . . . . . . . . . . . . . . . . . . . . . . . . . . . . . . . . . . . . . . . . . . . . . . . . . . . . . . . . . . . . . . . . . iii
Introduction . . . . . . . . . . . . . . . . . . . . . . . . . . . . . . . . . . . . . . . . . . . . . . . . . . . . . . . . . . . . . . . . . . . .1
Pollinators in Agriculture: Native Bees, Pollination Services, Honey Production, and Population Trends . . . . . . . . . . . . . . . . . . . . . . . . . . . . . . . . . . . . . . . . . . . . . . . . . . . . . . . . . . .2
A Review of Land Use and Pollinator Health . . . . . . . . . . . . . . . . . . . . . . . . . . . . . . . . . . . . . . . . .6Native pollinators and honey bees: Land-use and land-cover needs . . . . . . . . . . . . . . . . . . . . . . .6USDA land-use and pollinator programs . . . . . . . . . . . . . . . . . . . . . . . . . . . . . . . . . . . . . . . . . . 10
Trends in Pollinator Forage Suitability in the United States . . . . . . . . . . . . . . . . . . . . . . . . . . .12Data . . . . . . . . . . . . . . . . . . . . . . . . . . . . . . . . . . . . . . . . . . . . . . . . . . . . . . . . . . . . . . . . . . . . . . .12Methods . . . . . . . . . . . . . . . . . . . . . . . . . . . . . . . . . . . . . . . . . . . . . . . . . . . . . . . . . . . . . . . . . . . .12
Results . . . . . . . . . . . . . . . . . . . . . . . . . . . . . . . . . . . . . . . . . . . . . . . . . . . . . . . . . . . . . . . . . . . . . . .15
An Economics Perspective: Markets and the Role of Public Policy . . . . . . . . . . . . . . . . . . . . . .20Land for pollinators provides a positive externality . . . . . . . . . . . . . . . . . . . . . . . . . . . . . . . . . . . 21Land for commercial honey bees: Open access considerations . . . . . . . . . . . . . . . . . . . . . . . . . . 21Ecosystem services and co-products: Opportunity for collaboration in the provision of public goods . . . . . . . . . . . . . . . . . . . . . . . . . . . . . . . . . . . . . . . . . . . . . . . . .22Sustainability and marginal decisions . . . . . . . . . . . . . . . . . . . . . . . . . . . . . . . . . . . . . . . . . . . . .23Considering the participants . . . . . . . . . . . . . . . . . . . . . . . . . . . . . . . . . . . . . . . . . . . . . . . . . . . .24Government actions . . . . . . . . . . . . . . . . . . . . . . . . . . . . . . . . . . . . . . . . . . . . . . . . . . . . . . . . . . .25
Conclusions . . . . . . . . . . . . . . . . . . . . . . . . . . . . . . . . . . . . . . . . . . . . . . . . . . . . . . . . . . . . . . . . . . .26
References . . . . . . . . . . . . . . . . . . . . . . . . . . . . . . . . . . . . . . . . . . . . . . . . . . . . . . . . . . . . . . . . . . . .28
Appendix 1: FSI Scores for NRI Land-Use Categories . . . . . . . . . . . . . . . . . . . . . . . . . . . . . . . .36
Appendix 2: Changes in Acreage for Broad Categories (of Land Uses/Covers With Similar FSI) . . . . . . . . . . . . . . . . . . . . . . . . . . . . . . . . . . . . . . . . . . .38
Appendix 3: Sensitivity Analysis: Changing the FSI of CRP Acreage . . . . . . . . . . . . . . . . . . .41

United States Department of Agriculture
ERS is a primary source of economic research and
analysis from the U.S. Department of Agriculture, providing timely informa-
tion on economic and policy issues related to agriculture, food, the environment, and
rural America. www.ers.usda.gov
United States Department of Agriculture
Economic Research Service
Economic Research Report Number 232
June 2017
Land Use, Land Cover, and Pollinator Health: A Review and Trend Analysis
Daniel Hellerstein, Claudia Hitaj, David Smith, and Amélie Davis
June 2017
Find the full report at www.ers.usda.gov/
publications
Daniel Hellerstein, Claudia Hitaj, David Smith, and Amélie Davis
Land Use, Land Cover, and Pollinator Health: A Review and Trend Analysis
What is the issue?
Crops that depend on pollinators account for up to one-third of total U.S. food consumption. However, honey bees and other pollinators face a variety of stressors, including diseases, insect pests, pesticide exposure, and changing landscapes. Over the last decade, annual losses of managed honey bee colonies have been high. Better nutrition for pollinators may help alleviate the effects of some of the stressors. Changing the Nation’s land uses and land covers (LULC)—such as by planting vegetation rich in nectar and nutritious types of pollen—may improve the forage available to pollinators. This study reviews the literature on the effects of land use on pollinator health and examines trends in pollinator forage quality as LULC has changed in the United States over the last 30 years.
What did the study find?
A review of the literature reveals that both managed honey bees and native pollinators face several sources of stress that affect colony health. The main findings include:
• Honeybeemortality,asmeasuredbythelossofahoneybeecolony,ishigherthaninprevious decades. Annual losses varied between 29 and 45 percent of colonies from 2010-11 to 2015-16.
• Assessingthestatusofnativepollinatorsisdifficultbecauselong-termpopulationdataarenot available. However, evidence points to population decline for several wild bee species (notably bumblebees) and some butterflies, bats, and hummingbirds.
• Avarietyofstressorsaffectthehealthofhoneybeecolonies.Beekeepersreportedthatinspring 2015, nearly 45 percent of colonies were affected by varroa mites, 20 percent were affected by other pests, and 17 percent were affected by pesticides.
Beekeepers in the United States have maintained and even increased the number of colonies over the last decade through intensive management of honey bee colonies:
• Adaptedpracticesincludesplittingahoneybeecolonyandaddinganewqueentooneofthesplits, systematic monitoring of colonies for pests and pathogens, and supplemental feeding.
• Thenumberofhoney-producingcolonieshasincreasedby9percentfrom2.44millionin2007 to 2.66 million in 2015. Over the same period, the value of production of the top 10 pollinator-dependent crops grew by a weighted average of around 76 percent.
A report summary from the Economic Research Service
Summary

The literature review also reveals evidence of how LULCs that contain vegetation beneficial to pollinators improve both pollinator abundance and health and can lead to better agricultural outcomes. The LULC-related needs of native pollinators differ from those of managed honey bees.
• Nativepollinatorsbenefitfromaccesstonearbyhigh-qualityforagehabitat—habitatthatisbothrichinplants that provide pollen and nectar and that contain nesting opportunities.
• Managedhoneybeesareoftentransportedfromlocationtolocationbytheirbeekeeperstoprovidepollina-tion services and to increase honey production. Thus, the overall availability of forage may matter more than its exact placement. For example, the provision of high-quality forage land in the Dakotas, where many honey bee colonies spend the summer refortifying themselves, may help improve colony survival rates.
To examine how broad land-use changes have affected the ability of the land to provide forage to pollinators, ERS developed a forage suitability index (FSI) that links pollinator forage quality to LULC. Findings show that forage suitability was unchanged for most (75 percent) of the Nation between 1982 and 2012. Overall LULC changes in this timespan led to a small increase in the average FSI nationally. This is in part due to land taken out of agricultural production under USDA’s Conservation Reserve Program (CRP).
However, the overall results mask regional and temporal variation:
• From1982to2002,FSIimprovedonabouttwiceasmanyacresasitdeclined.Butfrom2002to2012,theindex declined on more acres than it improved.
• InNorthandSouthDakota'ssummerforaginggrounds,FSIdeclinedmorethanthenationalaveragebetween 2002 and 2012. This change is driven by decreases in acres with high FSI LULCs (such as CRP) and increases in acres in low FSI LULCs (such as soybeans).
These findings are limited by the study’s focus on estimated changes in the FSI. Other factors that may affect pollinator health—such as changes in land management, including pesticide use, and changes in field size and associated densities of uncultivated field edges—are not considered.
The report concludes with a summary of economic insights on issues facing the development of markets for forage-rich pollinator habitat. Pollinator habitat has “public good” features, so markets to provide better polli-nator habitat may not readily develop. This can lead to under-provision of forage-rich landscapes. For example, if a landowner converts land to honey bee-friendly habitat, his or her honey bees may benefit from this conver-sion but so, too, will honey bees managed by others. Thus, the landowner incurs the full cost of this conversion without reaping full benefits. Assigning exclusionary rights for hive placement—as is done in a few States—may encourage beekeepers and landowners to work together to install pollinator friendly habitat. In addition, the Government can support the creation of pollinator habitat, such as through pollinator-friendly covers on CRP land.
How was the study conducted?
The study reviews the economics and ecology literature on land use, land cover, and pollinators. Data from the National Resources Inventory (NRI) are used to supply land cover/use for 970,000 points in the conterminous United States from 1982 to 2012. Using an expert assessment of the average pollinator forage score for different types of land use, along with this land use/cover variable, researchers assigned each NRI point an FSI. Trends in pollinator habitat quality are computed by aggregating these index scores over regions. Lastly, economic theory informs the discussion of factors that can lead to under-provision of pollinator-friendly habitat.
www.ers.usda.gov

1 Land Use, Land Cover, and Pollinator Health: A Review and Trend Analysis, ERR-232
Economic Research Service/USDA
Land Use, Land Cover, and Pollinator Health: A Review and Trend Analysis
Introduction
About one-third of the world’s food crops depend, in varying degrees, on pollinators—including managed honey bees and more than 3,500 species of native bees (USDA-NRCS, 2016d). Some crops, such as almonds and melons, require pollination to produce nuts or fruit; other crops, such as tomatoes, apples, blueberries, cherries, and canola, receive a yield boost from pollination. The production of pollinator-dependent crops has increased over the last several decades, but the number of pollinators has declined (Aizen and Harder, 2009).1 In addition, beekeepers report elevated honey bee colony mortality over the last decade—for example, in the United States, nearly half of managed bee colonies were lost in 2015 (BIP, 2016; USDA-NASS, 2016b).
Honey bee well-being is affected by numerous stressors, such as insect pests (e.g., varroa mites), pesticide exposure, compromised nutrition, long-distance travel, and various diseases (e.g., European foulbrood). These factors have affected colony management, with beekeepers intensifying both monitoring and treatment of their hives (Alaux et al., 2010; Grünewald, 2010). Moreover, the thou-sands of native bee species in the United States (Droege, 2015) are also under stress from pesticide exposure and changes in native habitat (Steffan-Dewenter, 2008; Rose et al., 2014; Potts et al., 2015).
It is generally accepted by researchers that the various stressors facing honey bees and wild pollina-tors have a synergistic effect (USDA, 2012, Bryden et al., 2013). The integrated nature of these inter-actions, where any one additional stressor amplifies the decline in bee health, may explain the broad range of actions recommended by a variety of stakeholder groups, such as limiting neonicotinoid pesticide applications or combating varroa mite infestations (EPA, 2014).
Better nutrition may alleviate some of the synergistic stress impacts. Pollinators with access to good forage—the nectar and pollen of flowering plants—better withstand other stressors (Huang, 2012; Naug, 2009). Land with good-quality forage contains vegetation that provides abundant and diverse nectar and nutritious pollen (USDA, 2014). Land meeting those criteria could be (1) wild lands, (2) restored land that is planted with appropriate vegetation, or (3) cultivated lands that contain a more pollinator-friendly set of crops or cropping patterns. In the case of wild pollinators, land must also provide quality nesting habitat.
This study seeks to address the following questions. What is known about the impacts of LULC on pollinator health? How have nationwide changes in LULC affected honey bee forage availability? What economic issues may limit the capability of markets to provide pollinator-friendly LULC? And what issues bear consideration when evaluating how voluntary Government conservation programs, such as USDA’s Conservation Reserve Program and Environmental Quality Incentives Program, can provide pollinator-friendly habitat?
1The number of honey-producing colonies declined from 5.9 million in 1947 to 2.3 million in 2008, before recovering to 2.78 million in 2016 (Hoff, 1995; USDA-NASS, 2017).

2 Land Use, Land Cover, and Pollinator Health: A Review and Trend Analysis, ERR-232
Economic Research Service/USDA
Pollinators in Agriculture: Native Bees, Pollination Services, Honey Production, and Population Trends
While most agricultural commodities are wind pollinated, about 35 percent of the world’s food crops, primarily fruit, nuts, and vegetables, either require or benefit from insect pollination (USDA-NRCS, 2016d). Estimates of the annual value of pollinators in the United States range from $150 million to $19 billion (National Research Council, 2007), depending mainly on whether those values account for willingness to pay and indirect benefits of crops that require pollinators to produce seeds. 2 A frequently used estimate of the value of insect pollination services to crops is $15 billion, of which $12 billion is attributable to honey bees and $3 billion is attributable to other pollinators (Johnson 2010, Calderone 2012, Pollinator Health Task Force 2016).
Pollinators can be broadly classified in two categories: native pollinators and honey bees (Apis melilifera). The broad variety of native pollinators includes over 3,500 species of bees (most of which are solitary), moths and beetles, and other animals (such as bats and birds). With a few exceptions, native pollinators are not domesticated—they live, forage, and breed in the wild.3
Native bees in North America that pollinate crops include bumblebees (tomatoes and other green-house crops), the alkali bee (alfalfa hay, clover, and mint), the blue orchard bee (almonds, apples, and sweet cherries), and the aptly named squash and gourd bee, sunflower bee, and blueberry bee (National Research Council, 2007). Assessing the status of wild pollinators is difficult because data on long-term population are not available. However, there has been demonstrable evidence of population decline for several wild bee species (notably bumblebees) and some butterflies, bats, and hummingbirds (National Research Council, 2007).
Native pollinators are particularly efficient pollinators for a variety of crops, including pumpkin, tomato, cranberry, and blueberry—crops valued at $3 billion annually in the United States (Losey and Vaughan, 2006). With sufficient habitat, native pollinators could provide all of the necessary pollination for these specific crops (Barfield et al., 2015). In contrast, honey bees are generalist polli-nators and can pollinate a wider variety of crops, though not as efficiently as some native pollinators (National Research Council, 2007). However, honey bees can be managed by beekeepers and placed around crops during pollination time.
Honey bees are social insects that live together as a colony in a hive, usually a special box provided by a beekeeper. A colony consists of a single queen bee along with tens of thousands of female worker bees and hundreds of male drones. Honey bees collect pollen and nectar from flowering plants. During the winter, honey bees survive on the honey they have produced, though beekeepers can supplement their feed with sugar water and plant-based protein powders. Beekeepers can
2The higher values are derived by calculating the loss of agricultural production due to a hypothetical removal of all commercial honey bees with no substitute pollination method employed, and all other economic variables held constant (e.g., output prices, input costs). They do not include other values, such as impacts on the reproduction and diversity of noncultivated flora.
3Other than honey bees, a few insects are commercially available for pollination services. These include bumblebees—a colony insect that is often used in greenhouses to pollinate tomatoes and other high-value crops (http://extension.psu.edu/pests/ipm/pestproblemsolver/greenhouse/bugvsbug/bumble). The solitary alfalfa leaf cutter bee—a European bee introduced into the United States sometime after 1930—is used in the production of alfalfa seed (http://agr.mt.gov/agr/Programs/Bees/LeafcutterBees.html), and the solitary blue orchard bee is used as an orchard pollinator (www.ars.usda.gov/pacific-west-area/logan-ut/pollinating-insect-biology-management-systematics-research/docs/blue-orchard-bee/).

3 Land Use, Land Cover, and Pollinator Health: A Review and Trend Analysis, ERR-232
Economic Research Service/USDA
manage their colonies to produce honey, pollination services, and even other products, such as beeswax, throughout the year.
Farmers who grow crops that depend on pollination can choose to rely on wild pollinators in the area or pay beekeepers to place honey bees or other managed bees, such as the blue orchard bee, around their crops. In 2016, commercial honey bee keepers in the United States produced honey valued at $336 million and other products, including queens and beeswax, valued at $149 million (USDA-NASS, 2017) and earned $354 million from pollination services (USDA-NASS, 2016c).4 Almost four-fifths of pollination service fees in 2016 were collected from producers of almonds, followed by producers of apples, blueberries, and cherries (table 1). Production of the top four crops grown by farmers requiring pollination services increased from 2007 to 2015. For the top 10 crops as a whole, growth averaged around 76 percent (in value of production terms, weighted by the proportion of collected pollination fees for each crop). Over the same period, the number of honey-producing colonies grew by 9 percent (USDA-NASS, 2017).
4Beekeepers can engage in one or more of these activities throughout the year.
Table 1Top 10 crops by pollination value in 2016 and change in the value of their production from 2007 to 2015
Crop (region)Colonies used
in 2016
Total value of pollination,
2016 Price per
colony in 2016
Value of production in
2015
Change in value of production,
2007-15 (inflation adjusted)
Number 1,000 dollars Dollars 1,000 dollars Percent
Almond (6&7) 1,680,000 280,560 167.0 5,325,000 93.9
Apple (1,2,4,5,6&7) 183,400 10,167 52.6 3,394,185 13.8
Blueberry (1,2,3,5,6&7) 147,000 10,166 66.5 584,150 59.6
Cherry (1,4,5,6&7) 134,100 7,711 51.8 703,228 19.9
Melon: watermelon, cantaloupe, honeydew (1,2,3,5,6&7) 133,500 7,156 53.6 825,072 -9.6
Cranberry (1,5,6&7) 88,000 6,740 74.6 27,455 -1.3
Alfalfa (6&7) 92,000 5,851 63.6 8,729,134 -13.8
Plum (6&7) 46,000 2,962 64.4 104,760 -9.4
Avocado (6&7) 69,000 2,815 40.8 295,797 -24.2
Cucumber (1,2,3,6&7) 42,500 2,112 48.6 176,983 -35.2
Other 362,300 17,977 49.6
All crops 2,977,800 354,217 119.0
Note: NASS Cost of Pollination Survey provides the cost of pollination by crop for specific regions (1 through 7, available at http://usda.mannlib.cornell.edu/usda/current/CostPoll/CostPoll-12-22-2016.pdf) but not for the United States as a whole to avoid disclosing data of individual producers in particular regions. Thus, the category “other” in the table above may include the cost of pollination of some of the already listed crop categories for excluded regions. The total of colonies used is not a measure of total colonies because a colony can be used to pollinate multiple crops throughout the year. These numbers do not necessarily account for the value of all pollination services provided by honey bees. The price per colony is an unweighted average price across all regions for which an estimate is available.
Source: USDA, Economic Research Service analysis of USDA, National Agricultural Statistics Service (NASS) Cost of Pollination Survey (USDA-NASS, 2016c) and USDA, NASS QuickStats data portal (USDA-NASS, 2016a).

4 Land Use, Land Cover, and Pollinator Health: A Review and Trend Analysis, ERR-232
Economic Research Service/USDA
Honey-producing colonies in the United States declined from 5.9 million in 1947 to a low of 2.3 million in 2008, before recovering to 2.8 million in 2016 (Hoff, 1995; USDA-NASS, 2017; vanEngelsdorp and Meixner, 2010). The recent increase in honey-producing colonies has not kept pace with the growth in the value of production of pollinator-dependent crops.
In addition, honey bee mortality, as measured by the loss of a honey bee colony, has remained high for the past decade (fig. 1). Nationwide data on winter loss rates are not available prior to 2006, but several studies indicate winter loss rates in previous decades were 17-20 percent (John, 2010) or around 15 percent (Burgett et al., 2010; Pernal, 2008; Rucker et al., 2016; vanEngelsdorp et al., 2007). In 2006-07, approximately 30 percent of honey bee colonies were lost during the October 1 through April 1 over-winter period. While the over-winter loss rate has since dimin ished (22 percent in 2014-15), over-summer losses have grown. Colony loss is expected predominantly during the colder winter, but in 2014-15, summer losses (27 percent) exceeded winter losses (23 percent) for the first time (Kaplan, 2015). The net result is that in 2015-16, about 44 percent of colonies perished, compared with 36 percent in 2010-11 (BIP, 2016). The 2015-16 loss estimate of 44 percent is similar to the 43.4 percent annual loss estimate that ERS calculated based on quarterly numbers from the USDA, National Agricultural Statistics Service Colony Loss Report (USDA-NASS, 2016b). The Colony Loss Report provides quarterly loss estimates beginning only in 2015, but the survey is representative nationally, while the Bee Informed Partnership (BIP) survey is based on validated responses from 5,756 beekeepers that collectively managed about 15 percent of the country’s 2.66 million managed honey-producing colonies.5
The increase in honey-producing colony numbers since 2008, even with high colony mortality, is driven by intensified beekeeper management—splitting hives, purchasing new queens, and adopting preventative measures to maintain colony health. This includes systematic monitoring for pests and pathogens to inform the application of miticides, antibiotics, and other chemicals; and the use of supplemental feeds, such as during the early spring before almond bloom (USDA, 2012; Bee Culture, 2016), a time when honey bees are naturally in a dormancy period.
Honey bee colonies are lost for a variety of reasons, as many stressors affect honey bee health simultaneously. The recently released Colony Loss Survey (USDA-NASS, 2016b) asked beekeepers to identify the stressors affecting their colonies. Responses showed that in spring 2015, nearly 45 percent and 20 percent of colonies were affected by varroa mites or other pests, respectively, and 17 percent were affected by pesticides (fig. 2).
Given the importance of pollinators to the Nation’s food supply, farmers, researchers, and Government agencies are considering various pathways to improve pollinator health. One such pathway is improved pollinator habitat—a landscape that provides nutritious forage, nesting oppor-tunities for native pollinators, and reduced risk from pests, pathogens, and pesticides.
5See Steinhauer (2016) for a discussion of the differences between NASS and Bee Informed Project estimates of colony loss.

5 Land Use, Land Cover, and Pollinator Health: A Review and Trend Analysis, ERR-232
Economic Research Service/USDA
Figure 1
Managed honey bee colony numbers and loss estimates for the United States
2.1
2.2
2.3
2.4
2.5
2.6
2.7
2.8
2.9
0
5
10
15
20
25
30
35
40
45
50
2006-07 2007-08 2008-09 2009-10 2010-11 2011-12 2012-13 2013-14 2014-15 2015-16
Total winter loss Total annual loss
Number of colonies
Losses (percent) Number of honey-producing colonies (millions)
Note: Annual colony loss estimates from the Bee Informed Partnership are for the period from October 1 to September 30 of the following year, and winter loss estimates are from October 1 to April 1 of the following year. Note that before 2010-11, data on summer losses were not gathered. The data on the number of honey-producing colonies are from the NASS Honey Report. Source: USDA, Economic Research Service using Bee Informed Partnership (2016) and USDA, National Agricultural Statistics Service (NASS) Honey Report (USDA-NASS 2017).
Figure 2
Stressors affecting honey bee colonies, 2015
Percent of colonies
Note: A colony could be affected by more than one stressor simultaneously.Source: USDA, Economic Research Service using USDA, National Agricultural Statistics Service, Colony Loss Survey (2016).
0
5
10
15
20
25
30
35
40
45
Varroa Pests (excl.varroa)
Pesticides Other Disease Unknown
Jan-Mar Apr-Jun Jul-Sep Oct-Dec

6 Land Use, Land Cover, and Pollinator Health: A Review and Trend Analysis, ERR-232
Economic Research Service/USDA
A Review of Land Use and Pollinator Health
While both wild bees and managed honey bees contribute to agricultural production, they in turn depend on the land to provide forage resources—the pollen and nectar of flowering plants that bees feed on to survive. The quality and quantity of pollinator forage available to pollinators depend on the land use and land cover (LULC). And, if forage resources provided by an LULC are inadequate, pollinator health may be poor.
The literature on LULC and pollinator health has grown rapidly over the last decade, and a number of literature reviews and meta-analyses that combine data from multiple studies are now available (see table 2).6 Many of these studies link pollinator proclivities, especially those of native pollinators, with LULC characteristics, such as the amount and spatial configuration of land under various covers.
Native pollinators and honey bees: Land-use and land-cover needs
Native pollinators
During pollination season, the number and species mix of native pollinators depend on existing LULCs. Many native pollinator species have short life cycles and are dormant much of the year. Thus, a given pollinator species may not be active when a crop of interest (such as tomatoes) needs pollination. In general, native pollinators have shorter foraging ranges than do honey bees, and native bees require nesting habitat (Ricketts et al., 2008). Thus, pollinator-supporting LULCs need to be fairly close (often less than 500 meters) to the crops that need pollination services from native pollinators (Garibaldi et al., 2011).
On a per-individual basis, native pollinators often are more effective at pollinating crops than honey bees (Garibaldi et al., 2011); however, the densities of native pollinators may be low. It is typically difficult to increase the numbers of native pollinators on an as-needed basis.
Honey bees
Honey bees are not native to the United States and arrived with European settlers. They may be “wild” or “managed” (subject to beekeeper management). Since wild honey bees are no longer abun-dant (Kershner, 1999), this study considers managed honey bees only.
In some ways, honey bees are managed like livestock. In search of forage, given differences in weather and predominant vegetation, honey bees are moved around by beekeepers to find good “pasture.” In other ways, honey bee management is like the provision of agricultural services: the bees are moved to areas where pollination services are required, and then they are moved again (fig. 3).
Honey bees forage throughout much of the warm seasons and, in colder months, will cluster together in their hives. While foraging, they consume available pollen and nectar and store any surplus. During the cold months or when forage opportunities are sparse, they consume pollen and honey from their stores. Consumption of available pollen and nectar occurs regardless of nutritional
6The studies used in these meta-analyses do overlap. Later meta-analyses tend to draw from a large set of studies, both due to their ability to use more recent studies and due to searches that examine richer citation databases. In addition to these meta-analyses, non-review-type articles that analyze forage requirements and landscape composition include Cusser and Goodell (2013), Härtel and Steffan-Dewenter (2014), and Jhaand Kremen (2013).

7 Land Use, Land Cover, and Pollinator Health: A Review and Trend Analysis, ERR-232
Economic Research Service/USDA
Table 2
Synopsis of selected literature reviews on land use/land cover and pollinator health (ordered by year of publication)
Publication Synopsis and general findings
Ricketts et al. (2008) A synthesis of results from 23 studies estimating the relationship between pollination services and distance to natural habitats. Pollinator richness and visitation rates to crops exponentially decline with increasing distance from natural habitat, with evidence indicating overall decline in fruit and seed set (though landscape effects on pollination services can vary substantially).
Brown and Paxton (2009)
A synopsis of 12 reviews on the threats to pollinators suggesting that habitat loss is the major threat to pollinator diversity, while invasive species, emerging diseases, pesticide use, and climate change also have the potential to affect bee populations.
Winfree et al. (2009) A meta-analysis of wild bee abundance and species richness using data from 130 effects (from 54 stud-ies) and measures of human disturbance. Although both abundance and richness were affected by dis-turbance, the magnitude of the effects was not large: wild bee abundance and richness were significantly reduced by habitat loss only in systems experiencing extreme habitat loss (less than 5 percent natural-habitat cover or located 1 km from the nearest natural habitat). The study also notes that the abundance of managed honey bees is not associated with anthropogenic disturbance.
Potts et al. (2010) A study describing the nature and extent of reported declines and reviewing the potential drivers of pol-linator loss, including habitat loss and fragmentation. Evidence for decline in honey bees in the United States and Europe is noted, as is the lack of information about wild pollinators (whose contributions might be higher than assumed). The study notes several reviews that find negative effects of various types of disturbance (such as habitat loss and habitat fragmentation) on wild bee populations (though little evidence of impact on honey bees). The researchers note that “interactions between multiple driv-ers” are the most probable explanation for elevated over-wintering mortality in honey bee colonies.
Brodschneider and Crailsheim (2010)
Data inferred from over 20 articles that illuminate the nutritional demands of honey bees at 3 levels (colony, adult, and larval nutrition). Malnutrition can occur at any of these levels and can have long-term consequences. The authors note the importance, yet not well studied, of sub-lethal levels of larval and adult malnutrition and the substantial threat when malnutrition is combined with other stressors (such as parasitism and sub-lethal pesticide exposure).
Garibaldi et al. (2011)
A synthesis of data from 29 studies testing the effects of isolating bees from natural areas. The findings are consistent with the prediction that isolation from natural areas reduces both the stability and the mean levels of flower-visitor richness and visitation rate, with a lesser effect on fruit set in crop areas. The study notes that habitat loss is a major and consistent cause for the decline in richness and abundance of pollinating insects around the globe and that a negative association between isolation and crop fruit set was detected even though similar trends were not detected for related honey bee visitation. This suggests that pollination services provided by other (wild) insects are important even in the presence of A. mellifera.
Viana et al. (2012) A 2011 survey of the Web of Science Citation Index yielded 219 studies; with only 10 before 2000 and peaking at over 45 per year in 2010. About three-fourths are observational studies, often appearing in purely scientific journals. Most studies are from temperate zones, and most focus on the “patch,” rather than landscape level. Landscape-level work tends to consider land use in “buffers” around study sites. However, characteristics of the surrounding “inter-habitat matrix” have become more common. Overall, the review finds that “many authors demonstrated that the spatial organization of the landscape has a great influence on the survival and dispersal capacity of many pollinator species.”
Kennedy et al. (2013)
A meta-analysis model of wild bee abundance, using data from the literature on over 600 sites covering 39 studies around the world (most from temperate biomes), including measures of local farm management (such as extent of organic farming) and landscape composition and configuration. The study reports that the most important factors enhancing wild bee communities in agro-ecosystems were the amounts of high-quality habitats surrounding farms in combination with organic management and local-scale field diversity. The quality of the surrounding landscape, the local diversification of farmland, and organic management can act as substitutes (with shortcomings in one enhancing the benefits of the others).
Paudel et al. (2015) A broad review of honey bee and pollination issues, including land use and forage. The authors review trends in honey bee populations and the effects of declines on ecology and the agricultural economy. They note that “habitat loss might be one of the biggest factors impacting honey bee declines and the agricultural landscape changes after the Second World War.”

8 Land Use, Land Cover, and Pollinator Health: A Review and Trend Analysis, ERR-232
Economic Research Service/USDA
completeness, as honey bees tend to consume the pollen and nectar currently available by plants surrounding their hive, even if this source of food is of lower quality than the food in their stores (personal communication, Jeff Pettis, retired research entomologist, USDA-ARS Bee Research Laboratory). Thus, when honey bees are foraging, the availability of a diverse mix of forage—one that is likely to provide a balanced set of nutritional factors—is beneficial. On the other hand, episodic abundance of a single source of high quality forage (e.g., a mass flowering of canola) is beneficial as well, as it helps a honey bee colony build up reserves (both in terms of the number of workers and the amount of stored food).
While supplemental feeding is a common practice, the long-term efficacy of such foods as nutri-tional supplements is unknown (Brodschneider, 2010). The benefits of a diverse mix of quality forage (the pollen and nectar from flowering plants) seem to be difficult to duplicate—as such a mix can provide a complete suite of amino acids needed by honey bees (deGroot, 1952), along with fatty acids and trace nutritional factors (DiPasquale et al., 2013).
A survey of 5,937 beekeepers, collectively managing 15 percent of honey bee colonies in the United States, showed that the majority of honey bee colonies (87 percent) are managed commercially by beekeepers with more than 500 colonies (1.4 percent of beekeepers) (BIP, 2015). Most commercial colonies are transported from location to location to provide pollination services for producers of a variety of crops throughout the year. Over half the Nation’s colonies are transported to pollinate
Figure 3
Honey bee movements and crops requiring pollination in the United States
Source: USDA, Economic Research Service using Bond et al. (2014).
Less than 20,000
Summerfeedinggrounds
Dashed line represents distinct pollination routes
150,001 to 250,000Less than 20,000
250,001 to 500,000
More than 500,000
Total pollinated crop acres by State as of June 2014
20,001 to 80,000
80,001 to 150,000
BlueberriesApples
Blueberries
RaspberriesCranberries
CherriesPlums
Melons
Melons
Alfalfa
Alfalfa
Alfalfa
Alfalfa
Apples
Blueberries
Blueberries
Plums
CherriesApples
Apples
Cucumbers
Cucumbers
Cucumbers
Melons
Melons
Pears
Cucumbers
Berries
Almonds
CherriesMelons
Avocados
Cucumbers
BlueberriesMelons
Cucumbers
Berries
Sun�owers
Melons
Alfalfa
Melons
Blueberries
Sun�owers
Cherries
Cranberries
Sun�owers
Canola
Apples
Apples
Blueberries
Citrus
CitrusCitrus

9 Land Use, Land Cover, and Pollinator Health: A Review and Trend Analysis, ERR-232
Economic Research Service/USDA
almonds in California in February.7 Many of these colonies over-summer in the Northern Plains—a landscape that historically includes pollinator-friendly crops, such as sunflowers, canola, and alfalfa, and that contains large areas of native grassland and conservation covers. In the summer, commer-cial beekeepers typically transport their colonies to the Dakotas to rebuild their populations and their resources so as to better withstand the stresses of over-wintering and long-distance transport throughout the spring.
When commercially managed honey bees are under contract to provide pollination services to landowners, the honey bee colonies are placed near the crops to be pollinated. However, the forage quality of the target crops may not provide optimal nutrition. In such cases, locating pollinator-friendly habitat near target crops can help augment both the quality and quantity of available forage (London-Shafir et al., 2003; Pernal and Currie, 2001).
During times in which honey bees are not in high demand for pollination services, the precise loca-tion of good forage land is less important. Honey bees can exploit good forage within a few miles of their colony, although forage closer to hives is beneficial as it reduces the amount of energy bees expend in flight. Moreover, beekeepers can move their colonies to be closer to beneficial forage in the off-season. As such, the overall quantity (e.g., acres of flowering plants) and quality (e.g., pollen diversity and nectar quality) of forage may matter more than the exact placement of the pollinator-friendly land cover.
Partially due to the ability of beekeepers to move colonies around the landscape, there is less infor-mation on the effects of landscape features on the long-term health (i.e., over-winter survival) of managed honey bee colonies (Smart et al., 2016).
Land-use policy for native and managed pollinators
To enhance pollination of crops by wild pollinators, a broad assemblage of good-quality LULC near actively pollinated agriculture is needed, one that shortens the distance between crop fields and natural habitat. For some crops, such as tomatoes and blueberries, it may be useful to adjust adjacent LULCs, either by modifying agricultural lands or by altering natural habitat, so as to encourage wild pollinator species most beneficial for these crops (i.e., those active when the crop is flowering).
For honey bees, the dependency on any particular plot of land is lower than that of native pollina-tors, both because of their naturally longer flight radius and because hives can be relocated. Many commercial honey bee colonies are transported to the Northern Plains where they spend the summer collecting honey and improving colony health (Gallant et al., 2014). Land uses across the Nation (fig. 3) can thus affect a honey bee colony’s health, not just in regions where pollination services are being provided. Thus, LULC impacts on honey bee health may take longer to recognize than those on native pollinator health, manifesting as changes in survival probabilities as a function of the LULC spread across a rather broad landscape (i.e., within a 2-mile radius of a hive).
While most existing research on the impacts of LULC on pollinators considers native pollina-tors, there is a growing body of work that focuses on honey bees. Gallant et al. (2014) constructed a spatially explicit model that identifies sites with the potential to support large apiaries based on local-scale land-cover requirements. Maps of potential apiary locations for North Dakota were produced using land-cover maps representing current conditions and a realistic scenario of land
7For example, in 2015, the California Almond Board reported that 1.6 million colonies of honey bees were used for almond pollinations (www.almonds.com/pollination).

10 Land Use, Land Cover, and Pollinator Health: A Review and Trend Analysis, ERR-232
Economic Research Service/USDA
change. The scenario highlights the importance of conservation lands in landscapes intensively and extensively managed for crops.
Smart et al. (2016) assessed how land use affects the health and survivability of commercial honey bee colonies, or apiaries, in the Prairie Pothole Region of North Dakota. Specifically, this research considered the colony population size, pollen and honey stores, queen status, and the level of para-sites and diseases as measures of colony health. Results suggest that the greater the area of unculti-vated land near an apiary, the greater the level of apiary survival.
Otto et al. (2016) find that landscape features favored by beekeepers for apiary locations are decreasing in the Great Plains, and crops actively avoided by beekeepers, such as corn and soybeans, are becoming more common in areas with higher apiary densities. They applied a habitat selection model to predict the impacts from changes in biofuel crop production and grassland land covers surrounding 18,000 registered apiaries in North and South Dakota from 2006 to 2014. They find an increase in “biofuel crops” of around 3 million acres—crops that beekeepers avoid when siting their hives. Furthermore, grasslands favored by beekeepers are becoming less common.
USDA land-use and pollinator programs
Several USDA conservation programs exist that help producers provide habitat and forage to native and commercial pollinators. These include the Environmental Quality Incentives Program (EQIP), the Conservation Stewardship Program (CSP), and the Agricultural Conservation Easement Program (ACEP) administered by USDA’s Natural Resources Conservation Service (NRCS). A total of 37 conservation practices can be used under EQIP to create or enhance pollinator habitat (USDA, 2015), including planting cover crops, planting wildflowers and native grasses in buffers, and improving management of grazing lands. In 2015, NRCS began actively targeting the over-summering grounds in the Northern Plains (USDA-NRCS, 2015).
USDA’s Farm Service Agency administers the Conservation Reserve Program (CRP), which pays farmers a yearly rental payment in exchange for removing environmentally sensitive land from agri-cultural production and planting species that improve the land’s environmental quality. While most CRP land can be considered beneficial to pollinators, one of the conservation practices that farmers can implement under the program is designed specifically to provide habitat for honey bees and native pollinators (see box “Pollinator-Friendly Land Covers on CRP Land”).

11 Land Use, Land Cover, and Pollinator Health: A Review and Trend Analysis, ERR-232
Economic Research Service/USDA
Box 1
Pollinator-Friendly Land Covers on CRP Land
As of September 2016, the over 30-year-old Conservation Reserve Program (CRP) administered by USDA’s Farm Service Agency (FSA) covers 23.9 million acres of retired cropland (USDA-FSA, 2016). Landowners volunteer to participate in the program and in return receive yearly payments for removing environmentally sensitive land from agricultural production. Parcels enrolled in the program are planted with land covers intended to provide soil and water protection, erosion reduction, and wildlife habitat.
Although most conservation practices can provide forage for pollinators, seed mixes designed specifically for pollinators offer additional and more diverse pollen and nectar sources (Pollinator Partnership, 2009). For these reasons, the Food, Conservation, and Energy Act of 2008 incorporated support for development of pollinator habitat within USDA conservation programs. As outlined by FSA (2013), the CP42 Pollinator Habitat practice comprises a diverse mix of at least nine species of pollinator-friendly wildflowers, legumes, or shrubs. In addition, the mix should provide at least three species in each of the following bloom periods: April-June, June-July, and August-October.
Land in CP42 (or equivalent practices1) grew since 2011—with 45,000 acres under contract in 2011, 65,000 acres in 2012, 95,000 acres in 2013, 108,000 acres in 2014, and 135,000 acres in 2015. As of September 2016, CP42 enrollments have continued to accelerate, reaching 342,000 acres, or 1.4 percent of acres under CRP contract.
While CP42 is designed for supporting pollinators, other land covers can also be beneficial. In a June 2016 analysis,2 FSA estimated that over 15.7 million acres under CRP contract are in conservation practices (including CP42) deemed to be beneficial to pollinators, including 7.8 million acres in grass plantings that include forbs and/or legumes, 1.1 million acres in buffer and filter strips, and 4.7 million acres in wildlife habitat. These totals, however, are down from 22.1 million acres in 2007.
The Northern Plains has a high density of CRP land and is the summer location of many of the Nation’s honey bee colonies. FSA has established a Monitoring, Assessment, and Evaluation project to quantify and document the multiple benefits generated when lands are placed into the CRP and to identify successful innovative practices. For example, honey bee colonies established on CP42 land in Iowa, Montana, Nebraska, and Washington are producing more honey than those on CRP land planted with grasses, and a greater variety of native pollinators live around CP42 land (Wojcik, 2015). However, the average cost of converting agricultural land to CP42 land is substantially greater than that of converting to CRP grassland. For example, as of 2015, the national average CP42 establishment cost was $248 per acre, compared with an average of $68 per acre and $85 per acre for grass prac-tices in CP1 and CP2, respectively.3
In addition to ongoing research, a number of planning tools are available to landowners. For example, Pheasants Forever (2015) supports a seed-mixture calculator designed to enable resource professionals to build and recom-mend seeding mixtures that improve environmental quality while reducing costs.
1Equivalent practices include several under the State Acres for Wildlife Enhancement Initiative and acres enrolled in 2010 (during signup 39) using a “pollinator beneficial” seeding mix of existing practices.
2http://www.usda.gov/wps/portal/usda/usdahome?contentidonly=true&contentid=2016/06/0153.xml3See https://www.nass.usda.gov/Publications/Ag_Statistics/2015/Chapter12.pdf (Table 12-14). Note that average CP42 establishment
costs ranged from $49 per acre in Montana to $900 per acre in North Carolina.
12 Land Use, Land Cover, and Pollinator Health: A Review and Trend Analysis, ERR-232
Economic Research Service/USDA
Trends in Pollinator Forage Suitability in the United States
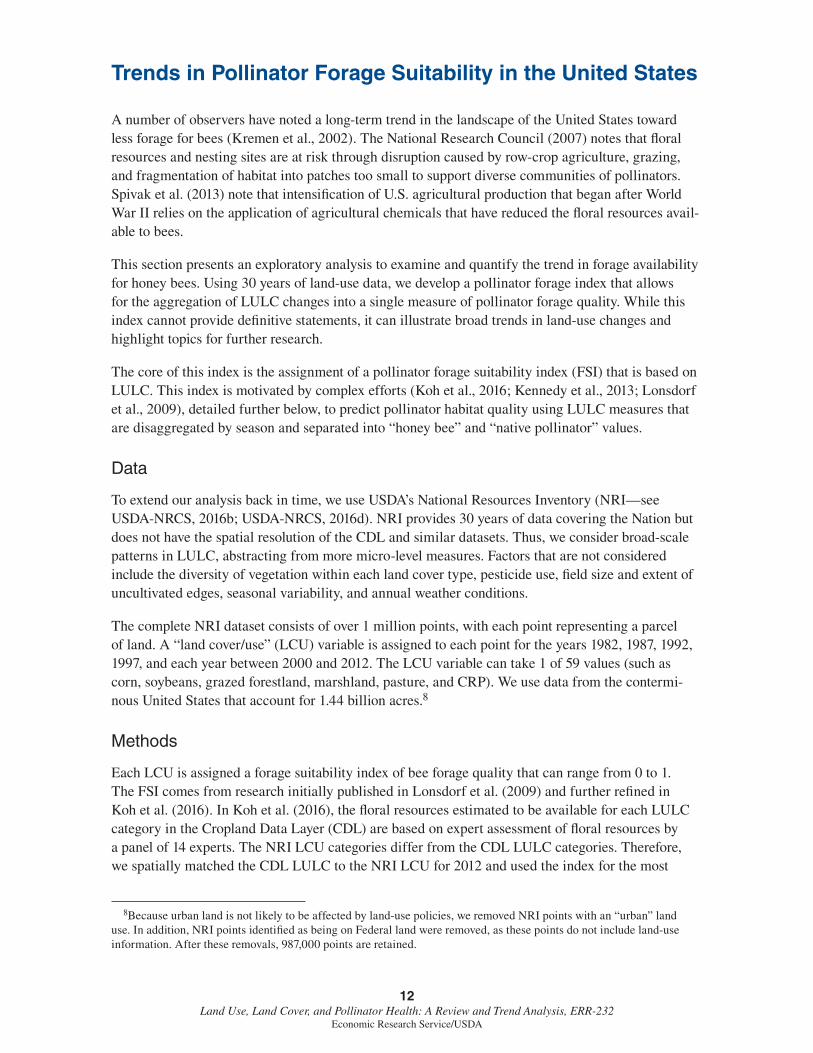
A number of observers have noted a long-term trend in the landscape of the United States toward less forage for bees (Kremen et al., 2002). The National Research Council (2007) notes that floral resources and nesting sites are at risk through disruption caused by row-crop agriculture, grazing, and fragmentation of habitat into patches too small to support diverse communities of pollinators. Spivak et al. (2013) note that intensification of U.S. agricultural production that began after World War II relies on the application of agricultural chemicals that have reduced the floral resources avail-able to bees.
This section presents an exploratory analysis to examine and quantify the trend in forage availability for honey bees. Using 30 years of land-use data, we develop a pollinator forage index that allows for the aggregation of LULC changes into a single measure of pollinator forage quality. While this index cannot provide definitive statements, it can illustrate broad trends in land-use changes and highlight topics for further research.
The core of this index is the assignment of a pollinator forage suitability index (FSI) that is based on LULC. This index is motivated by complex efforts (Koh et al., 2016; Kennedy et al., 2013; Lonsdorf et al., 2009), detailed further below, to predict pollinator habitat quality using LULC measures that are disaggregated by season and separated into “honey bee” and “native pollinator” values.
Data
To extend our analysis back in time, we use USDA’s National Resources Inventory (NRI—see USDA-NRCS, 2016b; USDA-NRCS, 2016d). NRI provides 30 years of data covering the Nation but does not have the spatial resolution of the CDL and similar datasets. Thus, we consider broad-scale patterns in LULC, abstracting from more micro-level measures. Factors that are not considered include the diversity of vegetation within each land cover type, pesticide use, field size and extent of uncultivated edges, seasonal variability, and annual weather conditions.
The complete NRI dataset consists of over 1 million points, with each point representing a parcel of land. A “land cover/use” (LCU) variable is assigned to each point for the years 1982, 1987, 1992, 1997, and each year between 2000 and 2012. The LCU variable can take 1 of 59 values (such as corn, soybeans, grazed forestland, marshland, pasture, and CRP). We use data from the contermi-nous United States that account for 1.44 billion acres.8
Methods
Each LCU is assigned a forage suitability index of bee forage quality that can range from 0 to 1. The FSI comes from research initially published in Lonsdorf et al. (2009) and further refined in Koh et al. (2016). In Koh et al. (2016), the floral resources estimated to be available for each LULC category in the Cropland Data Layer (CDL) are based on expert assessment of floral resources by a panel of 14 experts. The NRI LCU categories differ from the CDL LULC categories. Therefore, we spatially matched the CDL LULC to the NRI LCU for 2012 and used the index for the most
8Because urban land is not likely to be affected by land-use policies, we removed NRI points with an “urban” land use. In addition, NRI points identified as being on Federal land were removed, as these points do not include land-use information. After these removals, 987,000 points are retained.

13 Land Use, Land Cover, and Pollinator Health: A Review and Trend Analysis, ERR-232
Economic Research Service/USDA
common CDL LULC within a given NRI LCU. The FSI measure used in this analysis is specific to bees and consists of a single value for each land cover that abstracts from seasons.9
The FSI measures how well a land cover/use provides forage for honey bees. It does not consider other stressors (such as pesticide exposure). An index of 0 is used for LCUs that provide no forage, such as open water, while an index of 1 is a hypothetical land use that provides highly diverse and quality forage. Grain crops (e.g., corn, wheat, rice, and barley) have low FSI scores of 0.16-0.17, most fruits and vegetables have FSI scores of 0.31-0.35, and pasture, forest, and grasslands have FSI scores of 0.45-0.48.
CRP land is assigned an FSI score of 0.45, even though land enrolled in CRP can have a variety of land covers that have different forage suitability for bees. The NRI data, however, do not distinguish between different conservation practices on CRP lands, and CRP contract data can not readily be matched to NRI points. Given that most CRP land is planted with grasses, we assume all points assigned with a “CRP” LCU is in a grassland cover and assign these points an FSI of 0.45. To illus-trate the robustness of our results to this assumption, appendix 3 simulates how average FSI scores could change under different FSI scores for CRP acres.
FSI estimates are also affected by the availability of accurate data. Not all land cover/uses are contained in the NRI data. For example, canola, a honey bee-friendly LULC that accounts for over 1 million acres in the Northern Plains, is not one of the 59 land LCU codes of the NRI—hence, canola acreage cannot be specifically identified.10
Appendix 1 presents detailed information on the FSI assigned to the 59 LCU categories of the NRI data. While we use these 59 LCU categories in our analysis, to simplify the presentation of our results, these 59 land cover/use categories in the NRI dataset are aggregated into 9 broad categories, where LCUs in a category have similar FSI values. Table 3 lists the acreage under these nine broad categories over time, while appendix 2 provides maps illustrating LCU changes from 1982 to 2002 and from 2002 to 2012.
Farmland with very low FSI, which provides poor forage for pollinators, declined by 24 percent from 1982 to 2002 but rebounded by 5 percent after 2002. Farmland acreage with low FSI declined by 10 percent between 1982 and 2012. This change was offset by increases in farmland acreage with medium FSI scores. Acreage enrolled in the CRP increased from 0 in 1982 (the program began in 1986) to over 32 million acres in 2002 and declined to approximately 24 million acres in 2012.11
9Given the coarseness of the NRI LCU classification, in this analysis, we used a simplified version of the expert assess-ments. In contrast, Koh et al. (2016) factor in seasonal variation in FSI and construct robustness measures that consider variations in expert assessments.
10Canola acreage increased by over 800 percent (1.3 million acres) between 1991 (first year of data) and 2002. Between 2002 and 2012, canola acreage increased by 20 percent (300,000 acres). Canola was not assigned a forage suitability index score in Koh et al. (2016) and so cannot be compared with other land-use types in the area. In addition, canola is rotated with other crops (mostly wheat), and it is not clear which type of land use canola is displacing.
11These values are based on the 987,000 NRI points used in this analysis. For example, total CRP enrollment in 2002 and 2012 was 33.9 million and 29.5 million acres, respectively.

14 Land Use, Land Cover, and Pollinator Health: A Review and Trend Analysis, ERR-232
Economic Research Service/USDA
Table 3Summary of trends in land-cover/use area by broad (similar FSI values) category
Land-cover/use categoryMajor land covers
in category
Range of FSI scores assigned to points in this
land cover category
Area (million acres)
1982 2002 2012
Farmland: very low FSI Corn, wheat, rice, barley, sorghum 0.16 - 0.19 219.8 168.1 176.4
Farmland: low FSI Soybeans, cotton, nuts, grapes 0.20 - 0.29 90.6 100.3 99.3
Farmland: medium FSI Citrus, melons, potatoes, strawberries 0.30 - 0.39 91.3 90.2 82.4
Farmland: high FSI Sunflowers, berries (other) 0.40 - 0.54 4.0 2.8 2.3
Conservation Reserve Program Grassland 0.45 0.0 31.7 24.2
Forestland 0.48 388.5 406.9 409.9
Pasture & rangeland 0.45 533.6 523.8 524.2
Other high FSI land Rural roadsides 0.45 36.1 38.7 41.8
Other low FSI land Barren, water 0.0 - 0.25 74.9 76.8 78.5
FSI=forage suitability index. NRI = National Resources Inventory.
Source: USDA, Economic Research Service using non-Federal, non-urban NRI data (using 987,000 non-Federal, non-urban points). See appendix 1 for a listing of land use/cover codes used to create these categories, and appendix 2 for maps showing regional changes in acreage.

15 Land Use, Land Cover, and Pollinator Health: A Review and Trend Analysis, ERR-232
Economic Research Service/USDA
Results
Given the variety of land cover/use changes, it is useful to consider a measure based on point-by-point changes in the index over this time period. Table 4 summarizes the changes in the index across the United States. From 1982 to 2012, most of the U.S. landscape (about 75 percent) had no change in the index. About 11 percent of acreage had a decrease in FSI, and about 14 percent saw some increase. However, a different story emerges when considering more recent trends. From 1982 to 2002, the index improved on about twice as many acres as it declined. And from 2002 to 2012, the index declined on more acres than it improved (table 4).
No change in FSI does not imply that land cover/uses did not change—only that the FSI score did not change over time. The FSI score is an LCU-based estimate of the quality of honey bee forage. For example, a switch from corn to sorghum would have no effect on FSI in this analysis—both of these LCU are assumed to provide similar (very low) quality of honey bee forage. Conversion of land cover/uses with higher FSI scores (such as hay and sunflowers) to cropland (such as corn and soybean) is often the cause of index decreases. Conversely, conversion of cropland to CRP lands is often the cause of index increases.
This national summary masks regional differences. Figure 4 displays a comparison of the change in FSI across the United States from 1982 to 2002 and from 2002 to 2012.12 As also shown in table 4, increases were more prevalent between 1982 and 2002, while decreases were somewhat more preva-lent between 2002 and 2012. Note: Data are not displayed in hexagons that have less than 10 NRI points (blank with no border). Note the “over-summering” area of the Dakotas is outlined in black.
Overall, with the data and assumptions presented here, a story emerges that, in most places in the conterminous United States, broad LULC changes between 1982 and 2012 did not lead to decreases in estimated honey bee forage quality. However, the geographic scope and the time period over which changes in FSI are measured matters. Several locales show a recent decline in estimated
12The surface was interpolated using inverse distance weighting of the FSI changes for the 987,000 NRI points used in this analysis.
Table 4Distribution of the percentage change in estimated point-by-point FSI scores
Percentage of acres with a change in FSI
Decrease No change Increase
1982 to 2012 11.0 75.0 14.0
1982 to 2002 8.8 77.1 14.1
2002 to 2012 7.3 85.8 6.9
FSI = forage suitability index.
Source: USDA, Economic Research Service using National Resources Inventory. Note that when minor changes (a change less than 0.02 in either direction) were treated as a “No Change,” qualitatively similar results were obtained (the No Change categories increased by about 2 percent).

16 Land Use, Land Cover, and Pollinator Health: A Review and Trend Analysis, ERR-232
Economic Research Service/USDA
Figure 4
Changes in 2012 forage suitability index (FSI) over time
Note: Data are not displayed in hexagons that have less than 10 NRI points (blank with no border). Note the “over-summering” grounds of the Dakotas are outlined in black. FSI = forage suitability index.Source: USDA, Economic Research Service analysis of USDA, Natural Resources Conservation Service, National Resources Inventory (NRI) data.
1982-2002
2002-2012
Over-summering ground
Percent change in FSI-100 to -6-6 to -3-3 to 33 to 67 to 100

17 Land Use, Land Cover, and Pollinator Health: A Review and Trend Analysis, ERR-232
Economic Research Service/USDA
forage suitability. In particular, Central North and South Dakota (outlined in figure 4)13, which is an important summering ground for honey bee colonies, has seen a decline in forage suitability since 2002 (fig. 5).
While our analysis sheds light on trends in forage suitability due to changes across broad land-use and cover categories, it does not capture changes in forage suitability arising from within-category changes, such as changes in pesticide and herbicide use, changes in field size, or changes in conser-vation practices installed on CRP acreage. For example, changes in prevailing patterns of herbicide and pesticide use as well as field size could mean that a corn field’s actual value to pollinators may improve or deteriorate between 1982 and 2012, even though its index remained the same.
As noted earlier in this section, there is a perception that the U.S. landscape has undergone changes that have had a negative effect on pollinators over the last several decades. What may account for the divergence between this perception and the findings presented here? First, our analysis is based on a fairly simple LULC classification necessitated by the available data, which can reduce the accuracy of FSI scores.
More generally, the point structure of the NRI data cannot encompass agricultural landscape phenomenon (Potts et al., 2010; Meehan et al., 2011) and other subtle changes in LULC that have occurred over the study period. For example, they do not capture linear features such as roadside
13The “over-summering” grounds special region was constructed from 87 of the 119 counties in North and South Dakota. These 87 counties had a relatively larger high density of apiaries (see figure 3). Note that this is an imprecise allocation and is based on apiary density maps from South Dakota (http://arcgis.sd.gov/server/ag/sensitivesites/default-map.aspx) and North Dakota (https://apps.nd.gov/ndda/mapping/).
Figure 5
Average FSI scores over all NRI points for the United States and Central Dakotas (index, 2002=100)
Average forage suitability index score (Index, 2002=100)
FSI=forage suitability index. NRI=National Resource Inventory.Note: FSI is normalized so that 2002 is equal to 100 for both Central Dakotas and the United States. The Central Dakotas, an important summering ground for honey bee colonies, is outlined in fig. 4.Source: USDA, Economic Research Service analysis of USDA, Natural Resources Conservation Service, National Resources Inventory Data.
96
97
98
99
100
101
1982 1987 1992 1997 2002 2007 2012
Central Dakotas
United States

18 Land Use, Land Cover, and Pollinator Health: A Review and Trend Analysis, ERR-232
Economic Research Service/USDA
edges, field edges, and natural windbreaks that can provide excellent habitat for bees. As farm machinery has gotten larger and as farms have increasingly consolidated (MacDonald, Korb, and Hoppe 2013), agricultural fields have increased in size (White and Roy, 2015) and have fewer natural elements embedded in them. Less-managed land covers and hedgerows are fewer (Landis, 2016). Yet, for honey bees and other pollinators, those features are critical to their well-being.14
Similarly, NRI data do not account for changes in in-season land management, such as pre-flowering cutting of alfalfa, changes in pesticide use, such as the growth in neonicotoids, and reductions in forage from weeds both within and alongside agricultural fields and roads due to the expansion of nonselective herbicide application (USGS, 2016).
The actual impact of LULC changes on the health of honey bee colonies in the United States is a function of the biophysical impacts of LULC changes as well as the ability of beekeepers to adapt, such as by changing pollination routes or the over-summering location. The perception of a decrease in pollinator habitat may be driven by observed changes in LULC in areas with a substantial number of honey bee colonies but may not be reflective of national-level LULC changes.
Honey bee colonies are concentrated in different parts of the country in the course of a year, such as in California during the February almond bloom. As the number of honey-producing colonies has declined from 5.9 million in 1947 to a low of 2.3 million in 2008 before recovering to 2.8 million in 2016, some regions of the United States have experienced greater-than-average increases or declines in colony counts (see box “Distribution of Honey Bee Colonies”). Of particular interest is the above-noted decline in forage provision in the important over-summering grounds in Central North and South Dakota, as noted by Wright et al. (2013), Otto (2014), Koh et al. (2016), Smart et al. (2016), and Otto et al. (2016). The decline in the index in the region since 2002 is driven by a 42-percent decrease in CRP land, a 30-percent decrease in “high FSI” farmland, a 14-percent decrease in “medium FSI” farmland, and a 33-percent increase in “low FSI” farmland (fig. 3, table 5).
14Deguines et al. (2014) state that “There is abundant local-scale evidence that both pollinator diversity and pollination services decrease with increasing agricultural intensification.”
Table 5Changes in land use, by FSI category, for 87 selected counties in the Central Dakotas that constitute important over-summering grounds for honey bees
Land-cover category Major land covers in category Change, 2002-12 (%)
Farmland: very low FSI Corn, wheat, rice, barley, sorghum 3.3
Farmland: low FSI Soybeans, cotton, nuts, grapes 32.8
Farmland: medium FSI Citrus, melons, potatoes, strawberries -14.0
Farmland: high FSI Sunflowers, berries (other) -30.0
Conservation Reserve Program Grassland -42.0
Forest 3.1
Pasture and range 1.2
Other high FSI land Rural roadsides 5.2
Other low FSI land Barren, water 1.9
FSI=forage suitability index.
Source: USDA, Economic Research Service using USDA, Natural Resources Conservation Service, National Resources Inventory Data.

19 Land Use, Land Cover, and Pollinator Health: A Review and Trend Analysis, ERR-232
Economic Research Service/USDA
Box 2
Distribution of Honey Bee Colonies
The availability of forage for managed honey bees depends in part on where and when beekeepers choose to locate their honey bees. When honey bees are providing pollination services, the location of the colony is limited by the location of the crop(s) that require pollination. Later in the season, beekeepers can choose locations to optimize honey production and health of the colony. Box figure 2.1 shows the density of honey-producing colonies by State in 2010 and percent changes in the num-ber of colonies over time from 1981 to 2010. For the United States as a whole, honey-producing colo-nies declined from 4.21 million in 1981 to 2.69 million in 2010 (USDA-SRS 1982, USDA-NASS 2017), while figure 1 in the main body of the report shows that colony numbers have increased since 2008. Locations where honey bees only provide pollination services and do not produce sellable honey (e.g., almond farms in California) are not accounted for in these maps. Honey-producing colony density is highest in the two citrus-producing States (California and Florida) and summering grounds in the Northern Great Plains. Four States—Montana, North Dakota, South Dakota, and Minnesota—account for about 40 percent of the honey-producing colonies.
Not only does the Northern Great Plains have a high density of colonies, but it is also one of two regions with an increase in the number of honey-producing colonies from 1981 to 2010. In the Dakotas and Montana, the number of colonies increased 69 percent during this time period; in most of the rest of the States, the average number of colonies dropped by about half (51 percent) (USDA-NASS, 2017).
Box figure 2.1
Density of honey-producing honey bee colonies in 2010 and percentage change over time from 1981-2010
Source: USDA, Economic Research Service using USDA, National Agricultural Statistics Service (2017) and USDA, Statistical Reporting Service (1982).
Change in number of colonies (1981-2010)
-95% - 0%1% - 92%
Colonies per square mile (2010)0.0 - 0.30.4 - 0.80.9 - 1.71.8 - 3.63.7 - 7.2

20 Land Use, Land Cover, and Pollinator Health: A Review and Trend Analysis, ERR-232
Economic Research Service/USDA
An Economics Perspective: Markets and the Role of Public Policy
As discussed earlier in the literature review, evidence suggests that some changes in LULC and land management can have a positive effect on the provision of pollination services from both wild and managed bees. But what does that imply about public policy—what options are available for USDA policymakers?
A key perspective of economics is how market mechanisms coordinate the choices made by indi-vidual actors. Under certain conditions, markets do this well—markets lead to an outcome where no one can be made better off without making someone else worse off.
From this point of view, an economist might ask “where is the need for intervention in the polli-nator world?” Beekeepers, growers of pollinator-dependent crops, and landowners should be able to resolve their needs through market mechanisms. For example, if changes in LULC may enhance the delivery of pollination services (either by increasing the number of native pollinators near crops or by protecting the health of honey bees)—one should expect trades between beekeepers, crop producers, and landowners to occur that bring forth these modifications.
The ongoing growth in the importance of commercial pollination exemplifies this expectation. Historically, pollination services were provided by native pollinators and locally managed honey bees. However, a national pollination-services market has emerged in conjunction with intensifica-tion of agricultural production. In particular, the growth in almond production has led to a need for externally provided pollination services, and beekeepers have responded by trucking their hives to the desired locations and entering into pollination contracts.
A pollination contract can specify the condition that colonies should be in when they arrive to service the contract, including the number of brood frames, the pounds of honey stores, and the number of hive stores.15 Similarly, the contract can stipulate that the grower refrain from applying pesticides considered toxic to honey bees immediately before and while the honey bees are polli-nating the crop (Sanford et al., 2003).
More generally, with a robust demand for pollination services for a variety of crops at different loca-tions throughout the year, beekeepers can invest in the health of their bees in numerous ways, such as by monitoring and treating disease and pest infestation and by placing their hives in locations rich in forage opportunities when not servicing pollination contracts. Should lack of high-quality forage emerge as an issue, a beekeeper could obtain access to such lands through compensation to a landowner. Although obtaining such access might increase beekeeper costs, in theory market mechanisms should induce optimal purchase of access to quality forage land, in terms of equating marginal costs and marginal benefits.
Evidence shows that beekeepers have been able to adjust to changes in the pollinator environment. In particular, despite the increase in threats and elevated colony mortality, there is little indication of major shortages of honey bee colonies in pollinator markets, although the price of pollination
15For example, a typical almond pollination contract specifies a target strength of eight frames covered in adult bees. See http://ir.library.oregonstate.edu/xmlui/bitstream/handle/1957/19777/pnw623.pdf or http://beesource.com/point-of-view/joe-traynor/pollenation-guidelines-for-commercial-beekeepers/ for examples of recommendations.

21 Land Use, Land Cover, and Pollinator Health: A Review and Trend Analysis, ERR-232
Economic Research Service/USDA
services has increased (particularly for almond bloom) due to the increase in demand and cost of production (Rucker et al., 2012; Rucker and Thurman, 2012; Rucker et al., 2014). Moreover, the number of honey-producing colonies has increased since 2008 despite high colony mortality (USDA-NASS, 2017).
However, is it reasonable to always expect these markets to function optimally, especially if environ-mental factors are changing unpredictably? Are there market failures (Ledyard, 2008) that under-mine the conditions where markets do well? The next section considers conditions that are germane to the interaction between LULC and pollinator health—conditions that can hinder the success of market solutions and that illustrate when Government policy may be useful.
Land for pollinators provides a positive externality
The provision of pollinator habitat is an example of a positive externality (Cheung, 1973). When the cost of a good is borne by one economic agent while multiple agents benefit, the good is often under-provided.16 When the foraging range of a pollinator (native or managed) extends beyond the prop-erty boundaries of a landowner, the pollination services of pollinators (whose health is enhanced by forage land) may benefit other landowners.
Consider a hedgerow that provides forage for both honey bees that service cropland belonging to the hedgerow owner and honey bees that service the lands of an adja-cent farmer. In the absence of some means of sharing expenses with the neighbor, the incentive to provide the hedgerow is reduced since the landowner investing in the hedgerow does not reap all of its pollination benefits. If a means of sharing expenses were adopted, the farmer would install more hedgerows.
In some cases, this may not be a problem. For example, for native bees, which typically have a short flight radius, it is more likely that both components (land that benefits from pollinators and land that benefits pollinators) can be accommodated within a single ownership unit (e.g., if farmers install good-quality pollinator forage on borders between their fields). For sufficiently large farms, even pollinators with long flight ranges (such as honey bees) may not fly far afield. Alternatively, social norms may reduce “free riding” (Cheung, 1972), as when neighboring almond growers maintain standard colony-stocking densities or maintain equal ratios of planted and natural land (Champetier, 2011).
Land for commercial honey bees: Open access considerations
For the majority of the year that honey bees are not needed for pollination services, land providing forage need not be associated with land that requires pollination. Thus, it can make sense to locate forage lands where opportunity costs (e.g., the cost of not farming a parcel) are low. Consequently, the beneficiaries of pollination services may be quite different from the providers of pollinator forage, such as almond growers in California and landowners in North Dakota.
16In 1920, A.C. Pigou discussed the private provision of public goods (Pigou, 1932, chapter II.IX.11): “Among these examples we may set out first a number of instances in which marginal private net product falls short of marginal social net product, because incidental services are performed to third parties from whom it is technically difficult to exact payment…. It is true, in like manner, of resources devoted to afforestation, since the beneficial effect on climate often extends beyond the borders of the estates owned by the person responsible for the forest.” (http://www.econlib.org/cgi-bin/searchbooks.pl?searchtype=BookSearchPara&id=pgEW&query=forest). For further discussion of externalities, in an agricultural context, see Ribaudo et al., 2008.

22 Land Use, Land Cover, and Pollinator Health: A Review and Trend Analysis, ERR-232
Economic Research Service/USDA
An operation could internalize this by maintaining pollinator habitat on land that has less agri-cultural value, perhaps land that is far from its productive fields. Alternatively, beekeepers could efficiently maintain their hives by purchasing access to, and hence encourage creation of, land with good forage (e.g., native prairie in the Northern Great Plains).
Open access may make these transactions difficult to sustain—how can a beekeeper control access to the pollinator habitat he or she paid to create? That is, how can someone paying to create polli-nator habitat exclude “free riders”—such as other beekeepers who could place their hives near such pollinator habitat and reap the benefits without the costs (in other words, benefit from the positive externality). Unless the benefits of this free riding can be captured, incentives for any beekeeper to incur the costs of managing pollinator forage are lessened.
A related issue is that the use of land set aside for pollinators by one colony can reduce the available resources for other colonies because the quantity of pollen and nectar provided on a parcel is limited. As additional colonies are placed near a parcel, the marginal benefits (additional nectar and pollen gathered) decrease. Thus, honey bee forage land is nonexcludable, because other beekeepers can use the forage, but rival, since any honey bee that visits the forage will reduce the quantity of forage for all other honey bees. Although this does not meet the definition of a pure public good, which is both nonexcludable and nonrival, it can still lead to market failure (Gravelle and Rees, 2004).
Beekeeping has traditionally been an adventitious operation, where managers of stinging insects seek opportunities to reap the bounties of nature. As such, landowners are not necessarily notified when hives are placed near their lands. However, informal means (such as shares of honey) are often used to “secure” access to staging areas where hives can be situated. Moreover, anecdotal evidence (Nordhaus, 2011) suggests that beekeepers have informal “territories” in which they operate, which can serve to reduce over-exploitation pressures.
More formally, a variety of States regulate apiaries (see table 6). Many States require that beekeepers register the locations of their hives. Montana, South Dakota, and Wyoming create exclu-sionary zones—so that no commercial beekeeper can place hives within a few miles of a currently registered commercial beekeeper’s hives.
Ecosystem services and co-products: Opportunity for collaboration in the provision of public goods
Lands that provide pollinator habitat can simultaneously provide a variety of ecosystem services, such as biodiversity, soil protection, open space, and wildlife habitat. For example, CRP land selected due to erodibility concerns can also be managed for pollinators by the planting of polli-nator-friendly covers, although this is not currently the case for most CRP parcels.
Though not necessarily producing revenue, such beneficial ecosystem-service impacts may be valued by a number of people, as they are public goods. Public goods are often difficult to supply via markets.17 In particular, for native bees pollinating noncommercial plants, there is little financial incentive for property owners (both farmers and nonfarmers) to provide pollinator forage—even though many people would benefit from the ecosystem services such forage would sustain.
17See Ribaudo et al. (2008) for a discussion of public goods in an agriculture setting.

23 Land Use, Land Cover, and Pollinator Health: A Review and Trend Analysis, ERR-232
Economic Research Service/USDA
Sustainability and marginal decisions
What if society’s preferences differ from the preferences of participants in an important market? For example, individual landowners, farmers, and beekeepers may make decisions optimizing near-term financial needs. Sustainability goals, such as maintaining a robust and nutritionally diverse food supply for future generations, may not be fully aligned with the goals of the participants in these markets. For example, land-use policies to ensure pollinator health may be a sensible endeavor when the consequences of failure—the costs to the general public—exceed the policy cost.
Table 6Regulation of apiaries in States with more than 100,000 colonies at the start of the summer on July 1, 2015
State Regulation of apiaries
Exclusive rights to land (distance requirement to other apiaries)
California
Commercial and noncommercial beekeepers in California are required to register their honey bee colonies with the agricultural commissioner in the county where their colonies are placed. Registered beekeepers can request advance notification of pesticide applications.
No
FloridaBeekeepers with honey bee colonies must register with the Florida Depart-ment of Agriculture and Consumer Services and submit to inspection by the Department for the detection of honey bee pests.
No
Georgia
Apiary registration is not required by the Georgia Department of Agriculture. The Georgia Bee Law (O.C.G.A. 2-14-40) requires beekeepers selling bees, queens, and nuclei commercially to be licensed. All other beekeepers (e.g., hobbyists, pollinators, honey producers) are not required to be licensed or inspected by the Plant Protection Section.
No
Minnesota
Effective July 1, 2006, the annual apiary registration requirement with the Minnesota Department of Agriculture was discontinued. However, the Department still retains full authority to regulate pesticides and, as such, will continue to investigate reports of pesticide misuse or misapplication and take appropriate regulatory action.
No
Montana
Commercial beekeepers (with more than five hives) are required to register apiaries with the Montana Department of Agriculture. A registered apiary must be 3 miles from the next site of another registered beekeeper. This is to prevent the spread of diseases and pests from apiary to apiary and to limit the over-exploitation of pollen and nectar resources by foraging honey bees. A site registered for pollination is not subject to the 3-mile buffer-zone requirement but is limited in size and established only for the period in which pollination provides a benefit to the specific crop.
Yes
North Dakota The locations of all apiaries must be reported to the State. Inspection, quar-antine, and other actions may be taken by the agricultural commissioner. No
South DakotaNo apiary may be located within 3 miles of any other apiary. However, any beekeeper who owns property may locate an apiary anywhere on that property.
Yes
Source: USDA, Economic Research Service using Apiary Inspectors of America (2015) and (USDA-NASS, 2016b).

24 Land Use, Land Cover, and Pollinator Health: A Review and Trend Analysis, ERR-232
Economic Research Service/USDA
Considering the participants
It is useful to consider the issue of pollinator forage provision from the point of view of four stylized sets of participants: pollinator-dependent farmers (e.g., almond growers), beekeepers, landowners (who can provide land for forage), and the Government (representing broader public interests).18
For farmers, beekeepers, and landowners: what are the benefits of improving pollinator habitat?
Farmers Creating habitat for native pollinators can: • Reduce or eliminate the need for commercial pollination• Enhance the effectiveness of honey bees (Brittain et al., 2013)
Creating habitat for honey bees can:• Attract beekeepers, who may be willing to accept lower rental payments
Beekeepers Pollinator habitat near pollination contracts can:• Provide forage when few alternatives are available (i.e., in the weeks before almond bloom)
Pollinator habitat at other times and places (e.g., summertime in the Dakotas) can:• Increase honey production• Build colony strength after the bees have been transported around the country to pollinate crops
Landowners Landowner may be able to collect fees from beekeepers to plant pollinator-friendly habitat that these beekeepers will then place their hives on.
What barriers impede these three participants from providing an efficient amount of pollinator habitat?
Farmers Free riders: habitat created for pollinators that will work your crops may also support pollinators that work some other farmer’s crops.
Opportunity cost: land set aside for pollinator habitat is not available for crop production. For example, in almond orchards even though the per-acre rental rates for honey bees are high (about $300 acre), they are only 10 percent of gross revenues (Klonsky, 2011). If there were no opportunity costs, the dissipation of benefits due to free rider and open access issues would be less important.
Beekeepers Open access: beekeepers may be unwilling to pay for better honey bee forage if they worry that other beekeepers (who are not paying) will be reaping much of the benefit.
Landowners Free rider: beekeepers may be unwilling to pay landowners to install pollinator habitat if they think that other landowners will provide the habitat for free (and their bees can then visit these lands). Similarly, farmers growing pollinator-dependent crops can avoid the cost of in-stalling pollinator habitat on some of their lands if they think that nearby landowners will pro-vide the habitat for free—and the bees visiting these nearby lands will also visit their crops.
In addition, lack of information on cost-effective provision of pollinator habitat may dissuade invest-ment in providing habitat to native pollinators. For example, land set aside for native pollinators should support pollinator species that are active when the crop needs pollination. Furthermore, untimely plant efflorescence, or flowering, can be detrimental: growers who rent honey bees may prefer to limit the amount of plants growing near their crops that might attract honey bees (i.e., that compete with the crop for honey bee attention).
18To simplify this discussion, we assume that landowners are also land managers. Note that landowners can be non-farmers or farmers of crops that do not need honey bee (or other animal) pollination. We also abstract from other benefits due to improving pollinator habitat, such as biocontrol of pests.

25 Land Use, Land Cover, and Pollinator Health: A Review and Trend Analysis, ERR-232
Economic Research Service/USDA
Government actions
The Government can take a variety of actions to alleviate shortages of good pollinator forage. These include:
•Organizingorimprovingmarketsforbetterqualityforage.Forexample,systemsthatassignexclu-sive zones (such as the State regulations listed in table 6) may encourage beekeepers and land-owners to form contracts to improve land cover. However, such an assignation will create winners and losers (i.e., landowners with an existing apiary versus beekeepers who are new to an area).
•Installingimprovedaccesstoforageonexistingpubliclands.Forexample,byplantingbeneficialflowers rich in nectar or nutritious pollen in highway and railroad right-of-ways. A more complex example is allowing colonies to be placed in undeveloped public lands, such as national parks or Bureau of Land Management and U.S. Forest Service range and forestland. While these lands could provide substantial forage, other issues include potential impacts on public access and the risk of overwhelming natural systems with colonies of non-native honey bees.
•Payingforbetterforageonprivatelands.Forexample,asof2016,theCRPhasabout342,000acres (out of about 24 million total program acres) enrolled in pollinator-targeted land covers (see box “Pollinator-Friendly Land Covers on CRP Land” on page 11).
•Conductingresearchoncost-effectivelandcovers,suchasanalyzingtheadditionalbenefits,ascompared with the costs, of a superior seed mix (see box “Pollinator-Friendly Land Covers on CRP Land” on page 11).
•Conductingeducationandoutreachonhowtoeffectivelyincreasepollinatorforageforbothnativepollinators and honey bees.
While these Government actions may improve pollinator well-being, their implementation chal-lenges and cost effectiveness are largely unstudied.

26 Land Use, Land Cover, and Pollinator Health: A Review and Trend Analysis, ERR-232
Economic Research Service/USDA
Conclusions
Honey bees and native pollinators contribute to the pollination of crops annually worth about $15 billion and $3 billion, respectively (USDA-NRCS, 2016d; Losey and Vaughan, 2006). Both face a number of synergistic stressors including diseases, parasites, pesticides, and loss of nesting and foraging habitat. High honey bee colony mortality raises concerns that the quantity and diversity of agricultural goods may be reduced over the long term should these stressors continue to have the same effects on pollinators and should the management practices used by beekeepers to keep up the number of colonies fail.
Improved nutrition for pollinators can be part of the solution: a body of research suggests that if pollinators eat better, they can better withstand other stressors. This can be achieved by modifying the Nation’s land-use/land-cover (LULC) patterns so as to provide pollinators with higher quality forage—the pollen and nectar from blooming plants. LULC can affect both native pollinators and managed honey bees. While more research is needed on these topics, a strategy that is best for one may not be best for the other.
Native pollinators and managed honey bees can have different LULC needs and thus may be best served by different sets of policies designed to improve access to nutritious forage and nesting habitat. Native pollinators, if only due to their greater variety of species, may not be as susceptible to one of the main honey bee stressors—varroa mites—but may be more susceptible to others, such as pesticide exposure. A widely dispersed array of pollinator-friendly habitat, which may not require a large number of acres, could yield a robust ensemble of species that provide pollination services.
The health of honey bees is managed primarily by beekeepers. Improving the living environment for honey bees, such as by enhancing the extent and quality of honey bee-friendly land covers in the Northern Great Plains, may provide important insurance against sudden and widespread colony losses. The extent to which beekeeper inputs, such as mite-killing insecticides, supplemental feed, and new queens, complement or even substitute for better forage remains uncertain. Is there really a crisis that requires LULC change intervention? If so, will market solutions arise? If Government participation is needed, a suite of actions—ranging from changes in current agricultural manage-ment to setting aside natural habitat—can be considered (Aguire-Guitterez et al., 2015).
In a review of the literature on the effects of LULC on pollinator health, we report the results of several studies and meta-analyses. The general consensus is that nearby quality habitat can lead to enhanced pollination in pollination-dependent crops by native pollinators. For managed honey bees, the situation is more complex, as they are moved around the country to provide services. Managed honeybees'forageneedschangeatdifferentpointsinspaceandtime.However,expandingaccessto high-quality forage, perhaps in locations far from where honey bees are providing pollination services, is one of many possible means of improving honey bee health that may or may not be as cost-effective as more careful management of colonies.
As an exploratory exercise, we developed estimates of nationwide trends in pollinator forage quality from 1982 to 2012 using NRI data in combination with a metric that links LULC to bee forage suit-ability. The results reveal that the geographic scope and the time period of analysis matter. In our analysis, which includes a number of simplifying assumptions, overall changes across broad LULC categories (such as the establishment of the CRP) have led to a small net positive effect on overall honey bee forage quality over the conterminous United States from 1982 to 2012. However, forage

27 Land Use, Land Cover, and Pollinator Health: A Review and Trend Analysis, ERR-232
Economic Research Service/USDA
quality has decreased somewhat since 2002, and in some regions, such as Central North and South Dakota, this decline since 2002 has been more pronounced. Given the simplicity of the metric—which uses rough measures of LULC and does not account for management changes in pesticide and herbicide use as well as field size—these results highlight the need for more detailed analyses.
A number of research initiatives are underway to better understand the impacts of LULC change on pollinator health. These include developing broad-scale models of hive health and LULC change, investigating the contribution of specific floral resources to honey bee health, and trying to under-stand how land use and management decisions incorporate market and policy conditions as well as how the existence of a pollination-service market makes it possible for beekeepers to invest in protecting and expanding their colonies.
We included an economics discussion of markets and pollinators; one that considers the question of when land-use policy designed to improve pollinator health may be useful. For an agricultural oper-ation to set aside land for pollinators is akin to providing a semi-public good, as neighbors receive pollination services (if needed) without needing to compensate the landowner for providing polli-nator habitat. Similarly, from the perspective of beekeepers, the incentive to purchase or rent land for the purpose of providing their honey bees with optimal access to pollen and nectar is reduced as honey bees from other beekeepers in close proximity cannot be excluded from the land (although steps to do so can be undertaken such as with South Dakota and Wyoming apiary registries).
Public good and open-access arguments, alongside others, such as the role of agriculture as a whole to support native pollinators for the benefit of society, may provide a rationale for Government inter-vention to support pollinator health through policies affecting LULC. Alternatively, information on flowering periods, nutritional value of plants to pollinators, and sensitivity of pollinators to pesti-cides could induce growers of pollination-dependent crops to set aside land to support native pollina-tors while lowering their own costs of pollination services by managed pollinators. Other candidate policies include giving growers of commodity crops that are not dependent on pollination services an incentive to reduce pesticide use during the times when pollinators are most vulnerable, or to provide pollinator habitat in buffer strips or as cover crops.
Our review focuses on LULC but recognizes other important stressors, such as pesticide/herbicide use, pests, and diseases. A motivation for modifying LULC to support better forage is the notion that such changes can counteract or at least mitigate these stressors. But the effects can be synergistic. For example, growers are careful to avoid exposing to pesticides the commercial honey bees that descend on their crops for a few weeks each year.19 However, the benefit of setting aside land for native pollinators may require a greater (perhaps year-round) level of care.
19By law, pesticide applicators are required to follow label instructions. For those pesticides toxic to bees, label lan-guage designed by the U.S. Environmental Protection Agency ranges from the vague to the specific, such as, “protect bees” to “do not apply while bees are actively foraging.” (http://www.clemson.edu/public/regulatory/pesticide_regula-tion/bulletins/bulletin_5_protecting_honey bees.pdf

28 Land Use, Land Cover, and Pollinator Health: A Review and Trend Analysis, ERR-232
Economic Research Service/USDA
References
Aguirre-Gutiérrez, J., J.C. Biesmeijer, E.E. van Loon, M. Reemer, M.F. WallisDeVries, and L.G. Carvalheiro. (2015). “Susceptibility of Pollinators to Ongoing Landscape Changes Depends on Landscape History.” Diversity and Distributions, 21(10), 1129-1140. doi: 10.1111/ddi.12350.
Aizen, M.A., and L.D. Harder. (2009). “The Global Stock of Domesticated Honey Bees Is Growing Slower Than Agricultural Demand for Pollination.” Current Biology, 19(11), 915-918. doi: http://dx.doi.org/10.1016/j.cub.2009.03.071.
Alaux, C., F. Ducloz, D. Crauser, and Y. Le Conte. (2010). “Diet Effects on Honeybee Immunocompetence.” Biology Letters, 6(4), 562-565. doi: 10.1098/rsbl.2009.0986.
Apiary Inspectors of America. (2016). United States - State Statutes and Administrative Codes. Retrieved June 15, 2016, www.apiaryinspectors.org/laws/statelaws.html
Barfield, A.S., J.C. Bergstrom, S. Ferreira, A.P. Covich, and K.S. Delaplane. (2015). “An Economic Valuation of Biotic Pollination Services in Georgia.” Journal of Economic Entomology, 108(2), 388-398. doi: 10.1093/jee/tou045
Bee Culture. (2016). “A Closer Look: Feeding Sugar Syrup/HMI.” Bee Culture: The Magazine of American Beekeeping. Retrieved August 20, 2016, www.beeculture.com/a-closer-look-feeding-sugar-syruphmi/
Bee Informed Partnership (BIP). (2016). “A National Survey of Managed Honey Bee 2014-2015 Annual Colony Losses in the USA.” Retrieved June 15 2016, https://beeinformed.org/results-categories/winter-loss/
Bee Informed Partnership (BIP). (2015). “The Bee Informed Partnership National Management Survey 2014-2015.” Retrieved November 28, 2016, https://beeinformed.org/results/the-bee-informed-partnership-national-management-survey-2014-2015/
Bond, J., K. Plattner, and K. Hunt. (2014). Fruit and Tree Nuts Outlook: Economic Insight. U.S. Pollination-Services Market. (FTS-357SA). U.S. Department of Agriculture, Economic Research Service Retrieved, www.ers.usda.gov/media/1679168/fts-357.pdf.
Brittain, C., N. Williams, C. Kremen, and A.-M. Klein. (2013). “Synergistic Effects of Non-Apis Bees and Honey Bees for Pollination Services.” Proceedings of the Royal Society B: Biological Sciences, 280(1754). doi: 10.1098/rspb.2012.2767.
Brodschneider, R., and K. Crailsheim. (2010). “Nutrition and Health in Honey Bees.” Apidologie, 41(3), 278-294. doi: 10.1051/apido/2010012.
Brown, M.J.F., and R.J. Paxton. (2009). “The Conservation of Bees: A Global Perspective.” Apidologie.” 40(3), 410-416. doi: 10.1051/apido/2009019
Bryden, J., R.J. Gill, R.A.A. Mitton, N.E. Raine, and V.A.A. Jansen. (2013). “Chronic Sublethal Stress Causes Bee Colony Failure.” Ecology Letters, 16(12), 1463-1469. doi: 10.1111/ele.12188.
29 Land Use, Land Cover, and Pollinator Health: A Review and Trend Analysis, ERR-232
Economic Research Service/USDA
Burgett, M., S. Daberkow, and R. Rucker. (2010). "U.S. Pollination Markets: Recent Changes and Historical Perspective." American Bee Journal 150(1): 35-41.
Calderone, N.W. (2012). “Insect Pollinated Crops, Insect Pollinators and US Agriculture: Trend Analysis of Aggregate Data for the Period 1992-2009.” PLoS ONE, 7(5), e37235. doi: 10.1371/journal.pone.0037235.
Carvalheiro, L.G., R. Veldtman, A.G. Shenkute, G.B. Tesfay, C.W.W. Pirk, J.S. Donaldson, and S.W. Nicolson. (2011). “Natural and Within-Farmland Biodiversity Enhances Crop Productivity.” Ecology Letters, 14(3), 251-259. doi: 10.1111/j.1461-0248.2010.01579.x.
Champetier, A. (2011). Measuring the Importance of Pollination Externalities in Agriculture. Paper presented at the Agricultural & Applied Economics Association Meeting, Pittsburgh, PA. Poster retrieved from http://ageconsearch.umn.edu/bitstream/104007/2/AAEAPoster2011-PollinationExternalities.pdf
Cheung, S. (1973). “The Fable of the Bees: An Economic Investigation.” The Journal of Law & Economics, 16(1), 11-33.
Clark, C.W. (1980). “Towards a Predictive Model for the Economic Regulation of Commercial Fisheries.” Canadian Journal of Fisheries and Aquatic Sciences, 37(7), 1111-1129. doi: 10.1139/f80-144.
Cusser, S., and K. Goodell (2013). “Diversity and Distribution of Floral Resources Influence the Restoration of Plant-Pollinator Networks on a Reclaimed Strip Mine.” Restoration Ecology 21(6): 713-721.
Cusser, S., J.L. Neff, and S. Jha. (2015). “Land Use Change and Pollinator Extinction Debt in Exurban Landscapes.” Insect Conservation and Diversity, 8(6), 562-572. doi: 10.1111/icad.12139.
Davis, A., and E. Lonsdorf. (2014). “A GIS Tool to Project Managed and Wild Bees on Any Landscape.” Computer model. Miami University.
de Groot, A.P. (1952). “Amino Acid Requirements for Growth of the Honeybee (Apis mellifica L.).” Experientia, 8(5), 192-194. doi: 10.1007/bf02173740
Deguines, N., C. Jono, M. Baude, M. Henry, R. Julliard, and C. Fontaine. (2014). “Large-scale Trade-off Between Agricultural Intensification and Crop Pollination Services.” Frontiers in Ecology and the Environment, 12(4), 212-217. doi: 10.1890/130054.
Di Pasquale, G., M. Salignon, Y. Le Conte, L.P. Belzunces, A. Decourtye, A. Kretzschmar, and C. Alaux. (2013). “Influence of Pollen Nutrition on Honey Bee Health: Do Pollen Quality and Diversity Matter?” PLoS ONE, 8(8), e72016. doi: 10.1371/journal.pone.0072016.
Droege, S. (2015). “Bees in North America: The Whirlwind Tour.” Paper presented at the 2015 Agricultural Outlook Forum, Crystal City, VA. www.usda.gov/oce/forum/2015_Speeches/SDroege.pdf
Ehmke, M., C. Jones-Ritten, J. Shogren, and T. Panchalingam. (2015). “Integrating Ecological and Economic Considerations for Pollinator Habitat Policy.” Choices, 30(2).

30 Land Use, Land Cover, and Pollinator Health: A Review and Trend Analysis, ERR-232
Economic Research Service/USDA
Ferreira, P.A., D. Boscolo, and B.F. Viana. (2013). “What Do We Know About the Effects of Landscape Changes on Plant-Pollinator Interaction Networks?” Ecological Indicators, 31, 35-40. doi: http://dx.doi.org/10.1016/j.ecolind.2012.07.025.
Gallant, A.L., N.H. Euliss, Jr., and Z. Browning. (2014). “Mapping Large-Area Landscape Suitability for Honey Bees to Assess the Influence of Land-Use Change on Sustainability of National Pollination Services.” PLoS ONE, 9(6), e99268. doi: 10.1371/journal.pone.0099268.
Garibaldi, L.A., I. Steffan-Dewenter, C. Kremen, J.M. Morales, R. Bommarco, S.A. Cunningham, A.M. Klein. (2011). “Stability of Pollination Services Decreases With Isolation From Natural Areas Despite Honey Bee Visits.” Ecology Letters, 14(10), 1062-1072. doi: 10.1111/j.1461-0248.2011.01669.x.
Gordon, H.S. (1954). “The Economic Theory of a Common-Property Resource: The Fishery.” Journal of Political Economy, 62(2), 124-142.
Gravelle, H., and R. Rees. (2004). Microeconomics 3rd ed.: Prentice Hall.
Grünewald, B. (2010). “Is Pollination at Risk? Current Threats to and Conservation of Bees.” GAIA - Ecological Perspectives for Science and Society, 19(1), 61-67.
Hardin, G. (1968). “The Tragedy of the Commons.” Science, 162(3859), 1243-1248. doi: 10.1126/science.162.3859.1243.
Härtel, S., and I. Steffan-Dewenter (2014). “Ecology: Honey Bee Foraging in Human-Modified Landscapes.” Current Biology 24(11): R524-R526.
Hoff, F.L. (1995). Honey: Background for 1995 Farm Legislation. (AER-708). U.S. Department of Agriculture, Economics Research Service, https://www.ers.usda.gov/publications/pub-details/?pubid=40623.
Honey Bee World. (2016). “Splitting Hives.” Retrieved August 20, 2016, 2016, www.honeybeeworld.com/spring/splits.htm
Hopwood, J. (2013). “Roadsides as Habitat for Pollinators: Management to Support Bees and Butterflies.” Paper presented at the International Conference on Ecology and Transportation, Scotsdale, AZ.
Huang, Z. (2012). “Pollen Nutrition Affects Honey Bee Stress Resistance.” Terrestrial Arthropod Reviews, 5(2), 175-189. doi: doi:http://dx.doi.org/10.1163/187498312X639568.
Jha, S., and C. Kremen (2013). “Resource Diversity and Landscape-Level Homogeneity Drive Native Bee Foraging.” Proceedings of the National Academy of Sciences 110(2): 555-558.
Johnson, R. (2010). Honey Bee Colony Collapse Disorder. Congressional Research Service, Retrieved May 1, 2017, fas.org/sgp/crs/misc/RL33938.pdf
Johnson, R., M. Lynee Corn. (2015). Bee Health: Background and Issues for Congress Congressional Research Service, Retrieved May 1, 2017, www.fas.org/sgp/crs/misc/R43191.pdf.

31 Land Use, Land Cover, and Pollinator Health: A Review and Trend Analysis, ERR-232
Economic Research Service/USDA
Kaplan, K. (2015). “Bee Survey: Lower Winter Losses, Higher Summer Losses, Increased Total Annual Losses.” ARS Research News. U.S. Department of Agriculture, Agricultural Research Service. www.ars.usda.gov/news-events/news/research-news/2015/bee-survey-lower-winter-losses-higher-summer-losses-increased-total-annual-losses/ (Accessed June 1, 2017).
Kennedy, C.M., E. Lonsdorf, M.C. Neel, N.M. Williams, T.H. Ricketts, R. Winfree, and C. Kremen, (2013). “A Global Quantitative Synthesis of Local and Landscape Effects on Wild Bee Pollinators in Agroecosystems.” Ecology Letters, 16(5), 584-599. doi: 10.1111/ele.12082.
Kershner, Kelly (1999) Scientist: Honeybees in the Wild Nearly Gone in North America”, Ohio State University Research Note. http://researchnews.osu.edu/archive/bee.htm
Kirwan, B., R.N. Lubowski, and M.J. Roberts. (2005). “How Cost-Effective Are Land Retirement Auctions? Estimating the Difference between Payments and Willingness to Accept in the Conservation Reserve Program.” American Journal of Agricultural Economics, 87(5), 1239-1247. doi: 10.1111/j.1467-8276.2005.00813.x.
Klonsky, K. (2011). Economics of Almond Production. Paper presented at the Economics of Almond Production Almond Board Webinar. www.almonds.com/sites/default/files/content/attachments/economics_of_almond_production.pdf
Koh, I., E.V. Lonsdorf, N.M. Williams, C. Brittain, R. Isaacs, J. Gibbs, and T.H. Ricketts. (2016). “Modeling the Status, Trends, and Impacts of Wild Bee Abundance in the United States.” Proceedings of the National Academy of Sciences, 113(1), 140-145. doi: 10.1073/pnas.1517685113.
Kremen, C., N.M. Williams, and R.W. Thorp. (2002). “Crop Pollination From Native Bees at Risk From Agricultural Intensification.” Proceedings of the National Academy of Sciences, 99(26), 16812-16816. doi: 10.1073/pnas.262413599.
Landis, D.A. (2016). “Designing Agricultural Landscapes for Biodiversity-Based Ecosystem Services.” Basic and Applied Ecology. doi: http://dx.doi.org/10.1016/j.baae.2016.07.005.
Ledyard, J.O. (2008). “Market Failure.” In S.N. Durlauf and L.E. Blume (eds.), The New Palgrave Dictionary of Economics. Basingstoke: Palgrave Macmillan.
London-Shafir, I., S. Shafir, and D. Eisikowitch. (2003). “Amygdalin in Almond Nectar and Pollen – Facts and Possible Roles.” Plant Systematics and Evolution, 238(1), 87-95. doi: 10.1007/s00606-003-0272-y.
Lonsdorf, E., C. Kremen, T. Ricketts, R. Winfree, N. Williams, and S. Greenleaf. (2009). “Modelling Pollination Services Across Agricultural Landscapes.” Annals of Botany, 103(9), 1589-1600. doi: 10.1093/aob/mcp069.
Losey, J.E., and M. Vaughan. (2006). “The Economic Value of Ecological Services Provided by Insects.” BioScience, 56(4), 311-323. doi: 10.1641/0006-3568(2006)56[311:tevoes]2.0.co;2.
MacDonald, J., P. Korb, and R. Hoppe. (2013). Farm Size and the Organization of U.S. Crop Farming. (ERR-152). U.S. Department of Agriculture, Economic Research Service, www.ers.usda.gov/media/1156726/err152.pdf.

32 Land Use, Land Cover, and Pollinator Health: A Review and Trend Analysis, ERR-232
Economic Research Service/USDA
Meehan, T.D., B.P. Werling, D.A. Landis, and C. Gratton. (2011). “Agricultural Landscape Smplification and Insecticide Use in the Midwestern United States.” Proceedings of the National Academy of Sciences, 108(28), 11500-11505. doi: 10.1073/pnas.1100751108.
National Research Council. (2007). Status of Pollinators in North America. Washington, DC: The National Academies Press.
Naug, D. (2009). “Nutritional Stress Due to Habitat Loss May Explain Recent Honeybee Colony Collapses.” Biological Conservation, 142(10), 2369-2372. doi: http://dx.doi.org/10.1016/j.biocon.2009.04.007
Nordhaus, H. (2011). The Beekeeper’s Lament: How One Man and Half a Billion Honeybees Help Feed America: Harper Collins.
Otto, C. (2014). “Effects of Land Use on Insect Pollinator Health and Productivity in the Northern Great Plains: Avenues for Conservation.” Retrieved June 20, 2016, https://fsawebinars.adobecon-nect.com/_a1158554885/p3afzxyt2e2/?launcher=false&fcsContent=true&pbMode=normal
Otto, C.R.V., C.L. Roth, B.L. Carlson, and M.D. Smart. (2016). “Land-use Change Reduces Habitat Suitability for Supporting Managed Honey Bee Colonies in the Northern Great Plains.” Proceedings of the National Academy of Sciences. doi: 10.1073/pnas.1603481113.
Paudel, Y.P., R. Mackereth, R. Hanley, and W. Qin. (2015). “Honey Bees (Apis mellifera L.) and Pollination Issues: Current Status, Impacts and Potential Drivers of Decline.” Journal of Agricultural Science 7(6). doi: 10.5539/jas.v7n6p93.
Pernal, S. (2008). “CAPA Statement on Honey Bees Losses in Canada (Spring 2008)–Final Revision.” Canadian Association of Professional Apiculturists.
Pernal, S.F., and R.W. Currie. (2001). “The Influence of Pollen Quality on Foraging Behavior in Honeybees (Apis mellifera L.).” Behavioral Ecology and Sociobiology, 51(1), 53-68.
Pheasants Forever. (2015). “Build Your Own Seed Mix.” Retrieved June 15, 2016, http://nebraskapf.com/store/build-your-own-seed-mix/
Pigou, A.C. (1932). The Economics of Welfare, 4th edition. London: MacMillan.
Pollinator Partnership. (2009). Conservation Reserve Program Supplemental Environmental Impact Statement — Implementing 2008 Farm Bill Pollinator Conservation Provisions (pp. 5): Pollinator Partnership.
Pollinator Health Task Force (2016). “Pollinator Partnership Action Plan”. U.S. Department of Agriculture and U.S. Environmental Protection Agency. Retrieved April 2017. https://www.white-house.gov/sites/whitehouse.gov/files/images/Blog/PPAP_2016.pdf
Potts, S.B.K., R. Bommarco, T. Breeze, L. Carvalheiro, M. Franzén, J.P. González-Varo, A. Holz-schuh, D. Kleijn, A.-M. Klein, B. Kunin, T. Lecocq, O. Lundin, D. Michez, P. Neumann, A. Nieto, L. Penev, P. Rasmont., O. Ratamäki, V. Riedinger, S.P.M. Roberts, M. Rundlöf, J. Scheper, P. Sørensen, I. Steffan-Dewenter, P Stoev, M. Vilà, and O. Schweiger. (2015). Status and trends of European pollinators. Key findings of the STEP project (pp. 72). Sofia, Bulgaria: European

33 Land Use, Land Cover, and Pollinator Health: A Review and Trend Analysis, ERR-232
Economic Research Service/USDA
Commission the 7th Framework Programme for Research and Technological Development. http://www.step-project.net/online-library.php?P=7&SP=9
Potts, S.G., J.C. Biesmeijer, C. Kremen, P. Neumann, O. Schweigerand W.E. Kunin. (2010). “Global Pollinator Declines: Trends, Impacts and Drivers.” Trends in Ecology & Evolution, 25(6), 345-353. doi: http://dx.doi.org/10.1016/j.tree.2010.01.007.
Ribaudo, M., L. Hansen, D. Hellerstein, and C. Greene. (2008). The Use of Markets To Increase Private Investment in Environmental Stewardship. (ERR-64) U.S. Department of Agriculture, Economic Research Service, www.ers.usda.gov/publications/pub-details/?pubid=46077.
Ricketts, T.H., J. Regetz, I. Steffan-Dewenter, S.A. Cunningham, C. Kremen, A. Bogdanski, and B.F. Viana. (2008). “Landscape Effects on Crop Pollination Services: Are There General Patterns?” Ecology Letters, 11(5), 499-515. doi: 10.1111/j.1461-0248.2008.01157.x.
Rose, T., C. Kremen, A. Thrupp, Ba Gemmill-Herren, B. Graub, N. Azzu. (2014). “Policy Analysis Paper: Mainstreaming of Biodiversity and Ecosystem Services With A Focus on Pollination.” Food and Agriculture Organization of the United Nations.
Rucker, R., and W. Thurman. (2012). “Colony Collapse Disorder: The Market Response to Bee Disease.” In R. Meiners (ed.), PERC Policy Series (Vol. 50, pp. 32): PERC.
Rucker, R., W. Thurman, and M. Burgett. (2014). "Colony Collapse Disorder: The Economic Consequences of Bee Disease," N.C. State University Agricultural and Resource Economics Working Paper.
Rucker, R., W. Thurman, and M. Burgett. (2012). “Honey Bee Pollination Markets and the Internalization of Reciprocal Benefits.” American Journal of Agricultural Economics, 94(4), 956-977. doi: 10.1093/ajae/aas031.
Rucker, R.R., W.N. Thurman, and M. Burgett. (2016). “Colony Collapse and the Economic Consequences of Bee Disease: Adaptation to Environmental Change.” Montana State University Working Paper.
Sanford, M.T., J. Klopchin, and J.D. Ellis. (2003). “Sample Pollination Agreement.” Entomology and Nematology Department, University of Florida, and Institute of Food and Agricultural Sciences (IFAS).
Smart, M.D., J.S. Pettis, N. Euliss, and M.S. Spivak. (2016). “Land Use in the Northern Great Plains Region of the U.S. Influences the Survival and Productivity of Honey Bee Colonies.” Agriculture, Ecosystems & Environment, 230, 139-149. doi: http://dx.doi.org/10.1016/j.agee.2016.05.030.
Spivak, M.S. (Producer). (2013, July 15, 2016). “Why Bees Are Disappearing.” TED Talk. Retrieved from www.youtube.com/watch?feature=player_embedded&v=dY7iATJVCso
Steffan-Dewenter, I., and C. Westphal. (2008). “The Interplay of Pollinator Diversity, Pollination Services and Landscape Change.” Journal of Applied Ecology, 45(3), 737-741. doi: 10.1111/j.1365-2664.2008.01483.x.

34 Land Use, Land Cover, and Pollinator Health: A Review and Trend Analysis, ERR-232
Economic Research Service/USDA
Steinhauer, Natalie (2016). “BIP and NASS: Why the Difference.” Bee Culture, June, 1:5. http://www.beeculture.com/bip-nass-difference/
U.S. Department of Agriculture (USDA). (2015). Using 2014 Farm Bill Programs for Pollinator Conservation. (78). U.S. Department of Agriculture. Retrieved from http://plants.usda.gov/polli-nators/Using_2014_Farm_Bill_Programs_for_Pollinator_Conservation.pdf.
U.S. Department of Agriculture (USDA). (2014). “USDA Honey Bee Forage and Nutrition Summit.” Paper presented at the USDA Honey Bee Forage and Nutrition Summit, Alexandria, VA.
U.S. Department of Agriculture (USDA). (2012). “Report on the National Stakeholders Conference on Honey Bee Health.” Paper presented at the National Honey Bee Health Stakeholder Conference, Alexandria, VA, October 15-17.
U.S. Department of Agriculture, Farm Service Agency (USDA-FSA). (2016). Conservation Reserve Program. Retrieved August 20, 2016, from www.fsa.usda.gov/programs-and-services/conservation-programs/conservation-reserve-program/index
U.S. Department of Agriculture, Farm Service Agency (USDA-FSA). (2013). CP42 Pollinator Habitat: Establishing and Supporting Diverse Pollinator-Friendly Habitat Retrieved September 1, 2016, from www.fsa.usda.gov/Internet/FSA_File/cp42_habitat.pdf
U.S. Department of Agriculture, National Agricultural Statistics Service (USDA-NASS). (2017). Honey Report (multiple years). Retrieved July 15 2016, from U.S. Department of Agriculture, National Agricultural Statistical Service, http://usda.mannlib.cornell.edu/MannUsda/viewDocu-mentInfo.do?documentID=1191
U.S. Department of Agriculture, National Agricultural Statistics Service (USDA-NASS). (2016a). Quick Stats. U.S. Department of Agriculture. https://quickstats.nass.usda.gov/
U.S. Department of Agriculture, National Agricultural Statistics Service (USDA-NASS). (2016b). Honey Bee Colonies Report, http://usda.mannlib.cornell.edu/MannUsda/viewDocumentInfo.do?documentID=1943
U.S. Department of Agriculture, National Agricultural Statistics Service (USDA-NASS). (2016c). Cost of Pollination Report, http://usda.mannlib.cornell.edu/usda/current/CostPoll/CostPoll-12-22-2016.pdf.
U.S. Department of Agriculture, Natural Resources Conservation Service (USDA-NRCS). (2016a). National Resources Inventory: A statistical survey of land use and natural resource conditions and trends on U.S. non-Federal lands. Retrieved from www.nrcs.usda.gov/wps/portal/nrcs/main/national/technical/nra/nri/.
U.S. Department of Agriculture, Natural Resources Conservation Service (USDA-NRCS). (2016b). Summary Report: 2010 National Resources Inventory. Retrieved from www.nrcs.usda.gov/Internet/FSE_DOCUMENTS/stelprdb1167354.pdf.
U.S. Department of Agriculture, Natural Resources Conservation Service (USDA-NRCS). (2016c). Major Land Resource Area (MLRA) | NRCS Soils. Retrieved from http://www.nrcs.usda.gov/wps/portal/nrcs/detail/soils/survey/?cid=nrcs142p2_053624.

35 Land Use, Land Cover, and Pollinator Health: A Review and Trend Analysis, ERR-232
Economic Research Service/USDA
U.S. Department of Agriculture, Natural Resources Conservation Service (USDA-NRCS). (2016d). Insects and Pollinators: Pollinators by the Numbers. Retrieved from www.nrcs.usda.gov/wps/portal/nrcs/main/national/plantsanimals/pollinate/
U.S. Department of Agriculture, Natural Resources Conservation Service (USDA-NRCS). (2015). “USDA To Invest $4 Million for Honey Bee Food Sources on Private Lands [Press release]. Retrieved from www.nrcs.usda.gov/wps/portal/nrcs/detail/national/newsroom/releases/?cid=nrcseprd405226
U.S. Department of Agriculture, Statistical Reporting Service (USDA-SRS). (1982). Honey. Retrieved from http://usda.mannlib.cornell.edu/usda/nass/Hone//1980s/1982/Hone-01-15-1982.pdf
U.S. Environmental Protection Agency. (EPA). (2014). EPA Listening Session on Pollinator Strategy- Part 1. Paper presented at the EPA Listening Session on Pollinator Strategy, Crystal City, VA, November 1.
U.S. Geological Survey (USGS). (2016). Pesticide National Synthesis Project, Pesticide Use Maps – Glyphosate. National Water-Quality Assessment (NAWQA) Program. Retrieved from http://water.usgs.gov/nawqa/pnsp/usage/maps/show_map.php?year=2014&map=GLYPHOSATE&hilo=L&disp=Glyphosate
vanEngelsdorp, D., and M.D. Meixner. (2010). “A Historical Review of Managed Honey Bee Populations in Europe and the United States and the Factors That May Affect Them.” Journal of Invertebrate Pathology, 103, Supplement, S80-S95. doi: http://dx.doi.org/10.1016/j.jip.2009.06.011.
vanEngelsdorp, D., R. Underwood, D. Caron, and J. Hayes Jr. (2007). "Estimate of Managed Colony Losses in the Winter of 2006-2007: A Report Commissioned by the Apiary Inspectors of America." American Bee Journal 147(7): 599-603.
Viana, B.F., D. Boscolo, E. Mariano Neto, L.E. Lopes, A.V. Lopes, P.A. Ferreira, C.M. Pigozzo, and L.M. Primo (2012). “How Well Do We Understand Landscape Effects on Pollinators and Pollination Services?” Journal of Pollination Ecology 7(5): 31-41.
White, E.V., and D.P. Roy. (2015). “A Contemporary Decennial Examination of Changing Agricultural Field Sizes Using Landsat Time Series Data.” Geo: Geography and Environment, 2(1), 33-54. doi: 10.1002/geo2.4.
Winfree, R., R. Aguilar, D.P. Vázquez, G. LeBuhn, and M.A. Aizen. (2009). “A Meta-Analysis of Bees’ Responses to Anthropogenic Disturbance.” Ecology, 90(8), 2068-2076. doi: 10.1890/08-1245.1.
Wojcik, V. (2015). “Evaluating CRP Landscapes for Pollinator Support Capacity.” U.S. Department of Agriculture, Farm Service Agency Webinar. Retrieved August 20, 2016, from https://fsawebi-nars.adobeconnect.com/_a1158554885/p3ckul27c8g/?launcher=false&fcsContent=true&pbMode=normal
Wright, C.K., and M.C. Wimberly. (2013). “Recent Land Use Change in the Western Corn Belt Threatens Grasslands and Wetlands.” Proceedings of the National Academy of Sciences, 110(10), 4134-4139. doi: 10.1073/pnas.1215404110.

36 Land Use, Land Cover, and Pollinator Health: A Review and Trend Analysis, ERR-232
Economic Research Service/USDA
Appendix 1: FSI Scores for NRI Land-Use Categories
The forage suitability index (FSI) values assign nine categories in table 3—of similar (in FSI terms) land covers—created by combining NRI “land cover/use” codes. The FSI scores in appendix table 1.1 were assigned to each land cover/use:
Appendix table 1.1FSI scores assigned to NRI LULC categories
Forage suitability index (FSI) Land-use, land-cover (LULC) categories in NRI (category number in parentheses)
0 Water (900-920)
0.157 Corn (11), Sorghum (12)
0.169 Wheat (111), oats (112), rice (113), barley (114), all other close grown (116)
0.224 Vineyard (3)
0.227 Nuts (2), peanuts (15)
0.250 Sugar beets (17), other row crops (20)
0.253 Barren (611-620)
0.260 Cotton (14)
0.268 Tobacco (16)
0.269 Soybean (13)
0.307 Other veg/truck crops (19)
0.317 Summer fallow (170), aquaculture (171), other set aside (160)
0.322 Berries (5), potatoes (18)
0.332 Hayland (140)
0.351 Fruit (1)
0.434 Sunflower (21)
0.441 Brush fruit (4)
0.450 Pastureland (210), rangeland (250), other land (401), CRP (410), all other land (650), rural transportation (800)
0.474 Marshland (640)
0.482 Forestland (341-342)
0.495 Other horticultural (6)
0.537 Farmsteads (400)
FSI=Forage suitability Index. NRI=National Resource Inventory. CRP=Conservation Reserve Program.
Source: USDA, Economic Research Service using Lonsdorf et al. (2009) and Koh et al. (2016). The index in Koh et al. (2016) is based on a 14-member panel’s expert assessment of floral resources for each LULC category.

37 Land Use, Land Cover, and Pollinator Health: A Review and Trend Analysis, ERR-232
Economic Research Service/USDA
The nine categories in table 3—of similar (in FSI terms) land covers—are created by combining these NRI “land cover/uses.”
Appendix table 1.2Assignation of NRI land cover/uses to FSI category
Broad category Contains NRI points with the following land cover/uses:
Other low FSI land Various barren lands (i.e., sand dunes, beaches, and exposed rock), water bodies
Farmland: very low FSI Corn, sorghum, wheat, oats, rice, barley, other close grown
Farmland: low FSI Nuts, vineyard, soybeans, cotton, peanuts, tobacco, sugar beets, other row crops
Farmland: medium FSI Hort/fruit, berries, potatoes, other veg/truck crops, hayland, other crop/sum-mer fallow, aquaculture, other crop
Farmland: high FSI Hort/bush fruit, hort/other, sunflower, other farmland, farmstead
Forestland Forestland (grazed and not grazed)
Pasture & rangeland Pasture, rangeland
Conservation Reserve Program CRP
Other high FSI land Other rural/marshland, all other land (includes pasture and forest), rural transportation
NRI=National Resource Inventory. CRP=Conservation Reserve Program. FSI=Forage suitability index.
Source: USDA, Economic Research Service using non-Federal, nonurban NRI data.

38 Land Use, Land Cover, and Pollinator Health: A Review and Trend Analysis, ERR-232
Economic Research Service/USDA
Appendix 2: Changes in Acreage for Broad Categories (of Land Uses/Covers With Similar FSI)
As displayed in appendix figure 2.1, between 1982 and 2002 the grain cropland area declined in the Central Feed Grains and Great Plains regions. Over this same time period and in these same regions, nongrain cropland increased. The trend reversed itself from 2002 to 2012 in the Northern Great Plains and Central Feed Grain regions. Introduced in 1986, the CRP enrolled acreage primarily in the Northern and Western Great Plains and the Central Feed Grain regions. These are the same regions that saw a decline in CRP acreage between 2002 and 2012. The area of pastureland has been declining in the Northern Great Plains and Central Feed Grain regions. In the West, pastureland has become more common. Between 1982 and 2002, the Eastern and Southern United States experi-enced an expansion in forestland acreage.

39 Land Use, Land Cover, and Pollinator Health: A Review and Trend Analysis, ERR-232
Economic Research Service/USDA
Appendix figure 2.1
Changes in acreage, by broad category from 1982 to 2002 and 2002 to 2012
Continued—
1982 - 2002 2002 - 2012 Grain cropland
Conservation Reserve Program
Nongrain cropland

40 Land Use, Land Cover, and Pollinator Health: A Review and Trend Analysis, ERR-232
Economic Research Service/USDA
Appendix figure 2.1
Changes in acreage, by broad category from 1982 to 2002 and 2002 to 2012—continued
Source: USDA, Economic Research Service using USDA, Natural Resources Conservation Service, National Resources Inventory.
1982 - 2002 2002 - 2012
Pastureland
Forestland
Region Legend
Percent change in area
-100 to -6
-6 to -3
-3 to 3
3 to 6
7 to 100
Western RangeCentral
Feed GrainsCentral
Great Plains
WesternGreat Plains
Northern Great Plains

41 Land Use, Land Cover, and Pollinator Health: A Review and Trend Analysis, ERR-232
Economic Research Service/USDA
Appendix 3: Sensitivity Analysis: Changing the FSI of CRP Acreage
In the analysis earlier, an FSI value of 0.45 is assigned to all National Resources Inventory (NRI) points identified as Conservation Reserve Program (CRP). However, the forage suitability index (FSI) of land enrolled in the CRP depends on conservation practices installed on the land. Some practices (such as native grasses installed under CP2) are likely to provide better pollinator habitat than others (such as softwood trees installed under CP3). Thus, a more accurate measure should differentiate CRP acreage by the conservation practice installed.
However, due to the limitations of the NRI data, it is not straightforward to assign a conservation practice to NRI points assigned a land cover/use (LCU) of CRP. This is especially true for earlier years, where other USDA data (such as Common Land Unit) are not readily available.
To examine the implications of choosing an FSI value of 0.45 for all CRP lands, two alternative models were created: one with a CRP FSI of 0.35 (a moderately high value) and one with FSI values of 0.60 (well above the current maximum FSI for the land use/covers considered in this analysis).
As illustrated in appendix figure 3.1, the overall qualitative results do not change. Under all three FSI estimates, the average FSI scores peak in 2002, and the “Dakotas” region (the 87 counties deemed as prime over-summering grounds) has a sharper peak. With an FSI score of 0.35, the peak is attenuated. Conversely, with an FSI score of 0.60, the peak is sharper, especially in the “Dakotas.”
Going beyond these qualitative findings requires more sophisticated research that uses finer grained land-use coverages and incorporates additional variables.
Appendix figure 3.1
Trends in average FSI scores for the United States and the Central Dakotas under differentFSI scores for CRP
Average forage suitability index score (Index, 2002=100)
Note: Forage suitability index (FSI) is normalized so that, in 2002, it is equal to 100 for both the Central Dakotas and the United States. Note that the Central Dakotas contain a lower share of noncropland than the U.S. average. The solid lines show trends in the United States and the Central Dakotas with an FSI score of 0.45 for Conservation Reserve Program (CRP), as is assumed in the main analysis. The dotted and dashed lines show the trends in forage suitability assuming FSI scores of 0.35 and 0.60, respectively, for CRP. In both cases, forage suitability in the Central Dakotas has declined to a greater degree than in the United States as a whole. Source: USDA, Economic Research Service using non-Federal, nonurban NRI data.
93
94
95
96
97
98
99
100
101
1982 1987 1992 1997 2002 2007 2010 2012
U.S. (CRP FSI is 0.45) U.S. (CRP FSI is 0.35) U.S. (CRP FSI is 0.60)
Dakotas (CRP FSI is 0.45) Dakotas (CRP FSI is 0.35) Dakotas (CRP FSI is 0.60)
Related Documents