Land Degradation Focal Area Study NOVEMBER 2018 FULL REPORT

Welcome message from author
This document is posted to help you gain knowledge. Please leave a comment to let me know what you think about it! Share it to your friends and learn new things together.
Transcript

Land Degradation Focal Area Study
NOVEMBER 2018F U L L R E P O R T

Global Environment Facility Independent Evaluation Office
Land Degradation Focal Area StudyNovember 2018
Evaluation Report No. 120
This report was presented to the Council in May 2017.
© 2018 Global Environment Facility Independent Evaluation Office1818 H Street, NW, Washington, DC 20433Internet: www.gefieo.org/; email: [email protected]
Reproduction permitted provided source is acknowledged. Please cite the work as follows: Global Environment Facility Independent Evaluation Office (GEF IEO), Land Degradation Focal Area Study, Evaluation Report No. 120, Washington, DC: GEF IEO, 2018.
The findings, interpretations, and conclusions in this report are those of the authors and do not necessarily reflect the views of the GEF Council or the governments it represents.
ISBN: 978-1-64233-003-8
Cover: Subsistence farming in cold desert, Ladakh, India, by Anupam Anand/GEF IEO
iii
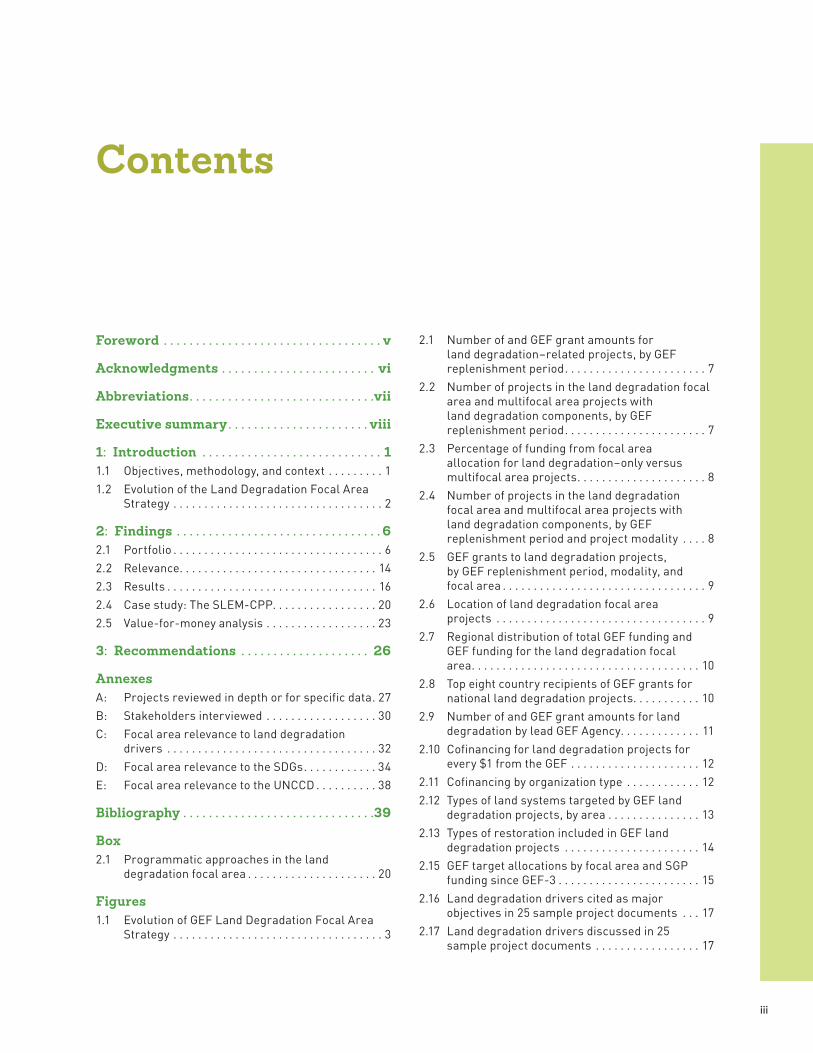
Contents
Foreword . . . . . . . . . . . . . . . . . . . . . . . . . . . . . . . . . . v
Acknowledgments . . . . . . . . . . . . . . . . . . . . . . . . vi
Abbreviations . . . . . . . . . . . . . . . . . . . . . . . . . . . . .vii
Executive summary . . . . . . . . . . . . . . . . . . . . . . viii
1: Introduction . . . . . . . . . . . . . . . . . . . . . . . . . . . . 11.1 Objectives, methodology, and context . . . . . . . . . 11.2 Evolution of the Land Degradation Focal Area
Strategy . . . . . . . . . . . . . . . . . . . . . . . . . . . . . . . . . . 2
2: Findings . . . . . . . . . . . . . . . . . . . . . . . . . . . . . . . . 62.1 Portfolio . . . . . . . . . . . . . . . . . . . . . . . . . . . . . . . . . . 62.2 Relevance. . . . . . . . . . . . . . . . . . . . . . . . . . . . . . . . 142.3 Results . . . . . . . . . . . . . . . . . . . . . . . . . . . . . . . . . . 162.4 Case study: The SLEM-CPP. . . . . . . . . . . . . . . . . 202.5 Value-for-money analysis . . . . . . . . . . . . . . . . . . 23
3: Recommendations . . . . . . . . . . . . . . . . . . . . 26
Annexes A: Projects reviewed in depth or for specific data. 27B: Stakeholders interviewed . . . . . . . . . . . . . . . . . . 30C: Focal area relevance to land degradation
drivers . . . . . . . . . . . . . . . . . . . . . . . . . . . . . . . . . . 32D: Focal area relevance to the SDGs. . . . . . . . . . . . 34E: Focal area relevance to the UNCCD . . . . . . . . . . 38
Bibliography . . . . . . . . . . . . . . . . . . . . . . . . . . . . . .39
Box2.1 Programmatic approaches in the land
degradation focal area . . . . . . . . . . . . . . . . . . . . . 20
Figures1.1 Evolution of GEF Land Degradation Focal Area
Strategy . . . . . . . . . . . . . . . . . . . . . . . . . . . . . . . . . . 3
2.1 Number of and GEF grant amounts for land degradation–related projects, by GEF replenishment period. . . . . . . . . . . . . . . . . . . . . . . 7
2.2 Number of projects in the land degradation focal area and multifocal area projects with land degradation components, by GEF replenishment period. . . . . . . . . . . . . . . . . . . . . . . 7
2.3 Percentage of funding from focal area allocation for land degradation–only versus multifocal area projects. . . . . . . . . . . . . . . . . . . . . 8
2.4 Number of projects in the land degradation focal area and multifocal area projects with land degradation components, by GEF replenishment period and project modality . . . . 8
2.5 GEF grants to land degradation projects, by GEF replenishment period, modality, and focal area . . . . . . . . . . . . . . . . . . . . . . . . . . . . . . . . . 9
2.6 Location of land degradation focal area projects . . . . . . . . . . . . . . . . . . . . . . . . . . . . . . . . . . 9
2.7 Regional distribution of total GEF funding and GEF funding for the land degradation focal area. . . . . . . . . . . . . . . . . . . . . . . . . . . . . . . . . . . . . 10
2.8 Top eight country recipients of GEF grants for national land degradation projects. . . . . . . . . . . 10
2.9 Number of and GEF grant amounts for land degradation by lead GEF Agency. . . . . . . . . . . . . 11
2.10 Cofinancing for land degradation projects for every $1 from the GEF . . . . . . . . . . . . . . . . . . . . . 12
2.11 Cofinancing by organization type . . . . . . . . . . . . 122.12 Types of land systems targeted by GEF land
degradation projects, by area . . . . . . . . . . . . . . . 132.13 Types of restoration included in GEF land
degradation projects . . . . . . . . . . . . . . . . . . . . . . 142.15 GEF target allocations by focal area and SGP
funding since GEF-3 . . . . . . . . . . . . . . . . . . . . . . . 152.16 Land degradation drivers cited as major
objectives in 25 sample project documents . . . 172.17 Land degradation drivers discussed in 25
sample project documents . . . . . . . . . . . . . . . . . 17
LAnD DEgRADAtIon FoCAL AREA StuDyiv
2.18 Performance ratings for land degradation focal area projects . . . . . . . . . . . . . . . . . . . . . . . . 18
2.19 Land degradation focal area projects with satisfactory/likely performance and sustainability ratings by region. . . . . . . . . . . . . . 18
2.20 Percentage of land degradation focal area projects with sustainability ratings of moderately likely or above . . . . . . . . . . . . . . . . . 19
2.21 Average project outcome and sustainability ratings for all land degradation projects by total project investment amount. . . . . . . . . . . . . 19
2.22 Increase in vegetation productivity in Madhya Pradesh child project: time-series plot and vegetation productivity maps . . . . . . . . . . . . . . . 21
2.23 Average estimated differences in rate of total forest loss at GEF intervention versus control locations. . . . . . . . . . . . . . . . . . . . . . . . . . . . . . . . . 24
2.24 Average estimated differences in increased vegetation productivity at GEF intervention versus control locations. . . . . . . . . . . . . . . . . . . . 24
2.25 Average estimated differences in reduced forest fragmentation at GEF intervention versus control locations. . . . . . . . . . . . . . . . . . . . 24
2.26 Average estimate differences for key factors at GEF intervention versus control locations . . 25
tables2.1 Expected direct and indirect benefits tracked
in eligible land degradation focal area projects . . . . . . . . . . . . . . . . . . . . . . . . . . . . . . . . . 13
2.2 Number of tracking tool indicators for land degradation projects by GEF replenishment period . . . . . . . . . . . . . . . . . . . . . . . . . . . . . . . . . . . 14
v
Foreword
During the first decade of the Global Environ-ment Facility (GEF), land degradation was
viewed as a “linkage activity” that cut across its climate change, biodiversity, and international waters focal areas. Land degradation was estab-lished as a separate GEF focal area during the third GEF replenishment in 2002, leading to imme-diate allocation of resources to directly combat the challenges associated with this global issue. The next few GEF periods had more integrated regional or multicountry projects, with expan-sion into the programmatic and multifocal area approaches, and the recent launch of integrated approach pilots during GEF-6. The GEF Assembly declared the GEF a financial mechanism for the United Nations Convention to Combat Desertifica-tion (UNCCD) in May 2010.
This study is the first comprehensive evaluation conducted by the GEF Independent Evaluation Office to assess GEF support to activities focused on addressing land degradation. Stand-alone evaluations of GEF support to the land degrada-tion focal area had not been conducted previously either by the Office or any other agency. The study’s purpose was to inform the GEF-7 replen-ishment process by evaluating the focal area since GEF-3.
The study derived evidence from a wide range of sources, using innovative methods such as geo-spatial techniques and value for money analysis alongside traditional evaluation methods. Sources of evidence include document reviews, key infor-mant interviews, portfolio analysis of 618 projects, value for money analysis, review of completed projects, and a case study. Staff from the GEF Sec-retariat, the GEF Agencies, and the GEF Scientific and Technical Advisory Panel as well as GEF Coun-cil members provided expert inputs and technical feedback.
The study was presented to the GEF’s 51st Coun-cil meeting in October 2016 as part of the Office’s Semi-Annual Evaluation Report. The Council noted that similar value for money analysis in other eval-uations of GEF focal areas would make a strong case for a robust replenishment. The findings of this study also contributed to the GEF report to the UNCCD’s 13th session of the Conference of the Parties (COP13) and side events in Ordos, China.
Juha I. UittoDirector, GEF Independent Evaluation Office
vi
Acknowledgments
This evaluation was led by Anupam Anand, Eval-uation Officer with the Independent Evaluation
Office (IEO) of the Global Environment Facility (GEF). The core evaluation team members were Sara El Choufi, Evaluation Analyst, and Maximilian Ashwill, Consultant. A team led by Daniel Runfola, from AidData at the College of William and Mary, contributed to the value for money analysis. Min Feng, Consultant, helped with the satellite data analysis. Peixuan Zhou, Evaluation Analyst, and Qijin Wu, Consultant, helped with the portfolio analysis.
The evaluation benefited from guidance and over-sight provided by Juha Uitto, Director of the IEO. Supervision and quality control were provided by Geeta Batra, IEO Chief Evaluation Officer. Administrative support was provided by Evelyn Chihuguyu, Program Assistant; Malac Kabir, Research Assistant; and Marie-Constance Manu-ella Koukoui, Senior Executive Assistant. Charles Hagner edited the report, and Nita Congress han-dled design and layout.
The team is grateful for the information, data, and insights provided by the United Nations Con-vention to Combat Desertification Secretariat, the GEF Secretariat, and all the GEF Agencies. The team is also deeply thankful to the GEF focal points, national and local government staff, civil society organizations, communities, and other stakeholders whose logistical support and infor-mation provided during the case study missions were critical to the success of this evaluation. The team acknowledges the support provided by the Norwegian Agency for Development Cooperation (NORAD) to develop the value for money approach.
The GEF IEO is grateful to all of these individu-als and institutions for their contributions. Final responsibility for this report remains firmly with the Office.
vii
Abbreviations
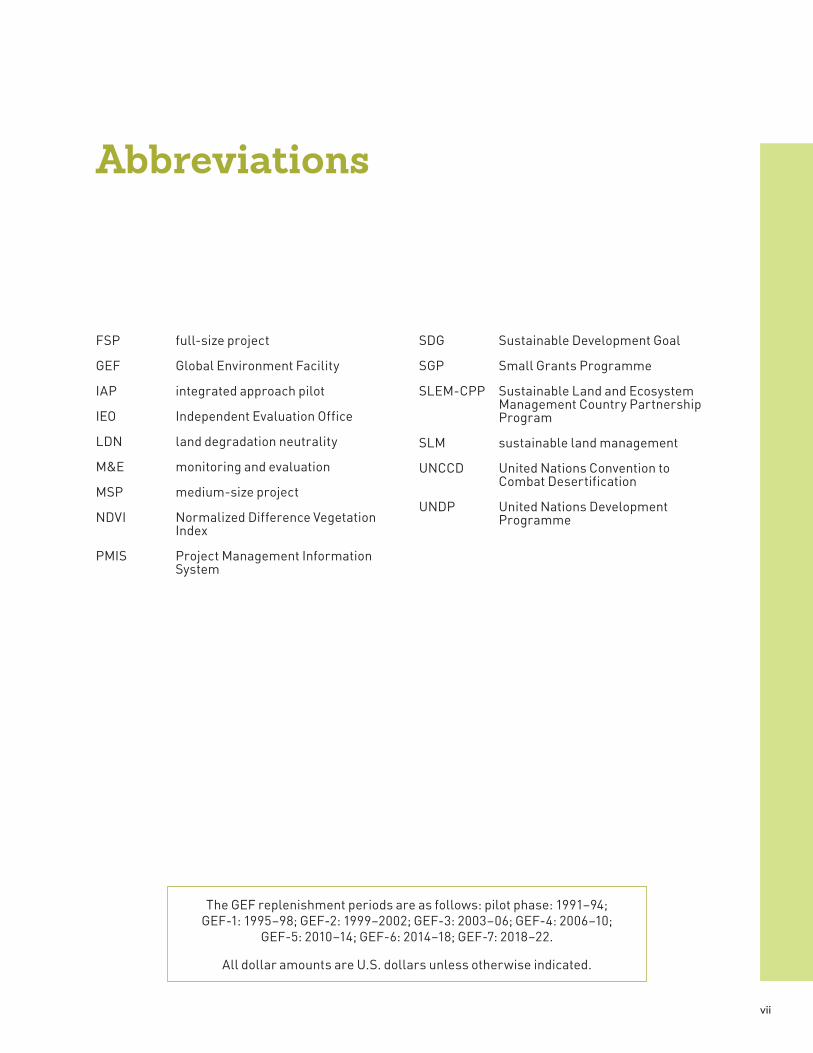
The GEF replenishment periods are as follows: pilot phase: 1991–94; GEF-1: 1995–98; GEF-2: 1999–2002; GEF-3: 2003–06; GEF-4: 2006–10;
GEF-5: 2010–14; GEF-6: 2014–18; GEF-7: 2018–22.
All dollar amounts are U.S. dollars unless otherwise indicated.
FSP full-sizeproject
GEF GlobalEnvironmentFacility
IAP integratedapproachpilot
IEO IndependentEvaluationOffice
LDN landdegradationneutrality
M&E monitoringandevaluation
MSP medium-sizeproject
NDVI NormalizedDifferenceVegetationIndex
PMIS ProjectManagementInformationSystem
SDG SustainableDevelopmentGoal
SGP Small Grants Programme
SLEM-CPP SustainableLandandEcosystemManagementCountryPartnershipProgram
SLM sustainablelandmanagement
UNCCD UnitedNationsConventiontoCombatDesertification
UNDP UnitedNationsDevelopmentProgramme

viii
Executive summary
The land degradation focal area, established during the Global Environment Facility’s
(GEF’s) third replenishment period as a separate focal area, currently combines the principles of landscape approach and integrated ecosystem management to maximize the global environmen-tal benefits of combating land degradation. The purpose of this study, as part of the Sixth Compre-hensive Evaluation of the GEF (OPS6), is to inform the GEF-7 replenishment process based on the evidence from an analysis of 618 land degradation focal area projects or multifocal area projects with a land degradation component, terminal evaluations, review of the results frameworks of completed projects, key informant interviews, and a case study. This focal area study is the first stand-alone study undertaken by the GEF’s Independent Evaluation Office (IEO) to assess the relevance and effectiveness of the GEF land deg-radation focal area. It presents the following key themes: (1) the relevance of the Land Degradation Focal Area Strategies, (2) the land degradation focal area portfolio, and (3) the performance, including monitoring and evaluation (M&E), of completed projects. The study concludes with recommendations for consideration.
Findings
STRATEGIC FOCUS
The GEF land degradation focal area has evolved through the GEF-3, GEF-4, GEF-5, and GEF-6
replenishment periods to remain relevant, closely reflecting convention guidance and, more recently, expanding to include the new ambition toward achieving land degradation neutrality (LDN). Viewed as a “linkage activity” in the first decade of the GEF, land degradation emerged as a single focal area during GEF-3 and has been gradually moving toward integrated approaches aiming to deliver global environmental benefits in multiple focal areas while generating local environmental and development benefits.
The GEF’s Land Degradation Focal Area Strategies have responded well to United Nations Conven-tion to Combat Desertification (UNCCD) global priorities, including its focus on combating desert-ification in Africa and the emphasis on drylands. In addition, the GEF’s support for tackling land degradation since its early replenishment periods (GEF IEO 2005) has also strived both to achieve geographical balance and to include non-dryland areas. During the 12th Conference of the Parties to the UNCCD, the LDN framework expanded its scope from drylands to include global lands (Safriel 2017). The GEF’s mandate to address unsustainable land management practices and degradation issues has been much broader in scope and driven by country priorities and needs.
PORTFOLIO
Move toward multifocal area projects. Since the launch of the focal area in GEF-3 and as of April

ExECutIvE SummARy ix
2017, the time of this analysis, there have been 618 land degradation projects or multifocal area projects with a land degradation component, amounting to a total of $3.364 billion in financ-ing—$3.046 billion in project grants (including project preparation grants) and $318.6 million in Agency fees. Of these 618 projects, 42 percent are classified solely as land degradation projects, and 58 percent are classified as multifocal area projects with a land degradation component.1 Ninety-eight projects (16 percent) have been completed, 135 (22 percent) are under implemen-tation, and the rest are at various stages in the approval process. Excluding Agency fees, a total of $689 million has been approved for land deg-radation focal area–only projects, and another $2.35 billion has been approved for multifocal area projects.
Regional focus. Africa has the highest share of land degradation focal area projects in the port-folio, with $1.12 billion or 37 percent of financing, followed by Latin America and the Caribbean, with $674 million or 24 percent of financing, and then Asia, with $528 million or 17 percent of financ-ing. In fact, the Africa region receives fewer GEF resources than Asia or regional projects but by far the most land degradation focal area resources.
Cofinancing. On average, for every GEF dollar spent on land degradation projects, another $6.70 in cofinancing is acquired. The overall cofinancing for land degradation stand-alone projects is lower, $6 to $1. GEF average cofinancing has improved from $5.50 to $1 during GEF-4 to $7.50 to $1 during GEF-6.
1 An additional 34 projects were identified as multifocal area, but it was not clear in the Project Management Information System if they included a land degradation component.
Shift toward integrated landscapes. Land degra-dation focal area projects most frequently focus on forest and agricultural lands. Rangelands are also a common focus of land degradation stand-alone projects. Agricultural lands, range-lands, degraded productive lands, and desert lands are the most frequent land type focus areas for land degradation stand-alone projects. Urban lands are the least frequent land focus of land degradation focal area projects. Between GEF-3 and GEF-5, forest lands, agricultural lands, and water bodies have declined as a focus of land deg-radation focal area projects. Although forest lands saw a 35 percent decline, the focus shifted to more holistic integrated landscapes, with an almost 30 percent increase over that time frame.
While new projects in the GEF-6 pipeline have increased their focus on responding to LDN targets through both sustainable land manage-ment (SLM) and restoration activities, about three-quarters of land degradation focal area projects do not include a restoration component. When land restoration does occur, it is twice as likely to be for forested lands or other natural ecosystems. One in 10 land degradation focal area projects includes a component to restore produc-tive lands that are degraded.
Tracking. The new and improved version of the tracking tool began only in GEF-5 and as such has not tracked results for any completed projects from GEF-3 and GEF-4 and has tracked only one project that has reached a midterm review. The tracking tool has been simplified from its original cumbersome version to a more practical form, but tracking can still be difficult for multifocal area projects, which require project managers to complete separate tracking tools for each focal area. The Integrated Approach Pilots, the Amazon Sustainable Landscapes Program, the Restoration Initiative, and the Illegal Wildlife Trade Program have their own tracking tools.
LAnD DEgRADAtIon FoCAL AREA StuDyx
RELEVANCE
Overall, the land degradation focal area has helped the GEF achieve its mandate of creating global environmental benefits. Land degradation focal area investments have led to positive impacts on UNCCD targets—specifically, increasing vege-tation productivity and carbon sequestration and reducing forest loss and forest fragmentation—besides generating additional benefits for the biodiversity and climate change focal areas.
The land degradation focal area is responding to UNCCD efforts to achieve LDN. The UNCCD, in line with the sustainable development goals, has made a major shift in focus toward achieving LDN by maintaining and improving the productivity of land resources through SLM practices, and restoring productive lands that have been degraded. Even though the focal area has maintained a relevant focus on SLM activities critical for maintaining and improving land productivity, this study found that 10 percent of land degradation focal area projects work on restoring degraded productive lands.
The land degradation focal area is highly relevant to country needs in all regions, particularly in Africa. The focal area has the largest number of projects and funding in Africa. An analysis of the GEF Small Grants Programme, which allocates small donations to civil society organizations, shows that demand for land degradation focal area projects is much higher than actual GEF funding would suggest. Currently, the land degradation focal area receives the least resources of all five GEF focal areas but is the second most demanded focal area among civil society organizations in the Small Grants Programme.
PERFORMANCE
Effectiveness. The land degradation focal area is effective in producing global environmental
benefits, though results varied across regions. A geospatial impact analysis and value-for-money analysis show that there have been important reductions in fragmentation and forest loss and an increase in vegetation productivity and carbon sequestration. The value-for-money analy-sis reveals three pertinent findings on project effectiveness:
■ A lag time of 4.5–5.5 years was an important inflection point at which impacts were observed to be larger in magnitude.
■ Projects with access to electricity tend to have some of the largest relative positive impacts. This may be due to better infrastructure and access to energy sources for irrigation.
■ The initial state of the environment is a key driver in GEF impacts, with GEF projects tend-ing to have a larger impact in areas with poorer initial conditions.
Analysis of land degradation focal area projects in the 2016 Annual Performance Report database showed that the portfolio was rated satisfacto-rily on outcomes, sustainability, M&E design and implementation, implementation quality, and execution quality. Land degradation focal area projects have slightly higher M&E design ratings than the GEF average: 63 percent of land degra-dation focal area projects were rated satisfactory, compared to 61 percent of non–land degradation focal area projects.
Multistakeholder partnerships and local par-ticipation. Sustainable land and ecosystem management case study analysis shows that effective multistakeholder partnerships between government agencies and civil society, private sector, and grassroots organizations, and priori-tizing the participation of local stakeholders play a critical role in addressing policy issues such as land tenure rights, and environmental issues such
ExECutIvE SummARy xi
soil erosion and the loss of land productivity at the local level, and in generating environmental and socioeconomic benefits that are sustainable.
Income generation and livelihood security. Income generation and livelihood security through land degradation focal area initiatives offered the greatest motivation for people to adopt SLM prac-tices and subsequently influenced their decision to migrate. Case study analysis and beneficiary surveys show that project activities that focus on improving income and market access and the productive capabilities of project beneficiaries improve both environmental and socioeconomic outcomes and influence people’s decision not to migrate to urban areas.
Climate risks. Addressing climate risks is imper-ative to realize the full potential of achieving global environmental benefits. Case study analysis in India demonstrates that variability in weather and extreme events, such as droughts, were not given due consideration in designing some of the agriculture-based livelihood activities. While the projects did generate environmental and socioeconomic benefits through SLM practices, beneficiaries raised concerns regarding their knowledge, adaptive capacity, and the suitability of the ongoing practices to cope with climate-related shocks. These gaps at the local level, if unad-dressed, could potentially limit the realization of the global environmental benefits through land degradation focal area initiatives.
Recommendations
Implement LDN with an appropriate mix of interventions. While being cognizant of cost-effectiveness, context, and country priorities, the land degradation focal area should also con-sider restoration activities along with SLM. SLM practices are intended to help avoid and reduce land degradation, while ecosystem restoration
will help reverse the process. Newer projects in GEF-6 increasingly focus on achieving LDN targets and therefore would benefit from distinguishing between the two complementary pathways—SLM and ecosystem restoration—to be able to measure progress toward the LDN targets.
Give due consideration to complex contextual factors within an integrated approach frame-work. While the land degradation focal area’s strategic focus has appropriately moved toward integrated approaches, complex contextual fac-tors—including drought, food insecurity, and migration—should be given due consideration during project design. The focal area is highly relevant to areas with land degradation, including Africa, particularly with its distressed emigra-tion hotspots. While neither land degradation nor drought is the primary driver, both increase food insecurity and vulnerability and therefore may exacerbate the risk of conflict or migration.
Assess climate risks to land degradation focal area initiatives, and design adaptive manage-ment responses to such risks. Unsustainable land management practices, which the GEF Land Deg-radation Focal Area Strategies aim to ameliorate, have a direct and clear linkage to climate change. The effects of climate change are likely to affect many land-based activities, including ecosystem functions and services. Broader application of the Resilience Adaptation and Transformation Assessment framework is encouraged.
Strengthen M&E tools and methods of knowledge dissemination. The development and continued improvement of the tracking tool is a step in the right direction but will be inadequate to assess project impacts in the long run. The tracking tools should include additional biophysical indicators, increasingly available through geospatial data, to set baselines and measure progress of land productivity to track both global environmental
LAnD DEgRADAtIon FoCAL AREA StuDyxii
benefits and LDN targets. Precise geospatial information on project locations is imperative for carrying out accurate M&E of land degradation projects. The land degradation focal area should consider integrating the indicators proposed by the UNCCD’s LDN framework. The benefits and
impacts of sustained SLM practices and resto-ration measures are not fully accounted for in the current M&E system. Recognition, therefore, should be given to the fact that it might be nec-essary to set a sufficiently longer time frame in monitoring projects striving to achieve LDN.

1
1: Introduction1. chapter numbe
1 .1 objectives, methodology, and context
The Land Degradation Focal Area Strategy of the Global Environment Facility (GEF) currently combines the principles of sustainable land man-agement (SLM) and integrated natural resource management to maximize the global environ-mental benefits of combating land degradation.1 During GEF-1 and GEF-2, land degradation was viewed as a “linkage activity” that cut across the focal areas on climate change, biodiversity, and international waters. However, in GEF-3, the GEF mandate was expanded to include land deg-radation as a new focal area on the basis of the Millennium Ecosystem Assessment’s recommen-dation for investment in the prevention and control of land degradation in production landscapes. In 2010, the GEF began serving as the financial mech-anism of the United Nations Convention to Combat Desertification (UNCCD).
1 According to the World Bank (2008), “Sustainable land management is a knowledge-based procedure that helps integrate land, water, biodiversity, and envi-ronmental management (including input and output externalities) to meet rising food and fiber demands while sustaining ecosystem services and livelihoods.” Sayer and Campbell (2004) define integrated natural resource management as “a conscious process of incorporating the multiple aspects of resource use into a system of sustainable management to meet the goals of resource users, managers and other stakeholders (e.g. production, food security, profitability, risk aver-sion and sustainability goals).”
Previous studies on the GEF land degradation investments include progress toward impact studies, country portfolio evaluation reports, focal area strategy evaluations, GEF Small Grants Pro-gramme (SGP) evaluations, and annual monitoring reports. Findings from these studies point to the GEF’s responsiveness to UNCCD guidance both at the strategic and portfolio levels (GEF IEO 2013), to the high demand for GEF support in combating land degradation and insufficient funding (GEF IEO 2008), and consideration to the time frame in measuring the impact of land degradation projects (GEF IEO 2010).
Neither the GEF’s Independent Evaluation Office (IEO) nor any other Agencies have conducted pre-vious stand-alone evaluations of GEF support to the land degradation focal area. This evaluation is the first comprehensive study carried out by the IEO assessing GEF support of activities focused on addressing land degradation.
The purpose of this study is to inform the GEF-7 replenishment process by evaluating the GEF’s land degradation focal area based on the evidence gathered through the review of available docu-mentation, portfolio analysis, a case study, and analysis of the relevance and effectiveness of the land degradation focal area since GEF-3. The study has the following objectives:
■ Assess the Land Degradation Focal Area Strategy

LAnD DEgRADAtIon FoCAL AREA StuDy2
■ Analyze the land degradation focal area portfo-lio and present trends
■ Assess the performance of completed land degradation focal area projects
■ Present recommendations for GEF-7
This study draws on document reviews, key infor-mant interviews, a portfolio analysis of 618 land degradation focal area projects based on the GEF’s Project Management Information System (PMIS), a review of completed projects to assess performance, and a case study to assess prog-ress toward impact. The case study comprises two completed multifocal area projects with land degradation components and was complemented by field visits and interviews at the project sites (see annex B for a complete list of interviewees). A mobile phone application based on Open Data Kit was piloted to collect perspectives from 80 per-cent of the project beneficiaries at one site.
The study also includes a value-for-money (VFM) analysis carried out by the GEF IEO to understand the effectiveness of GEF investments in land degradation projects. In addition, the study also includes the preliminary results of the portfolio monitoring and assessment tool that was carried out by the GEF Secretariat, commonly known as the tracking tool used for land degradation focal area projects since GEF-5.
1 .2 Evolution of the Land Degradation Focal Area Strategy
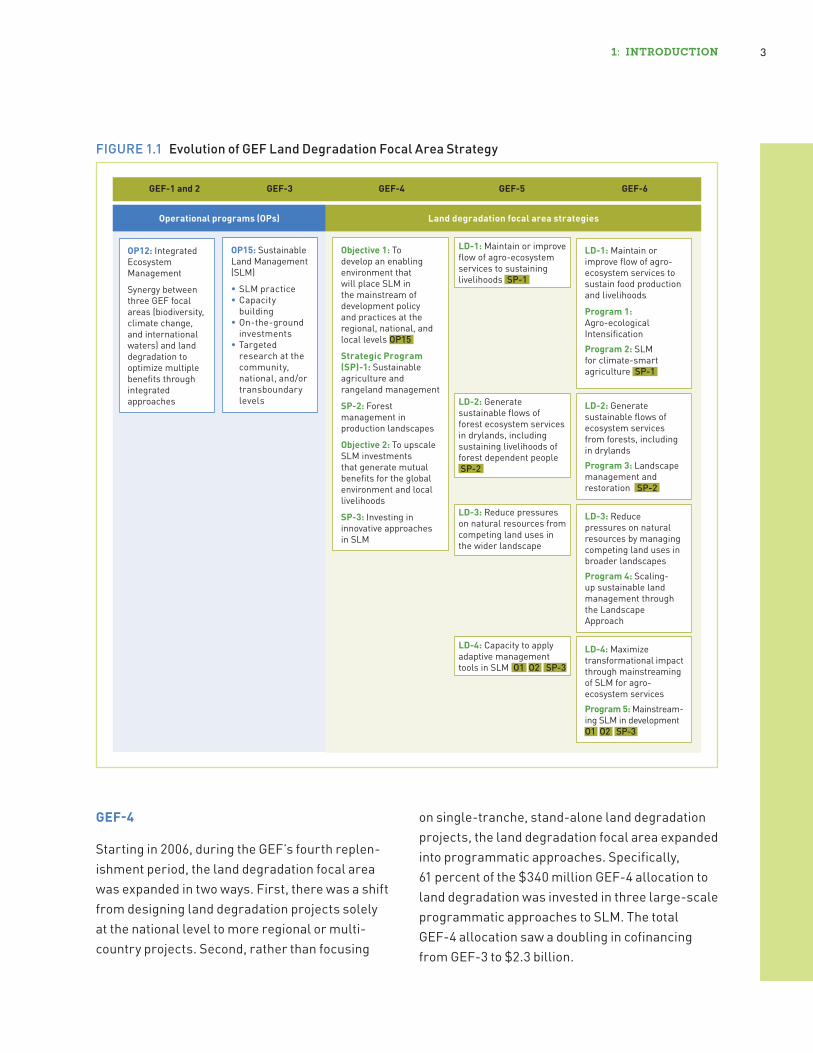
The GEF Land Degradation Focal Area Strategy has evolved through the GEF periods to remain relevant. Land degradation was designated as a separate focal area during GEF-3. Over the years, it has grad-ually been moving toward integrated approaches aimed at delivering global environmental benefits in multiple focal areas while generating local environ-mental and development benefits (figure 1.1).
GEF-1 AND GEF-2
From the GEF’s inception in 1991 until GEF-3, land degradation was viewed as a “linkage activity” that cut across the climate change, biodiversity, and international waters focal areas. A 2001 analysis (Berry and Olson 2001) showed that almost 70 per-cent of the projects with a strong land degradation component fell within the biodiversity focal area. The other 30 percent of these projects belonged to the climate change mitigation and international waters focal areas, 15 percent for each.
The 2001 analysis showed that land degradation was not as strong a component as previously thought and that “the number of land degradation projects and financial allocation to land degradation have not increased in recent years.” Also most of the land degradation components focused on, or near, protected conservation areas. The study con-cluded, “In general, the large majority of current projects identified as land degradation linkage proj-ects have been designed to address the (other) focal areas as a first priority and only in some cases has land degradation mitigation been a priority.”
GEF-3
During GEF-3, land degradation was established as a separate focal area. This was important for two reasons. First, it meant there was an imme-diate allocation of resources to combat land degradation challenges directly. According to the SLM primer for GEF-6 (GEF 2015a), this led to the formulation of 158 projects with land degrada-tion components, totaling $644 million. Second, it approved a separate $250 million for projects under the new land degradation focal area. Together, this led to the development of 180 land degradation–related projects, more than twice as many as had existed until then. At the close of GEF-3, SLM investment was nearly $400 million and generated $1.08 billion in cofinancing.
1: IntRoDuCtIon 3
GEF-4
Starting in 2006, during the GEF’s fourth replen-ishment period, the land degradation focal area was expanded in two ways. First, there was a shift from designing land degradation projects solely at the national level to more regional or multi-country projects. Second, rather than focusing
on single-tranche, stand-alone land degradation projects, the land degradation focal area expanded into programmatic approaches. Specifically, 61 percent of the $340 million GEF-4 allocation to land degradation was invested in three large-scale programmatic approaches to SLM. The total GEF-4 allocation saw a doubling in cofinancing from GEF-3 to $2.3 billion.
FIGURE 1.1 Evolution of GEF Land Degradation Focal Area Strategy
Operational programs (OPs) Land degradation focal area strategies
OP12: Integrated Ecosystem Management
Synergy between three GEF focal areas (biodiversity, climate change, and international waters) and land degradation to optimize multiple benefitsthroughintegrated approaches
OP15: Sustainable Land Management (SLM)
•SLM practice•Capacity
building•On-the-ground
investments•Targeted
research at the community, national, and/or transboundary levels
Objective 1: To develop an enabling environment that will place SLM in the mainstream of development policy and practices at the regional, national, and local levels OP15
Strategic Program (SP)-1: Sustainable agriculture and rangeland management
SP-2: Forest management in production landscapes
Objective 2: To upscale SLM investments that generate mutual benefitsfortheglobalenvironment and local livelihoods
SP-3: Investing in innovative approaches in SLM
LD-1: Maintain or improveflowofagro-ecosystem services to sustain food production and livelihoods
Program 1: Agro-ecological IntensificationProgram 2: SLM for climate-smart agriculture SP-1
LD-1: Maintain or improve flowofagro-ecosystemservices to sustaining livelihoods SP-1
LD-2: Generate sustainableflowsofforest ecosystem services in drylands, including sustaining livelihoods of forest dependent people SP-2
LD-4: Capacity to apply adaptive management tools in SLM O1 O2 SP-3
LD-3: Reduce pressures on natural resources from competing land uses in the wider landscape
LD-4: Maximize transformational impact through mainstreaming of SLM for agro-ecosystem servicesProgram 5: Mainstream-ing SLM in development O1 O2 SP-3
LD-2: Generate sustainableflowsofecosystem services from forests, including in drylandsProgram 3: Landscape management and restoration SP-2
LD-3: Reduce pressures on natural resources by managing competing land uses in broader landscapesProgram 4: Scaling-up sustainable land management through the Landscape Approach
GEF-1 and 2 GEF-3 GEF-4 GEF-5 GEF-6
LAnD DEgRADAtIon FoCAL AREA StuDy4
GEF-5
GEF-5 saw similar allocations as GEF-4, but with some structural changes. Overall, the GEF-5 land degradation focal area allocation was $385 mil-lion, with $2 billion in cofinancing. However, this was the first time that the land degradation focal area functioned as one of the financing mecha-nisms for the UNCCD, along with the UNCCD’s Global Mechanism. The land degradation focal area is directly linked to the UNCCD’s 10-year strategy, which concludes in 2018. The UNCCD aims to reverse and prevent desertification and land degradation and to support poverty reduction and environmental sustainability.
During GEF-5, a new system of resource allocation was applied to the land degradation focal area. For the first time, most land degradation focal area resources were allocated using the System for a Transparent Allocation of Resources, which is based on a set of indexes. These include the GEF performance index, the gross domestic product index, and the GEF benefits index. The GEF bene-fits index for the land degradation focal area has three indicators: the area affected by land degra-dation, the total dryland area, and the vulnerable population affected. Basing resource allocation on measurable indexes improves transparency and flexibility and ensures synergies with focal area objectives, since a smaller portion of land degradation focal area resources are allocated as set-aside funds. These funds are used to support the focal area through (1) UNCCD enabling activ-ities, (2) incentive mechanisms for sustainable forest management programs and the integrated approach pilot (IAP) Fostering Sustainability and Resilience of Product Systems in Sub-Saharan Africa, and (3) global initiatives to foster regional integration and knowledge sharing and transfer to advance SLM globally.
GEF-6
GEF-6 has trended toward using a multifocal area approach project design. In practice, a multi-focal area approach implements projects that are designed to achieve objectives in two or more of the focal areas. Land degradation focal area resources have steadily moved toward a multi-focal area approach. To further highlight this trend, GEF-6 introduced three IAPs, one of which, Fostering Sustainability and Resilience for Food Security in Sub-Saharan Africa, is focused on land degradation in Africa. Generally, these integrated pilots aim to generate global environmental bene-fits by promoting local development benefits. More specifically, an IAP is intended to target the entire supply chain to improve productive systems. This goes beyond reducing land degradation acreage and extends into areas such as improved market access, policy reforms, private sector engage-ment, and knowledge generation to promote sustainability and resilience in food value chains.
The GEF-6 Land Degradation Focal Area Strat-egy is responding to the framework of land degradation neutrality (LDN). The UNCCD’s Intergovernmental Working Group defines LDN as “a state whereby the amount of healthy and productive land resources, necessary to support ecosystem services, remains stable or increases within specified temporal and spatial scales.” The benefit of LDN is that it allows nations to manage their own trade-offs between biological and economic productivity through voluntary commit-ments to achieve the LDN target. In 2012, LDN was designated as a priority at the United Nations Con-ference on Sustainable Development, or Rio+20. The UNCCD also made LDN a priority by including LDN targets in the new Sustainable Develop-ment Goals (SDGs) (target 15.3). In fact, LDN has become the UNCCD’s chief mandate.
1: IntRoDuCtIon 5
The land degradation focal area has responded to this development and the guidance to the conven-tion. The GEF-6 strategy was approved prior to the formal release of the Scientific Conceptual Frame-work for Land Degradation Neutrality. However, during the later part of GEF-6, land degradation focal area project identification forms (PIFs) sub-mitted by countries with voluntary LDN targets require linkages between project activities and how those activities bolster LDN targets. As part of GEF-6, more projects are increasingly recog-nizing LDN as a major component of their project design. For example, a full-size project (FSP) for combating land degradation in the mountain land-scapes of Lebanon seeks to achieve LDN through integrated landscape management.
The land degradation focal area has steadily expanded the number of Agencies it partners with on land degradation or land degradation–related projects. The number of lead Agencies on land degradation focal area projects or multifocal area projects with a land degradation component has doubled since GEF-3. This allows for a broader spectrum of institutions with a broader set of man-dates to combat land degradation in ways specific to those institutions.
6
2: Findings2. chapter number
2 .1 Portfolio
As of April 2017, there were 618 land degradation projects or multifocal area projects with a land degradation component since GEF-3 (figure 2.1a). Of these, 42 percent (259 projects) are classified solely as land degradation projects, and 58 per-cent (359 projects) are classified as multifocal area projects with a land degradation element. Of the 618 projects, 98 (16 percent) have been completed,1 135 (22 percent) are currently under implementation, and 196 (32 percent) have com-pleted their GEF approval process and are ready to start implementation,2 while the remaining 187 projects (30 percent) are at various stages of the design and approval process.3 A total of $689 million has been approved for land degra-dation focal area stand-alone projects. Another $2.35 billion has been approved for land degrada-tion multifocal area projects, but not all of these
1 With the exception of one GEF-5 project, all completed projects were initiated during GEF-3 and GEF-4. 2 Projects that have been approved or endorsed by the Chief Executive Officer are considered to have com-pleted their GEF approval process and are ready to start implementation. 3 Projects that either have been approved by the Council (but still need Chief Executive Officer approval) or are still in the pipeline (at the project preparation grant stage or awaiting work program inclusion).
funds come from land degradation focal area replenishments4 (figure 2.1b).
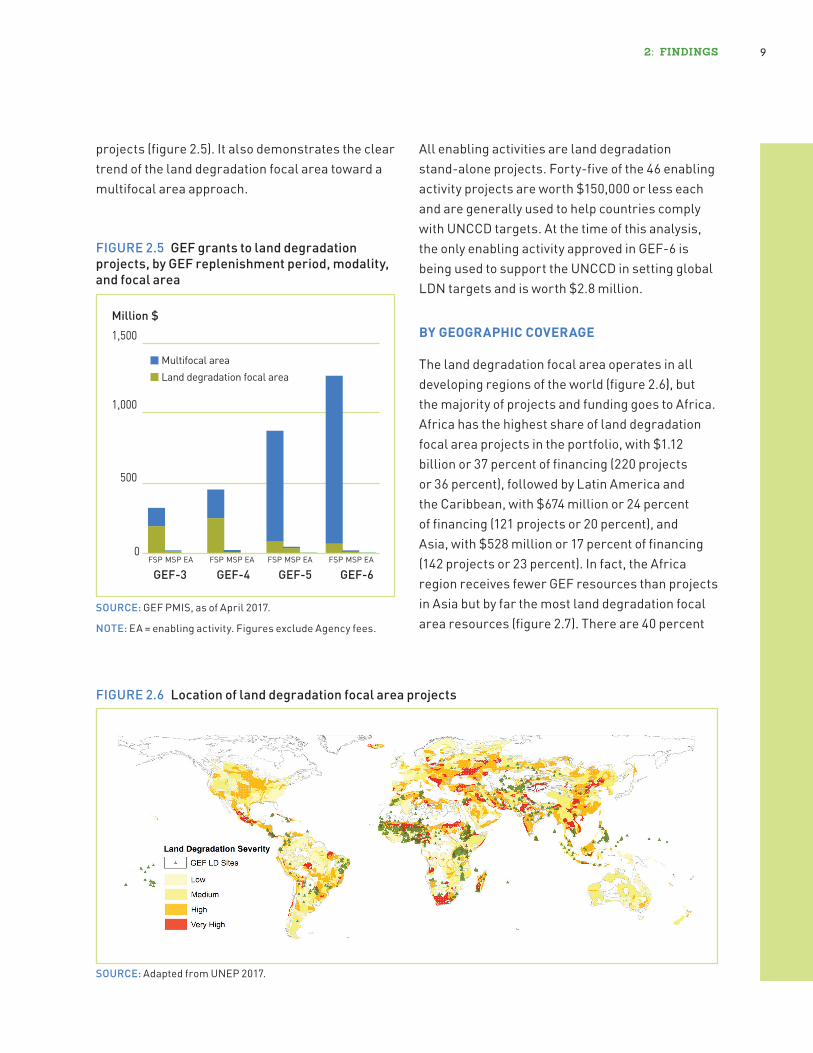
The land degradation focal area portfolio has 428 (69 percent) FSPs, accounting for $2.923 billion (96 percent of total funding); 144 projects (23 per-cent), accounting for $113.6 million (4 percent of total funding) are medium-size projects (MSPs); and 46 (7 percent) are enabling activity projects, with financing of less than $150,000 each. A slight majority of land degradation stand-alone projects are MSPs (111 versus 102 FSPs), while the majority of multifocal area projects with a land degradation component are FSPs (326 versus 33 MSPs).
BY REPLENISHMENT PERIOD
Most land degradation–related projects were approved during GEF-5 (figure 2.1),5 but GEF-6 already has a higher amount of approved grants than any other replenishment period. This is largely because of the increased focus on multi-focal area projects, which utilize resources from multiple focal areas, not just the land degradation focal area. Eleven percent of GEF-5 projects are
4 It is unclear from the GEF PMIS how many of these multifocal area funds come from land degradation focal area replenishments. Also note that financing excludes Agency fees to account only for money gone to actual projects.5 Note that two more years still remain for the GEF-6 replenishment, so the figures do not represent the final GEF-6 tallies.
2: FInDIngS 7
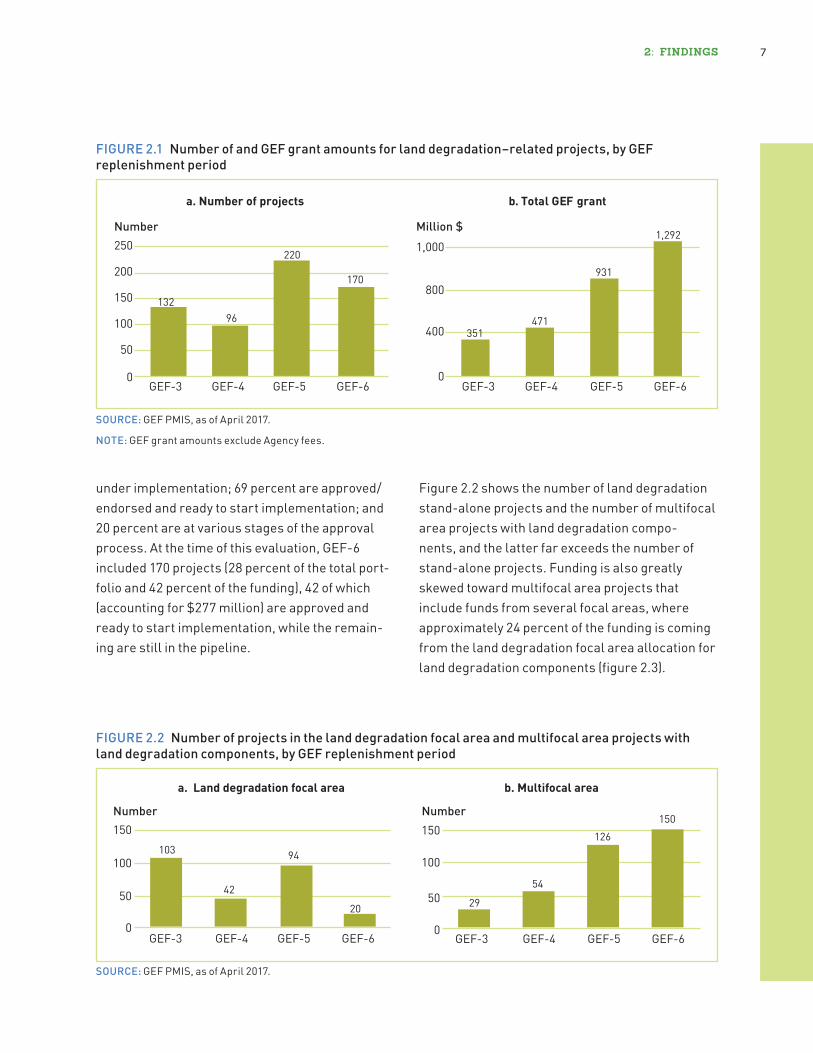
FIGURE 2.1 Number of and GEF grant amounts for land degradation–related projects, by GEF replenishment period
13296
220
170
0
50
100
150
200
250
GEF-3
a. Number of projects
351471
931
1,292
b. Total GEF grant
GEF-4 GEF-5 GEF-6 GEF-3 GEF-4 GEF-5 GEF-60
400
800
1,000
Million $Number
SOURCE: GEF PMIS, as of April 2017.
NOTE: GEF grant amounts exclude Agency fees.
under implementation; 69 percent are approved/endorsed and ready to start implementation; and 20 percent are at various stages of the approval process. At the time of this evaluation, GEF-6 included 170 projects (28 percent of the total port-folio and 42 percent of the funding), 42 of which (accounting for $277 million) are approved and ready to start implementation, while the remain-ing are still in the pipeline.
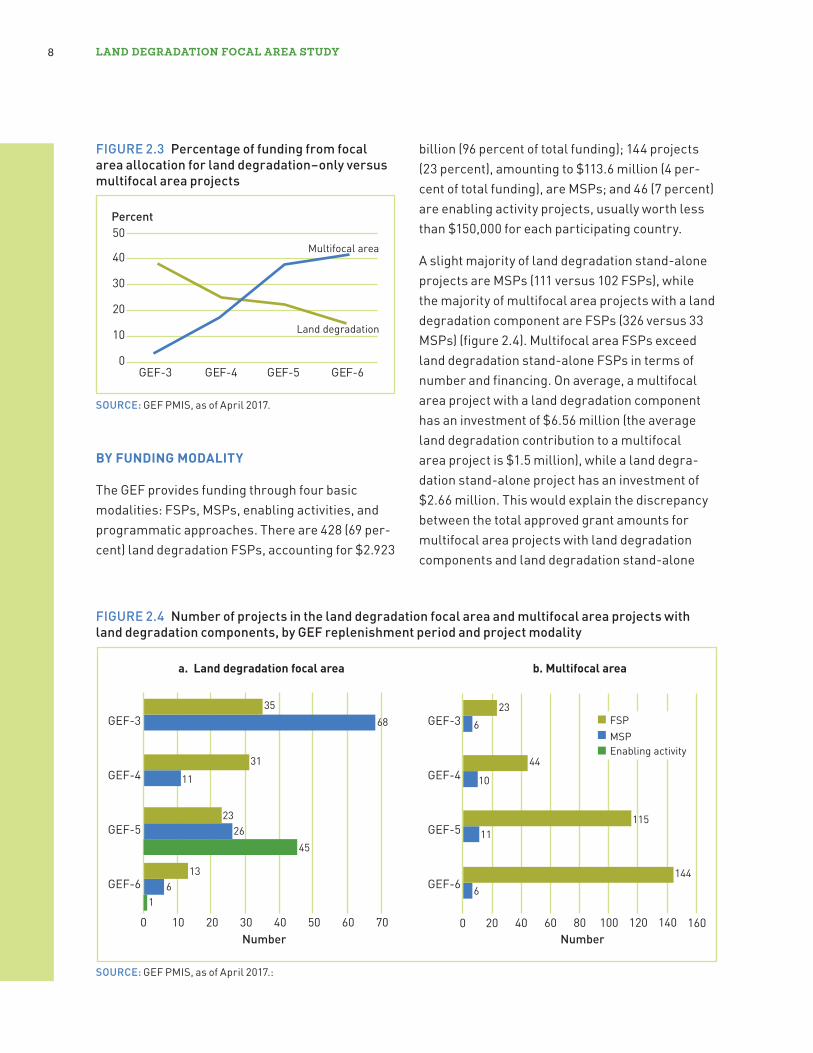
Figure 2.2 shows the number of land degradation stand-alone projects and the number of multifocal area projects with land degradation compo-nents, and the latter far exceeds the number of stand-alone projects. Funding is also greatly skewed toward multifocal area projects that include funds from several focal areas, where approximately 24 percent of the funding is coming from the land degradation focal area allocation for land degradation components (figure 2.3).
FIGURE 2.2 Number of projects in the land degradation focal area and multifocal area projects with land degradation components, by GEF replenishment period
103
42
94
20
a. Land degradation focal area
29
54
126150
b. Multifocal area
GEF-3 GEF-4 GEF-5 GEF-6 GEF-3 GEF-4 GEF-5 GEF-60 0
50 50
100 100
150 150Number Number
SOURCE: GEF PMIS, as of April 2017.
LAnD DEgRADAtIon FoCAL AREA StuDy8
billion (96 percent of total funding); 144 projects (23 percent), amounting to $113.6 million (4 per-cent of total funding), are MSPs; and 46 (7 percent) are enabling activity projects, usually worth less than $150,000 for each participating country.
A slight majority of land degradation stand-alone projects are MSPs (111 versus 102 FSPs), while the majority of multifocal area projects with a land degradation component are FSPs (326 versus 33 MSPs) (figure 2.4). Multifocal area FSPs exceed land degradation stand-alone FSPs in terms of number and financing. On average, a multifocal area project with a land degradation component has an investment of $6.56 million (the average land degradation contribution to a multifocal area project is $1.5 million), while a land degra-dation stand-alone project has an investment of $2.66 million. This would explain the discrepancy between the total approved grant amounts for multifocal area projects with land degradation components and land degradation stand-alone
FIGURE 2.3 Percentage of funding from focal area allocation for land degradation–only versus multifocal area projects
0
10
20
30
40
50
Land degradation
Multifocal area
GEF-3 GEF-4 GEF-5 GEF-6
Percent
SOURCE: GEF PMIS, as of April 2017.
FIGURE 2.4 Number of projects in the land degradation focal area and multifocal area projects with land degradation components, by GEF replenishment period and project modality
Number
236
44
10
11511
1446
0 20 40 60 80 100 120 140 160
3568
31
11
2326
136
0 10 20 30 40 50 60 70
45
1
GEF-3
GEF-4
GEF-5
GEF-6 GEF-6
GEF-5
GEF-4
GEF-3
Enabling activity
FSPMSP
Number
a. Land degradation focal area b. Multifocal area
SOURCE: GEF PMIS, as of April 2017.:
BY FUNDING MODALITY
The GEF provides funding through four basic modalities: FSPs, MSPs, enabling activities, and programmatic approaches. There are 428 (69 per-cent) land degradation FSPs, accounting for $2.923
2: FInDIngS 9
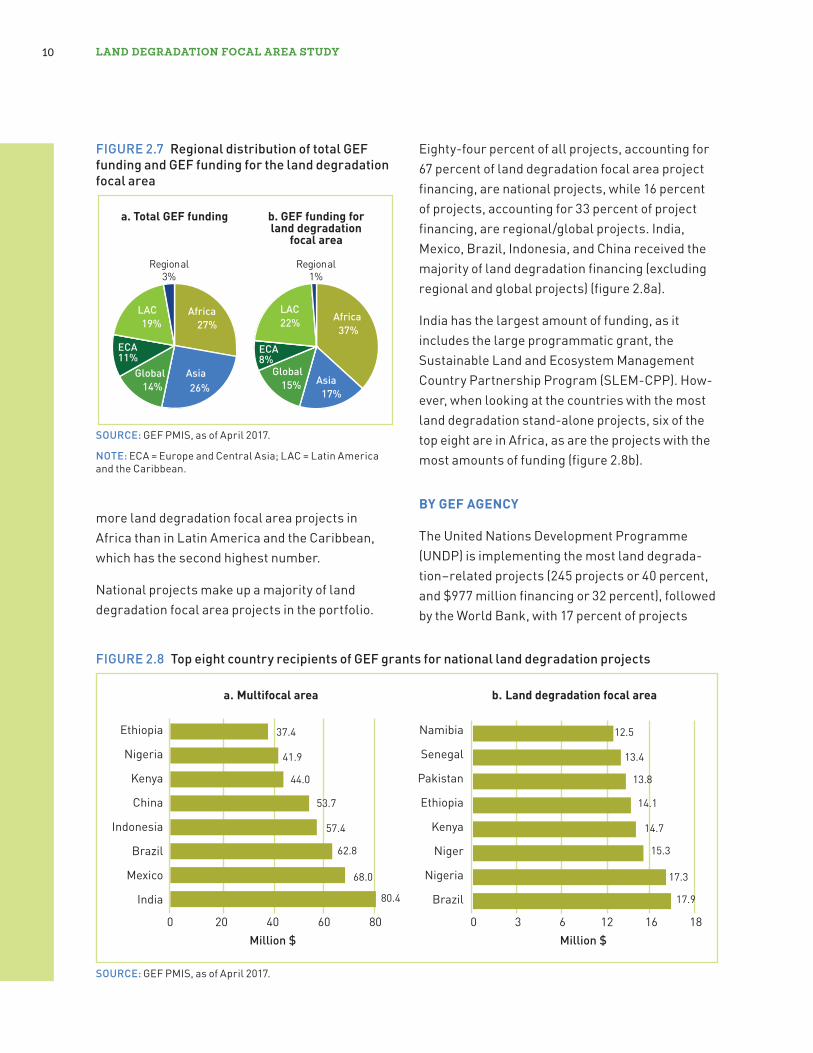
projects (figure 2.5). It also demonstrates the clear trend of the land degradation focal area toward a multifocal area approach.
FIGURE 2.5 GEF grants to land degradation projects, by GEF replenishment period, modality, and focal area
Land degradation focal area
GEF-6GEF-5GEF-4GEF-3
0
500
1,000
1,500
EAMSPFSP
Million $
Multifocal area
EAMSPFSP EAMSPFSP EAMSPFSP
SOURCE: GEF PMIS, as of April 2017.
NOTE: EA = enabling activity. Figures exclude Agency fees.
FIGURE 2.6 Location of land degradation focal area projects
SOURCE: Adapted from UNEP 2017.
All enabling activities are land degradation stand-alone projects. Forty-five of the 46 enabling activity projects are worth $150,000 or less each and are generally used to help countries comply with UNCCD targets. At the time of this analysis, the only enabling activity approved in GEF-6 is being used to support the UNCCD in setting global LDN targets and is worth $2.8 million.
BY GEOGRAPHIC COVERAGE
The land degradation focal area operates in all developing regions of the world (figure 2.6), but the majority of projects and funding goes to Africa. Africa has the highest share of land degradation focal area projects in the portfolio, with $1.12 billion or 37 percent of financing (220 projects or 36 percent), followed by Latin America and the Caribbean, with $674 million or 24 percent of financing (121 projects or 20 percent), and Asia, with $528 million or 17 percent of financing (142 projects or 23 percent). In fact, the Africa region receives fewer GEF resources than projects in Asia but by far the most land degradation focal area resources (figure 2.7). There are 40 percent
LAnD DEgRADAtIon FoCAL AREA StuDy10
more land degradation focal area projects in Africa than in Latin America and the Caribbean, which has the second highest number.
National projects make up a majority of land degradation focal area projects in the portfolio.
FIGURE 2.7 Regional distribution of total GEF funding and GEF funding for the land degradation focal area
Africa27%
Asia26%
Global14%
ECA11%
LAC19%
Regional3%
Africa37%
Asia17%
Global15%
ECA8%
LAC22%
Regional1%
a. Total GEF funding b. GEF funding forland degradation
focal area
SOURCE: GEF PMIS, as of April 2017.
NOTE: ECA = Europe and Central Asia; LAC = Latin America and the Caribbean.
FIGURE 2.8 Top eight country recipients of GEF grants for national land degradation projects
a. Multifocal area b. Land degradation focal area
37.4
41.9
44.0
53.7
57.4
62.8
68.0
80.4
Ethiopia
Nigeria
Kenya
China
Indonesia
Brazil
Mexico
India
0 20 40 60 80Million $
12.5
13.4
13.8
14.1
14.7
15.3
17.3
17.9
Namibia
Senegal
Pakistan
Ethiopia
Kenya
Niger
Nigeria
Brazil
12 18630 16Million $
SOURCE: GEF PMIS, as of April 2017.
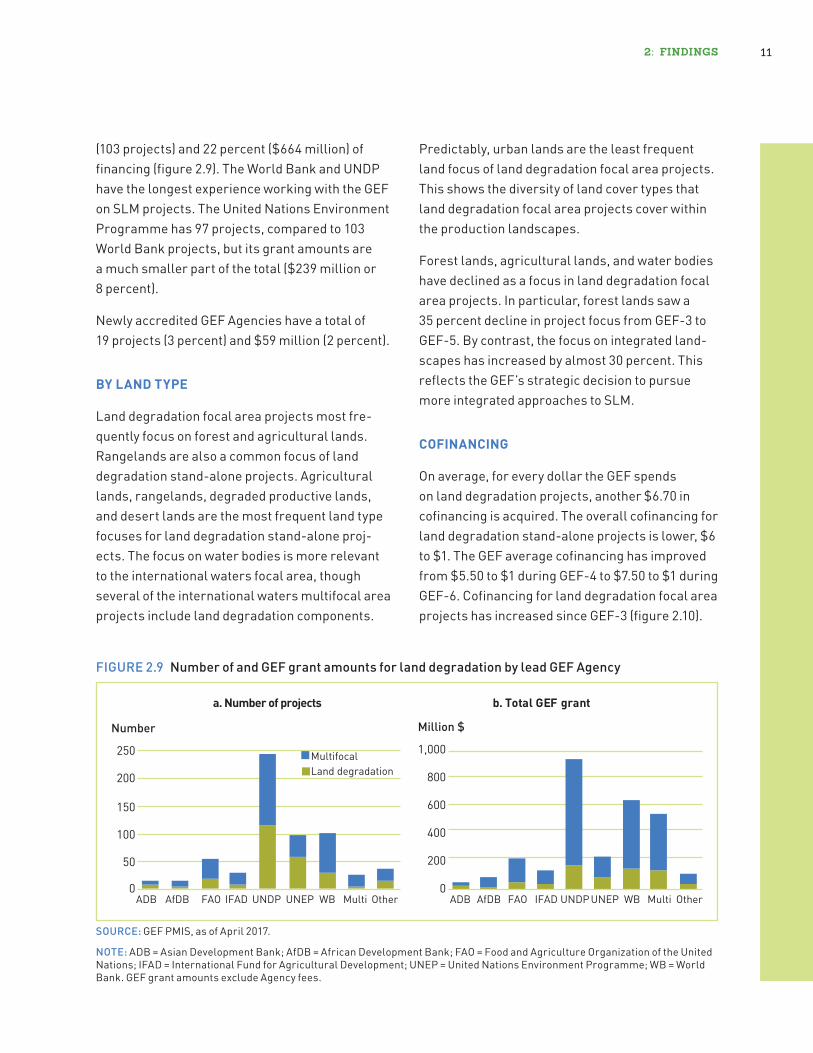
Eighty-four percent of all projects, accounting for 67 percent of land degradation focal area project financing, are national projects, while 16 percent of projects, accounting for 33 percent of project financing, are regional/global projects. India, Mexico, Brazil, Indonesia, and China received the majority of land degradation financing (excluding regional and global projects) (figure 2.8a).
India has the largest amount of funding, as it includes the large programmatic grant, the Sustainable Land and Ecosystem Management Country Partnership Program (SLEM-CPP). How-ever, when looking at the countries with the most land degradation stand-alone projects, six of the top eight are in Africa, as are the projects with the most amounts of funding (figure 2.8b).
BY GEF AGENCY
The United Nations Development Programme (UNDP) is implementing the most land degrada-tion–related projects (245 projects or 40 percent, and $977 million financing or 32 percent), followed by the World Bank, with 17 percent of projects
2: FInDIngS 11
FIGURE 2.9 Number of and GEF grant amounts for land degradation by lead GEF Agency
0
50
100
150
200
250
ADB AfDB FAO IFAD UNDP UNEP Multi Other
Land degradationMultifocal
0
200
400
600
800
1,000
b. Total GEF granta. Number of projects
WB ADB AfDB FAO IFAD UNDP UNEP Multi OtherWB
Million $Number
SOURCE: GEF PMIS, as of April 2017.
NOTE: ADB = Asian Development Bank; AfDB = African Development Bank; FAO = Food and Agriculture Organization of the United Nations; IFAD = International Fund for Agricultural Development; UNEP = United Nations Environment Programme; WB = World Bank. GEF grant amounts exclude Agency fees.
(103 projects) and 22 percent ($664 million) of financing (figure 2.9). The World Bank and UNDP have the longest experience working with the GEF on SLM projects. The United Nations Environment Programme has 97 projects, compared to 103 World Bank projects, but its grant amounts are a much smaller part of the total ($239 million or 8 percent).
Newly accredited GEF Agencies have a total of 19 projects (3 percent) and $59 million (2 percent).
BY LAND TYPE
Land degradation focal area projects most fre-quently focus on forest and agricultural lands. Rangelands are also a common focus of land degradation stand-alone projects. Agricultural lands, rangelands, degraded productive lands, and desert lands are the most frequent land type focuses for land degradation stand-alone proj-ects. The focus on water bodies is more relevant to the international waters focal area, though several of the international waters multifocal area projects include land degradation components.
Predictably, urban lands are the least frequent land focus of land degradation focal area projects. This shows the diversity of land cover types that land degradation focal area projects cover within the production landscapes.
Forest lands, agricultural lands, and water bodies have declined as a focus in land degradation focal area projects. In particular, forest lands saw a 35 percent decline in project focus from GEF-3 to GEF-5. By contrast, the focus on integrated land-scapes has increased by almost 30 percent. This reflects the GEF’s strategic decision to pursue more integrated approaches to SLM.
COFINANCING
On average, for every dollar the GEF spends on land degradation projects, another $6.70 in cofinancing is acquired. The overall cofinancing for land degradation stand-alone projects is lower, $6 to $1. The GEF average cofinancing has improved from $5.50 to $1 during GEF-4 to $7.50 to $1 during GEF-6. Cofinancing for land degradation focal area projects has increased since GEF-3 (figure 2.10).

LAnD DEgRADAtIon FoCAL AREA StuDy12
Every $1 of GEF funds in programs is leveraged by $11.50 in cofinancing.
GEF cofinancing by government has increased from 38 percent during GEF-3 to 54 percent during GEF-6. While cofinancing by the private sector remains low, with 1 percent in GEF-3 and 3 percent in GEF-6, cofinancing by multilateral Agencies has decreased over time (figure 2.11).
EXPECTED RESULTS FROM THE MONITORING SYSTEM
To monitor the global environmental benefits of land degradation focal area projects, imple-menting Agencies are required to complete the portfolio monitoring and assessment tool, com-monly known as the tracking tool. The tool helps report outcomes to the UNCCD and enhances the accountability of the land degradation focal area. The tracking tool began for land degradation focal area projects only in GEF-5. This includes tracking of 109 full- and medium-size land degra-dation focal area–only projects (37 projects) and multifocal area projects with land degradation components (72 projects). Only one of these has reached the midterm reporting stage, and none has been completed.
The system reports the expected results from the portfolio. The land area covered by the 98 projects included in the tracking tool amounts to 620,000 km2. Seventy-nine projects have 212.3 million potential beneficiaries, including over 100 million poor people. Ninety percent of potential land deg-radation focal area project beneficiaries live in rural areas. The remaining 10 percent live in urban or peri-urban locations. This implies that the aver-age land degradation focal area project covers nearly 6,300 km2 (about half the size of Jamaica) and potentially benefits about 2.7 million individu-als. It should be noted, however, that this number reflects only potential beneficiaries, or people living in project areas, and does not capture the actual number of beneficiaries.
Lead implementing Agencies are also asked to calculate the system areas targeted by projects. Figure 2.12 shows the number of hectares of each landscape system targeted by the 94 reporting projects. Pastoral and rangeland systems are the largest targeted areas of land degradation focal area projects. Projects target less forest and
FIGURE 2.10 Cofinancing for land degradation projects for every $1 from the GEF
0
2
4
6
8
10
12 Overall
All landdegradation
Landdegradation only
Multifocal
GEF-3 GEF-4 GEF-5 GEF-6
Dollars
SOURCE: GEF PMIS, as of April 2017.
FIGURE 2.11 Cofinancing by organization type
0
20
40
60
80
100
Agency/multilateral
CSOGovernment
Other
GEF-3 GEF-4 GEF-5 GEF-6
Private sector
Percent
SOURCE: GEF PMIS, as of April 2017.

2: FInDIngS 13
agricultural system area. This is probably not a reflection of priorities but may be because individ-ual rangelands and pastoral systems tend to be larger land areas in general than forest or agricul-tural land. Rangelands and pastoral systems are often used for livestock grazing and simply require a larger area to be productive.
The GEF tracking tool monitors the direct and indirect benefits expected over a project’s life-time, as shown in table 2.1. Based on the analysis of available tracking tool data, on average, a land degradation focal area project or a multifocal area project with land degradation components is expected to (1) produce 13,078 km2 of vegetation
cover, (2) avoid 4.3 million tons of carbon emis-sions, (3) sequester about 3 million tons of carbon, and (4) protect 4,807 km2 of biodiversity habitat in productive systems. However, land degradation focal area–only projects are expected to gener-ate fewer benefits than multifocal area projects in these areas. For example, a land degradation focal area stand-alone project is expected to pro-duce 40 percent less vegetation cover on average than a comparable multifocal area project with a land degradation component. Similarly, land degradation focal area stand-alone projects are expected to avoid 57 percent fewer tons of carbon emissions, and to sequester 95 percent fewer tons of carbon than comparable multifocal area projects with a land degradation component. The reason is that multifocal area projects include other focal areas, such as climate change and biodiversity, which are focused more on improving these global environmental benefit indicators. The land degradation focal area, however, is also expected to produce more socioeconomic bene-fits—such as improved incomes, livelihoods, land productivity, and other local benefits (Foley et al. 2005; GEF STAP 2006)—which the tracking tool does not capture. At the same time, land degra-dation focal area–only projects protect 61 percent more biodiversity habitat in productive systems on average than multifocal area projects with a land degradation component. Also, considering
FIGURE 2.12 Types of land systems targeted by GEF land degradation projects, by area
0 10 20 30 40
Agriculture
Rangeland
Pastoral
Forestry
Mixed systems
Land degradation Multifocal
Hectares
SOURCE: GEF PMIS, as of April 2017.
TABLE 2.1 Expected direct and indirect benefits tracked in eligible land degradation focal area projects
Project type
Vegetative coverTotal carbon benefits
Habitat protectedAvoided emissions Carbon sequestered
Ha# of
projects Tons CO2 eq# of
projects Tons CO2 eq# of
projects Ha# of
projectsLand degradation 20,777,838 23 12,431,575 6 463,249 3 12,793,792 15Multifocal with land degradation component
78,621,048 53 131,041,983 27 105,806,746 32 12,686,844 38
Total 99,398,886 76 143,473,558 33 106,269,995 35 25,480,636 53
LAnD DEgRADAtIon FoCAL AREA StuDy14
that the allocation for a land degradation project is around $2.6 million on average, while the average allocation for a multifocal area project with a land degradation component is $1.5 million out of land degradation focal area, the multifocal area land degradation project is expected not only to gen-erate more ecological benefits but also to provide greater returns for the investments.
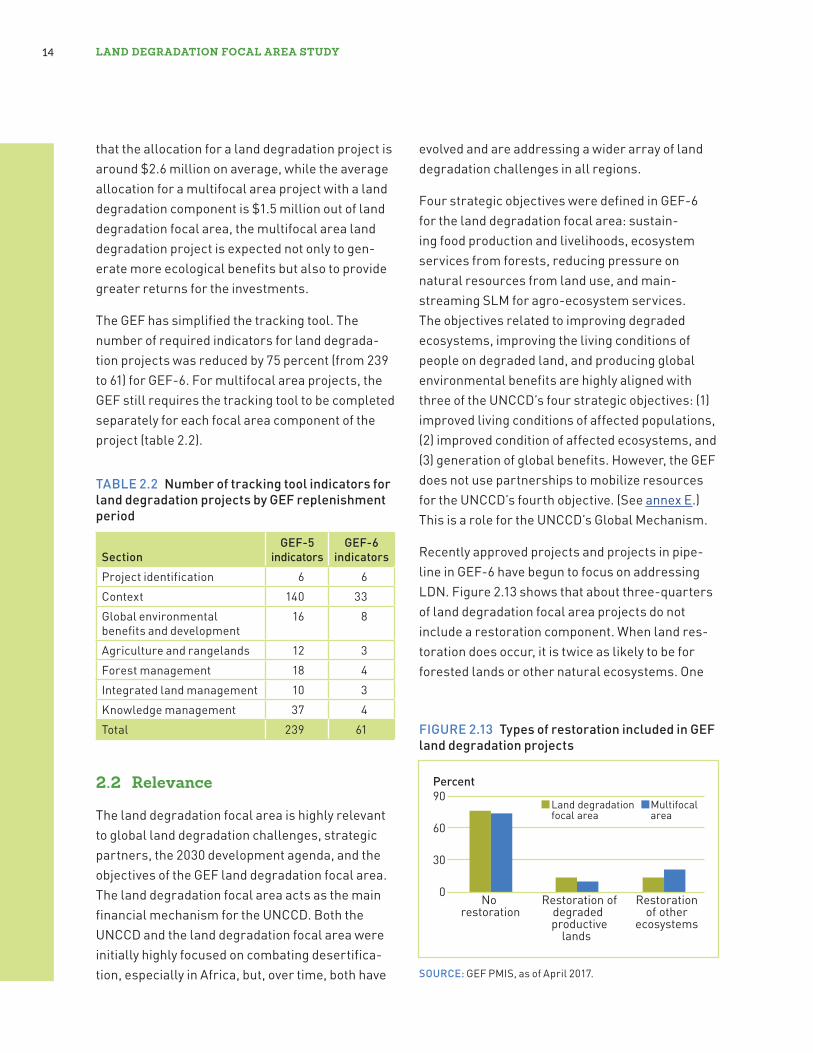
The GEF has simplified the tracking tool. The number of required indicators for land degrada-tion projects was reduced by 75 percent (from 239 to 61) for GEF-6. For multifocal area projects, the GEF still requires the tracking tool to be completed separately for each focal area component of the project (table 2.2).
2 .2 Relevance
The land degradation focal area is highly relevant to global land degradation challenges, strategic partners, the 2030 development agenda, and the objectives of the GEF land degradation focal area. The land degradation focal area acts as the main financial mechanism for the UNCCD. Both the UNCCD and the land degradation focal area were initially highly focused on combating desertifica-tion, especially in Africa, but, over time, both have
evolved and are addressing a wider array of land degradation challenges in all regions.
Four strategic objectives were defined in GEF-6 for the land degradation focal area: sustain-ing food production and livelihoods, ecosystem services from forests, reducing pressure on natural resources from land use, and main-streaming SLM for agro-ecosystem services. The objectives related to improving degraded ecosystems, improving the living conditions of people on degraded land, and producing global environmental benefits are highly aligned with three of the UNCCD’s four strategic objectives: (1) improved living conditions of affected populations, (2) improved condition of affected ecosystems, and (3) generation of global benefits. However, the GEF does not use partnerships to mobilize resources for the UNCCD’s fourth objective. (See annex E.) This is a role for the UNCCD’s Global Mechanism.
Recently approved projects and projects in pipe-line in GEF-6 have begun to focus on addressing LDN. Figure 2.13 shows that about three-quarters of land degradation focal area projects do not include a restoration component. When land res-toration does occur, it is twice as likely to be for forested lands or other natural ecosystems. One
TABLE 2.2 Number of tracking tool indicators for land degradation projects by GEF replenishment period
SectionGEF-5
indicatorsGEF-6
indicatorsProject identification 6 6Context 140 33Global environmental benefits and development
16 8
Agriculture and rangelands 12 3Forest management 18 4Integrated land management 10 3Knowledge management 37 4Total 239 61 FIGURE 2.13 Types of restoration included in GEF
land degradation projects
0
30
60
90
No restoration
Restoration ofdegraded productive
lands
Restoration of other
ecosystems
Land degradationfocal area
Percent
Multifocalarea
SOURCE: GEF PMIS, as of April 2017.
2: FInDIngS 15
in 10 land degradation focal area projects includes a component to restore productive lands that are degraded. Figure 2.14 also shows there has been a slight increase in this type of restoration since GEF-3.
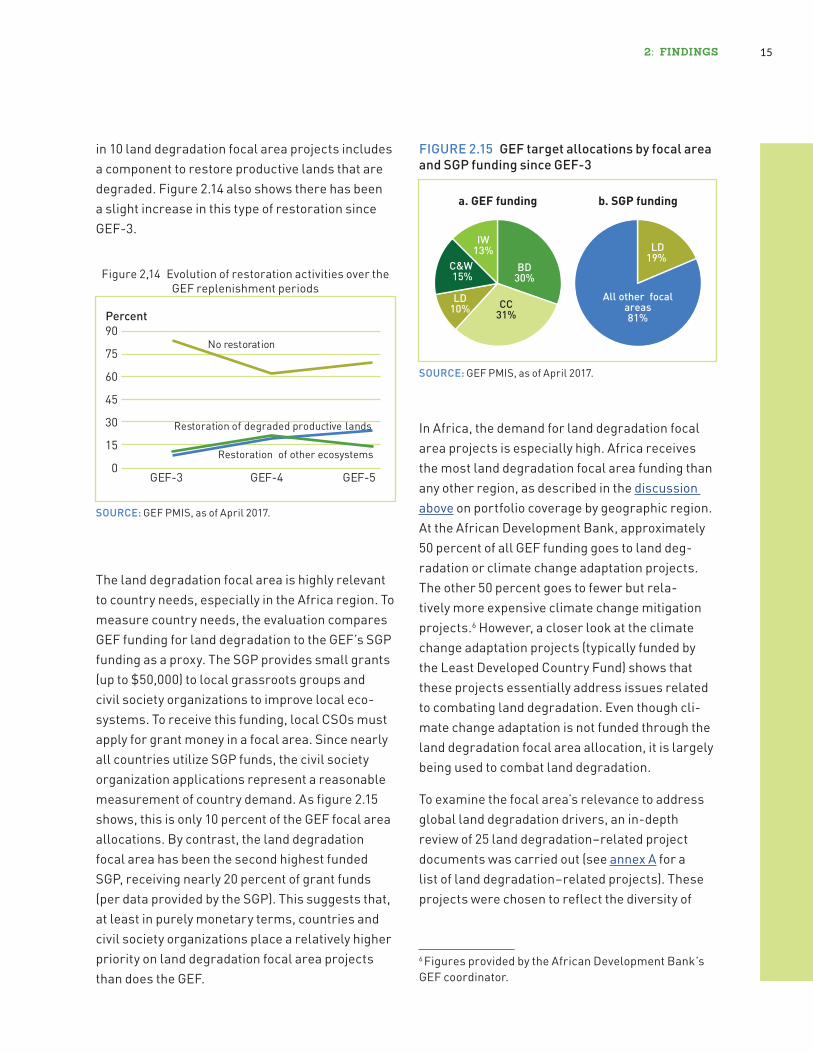
The land degradation focal area is highly relevant to country needs, especially in the Africa region. To measure country needs, the evaluation compares GEF funding for land degradation to the GEF’s SGP funding as a proxy. The SGP provides small grants (up to $50,000) to local grassroots groups and civil society organizations to improve local eco-systems. To receive this funding, local CSOs must apply for grant money in a focal area. Since nearly all countries utilize SGP funds, the civil society organization applications represent a reasonable measurement of country demand. As figure 2.15 shows, this is only 10 percent of the GEF focal area allocations. By contrast, the land degradation focal area has been the second highest funded SGP, receiving nearly 20 percent of grant funds (per data provided by the SGP). This suggests that, at least in purely monetary terms, countries and civil society organizations place a relatively higher priority on land degradation focal area projects than does the GEF.
Figure 2,14 Evolution of restoration activities over the GEF replenishment periods
No restoration
0
15
30
45
60
75
90
GEF-3 GEF-4 GEF-5
Restoration of degraded productive lands
Restoration of other ecosystems
Percent
SOURCE: GEF PMIS, as of April 2017.
FIGURE 2.15 GEF target allocations by focal area and SGP funding since GEF-3
LD19%
All other focalareas81%
BD30%
CC31%
LD10%
C&W 15%
IW13%
a. GEF funding b. SGP funding
SOURCE: GEF PMIS, as of April 2017.
In Africa, the demand for land degradation focal area projects is especially high. Africa receives the most land degradation focal area funding than any other region, as described in the discussion above on portfolio coverage by geographic region. At the African Development Bank, approximately 50 percent of all GEF funding goes to land deg-radation or climate change adaptation projects. The other 50 percent goes to fewer but rela-tively more expensive climate change mitigation projects.6 However, a closer look at the climate change adaptation projects (typically funded by the Least Developed Country Fund) shows that these projects essentially address issues related to combating land degradation. Even though cli-mate change adaptation is not funded through the land degradation focal area allocation, it is largely being used to combat land degradation.
To examine the focal area’s relevance to address global land degradation drivers, an in-depth review of 25 land degradation–related project documents was carried out (see annex A for a list of land degradation–related projects). These projects were chosen to reflect the diversity of
6 Figures provided by the African Development Bank’s GEF coordinator.
LAnD DEgRADAtIon FoCAL AREA StuDy16
projects within the land degradation focal area portfolio, but not necessarily as a representation of the portfolio. Projects were also selected to represent a diversity of regions, lead Agencies, project sizes, and implementation stages. Of the 25 projects, 18 were classified as land degradation focal area–only projects, while 7 were multifocal area projects with a land degradation component. Using the framework established by Mirzabaev et al. (2016), project documents were examined to see if different land degradation drivers were dis-cussed and considered (annex C).7
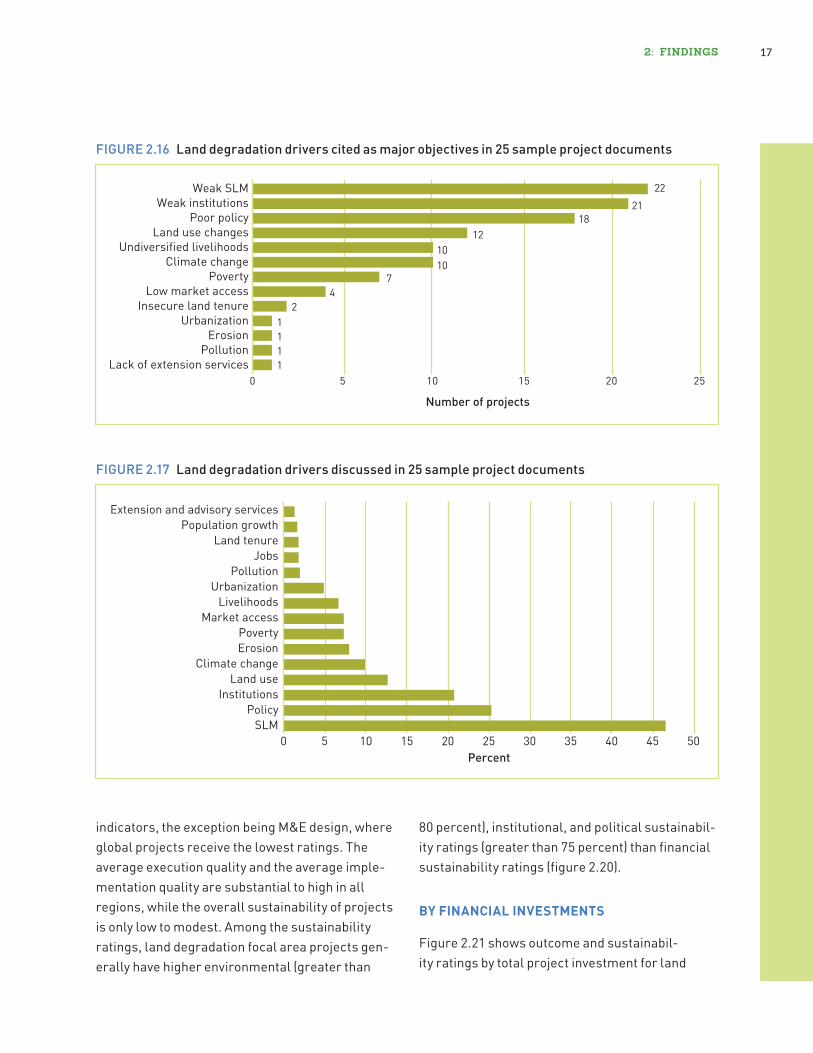
Figure 2.16 charts how frequently land degrada-tion drivers were prioritized and targeted in the projects’ results frameworks. Figure 2.17 shows the different land degradation drivers discussed in the project documents.
Assessment shows that the land degradation focal area is highly relevant to the proximate and natural causes of land degradation (annex C). The focal area is relevant to most of the natural causes of land degradation, including climate change, land use change, and soil erodibility. The focal area is also relevant to reducing drivers such as poverty, weak land degradation policies, and unsustainable land management. But the land degradation focal area is largely absent from tackling other drivers of land degradation, such as weak land tenure policy, population changes, low market access, and urbanization and infrastructure development.
7 Mirzabaev et al. (2016) reviewed the relevant scientific literature to compile a comprehensive list of the prox-imate and underlying drivers of land degradation. The study examined if the project documents (1) included a strategy or framework for managing Mirzabaev’s driv-ers and (2) considered the different drivers in contextual discussions. For the former, inclusion of each driver in the project’s proposed activities was checked. For the latter, each document was reviewed in detail to see if the different drivers were discussed and considered.
2 .3 Results
The IEO’s 2016 Annual Performance Report database was used to review the performance trends of 116 completed land degradation focal area projects. The database compiles the results ratings from all GEF projects with completed ter-minal evaluations. The data set included ratings on outcomes, sustainability, and the quality of implementation, execution, and monitoring and evaluation (M&E) design and implementation. The terminal evaluation and Annual Performance Report data set was of completed land degradation focal area projects.
OVERALL PERFORMANCE
In all, 116 land degradation–related projects have completed terminal evaluations. This includes 70 FSPs and 46 MSPs. Of these, 67 are land degra-dation stand-alone projects, and 49 are multifocal area projects with a land degradation component. All projects were initiated during GEF-3 or GEF-4, with the exception of one GEF-5 completed project, A Global Initiative on Landscapes for People, Food and Nature (GEF ID 4806). All projects are rated on a six-point scale.
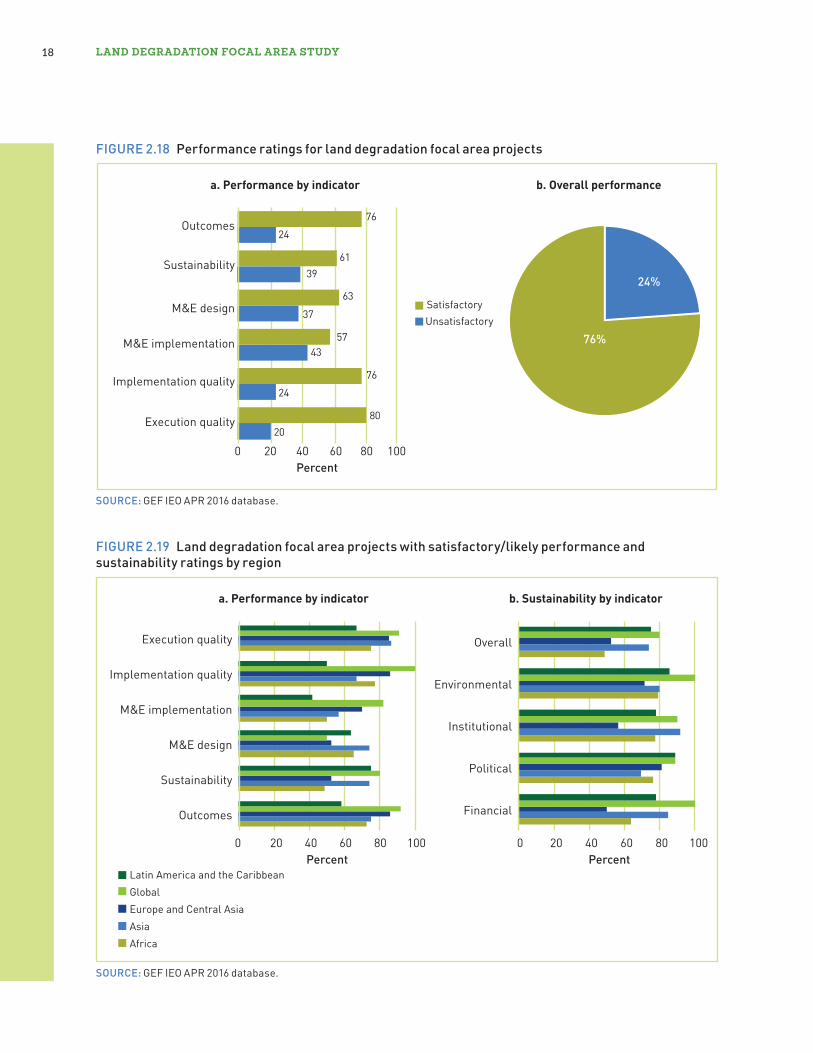
Overall, 76 percent of land degradation–related projects and land degradation stand-alone proj-ects had satisfactory outcome ratings (figure 2.18). This is slightly less than the GEF average for all projects from GEF-3, GEF-4, and GEF-5, which have an 82 percent satisfactory rating.
BY REGION
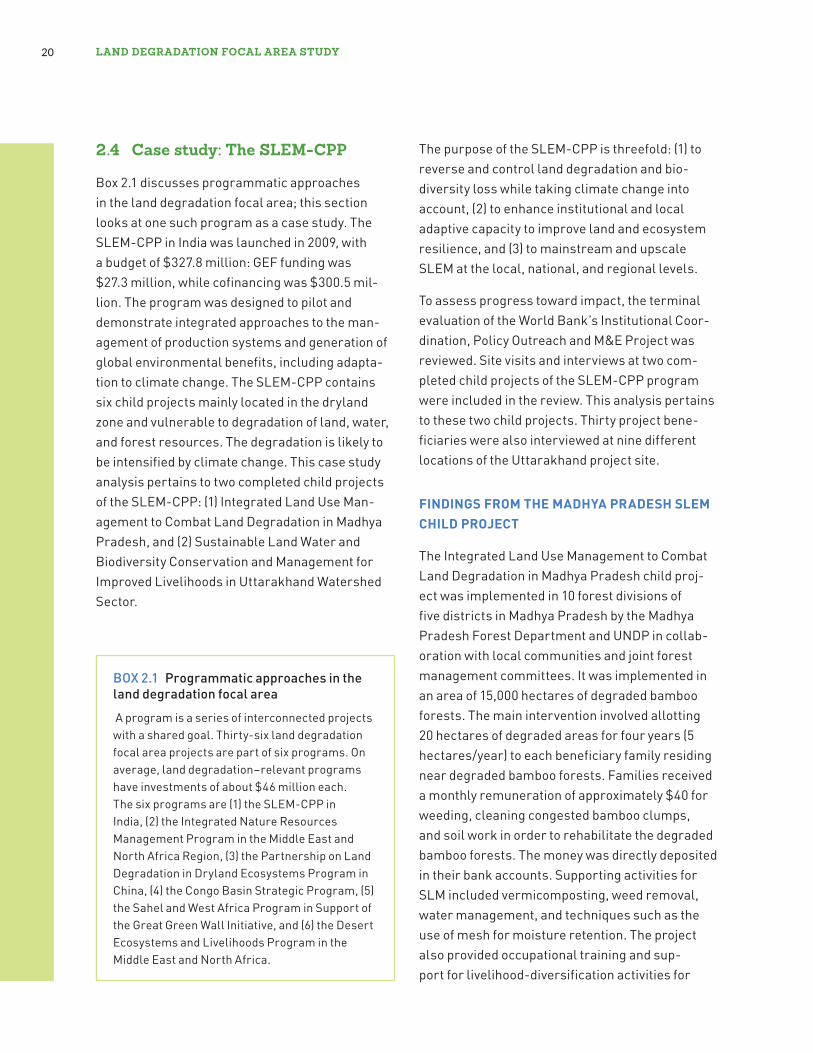
Figure 2.19 shows overall project rating by GEF region. Projects in Latin America and the Caribbean generally have the lowest ratings for outcomes, M&E implementation, and imple-mentation and execution quality. Global projects tend to have the highest ratings for five of the six
2: FInDIngS 17
FIGURE 2.16 Land degradation drivers cited as major objectives in 25 sample project documents
2221
1812
1010
74
21111
0 5 10 15 20 25
Weak SLMWeak institutions
Poor policyLand use changes
Undiversified livelihoodsClimate change
PovertyLow market access
Insecure land tenureUrbanization
ErosionPollution
Lack of extension services
Number of projects
FIGURE 2.17 Land degradation drivers discussed in 25 sample project documents
0 5 10 15 20 25 30 35 40 45 50
Extension and advisory servicesPopulation growth
Land tenureJobs
PollutionUrbanization
LivelihoodsMarket access
PovertyErosion
Climate changeLand use
InstitutionsPolicy
SLM
Percent
indicators, the exception being M&E design, where global projects receive the lowest ratings. The average execution quality and the average imple-mentation quality are substantial to high in all regions, while the overall sustainability of projects is only low to modest. Among the sustainability ratings, land degradation focal area projects gen-erally have higher environmental (greater than
80 percent), institutional, and political sustainabil-ity ratings (greater than 75 percent) than financial sustainability ratings (figure 2.20).
BY FINANCIAL INVESTMENTS
Figure 2.21 shows outcome and sustainabil-ity ratings by total project investment for land
LAnD DEgRADAtIon FoCAL AREA StuDy18
FIGURE 2.18 Performance ratings for land degradation focal area projects
24
39
37
43
24
20
76
61
63
57
76
80
0 20 40 60 80 100
Outcomes
Sustainability
M&E design
M&E implementation
Implementation quality
Execution quality
Unsatisfactory
24%
76%
Percent
Satisfactory
a. Performance by indicator b. Overall performance
SOURCE: GEF IEO APR 2016 database.
FIGURE 2.19 Land degradation focal area projects with satisfactory/likely performance and sustainability ratings by region
0 20 40 60 80 100
Outcomes
Sustainability
M&E design
M&E implementation
Implementation quality
Execution quality
Percent0 20 40 60 80 100
Financial
Political
Institutional
Environmental
Overall
Percent
a. Performance by indicator b. Sustainability by indicator
GlobalLatin America and the Caribbean
AfricaAsiaEurope and Central Asia
SOURCE: GEF IEO APR 2016 database.

2: FInDIngS 19
degradation projects (both focal area stand-alone projects and multifocal projects with a land degra-dation component). These totals include both GEF financing and cofinancing to provide a complete
picture of project funding. Outcomes and sustain-ability are positively correlated with increases in funding. The higher the level of investment, the better the project outcomes and sustainability. The highest ratings are for projects in the $10 mil-lion to $20 million cohort, with a slight decline in ratings for the largest projects, which average $47 million each in this sample.
On average, land degradation focal area projects take slightly less time to complete (5.1 years) than most GEF projects (5.7 years). MSPs require just under four years, while FSPs require just over five years. This shorter time frame could possibly explain the lower outcome ratings for closed proj-ects, since environmental benefits take much longer to materialize in land degradation interventions.
Land degradation focal area projects have higher M&E design ratings than the GEF average, but the differences are small. Sixty-three percent of land degradation focal area projects were rated satisfactory, compared to 61 percent of non–land degradation focal area projects.
FIGURE 2.20 Percentage of land degradation focal area projects with sustainability ratings of moderately likely or above
7179 77 81
0
100
20
40
60
80
Financial Political Institutional Environ-mental
Percent
SOURCE: GEF IEO APR 2016 database.
FIGURE 2.21 Average project outcome and sustainability ratings for all land degradation projects by total project investment amount
0
1
2
3
4
5
6
< $2million
$2–$5million
$5–$10million
$10–$20million
>$20million
Investment
Score Score
a. Outcome ratings b. Sustainability ratings
< $2million
$2–$5million
$5–$10million
$10–$20million
>$20million
Investment
0
1
2
3
4
5
6
SOURCE: GEF IEO APR 2016 database.
NOTE: Outcome rating scores are: 0 = unable to assess; 1 = highly unsatisfactory; 2 = unsatisfactory; 3 = moderately unsatisfactory; 4 = moderately satisfactory; 5 = satisfactory; 6 = highly satisfactory. Total project investment includes both GEF grant and cofinancing.
LAnD DEgRADAtIon FoCAL AREA StuDy20
2 .4 Case study: the SLEm-CPP
Box 2.1 discusses programmatic approaches in the land degradation focal area; this section looks at one such program as a case study. The SLEM-CPP in India was launched in 2009, with a budget of $327.8 million: GEF funding was $27.3 million, while cofinancing was $300.5 mil-lion. The program was designed to pilot and demonstrate integrated approaches to the man-agement of production systems and generation of global environmental benefits, including adapta-tion to climate change. The SLEM-CPP contains six child projects mainly located in the dryland zone and vulnerable to degradation of land, water, and forest resources. The degradation is likely to be intensified by climate change. This case study analysis pertains to two completed child projects of the SLEM-CPP: (1) Integrated Land Use Man-agement to Combat Land Degradation in Madhya Pradesh, and (2) Sustainable Land Water and Biodiversity Conservation and Management for Improved Livelihoods in Uttarakhand Watershed Sector.
BOX 2.1 Programmatic approaches in the land degradation focal area
A program is a series of interconnected projects with a shared goal. Thirty-six land degradation focal area projects are part of six programs. On average, land degradation–relevant programs have investments of about $46 million each. The six programs are (1) the SLEM-CPP in India, (2) the Integrated Nature Resources Management Program in the Middle East and North Africa Region, (3) the Partnership on Land Degradation in Dryland Ecosystems Program in China, (4) the Congo Basin Strategic Program, (5) the Sahel and West Africa Program in Support of the Great Green Wall Initiative, and (6) the Desert Ecosystems and Livelihoods Program in the Middle East and North Africa.
The purpose of the SLEM-CPP is threefold: (1) to reverse and control land degradation and bio-diversity loss while taking climate change into account, (2) to enhance institutional and local adaptive capacity to improve land and ecosystem resilience, and (3) to mainstream and upscale SLEM at the local, national, and regional levels.
To assess progress toward impact, the terminal evaluation of the World Bank’s Institutional Coor-dination, Policy Outreach and M&E Project was reviewed. Site visits and interviews at two com-pleted child projects of the SLEM-CPP program were included in the review. This analysis pertains to these two child projects. Thirty project bene-ficiaries were also interviewed at nine different locations of the Uttarakhand project site.
FINDINGS FROM THE MADHYA PRADESH SLEM CHILD PROJECT
The Integrated Land Use Management to Combat Land Degradation in Madhya Pradesh child proj-ect was implemented in 10 forest divisions of five districts in Madhya Pradesh by the Madhya Pradesh Forest Department and UNDP in collab-oration with local communities and joint forest management committees. It was implemented in an area of 15,000 hectares of degraded bamboo forests. The main intervention involved allotting 20 hectares of degraded areas for four years (5 hectares/year) to each beneficiary family residing near degraded bamboo forests. Families received a monthly remuneration of approximately $40 for weeding, cleaning congested bamboo clumps, and soil work in order to rehabilitate the degraded bamboo forests. The money was directly deposited in their bank accounts. Supporting activities for SLM included vermicomposting, weed removal, water management, and techniques such as the use of mesh for moisture retention. The project also provided occupational training and sup-port for livelihood-diversification activities for

2: FInDIngS 21
establishing vegetable gardens and making furniture from bamboo and lantana, an invasive species.
Eighty percent of the beneficiaries8 responded to 12 questions related to the project’s effectiveness, and the responses were automatically compiled. The key findings from the survey are:
■ Nearly all interviewed beneficiaries (87 percent) noted that the project contributed to improved land management to a major or moderate extent.
■ Nearly all beneficiaries indicated that the proj-ect included local participation, included their perspectives, and benefited youth, men, and women.
■ All beneficiaries noted that the project “allowed creating new jobs and livelihoods,” and 75 per-cent responded that the project had some impact.
■ Nearly 70 percent of the practices taught through the project were sustainable and being replicated locally.
Results of the geospatial analysis indicate that vegetation has been fluctuating but has demonstrated an increasing trend after 2008 (figure 2.22). Results indicate that the vegetation cover in the area improved over the project period. The average Normalized Difference Vegetation Index (NDVI) for April, the driest month in the region in 2015, increased by about 10 percent, compared to 2009 levels. The vegetation signifi-cantly improved inside the project area, compared to areas outside the project boundary. Field visits and stakeholder perspectives corroborate that
8 Household heads of 16 beneficiary families were inter-viewed, covering 80 percent of beneficiaries from four villages visited during the case study.
SLEM interventions improved land management and helped in the regeneration of bamboo forests in the area.
FINDINGS FROM THE UTTARAKHAND PROJECT
The Sustainable Land Water and Biodiversity Conservation and Management for Improved Live-lihoods in Uttarakhand Watershed Sector child project was linked to a previous decentralized watershed management project implemented between 2004 and 2012 in 75 microwatersheds in the state. The GEF project targeted 20 micro-watersheds based on severity of erosion, extent of poverty, and lack of infrastructure facilities. Year-round availability of water is a problem in the project area, and soil erosion during the rainy season had threatened soil and water conserva-tion. Forest fires are another environmental issue, caused by the highly inflammable material of dry pine needles and the leaf litter of the chir pine (Pinus roxburghii). The project focused on reducing land, water, and forest degradation. Microwater-shed management activities included construction
FIGURE 2.22 Increase in vegetation productivity in Madhya Pradesh child project: time-series plot and vegetation productivity maps
LAnD DEgRADAtIon FoCAL AREA StuDy22
of gravity sprinklers and check dams. Slopes were stabilized by planting Napier grass, a species that is also used to feed livestock. Supporting activities for sustainable forest management included the introduction of preventive practices to reduce the number of forest fire incidents.
The project involved a Van Panchayat, a village-level traditional community–based forest management body, unique to the state, to manage the local forests. The Van Panchayat was given rights to manage the government oak forest. Forest management practice involves setting aside saplings with potential for healthy growth and cutting off the rest for use as animal feed and fuel wood. This collaborative practice was insti-tutionalized in the second phase of the project, and stakeholders reported a healthy forest cover in the area as a result of the initiative. The project also supported agricultural intensification and livelihood diversification activities. Prior to project implementation, farmers in the area were growing potatoes and wheat but later included cash crops such as vegetables, fruits, flowers, and peas and considered them more profitable.
IMPACT
Field visits were conducted to gather evidence on impacts of the project through interviews with a variety of stakeholders. The main findings were as follows:
■ Policy and institutional reforms implemented have been successful largely because the Indian government is fully engaged in the imple-mentation of this program.
■ Social and environmental benefits have been wide ranging and include minor tenure reforms, sustainable livelihood opportunities, sustain-able resource management, and science-driven interventions.
■ The projects have a strong decentralized and grassroots structure because of a high level of local participation.
■ So far, project activities seem sustainable because of successes in building local skills and creating alternative income-generation opportunities. It is these productive enhance-ments that ensure sustainability and positive environmental outcomes.
■ Project beneficiaries less likely to migrate to urban areas due to the increase in income-generating opportunities and improved access to forest and water resources.
CHALLENGES AND LESSONS
There were also project-specific challenges in the case of the land degradation project in Madhya Pradesh.
■ Most project landowners own small plots or have been provided small five-hectare plots. These small land holdings make it difficult to apply interventions consistently across large areas. Each plot is controlled by individuals who decide if and how they will apply SLEM practices and for how long. Moreover, small plots do not generate high incomes, so farmers on these lands must seek alternative seasonal work elsewhere.
■ Most farmers engaged in traditional subsis-tence farming, so transitioning them toward production required a change in thinking.
■ There has been little to no involvement from civil society. The program is essentially a pro-gram between locals and the government. The lack of civil-society participation could affect sustainability.
2: FInDIngS 23
■ Continued efforts must be made to gener-ate incomes and build local and institutional capacity.
■ At the time of our field visit (September 2016), prolonged dry spells with sporadic rises in tem-perature caused many restored bamboo forests to dry out.
The project in Uttarakhand had a unique issue: the introduction of expensive equipment that is not cost-effective and sustainable. Focus group participants mentioned that repair costs for the portable tiller is very costly, and local skills were not developed to perform repairs. Thus, expen-sive equipment routinely sits idle and unusable. Project stakeholders at the Uttarakhand site also raised two main concerns regarding the suitability of some of the project activities in the context of variability in seasons and amount of rainfall:
■ Erratic rainfall patterns made it difficult to plan what to grow. Farmers reported previous instances of crop damage due to either delayed or excessive rains.
■ Farmers noted that they lacked adequate knowledge and strategies to face climate shocks, including droughts, pointing to the need to address risks.
2 .5 value-for-money analysis
A VFM analysis was carried out by the GEF IEO to learn about the effectiveness of land degradation focal area investments. The VFM had two goals. The first was to identify the causal impacts from land degradation focal area projects along three indicators that closely relate to those suggested by the UNCCD’s 2015 LDN scientific framework and the proposed indicators and subindicators for SDG 15. These include forest cover change, forest fragmentation, and vegetation productivity. The
second aim was to determine the VFM from these land degradation focal area projects.
Land degradation focal area investments had led to positive environmental impacts, specifically reducing forest loss, reducing forest fragmen-tation, and increasing vegetation productivity. Vegetation productivity or density is measured by the NDVI. Globally, within 25-km catchment areas surrounding project locations, land degradation focal area projects increased NDVI by approxi-mately 0.03 percent (relative to an average NDVI of 0.55). Moreover, land degradation focal area proj-ects reduced forest loss by 1.3 percent (relative to the 2.4 percent global mean forest loss). Land degradation focal area projects also increased the average forest patch size by 0.25 km (relative to a global mean of 7.3 km2).
Impacts vary across different geographic con-texts. Projects in Africa and Asia had generally positive impacts on average. Projects in Oceania, and North and South America all had positive impacts on all three indicators. In all regions of the world, land degradation focal area projects reduced the rate of forest loss as measured in 2014 (figure 2.23). Likewise, all regions except Europe saw improved vegetation productivity (figure 2.24). Fragmentation was the most differ-entiated across regions.
Africa had the most fragmentation in areas of land degradation focal area projects, while North America and South America had the largest mean patch sizes (figure 2.25).
Improvements in vegetation cover from land deg-radation focal area projects have led to higher levels of carbon sequestration. The estimated carbon sequestered was 43.52 tons of carbon per hectare, on average. This equates to about 108,800 tons of carbon sequestered in each land degrada-tion focal area project location. The VFM analysis further estimates that, at a valuation of $12.90 per

LAnD DEgRADAtIon FoCAL AREA StuDy24
FIGURE 2.23 Average estimated differences in rate of total forest loss at GEF intervention versus control locations
0 0.005 0.010 0.015 0.020 0.025 0.030
Africa
Asia
Europe
North America
Oceania
South America
Percent
NOTE: This figure excludes a small number of projects that are not clearly delineated as affecting a single continent (i.e., where the exact degree of impact attributable to each continent is unknown).
ton, individual land degradation focal area projects contributed $7.5 million on average to sequestra-tion, which is well above the average cost of most land degradation focal area projects.
The analysis identified a range of values consistent with previous analyses of the value of land degra-dation projects. Because considerable uncertainty exists, the range of potential benefits from a single focal area land degradation project is estimated at $52–$143/hectare affected in terms of carbon sequestration alone; soil retention promotes an additional value of $10–$43/hectare, for a total valuation of $62–$186/hectare across all land degradation projects. After costs are accounted for, it is estimated that the per-dollar return on investment for land degradation projects is approximately $1.08 per dollar invested. This is likely to be an underestimate, since it captures only two ecosystem services.
The VFM analysis reveals the following three pertinent findings on project effectiveness (figure 2.26):
FIGURE 2.24 Average estimated differences in increased vegetation productivity at GEF intervention versus control locations
−0.05 0 0.05 0.10 0.15 0.20 0.25 0.30
Africa
Asia
Europe
North America
Oceania
South America
NDVI
NOTE: This figure excludes a small number of projects that are not clearly delineated as affecting a single continent (i.e., where the exact degree of impact attributable to each continent is unknown).
FIGURE 2.25 Average estimated differences in reduced forest fragmentation at GEF intervention versus control locations
−3 −2 −1 0 1 2 3 4
Africa
Asia
Europe
North America
Oceania
South America
Mean patch size in km2
NOTE: This figure excludes a small number of projects that are not clearly delineated as affecting a single continent (i.e., where the exact degree of impact attributable to each continent is unknown).
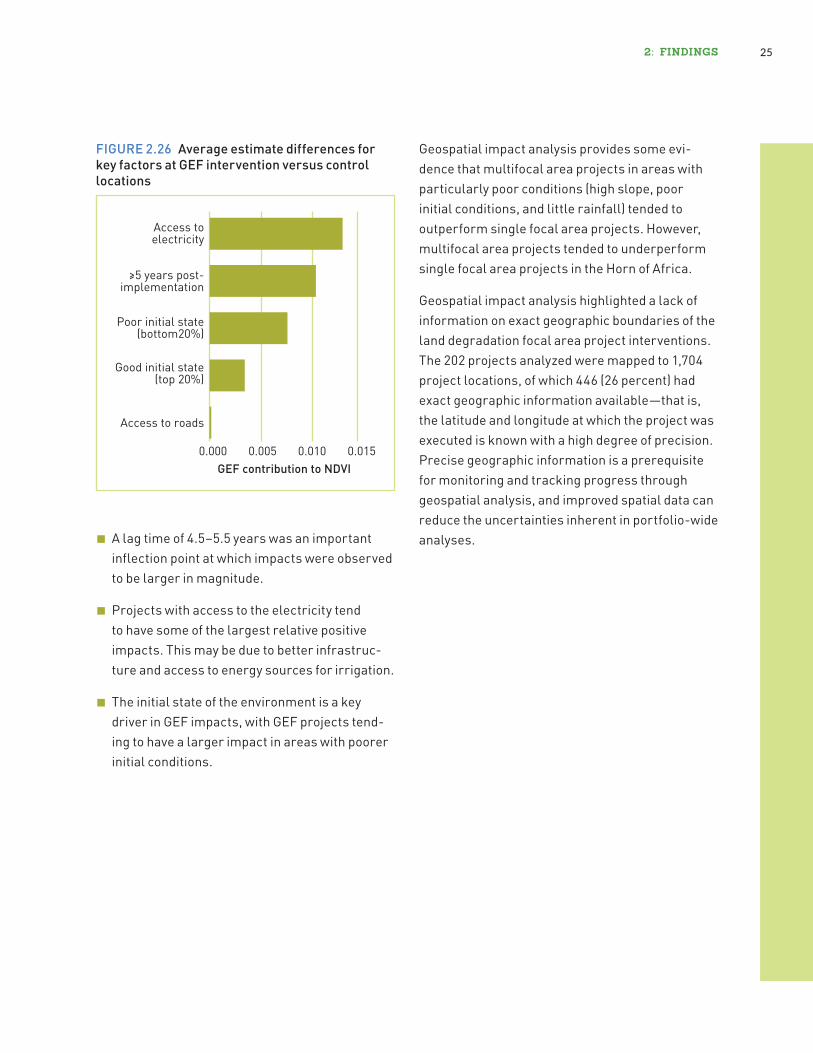
2: FInDIngS 25
Geospatial impact analysis provides some evi-dence that multifocal area projects in areas with particularly poor conditions (high slope, poor initial conditions, and little rainfall) tended to outperform single focal area projects. However, multifocal area projects tended to underperform single focal area projects in the Horn of Africa.
Geospatial impact analysis highlighted a lack of information on exact geographic boundaries of the land degradation focal area project interventions. The 202 projects analyzed were mapped to 1,704 project locations, of which 446 (26 percent) had exact geographic information available—that is, the latitude and longitude at which the project was executed is known with a high degree of precision. Precise geographic information is a prerequisite for monitoring and tracking progress through geospatial analysis, and improved spatial data can reduce the uncertainties inherent in portfolio-wide analyses.
FIGURE 2.26 Average estimate differences for key factors at GEF intervention versus control locations
Access to roads
Access toelectricity
Good initial state(top 20%)
Poor initial state(bottom20%)
≥5 years post-implementation
0.000 0.005 0.010 0.015GEF contribution to NDVI
■ A lag time of 4.5–5.5 years was an important inflection point at which impacts were observed to be larger in magnitude.
■ Projects with access to the electricity tend to have some of the largest relative positive impacts. This may be due to better infrastruc-ture and access to energy sources for irrigation.
■ The initial state of the environment is a key driver in GEF impacts, with GEF projects tend-ing to have a larger impact in areas with poorer initial conditions.

26
3: Recommendations3. chapter number
Following are the four main recommendations of the evaluation.
■ Implement LDN with an appropriate mix of interventions. While being cognizant of cost-effectiveness, context, and country prior-ities, land degradation focal area should also consider restoration activities along with SLM. SLM practices are intended to help avoid and reduce land degradation, while ecosystem res-toration will help reverse the process. Newer projects in GEF-6 increasingly focus on achieving LDN targets and therefore would benefit from distinguishing between the two complementary pathways—SLM and ecosystem restoration—to be able to measure progress toward LDN targets.
■ Give due consideration to complex contextual factors within an integrated approach frame-work. While the land degradation focal area’s strategic focus has moved appropriately toward integrated approaches, complex contextual factors—including drought, food insecurity and migration—should be given due consideration during project design. The focal area is highly relevant to areas with land degradation, including Africa, particularly with its distressed emigration hotspots. While neither land degradation nor drought is the primary driver, both increase food insecurity and vulnerability and therefore may exacerbate the risk of conflict or migration.
■ Assess climate risks to land degradation focal area initiatives, and design adaptive
management responses to such risks. Unsus-tainable land management practices that the GEF Land Degradation Focal Area Strategies aim to ameliorate have a direct and clear link-age to climate change. The effects of climate change are likely to affect many land-based activities, including ecosystem functions and services. Broader application of the Resilience Adaptation and Transformation Assessment framework is encouraged.
■ Strengthen M&E tools and methods of knowl-edge dissemination. The development and continued improvement of the tracking tool is a step in the right direction but will be inadequate to assess project impacts in the long run. The tracking tools should include additional biophys-ical indicators, increasingly available through geospatial data, to set baselines and measure progress of land productivity to track both global environmental benefits and LDN targets. Precise geospatial information on project loca-tions is imperative for carrying out accurate M&E of land degradation projects. The land degradation focal area should consider inte-grating the indicators proposed by the UNCCD’s LDN framework. The benefits and impacts of sustained SLM practices and restoration mea-sures are not fully accounted for in the current M&E system. Recognition, therefore, should be given to the fact that it might be necessary to set a sufficiently longer time frame in monitoring projects striving to achieve LDN.
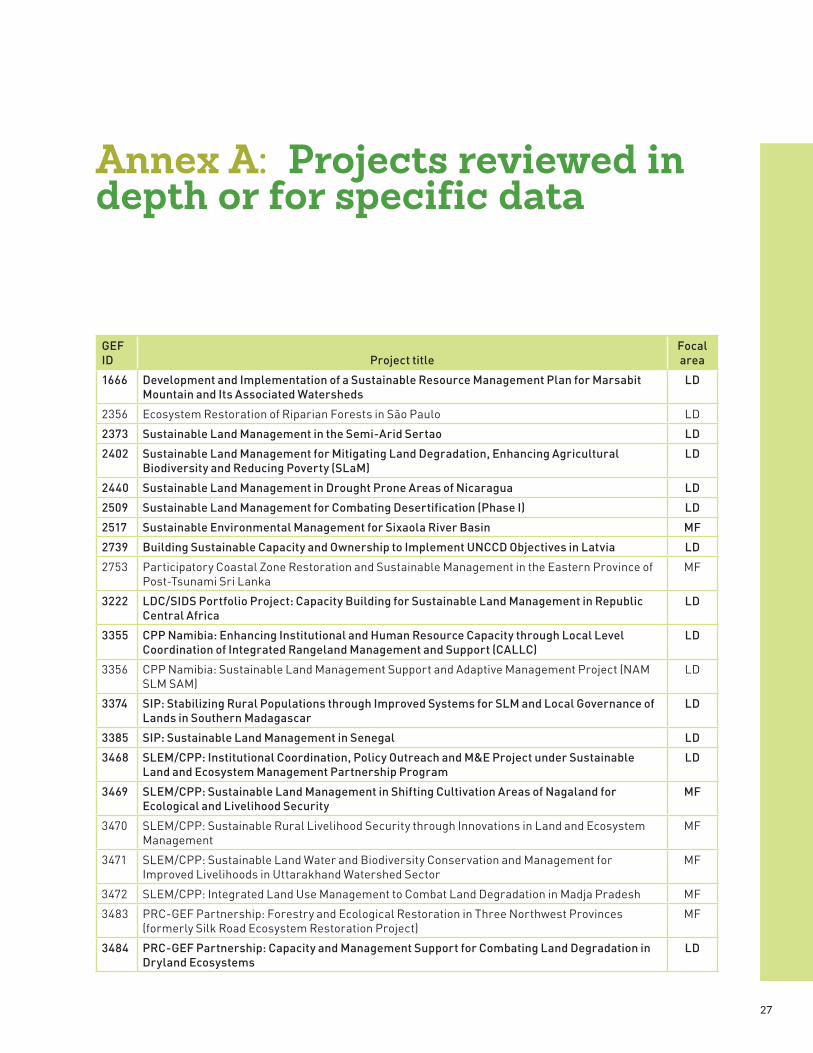
27
Annex A: Projects reviewed in depth or for specific dataA. annex number
GEF ID Project title
Focal area
1666 Development and Implementation of a Sustainable Resource Management Plan for Marsabit Mountain and Its Associated Watersheds
LD
2356 Ecosystem Restoration of Riparian Forests in São Paulo LD2373 Sustainable Land Management in the Semi-Arid Sertao LD2402 Sustainable Land Management for Mitigating Land Degradation, Enhancing Agricultural
Biodiversity and Reducing Poverty (SLaM)LD
2440 Sustainable Land Management in Drought Prone Areas of Nicaragua LD2509 Sustainable Land Management for Combating Desertification (Phase I) LD2517 Sustainable Environmental Management for Sixaola River Basin MF2739 Building Sustainable Capacity and Ownership to Implement UNCCD Objectives in Latvia LD2753 Participatory Coastal Zone Restoration and Sustainable Management in the Eastern Province of
Post-Tsunami Sri LankaMF
3222 LDC/SIDS Portfolio Project: Capacity Building for Sustainable Land Management in Republic Central Africa
LD
3355 CPP Namibia: Enhancing Institutional and Human Resource Capacity through Local Level Coordination of Integrated Rangeland Management and Support (CALLC)
LD
3356 CPP Namibia: Sustainable Land Management Support and Adaptive Management Project (NAM SLM SAM)
LD
3374 SIP: Stabilizing Rural Populations through Improved Systems for SLM and Local Governance of Lands in Southern Madagascar
LD
3385 SIP: Sustainable Land Management in Senegal LD3468 SLEM/CPP: Institutional Coordination, Policy Outreach and M&E Project under Sustainable
Land and Ecosystem Management Partnership ProgramLD
3469 SLEM/CPP: Sustainable Land Management in Shifting Cultivation Areas of Nagaland for Ecological and Livelihood Security
MF
3470 SLEM/CPP: Sustainable Rural Livelihood Security through Innovations in Land and Ecosystem Management
MF
3471 SLEM/CPP: Sustainable Land Water and Biodiversity Conservation and Management for Improved Livelihoods in Uttarakhand Watershed Sector
MF
3472 SLEM/CPP: Integrated Land Use Management to Combat Land Degradation in Madja Pradesh MF3483 PRC-GEF Partnership: Forestry and Ecological Restoration in Three Northwest Provinces
(formerly Silk Road Ecosystem Restoration Project)MF
3484 PRC-GEF Partnership: Capacity and Management Support for Combating Land Degradation in Dryland Ecosystems
LD
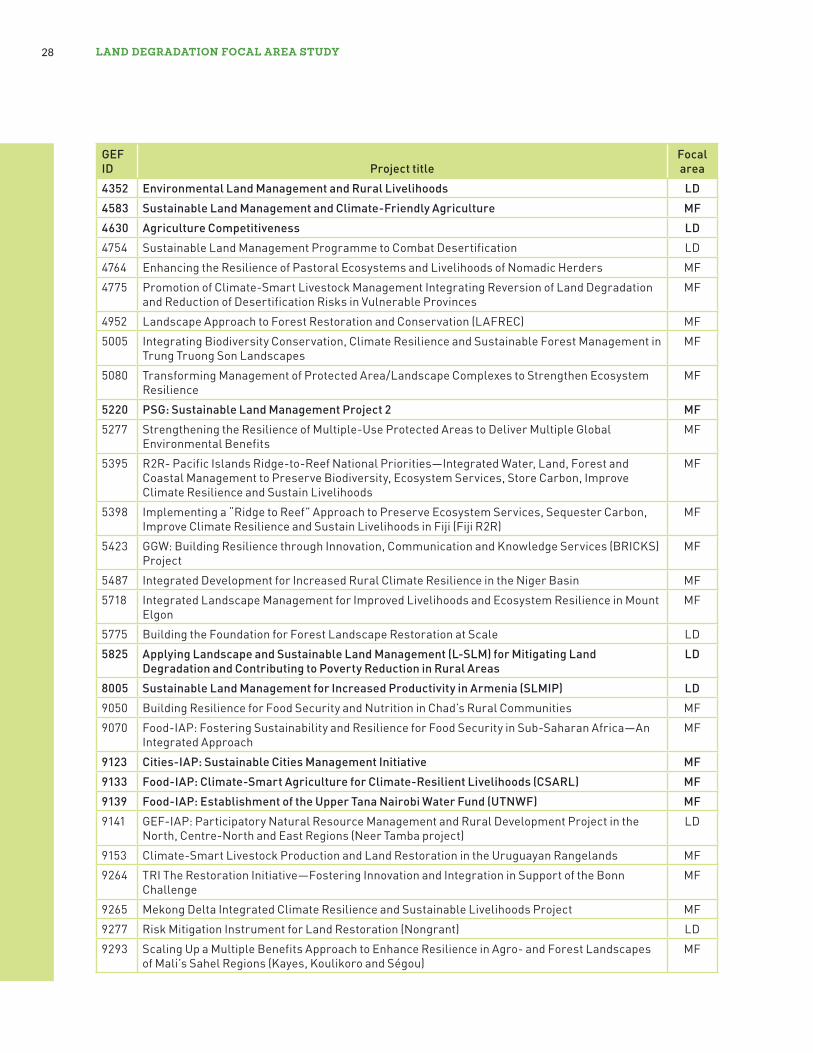
LAnD DEgRADAtIon FoCAL AREA StuDy28
GEF ID Project title
Focal area
4352 Environmental Land Management and Rural Livelihoods LD4583 Sustainable Land Management and Climate-Friendly Agriculture MF4630 Agriculture Competitiveness LD4754 Sustainable Land Management Programme to Combat Desertification LD4764 Enhancing the Resilience of Pastoral Ecosystems and Livelihoods of Nomadic Herders MF4775 Promotion of Climate-Smart Livestock Management Integrating Reversion of Land Degradation
and Reduction of Desertification Risks in Vulnerable ProvincesMF
4952 Landscape Approach to Forest Restoration and Conservation (LAFREC) MF5005 Integrating Biodiversity Conservation, Climate Resilience and Sustainable Forest Management in
Trung Truong Son LandscapesMF
5080 Transforming Management of Protected Area/Landscape Complexes to Strengthen Ecosystem Resilience
MF
5220 PSG: Sustainable Land Management Project 2 MF5277 Strengthening the Resilience of Multiple-Use Protected Areas to Deliver Multiple Global
Environmental BenefitsMF
5395 R2R- Pacific Islands Ridge-to-Reef National Priorities—Integrated Water, Land, Forest and Coastal Management to Preserve Biodiversity, Ecosystem Services, Store Carbon, Improve Climate Resilience and Sustain Livelihoods
MF
5398 Implementing a “Ridge to Reef” Approach to Preserve Ecosystem Services, Sequester Carbon, Improve Climate Resilience and Sustain Livelihoods in Fiji (Fiji R2R)
MF
5423 GGW: Building Resilience through Innovation, Communication and Knowledge Services (BRICKS) Project
MF
5487 Integrated Development for Increased Rural Climate Resilience in the Niger Basin MF5718 Integrated Landscape Management for Improved Livelihoods and Ecosystem Resilience in Mount
ElgonMF
5775 Building the Foundation for Forest Landscape Restoration at Scale LD5825 Applying Landscape and Sustainable Land Management (L-SLM) for Mitigating Land
Degradation and Contributing to Poverty Reduction in Rural AreasLD
8005 Sustainable Land Management for Increased Productivity in Armenia (SLMIP) LD9050 Building Resilience for Food Security and Nutrition in Chad’s Rural Communities MF9070 Food-IAP: Fostering Sustainability and Resilience for Food Security in Sub-Saharan Africa—An
Integrated ApproachMF
9123 Cities-IAP: Sustainable Cities Management Initiative MF9133 Food-IAP: Climate-Smart Agriculture for Climate-Resilient Livelihoods (CSARL) MF9139 Food-IAP: Establishment of the Upper Tana Nairobi Water Fund (UTNWF) MF9141 GEF-IAP: Participatory Natural Resource Management and Rural Development Project in the
North, Centre-North and East Regions (Neer Tamba project)LD
9153 Climate-Smart Livestock Production and Land Restoration in the Uruguayan Rangelands MF9264 TRI The Restoration Initiative—Fostering Innovation and Integration in Support of the Bonn
ChallengeMF
9265 Mekong Delta Integrated Climate Resilience and Sustainable Livelihoods Project MF9277 Risk Mitigation Instrument for Land Restoration (Nongrant) LD9293 Scaling Up a Multiple Benefits Approach to Enhance Resilience in Agro- and Forest Landscapes
of Mali’s Sahel Regions (Kayes, Koulikoro and Ségou)MF

AnnEx A: PRojECtS REvIEwED In DEPth oR FoR SPECIFIC DAtA 29
GEF ID Project title
Focal area
9340 Food-IAP: Sustainable Land and Water Management Project, Second Additional Financing MF9365 Land Degradation Neutrality Target Setting Project LD9385 Forest Landscape Restoration in the Mayaga Region MF9388 Land Degradation Neutrality of Mountain Landscapes in Lebanon LD9389 Ensuring Sustainability and Resilience (ENSURE) of Green Landscapes in Mongolia MF9405 Integrated Management of Oasis Ecosystems of Northern Niger (IMOE-NN) MF9406 Integrated Ecosystem Management and Restoration of Forests on the South East Coast of St.
LuciaMF
9477 Promoting Sustainable Land Management (SLM) through Integrated Restoration of Ecosystems LD9556 Restoration of Arid and Semi-Arid Lands (ASAL) of Kenya through Bio-Enterprise Development
and Other Incentives under the Restoration InitiativeMF
SOURCE: GEF PMIS.
NOTE: LD = land degradation; MF = multifocal. Boldface indicates projects that were reviewed in depth.
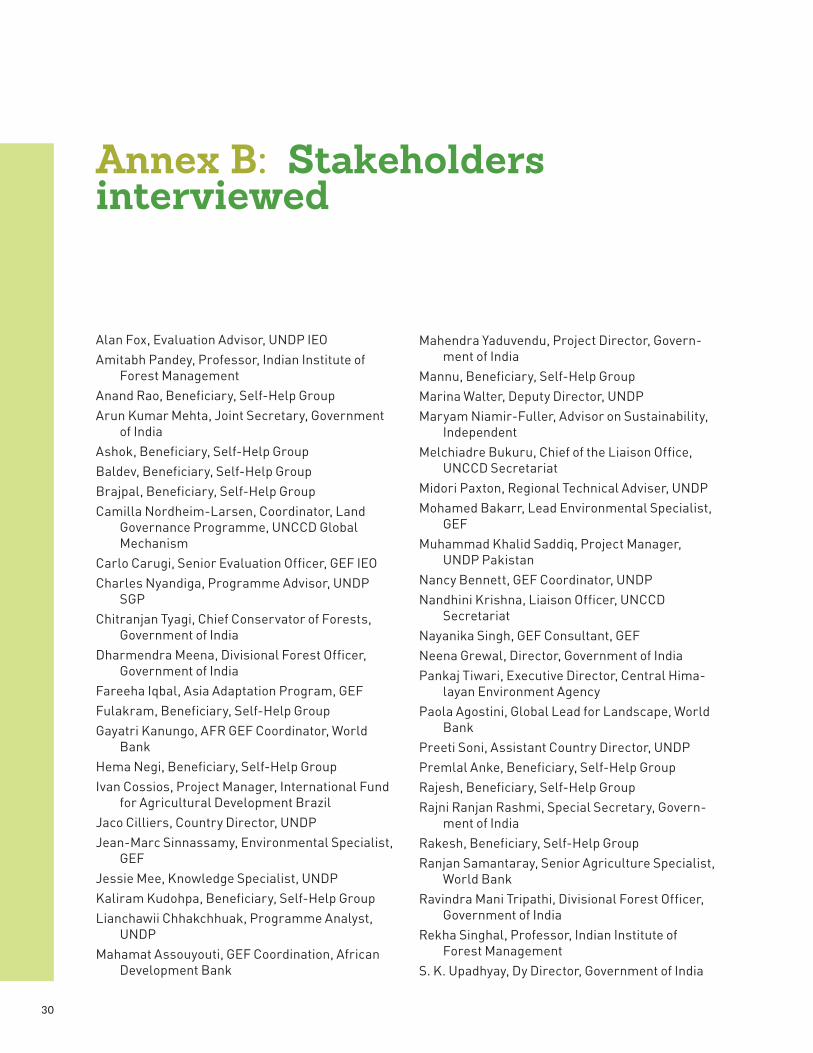
30
Annex B: Stakeholders interviewedB. annex number
Alan Fox, Evaluation Advisor, UNDP IEOAmitabh Pandey, Professor, Indian Institute of
Forest ManagementAnand Rao, Beneficiary, Self-Help GroupArun Kumar Mehta, Joint Secretary, Government
of IndiaAshok, Beneficiary, Self-Help GroupBaldev, Beneficiary, Self-Help GroupBrajpal, Beneficiary, Self-Help GroupCamilla Nordheim-Larsen, Coordinator, Land
Governance Programme, UNCCD Global Mechanism
Carlo Carugi, Senior Evaluation Officer, GEF IEOCharles Nyandiga, Programme Advisor, UNDP
SGPChitranjan Tyagi, Chief Conservator of Forests,
Government of IndiaDharmendra Meena, Divisional Forest Officer,
Government of IndiaFareeha Iqbal, Asia Adaptation Program, GEFFulakram, Beneficiary, Self-Help GroupGayatri Kanungo, AFR GEF Coordinator, World
BankHema Negi, Beneficiary, Self-Help GroupIvan Cossios, Project Manager, International Fund
for Agricultural Development BrazilJaco Cilliers, Country Director, UNDPJean-Marc Sinnassamy, Environmental Specialist,
GEFJessie Mee, Knowledge Specialist, UNDPKaliram Kudohpa, Beneficiary, Self-Help GroupLianchawii Chhakchhuak, Programme Analyst,
UNDPMahamat Assouyouti, GEF Coordination, African
Development Bank
Mahendra Yaduvendu, Project Director, Govern-ment of India
Mannu, Beneficiary, Self-Help GroupMarina Walter, Deputy Director, UNDPMaryam Niamir-Fuller, Advisor on Sustainability,
IndependentMelchiadre Bukuru, Chief of the Liaison Office,
UNCCD SecretariatMidori Paxton, Regional Technical Adviser, UNDPMohamed Bakarr, Lead Environmental Specialist,
GEFMuhammad Khalid Saddiq, Project Manager,
UNDP PakistanNancy Bennett, GEF Coordinator, UNDPNandhini Krishna, Liaison Officer, UNCCD
SecretariatNayanika Singh, GEF Consultant, GEFNeena Grewal, Director, Government of IndiaPankaj Tiwari, Executive Director, Central Hima-
layan Environment AgencyPaola Agostini, Global Lead for Landscape, World
BankPreeti Soni, Assistant Country Director, UNDPPremlal Anke, Beneficiary, Self-Help GroupRajesh, Beneficiary, Self-Help GroupRajni Ranjan Rashmi, Special Secretary, Govern-
ment of IndiaRakesh, Beneficiary, Self-Help GroupRanjan Samantaray, Senior Agriculture Specialist,
World BankRavindra Mani Tripathi, Divisional Forest Officer,
Government of IndiaRekha Singhal, Professor, Indian Institute of
Forest ManagementS. K. Upadhyay, Dy Director, Government of India

AnnEx B: StAkEhoLDERS IntERvIEwED 31
Sardas Salame, Beneficiary, Self-Help GroupSarojni Melkani, Van Sarpanch, Self-Help GroupSatish Dhurbey, Beneficiary, Self-Help GroupSiyalal, Beneficiary, Self-Help GroupSiyaram, Beneficiary, Self-Help GroupSobharam Koureti, Beneficiary, Self-Help GroupSomit Burman, Project Manager, UNDP
Tehmina Akhtar, Deputy Global Manager, UNDP SGP
Ulrich Apel, land degradation focal area Coordina-tor, GEF
Yashwant Parthe, Beneficiary, Self-Help Group

32
Annex C: Focal area relevance to land degradation driversC. annex number
Major driver Example
Land degradation focal area objectivesLD1 LD2 LD3 LD4
1.1 1.2 1.3 2.1 2.2 2.3 3.1 3.2 3.3 4.1 4.2Topography Steep slopes are vulnerable to
severe water-induced soil erosion. x x x x x x x x x
Land cover change
Conversion of rangelands to irrigated farming with resulting soil salinity. Deforestation.
x x x x x x x x x x x
Climate Dry, hot areas are prone to naturally occurring wildfires, which, in turn, lead to soil erosion. Strong rainstorms lead to flooding and erosion. Low and infrequent rainfall and erratic and erosive rainfall (monsoon areas) lead to erosion and salinization.
x x x x x x x x x x x
Soil erodibility Some soils—for example, those with high silt content—could be naturally more prone to erosion.
x x x x x x x x x x x
Pest and diseases
Pests and diseases lead to loss of biodiversity, loss of crop and livestock productivity, and other forms of land degradation.
Unsustainable land management
Land clearing, overgrazing, cultivation on steep slopes, bush burning, pollution of land and water sources, and soil nutrient mining are among the major causes of land degradation.
x x x x x x x x x x x
Infrastructure development
Transport and earthmoving techniques, such as trucks and tractors, as well as new processing and storage technologies, could lead to increased production and foster land degradation if not properly planned.
Population density
Population density leads to land degradation.
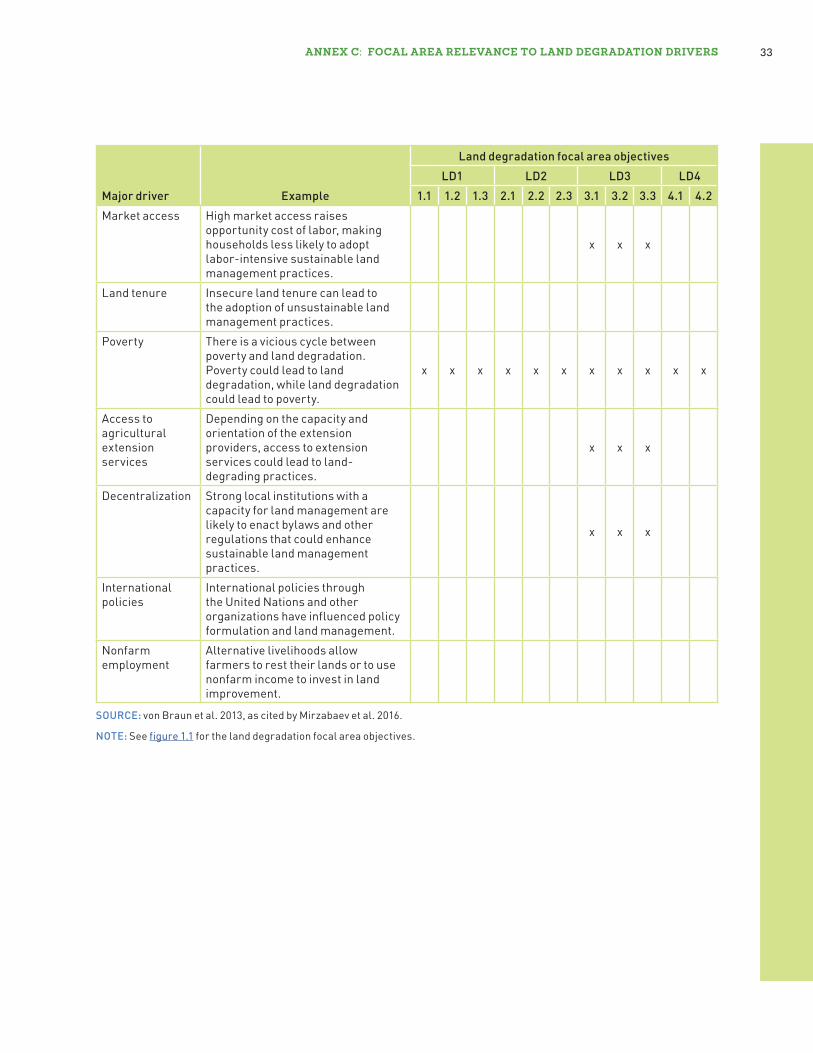
AnnEx C: FoCAL AREA RELEvAnCE to LAnD DEgRADAtIon DRIvERS 33
Major driver Example
Land degradation focal area objectivesLD1 LD2 LD3 LD4
1.1 1.2 1.3 2.1 2.2 2.3 3.1 3.2 3.3 4.1 4.2Market access High market access raises
opportunity cost of labor, making households less likely to adopt labor-intensive sustainable land management practices.
x x x
Land tenure Insecure land tenure can lead to the adoption of unsustainable land management practices.
Poverty There is a vicious cycle between poverty and land degradation. Poverty could lead to land degradation, while land degradation could lead to poverty.
x x x x x x x x x x x
Access to agricultural extension services
Depending on the capacity and orientation of the extension providers, access to extension services could lead to land-degrading practices.
x x x
Decentralization Strong local institutions with a capacity for land management are likely to enact bylaws and other regulations that could enhance sustainable land management practices.
x x x
International policies
International policies through the United Nations and other organizations have influenced policy formulation and land management.
Nonfarm employment
Alternative livelihoods allow farmers to rest their lands or to use nonfarm income to invest in land improvement.
SOURCE: von Braun et al. 2013, as cited by Mirzabaev et al. 2016.
NOTE: See figure 1.1 for the land degradation focal area objectives.

34
Annex D: Focal area relevance to the SDgsD. annex number
TABLE D.1 Relevance to the 17 Sustainable Development Goals
SDG Goal
Land degradation focal area objectivesLD1 LD2 LD3 LD4
1.1 1.2 1.3 2.1 2.2 2.3 3.1 3.2 3.3 4.1 4.21: No poverty End poverty in all its forms
everywhere x x x x x x
2: Zero hunger End hunger, achieve food security and improved nutrition, and promote sustainable agriculture
x x x x x x x x
3: Good health and well being
Ensure healthy lives and promote well-being for all at all ages
4: Quality education
Ensure inclusive and equitable quality education and promote lifelong learning opportunities for all
5: Gender equality
Achieve gender equality, and empower all women and girls x
6: Clean water and sanitation
Ensure availability and sustainable management of water and sanitation for all
x x x x x x x x x x x
7: Affordable and clean energy
Ensure access to affordable, reliable, sustainable, and modern energy for all
8: Decent work and economic growth
Promote sustained, inclusive, and sustainable economic growth, full and productive employment, and decent work for all
x x x x x x
9: Industry, innovation, and infrastructure
Build resilient infrastructure, promote inclusive and sustainable industrialization, and foster innovation
10: Reduced inequalities
Reduce inequality within and among countries x x x x x x x x x
11: Sustainable cities and communities
Make cities and human settlements inclusive, safe, resilient, and sustainable
12: Responsible consumption and production
Ensure sustainable consumption and production patterns
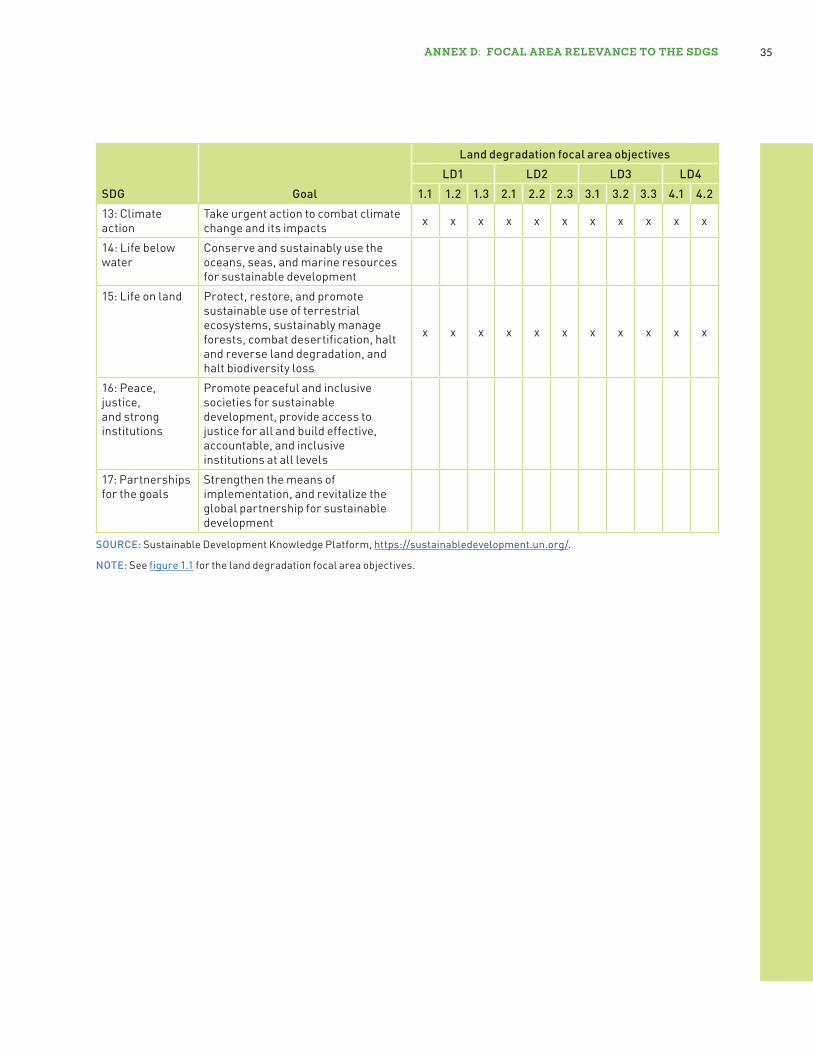
AnnEx D: FoCAL AREA RELEvAnCE to thE SDgS 35
SDG Goal
Land degradation focal area objectivesLD1 LD2 LD3 LD4
1.1 1.2 1.3 2.1 2.2 2.3 3.1 3.2 3.3 4.1 4.213: Climate action
Take urgent action to combat climate change and its impacts x x x x x x x x x x x
14: Life below water
Conserve and sustainably use the oceans, seas, and marine resources for sustainable development
15: Life on land Protect, restore, and promote sustainable use of terrestrial ecosystems, sustainably manage forests, combat desertification, halt and reverse land degradation, and halt biodiversity loss
x x x x x x x x x x x
16: Peace, justice, and strong institutions
Promote peaceful and inclusive societies for sustainable development, provide access to justice for all and build effective, accountable, and inclusive institutions at all levels
17: Partnerships for the goals
Strengthen the means of implementation, and revitalize the global partnership for sustainable development
SOURCE: Sustainable Development Knowledge Platform, https://sustainabledevelopment.un.org/.
NOTE: See figure 1.1 for the land degradation focal area objectives.

LAnD DEgRADAtIon FoCAL AREA StuDy36
TABLE D.2 Relevance to SDG 15: Life on land
Target
Land degradation focal area objectivesLD1 LD2 LD3 LD4
1.1 1.2 1.3 2.1 2.2 2.3 3.1 3.2 3.3 4.1 4.215.1: By 2020, ensure the conservation, restoration, and sustainable use of terrestrial and inland freshwater ecosystems and their services—in particular forests, wetlands, mountains, and drylands—in line with obligations under international agreements
x x x x x x x x x x x
15.2: By 2020, promote the implementation of sustainable management of all types of forests, halt deforestation, restore degraded forests, and substantially increase afforestation and reforestation globally
x x x
15.3: By 2030, combat desertification, restore degraded land and soil, including land affected by desertification, drought, and floods, and strive to achieve a LDN [land degradation neutrality] world
x x x x x x x x x x x
15.4: By 2030, ensure the conservation of mountain ecosystems, including their biodiversity, in order to enhance their capacity to provide benefits that are essential for sustainable development
x x x
15.5: Take urgent and significant action to reduce the degradation of natural habitats, halt the loss of biodiversity, and, by 2020, protect and prevent the extinction of threatened species
x x x
15.6: Promote fair and equitable sharing of the benefits arising from the utilization of genetic resources and promote appropriate access to such resources, as internationally agreed15.7: Take urgent action to end poaching and trafficking of protected species of flora and fauna, and address both demand and supply of illegal wildlife products15.8: By 2020, introduce measures to prevent the introduction and significantly reduce the impact of invasive alien species on land and water ecosystems, and control or eradicate the priority species15.9: By 2020, integrate ecosystem and biodiversity values into national and local planning, development processes, poverty-reduction strategies and accounts
x x x x x
15.a: Mobilize and significantly increase financial resources from all sources to conserve and sustainably use biodiversity and ecosystems
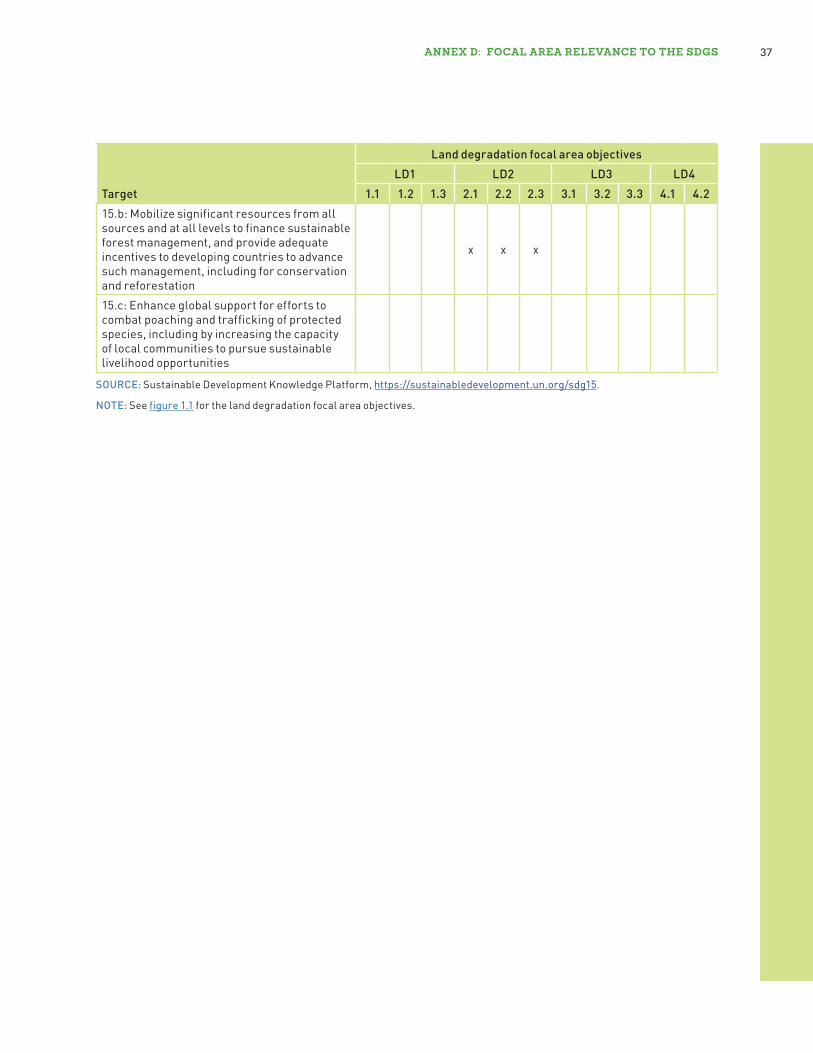
AnnEx D: FoCAL AREA RELEvAnCE to thE SDgS 37
Target
Land degradation focal area objectivesLD1 LD2 LD3 LD4
1.1 1.2 1.3 2.1 2.2 2.3 3.1 3.2 3.3 4.1 4.215.b: Mobilize significant resources from all sources and at all levels to finance sustainable forest management, and provide adequate incentives to developing countries to advance such management, including for conservation and reforestation
x x x
15.c: Enhance global support for efforts to combat poaching and trafficking of protected species, including by increasing the capacity of local communities to pursue sustainable livelihood opportunities
SOURCE: Sustainable Development Knowledge Platform, https://sustainabledevelopment.un.org/sdg15.
NOTE: See figure 1.1 for the land degradation focal area objectives.

38
Annex E: Focal area relevance to the unCCDE. annex number
UNCCD strategic objective Expected impact
Land degradation focal area objectivesLD1 LD2 LD3 LD4
1.1 1.2 1.3 2.1 2.2 2.3 3.1 3.2 3.3 4.1 4.2
1. Improved living conditions of affected populations
1.1: People living in areas affected by desertification/land degradation and drought to have an improved and more diversified livelihood base and to benefit from income generated from sustainable land management
x x x x x x x x x
1.2: Affected populations’ socioeconomic and environmental vulnerability to climate change, climate variability, and drought is reduced
x x x x x x x x x
2. Improved condition of affected ecosystems
2.1 Land productivity and other ecosystem goods and services in affected areas are enhanced in a sustainable manner, contributing to improved livelihoods
x x x x x x x x x
2.2 The vulnerability of affected ecosystems to climate change, climate variability, and drought is reduced
x x x x x x x x x
3. Genera-tion of global benefits
3.1 Sustainable land management and combating desertification/land degradation contribute to the conservation and sustainable use of biodiversity and the mitigation of climate change
x x x x x x x x x x x
4. Resource mobilization through partnerships
4.1 Increased financial, technical, and technological resources are made available to affected developing country parties and, where appropriate, Central and Eastern European countries to implement the convention4.2 Enabling policy environments are improved for UNCCD implementation at all levels
SOURCE: UNCCD 10-Year Strategic Plan and Framework, https://www.unccd.int/sites/default/files/relevant-links/2017-01/Strategy-leaflet-eng.pdf.
NOTE: See figure 1.1 for the land degradation focal area objectives.
39
Bibliography
Bai, Z. G., David Dent, Lennart Olsson, and M. E. Schaepman. 2008. “Proxy Global Assessment of Land Degradation.” Soil Use and Manage-ment 24 (3): 223–34.
Barbut, Monique. 2016. “UNCCD: Land Degrada-tion Neutrality Heralds a New Dawn for GEF and the World.” Global Environment Facility Newsroom. July 7, 2016.
Barrow, Christopher. 1991. Land Degradation: Development and Breakdown of Terrestrial Environments. Cambridge, UK: Cambridge University Press.
Benin, Samuel, Ephraim Nkonya, Geresom Okecho, John Pender, Silim Nahdy, Samuel Mugarura, Edward Kato, and Godfrey Kayobyo. 2007. “Assessing the Impact of the National Agricultural Advisory Services (NAADS) in the Uganda Rural Livelihoods.” IFPRI Discussion Paper 724. International Food Policy Research Institute, Washington, DC.
Berry, Leonard, and Jennifer Olson. 2001. “GEF Land Degradation Linkage Study.” Working Paper 6. Global Environment Facility, Wash-ington, DC.
Besley, Timothy. 1995. “Property Rights and Investment Incentives: Theory and Evidence from Ghana.” Journal of Political Economy 103 (5): 903–37.
Bonilla, Carlos A., and Odette I. Johnson. 2012. “Soil Erodibility Mapping and Its Correlation with Soil Properties in Central Chile.” Geo-derma 189–190 (November): 116–23.
Boserup, Ester. 1965. The Conditions of Agricultural Growth: The Economics of Agrarian Change under Population Pressure. New York: Aldine Press.
Brasselle, Anne-Sophie, Frédéric Gaspart, and Jean-Philippe Platteau. 2002. “Land Tenure Security and Investment Incentives: Puzzling Evidence from Burkina Faso.” Journal of Devel-opment Economics 67 (2): 373–418.
Clay, Daniel C., Fidele Usabuwera Byiringiro, Jaakko Kangasniemi, Thomas Reardon, Bosco Sibomana, Laurence Uwamariya, and David Tardif-Douglin. 1996. “Promoting Food Security in Rwanda through Sustainable Agri-cultural Productivity: Meeting the Challenges of Population Pressure, Land Degradation, and Poverty.” MSU International Development Paper 17. Michigan State University, East Lansing.
Cleaver, Kevin M., and Götz A. Schreiber. 1994. Reversing the Spiral: The Population, Agricul-ture, and Environment Nexus in Sub-Saharan Africa. Washington, DC: The World Bank.
De Janvry, Alain, Marcel Fafchamps, and Elis-abeth Sadoulet. 1991. “Peasant Household Behaviour with Missing Markets: Some Para-doxes Explained.” Economic Journal 101 (409): 1400–17.
FAO (Food and Agriculture Organization of the United Nations). 2011. State of the World‘s For-ests, 2011. FAO, Rome.

LAnD DEgRADAtIon FoCAL AREA StuDy40
Foley, Jonathan A., Ruth DeFries, Gregory P. Asner, Carol Barford, Gordon Bonan, Ste-phen R. Carpenter, F. Stuart Chapin, Michael T. Coe, Gretchen C. Daily, Holly K. Gibbs, Joseph H. Helkowski, Tracey Holloway, Erica A. Howard, Christopher J. Kucharik, Chad Monfreda, Jonathan A. Patz, I. Colin Prentice, Navin Ramankutty, and Peter K. Snyder. 2005. “Global Consequences of Land Use.” Science 309 (5734): 570–74.
Gao, Jay, and Yansui Liu. 2010. “Determination of Land Degradation Causes in Tongyu County, Northeast China via Land Cover Change Detection.” International Journal of Applied Earth Observation and Geoinformation 12 (1): 9–16.
GEF (Global Environment Facility). 2003. “Oper-ational Program on Sustainable Land Management (OP#15).” GEF, Washington, DC.
—. 2012. “Evaluation of the GEF Focal Area Strategies.” GEF Council Meeting, November 13–15, 2012. GEF, Washington, DC.
—. 2015a. Sustainable Land Management Financing in the GEF: A Primer for the Sixth Replenishment Phase (GEF-6). GEF, Washing-ton, DC, January.
—. 2015b. “GEF Annual Performance Report 2015.” 50th GEF Council Meeting, June 7–9, 2016. GEF, Washington, DC, May.
—. 2015c. “Investing in Land Stewardship.” Report of the Global Environment Facility to the Twelfth Session of the Conference of the Parties to the United Nations Convention to Combat Desertification, July 2015. GEF, Wash-ington, DC.
—. 2015d. Transforming Land Management Globally: Q&A about Land in the 6th GEF Replen-ishment Phase (GEF-6). GEF, Washington, DC.
—. 2016a. GEF Corporate Scorecard, April 2016. GEF, Washington, DC.
—. 2016b. 25 Years of the GEF. GEF, Washington, DC.
GEF IEO (Global Environment Facility Independent Evaluation Office). 2005. OPS3: Progressing toward Environmental Results, Complete Report. Third Overall Performance Study on the GEF. Washington, DC: GEF IEO.
—. 2006. The Role of Local Benefits in Global Environmental Programs. Evaluation Report 30. Washington, DC: GEF IEO.
—. 2008. GEF Annual Country Portfolio Evaluation Report 2008. Washington, DC: GEF IEO.
—. 2010. OPS4: Progress toward Impact. Fourth Overall Performance Study of the GEF Progress toward Impact. Washington, DC: GEF IEO.
—. 2013. OPS5: Fifth Overall Performance Study of the GEF. First Report: Cumulative Evidence on the Challenging Pathways to Impact. Washing-ton, DC: GEF IEO.
GEF STAP (Global Environment Facility Scientific and Technical Advisory Panel). 2006. “Land Degradation as a Global Environmental Issue: A Synthesis of Three Studies Commissioned by the Global Environment Facility to Strengthen the Knowledge Base to Support the Land Degradation Focal Area.” GEF/C.30/Inf.8. GEF, Washington, DC.
Geist, Helmut J., and Eric F. Lambin. 2004. “Dynamical Causal Patterns of Desertifica-tion.” BioScience 54 (9): 817–29.
Grepperud, Sverre. 1996. “Population Pressure and Land Degradation: The Case of Ethiopia,” Journal of Environmental Economics and Man-agement 30 (1): 18–33.
Kabubo-Mariara, Jane. 2007. “Land Conserva-tion and Tenure Security in Kenya: Boserup’s Hypothesis Revisited.” Ecological Economics 64 (1): 25–35.
Lu, D., M. Batistella, P. Mausel, and E. Moran. 2007. “Mapping and Monitoring Land Degra-dation Risks in the Western Brazilian Amazon Using Multitemporal Landsat TM/ETM+ Images.” Land Degradation and Development 18 (1): 41–54.

BIBLIogRAPhy 41
Mirzabaev, Alisher, Ephraim Nkonya, Jann Goedecke, Timothy Johnson, and Weston Anderson. 2016. “Global Drivers of Land Degradation and Improvement.” In Ephraim Nkonya, Alisher Mirzabaev, and Joachim von Braun, eds., Economics of Land Degradation and Improvement: A Global Assessment for Sustainable Development, 167–95. Springer International Publishing.
Nkonya, Ephraim, Nicolas Gerber, Philipp Baumgartner, Joachim von Braun, Alex De Pinto, Valerie Graw, Edward Kato, Julia Kloos, and Teresa Walter. 2011. “The Eco-nomics of Desertification, Land Degradation, and Drought: Toward an Integrated Global Assessment.” ZEF Discussion Papers on Development Policy 150. Center for Develop-ment Research (ZEF), Bonn.
Nkonya, Ephraim, Alisher Mirzabaev, and Joa-chim von Braun, eds. 2016. Economics of Land Degradation and Improvement: A Global Assess-ment for Sustainable Development. Dordrecht: Springer International Publishing.
Nkonya, Ephraim, John Pender, Kayuki C. Kaizzi, Edward Kato, Samuel Mugarura, Henry Ssali, and James Muwonge. 2008. “Linkages between Land Management, Land Degra-dation, and Poverty in Sub-Saharan Africa: The Case of Uganda.” Research Report 159. International Food Policy Research Institute, Washington, DC.
Nkonya, Ephraim, Dayo Phillip, Tewodaj Mogues, John Pender, Kuta Yahaya, Gbenga Adebow-ale, Tunji Arokoyo, and Edward Kato. 2010. From the Ground up: Impacts of a Pro-Poor Community-Driven Development Project in Nigeria. IFPRI Discussion Paper 756. Inter-national Food Policy Research Institute, Washington, DC.
Paudel, Giridhari. S., and Gopal B. Thapa. 2004. “Impact of Social, Institutional, and Ecological Factors on Land Management Practices in Mountain Watersheds of Nepal.” Applied Geog-raphy 24 (1): 35–55.
Pender, John L., and John M. Kerr. 1998. “Determi-nants of Farmers’ Indigenous Soil and Water Conservation Investments in Semi-Arid India.” Agricultural Economics 19, nos. 1–2 (Septem-ber), 113–25.
Pender, John, Ephraim Nkonya, Pamela Jagger, Dick Sserunkuuma, and Henry Ssali. 2006. “Strategies to Increase Agricultural Pro-ductivity and Reduce Land Degradation in Uganda: An Econometric Analysis.” In John Pender, Frank Place, and Simeon K. Ehui, eds., Strategies for Sustainable Land Management in the East African Highlands, 165–90. Washing-ton, DC: International Food Policy Research Institute.
Possingham, Hugh P., Michael Bode, and Carissa J. Klein. 2015. “Optimal Conservation Outcomes Require Both Restoration and Protection.” Plos Biology 13.1: e1002052.
Safriel, Uriel. 2017. “Land Degradation Neutrality (LDN) in Drylands and Beyond: Where Has It Come from and Where Does It Go.” Silva Fen-nica 51 (1B), article ID 1650.
Safriel, Uriel, and Zafar Adeel. 2005. “Dryland Sys-tems.” In Ecosystems and Human Well-Being: Current State and Trends, Volume 1, edited by Rashid Hassan, Robert Scholes, and Neville Ash, 623–62. Washington, DC: Island Press.
Sanwal, Mukul. 2004. “Trends in Global Envi-ronmental Governance: The Emergence of a Mutual Supportiveness Approach to Achieve Sustainable Development.” Global Environ-mental Politics 4 (4): 16–22.
Sayer, Jeffrey A., and Bruce M. Campbell. 2004. The Science of Sustainable Development: Local Livelihoods and the Global Environment. Cam-bridge, UK: Cambridge University Press.
Scherr, Sara J. 2000. “A Downward Spiral? Research Evidence on the Relationship between Poverty and Natural Resource Deg-radation.” Food Policy 25 (4): 479–98.
Scherr, Sara J., and Peter B. R. Hazell. 1994. “Sus-tainable Agricultural Development Strategies in Fragile Lands.” EPTD Discussion Paper 1. International Food Policy Research Institute, Washington, DC.

LAnD DEgRADAtIon FoCAL AREA StuDy42
Sternberg, T. 2008. “Environmental Challenges in Mongolia’s Dryland Pastoral Landscape.” Journal of Arid Environments 72 (7): 1294–304.
Svenson, Lisa. 2005. “Socio-Economic Indica-tors for Causes and Consequences of Land Degradation.” LADA Technical Paper. Food and Agriculture Organization of the United Nations, Rome.
Tiffen, Mary, Michael Mortimore, and Francis Gichuki. 1994. More People, Less Erosion: Environmental Recovery in Kenya. London, UK: Wiley and Sons.
UNEP (United Nations Environment Programme). 2016. UN Environment Annual Report 2016: Empowering People to Protect the Planet. New York: UNEP.
von Braun, Joachim, Nicolas Gerber, Alisher Mirzabaev, and Ephraim Nkonya. 2013. “The Economics of Land Degradation.” ZEF Working Paper 109. Center for Development Research (ZEF), Bonn.
Voortman, Roelf L., Ben G. J. S. Sonneveld, and Michiel A. Keyzer. 2000. “African Land Ecology: Opportunities and Constraints for Agricultural Development.” CID Working Paper 37. Cam-bridge, Mass.: Harvard University.
Way, S. A. 2006. “Examining the Links between Poverty and Land Degradation: From Blam-ing the Poor toward Recognizing the Rights of the Poor.” In Governing Global Desertification: Linking Environmental Degradation, Poverty, and Participation, edited by Pierre Marc John-son, Karel Mayrand, and Marc Paquin, 27–41. Aldershot, UK: Ashgate.
Wischmeier, W. H. 1976. “Use and Misuse of the Universal Soil Loss Equation.” Journal of Soil and Water Conservation 13 (1): 5–9.
World Bank. 2008. Sustainable Land Management Sourcebook. e- ISBN: 978-0-8213-7433-7. Washington, DC: World Bank.
Recent gEF IEo PublicationsEvaluation Reports119 Evaluation of GEF Engagement with Indigenous Peoples 2018118 Evaluation of Gender Mainstreaming in the GEF 2018117 Program Evaluation of the Special Climate Change Fund 2018116 Review of the GEF Policy on Agency Minimum Standards on Environmental and Social Safeguards 2018115 Chemicals and Waste Focal Area Study 2018114 International Waters Focal Area Study 2018113 Evaluation of Programmatic Approaches in the GEF 2018112 Review of Results-Based Management in the GEF 2017111 Evaluation of GEF Engagement with the Private Sector, Volumes 1 and 2 2017110 OPS6: The GEF in the Changing Environmental Finance Landscape – Final Report 2017109 GEF Annual Performance Report 2015 2017108 Evaluation of the GEF–Civil Society Organization Network, Volumes 1 and 2 2016107 GEF Country Portfolio Evaluation: Tajikistan (1999–2015), Volumes 1 and 2 2016106 Program Evaluation of the Least Developed Countries Fund 2016105 FEM Evaluation du Portefeuille de Pays : Maroc (1997–2015) 2016104 Impact Evaluation of GEF Support to Protected Areas and Protected Area Systems—Full Report 2016103 Impact Evaluation of GEF Support to Protected Areas and Protected Area Systems—Highlights 2015102 GEF Annual Performance Report 2014 2015101 GEF Country Portfolio Evaluation: Eritrea (1992–2012) 2015100 GEF Country Portfolio Evaluation: Tanzania (1992–2012) 201599 GEF Country Portfolio Study: Sierra Leone (1998–2013) 201598 GEF Country Portfolio Evaluation: Vanuatu and SPREP (1991–2012) 201597 Joint GEF-UNDP Evaluation of the Small Grants Programme 201596 Joint GEF–Sri Lanka Country Portfolio Evaluation (1991–2012) 201595 GEF Annual Country Portfolio Evaluation Report 2014 201594 Midterm Evaluation of the System of Transparent Allocation of Resources 201493 Midterm Evaluation of the National Portfolio Formulation Exercise 201492 GEF Annual Performance Report 2013 201491 GEF Annual Impact Report 2013 201490 Impact Evaluation on Climate Change Mitigation: GEF Support to Market Change in China, India,
Mexico and Russia2014
89 Report of the Second Professional Peer Review of the GEF Evaluation Function 201488 OPS5: Final Report: At the Crossroads for Higher Impact—Summary 201487 GEF Annual Country Portfolio Evaluation Report 2013 201486 OPS5: Final Report: At the Crossroads for Higher Impact 2014
To see all GEF Independent Evaluation Office publications, please visit our webpage.
Independent Evaluation Office Global Environment Facility1818 H Street, NW Washington, DC 20433, USAwww.gefieo.org /gefieo_tweets /gefieo
Related Documents