ACT Publication No. 11-09 Land-cover classification in a moist tropical region of Brazil with Landsat Thematic Mapper imagery G. Li, D. Lu, E.F. Moran & S. Hetrick In: International Journal of Remote Sensing, 32:23, 8207-8230 _______________________________________________________________________________________ Anthropological Center for Training and Research on Global Environmental Change Indiana University, Student Building 331, 701 E. Kirkwood Ave., 47405-7100, U.S.A. Phone: (812) 855-6181, Fax: (812) 855-3000, Email: [email protected], internet: www.indiana.edu/~act

Welcome message from author
This document is posted to help you gain knowledge. Please leave a comment to let me know what you think about it! Share it to your friends and learn new things together.
Transcript
ACT Publication No. 11-09
Land-cover classification in a moist
tropical region of Brazil with Landsat
Thematic Mapper imagery
G. Li, D. Lu, E.F. Moran & S. Hetrick
In: International Journal of Remote Sensing, 32:23, 8207-8230
_______________________________________________________________________________________
Anthropological Center for Training and Research on Global Environmental Change Indiana University, Student Building 331, 701 E. Kirkwood Ave., 47405-7100, U.S.A.
Phone: (812) 855-6181, Fax: (812) 855-3000, Email: [email protected], internet: www.indiana.edu/~act

This article was downloaded by: [Indiana University Libraries]On: 30 January 2012, At: 12:08Publisher: Taylor & FrancisInforma Ltd Registered in England and Wales Registered Number: 1072954 Registeredoffice: Mortimer House, 37-41 Mortimer Street, London W1T 3JH, UK
International Journal of RemoteSensingPublication details, including instructions for authors andsubscription information:http://www.tandfonline.com/loi/tres20
Land-cover classification in a moisttropical region of Brazil with LandsatThematic Mapper imageryGuiying Li a , Dengsheng Lu a , Emilio Moran a & Scott Hetrick aa Anthropological Center for Training and Research on GlobalEnvironmental Change (ACT), Indiana University, Bloomington,Indiana, 47405, USA
Available online: 09 Aug 2011
To cite this article: Guiying Li, Dengsheng Lu, Emilio Moran & Scott Hetrick (2011): Land-cover classification in a moist tropical region of Brazil with Landsat Thematic Mapper imagery,International Journal of Remote Sensing, 32:23, 8207-8230
To link to this article: http://dx.doi.org/10.1080/01431161.2010.532831
PLEASE SCROLL DOWN FOR ARTICLE
Full terms and conditions of use: http://www.tandfonline.com/page/terms-and-conditions
This article may be used for research, teaching, and private study purposes. Anysubstantial or systematic reproduction, redistribution, reselling, loan, sub-licensing,systematic supply, or distribution in any form to anyone is expressly forbidden.
The publisher does not give any warranty express or implied or make any representationthat the contents will be complete or accurate or up to date. The accuracy of anyinstructions, formulae, and drug doses should be independently verified with primarysources. The publisher shall not be liable for any loss, actions, claims, proceedings,demand, or costs or damages whatsoever or howsoever caused arising directly orindirectly in connection with or arising out of the use of this material.
International Journal of Remote SensingVol. 32, No. 23, 10 December 2011, 8207–8230
Land-cover classification in a moist tropical region of Brazilwith Landsat Thematic Mapper imagery
GUIYING LI*, DENGSHENG LU, EMILIO MORAN and SCOTT HETRICKAnthropological Center for Training and Research on Global Environmental Change
(ACT), Indiana University, Bloomington, Indiana 47405, USA
(Received 9 July 2010; in final form 23 September 2010)
This research aims to improve land-cover classification accuracy in a moist tropicalregion in Brazil by examining the use of different remote-sensing-derived vari-ables and classification algorithms. Different scenarios based on Landsat ThematicMapper (TM) spectral data and derived vegetation indices and textural images anddifferent classification algorithms, maximum likelihood classification (MLC), arti-ficial neural network (ANN), classification tree analysis (CTA) and object-basedclassification (OBC), were explored. The results indicate that a combination ofvegetation indices as extra bands into Landsat TM multi-spectral bands did notimprove the overall classification performance, but the combination of texturalimages was valuable for improving vegetation classification accuracy. In partic-ular, the combination of both vegetation indices and textural images into TMmulti-spectral bands improved the overall classification accuracy (OCA) by 5.6%and the overall kappa coefficient (OKC) by 6.25%. Comparison of the differentclassification algorithms indicated that CTA and ANN have poor classificationperformance in this research, but OBC improved primary forest and pasture clas-sification accuracies. This research indicates that use of textural images or use ofOBC are especially valuable for improving the vegetation classes such as uplandand liana forest classes that have complex stand structures and large patch sizes.
1. Introduction
Since the 1970s, deforestation in the Brazilian Amazon has converted a vast areaof primary forest into a mosaic of large patches of agricultural lands, pasture anddifferent stages of successional vegetation (Moran et al. 1994a, Skole et al. 1994,Lucas et al. 2000, Roberts et al. 2002, Lu et al. 2008). The unprecedented tropicaldeforestation rates have been regarded as an important factor in climate change andenvironmental degradation at regional and global scales (Skole et al. 1994). In orderto better understand the consequences of deforestation and landscape transforma-tions in the region, the timely mapping and monitoring of land-use/cover change isrequired. Remote-sensing technologies are useful tools in providing these datasets.Much research has been conducted to classify land cover, especially vegetation classes(Mausel et al. 1993, Moran et al. 1994a,b, Brondízio et al. 1996, Foody et al. 1996,Rignot et al. 1997, Yanasse et al. 1997, Lucas et al. 2002, Vieira et al. 2003, Lu et al.2004a, 2007, 2008, Lu 2005a). Different classification methods, such as traditional
*Corresponding author. Email: [email protected]
International Journal of Remote SensingISSN 0143-1161 print/ISSN 1366-5901 online © 2011 Taylor & Francis
http://www.tandf.co.uk/journalshttp://dx.doi.org/10.1080/01431161.2010.532831
Dow
nloa
ded
by [
Indi
ana
Uni
vers
ity L
ibra
ries
] at
12:
08 3
0 Ja
nuar
y 20
12

8208 G. Li et al.
pixel-based classifiers (e.g. Euclidean distance and maximum likelihood) (Foody et al.1996, Yanasse et al. 1997, Vieira et al. 2003), a combination of spectral and spatialinformation (Mausel et al. 1993, Moran et al. 1994a,b, Lu et al. 2004a) and use ofsub-pixel information (Roberts et al. 1998, Lu et al. 2003) have been examined. Castroet al. (2003) summarized many approaches using space-borne remotely sensed datato quantify successional forest classification based on biomass or age estimation. Lu(2005a) and Lu et al. (2003, 2008) summarized the major methods for mapping vege-tation types, especially successional vegetation stages with remotely sensed data in themoist tropical regions of the Brazilian Amazon.
Previous research has indicated that a major source of confusion often occursin identifying different successional stages or distinguishing between advanced sec-ondary succession and mature forest (Lu et al. 2003, 2008), since remotely sensed dataprimarily capture canopy information, and the canopy structures between advancedsecondary succession and mature forest can be very similar, although they mayhave different ages, species composition and biomass density. The smooth transitionbetween different successional stages also causes problems for vegetation classifica-tion. Therefore, previous research often provides only coarse vegetation classes suchas primary forest and successional vegetation (Adams et al. 1995, Roberts et al. 2002).However, the biomass densities of different successional stages vary considerably,ranging from less than 2 kg m−2 in initial successional vegetation to greater than 20 kgm−2 in advanced successional vegetation (Lu 2005b). The biomass densities of pri-mary forests also vary considerably, ranging from approximately 12 kg m−2 to greaterthan 50 kg m−2 in different biophysical environments. Obviously, a single class of pri-mary forest or successional vegetation is not suitable for many applications such ascarbon estimations or land degradation assessments.
Remote-sensing image classification is a complex process that involves many stepssuch as definition of a land-cover classification system, collection of data sources (e.g.reference data, different sensor data), extraction of remote-sensing variables, selectionof classification algorithm and accuracy assessment (Jensen 2004, Lu and Weng 2007).Great progress in image classification has been achieved, including: (1) the develop-ment of advanced classification algorithms (e.g. neural network, decision tree, supportvector machine, object-based algorithms and sub-pixel-based algorithms) (Tso andMather 2001, Franklin and Wulder 2002, Lu and Weng 2007, Rogan et al. 2008,Blaschke 2010), (2) the use of multi-source data in a classification process such asintegration of different spatial resolution or sensor images (Solberg et al. 1996, Pohland Van Genderen 1998, Ali et al. 2009, Ehlers et al. 2010, Zhang 2010) and the inte-gration of remote sensing and ancillary data (Harris and Ventura 1995, Williams 2001,Li 2010) and (3) the development of techniques for modifying classified images by theuse of expert knowledge (Stefanov et al. 2001, Hodgson et al. 2003, Zhang et al. 2011).
In practice, Landsat Thematic Mapper (TM) images are still the most common datasource for land-cover classification, even in moist tropical regions, due to their suitablespectral and spatial resolutions and the long-term data availability since the 1970s.Although much research related to land-cover classification has been conducted,a comprehensive analysis of the selection of variables and classification algorithms hasnot been fully investigated. Therefore, this research aims to explore how combinationsof different variables can improve land-cover classification performance and whichclassification algorithm has better classification performance in the moist tropicalregion of Brazil. This research investigates the roles of vegetation indices and texturalimages in improving vegetation classification performance based on a comparison of
Dow
nloa
ded
by [
Indi
ana
Uni
vers
ity L
ibra
ries
] at
12:
08 3
0 Ja
nuar
y 20
12
Land-cover classification 8209
accuracy assessment of the classified images and compares parametric and nonpara-metric algorithms in order to understand which classification algorithm is suitable forvegetation classification in the moist tropical region of the Brazilian Amazon, wherecomplex forest stand structure in successional vegetation and primary forest exists.Through this research, we can better understand the classification procedure, includ-ing the selection of suitable remote-sensing variables and the selection of classificationalgorithms, for the vegetation classification in the Brazilian Amazon.
2. Study area
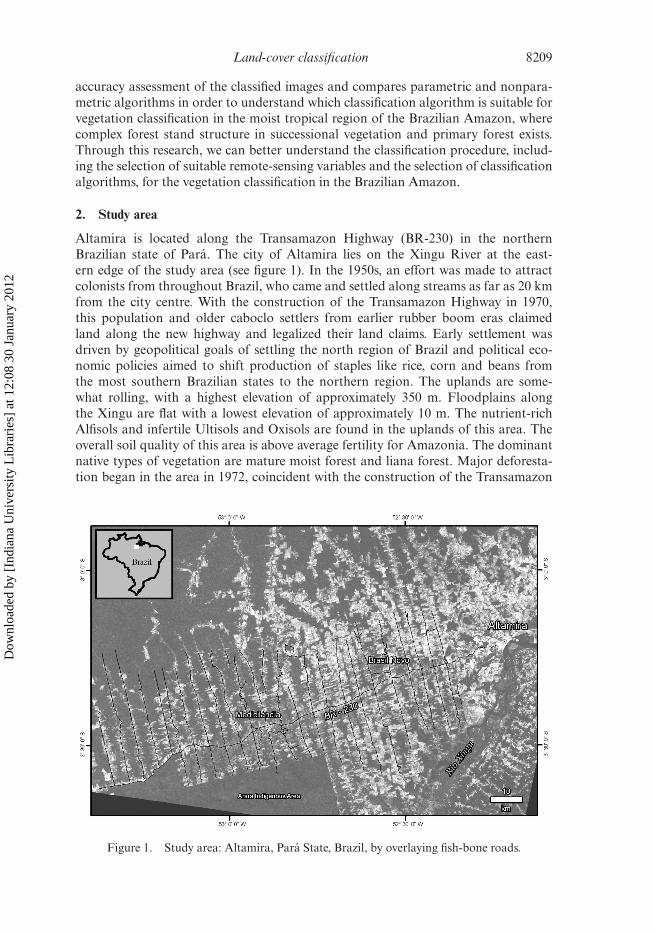
Altamira is located along the Transamazon Highway (BR-230) in the northernBrazilian state of Pará. The city of Altamira lies on the Xingu River at the east-ern edge of the study area (see figure 1). In the 1950s, an effort was made to attractcolonists from throughout Brazil, who came and settled along streams as far as 20 kmfrom the city centre. With the construction of the Transamazon Highway in 1970,this population and older caboclo settlers from earlier rubber boom eras claimedland along the new highway and legalized their land claims. Early settlement wasdriven by geopolitical goals of settling the north region of Brazil and political eco-nomic policies aimed to shift production of staples like rice, corn and beans fromthe most southern Brazilian states to the northern region. The uplands are some-what rolling, with a highest elevation of approximately 350 m. Floodplains alongthe Xingu are flat with a lowest elevation of approximately 10 m. The nutrient-richAlfisols and infertile Ultisols and Oxisols are found in the uplands of this area. Theoverall soil quality of this area is above average fertility for Amazonia. The dominantnative types of vegetation are mature moist forest and liana forest. Major deforesta-tion began in the area in 1972, coincident with the construction of the Transamazon
Figure 1. Study area: Altamira, Pará State, Brazil, by overlaying fish-bone roads.
Dow
nloa
ded
by [
Indi
ana
Uni
vers
ity L
ibra
ries
] at
12:
08 3
0 Ja
nuar
y 20
12

8210 G. Li et al.
Highway (Moran 1981). Deforestation has led to a complex composition of differ-ent vegetation types such as different succession stages and pasture (Moran et al.1994a,b, Moran and Brondízio 1998). Annual rainfall in Altamira is approximately2000 mm and is concentrated from late October through to early June; the dry periodoccurs between June and September. The average temperature is about 26◦C (Tuckeret al. 1998).
3. Methods
3.1 Data collection, organization and preprocessing
3.1.1 Field data collection and determination of a land-cover classification system.Sample plots for different land covers, especially for different stages of secondary suc-cession and pasture were collected during the summer of 2009 in the Altamira studyarea. Prior to the fieldwork, candidate sample locations of complex vegetation areaswere identified in the laboratory through visual interpretation of a Landsat 5 TMimage acquired in July 2008. As shown in figure 1, primary forest is distributed awayfrom the roads, and different stages of succession vegetation, pastures and agricul-tural lands were distributed along the main and secondary roads, forming the familiar‘fishbone’ pattern of deforestation. Because of the difficulty in accessing forested sitesin moist tropical regions like this study area, random allocation of sample plots fora field survey is not feasible. Therefore, the majority of sample plots relevant to non-forest vegetation and pastures were allocated along the roadsides. In each sample area,the locations of different vegetation cover types were recorded using a global posi-tioning system (GPS) device, while detailed descriptions of vegetation stand structure(e.g. height, canopy cover, dominant tree species) were recorded. Sketch map formswere used in conjunction with small field maps showing the candidate sample loca-tions on A4 paper to note the spatial extent and patch shape of vegetation cover typesin the area surrounding the GPS point. Following fieldwork, GPS points and fieldsurvey data were organized and stored in a data base. Geographic information sys-tems (GISs) and remote-sensing software were used to create representative regions ofinterest (ROI). ROIs were created by identifying areas of uniform pixel reflectance inan approximate 3 × 3 pixel window size on the Landsat TM imagery. Approximatelyhalf of the samples from the field survey were used for training samples for image clas-sification, and the rest were used as test samples for accuracy assessment. Meanwhile,a QuickBird image acquired in September 2008 was also used to support the selec-tion of more sample plots for use as training and test sample plots. According to theresearch objectives, compatibility with previous research work (Mausel et al. 1993,Moran et al. 1994a,b, Moran and Brondízio 1998) and field surveys, the land-coverclassification system including three forest classes (i.e. upland (UPF), flooding (FLF)and liana (LIF)), three succession stages (i.e. initial (SS1), intermediate (SS2) andadvanced (SS3)), pasture (PAS) and four non-vegetated classes (i.e. water (WAT),wetland (NVW), urban (URB) and burn scars (BUR)), were designed and used forthis research.
3.1.2 Image collection and preprocessing. A Landsat 5 TM image acquired on 2 July2008 was geometrically registered to a previously corrected Landsat 5 TM image withUTM coordinates (zone 22). The geometric error was less than 0.5 pixels. During
Dow
nloa
ded
by [
Indi
ana
Uni
vers
ity L
ibra
ries
] at
12:
08 3
0 Ja
nuar
y 20
12

Land-cover classification 8211
image-to-image registration, a nearest-neighbour resampling algorithm was used toresample the TM imagery in order to avoid a change of digital numbers and keep thesame pixel size of 30 × 30 m as the original image. An improved image-based darkobject subtraction (DOS) model was used to perform radiometric and atmosphericcorrection (Chavez 1996, Lu et al. 2002, Chander et al. 2009). The gain and offsetfor each band and sun elevation angle were obtained from the image header file. Thepath radiance for each band was identified from deep-water bodies. The geometricallycorrected and atmospherically calibrated TM image was used to develop vegetationindices and textural images.
3.2 Selection of remote-sensing variables for land-cover classification
Since the vegetation classification is especially important in this research, the objec-tive of selecting vegetation indices and textural images is to enhance the separabilityof vegetation types, especially for different primary forest classes and secondary suc-cession (SS) stages. Therefore, training samples for three forest types (UPF, FLF andLIF), three succession stages (SS1, SS2 and SS3) and pasture were selected for evaluat-ing the separability of vegetation types in order to identify suitable vegetation indicesand textural images for improving vegetation classification accuracies.
3.2.1 Selection of vegetation indices. Many vegetation indices have been used fordifferent purposes such as estimation of biophysical parameters (Bannari et al. 1995,McDonald et al. 1998). Lu et al. (2004b) examined the relationships between vegeta-tion indices and forest stand structure attributes such as aboveground biomass (AGB),average stand diameter and height in different biophysical conditions in the BrazilianAmazon. They found that vegetation indices containing TM band 5 had higher corre-lation coefficients with forest stand parameters (e.g. AGB) than those without band 5such as the normalized difference vegetation index (NDVI) in Altamira, where foreststand structure is very complex, while NDVI had a higher correlation with forest standparameters in Bragantina, where forest stand structure is much simpler. This is becausethe complex forest stand structures result in higher spectral variation in near-infraredwavelengths (TM band 4) within the forest class or the successional vegetation thanthose simple stand structures. Therefore, in this research, different vegetation indicesincluding band 5 were designed, together with the other indices summarized in table 1.
In order to identify suitable vegetation indices for improving vegetation classifica-tion performance, training sample plots for different vegetation types were selectedfrom field surveys for conducting separability analysis with the transformed divergence(TD) algorithm (Mausel et al. 1990, Landgrebe 2003). Individual vegetation indicesand combinations of two or more vegetation indices were investigated. When differentcombinations of two or more indices were tested, Lu et al. (2008) proposed to iden-tify the best combination based on TD values and correlation coefficients. However,some combinations of vegetation indices have similar TD values, thus this method can-not determine the best combination for vegetation classification. In general, a higherstandard deviation value of an image indicates higher information load, implying bet-ter performance for land-cover classification. Therefore, this research modified thepreviously used method by replacing TD with standard deviation. When the poten-tial combination of vegetation index images are selected on the basis of TD analysis,
Dow
nloa
ded
by [
Indi
ana
Uni
vers
ity L
ibra
ries
] at
12:
08 3
0 Ja
nuar
y 20
12

8212 G. Li et al.
Table 1. Vegetation indices used in the research.
VegetationNo. index Equation
1 TC1 0.304TM1+0.279TM2+0.474TM3+0.559TM4+0.508TM5+0.186TM72 TC2 −0.285TM1−0.244TM2−0.544TM3+0.704TM4+0.084TM5−0.180TM73 TC3 0.151TM1+0.197TM2+0.328TM3+0.341TM4−0.711TM5−0.457TM74 ASVI ((2NIR + 1) − √
(2NIR + 1)2 − 8(NIR − 2RED + BLUE))/25 MSAVI ((2NIR + 1) − √
(2NIR + 1)2 − 8(NIR − 2RED))/26 ND4-2 (TM4−TM2)/(TM4+TM2)7 ND4-25 (TM4−TM2−TM5)/(TM4+TM2+TM5)8 ND42-53 (TM4+TM2−TM5−TM3)/(TM4+TM2+TM5+TM3)9 ND42-57 (TM4+TM2−TM5−TM7)/(TM4+TM2+TM5+TM7)
10 ND4-35 (TM4−TM3−TM5)/(TM4+TM3+TM5)11 ND45-23 (TM4+TM5−TM2−TM3)/(TM4+TM5+TM2+TM3)12 ND4-57 (2TM4−TM5−TM7)/(TM4+TM5+TM7)13 NDVI (TM4−TM3)/(TM4+TM3)14 NDWI (TM4-TM5)/(TM4+TM5)
Note: ND, normalized difference; ASVI, atmospheric and soil vegetation index; MSAVI, mod-ified soil adjusted vegetation index; NDVI, normalized difference vegetation index; NDWI,normalized difference water index; TC, tasselled cap transform.
the best combination (C) is determined from the analysis of standard deviation andcorrelation coefficients according to equation (1):
C =n∑
i=1
Si/
∣∣∣∣∣∣
n∑
j=1
Rij
∣∣∣∣∣∣, (1)
where Si is the standard deviation of the vegetation index image i, Rij is the correlationcoefficient between two vegetation index images i and j and n is the number of vege-tation index images. A higher C value indicates a better combination of vegetationindices for vegetation classification.
3.2.2 Selection of textural images. Many texture measures have been developed andproper use of textural images has proven useful in improving land-cover classificationaccuracy (Haralick et al. 1973, Kashyap et al. 1982, Marceau et al. 1990, Augusteijnet al. 1995, Shaban and Dikshit 2001, Chen et al. 2004, Lu et al. 2008). Of the manytexture measures, grey level co-occurrence matrix (GLCM)-based textural images havebeen extensively used for land-cover classification (Marceau et al. 1990, Lu et al. 2008).Lu (2005b) has explored the roles of textural images in AGB estimation and found thattextural image based on variance with TM band 2 and a window size of 9 × 9 pixelshad a significant relationship with AGB. In another study, Lu et al. explored texturalimages in vegetation classification and found that textural images based on entropy,second moment, dissimilarity and contrast with window sizes of 7 × 7 or 9 × 9 pix-els had a better performance in Rondonia State (Lu et al. 2008). Therefore, in thisresearch, GLCM-based texture measures, variance, homogeneity, contrast, dissimilar-ity and entropy (see table 2 for their formulas) were employed with a window size of9 × 9 pixels and Landsat TM bands 2, 3, 4, 5 and 7. Separability analysis with a TDbased on selected training sample plots of different vegetation classes was used forthe selection of a potential single textural image and a combination of two or more
Dow
nloa
ded
by [
Indi
ana
Uni
vers
ity L
ibra
ries
] at
12:
08 3
0 Ja
nuar
y 20
12

Land-cover classification 8213
Table 2. Texture measures used in the research.
No. Texture measures Formula
1 Variance (VAR) VAR =N−1∑i,j=0
Pi,j(i − ME)2
2 Homogeneity (HOM) HOM =N−1∑i,j=0
Pi,j1+(i−j)2
3 Contrast (CON) CON =N−1∑i,j=0
Pi,j(i − j)2
4 Dissimilarity (DIS) DIS =N−1∑i,j=0
Pi,j|i − j|
5 Entropy (ENT) ENT =N−1∑i,j=0
Pi,j(− lnPi,j)
Note: Pi,j = Vi,j/N−1∑i,j=0
Vi,j, ME =N−1∑i,j=0
i(Pi,j), where Vi,j is the
value in cell i, j (row i and column j) of the moving windowand N is the number of rows or columns.
textural images. When two or more textural images were selected, correlation coeffi-cients between textural images and the standard deviation of each textural image wereused to identify the C according to equation (1).
3.3 Land-cover classification
Four classification algorithms, maximum likelihood classification (MLC), artificialneural network (ANN), classification tree analysis (CTA) and object-based classifica-tion (OBC) were selected in this research. In order to identify a suitable classificationalgorithm, the classification results from the four algorithms based on original TMsix spectral bands and the C of spectral bands, vegetation indices and textural imageswere analysed, for which the same training and test samples were used. A total of 254sample plots (over 3500 pixels) covering the 11 land covers, where each land cover had15–30 plots, were used for each classification algorithm.
3.3.1 Maximum likelihood classification (MLC). MLC is the most common para-metric classifier that assumes normal or near-normal spectral distribution for eachfeature of interest and an equal prior probability among the classes. This classifier isbased on the probability that a pixel belongs to a particular class. It takes the vari-ability of classes into account by using the covariance matrix. A detailed descriptionof MLC can be found in many textbooks (e.g. Richards and Jia 1999, Lillesand andKiefer 2000, Jensen 2004). In this research, MLC was used to conduct land-cover clas-sification based on different scenarios in order to explore the roles of vegetation indicesand textural images in improving land cover, especially vegetation classification in themoist tropical region. The scenarios included: (1) TM six spectral bands, (2) selectedvegetation indices, (3) selected textural images, (4) combination of selected vegetationindices and textural images, (5) combination of spectral bands and vegetation indices,(6) combination of spectral bands and textural images and (7) combination of spectralbands, vegetation indices and textural images. These classification results were evalu-ated with accuracy assessment methods. The best scenario was further analysed with
Dow
nloa
ded
by [
Indi
ana
Uni
vers
ity L
ibra
ries
] at
12:
08 3
0 Ja
nuar
y 20
12

8214 G. Li et al.
nonparametric classification algorithms, as well as the TM spectral bands for the sakeof comparison.
3.3.2 Artificial neural networks (ANNs). ANNs have gained great interest as a clas-sification technique during past decades (Bischof et al. 1992, Paola and Schowengerdt1995, Bruzzone et al. 1997, Kanellopoulos and Wilkinson 1997) because no assump-tions about a feature’s distribution (distribution free) and no a priori knowledge aboutthe statistical characteristics of feature class data are required. Of the different neural-network models, the multi-layer perceptron (MLP) trained by a back propagation (BP)algorithm is one of the most widely used models (Kanellopoulos and Wilkinson 1997,Tso and Mather 2001). Typically, an MLP consists of one input layer, one output layerand one or more hidden layers. Each layer contains neurons, and each neuron is con-nected to every neuron in the adjacent layers by a weighted connection. In general, asingle hidden layer MLP is approximate for most classification problems. The numberof neurons in the input layer and output layer are determined by the number of layersof images used for classification and the number of categories in classification results,respectively. However, the number of neurons in hidden layers is not straightforwardto define. It requires lengthy experiments in combining with other parameters such aslearning rate, number of iterations and momentum factor to produce the best results.In this research, MLP was conducted using a sigmoid activation function.
3.3.3 Classification tree analysis (CTA). CTA is a nonparametric statisticalmachine learning algorithm, having such advantages as distribution free and easyinterpretation over traditional supervised classifiers, and thus has received increas-ing attention in remote-sensing classification (Hansen et al. 1996, Friedl and Brodley1997, Zambon et al. 2006). The basic concept of a classification tree is to split a datasetinto homogeneous subgroups based on measured attributes. The tree is composed ofa root node, representing variables or attributes, a set of internal nodes (branches),representing attribute values used to split, and a set of terminal nodes (leaves), rep-resenting classes. Each node makes a binary decision that separates either one classor some of the classes from the remaining classes. The processing starts at the rootand follows the branches until the leaf node is reached. This is known as a top-downapproach. Different splitting rules were used in previous studies (Zambon et al. 2006).In this research, three types of splitting rules, ratio, entropy and Gini, were examined.The training samples were used to grow classification trees, and the whole image wasthen classified with them. Based on experimentation, the ratio-splitting method wasselected for this research.
3.3.4 Object-based classification (OBC). Per-pixel-based classification algorithmsoften result in a salt-and-pepper effect in the classified image. In order to reducethis problem, different techniques have been used, including image processing (e.g.low-pass filter, texture analysis) (Gong 1994, Hill and Foody 1994), contextual clas-sification (Gong and Howarth 1992) and post-classification processing (e.g. modefiltering, morphological filtering, rule-based processing and probabilistic relaxation)(Shackelford and Davis 2003, Sun et al. 2003). OBC provides a useful alternativecompared to the traditional per-pixel methods because it classifies a remotely sensedimage based on image segments. Segmentation is the process partitioning images into
Dow
nloa
ded
by [
Indi
ana
Uni
vers
ity L
ibra
ries
] at
12:
08 3
0 Ja
nuar
y 20
12
Land-cover classification 8215
isolated objects so that each object shares a homogeneous spectral similarity. Theseobjects better represent the landscape than the original pixels do. The homogeneousobjects are then analysed using traditional classification methods such as minimumdistance and MLC (Jensen 2004, Lu et al. 2010). Different image-segmentation algo-rithms, such as Split and Merge, Watershed, K-means, Finite Gaussian Mixture andMarkov Random Field, have been developed (Yu et al. 2006, Blaschke 2010). TheWatershed delineation approach was used in this study. The classification processconsists of three steps: (1) image segmentation, a moving window assesses spectralsimilarity across space and over all input bands, and segments are defined based onuser-specified similarity thresholds, (2) creation of training sites and signature classesbased on image segments and (3) classification of the segments. This is carried out withthe assistance of a reference image, which is an already classified image and which isused to assign the majority class within each segment. Training sites (polygons), whichcoincide with the sample sites used in MLC, ANN and CTA, were selected on thesegmented image. The classified image from MLC was used as a reference image.
3.4 Accuracy assessment
A common method for accuracy assessment is through the use of an error matrix.An error matrix can provide a detailed assessment of the agreement between the clas-sified result and reference data and provide information of how the misclassificationhappened (Congalton and Green 2008). In addition, different accuracy assessmentparameters, such as overall classification accuracy (OCA), producer’s accuracy (PA),user’s accuracy (UA) and overall kappa coefficient (OKC), can be calculated from theerror matrix, as previous literature has described (e.g. Congalton 1991, Smits et al.1999, Foody 2002, 2004, Wulder et al. 2006, Congalton and Green 2008, Foody 2009).OCA considers only the total number of correctly classified class without taking intoaccount the omission and commission errors, thus it does not reveal whether errorswere evenly distributed between classes or whether some classes were really bad andsome really good. The OKC is a measure of overall statistical agreement of an errormatrix, which takes non-diagonal elements into account. Kappa analysis is recog-nized as a powerful method for analysing a single error matrix and for comparingthe differences between various error matrices (Congalton 1991, Smits et al. 1999,Foody 2002, 2004). Both OCA and OKC reflect the overall classification situation,which cannot provide the reliability of some land-cover classes of interest; thus, PAand UA for each land-cover class are often used to provide a complementary anal-ysis of the accuracy assessment. In this study, a total of 338 test sample plots fromthe field survey and the QuickBird image were used for accuracy assessment. An errormatrix was developed for each classified image and then PA and UA for each classand OCA and OKC for each classified image were calculated from the correspondingerror matrix.
4. Results
4.1 Identification of vegetation indices and textural images
The separabiltiy analysis based on training samples indicated that the single veg-etation index such as ND4-25, TC2, ND42-53, ND4-35 and TC3 and the singletextural images from the dissimilarity on TM band 2 or band 3 (TM2-DIS, TM3-DIS), contrast on TM band 2 (TM2-CON) and homogeneity on TM band 2 or band 3
Dow
nloa
ded
by [
Indi
ana
Uni
vers
ity L
ibra
ries
] at
12:
08 3
0 Ja
nuar
y 20
12

8216 G. Li et al.
Table 3. Summary of potential vegetation indices and textural images.
Potential bands Best band
Vegetationindices
Single ND4-25, TC2, ND42-53, ND4-35 and TC3
Combination TC2 with any of the following: TC3, ND42-53,ND42-57, ND4-57, ND4-35, NDWI,ND42-53, ND4-25; ND42-57 with ND4-2,ND4-25, ND42-53, ND4-35 and NDWI;TC1 with TC3, ND4-25, ND42-53,ND42-57, ND4-37 and NDWI.
TC2 andND42-57
Texturalimages
Single TM2 or TM3-DIS, TM2-CON, TM2 or TM3-HOM
Combination TM2-DIS with all texture measures based onbands TM3, 4, 5 and 7; TM2-HOM withTM4-CON or DIS, TM7-CON or DIS;TM2-CON with TM4-CON or DIS,TM7-CON or DIS; TM3-DIS with TM4,TM5 and TM7- HOM, CON and DIS
TM2-DIS andTM4-DIS
Note: The formulas for vegetation indices and texture measures are summarized in tables 1and 2.
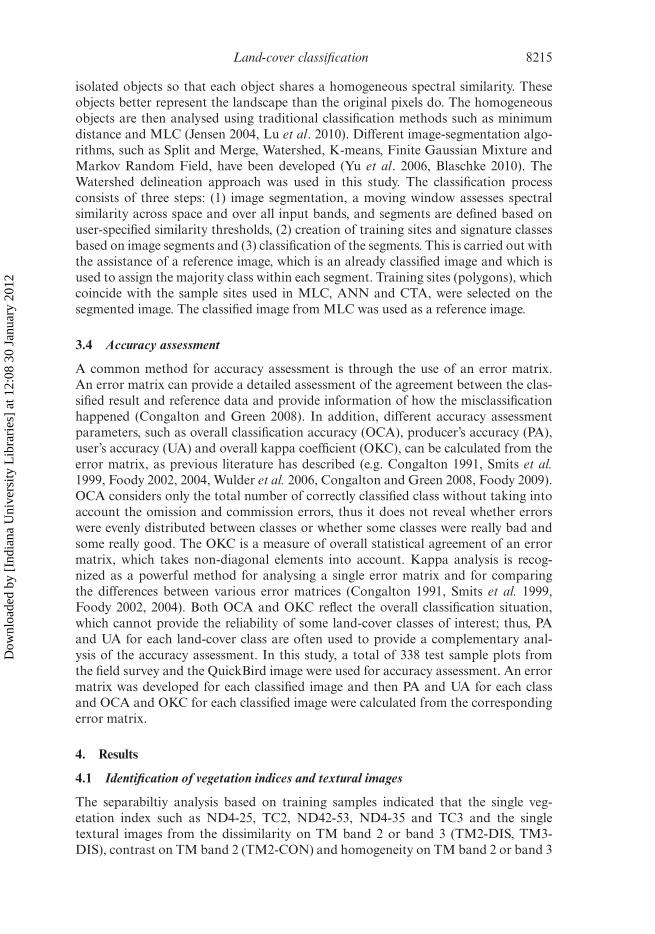
(TM2-HOM or TM3-HOM) (see table 3) have relatively high TD values, but no singlevegetation index or textural image can successfully separate these vegetation types.According to the separability analysis and the C value, a combination of two vegeta-tion indices or two textural images provided the best results for vegetation separability.The combination of three or more vegetation indices or textural images did not sig-nificantly improve the vegetation separability, a similar conclusion to our previousresearch (Lu et al. 2008). According to the analysis of the C value, the C for two vege-tation indices was TC2 and ND42-57 and the C for two textural images was TM2-DISand TM4-DIS (dissimilarity based on TM band 2 and band 4). Figure 2 provides acomparison of TM spectral bands, two selected vegetation indices and textural images,showing the different features for vegetation types, especially between spectral bandsand textural images.
4.2 Accuracy assessment of land-cover classification images based on MLC andanalysis of the roles of vegetation indices and textural images in improving land-coverclassification accuracy
The accuracy assessment result from Landsat TM six spectral bands with MLC (seetable 4) indicated that the major errors were due to the confusions of vegetation typessuch as among the three forest classes (i.e. UPF, FLF and LIF) and among SS2, SS3,LIF and UPF. URB is also confused with WAT and NVW because URB is oftena complex landscape and dark impervious surfaces in urban landscape have similarspectral signatures with WAT and/or NVW. Although the TD analysis indicated thatthe selected combination of two vegetation indices or two textural images was opti-mal for vegetation separation based on training sample plots, the accuracy assessmentshowed that their overall accuracies (i.e. OCA and OKC) were much lower than fromthe classification results based on six spectral bands (see table 5). However, the clas-sification accuracy showed that the combination of vegetation indices and texturalimages improved classification performance, with similar OCA as the TM six spectral
Dow
nloa
ded
by [
Indi
ana
Uni
vers
ity L
ibra
ries
] at
12:
08 3
0 Ja
nuar
y 20
12
Land-cover classification 8217
Figure 2. A comparison of TM band 4, band 5, two vegetation indices and two texturalimages. (a), (b) TM bands 4 and 5; (c), (d) the second component from tasselled cap trans-formation and the vegetation index based on bands 4, 2, 5 and 7; (e), (f ) textural images basedon dissimilarity on band 2 and band 4 and window size of 9 × 9 pixels.
bands. In particular, this combination improved classification performance for forestclasses, that is, UPF, FLF and LIF.
The combination of vegetation indices as extra bands into TM multi-spectral bandshad a limited role in improving overall classification performance, but was helpful in
Dow
nloa
ded
by [
Indi
ana
Uni
vers
ity L
ibra
ries
] at
12:
08 3
0 Ja
nuar
y 20
12

8218 G. Li et al.
Tab
le4.
Err
orm
atri
xfr
omM
LC
base
don
the
Lan
dsat
TM
six
spec
tral
band
s.
UP
FF
LF
LIF
SS1
SS2
SS3
PAS
WA
TN
VW
UR
BB
UR
RT
CT
PAU
A
UP
F20
10
00
00
00
00
2154
37.0
95.2
FL
F15
150
00
00
00
00
3016
93.8
50.0
LIF
130
420
43
00
10
063
4495
.566
.7SS
11
00
211
011
00
00
3425
84.0
61.8
SS2
00
02
190
00
00
021
2867
.990
.5SS
35
00
04
260
00
00
3529
89.7
74.3
PAS
00
02
00
550
10
058
6683
.394
.8W
AT
00
00
00
015
00
015
2268
.210
0N
VW
00
00
00
00
70
07
1353
.910
0U
RB
00
00
00
07
427
038
2710
071
.1B
UR
00
20
00
00
00
1416
1410
087
.5O
CA
=77
.2%
,OK
C=
0.74
5
Not
e:R
Tan
dC
Tre
pres
ent
row
tota
land
colu
mn
tota
l;U
Aan
dPA
repr
esen
tus
er’s
accu
racy
(%)
and
prod
ucer
’sac
cura
cy(%
);O
CA
and
OK
Cre
pres
ent
over
allc
lass
ifica
tion
accu
racy
(%)
and
over
allk
appa
coef
ficie
nt.
Dow
nloa
ded
by [
Indi
ana
Uni
vers
ity L
ibra
ries
] at
12:
08 3
0 Ja
nuar
y 20
12

Land-cover classification 8219
Tab
le5.
Com
pari
son
ofac
cura
cyas
sess
men
tre
sult
sam
ong
diff
eren
tsc
enar
ios
base
don
ML
C.
6SB
2VI
2TX
2VI&
2TX
6SB
&2V
I6S
B&
2TX
6SB
&2V
I&2T
X
Lan
dco
ver
PAU
APA
UA
PAU
APA
UA
PAU
APA
UA
PAU
A
UP
F37
.095
.218
.566
.761
.161
.166
.775
.024
.292
.966
.778
.366
.778
.3F
LF
93.8
50.0
100
37.2
0.0
0.0
100
72.7
100
41.0
100
66.7
100
69.6
LIF
95.5
66.7
95.5
59.2
77.3
30.6
86.4
67.9
95.5
63.6
81.8
66.7
84.1
69.8
SS1
84.0
61.8
64.0
48.5
36.0
34.6
92.0
52.3
80.0
64.5
92.0
57.5
92.0
59.0
SS2
67.9
90.5
46.4
65.0
3.6
14.3
50.0
82.4
67.9
86.4
78.6
95.7
82.1
92.0
SS3
89.7
74.3
82.8
75.0
00
72.4
65.6
86.2
75.8
79.3
85.2
86.2
89.3
PAS
83.3
94.8
75.8
86.2
54.6
51.4
69.7
95.8
86.4
95.0
75.8
96.2
77.3
98.1
WA
T68
.210
010
010
050
.073
.310
010
095
.510
072
.710
095
.510
0N
VW
53.9
100
38.5
100
0.0
0.0
38.5
83.3
69.2
90.0
69.2
100
53.9
87.5
UR
B10
071
.192
.696
.210
081
.810
096
.410
010
010
079
.410
010
0B
UR
100
87.5
78.6
84.6
28.6
21.1
85.7
80.0
92.9
86.7
92.9
100
100
87.5
OC
A77
.269
.245
.976
.977
.580
.282
.8O
KC
0.74
50.
656
0.37
80.
741
0.74
90.
777
0.80
7
Not
e:SB
,VI
and
TX
repr
esen
tTM
mul
ti-s
pect
ralb
ands
,veg
etat
ion
indi
ces
and
text
ural
imag
es;U
Aan
dPA
repr
esen
tuse
r’sac
cura
cy(%
)and
prod
ucer
’sac
cura
cy(%
);O
CA
and
OK
Cre
pres
ent
over
allc
lass
ifica
tion
accu
racy
(%)
and
over
allk
appa
coef
ficie
nt.
Dow
nloa
ded
by [
Indi
ana
Uni
vers
ity L
ibra
ries
] at
12:
08 3
0 Ja
nuar
y 20
12

8220 G. Li et al.
improving the separability of PAS, WAT and URB from other land covers; in contrast,the combination of textural images into spectral bands was valuable for improvingvegetation classification accuracy, especially for UPF, FLF, SS2 and SS3 and improvedOCA by 3%, as indicated in table 5. The high correlation between vegetation indicesand spectral bands, as shown in table 6, limited the role of vegetation indices in improv-ing vegetation classification accuracy. The second component (TC2) from the tasselledcap (TC) transform mainly represented the vegetation information, as indicated in theconstants in the TC transform (see table 1), which had very high correlation with thenear-infrared band (0.83), while the ND42-57 image had a strongly negative correla-tion with visible bands (bands 1–3) and shortwave infrared bands (bands 5 and 7),which mainly reflected the overall brightness, good for separation of non-vegetationclasses. In contrast, textural images, either based on TM band 2 or band 4, had rela-tively low correlation with spectral signatures, thus, incorporation of textural imagesimproved land-cover classification performance.
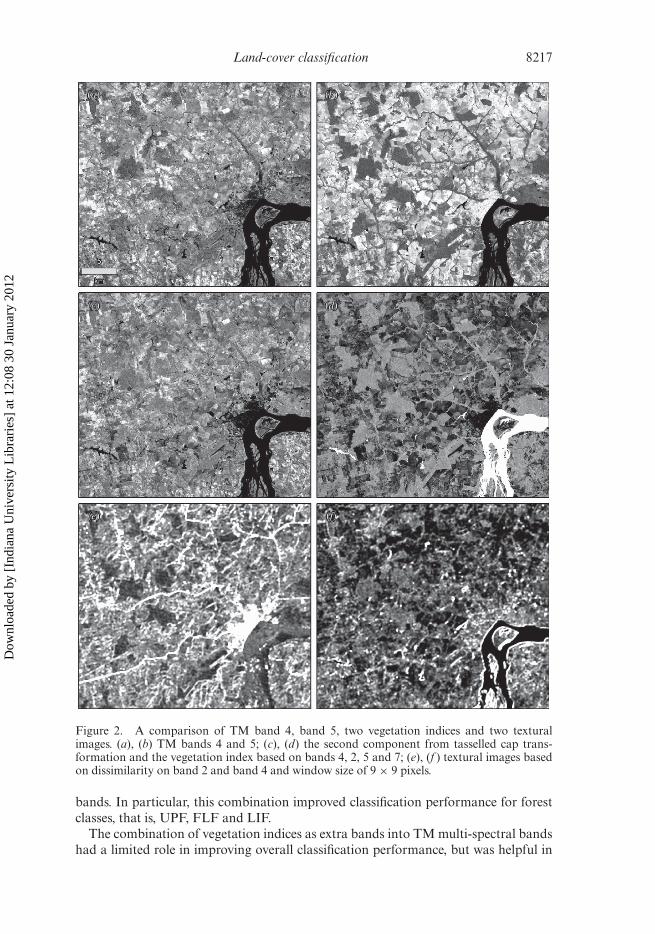
The combination of both vegetation indices and textural images with multi-spectralbands provided the best classification performance, with OCA and OKC increasedby 5.6% and 6.2%, respectively, compared with the result from MLC on the TMmulti-spectral bands (see table 5). However, even in this best scenario, that is, thecombination of vegetation indices and textural images into multi-spectral bands, highconfusion still existed between UPF, FLF and LIF among different successional stagesand between SS2, SS3 and forest classes (see table 7). Figure 3 provides a compari-son of classification results among the four scenarios. It indicates that use of texturalimages (see figure 3(c) and (d)) reduced the salt-and-pepper effect in the classifiedimage, which is often a problem with per-pixel-based classification methods. Thisresearch implies that use of textural images can reduce the heterogeneity of forest standstructure, thus improving the vegetation classification accuracies.
4.3 Analysis of land-cover classification results among different classificationalgorithms
The comparison of accuracy assessment results among different classification algo-rithms (see table 8) indicates that the OBC and MLC outperformed CTA and MLPfor both datasets. In particular, OBC provided the best classification accuracy and theMLP provided the poorest accuracy. Table 8 indicates that the OBC was especiallyvaluable for the forest classes (i.e. UPF, FLF and LIF) and pasture whose patchsize was relatively large; in contrast, this method did not improve the classificationperformance of secondary succession (SS) stages (i.e. SS1, SS2, SS3) because of theirrelatively small patch size. Table 8 also indicates the importance of using both thevegetation indices and textural images in improving land-cover classification perfor-mance, no matter what classification algorithms were used. Figure 4 shows part of theclassified images based on these four classification algorithms from the combinationof spectral bands, vegetation indices and textural images. Visual interpretation of theclassified images by comparing with the TM colour composite indicates that the CTAoverestimated forest but underestimated SS, while MLP obviously underestimated SSclasses.
5. Discussion
5.1 Selection of suitable variables for land-cover classification
Much previous research has shown the importance of using textural images in improv-ing land-cover classification accuracies (Kurosu et al. 2001, Shaban and Dikshit 2001,
Dow
nloa
ded
by [
Indi
ana
Uni
vers
ity L
ibra
ries
] at
12:
08 3
0 Ja
nuar
y 20
12

Land-cover classification 8221
Tab
le6.
Cor
rela
tion
coef
ficie
nts
betw
een
sele
cted
imag
es.
B1
B2
B3
B4
B5
B7
TC
2N
D42
-57
B2-
DIS
B4-
DIS
B1
1.00
0.91
0.91
0.41
0.85
0.86
−0.1
4−0
.71
0.51
−0.2
1B
20.
911.
000.
940.
520.
910.
88−0
.03
−0.6
80.
54−0
.27
B3
0.91
0.94
1.00
0.33
0.88
0.89
−0.2
5−0
.78
0.55
−0.2
4B
40.
410.
520.
331.
000.
600.
380.
83−0
.01
0.21
−0.2
4B
50.
850.
910.
880.
601.
000.
960.
09−0
.78
0.48
−0.3
3B
70.
860.
880.
890.
380.
961.
00−0
.16
−0.9
00.
50−0
.28
TC
2−0
.14
−0.0
3−0
.25
0.83
0.09
−0.1
61.
000.
47−0
.11
−0.1
1N
D42
-57
−0.7
1−0
.68
−0.7
8−0
.01
−0.7
8−0
.90
0.47
1.00
−0.4
40.
22B
2-D
IS0.
510.
540.
550.
210.
480.
50−0
.11
−0.4
41.
000.
17B
4-D
IS−0
.21
−0.2
7−0
.24
−0.2
4−0
.33
−0.2
8−0
.11
0.22
0.17
1.00
Not
e:B
1–B
7re
pres
ent
TM
band
sfr
om1
to7,
exce
pt6
for
the
ther
mal
band
;TC
2an
dN
D42
-57
repr
esen
ttw
ove
geta
tion
indi
ces;
B2-
DIS
and
B4-
DIS
repr
esen
ttw
ote
xtur
alim
ages
.
Dow
nloa
ded
by [
Indi
ana
Uni
vers
ity L
ibra
ries
] at
12:
08 3
0 Ja
nuar
y 20
12

8222 G. Li et al.
Tab
le7.
Err
orm
atri
xfr
omth
eM
LC
onth
eco
mbi
nati
onof
spec
tral
sign
atur
e,ve
geta
tion
indi
ces
and
text
ural
imag
es.
UP
FF
LF
LIF
SS1
SS2
SS3
PAS
WA
TN
VW
UR
BB
UR
RT
CT
PAU
A
UP
F36
05
00
30
02
00
4654
66.7
78.3
FL
F5
162
00
00
00
00
2316
100
69.6
LIF
110
370
31
00
10
053
4484
.169
.8SS
11
00
230
015
00
00
3925
92.0
59.0
SS2
00
02
230
00
00
025
2882
.192
.0SS
31
00
02
250
00
00
2829
86.2
89.3
PAS
00
00
00
510
10
052
6677
.398
.1W
AT
00
00
00
021
00
021
2295
.510
0N
VW
00
00
00
01
70
08
1353
.987
.5U
RB
00
00
00
00
027
027
2710
010
0B
UR
00
00
00
00
20
1416
1410
087
.5
Not
e:C
Tan
dR
Tre
pres
ent
colu
mn
and
row
tota
l;PA
and
UA
repr
esen
tpr
oduc
er’s
and
user
’sac
cura
cy(%
).
Dow
nloa
ded
by [
Indi
ana
Uni
vers
ity L
ibra
ries
] at
12:
08 3
0 Ja
nuar
y 20
12
Land-cover classification 8223
Figure 3. Comparison of classification results among different scenarios with maximum likeli-hood classifier: (a) six TM spectral bands, (b) combination of spectral bands and two vegetationindices, (c) combination of spectral bands and two textural images and (d) combination ofspectral bands, two vegetation indices and two textural images. (In order to clearly show theland-cover distribution, three forest classes and three SS classes were merged as forest and SS inthis figure.)
Narasimha Rao et al. 2002, Podest and Saatchi 2002, Butusov 2003, Lu et al. 2008).This research confirms the value of using textural images from Landsat TM datafor improving vegetation classification performance in moist tropical regions. Onecritical step in a study is to identify suitable textural images that can provide thebest separability for the specific classes. Selection of suitable textural images can bechallenging because textures vary with the characteristics of the landscape under inves-tigation and images used. In particular, the selection of a suitable size of movingwindow is important for the creation of a textural image, but no window size is per-fect for all vegetation types because the patch sizes of the vegetation types can varygreatly, from less than 1 ha for some successional vegetation to hundreds of hectaresfor primary forests. Therefore, there are tradeoffs among moving window size, spa-tial resolution of images and the patch sizes of vegetation types of interest on theground. For the selection of a single textural image, one can select a best texturalimage based on the highest separability value with the separability analysis, but forthe selection of two or more textural images, the C approach provides an easy methodto identify the suitable combination of textural images that can be used for improvingclassification performance.
Dow
nloa
ded
by [
Indi
ana
Uni
vers
ity L
ibra
ries
] at
12:
08 3
0 Ja
nuar
y 20
12
8224 G. Li et al.
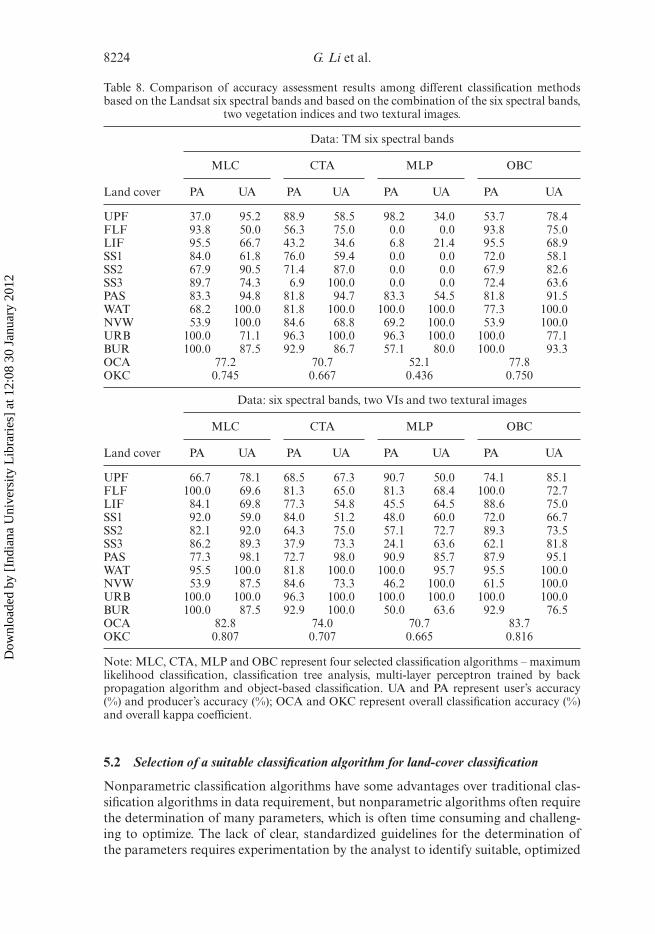
Table 8. Comparison of accuracy assessment results among different classification methodsbased on the Landsat six spectral bands and based on the combination of the six spectral bands,
two vegetation indices and two textural images.
Data: TM six spectral bands
MLC CTA MLP OBC
Land cover PA UA PA UA PA UA PA UA
UPF 37.0 95.2 88.9 58.5 98.2 34.0 53.7 78.4FLF 93.8 50.0 56.3 75.0 0.0 0.0 93.8 75.0LIF 95.5 66.7 43.2 34.6 6.8 21.4 95.5 68.9SS1 84.0 61.8 76.0 59.4 0.0 0.0 72.0 58.1SS2 67.9 90.5 71.4 87.0 0.0 0.0 67.9 82.6SS3 89.7 74.3 6.9 100.0 0.0 0.0 72.4 63.6PAS 83.3 94.8 81.8 94.7 83.3 54.5 81.8 91.5WAT 68.2 100.0 81.8 100.0 100.0 100.0 77.3 100.0NVW 53.9 100.0 84.6 68.8 69.2 100.0 53.9 100.0URB 100.0 71.1 96.3 100.0 96.3 100.0 100.0 77.1BUR 100.0 87.5 92.9 86.7 57.1 80.0 100.0 93.3OCA 77.2 70.7 52.1 77.8OKC 0.745 0.667 0.436 0.750
Data: six spectral bands, two VIs and two textural images
MLC CTA MLP OBC
Land cover PA UA PA UA PA UA PA UA
UPF 66.7 78.1 68.5 67.3 90.7 50.0 74.1 85.1FLF 100.0 69.6 81.3 65.0 81.3 68.4 100.0 72.7LIF 84.1 69.8 77.3 54.8 45.5 64.5 88.6 75.0SS1 92.0 59.0 84.0 51.2 48.0 60.0 72.0 66.7SS2 82.1 92.0 64.3 75.0 57.1 72.7 89.3 73.5SS3 86.2 89.3 37.9 73.3 24.1 63.6 62.1 81.8PAS 77.3 98.1 72.7 98.0 90.9 85.7 87.9 95.1WAT 95.5 100.0 81.8 100.0 100.0 95.7 95.5 100.0NVW 53.9 87.5 84.6 73.3 46.2 100.0 61.5 100.0URB 100.0 100.0 96.3 100.0 100.0 100.0 100.0 100.0BUR 100.0 87.5 92.9 100.0 50.0 63.6 92.9 76.5OCA 82.8 74.0 70.7 83.7OKC 0.807 0.707 0.665 0.816
Note: MLC, CTA, MLP and OBC represent four selected classification algorithms – maximumlikelihood classification, classification tree analysis, multi-layer perceptron trained by backpropagation algorithm and object-based classification. UA and PA represent user’s accuracy(%) and producer’s accuracy (%); OCA and OKC represent overall classification accuracy (%)and overall kappa coefficient.
5.2 Selection of a suitable classification algorithm for land-cover classification
Nonparametric classification algorithms have some advantages over traditional clas-sification algorithms in data requirement, but nonparametric algorithms often requirethe determination of many parameters, which is often time consuming and challeng-ing to optimize. The lack of clear, standardized guidelines for the determination ofthe parameters requires experimentation by the analyst to identify suitable, optimized
Dow
nloa
ded
by [
Indi
ana
Uni
vers
ity L
ibra
ries
] at
12:
08 3
0 Ja
nuar
y 20
12
Land-cover classification 8225
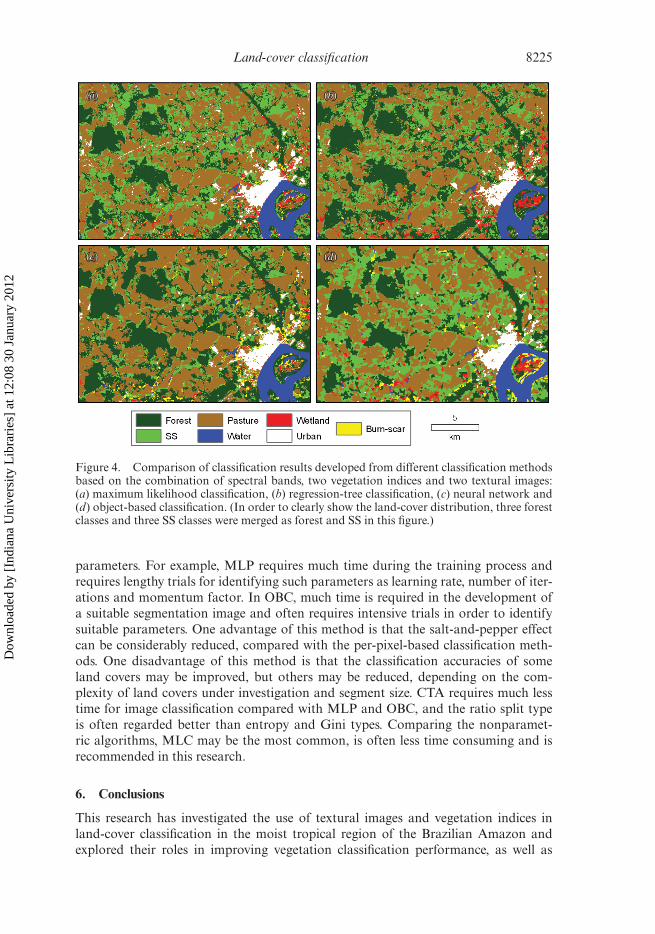
Figure 4. Comparison of classification results developed from different classification methodsbased on the combination of spectral bands, two vegetation indices and two textural images:(a) maximum likelihood classification, (b) regression-tree classification, (c) neural network and(d) object-based classification. (In order to clearly show the land-cover distribution, three forestclasses and three SS classes were merged as forest and SS in this figure.)
parameters. For example, MLP requires much time during the training process andrequires lengthy trials for identifying such parameters as learning rate, number of iter-ations and momentum factor. In OBC, much time is required in the development ofa suitable segmentation image and often requires intensive trials in order to identifysuitable parameters. One advantage of this method is that the salt-and-pepper effectcan be considerably reduced, compared with the per-pixel-based classification meth-ods. One disadvantage of this method is that the classification accuracies of someland covers may be improved, but others may be reduced, depending on the com-plexity of land covers under investigation and segment size. CTA requires much lesstime for image classification compared with MLP and OBC, and the ratio split typeis often regarded better than entropy and Gini types. Comparing the nonparamet-ric algorithms, MLC may be the most common, is often less time consuming and isrecommended in this research.
6. Conclusions
This research has investigated the use of textural images and vegetation indices inland-cover classification in the moist tropical region of the Brazilian Amazon andexplored their roles in improving vegetation classification performance, as well as
Dow
nloa
ded
by [
Indi
ana
Uni
vers
ity L
ibra
ries
] at
12:
08 3
0 Ja
nuar
y 20
12

8226 G. Li et al.
different classification algorithms. The results indicated that combination of vege-tation indices as extra bands into Landsat TM multi-spectral bands has a limitedrole, but the combination of textural images was valuable for improving vegetationclassification accuracy. If both vegetation indices and textural images were combinedwith TM multi-spectral bands, OCA can be improved by 5.6% and OKC by 6.25%.Comparison of the different classification algorithms indicated that CTA and MLPhave a poor classification performance in this research, but OBC improved primaryforest and pasture classification accuracies. This research indicates that use of textu-ral images or use of OBC are especially valuable for improving the vegetation classes,such as UPF and LIF, that have complex stand structures and relatively large patchsizes. This research is valuable for guiding the selection of remote-sensing variablesand classification algorithms for vegetation classification in moist tropical regions.
AcknowledgementsThe authors thank the National Institute of Child Health and Human Developmentat NIH (grant #R01 HD035811) and the National Science Foundation (grant #BCS0850615) for support of this research. The authors also thank Anthony Cak for helpin field data collection.
ReferencesADAMS, J.B., SABOL, D.E., KAPOS, V., FILHO, R.A., ROBERTS, D.A., SMITH, M.O. and
GILLESPIE, A.R., 1995, Classification of multispectral images based on fractions of end-members: application to land-cover change in the Brazilian Amazon. Remote Sensingof Environment, 52, pp. 137–154.
ALI, S.S., DARE, P.M. and JONES, S.D., 2009, A comparison of pixel- and object-leveldata fusion using Lidar and high-resolution imagery for enhanced classification. InInnovations in Remote Sensing and Photogrammetry, S. Jones and K. Reinke (Eds.),pp. 3–17 (Berlin: Springer-Verlag).
AUGUSTEIJN, M.F., CLEMENS, L.E. and SHAW, K.A., 1995, Performance evaluation of tex-ture measures for ground cover identification in satellite images by means of aneural network classifier. IEEE Transactions on Geoscience and Remote Sensing, 33,pp. 616–625.
BANNARI, A., MORIN, D. and BONN, E., 1995, A review of vegetation indices. Remote SensingReviews, 13, pp. 95–120.
BISCHOF, H., SCHNEIDER, W. and PINZ, A.J., 1992, Multispectral classification of Landsatimages using neural networks. IEEE Transactions on Geoscience and Remote Sensing,30, pp. 482–489.
BLASCHKE, T., 2010, Object based image analysis for remote sensing. ISPRS Journal ofPhotogrammetry and Remote Sensing, 65, pp. 2–16.
BRONDÍZIO, E.S., MORAN, E.F., MAUSEL, P. and WU, Y., 1996, Land cover in theAmazon estuary: linking of the Thematic Mapper with botanical and historical data.Photogrammetric Engineering and Remote Sensing, 62, pp. 921–929.
BRUZZONE, L., CONESE, C., MASELLI, F. and ROLI, F., 1997, Multisource classification ofcomplex rural areas by statistical and neural-network approaches. PhotogrammetricEngineering and Remote Sensing, 63, pp. 523–533.
BUTUSOV, O.B., 2003, Textural classification of forest types from Landsat 7 imagery. MappingSciences and Remote Sensing, 40, pp. 91–104.
CASTRO, K.L., SANCHEZ-AZOFEIFA, G.A. and RIVARD, B., 2003, Monitoring secondary trop-ical forests using space-borne data: implications for Central America. InternationalJournal of Remote Sensing, 24, pp. 1853–1894.
Dow
nloa
ded
by [
Indi
ana
Uni
vers
ity L
ibra
ries
] at
12:
08 3
0 Ja
nuar
y 20
12

Land-cover classification 8227
CHANDER, G., MARKHAM, B.L. and HELDER, D.L., 2009, Summary of current radiometriccalibration coefficients for Landsat MSS, TM, ETM+, and EO-1 ALI sensors. RemoteSensing of Environment, 113, pp. 893–903.
CHAVEZ, JR., P.S., 1996, Image-based atmospheric corrections – revisited and improved.Photogrammetric Engineering and Remote Sensing, 62, pp. 1025–1036.
CHEN, D., STOW, D.A. and GONG, P., 2004, Examining the effect of spatial resolution andtexture window size on classification accuracy: an urban environment case. InternationalJournal of Remote Sensing, 25, pp. 2177–2192.
CONGALTON, R.G., 1991, A review of assessing the accuracy of classification of remotely senseddata. Remote Sensing of Environment, 37, pp. 35–46.
CONGALTON, R.G. and GREEN, K., 2008, Assessing the Accuracy of Remotely Sensed Data:Principles and Practices, 2nd ed., p. 183 (Boca Raton, FL: CRC Press).
EHLERS, M., KLONUS, S., ASTRAND, P.J. and ROSSO, P., 2010, Multisensor image fusion forpansharpening in remote sensing. International Journal of Image and Data Fusion, 1,pp. 25–45.
FOODY, G.M., 2002, Status of land cover classification accuracy assessment. Remote Sensing ofEnvironment, 80, pp. 185–201.
FOODY, G.M., 2004, Thematic map comparison: evaluating the statistical significance of differ-ences in classification accuracy. Photogrammetric Engineering and Remote Sensing, 70,pp. 627–633.
FOODY, G.M., 2009, Classification accuracy comparison: hypothesis tests and the use of con-fidence intervals in evaluations of difference, equivalence and non-inferiority. RemoteSensing of Environment, 113, pp. 1658–1663.
FOODY, G.M., PALUBINSKAS, G., LUCAS, R.M., CURRAN, P.J. and HONZÁK, M., 1996,Identifying terrestrial carbon sinks: classification of successional stages in regeneratingtropical forest from Landsat TM data. Remote Sensing of Environment, 55, pp. 205–216.
FRANKLIN, S.E. and WULDER, M.A., 2002, Remote sensing methods in medium spatial resolu-tion satellite data land cover classification of large areas. Progress in Physical Geography,26, pp. 173–205.
FRIEDL, M.A. and BRODLEY, C.E., 1997, Decision tree classification of land cover fromremotely sensed data. Remote Sensing of Environment, 61, pp. 399–409.
GONG, P., 1994, Integrated analysis of spatial data from multiple sources: an overview. CanadianJournal of Remote Sensing, 20, pp. 349–359.
GONG, P. and HOWARTH, P.J., 1992, Frequency-based contextual classification and gray-levelvector reduction for land-use identification. Photogrammetric Engineering & RemoteSensing, 58, pp. 423–437.
HANSEN, M., DUBAYAH, R. and DEFRIES, R., 1996, Classification trees: an alternative to tradi-tional land cover classifiers. International Journal of Remote Sensing, 17, pp. 1075–1081.
HARALICK, R.M., SHANMUGAM, K. and DINSTEIN, I., 1973, Textural features for image classi-fication. IEEE Transactions on Systems, Man, and Cybernetics, SMC-3, pp. 610–620.
HARRIS, P.M. and VENTURA, S.J., 1995, The integration of geographic data with remotelysensed imagery to improve classification in an urban area. Photogrammetric Engineeringand Remote Sensing, 61, pp. 993–998.
HILL, R.A. and FOODY, G.M., 1994, Separability of tropical rain-forest types in theTambopata-Candamo reserved zone, Peru. International Journal of Remote Sensing, 15,pp. 2687–2693.
HODGSON, M.E., JENSEN, J.R., TULLIS, J.A., RIORDAN, K.D. and ARCHER, C.M., 2003,Synergistic use Lidar and color aerial photography for mapping urban parcel imper-viousness. Photogrammetric Engineering and Remote Sensing, 69, pp. 973–980.
JENSEN, J.R. 2004, Introductory Digital Image Processing: A Remote Sensing Perspective, 3rded., p. 526 (Upper Saddle River, NJ: Pearson Prentice Hall).
KANELLOPOULOS, I. and WILKINSON, G.G., 1997, Strategies and best practice for neuralnetwork image classification. International Journal of Remote Sensing, 18, pp. 711–725.
Dow
nloa
ded
by [
Indi
ana
Uni
vers
ity L
ibra
ries
] at
12:
08 3
0 Ja
nuar
y 20
12
8228 G. Li et al.
KASHYAP, R.L., CHELLAPPA, R. and KHOTANZAD, A., 1982, Texture classificationusing features derived from random field models. Pattern Recognition Letters, 1,pp. 43–50.
KUROSU, T., YOKOYAMA, S. and CHIBA, K., 2001, Land use classification with textural analy-sis and the aggregation technique using multi-temporal JERS-1 L-band SAR images.International Journal of Remote Sensing, 22, pp. 595–613.
LANDGREBE, D.A., 2003, Signal Theory Methods in Multispectral Remote Sensing, p. 508(Hoboken, NJ: John Wiley & Sons).
LI, D., 2010, Remotely sensed images and GIS data fusion for automatic change detection.International Journal of Image and Data Fusion, 1, pp. 99–108.
LILLESAND, T.M. and KIEFER, R.W., 2000, Remote Sensing and Image Interpretation, 4th ed.,p. 724 (New York: John Wiley & Sons).
LU, D., 2005a, Integration of vegetation inventory data and Landsat TM image for vegetationclassification in the western Brazilian Amazon. Forest Ecology and Management, 213,pp. 369–383.
LU, D., 2005b, Aboveground biomass estimation using Landsat TM data in the BrazilianAmazon. International Journal of Remote Sensing, 26, pp. 2509–2525.
LU, D., BATISTELLA, M. and MORAN, E., 2007, Land cover classification in the BrazilianAmazon with the integration of Landsat ETM+ and RADARSAT data. InternationalJournal of Remote Sensing, 28, pp. 5447–5459.
LU, D., BATISTELLA, M., MORAN, E. and DE MIRANDA, E.E., 2008, A comparative studyof Landsat TM and SPOT HRG images for vegetation classification in the BrazilianAmazon. Photogrammetric Engineering and Remote Sensing, 70, pp. 311–321.
LU, D., HETRICK, S. and MORAN, E., 2010, Land cover classification in a complex urban-rurallandscape with Quickbird imagery. Photogrammetric Engineering and Remote Sensing,76, pp. 1159–1168.
LU, D., MAUSEL, P., BATISTELLA, M. and MORAN, E., 2004a, Comparison of land-cover clas-sification methods in the Brazilian Amazon basin. Photogrammetric Engineering andRemote Sensing, 70, pp. 723–731.
LU, D., MAUSEL, P., BRONDÍZIO, E.S. and MORAN, E., 2002, Assessment of atmospheric cor-rection methods for Landsat TM data applicable to Amazon basin LBA research.International Journal of Remote Sensing, 23, pp. 2651–2671.
LU, D., MAUSEL, P., BRONDÍZIO, E.S. and MORAN, E., 2004b, Relationships between foreststand parameters and Landsat Thematic Mapper spectral responses in the BrazilianAmazon Basin. Forest Ecology and Management, 198, pp. 149–167.
LU, D., MORAN, E. and BATISTELLA, M., 2003, Linear mixture model applied to Amazonianvegetation classification. Remote Sensing of Environment, 87, pp. 456–469.
LU, D. and WENG, Q., 2007, A survey of image classification methods and techniques forimproving classification performance. International Journal of Remote Sensing, 28,pp. 823–870.
LUCAS, R.M., HONZÁK, M., CURRAN, P.J., FOODY, G.M., MILNE, R., BROWN, T. and AMARAL,S., 2000, The regeneration of tropical forests within the Legal Amazon. InternationalJournal of Remote Sensing, 21, pp. 2855–2881.
LUCAS, R.M., HONZÁK, M., DO AMARAL, I., CURRAN, P.J. and FOODY, G.M., 2002, Forestregeneration on abandoned clearances in central Amazonia. International Journal ofRemote Sensing, 23, pp. 965–988.
MARCEAU, D.J., HOWARTH, P.J., DUBOIS, J.M. and GRATTON, D.J., 1990, Evaluationof the grey-level co-occurrence matrix method for land-cover classification usingSPOT imagery. IEEE Transactions on Geoscience and Remote Sensing, 28, pp.513–519.
MAUSEL, P., WU, Y., LI, Y., MORAN, E. and BRONDÍZIO, E., 1993, Spectral identificationof succession stages following deforestation in Amazonia. Geocarto International, 8,pp. 11–20.
Dow
nloa
ded
by [
Indi
ana
Uni
vers
ity L
ibra
ries
] at
12:
08 3
0 Ja
nuar
y 20
12
Land-cover classification 8229
MAUSEL, P.W., KRAMBER, W.J. and LEE, J.K., 1990, Optimum band selection for supervisedclassification of multispectral data. Photogrammetric Engineering and Remote Sensing,56, pp. 55–60.
MCDONALD, A.J., GEMMELL, F.M. and LEWIS, P.E., 1998, Investigation of the utility of spectralvegetation indices for determining information on coniferous forests. Remote Sensing ofEnvironment, 66, pp. 250–272.
MORAN, E.F., 1981, Developing the Amazon (Bloomington, IN: Indiana University Press).MORAN, E.F. and BRONDÍZIO, E.S., 1998, Land-use change after deforestation. In Amazônia,
People and Pixels: Linking Remote Sensing and Social Science, D. Liverman, E.F.Moran, R.R. Rindfuss and P.C. Stern (Eds.), pp. 94–120 (Washington, DC: NationalAcademy Press).
MORAN, E.F., BRONDÍZIO, E.S. and MAUSEL, P., 1994a, Secondary succession. Research andExploration, 10, pp. 458–476.
MORAN, E.F., BRONDÍZIO, E.S., MAUSEL, P. and WU, Y., 1994b, Integrating Amazonianvegetation, land use, and satellite data. Bioscience, 44, pp. 329–338.
NARASIMHA RAO, P.V., SESHA SAI, M.V.R., SREENIVAS, K., KRISHNA RAO, M.V., RAO,B.R.M., DWIVEDI, R.S. and VENKATARATNAM, L., 2002, Textural analysis of IRS-1D panchromatic data for land cover classification. International Journal of RemoteSensing, 23, pp. 3327–3345.
PAOLA, J.D. and SCHOWENGERDT, R.A., 1995, A review and analysis of back propagation neu-ral networks for classification of remotely sensed multi-spectral imagery. InternationalJournal of Remote Sensing, 16, pp. 3033–3058.
PODEST, E. and SAATCHI, S., 2002, Application of multiscale texture in classifying JERS-1 radar data over tropical vegetation. International Journal of Remote Sensing, 23,pp. 1487–1506.
POHL, C. and VAN GENDEREN, J.L., 1998, Multisensor image fusion in remote sensing: con-cepts, methods, and applications. International Journal of Remote Sensing, 19, pp.823–854.
RICHARDS, J.A. and JIA, X., 1999, Remote Sensing Digital Image Analysis: An Introduction, 3rded., p. 363 (Berlin: Springer-Verlag).
RIGNOT, E., SALAS, W.A. and SKOLE, D.L., 1997, Mapping deforestation and secondary growthin Rondônia, Brazil using imaging Radar and Thematic Mapper data. Remote Sensingof Environment, 59, pp. 167–176.
ROBERTS, D.A., BATISTA, G.T., PEREIRA, J.L.G., WALLER, E.K. and NELSON, B.W., 1998,Change identification using multitemporal spectral mixture analysis: applications ineastern Amazônia. In Remote Sensing Change Detection: Environmental MonitoringMethods and Applications, R.S. Lunetta and C.D. Elvidge (Eds.), pp. 137–161 (AnnArbor, MI: Ann Arbor Press).
ROBERTS, D.A., NUMATA, I., HOLMES, K., BATISTA, G., KRUG, T., MONTEIRO, A., POWELL,B. and CHADWICK, O.A., 2002, Large area mapping of land-cover change in Rondôniausing multitemporal spectral mixture analysis and decision tree classifiers. Journal ofGeophysical Research, 107, 8073.
ROGAN, J., FRANKLIN, J., STOW, D., MILLER, J., WOODCOCK, C. and ROBERTS, D., 2008,Mapping land-cover modifications over large areas: a comparison of machine learningalgorithms. Remote Sensing of Environment, 112, pp. 2272–2283.
SHABAN, M.A. and DIKSHIT, O., 2001, Improvement of classification in urban areas by theuse of textural features: the case study of Lucknow city, Uttar Pradesh. InternationalJournal of Remote Sensing, 22, pp. 565–593.
SHACKELFORD, A.K. and DAVIS, C.H., 2003, A hierarchical fuzzy classification approach forhigh-resolution multispectral data over urban areas. IEEE Transactions on Geoscienceand Remote Sensing, 41, pp. 1920–1932.
SKOLE, D.L., CHOMENTOWSKI, W.H., SALAS, W.A. and NOBRE, A.D., 1994, Physical andhuman dimension of deforestation in Amazonia. BioScience, 44, pp. 314–328.
Dow
nloa
ded
by [
Indi
ana
Uni
vers
ity L
ibra
ries
] at
12:
08 3
0 Ja
nuar
y 20
12

8230 G. Li et al.
SMITS, P.C., DELLEPIANE, S.G. and SCHOWENGERDT, R.A., 1999, Quality assessment of imageclassification algorithms for land-cover mapping: a review and a proposal for a cost-based approach. International Journal of Remote Sensing, 20, pp. 1461–1486.
SOLBERG, A.H.S., TAXT, T. and JAIN, A.K., 1996, A Markov random field model for classifi-cation of multisource satellite imagery. IEEE Transactions on Geoscience and RemoteSensing, 34, pp. 100–112.
STEFANOV, W.L., RAMSEY, M.S. and CHRISTENSEN, P.R., 2001, Monitoring urban land coverchange: an expert system approach to land cover classification of semiarid to arid urbancenters. Remote Sensing of Environment, 77, pp. 173–185.
SUN, W.X., HEIDT, V., GONG, P. and XU, G., 2003, Information fusion for rural land-use clas-sification with high-resolution satellite imagery. IEEE Transactions on Geoscience andRemote Sensing, 41, pp. 883–890.
TSO, B. and MATHER, P.M., 2001, Classification Methods for Remotely Sensed Data (London,UK: Taylor & Francis).
TUCKER, J.M., BRONDÍZIO, E.S. and MORAN, E.F., 1998, Rates of forest regrowth in EasternAmazônia: a comparison of Altamira and Bragantina regions, Para State, Brazil.Interciencia, 23, pp. 64–73.
VIEIRA, I.C.G., DE ALMEIDA, A.S., DAVIDSON, E.A., STONE, T.A., DE CARVALHO, C.J.R. andGUERRERO, J.B., 2003, Classifying successional forests using Landsat spectral proper-ties and ecological characteristics in eastern Amazonia. Remote Sensing of Environment,87, pp. 470–481.
WILLIAMS, J., 2001, GIS Processing of Geocoded Satellite Data, p. 327 (Chichester, UK:Springer and Praxis Publishing).
WULDER, M.A., FRANKLIN, S.E., WHITE, J.C., LINKE, J. and MAGNUSSEN, S., 2006, An accu-racy assessment framework for large-area land cover classification products derivedfrom medium-resolution satellite data. International Journal of Remote Sensing, 27,pp. 663–683.
YANASSE, C.C.F., SANT’ANNA, S.J.S., FRERY, A.C., RENNÓ, C.D., SOARES, J.V. and LUCKMAN,A.J., 1997, Exploratory study of the relationship between tropical forest regenerationstages and SIR-C L and C data. Remote Sensing of Environment, 59, pp. 180–190.
YU, Q., GONG, P., CLINTON, N., BIGING, G., KELLY, M. and SCHIROKAUER, D., 2006, Object-based detailed vegetation classification with airborne high spatial resolution remotesensing imagery. Photogrammetric Engineering & Remote Sensing, 72, pp. 799–811.
ZAMBON, M, LAWRENCE, R.„ BUNN, A. and POWELL, S., 2006, Effect of alternative split-ting rules on image processing using classification tree analysis. PhotogrammetricEngineering & Remote Sensing, 72, pp. 25–30.
ZHANG, J., 2010, Multisource remote sensing data fusion: status and trends. InternationalJournal of Image and Data Fusion, 1, pp. 5–24.
ZHANG, Y., LU, D., YANG, B., SUN, C. and SUN, M., 2011, Coastal wetland vegetation classifica-tion with a Landsat Thematic Mapper image. International Journal of Remote Sensing,32, pp. 545–561.
Dow
nloa
ded
by [
Indi
ana
Uni
vers
ity L
ibra
ries
] at
12:
08 3
0 Ja
nuar
y 20
12

2010 No. 10-03 Lu, D., S. Hetrick, and E. Moran 2010. Land Cover Classification in a Complex Urban-rural Landscape with QuickBird Imagery. Photogrammetric Engineering & Remote Sensing 76(10):1159-1168. No. 10-04 Lu, D., E. Moran, S. Hetrick and G. Li. In Press. Mapping Impervious Surface Distribution with the Integration of Landsat TM and Quickbird Images in a Complex Urban-rural Frontier in Brazil. Chapter 16. No. 10-05 Lu, D., S. Hetrick, and E. Moran. In Press. Impervious Surface Mapping with Quickbird Imagery. International Journal of Remote Sensing. No. 10-06 Mattos, L. and A. Cau. In Press. The Clean Development Mechanism and Agroforestry Activities in the Brazilian Amazon. No. 10-09 Lu, D., E. Moran, and S. Hetrick. In Press. Detection of Impervious Surface Change with Multitemporal Remote Sensing Data in an Urban-rural Frontier. No. 10-10 D. Lu, S. Hetrick, E. Moran, and G. Li. In Press. Detection of Urban Expansion with Multitemporal Quickbird Images. International Journal of Remote Sensing. No. 10-11 Muehlenbein, M.P., J.L. Hirschtick, J.Z. Bonner, and A.M. Swartz. 2010. Toward quantifying the usage costs of human immunity: Altered metabolic rates and hormone levels during acute immune activation in men. American Journal of Human Biology 22: 546-556. No. 10-12 Muehlenbein, M.P., L.A. Martinez, A.A. Lemke, L. Ambu, S. Nathan, S. Alsito, and R. Sakong. 2010. Unhealthy travelers present challenges to sustainable primate ecotourism. Travel Medicine and Infectious Disease 8: 169-175. No. 10-13 Tucker, C.M. 2010. Private Goods and Common Property: Pottery Production in a Honduran Lenca Community. Human Organization 69(1): 43-53. No. 10-14 Tucker, C.M., H. Eakin, and E.J. Castellanos. 2010. Perceptions of risk and adaptation: Coffee producers, market shocks, and extreme weather in Central America and Mexico. Global Environmental Change 20: 23-32. No. 10-15 Lu, D., S. Hetrick, E. Moran, and G. Li. 2010. Detection of Urban Expansion in an Urban-rural Landscape with Multitemporal QuickBird Images. Journal of Applied Remote Sensing 4(041880): 1-17. No. 10-16 Mattos, L., E. Brondizio, A. Romeiro, and R. Orair. 2010. Agricultural de pequena escala e suas implicações na transição agroecológica na Amazônia Brasileira. Amazônica 2(2): 220-248.
Related Documents