Land and cryosphere products from Suomi NPP VIIRS: Overview and status Christopher O. Justice, 1,2 Miguel O. Román, 2,3 Ivan Csiszar, 4 Eric F. Vermote, 3 Robert E. Wolfe, 3 Simon J. Hook, 5 Mark Friedl, 6 Zhuosen Wang, 7,8 Crystal B. Schaaf, 7,8 Tomoaki Miura, 9 Mark Tschudi, 10 George Riggs, 11,12 Dorothy K. Hall, 12 Alexei I. Lyapustin, 13 Sadashiva Devadiga, 3,14 Carol Davidson, 3,14 and Edward J. Masuoka 3 Received 18 June 2013; revised 15 August 2013; accepted 15 August 2013; published 11 September 2013. [1] The Visible Infrared Imaging Radiometer Suite (VIIRS) instrument was launched in October 2011 as part of the Suomi National Polar-Orbiting Partnership (S-NPP). The VIIRS instrument was designed to improve upon the capabilities of the operational Advanced Very High Resolution Radiometer and provide observation continuity with NASA’s Earth Observing System’s Moderate Resolution Imaging Spectroradiometer (MODIS). Since the VIIRS first-light images were received in November 2011, NASA- and NOAA-funded scientists have been working to evaluate the instrument performance and generate land and cryosphere products to meet the needs of the NOAA operational users and the NASA science community. NOAA’s focus has been on refining a suite of operational products known as Environmental Data Records (EDRs), which were developed according to project specifications under the National Polar-Orbiting Environmental Satellite System. The NASA S-NPP Science Team has focused on evaluating the EDRs for science use, developing and testing additional products to meet science data needs, and providing MODIS data product continuity. This paper presents to-date findings of the NASA Science Team’s evaluation of the VIIRS land and cryosphere EDRs, specifically Surface Reflectance, Land Surface Temperature, Surface Albedo, Vegetation Indices, Surface Type, Active Fires, Snow Cover, Ice Surface Temperature, and Sea Ice Characterization. The study concludes that, for MODIS data product continuity and earth system science, an enhanced suite of land and cryosphere products and associated data system capabilities are needed beyond the EDRs currently available from the VIIRS. Citation: Justice, C. O., et al. (2013), Land and cryosphere products from Suomi NPP VIIRS: Overview and status, J. Geophys. Res. Atmos., 118, 9753–9765, doi:10.1002/jgrd.50771. 1. The S-NPP Mission and the VIIRS Instrument for Land Remote Sensing [2] The Visible Infrared Imaging Radiometer Suite (VIIRS) instrument was launched in October 2011 as part of the NPOESS (National Polar-orbiting Environmental Satellite System) Preparatory Project (NPP), subsequently renamed the Suomi National Polar-orbiting Partnership (S-NPP) in January 2012. S-NPP was planned as a bridging mission intended to provide observation continuity with NASA’s The copyright line for this article was changed on 22 August 2014. 1 Department of Geographical Sciences, University of Maryland, College Park, Maryland, USA. 2 These authors contributed equally to this work. 3 Terrestrial Information Systems Laboratory, NASA Goddard Space Flight Center, Greenbelt, Maryland, USA. 4 NOAA Center for Satellite Applications and Research, College Park, Maryland, USA. 5 Jet Propulsion Laboratory, California Institute of Technology, Pasadena, California, USA. 6 Department of Earth and Environment, Boston University, Boston, Massachusetts, USA. 7 Department of Environmental, Earth and Ocean Sciences, University of Massachusetts, Boston, Massachusetts, USA. 8 Center for Remote Sensing Department of Earth and Environment, Boston University, Boston, Massachusetts, USA. 9 Department of Natural Resources and Environmental Management, University of Hawaii at Manoa, Honolulu, Hawaii, USA. 10 Colorado Center for Astrodynamics Research, University of Colorado, Boulder, Colorado, USA. 11 Science Systems & Applications, Inc., NASA Goddard Space Flight Center, Lanham, Maryland, USA. 12 Cryospheric Sciences Laboratory, NASA Goddard Space Flight Center, Greenbelt, Maryland, USA. 13 Climate and Radiation Laboratory, NASA Goddard Space Flight Center, Greenbelt, Maryland, USA. 14 Sigma Space Corporation, NASA Goddard Space Flight Center, Greenbelt, Maryland, USA. Corresponding author: C. O. Justice, Department of Geographical Sciences, University of Maryland, College Park, MD 20782, USA. ([email protected]) M. O. Román, Terrestrial Information Systems Laboratory, NASA Goddard Space Flight Center, Greenbelt, MD 20771, USA. ([email protected]) ©2014 The Authors. This is an open access article under the terms of the Creative Commons Attribution-NonCommercial-NoDerivs License, which permits use and dis- tribution in any medium, provided the original work is properly cited, the use is non-commercial and no modifications or adaptations are made. 2169-897X/13/10.1002/jgrd.50771 9753 JOURNAL OF GEOPHYSICAL RESEARCH: ATMOSPHERES, VOL. 118, 9753–9765, doi:10.1002/jgrd.50771, 2013

Welcome message from author
This document is posted to help you gain knowledge. Please leave a comment to let me know what you think about it! Share it to your friends and learn new things together.
Transcript
Land and cryosphere products from Suomi NPP VIIRS:Overview and status
Christopher O. Justice,1,2 Miguel O. Román,2,3 Ivan Csiszar,4 Eric F. Vermote,3
Robert E. Wolfe,3 Simon J. Hook,5 Mark Friedl,6 Zhuosen Wang,7,8 Crystal B. Schaaf,7,8
TomoakiMiura,9Mark Tschudi,10 George Riggs,11,12 DorothyK. Hall,12 Alexei I. Lyapustin,13
Sadashiva Devadiga,3,14 Carol Davidson,3,14 and Edward J. Masuoka3
Received 18 June 2013; revised 15 August 2013; accepted 15 August 2013; published 11 September 2013.
[1] The Visible Infrared Imaging Radiometer Suite (VIIRS) instrument was launched inOctober 2011 as part of the Suomi National Polar-Orbiting Partnership (S-NPP). The VIIRSinstrument was designed to improve upon the capabilities of the operational Advanced VeryHigh Resolution Radiometer and provide observation continuity with NASA’s EarthObserving System’s Moderate Resolution Imaging Spectroradiometer (MODIS). Since theVIIRS first-light images were received in November 2011, NASA- and NOAA-fundedscientists have been working to evaluate the instrument performance and generate land andcryosphere products to meet the needs of the NOAA operational users and the NASA sciencecommunity. NOAA’s focus has been on refining a suite of operational products known asEnvironmental Data Records (EDRs), which were developed according to projectspecifications under the National Polar-Orbiting Environmental Satellite System. The NASAS-NPP Science Team has focused on evaluating the EDRs for science use, developing andtesting additional products to meet science data needs, and providing MODIS data productcontinuity. This paper presents to-date findings of the NASA Science Team’s evaluation ofthe VIIRS land and cryosphere EDRs, specifically Surface Reflectance, Land SurfaceTemperature, Surface Albedo, Vegetation Indices, Surface Type, Active Fires, Snow Cover,Ice Surface Temperature, and Sea Ice Characterization. The study concludes that, for MODISdata product continuity and earth system science, an enhanced suite of land and cryosphereproducts and associated data system capabilities are needed beyond the EDRs currentlyavailable from the VIIRS.
Citation: Justice, C. O., et al. (2013), Land and cryosphere products from Suomi NPP VIIRS: Overview and status,J. Geophys. Res. Atmos., 118, 9753–9765, doi:10.1002/jgrd.50771.
1. The S-NPP Mission and the VIIRS Instrumentfor Land Remote Sensing
[2] The Visible Infrared Imaging Radiometer Suite (VIIRS)instrument was launched in October 2011 as part of the
NPOESS (National Polar-orbiting Environmental SatelliteSystem) Preparatory Project (NPP), subsequently renamedthe Suomi National Polar-orbiting Partnership (S-NPP) inJanuary 2012. S-NPP was planned as a bridging missionintended to provide observation continuity with NASA’s
The copyright line for this article was changed on 22 August 2014.1Department of Geographical Sciences, University of Maryland, College
Park, Maryland, USA.2These authors contributed equally to this work.3Terrestrial Information Systems Laboratory, NASA Goddard Space
Flight Center, Greenbelt, Maryland, USA.4NOAA Center for Satellite Applications and Research, College Park,
Maryland, USA.
5Jet Propulsion Laboratory, California Institute of Technology,Pasadena, California, USA.
6Department of Earth and Environment, Boston University, Boston,Massachusetts, USA.
7Department of Environmental, Earth and Ocean Sciences, University ofMassachusetts, Boston, Massachusetts, USA.
8Center for Remote Sensing Department of Earth and Environment,Boston University, Boston, Massachusetts, USA.
9Department of Natural Resources and Environmental Management,University of Hawaii at Manoa, Honolulu, Hawaii, USA.
10Colorado Center for Astrodynamics Research, University of Colorado,Boulder, Colorado, USA.
11Science Systems & Applications, Inc., NASA Goddard Space FlightCenter, Lanham, Maryland, USA.
12Cryospheric Sciences Laboratory, NASA Goddard Space FlightCenter, Greenbelt, Maryland, USA.
13Climate and Radiation Laboratory, NASA Goddard Space FlightCenter, Greenbelt, Maryland, USA.
14Sigma Space Corporation, NASA Goddard Space Flight Center,Greenbelt, Maryland, USA.
Corresponding author: C. O. Justice, Department of Geographical Sciences,UniversityofMaryland,CollegePark,MD20782,USA. ([email protected])
M. O. Román, Terrestrial Information Systems Laboratory, NASA GoddardSpace Flight Center, Greenbelt, MD 20771, USA. ([email protected])
©2014 The Authors.This is an open access article under the terms of the Creative CommonsAttribution-NonCommercial-NoDerivs License, which permits use and dis-tribution in any medium, provided the original work is properly cited, theuse is non-commercial and no modifications or adaptations are made.2169-897X/13/10.1002/jgrd.50771
9753
JOURNAL OF GEOPHYSICAL RESEARCH: ATMOSPHERES, VOL. 118, 9753–9765, doi:10.1002/jgrd.50771, 2013
Earth Observing System (EOS) and the operational VIIRS in-struments to be flown on the first Joint Polar-Orbiting SatelliteSystem (JPSS-1) in 2017. The VIIRS instrument is intended toimprove upon the operational Advanced Very High ResolutionRadiometer (AVHRR) and provide continuity with the EOSModerate Resolution Imaging Spectroradiometer (MODIS).Since the VIIRS first-light images were received inNovember 2011, NASA and NOAA scientists have beenworking to evaluate the instrument on-orbit performance andgenerate land and cryosphere products to meet the needs ofthe NOAA operational user community and NASA science.NOAA’s focus has been on refining and validating a suite ofoperational products known as Environmental Data Records(EDRs), developed by Northrop Grumman and Raytheonaccording to project specifications. The NASA NPP ScienceTeam has focused on evaluating the EDRs for science useand developing and testing additional or improvedVIIRS prod-ucts to meet outstanding science data needs and provideMODIS data continuity. The S-NPP has had a dynamic andcomplex history with roles and responsibilities changingbetween federal agencies and private contractors. With theemphasis of the program on meeting operational user needs,the bulk of the resources and effort to generate land andcryosphere products from S-NPP have been focused on thecontractor-developed EDRs [Justice et al., 2011].[3] The primary target audience for the NOAA EDRs is the
traditional NOAA operational users, such as the NationalWeather Service and the Air Force Weather Agency. Datafrom the VIIRS are being used to generate land and cryosphereEDRs (hereby termed EDRs or “VIIRS products”) for use in anumber of operational applications, ranging from real-timeweather operations to forecast model input and environmentalmonitoring applications. The VIIRS products are currentlybeing processed in NOAA’s near-real-time Interface DataProcessing Segment (IDPS), which receives raw instrument dataand telemetry from the ground stations supporting the S-NPPmission. The IDPS converts the Raw Data Records, generatedby sensors on S-NPP, into calibrated geolocated measurementscalled Sensor Data Records (SDRs) and then into geophysicalparameters or Environmental Data Records (EDRs). In additionto SDRs and EDRs, the IDPS produces Intermediate Products(IPs) and Application-Related Products (ARPs). Application-Related Products (ARPs) are a subcategory of EDRs and are sub-ject to the same latency requirements. Intermediate Products (IPs)are produced as an interim step in the EDRprocessing and (for theS-NPP mission) are stored for long-term archiving. These prod-ucts are archived and distributed by NOAA’s ComprehensiveLarge Array-Data Stewardship System (CLASS).[4] The standard VIIRS IDPS-generated products (EDRs,
ARPs, and IPs) are only produced in swath-based Level 2 for-mat. Thus, only information from a single orbit is used, andavailable “per-pixel” information from overlapping swaths isnot used. In contrast, the MODIS land products are storedusing the Level 2 Grid (L2G) approach, which provides userswith the original observations and their subpixel geolocationinformation. The rationale behind the L2G approach was toselect the observations least affected by off-nadir viewingobservations while maximizing coverage within a cell of thegridded projection. This improves the efficiency of processingand reprocessing of L2G and higher-level gridded products.[5] Early versions of the VIIRS Land EDRs have been avail-
able since “first light” to allow data users to gain familiarity
with data formats and parameters. In the first 12months ofon-orbit operations, three major baseline releases (termedIDPS Mx5.3, Mx6.2, and Mx6.3) were installed to deliverproduct fixes and look-up table updates. However, the prod-ucts have undergone limited “Beta” testing and in some casescontain significant errors. Further detailed evaluation isneeded to determine their suitability for quantitative scientificstudies [Román et al., 2012]. As the VIIRS on-orbit perfor-mance has stabilized and ground-truth campaigns and data ex-amination exercises are generating results, the NOAA JPSSLand Product Algorithm Development and Cal/Val teamand the NASA S-NPP VIIRS Land discipline team are work-ing toward bringing EDRs to “provisional” status by the endof 2013.
2. VIIRS Land EDR Evaluation and Status
[6] As with theMODIS products, the VIIRS Land EDRs canbe grouped into four general product categories: (1) radiationbudget variables, i.e., the Surface Reflectance (corrected foreffects of the atmosphere), Land Surface Temperature (LST),and Surface Albedo; (2) ecosystem variables, i.e., VegetationIndices (VI); (3) land-cover characteristics, i.e., Surface Type(ST) and the location of Active Fires; and (4) cryospheric prod-ucts, i.e., Snow Cover, Ice Surface Temperature (IST) and SeaIce Characterization (SIC). A number of these products, includ-ing the Surface Reflectance, have their heritage in the MODISproduct algorithms, and in some cases early versions of theMODIS code were used by the contractor in the VIIRS productalgorithm development. The Land Group of NASA’s S-NPPScience Team is evaluating the suitability of the VIIRS Landalgorithms in terms of their ability to fulfill NASA’s scienceneeds. It should be noted that data from the VIIRS LandProduct Evaluation and Analysis Tool Element’s (LandPEATE) archive sets (AS) 3001 (products generated by theLand PEATE using the IDPS software) and AS 3002 (productsgenerated by the Land PEATE using NASA Land ScienceTeam adjusted versions of the IDPS software) were used inthe evaluation of the VIIRS EDRs (cf. section 3 for a descrip-tion of the Land PEATE). The improvements performed as partof AS 3002 included algorithm improvements, bug fixes, andlook-up table updates. In most cases, these adjustments wereimplemented months before they transitioned into operationalproduction in the IDPS (AS 3001).
2.1. Land Surface Temperature
[7] The VIIRS Land Surface Temperature (LST) EDR pro-vides the skin temperature of the uppermost layer of the landsurface (and larger inland waters) in swath format, equivalentto the MODIS Level 2 product. The EDR deviates from itsMODIS counterpart in a few ways: (1) it has a functionaldependency on previously generated surface type dependentcoefficients; (2) it does not provide dynamic land emissivityper the current MODIS day-night product, MOD11B1[Wan and Li, 1997], or MODIS temperature emissivity sepa-ration product, MOD21 [Hulley et al., 2010]; and (3) the fall-back two-band split-window algorithm (employed whencloud cover or strong atmospheric effects are detected) usesboth thermal and middle-infrared bands. Surface emissivityis known to change under many circumstances, includingrainfall in arid regions, phenological changes, andintrasurface type changes or fires. This variation is not fully
JUSTICE ET AL.: STATUS OF S-NPP VIIRS LAND/CRYO PRODUCTS
9754
captured in the current IDPS version of the VIIRS product.Previous work has shown that for arid and semiarid regions,a better approach is to use an algorithm with dynamicallyvarying emissivity, such as is used in the MOD11B1 orMOD21 products [Hulley and Hook, 2009]. For continuity,the generation of an emissivity product compatible withMODIS is desired, i.e., a merged product using both split-window and dynamic emissivity retrieval.[8] The measurement accuracy (bias) and precision (1
sigma) specified for the VIIRS LST product are 1.4 and0.5K, respectively, which must be met when the VIIRSCloud Mask indicates a high confidence of clear conditions(cf. Table 1). The dynamic range for the product extends from213 to 343K. The product is being generated over all landpixels except when conditions mentioned above are not met,as determined from the VIIRS Cloud Mask (VCM).[9] Initial evaluation of the VIIRS Land Surface Temperature
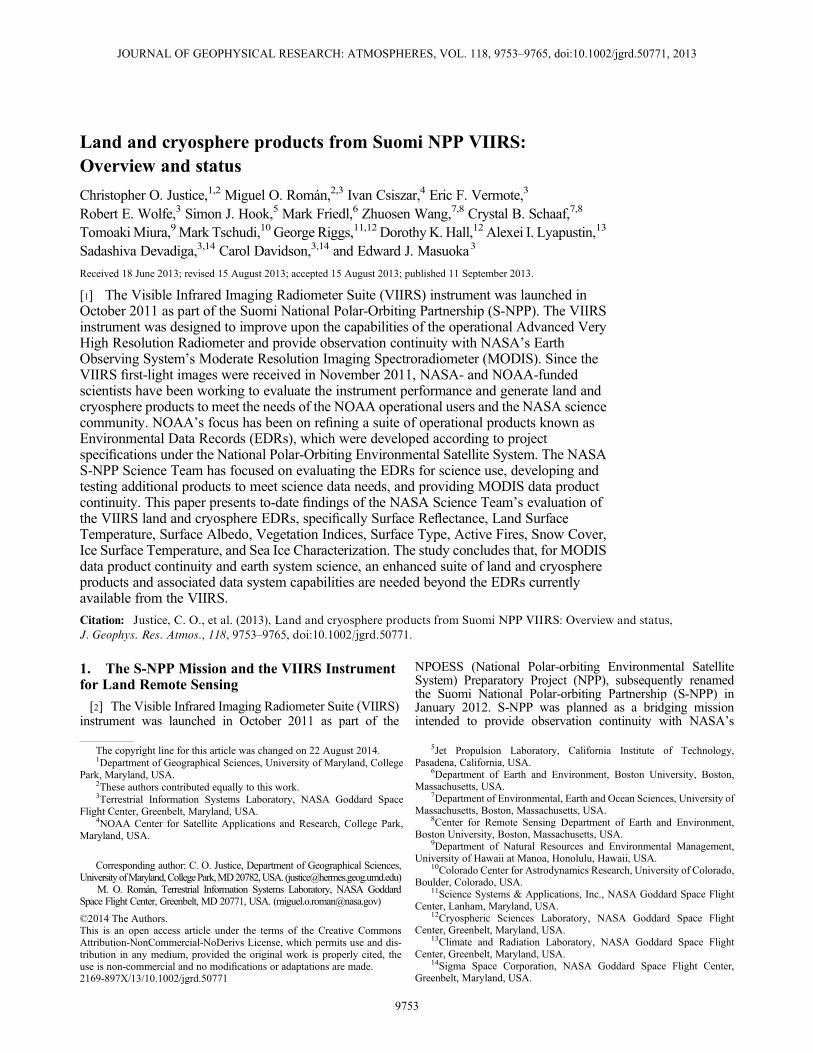
(LST) EDR (based on IDPSMx6.2) was performed using threedifferent approaches: (1) cross comparison with the AquaMODIS LST product (MOD11) when the Aqua and S-NPPoverpasses were within 30min of each other; (2) absolutetemperature validation using the Lake Tahoe and Salton Seaautomated validation approach [Hook et al., 2007]; and (3)radiance-based (R-based) LST validation over a set of pseudo-invariant sites [Wan and Li, 2008]. The R-based methodprovides estimates of the true LST using a radiative closure
simulation without the need for in situ measurements andrequires input air temperature, relative humidity profiles, andemissivity data [Hulley and Hook, 2012].[10] Figure 1 shows a plot of the validation results using
MOD11, MOD21, and VIIRS for the Kelso Dunes pseudo-invariant field site using data from AS 3001 and AS 3002.Note that, at the time of this exercise, the baseline algorithmavailable at the IDPS (AS 3001) was the “fallback” split-window (land-cover-based approach) retrieval method. Incontrast, the baseline algorithm available at the Land PEATEwas the two-band, split-window algorithm.[11] This case highlights the problem of using a static map
for the emissivity coefficients seen with both the MOD11 andVIIRS products [Hulley and Hook, 2009]. In both cases theretrieved MOD11 and VIIRS LSTs are too low by 2–3K(emissivity set too high), whereas the dynamic emissivityapproach MOD21 gives the better answer. As a result, theVIIRS LST EDR retrieval does not meet the accuracy thresh-old requirement. In summary, while the VIIRS Land SurfaceTemperature EDR is shown to be good to 1K over densevegetation and water, users should beware of major deficien-cies in the current IDPS algorithm, particularly over semiaridand seasonally varying regions, where large errors of severaldegrees kelvin have been found. Long-term validation isneeded as well as additional comparisons with data fromother instruments.
Table 1. JPSS Accuracy Requirements (Threshold and Objective as Listed in Version 2.7 of the JPSS Level 1 Requirements Supplement)and Estimated Performance Based on NASA VIIRS Science Team Evaluations To-Datea
EDR, IP, or ARP Threshold Objective Estimate (Evaluation Scenario)
Land Surface Temperatureb 1.4K 0.8K ~ 1.0K (dense vegetation and water)> 2.5K (semiarid, seasonally varying landscapes)
Surface Reflectancec ± (0.01 + 10%) ± (0.005 + 5%) ≤ 0.015 (dense vegetation and dark surfaces)> 0.015 (bright surfaces)
Surface Albedo 0.08 0.0125 > 0.078 (CEOS LPV sites and desert sites)Vegetation Index (TOA NDVI) 0.05 0.03 < 0.030 (nadir view over Western Hemisphere
versus MODIS Aqua)Vegetation Index (TOC EVI) 0.05 N/S < 0.030d (nadir view over Western Hemisphere
versus MODIS Aqua)Active Firese [1.0, 5,000MW] [1.0, 10,000MW] N/SSurface Typef 70% PCT 80% PCT ~ 70% PCT (IGBP Classes 0–5, 10, 12–13, 15–16)
< 70% PCT (IGBP Classes 6–9, 11, 14)Snow Coverg 90% PCT 90% PCT ~ 90% PCT (midlatitude and high-latitude regions)Ice Age 70% PCTh 90% PCTh > 70% PCTi (polar regions, all seasons)
< 70% PCTh (polar regions, all seasons)Ice Concentration N/Sj N/S Good agreement versus MODIS sea ice extent
(polar regions, all seasons)Ice Surface Temperature 1.0Kelvink N/S < 0.2K (versus MODIS IST)
< 0.5K (versus KT-19 observations,Ice Bridge cal/val campaign)
aNote that additional specifications typically apply to each product, such as revisit time, coverage, long-term stability and mapping, precision, and uncer-tainty; for brevity, these are not listed here. Further, each product has an associated set of exclusion conditions (e.g., high solar zenith angles) for which itsspecifications are relaxed. N/S =No value specified. PCT=Probability of correct typing.
bResults are based on IDPS MX6.2 build, after a look-up table update was implemented.cNote that performance is dependent on both the spectral band and magnitude of the reflectance (e.g., increased surface brightness results in a multiplicative
error of 5%).dWith EVI gain adjusted to 2.5.eFire Radiative Power (FRP) measurement range threshold requirement. The high end of the FRP measurement range threshold requirement (5000MW) is
based on current design capabilities (i.e., the present 634K saturation specification for the VIIRS M13 Band) and the recommendation of the NOAA-NASALand Science Team. Quantitative assessment of ARP product is pending on availability of quality reference data, primarily from airborne measurements.
fSeventeen-class IGBP classification.gApplies only to snow/no-snow classification.hIce-free, new/young ice, all other ice.iIce/ice-free classification.jVIIRS produces a sea ice concentration IP in clear sky conditions, which is provided as an input to the Ice Surface Temperature calculation.kUncertainty requirement for Ice Surface Temperature.
JUSTICE ET AL.: STATUS OF S-NPP VIIRS LAND/CRYO PRODUCTS
9755
2.2. Surface Reflectance
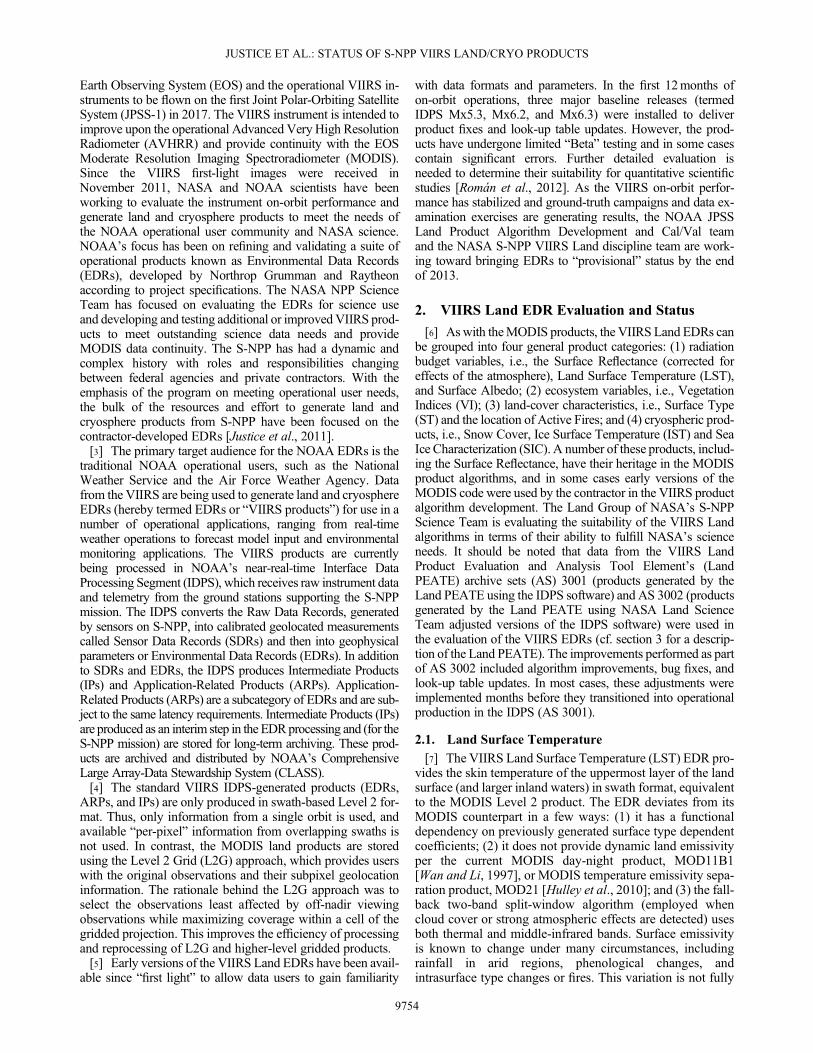
[12] Surface reflectance is one of the key products fromVIIRS and, as with MODIS, is used in developing severalhigher-order land and cryosphere products, including GlobalClimate Modeling Grid (CMG) products (cf. Figure 2), whichare used as input for modeling global trends. The VIIRSSurface Reflectance IP is based on the heritage MODISCollection 5 product [Vermote et al., 2002], which providesatmospherically corrected reflectances for the VIIRS bandsM1, M2,M3,M4,M5,M7,M8, M10, andM11 for each mod-erate resolution pixel and for the VIIRS bands I1, I2, and I3 foreach imagery resolution pixel. The quality and character ofsurface reflectance depend largely on the accuracy of theVCM and aerosol algorithms.[13] A preliminary assessment of the VCM shows that the
product correctly detects large, bright, and cold clouds and sig-nificantly underestimates small and low cumulus clouds. Inpart, this is a consequence of VCM being designed to satisfyall EDR algorithms and thus provide an average performancein terms of omission and commission errors, in contrast to the
more conservative MODIS cloud mask. The leakage of smallclouds creates large biases in the VIIRS Surface ReflectanceIP, which are not currently captured by the quality flags.[14] The quality of VIIRS aerosol retrievals is still being eval-
uated by the VIIRS Land and Aerosol cal/val teams, and a de-tailed picture has yet to emerge. At present, the VIIRS aerosolalgorithm does not provide aerosol type (model) information,and its aerosol optical depth (AOD) product is of lower quality,often significantly, than that of MODIS. The deficiencies aremost apparent over bright surfaces, where VIIRS often showshigh AOD values when in fact it is clear. Over moderatelybright and dark surfaces, VIIRS AOD rather unpredictablymay show a substantial bias, which could stem from theadopted flexible selection of the aerosol model on a pixel basis[H. Liu et al., Validation of Suomi-NPP VIIRS Aerosol OpticalThickness, submitted to Journal of Geophysical Research:Atmospheres, 2013].[15] The VIIRS SDR, and particularly the associated calibra-
tion, is being closely monitored on a continuous basis by crosscomparison of the VIIRS and MODIS Surface Reflectanceproduct over instrumented field sites. At this early stage, we
Figure 1. (left) Plot of MODIS/VIIRS LST at the Kelso Dunes, California, pseudo-invariant site (imageon right) versus radiance-based LST.
Figure 2. VIIRS Level 3 Global 0.05 Degree Global Climate Modeling Grid (CMG) Surface ReflectanceIntermediate Product (Land PEATE-adjusted version of the Surface Reflectance IP IDPS algorithm) for 26October 2012.
JUSTICE ET AL.: STATUS OF S-NPP VIIRS LAND/CRYO PRODUCTS
9756
can confirm that the VIIRS SDR is suitable for generatingSurface Reflectance IP; however, continuous monitoring isnecessary, and in the absence of any reprocessing, data gener-ated prior to the VIIRS SDR provisional status (March 2013)might not be suitable for the Surface Reflectance IP.[16] An evaluation of the VIIRS Surface Reflectance IP was
performed based on accuracy assessments over several AerosolRobotic Network (AERONET)-based Surface ReflectanceValidation Network sites [Wang et al., 2009]. Results aresummarized in Table 2. The data are organized to indicate anaverage performance level over regions with relatively lowcloudiness, good AERONET record (without gaps in themeasurements), and high retrieval statistics. The top part ofTable 2 indicates sites that have a relatively good performancewith biases across all spectral bands below 0.015. These studysites are characterized by an abundance of vegetation and
relatively dark surfaces, with the exception of the Universityof California, Santa Barbara (UCSB) site. The middle part ofTable 2 indicates sites that have a marginal performance, andthe bottom part of Table 2 indicates sites of poor performance.Of these, the high biases for the Beijing and XiangHe are dueto the high aerosol levels, and Dakar and Banizoumbouhave bright surfaces where the VIIRS aerosol retrievals areproblematic.
2.3. Surface Albedo
[17] Albedo, the quantity that specifies the proportion of theshortwave radiative flux that is reflected by the surface, is oneof the primary VIIRS Land EDRs as well as being one of theGlobal Climate Observing System’s Essential ClimateVariables [Schaaf et al., 2011]. The VIIRS EDR specificationcalls for only a broadband (0.3–4.0μm) value, retrieved on a
Table 2. Average Surface Reflectance and Bias of VIIRS Surface Reflectance IP for Selected Sitesa
Site Name
M2 (436–454 nm) M4 (545–565 nm) M5 (662–682 nm) M7 (846–885 nm)
Reflectance Bias Reflectance Bias Reflectance Bias Reflectance Bias
Sites that have a relatively good performance with biasesUCSB 0.042 �0.007 0.070 �0.006 0.084 �0.005 0.230 �0.005Cuiaba-Miranda 0.033 0.004 0.069 0.000 0.084 �0.002 0.254 �0.006Ispra 0.029 �0.013 0.055 �0.009 0.045 �0.006 0.297 �0.006Evora 0.058 �0.004 0.106 �0.005 0.157 �0.007 0.300 �0.009Konza 0.039 �0.004 0.077 �0.006 0.084 �0.007 0.302 �0.014Alta Floresta 0.036 �0.003 0.078 �0.005 0.094 �0.003 0.321 �0.008Bondville 0.027 �0.010 0.059 �0.004 0.052 �0.005 0.348 0.012Lille 0.042 �0.015 0.081 �0.011 0.074 �0.009 0.355 �0.001Sites that have a marginal performanceTable Mountain 0.082 �0.017 0.123 �0.014 0.156 �0.011 0.250 �0.008Railroad Valley 0.123 �0.018 0.183 �0.015 0.229 �0.014 0.273 �0.010Goddard Space Flight Center 0.038 �0.026 0.063 �0.018 0.053 �0.019 0.295 �0.008Hamburg 0.032 �0.012 0.071 �0.011 0.060 �0.010 0.345 �0.007Sites of poor performanceBeijing 0.058 �0.032 0.086 �0.022 0.086 �0.022 0.255 �0.009XiangHe 0.039 �0.019 0.072 �0.017 0.062 �0.011 0.326 �0.007Dakar 0.079 �0.028 0.132 �0.037 0.147 �0.028 0.328 �0.086Banizoumbou 0.066 0.021 0.174 �0.005 0.298 �0.029 0.467 �0.049
aThe analysis covered the period of January–October 2012 based on 50 × 50 km2 subsets of VIIRS data gridded to 0.750 km resolution over the AERONETsites. The full analysis includes Accuracy or bias, Precision, and Total Uncertainty (APU) for different levels of surface brightness in each target area. Resultshere provide a cumulative evaluation for the average reflectance level.
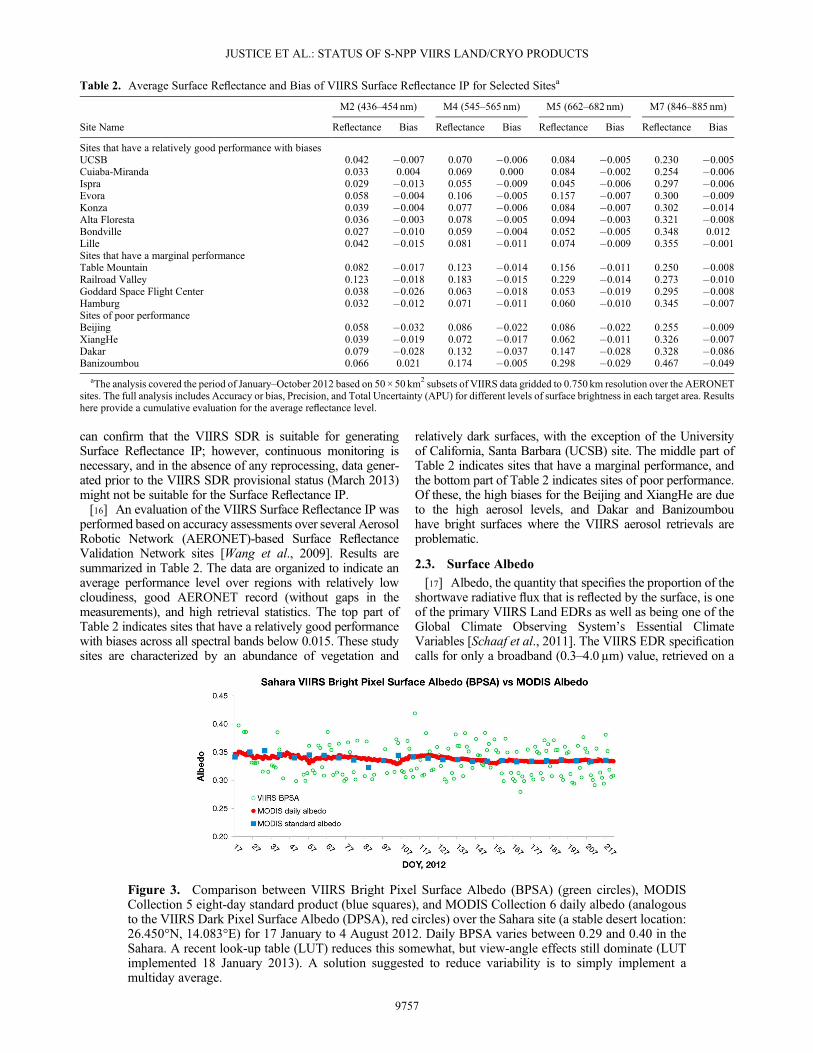
Figure 3. Comparison between VIIRS Bright Pixel Surface Albedo (BPSA) (green circles), MODISCollection 5 eight-day standard product (blue squares), and MODIS Collection 6 daily albedo (analogousto the VIIRS Dark Pixel Surface Albedo (DPSA), red circles) over the Sahara site (a stable desert location:26.450°N, 14.083°E) for 17 January to 4 August 2012. Daily BPSA varies between 0.29 and 0.40 in theSahara. A recent look-up table (LUT) reduces this somewhat, but view-angle effects still dominate (LUTimplemented 18 January 2013). A solution suggested to reduce variability is to simply implement amultiday average.
JUSTICE ET AL.: STATUS OF S-NPP VIIRS LAND/CRYO PRODUCTS
9757
daily basis under cloud-free conditions. Two algorithms havebeen implemented as part of the Albedo EDR to fulfill this op-erational requirement. The first (designated as a Dark PixelSurface Albedo or DPSA) is derived from the validatedMODIS heritage [Cescatti et al., 2012; Román et al., 2009;Schaaf et al., 2002] and relies on the periodic multidayretrieval of narrowband anisotropy models to estimate theBidirectional Reflectance Distribution Function (BRDF) ofeach field of view [Lucht et al., 2000; Wanner et al., 1995].These periodic models are then coupled with the surfacereflectance retrieved on any single day to obtain an estimateof the daily shortwave albedo at the overpass time. Similarapproaches have been employed with data from Multi-angleImaging SpectroRadiometer (MISR), Meteosat, MeteosatSecond Generation (MSG)/Seviri, and MEdium ResolutionImaging Spectrometer (MERIS) GLOBAlbedo. The second ap-proach (designated as a Bright Pixel Surface Albedo or BPSA)relies on top-of-atmosphere radiance measurements at overpasstime and precomputed radiative transfer model information toestimate daily broadband surface albedos [Liang, 2003].[18] Only the BPSA output has been produced since launch.
After concern over the VIIRS Rotating Telescope Assemblydegradation subsided [Barrie et al., 2012], daily records ofthe BPSA product were investigated over several field sites.Results were noisy and variable, a condition ascribed to poorcloud clearing or atmospheric correction. However, investiga-tion of IDPS BPSA outputs (version Mx6.2) over a location inthe Sahara (26.450°N, 14.083°E) revealed that this variabilitycontinued over what should have been a stable calibrationlocation (cf. Figure 3). A look-up table correction over thesummer of 2012 exacerbated the problem. Investigation ofrecent studies using the BPSA approach indicate that averag-ing (both spatially and temporally) can be used to derive a sta-ble product [He et al., 2012]. On the other hand, when dailyestimates from the VIIRS were tested using the MODIS dailyalgorithm code [Wang et al., 2012], the results were stable andsimilar to what is achieved with MODIS data. While efforts toincorporate surface BRDF in the construction of linear regres-sion models to estimate broadband albedo are being examined[Wang et al., submitted to Journal of Geophysical Research:Atmospheres, 2013], the operational BPSA algorithm has yet
to undergo substantial code changes, unit testing, and evalua-tion exercises, making it at this time unusable for land studies.Therefore, while the VIIRS input spectral data is behavingwell, users should beware of the deficiencies inherent in thecurrent baseline algorithm (the BPSA) and should refrain fromusing the Albedo EDR in science applications until such prob-lems are addressed.
2.4. Vegetation Index
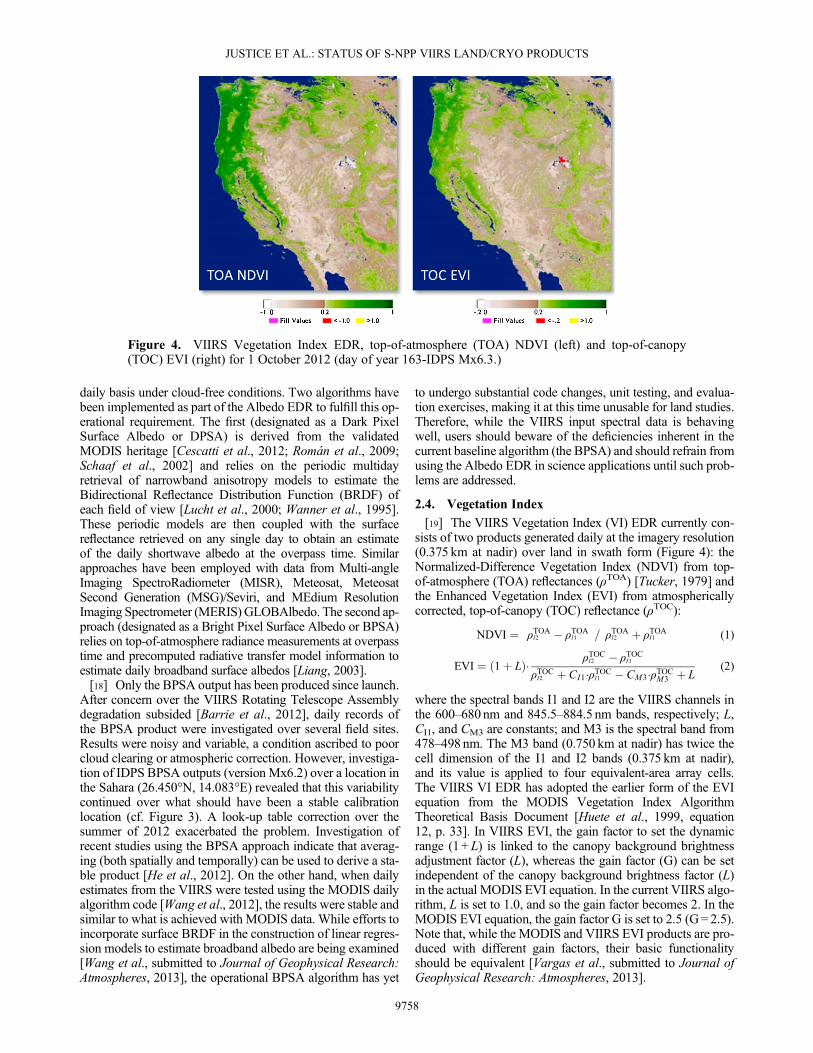
[19] The VIIRS Vegetation Index (VI) EDR currently con-sists of two products generated daily at the imagery resolution(0.375 km at nadir) over land in swath form (Figure 4): theNormalized-Difference Vegetation Index (NDVI) from top-of-atmosphere (TOA) reflectances (ρTOA) [Tucker, 1979] andthe Enhanced Vegetation Index (EVI) from atmosphericallycorrected, top-of-canopy (TOC) reflectance (ρTOC):
NDVI ¼ ρTOAI2 � ρTOAI1
� �= ρTOAI2 þ ρTOAI1
� �(1)
EVI ¼ 1þ Lð Þ� ρTOCI2 � ρTOCI1
ρTOCI2 þ CI1�ρTOCI1 � CM3�ρTOCM3 þ L(2)
where the spectral bands I1 and I2 are the VIIRS channels inthe 600–680 nm and 845.5–884.5 nm bands, respectively; L,CI1, and CM3 are constants; and M3 is the spectral band from478–498 nm. The M3 band (0.750 km at nadir) has twice thecell dimension of the I1 and I2 bands (0.375 km at nadir),and its value is applied to four equivalent-area array cells.The VIIRS VI EDR has adopted the earlier form of the EVIequation from the MODIS Vegetation Index AlgorithmTheoretical Basis Document [Huete et al., 1999, equation12, p. 33]. In VIIRS EVI, the gain factor to set the dynamicrange (1+L) is linked to the canopy background brightnessadjustment factor (L), whereas the gain factor (G) can be setindependent of the canopy background brightness factor (L)in the actual MODIS EVI equation. In the current VIIRS algo-rithm, L is set to 1.0, and so the gain factor becomes 2. In theMODIS EVI equation, the gain factor G is set to 2.5 (G=2.5).Note that, while the MODIS and VIIRS EVI products are pro-duced with different gain factors, their basic functionalityshould be equivalent [Vargas et al., submitted to Journal ofGeophysical Research: Atmospheres, 2013].
Figure 4. VIIRS Vegetation Index EDR, top-of-atmosphere (TOA) NDVI (left) and top-of-canopy(TOC) EVI (right) for 1 October 2012 (day of year 163-IDPS Mx6.3.)
JUSTICE ET AL.: STATUS OF S-NPP VIIRS LAND/CRYO PRODUCTS
9758
[20] The VI EDR is based on bidirectional reflectancefactor estimates, representing intrinsic measurements foractual sensor view and sun angle conditions [Schaepman-Strub et al., 2006]. The EDR includes quality flags on land/water, cloud confidence, including thin cirrus, heavy aerosolloadings, and exclusion conditions.[21] In general, the VIIRS VI EDR is radiometrically
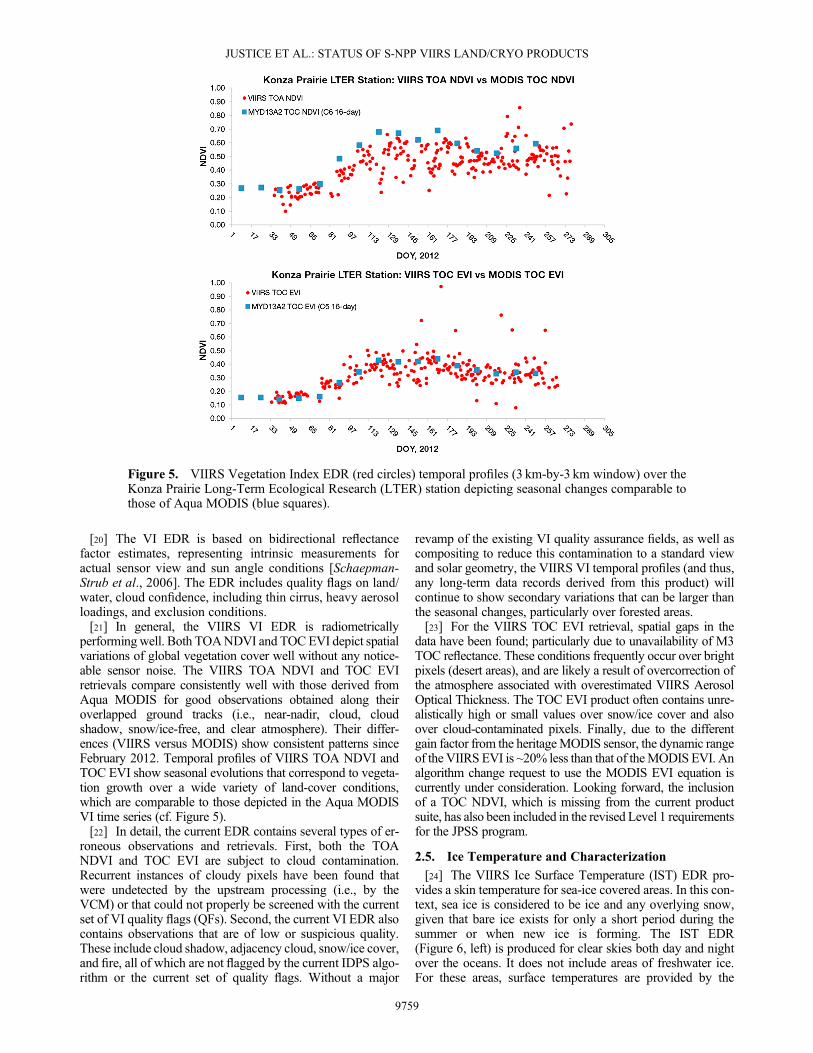
performing well. Both TOANDVI and TOCEVI depict spatialvariations of global vegetation cover well without any notice-able sensor noise. The VIIRS TOA NDVI and TOC EVIretrievals compare consistently well with those derived fromAqua MODIS for good observations obtained along theiroverlapped ground tracks (i.e., near-nadir, cloud, cloudshadow, snow/ice-free, and clear atmosphere). Their differ-ences (VIIRS versus MODIS) show consistent patterns sinceFebruary 2012. Temporal profiles of VIIRS TOA NDVI andTOC EVI show seasonal evolutions that correspond to vegeta-tion growth over a wide variety of land-cover conditions,which are comparable to those depicted in the Aqua MODISVI time series (cf. Figure 5).[22] In detail, the current EDR contains several types of er-
roneous observations and retrievals. First, both the TOANDVI and TOC EVI are subject to cloud contamination.Recurrent instances of cloudy pixels have been found thatwere undetected by the upstream processing (i.e., by theVCM) or that could not properly be screened with the currentset of VI quality flags (QFs). Second, the current VI EDR alsocontains observations that are of low or suspicious quality.These include cloud shadow, adjacency cloud, snow/ice cover,and fire, all of which are not flagged by the current IDPS algo-rithm or the current set of quality flags. Without a major
revamp of the existing VI quality assurance fields, as well ascompositing to reduce this contamination to a standard viewand solar geometry, the VIIRS VI temporal profiles (and thus,any long-term data records derived from this product) willcontinue to show secondary variations that can be larger thanthe seasonal changes, particularly over forested areas.[23] For the VIIRS TOC EVI retrieval, spatial gaps in the
data have been found; particularly due to unavailability of M3TOC reflectance. These conditions frequently occur over brightpixels (desert areas), and are likely a result of overcorrection ofthe atmosphere associated with overestimated VIIRS AerosolOptical Thickness. The TOC EVI product often contains unre-alistically high or small values over snow/ice cover and alsoover cloud-contaminated pixels. Finally, due to the differentgain factor from the heritageMODIS sensor, the dynamic rangeof the VIIRS EVI is ~20% less than that of theMODIS EVI. Analgorithm change request to use the MODIS EVI equation iscurrently under consideration. Looking forward, the inclusionof a TOC NDVI, which is missing from the current productsuite, has also been included in the revised Level 1 requirementsfor the JPSS program.
2.5. Ice Temperature and Characterization
[24] The VIIRS Ice Surface Temperature (IST) EDR pro-vides a skin temperature for sea-ice covered areas. In this con-text, sea ice is considered to be ice and any overlying snow,given that bare ice exists for only a short period during thesummer or when new ice is forming. The IST EDR(Figure 6, left) is produced for clear skies both day and nightover the oceans. It does not include areas of freshwater ice.For these areas, surface temperatures are provided by the
Figure 5. VIIRS Vegetation Index EDR (red circles) temporal profiles (3 km-by-3 km window) over theKonza Prairie Long-Term Ecological Research (LTER) station depicting seasonal changes comparable tothose of Aqua MODIS (blue squares).
JUSTICE ET AL.: STATUS OF S-NPP VIIRS LAND/CRYO PRODUCTS
9759
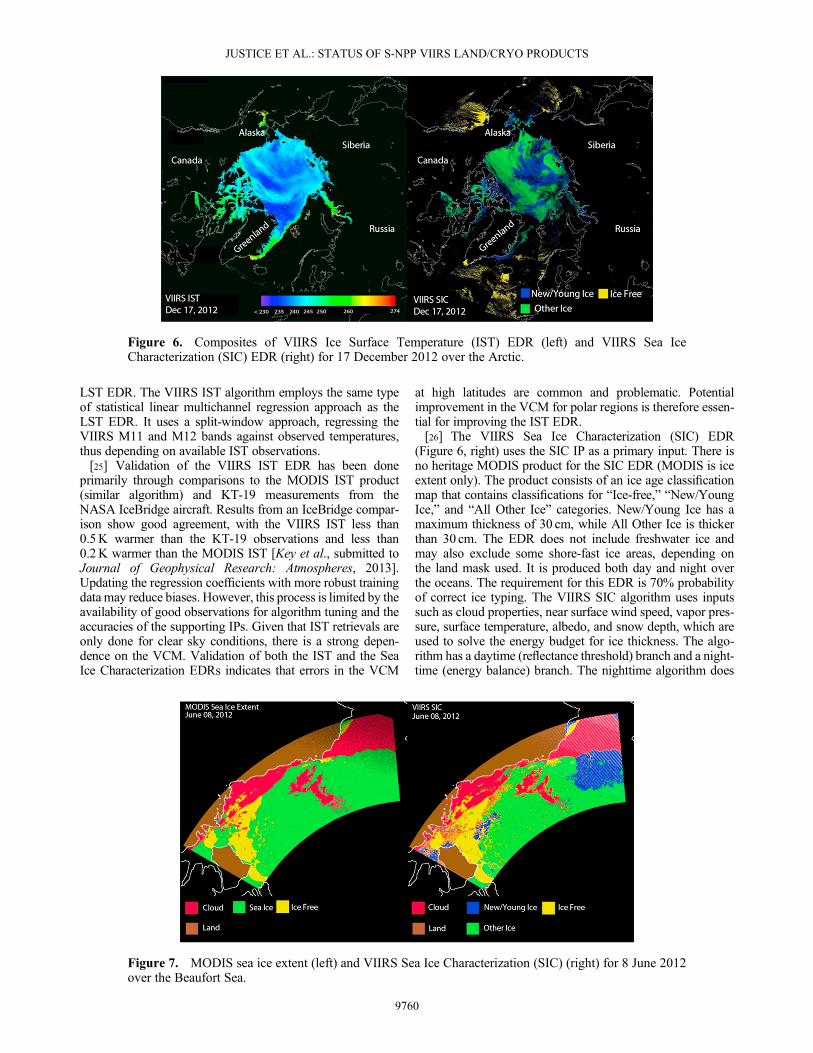
LST EDR. The VIIRS IST algorithm employs the same typeof statistical linear multichannel regression approach as theLST EDR. It uses a split-window approach, regressing theVIIRS M11 and M12 bands against observed temperatures,thus depending on available IST observations.[25] Validation of the VIIRS IST EDR has been done
primarily through comparisons to the MODIS IST product(similar algorithm) and KT-19 measurements from theNASA IceBridge aircraft. Results from an IceBridge compar-ison show good agreement, with the VIIRS IST less than0.5K warmer than the KT-19 observations and less than0.2K warmer than the MODIS IST [Key et al., submitted toJournal of Geophysical Research: Atmospheres, 2013].Updating the regression coefficients with more robust trainingdata may reduce biases. However, this process is limited by theavailability of good observations for algorithm tuning and theaccuracies of the supporting IPs. Given that IST retrievals areonly done for clear sky conditions, there is a strong depen-dence on the VCM. Validation of both the IST and the SeaIce Characterization EDRs indicates that errors in the VCM
at high latitudes are common and problematic. Potentialimprovement in the VCM for polar regions is therefore essen-tial for improving the IST EDR.[26] The VIIRS Sea Ice Characterization (SIC) EDR
(Figure 6, right) uses the SIC IP as a primary input. There isno heritage MODIS product for the SIC EDR (MODIS is iceextent only). The product consists of an ice age classificationmap that contains classifications for “Ice-free,” “New/YoungIce,” and “All Other Ice” categories. New/Young Ice has amaximum thickness of 30 cm, while All Other Ice is thickerthan 30 cm. The EDR does not include freshwater ice andmay also exclude some shore-fast ice areas, depending onthe land mask used. It is produced both day and night overthe oceans. The requirement for this EDR is 70% probabilityof correct ice typing. The VIIRS SIC algorithm uses inputssuch as cloud properties, near surface wind speed, vapor pres-sure, surface temperature, albedo, and snow depth, which areused to solve the energy budget for ice thickness. The algo-rithm has a daytime (reflectance threshold) branch and a night-time (energy balance) branch. The nighttime algorithm does
Figure 6. Composites of VIIRS Ice Surface Temperature (IST) EDR (left) and VIIRS Sea IceCharacterization (SIC) EDR (right) for 17 December 2012 over the Arctic.
Figure 7. MODIS sea ice extent (left) and VIIRS Sea Ice Characterization (SIC) (right) for 8 June 2012over the Beaufort Sea.
JUSTICE ET AL.: STATUS OF S-NPP VIIRS LAND/CRYO PRODUCTS
9760
not utilize albedo as input, relying more on the IST EDR todetermine ice growth and subsequent thickness.[27] The SIC EDR in its present form is unlikely to meet the
specification of 70% probability for correct classification.Although the SIC IP agrees well with the MODIS sea iceextent product for comparisons performed in the BeaufortSea region, the classification of ice type by the SIC EDR variesin accuracy. The SIC EDR is thus likely to be useful for iden-tification of ice versus ice-free areas, but currently, there is nospecification for this capability. The SIC EDR algorithmexhibits reasonable classification in some cases, althoughimprovements to the algorithm will need to be devised andtested to overcome significant classification errors. Somemisclassification appears to be caused by errors in snow depthparameterization, which is currently based on climatology.False ice is often observed near cloud edges. For the SICEDR daytime branch of the algorithm during the melt season,misclassifications occur when the lower reflectance of meltingsea ice appears to cause the SIC EDR to indicate New/YoungIce, although this type of ice cannot be present this time of year(cf. Figure 7, right). Note, however, that the distribution ofice and ice-free areas compares well with the MODIS sea iceextent in this example. For the nighttime branch of the SIC
EDR, ice misclassifications have been found that are likelydue to low opacity clouds or ice fog, which result in errors tothe IST IP that are in turn passed to the SIC EDR [Key et al.,submitted to Journal of Geophysical Research: Atmospheres,2013].
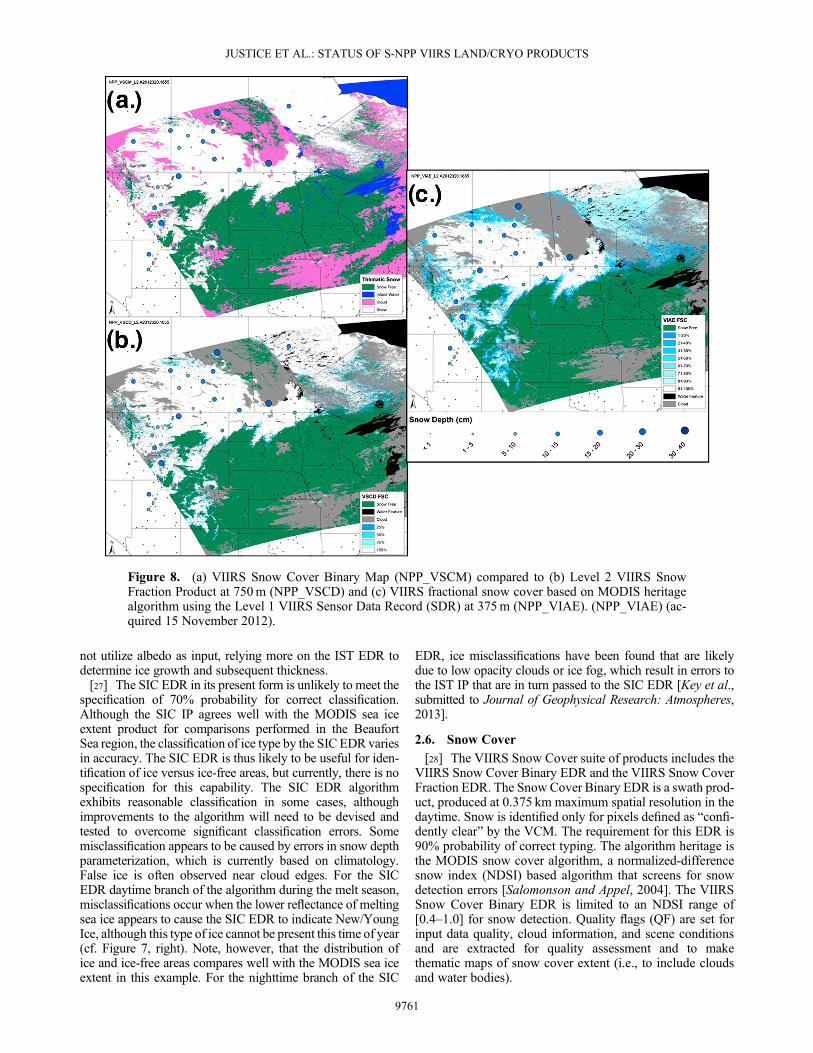
2.6. Snow Cover
[28] The VIIRS Snow Cover suite of products includes theVIIRS Snow Cover Binary EDR and the VIIRS Snow CoverFraction EDR. The Snow Cover Binary EDR is a swath prod-uct, produced at 0.375 km maximum spatial resolution in thedaytime. Snow is identified only for pixels defined as “confi-dently clear” by the VCM. The requirement for this EDR is90% probability of correct typing. The algorithm heritage isthe MODIS snow cover algorithm, a normalized-differencesnow index (NDSI) based algorithm that screens for snowdetection errors [Salomonson and Appel, 2004]. The VIIRSSnow Cover Binary EDR is limited to an NDSI range of[0.4–1.0] for snow detection. Quality flags (QF) are set forinput data quality, cloud information, and scene conditionsand are extracted for quality assessment and to makethematic maps of snow cover extent (i.e., to include cloudsand water bodies).
Figure 8. (a) VIIRS Snow Cover Binary Map (NPP_VSCM) compared to (b) Level 2 VIIRS SnowFraction Product at 750m (NPP_VSCD) and (c) VIIRS fractional snow cover based on MODIS heritagealgorithm using the Level 1 VIIRS Sensor Data Record (SDR) at 375m (NPP_VIAE). (NPP_VIAE) (ac-quired 15 November 2012).
JUSTICE ET AL.: STATUS OF S-NPP VIIRS LAND/CRYO PRODUCTS
9761
[29] The VIIRS Snow Cover Fraction EDR is generated byspatially aggregating four (i.e., 2 × 2) adjacent pixels in theBinary Snow Cover EDR to generate the fractional snowcover values using five discrete classes at 0.750 km resolu-tion: 0, 25, 50, 75, and 100%. Quality flags from the VIIRSSnow Cover Binary EDR are aggregated in the SnowFraction algorithm’s QF data. There is no similarity betweenthe VIIRS Snow Cover Fraction EDR and the MODIS Level-2 fractional snow cover algorithm. The latter is based on aNDSI regression using reflectance for input to estimatefractional snow cover continuously over the 1–100% range[Salomonson and Appel, 2004]. The VIIRS Snow CoverFraction EDR maps the same snow extent as the VIIRSBinary Snow Cover EDR but at a coarser resolution.[30] A preliminary evaluation of the VIIRS Snow Cover
EDR shows that it is similar in accuracy to itsMODIS counter-part (MYD10) in mapping snow cover extent [Key et al.,submitted to Journal of Geophysical Research: Atmospheres,2013]. Confusion between clouds and snow that decreases ac-curacy in snow extent exists in both products. Note that theSnow Cover Binary EDR uses the same NDSI algorithm asMODIS to map snow cover but uses a different wavelength(VIIRS 0.640μm versus MODIS 0.555μm). The differencein visible bands may have an effect on sensitivity or thresholdselection of the NDSI for snow cover mapping, but this effecthas yet to be investigated. Since the VIIRS Snow CoverBinary EDR and MODIS are similar, the working assumptionis that the VIIRS product has an overall accuracy of ~90%,similar to that of MODIS in clear conditions. The VIIRSSnow Cover Binary EDR accuracy and quality has beenobserved to be static over seasons and many situationscompared to the MYD10 and other snow cover maps. Snow/cloud or cloud/snow confusion causes snow commission oromission errors. These vary spatially and temporally in a sceneand across seasons, with a typical range of 0–10% of pixels ina scene, depending on cloud and illumination conditions inthe scene.[31] In its current form, the VIIRS SnowCover Fraction EDR
is less accurate than the VIIRS Snow Cover Binary EDR. Arevised version of the VIIRS Snow Cover Fraction EDR wasdeveloped by adapting the MODIS Collection 6 fractional
snow algorithm to the VIIRS data and is being run in theLand PEATE (Figure 8c). Retrievals of fractional cover arebased on the full range of NDSI (0.0–1.0) at the VIIRSimagery resolution (0.375 km). These improvements areshown to reduce omission and commission errors and improveretrieval accuracy for mapping snow cover extent—a criticalfactor in predicting snowmelt runoff.
2.7. Active Fires
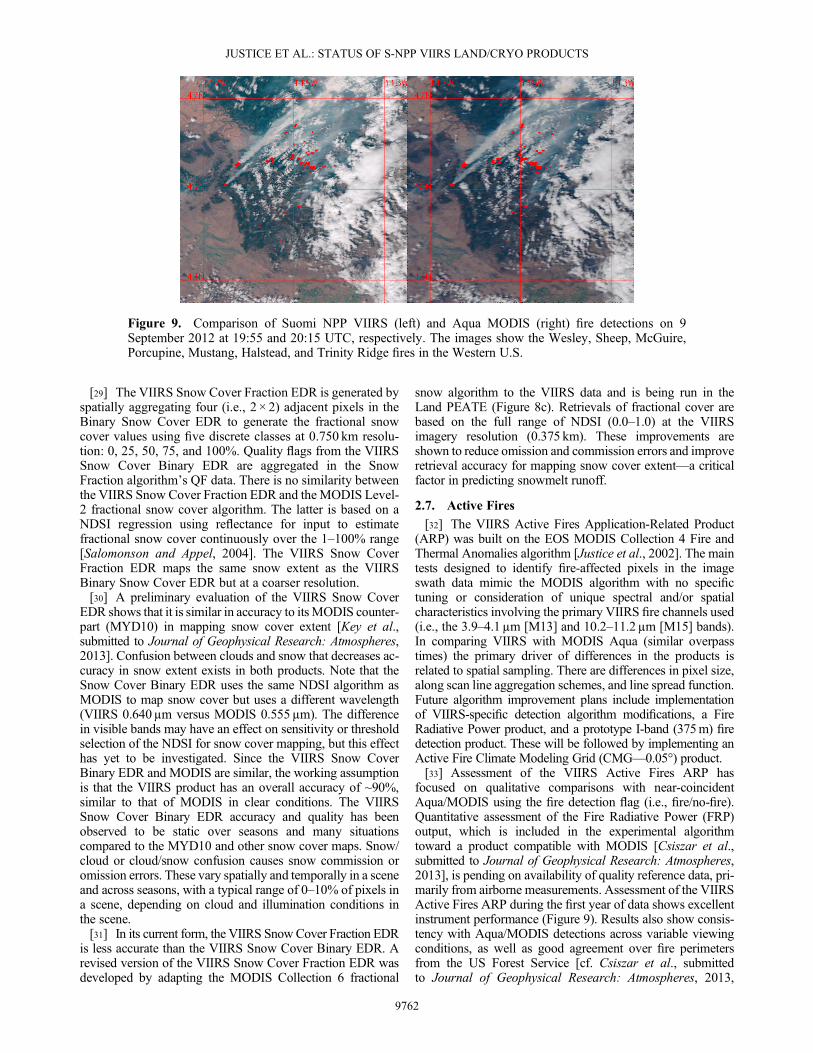
[32] The VIIRS Active Fires Application-Related Product(ARP) was built on the EOS MODIS Collection 4 Fire andThermal Anomalies algorithm [Justice et al., 2002]. The maintests designed to identify fire-affected pixels in the imageswath data mimic the MODIS algorithm with no specifictuning or consideration of unique spectral and/or spatialcharacteristics involving the primary VIIRS fire channels used(i.e., the 3.9–4.1μm [M13] and 10.2–11.2μm [M15] bands).In comparing VIIRS with MODIS Aqua (similar overpasstimes) the primary driver of differences in the products isrelated to spatial sampling. There are differences in pixel size,along scan line aggregation schemes, and line spread function.Future algorithm improvement plans include implementationof VIIRS-specific detection algorithm modifications, a FireRadiative Power product, and a prototype I-band (375m) firedetection product. These will be followed by implementing anActive Fire Climate Modeling Grid (CMG—0.05°) product.[33] Assessment of the VIIRS Active Fires ARP has
focused on qualitative comparisons with near-coincidentAqua/MODIS using the fire detection flag (i.e., fire/no-fire).Quantitative assessment of the Fire Radiative Power (FRP)output, which is included in the experimental algorithmtoward a product compatible with MODIS [Csiszar et al.,submitted to Journal of Geophysical Research: Atmospheres,2013], is pending on availability of quality reference data, pri-marily from airborne measurements. Assessment of the VIIRSActive Fires ARP during the first year of data shows excellentinstrument performance (Figure 9). Results also show consis-tency with Aqua/MODIS detections across variable viewingconditions, as well as good agreement over fire perimetersfrom the US Forest Service [cf. Csiszar et al., submittedto Journal of Geophysical Research: Atmospheres, 2013,
Figure 9. Comparison of Suomi NPP VIIRS (left) and Aqua MODIS (right) fire detections on 9September 2012 at 19:55 and 20:15 UTC, respectively. The images show the Wesley, Sheep, McGuire,Porcupine, Mustang, Halstead, and Trinity Ridge fires in the Western U.S.
JUSTICE ET AL.: STATUS OF S-NPP VIIRS LAND/CRYO PRODUCTS
9762
Figures 5–8]. In terms of algorithm performance, the currentproduct shows satisfactory results with good overall correla-tion with near-coincident Aqua/MODIS active fire productdata. However, false alarms leading to large clusters of spuri-ous fire pixels occasionally occur due to inappropriatehandling of the input SDR quality flags. This and earlierquality issues have been documented [Csiszar et al., 2012].Improvements to the VIIRS Active Fire ARP are being devel-oped and run in the Land PEATE. There is no burned areaproduct currently being generated from VIIRS.
2.8. Surface Type
[34] The VIIRS Surface Type EDR is a swath product builtby reprojecting the VIIRS Gridded Quarterly Surface Type IPand overlaying it with the Active Fire ARP, SnowCover EDR,and Vegetation Fractional Greenness products. It is producedat 1.0 km spatial resolution based on the previous 12monthsof VIIRS data. The EDR provides 17 surface type classes fol-lowing the International Geosphere-Biosphere Programme(IGBP) classification scheme [Belward et al., 1999; Friedlet al., 2002]. The requirement for this EDR is a 70% metricof correct classification. Off-the-shelf commercial software isused to generate the GriddedQuarterly Surface Type IP, whichprovides the foundation for the EDR. The algorithm uses anensemble decision tree classifier to perform a supervised clas-sification of global VIIRS data using a set of global trainingsites [Quinlan, 1996]. Input features include spectral informa-tion and temporal metrics developed from 12months of VIIRSvisible and infrared band information. Note that, because theGridded Quarterly Surface Type IP requires a full year of inputdata fromVIIRS, evaluation of the IP and EDR currently relieson prototype results from MODIS.[35] The Surface Type EDR is expected to meet its target re-
quirement of 70% overall classification accuracy. However,uniform land-cover types (e.g., barren/sparsely vegetated;permanent snow, and ice) are likely to have much higherclassification accuracies than more complex and less separableclasses. Results using MODIS data demonstrate that the algo-rithm is working but also indicate significant challengesrelated to confusion among specific classes that are also prob-lematic in the MODIS Collection 5 land-cover product (e.g.,shrublands, savannas, and mixture classes, such as the agricul-tural mosaic) [Friedl et al., 2010]. The agriculture class,because of its global extent and diversity, is also challengingto map. It is unlikely that these issues will be resolved whenthe Quarterly Surface Type IP and Surface Type EDR are gen-erated from VIIRS data. Thus, the VIIRS Surface Type EDR’saccuracy will be below the 70% target for some classes.Differences in classification results across time will introducespurious land-cover changes that are also difficult to addressin the current algorithm implementation.
3. Data Generation and Distribution of VIIRSLand and Cryosphere Products
[36] For the S-NPP mission, NOAA’s CLASS provides themain archive for the IDPS-generated products and is the pri-mary facility for long-term archiving of these products. Note,however, that the primary focus of CLASS is data preservationand not on distribution (e.g., postprocessing is currently lim-ited to band subsetting and aggregation, and common servicessuch as spatial subsetting and reprojection are not available).
In addition to NOAACLASS, the VIIRS Land PEATE, whichis collocated with the MODIS Land production facilities, has anumber of capabilities to support land science users of VIIRSdata and leverages NASA’s experience in the production ofglobal land measurements [Masuoka et al., 2011]. These in-clude support for evaluation against MODIS science products,quality assessment and validation, and a test bed for algorithmchanges [Román et al., 2011;Wolfe et al., 2010]. In a numberof cases, the NASA VIIRS land and cryosphere teams aredeveloping and testing MODIS continuity or improvedalgorithms at the Land PEATE, as described above.[37] Currently, the Land PEATE aggregates the IDPS prod-
ucts into standard 5min “MODIS-like” granules and distrib-utes the data through NASA’s Level 1 and AtmosphereArchive and Distribution System (LAADS) [Masuoka et al.,2007] in a compact HDF4 format that is compatible with stan-dard EOS MODIS products. The Land PEATE also producesdaily and multiday global gridded (Level 3) versions of theIDPS EDR products that can be compared to the similarMODIS products. These data are made available to theNASAVIIRS Land Science Team and the broader communitythrough the LAADS.[38] To aid in understanding of the VIIRS instrument’s ca-
pabilities for NASA earth science research and develop thelong-term data record, the Land PEATE is working to regener-ate the SDR and Land EDR, ARP, and IP products fromJanuary 2012 to the present, using the best available calibra-tion and latest available algorithm changes. A number of algo-rithm changes recommended by the science team as a result ofthis evaluation will be included, and L3 daily and multidaygridded products will be generated. The results of this exercisewill enable the science team to more fully evaluate the VIIRSinstrument’s usefulness in producing high-quality science dataproducts and demonstrate improvements that could be made tothe NOAA products. This reprocessing will also fulfill arequirement to provide reprocessed L1 VIIRS data for theClouds and the Earth’s Radiant Energy System (CERES)mission Climate Data Record (CDR). As demonstrated byMODIS and the AVHRR, reprocessing of the VIIRS datarecord will be essential for the production of climate qualitydata records that can further research in Earth System Science.
4. Next Steps for VIIRS Landand Cryosphere Products
[39] The VIIRS instrument has a critical role to play in long-term coarse resolution observations of the land surface. Aftermore than a year of on-orbit operations, the land group of theNASA S-NPP Science Team has determined that the VIIRSis an instrument well suited for continuing and further develop-ing the land science currently undertaken using MODIS and insome aspects provides an improvement over the MODIS in-strument capability. For example, the VIIRS instrument designconstrains pixel growth across the scan and provides completedaily global coverage, which has proven to be an advantage forland and cryosphere products. Similarly, the higher-resolutionimage bands and day-night band offer enhanced capabilitiesbeyondMODIS [Miller et al., 2012]. However, it is our conclu-sion that the full potential of VIIRS for global change scienceand applications will not be exploited through the operationalIDPS system as currently configured.
JUSTICE ET AL.: STATUS OF S-NPP VIIRS LAND/CRYO PRODUCTS
9763
[40] The JPSS program has been designed tomeet the needs ofthe NOAA operational user community (e.g., National WeatherService, National Centers for Environmental Prediction, andAir Force Weather Agency) with product specifications tomeet those needs, with no requirement for developing scienceproducts or developing a consistent long-term data recordneeded for global change science. Improvements are slowlybeing made to the IDPS and EDRs as problems are encoun-tered or proposed improvements made by the VIIRSAlgorithm and science teams are accepted, and this willcontinue until the EDR specifications are met. However, thismeans that there is no archive of consistently processed dataproducts and there is no reprocessing planned usingthe IDPS system. In addition, some of the improvementssuggested by the Land Science Team will not be accepted;although they would result in better products, as they are in-compatible with the configuration of the IDPS processingchain and the current EDR algorithms. A more rapid and nim-ble system for integration and testing of improvements toVIIRS land and cryosphere products is needed, preferably fol-lowing the approach developed for MODIS which enablesthorough testing of algorithm changes and dependencies onglobal time series and golden tiles before moving them intoproduction. As with MODIS, the VIIRS data record can nowbe improved based on the ongoing efforts to better understandthe instrument calibration and product accuracy assessment,and in this context periodic reprocessing of the entire data re-cord from VIIRS is essential.[41] There are a number of land standard products from
MODIS which are not currently generated by the IDPS orplanned for IDPS production (i.e., Leaf Area Index/Fractionof Photosynthetically Active Radiation(LAI/FPAR), NetPrimary Productivity, Vegetation Dynamics (phenology),Vegetation Continuous Fields, and Burned Area). If NASAMODIS product continuity is to be maintained, these productswill need to be generated. At the same time both earth systemscience and remote sensing methods are advancing, andadditional global products could be considered, e.g.,Evapotranspiration, Forest Cover Change, and Crop Type.Similarly, although there has been considerable investment inregional ground station, Direct Read-Out capability fromVIIRS, there is a strong interest from the science and applica-tions communities to obtain global VIIRS data in near-real timewith the functionality similar to that of the NASA LandAtmosphere Near-real-time Capability for EOS (LANCE)system [Murphy et al., 2012].[42] Based on the EDR evaluation experience to-date summa-
rized above, it is strongly recommended that a suite of VIIRSEarth Science Data Records for land science be developed, fromthe start of the S-NPP VIIRS observations, that will at least pro-vide continuity with the MODIS products. The lesson learnedfrom MODIS is that the data records should be under the stew-ardship of a group of scientists, responsible for quality and accu-racy assessment (QA and validation), product maintenance anddocumentation, guidance on data reprocessing, and outreach tothe science and applications community. Once these productshave been promoted to “provisional status,” product validationshould be initiated to take the products to at least Committeeon Earth Observation Satellites (CEOS) Validation Stage 2[Morisette et al., 2002]. There will also be some benefit fromconnecting these global-scale validation activities to the interna-tional Land Product Validation (LPV) subgroup of the CEOS
Working Group on Calibration and Validation, as is currentlythe case with MODIS.[43] To achieve the stated goal of MODIS data continuity
and the establishment of long-term data records throughVIIRS, it is important to start now to use S-NPP to establisha pathway to science use of VIIRS data in the JPSS era[Justice et al., 2011]. One year after launch, initial instrumentand operational product evaluations are now ending, and thenext step is to build on the success of the MODIS AdaptiveProcessing System and the Land PEATE data processing andgenerate and distribute high-quality VIIRS land and cryosphereproducts from the beginning of the VIIRS data record and withthe capability of subsequent reprocessing to meet the needs ofthe land science and applications communities.
ReferencesBarrie, J. D., P. D. Fuqua, M. J. Meshishnek, M. R. Ciofalo, C. T. Chu,J. A. Chaney, R. M. Moision, and L. Graziani (2012), Root cause determi-nation of on-orbit degradation of the VIIRS rotating telescope assembly,Proc. SPIE 8510, Earth Observing Systems XVII, 85101B-85101B,doi:10.1117/12.933276.
Belward, A. S., J. E. Estes, and K. D. Kline (1999), The IGBP-DIS global1-km land-cover data set DISCover: A project overview, Photogramm.Eng. Remote Sens., 65(9), 1013–1020.
Cescatti, A., et al. (2012), Intercomparison of MODIS albedo retrievals andin situ measurements across the global FLUXNET network, Remote Sens.Environ., 121, 323–334, doi:10.1016/j.rse.2012.02.019.
Csiszar, I., W. Schroeder, L. Giglio, and C. Justice (2012), VIIRS ARPRelease, Beta Data Quality (Read-me for Data Users): http://www.class.ncdc.noaa.gov/notification/pdfs/VIIRS_Active%20Fire%20ARP_Release_Readme_final.pdf—Last Updated: 10/22/2012.
Friedl, M. A., et al. (2002), Global land cover mapping from MODIS:Algorithms and early results, Remote Sens. Environ., 83(1–2), 287–302.
Friedl, M. A., D. Sulla-Menashe, B. Tan, A. Schneider, N. Ramankutty,A. Sibley, and X. Huang (2010), MODIS Collection 5 global land cover:Algorithm refinements and characterization of new datasets, RemoteSens. Environ., 114(1), 165–182, doi:10.1016/j.rse.2009.08.016.
He, T., S. Liang, D. Wang, H. Wu, Y. Yu, and J. Wang (2012), Estimation ofsurface albedo and directional reflectance from Moderate ResolutionImaging Spectroradiometer (MODIS) observations, Remote Sens.Environ., 119, 286–300.
Hook, S. J., R. G. Vaughan, H. Tonooka, and S. G. Schladow (2007),Absolute radiometric in-flight validation of mid infrared and thermal infra-red data from ASTER and MODIS on the terra spacecraft using the LakeTahoe, CA/NV, USA, automated validation site, IEEE Trans. Geosci.Remote Sens., 45(6), 1798–1807.
Huete, A., C. Justice, and W. Leeuwen (1999), MODIS Vegetation Index(MOD 13) Algorithm Theoretical Basis Document Version 3.0.Technical Report (Version 3, 1999, http://modis.gsfc.nasa.gov/data/atbd/atbd_mod13.pdf)Rep., NASA EOS-MODIS.
Hulley, G. C., and S. J. Hook (2009), Intercomparison of versions 4, 4.1 and5 of the MODIS land surface temperature and emissivity products and val-idation with laboratory measurements of sand samples from the NamibDesert, Namibia, Remote Sens. Environ., 113, 1313–1318.
Hulley, G. C., and S. J. Hook (2012), A radiance-based method for estimat-ing uncertainties in the Atmospheric Infrared Sounder (AIRS) land surfacetemperature product, J. Geophys. Res., 117(D20), D20117, doi:10.1029/2012JD018102.
Hulley, G. C., S. J. Hook, and A. M. Baldridge (2010), Generating consistentLand Surface Temperature and Emissivity (LST&E) products betweenASTER and MODIS data for earth science research, IEEE Trans. Geosci.Remote Sens., 49(9), 1,304–1,315, doi:10.1109/TGRS.2010.2063034.
Justice, C. O., L. Giglio, S. Korontzi, J. Owens, J. T. Morisette, D. Roy,J. Descloitres, S. Alleaume, F. Petitcolin, and Y. Kaufman (2002), TheMODIS fire products, Remote Sens. Environ., 83(1–2), 244–262.
Justice, C. O., E. Vermote, J. L. Privette, and A. Sei (2011), The evolution ofU.S. moderate resolution optical land remote sensing from AVHRR toVIIRS, in Land Remote Sensing and Global Environmental Change:NASA’s Earth Observing System and the Science of ASTER and MODIS,edited by B. Ramachandran, C. O. Justice, and M. J. Abrams, pp. 873,Springer Verlag, London, UK.
Liang, S. (2003), A direct algorithm for estimating land surface broadband albe-dos fromMODIS Imagery, IEEE Trans. Geosci. Remote Sens., 41, 136–145.
JUSTICE ET AL.: STATUS OF S-NPP VIIRS LAND/CRYO PRODUCTS
9764
Lucht, W., C. B. Schaaf, and A. H. Strahler (2000), An algorithm for theretrieval of albedo from space using semi-empirical BRDF models,IEEE Trans. Geosci. Remote Sens., 38, 977–998, doi:10.1109/36.841980.
Masuoka, E. J., R. E. Wolfe, S. Sinno, Y. Gang, and M. Teague (2007),A disk-based system for producing and distributing science productsfrom MODIS, Proceedings of the Geoscience and Remote SensingSymposium (IGARSS’07), Barcelona, Spain, 3043–3046, doi:10.1109/IGARSS.2007.4423486.
Masuoka, E., D. Roy, R. Wolfe, J. Morisette, S. Sinno, M. Teague,N. Saleous, S. Devadiga, C. O. Justice, and J. Nickeson (2011), MODISland data products: Generation, quality assurance and validation, in LandRemote Sensing and Global Environmental Change: NASA’s EarthObserving System and the Science of ASTER and MODIS, edited by B.Ramachandran, C. Justice, and M. Abrams, pp. 873, Springer Verlag,London, UK.
Miller, S. D., S. P. Mills, C. D. Elvidge, D. T. Lindsey, T. F. Lee, andJ. D. Hawkins (2012), Suomi satellite brings to light a unique frontierof nighttime environmental sensing capabilities, PNAS, 109(39),15,706–15,711, doi:10.1073/pnas.1207034109.
Morisette, J. T., J. L. Privette, and C. O. Justice (2002), A framework for thevalidation of MODIS land products, Remote Sens. Environ., 83(1–2),77–96, doi:10.1016/S0034-4257(02)00088-3.
Murphy, K., C. Justice, D. Lowe,M.Maiden, and D. Davies (2012), LANCEuser working group meeting, in The Earth Observer, edited, pp. 19–21,NASA GSFC.
Quinlan, J. R. (1996), Bagging, boosting, and c4.5, paper presented atThirteenth National Conference on Artificial Intelligence, AAAI Pressand the MIT Press.
Román, M. O., et al. (2009), The MODIS (Collection V005) BRDF/albedoproduct: Assessment of spatial representativeness over forested land-scapes, Remote Sens. Environ., 113, 2476–2498, doi:10.1016/j.rse.2009.07.009.
Román, M. O., C. Justice, I. Csiszar, J. R. Key, S. Devadiga, C. Davidson,R.Wolfe, and J. Privette (2011), Pre-launch evaluation of the NPPVIIRS landand cryosphere EDRs to meet NASA’s science requirements, Proceedings ofthe Geoscience and Remote Sensing Symposium (IGARSS’11), Vancouver,BC, 154–157, doi:10.1109/IGARSS.2011.6048921.
Román, M. O., I. Csiszar, C. Justice, J. Key, J. Privette, S. Devadiga,C. Davidson, R. E. Wolfe, and E. J. Masuoka (2012), Status of theSuomi NPP visible/infrared imager radiometer suite’s (VIIRS) land envi-ronmental data records (EDRs) after early evaluation of on-orbit perfor-mance, paper presented at Geoscience and Remote Sensing Symposium(IGARSS), 2012 IEEE International, 22–27 July 2012.
Salomonson, V. V., and I. Appel (2004), Estimating the fractional snowcover using the normalized difference snow index, Remote Sens. Environ.,89(3), 351–360.
Schaaf, C. B., et al. (2002), First operational BRDF, albedo and nadir reflec-tance products from MODIS, Remote Sens. Environ., 83(1–2), 135–148,doi:10.1016/S0034-4257(02)00091-3.
Schaaf, C. B., J. Liu, F. Gao, and A. H. Strahler (2011), MODIS albedo andreflectance anisotropy products from Aqua and Terra, in Land RemoteSensing and Global Environmental Change: NASA’s Earth ObservingSystem and the Science of ASTER and MODIS, edited by B.Ramachandran, C. Justice, and M. Abrams, pp. 873, Springer-Verlag,London, UK.
Schaepman-Strub, G., M. E. Schaepman, T. H. Painter, S. Dangel, andJ. V. Martonchik (2006), Reflectance quantities in optical remote sens-ing-definitions and case studies, Remote Sens. Environ., 103(1), 27–42,doi:10.1016/j.rse.2006.03.002.
Tucker, C. J. (1979), Red and photographic infrared linear combinations formonitoring vegetation, Remote Sens. Environ., 8(2), 127–150,doi:10.1016/0034-4257(79)90013-0.
Vermote, E. F., N. Z. El Saleous, and C. O. Justice (2002), Atmospheric cor-rection of MODIS data in the visible to middle infrared: First results,Remote Sens. Environ., 83(1–2), 97–111.
Wan, Z. M., and Z. L. Li (1997), A physics-based algorithm for retrievingland-surface emissivity and temperature from EOS/MODIS data, IEEETrans. Geosci. Remote Sens., 35(4), 980–996.
Wan, Z. M., and Z. L. Li (2008), Radiance-based validation of the V5MODIS land-surface temperature product, Int. J. Remote Sens.,29(17–18), 5373–5395.
Wang, Y., A. Lyapustin, J. L. Privette, J. Morisette, and B. N. Holben(2009), Atmospheric correction at AERONET locations: A new scienceand validation data set, IEEE Trans. Geosci. Remote Sens., 47(1),2450–2466.
Wang, Z., C. B. Schaaf, A. H. Strahler, J. Wang, C. E. Woodcock,M. J. Chopping, M. O. Román, A. V. Rocha, and Y. Shuai (2012),Evaluation of Moderate-Resolution Imaging Spectroradiometer (MODIS)snow albedo product (MCD43A) over tundra, Remote Sens. Environ., 117,264–280, doi:10.1016/j.rse.2011.10.002.
Wanner, W., X. Li, and A. H. Strahler (1995), On the derivation of kernelsfor kernel-driven models of bidirectional reflectance, J. Geophys. Res.,100(D10), 21,077–21,089, doi:10.1029/95JD02371.
Wolfe, R., S. Devadiga, G. Ye, E. Masuoka, and R. J. Schweiss (2010),Evaluation of the VIIRS land algorithms at the Land PEATE, IEEEGeoscience and Remote Sensing Symposium (IGARSS’10) Honolulu, HI(204-307), doi:10.1109/IGARSS.2010.5652831.
JUSTICE ET AL.: STATUS OF S-NPP VIIRS LAND/CRYO PRODUCTS
9765
Related Documents