57 Universitas Indonesia Lampiran 1. Data Hasil Pengujian Ergonomi/Kenyamanan A. Pengujian awal pada prototip-2 Suasana pengujian Perancangan dan pengembangan..., Yeny Pusvyta, FT UI, 2010.

Welcome message from author
This document is posted to help you gain knowledge. Please leave a comment to let me know what you think about it! Share it to your friends and learn new things together.
Transcript
57
Universitas Indonesia
Lampiran 1. Data Hasil Pengujian Ergonomi/Kenyamanan
A. Pengujian awal pada prototip-2
Suasana pengujian
Perancangan dan pengembangan..., Yeny Pusvyta, FT UI, 2010.
58
Universitas Indonesia
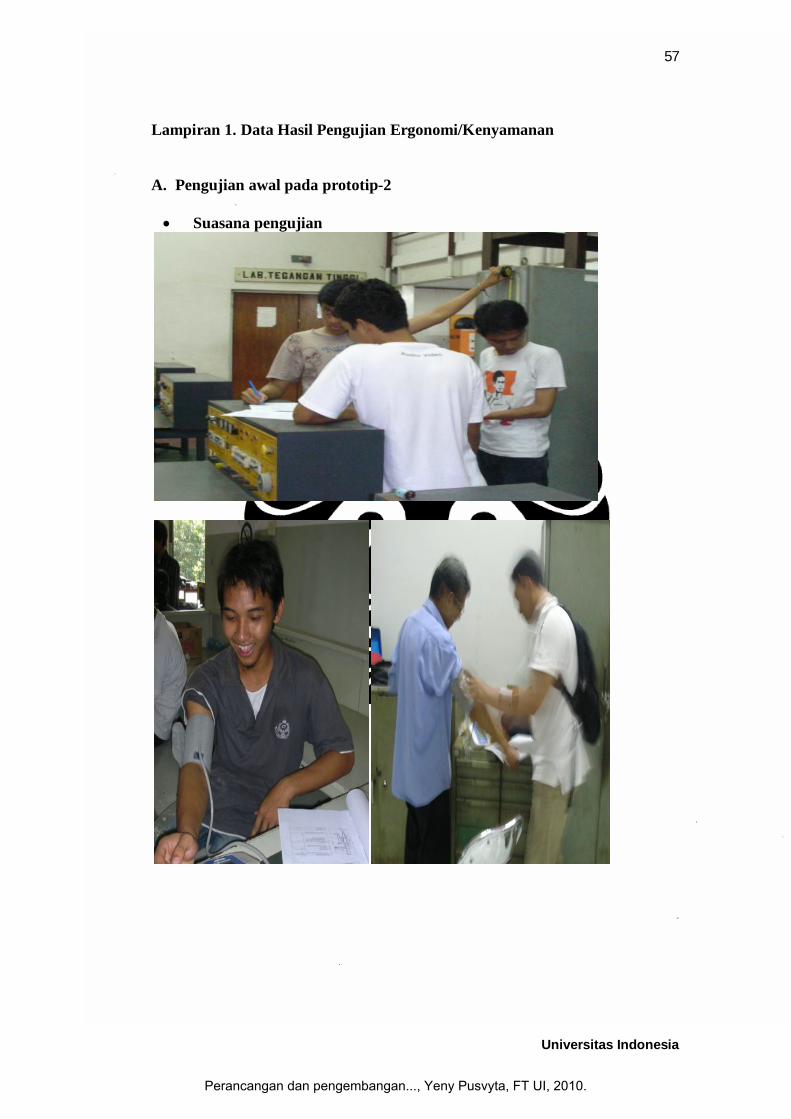
Data antropometri responden pada pengujian awal
Perancangan dan pengembangan..., Yeny Pusvyta, FT UI, 2010.

59
Universitas Indonesia
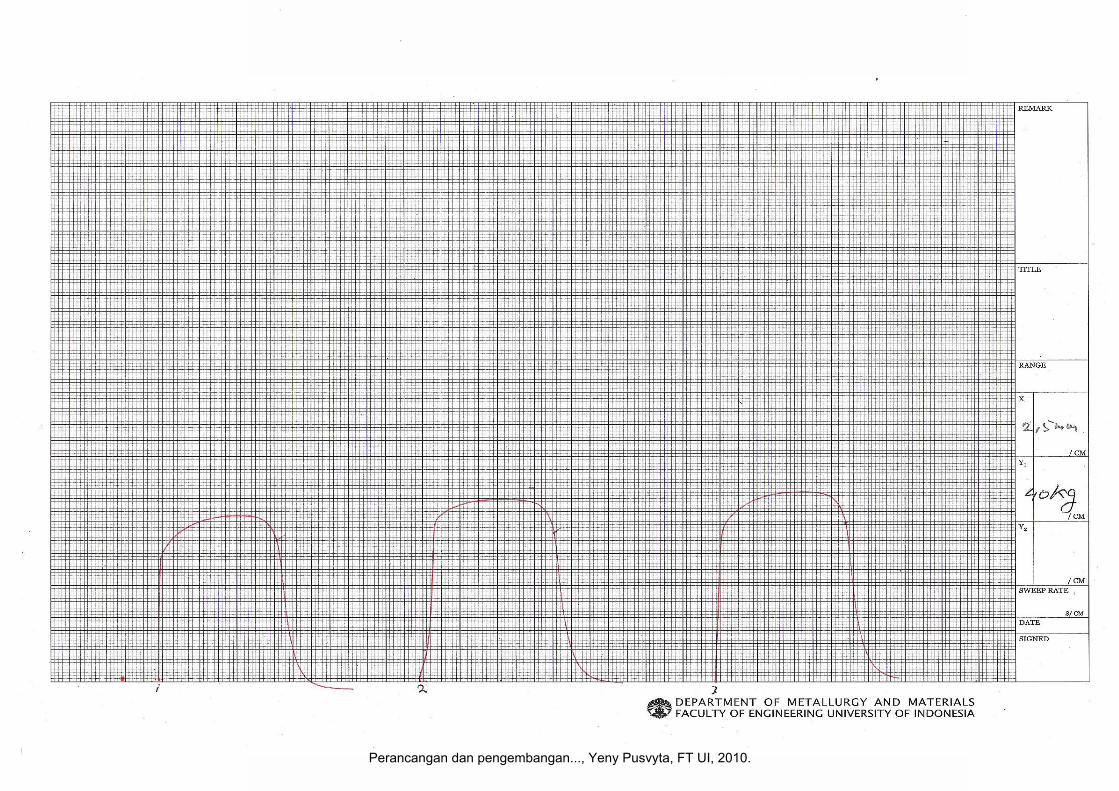
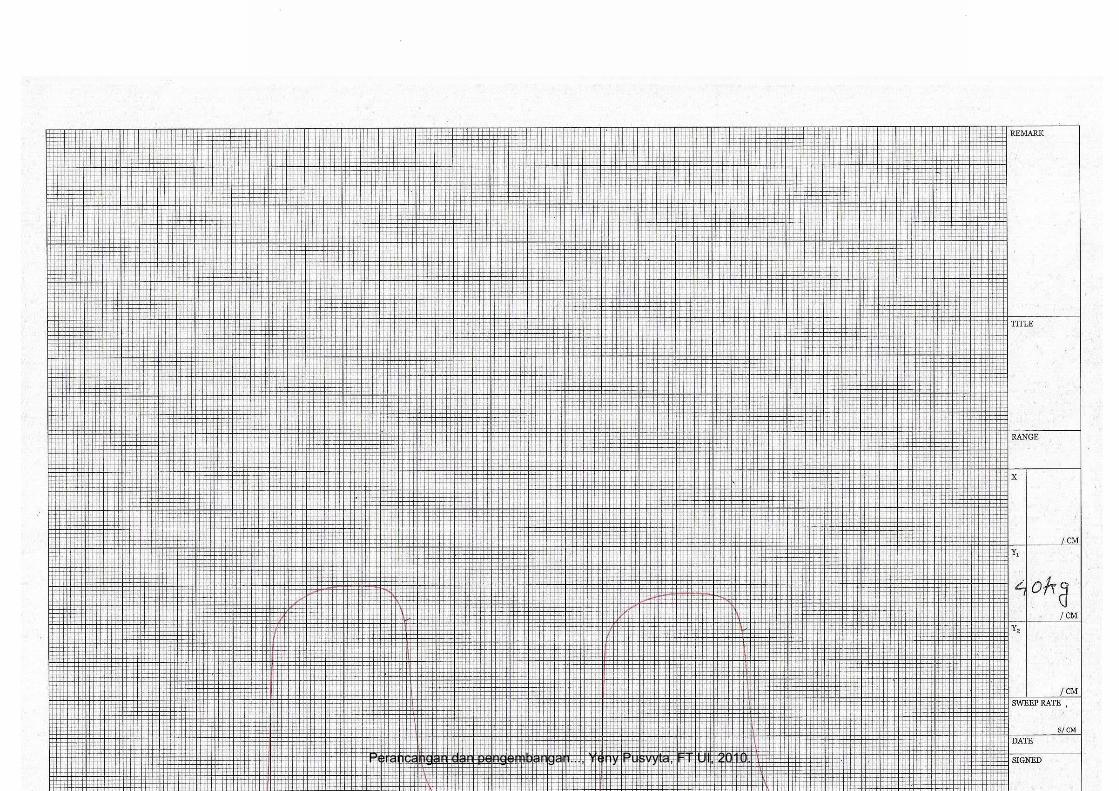
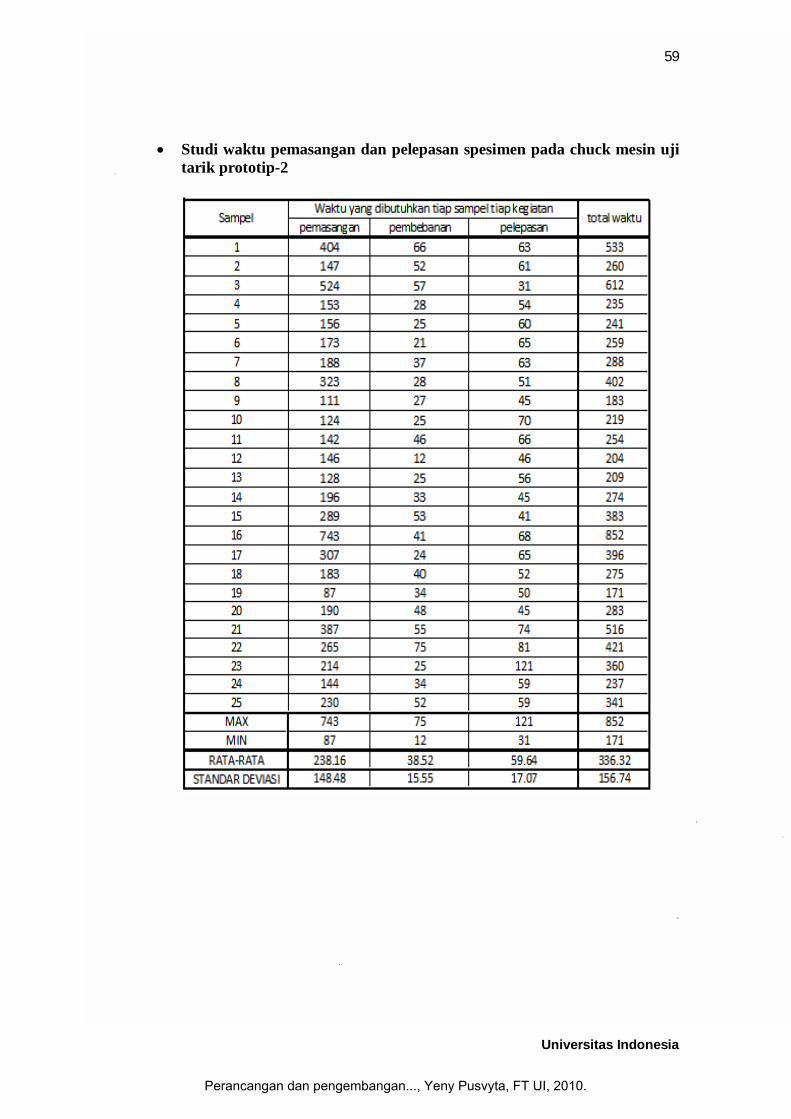
Studi waktu pemasangan dan pelepasan spesimen pada chuck mesin uji
tarik prototip-2
Perancangan dan pengembangan..., Yeny Pusvyta, FT UI, 2010.
60
Universitas Indonesia
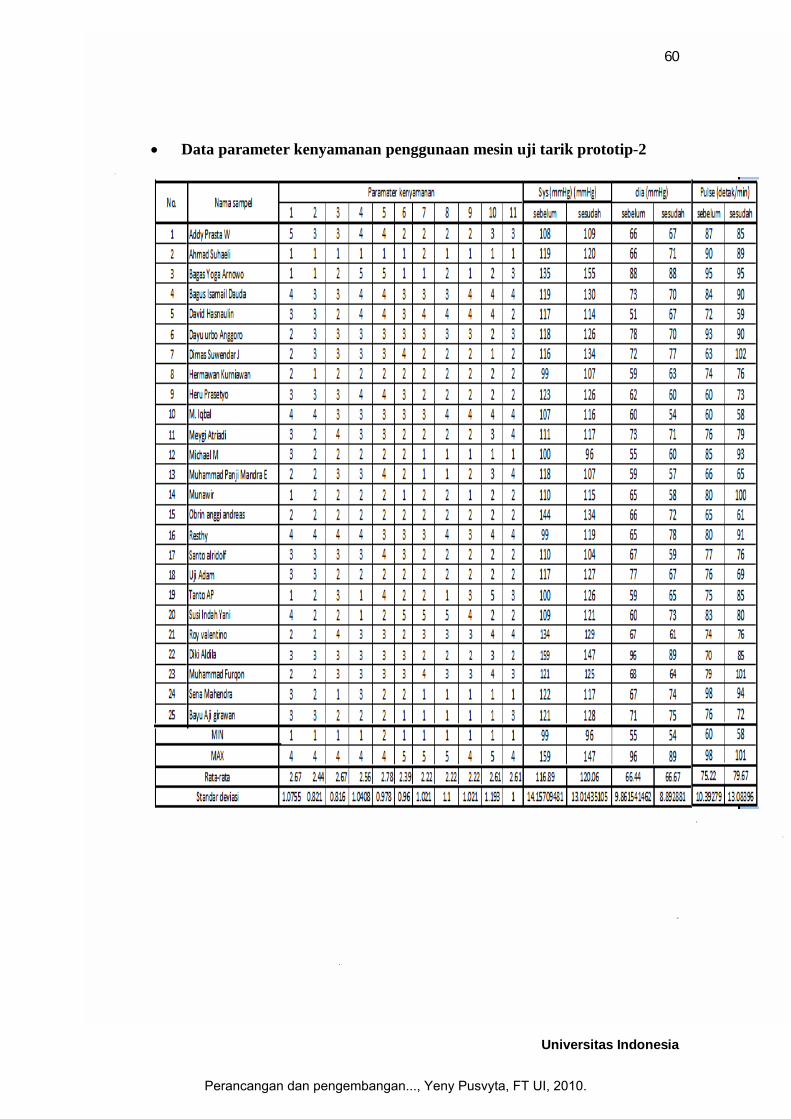
Data parameter kenyamanan penggunaan mesin uji tarik prototip-2
Perancangan dan pengembangan..., Yeny Pusvyta, FT UI, 2010.
61
Universitas Indonesia
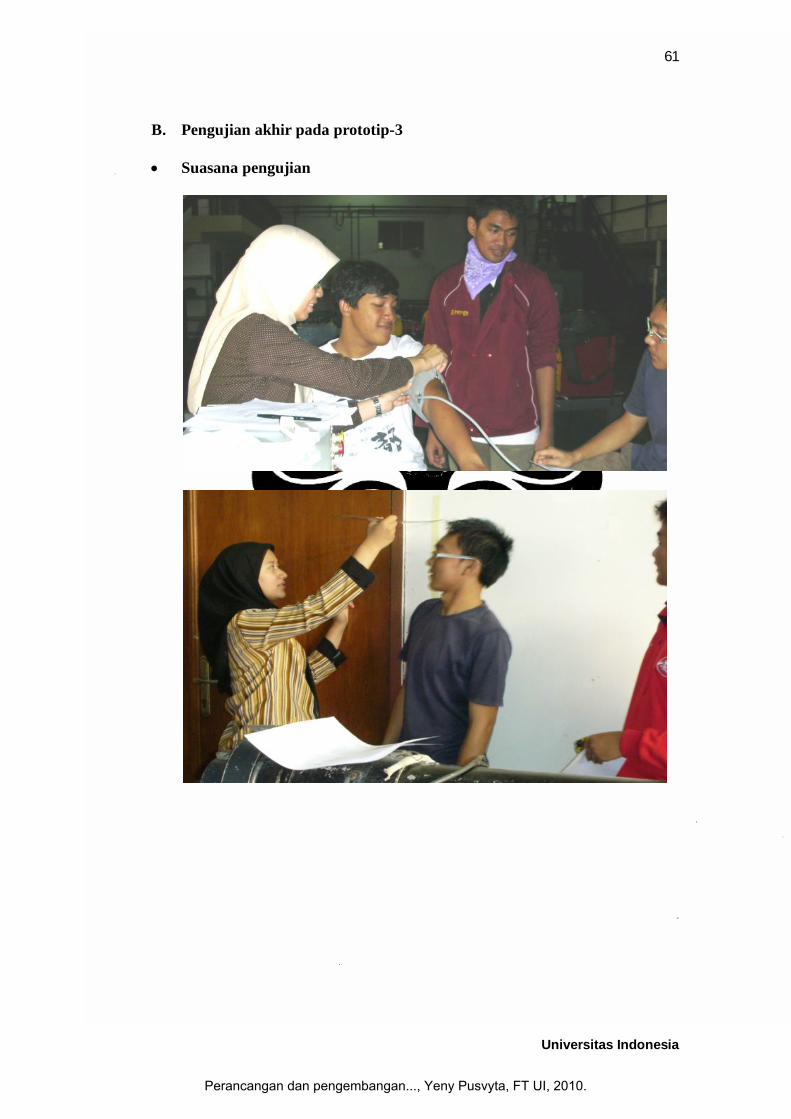
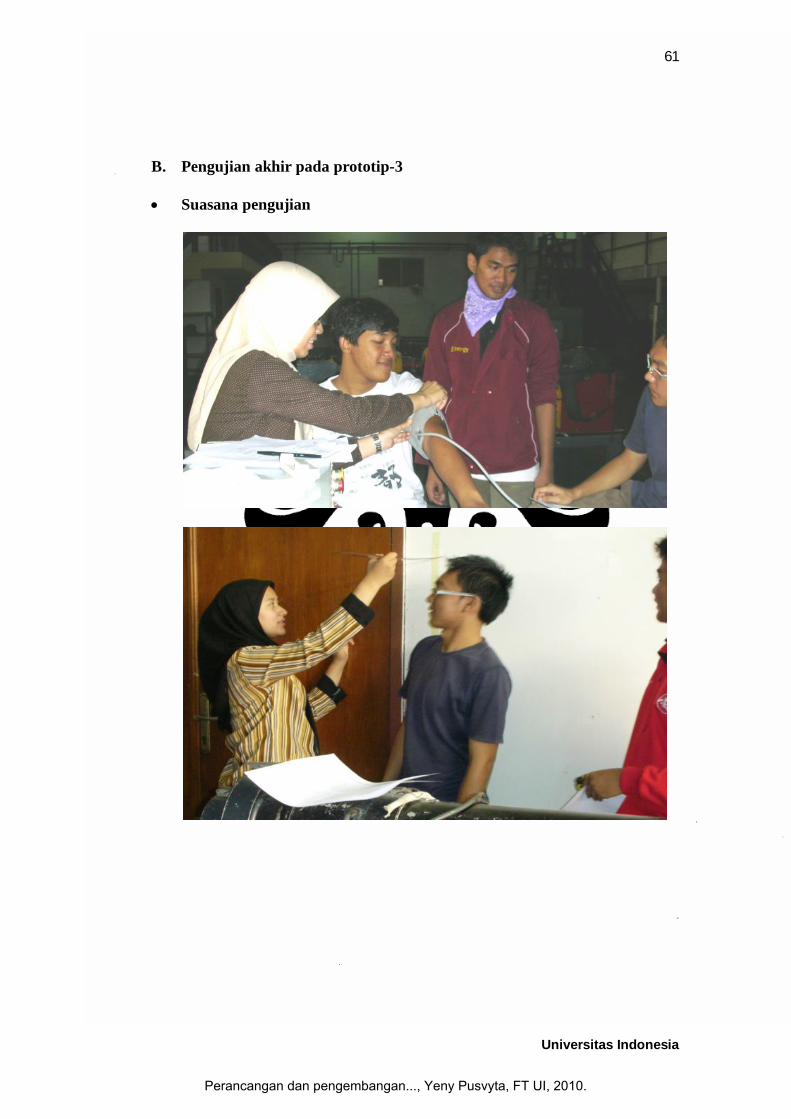
B. Pengujian akhir pada prototip-3
Suasana pengujian
Perancangan dan pengembangan..., Yeny Pusvyta, FT UI, 2010.
62
Universitas Indonesia
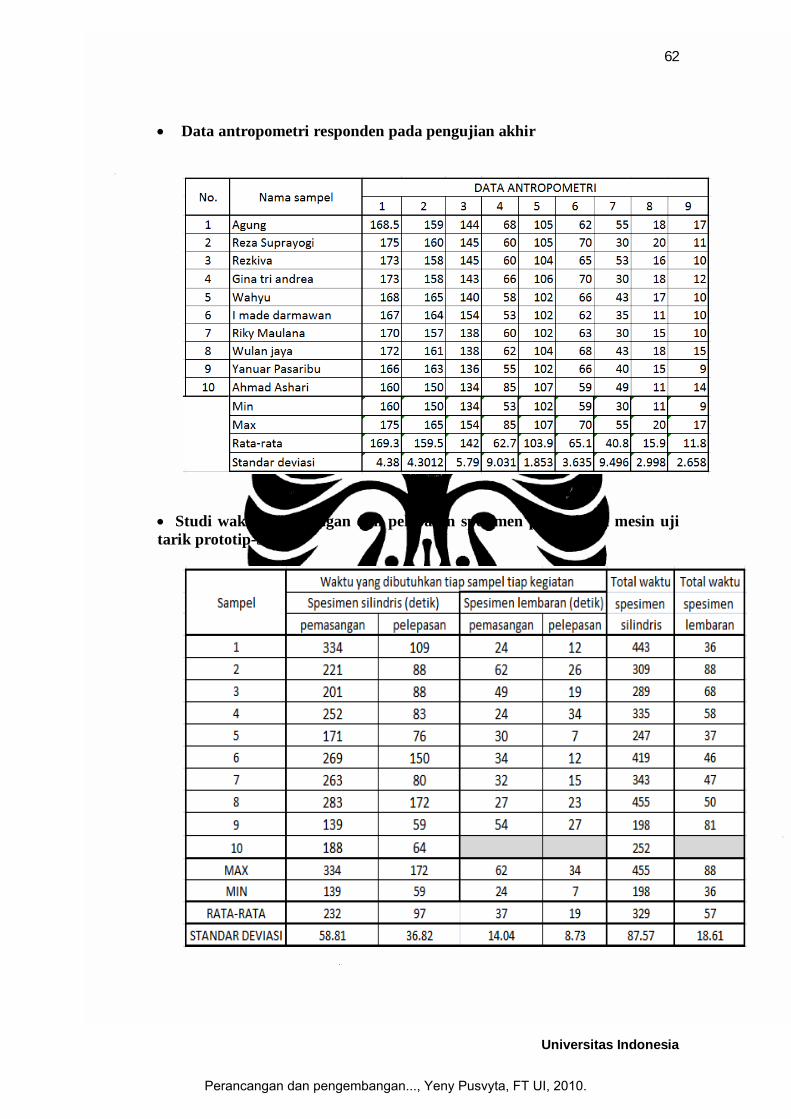
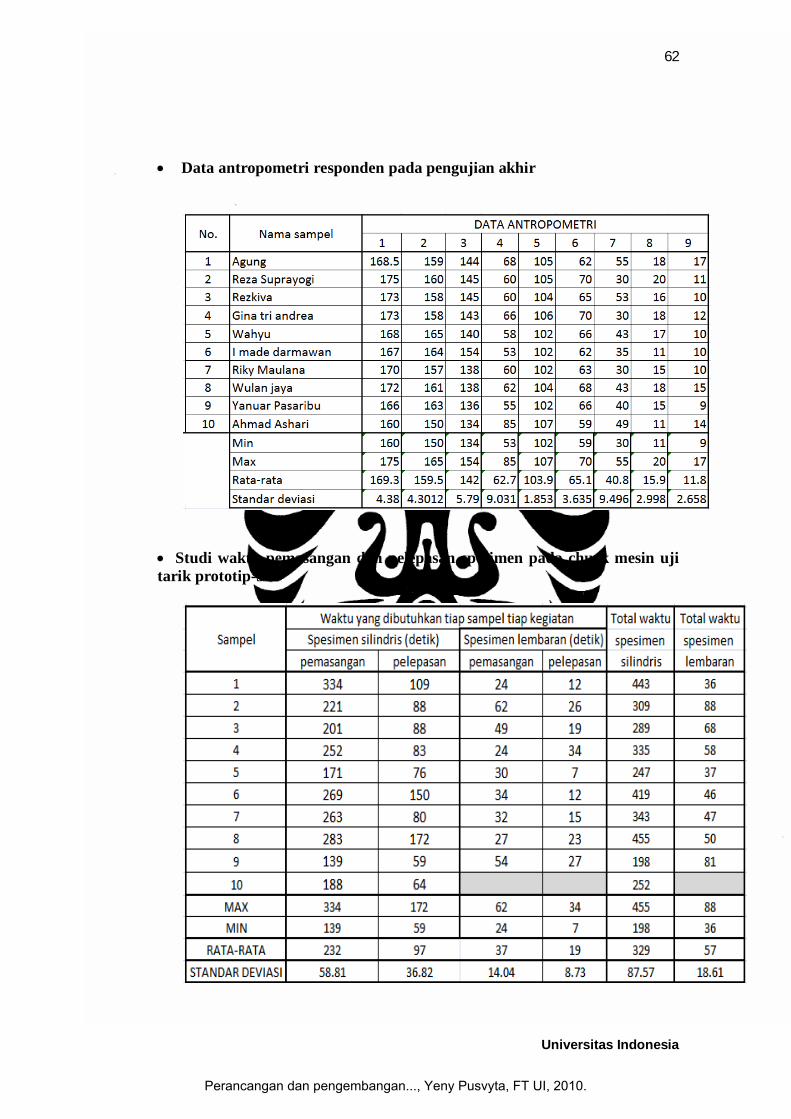
Data antropometri responden pada pengujian akhir
Studi waktu pemasangan dan pelepasan spesimen pada chuck mesin uji tarik prototip-3
Perancangan dan pengembangan..., Yeny Pusvyta, FT UI, 2010.
63
Universitas Indonesia
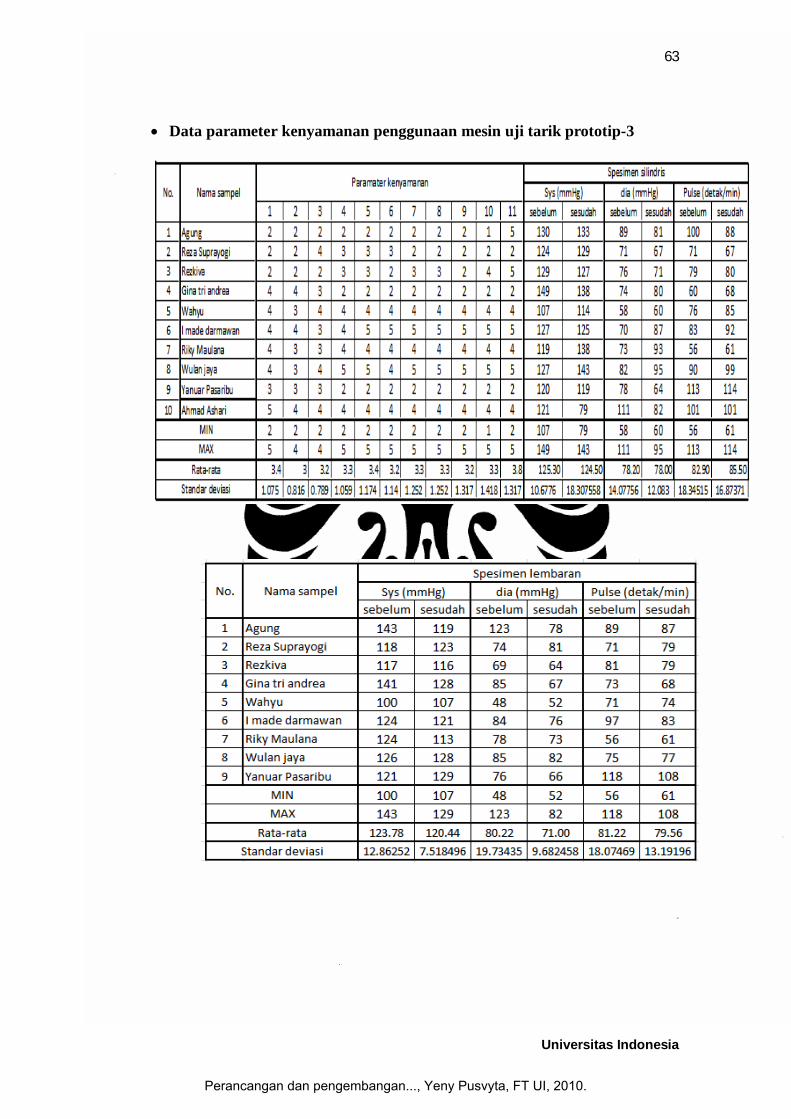
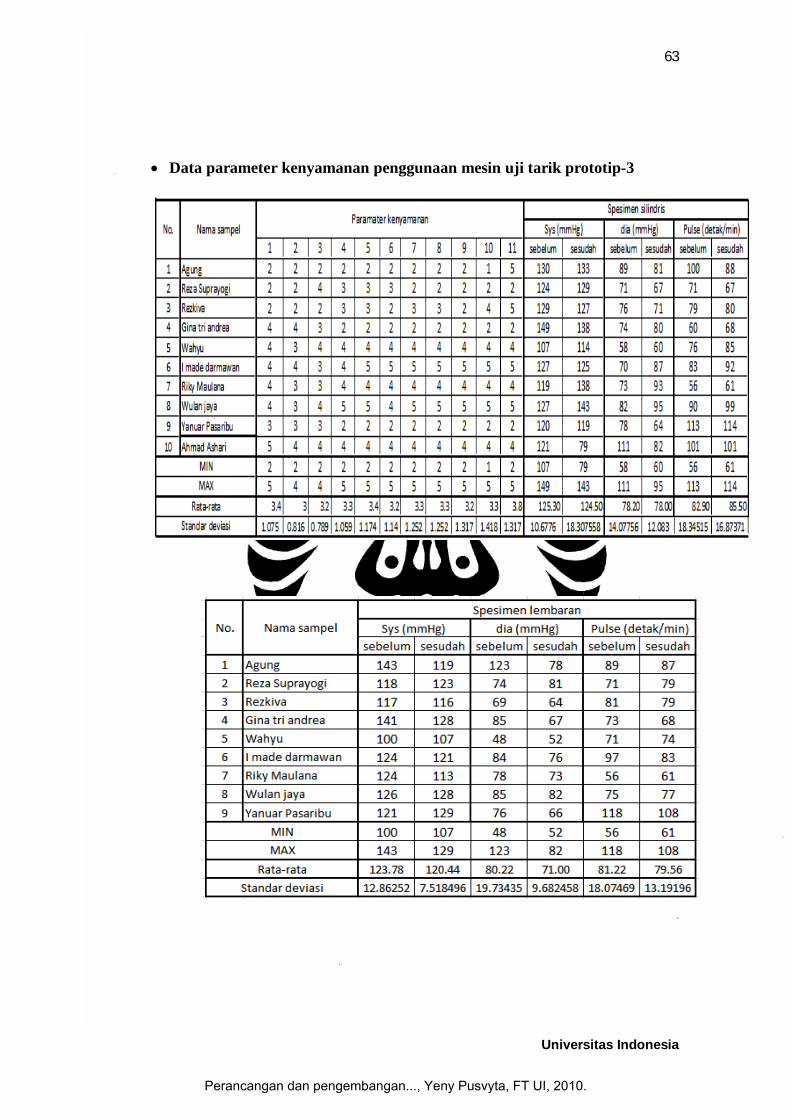
Data parameter kenyamanan penggunaan mesin uji tarik prototip-3
Perancangan dan pengembangan..., Yeny Pusvyta, FT UI, 2010.

64
Universitas Indonesia
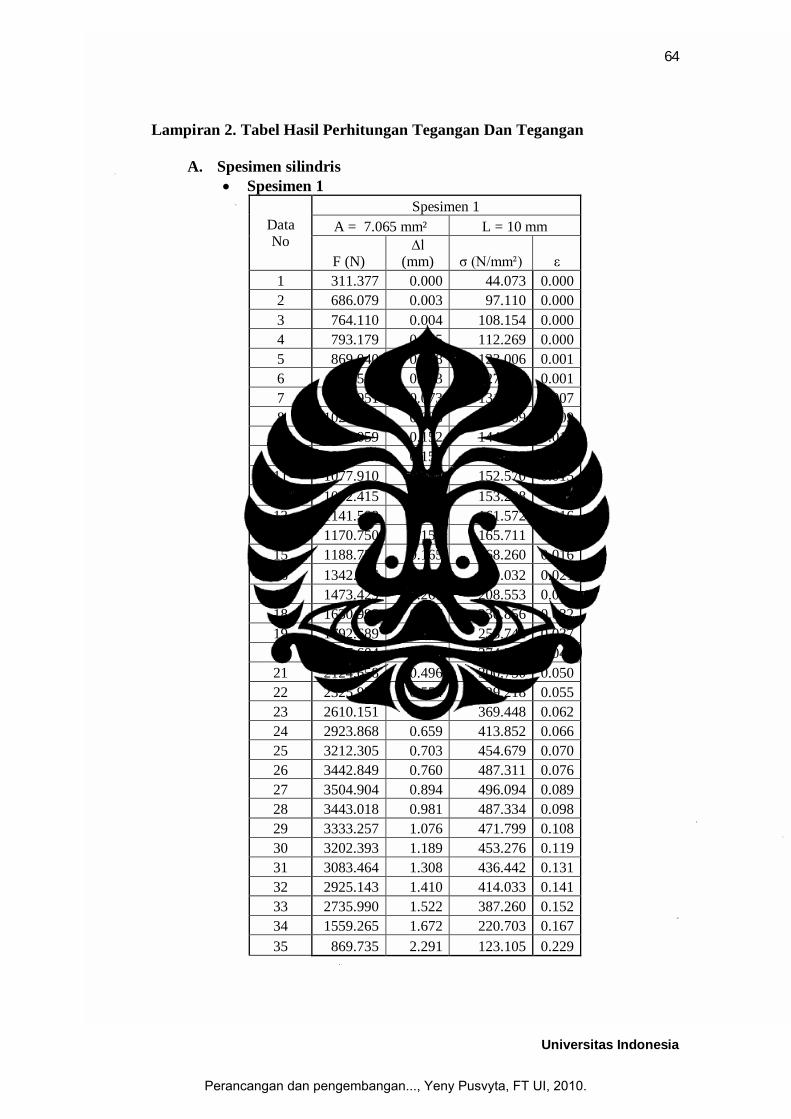
Lampiran 2. Tabel Hasil Perhitungan Tegangan Dan Tegangan
A. Spesimen silindris Spesimen 1
Data No
Spesimen 1 A = 7.065 mm² L = 10 mm
F (N) ∆l
(mm) σ (N/mm²) ε 1 311.377 0.000 44.073 0.000 2 686.079 0.003 97.110 0.000 3 764.110 0.004 108.154 0.000 4 793.179 0.005 112.269 0.000 5 869.040 0.008 123.006 0.001 6 900.524 0.013 127.463 0.001 7 928.951 0.073 131.486 0.007 8 1020.246 0.088 144.409 0.009 9 1019.059 0.152 144.240 0.015
10 1070.894 0.153 151.577 0.015 11 1077.910 0.154 152.570 0.015 12 1082.415 0.154 153.208 0.015 13 1141.509 0.155 161.572 0.016 14 1170.750 0.157 165.711 0.016 15 1188.754 0.165 168.260 0.016 16 1342.576 0.208 190.032 0.021 17 1473.429 0.261 208.553 0.026 18 1630.998 0.317 230.856 0.032 19 1792.689 0.372 253.742 0.037 20 1937.604 0.428 274.254 0.043 21 2124.658 0.496 300.730 0.050 22 2325.923 0.554 329.218 0.055 23 2610.151 0.618 369.448 0.062 24 2923.868 0.659 413.852 0.066 25 3212.305 0.703 454.679 0.070 26 3442.849 0.760 487.311 0.076 27 3504.904 0.894 496.094 0.089 28 3443.018 0.981 487.334 0.098 29 3333.257 1.076 471.799 0.108 30 3202.393 1.189 453.276 0.119 31 3083.464 1.308 436.442 0.131 32 2925.143 1.410 414.033 0.141 33 2735.990 1.522 387.260 0.152 34 1559.265 1.672 220.703 0.167 35 869.735 2.291 123.105 0.229
Perancangan dan pengembangan..., Yeny Pusvyta, FT UI, 2010.
65
Universitas Indonesia
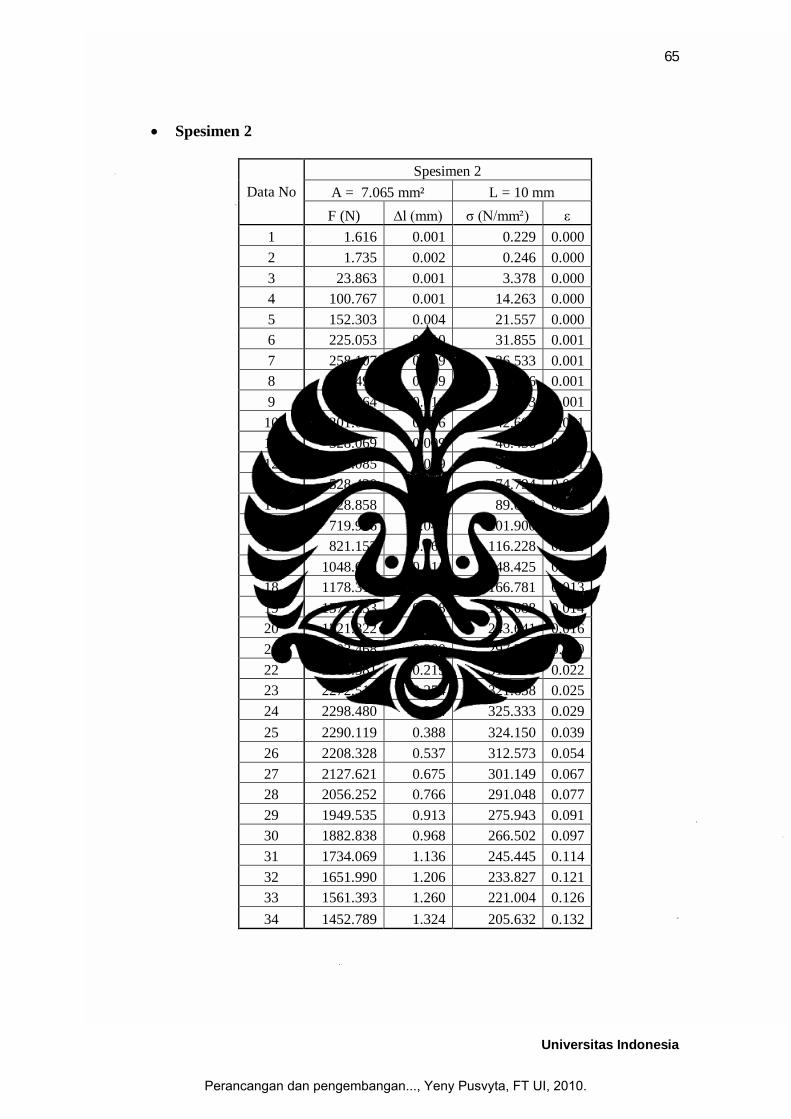
Spesimen 2
Data No Spesimen 2
A = 7.065 mm² L = 10 mm F (N) ∆l (mm) σ (N/mm²) ε
1 1.616 0.001 0.229 0.000 2 1.735 0.002 0.246 0.000 3 23.863 0.001 3.378 0.000 4 100.767 0.001 14.263 0.000 5 152.303 0.004 21.557 0.000 6 225.053 0.010 31.855 0.001 7 258.107 0.009 36.533 0.001 8 257.493 0.009 36.446 0.001 9 273.864 0.011 38.763 0.001
10 301.012 0.006 42.606 0.001 11 328.069 0.009 46.436 0.001 12 376.085 0.009 53.232 0.001 13 528.420 0.008 74.794 0.001 14 628.858 0.016 89.010 0.002 15 719.926 0.042 101.900 0.004 16 821.153 0.062 116.228 0.006 17 1048.625 0.111 148.425 0.011 18 1178.310 0.125 166.781 0.013 19 1371.233 0.138 194.088 0.014 20 1721.322 0.164 243.641 0.016 21 2103.468 0.200 297.731 0.020 22 2216.581 0.219 313.741 0.022 23 2272.517 0.254 321.658 0.025 24 2298.480 0.294 325.333 0.029 25 2290.119 0.388 324.150 0.039 26 2208.328 0.537 312.573 0.054 27 2127.621 0.675 301.149 0.067 28 2056.252 0.766 291.048 0.077 29 1949.535 0.913 275.943 0.091 30 1882.838 0.968 266.502 0.097 31 1734.069 1.136 245.445 0.114 32 1651.990 1.206 233.827 0.121 33 1561.393 1.260 221.004 0.126 34 1452.789 1.324 205.632 0.132
Perancangan dan pengembangan..., Yeny Pusvyta, FT UI, 2010.

66
Universitas Indonesia
Spesimen 3
Data No Spesimen 3
A = 7.065 mm² L = 10 mm F (N) ∆l (mm) σ (N/mm²) ε
1 0.390 -0.001 0.055 0.000 2 -35.252 -0.004 -4.990 0.000 3 10.577 -0.006 1.497 -0.001 4 132.994 -0.006 18.824 -0.001 5 229.381 -0.009 32.467 -0.001 6 333.937 -0.009 47.266 -0.001 7 433.871 -0.005 61.411 -0.001 8 549.010 0.000 77.708 0.000 9 682.416 0.005 96.591 0.001
10 801.449 0.010 113.439 0.001 11 984.097 0.015 139.292 0.002 12 1137.996 0.023 161.075 0.002 13 1290.396 0.028 182.646 0.003 14 1519.542 0.033 215.080 0.003 15 1713.501 0.037 242.534 0.004 16 1931.345 0.040 273.368 0.004 17 2064.524 0.044 292.219 0.004 18 2173.447 0.067 307.636 0.007 19 2233.585 0.119 316.148 0.012 20 2238.475 0.183 316.840 0.018 21 2284.385 0.210 323.338 0.021 22 2265.552 0.243 320.673 0.024 23 2247.183 0.285 318.073 0.028 24 2243.228 0.321 317.513 0.032 25 2196.211 0.364 310.858 0.036 26 2178.170 0.413 308.304 0.041 27 2110.710 0.461 298.756 0.046 28 2064.215 0.511 292.175 0.051 29 2025.852 0.562 286.745 0.056 30 1953.072 0.612 276.443 0.061 31 1929.297 0.662 273.078 0.066 32 1894.147 0.675 268.103 0.068 33 1831.879 0.738 259.289 0.074 34 1748.138 0.796 247.436 0.080 35 1693.039 0.857 239.638 0.086
Perancangan dan pengembangan..., Yeny Pusvyta, FT UI, 2010.

67
Universitas Indonesia
Spesimen 4
Data No Spesimen 4
A = 7.065 mm² L = 10 mm F (N) ∆l (mm) σ (N/mm²) ε
1 -0.450 0.003 -0.064 0.000 2 -1.143 0.002 -0.162 0.000 3 58.595 0.004 8.294 0.000 4 165.154 0.004 23.376 0.000 5 294.128 0.005 41.632 0.000 6 416.963 0.005 59.018 0.001 7 492.396 0.005 69.695 0.001 8 642.040 0.008 90.876 0.001 9 768.968 0.012 108.842 0.001
10 923.276 0.018 130.683 0.002 11 1113.687 0.022 157.634 0.002 12 1321.987 0.027 187.118 0.003 13 1554.196 0.041 219.985 0.004 14 1747.143 0.072 247.296 0.007 15 2005.815 0.112 283.909 0.011 16 2209.642 0.143 312.759 0.014 17 2295.620 0.161 324.928 0.016 18 2382.641 0.196 337.246 0.020 19 2402.600 0.236 340.071 0.024 20 2431.599 0.274 344.175 0.027 21 2433.354 0.319 344.424 0.032 22 2397.698 0.369 339.377 0.037 23 2378.700 0.430 336.688 0.043 24 2316.865 0.466 327.936 0.047 25 2283.008 0.499 323.143 0.050 26 2217.988 0.538 313.940 0.054 27 2132.168 0.583 301.793 0.058 28 2090.289 0.627 295.865 0.063 29 2004.489 0.685 283.721 0.069 30 1933.541 0.741 273.679 0.074 31 1901.690 0.751 269.170 0.075 32 1831.448 0.795 259.228 0.079 33 1714.201 0.855 242.633 0.086 34 1600.103 0.923 226.483 0.092 35 1465.121 0.976 207.377 0.098
Perancangan dan pengembangan..., Yeny Pusvyta, FT UI, 2010.

68
Universitas Indonesia
Spesimen 5
Data No
Spesimen 5 A = 7.065 mm² L = 10 mm
F (N) ∆l
(mm) σ (N/mm²) ε 1 0.068 0.002 0.010 0.000 2 185.529 0.000 26.260 0.000 3 257.190 0.005 36.403 0.000 4 353.493 0.003 50.034 0.000 5 435.129 0.012 61.589 0.001 6 540.845 0.011 76.553 0.001 7 633.154 0.014 89.618 0.001 8 860.365 0.016 121.778 0.002 9 976.806 0.020 138.260 0.002
10 1292.149 0.024 182.894 0.002 11 1450.254 0.023 205.273 0.002 12 1792.865 0.047 253.767 0.005 13 1967.836 0.061 278.533 0.006 14 2147.488 0.070 303.961 0.007 15 2265.896 0.082 320.721 0.008 16 2412.650 0.114 341.493 0.011 17 2474.563 0.130 350.257 0.013 18 2499.562 0.154 353.795 0.015 19 2486.755 0.181 351.982 0.018 20 2490.982 0.203 352.581 0.020 21 2470.194 0.262 349.638 0.026 22 2382.311 0.331 337.199 0.033 23 2372.183 0.340 335.766 0.034 24 2350.819 0.374 332.741 0.037 25 2255.715 0.434 319.280 0.043 26 2232.246 0.474 315.958 0.047 27 2172.376 0.508 307.484 0.051 28 2107.559 0.548 298.310 0.055 29 2040.703 0.579 288.847 0.058 30 1926.542 0.650 272.688 0.065 31 1884.486 0.673 266.735 0.067 32 1827.063 0.701 258.608 0.070 33 1739.529 0.735 246.218 0.074 34 1571.371 0.819 222.416 0.082 35 1486.300 0.850 210.375 0.085
Perancangan dan pengembangan..., Yeny Pusvyta, FT UI, 2010.

69
Universitas Indonesia
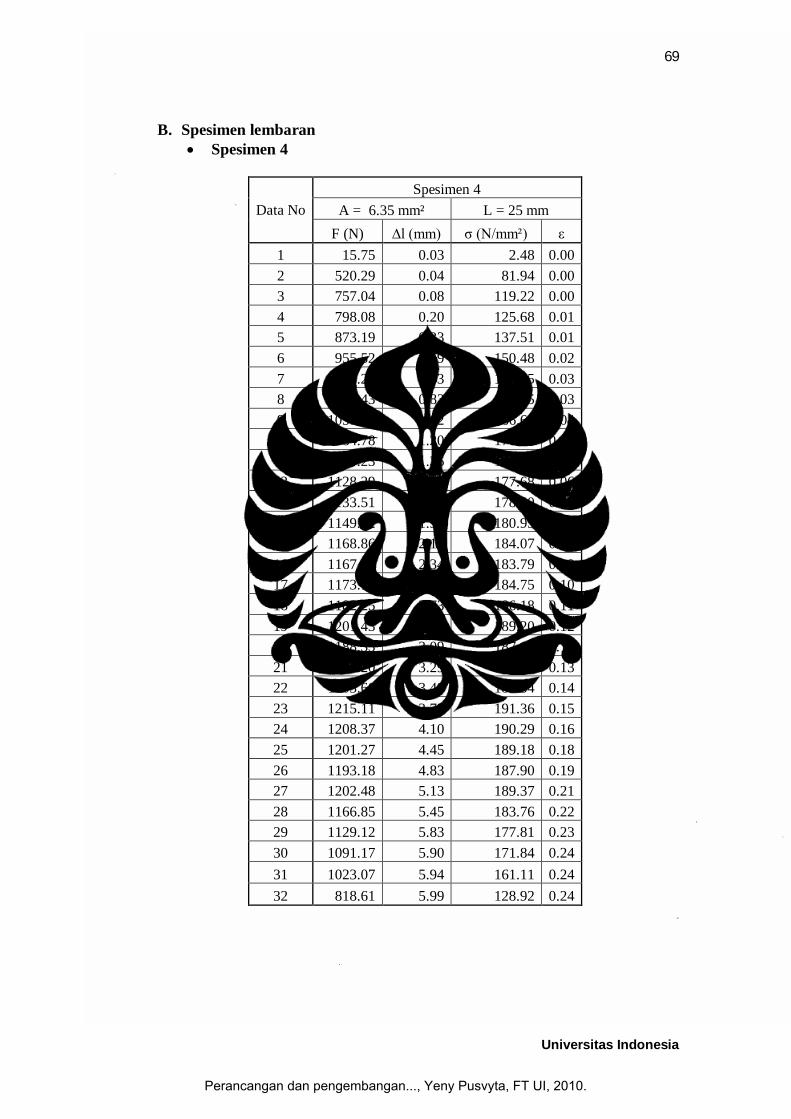
B. Spesimen lembaran Spesimen 4
Data No Spesimen 4
A = 6.35 mm² L = 25 mm F (N) ∆l (mm) σ (N/mm²) ε
1 15.75 0.03 2.48 0.00 2 520.29 0.04 81.94 0.00 3 757.04 0.08 119.22 0.00 4 798.08 0.20 125.68 0.01 5 873.19 0.33 137.51 0.01 6 955.52 0.49 150.48 0.02 7 999.20 0.63 157.35 0.03 8 1047.43 0.83 164.95 0.03 9 1058.34 1.02 166.67 0.04
10 1084.78 1.20 170.83 0.05 11 1110.23 1.36 174.84 0.05 12 1128.29 1.56 177.68 0.06 13 1133.51 1.75 178.50 0.07 14 1149.02 1.96 180.95 0.08 15 1168.86 2.15 184.07 0.09 16 1167.05 2.34 183.79 0.09 17 1173.19 2.51 184.75 0.10 18 1182.25 2.73 186.18 0.11 19 1201.43 2.91 189.20 0.12 20 1188.33 3.09 187.14 0.12 21 1197.20 3.29 188.54 0.13 22 1203.60 3.49 189.54 0.14 23 1215.11 3.73 191.36 0.15 24 1208.37 4.10 190.29 0.16 25 1201.27 4.45 189.18 0.18 26 1193.18 4.83 187.90 0.19 27 1202.48 5.13 189.37 0.21 28 1166.85 5.45 183.76 0.22 29 1129.12 5.83 177.81 0.23 30 1091.17 5.90 171.84 0.24 31 1023.07 5.94 161.11 0.24 32 818.61 5.99 128.92 0.24
Perancangan dan pengembangan..., Yeny Pusvyta, FT UI, 2010.

70
Universitas Indonesia
Spesimen 6
Data No Spesimen 6
A = 6.1 mm² L = 25 mm F (N) ∆l (mm) σ (N/mm²) ε
1 0.42 0.02 0.07 0.00 2 67.27 0.02 11.03 0.00 3 263.08 0.01 43.13 0.00 4 612.30 0.02 100.38 0.00 5 815.16 0.03 133.63 0.00 6 906.81 0.10 148.66 0.00 7 939.41 0.33 154.00 0.01 8 975.50 0.55 159.92 0.02 9 1006.98 0.73 165.08 0.03
10 1042.18 0.96 170.85 0.04 11 1046.85 1.14 171.61 0.05 12 1072.75 1.35 175.86 0.05 13 1094.01 1.53 179.35 0.06 14 1114.94 1.72 182.78 0.07 15 1118.04 1.93 183.29 0.08 16 1133.59 2.13 185.83 0.09 17 1145.10 2.34 187.72 0.09 18 1144.59 2.53 187.64 0.10 19 1139.96 2.81 186.88 0.11 20 1145.46 3.02 187.78 0.12 21 1160.72 3.26 190.28 0.13 22 1145.82 3.45 187.84 0.14 23 1148.34 3.73 188.25 0.15 24 1147.51 4.13 188.12 0.17 25 1152.43 4.34 188.92 0.17 26 1156.36 4.60 189.57 0.18 27 1151.28 4.91 188.73 0.20 28 1148.40 5.21 188.26 0.21 29 1141.75 5.60 187.17 0.22 30 1146.43 5.91 187.94 0.24 31 1121.67 6.17 183.88 0.25 32 1094.47 6.61 179.42 0.26 33 1067.27 6.88 174.96 0.28 34 1011.49 7.20 165.82 0.29 35 908.87 7.56 149.00 0.30
Perancangan dan pengembangan..., Yeny Pusvyta, FT UI, 2010.
71
Universitas Indonesia
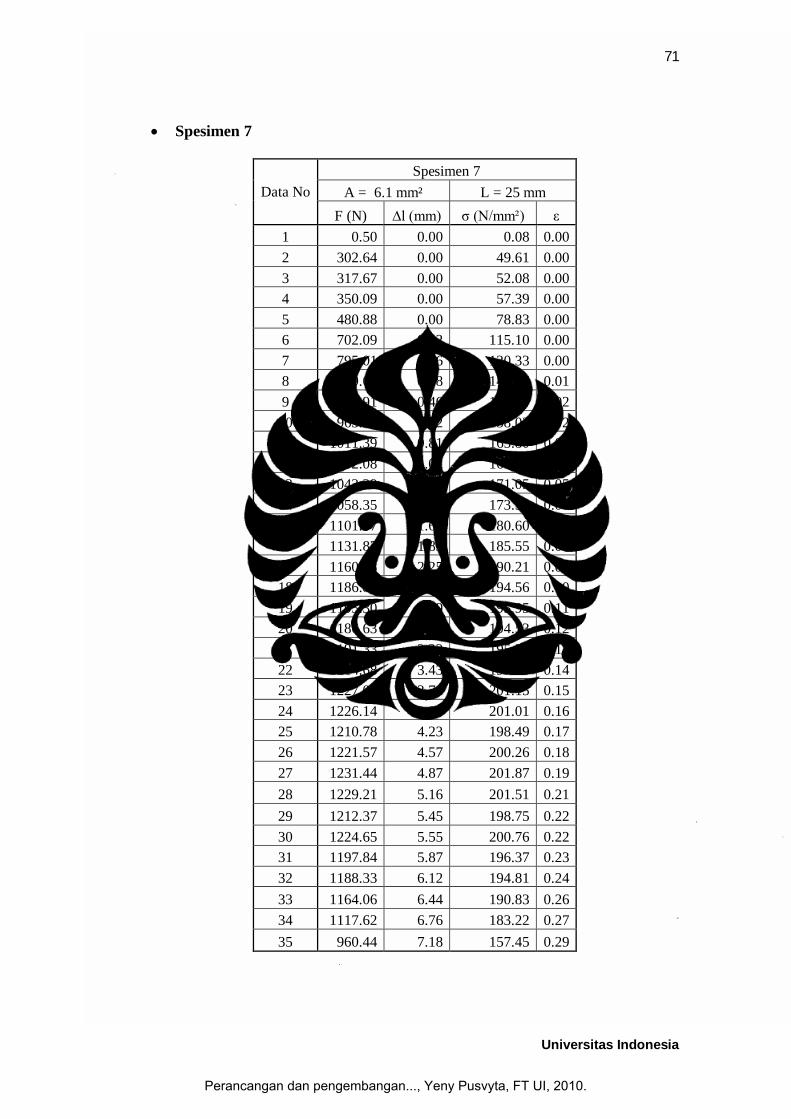
Spesimen 7
Data No Spesimen 7
A = 6.1 mm² L = 25 mm F (N) ∆l (mm) σ (N/mm²) ε
1 0.50 0.00 0.08 0.00 2 302.64 0.00 49.61 0.00 3 317.67 0.00 52.08 0.00 4 350.09 0.00 57.39 0.00 5 480.88 0.00 78.83 0.00 6 702.09 0.02 115.10 0.00 7 795.01 0.06 130.33 0.00 8 869.01 0.18 142.46 0.01 9 918.91 0.46 150.64 0.02
10 963.91 0.62 158.02 0.02 11 1011.39 0.81 165.80 0.03 12 1002.08 1.02 164.27 0.04 13 1043.39 1.25 171.05 0.05 14 1058.35 1.41 173.50 0.06 15 1101.67 1.62 180.60 0.06 16 1131.87 1.83 185.55 0.07 17 1160.28 2.25 190.21 0.09 18 1186.83 2.45 194.56 0.10 19 1195.30 2.69 195.95 0.11 20 1186.63 2.93 194.53 0.12 21 1191.33 3.23 195.30 0.13 22 1214.68 3.43 199.13 0.14 23 1227.02 3.70 201.15 0.15 24 1226.14 3.99 201.01 0.16 25 1210.78 4.23 198.49 0.17 26 1221.57 4.57 200.26 0.18 27 1231.44 4.87 201.87 0.19 28 1229.21 5.16 201.51 0.21 29 1212.37 5.45 198.75 0.22 30 1224.65 5.55 200.76 0.22 31 1197.84 5.87 196.37 0.23 32 1188.33 6.12 194.81 0.24 33 1164.06 6.44 190.83 0.26 34 1117.62 6.76 183.22 0.27 35 960.44 7.18 157.45 0.29
Perancangan dan pengembangan..., Yeny Pusvyta, FT UI, 2010.
72
Universitas Indonesia
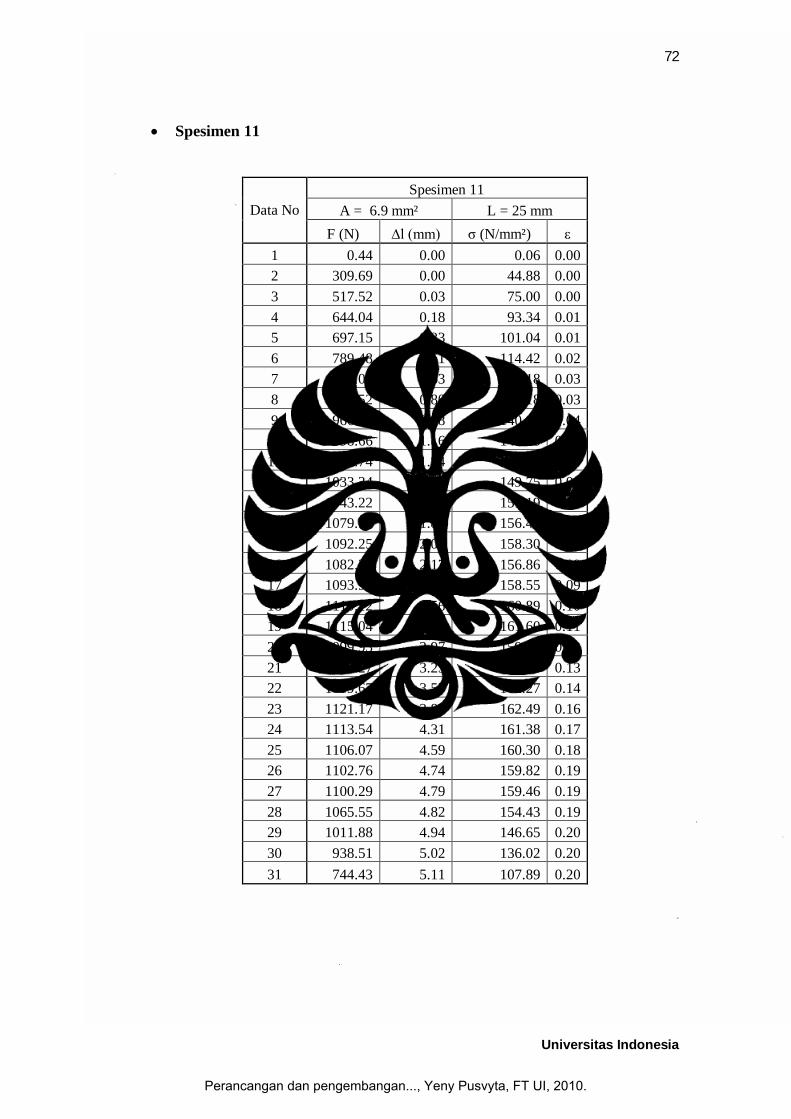
Spesimen 11
Data No Spesimen 11
A = 6.9 mm² L = 25 mm F (N) ∆l (mm) σ (N/mm²) ε
1 0.44 0.00 0.06 0.00 2 309.69 0.00 44.88 0.00 3 517.52 0.03 75.00 0.00 4 644.04 0.18 93.34 0.01 5 697.15 0.33 101.04 0.01 6 789.48 0.51 114.42 0.02 7 912.02 0.63 132.18 0.03 8 946.52 0.80 137.18 0.03 9 966.78 0.98 140.11 0.04
10 998.66 1.16 144.73 0.05 11 1031.74 1.34 149.53 0.05 12 1033.24 1.51 149.75 0.06 13 1043.22 1.67 151.19 0.07 14 1079.58 1.85 156.46 0.07 15 1092.25 2.01 158.30 0.08 16 1082.31 2.17 156.86 0.09 17 1093.98 2.34 158.55 0.09 18 1110.12 2.56 160.89 0.10 19 1115.04 2.75 161.60 0.11 20 1099.93 2.97 159.41 0.12 21 1109.27 3.25 160.76 0.13 22 1119.67 3.57 162.27 0.14 23 1121.17 3.89 162.49 0.16 24 1113.54 4.31 161.38 0.17 25 1106.07 4.59 160.30 0.18 26 1102.76 4.74 159.82 0.19 27 1100.29 4.79 159.46 0.19 28 1065.55 4.82 154.43 0.19 29 1011.88 4.94 146.65 0.20 30 938.51 5.02 136.02 0.20 31 744.43 5.11 107.89 0.20
Perancangan dan pengembangan..., Yeny Pusvyta, FT UI, 2010.

73
Universitas Indonesia
Spesimen 12
Data No Spesimen 12
A = 6.55 mm² L = 25 mm F (N) ∆l (mm) σ (N/mm²) ε
1 12.09 -0.01 1.85 0.00 2 1002.30 -0.01 153.02 0.00 3 1042.04 -0.01 159.09 0.00 4 1049.31 -0.01 160.20 0.00 5 1043.47 -0.01 159.31 0.00 6 1035.20 -0.01 158.05 0.00 7 1027.04 -0.01 156.80 0.00 8 1024.15 0.01 156.36 0.00 9 1023.39 0.01 156.24 0.00
10 1021.43 0.01 155.94 0.00 11 1020.05 0.01 155.73 0.00 12 1019.61 0.01 155.67 0.00 13 788.31 0.01 120.35 0.00 14 1107.75 0.01 169.12 0.00 15 1116.87 0.05 170.51 0.00 16 1143.28 0.31 174.55 0.01 17 1161.38 0.52 177.31 0.02 18 1194.20 0.70 182.32 0.03 19 1201.34 0.93 183.41 0.04 20 1189.94 1.11 181.67 0.04 21 1210.13 1.38 184.75 0.06 22 1222.55 1.57 186.65 0.06 23 1238.08 1.96 189.02 0.08 24 1246.89 2.02 190.36 0.08 25 1243.31 2.23 189.82 0.09 26 1234.35 2.43 188.45 0.10 27 1250.43 2.69 190.91 0.11 28 1257.79 2.91 192.03 0.12 29 1250.56 3.50 190.93 0.14 30 1222.84 3.79 186.69 0.15 31 1189.30 4.09 181.57 0.16 32 1160.15 4.30 177.12 0.17 33 1063.88 4.59 162.42 0.18 34 984.67 4.71 150.33 0.19 35 852.79 4.83 130.20 0.19
Perancangan dan pengembangan..., Yeny Pusvyta, FT UI, 2010.

74
Universitas Indonesia
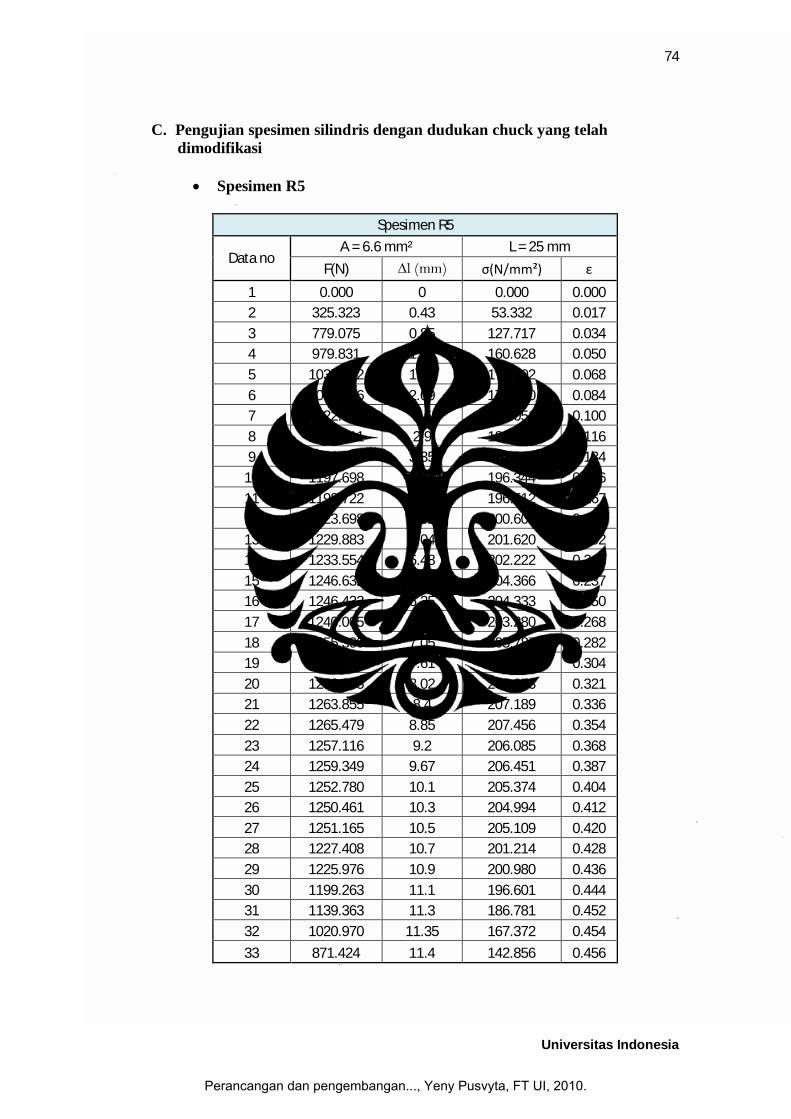
C. Pengujian spesimen silindris dengan dudukan chuck yang telah dimodifikasi
Spesimen R5
Spesimen R5
Data no A = 6.6 mm² L = 25 mm
F(N) ∆l (mm) σ(N/mm²) ε
1 0.000 0 0.000 0.000 2 325.323 0.43 53.332 0.017 3 779.075 0.85 127.717 0.034 4 979.831 1.25 160.628 0.050 5 1037.622 1.69 170.102 0.068 6 1092.266 2.09 179.060 0.084 7 1122.708 2.5 184.051 0.100 8 1135.611 2.9 186.166 0.116 9 1176.849 3.35 192.926 0.134
10 1197.698 3.66 196.344 0.146 11 1198.722 4.18 196.512 0.167 12 1223.698 4.62 200.606 0.185 13 1229.883 5.04 201.620 0.202 14 1233.554 5.48 202.222 0.219 15 1246.632 5.93 204.366 0.237 16 1246.432 6.25 204.333 0.250 17 1240.005 6.7 203.280 0.268 18 1255.300 7.05 205.787 0.282 19 1260.149 7.61 206.582 0.304 20 1250.945 8.02 205.073 0.321 21 1263.855 8.4 207.189 0.336 22 1265.479 8.85 207.456 0.354 23 1257.116 9.2 206.085 0.368 24 1259.349 9.67 206.451 0.387 25 1252.780 10.1 205.374 0.404 26 1250.461 10.3 204.994 0.412 27 1251.165 10.5 205.109 0.420 28 1227.408 10.7 201.214 0.428 29 1225.976 10.9 200.980 0.436 30 1199.263 11.1 196.601 0.444 31 1139.363 11.3 186.781 0.452 32 1020.970 11.35 167.372 0.454
33 871.424 11.4 142.856 0.456
Perancangan dan pengembangan..., Yeny Pusvyta, FT UI, 2010.

75
Universitas Indonesia
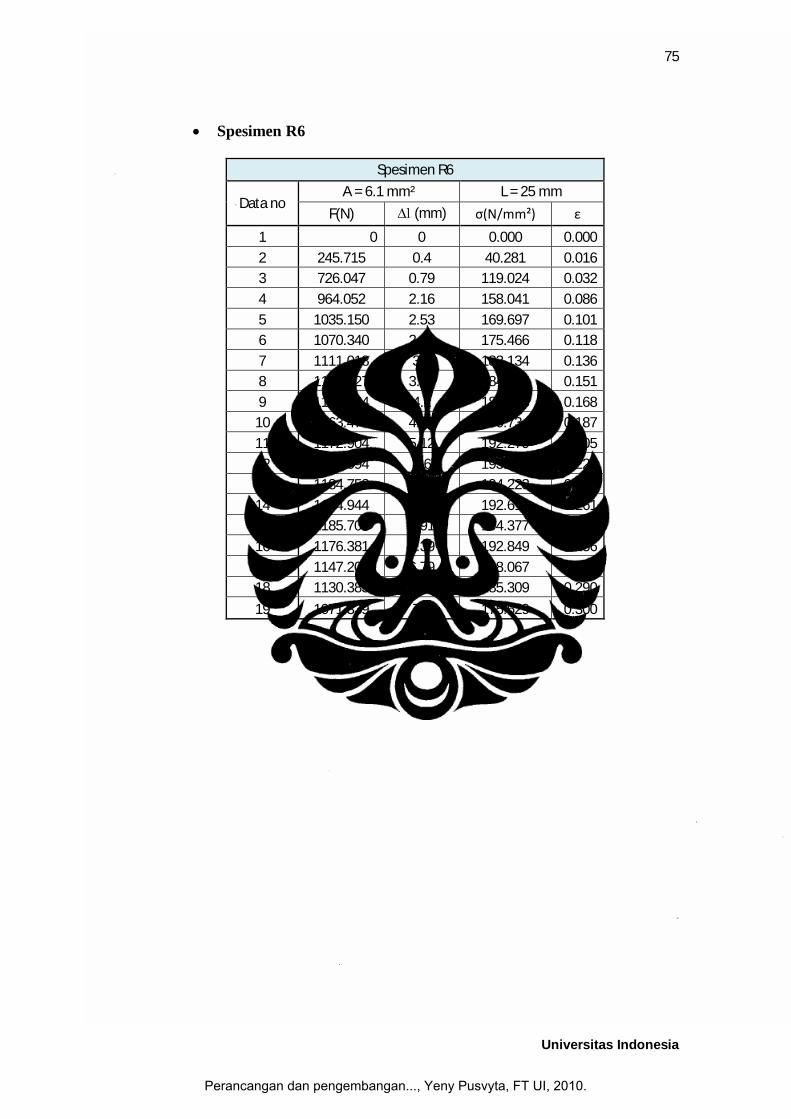
Spesimen R6
Spesimen R6
Data no A = 6.1 mm² L = 25 mm
F(N) ∆l (mm) σ(N/mm²) ε
1 0 0 0.000 0.000 2 245.715 0.4 40.281 0.016 3 726.047 0.79 119.024 0.032 4 964.052 2.16 158.041 0.086 5 1035.150 2.53 169.697 0.101 6 1070.340 2.95 175.466 0.118 7 1111.018 3.4 182.134 0.136 8 1125.027 3.78 184.431 0.151 9 1140.534 4.2 186.973 0.168
10 1163.479 4.68 190.734 0.187 11 1172.904 5.12 192.279 0.205 12 1179.094 5.6 193.294 0.224 13 1184.758 5.99 194.223 0.240 14 1174.944 6.53 192.614 0.261 15 1185.700 6.91 194.377 0.276 16 1176.381 6.39 192.849 0.256 17 1147.209 6.79 188.067 0.272 18 1130.383 7.25 185.309 0.290
19 1071.339 7.5 175.629 0.300
Perancangan dan pengembangan..., Yeny Pusvyta, FT UI, 2010.

76
Universitas Indonesia
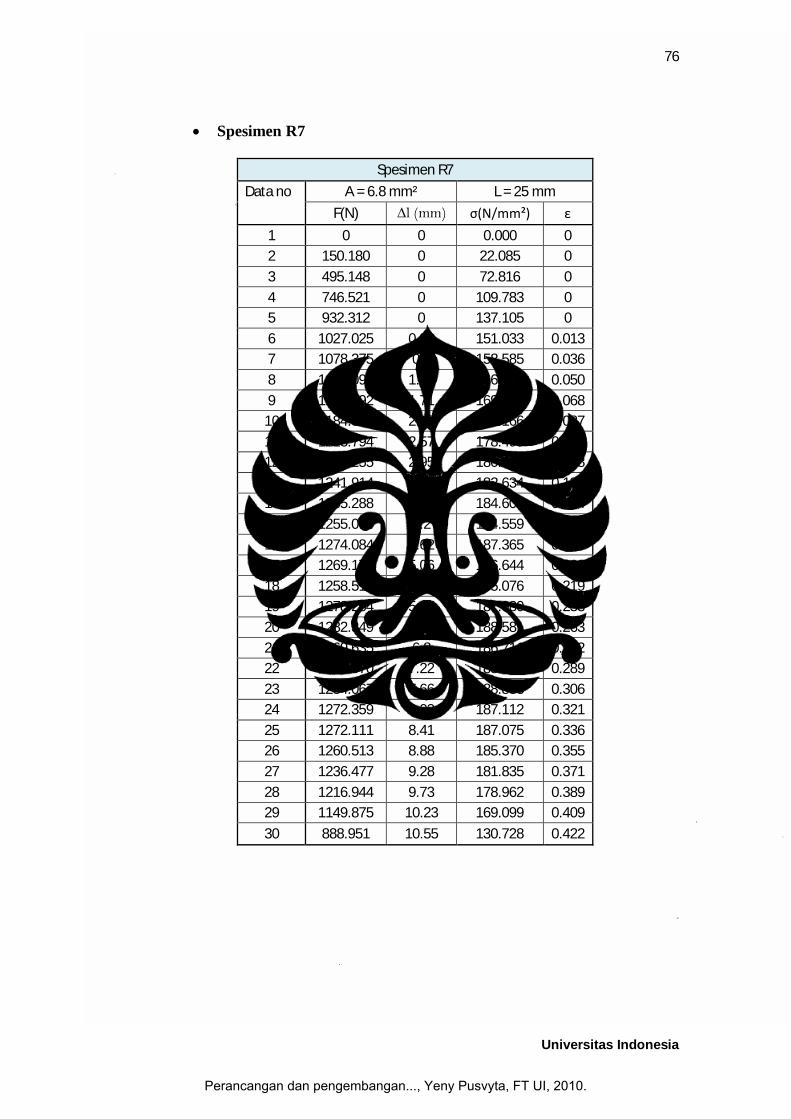
Spesimen R7
Spesimen R7
Data no A = 6.8 mm² L = 25 mm
F(N) ∆l (mm) σ(N/mm²) ε
1 0 0 0.000 0 2 150.180 0 22.085 0 3 495.148 0 72.816 0 4 746.521 0 109.783 0 5 932.312 0 137.105 0 6 1027.025 0.32 151.033 0.013 7 1078.375 0.9 158.585 0.036 8 1129.098 1.26 166.044 0.050 9 1151.692 1.71 169.366 0.068
10 1184.328 2.18 174.166 0.087 11 1213.794 2.57 178.499 0.103 12 1226.255 2.95 180.332 0.118 13 1241.914 3.39 182.634 0.136 14 1255.288 3.84 184.601 0.154 15 1255.004 4.2 184.559 0.168 16 1274.084 4.62 187.365 0.185 17 1269.179 5.06 186.644 0.202 18 1258.517 5.47 185.076 0.219 19 1278.264 5.95 187.980 0.238 20 1282.349 6.57 188.581 0.263 21 1269.635 6.8 186.711 0.272 22 1284.070 7.22 188.834 0.289 23 1284.067 7.66 188.833 0.306 24 1272.359 8.03 187.112 0.321 25 1272.111 8.41 187.075 0.336 26 1260.513 8.88 185.370 0.355 27 1236.477 9.28 181.835 0.371 28 1216.944 9.73 178.962 0.389 29 1149.875 10.23 169.099 0.409
30 888.951 10.55 130.728 0.422
Perancangan dan pengembangan..., Yeny Pusvyta, FT UI, 2010.
77
Universitas Indonesia
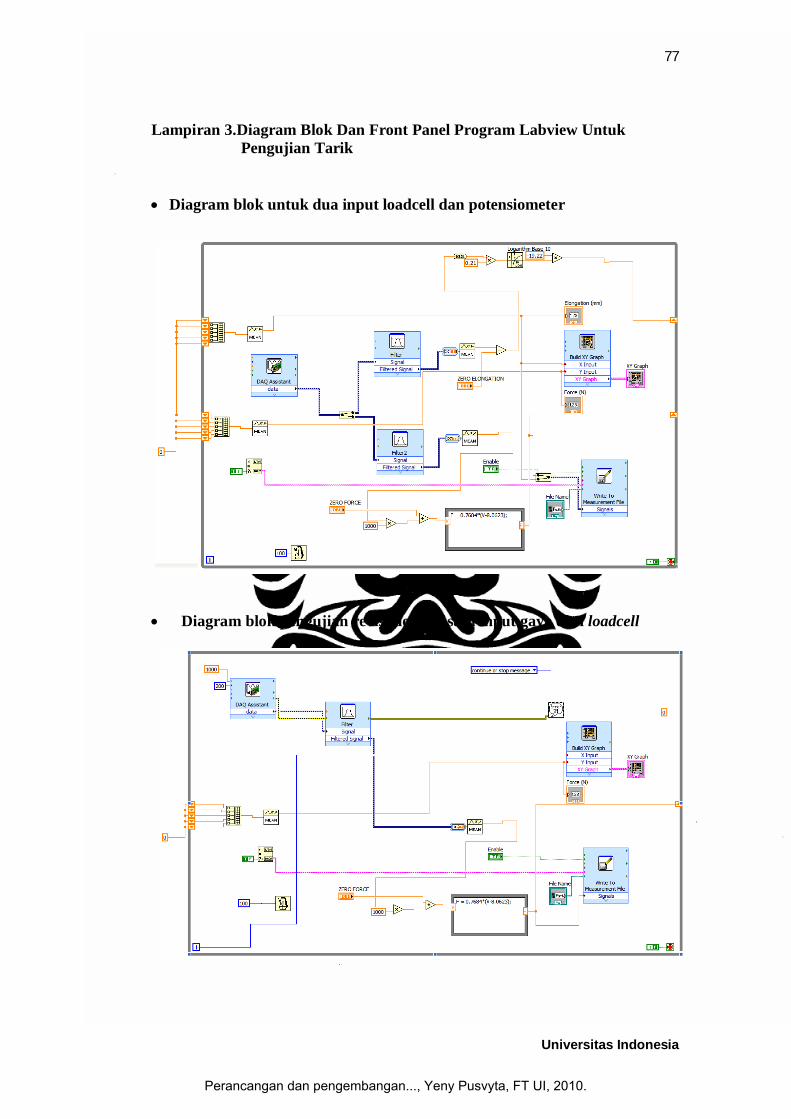
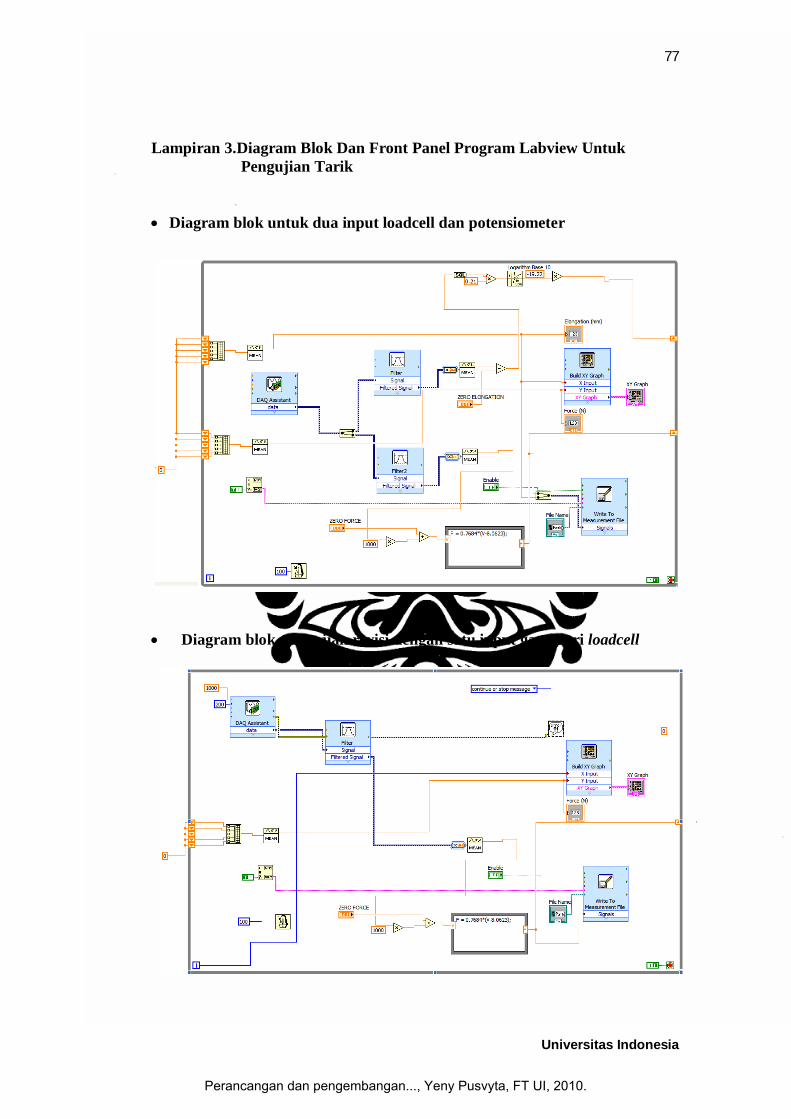
Lampiran 3.Diagram Blok Dan Front Panel Program Labview Untuk Pengujian Tarik
Diagram blok untuk dua input loadcell dan potensiometer
Diagram blok pengujian revisi dengan satu input gaya dari loadcell
Perancangan dan pengembangan..., Yeny Pusvyta, FT UI, 2010.
78
Universitas Indonesia
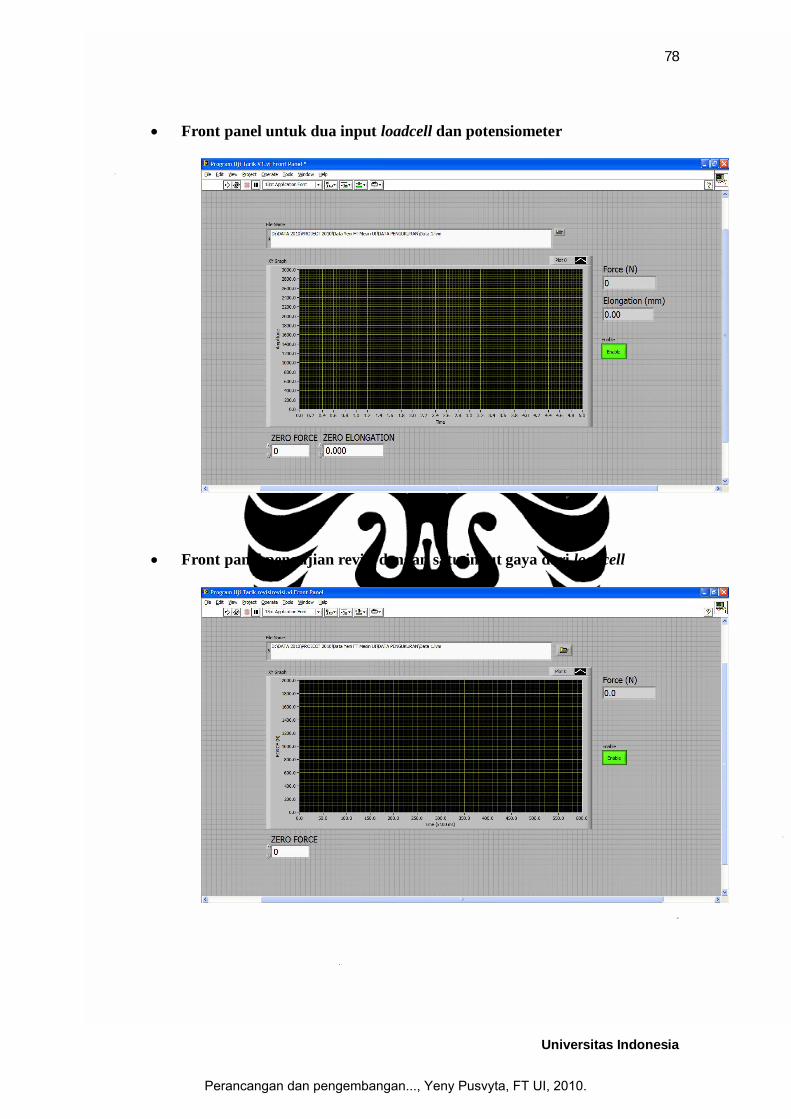
Front panel untuk dua input loadcell dan potensiometer
Front panel pengujian revisi dengan satu input gaya dari loadcell
Perancangan dan pengembangan..., Yeny Pusvyta, FT UI, 2010.
79
Universitas Indonesia
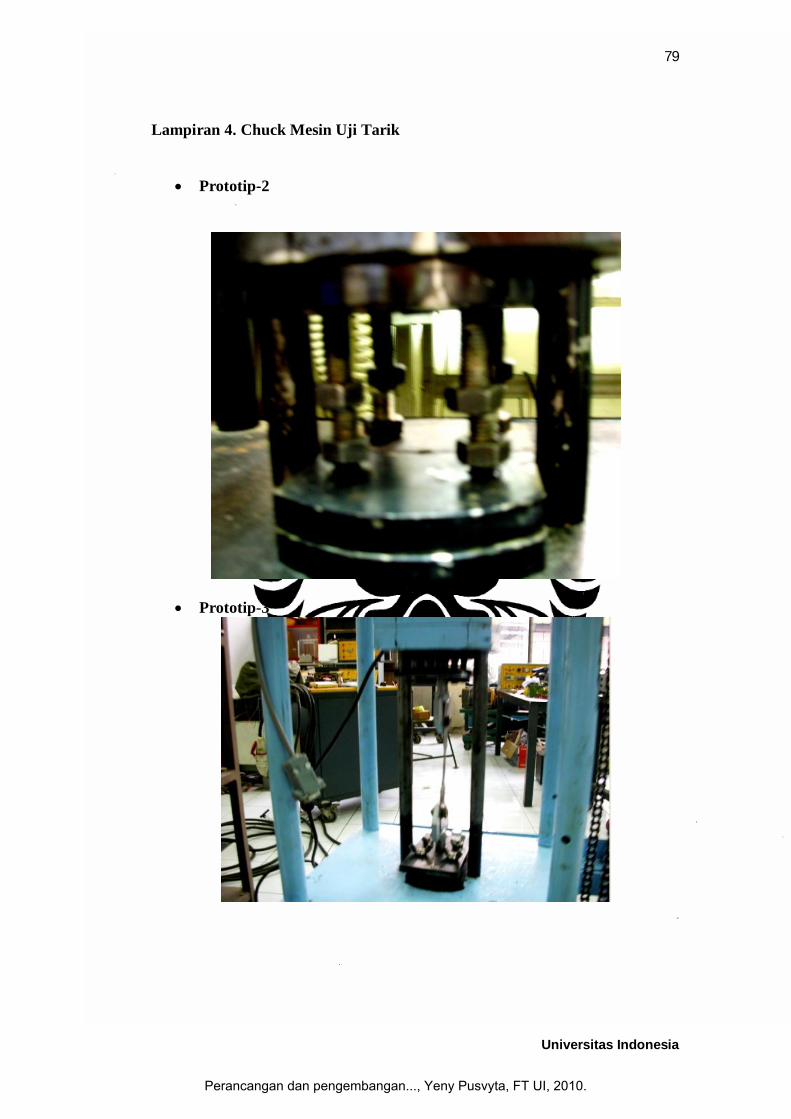
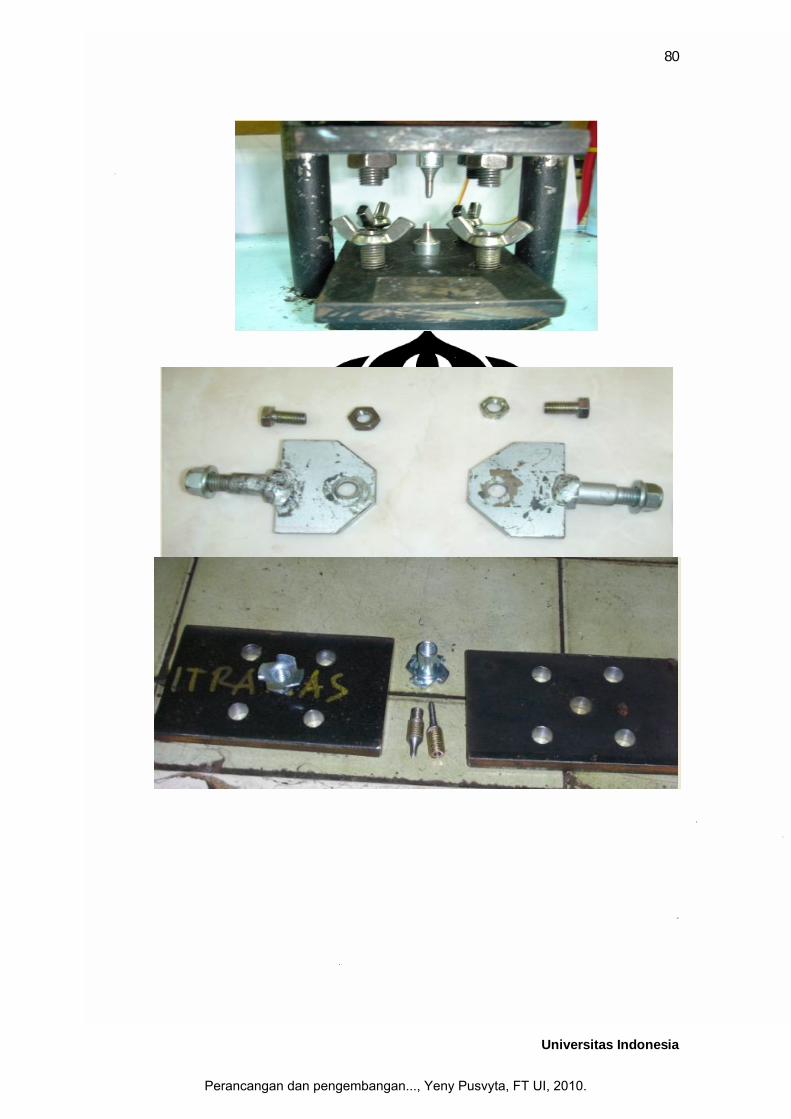
Lampiran 4. Chuck Mesin Uji Tarik
Prototip-2
Prototip-3
Perancangan dan pengembangan..., Yeny Pusvyta, FT UI, 2010.

80
Universitas Indonesia
Perancangan dan pengembangan..., Yeny Pusvyta, FT UI, 2010.
81
Universitas Indonesia
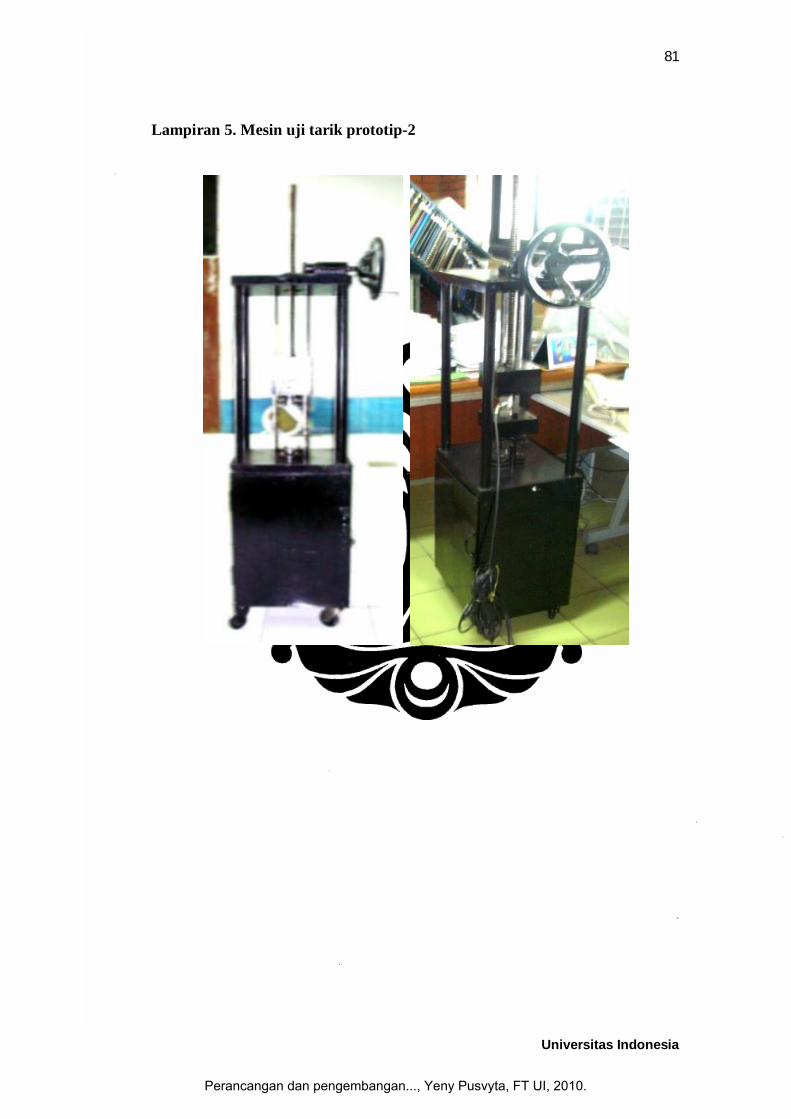
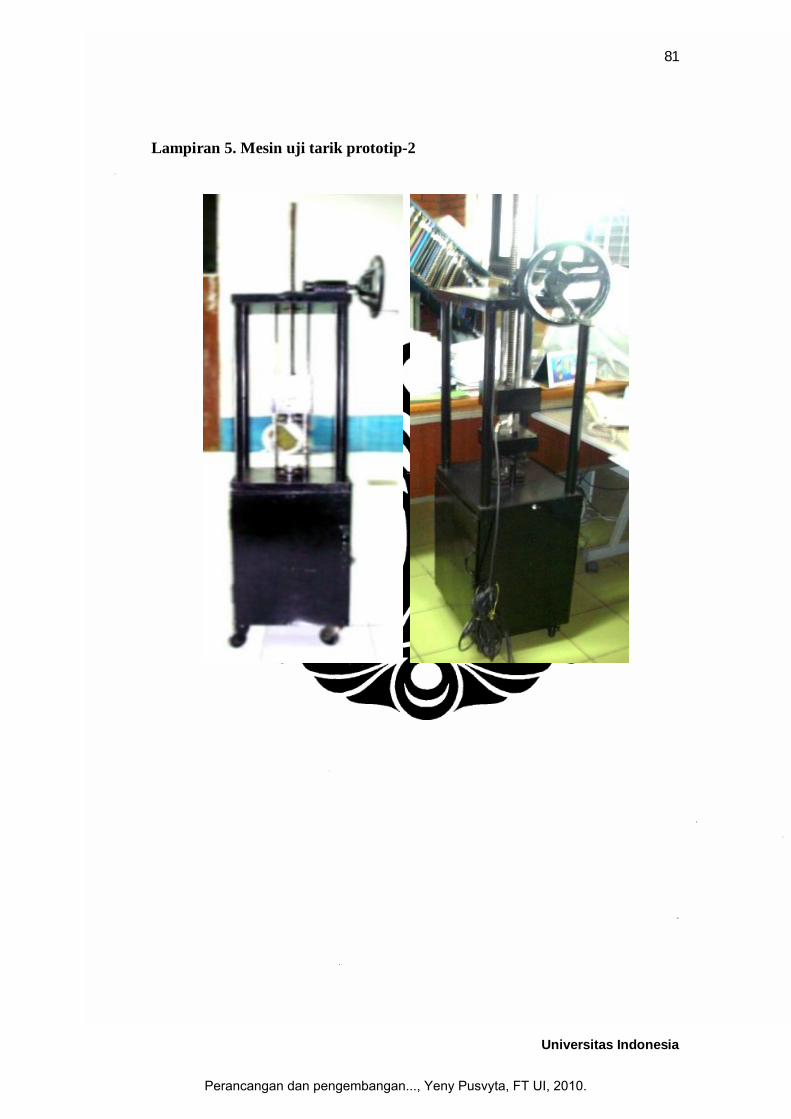
Lampiran 5. Mesin uji tarik prototip-2
Perancangan dan pengembangan..., Yeny Pusvyta, FT UI, 2010.
240
8
6
D
C
B
A
E
F
G
H
E
A
B
C
D
F
54321 7 8 9 10 11 12
1 2 3 4 5 6 7
G
75
260
30045
4,7
SKALA :SATUAN : mmTANGGAL: DILIHAT :
DIGAMBAR : YENY PDEPT/NIM : MESIN
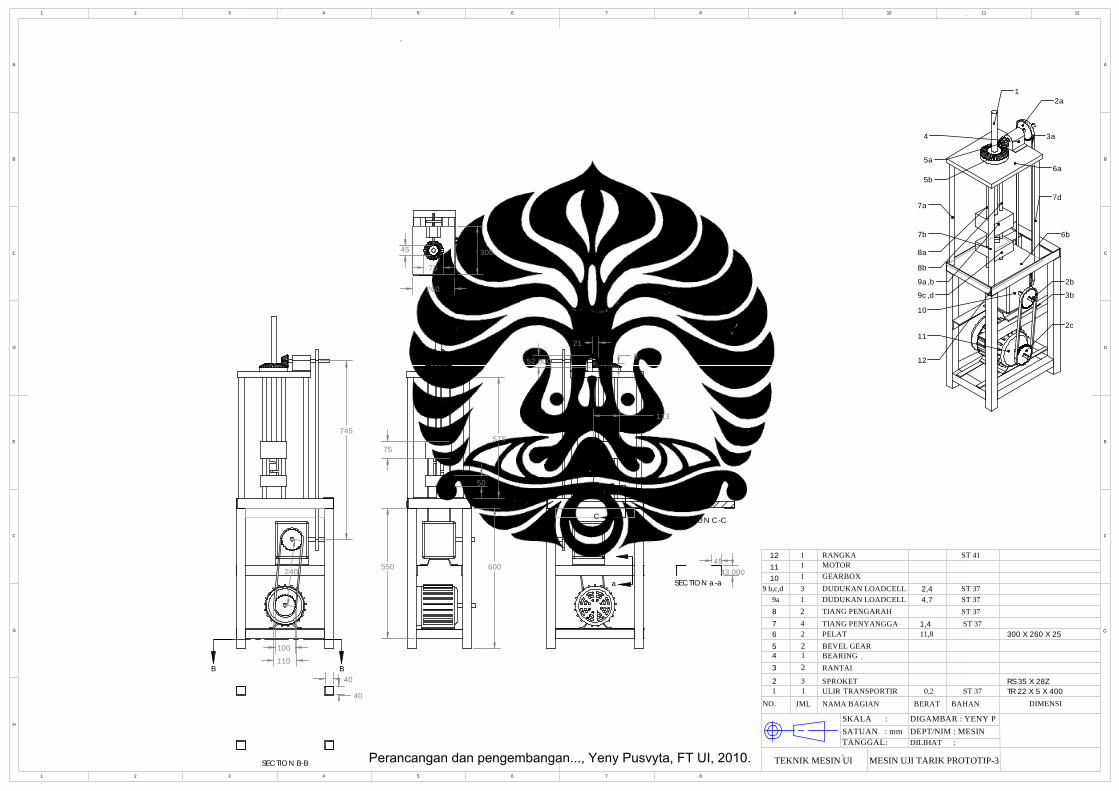
MESIN UJI TARIK PROTOTIP-3TEKNIK MESIN UI
NO. JML NAMA BAGIAN DIMENSIBAHANBERAT
1
2,4
300 X 260 X 25
TRANSPORTIRSPROKET
RANTAIBEARINGBEVEL GEARPELAT
2
3456789a
101112
13
2
21
2TIANG PENYANGGA4TIANG PENGARAHDUDUKAN LOADCELLDUDUKAN LOADCELL9 b,c,d
2
31
GEARBOX111
MOTORRANGKA
11,8
0,2
ST 41
ST 37
ST 37ST 37ST 37ST 37
TR 22 X 5 X 400RS 35 X 28Z
ULIR
1,4
SECTION C-C
21
113
852.000
a
a
C
C
100
745
110B B
SECTION B-B
40
40
12a
3a
3b
5a
4
5b6a
6b
7a
2c
7b
7d
8a
8b
9a,b
9c,d
10
11
2b
12
575
600
75
50
550
SECTION a-a
4543.000
Perancangan dan pengembangan..., Yeny Pusvyta, FT UI, 2010.
Perancangan dan pengembangan..., Yeny Pusvyta, FT UI, 2010.
Perancangan dan pengembangan..., Yeny Pusvyta, FT UI, 2010.
Perancangan dan pengembangan..., Yeny Pusvyta, FT UI, 2010.

57
Universitas Indonesia
Lampiran 1. Data Hasil Pengujian Ergonomi/Kenyamanan
A. Pengujian awal pada prototip-2
Suasana pengujian
Perancangan dan pengembangan..., Yeny Pusvyta, FT UI, 2010.

58
Universitas Indonesia
Data antropometri responden pada pengujian awal
Perancangan dan pengembangan..., Yeny Pusvyta, FT UI, 2010.
59
Universitas Indonesia
Studi waktu pemasangan dan pelepasan spesimen pada chuck mesin uji
tarik prototip-2
Perancangan dan pengembangan..., Yeny Pusvyta, FT UI, 2010.

60
Universitas Indonesia
Data parameter kenyamanan penggunaan mesin uji tarik prototip-2
Perancangan dan pengembangan..., Yeny Pusvyta, FT UI, 2010.
61
Universitas Indonesia
B. Pengujian akhir pada prototip-3
Suasana pengujian
Perancangan dan pengembangan..., Yeny Pusvyta, FT UI, 2010.
62
Universitas Indonesia
Data antropometri responden pada pengujian akhir
Studi waktu pemasangan dan pelepasan spesimen pada chuck mesin uji tarik prototip-3
Perancangan dan pengembangan..., Yeny Pusvyta, FT UI, 2010.
63
Universitas Indonesia
Data parameter kenyamanan penggunaan mesin uji tarik prototip-3
Perancangan dan pengembangan..., Yeny Pusvyta, FT UI, 2010.
64
Universitas Indonesia
Lampiran 2. Tabel Hasil Perhitungan Tegangan Dan Tegangan
A. Spesimen silindris Spesimen 1
Data No
Spesimen 1 A = 7.065 mm² L = 10 mm
F (N) ∆l
(mm) σ (N/mm²) ε 1 311.377 0.000 44.073 0.000 2 686.079 0.003 97.110 0.000 3 764.110 0.004 108.154 0.000 4 793.179 0.005 112.269 0.000 5 869.040 0.008 123.006 0.001 6 900.524 0.013 127.463 0.001 7 928.951 0.073 131.486 0.007 8 1020.246 0.088 144.409 0.009 9 1019.059 0.152 144.240 0.015
10 1070.894 0.153 151.577 0.015 11 1077.910 0.154 152.570 0.015 12 1082.415 0.154 153.208 0.015 13 1141.509 0.155 161.572 0.016 14 1170.750 0.157 165.711 0.016 15 1188.754 0.165 168.260 0.016 16 1342.576 0.208 190.032 0.021 17 1473.429 0.261 208.553 0.026 18 1630.998 0.317 230.856 0.032 19 1792.689 0.372 253.742 0.037 20 1937.604 0.428 274.254 0.043 21 2124.658 0.496 300.730 0.050 22 2325.923 0.554 329.218 0.055 23 2610.151 0.618 369.448 0.062 24 2923.868 0.659 413.852 0.066 25 3212.305 0.703 454.679 0.070 26 3442.849 0.760 487.311 0.076 27 3504.904 0.894 496.094 0.089 28 3443.018 0.981 487.334 0.098 29 3333.257 1.076 471.799 0.108 30 3202.393 1.189 453.276 0.119 31 3083.464 1.308 436.442 0.131 32 2925.143 1.410 414.033 0.141 33 2735.990 1.522 387.260 0.152 34 1559.265 1.672 220.703 0.167 35 869.735 2.291 123.105 0.229
Perancangan dan pengembangan..., Yeny Pusvyta, FT UI, 2010.

65
Universitas Indonesia
Spesimen 2
Data No Spesimen 2
A = 7.065 mm² L = 10 mm F (N) ∆l (mm) σ (N/mm²) ε
1 1.616 0.001 0.229 0.000 2 1.735 0.002 0.246 0.000 3 23.863 0.001 3.378 0.000 4 100.767 0.001 14.263 0.000 5 152.303 0.004 21.557 0.000 6 225.053 0.010 31.855 0.001 7 258.107 0.009 36.533 0.001 8 257.493 0.009 36.446 0.001 9 273.864 0.011 38.763 0.001
10 301.012 0.006 42.606 0.001 11 328.069 0.009 46.436 0.001 12 376.085 0.009 53.232 0.001 13 528.420 0.008 74.794 0.001 14 628.858 0.016 89.010 0.002 15 719.926 0.042 101.900 0.004 16 821.153 0.062 116.228 0.006 17 1048.625 0.111 148.425 0.011 18 1178.310 0.125 166.781 0.013 19 1371.233 0.138 194.088 0.014 20 1721.322 0.164 243.641 0.016 21 2103.468 0.200 297.731 0.020 22 2216.581 0.219 313.741 0.022 23 2272.517 0.254 321.658 0.025 24 2298.480 0.294 325.333 0.029 25 2290.119 0.388 324.150 0.039 26 2208.328 0.537 312.573 0.054 27 2127.621 0.675 301.149 0.067 28 2056.252 0.766 291.048 0.077 29 1949.535 0.913 275.943 0.091 30 1882.838 0.968 266.502 0.097 31 1734.069 1.136 245.445 0.114 32 1651.990 1.206 233.827 0.121 33 1561.393 1.260 221.004 0.126 34 1452.789 1.324 205.632 0.132
Perancangan dan pengembangan..., Yeny Pusvyta, FT UI, 2010.

66
Universitas Indonesia
Spesimen 3
Data No Spesimen 3
A = 7.065 mm² L = 10 mm F (N) ∆l (mm) σ (N/mm²) ε
1 0.390 -0.001 0.055 0.000 2 -35.252 -0.004 -4.990 0.000 3 10.577 -0.006 1.497 -0.001 4 132.994 -0.006 18.824 -0.001 5 229.381 -0.009 32.467 -0.001 6 333.937 -0.009 47.266 -0.001 7 433.871 -0.005 61.411 -0.001 8 549.010 0.000 77.708 0.000 9 682.416 0.005 96.591 0.001
10 801.449 0.010 113.439 0.001 11 984.097 0.015 139.292 0.002 12 1137.996 0.023 161.075 0.002 13 1290.396 0.028 182.646 0.003 14 1519.542 0.033 215.080 0.003 15 1713.501 0.037 242.534 0.004 16 1931.345 0.040 273.368 0.004 17 2064.524 0.044 292.219 0.004 18 2173.447 0.067 307.636 0.007 19 2233.585 0.119 316.148 0.012 20 2238.475 0.183 316.840 0.018 21 2284.385 0.210 323.338 0.021 22 2265.552 0.243 320.673 0.024 23 2247.183 0.285 318.073 0.028 24 2243.228 0.321 317.513 0.032 25 2196.211 0.364 310.858 0.036 26 2178.170 0.413 308.304 0.041 27 2110.710 0.461 298.756 0.046 28 2064.215 0.511 292.175 0.051 29 2025.852 0.562 286.745 0.056 30 1953.072 0.612 276.443 0.061 31 1929.297 0.662 273.078 0.066 32 1894.147 0.675 268.103 0.068 33 1831.879 0.738 259.289 0.074 34 1748.138 0.796 247.436 0.080 35 1693.039 0.857 239.638 0.086
Perancangan dan pengembangan..., Yeny Pusvyta, FT UI, 2010.

67
Universitas Indonesia
Spesimen 4
Data No Spesimen 4
A = 7.065 mm² L = 10 mm F (N) ∆l (mm) σ (N/mm²) ε
1 -0.450 0.003 -0.064 0.000 2 -1.143 0.002 -0.162 0.000 3 58.595 0.004 8.294 0.000 4 165.154 0.004 23.376 0.000 5 294.128 0.005 41.632 0.000 6 416.963 0.005 59.018 0.001 7 492.396 0.005 69.695 0.001 8 642.040 0.008 90.876 0.001 9 768.968 0.012 108.842 0.001
10 923.276 0.018 130.683 0.002 11 1113.687 0.022 157.634 0.002 12 1321.987 0.027 187.118 0.003 13 1554.196 0.041 219.985 0.004 14 1747.143 0.072 247.296 0.007 15 2005.815 0.112 283.909 0.011 16 2209.642 0.143 312.759 0.014 17 2295.620 0.161 324.928 0.016 18 2382.641 0.196 337.246 0.020 19 2402.600 0.236 340.071 0.024 20 2431.599 0.274 344.175 0.027 21 2433.354 0.319 344.424 0.032 22 2397.698 0.369 339.377 0.037 23 2378.700 0.430 336.688 0.043 24 2316.865 0.466 327.936 0.047 25 2283.008 0.499 323.143 0.050 26 2217.988 0.538 313.940 0.054 27 2132.168 0.583 301.793 0.058 28 2090.289 0.627 295.865 0.063 29 2004.489 0.685 283.721 0.069 30 1933.541 0.741 273.679 0.074 31 1901.690 0.751 269.170 0.075 32 1831.448 0.795 259.228 0.079 33 1714.201 0.855 242.633 0.086 34 1600.103 0.923 226.483 0.092 35 1465.121 0.976 207.377 0.098
Perancangan dan pengembangan..., Yeny Pusvyta, FT UI, 2010.

68
Universitas Indonesia
Spesimen 5
Data No
Spesimen 5 A = 7.065 mm² L = 10 mm
F (N) ∆l
(mm) σ (N/mm²) ε 1 0.068 0.002 0.010 0.000 2 185.529 0.000 26.260 0.000 3 257.190 0.005 36.403 0.000 4 353.493 0.003 50.034 0.000 5 435.129 0.012 61.589 0.001 6 540.845 0.011 76.553 0.001 7 633.154 0.014 89.618 0.001 8 860.365 0.016 121.778 0.002 9 976.806 0.020 138.260 0.002
10 1292.149 0.024 182.894 0.002 11 1450.254 0.023 205.273 0.002 12 1792.865 0.047 253.767 0.005 13 1967.836 0.061 278.533 0.006 14 2147.488 0.070 303.961 0.007 15 2265.896 0.082 320.721 0.008 16 2412.650 0.114 341.493 0.011 17 2474.563 0.130 350.257 0.013 18 2499.562 0.154 353.795 0.015 19 2486.755 0.181 351.982 0.018 20 2490.982 0.203 352.581 0.020 21 2470.194 0.262 349.638 0.026 22 2382.311 0.331 337.199 0.033 23 2372.183 0.340 335.766 0.034 24 2350.819 0.374 332.741 0.037 25 2255.715 0.434 319.280 0.043 26 2232.246 0.474 315.958 0.047 27 2172.376 0.508 307.484 0.051 28 2107.559 0.548 298.310 0.055 29 2040.703 0.579 288.847 0.058 30 1926.542 0.650 272.688 0.065 31 1884.486 0.673 266.735 0.067 32 1827.063 0.701 258.608 0.070 33 1739.529 0.735 246.218 0.074 34 1571.371 0.819 222.416 0.082 35 1486.300 0.850 210.375 0.085
Perancangan dan pengembangan..., Yeny Pusvyta, FT UI, 2010.
69
Universitas Indonesia
B. Spesimen lembaran Spesimen 4
Data No Spesimen 4
A = 6.35 mm² L = 25 mm F (N) ∆l (mm) σ (N/mm²) ε
1 15.75 0.03 2.48 0.00 2 520.29 0.04 81.94 0.00 3 757.04 0.08 119.22 0.00 4 798.08 0.20 125.68 0.01 5 873.19 0.33 137.51 0.01 6 955.52 0.49 150.48 0.02 7 999.20 0.63 157.35 0.03 8 1047.43 0.83 164.95 0.03 9 1058.34 1.02 166.67 0.04
10 1084.78 1.20 170.83 0.05 11 1110.23 1.36 174.84 0.05 12 1128.29 1.56 177.68 0.06 13 1133.51 1.75 178.50 0.07 14 1149.02 1.96 180.95 0.08 15 1168.86 2.15 184.07 0.09 16 1167.05 2.34 183.79 0.09 17 1173.19 2.51 184.75 0.10 18 1182.25 2.73 186.18 0.11 19 1201.43 2.91 189.20 0.12 20 1188.33 3.09 187.14 0.12 21 1197.20 3.29 188.54 0.13 22 1203.60 3.49 189.54 0.14 23 1215.11 3.73 191.36 0.15 24 1208.37 4.10 190.29 0.16 25 1201.27 4.45 189.18 0.18 26 1193.18 4.83 187.90 0.19 27 1202.48 5.13 189.37 0.21 28 1166.85 5.45 183.76 0.22 29 1129.12 5.83 177.81 0.23 30 1091.17 5.90 171.84 0.24 31 1023.07 5.94 161.11 0.24 32 818.61 5.99 128.92 0.24
Perancangan dan pengembangan..., Yeny Pusvyta, FT UI, 2010.

70
Universitas Indonesia
Spesimen 6
Data No Spesimen 6
A = 6.1 mm² L = 25 mm F (N) ∆l (mm) σ (N/mm²) ε
1 0.42 0.02 0.07 0.00 2 67.27 0.02 11.03 0.00 3 263.08 0.01 43.13 0.00 4 612.30 0.02 100.38 0.00 5 815.16 0.03 133.63 0.00 6 906.81 0.10 148.66 0.00 7 939.41 0.33 154.00 0.01 8 975.50 0.55 159.92 0.02 9 1006.98 0.73 165.08 0.03
10 1042.18 0.96 170.85 0.04 11 1046.85 1.14 171.61 0.05 12 1072.75 1.35 175.86 0.05 13 1094.01 1.53 179.35 0.06 14 1114.94 1.72 182.78 0.07 15 1118.04 1.93 183.29 0.08 16 1133.59 2.13 185.83 0.09 17 1145.10 2.34 187.72 0.09 18 1144.59 2.53 187.64 0.10 19 1139.96 2.81 186.88 0.11 20 1145.46 3.02 187.78 0.12 21 1160.72 3.26 190.28 0.13 22 1145.82 3.45 187.84 0.14 23 1148.34 3.73 188.25 0.15 24 1147.51 4.13 188.12 0.17 25 1152.43 4.34 188.92 0.17 26 1156.36 4.60 189.57 0.18 27 1151.28 4.91 188.73 0.20 28 1148.40 5.21 188.26 0.21 29 1141.75 5.60 187.17 0.22 30 1146.43 5.91 187.94 0.24 31 1121.67 6.17 183.88 0.25 32 1094.47 6.61 179.42 0.26 33 1067.27 6.88 174.96 0.28 34 1011.49 7.20 165.82 0.29 35 908.87 7.56 149.00 0.30
Perancangan dan pengembangan..., Yeny Pusvyta, FT UI, 2010.

71
Universitas Indonesia
Spesimen 7
Data No Spesimen 7
A = 6.1 mm² L = 25 mm F (N) ∆l (mm) σ (N/mm²) ε
1 0.50 0.00 0.08 0.00 2 302.64 0.00 49.61 0.00 3 317.67 0.00 52.08 0.00 4 350.09 0.00 57.39 0.00 5 480.88 0.00 78.83 0.00 6 702.09 0.02 115.10 0.00 7 795.01 0.06 130.33 0.00 8 869.01 0.18 142.46 0.01 9 918.91 0.46 150.64 0.02
10 963.91 0.62 158.02 0.02 11 1011.39 0.81 165.80 0.03 12 1002.08 1.02 164.27 0.04 13 1043.39 1.25 171.05 0.05 14 1058.35 1.41 173.50 0.06 15 1101.67 1.62 180.60 0.06 16 1131.87 1.83 185.55 0.07 17 1160.28 2.25 190.21 0.09 18 1186.83 2.45 194.56 0.10 19 1195.30 2.69 195.95 0.11 20 1186.63 2.93 194.53 0.12 21 1191.33 3.23 195.30 0.13 22 1214.68 3.43 199.13 0.14 23 1227.02 3.70 201.15 0.15 24 1226.14 3.99 201.01 0.16 25 1210.78 4.23 198.49 0.17 26 1221.57 4.57 200.26 0.18 27 1231.44 4.87 201.87 0.19 28 1229.21 5.16 201.51 0.21 29 1212.37 5.45 198.75 0.22 30 1224.65 5.55 200.76 0.22 31 1197.84 5.87 196.37 0.23 32 1188.33 6.12 194.81 0.24 33 1164.06 6.44 190.83 0.26 34 1117.62 6.76 183.22 0.27 35 960.44 7.18 157.45 0.29
Perancangan dan pengembangan..., Yeny Pusvyta, FT UI, 2010.

72
Universitas Indonesia
Spesimen 11
Data No Spesimen 11
A = 6.9 mm² L = 25 mm F (N) ∆l (mm) σ (N/mm²) ε
1 0.44 0.00 0.06 0.00 2 309.69 0.00 44.88 0.00 3 517.52 0.03 75.00 0.00 4 644.04 0.18 93.34 0.01 5 697.15 0.33 101.04 0.01 6 789.48 0.51 114.42 0.02 7 912.02 0.63 132.18 0.03 8 946.52 0.80 137.18 0.03 9 966.78 0.98 140.11 0.04
10 998.66 1.16 144.73 0.05 11 1031.74 1.34 149.53 0.05 12 1033.24 1.51 149.75 0.06 13 1043.22 1.67 151.19 0.07 14 1079.58 1.85 156.46 0.07 15 1092.25 2.01 158.30 0.08 16 1082.31 2.17 156.86 0.09 17 1093.98 2.34 158.55 0.09 18 1110.12 2.56 160.89 0.10 19 1115.04 2.75 161.60 0.11 20 1099.93 2.97 159.41 0.12 21 1109.27 3.25 160.76 0.13 22 1119.67 3.57 162.27 0.14 23 1121.17 3.89 162.49 0.16 24 1113.54 4.31 161.38 0.17 25 1106.07 4.59 160.30 0.18 26 1102.76 4.74 159.82 0.19 27 1100.29 4.79 159.46 0.19 28 1065.55 4.82 154.43 0.19 29 1011.88 4.94 146.65 0.20 30 938.51 5.02 136.02 0.20 31 744.43 5.11 107.89 0.20
Perancangan dan pengembangan..., Yeny Pusvyta, FT UI, 2010.

73
Universitas Indonesia
Spesimen 12
Data No Spesimen 12
A = 6.55 mm² L = 25 mm F (N) ∆l (mm) σ (N/mm²) ε
1 12.09 -0.01 1.85 0.00 2 1002.30 -0.01 153.02 0.00 3 1042.04 -0.01 159.09 0.00 4 1049.31 -0.01 160.20 0.00 5 1043.47 -0.01 159.31 0.00 6 1035.20 -0.01 158.05 0.00 7 1027.04 -0.01 156.80 0.00 8 1024.15 0.01 156.36 0.00 9 1023.39 0.01 156.24 0.00
10 1021.43 0.01 155.94 0.00 11 1020.05 0.01 155.73 0.00 12 1019.61 0.01 155.67 0.00 13 788.31 0.01 120.35 0.00 14 1107.75 0.01 169.12 0.00 15 1116.87 0.05 170.51 0.00 16 1143.28 0.31 174.55 0.01 17 1161.38 0.52 177.31 0.02 18 1194.20 0.70 182.32 0.03 19 1201.34 0.93 183.41 0.04 20 1189.94 1.11 181.67 0.04 21 1210.13 1.38 184.75 0.06 22 1222.55 1.57 186.65 0.06 23 1238.08 1.96 189.02 0.08 24 1246.89 2.02 190.36 0.08 25 1243.31 2.23 189.82 0.09 26 1234.35 2.43 188.45 0.10 27 1250.43 2.69 190.91 0.11 28 1257.79 2.91 192.03 0.12 29 1250.56 3.50 190.93 0.14 30 1222.84 3.79 186.69 0.15 31 1189.30 4.09 181.57 0.16 32 1160.15 4.30 177.12 0.17 33 1063.88 4.59 162.42 0.18 34 984.67 4.71 150.33 0.19 35 852.79 4.83 130.20 0.19
Perancangan dan pengembangan..., Yeny Pusvyta, FT UI, 2010.
74
Universitas Indonesia
C. Pengujian spesimen silindris dengan dudukan chuck yang telah dimodifikasi
Spesimen R5
Spesimen R5
Data no A = 6.6 mm² L = 25 mm
F(N) ∆l (mm) σ(N/mm²) ε
1 0.000 0 0.000 0.000 2 325.323 0.43 53.332 0.017 3 779.075 0.85 127.717 0.034 4 979.831 1.25 160.628 0.050 5 1037.622 1.69 170.102 0.068 6 1092.266 2.09 179.060 0.084 7 1122.708 2.5 184.051 0.100 8 1135.611 2.9 186.166 0.116 9 1176.849 3.35 192.926 0.134
10 1197.698 3.66 196.344 0.146 11 1198.722 4.18 196.512 0.167 12 1223.698 4.62 200.606 0.185 13 1229.883 5.04 201.620 0.202 14 1233.554 5.48 202.222 0.219 15 1246.632 5.93 204.366 0.237 16 1246.432 6.25 204.333 0.250 17 1240.005 6.7 203.280 0.268 18 1255.300 7.05 205.787 0.282 19 1260.149 7.61 206.582 0.304 20 1250.945 8.02 205.073 0.321 21 1263.855 8.4 207.189 0.336 22 1265.479 8.85 207.456 0.354 23 1257.116 9.2 206.085 0.368 24 1259.349 9.67 206.451 0.387 25 1252.780 10.1 205.374 0.404 26 1250.461 10.3 204.994 0.412 27 1251.165 10.5 205.109 0.420 28 1227.408 10.7 201.214 0.428 29 1225.976 10.9 200.980 0.436 30 1199.263 11.1 196.601 0.444 31 1139.363 11.3 186.781 0.452 32 1020.970 11.35 167.372 0.454
33 871.424 11.4 142.856 0.456
Perancangan dan pengembangan..., Yeny Pusvyta, FT UI, 2010.
75
Universitas Indonesia
Spesimen R6
Spesimen R6
Data no A = 6.1 mm² L = 25 mm
F(N) ∆l (mm) σ(N/mm²) ε
1 0 0 0.000 0.000 2 245.715 0.4 40.281 0.016 3 726.047 0.79 119.024 0.032 4 964.052 2.16 158.041 0.086 5 1035.150 2.53 169.697 0.101 6 1070.340 2.95 175.466 0.118 7 1111.018 3.4 182.134 0.136 8 1125.027 3.78 184.431 0.151 9 1140.534 4.2 186.973 0.168
10 1163.479 4.68 190.734 0.187 11 1172.904 5.12 192.279 0.205 12 1179.094 5.6 193.294 0.224 13 1184.758 5.99 194.223 0.240 14 1174.944 6.53 192.614 0.261 15 1185.700 6.91 194.377 0.276 16 1176.381 6.39 192.849 0.256 17 1147.209 6.79 188.067 0.272 18 1130.383 7.25 185.309 0.290
19 1071.339 7.5 175.629 0.300
Perancangan dan pengembangan..., Yeny Pusvyta, FT UI, 2010.
76
Universitas Indonesia
Spesimen R7
Spesimen R7
Data no A = 6.8 mm² L = 25 mm
F(N) ∆l (mm) σ(N/mm²) ε
1 0 0 0.000 0 2 150.180 0 22.085 0 3 495.148 0 72.816 0 4 746.521 0 109.783 0 5 932.312 0 137.105 0 6 1027.025 0.32 151.033 0.013 7 1078.375 0.9 158.585 0.036 8 1129.098 1.26 166.044 0.050 9 1151.692 1.71 169.366 0.068
10 1184.328 2.18 174.166 0.087 11 1213.794 2.57 178.499 0.103 12 1226.255 2.95 180.332 0.118 13 1241.914 3.39 182.634 0.136 14 1255.288 3.84 184.601 0.154 15 1255.004 4.2 184.559 0.168 16 1274.084 4.62 187.365 0.185 17 1269.179 5.06 186.644 0.202 18 1258.517 5.47 185.076 0.219 19 1278.264 5.95 187.980 0.238 20 1282.349 6.57 188.581 0.263 21 1269.635 6.8 186.711 0.272 22 1284.070 7.22 188.834 0.289 23 1284.067 7.66 188.833 0.306 24 1272.359 8.03 187.112 0.321 25 1272.111 8.41 187.075 0.336 26 1260.513 8.88 185.370 0.355 27 1236.477 9.28 181.835 0.371 28 1216.944 9.73 178.962 0.389 29 1149.875 10.23 169.099 0.409
30 888.951 10.55 130.728 0.422
Perancangan dan pengembangan..., Yeny Pusvyta, FT UI, 2010.
77
Universitas Indonesia
Lampiran 3.Diagram Blok Dan Front Panel Program Labview Untuk
Pengujian Tarik Diagram blok untuk dua input loadcell dan potensiometer
Diagram blok pengujian revisi dengan satu input gaya dari loadcell
Perancangan dan pengembangan..., Yeny Pusvyta, FT UI, 2010.

78
Universitas Indonesia
Front panel untuk dua input loadcell dan potensiometer
Front panel pengujian revisi dengan satu input gaya dari loadcell
Perancangan dan pengembangan..., Yeny Pusvyta, FT UI, 2010.

79
Universitas Indonesia
Lampiran 4. Chuck Mesin Uji Tarik
Prototip-2
Prototip-3
Perancangan dan pengembangan..., Yeny Pusvyta, FT UI, 2010.
80
Universitas Indonesia
Perancangan dan pengembangan..., Yeny Pusvyta, FT UI, 2010.
81
Universitas Indonesia
Lampiran 5. Mesin uji tarik prototip-2
Perancangan dan pengembangan..., Yeny Pusvyta, FT UI, 2010.
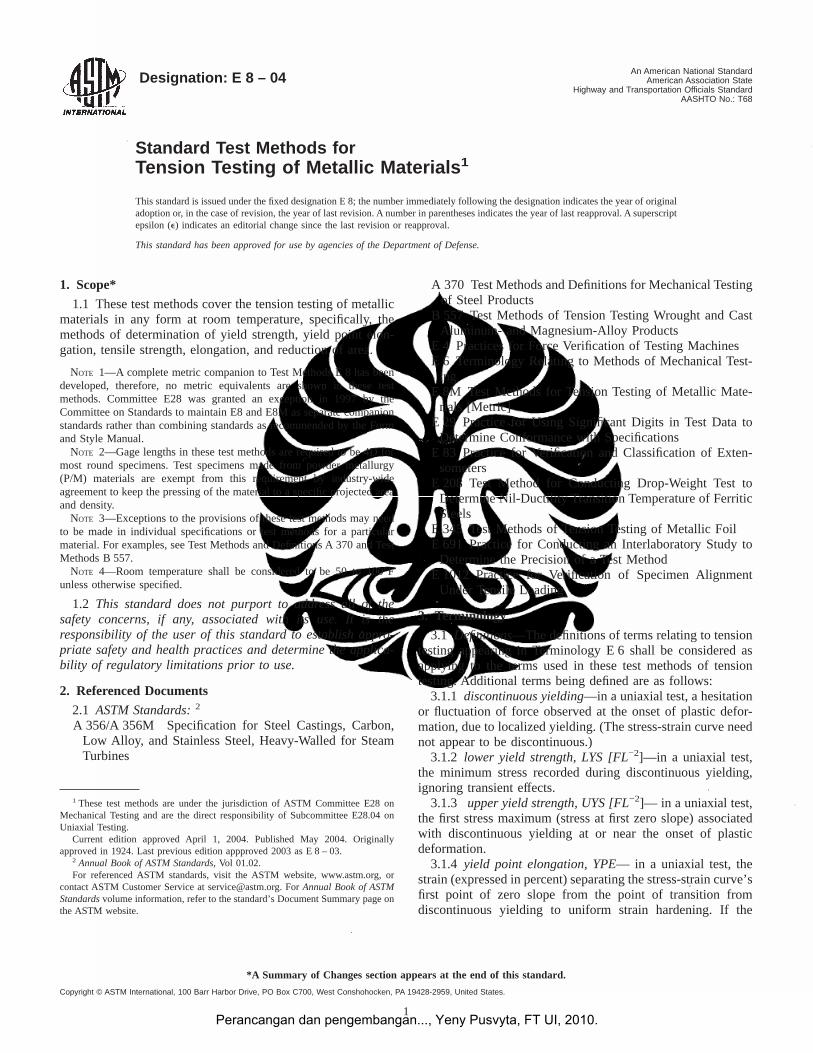
Designation : E 8 – 04 An American National StandardAmerican Association State
Highway and Transportation Officials StandardAASHTO No.: T68
Standard Test Methods forTension Testing of Metallic Materials 1
This standard is issued under the fixed designation E 8; the number immediately following the designation indicates the year of originaladoption or, in the case of revision, the year of last revision. A number in parentheses indicates the year of last reapproval. A superscriptepsilon (e) indicates an editorial change since the last revision or reapproval.
This standard has been approved for use by agencies of the Department of Defense.
1. Scope*
1.1 These test methods cover the tension testing of metallicmaterials in any form at room temperature, specifically, themethods of determination of yield strength, yield point elon-gation, tensile strength, elongation, and reduction of area.
NOTE 1—A complete metric companion to Test Methods E 8 has beendeveloped, therefore, no metric equivalents are shown in these testmethods. Committee E28 was granted an exception in 1997 by theCommittee on Standards to maintain E8 and E8M as separate companionstandards rather than combining standards as recommended by the Formand Style Manual.
NOTE 2—Gage lengths in these test methods are required to be 4D formost round specimens. Test specimens made from powder metallurgy(P/M) materials are exempt from this requirement by industry-wideagreement to keep the pressing of the material to a specific projected areaand density.
NOTE 3—Exceptions to the provisions of these test methods may needto be made in individual specifications or test methods for a particularmaterial. For examples, see Test Methods and Definitions A 370 and TestMethods B 557.
NOTE 4—Room temperature shall be considered to be 50 to 100°Funless otherwise specified.
1.2 This standard does not purport to address all of thesafety concerns, if any, associated with its use. It is theresponsibility of the user of this standard to establish appro-priate safety and health practices and determine the applica-bility of regulatory limitations prior to use.
2. Referenced Documents
2.1 ASTM Standards:2
A 356/A 356M Specification for Steel Castings, Carbon,Low Alloy, and Stainless Steel, Heavy-Walled for SteamTurbines
A 370 Test Methods and Definitions for Mechanical Testingof Steel Products
B 557 Test Methods of Tension Testing Wrought and CastAluminum- and Magnesium-Alloy Products
E 4 Practices for Force Verification of Testing MachinesE 6 Terminology Relating to Methods of Mechanical Test-
ingE 8M Test Methods for Tension Testing of Metallic Mate-
rials [Metric]E 29 Practice for Using Significant Digits in Test Data to
Determine Conformance with SpecificationsE 83 Practice for Verification and Classification of Exten-
sometersE 208 Test Method for Conducting Drop-Weight Test to
Determine Nil-Ductility Transition Temperature of FerriticSteels
E 345 Test Methods of Tension Testing of Metallic FoilE 691 Practice for Conducting an Interlaboratory Study to
Determine the Precision of a Test MethodE 1012 Practice for Verification of Specimen Alignment
Under Tensile Loading
3. Terminology
3.1 Definitions—The definitions of terms relating to tensiontesting appearing in Terminology E 6 shall be considered asapplying to the terms used in these test methods of tensiontesting. Additional terms being defined are as follows:
3.1.1 discontinuous yielding—in a uniaxial test, a hesitationor fluctuation of force observed at the onset of plastic defor-mation, due to localized yielding. (The stress-strain curve neednot appear to be discontinuous.)
3.1.2 lower yield strength, LYS [FL−2]—in a uniaxial test,the minimum stress recorded during discontinuous yielding,ignoring transient effects.
3.1.3 upper yield strength, UYS [FL−2]— in a uniaxial test,the first stress maximum (stress at first zero slope) associatedwith discontinuous yielding at or near the onset of plasticdeformation.
3.1.4 yield point elongation, YPE— in a uniaxial test, thestrain (expressed in percent) separating the stress-strain curve’sfirst point of zero slope from the point of transition fromdiscontinuous yielding to uniform strain hardening. If the
1 These test methods are under the jurisdiction of ASTM Committee E28 onMechanical Testing and are the direct responsibility of Subcommittee E28.04 onUniaxial Testing.
Current edition approved April 1, 2004. Published May 2004. Originallyapproved in 1924. Last previous edition appproved 2003 asE 8 – 03.
2 Annual Book of ASTM Standards, Vol 01.02.For referenced ASTM standards, visit the ASTM website, www.astm.org, or
contact ASTM Customer Service at [email protected]. ForAnnual Book of ASTMStandardsvolume information, refer to the standard’s Document Summary page onthe ASTM website.
1
*A Summary of Changes section appears at the end of this standard.
Copyright © ASTM International, 100 Barr Harbor Drive, PO Box C700, West Conshohocken, PA 19428-2959, United States.
Perancangan dan pengembangan..., Yeny Pusvyta, FT UI, 2010.
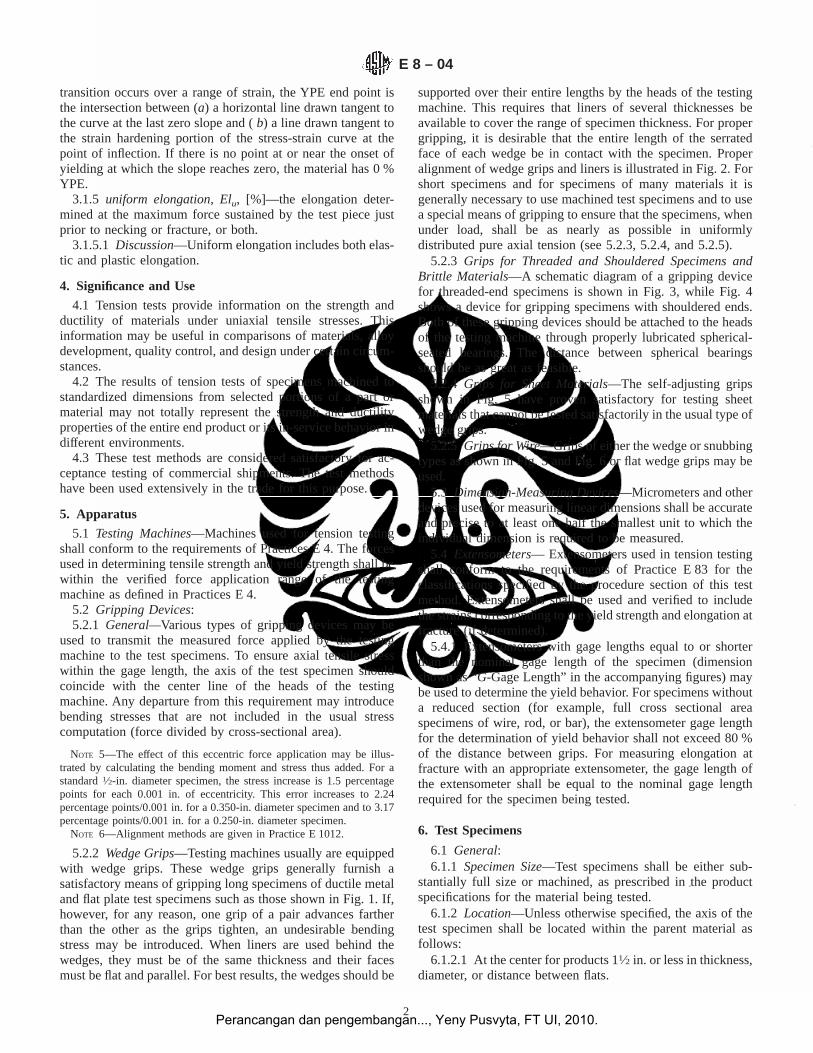
transition occurs over a range of strain, the YPE end point isthe intersection between (a) a horizontal line drawn tangent tothe curve at the last zero slope and (b) a line drawn tangent tothe strain hardening portion of the stress-strain curve at thepoint of inflection. If there is no point at or near the onset ofyielding at which the slope reaches zero, the material has 0 %YPE.
3.1.5 uniform elongation, Elu, [%]—the elongation deter-mined at the maximum force sustained by the test piece justprior to necking or fracture, or both.
3.1.5.1 Discussion—Uniform elongation includes both elas-tic and plastic elongation.
4. Significance and Use
4.1 Tension tests provide information on the strength andductility of materials under uniaxial tensile stresses. Thisinformation may be useful in comparisons of materials, alloydevelopment, quality control, and design under certain circum-stances.
4.2 The results of tension tests of specimens machined tostandardized dimensions from selected portions of a part ormaterial may not totally represent the strength and ductilityproperties of the entire end product or its in-service behavior indifferent environments.
4.3 These test methods are considered satisfactory for ac-ceptance testing of commercial shipments. The test methodshave been used extensively in the trade for this purpose.
5. Apparatus
5.1 Testing Machines—Machines used for tension testingshall conform to the requirements of Practices E 4. The forcesused in determining tensile strength and yield strength shall bewithin the verified force application range of the testingmachine as defined in Practices E 4.
5.2 Gripping Devices:5.2.1 General—Various types of gripping devices may be
used to transmit the measured force applied by the testingmachine to the test specimens. To ensure axial tensile stresswithin the gage length, the axis of the test specimen shouldcoincide with the center line of the heads of the testingmachine. Any departure from this requirement may introducebending stresses that are not included in the usual stresscomputation (force divided by cross-sectional area).
NOTE 5—The effect of this eccentric force application may be illus-trated by calculating the bending moment and stress thus added. For astandard1⁄2-in. diameter specimen, the stress increase is 1.5 percentagepoints for each 0.001 in. of eccentricity. This error increases to 2.24percentage points/0.001 in. for a 0.350-in. diameter specimen and to 3.17percentage points/0.001 in. for a 0.250-in. diameter specimen.
NOTE 6—Alignment methods are given in Practice E 1012.
5.2.2 Wedge Grips—Testing machines usually are equippedwith wedge grips. These wedge grips generally furnish asatisfactory means of gripping long specimens of ductile metaland flat plate test specimens such as those shown in Fig. 1. If,however, for any reason, one grip of a pair advances fartherthan the other as the grips tighten, an undesirable bendingstress may be introduced. When liners are used behind thewedges, they must be of the same thickness and their facesmust be flat and parallel. For best results, the wedges should be
supported over their entire lengths by the heads of the testingmachine. This requires that liners of several thicknesses beavailable to cover the range of specimen thickness. For propergripping, it is desirable that the entire length of the serratedface of each wedge be in contact with the specimen. Properalignment of wedge grips and liners is illustrated in Fig. 2. Forshort specimens and for specimens of many materials it isgenerally necessary to use machined test specimens and to usea special means of gripping to ensure that the specimens, whenunder load, shall be as nearly as possible in uniformlydistributed pure axial tension (see 5.2.3, 5.2.4, and 5.2.5).
5.2.3 Grips for Threaded and Shouldered Specimens andBrittle Materials—A schematic diagram of a gripping devicefor threaded-end specimens is shown in Fig. 3, while Fig. 4shows a device for gripping specimens with shouldered ends.Both of these gripping devices should be attached to the headsof the testing machine through properly lubricated spherical-seated bearings. The distance between spherical bearingsshould be as great as feasible.
5.2.4 Grips for Sheet Materials—The self-adjusting gripsshown in Fig. 5 have proven satisfactory for testing sheetmaterials that cannot be tested satisfactorily in the usual type ofwedge grips.
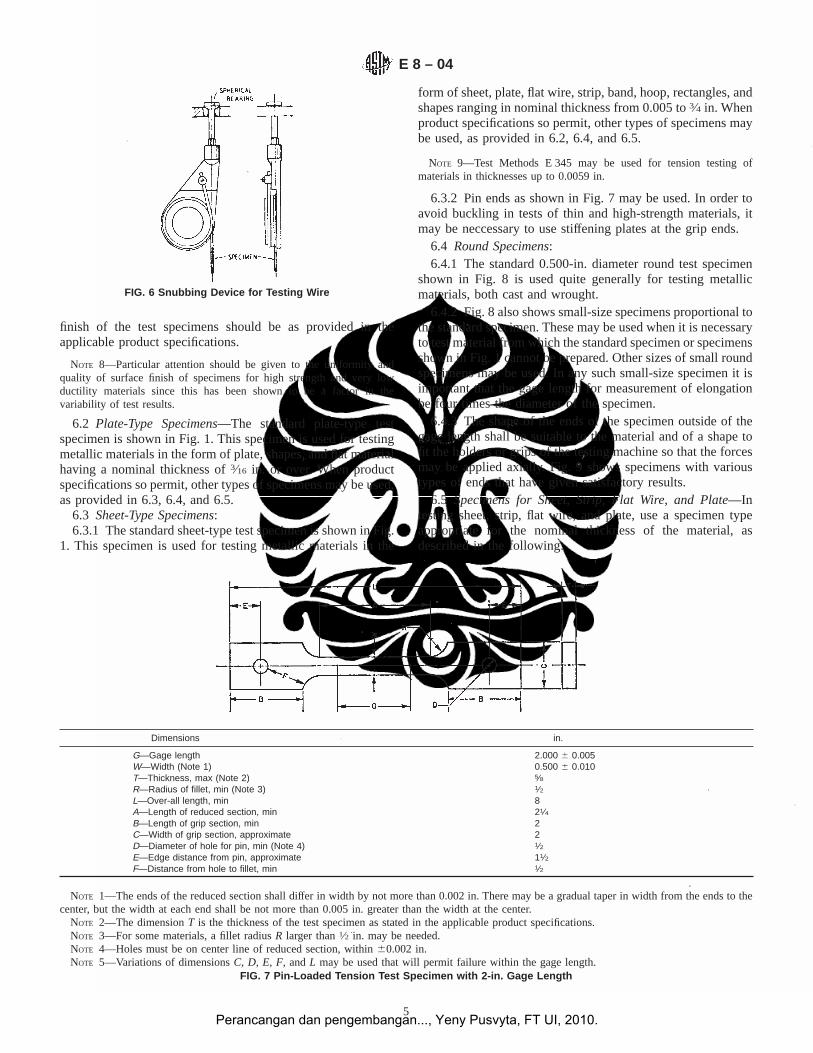
5.2.5 Grips for Wire—Grips of either the wedge or snubbingtypes as shown in Fig. 5 and Fig. 6 or flat wedge grips may beused.
5.3 Dimension-Measuring Devices—Micrometers and otherdevices used for measuring linear dimensions shall be accurateand precise to at least one half the smallest unit to which theindividual dimension is required to be measured.
5.4 Extensometers— Extensometers used in tension testingshall conform to the requirements of Practice E 83 for theclassifications specified by the procedure section of this testmethod. Extensometers shall be used and verified to includethe strains corresponding to the yield strength and elongation atfracture (if determined).
5.4.1 Extensometers with gage lengths equal to or shorterthan the nominal gage length of the specimen (dimensionshown as “G-Gage Length” in the accompanying figures) maybe used to determine the yield behavior. For specimens withouta reduced section (for example, full cross sectional areaspecimens of wire, rod, or bar), the extensometer gage lengthfor the determination of yield behavior shall not exceed 80 %of the distance between grips. For measuring elongation atfracture with an appropriate extensometer, the gage length ofthe extensometer shall be equal to the nominal gage lengthrequired for the specimen being tested.
6. Test Specimens
6.1 General:6.1.1 Specimen Size—Test specimens shall be either sub-
stantially full size or machined, as prescribed in the productspecifications for the material being tested.
6.1.2 Location—Unless otherwise specified, the axis of thetest specimen shall be located within the parent material asfollows:
6.1.2.1 At the center for products 11⁄2 in. or less in thickness,diameter, or distance between flats.
E 8 – 04
2Perancangan dan pengembangan..., Yeny Pusvyta, FT UI, 2010.
6.1.2.2 Midway from the center to the surface for productsover 11⁄2 in. in thickness, diameter, or distance between flats.
6.1.3 Specimen Machining—Improperly prepared testspecimens often are the reason for unsatisfactory and incorrecttest results. It is important, therefore, that care be exercised inthe preparation of specimens, particularly in the machining, tomaximize precision and minimize bias in test results.
6.1.3.1 The reduced sections of prepared specimens shouldbe free of cold work, notches, chatter marks, grooves, gouges,burrs, rough surfaces or edges, overheating, or any othercondition which can deleteriously affect the properties to bemeasured.
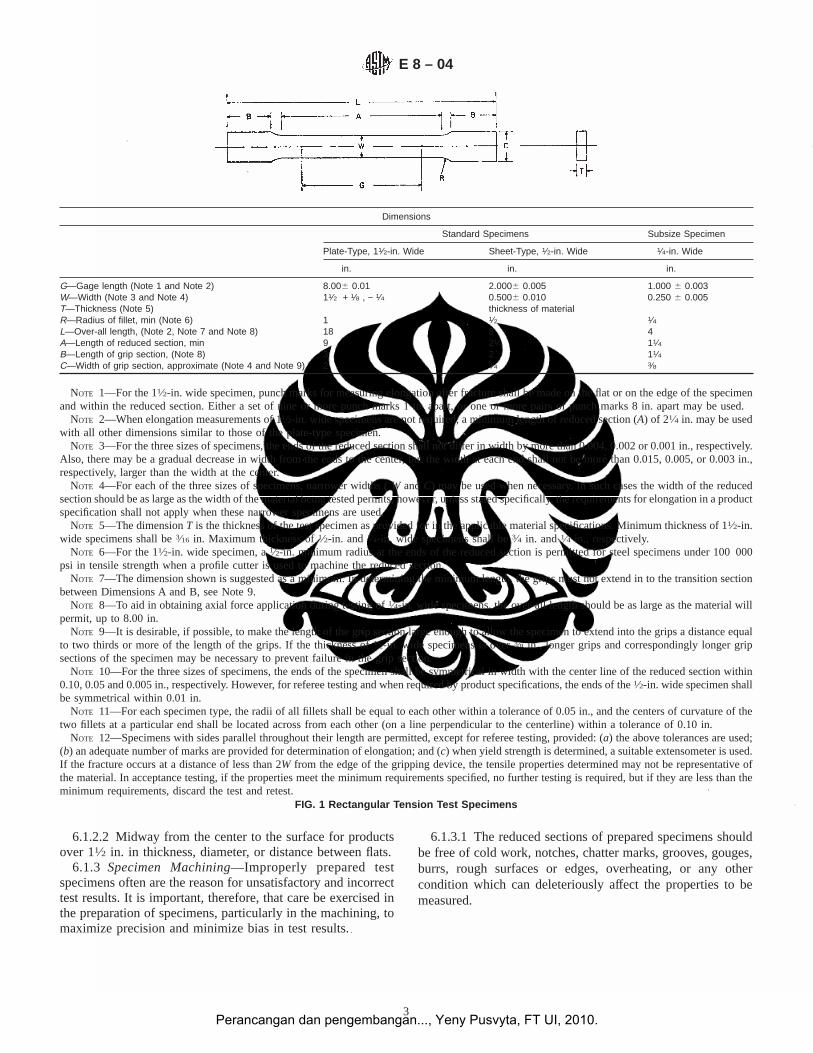
Dimensions
Standard Specimens Subsize Specimen
Plate-Type, 11⁄2-in. Wide Sheet-Type, 1⁄2-in. Wide 1⁄4-in. Wide
in. in. in.
G—Gage length (Note 1 and Note 2) 8.006 0.01 2.0006 0.005 1.000 6 0.003W—Width (Note 3 and Note 4) 11⁄2 + 1⁄8 , − 1⁄4 0.5006 0.010 0.250 6 0.005T—Thickness (Note 5) thickness of materialR—Radius of fillet, min (Note 6) 1 1⁄2 1⁄4L—Over-all length, (Note 2, Note 7 and Note 8) 18 8 4A—Length of reduced section, min 9 21⁄4 11⁄4B—Length of grip section, (Note 8) 3 2 11⁄4C—Width of grip section, approximate (Note 4 and Note 9) 2 3⁄4 3⁄8
NOTE 1—For the 11⁄2-in. wide specimen, punch marks for measuring elongation after fracture shall be made on the flat or on the edge of the specimenand within the reduced section. Either a set of nine or more punch marks 1 in. apart, or one or more pairs of punch marks 8 in. apart may be used.
NOTE 2—When elongation measurements of 11⁄2-in. wide specimens are not required, a minimum length of reduced section (A) of 21⁄4 in. may be usedwith all other dimensions similar to those of the plate-type specimen.
NOTE 3—For the three sizes of specimens, the ends of the reduced section shall not differ in width by more than 0.004, 0.002 or 0.001 in., respectively.Also, there may be a gradual decrease in width from the ends to the center, but the width at each end shall not be more than 0.015, 0.005, or 0.003 in.,respectively, larger than the width at the center.
NOTE 4—For each of the three sizes of specimens, narrower widths (W andC) may be used when necessary. In such cases the width of the reducedsection should be as large as the width of the material being tested permits; however, unless stated specifically, the requirements for elongation in aproductspecification shall not apply when these narrower specimens are used.
NOTE 5—The dimensionT is the thickness of the test specimen as provided for in the applicable material specifications. Minimum thickness of 11⁄2-in.wide specimens shall be3⁄16 in. Maximum thickness of1⁄2-in. and1⁄4-in. wide specimens shall be3⁄4 in. and1⁄4 in., respectively.
NOTE 6—For the 11⁄2-in. wide specimen, a1⁄2-in. minimum radius at the ends of the reduced section is permitted for steel specimens under 100 000psi in tensile strength when a profile cutter is used to machine the reduced section.
NOTE 7—The dimension shown is suggested as a minimum. In determining the minimum length, the grips must not extend in to the transition sectionbetween Dimensions A and B, see Note 9.
NOTE 8—To aid in obtaining axial force application during testing of1⁄4-in. wide specimens, the over-all length should be as large as the material willpermit, up to 8.00 in.
NOTE 9—It is desirable, if possible, to make the length of the grip section large enough to allow the specimen to extend into the grips a distance equalto two thirds or more of the length of the grips. If the thickness of1⁄2-in. wide specimens is over3⁄8 in., longer grips and correspondingly longer gripsections of the specimen may be necessary to prevent failure in the grip section.
NOTE 10—For the three sizes of specimens, the ends of the specimen shall be symmetrical in width with the center line of the reduced section within0.10, 0.05 and 0.005 in., respectively. However, for referee testing and when required by product specifications, the ends of the1⁄2-in. wide specimen shallbe symmetrical within 0.01 in.
NOTE 11—For each specimen type, the radii of all fillets shall be equal to each other within a tolerance of 0.05 in., and the centers of curvature of thetwo fillets at a particular end shall be located across from each other (on a line perpendicular to the centerline) within a tolerance of 0.10 in.
NOTE 12—Specimens with sides parallel throughout their length are permitted, except for referee testing, provided: (a) the above tolerances are used;(b) an adequate number of marks are provided for determination of elongation; and (c) when yield strength is determined, a suitable extensometer is used.If the fracture occurs at a distance of less than 2W from the edge of the gripping device, the tensile properties determined may not be representative ofthe material. In acceptance testing, if the properties meet the minimum requirements specified, no further testing is required, but if they are less than theminimum requirements, discard the test and retest.
FIG. 1 Rectangular Tension Test Specimens
E 8 – 04
3Perancangan dan pengembangan..., Yeny Pusvyta, FT UI, 2010.
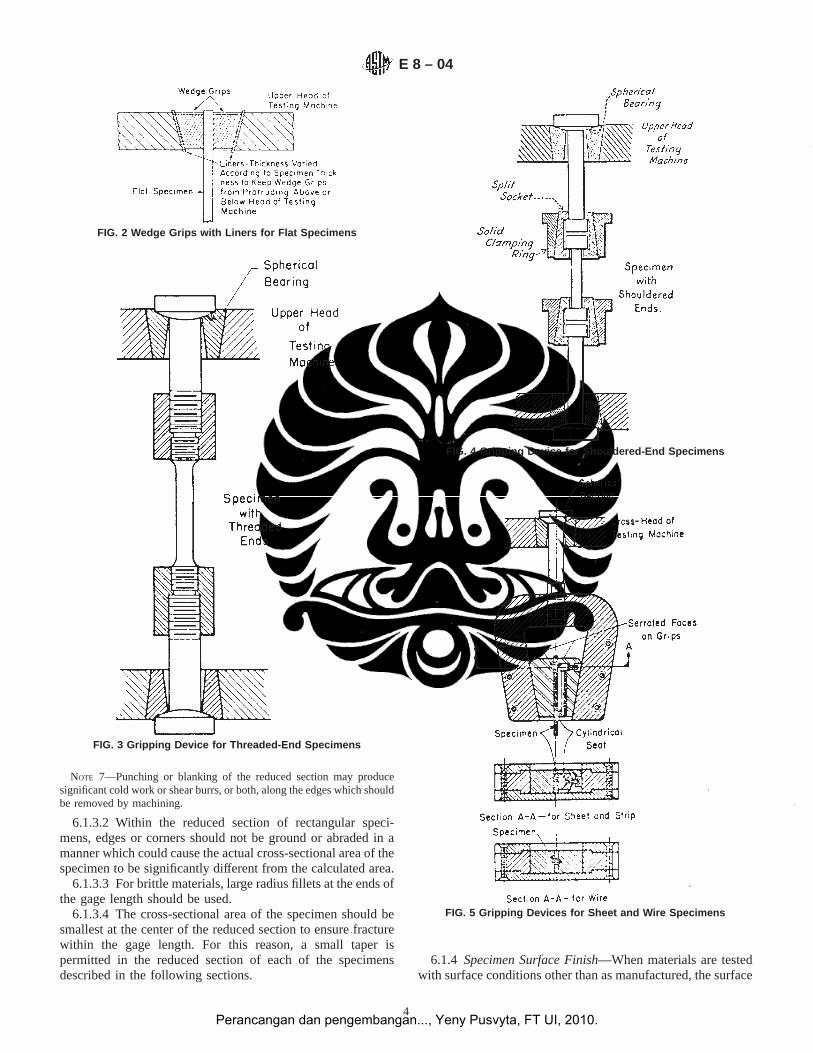
NOTE 7—Punching or blanking of the reduced section may producesignificant cold work or shear burrs, or both, along the edges which shouldbe removed by machining.
6.1.3.2 Within the reduced section of rectangular speci-mens, edges or corners should not be ground or abraded in amanner which could cause the actual cross-sectional area of thespecimen to be significantly different from the calculated area.
6.1.3.3 For brittle materials, large radius fillets at the ends ofthe gage length should be used.
6.1.3.4 The cross-sectional area of the specimen should besmallest at the center of the reduced section to ensure fracturewithin the gage length. For this reason, a small taper ispermitted in the reduced section of each of the specimensdescribed in the following sections.
6.1.4 Specimen Surface Finish—When materials are testedwith surface conditions other than as manufactured, the surface
FIG. 2 Wedge Grips with Liners for Flat Specimens
FIG. 3 Gripping Device for Threaded-End Specimens
FIG. 4 Gripping Device for Shouldered-End Specimens
FIG. 5 Gripping Devices for Sheet and Wire Specimens
E 8 – 04
4Perancangan dan pengembangan..., Yeny Pusvyta, FT UI, 2010.
finish of the test specimens should be as provided in theapplicable product specifications.
NOTE 8—Particular attention should be given to the uniformity andquality of surface finish of specimens for high strength and very lowductility materials since this has been shown to be a factor in thevariability of test results.
6.2 Plate-Type Specimens—The standard plate-type testspecimen is shown in Fig. 1. This specimen is used for testingmetallic materials in the form of plate, shapes, and flat materialhaving a nominal thickness of3⁄16 in. or over. When productspecifications so permit, other types of specimens may be used,as provided in 6.3, 6.4, and 6.5.
6.3 Sheet-Type Specimens:6.3.1 The standard sheet-type test specimen is shown in Fig.
1. This specimen is used for testing metallic materials in the
form of sheet, plate, flat wire, strip, band, hoop, rectangles, andshapes ranging in nominal thickness from 0.005 to3⁄4 in. Whenproduct specifications so permit, other types of specimens maybe used, as provided in 6.2, 6.4, and 6.5.
NOTE 9—Test Methods E 345 may be used for tension testing ofmaterials in thicknesses up to 0.0059 in.
6.3.2 Pin ends as shown in Fig. 7 may be used. In order toavoid buckling in tests of thin and high-strength materials, itmay be neccessary to use stiffening plates at the grip ends.
6.4 Round Specimens:6.4.1 The standard 0.500-in. diameter round test specimen
shown in Fig. 8 is used quite generally for testing metallicmaterials, both cast and wrought.
6.4.2 Fig. 8 also shows small-size specimens proportional tothe standard specimen. These may be used when it is necessaryto test material from which the standard specimen or specimensshown in Fig. 1 cannot be prepared. Other sizes of small roundspecimens may be used. In any such small-size specimen it isimportant that the gage length for measurement of elongationbe four times the diameter of the specimen.
6.4.3 The shape of the ends of the specimen outside of thegage length shall be suitable to the material and of a shape tofit the holders or grips of the testing machine so that the forcesmay be applied axially. Fig. 9 shows specimens with varioustypes of ends that have given satisfactory results.
6.5 Specimens for Sheet, Strip, Flat Wire, and Plate—Intesting sheet, strip, flat wire, and plate, use a specimen typeappropriate for the nominal thickness of the material, asdescribed in the following:
FIG. 6 Snubbing Device for Testing Wire
Dimensions in.
G—Gage lengthW—Width (Note 1)
2.000 6 0.0050.500 6 0.010
T—Thickness, max (Note 2)R—Radius of fillet, min (Note 3)
5⁄81⁄2
L—Over-all length, minA—Length of reduced section, min
821⁄4
B—Length of grip section, minC—Width of grip section, approximate
22
D—Diameter of hole for pin, min (Note 4) 1⁄2E—Edge distance from pin, approximate 11⁄2F—Distance from hole to fillet, min 1⁄2
NOTE 1—The ends of the reduced section shall differ in width by not more than 0.002 in. There may be a gradual taper in width from the ends to thecenter, but the width at each end shall be not more than 0.005 in. greater than the width at the center.
NOTE 2—The dimensionT is the thickness of the test specimen as stated in the applicable product specifications.NOTE 3—For some materials, a fillet radiusR larger than1⁄2 in. may be needed.NOTE 4—Holes must be on center line of reduced section, within60.002 in.NOTE 5—Variations of dimensionsC, D, E, F, andL may be used that will permit failure within the gage length.
FIG. 7 Pin-Loaded Tension Test Specimen with 2-in. Gage Length
E 8 – 04
5Perancangan dan pengembangan..., Yeny Pusvyta, FT UI, 2010.
6.5.1 For material with a nominal thickness of 0.0005-0.1875 in., use the sheet-type specimen described in 6.3.
6.5.2 For material with a nominal thickness of 0.1875-0.500 in., use either the sheet-type specimen of 6.3 or theplate-type specimen of 6.2.
6.5.3 For material with a nominal thickness of 0.500–0.750in., use either the sheet-type specimen of 6.3, the plate-typespecimen of 6.2, or the largest practical size of round specimendescribed in 6.4.
6.5.4 For material with a nominal thickness of 0.750 in., orgreater, use the plate-type specimen of paragraph 6.2 or thelargest practical size of round specimen described in 6.4.
6.5.4.1 If the product specifications permit, material of athickness of 0.750 in., or greater may be tested using amodified sheet-type specimen conforming to the configurationshown by Fig. 2. The thickness of this modified specimen mustbe machined to 0.400 +/- 0.020 in., and must be uniform within0.004 in. throughout the reduced section. In the event ofdisagreement, a round specimen shall be used as the refereespecimen.
6.6 Specimens for Wire, Rod, and Bar:6.6.1 For round wire, rod, and bar, test specimens having the
full cross-sectional area of the wire, rod, or bar shall be usedwherever practicable. The gage length for the measurement ofelongation of wire less than1⁄8 in. in diameter shall be as
prescribed in product specifications. In testing wire, rod, or barthat has a1⁄8-in. or larger diameter, unless otherwise specified,a gage length equal to four times the diameter shall be used.The total length of the specimens shall be at least equal to thegage length plus the length of material required for the full useof the grips employed.
6.6.2 For wire of octagonal, hexagonal, or square crosssection, for rod or bar of round cross section where thespecimen required in 6.6.1 is not practicable, and for rod or barof octagonal, hexagonal, or square cross section, one of thefollowing types of specimens shall be used:
6.6.2.1 Full Cross Section(Note 10)—It is permissible toreduce the test section slightly with abrasive cloth or paper, ormachine it sufficiently to ensure fracture within the gagemarks. For material not exceeding 0.188 in. in diameter ordistance between flats, the cross-sectional area may be reducedto not less than 90 % of the original area without changing theshape of the cross section. For material over 0.188 in. indiameter or distance between flats, the diameter or distancebetween flats may be reduced by not more than 0.010 in.without changing the shape of the cross section. Square,hexagonal, or octagonal wire or rod not exceeding 0.188 in.between flats may be turned to a round having a cross-sectionalarea not smaller than 90 % of the area of the maximuminscribed circle. Fillets, preferably with a radius of3⁄8 in., but
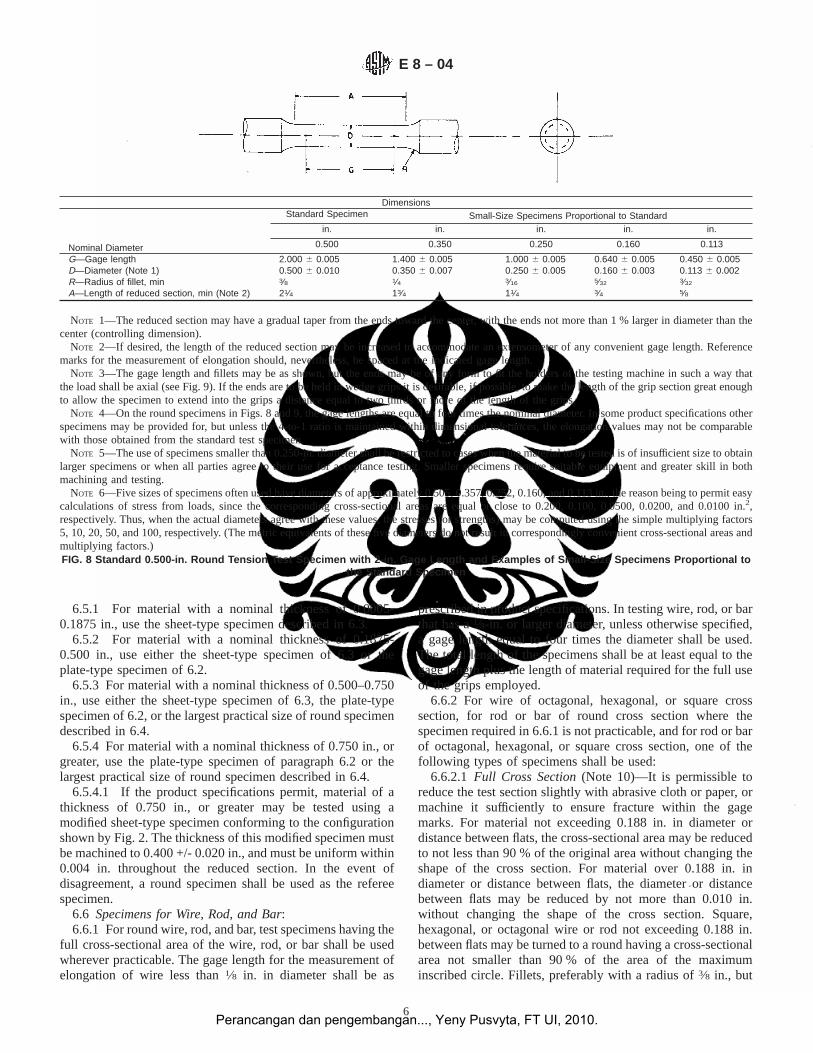
Dimensions
Nominal Diameter
Standard Specimen Small-Size Specimens Proportional to Standardin. in. in. in. in.
0.500 0.350 0.250 0.160 0.113
G—Gage length 2.000 6 0.005 1.400 6 0.005 1.000 6 0.005 0.640 6 0.005 0.450 6 0.005D—Diameter (Note 1) 0.500 6 0.010 0.350 6 0.007 0.250 6 0.005 0.160 6 0.003 0.113 6 0.002R—Radius of fillet, minA—Length of reduced section, min (Note 2)
3⁄821⁄4
1⁄413⁄4
3⁄16
11⁄4
5⁄32
3⁄4
3⁄32
5⁄8
NOTE 1—The reduced section may have a gradual taper from the ends toward the center, with the ends not more than 1 % larger in diameter than thecenter (controlling dimension).
NOTE 2—If desired, the length of the reduced section may be increased to accommodate an extensometer of any convenient gage length. Referencemarks for the measurement of elongation should, nevertheless, be spaced at the indicated gage length.
NOTE 3—The gage length and fillets may be as shown, but the ends may be of any form to fit the holders of the testing machine in such a way thatthe load shall be axial (see Fig. 9). If the ends are to be held in wedge grips it is desirable, if possible, to make the length of the grip section great enoughto allow the specimen to extend into the grips a distance equal to two thirds or more of the length of the grips.
NOTE 4—On the round specimens in Figs. 8 and 9, the gage lengths are equal to four times the nominal diameter. In some product specifications otherspecimens may be provided for, but unless the 4-to-1 ratio is maintained within dimensional tolerances, the elongation values may not be comparablewith those obtained from the standard test specimen.
NOTE 5—The use of specimens smaller than 0.250-in. diameter shall be restricted to cases when the material to be tested is of insufficient size to obtainlarger specimens or when all parties agree to their use for acceptance testing. Smaller specimens require suitable equipment and greater skill in bothmachining and testing.
NOTE 6—Five sizes of specimens often used have diameters of approximately 0.505, 0.357, 0.252, 0.160, and 0.113 in., the reason being to permit easycalculations of stress from loads, since the corresponding cross-sectional areas are equal or close to 0.200, 0.100, 0.0500, 0.0200, and 0.0100 in.2,respectively. Thus, when the actual diameters agree with these values, the stresses (or strengths) may be computed using the simple multiplying factors5, 10, 20, 50, and 100, respectively. (The metric equivalents of these five diameters do not result in correspondingly convenient cross-sectional areas andmultiplying factors.)FIG. 8 Standard 0.500-in. Round Tension Test Specimen with 2-in. Gage Length and Examples of Small-Size Specimens Proportional to
the Standard Specimen
E 8 – 04
6Perancangan dan pengembangan..., Yeny Pusvyta, FT UI, 2010.
not less than1⁄8 in., shall be used at the ends of the reducedsections. Square, hexagonal, or octagonal rod over 0.188 in.between flats may be turned to a round having a diameter nosmaller than 0.010 in. less than the original distance betweenflats.
NOTE 10—The ends of copper or copper alloy specimens may beflattened 10 to 50 % from the original dimension in a jig similar to thatshown in Fig. 10, to facilitate fracture within the gage marks. In flatteningthe opposite ends of the test specimen, care shall be taken to ensure thatthe four flattened surfaces are parallel and that the two parallel surfaces onthe same side of the axis of the test specimen lie in the same plane.
6.6.2.2 For rod and bar, the largest practical size of roundspecimen as described in 6.4 may be used in place of a testspecimen of full cross section. Unless otherwise specified inthe product specification, specimens shall be parallel to thedirection of rolling or extrusion.
6.7 Specimens for Rectangular Bar— In testing rectangularbar one of the following types of specimens shall be used:
6.7.1 Full Cross Section—It is permissible to reduce thewidth of the specimen throughout the test section with abrasivecloth or paper, or by machining sufficiently to facilitate fracturewithin the gage marks, but in no case shall the reduced widthbe less than 90 % of the original. The edges of the midlengthof the reduced section not less than3⁄4 in. in length shall beparallel to each other and to the longitudinal axis of thespecimen within 0.002 in. Fillets, preferably with a radius of3⁄8in. but not less than1⁄8 in. shall be used at the ends of thereduced sections.
6.7.2 Rectangular bar of thickness small enough to fit thegrips of the testing machine but of too great width may bereduced in width by cutting to fit the grips, after which the cutsurfaces shall be machined or cut and smoothed to ensurefailure within the desired section. The reduced width shall benot less than the original bar thickness. Also, one of the typesof specimens described in 6.2, 6.3, and 6.4 may be used.
6.8 Shapes, Structural and Other—In testing shapes otherthan those covered by the preceding sections, one of the typesof specimens described in 6.2, 6.3, and 6.4 shall be used.
6.9 Specimens for Pipe and Tube(Note 11):
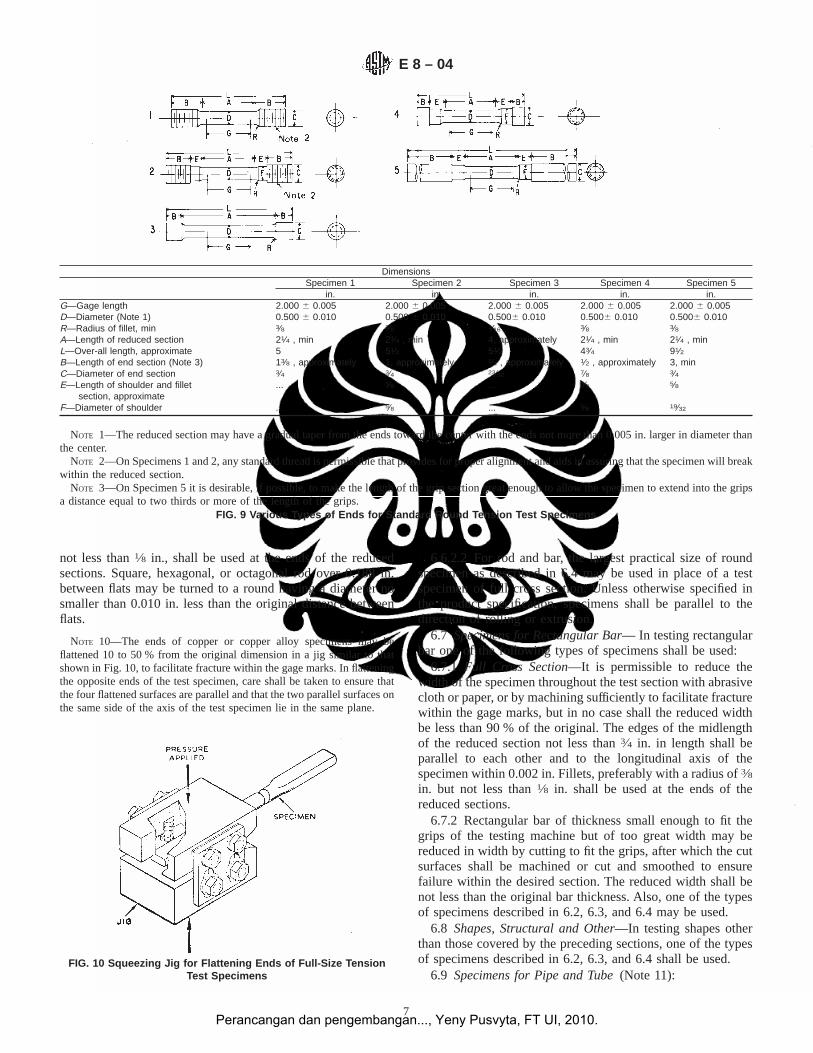
DimensionsSpecimen 1 Specimen 2 Specimen 3 Specimen 4 Specimen 5
in. in. in. in. in.G—Gage lengthD—Diameter (Note 1)
2.000 6 0.0050.500 6 0.010
2.000 6 0.0050.500 6 0.010
2.000 6 0.0050.5006 0.010
2.000 6 0.0050.5006 0.010
2.000 6 0.0050.5006 0.010
R—Radius of fillet, minA—Length of reduced section
3⁄821⁄4 , min
3⁄821⁄4 , min
1⁄16
4, approximately
3⁄821⁄4 , min
3⁄821⁄4 , min
L—Over-all length, approximateB—Length of end section (Note 3)
513⁄8 , approximately
51⁄21, approximately
51⁄23⁄4 , approximately
43⁄41⁄2 , approximately
91⁄23, min
C—Diameter of end sectionE—Length of shoulder and fillet
section, approximate
3⁄4...
3⁄45⁄8
23⁄32
...
7⁄83⁄4
3⁄45⁄8
F—Diameter of shoulder ... 5⁄8 ... 5⁄8 19⁄32
NOTE 1—The reduced section may have a gradual taper from the ends toward the center with the ends not more than 0.005 in. larger in diameter thanthe center.
NOTE 2—On Specimens 1 and 2, any standard thread is permissible that provides for proper alignment and aids in assuring that the specimen will breakwithin the reduced section.
NOTE 3—On Specimen 5 it is desirable, if possible, to make the length of the grip section great enough to allow the specimen to extend into the gripsa distance equal to two thirds or more of the length of the grips.
FIG. 9 Various Types of Ends for Standard Round Tension Test Specimens
FIG. 10 Squeezing Jig for Flattening Ends of Full-Size TensionTest Specimens
E 8 – 04
7Perancangan dan pengembangan..., Yeny Pusvyta, FT UI, 2010.
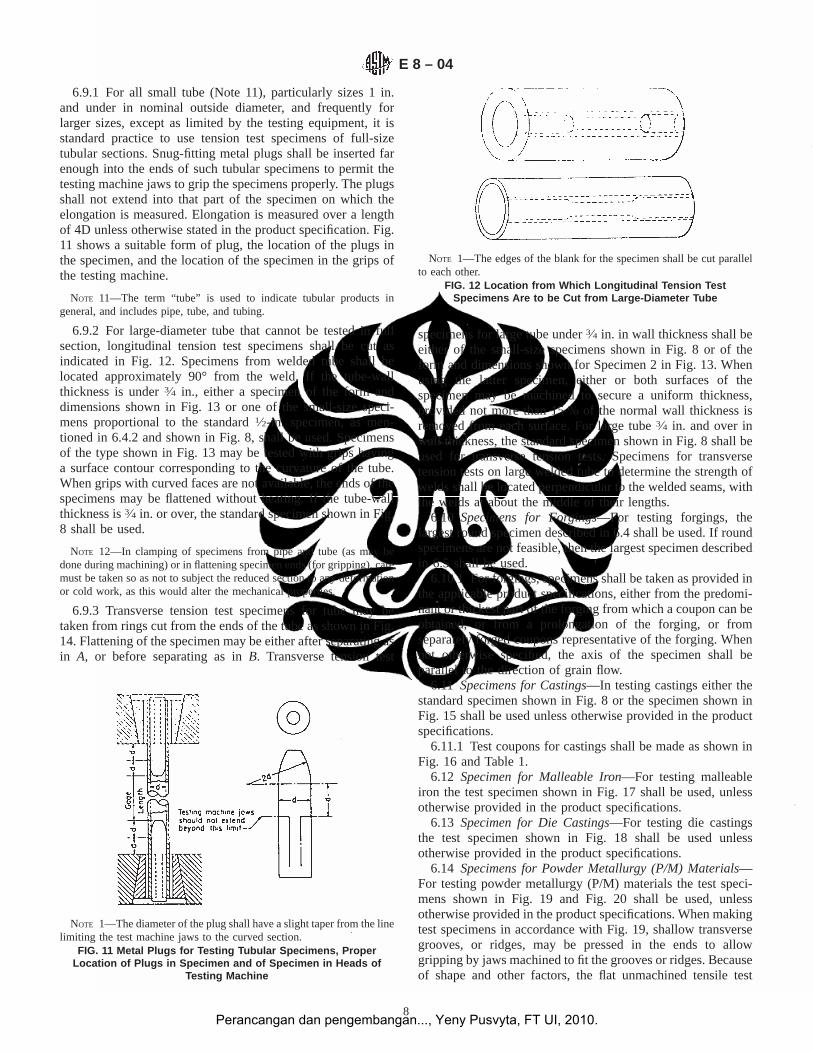
6.9.1 For all small tube (Note 11), particularly sizes 1 in.and under in nominal outside diameter, and frequently forlarger sizes, except as limited by the testing equipment, it isstandard practice to use tension test specimens of full-sizetubular sections. Snug-fitting metal plugs shall be inserted farenough into the ends of such tubular specimens to permit thetesting machine jaws to grip the specimens properly. The plugsshall not extend into that part of the specimen on which theelongation is measured. Elongation is measured over a lengthof 4D unless otherwise stated in the product specification. Fig.11 shows a suitable form of plug, the location of the plugs inthe specimen, and the location of the specimen in the grips ofthe testing machine.
NOTE 11—The term “tube” is used to indicate tubular products ingeneral, and includes pipe, tube, and tubing.
6.9.2 For large-diameter tube that cannot be tested in fullsection, longitudinal tension test specimens shall be cut asindicated in Fig. 12. Specimens from welded tube shall belocated approximately 90° from the weld. If the tube-wallthickness is under3⁄4 in., either a specimen of the form anddimensions shown in Fig. 13 or one of the small-size speci-mens proportional to the standard1⁄2-in. specimen, as men-tioned in 6.4.2 and shown in Fig. 8, shall be used. Specimensof the type shown in Fig. 13 may be tested with grips havinga surface contour corresponding to the curvature of the tube.When grips with curved faces are not available, the ends of thespecimens may be flattened without heating. If the tube-wallthickness is3⁄4 in. or over, the standard specimen shown in Fig.8 shall be used.
NOTE 12—In clamping of specimens from pipe and tube (as may bedone during machining) or in flattening specimen ends (for gripping), caremust be taken so as not to subject the reduced section to any deformationor cold work, as this would alter the mechanical properties.
6.9.3 Transverse tension test specimens for tube may betaken from rings cut from the ends of the tube as shown in Fig.14. Flattening of the specimen may be either after separating asin A, or before separating as inB. Transverse tension test
specimens for large tube under3⁄4 in. in wall thickness shall beeither of the small-size specimens shown in Fig. 8 or of theform and dimensions shown for Specimen 2 in Fig. 13. Whenusing the latter specimen, either or both surfaces of thespecimen may be machined to secure a uniform thickness,provided not more than 15 % of the normal wall thickness isremoved from each surface. For large tube3⁄4 in. and over inwall thickness, the standard specimen shown in Fig. 8 shall beused for transverse tension tests. Specimens for transversetension tests on large welded tube to determine the strength ofwelds shall be located perpendicular to the welded seams, withthe welds at about the middle of their lengths.
6.10 Specimens for Forgings—For testing forgings, thelargest round specimen described in 6.4 shall be used. If roundspecimens are not feasible, then the largest specimen describedin 6.5 shall be used.
6.10.1 For forgings, specimens shall be taken as provided inthe applicable product specifications, either from the predomi-nant or thickest part of the forging from which a coupon can beobtained, or from a prolongation of the forging, or fromseparately forged coupons representative of the forging. Whennot otherwise specified, the axis of the specimen shall beparallel to the direction of grain flow.
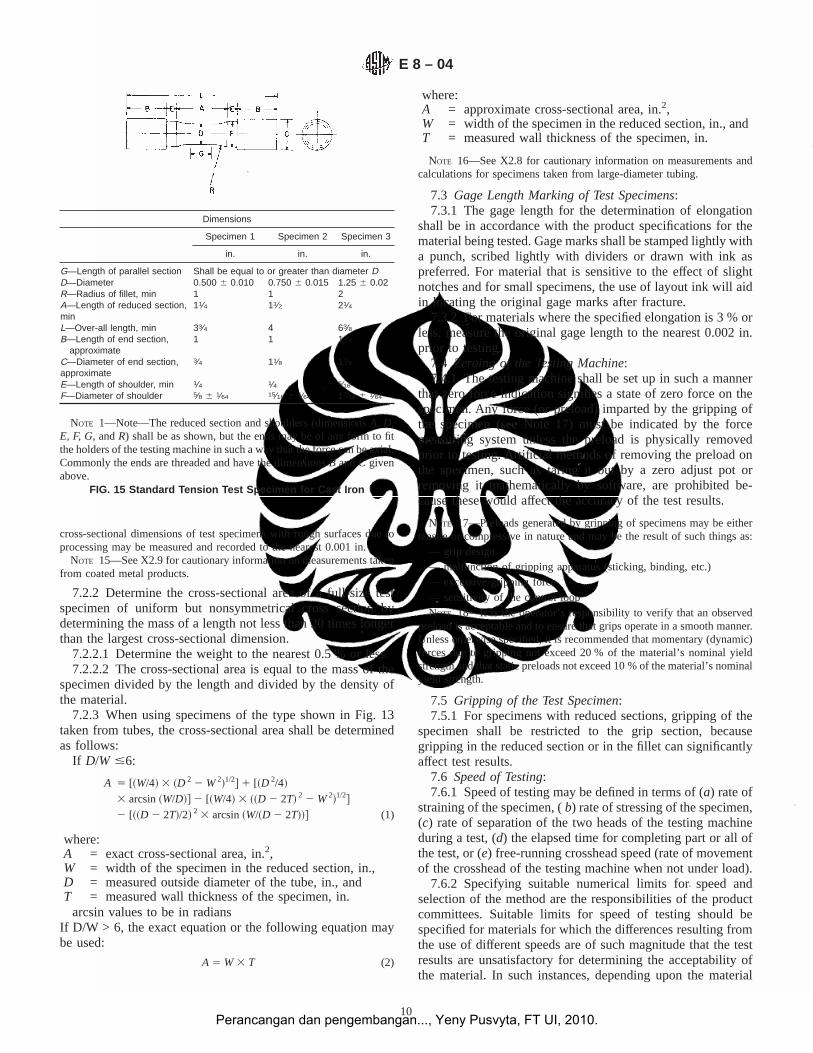
6.11 Specimens for Castings—In testing castings either thestandard specimen shown in Fig. 8 or the specimen shown inFig. 15 shall be used unless otherwise provided in the productspecifications.
6.11.1 Test coupons for castings shall be made as shown inFig. 16 and Table 1.
6.12 Specimen for Malleable Iron—For testing malleableiron the test specimen shown in Fig. 17 shall be used, unlessotherwise provided in the product specifications.
6.13 Specimen for Die Castings—For testing die castingsthe test specimen shown in Fig. 18 shall be used unlessotherwise provided in the product specifications.
6.14 Specimens for Powder Metallurgy (P/M) Materials—For testing powder metallurgy (P/M) materials the test speci-mens shown in Fig. 19 and Fig. 20 shall be used, unlessotherwise provided in the product specifications. When makingtest specimens in accordance with Fig. 19, shallow transversegrooves, or ridges, may be pressed in the ends to allowgripping by jaws machined to fit the grooves or ridges. Becauseof shape and other factors, the flat unmachined tensile test
NOTE 1—The diameter of the plug shall have a slight taper from the linelimiting the test machine jaws to the curved section.
FIG. 11 Metal Plugs for Testing Tubular Specimens, ProperLocation of Plugs in Specimen and of Specimen in Heads of
Testing Machine
NOTE 1—The edges of the blank for the specimen shall be cut parallelto each other.
FIG. 12 Location from Which Longitudinal Tension TestSpecimens Are to be Cut from Large-Diameter Tube
E 8 – 04
8Perancangan dan pengembangan..., Yeny Pusvyta, FT UI, 2010.
specimen (Fig. 19) in the heat treated condition will have anultimate tensile strength of 50 % to 85 % of that determined ina machined round tensile test specimen (Fig. 20) of likecomposition and processing.
7. Procedures
7.1 Preparation of the Test Machine— Upon startup, orfollowing a prolonged period of machine inactivity, the testmachine should be exercised or warmed up to normal operatingtemperatures to minimize errors that may result from transientconditions.
7.2 Measurement of Dimensions of Test Specimens:7.2.1 To determine the cross-sectional area of a test speci-
men, measure the dimensions of the cross section at the centerof the reduced section. For referee testing of specimens under3⁄16 in. in their least dimension, measure the dimensions wherethe least cross-sectional area is found. Measure and record thecross-sectional dimensions of tension test specimens 0.200 in.and over to the nearest 0.001 in.; the cross-sectional dimen-sions from 0.100 in. but less than 0.200 in., to the nearest0.0005 in.; the cross-sectional dimensions from 0.020 in. butless than 0.100 in., to the nearest 0.0001 in.; and whenpractical, the cross-sectional dimensions less than 0.020 in., toat least the nearest 1 % but in all cases to at least the nearest0.0001 in.
NOTE 13—Accurate and precise measurement of specimen dimensionscan be one of the most critical aspects of tension testing, depending onspecimen geometry. See Appendix X2 for additional information.
NOTE 14—Rough surfaces due to the manufacturing process such as hotrolling, metallic coating, etc., may lead to inaccuracy of the computedareas greater than the measured dimensions would indicate. Therefore,
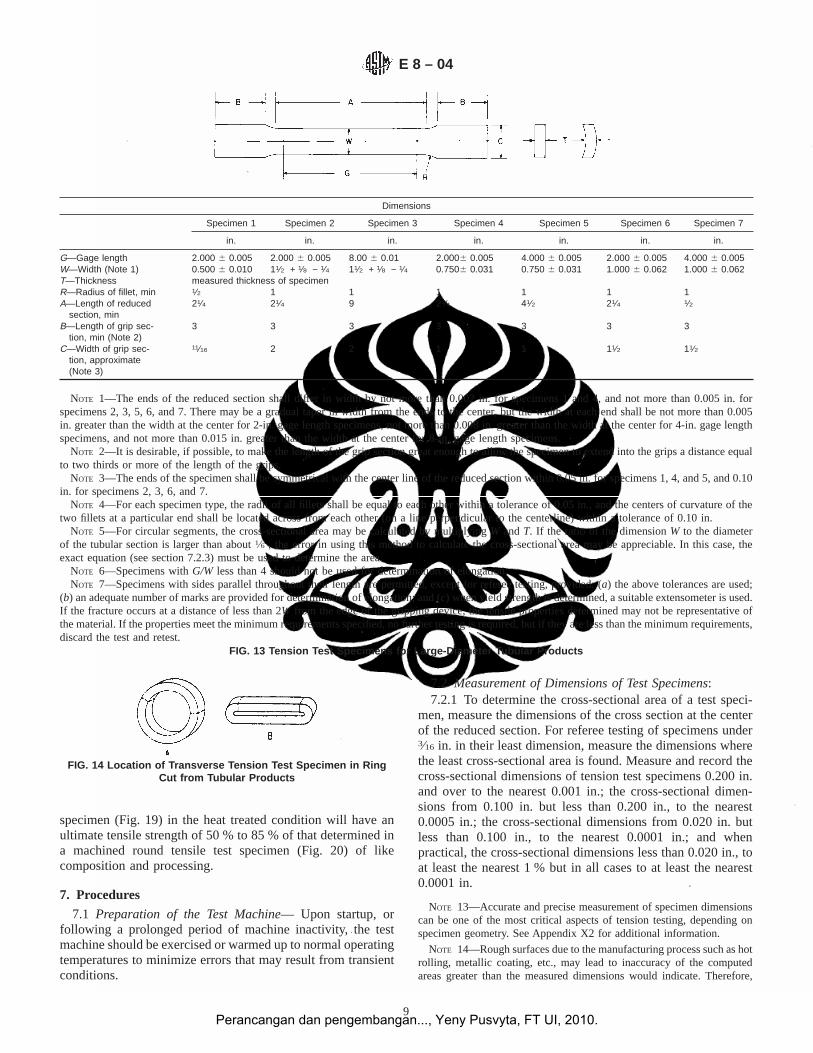
Dimensions
Specimen 1 Specimen 2 Specimen 3 Specimen 4 Specimen 5 Specimen 6 Specimen 7
in. in. in. in. in. in. in.
G—Gage length 2.000 6 0.005 2.000 6 0.005 8.00 6 0.01 2.0006 0.005 4.000 6 0.005 2.000 6 0.005 4.000 6 0.005W—Width (Note 1) 0.500 6 0.010 11⁄2 + 1⁄8 − 1⁄4 11⁄2 + 1⁄8 − 1⁄4 0.7506 0.031 0.750 6 0.031 1.000 6 0.062 1.000 6 0.062T—Thickness measured thickness of specimenR—Radius of fillet, min 1⁄2 1 1 1 1 1 1A—Length of reduced
section, min21⁄4 21⁄4 9 21⁄4 41⁄2 21⁄4 1⁄2
B—Length of grip sec-tion, min (Note 2)
3 3 3 3 3 3 3
C—Width of grip sec-tion, approximate(Note 3)
11⁄16 2 2 1 1 11⁄2 11⁄2
NOTE 1—The ends of the reduced section shall differ in width by not more than 0.002 in. for specimens 1 and 4, and not more than 0.005 in. forspecimens 2, 3, 5, 6, and 7. There may be a gradual taper in width from the ends to the center, but the width at each end shall be not more than 0.005in. greater than the width at the center for 2-in. gage length specimens, not more than 0.008 in. greater than the width at the center for 4-in. gage lengthspecimens, and not more than 0.015 in. greater than the width at the center for 8-in. gage length specimens.
NOTE 2—It is desirable, if possible, to make the length of the grip section great enough to allow the specimen to extend into the grips a distance equalto two thirds or more of the length of the grips.
NOTE 3—The ends of the specimen shall be symmetrical with the center line of the reduced section within 0.05 in. for specimens 1, 4, and 5, and 0.10in. for specimens 2, 3, 6, and 7.
NOTE 4—For each specimen type, the radii of all fillets shall be equal to each other within a tolerance of 0.05 in., and the centers of curvature of thetwo fillets at a particular end shall be located across from each other (on a line perpendicular to the centerline) within a tolerance of 0.10 in.
NOTE 5—For circular segments, the cross-sectional area may be calculated by multiplyingW andT. If the ratio of the dimensionW to the diameterof the tubular section is larger than about1⁄6 , the error in using this method to calculate the cross-sectional area may be appreciable. In this case, theexact equation (see section 7.2.3) must be used to determine the area.
NOTE 6—Specimens withG/W less than 4 should not be used for determination of elongation.NOTE 7—Specimens with sides parallel throughout their length are permitted, except for referee testing, provided: (a) the above tolerances are used;
(b) an adequate number of marks are provided for determination of elongation; and (c) when yield strength is determined, a suitable extensometer is used.If the fracture occurs at a distance of less than 2W from the edge of the gripping device, the tensile properties determined may not be representative ofthe material. If the properties meet the minimum requirements specified, no further testing is required, but if they are less than the minimum requirements,discard the test and retest.
FIG. 13 Tension Test Specimens for Large-Diameter Tubular Products
FIG. 14 Location of Transverse Tension Test Specimen in RingCut from Tubular Products
E 8 – 04
9Perancangan dan pengembangan..., Yeny Pusvyta, FT UI, 2010.
cross-sectional dimensions of test specimens with rough surfaces due toprocessing may be measured and recorded to the nearest 0.001 in.
NOTE 15—See X2.9 for cautionary information on measurements takenfrom coated metal products.
7.2.2 Determine the cross-sectional area of a full-size testspecimen of uniform but nonsymmetrical cross section bydetermining the mass of a length not less than 20 times longerthan the largest cross-sectional dimension.
7.2.2.1 Determine the weight to the nearest 0.5 % or less.7.2.2.2 The cross-sectional area is equal to the mass of the
specimen divided by the length and divided by the density ofthe material.
7.2.3 When using specimens of the type shown in Fig. 13taken from tubes, the cross-sectional area shall be determinedas follows:
If D/W #6:
A 5 [~W/4! 3 ~D 2 2 W2!1/2# 1 [~D 2/4!
3 arcsin~W/D!# 2 [~W/4! 3 ~~D 2 2T! 2 2 W2!1/2#
2 [~~D 2 2T!/2! 2 3 arcsin~W/~D 2 2T!!# (1)
where:A = exact cross-sectional area, in.2,W = width of the specimen in the reduced section, in.,D = measured outside diameter of the tube, in., andT = measured wall thickness of the specimen, in.
arcsin values to be in radiansIf D/W > 6, the exact equation or the following equation maybe used:
A 5 W3 T (2)
where:A = approximate cross-sectional area, in.2,W = width of the specimen in the reduced section, in., andT = measured wall thickness of the specimen, in.
NOTE 16—See X2.8 for cautionary information on measurements andcalculations for specimens taken from large-diameter tubing.
7.3 Gage Length Marking of Test Specimens:7.3.1 The gage length for the determination of elongation
shall be in accordance with the product specifications for thematerial being tested. Gage marks shall be stamped lightly witha punch, scribed lightly with dividers or drawn with ink aspreferred. For material that is sensitive to the effect of slightnotches and for small specimens, the use of layout ink will aidin locating the original gage marks after fracture.
7.3.2 For materials where the specified elongation is 3 % orless, measure the original gage length to the nearest 0.002 in.prior to testing.
7.4 Zeroing of the Testing Machine:7.4.1 The testing machine shall be set up in such a manner
that zero force indication signifies a state of zero force on thespecimen. Any force (or preload) imparted by the gripping ofthe specimen (see Note 17) must be indicated by the forcemeasuring system unless the preload is physically removedprior to testing. Artificial methods of removing the preload onthe specimen, such as taring it out by a zero adjust pot orremoving it mathematically by software, are prohibited be-cause these would affect the accuracy of the test results.
NOTE 17—Preloads generated by gripping of specimens may be eithertensile or compressive in nature and may be the result of such things as:
— grip design— malfunction of gripping apparatus (sticking, binding, etc.)— excessive gripping force— sensitivity of the control loopNOTE 18—It is the operator’s responsibility to verify that an observed
preload is acceptable and to ensure that grips operate in a smooth manner.Unless otherwise specified, it is recommended that momentary (dynamic)forces due to gripping not exceed 20 % of the material’s nominal yieldstrength and that static preloads not exceed 10 % of the material’s nominalyield strength.
7.5 Gripping of the Test Specimen:7.5.1 For specimens with reduced sections, gripping of the
specimen shall be restricted to the grip section, becausegripping in the reduced section or in the fillet can significantlyaffect test results.
7.6 Speed of Testing:7.6.1 Speed of testing may be defined in terms of (a) rate of
straining of the specimen, (b) rate of stressing of the specimen,(c) rate of separation of the two heads of the testing machineduring a test, (d) the elapsed time for completing part or all ofthe test, or (e) free-running crosshead speed (rate of movementof the crosshead of the testing machine when not under load).
7.6.2 Specifying suitable numerical limits for speed andselection of the method are the responsibilities of the productcommittees. Suitable limits for speed of testing should bespecified for materials for which the differences resulting fromthe use of different speeds are of such magnitude that the testresults are unsatisfactory for determining the acceptability ofthe material. In such instances, depending upon the material
Dimensions
Specimen 1 Specimen 2 Specimen 3
in. in. in.
G—Length of parallel section Shall be equal to or greater than diameter DD—Diameter 0.500 6 0.010 0.750 6 0.015 1.25 6 0.02R—Radius of fillet, minA—Length of reduced section,min
111⁄4
111⁄2
221⁄4
L—Over-all length, minB—Length of end section,
approximate
33⁄41
41
63⁄813⁄4
C—Diameter of end section,approximate
3⁄4 11⁄8 17⁄8
E—Length of shoulder, minF—Diameter of shoulder
1⁄45⁄8 6 1⁄64
1⁄415⁄16 6 1⁄64
5⁄16
17⁄16 6 1⁄64
NOTE 1—Note—The reduced section and shoulders (dimensionsA, D,E, F, G, andR) shall be as shown, but the ends may be of any form to fitthe holders of the testing machine in such a way that the force can be axial.Commonly the ends are threaded and have the dimensionsB andC givenabove.
FIG. 15 Standard Tension Test Specimen for Cast Iron
E 8 – 04
10Perancangan dan pengembangan..., Yeny Pusvyta, FT UI, 2010.
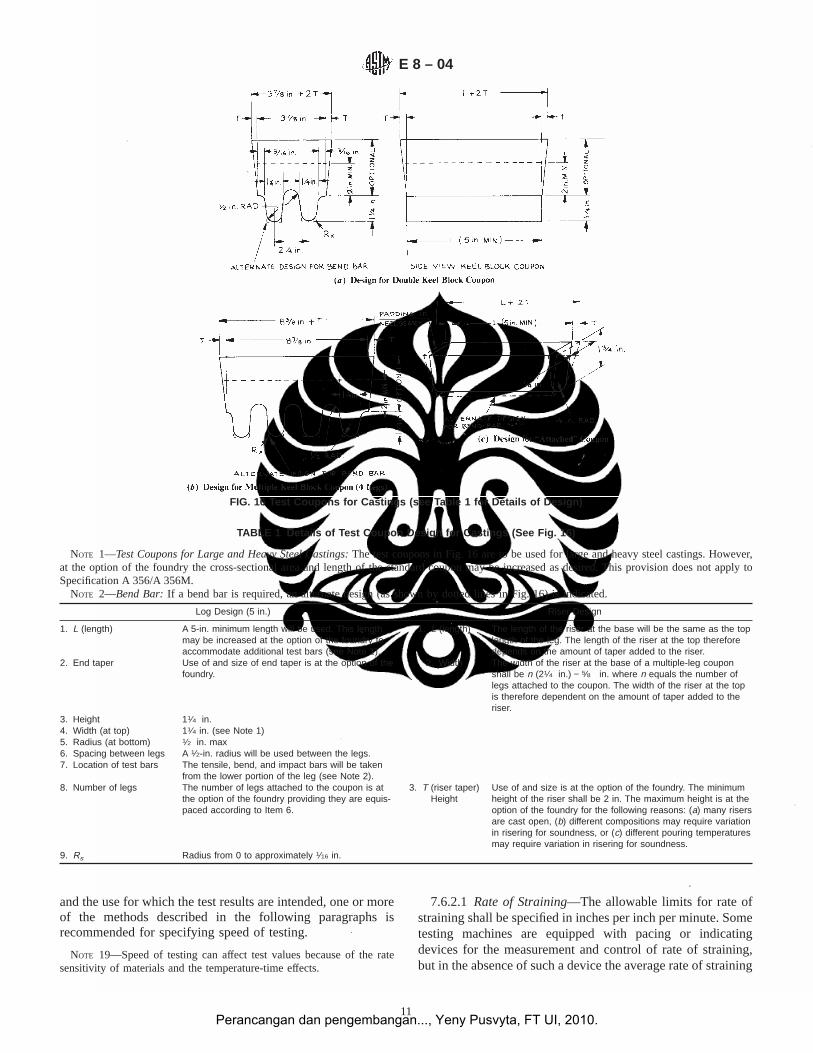
and the use for which the test results are intended, one or moreof the methods described in the following paragraphs isrecommended for specifying speed of testing.
NOTE 19—Speed of testing can affect test values because of the ratesensitivity of materials and the temperature-time effects.
7.6.2.1 Rate of Straining—The allowable limits for rate ofstraining shall be specified in inches per inch per minute. Sometesting machines are equipped with pacing or indicatingdevices for the measurement and control of rate of straining,but in the absence of such a device the average rate of straining
FIG. 16 Test Coupons for Castings (see Table 1 for Details of Design)
TABLE 1 Details of Test Coupon Design for Castings (See Fig. 16)
NOTE 1—Test Coupons for Large and Heavy Steel Castings:The test coupons in Fig. 16 are to be used for large and heavy steel castings. However,at the option of the foundry the cross-sectional area and length of the standard coupon may be increased as desired. This provision does not apply toSpecification A 356/A 356M.
NOTE 2—Bend Bar:If a bend bar is required, an alternate design (as shown by dotted lines in Fig. 16) is indicated.
Log Design (5 in.) Riser Design
1. L (length) A 5-in. minimum length will be used. This lengthmay be increased at the option of the foundry toaccommodate additional test bars (see Note 1).
1. L (length) The length of the riser at the base will be the same as the toplength of the leg. The length of the riser at the top thereforedepends on the amount of taper added to the riser.
2. End taper Use of and size of end taper is at the option of thefoundry.
2. Width The width of the riser at the base of a multiple-leg couponshall be n (21⁄4 in.) − 5⁄8 in. where n equals the number oflegs attached to the coupon. The width of the riser at the topis therefore dependent on the amount of taper added to theriser.
3. Height 11⁄4 in.4. Width (at top) 11⁄4 in. (see Note 1)5. Radius (at bottom) 1⁄2 in. max6. Spacing between legs A 1⁄2-in. radius will be used between the legs.7. Location of test bars The tensile, bend, and impact bars will be taken
from the lower portion of the leg (see Note 2).8. Number of legs The number of legs attached to the coupon is at
the option of the foundry providing they are equis-paced according to Item 6.
3. T (riser taper)Height
Use of and size is at the option of the foundry. The minimumheight of the riser shall be 2 in. The maximum height is at theoption of the foundry for the following reasons: (a) many risersare cast open, (b) different compositions may require variationin risering for soundness, or (c) different pouring temperaturesmay require variation in risering for soundness.
9. Rs Radius from 0 to approximately 1⁄16 in.
E 8 – 04
11Perancangan dan pengembangan..., Yeny Pusvyta, FT UI, 2010.
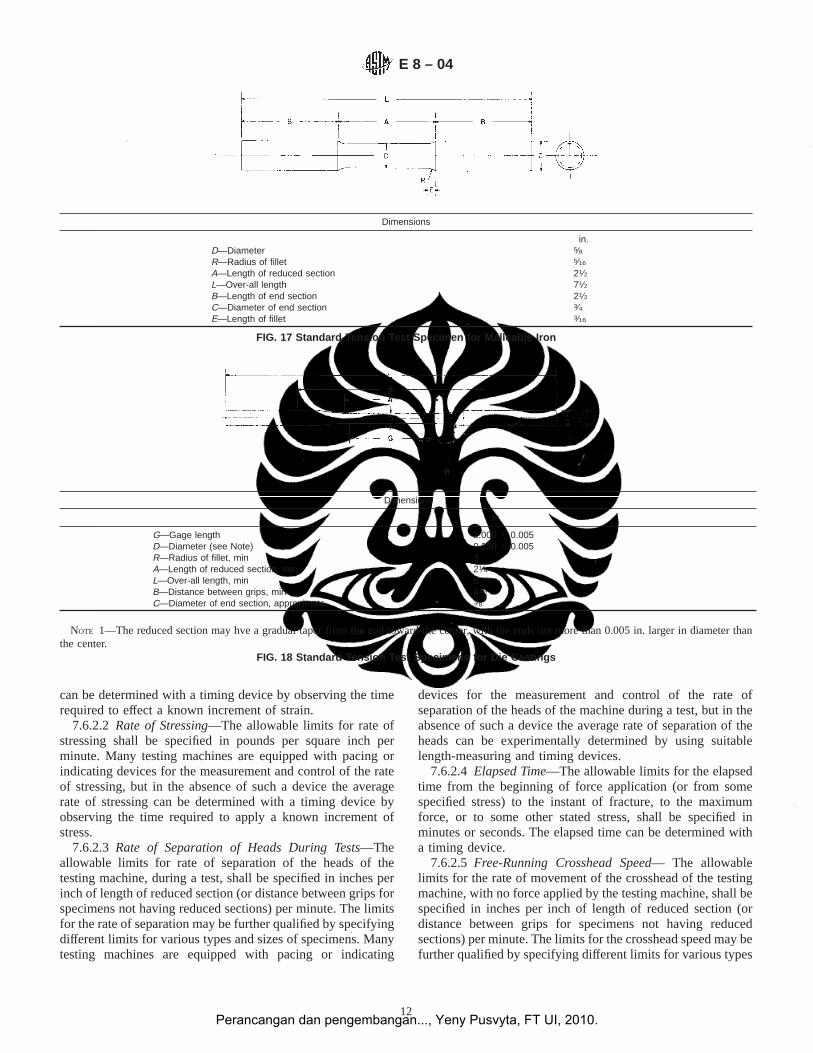
can be determined with a timing device by observing the timerequired to effect a known increment of strain.
7.6.2.2 Rate of Stressing—The allowable limits for rate ofstressing shall be specified in pounds per square inch perminute. Many testing machines are equipped with pacing orindicating devices for the measurement and control of the rateof stressing, but in the absence of such a device the averagerate of stressing can be determined with a timing device byobserving the time required to apply a known increment ofstress.
7.6.2.3 Rate of Separation of Heads During Tests—Theallowable limits for rate of separation of the heads of thetesting machine, during a test, shall be specified in inches perinch of length of reduced section (or distance between grips forspecimens not having reduced sections) per minute. The limitsfor the rate of separation may be further qualified by specifyingdifferent limits for various types and sizes of specimens. Manytesting machines are equipped with pacing or indicating
devices for the measurement and control of the rate ofseparation of the heads of the machine during a test, but in theabsence of such a device the average rate of separation of theheads can be experimentally determined by using suitablelength-measuring and timing devices.
7.6.2.4 Elapsed Time—The allowable limits for the elapsedtime from the beginning of force application (or from somespecified stress) to the instant of fracture, to the maximumforce, or to some other stated stress, shall be specified inminutes or seconds. The elapsed time can be determined witha timing device.
7.6.2.5 Free-Running Crosshead Speed— The allowablelimits for the rate of movement of the crosshead of the testingmachine, with no force applied by the testing machine, shall bespecified in inches per inch of length of reduced section (ordistance between grips for specimens not having reducedsections) per minute. The limits for the crosshead speed may befurther qualified by specifying different limits for various types
Dimensions
in.D—Diameter 5⁄8R—Radius of fillet 5⁄16
A—Length of reduced section 21⁄2L—Over-all length 71⁄2B—Length of end section 21⁄2C—Diameter of end section 3⁄4E—Length of fillet 3⁄16
FIG. 17 Standard Tension Test Specimen for Malleable Iron
Dimensions
in
G—Gage length 2.000 6 0.005D—Diameter (see Note) 0.250 6 0.005R—Radius of fillet, min 3A—Length of reduced section, min 21⁄4L—Over-all length, min 9B—Distance between grips, min 41⁄2C—Diameter of end section, approximate 3⁄8
NOTE 1—The reduced section may hve a gradual taper from the end toward the center, with the ends not more than 0.005 in. larger in diameter thanthe center.
FIG. 18 Standard Tension Test Specimens for Die Castings
E 8 – 04
12Perancangan dan pengembangan..., Yeny Pusvyta, FT UI, 2010.
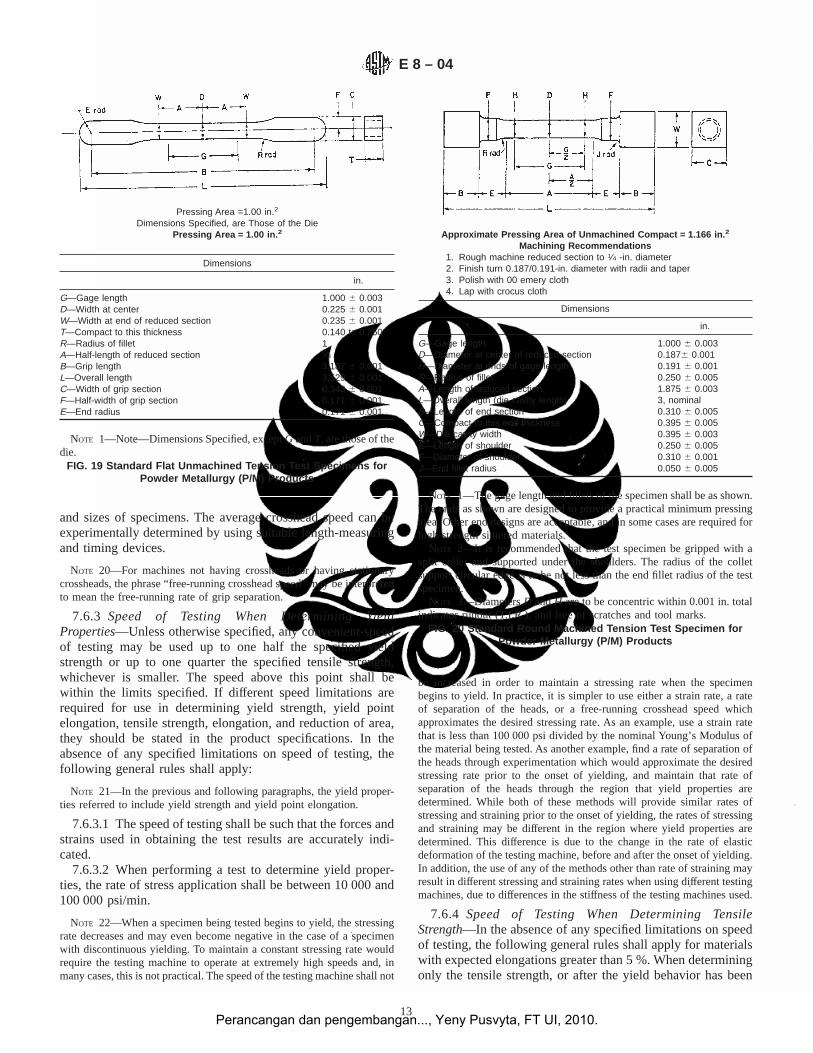
and sizes of specimens. The average crosshead speed can beexperimentally determined by using suitable length-measuringand timing devices.
NOTE 20—For machines not having crossheads or having stationarycrossheads, the phrase “free-running crosshead speed” may be interpretedto mean the free-running rate of grip separation.
7.6.3 Speed of Testing When Determining YieldProperties—Unless otherwise specified, any convenient speedof testing may be used up to one half the specified yieldstrength or up to one quarter the specified tensile strength,whichever is smaller. The speed above this point shall bewithin the limits specified. If different speed limitations arerequired for use in determining yield strength, yield pointelongation, tensile strength, elongation, and reduction of area,they should be stated in the product specifications. In theabsence of any specified limitations on speed of testing, thefollowing general rules shall apply:
NOTE 21—In the previous and following paragraphs, the yield proper-ties referred to include yield strength and yield point elongation.
7.6.3.1 The speed of testing shall be such that the forces andstrains used in obtaining the test results are accurately indi-cated.
7.6.3.2 When performing a test to determine yield proper-ties, the rate of stress application shall be between 10 000 and100 000 psi/min.
NOTE 22—When a specimen being tested begins to yield, the stressingrate decreases and may even become negative in the case of a specimenwith discontinuous yielding. To maintain a constant stressing rate wouldrequire the testing machine to operate at extremely high speeds and, inmany cases, this is not practical. The speed of the testing machine shall not
be increased in order to maintain a stressing rate when the specimenbegins to yield. In practice, it is simpler to use either a strain rate, a rateof separation of the heads, or a free-running crosshead speed whichapproximates the desired stressing rate. As an example, use a strain ratethat is less than 100 000 psi divided by the nominal Young’s Modulus ofthe material being tested. As another example, find a rate of separation ofthe heads through experimentation which would approximate the desiredstressing rate prior to the onset of yielding, and maintain that rate ofseparation of the heads through the region that yield properties aredetermined. While both of these methods will provide similar rates ofstressing and straining prior to the onset of yielding, the rates of stressingand straining may be different in the region where yield properties aredetermined. This difference is due to the change in the rate of elasticdeformation of the testing machine, before and after the onset of yielding.In addition, the use of any of the methods other than rate of straining mayresult in different stressing and straining rates when using different testingmachines, due to differences in the stiffness of the testing machines used.
7.6.4 Speed of Testing When Determining TensileStrength—In the absence of any specified limitations on speedof testing, the following general rules shall apply for materialswith expected elongations greater than 5 %. When determiningonly the tensile strength, or after the yield behavior has been
Pressing Area =1.00 in.2
Dimensions Specified, are Those of the DiePressing Area = 1.00 in. 2
Dimensions
in.
G—Gage length 1.000 6 0.003D—Width at center 0.225 6 0.001W—Width at end of reduced section 0.235 6 0.001T—Compact to this thickness 0.140 to 0.250R—Radius of fillet 1A—Half-length of reduced section 5⁄8B—Grip length 3.187 6 0.001L—Overall length 3.529 6 0.001C—Width of grip section 0.343 6 0.001F—Half-width of grip section 0.171 6 0.001E—End radius 0.171 6 0.001
NOTE 1—Note—Dimensions Specified, exceptG andT, are those of thedie.
FIG. 19 Standard Flat Unmachined Tension Test Specimens forPowder Metallurgy (P/M) Products
Approximate Pressing Area of Unmachined Compact = 1.166 in. 2
Machining Recommendations1. Rough machine reduced section to 1⁄4 -in. diameter2. Finish turn 0.187/0.191-in. diameter with radii and taper3. Polish with 00 emery cloth4. Lap with crocus cloth
Dimensions
in.
G—Gage lengthD—Diameter at center of reduced section
1.000 6 0.0030.1876 0.001
H—Diameter at ends of gage length 0.191 6 0.001R—Radius of fillet 0.250 6 0.005A—Length of reduced sectionL—Overall length (die cavity length)
1.875 6 0.0033, nominal
B—Length of end sectionC—Compact to this end thickness
0.310 6 0.0050.395 6 0.005
W—Die cavity width 0.395 6 0.003E—Length of shoulder 0.250 6 0.005F—Diameter of shoulder 0.310 6 0.001J—End fillet radius 0.050 6 0.005
NOTE 1—The gage length and fillets of the specimen shall be as shown.The ends as shown are designed to provide a practical minimum pressingarea. Other end designs are acceptable, and in some cases are required forhigh-strength sintered materials.
NOTE 2—It is recommended that the test specimen be gripped with asplit collet and supported under the shoulders. The radius of the colletsupport circular edge is to be not less than the end fillet radius of the testspecimen.
NOTE 3—DiametersD andH are to be concentric within 0.001 in. totalindicator runout (T.I.R.), and free of scratches and tool marks.
FIG. 20 Standard Round Machined Tension Test Specimen forPowder Metallurgy (P/M) Products
E 8 – 04
13Perancangan dan pengembangan..., Yeny Pusvyta, FT UI, 2010.
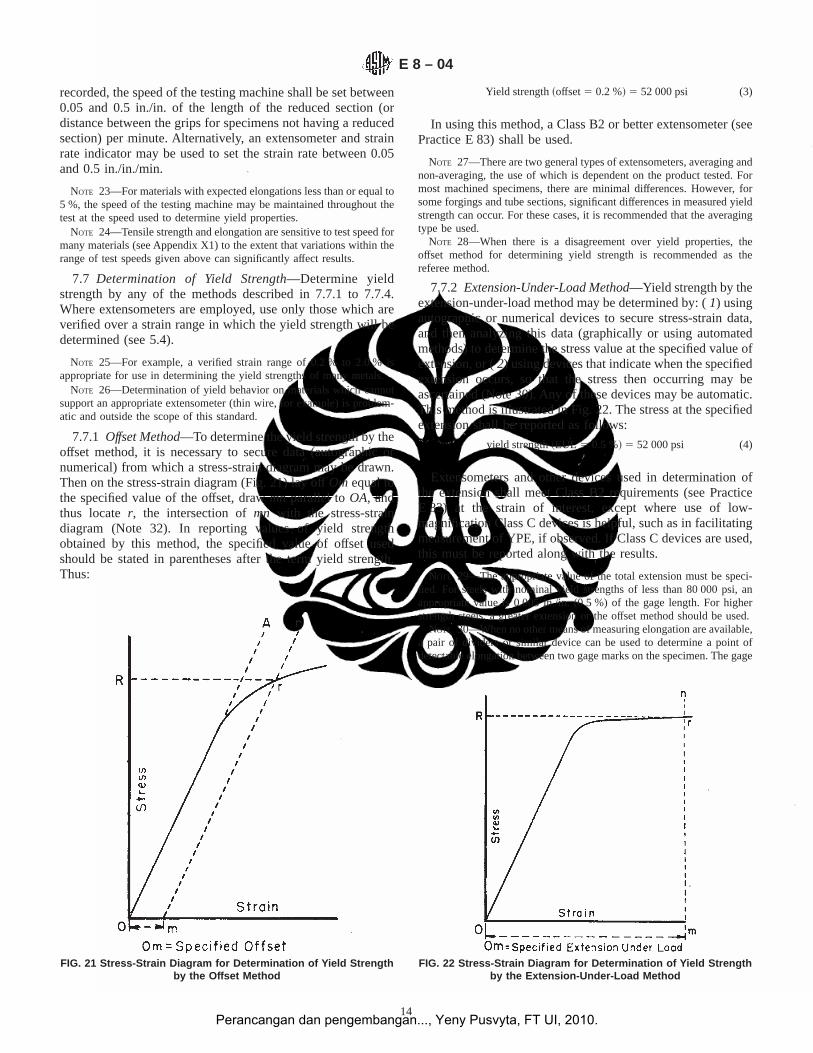
recorded, the speed of the testing machine shall be set between0.05 and 0.5 in./in. of the length of the reduced section (ordistance between the grips for specimens not having a reducedsection) per minute. Alternatively, an extensometer and strainrate indicator may be used to set the strain rate between 0.05and 0.5 in./in./min.
NOTE 23—For materials with expected elongations less than or equal to5 %, the speed of the testing machine may be maintained throughout thetest at the speed used to determine yield properties.
NOTE 24—Tensile strength and elongation are sensitive to test speed formany materials (see Appendix X1) to the extent that variations within therange of test speeds given above can significantly affect results.
7.7 Determination of Yield Strength—Determine yieldstrength by any of the methods described in 7.7.1 to 7.7.4.Where extensometers are employed, use only those which areverified over a strain range in which the yield strength will bedetermined (see 5.4).
NOTE 25—For example, a verified strain range of 0.2 % to 2.0 % isappropriate for use in determining the yield strengths of many metals.
NOTE 26—Determination of yield behavior on materials which cannotsupport an appropriate extensometer (thin wire, for example) is problem-atic and outside the scope of this standard.
7.7.1 Offset Method—To determine the yield strength by theoffset method, it is necessary to secure data (autographic ornumerical) from which a stress-strain diagram may be drawn.Then on the stress-strain diagram (Fig. 21) lay offOmequal tothe specified value of the offset, drawmn parallel toOA, andthus locater, the intersection ofmn with the stress-straindiagram (Note 32). In reporting values of yield strengthobtained by this method, the specified value of offset usedshould be stated in parentheses after the term yield strength.Thus:
Yield strength~offset5 0.2 %! 5 52 000 psi (3)
In using this method, a Class B2 or better extensometer (seePractice E 83) shall be used.
NOTE 27—There are two general types of extensometers, averaging andnon-averaging, the use of which is dependent on the product tested. Formost machined specimens, there are minimal differences. However, forsome forgings and tube sections, significant differences in measured yieldstrength can occur. For these cases, it is recommended that the averagingtype be used.
NOTE 28—When there is a disagreement over yield properties, theoffset method for determining yield strength is recommended as thereferee method.
7.7.2 Extension-Under-Load Method—Yield strength by theextension-under-load method may be determined by: (1) usingautographic or numerical devices to secure stress-strain data,and then analyzing this data (graphically or using automatedmethods) to determine the stress value at the specified value ofextension, or (2) using devices that indicate when the specifiedextension occurs, so that the stress then occurring may beascertained (Note 30). Any of these devices may be automatic.This method is illustrated in Fig. 22. The stress at the specifiedextension shall be reported as follows:
yield strength~EUL 5 0.5 %! 5 52 000 psi (4)
Extensometers and other devices used in determination ofthe extension shall meet Class B2 requirements (see PracticeE 83) at the strain of interest, except where use of low-magnification Class C devices is helpful, such as in facilitatingmeasurement of YPE, if observed. If Class C devices are used,this must be reported along with the results.
NOTE 29—The appropriate value of the total extension must be speci-fied. For steels with nominal yield strengths of less than 80 000 psi, anappropriate value is 0.005 in./in. (0.5 %) of the gage length. For higherstrength steels, a greater extension or the offset method should be used.
NOTE 30—When no other means of measuring elongation are available,a pair of dividers or similar device can be used to determine a point ofdetectable elongation between two gage marks on the specimen. The gage
FIG. 21 Stress-Strain Diagram for Determination of Yield Strengthby the Offset Method
FIG. 22 Stress-Strain Diagram for Determination of Yield Strengthby the Extension-Under-Load Method
E 8 – 04
14Perancangan dan pengembangan..., Yeny Pusvyta, FT UI, 2010.
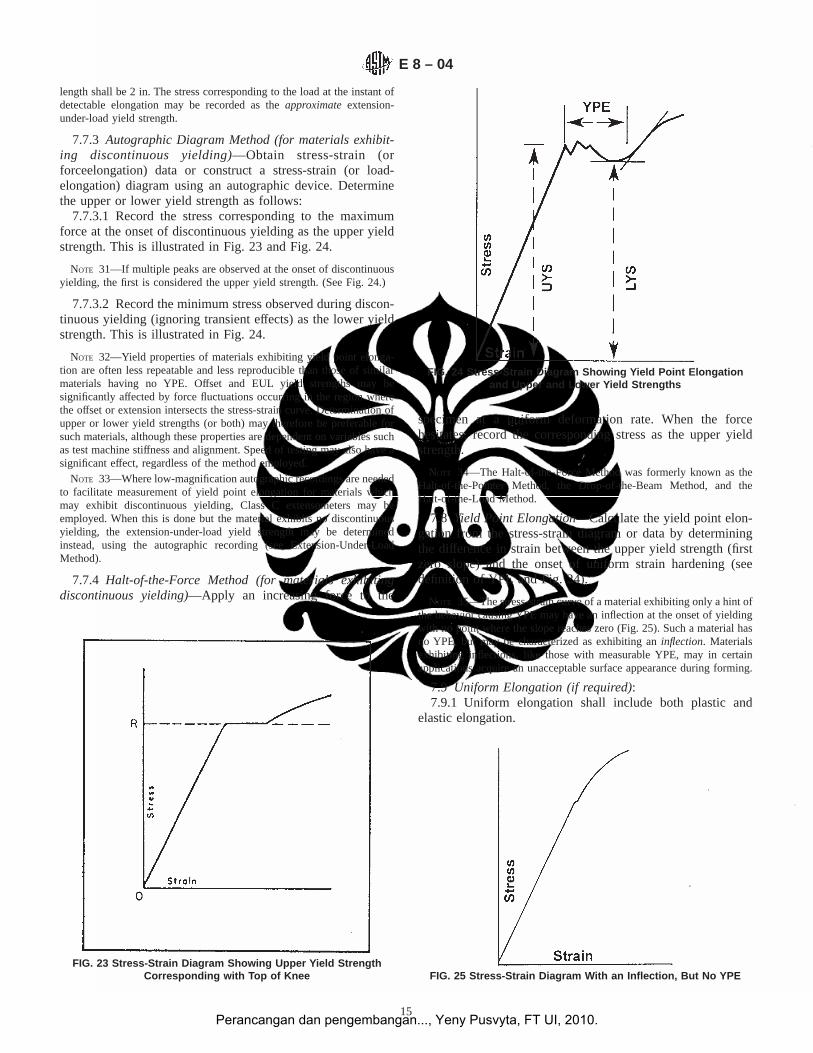
length shall be 2 in. The stress corresponding to the load at the instant ofdetectable elongation may be recorded as theapproximateextension-under-load yield strength.
7.7.3 Autographic Diagram Method (for materials exhibit-ing discontinuous yielding)—Obtain stress-strain (orforceelongation) data or construct a stress-strain (or load-elongation) diagram using an autographic device. Determinethe upper or lower yield strength as follows:
7.7.3.1 Record the stress corresponding to the maximumforce at the onset of discontinuous yielding as the upper yieldstrength. This is illustrated in Fig. 23 and Fig. 24.
NOTE 31—If multiple peaks are observed at the onset of discontinuousyielding, the first is considered the upper yield strength. (See Fig. 24.)
7.7.3.2 Record the minimum stress observed during discon-tinuous yielding (ignoring transient effects) as the lower yieldstrength. This is illustrated in Fig. 24.
NOTE 32—Yield properties of materials exhibiting yield point elonga-tion are often less repeatable and less reproducible than those of similarmaterials having no YPE. Offset and EUL yield strengths may besignificantly affected by force fluctuations occurring in the region wherethe offset or extension intersects the stress-strain curve. Determination ofupper or lower yield strengths (or both) may therefore be preferable forsuch materials, although these properties are dependent on variables suchas test machine stiffness and alignment. Speed of testing may also have asignificant effect, regardless of the method employed.
NOTE 33—Where low-magnification autographic recordings are neededto facilitate measurement of yield point elongation for materials whichmay exhibit discontinuous yielding, Class C extensometers may beemployed. When this is done but the material exhibits no discontinuousyielding, the extension-under-load yield strength may be determinedinstead, using the autographic recording (see Extension-Under-LoadMethod).
7.7.4 Halt-of-the-Force Method (for materials exhibitingdiscontinuous yielding)—Apply an increasing force to the
specimen at a uniform deformation rate. When the forcehesitates, record the corresponding stress as the upper yieldstrength.
NOTE 34—The Halt-of-the-Force Method was formerly known as theHalt-of-the-Pointer Method, the Drop-of-the-Beam Method, and theHalt-of-the-Load Method.
7.8 Yield Point Elongation—Calculate the yield point elon-gation from the stress-strain diagram or data by determiningthe difference in strain between the upper yield strength (firstzero slope) and the onset of uniform strain hardening (seedefinition of YPE and Fig. 24).
NOTE 35—The stress-strain curve of a material exhibiting only a hint ofthe behavior causing YPE may have an inflection at the onset of yieldingwith no point where the slope reaches zero (Fig. 25). Such a material hasno YPE, but may be characterized as exhibiting aninflection. Materialsexhibiting inflections, like those with measurable YPE, may in certainapplications acquire an unacceptable surface appearance during forming.
7.9 Uniform Elongation (if required):7.9.1 Uniform elongation shall include both plastic and
elastic elongation.
FIG. 23 Stress-Strain Diagram Showing Upper Yield StrengthCorresponding with Top of Knee
FIG. 24 Stress-Strain Diagram Showing Yield Point Elongationand Upper and Lower Yield Strengths
FIG. 25 Stress-Strain Diagram With an Inflection, But No YPE
E 8 – 04
15Perancangan dan pengembangan..., Yeny Pusvyta, FT UI, 2010.
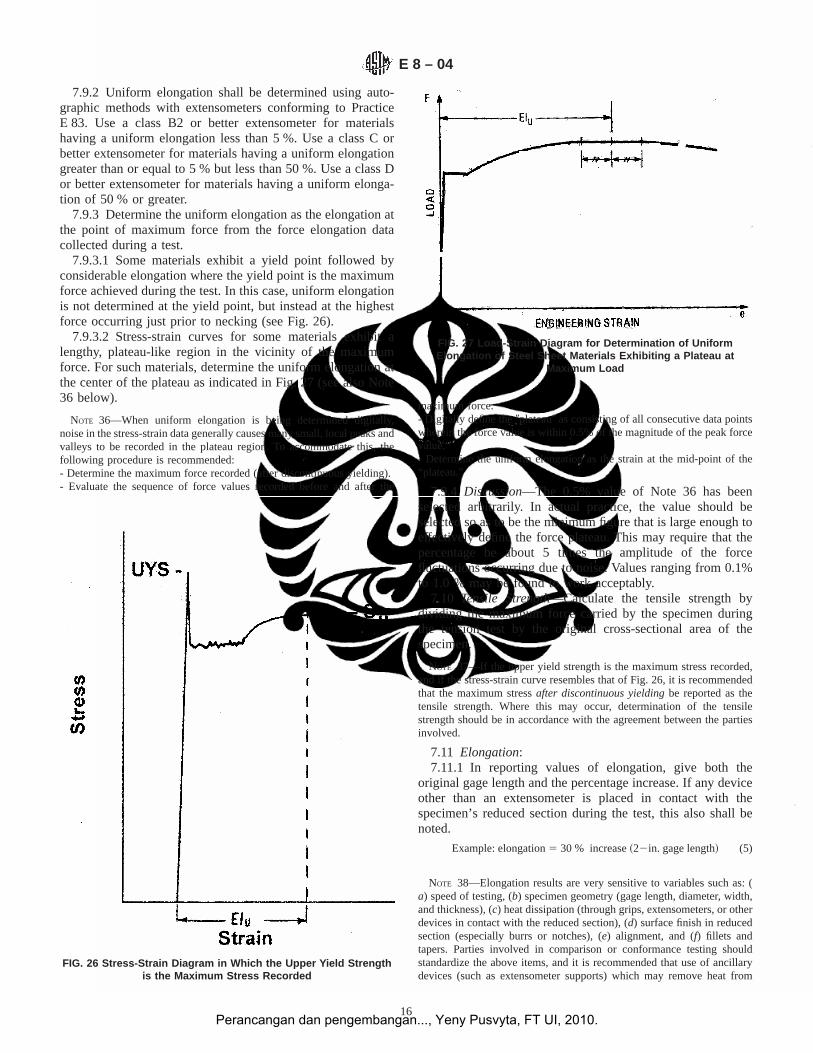
7.9.2 Uniform elongation shall be determined using auto-graphic methods with extensometers conforming to PracticeE 83. Use a class B2 or better extensometer for materialshaving a uniform elongation less than 5 %. Use a class C orbetter extensometer for materials having a uniform elongationgreater than or equal to 5 % but less than 50 %. Use a class Dor better extensometer for materials having a uniform elonga-tion of 50 % or greater.
7.9.3 Determine the uniform elongation as the elongation atthe point of maximum force from the force elongation datacollected during a test.
7.9.3.1 Some materials exhibit a yield point followed byconsiderable elongation where the yield point is the maximumforce achieved during the test. In this case, uniform elongationis not determined at the yield point, but instead at the highestforce occurring just prior to necking (see Fig. 26).
7.9.3.2 Stress-strain curves for some materials exhibit alengthy, plateau-like region in the vicinity of the maximumforce. For such materials, determine the uniform elongation atthe center of the plateau as indicated in Fig. 27 (see also Note36 below).
NOTE 36—When uniform elongation is being determined digitally,noise in the stress-strain data generally causes many small, local peaks andvalleys to be recorded in the plateau region. To accommodate this, thefollowing procedure is recommended:- Determine the maximum force recorded (after discontinuous yielding).- Evaluate the sequence of force values recorded before and after the
maximum force.- Digitally define the9plateau9 as consisting of all consecutive data pointswherein the force value is within 0.5% of the magnitude of the peak forcevalue.- Determine the uniform elongation as the strain at the mid-point of the“plateau.”
7.9.4 Discussion—The 0.5% value of Note 36 has beenselected arbitrarily. In actual practice, the value should beselected so as to be the minimum figure that is large enough toeffectively define the force plateau. This may require that thepercentage be about 5 times the amplitude of the forcefluctuations occurring due to noise. Values ranging from 0.1%to 1.0 % may be found to work acceptably.
7.10 Tensile Strength—Calculate the tensile strength bydividing the maximum force carried by the specimen duringthe tension test by the original cross-sectional area of thespecimen.
NOTE 37—If the upper yield strength is the maximum stress recorded,and if the stress-strain curve resembles that of Fig. 26, it is recommendedthat the maximum stressafter discontinuous yieldingbe reported as thetensile strength. Where this may occur, determination of the tensilestrength should be in accordance with the agreement between the partiesinvolved.
7.11 Elongation:7.11.1 In reporting values of elongation, give both the
original gage length and the percentage increase. If any deviceother than an extensometer is placed in contact with thespecimen’s reduced section during the test, this also shall benoted.
Example: elongation5 30 % increase~22in. gage length! (5)
NOTE 38—Elongation results are very sensitive to variables such as: (a) speed of testing, (b) specimen geometry (gage length, diameter, width,and thickness), (c) heat dissipation (through grips, extensometers, or otherdevices in contact with the reduced section), (d) surface finish in reducedsection (especially burrs or notches), (e) alignment, and (f) fillets andtapers. Parties involved in comparison or conformance testing shouldstandardize the above items, and it is recommended that use of ancillarydevices (such as extensometer supports) which may remove heat from
FIG. 26 Stress-Strain Diagram in Which the Upper Yield Strengthis the Maximum Stress Recorded
FIG. 27 Load-Strain Diagram for Determination of UniformElongation of Steel Sheet Materials Exhibiting a Plateau at
Maximum Load
E 8 – 04
16Perancangan dan pengembangan..., Yeny Pusvyta, FT UI, 2010.
specimens be avoided. See Appendix X1. for additional information on theeffects of these variables.
7.11.2 When the specified elongation is greater than 3 %, fitends of the fractured specimen together carefully and measurethe distance between the gage marks to the nearest 0.01 in. forgage lengths of 2 in. and under, and to at least the nearest 0.5 %of the gage length for gage lengths over 2 in. A percentagescale reading to 0.5 % of the gage length may be used.
7.11.3 When thespecifiedelongation is 3 % or less, deter-mine the elongation of the specimen using the followingprocedure, except that the procedure given in 7.11.2 may beused instead when themeasuredelongation is greater than 3 %.
7.11.3.1 Prior to testing, measure the original gage length ofthe specimen to the nearest 0.002 in.
7.11.3.2 Remove partly torn fragments that will interferewith fitting together the ends of the fractured specimen or withmaking the final measurement.
7.11.3.3 Fit the fractured ends together with matched sur-faces and apply a force along the axis of the specimen sufficientto close the fractured ends together. If desired, this force maythen be removed carefully, provided the specimen remainsintact.
NOTE 39—The use of a force of approximately 2000 psi has been foundto give satisfactory results on test specimens of aluminum alloy.
7.11.3.4 Measure the final gage length to the nearest 0.002in. and report the elongation to the nearest 0.2 %.
7.11.4 Elongation measured per paragraph 7.11.2 or 7.11.3may be affected by location of the fracture, relative to themarked gage length. If any part of the fracture occurs outsidethe gage marks or is located less than 25 % of the elongatedgage length from either gage mark, the elongation valueobtained using that pair of gage marks may be abnormally lowand non-representative of the material. If such an elongationmeasure is obtained in acceptance testing involving only aminimum requirement and meets the requirement, no furthertesting need be done. Otherwise, discard the test and retest thematerial.
7.11.5 Elongation at fracture is defined as the elongationmeasured just prior to the sudden decrease in force associatedwith fracture. For many ductile materials not exhibiting asudden decrease in force, the elongation at fracture can betaken as the strain measured just prior to when the force fallsbelow 10 % of the maximum force encountered during the test.
7.11.5.1 Elongation at fracture shall include elastic andplastic elongation and may be determined with autographic orautomated methods using extensometers verified over thestrain range of interest (see 5.4). Use a class B2 or betterextensometer for materials having less than 5 % elongation, aclass C or better extensometer for materials having elongationgreater than or equal to 5 % but less than 50 %, and a class Dor better extensometer for materials having 50 % or greaterelongation. In all cases, the extensometer gage length shall bethe nominal gage length required for the specimen being tested.Due to the lack of precision in fitting fractured ends together,the elongation after fracture using the manual methods of thepreceding paragraphs may differ from the elongation at fracturedetermined with extensometers.
7.11.5.2 Percent elongation at fracture may be calculateddirectly from elongation at fracture data and be reportedinstead of percent elongation as calculated in paragraphs 7.11.2to 7.11.3. However, these two parameters are not interchange-able. Use of the elongation at fracture method generallyprovides more repeatable results.
NOTE 40—When disagreements arise over the percent elongation re-sults, agreement must be reached on which method to use to obtain theresults.
7.12 Reduction of Area:7.12.1 The reduced area used to calculate reduction of area
(see 7.12.2 and 7.12.3) shall be the minimum cross section atthe location of fracture.
7.12.2 Specimens with Originally Circular Cross Sections—Fit the ends of the fractured specimen together and measure thereduced diameter to the same accuracy as the original mea-surement.
NOTE 41—Because of anisotropy, circular cross sections often do notremain circular during straining in tension. The shape is usually elliptical,thus, the area may be calculated byp· d1·d2/4, whered 1 andd2 are themajor and minor diameters, respectively.
7.12.3 Specimens with Original Rectangular CrossSections—Fit the ends of the fractured specimen together andmeasure the thickness and width at the minimum cross sectionto the same accuracy as the original measurements.
NOTE 42—Because of the constraint to deformation that occurs at thecorners of rectangular specimens, the dimensions at the center of theoriginal flat surfaces are less than those at the corners. The shapes of thesesurfaces are often assumed to be parabolic. When this assumption is made,an effective thickness,te, may be calculated as follows: (t1 + 4 t2 + t3)/6,wheret1 andt 3 are the thicknesses at the corners, andt 2 is the thicknessat mid-width. An effective width may be similarly calculated.
7.12.4 Calculate the reduced area based upon the dimen-sions determined in 7.12.2 or 7.12.3. The difference betweenthe area thus found and the area of the original cross sectionexpressed as a percentage of the original area is the reductionof area.
7.12.5 If any part of the fracture takes place outside themiddle half of the reduced section or in a punched or scribedgage mark within the reduced section, the reduction of areavalue obtained may not be representative of the material. Inacceptance testing, if the reduction of area so calculated meetsthe minimum requirements specified, no further testing isrequired, but if the reduction of area is less than the minimumrequirements, discard the test results and retest.
7.12.6 Results of measurements of reduction of area shall berounded using the procedures of Practice E 29 and any specificprocedures in the product specifications. In the absence of aspecified procedure, it is recommended that reduction of areatest values in the range from 0 to 10 % be rounded to thenearest 0.5 % and test values of 10 % and greater to the nearest1 %.
7.13 Rounding Reported Test Data for Yield Strength andTensile Strength—Test data should be rounded using theprocedures of Practice E 29 and the specific procedures in theproduct specifications. In the absence of a specified procedurefor rounding the test data, one of the procedures described inthe following paragraphs is recommended.
E 8 – 04
17Perancangan dan pengembangan..., Yeny Pusvyta, FT UI, 2010.
7.13.1 For test values up to 50 000 psi, round to the nearest100 psi; for test values of 50 000 psi and up to 100 000 psi,round to the nearest 500 psi; for test values of 100 000 psi andgreater, round to the nearest 1000 psi.
NOTE 43—For steel products, see Test Methods and Definitions A 370.
7.13.2 For all test values, round to the nearest 100 psi.
NOTE 44—For aluminum- and magnesium-alloy products, see MethodsB 557.
7.13.3 For all test values, round to the nearest 500 psi.7.14 Replacement of Specimens—A test specimen may be
discarded and a replacement specimen selected from the samelot of material in the following cases:
7.14.1 The original specimen had a poorly machined sur-face,
7.14.2 The original specimen had the wrong dimensions,7.14.3 The specimen’s properties were changed because of
poor machining practice,7.14.4 The test procedure was incorrect,7.14.5 The fracture was outside the gage length,7.14.6 For elongation determinations, the fracture was out-
side the middle half of the gage length, or7.14.7 There was a malfunction of the testing equipment.
NOTE 45—The tension specimen is inappropriate for assessing sometypes of imperfections in a material. Other methods and specimensemploying ultrasonics, dye penetrants, radiography, etc., may be consid-ered when flaws such as cracks, flakes, porosity, etc., are revealed duringa test and soundness is a condition of acceptance.
8. Report
8.1 Test information on materials not covered by a productspecification should be reported in accordance with 8.2 or both8.2 and 8.3.
8.2 Test information to be reported shall include the follow-ing when applicable:
8.2.1 Material and sample identification.8.2.2 Specimen type (see Section 6).8.2.3 Yield strength and the method used to determine yield
strength (see 7.7).8.2.4 Yield point elongation (see 7.8).8.2.5 Tensile strength (see 7.10).8.2.6 Elongation (report original gage length, percentage
increase, and method used to determine elongation) (see 7.11).8.2.7 Reduction of area, if required (see 7.12).8.3 Test information to be available on request shall include:8.3.1 Specimen test section dimension(s).
8.3.2 Equation used to calculate cross-sectional area ofrectangular specimens taken from large-diameter tubular prod-ucts.
8.3.3 Speed and method used to determine speed of testing(see 7.6).
8.3.4 Method used for rounding of test results (see 7.13).8.3.5 Reasons for replacement specimens (see 7.14).
9. Precision and Bias
9.1 Precision—An interlaboratory test program3 gave thefollowing values for coefficients of variation for the mostcommonly measured tensile properties:
Coefficient of Variation, %
TensileStrength
YieldStrengthOffset =0.02 %
YieldStrengthOffset =
0.2 %
ElongationGage Length=
4 Diameter
Reduc-tion ofArea
CV %r
CV %R
0.91.3
2.74.5
1.42.3
2.85.4
2.84.6
CV %r = repeatability coefficient of variation in percent within a laboratoryCV %R = repeatability coefficient of variation in percent between laborato-ries
9.1.1 The values shown are the averages from tests on sixfrequently tested metals, selected to include most of the normalrange for each property listed above. When these materials arecompared, a large difference in coefficient of variation is found.Therefore, the values above should not be used to judgewhether the difference between duplicate tests of a specificmaterial is larger than expected. The values are provided toallow potential users of this test method to assess, in generalterms, its usefulness for a proposed application.
9.2 Bias—The procedures in Test Methods E 8 for mea-suring tensile properties have no bias because these propertiescan be defined only in terms of a test method.
10. Keywords
10.1 accuracy; bending stress; discontinuous yielding; drop-of-the-beam; eccentric force application; elastic extension;elongation; extension-under-load; extensometer; force; free-running crosshead speed; gage length; halt-of-the force; per-cent elongation; plastic extension; preload; rate of stressing;rate of straining; reduced section; reduction of area; sensitivity;strain; stress; taring; tensile strength; tension testing; yieldpoint elongation; yield strength
3 Supporting data can be found in Appendix I and additional data are availablefrom ASTM Headquarters. Request RR: E28-1004.
E 8 – 04
18Perancangan dan pengembangan..., Yeny Pusvyta, FT UI, 2010.

APPENDIXES
(Nonmandatory Information)
X1. FACTORS AFFECTING TENSION TEST RESULTS
X1.1 The precision and bias of tension test strength andductility measurements depend on strict adherence to the statedtest procedure and are influenced by instrumental and materialfactors, specimen preparation, and measurement/testing errors.
X1.2 The consistency of agreement for repeated tests of thesame material is dependent on the homogeneity of the material,and the repeatability of specimen preparation, test conditions,and measurements of the tension test parameters.
X1.3 Instrumental factors that can affect test results in-clude: the stiffness, damping capacity, natural frequency, andmass of moving parts of the tensile test machine; accuracy offorce indication and use of forces within the verified range ofthe machine; rate of force application, alignment of the testspecimen with the applied force, parallelness of the grips, grippressure, nature of the force control used, appropriateness andcalibration of extensometers, heat dissipation (by grips, exten-someters, or ancillary devices), and so forth.
X1.4 Material factors that can affect test results include:representativeness and homogeneity of the test material, sam-pling scheme, and specimen preparation (surface finish, dimen-sional accuracy, fillets at the ends of the gage length, taper inthe gage length, bent specimens, thread quality, and so forth).
X1.4.1 Some materials are very sensitive to the quality ofthe surface finish of the test specimen (see Note 8) and must beground to a fine finish, or polished to obtain correct results.
X1.4.2 Test results for specimens with as-cast, as-rolled,as-forged, or other non-machined surface conditions can beaffected by the nature of the surface (see Note 14).
X1.4.3 Test specimens taken from appendages to the part orcomponent, such as prolongs or risers, or from separatelyproduced castings (for example, keel blocks) may produce testresults that are not representative of the part or component.
X1.4.4 Test specimen dimensions can influence test results.For cylindrical or rectangular specimens, changing the testspecimen size generally has a negligible effect on the yield andtensile strength but may influence the upper yield strength, ifone is present, and elongation and reduction of area values.Comparison of elongation values determined using differentspecimens requires that the following ratio be controlled:
Lo/~Ao!1/2 (X1.1)
where:Lo = original gage length of specimen, andAo = original cross-sectional area of specimen.
X1.4.4.1 Specimens with smallerL o/(Ao)1/2 ratios generally
give greater elongation and reduction in area values. This is thecase for example, when the width or thickness of a rectangulartensile test specimen is increased.
X1.4.4.2 Holding theLo/(Ao)1/2 ratio constant minimizes,
but does not necessarily eliminate, differences. Depending on
material and test conditions, increasing the size of the propor-tional specimen of Fig. 8 may be found to increase or decreaseelongation and reduction in area values somewhat.
X1.4.5 Use of a taper in the gage length, up to the allowed1 % limit, can result in lower elongation values. Reductions ofas much as 15 % have been reported for a 1 % taper.
X1.4.6 Changes in the strain rate can affect the yieldstrength, tensile strength, and elongation values, especially formaterials which are highly strain rate sensitive. In general, theyield strength and tensile strength will increase with increasingstrain rate, although the effect on tensile strength is generallyless pronounced. Elongation values generally decrease as thestrain rate increases.
X1.4.7 Brittle materials require careful specimen prepara-tion, high quality surface finishes, large fillets at the ends of thegage length, oversize threaded grip sections, and cannottolerate punch or scribe marks as gage length indicators.
X1.4.8 Flattening of tubular products to permit testing doesalter the material properties, generally nonuniformly, in theflattened region which may affect test results.
X1.5 Measurement errors that can affect test results in-clude: verification of the test force, extensometers, microme-ters, dividers, and other measurement devices, alignment andzeroing of chart recording devices, and so forth.
X1.5.1 Measurement of the dimensions of as-cast, as-rolled,as-forged, and other test specimens with non-machined sur-faces may be imprecise due to the irregularity of the surfaceflatness.
X1.5.2 Materials with anisotropic flow characteristics mayexhibit non-circular cross sections after fracture and measure-ment precision may be affected, as a result (see Note 37).
X1.5.3 The corners of rectangular test specimens are subjectto constraint during deformation and the originally flat surfacesmay be parabolic in shape after testing which will affect theprecision of final cross-sectional area measurements (see Note42).
X1.5.4 If any portion of the fracture occurs outside of themiddle of the gage length, or in a punch or scribe mark withinthe gage length, the elongation and reduction of area valuesmay not be representative of the material. Wire specimens thatbreak at or within the grips may not produce test resultsrepresentative of the material.
X1.5.5 Use of specimens with shouldered ends (“button-head” tensiles) will produce lower 0.02 % offset yield strengthvalues than threaded specimens.
X1.6 Because standard reference materials with certifiedtensile property values are not available, it is not possible torigorously define the bias of tension tests. However, by the useof carefully designed and controlled interlaboratory studies, areasonable definition of the precision of tension test results canbe obtained.
E 8 – 04
19Perancangan dan pengembangan..., Yeny Pusvyta, FT UI, 2010.
X1.6.1 An interlaboratory test program3 was conducted inwhich six specimens each, of six different materials wereprepared and tested by each of six different laboratories. TablesX1.1-X1.5 present the precision statistics, as defined in Prac-tice E 691, for: tensile strength, 0.02 % yield strength, 0.2 %yield strength, % elongation in 4D, and % reduction in area. Ineach table, the first column lists the six materials tested, thesecond column lists the average of the average results obtainedby the laboratories, the third and fifth columns list therepeatability and reproducibility standard deviations, the fourthand sixth columns list the coefficients of variation for these
standard deviations, and the seventh and eighth columns listthe 95 % repeatability and reproducibility limits.
X1.6.2 The averages (below columns four and six in eachtable) of the coefficients of variation permit a relative compari-son of the repeatability (within-laboratory precision) andreproducibility (between-laboratory precision) of the tensiontest parameters. This shows that the ductility measurementsexhibit less repeatability and reproducibility than the strengthmeasurements. The overall ranking from the least to the mostrepeatable and reproducible is: % elongation in 4D, % reduc-tion in area, 0.02 % offset yield strength, 0.2 % offset yield
TABLE X1.1 Precision Statistics—Tensile Strength, ksi
NOTE 1— X is the average of the cell averages, that is, the grand mean for the test parameter,sr is the repeatability standard deviation (within-laboratory precision),sr/X is the coefficient of variation in %,sR is the reproducibility standard deviation (between-laboratory precision),sR/X is the coefficient of variation, %,r is the 95 % repeatability limits,R is the 95 % reproducibility limits.
Material X sr sr/X,% sR sR/X, % r R
EC-H19 25.66 0.63 2.45 0.63 2.45 1.76 1.762024-T351 71.26 0.88 1.24 0.96 1.34 2.47 2.68ASTM A105 86.57 0.60 0.69 1.27 1.47 1.68 3.55AISI 316 100.75 0.39 0.39 1.22 1.21 1.09 3.39Inconel 600 99.48 0.42 0.43 0.72 0.72 1.19 2.02SAE 51410 181.73 0.46 0.25 1.14 0.63 1.29 3.20
Averages: 0.91 1.30
TABLE X1.2 Precision Statistics—0.02 % Yield Strength, ksi
Material X sr sr/X,% sR sR/X, % r R
EC-H19 16.16 0.65 4.00 1.19 7.37 1.81 3.332024-T351 51.38 0.84 1.64 0.89 1.73 2.36 2.49ASTM A105 59.66 1.20 2.02 1.90 3.18 3.37 5.31AISI 316 48.75 2.42 4.97 4.63 9.49 6.68 12.91Inconel 600 38.74 0.46 1.18 0.76 1.96 1.28 2.13SAE 51410 104.90 2.40 2.29 3.17 3.02 6.73 8.88
Averages: 2.68 4.46
TABLE X1.3 Precision Statistics—0.2 % Yield Strength, ksi
Material X sr sr/X,% sR sR/X, % r R
EC-H19 22.98 0.47 2.06 0.48 2.07 1.33 1.332024-T351 52.64 0.74 1.41 0.79 1.49 2.08 2.20ASTM A105 58.36 0.83 1.42 1.44 2.47 2.31 4.03AISI 316 69.78 0.95 1.36 2.83 4.06 2.63 7.93Inconel 600 38.91 0.36 0.93 0.85 2.17 1.01 2.37SAE 51410 140.33 1.29 0.92 2.30 1.64 3.60 6.45
Averages: 1.35 2.32
TABLE X1.4 Precision Statistics—% Elongation in 4D
NOTE 1—Length of reduced section = 6D.
Material X sr sr/X,% sR sR/X, % r R
EC-H19 17.42 0.64 3.69 0.92 5.30 1.80 2.592024-T351 19.76 0.58 2.94 1.58 7.99 1.65 4.43ASTM A105 29.10 0.76 2.62 0.98 3.38 2.13 2.76AISI 316 40.07 1.10 2.75 2.14 5.35 3.09 6.00Inconel 600 44.28 0.66 1.50 1.54 3.48 1.86 4.31SAE 51410 14.48 0.48 3.29 0.99 6.83 1.34 2.77
Averages: 2.80 5.39
E 8 – 04
20Perancangan dan pengembangan..., Yeny Pusvyta, FT UI, 2010.
strength, and tensile strength. Note that the rankings are in thesame order for the repeatability and reproducibility averagecoefficients of variation and that the reproducibility (between-laboratory precision) is poorer than the repeatability (within-laboratory precision), as would be expected.
X1.6.3 No comments about bias can be made for theinterlaboratory study due to the lack of certified test results for
these specimens. However, examination of the test resultsshowed that one laboratory consistently exhibited higher thanaverage strength values and lower than average ductility valuesfor most of the specimens. One other laboratory had consis-tently lower than average tensile strength results for allspecimens.
X2. MEASUREMENT OF SPECIMEN DIMENSIONS
X2.1 Measurement of specimen dimensions is critical intension testing, and it becomes more critical with decreasingspecimen size, as a given absolute error becomes a largerrelative (percent) error. Measuring devices and proceduresshould be selected carefully, so as to minimize measurementerror and provide good repeatability and reproducibility.
X2.2 Relative measurement error should be kept at orbelow 1 %, where possible. Ideally, this 1 % error shouldinclude not only the resolution of the measuring device but alsothe variability commonly referred to as repeatability andreproducibility. (Repeatability is the ability of any operator toobtain similar measurements in repeated trials. Reproducibilityis the ability of multiple operators to obtain similar measure-ments.)
X2.3 Formal evaluation of gage repeatability and reproduc-ibility (GR and R) by way of a GR and R study is highlyrecommended. A GR and R study involves having multipleoperators each take two or three measurements of a number ofparts—in this case, test specimens. Analysis, usually done bycomputer, involves comparing the observed measurementvariations to a tolerance the procedure is to determine con-formance to. High GR and R percentages (more than 20 %)indicate much variability relative to the tolerance, whereas lowpercentages (10 % or lower) indicate the opposite. The analysisalso estimates, independently, the repeatability and reproduc-ibility.
X2.4 GR and R studies in which nontechnical personnelused different brands and models of hand-held micrometershave given results varying from about 10 % (excellent) tonearly 100 % (essentially useless), relative to a dimensionaltolerance of 0.003 in. The user is therefore advised to be verycareful in selecting devices, setting up measurement proce-dures, and training personnel.
X2.5 With a 0.003 in. tolerance, a 10 % GR and R result(exceptionally good, even for digital hand-held micrometers
reading to 0.00005 in.) indicates that the total variation due torepeatability and reproducibility is around 0.0003 in. This isless than or equal to 1 % only if all dimensions to be measuredare greater than or equal to 0.03 in. The relative error in usingthis device to measure thickness of a 0.01 in. flat tensilespecimen would be 3 %—which is considerably more than thatallowed for load or strain measurement.
X2.6 Dimensional measurement errors can be identified asthe cause of manyout-of-control signals, as indicated bystatistical process control (SPC) charts used to monitor tensiontesting procedures. This has been the experience of a produc-tion laboratory employing SPC methodology and the besthand-held micrometers available (from a GR and R standpoint)in testing of 0.018 in. to 0.25 in. flat rolled steel products.
X2.7 Factors which affect GR and R, sometimes dramati-cally, and which should be considered in the selection andevaluation of hardware and procedures include:
X2.7.1 Resolution,X2.7.2 Verification,X2.7.3 Zeroing,X2.7.4 Type of anvil (flat, rounded, or pointed),X2.7.5 Cleanliness of part and anvil surfaces,X2.7.6 User-friendliness of measuring device,X2.7.7 Stability/temperature variations,X2.7.8 Coating removal,X2.7.9 Operator techique, andX2.7.10 Ratchets or other features used to regulate the
clamping force.
X2.8 Flat anvils are generally preferred for measuring thedimensions of round or flat specimens which have relativelysmooth surfaces. One exception is that rounded or pointedanvils must be used in measuring the thickness of curvedspecimens taken from large-diameter tubing (see Fig. 13), toprevent overstating the thickness. (Another concern for thesecurved specimens is the error that can be introduced through
TABLE X1.5 Precision Statistics—% Reduction in Area
Material X sr sr/X,% sR sR/X, % r R
EC-H19 79.15 1.93 2.43 2.01 2.54 5.44 5.672024-T351 30.41 2.09 6.87 3.59 11.79 5.79 10.01ASTM A105 65.59 0.84 1.28 1.26 1.92 2.35 3.53AISI 316 71.49 0.99 1.39 1.60 2.25 2.78 4.50Inconel 600 59.34 0.67 1.14 0.70 1.18 1.89 1.97SAE 51410 50.49 1.86 3.69 3.95 7.81 5.21 11.05
Averages: 2.80 4.58
E 8 – 04
21Perancangan dan pengembangan..., Yeny Pusvyta, FT UI, 2010.
use of the equationA = W 3T; see 7.2.3.)
X2.9 Heavy coatings should generally be removed from atleast one grip end of flat specimens taken from coated productsto permit accurate measurement of base metal thickness,assuming (a) the base metal properties are what are desired, (b)the coating does not contribute significantly to the strength ofthe product, and (c) coating removal can be easily accom-plished (some coatings may be easily removed by chemicalstripping). Otherwise, it may be advisable to leave the coatingintact and determine the base metal thickness by an alternatemethod. Where this issue may arise, all parties involved incomparison or conformance testing should agree as to whetheror not coatings are to be removed before measurement.
X2.10 As an example of how the considerations identified
above affect dimensional measurement procedures, considerthe case of measuring the thickness of 0.015 in. painted, flatrolled steel specimens. The paint should be removed prior tomeasurement, if possible. The measurement device usedshould have flat anvils, must read to 0.0001 in. or better, andmust have excellent repeatability and reproducibility. Since GRand R is a significant concern, it will be best to use a devicewhich has a feature for regulating the clamping force used, anddevices without digital displays should be avoided to preventreading errors. Before use of the device, and periodicallyduring use, the anvils should be cleaned, and the device shouldbe verified or zeroed (if an electronic display is used) or both.Finally, personnel should be trained and audited periodically toensure that the measuring device is being used correctly andconsistently by all.
X3. SUGGESTED ACCREDITATION CRITERIA FOR LABORATORIES PERFORMING TENSILE TESTS
X3.1 Scope
X3.1.1 The following are specific features that an assessormay check to assess a laboratory’s technical competence, if thelaboratory is performing tests in accordance with Test MethodsE 8 and/or E 8M.
X3.2 Preparation
X3.2.1 The laboratory should follow documented proce-dures to ensure that machining or other preparation generatesspecimens conforming to applicable tolerances and require-ments of Test Methods E 8 or E 8M. Particularly important arethose requirements that pertain to the dimensions and finish ofreduced sections, as found in the text and in applicable figures.
X3.2.2 Where gage marks are used, the laboratory shouldemploy documented gage marking procedures to ensure thatthe marks and gage lengths comply with the tolerances andguidelines of Test Methods E 8 or E 8M.
X3.2.2.1 The gage marking procedure used should notdeleteriously affect the test results.
NOTE X3.1—Frequent occurrence of fracturing at the gage marks mayindicate that gage marks have excessive depth or sharpness and may beaffecting test results.
X3.3 Test Equipment
X3.3.1 As specified in the Apparatus sections of TestMethods E 8 and E 8M, the axis of the test specimen shouldcoincide with the center line of the heads of the testingmachine, in order to minimize bending stresses which couldaffect the results.
X3.3.2 Equipment verification requirements of PracticesE 4 and E 83 shall be met. Documentation showing theverification work to have been thorough and technically correctshould be available.
X3.3.2.1 Verification reports shall demonstrate that forceand extension readings have been taken at the prescribedintervals and that the prescribed runs have been completed.
X3.3.3 Extensometers used shall meet all requirements ofTest Methods E 8 or E 8M as to the classification of device tobe used for the results determined. For example, an extensom-
eter not meeting the Class B2 requirements of Practice E 83may not be used in determination of offset yield strengths.
X3.3.4 Before computerized or automated test equipment isput into routine service, or following a software revision, it isrecommended that measures be taken to verify proper opera-tion and result interpretation. Guide E 1856 addresses thisconcern.
X3.3.5 Micrometers and other devices used in measurementof specimen dimensions should be selected, maintained andused in such a manner as to comply with the appendixes of TestMethods E 8 and E 8M on measurement. Traceability tonational standards should be established for these devices, andreasonable effort should be employed to prevent errors greaterthan 1 % from being generated as a result of measurementerror, resolution, and rounding practice.
X3.4 Procedures
X3.4.1 The test machine shall be set up and zeroed in sucha manner that zero force indication signifies a state of zeroforce on the specimen, as indicated in the Zeroing of the TestMachine sections of Test Methods E 8 and E 8M.
NOTE X3.2—Provisions should be made to ensure that zero readings areproperly maintained, from test to test. These may include, for example,zeroing after a predetermined number of tests or each time, under zeroforce conditions, the indicator exceeds a predetermined value.
X3.4.2 Upon request, the laboratory should be capable ofdemonstrating (perhaps through time, force, displacement orextensometer measurements, or both) that the test speeds usedconform to the requirements of Test Methods E 8 or E 8M, orother standards which take precedence.
X3.4.3 Upon request, the laboratory should be capable ofdemonstrating that the offsets and extensions used in determin-ing yield strengths conform to the requirements of TestMethods E 8 or E 8M and are constructed so as to indicate theforces corresponding to the desired offset strain or total strain.
NOTE X3.3—Use caution when performing calculations with exten-someter magnification, because the manufacturer may report strain mag-nification, which relates the strain (not the elongation) to thex-axisdisplacement on the stress strain diagram. A user or assessor interested in
E 8 – 04
22Perancangan dan pengembangan..., Yeny Pusvyta, FT UI, 2010.

an extensometer’s magnification may use calibration equipment to deter-mine the ratio between elongation and chart travel or may verify areported magnification by calculating the Young’s modulus from tests ofspecimens of a known nominal modulus.
X3.4.4 Measurement of elongation shall conform to re-quirements of Test Methods E 8 or E 8M.
NOTE X3.4—Test Methods E 8 and E 8M permit the measurement andreporting of elongation at fracture in place of elongation, as is often donein automated testing.
X3.4.5 Reduction of area, when required, shall be deter-mined in accordance with the requirements of Test MethodsE 8 or E 8M.
X3.4.6 Procedures for recording, calculating, and reportingdata and test results shall conform to all applicable require-ments of Test Methods E 8 or E 8M. In addition, whereverpractical, the procedures should also be in accordance withwidely accepted provisions of good laboratory practice, such asthose detailed below.
X3.4.6.1 When recording data, personnel should record allfigures that are definite, plus the best estimate of the first figurewhich is uncertain. (If a result is known to be approximatelymidway between 26 and 27, 26.5 should be the result recorded(not 26, 27, or 26.475).
X3.4.6.2 When performing calculations, personnel shouldavoid compounding of rounding errors. This may be accom-plished by performing one large calculation, rather than severalcalculations using individual results. Alternatively, if multi-step calculations are done, intermediate results should not berounded before use in subsequent calculations.
X3.4.6.3 In rounding, no final result should retain moresignificant figures than the least-significant-figure measure-ment or data point used in the calculation.
X3.5 Retention
X3.5.1 A retention program appropriate for the nature andfrequency of testing done in the laboratory should be main-tained. Items that may warrant retention for defined timeperiods include:
X3.5.1.1 Raw data and forms,X3.5.1.2 Force-elongation or stress-strain charts,X3.5.1.3 Computer printouts of curves and test results,X3.5.1.4 Data and results stored on computer discs or hard
drives,
X3.5.1.5 Broken specimens,X3.5.1.6 Excess material,X3.5.1.7 Test reports, andX3.5.1.8 Verification reports and certifications.
X3.6 EnvironmentX3.6.1 All test equipment should be located and connected
to power sources in such a manner as to minimize the effectsof vibrations and electrical disturbances on raw data collected,stress-strain charts, and operation of equipment.
X3.7 ControlsX3.7.1 Controlled procedures and work instructions should
cover all aspects of specimen preparation, tensile testing, andresult reporting. These documents should be readily availableto all involved in the documented tasks.
X3.7.2 Clear, concise, operating instructions should bemaintained for equipment used in specimen preparation andtensile testing. These instructions should be readily available toall qualified operators.
X3.7.3 All applicable verification requirements shall bemet, as detailed in X3.3.2.
X3.7.4 It is recommended that special studies and programsbe employed to monitor and control tensile testing, becausetensile test results are easily affected by operators, measuringdevices, and test equipment. Examples of such programsinclude but are not limited to:
X3.7.4.1 Round-robin studies, proficiency tests, or othercross-checks,
X3.7.4.2 Repeatability and reproducibility (R and R) stud-ies,
X3.7.4.3 Control charting, andX3.7.4.4 Determination of typical lab uncertainties for each
result typically reported.
NOTE X3.5—For nondestructive testing, repeatability and reproducibil-ity are often measured by conducting gage R and R studies, as discussedin Appendix X2 of Test Methods E 8 and E 8M. These studies involverepeated determination of a test result, using a single part or specimen, sogage R and Rs are not directly applicable to mechanical properties, whichare obtained through destructive testing. (True differences between eventhe best duplicate specimens manifest themselves in the form of poorer Rand R results than would be obtained for perfect duplicates.) Nevertheless,quasi-R and R studies conducted with these limitations taken intoconsideration may be helpful in analyzing sources of error and improvingreliability of test results.
E 8 – 04
23Perancangan dan pengembangan..., Yeny Pusvyta, FT UI, 2010.

SUMMARY OF CHANGES
Committee E28 has identified the location of selected changes to this standard since the last issue (E 8M – 03)that may impact the use of this standard. (Approved July 10, 2003)
(1) Section 7.9.3.2 was revised. Note 36 and a discussion wereadded following this revised section.
Committee E28 has identified the location of selected changes to this standard since the last issue (E 8M – 01) that mayimpact the use of this standard. (Approved Oct. 10, 2001)
(1) Section 6.5 and it subsections were revised.(2) Note 10 was deleted and the remaining notes wererenumbered.
(3) Appendix X3 was added.
ASTM International takes no position respecting the validity of any patent rights asserted in connection with any item mentionedin this standard. Users of this standard are expressly advised that determination of the validity of any such patent rights, and the riskof infringement of such rights, are entirely their own responsibility.
This standard is subject to revision at any time by the responsible technical committee and must be reviewed every five years andif not revised, either reapproved or withdrawn. Your comments are invited either for revision of this standard or for additional standardsand should be addressed to ASTM International Headquarters. Your comments will receive careful consideration at a meeting of theresponsible technical committee, which you may attend. If you feel that your comments have not received a fair hearing you shouldmake your views known to the ASTM Committee on Standards, at the address shown below.
This standard is copyrighted by ASTM International, 100 Barr Harbor Drive, PO Box C700, West Conshohocken, PA 19428-2959,United States. Individual reprints (single or multiple copies) of this standard may be obtained by contacting ASTM at the aboveaddress or at 610-832-9585 (phone), 610-832-9555 (fax), or [email protected] (e-mail); or through the ASTM website(www.astm.org).
E 8 – 04
24Perancangan dan pengembangan..., Yeny Pusvyta, FT UI, 2010.
Designation: A 370 – 03a
Standard Test Methods and Definitions forMechanical Testing of Steel Products 1
This standard is issued under the fixed designation A 370; the number immediately following the designation indicates the year oforiginal adoption or, in the case of revision, the year of last revision. A number in parentheses indicates the year of last reapproval. Asuperscript epsilon (e) indicates an editorial change since the last revision or reapproval.
This standard has been approved for use by agencies of the Department of Defense.
1. Scope*
1.1 These test methods2 cover procedures and definitionsfor the mechanical testing of wrought and cast steels, stainlesssteels, and related alloys. The various mechanical tests hereindescribed are used to determine properties required in theproduct specifications. Variations in testing methods are to beavoided, and standard methods of testing are to be followed toobtain reproducible and comparable results. In those cases inwhich the testing requirements for certain products are uniqueor at variance with these general procedures, the productspecification testing requirements shall control.
1.2 The following mechanical tests are described:Sections
Tension 5 to 13Bend 14Hardness 15
Brinell 16Rockwell 17Portable 18
Impact 19 to 28Keywords 29
1.3 Annexes covering details peculiar to certain productsare appended to these test methods as follows:
AnnexBar Products A1.1Tubular Products Annex A2Fasteners Annex A3Round Wire Products Annex A4Significance of Notched-Bar Impact Testing Annex A5Converting Percentage Elongation of Round Specimens to
Equivalents for Flat SpecimensAnnex A6
Testing Multi-Wire Strand Annex A7Rounding of Test Data Annex A8Methods for Testing Steel Reinforcing Bars Annex A9Procedure for Use and Control of Heat-Cycle Simulation Annex A10
1.4 The values stated in inch-pound units are to be regardedas the standard.
1.5 When this document is referenced in a metric productspecification, the yield and tensile values may be determined in
inch-pound (ksi) units then converted into SI (MPa) units. Theelongation determined in inch-pound gage lengths of 2 or 8 in.may be reported in SI unit gage lengths of 50 or 200 mm,respectively, as applicable. Conversely, when this document isreferenced in an inch-pound product specification, the yieldand tensile values may be determined in SI units then con-verted into inch-pound units. The elongation determined in SIunit gage lengths of 50 or 200 mm may be reported ininch-pound gage lengths of 2 or 8 in., respectively, as appli-cable.
1.6 Attention is directed to Practices A 880 and E 1595when there may be a need for information on criteria forevaluation of testing laboratories.
1.7 This standard does not purport to address all of thesafety concerns, if any, associated with its use. It is theresponsibility of the user of this standard to establish appro-priate safety and health practices and determine the applica-bility of regulatory limitations prior to use.
2. Referenced Documents
2.1 ASTM Standards:A 703/A 703M Specification for Steel Castings, General
Requirements, for Pressure-Containing Parts3
A 781/A 781M Specification for Castings, Steel and Alloy,Common Requirements, for General Industrial Use3
A 833 Practice for Indentation Hardness of Metallic Mate-rials by Comparison Hardness Testers4
A 880 Practice for Criteria for Use in Evaluation of TestingLaboratories and Organizations for Examination and In-spection of Steel, Stainless Steel, and Related Alloys5
E 4 Practices for Force Verification of Testing Machines6
E 6 Terminology Relating to Methods of Mechanical Test-ing6
E 8 Test Methods for Tension Testing of Metallic Materials6
E 8M Test Methods for Tension Testing of Metallic Mate-rials [Metric]6
E 10 Test Method for Brinell Hardness of Metallic Materi-als6
1 These test methods and definitions are under the jurisdiction of ASTMCommittee A01 on Steel, Stainless Steel and Related Alloys and are the directresponsibility of Subcommittee A01.13 on Mechanical and Chemical Testing andProcessing Methods of Steel Products and Processes.
Current edition approved Oct. 1, 2003. Published October 2003. Originallyapproved in 1953. Last previous edition approved in 2003 as A 370 – 03.
2 For ASME Boiler and Pressure Vessel Codeapplications see related Specifi-cation SA-370 in Section II of that Code.
3 Annual Book of ASTM Standards, Vol 01.02.4 Annual Book of ASTM Standards, Vol 01.05.5 Annual Book of ASTM Standards, Vol 01.03.6 Annual Book of ASTM Standards, Vol 03.01.
1
*A Summary of Changes section appears at the end of this standard.
Copyright © ASTM International, 100 Barr Harbor Drive, PO Box C700, West Conshohocken, PA 19428-2959, United States.
Perancangan dan pengembangan..., Yeny Pusvyta, FT UI, 2010.

E 18 Test Methods for Rockwell Hardness and RockwellSuperficial Hardness of Metallic Materials6
E 23 Test Methods for Notched Bar Impact Testing ofMetallic Materials6
E 29 Practice for Using Significant Digits in Test Data toDetermine Conformance with Specifications7
E 83 Practice for Verification and Classification of Exten-someters6
E 110 Test Method for Indentation Hardness of MetallicMaterials by Portable Hardness Testers6
E 190 Test Method for Guided Bend Test for Ductility ofWelds6
E 208 Test Method for Conducting Drop-Weight Test toDetermine Nil-Ductility Transition Temperature of FerriticSteels6
E 290 Test Method for Bend Test of Material for Ductility6
E 1595 Practice for Evaluating the Performance of Me-chanical Testing Laboratories8
2.2 Other Document:ASME Boiler and Pressure Vessel Code, Section VIII,
Division I, Part UG-849
3. General Precautions
3.1 Certain methods of fabrication, such as bending, form-ing, and welding, or operations involving heating, may affectthe properties of the material under test. Therefore, the productspecifications cover the stage of manufacture at which me-chanical testing is to be performed. The properties shown bytesting prior to fabrication may not necessarily be representa-tive of the product after it has been completely fabricated.
3.2 Improper machining or preparation of test specimensmay give erroneous results. Care should be exercised to assuregood workmanship in machining. Improperly machined speci-mens should be discarded and other specimens substituted.
3.3 Flaws in the specimen may also affect results. If any testspecimen develops flaws, the retest provision of the applicableproduct specification shall govern.
3.4 If any test specimen fails because of mechanical reasonssuch as failure of testing equipment or improper specimenpreparation, it may be discarded and another specimen taken.
4. Orientation of Test Specimens
4.1 The terms “longitudinal test” and “transverse test” areused only in material specifications for wrought products andare not applicable to castings. When such reference is made toa test coupon or test specimen, the following definitions apply:
4.1.1 Longitudinal Test, unless specifically defined other-wise, signifies that the lengthwise axis of the specimen isparallel to the direction of the greatest extension of the steelduring rolling or forging. The stress applied to a longitudinaltension test specimen is in the direction of the greatestextension, and the axis of the fold of a longitudinal bend testspecimen is at right angles to the direction of greatest extension(Fig. 1, Fig. 2a, and 2b).
4.1.2 Transverse Test, unless specifically defined otherwise,signifies that the lengthwise axis of the specimen is at rightangles to the direction of the greatest extension of the steelduring rolling or forging. The stress applied to a transversetension test specimen is at right angles to the greatest exten-sion, and the axis of the fold of a transverse bend test specimenis parallel to the greatest extension (Fig. 1).
4.2 The terms “radial test” and “tangential test” are used inmaterial specifications for some wrought circular products andare not applicable to castings. When such reference is made toa test coupon or test specimen, the following definitions apply:
7 Annual Book of ASTM Standards, Vol 14.02.8 Discontinued, see 2001Annual Book of ASTM Standards, Vol 03.01.9 Available from American Society of Mechanical Engineers, 345 E. 47th Street,
New York, NY 10017.
FIG. 1 The Relation of Test Coupons and Test Specimens toRolling Direction or Extension (Applicable to General Wrought
Products)
A 370 – 03a
2Perancangan dan pengembangan..., Yeny Pusvyta, FT UI, 2010.
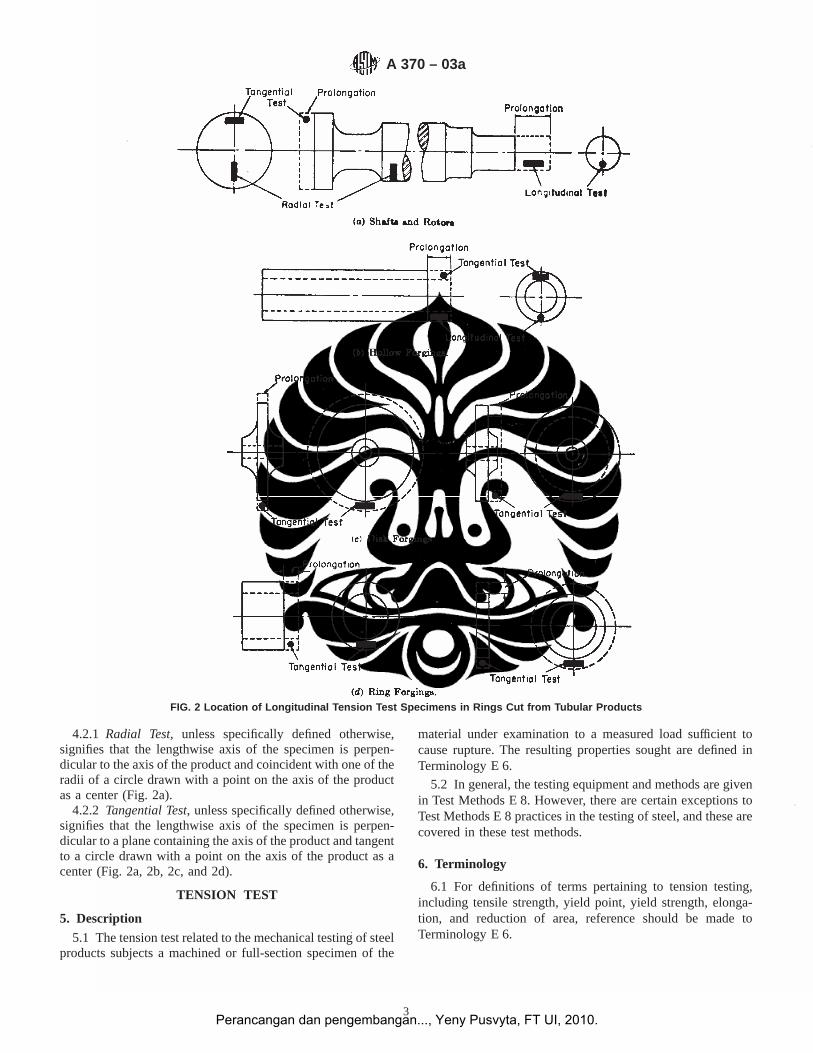
4.2.1 Radial Test, unless specifically defined otherwise,signifies that the lengthwise axis of the specimen is perpen-dicular to the axis of the product and coincident with one of theradii of a circle drawn with a point on the axis of the productas a center (Fig. 2a).
4.2.2 Tangential Test, unless specifically defined otherwise,signifies that the lengthwise axis of the specimen is perpen-dicular to a plane containing the axis of the product and tangentto a circle drawn with a point on the axis of the product as acenter (Fig. 2a, 2b, 2c, and 2d).
TENSION TEST
5. Description
5.1 The tension test related to the mechanical testing of steelproducts subjects a machined or full-section specimen of the
material under examination to a measured load sufficient tocause rupture. The resulting properties sought are defined inTerminology E 6.
5.2 In general, the testing equipment and methods are givenin Test Methods E 8. However, there are certain exceptions toTest Methods E 8 practices in the testing of steel, and these arecovered in these test methods.
6. Terminology
6.1 For definitions of terms pertaining to tension testing,including tensile strength, yield point, yield strength, elonga-tion, and reduction of area, reference should be made toTerminology E 6.
FIG. 2 Location of Longitudinal Tension Test Specimens in Rings Cut from Tubular Products
A 370 – 03a
3Perancangan dan pengembangan..., Yeny Pusvyta, FT UI, 2010.
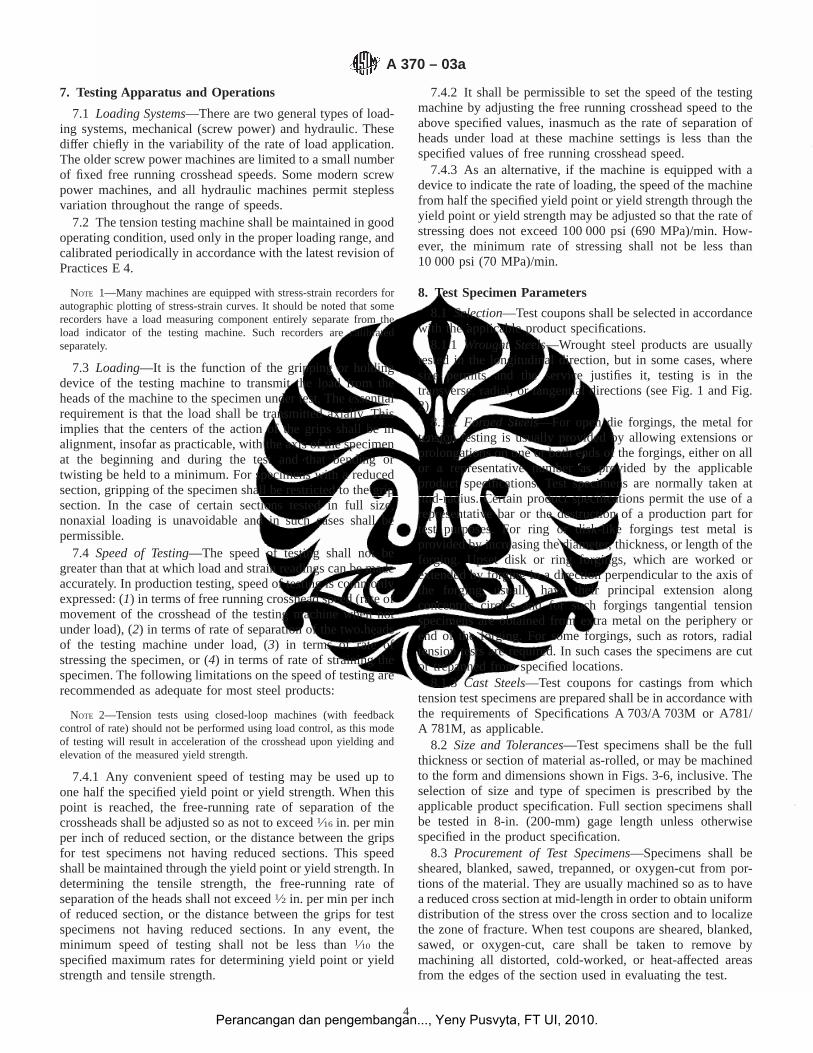
7. Testing Apparatus and Operations
7.1 Loading Systems—There are two general types of load-ing systems, mechanical (screw power) and hydraulic. Thesediffer chiefly in the variability of the rate of load application.The older screw power machines are limited to a small numberof fixed free running crosshead speeds. Some modern screwpower machines, and all hydraulic machines permit steplessvariation throughout the range of speeds.
7.2 The tension testing machine shall be maintained in goodoperating condition, used only in the proper loading range, andcalibrated periodically in accordance with the latest revision ofPractices E 4.
NOTE 1—Many machines are equipped with stress-strain recorders forautographic plotting of stress-strain curves. It should be noted that somerecorders have a load measuring component entirely separate from theload indicator of the testing machine. Such recorders are calibratedseparately.
7.3 Loading—It is the function of the gripping or holdingdevice of the testing machine to transmit the load from theheads of the machine to the specimen under test. The essentialrequirement is that the load shall be transmitted axially. Thisimplies that the centers of the action of the grips shall be inalignment, insofar as practicable, with the axis of the specimenat the beginning and during the test and that bending ortwisting be held to a minimum. For specimens with a reducedsection, gripping of the specimen shall be restricted to the gripsection. In the case of certain sections tested in full size,nonaxial loading is unavoidable and in such cases shall bepermissible.
7.4 Speed of Testing—The speed of testing shall not begreater than that at which load and strain readings can be madeaccurately. In production testing, speed of testing is commonlyexpressed: (1) in terms of free running crosshead speed (rate ofmovement of the crosshead of the testing machine when notunder load), (2) in terms of rate of separation of the two headsof the testing machine under load, (3) in terms of rate ofstressing the specimen, or (4) in terms of rate of straining thespecimen. The following limitations on the speed of testing arerecommended as adequate for most steel products:
NOTE 2—Tension tests using closed-loop machines (with feedbackcontrol of rate) should not be performed using load control, as this modeof testing will result in acceleration of the crosshead upon yielding andelevation of the measured yield strength.
7.4.1 Any convenient speed of testing may be used up toone half the specified yield point or yield strength. When thispoint is reached, the free-running rate of separation of thecrossheads shall be adjusted so as not to exceed1⁄16 in. per minper inch of reduced section, or the distance between the gripsfor test specimens not having reduced sections. This speedshall be maintained through the yield point or yield strength. Indetermining the tensile strength, the free-running rate ofseparation of the heads shall not exceed1⁄2 in. per min per inchof reduced section, or the distance between the grips for testspecimens not having reduced sections. In any event, theminimum speed of testing shall not be less than1⁄10 thespecified maximum rates for determining yield point or yieldstrength and tensile strength.
7.4.2 It shall be permissible to set the speed of the testingmachine by adjusting the free running crosshead speed to theabove specified values, inasmuch as the rate of separation ofheads under load at these machine settings is less than thespecified values of free running crosshead speed.
7.4.3 As an alternative, if the machine is equipped with adevice to indicate the rate of loading, the speed of the machinefrom half the specified yield point or yield strength through theyield point or yield strength may be adjusted so that the rate ofstressing does not exceed 100 000 psi (690 MPa)/min. How-ever, the minimum rate of stressing shall not be less than10 000 psi (70 MPa)/min.
8. Test Specimen Parameters
8.1 Selection—Test coupons shall be selected in accordancewith the applicable product specifications.
8.1.1 Wrought Steels—Wrought steel products are usuallytested in the longitudinal direction, but in some cases, wheresize permits and the service justifies it, testing is in thetransverse, radial, or tangential directions (see Fig. 1 and Fig.2).
8.1.2 Forged Steels—For open die forgings, the metal fortension testing is usually provided by allowing extensions orprolongations on one or both ends of the forgings, either on allor a representative number as provided by the applicableproduct specifications. Test specimens are normally taken atmid-radius. Certain product specifications permit the use of arepresentative bar or the destruction of a production part fortest purposes. For ring or disk-like forgings test metal isprovided by increasing the diameter, thickness, or length of theforging. Upset disk or ring forgings, which are worked orextended by forging in a direction perpendicular to the axis ofthe forging, usually have their principal extension alongconcentric circles and for such forgings tangential tensionspecimens are obtained from extra metal on the periphery orend of the forging. For some forgings, such as rotors, radialtension tests are required. In such cases the specimens are cutor trepanned from specified locations.
8.1.3 Cast Steels—Test coupons for castings from whichtension test specimens are prepared shall be in accordance withthe requirements of Specifications A 703/A 703M or A781/A 781M, as applicable.
8.2 Size and Tolerances—Test specimens shall be the fullthickness or section of material as-rolled, or may be machinedto the form and dimensions shown in Figs. 3-6, inclusive. Theselection of size and type of specimen is prescribed by theapplicable product specification. Full section specimens shallbe tested in 8-in. (200-mm) gage length unless otherwisespecified in the product specification.
8.3 Procurement of Test Specimens—Specimens shall besheared, blanked, sawed, trepanned, or oxygen-cut from por-tions of the material. They are usually machined so as to havea reduced cross section at mid-length in order to obtain uniformdistribution of the stress over the cross section and to localizethe zone of fracture. When test coupons are sheared, blanked,sawed, or oxygen-cut, care shall be taken to remove bymachining all distorted, cold-worked, or heat-affected areasfrom the edges of the section used in evaluating the test.
A 370 – 03a
4Perancangan dan pengembangan..., Yeny Pusvyta, FT UI, 2010.
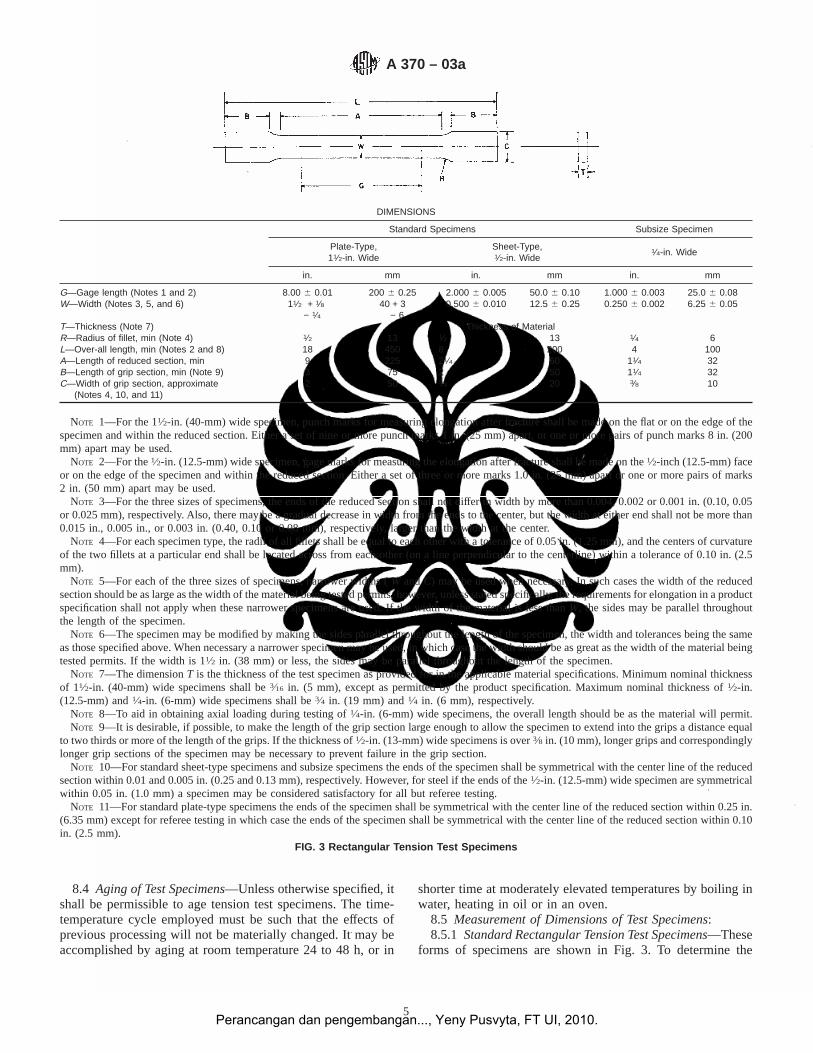
8.4 Aging of Test Specimens—Unless otherwise specified, itshall be permissible to age tension test specimens. The time-temperature cycle employed must be such that the effects ofprevious processing will not be materially changed. It may beaccomplished by aging at room temperature 24 to 48 h, or in
shorter time at moderately elevated temperatures by boiling inwater, heating in oil or in an oven.
8.5 Measurement of Dimensions of Test Specimens:8.5.1 Standard Rectangular Tension Test Specimens—These
forms of specimens are shown in Fig. 3. To determine the
DIMENSIONS
Standard Specimens Subsize Specimen
Plate-Type,11⁄2-in. Wide
Sheet-Type,1⁄2-in. Wide
1⁄4-in. Wide
in. mm in. mm in. mm
G—Gage length (Notes 1 and 2) 8.00 6 0.01 200 6 0.25 2.000 6 0.005 50.0 6 0.10 1.000 6 0.003 25.0 6 0.08W—Width (Notes 3, 5, and 6) 11⁄2 + 1⁄8
− 1⁄440 + 3
− 60.500 6 0.010 12.5 6 0.25 0.250 6 0.002 6.25 6 0.05
T—Thickness (Note 7) Thickness of MaterialR—Radius of fillet, min (Note 4) 1⁄2 13 1⁄2 13 1⁄4 6L—Over-all length, min (Notes 2 and 8) 18 450 8 200 4 100A—Length of reduced section, min 9 225 21⁄4 60 11⁄4 32B—Length of grip section, min (Note 9) 3 75 2 50 11⁄4 32C—Width of grip section, approximate
(Notes 4, 10, and 11)2 50 3⁄4 20 3⁄8 10
NOTE 1—For the 11⁄2-in. (40-mm) wide specimen, punch marks for measuring elongation after fracture shall be made on the flat or on the edge of thespecimen and within the reduced section. Either a set of nine or more punch marks 1 in. (25 mm) apart, or one or more pairs of punch marks 8 in. (200mm) apart may be used.
NOTE 2—For the1⁄2-in. (12.5-mm) wide specimen, gage marks for measuring the elongation after fracture shall be made on the1⁄2-inch (12.5-mm) faceor on the edge of the specimen and within the reduced section. Either a set of three or more marks 1.0 in. (25 mm) apart or one or more pairs of marks2 in. (50 mm) apart may be used.
NOTE 3—For the three sizes of specimens, the ends of the reduced section shall not differ in width by more than 0.004, 0.002 or 0.001 in. (0.10, 0.05or 0.025 mm), respectively. Also, there may be a gradual decrease in width from the ends to the center, but the width at either end shall not be more than0.015 in., 0.005 in., or 0.003 in. (0.40, 0.10 or 0.08 mm), respectively, larger than the width at the center.
NOTE 4—For each specimen type, the radii of all fillets shall be equal to each other with a tolerance of 0.05 in. (1.25 mm), and the centers of curvatureof the two fillets at a particular end shall be located across from each other (on a line perpendicular to the centerline) within a tolerance of 0.10 in. (2.5mm).
NOTE 5—For each of the three sizes of specimens, narrower widths (W andC) may be used when necessary. In such cases the width of the reducedsection should be as large as the width of the material being tested permits; however, unless stated specifically, the requirements for elongation in aproductspecification shall not apply when these narrower specimens are used. If the width of the material is less thanW, the sides may be parallel throughoutthe length of the specimen.
NOTE 6—The specimen may be modified by making the sides parallel throughout the length of the specimen, the width and tolerances being the sameas those specified above. When necessary a narrower specimen may be used, in which case the width should be as great as the width of the material beingtested permits. If the width is 11⁄2 in. (38 mm) or less, the sides may be parallel throughout the length of the specimen.
NOTE 7—The dimensionT is the thickness of the test specimen as provided for in the applicable material specifications. Minimum nominal thicknessof 11⁄2-in. (40-mm) wide specimens shall be3⁄16 in. (5 mm), except as permitted by the product specification. Maximum nominal thickness of1⁄2-in.(12.5-mm) and1⁄4-in. (6-mm) wide specimens shall be3⁄4 in. (19 mm) and1⁄4 in. (6 mm), respectively.
NOTE 8—To aid in obtaining axial loading during testing of1⁄4-in. (6-mm) wide specimens, the overall length should be as the material will permit.NOTE 9—It is desirable, if possible, to make the length of the grip section large enough to allow the specimen to extend into the grips a distance equal
to two thirds or more of the length of the grips. If the thickness of1⁄2-in. (13-mm) wide specimens is over3⁄8 in. (10 mm), longer grips and correspondinglylonger grip sections of the specimen may be necessary to prevent failure in the grip section.
NOTE 10—For standard sheet-type specimens and subsize specimens the ends of the specimen shall be symmetrical with the center line of the reducedsection within 0.01 and 0.005 in. (0.25 and 0.13 mm), respectively. However, for steel if the ends of the1⁄2-in. (12.5-mm) wide specimen are symmetricalwithin 0.05 in. (1.0 mm) a specimen may be considered satisfactory for all but referee testing.
NOTE 11—For standard plate-type specimens the ends of the specimen shall be symmetrical with the center line of the reduced section within 0.25 in.(6.35 mm) except for referee testing in which case the ends of the specimen shall be symmetrical with the center line of the reduced section within 0.10in. (2.5 mm).
FIG. 3 Rectangular Tension Test Specimens
A 370 – 03a
5Perancangan dan pengembangan..., Yeny Pusvyta, FT UI, 2010.
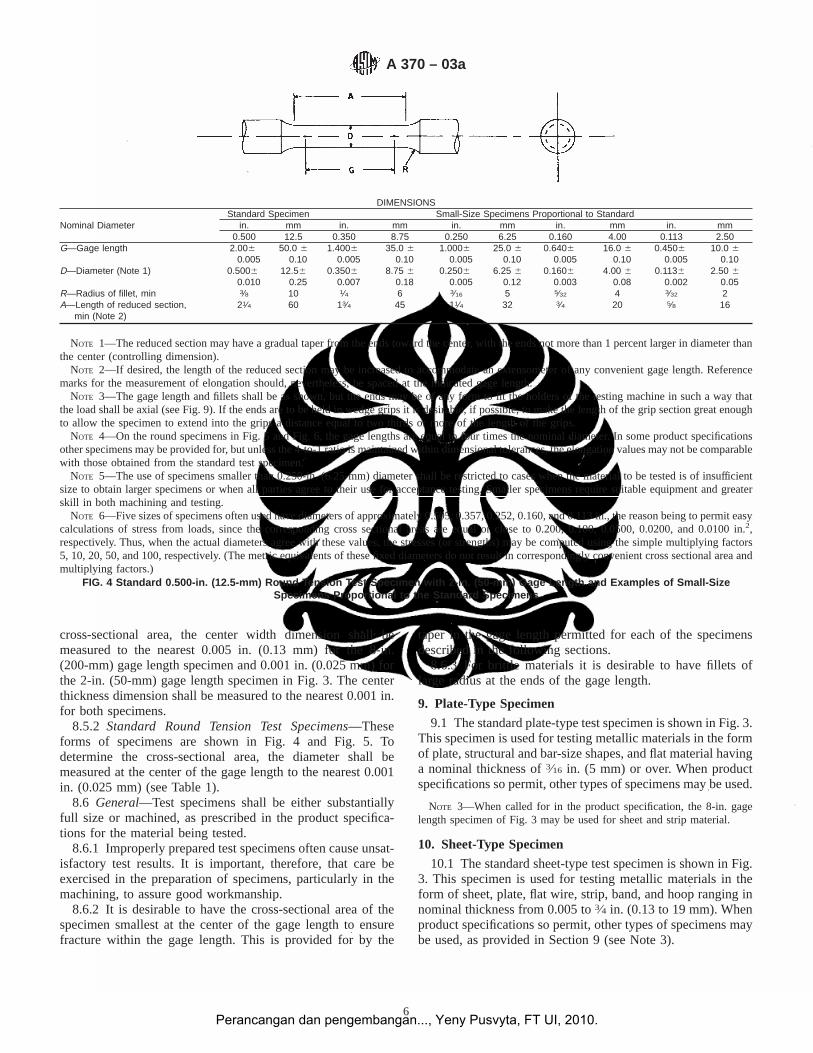
cross-sectional area, the center width dimension shall bemeasured to the nearest 0.005 in. (0.13 mm) for the 8-in.(200-mm) gage length specimen and 0.001 in. (0.025 mm) forthe 2-in. (50-mm) gage length specimen in Fig. 3. The centerthickness dimension shall be measured to the nearest 0.001 in.for both specimens.
8.5.2 Standard Round Tension Test Specimens—Theseforms of specimens are shown in Fig. 4 and Fig. 5. Todetermine the cross-sectional area, the diameter shall bemeasured at the center of the gage length to the nearest 0.001in. (0.025 mm) (see Table 1).
8.6 General—Test specimens shall be either substantiallyfull size or machined, as prescribed in the product specifica-tions for the material being tested.
8.6.1 Improperly prepared test specimens often cause unsat-isfactory test results. It is important, therefore, that care beexercised in the preparation of specimens, particularly in themachining, to assure good workmanship.
8.6.2 It is desirable to have the cross-sectional area of thespecimen smallest at the center of the gage length to ensurefracture within the gage length. This is provided for by the
taper in the gage length permitted for each of the specimensdescribed in the following sections.
8.6.3 For brittle materials it is desirable to have fillets oflarge radius at the ends of the gage length.
9. Plate-Type Specimen
9.1 The standard plate-type test specimen is shown in Fig. 3.This specimen is used for testing metallic materials in the formof plate, structural and bar-size shapes, and flat material havinga nominal thickness of3⁄16 in. (5 mm) or over. When productspecifications so permit, other types of specimens may be used.
NOTE 3—When called for in the product specification, the 8-in. gagelength specimen of Fig. 3 may be used for sheet and strip material.
10. Sheet-Type Specimen
10.1 The standard sheet-type test specimen is shown in Fig.3. This specimen is used for testing metallic materials in theform of sheet, plate, flat wire, strip, band, and hoop ranging innominal thickness from 0.005 to3⁄4 in. (0.13 to 19 mm). Whenproduct specifications so permit, other types of specimens maybe used, as provided in Section 9 (see Note 3).
DIMENSIONS
Nominal DiameterStandard Specimen Small-Size Specimens Proportional to Standard
in. mm in. mm in. mm in. mm in. mm0.500 12.5 0.350 8.75 0.250 6.25 0.160 4.00 0.113 2.50
G—Gage length 2.0060.005
50.0 60.10
1.40060.005
35.0 60.10
1.00060.005
25.0 60.10
0.64060.005
16.0 60.10
0.45060.005
10.0 60.10
D—Diameter (Note 1) 0.50060.010
12.560.25
0.35060.007
8.75 60.18
0.25060.005
6.25 60.12
0.16060.003
4.00 60.08
0.11360.002
2.50 60.05
R—Radius of fillet, min 3⁄8 10 1⁄4 6 3⁄16 5 5⁄32 4 3⁄32 2A—Length of reduced section,
min (Note 2)21⁄4 60 13⁄4 45 11⁄4 32 3⁄4 20 5⁄8 16
NOTE 1—The reduced section may have a gradual taper from the ends toward the center, with the ends not more than 1 percent larger in diameter thanthe center (controlling dimension).
NOTE 2—If desired, the length of the reduced section may be increased to accommodate an extensometer of any convenient gage length. Referencemarks for the measurement of elongation should, nevertheless, be spaced at the indicated gage length.
NOTE 3—The gage length and fillets shall be as shown, but the ends may be of any form to fit the holders of the testing machine in such a way thatthe load shall be axial (see Fig. 9). If the ends are to be held in wedge grips it is desirable, if possible, to make the length of the grip section great enoughto allow the specimen to extend into the grips a distance equal to two thirds or more of the length of the grips.
NOTE 4—On the round specimens in Fig. 5 and Fig. 6, the gage lengths are equal to four times the nominal diameter. In some product specificationsother specimens may be provided for, but unless the 4-to-1 ratio is maintained within dimensional tolerances, the elongation values may not be comparablewith those obtained from the standard test specimen.
NOTE 5—The use of specimens smaller than 0.250-in. (6.25-mm) diameter shall be restricted to cases when the material to be tested is of insufficientsize to obtain larger specimens or when all parties agree to their use for acceptance testing. Smaller specimens require suitable equipment and greaterskill in both machining and testing.
NOTE 6—Five sizes of specimens often used have diameters of approximately 0.505, 0.357, 0.252, 0.160, and 0.113 in., the reason being to permit easycalculations of stress from loads, since the corresponding cross sectional areas are equal or close to 0.200, 0.100, 0.0500, 0.0200, and 0.0100 in.2,respectively. Thus, when the actual diameters agree with these values, the stresses (or strengths) may be computed using the simple multiplying factors5, 10, 20, 50, and 100, respectively. (The metric equivalents of these fixed diameters do not result in correspondingly convenient cross sectional area andmultiplying factors.)
FIG. 4 Standard 0.500-in. (12.5-mm) Round Tension Test Specimen with 2-in. (50-mm) Gage Length and Examples of Small-SizeSpecimens Proportional to the Standard Specimens
A 370 – 03a
6Perancangan dan pengembangan..., Yeny Pusvyta, FT UI, 2010.
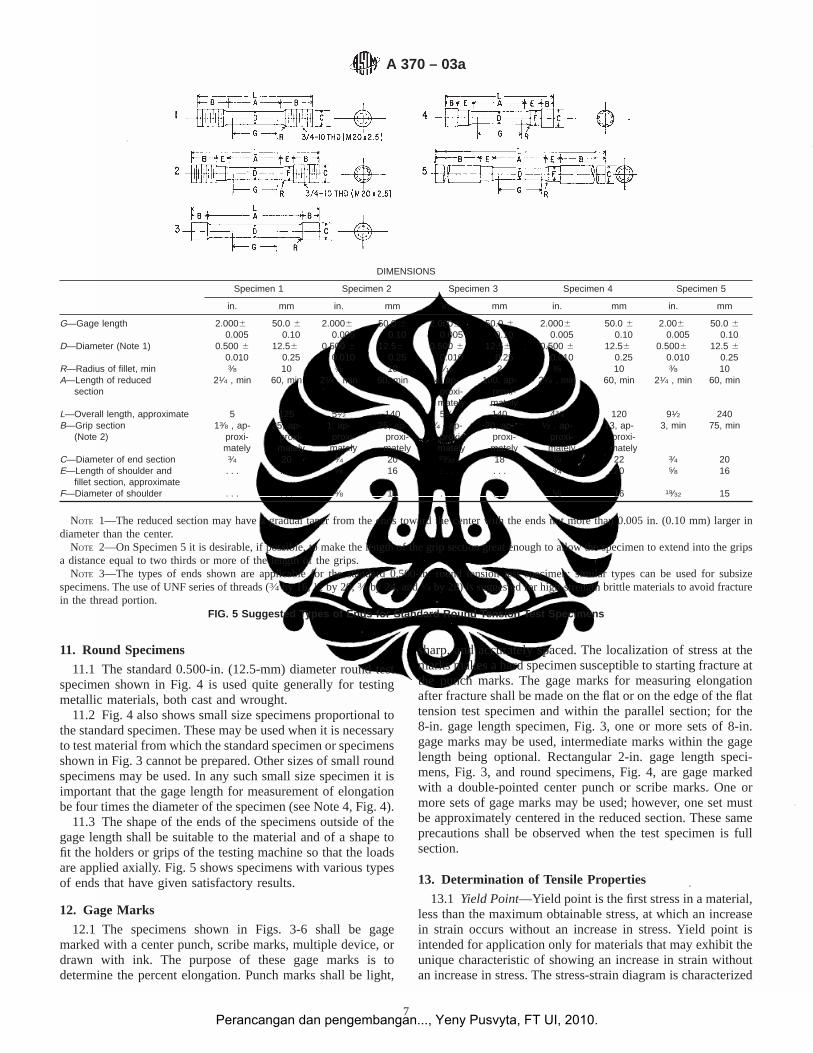
11. Round Specimens
11.1 The standard 0.500-in. (12.5-mm) diameter round testspecimen shown in Fig. 4 is used quite generally for testingmetallic materials, both cast and wrought.
11.2 Fig. 4 also shows small size specimens proportional tothe standard specimen. These may be used when it is necessaryto test material from which the standard specimen or specimensshown in Fig. 3 cannot be prepared. Other sizes of small roundspecimens may be used. In any such small size specimen it isimportant that the gage length for measurement of elongationbe four times the diameter of the specimen (see Note 4, Fig. 4).
11.3 The shape of the ends of the specimens outside of thegage length shall be suitable to the material and of a shape tofit the holders or grips of the testing machine so that the loadsare applied axially. Fig. 5 shows specimens with various typesof ends that have given satisfactory results.
12. Gage Marks
12.1 The specimens shown in Figs. 3-6 shall be gagemarked with a center punch, scribe marks, multiple device, ordrawn with ink. The purpose of these gage marks is todetermine the percent elongation. Punch marks shall be light,
sharp, and accurately spaced. The localization of stress at themarks makes a hard specimen susceptible to starting fracture atthe punch marks. The gage marks for measuring elongationafter fracture shall be made on the flat or on the edge of the flattension test specimen and within the parallel section; for the8-in. gage length specimen, Fig. 3, one or more sets of 8-in.gage marks may be used, intermediate marks within the gagelength being optional. Rectangular 2-in. gage length speci-mens, Fig. 3, and round specimens, Fig. 4, are gage markedwith a double-pointed center punch or scribe marks. One ormore sets of gage marks may be used; however, one set mustbe approximately centered in the reduced section. These sameprecautions shall be observed when the test specimen is fullsection.
13. Determination of Tensile Properties
13.1 Yield Point—Yield point is the first stress in a material,less than the maximum obtainable stress, at which an increasein strain occurs without an increase in stress. Yield point isintended for application only for materials that may exhibit theunique characteristic of showing an increase in strain withoutan increase in stress. The stress-strain diagram is characterized
DIMENSIONS
Specimen 1 Specimen 2 Specimen 3 Specimen 4 Specimen 5
in. mm in. mm in. mm in. mm in. mm
G—Gage length 2.00060.005
50.0 60.10
2.00060.005
50.0 60.10
2.00060.005
50.0 60.10
2.00060.005
50.0 60.10
2.0060.005
50.0 60.10
D—Diameter (Note 1) 0.500 60.010
12.560.25
0.500 60.010
12.560.25
0.500 60.010
12.560.25
0.500 60.010
12.560.25
0.50060.010
12.5 60.25
R—Radius of fillet, min 3⁄8 10 3⁄8 10 1⁄16 2 3⁄8 10 3⁄8 10A—Length of reduced
section21⁄4 , min 60, min 21⁄4 , min 60, min 4, ap-
proxi-mately
100, ap-proxi-mately
21⁄4 , min 60, min 21⁄4 , min 60, min
L—Overall length, approximate 5 125 51⁄2 140 51⁄2 140 43⁄4 120 91⁄2 240B—Grip section
(Note 2)13⁄8 , ap-
proxi-mately
35, ap-proxi-mately
1, ap-proxi-mately
25, ap-proxi-mately
3⁄4 , ap-proxi-mately
20, ap-proxi-mately
1⁄2 , ap-proxi-mately
13, ap-proxi-mately
3, min 75, min
C—Diameter of end section 3⁄4 20 3⁄4 20 23⁄32 18 7⁄8 22 3⁄4 20E—Length of shoulder and
fillet section, approximate. . . . . . 5⁄8 16 . . . . . . 3⁄4 20 5⁄8 16
F—Diameter of shoulder . . . . . . 5⁄8 16 . . . . . . 5⁄8 16 19⁄32 15
NOTE 1—The reduced section may have a gradual taper from the ends toward the center with the ends not more than 0.005 in. (0.10 mm) larger indiameter than the center.
NOTE 2—On Specimen 5 it is desirable, if possible, to make the length of the grip section great enough to allow the specimen to extend into the gripsa distance equal to two thirds or more of the length of the grips.
NOTE 3—The types of ends shown are applicable for the standard 0.500-in. round tension test specimen; similar types can be used for subsizespecimens. The use of UNF series of threads (3⁄4 by 16,1⁄2 by 20,3⁄8 by 24, and1⁄4 by 28) is suggested for high-strength brittle materials to avoid fracturein the thread portion.
FIG. 5 Suggested Types of Ends for Standard Round Tension Test Specimens
A 370 – 03a
7Perancangan dan pengembangan..., Yeny Pusvyta, FT UI, 2010.
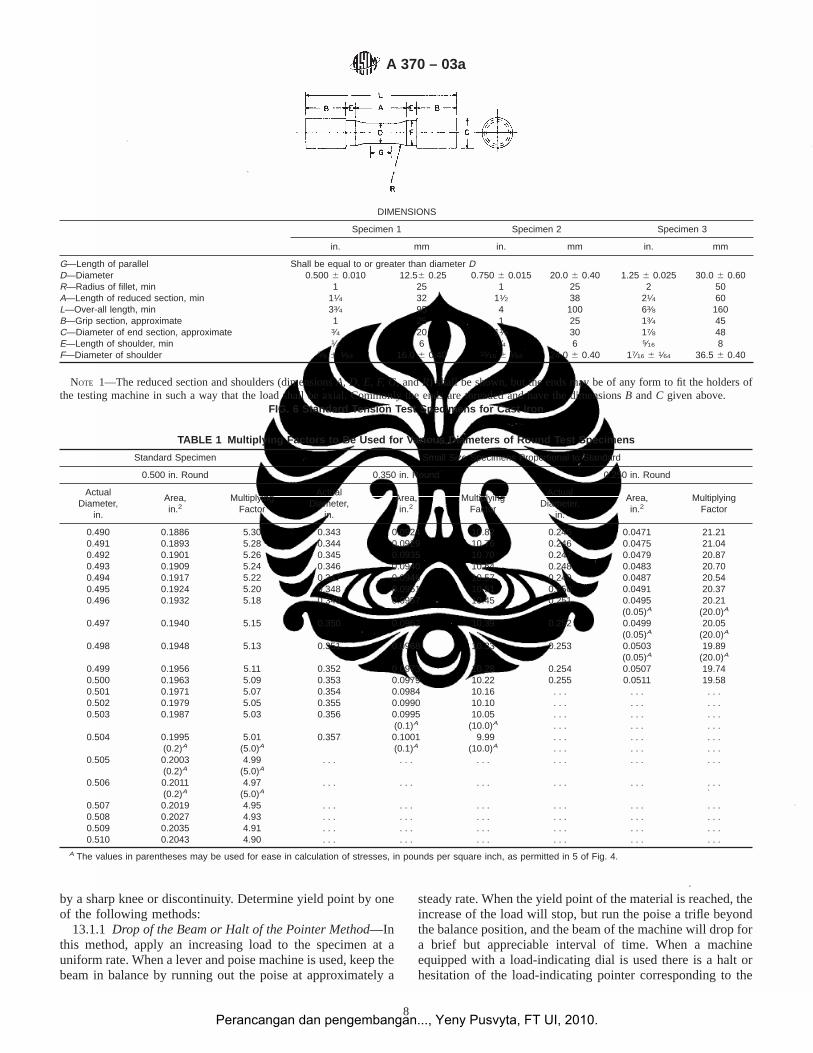
by a sharp knee or discontinuity. Determine yield point by oneof the following methods:
13.1.1 Drop of the Beam or Halt of the Pointer Method—Inthis method, apply an increasing load to the specimen at auniform rate. When a lever and poise machine is used, keep thebeam in balance by running out the poise at approximately a
steady rate. When the yield point of the material is reached, theincrease of the load will stop, but run the poise a trifle beyondthe balance position, and the beam of the machine will drop fora brief but appreciable interval of time. When a machineequipped with a load-indicating dial is used there is a halt orhesitation of the load-indicating pointer corresponding to the
DIMENSIONS
Specimen 1 Specimen 2 Specimen 3
in. mm in. mm in. mm
G—Length of parallel Shall be equal to or greater than diameter DD—Diameter 0.500 6 0.010 12.56 0.25 0.750 6 0.015 20.0 6 0.40 1.25 6 0.025 30.0 6 0.60R—Radius of fillet, min 1 25 1 25 2 50A—Length of reduced section, min 11⁄4 32 11⁄2 38 21⁄4 60L—Over-all length, min 33⁄4 95 4 100 63⁄8 160B—Grip section, approximate 1 25 1 25 13⁄4 45C—Diameter of end section, approximate 3⁄4 20 11⁄8 30 17⁄8 48E—Length of shoulder, min 1⁄4 6 1⁄4 6 5⁄16 8F—Diameter of shoulder 5⁄8 6 1⁄64 16.0 6 0.40 15⁄16 6 1⁄64 24.0 6 0.40 17⁄16 6 1⁄64 36.5 6 0.40
NOTE 1—The reduced section and shoulders (dimensionsA, D, E, F, G,andR) shall be shown, but the ends may be of any form to fit the holders ofthe testing machine in such a way that the load shall be axial. Commonly the ends are threaded and have the dimensionsB andC given above.
FIG. 6 Standard Tension Test Specimens for Cast Iron
TABLE 1 Multiplying Factors to Be Used for Various Diameters of Round Test Specimens
Standard Specimen Small Size Specimens Proportional to Standard
0.500 in. Round 0.350 in. Round 0.250 in. Round
ActualDiameter,
in.
Area,in.2
MultiplyingFactor
ActualDiameter,
in.
Area,in.2
MultiplyingFactor
ActualDiameter,
in.
Area,in.2
MultiplyingFactor
0.490 0.1886 5.30 0.343 0.0924 10.82 0.245 0.0471 21.210.491 0.1893 5.28 0.344 0.0929 10.76 0.246 0.0475 21.040.492 0.1901 5.26 0.345 0.0935 10.70 0.247 0.0479 20.870.493 0.1909 5.24 0.346 0.0940 10.64 0.248 0.0483 20.700.494 0.1917 5.22 0.347 0.0946 10.57 0.249 0.0487 20.540.495 0.1924 5.20 0.348 0.0951 10.51 0.250 0.0491 20.370.496 0.1932 5.18 0.349 0.0957 10.45 0.251 0.0495 20.21
(0.05)A (20.0)A
0.497 0.1940 5.15 0.350 0.0962 10.39 0.252 0.0499 20.05(0.05)A (20.0)A
0.498 0.1948 5.13 0.351 0.0968 10.33 0.253 0.0503 19.89(0.05)A (20.0)A
0.499 0.1956 5.11 0.352 0.0973 10.28 0.254 0.0507 19.740.500 0.1963 5.09 0.353 0.0979 10.22 0.255 0.0511 19.580.501 0.1971 5.07 0.354 0.0984 10.16 . . . . . . . . .0.502 0.1979 5.05 0.355 0.0990 10.10 . . . . . . . . .0.503 0.1987 5.03 0.356 0.0995 10.05 . . . . . . . . .
(0.1)A (10.0)A . . . . . . . . .0.504 0.1995 5.01 0.357 0.1001 9.99 . . . . . . . . .
(0.2)A (5.0)A (0.1)A (10.0)A . . . . . . . . .0.505 0.2003 4.99 . . . . . . . . . . . . . . . . . .
(0.2)A (5.0)A
0.506 0.2011 4.97 . . . . . . . . . . . . . . . . . .(0.2)A (5.0)A
0.507 0.2019 4.95 . . . . . . . . . . . . . . . . . .0.508 0.2027 4.93 . . . . . . . . . . . . . . . . . .0.509 0.2035 4.91 . . . . . . . . . . . . . . . . . .0.510 0.2043 4.90 . . . . . . . . . . . . . . . . . .
A The values in parentheses may be used for ease in calculation of stresses, in pounds per square inch, as permitted in 5 of Fig. 4.
A 370 – 03a
8Perancangan dan pengembangan..., Yeny Pusvyta, FT UI, 2010.
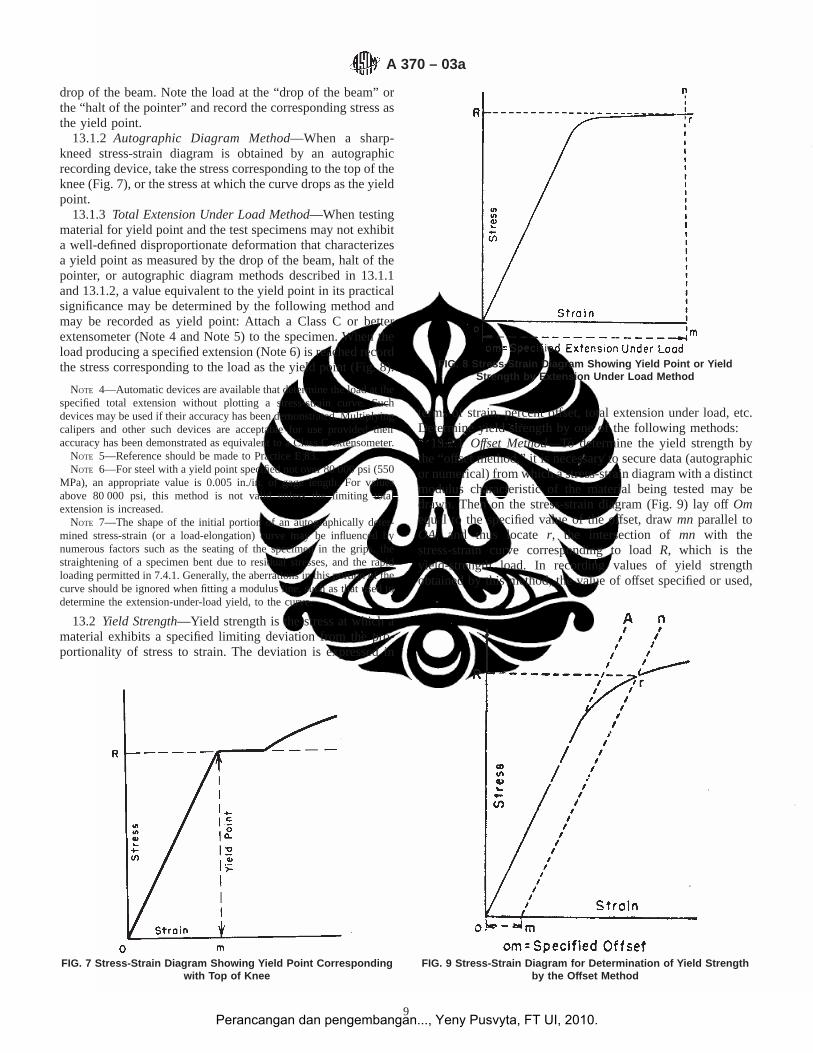
drop of the beam. Note the load at the “drop of the beam” orthe “halt of the pointer” and record the corresponding stress asthe yield point.
13.1.2 Autographic Diagram Method—When a sharp-kneed stress-strain diagram is obtained by an autographicrecording device, take the stress corresponding to the top of theknee (Fig. 7), or the stress at which the curve drops as the yieldpoint.
13.1.3 Total Extension Under Load Method—When testingmaterial for yield point and the test specimens may not exhibita well-defined disproportionate deformation that characterizesa yield point as measured by the drop of the beam, halt of thepointer, or autographic diagram methods described in 13.1.1and 13.1.2, a value equivalent to the yield point in its practicalsignificance may be determined by the following method andmay be recorded as yield point: Attach a Class C or betterextensometer (Note 4 and Note 5) to the specimen. When theload producing a specified extension (Note 6) is reached recordthe stress corresponding to the load as the yield point (Fig. 8).
NOTE 4—Automatic devices are available that determine the load at thespecified total extension without plotting a stress-strain curve. Suchdevices may be used if their accuracy has been demonstrated. Multiplyingcalipers and other such devices are acceptable for use provided theiraccuracy has been demonstrated as equivalent to a Class C extensometer.
NOTE 5—Reference should be made to Practice E 83.NOTE 6—For steel with a yield point specified not over 80 000 psi (550
MPa), an appropriate value is 0.005 in./in. of gage length. For valuesabove 80 000 psi, this method is not valid unless the limiting totalextension is increased.
NOTE 7—The shape of the initial portion of an autographically deter-mined stress-strain (or a load-elongation) curve may be influenced bynumerous factors such as the seating of the specimen in the grips, thestraightening of a specimen bent due to residual stresses, and the rapidloading permitted in 7.4.1. Generally, the aberrations in this portion of thecurve should be ignored when fitting a modulus line, such as that used todetermine the extension-under-load yield, to the curve.
13.2 Yield Strength—Yield strength is the stress at which amaterial exhibits a specified limiting deviation from the pro-portionality of stress to strain. The deviation is expressed in
terms of strain, percent offset, total extension under load, etc.Determine yield strength by one of the following methods:
13.2.1 Offset Method—To determine the yield strength bythe “offset method,” it is necessary to secure data (autographicor numerical) from which a stress-strain diagram with a distinctmodulus characteristic of the material being tested may bedrawn. Then on the stress-strain diagram (Fig. 9) lay offOmequal to the specified value of the offset, drawmn parallel toOA, and thus locater, the intersection ofmn with thestress-strain curve corresponding to loadR, which is theyield-strength load. In recording values of yield strengthobtained by this method, the value of offset specified or used,
FIG. 7 Stress-Strain Diagram Showing Yield Point Correspondingwith Top of Knee
FIG. 8 Stress-Strain Diagram Showing Yield Point or YieldStrength by Extension Under Load Method
FIG. 9 Stress-Strain Diagram for Determination of Yield Strengthby the Offset Method
A 370 – 03a
9Perancangan dan pengembangan..., Yeny Pusvyta, FT UI, 2010.
or both, shall be stated in parentheses after the term yieldstrength, for example:
Yield strength~0.2 % offset! 5 52 000 psi~360 MPa! (1)
When the offset is 0.2 % or larger, the extensometer usedshall qualify as a Class B2 device over a strain range of 0.05 to1.0 %. If a smaller offset is specified, it may be necessary tospecify a more accurate device (that is, a Class B1 device) orreduce the lower limit of the strain range (for example, to0.01 %) or both. See also Note 9 for automatic devices.
NOTE 8—For stress-strain diagrams not containing a distinct modulus,such as for some cold-worked materials, it is recommended that theextension under load method be utilized. If the offset method is used formaterials without a distinct modulus, a modulus value appropriate for thematerial being tested should be used: 30 000 000 psi (207 000 MPa) forcarbon steel; 29 000 000 psi (200 000 MPa) for ferritic stainless steel;28 000 000 psi (193 000 MPa) for austenitic stainless steel. For specialalloys, the producer should be contacted to discuss appropriate modulusvalues.
13.2.2 Extension Under Load Method—For tests to deter-mine the acceptance or rejection of material whose stress-straincharacteristics are well known from previous tests of similarmaterial in which stress-strain diagrams were plotted, the totalstrain corresponding to the stress at which the specified offset(see Note 9 and Note 10) occurs will be known withinsatisfactory limits. The stress on the specimen, when this totalstrain is reached, is the value of the yield strength. In recordingvalues of yield strength obtained by this method, the value of“extension” specified or used, or both, shall be stated inparentheses after the term yield strength, for example:
Yield strength~0.5 % EUL! 5 52 000 psi~360 MPa! (2)
The total strain can be obtained satisfactorily by use of aClass B1 extensometer (Note 4, Note 5, and Note 7).
NOTE 9—Automatic devices are available that determine offset yieldstrength without plotting a stress-strain curve. Such devices may be usedif their accuracy has been demonstrated.
NOTE 10—The appropriate magnitude of the extension under load willobviously vary with the strength range of the particular steel under test. Ingeneral, the value of extension under load applicable to steel at anystrength level may be determined from the sum of the proportional strainand the plastic strain expected at the specified yield strength. Thefollowing equation is used:
Extension under load, in./in. of gage length5 ~YS/E! 1 r (3)
where:YS = specified yield strength, psi or MPa,E = modulus of elasticity, psi or MPa, andr = limiting plastic strain, in./in.
13.3 Tensile Strength— Calculate the tensile strength bydividing the maximum load the specimen sustains during atension test by the original cross-sectional area of the speci-men.
13.4 Elongation:13.4.1 Fit the ends of the fractured specimen together
carefully and measure the distance between the gage marks tothe nearest 0.01 in. (0.25 mm) for gage lengths of 2 in. andunder, and to the nearest 0.5 % of the gage length for gagelengths over 2 in. A percentage scale reading to 0.5 % of thegage length may be used. The elongation is the increase in
length of the gage length, expressed as a percentage of theoriginal gage length. In recording elongation values, give boththe percentage increase and the original gage length.
13.4.2 If any part of the fracture takes place outside of themiddle half of the gage length or in a punched or scribed markwithin the reduced section, the elongation value obtained maynot be representative of the material. If the elongation someasured meets the minimum requirements specified, nofurther testing is indicated, but if the elongation is less than theminimum requirements, discard the test and retest.
13.4.3 Automated tensile testing methods using extensom-eters allow for the measurement of elongation in a methoddescribed below. Elongation may be measured and reportedeither this way, or as in the method described above, fitting thebroken ends together. Either result is valid.
13.4.4 Elongation at fracture is defined as the elongationmeasured just prior to the sudden decrease in force associatedwith fracture. For many ductile materials not exhibiting asudden decrease in force, the elongation at fracture can betaken as the strain measured just prior to when the force fallsbelow 10 % of the maximum force encountered during the test.
13.4.4.1 Elongation at fracture shall include elastic andplastic elongation and may be determined with autographic orautomated methods using extensometers verified over thestrain range of interest. Use a class B2 or better extensometerfor materials having less than 5 % elongation; a class C orbetter extensometer for materials having elongation greaterthan or equal to 5 % but less than 50 %; and a class D or betterextensometer for materials having 50 % or greater elongation.In all cases, the extensometer gage length shall be the nominalgage length required for the specimen being tested. Due to thelack of precision in fitting fractured ends together, the elonga-tion after fracture using the manual methods of the precedingparagraphs may differ from the elongation at fracture deter-mined with extensometers.
13.4.4.2 Percent elongation at fracture may be calculateddirectly from elongation at fracture data and be reportedinstead of percent elongation as calculated in 13.4.1. However,these two parameters are not interchangeable. Use of theelongation at fracture method generally provides more repeat-able results.
13.5 Reduction of Area—Fit the ends of the fracturedspecimen together and measure the mean diameter or the widthand thickness at the smallest cross section to the same accuracyas the original dimensions. The difference between the areathus found and the area of the original cross section expressedas a percentage of the original area is the reduction of area.
BEND TEST
14. Description
14.1 The bend test is one method for evaluating ductility,but it cannot be considered as a quantitative means of predict-ing service performance in bending operations. The severity ofthe bend test is primarily a function of the angle of bend andinside diameter to which the specimen is bent, and of the crosssection of the specimen. These conditions are varied accordingto location and orientation of the test specimen and thechemical composition, tensile properties, hardness, type, and
A 370 – 03a
10Perancangan dan pengembangan..., Yeny Pusvyta, FT UI, 2010.

quality of the steel specified. Method E 190 and Test MethodE 290 may be consulted for methods of performing the test.
14.2 Unless otherwise specified, it shall be permissible toage bend test specimens. The time-temperature cycle employedmust be such that the effects of previous processing will not bematerially changed. It may be accomplished by aging at roomtemperature 24 to 48 h, or in shorter time at moderatelyelevated temperatures by boiling in water or by heating in oilor in an oven.
14.3 Bend the test specimen at room temperature to aninside diameter, as designated by the applicable productspecifications, to the extent specified without major crackingon the outside of the bent portion. The speed of bending isordinarily not an important factor.
HARDNESS TEST
15. General
15.1 A hardness test is a means of determining resistance topenetration and is occasionally employed to obtain a quickapproximation of tensile strength. Table 2, Table 3, Table 4,and Table 5 are for the conversion of hardness measurementsfrom one scale to another or to approximate tensile strength.These conversion values have been obtained from computer-generated curves and are presented to the nearest 0.1 point topermit accurate reproduction of those curves. Since all con-verted hardness values must be considered approximate, how-ever, all converted Rockwell hardness numbers shall berounded to the nearest whole number.
15.2 Hardness Testing:15.2.1 If the product specification permits alternative hard-
ness testing to determine conformance to a specified hardnessrequirement, the conversions listed in Table 2, Table 3, Table 4,and Table 5 shall be used.
15.2.2 When recording converted hardness numbers, themeasured hardness and test scale shall be indicated in paren-theses, for example: 353 HB (38 HRC). This means that ahardness value of 38 was obtained using the Rockwell C scaleand converted to a Brinell hardness of 353.
16. Brinell Test
16.1 Description:16.1.1 A specified load is applied to a flat surface of the
specimen to be tested, through a hard ball of specified diameter.The average diameter of the indentation is used as a basis forcalculation of the Brinell hardness number. The quotient of theapplied load divided by the area of the surface of theindentation, which is assumed to be spherical, is termed theBrinell hardness number (HB) in accordance with the follow-ing equation:
HB 5 P/[~pD/2!~D 2 =D 2 2 d2!# (4)
where:HB = Brinell hardness number,P = applied load, kgf,D = diameter of the steel ball, mm, andd = average diameter of the indentation, mm.
NOTE 11—The Brinell hardness number is more conveniently secured
from standard tables such as Table 6, which show numbers correspondingto the various indentation diameters, usually in increments of 0.05 mm.
NOTE 12—In Test Method E 10 the values are stated in SI units,whereas in this section kg/m units are used.
16.1.2 The standard Brinell test using a 10-mm ball em-ploys a 3000-kgf load for hard materials and a 1500 or 500-kgfload for thin sections or soft materials (see Annex on SteelTubular Products). Other loads and different size indentors maybe used when specified. In recording hardness values, thediameter of the ball and the load must be stated except when a10-mm ball and 3000-kgf load are used.
16.1.3 A range of hardness can properly be specified onlyfor quenched and tempered or normalized and temperedmaterial. For annealed material a maximum figure only shouldbe specified. For normalized material a minimum or a maxi-mum hardness may be specified by agreement. In general, nohardness requirements should be applied to untreated material.
16.1.4 Brinell hardness may be required when tensile prop-erties are not specified.
16.2 Apparatus—Equipment shall meet the following re-quirements:
16.2.1 Testing Machine— A Brinell hardness testing ma-chine is acceptable for use over a loading range within whichits load measuring device is accurate to61 %.
16.2.2 Measuring Microscope—The divisions of the mi-crometer scale of the microscope or other measuring devicesused for the measurement of the diameter of the indentationsshall be such as to permit the direct measurement of thediameter to 0.1 mm and the estimation of the diameter to 0.05mm.
NOTE 13—This requirement applies to the construction of the micro-scope only and is not a requirement for measurement of the indentation,see 16.4.3.
16.2.3 Standard Ball— The standard ball for Brinell hard-ness testing is 10 mm (0.3937 in.) in diameter with a deviationfrom this value of not more than 0.005 mm (0.0004 in.) in anydiameter. A ball suitable for use must not show a permanentchange in diameter greater than 0.01 mm (0.0004 in.) whenpressed with a force of 3000 kgf against the test specimen.
16.3 Test Specimen—Brinell hardness tests are made onprepared areas and sufficient metal must be removed from thesurface to eliminate decarburized metal and other surfaceirregularities. The thickness of the piece tested must be suchthat no bulge or other marking showing the effect of the loadappears on the side of the piece opposite the indentation.
16.4 Procedure:
16.4.1 It is essential that the applicable product specifica-tions state clearly the position at which Brinell hardnessindentations are to be made and the number of such indenta-tions required. The distance of the center of the indentationfrom the edge of the specimen or edge of another indentationmust be at least two and one-half times the diameter of theindentation.
16.4.2 Apply the load for a minimum of 15 s.
A 370 – 03a
11Perancangan dan pengembangan..., Yeny Pusvyta, FT UI, 2010.
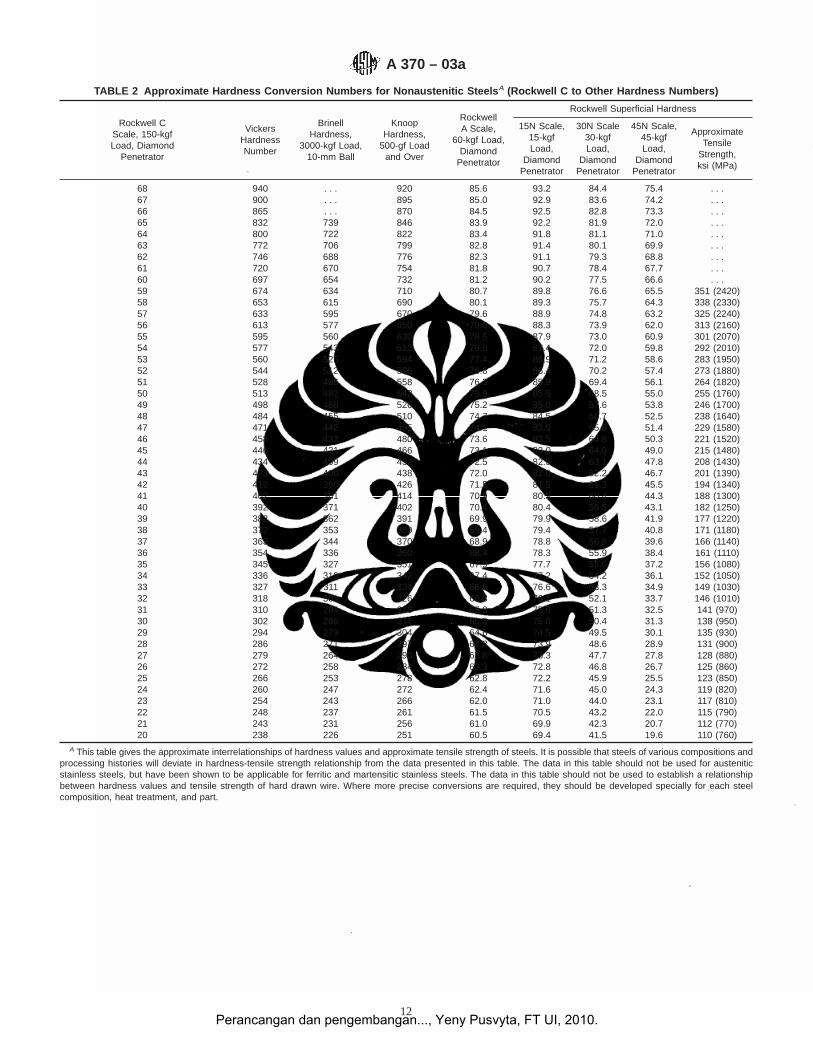
TABLE 2 Approximate Hardness Conversion Numbers for Nonaustenitic Steels A (Rockwell C to Other Hardness Numbers)
Rockwell CScale, 150-kgfLoad, Diamond
Penetrator
VickersHardnessNumber
BrinellHardness,
3000-kgf Load,10-mm Ball
KnoopHardness,
500-gf Loadand Over
RockwellA Scale,
60-kgf Load,Diamond
Penetrator
Rockwell Superficial Hardness
15N Scale,15-kgfLoad,
DiamondPenetrator
30N Scale30-kgfLoad,
DiamondPenetrator
45N Scale,45-kgfLoad,
DiamondPenetrator
ApproximateTensile
Strength,ksi (MPa)
68 940 . . . 920 85.6 93.2 84.4 75.4 . . .67 900 . . . 895 85.0 92.9 83.6 74.2 . . .66 865 . . . 870 84.5 92.5 82.8 73.3 . . .65 832 739 846 83.9 92.2 81.9 72.0 . . .64 800 722 822 83.4 91.8 81.1 71.0 . . .63 772 706 799 82.8 91.4 80.1 69.9 . . .62 746 688 776 82.3 91.1 79.3 68.8 . . .61 720 670 754 81.8 90.7 78.4 67.7 . . .60 697 654 732 81.2 90.2 77.5 66.6 . . .59 674 634 710 80.7 89.8 76.6 65.5 351 (2420)58 653 615 690 80.1 89.3 75.7 64.3 338 (2330)57 633 595 670 79.6 88.9 74.8 63.2 325 (2240)56 613 577 650 79.0 88.3 73.9 62.0 313 (2160)55 595 560 630 78.5 87.9 73.0 60.9 301 (2070)54 577 543 612 78.0 87.4 72.0 59.8 292 (2010)53 560 525 594 77.4 86.9 71.2 58.6 283 (1950)52 544 512 576 76.8 86.4 70.2 57.4 273 (1880)51 528 496 558 76.3 85.9 69.4 56.1 264 (1820)50 513 482 542 75.9 85.5 68.5 55.0 255 (1760)49 498 468 526 75.2 85.0 67.6 53.8 246 (1700)48 484 455 510 74.7 84.5 66.7 52.5 238 (1640)47 471 442 495 74.1 83.9 65.8 51.4 229 (1580)46 458 432 480 73.6 83.5 64.8 50.3 221 (1520)45 446 421 466 73.1 83.0 64.0 49.0 215 (1480)44 434 409 452 72.5 82.5 63.1 47.8 208 (1430)43 423 400 438 72.0 82.0 62.2 46.7 201 (1390)42 412 390 426 71.5 81.5 61.3 45.5 194 (1340)41 402 381 414 70.9 80.9 60.4 44.3 188 (1300)40 392 371 402 70.4 80.4 59.5 43.1 182 (1250)39 382 362 391 69.9 79.9 58.6 41.9 177 (1220)38 372 353 380 69.4 79.4 57.7 40.8 171 (1180)37 363 344 370 68.9 78.8 56.8 39.6 166 (1140)36 354 336 360 68.4 78.3 55.9 38.4 161 (1110)35 345 327 351 67.9 77.7 55.0 37.2 156 (1080)34 336 319 342 67.4 77.2 54.2 36.1 152 (1050)33 327 311 334 66.8 76.6 53.3 34.9 149 (1030)32 318 301 326 66.3 76.1 52.1 33.7 146 (1010)31 310 294 318 65.8 75.6 51.3 32.5 141 (970)30 302 286 311 65.3 75.0 50.4 31.3 138 (950)29 294 279 304 64.6 74.5 49.5 30.1 135 (930)28 286 271 297 64.3 73.9 48.6 28.9 131 (900)27 279 264 290 63.8 73.3 47.7 27.8 128 (880)26 272 258 284 63.3 72.8 46.8 26.7 125 (860)25 266 253 278 62.8 72.2 45.9 25.5 123 (850)24 260 247 272 62.4 71.6 45.0 24.3 119 (820)23 254 243 266 62.0 71.0 44.0 23.1 117 (810)22 248 237 261 61.5 70.5 43.2 22.0 115 (790)21 243 231 256 61.0 69.9 42.3 20.7 112 (770)20 238 226 251 60.5 69.4 41.5 19.6 110 (760)
A This table gives the approximate interrelationships of hardness values and approximate tensile strength of steels. It is possible that steels of various compositions andprocessing histories will deviate in hardness-tensile strength relationship from the data presented in this table. The data in this table should not be used for austeniticstainless steels, but have been shown to be applicable for ferritic and martensitic stainless steels. The data in this table should not be used to establish a relationshipbetween hardness values and tensile strength of hard drawn wire. Where more precise conversions are required, they should be developed specially for each steelcomposition, heat treatment, and part.
A 370 – 03a
12Perancangan dan pengembangan..., Yeny Pusvyta, FT UI, 2010.
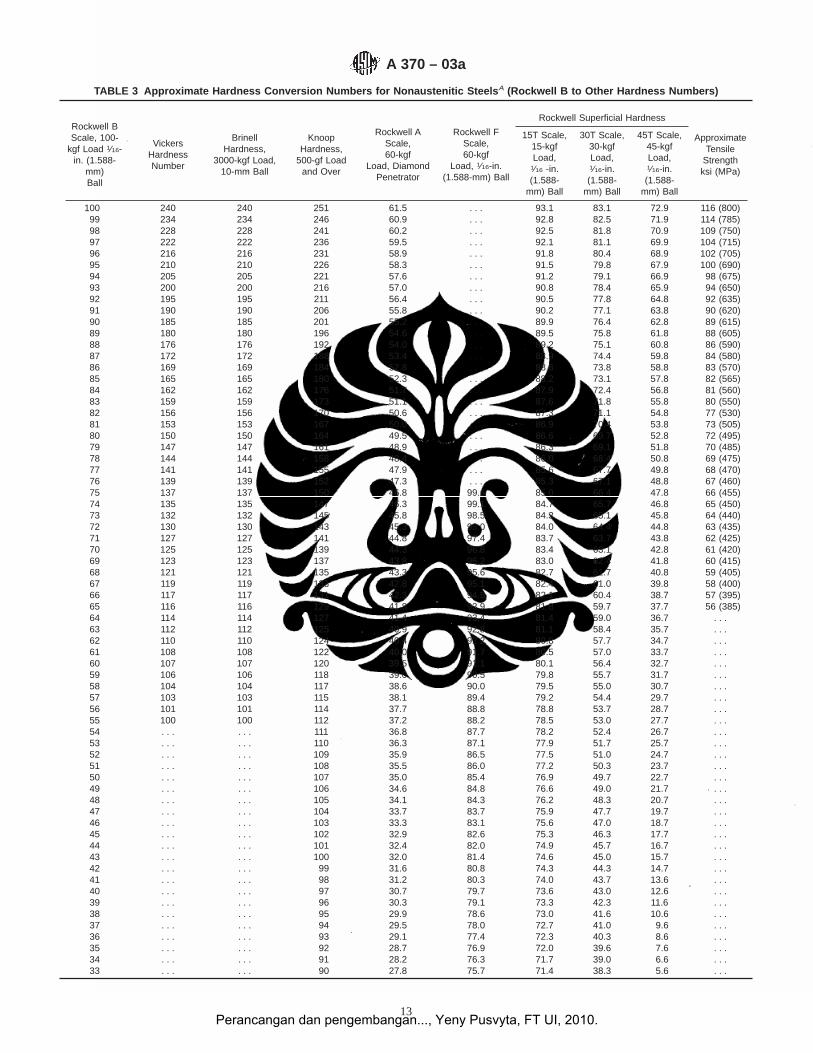
TABLE 3 Approximate Hardness Conversion Numbers for Nonaustenitic Steels A (Rockwell B to Other Hardness Numbers)
Rockwell BScale, 100-
kgf Load 1⁄16-in. (1.588-
mm)Ball
VickersHardnessNumber
BrinellHardness,
3000-kgf Load,10-mm Ball
KnoopHardness,
500-gf Loadand Over
Rockwell AScale,60-kgf
Load, DiamondPenetrator
Rockwell FScale,60-kgf
Load, 1⁄16-in.(1.588-mm) Ball
Rockwell Superficial Hardness
ApproximateTensile
Strengthksi (MPa)
15T Scale,15-kgfLoad,
1⁄16 -in.(1.588-
mm) Ball
30T Scale,30-kgfLoad,1⁄16-in.(1.588-
mm) Ball
45T Scale,45-kgfLoad,1⁄16-in.(1.588-
mm) Ball
100 240 240 251 61.5 . . . 93.1 83.1 72.9 116 (800)99 234 234 246 60.9 . . . 92.8 82.5 71.9 114 (785)98 228 228 241 60.2 . . . 92.5 81.8 70.9 109 (750)97 222 222 236 59.5 . . . 92.1 81.1 69.9 104 (715)96 216 216 231 58.9 . . . 91.8 80.4 68.9 102 (705)95 210 210 226 58.3 . . . 91.5 79.8 67.9 100 (690)94 205 205 221 57.6 . . . 91.2 79.1 66.9 98 (675)93 200 200 216 57.0 . . . 90.8 78.4 65.9 94 (650)92 195 195 211 56.4 . . . 90.5 77.8 64.8 92 (635)91 190 190 206 55.8 . . . 90.2 77.1 63.8 90 (620)90 185 185 201 55.2 . . . 89.9 76.4 62.8 89 (615)89 180 180 196 54.6 . . . 89.5 75.8 61.8 88 (605)88 176 176 192 54.0 . . . 89.2 75.1 60.8 86 (590)87 172 172 188 53.4 . . . 88.9 74.4 59.8 84 (580)86 169 169 184 52.8 . . . 88.6 73.8 58.8 83 (570)85 165 165 180 52.3 . . . 88.2 73.1 57.8 82 (565)84 162 162 176 51.7 . . . 87.9 72.4 56.8 81 (560)83 159 159 173 51.1 . . . 87.6 71.8 55.8 80 (550)82 156 156 170 50.6 . . . 87.3 71.1 54.8 77 (530)81 153 153 167 50.0 . . . 86.9 70.4 53.8 73 (505)80 150 150 164 49.5 . . . 86.6 69.7 52.8 72 (495)79 147 147 161 48.9 . . . 86.3 69.1 51.8 70 (485)78 144 144 158 48.4 . . . 86.0 68.4 50.8 69 (475)77 141 141 155 47.9 . . . 85.6 67.7 49.8 68 (470)76 139 139 152 47.3 . . . 85.3 67.1 48.8 67 (460)75 137 137 150 46.8 99.6 85.0 66.4 47.8 66 (455)74 135 135 147 46.3 99.1 84.7 65.7 46.8 65 (450)73 132 132 145 45.8 98.5 84.3 65.1 45.8 64 (440)72 130 130 143 45.3 98.0 84.0 64.4 44.8 63 (435)71 127 127 141 44.8 97.4 83.7 63.7 43.8 62 (425)70 125 125 139 44.3 96.8 83.4 63.1 42.8 61 (420)69 123 123 137 43.8 96.2 83.0 62.4 41.8 60 (415)68 121 121 135 43.3 95.6 82.7 61.7 40.8 59 (405)67 119 119 133 42.8 95.1 82.4 61.0 39.8 58 (400)66 117 117 131 42.3 94.5 82.1 60.4 38.7 57 (395)65 116 116 129 41.8 93.9 81.8 59.7 37.7 56 (385)64 114 114 127 41.4 93.4 81.4 59.0 36.7 . . .63 112 112 125 40.9 92.8 81.1 58.4 35.7 . . .62 110 110 124 40.4 92.2 80.8 57.7 34.7 . . .61 108 108 122 40.0 91.7 80.5 57.0 33.7 . . .60 107 107 120 39.5 91.1 80.1 56.4 32.7 . . .59 106 106 118 39.0 90.5 79.8 55.7 31.7 . . .58 104 104 117 38.6 90.0 79.5 55.0 30.7 . . .57 103 103 115 38.1 89.4 79.2 54.4 29.7 . . .56 101 101 114 37.7 88.8 78.8 53.7 28.7 . . .55 100 100 112 37.2 88.2 78.5 53.0 27.7 . . .54 . . . . . . 111 36.8 87.7 78.2 52.4 26.7 . . .53 . . . . . . 110 36.3 87.1 77.9 51.7 25.7 . . .52 . . . . . . 109 35.9 86.5 77.5 51.0 24.7 . . .51 . . . . . . 108 35.5 86.0 77.2 50.3 23.7 . . .50 . . . . . . 107 35.0 85.4 76.9 49.7 22.7 . . .49 . . . . . . 106 34.6 84.8 76.6 49.0 21.7 . . .48 . . . . . . 105 34.1 84.3 76.2 48.3 20.7 . . .47 . . . . . . 104 33.7 83.7 75.9 47.7 19.7 . . .46 . . . . . . 103 33.3 83.1 75.6 47.0 18.7 . . .45 . . . . . . 102 32.9 82.6 75.3 46.3 17.7 . . .44 . . . . . . 101 32.4 82.0 74.9 45.7 16.7 . . .43 . . . . . . 100 32.0 81.4 74.6 45.0 15.7 . . .42 . . . . . . 99 31.6 80.8 74.3 44.3 14.7 . . .41 . . . . . . 98 31.2 80.3 74.0 43.7 13.6 . . .40 . . . . . . 97 30.7 79.7 73.6 43.0 12.6 . . .39 . . . . . . 96 30.3 79.1 73.3 42.3 11.6 . . .38 . . . . . . 95 29.9 78.6 73.0 41.6 10.6 . . .37 . . . . . . 94 29.5 78.0 72.7 41.0 9.6 . . .36 . . . . . . 93 29.1 77.4 72.3 40.3 8.6 . . .35 . . . . . . 92 28.7 76.9 72.0 39.6 7.6 . . .34 . . . . . . 91 28.2 76.3 71.7 39.0 6.6 . . .33 . . . . . . 90 27.8 75.7 71.4 38.3 5.6 . . .
A 370 – 03a
13Perancangan dan pengembangan..., Yeny Pusvyta, FT UI, 2010.
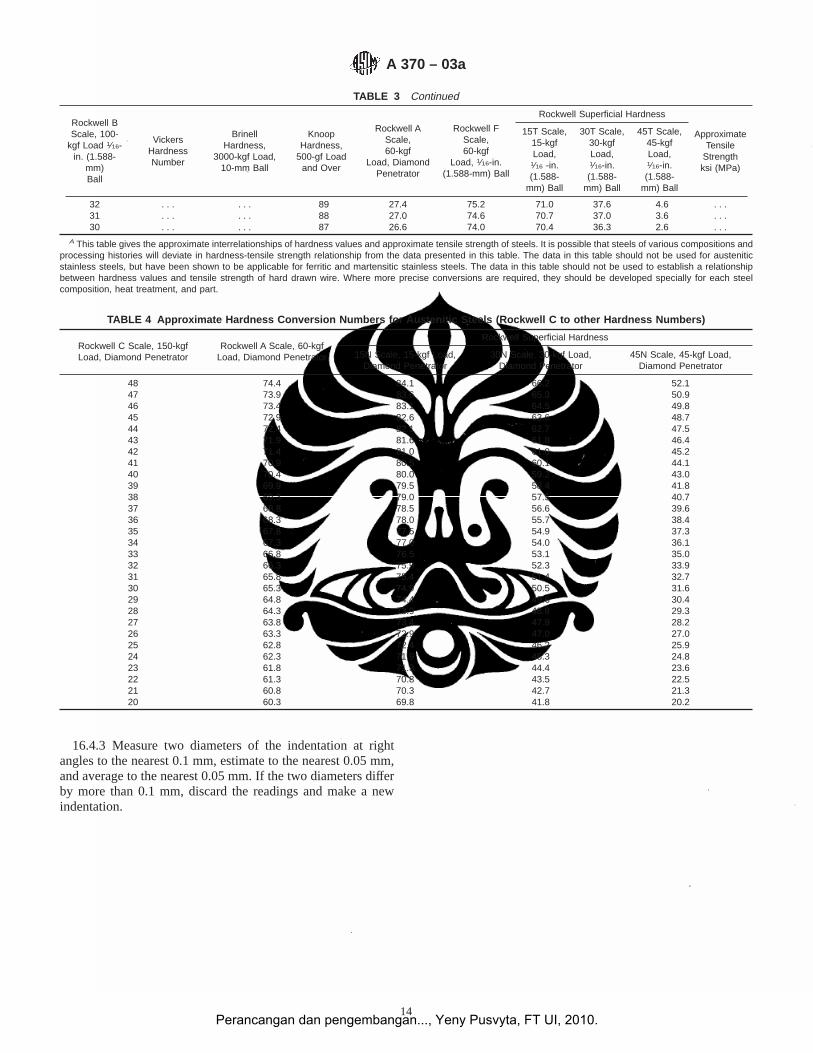
16.4.3 Measure two diameters of the indentation at rightangles to the nearest 0.1 mm, estimate to the nearest 0.05 mm,and average to the nearest 0.05 mm. If the two diameters differby more than 0.1 mm, discard the readings and make a newindentation.
TABLE 3 Continued
Rockwell BScale, 100-
kgf Load 1⁄16-in. (1.588-
mm)Ball
VickersHardnessNumber
BrinellHardness,
3000-kgf Load,10-mm Ball
KnoopHardness,
500-gf Loadand Over
Rockwell AScale,60-kgf
Load, DiamondPenetrator
Rockwell FScale,60-kgf
Load, 1⁄16-in.(1.588-mm) Ball
Rockwell Superficial Hardness
ApproximateTensile
Strengthksi (MPa)
15T Scale,15-kgfLoad,
1⁄16 -in.(1.588-
mm) Ball
30T Scale,30-kgfLoad,1⁄16-in.(1.588-
mm) Ball
45T Scale,45-kgfLoad,1⁄16-in.(1.588-
mm) Ball
32 . . . . . . 89 27.4 75.2 71.0 37.6 4.6 . . .31 . . . . . . 88 27.0 74.6 70.7 37.0 3.6 . . .30 . . . . . . 87 26.6 74.0 70.4 36.3 2.6 . . .
A This table gives the approximate interrelationships of hardness values and approximate tensile strength of steels. It is possible that steels of various compositions andprocessing histories will deviate in hardness-tensile strength relationship from the data presented in this table. The data in this table should not be used for austeniticstainless steels, but have been shown to be applicable for ferritic and martensitic stainless steels. The data in this table should not be used to establish a relationshipbetween hardness values and tensile strength of hard drawn wire. Where more precise conversions are required, they should be developed specially for each steelcomposition, heat treatment, and part.
TABLE 4 Approximate Hardness Conversion Numbers for Austenitic Steels (Rockwell C to other Hardness Numbers)
Rockwell C Scale, 150-kgfLoad, Diamond Penetrator
Rockwell A Scale, 60-kgfLoad, Diamond Penetrator
Rockwell Superficial Hardness
15N Scale, 15-kgf Load,Diamond Penetrator
30N Scale, 30-kgf Load,Diamond Penetrator
45N Scale, 45-kgf Load,Diamond Penetrator
48 74.4 84.1 66.2 52.147 73.9 83.6 65.3 50.946 73.4 83.1 64.5 49.845 72.9 82.6 63.6 48.744 72.4 82.1 62.7 47.543 71.9 81.6 61.8 46.442 71.4 81.0 61.0 45.241 70.9 80.5 60.1 44.140 70.4 80.0 59.2 43.039 69.9 79.5 58.4 41.838 69.3 79.0 57.5 40.737 68.8 78.5 56.6 39.636 68.3 78.0 55.7 38.435 67.8 77.5 54.9 37.334 67.3 77.0 54.0 36.133 66.8 76.5 53.1 35.032 66.3 75.9 52.3 33.931 65.8 75.4 51.4 32.730 65.3 74.9 50.5 31.629 64.8 74.4 49.6 30.428 64.3 73.9 48.8 29.327 63.8 73.4 47.9 28.226 63.3 72.9 47.0 27.025 62.8 72.4 46.2 25.924 62.3 71.9 45.3 24.823 61.8 71.3 44.4 23.622 61.3 70.8 43.5 22.521 60.8 70.3 42.7 21.320 60.3 69.8 41.8 20.2
A 370 – 03a
14Perancangan dan pengembangan..., Yeny Pusvyta, FT UI, 2010.

TABLE 6 Brinell Hardness Numbers A
(Ball 10 mm in Diameter, Applied Loads of 500, 1500, and 3000 kgf)
Diameterof Indenta-tion, mm
Brinell Hardness NumberDiameter
of Indenta-tion, mm
Brinell Hardness Number Diameterof Indenta-tion, mm
Brinell Hardness NumberDiameter
of Indenta-tion, mm
Brinell Hardness Number
500-kgf
Load
1500-kgf
Load
3000-kgf
Load
500-kgf
Load
1500-kgf
Load
3000-kgf
Load
500-kgf
Load
1500-kgf
Load
3000-kgf
Load
500-kgf
Load
1500-kgf
Load
3000-kgf
Load
2.00 158 473 945 2.60 92.6 278 555 3.20 60.5 182 363 3.80 42.4 127 2552.01 156 468 936 2.61 91.8 276 551 3.21 60.1 180 361 3.81 42.2 127 2532.02 154 463 926 2.62 91.1 273 547 3.22 59.8 179 359 3.82 42.0 126 2522.03 153 459 917 2.63 90.4 271 543 3.23 59.4 178 356 3.83 41.7 125 2502.04 151 454 908 2.64 89.7 269 538 3.24 59.0 177 354 3.84 41.5 125 2492.05 150 450 899 2.65 89.0 267 534 3.25 58.6 176 352 3.85 41.3 124 2482.06 148 445 890 2.66 88.4 265 530 3.26 58.3 175 350 3.86 41.1 123 2462.07 147 441 882 2.67 87.7 263 526 3.27 57.9 174 347 3.87 40.9 123 2452.08 146 437 873 2.68 87.0 261 522 3.28 57.5 173 345 3.88 40.6 122 2442.09 144 432 865 2.69 86.4 259 518 3.29 57.2 172 343 3.89 40.4 121 2422.10 143 428 856 2.70 85.7 257 514 3.30 56.8 170 341 3.90 40.2 121 2412.11 141 424 848 2.71 85.1 255 510 3.31 56.5 169 339 3.91 40.0 120 2402.12 140 420 840 2.72 84.4 253 507 3.32 56.1 168 337 3.92 39.8 119 2392.13 139 416 832 2.73 83.8 251 503 3.33 55.8 167 335 3.93 39.6 119 2372.14 137 412 824 2.74 83.2 250 499 3.34 55.4 166 333 3.94 39.4 118 2362.15 136 408 817 2.75 82.6 248 495 3.35 55.1 165 331 3.95 39.1 117 2352.16 135 404 809 2.76 81.9 246 492 3.36 54.8 164 329 3.96 38.9 117 2342.17 134 401 802 2.77 81.3 244 488 3.37 54.4 163 326 3.97 38.7 116 2322.18 132 397 794 2.78 80.8 242 485 3.38 54.1 162 325 3.98 38.5 116 2312.19 131 393 787 2.79 80.2 240 481 3.39 53.8 161 323 3.99 38.3 115 2302.20 130 390 780 2.80 79.6 239 477 3.40 53.4 160 321 4.00 38.1 114 2292.21 129 386 772 2.81 79.0 237 474 3.41 53.1 159 319 4.01 37.9 114 2282.22 128 383 765 2.82 78.4 235 471 3.42 52.8 158 317 4.02 37.7 113 2262.23 126 379 758 2.83 77.9 234 467 3.43 52.5 157 315 4.03 37.5 113 2252.24 125 376 752 2.84 77.3 232 464 344 52.2 156 313 4.04 37.3 112 2242.25 124 372 745 2.85 76.8 230 461 3.45 51.8 156 311 4.05 37.1 111 2232.26 123 369 738 2.86 76.2 229 457 3.46 51.5 155 309 4.06 37.0 111 2222.27 122 366 732 2.87 75.7 227 454 3.47 51.2 154 307 4.07 36.8 110 2212.28 121 363 725 2.88 75.1 225 451 3.48 50.9 153 306 4.08 36.6 110 2192.29 120 359 719 2.89 74.6 224 448 3.49 50.6 152 304 4.09 36.4 109 2182.30 119 356 712 2.90 74.1 222 444 3.50 50.3 151 302 4.10 36.2 109 2172.31 118 353 706 2.91 73.6 221 441 3.51 50.0 150 300 4.11 36.0 108 2162.32 117 350 700 2.92 73.0 219 438 3.52 49.7 149 298 4.12 35.8 108 2152.33 116 347 694 2.93 72.5 218 435 3.53 49.4 148 297 4.13 35.7 107 2142.34 115 344 688 2.94 72.0 216 432 3.54 49.2 147 295 4.14 35.5 106 2132.35 114 341 682 2.95 71.5 215 429 3.55 48.9 147 293 4.15 35.3 106 2122.36 113 338 676 2.96 71.0 213 426 3.56 48.6 146 292 4.16 35.1 105 2112.37 112 335 670 2.97 70.5 212 423 3.57 48.3 145 290 4.17 34.9 105 210
TABLE 5 Approximate Hardness Conversion Numbers for Austenitic Steels (Rockwell B to other Hardness Numbers)
Rockwell BScale, 100-
kgf Load, 1⁄16-in. (1.588-mm) Ball
Brinell IndentationDiameter, mm
Brinell Hardness,3000-kgf Load,
10-mm Ball
Rockwell A Scale,60-kgf Load,
Diamond Penetrator
Rockwell Superficial Hardness
15T Scale,15-kgf Load,
1⁄16-in. (1.588-mm) Ball
30T Scale,30-kgf Load,
1⁄16-in. (1.588-mm) Ball
45T Scale,45-kgf Load,
1⁄16-in. (1.588-mm) Ball
100 3.79 256 61.5 91.5 80.4 70.299 3.85 248 60.9 91.2 79.7 69.298 3.91 240 60.3 90.8 79.0 68.297 3.96 233 59.7 90.4 78.3 67.296 4.02 226 59.1 90.1 77.7 66.195 4.08 219 58.5 89.7 77.0 65.194 4.14 213 58.0 89.3 76.3 64.193 4.20 207 57.4 88.9 75.6 63.192 4.24 202 56.8 88.6 74.9 62.191 4.30 197 56.2 88.2 74.2 61.190 4.35 192 55.6 87.8 73.5 60.189 4.40 187 55.0 87.5 72.8 59.088 4.45 183 54.5 87.1 72.1 58.087 4.51 178 53.9 86.7 71.4 57.086 4.55 174 53.3 86.4 70.7 56.085 4.60 170 52.7 86.0 70.0 55.084 4.65 167 52.1 85.6 69.3 54.083 4.70 163 51.5 85.2 68.6 52.982 4.74 160 50.9 84.9 67.9 51.981 4.79 156 50.4 84.5 67.2 50.980 4.84 153 49.8 84.1 66.5 49.9
A 370 – 03a
15Perancangan dan pengembangan..., Yeny Pusvyta, FT UI, 2010.
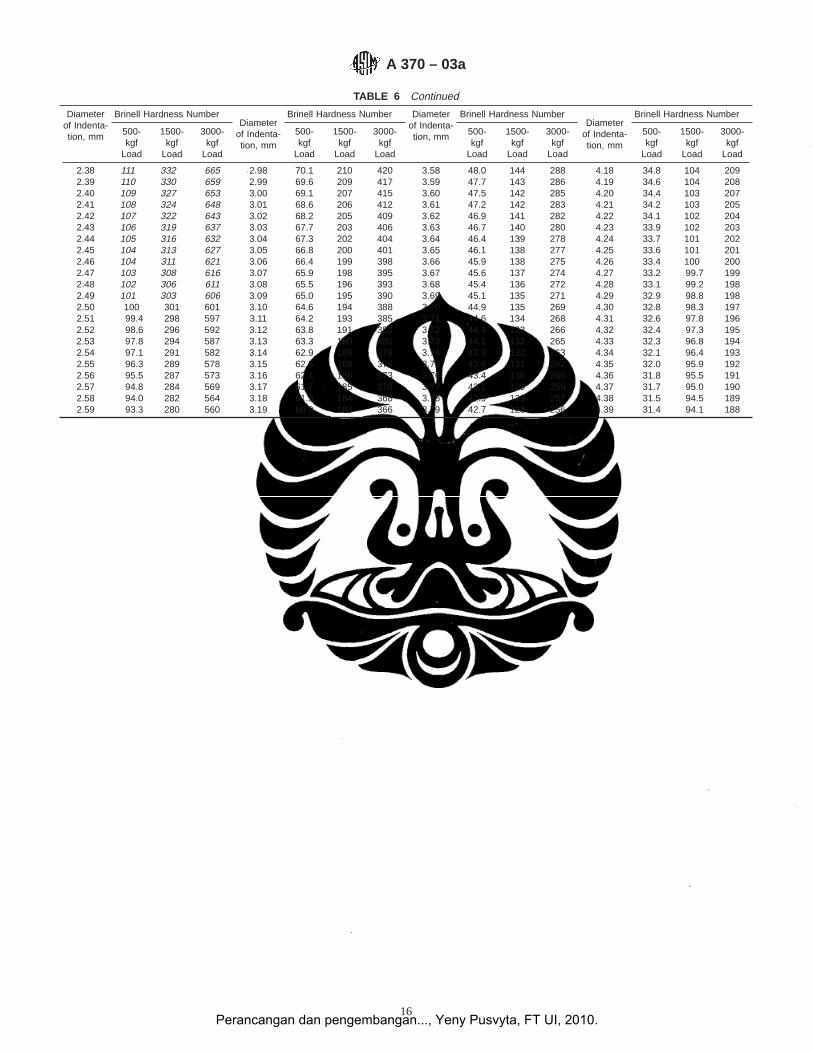
TABLE 6 Continued
Diameterof Indenta-tion, mm
Brinell Hardness NumberDiameter
of Indenta-tion, mm
Brinell Hardness Number Diameterof Indenta-tion, mm
Brinell Hardness NumberDiameter
of Indenta-tion, mm
Brinell Hardness Number
500-kgf
Load
1500-kgf
Load
3000-kgf
Load
500-kgf
Load
1500-kgf
Load
3000-kgf
Load
500-kgf
Load
1500-kgf
Load
3000-kgf
Load
500-kgf
Load
1500-kgf
Load
3000-kgf
Load
2.38 111 332 665 2.98 70.1 210 420 3.58 48.0 144 288 4.18 34.8 104 2092.39 110 330 659 2.99 69.6 209 417 3.59 47.7 143 286 4.19 34.6 104 2082.40 109 327 653 3.00 69.1 207 415 3.60 47.5 142 285 4.20 34.4 103 2072.41 108 324 648 3.01 68.6 206 412 3.61 47.2 142 283 4.21 34.2 103 2052.42 107 322 643 3.02 68.2 205 409 3.62 46.9 141 282 4.22 34.1 102 2042.43 106 319 637 3.03 67.7 203 406 3.63 46.7 140 280 4.23 33.9 102 2032.44 105 316 632 3.04 67.3 202 404 3.64 46.4 139 278 4.24 33.7 101 2022.45 104 313 627 3.05 66.8 200 401 3.65 46.1 138 277 4.25 33.6 101 2012.46 104 311 621 3.06 66.4 199 398 3.66 45.9 138 275 4.26 33.4 100 2002.47 103 308 616 3.07 65.9 198 395 3.67 45.6 137 274 4.27 33.2 99.7 1992.48 102 306 611 3.08 65.5 196 393 3.68 45.4 136 272 4.28 33.1 99.2 1982.49 101 303 606 3.09 65.0 195 390 3.69 45.1 135 271 4.29 32.9 98.8 1982.50 100 301 601 3.10 64.6 194 388 3.70 44.9 135 269 4.30 32.8 98.3 1972.51 99.4 298 597 3.11 64.2 193 385 3.71 44.6 134 268 4.31 32.6 97.8 1962.52 98.6 296 592 3.12 63.8 191 383 3.72 44.4 133 266 4.32 32.4 97.3 1952.53 97.8 294 587 3.13 63.3 190 380 3.73 44.1 132 265 4.33 32.3 96.8 1942.54 97.1 291 582 3.14 62.9 189 378 3.74 43.9 132 263 4.34 32.1 96.4 1932.55 96.3 289 578 3.15 62.5 188 375 3.75 43.6 131 262 4.35 32.0 95.9 1922.56 95.5 287 573 3.16 62.1 186 373 3.76 43.4 130 260 4.36 31.8 95.5 1912.57 94.8 284 569 3.17 61.7 185 370 3.77 43.1 129 259 4.37 31.7 95.0 1902.58 94.0 282 564 3.18 61.3 184 368 3.78 42.9 129 257 4.38 31.5 94.5 1892.59 93.3 280 560 3.19 60.9 183 366 3.79 42.7 128 256 4.39 31.4 94.1 188
A 370 – 03a
16Perancangan dan pengembangan..., Yeny Pusvyta, FT UI, 2010.
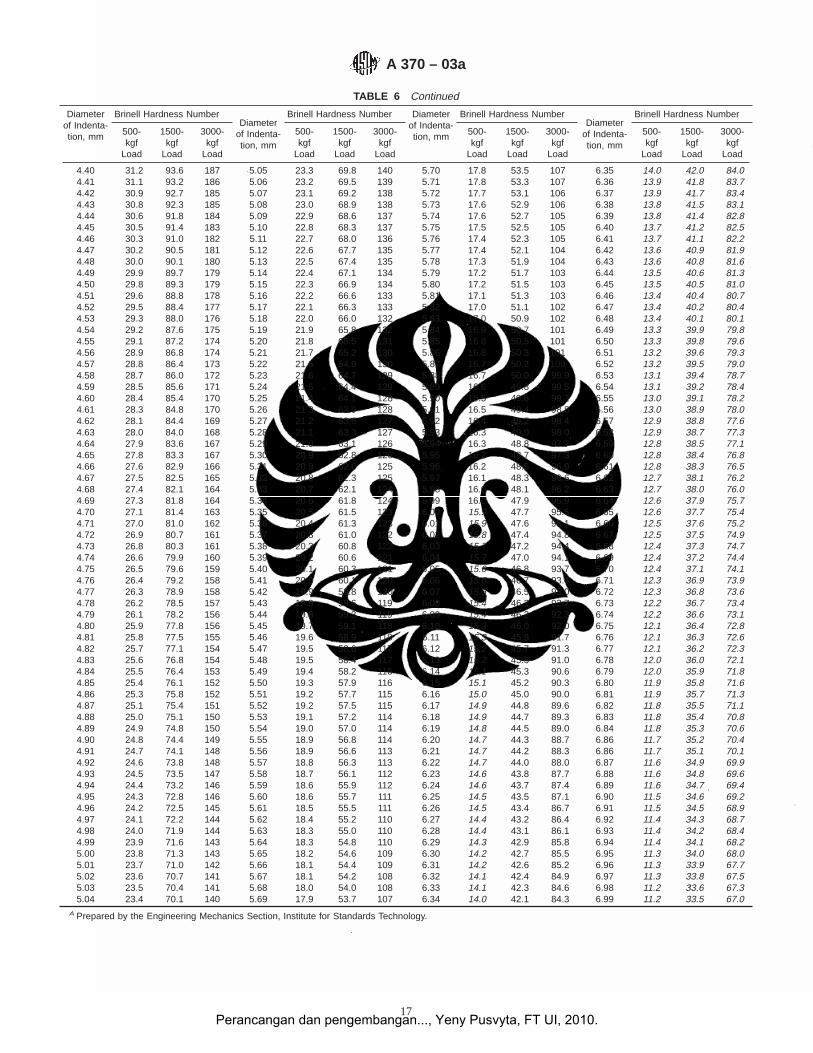
TABLE 6 Continued
Diameterof Indenta-tion, mm
Brinell Hardness NumberDiameter
of Indenta-tion, mm
Brinell Hardness Number Diameterof Indenta-tion, mm
Brinell Hardness NumberDiameter
of Indenta-tion, mm
Brinell Hardness Number
500-kgf
Load
1500-kgf
Load
3000-kgf
Load
500-kgf
Load
1500-kgf
Load
3000-kgf
Load
500-kgf
Load
1500-kgf
Load
3000-kgf
Load
500-kgf
Load
1500-kgf
Load
3000-kgf
Load
4.40 31.2 93.6 187 5.05 23.3 69.8 140 5.70 17.8 53.5 107 6.35 14.0 42.0 84.04.41 31.1 93.2 186 5.06 23.2 69.5 139 5.71 17.8 53.3 107 6.36 13.9 41.8 83.74.42 30.9 92.7 185 5.07 23.1 69.2 138 5.72 17.7 53.1 106 6.37 13.9 41.7 83.44.43 30.8 92.3 185 5.08 23.0 68.9 138 5.73 17.6 52.9 106 6.38 13.8 41.5 83.14.44 30.6 91.8 184 5.09 22.9 68.6 137 5.74 17.6 52.7 105 6.39 13.8 41.4 82.84.45 30.5 91.4 183 5.10 22.8 68.3 137 5.75 17.5 52.5 105 6.40 13.7 41.2 82.54.46 30.3 91.0 182 5.11 22.7 68.0 136 5.76 17.4 52.3 105 6.41 13.7 41.1 82.24.47 30.2 90.5 181 5.12 22.6 67.7 135 5.77 17.4 52.1 104 6.42 13.6 40.9 81.94.48 30.0 90.1 180 5.13 22.5 67.4 135 5.78 17.3 51.9 104 6.43 13.6 40.8 81.64.49 29.9 89.7 179 5.14 22.4 67.1 134 5.79 17.2 51.7 103 6.44 13.5 40.6 81.34.50 29.8 89.3 179 5.15 22.3 66.9 134 5.80 17.2 51.5 103 6.45 13.5 40.5 81.04.51 29.6 88.8 178 5.16 22.2 66.6 133 5.81 17.1 51.3 103 6.46 13.4 40.4 80.74.52 29.5 88.4 177 5.17 22.1 66.3 133 5.82 17.0 51.1 102 6.47 13.4 40.2 80.44.53 29.3 88.0 176 5.18 22.0 66.0 132 5.83 17.0 50.9 102 6.48 13.4 40.1 80.14.54 29.2 87.6 175 5.19 21.9 65.8 132 5.84 16.9 50.7 101 6.49 13.3 39.9 79.84.55 29.1 87.2 174 5.20 21.8 65.5 131 5.85 16.8 50.5 101 6.50 13.3 39.8 79.64.56 28.9 86.8 174 5.21 21.7 65.2 130 5.86 16.8 50.3 101 6.51 13.2 39.6 79.34.57 28.8 86.4 173 5.22 21.6 64.9 130 5.87 16.7 50.2 100 6.52 13.2 39.5 79.04.58 28.7 86.0 172 5.23 21.6 64.7 129 5.88 16.7 50.0 99.9 6.53 13.1 39.4 78.74.59 28.5 85.6 171 5.24 21.5 64.4 129 5.89 16.6 49.8 99.5 6.54 13.1 39.2 78.44.60 28.4 85.4 170 5.25 21.4 64.1 128 5.90 16.5 49.6 99.2 6.55 13.0 39.1 78.24.61 28.3 84.8 170 5.26 21.3 63.9 128 5.91 16.5 49.4 98.8 6.56 13.0 38.9 78.04.62 28.1 84.4 169 5.27 21.2 63.6 127 5.92 16.4 49.2 98.4 6.57 12.9 38.8 77.64.63 28.0 84.0 168 5.28 21.1 63.3 127 5.93 16.3 49.0 98.0 6.58 12.9 38.7 77.34.64 27.9 83.6 167 5.29 21.0 63.1 126 5.94 16.3 48.8 97.7 6.59 12.8 38.5 77.14.65 27.8 83.3 167 5.30 20.9 62.8 126 5.95 16.2 48.7 97.3 6.60 12.8 38.4 76.84.66 27.6 82.9 166 5.31 20.9 62.6 125 5.96 16.2 48.5 96.9 6.61 12.8 38.3 76.54.67 27.5 82.5 165 5.32 20.8 62.3 125 5.97 16.1 48.3 96.6 6.62 12.7 38.1 76.24.68 27.4 82.1 164 5.33 20.7 62.1 124 5.98 16.0 48.1 96.2 6.63 12.7 38.0 76.04.69 27.3 81.8 164 5.34 20.6 61.8 124 5.99 16.0 47.9 95.9 6.64 12.6 37.9 75.74.70 27.1 81.4 163 5.35 20.5 61.5 123 6.00 15.9 47.7 95.5 6.65 12.6 37.7 75.44.71 27.0 81.0 162 5.36 20.4 61.3 123 6.01 15.9 47.6 95.1 6.66 12.5 37.6 75.24.72 26.9 80.7 161 5.37 20.3 61.0 122 6.02 15.8 47.4 94.8 6.67 12.5 37.5 74.94.73 26.8 80.3 161 5.38 20.3 60.8 122 6.03 15.7 47.2 94.4 6.68 12.4 37.3 74.74.74 26.6 79.9 160 5.39 20.2 60.6 121 6.04 15.7 47.0 94.1 6.69 12.4 37.2 74.44.75 26.5 79.6 159 5.40 20.1 60.3 121 6.05 15.6 46.8 93.7 6.70 12.4 37.1 74.14.76 26.4 79.2 158 5.41 20.0 60.1 120 6.06 15.6 46.7 93.4 6.71 12.3 36.9 73.94.77 26.3 78.9 158 5.42 19.9 59.8 120 6.07 15.5 46.5 93.0 6.72 12.3 36.8 73.64.78 26.2 78.5 157 5.43 19.9 59.6 119 6.08 15.4 46.3 92.7 6.73 12.2 36.7 73.44.79 26.1 78.2 156 5.44 19.8 59.3 119 6.09 15.4 46.2 92.3 6.74 12.2 36.6 73.14.80 25.9 77.8 156 5.45 19.7 59.1 118 6.10 15.3 46.0 92.0 6.75 12.1 36.4 72.84.81 25.8 77.5 155 5.46 19.6 58.9 118 6.11 15.3 45.8 91.7 6.76 12.1 36.3 72.64.82 25.7 77.1 154 5.47 19.5 58.6 117 6.12 15.2 45.7 91.3 6.77 12.1 36.2 72.34.83 25.6 76.8 154 5.48 19.5 58.4 117 6.13 15.2 45.5 91.0 6.78 12.0 36.0 72.14.84 25.5 76.4 153 5.49 19.4 58.2 116 6.14 15.1 45.3 90.6 6.79 12.0 35.9 71.84.85 25.4 76.1 152 5.50 19.3 57.9 116 6.15 15.1 45.2 90.3 6.80 11.9 35.8 71.64.86 25.3 75.8 152 5.51 19.2 57.7 115 6.16 15.0 45.0 90.0 6.81 11.9 35.7 71.34.87 25.1 75.4 151 5.52 19.2 57.5 115 6.17 14.9 44.8 89.6 6.82 11.8 35.5 71.14.88 25.0 75.1 150 5.53 19.1 57.2 114 6.18 14.9 44.7 89.3 6.83 11.8 35.4 70.84.89 24.9 74.8 150 5.54 19.0 57.0 114 6.19 14.8 44.5 89.0 6.84 11.8 35.3 70.64.90 24.8 74.4 149 5.55 18.9 56.8 114 6.20 14.7 44.3 88.7 6.86 11.7 35.2 70.44.91 24.7 74.1 148 5.56 18.9 56.6 113 6.21 14.7 44.2 88.3 6.86 11.7 35.1 70.14.92 24.6 73.8 148 5.57 18.8 56.3 113 6.22 14.7 44.0 88.0 6.87 11.6 34.9 69.94.93 24.5 73.5 147 5.58 18.7 56.1 112 6.23 14.6 43.8 87.7 6.88 11.6 34.8 69.64.94 24.4 73.2 146 5.59 18.6 55.9 112 6.24 14.6 43.7 87.4 6.89 11.6 34.7 69.44.95 24.3 72.8 146 5.60 18.6 55.7 111 6.25 14.5 43.5 87.1 6.90 11.5 34.6 69.24.96 24.2 72.5 145 5.61 18.5 55.5 111 6.26 14.5 43.4 86.7 6.91 11.5 34.5 68.94.97 24.1 72.2 144 5.62 18.4 55.2 110 6.27 14.4 43.2 86.4 6.92 11.4 34.3 68.74.98 24.0 71.9 144 5.63 18.3 55.0 110 6.28 14.4 43.1 86.1 6.93 11.4 34.2 68.44.99 23.9 71.6 143 5.64 18.3 54.8 110 6.29 14.3 42.9 85.8 6.94 11.4 34.1 68.25.00 23.8 71.3 143 5.65 18.2 54.6 109 6.30 14.2 42.7 85.5 6.95 11.3 34.0 68.05.01 23.7 71.0 142 5.66 18.1 54.4 109 6.31 14.2 42.6 85.2 6.96 11.3 33.9 67.75.02 23.6 70.7 141 5.67 18.1 54.2 108 6.32 14.1 42.4 84.9 6.97 11.3 33.8 67.55.03 23.5 70.4 141 5.68 18.0 54.0 108 6.33 14.1 42.3 84.6 6.98 11.2 33.6 67.35.04 23.4 70.1 140 5.69 17.9 53.7 107 6.34 14.0 42.1 84.3 6.99 11.2 33.5 67.0
A Prepared by the Engineering Mechanics Section, Institute for Standards Technology.
A 370 – 03a
17Perancangan dan pengembangan..., Yeny Pusvyta, FT UI, 2010.
16.4.4 Do not use a steel ball on steels having a hardnessover 450 HB nor a carbide ball on steels having a hardness over650 HB. The Brinell hardness test is not recommended formaterials having a hardness over 650 HB.
16.4.4.1 If a ball is used in a test of a specimen which showsa Brinell hardness number greater than the limit for the ball asdetailed in 16.4.4, the ball shall be either discarded andreplaced with a new ball or remeasured to ensure conformancewith the requirements of Test Method E 10.
16.5 Detailed Procedure—For detailed requirements of thistest, reference shall be made to the latest revision of TestMethod E 10.
17. Rockwell Test
17.1 Description:17.1.1 In this test a hardness value is obtained by determin-
ing the depth of penetration of a diamond point or a steel ballinto the specimen under certain arbitrarily fixed conditions. Aminor load of 10 kgf is first applied which causes an initialpenetration, sets the penetrator on the material and holds it inposition. A major load which depends on the scale being usedis applied increasing the depth of indentation. The major loadis removed and, with the minor load still acting, the Rockwellnumber, which is proportional to the difference in penetrationbetween the major and minor loads is determined; this isusually done by the machine and shows on a dial, digitaldisplay, printer, or other device. This is an arbitrary numberwhich increases with increasing hardness. The scales mostfrequently used are as follows:
ScaleSymbol Penetrator
MajorLoad,
kgf
MinorLoad,
kgf
B 1⁄16-in. steel ball 100 10C Diamond brale 150 10
17.1.2 Rockwell superficial hardness machines are used forthe testing of very thin steel or thin surface layers. Loads of 15,30, or 45 kgf are applied on a hardened steel ball or diamondpenetrator, to cover the same range of hardness values as forthe heavier loads. The superficial hardness scales are asfollows:
Major MinorScale Load, Load,
Symbol Penetrator kgf kgf
15T 1⁄16-in. steel ball 15 330T 1⁄16-in. steel ball 30 345T 1⁄16-in. steel ball 45 315N Diamond brale 15 330N Diamond brale 30 345N Diamond brale 45 3
17.2 Reporting Hardness—In recording hardness values,the hardness number shall always precede the scale symbol, forexample: 96 HRB, 40 HRC, 75 HR15N, or 77 HR30T.
17.3 Test Blocks—Machines should be checked to makecertain they are in good order by means of standardizedRockwell test blocks.
17.4 Detailed Procedure—For detailed requirements of thistest, reference shall be made to the latest revision of TestMethods E 18.
18. Portable Hardness Test
18.1 Although the use of the standard, stationary Brinell orRockwell hardness tester is generally preferred, it is not alwayspossible to perform the hardness test using such equipment dueto the part size or location. In this event, hardness testing usingportable equipment as described in Practice A 833 or TestMethod E 110 shall be used.
CHARPY IMPACT TESTING
19. Summary
19.1 A Charpy V-notch impact test is a dynamic test inwhich a notched specimen is struck and broken by a singleblow in a specially designed testing machine. The measuredtest values may be the energy absorbed, the percentage shearfracture, the lateral expansion opposite the notch, or a combi-nation thereof.
19.2 Testing temperatures other than room (ambient) tem-perature often are specified in product or general requirementspecifications (hereinafter referred to as the specification).Although the testing temperature is sometimes related to theexpected service temperature, the two temperatures need not beidentical.
20. Significance and Use
20.1 Ductile vs. Brittle Behavior—Body-centered-cubic orferritic alloys exhibit a significant transition in behavior whenimpact tested over a range of temperatures. At temperaturesabove transition, impact specimens fracture by a ductile(usually microvoid coalescence) mechanism, absorbing rela-tively large amounts of energy. At lower temperatures, theyfracture in a brittle (usually cleavage) manner absorbing lessenergy. Within the transition range, the fracture will generallybe a mixture of areas of ductile fracture and brittle fracture.
20.2 The temperature range of the transition from one typeof behavior to the other varies according to the material beingtested. This transition behavior may be defined in various waysfor specification purposes.
20.2.1 The specification may require a minimum test resultfor absorbed energy, fracture appearance, lateral expansion, ora combination thereof, at a specified test temperature.
20.2.2 The specification may require the determination ofthe transition temperature at which either the absorbed energyor fracture appearance attains a specified level when testing isperformed over a range of temperatures.
20.3 Further information on the significance of impacttesting appears in Annex A5.
21. Apparatus
21.1 Testing Machines:21.1.1 A Charpy impact machine is one in which a notched
specimen is broken by a single blow of a freely swingingpendulum. The pendulum is released from a fixed height. Sincethe height to which the pendulum is raised prior to its swing,and the mass of the pendulum are known, the energy of theblow is predetermined. A means is provided to indicate theenergy absorbed in breaking the specimen.
21.1.2 The other principal feature of the machine is a fixture(See Fig. 10) designed to support a test specimen as a simple
A 370 – 03a
18Perancangan dan pengembangan..., Yeny Pusvyta, FT UI, 2010.
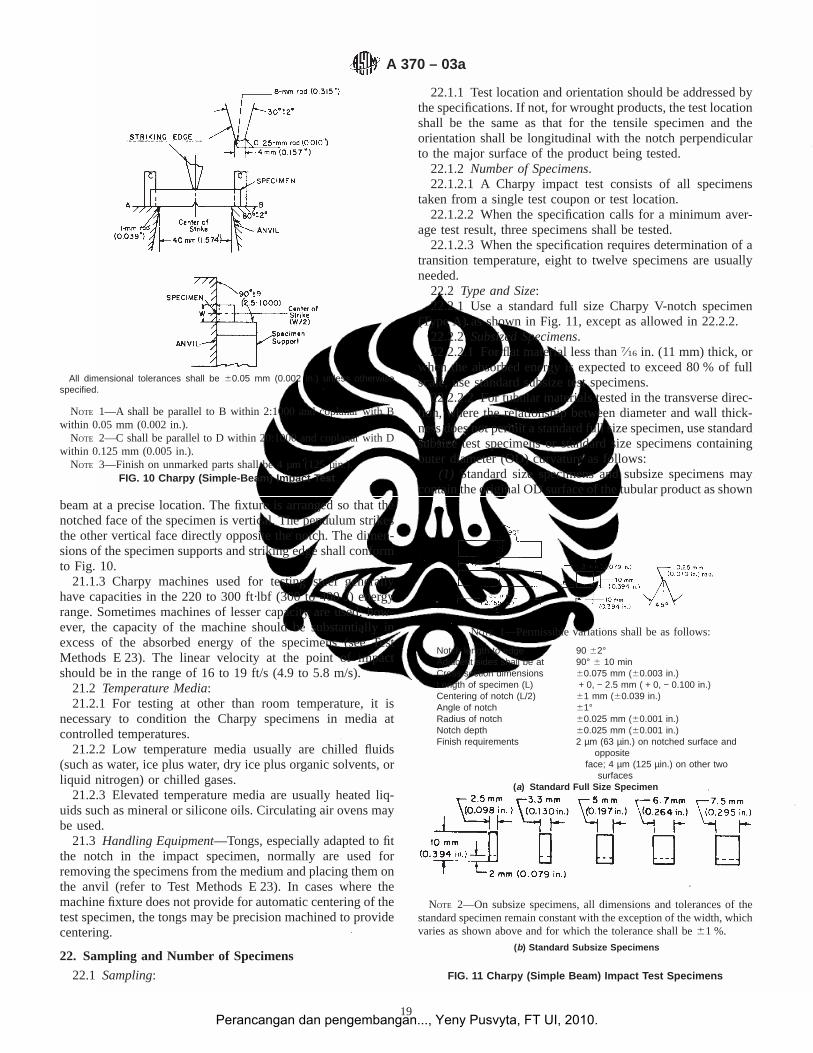
beam at a precise location. The fixture is arranged so that thenotched face of the specimen is vertical. The pendulum strikesthe other vertical face directly opposite the notch. The dimen-sions of the specimen supports and striking edge shall conformto Fig. 10.
21.1.3 Charpy machines used for testing steel generallyhave capacities in the 220 to 300 ft·lbf (300 to 400 J) energyrange. Sometimes machines of lesser capacity are used; how-ever, the capacity of the machine should be substantially inexcess of the absorbed energy of the specimens (see TestMethods E 23). The linear velocity at the point of impactshould be in the range of 16 to 19 ft/s (4.9 to 5.8 m/s).
21.2 Temperature Media:21.2.1 For testing at other than room temperature, it is
necessary to condition the Charpy specimens in media atcontrolled temperatures.
21.2.2 Low temperature media usually are chilled fluids(such as water, ice plus water, dry ice plus organic solvents, orliquid nitrogen) or chilled gases.
21.2.3 Elevated temperature media are usually heated liq-uids such as mineral or silicone oils. Circulating air ovens maybe used.
21.3 Handling Equipment—Tongs, especially adapted to fitthe notch in the impact specimen, normally are used forremoving the specimens from the medium and placing them onthe anvil (refer to Test Methods E 23). In cases where themachine fixture does not provide for automatic centering of thetest specimen, the tongs may be precision machined to providecentering.
22. Sampling and Number of Specimens
22.1 Sampling:
22.1.1 Test location and orientation should be addressed bythe specifications. If not, for wrought products, the test locationshall be the same as that for the tensile specimen and theorientation shall be longitudinal with the notch perpendicularto the major surface of the product being tested.
22.1.2 Number of Specimens.22.1.2.1 A Charpy impact test consists of all specimens
taken from a single test coupon or test location.22.1.2.2 When the specification calls for a minimum aver-
age test result, three specimens shall be tested.22.1.2.3 When the specification requires determination of a
transition temperature, eight to twelve specimens are usuallyneeded.
22.2 Type and Size:22.2.1 Use a standard full size Charpy V-notch specimen
(Type A) as shown in Fig. 11, except as allowed in 22.2.2.22.2.2 Subsized Specimens.22.2.2.1 For flat material less than7⁄16 in. (11 mm) thick, or
when the absorbed energy is expected to exceed 80 % of fullscale, use standard subsize test specimens.
22.2.2.2 For tubular materials tested in the transverse direc-tion, where the relationship between diameter and wall thick-ness does not permit a standard full size specimen, use standardsubsize test specimens or standard size specimens containingouter diameter (OD) curvature as follows:
(1) Standard size specimens and subsize specimens maycontain the original OD surface of the tubular product as shown
All dimensional tolerances shall be 60.05 mm (0.002 in.) unless otherwisespecified.
NOTE 1—A shall be parallel to B within 2:1000 and coplanar with Bwithin 0.05 mm (0.002 in.).
NOTE 2—C shall be parallel to D within 20:1000 and coplanar with Dwithin 0.125 mm (0.005 in.).
NOTE 3—Finish on unmarked parts shall be 4 µm (125 µin.).FIG. 10 Charpy (Simple-Beam) Impact Test
NOTE 1—Permissible variations shall be as follows:
Notch length to edge 90 62°Adjacent sides shall be at 90° 6 10 minCross-section dimensions 60.075 mm (60.003 in.)Length of specimen (L) + 0, − 2.5 mm ( + 0, − 0.100 in.)Centering of notch (L/2) 61 mm (60.039 in.)Angle of notch 61°Radius of notch 60.025 mm (60.001 in.)Notch depth 60.025 mm (60.001 in.)Finish requirements 2 µm (63 µin.) on notched surface and
oppositeface; 4 µm (125 µin.) on other two
surfaces(a) Standard Full Size Specimen
NOTE 2—On subsize specimens, all dimensions and tolerances of thestandard specimen remain constant with the exception of the width, whichvaries as shown above and for which the tolerance shall be61 %.
(b) Standard Subsize Specimens
FIG. 11 Charpy (Simple Beam) Impact Test Specimens
A 370 – 03a
19Perancangan dan pengembangan..., Yeny Pusvyta, FT UI, 2010.
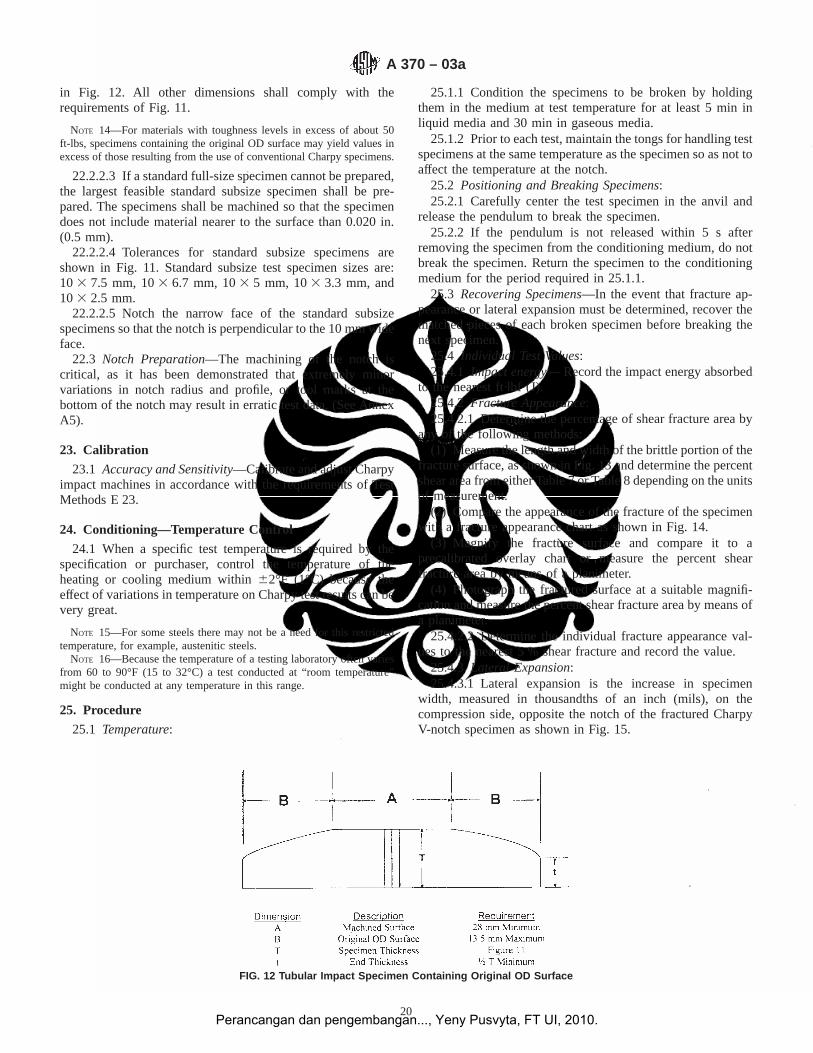
in Fig. 12. All other dimensions shall comply with therequirements of Fig. 11.
NOTE 14—For materials with toughness levels in excess of about 50ft-lbs, specimens containing the original OD surface may yield values inexcess of those resulting from the use of conventional Charpy specimens.
22.2.2.3 If a standard full-size specimen cannot be prepared,the largest feasible standard subsize specimen shall be pre-pared. The specimens shall be machined so that the specimendoes not include material nearer to the surface than 0.020 in.(0.5 mm).
22.2.2.4 Tolerances for standard subsize specimens areshown in Fig. 11. Standard subsize test specimen sizes are:103 7.5 mm, 103 6.7 mm, 103 5 mm, 103 3.3 mm, and103 2.5 mm.
22.2.2.5 Notch the narrow face of the standard subsizespecimens so that the notch is perpendicular to the 10 mm wideface.
22.3 Notch Preparation—The machining of the notch iscritical, as it has been demonstrated that extremely minorvariations in notch radius and profile, or tool marks at thebottom of the notch may result in erratic test data. (See AnnexA5).
23. Calibration
23.1 Accuracy and Sensitivity—Calibrate and adjust Charpyimpact machines in accordance with the requirements of TestMethods E 23.
24. Conditioning—Temperature Control
24.1 When a specific test temperature is required by thespecification or purchaser, control the temperature of theheating or cooling medium within62°F (1°C) because theeffect of variations in temperature on Charpy test results can bevery great.
NOTE 15—For some steels there may not be a need for this restrictedtemperature, for example, austenitic steels.
NOTE 16—Because the temperature of a testing laboratory often variesfrom 60 to 90°F (15 to 32°C) a test conducted at “room temperature”might be conducted at any temperature in this range.
25. Procedure
25.1 Temperature:
25.1.1 Condition the specimens to be broken by holdingthem in the medium at test temperature for at least 5 min inliquid media and 30 min in gaseous media.
25.1.2 Prior to each test, maintain the tongs for handling testspecimens at the same temperature as the specimen so as not toaffect the temperature at the notch.
25.2 Positioning and Breaking Specimens:25.2.1 Carefully center the test specimen in the anvil and
release the pendulum to break the specimen.25.2.2 If the pendulum is not released within 5 s after
removing the specimen from the conditioning medium, do notbreak the specimen. Return the specimen to the conditioningmedium for the period required in 25.1.1.
25.3 Recovering Specimens—In the event that fracture ap-pearance or lateral expansion must be determined, recover thematched pieces of each broken specimen before breaking thenext specimen.
25.4 Individual Test Values:25.4.1 Impact energy— Record the impact energy absorbed
to the nearest ft·lbf (J).25.4.2 Fracture Appearance:25.4.2.1 Determine the percentage of shear fracture area by
any of the following methods:(1) Measure the length and width of the brittle portion of the
fracture surface, as shown in Fig. 13 and determine the percentshear area from either Table 7 or Table 8 depending on the unitsof measurement.
(2) Compare the appearance of the fracture of the specimenwith a fracture appearance chart as shown in Fig. 14.
(3) Magnify the fracture surface and compare it to aprecalibrated overlay chart or measure the percent shearfracture area by means of a planimeter.
(4) Photograph the fractured surface at a suitable magnifi-cation and measure the percent shear fracture area by means ofa planimeter.
25.4.2.2 Determine the individual fracture appearance val-ues to the nearest 5 % shear fracture and record the value.
25.4.3 Lateral Expansion:25.4.3.1 Lateral expansion is the increase in specimen
width, measured in thousandths of an inch (mils), on thecompression side, opposite the notch of the fractured CharpyV-notch specimen as shown in Fig. 15.
FIG. 12 Tubular Impact Specimen Containing Original OD Surface
A 370 – 03a
20Perancangan dan pengembangan..., Yeny Pusvyta, FT UI, 2010.
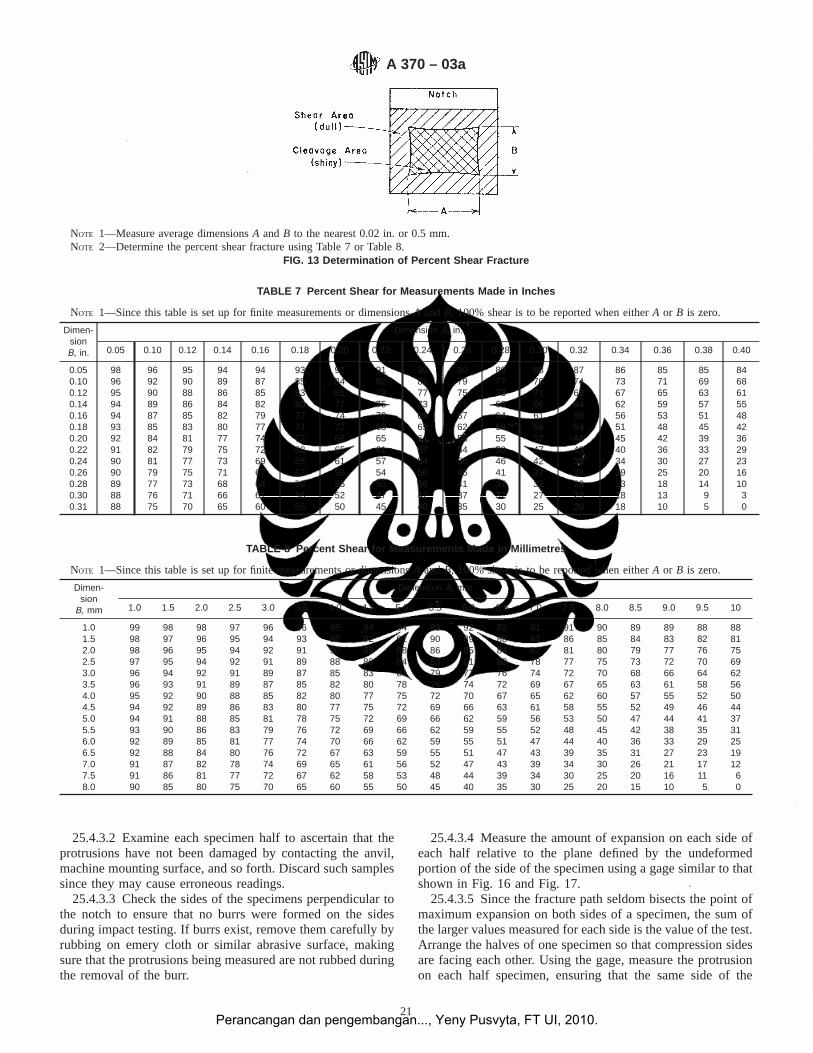
25.4.3.2 Examine each specimen half to ascertain that theprotrusions have not been damaged by contacting the anvil,machine mounting surface, and so forth. Discard such samplessince they may cause erroneous readings.
25.4.3.3 Check the sides of the specimens perpendicular tothe notch to ensure that no burrs were formed on the sidesduring impact testing. If burrs exist, remove them carefully byrubbing on emery cloth or similar abrasive surface, makingsure that the protrusions being measured are not rubbed duringthe removal of the burr.
25.4.3.4 Measure the amount of expansion on each side ofeach half relative to the plane defined by the undeformedportion of the side of the specimen using a gage similar to thatshown in Fig. 16 and Fig. 17.
25.4.3.5 Since the fracture path seldom bisects the point ofmaximum expansion on both sides of a specimen, the sum ofthe larger values measured for each side is the value of the test.Arrange the halves of one specimen so that compression sidesare facing each other. Using the gage, measure the protrusionon each half specimen, ensuring that the same side of the
NOTE 1—Measure average dimensionsA andB to the nearest 0.02 in. or 0.5 mm.NOTE 2—Determine the percent shear fracture using Table 7 or Table 8.
FIG. 13 Determination of Percent Shear Fracture
TABLE 7 Percent Shear for Measurements Made in Inches
NOTE 1—Since this table is set up for finite measurements or dimensionsA andB, 100% shear is to be reported when eitherA or B is zero.
Dimen-sionB, in.
Dimension A, in.
0.05 0.10 0.12 0.14 0.16 0.18 0.20 0.22 0.24 0.26 0.28 0.30 0.32 0.34 0.36 0.38 0.40
0.05 98 96 95 94 94 93 92 91 90 90 89 88 87 86 85 85 840.10 96 92 90 89 87 85 84 82 81 79 77 76 74 73 71 69 680.12 95 90 88 86 85 83 81 79 77 75 73 71 69 67 65 63 610.14 94 89 86 84 82 80 77 75 73 71 68 66 64 62 59 57 550.16 94 87 85 82 79 77 74 72 69 67 64 61 59 56 53 51 480.18 93 85 83 80 77 74 72 68 65 62 59 56 54 51 48 45 420.20 92 84 81 77 74 72 68 65 61 58 55 52 48 45 42 39 360.22 91 82 79 75 72 68 65 61 57 54 50 47 43 40 36 33 290.24 90 81 77 73 69 65 61 57 54 50 46 42 38 34 30 27 230.26 90 79 75 71 67 62 58 54 50 46 41 37 33 29 25 20 160.28 89 77 73 68 64 59 55 50 46 41 37 32 28 23 18 14 100.30 88 76 71 66 61 56 52 47 42 37 32 27 23 18 13 9 30.31 88 75 70 65 60 55 50 45 40 35 30 25 20 18 10 5 0
TABLE 8 Percent Shear for Measurements Made in Millimetres
NOTE 1—Since this table is set up for finite measurements or dimensionsA andB, 100% shear is to be reported when eitherA or B is zero.
Dimen-sion
B, mm
Dimension A, mm
1.0 1.5 2.0 2.5 3.0 3.5 4.0 4.5 5.0 5.5 6.0 6.5 7.0 7.5 8.0 8.5 9.0 9.5 10
1.0 99 98 98 97 96 96 95 94 94 93 92 92 91 91 90 89 89 88 881.5 98 97 96 95 94 93 92 92 91 90 89 88 87 86 85 84 83 82 812.0 98 96 95 94 92 91 90 89 88 86 85 84 82 81 80 79 77 76 752.5 97 95 94 92 91 89 88 86 84 83 81 80 78 77 75 73 72 70 693.0 96 94 92 91 89 87 85 83 81 79 77 76 74 72 70 68 66 64 623.5 96 93 91 89 87 85 82 80 78 76 74 72 69 67 65 63 61 58 564.0 95 92 90 88 85 82 80 77 75 72 70 67 65 62 60 57 55 52 504.5 94 92 89 86 83 80 77 75 72 69 66 63 61 58 55 52 49 46 445.0 94 91 88 85 81 78 75 72 69 66 62 59 56 53 50 47 44 41 375.5 93 90 86 83 79 76 72 69 66 62 59 55 52 48 45 42 38 35 316.0 92 89 85 81 77 74 70 66 62 59 55 51 47 44 40 36 33 29 256.5 92 88 84 80 76 72 67 63 59 55 51 47 43 39 35 31 27 23 197.0 91 87 82 78 74 69 65 61 56 52 47 43 39 34 30 26 21 17 127.5 91 86 81 77 72 67 62 58 53 48 44 39 34 30 25 20 16 11 68.0 90 85 80 75 70 65 60 55 50 45 40 35 30 25 20 15 10 5 0
A 370 – 03a
21Perancangan dan pengembangan..., Yeny Pusvyta, FT UI, 2010.
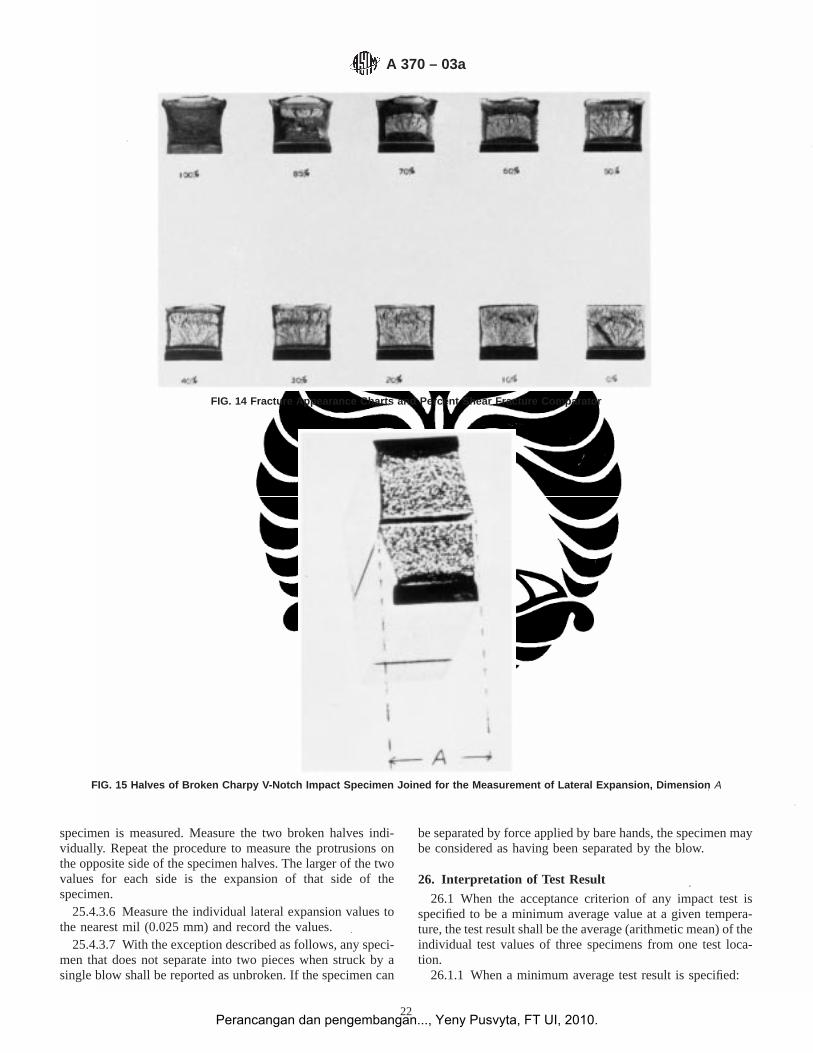
specimen is measured. Measure the two broken halves indi-vidually. Repeat the procedure to measure the protrusions onthe opposite side of the specimen halves. The larger of the twovalues for each side is the expansion of that side of thespecimen.
25.4.3.6 Measure the individual lateral expansion values tothe nearest mil (0.025 mm) and record the values.
25.4.3.7 With the exception described as follows, any speci-men that does not separate into two pieces when struck by asingle blow shall be reported as unbroken. If the specimen can
be separated by force applied by bare hands, the specimen maybe considered as having been separated by the blow.
26. Interpretation of Test Result
26.1 When the acceptance criterion of any impact test isspecified to be a minimum average value at a given tempera-ture, the test result shall be the average (arithmetic mean) of theindividual test values of three specimens from one test loca-tion.
26.1.1 When a minimum average test result is specified:
FIG. 14 Fracture Appearance Charts and Percent Shear Fracture Comparator
FIG. 15 Halves of Broken Charpy V-Notch Impact Specimen Joined for the Measurement of Lateral Expansion, Dimension A
A 370 – 03a
22Perancangan dan pengembangan..., Yeny Pusvyta, FT UI, 2010.
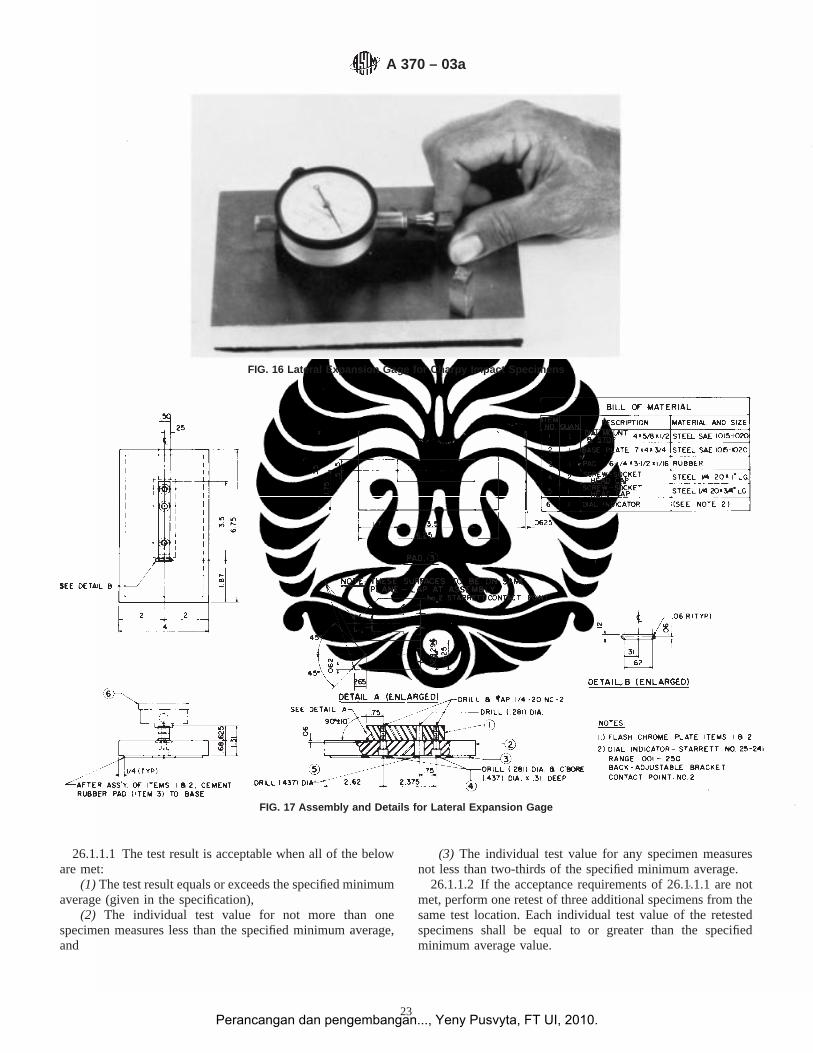
26.1.1.1 The test result is acceptable when all of the beloware met:
(1) The test result equals or exceeds the specified minimumaverage (given in the specification),
(2) The individual test value for not more than onespecimen measures less than the specified minimum average,and
(3) The individual test value for any specimen measuresnot less than two-thirds of the specified minimum average.
26.1.1.2 If the acceptance requirements of 26.1.1.1 are notmet, perform one retest of three additional specimens from thesame test location. Each individual test value of the retestedspecimens shall be equal to or greater than the specifiedminimum average value.
FIG. 16 Lateral Expansion Gage for Charpy Impact Specimens
FIG. 17 Assembly and Details for Lateral Expansion Gage
A 370 – 03a
23Perancangan dan pengembangan..., Yeny Pusvyta, FT UI, 2010.
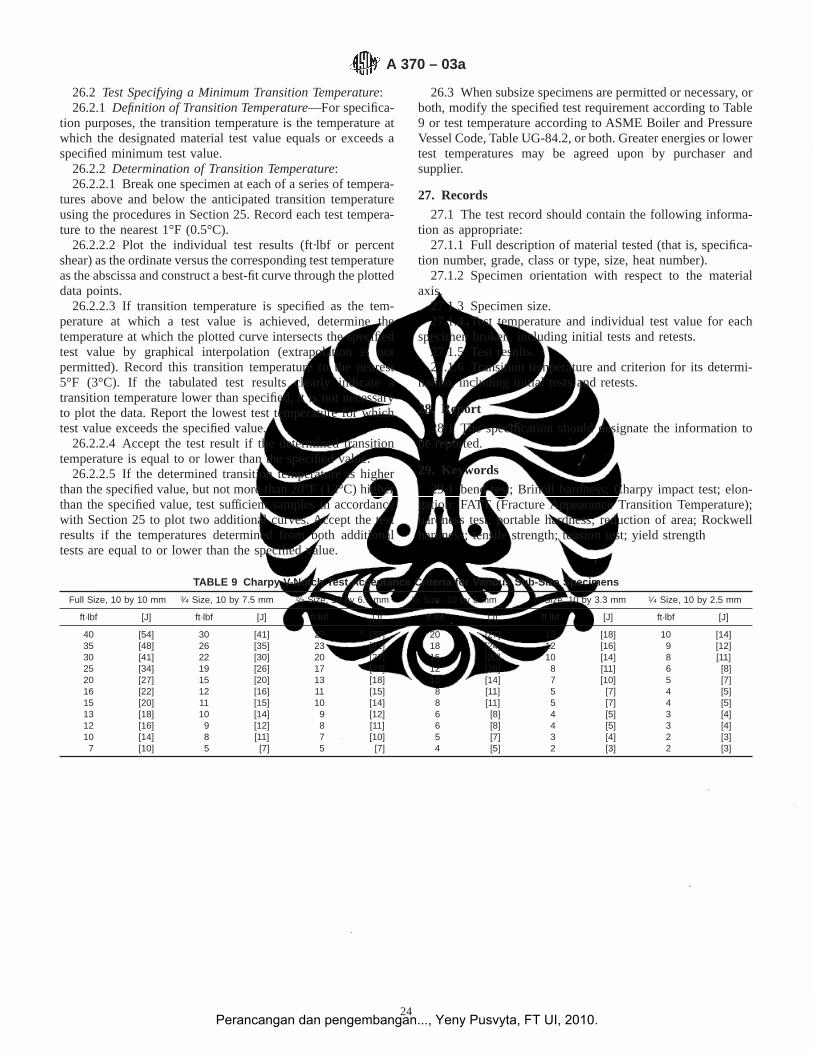
26.2 Test Specifying a Minimum Transition Temperature:26.2.1 Definition of Transition Temperature—For specifica-
tion purposes, the transition temperature is the temperature atwhich the designated material test value equals or exceeds aspecified minimum test value.
26.2.2 Determination of Transition Temperature:26.2.2.1 Break one specimen at each of a series of tempera-
tures above and below the anticipated transition temperatureusing the procedures in Section 25. Record each test tempera-ture to the nearest 1°F (0.5°C).
26.2.2.2 Plot the individual test results (ft·lbf or percentshear) as the ordinate versus the corresponding test temperatureas the abscissa and construct a best-fit curve through the plotteddata points.
26.2.2.3 If transition temperature is specified as the tem-perature at which a test value is achieved, determine thetemperature at which the plotted curve intersects the specifiedtest value by graphical interpolation (extrapolation is notpermitted). Record this transition temperature to the nearest5°F (3°C). If the tabulated test results clearly indicate atransition temperature lower than specified, it is not necessaryto plot the data. Report the lowest test temperature for whichtest value exceeds the specified value.
26.2.2.4 Accept the test result if the determined transitiontemperature is equal to or lower than the specified value.
26.2.2.5 If the determined transition temperature is higherthan the specified value, but not more than 20°F (12°C) higherthan the specified value, test sufficient samples in accordancewith Section 25 to plot two additional curves. Accept the testresults if the temperatures determined from both additionaltests are equal to or lower than the specified value.
26.3 When subsize specimens are permitted or necessary, orboth, modify the specified test requirement according to Table9 or test temperature according to ASME Boiler and PressureVessel Code, Table UG-84.2, or both. Greater energies or lowertest temperatures may be agreed upon by purchaser andsupplier.
27. Records
27.1 The test record should contain the following informa-tion as appropriate:
27.1.1 Full description of material tested (that is, specifica-tion number, grade, class or type, size, heat number).
27.1.2 Specimen orientation with respect to the materialaxis.
27.1.3 Specimen size.27.1.4 Test temperature and individual test value for each
specimen broken, including initial tests and retests.27.1.5 Test results.27.1.6 Transition temperature and criterion for its determi-
nation, including initial tests and retests.
28. Report
28.1 The specification should designate the information tobe reported.
29. Keywords
29.1 bend test; Brinell hardness; Charpy impact test; elon-gation; FATT (Fracture Appearance Transition Temperature);hardness test; portable hardness; reduction of area; Rockwellhardness; tensile strength; tension test; yield strength
TABLE 9 Charpy V-Notch Test Acceptance Criteria for Various Sub-Size Specimens
Full Size, 10 by 10 mm 3⁄4 Size, 10 by 7.5 mm 2⁄3 Size, 10 by 6.7 mm 1⁄2 Size, 10 by 5 mm 1⁄3 Size, 10 by 3.3 mm 1⁄4 Size, 10 by 2.5 mm
ft·lbf [J] ft·lbf [J] ft·lbf [J] ft·lbf [J] ft·lbf [J] ft·lbf [J]
40 [54] 30 [41] 27 [37] 20 [27] 13 [18] 10 [14]35 [48] 26 [35] 23 [31] 18 [24] 12 [16] 9 [12]30 [41] 22 [30] 20 [27] 15 [20] 10 [14] 8 [11]25 [34] 19 [26] 17 [23] 12 [16] 8 [11] 6 [8]20 [27] 15 [20] 13 [18] 10 [14] 7 [10] 5 [7]16 [22] 12 [16] 11 [15] 8 [11] 5 [7] 4 [5]15 [20] 11 [15] 10 [14] 8 [11] 5 [7] 4 [5]13 [18] 10 [14] 9 [12] 6 [8] 4 [5] 3 [4]12 [16] 9 [12] 8 [11] 6 [8] 4 [5] 3 [4]10 [14] 8 [11] 7 [10] 5 [7] 3 [4] 2 [3]7 [10] 5 [7] 5 [7] 4 [5] 2 [3] 2 [3]
A 370 – 03a
24Perancangan dan pengembangan..., Yeny Pusvyta, FT UI, 2010.
ANNEXES
(Mandatory Information)
A1. STEEL BAR PRODUCTS
A1.1 Scope
A1.1.1 This supplement delineates only those details whichare peculiar to hot-rolled and cold-finished steel bars and arenot covered in the general section of these test methods.
A1.2 Orientation of Test Specimens
A1.2.1 Carbon and alloy steel bars and bar-size shapes, dueto their relatively small cross-sectional dimensions, are cus-tomarily tested in the longitudinal direction. In special caseswhere size permits and the fabrication or service of a partjustifies testing in a transverse direction, the selection andlocation of test or tests are a matter of agreement between themanufacturer and the purchaser.
A1.3 Tension Test
A1.3.1 Carbon Steel Bars—Carbon steel bars are not com-monly specified to tensile requirements in the as-rolled condi-tion for sizes of rounds, squares, hexagons, and octagons under1⁄2 in. (13 mm) in diameter or distance between parallel faces
nor for other bar-size sections, other than flats, less than 1 in.2
(645 mm2) in cross-sectional area.A1.3.2 Alloy Steel Bars—Alloy steel bars are usually not
tested in the as-rolled condition.A1.3.3 When tension tests are specified, the practice for
selecting test specimens for hot-rolled and cold-finished steelbars of various sizes shall be in accordance with Table A1.1,unless otherwise specified in the product specification.
A1.4 Bend Test
A1.4.1 When bend tests are specified, the recommendedpractice for hot-rolled and cold-finished steel bars shall be inaccordance with Table A1.2.
A1.5 Hardness Test
A1.5.1 Hardness Tests on Bar Products—flats, rounds,squares, hexagons and octagons—is conducted on the surfaceafter a minimum removal of 0.015 in. to provide for accuratehardness penetration.
A 370 – 03a
25Perancangan dan pengembangan..., Yeny Pusvyta, FT UI, 2010.

TABLE A1.1 Practices for Selecting Tension Test Specimens for Steel Bar Products
NOTE 1—For bar sections where it is difficult to determine the cross-sectional area by simple measurement, the area in square inches may be calculatedby dividing the weight per linear inch of specimen in pounds by 0.2833 (weight of 1 in.3 of steel) or by dividing the weight per linear foot of specimenby 3.4 (weight of steel 1 in. square and 1 ft long).
Thickness, in. (mm) Width, in. (mm) Hot-Rolled Bars Cold-Finished Bars
Flats
Under 5⁄8 (16) Up to 11⁄2 (38), incl Full section by 8-in. (203-mm) gagelength (Fig. 4).
Mill reduced section to 2-in. (51-mm) gagelength and approximately 25% less thantest specimen width.
Over 11⁄2 (38) Full section, or mill to 11⁄2 in. (38 mm)wide by 8-in. (203-mm) gage length (Fig.4).
Mill reduced section to 2-in. gage lengthand 11⁄2 in. wide.
5⁄8 to 11⁄2 (16 to 38),excl
Up to 11⁄2 (38), incl Full section by 8-in. gage length or ma-chine standard 1⁄2 by 2-in. (13 by 51-mm)gage length specimen from center of sec-tion (Fig. 5).
Mill reduced section to 2-in. (51-mm) gagelength and approximately 25% less thantest specimen width or machine standard1⁄2 by 2-in. (13 by 51-mm) gage lengthspecimen from center of section (Fig. 5).
Over 11⁄2 (38) Full section, or mill 11⁄2 in. (38 mm) widthby 8-in. (203-mm) gage length (Fig. 4) ormachine standard 1⁄2 by 2-in. gage (13 by51-mm) gage length specimen from mid-way between edge and center of section(Fig. 5).
Mill reduced section to 2-in. gage lengthand 11⁄2 in. wide or machine standard 1⁄2by 2-in. gage length specimen from mid-way between edge and center of section(Fig. 5).
11⁄2 (38) and over Full section by 8-in. (203-mm) gagelength, or machine standard 1⁄2 by 2-in.(13 by 51-mm) gage length specimenfrom midway between surface and center(Fig. 5).
Machine standard 1⁄2 by 2-in. (13 by 51-mm) gage length specimen from midwaybetween surface and center (Fig. 5).
Rounds, Squares, Hexagons, and Octagons
Diameter or DistanceBetween ParallelFaces, in. (mm)
Hot-Rolled Bars Cold-Finished Bars
Under 5⁄8 Full section by 8-in. (203-mm) gage length on ma-chine to subsize specimen (Fig. 5).
Machine to sub-size specimen (Fig. 5).
5⁄8 to 11⁄2 (16 to 38), excl Full section by 8-in. (203-mm) gage length or ma-chine standard 1⁄2 in. by 2-in. (13 by 51-mm) gagelength specimen from center of section (Fig. 5).
Machine standard 1⁄2 in. by 2-in. gage length specimen fromcenter of section (Fig. 5).
11⁄2 (38) and over Full section by 8-in. (203-mm) gage length or ma-chine standard 1⁄2 in. by 2-in. (13 by 51-mm) gagelength specimen from midway between surface andcenter of section (Fig. 5).
Machine standard 1⁄2 in. by 2-in. (13 by 51-mm gage lengthspecimen from midway between surface and center of sec-tion (Fig. 5)).
Other Bar-Size Sections
All sizes Full section by 8-in. (203-mm) gage length or pre-pare test specimen 11⁄2 in. (38 mm) wide (if possible)by 8-in. (203-mm) gage length.
Mill reduced section to 2-in. (51-mm) gage length and ap-proximately 25% less than test specimen width.
A 370 – 03a
26Perancangan dan pengembangan..., Yeny Pusvyta, FT UI, 2010.
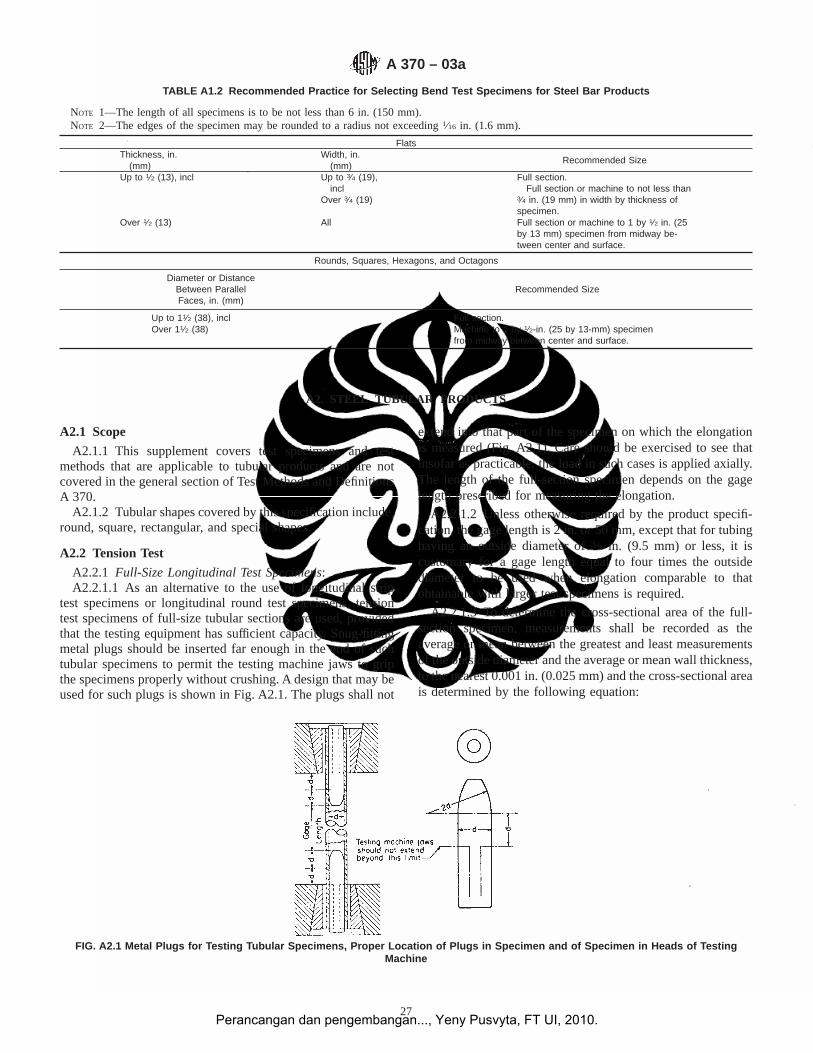
A2. STEEL TUBULAR PRODUCTS
A2.1 Scope
A2.1.1 This supplement covers test specimens and testmethods that are applicable to tubular products and are notcovered in the general section of Test Methods and DefinitionsA 370.
A2.1.2 Tubular shapes covered by this specification include,round, square, rectangular, and special shapes.
A2.2 Tension Test
A2.2.1 Full-Size Longitudinal Test Specimens:A2.2.1.1 As an alternative to the use of longitudinal strip
test specimens or longitudinal round test specimens, tensiontest specimens of full-size tubular sections are used, providedthat the testing equipment has sufficient capacity. Snug-fittingmetal plugs should be inserted far enough in the end of suchtubular specimens to permit the testing machine jaws to gripthe specimens properly without crushing. A design that may beused for such plugs is shown in Fig. A2.1. The plugs shall not
extend into that part of the specimen on which the elongationis measured (Fig. A2.1). Care should be exercised to see thatinsofar as practicable, the load in such cases is applied axially.The length of the full-section specimen depends on the gagelength prescribed for measuring the elongation.
A2.2.1.2 Unless otherwise required by the product specifi-cation, the gage length is 2 in. or 50 mm, except that for tubinghaving an outside diameter of3⁄8 in. (9.5 mm) or less, it iscustomary for a gage length equal to four times the outsidediameter to be used when elongation comparable to thatobtainable with larger test specimens is required.
A2.2.1.3 To determine the cross-sectional area of the full-section specimen, measurements shall be recorded as theaverage or mean between the greatest and least measurementsof the outside diameter and the average or mean wall thickness,to the nearest 0.001 in. (0.025 mm) and the cross-sectional areais determined by the following equation:
TABLE A1.2 Recommended Practice for Selecting Bend Test Specimens for Steel Bar Products
NOTE 1—The length of all specimens is to be not less than 6 in. (150 mm).NOTE 2—The edges of the specimen may be rounded to a radius not exceeding1⁄16 in. (1.6 mm).
FlatsThickness, in.
(mm)Width, in.
(mm)Recommended Size
Up to 1⁄2 (13), incl Up to 3⁄4 (19),incl
Over 3⁄4 (19)
Full section.Full section or machine to not less than
3⁄4 in. (19 mm) in width by thickness ofspecimen.
Over 1⁄2 (13) All Full section or machine to 1 by 1⁄2 in. (25by 13 mm) specimen from midway be-tween center and surface.
Rounds, Squares, Hexagons, and Octagons
Diameter or DistanceBetween ParallelFaces, in. (mm)
Recommended Size
Up to 11⁄2 (38), incl Full section.Over 11⁄2 (38) Machine to 1 by 1⁄2-in. (25 by 13-mm) specimen
from midway between center and surface.
FIG. A2.1 Metal Plugs for Testing Tubular Specimens, Proper Location of Plugs in Specimen and of Specimen in Heads of TestingMachine
A 370 – 03a
27Perancangan dan pengembangan..., Yeny Pusvyta, FT UI, 2010.
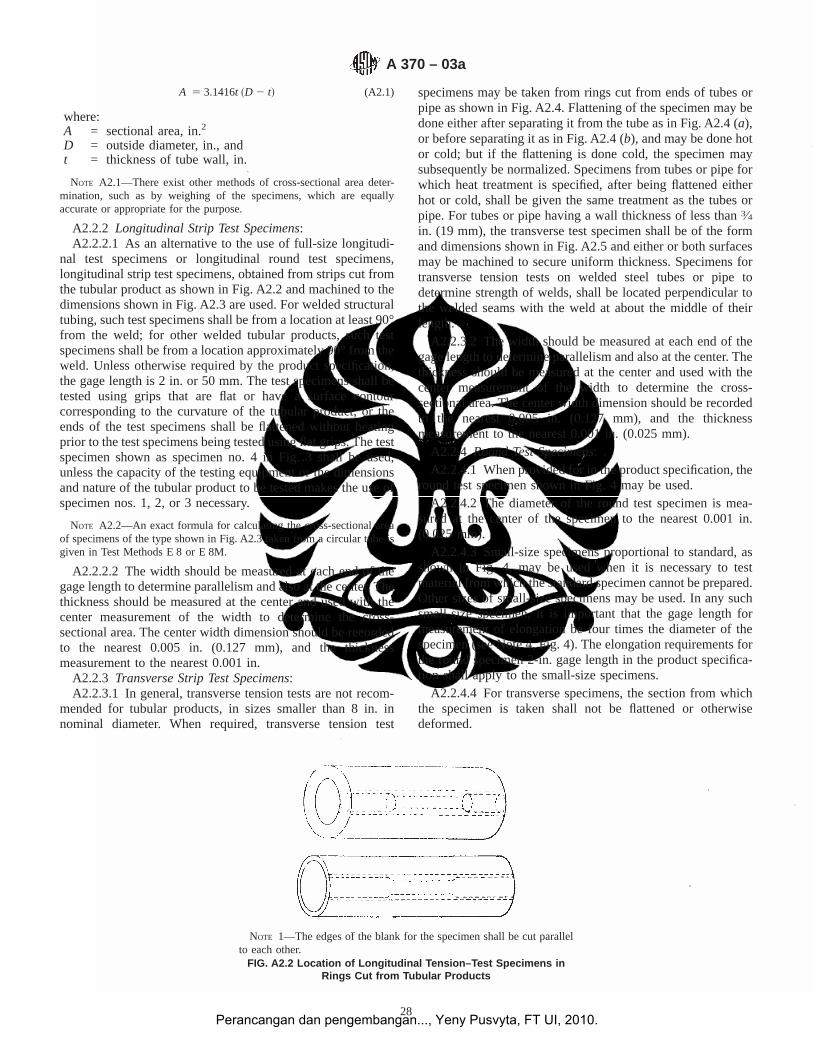
A 5 3.1416t ~D 2 t! (A2.1)
where:A = sectional area, in.2
D = outside diameter, in., andt = thickness of tube wall, in.
NOTE A2.1—There exist other methods of cross-sectional area deter-mination, such as by weighing of the specimens, which are equallyaccurate or appropriate for the purpose.
A2.2.2 Longitudinal Strip Test Specimens:A2.2.2.1 As an alternative to the use of full-size longitudi-
nal test specimens or longitudinal round test specimens,longitudinal strip test specimens, obtained from strips cut fromthe tubular product as shown in Fig. A2.2 and machined to thedimensions shown in Fig. A2.3 are used. For welded structuraltubing, such test specimens shall be from a location at least 90°from the weld; for other welded tubular products, such testspecimens shall be from a location approximately 90° from theweld. Unless otherwise required by the product specification,the gage length is 2 in. or 50 mm. The test specimens shall betested using grips that are flat or have a surface contourcorresponding to the curvature of the tubular product, or theends of the test specimens shall be flattened without heatingprior to the test specimens being tested using flat grips. The testspecimen shown as specimen no. 4 in Fig. 3 shall be used,unless the capacity of the testing equipment or the dimensionsand nature of the tubular product to be tested makes the use ofspecimen nos. 1, 2, or 3 necessary.
NOTE A2.2—An exact formula for calculating the cross-sectional areaof specimens of the type shown in Fig. A2.3 taken from a circular tube isgiven in Test Methods E 8 or E 8M.
A2.2.2.2 The width should be measured at each end of thegage length to determine parallelism and also at the center. Thethickness should be measured at the center and used with thecenter measurement of the width to determine the cross-sectional area. The center width dimension should be recordedto the nearest 0.005 in. (0.127 mm), and the thicknessmeasurement to the nearest 0.001 in.
A2.2.3 Transverse Strip Test Specimens:A2.2.3.1 In general, transverse tension tests are not recom-
mended for tubular products, in sizes smaller than 8 in. innominal diameter. When required, transverse tension test
specimens may be taken from rings cut from ends of tubes orpipe as shown in Fig. A2.4. Flattening of the specimen may bedone either after separating it from the tube as in Fig. A2.4 (a),or before separating it as in Fig. A2.4 (b), and may be done hotor cold; but if the flattening is done cold, the specimen maysubsequently be normalized. Specimens from tubes or pipe forwhich heat treatment is specified, after being flattened eitherhot or cold, shall be given the same treatment as the tubes orpipe. For tubes or pipe having a wall thickness of less than3⁄4in. (19 mm), the transverse test specimen shall be of the formand dimensions shown in Fig. A2.5 and either or both surfacesmay be machined to secure uniform thickness. Specimens fortransverse tension tests on welded steel tubes or pipe todetermine strength of welds, shall be located perpendicular tothe welded seams with the weld at about the middle of theirlength.
A2.2.3.2 The width should be measured at each end of thegage length to determine parallelism and also at the center. Thethickness should be measured at the center and used with thecenter measurement of the width to determine the cross-sectional area. The center width dimension should be recordedto the nearest 0.005 in. (0.127 mm), and the thicknessmeasurement to the nearest 0.001 in. (0.025 mm).
A2.2.4 Round Test Specimens:A2.2.4.1 When provided for in the product specification, the
round test specimen shown in Fig. 4 may be used.A2.2.4.2 The diameter of the round test specimen is mea-
sured at the center of the specimen to the nearest 0.001 in.(0.025 mm).
A2.2.4.3 Small-size specimens proportional to standard, asshown in Fig. 4, may be used when it is necessary to testmaterial from which the standard specimen cannot be prepared.Other sizes of small-size specimens may be used. In any suchsmall-size specimen, it is important that the gage length formeasurement of elongation be four times the diameter of thespecimen (see Note 4, Fig. 4). The elongation requirements forthe round specimen 2-in. gage length in the product specifica-tion shall apply to the small-size specimens.
A2.2.4.4 For transverse specimens, the section from whichthe specimen is taken shall not be flattened or otherwisedeformed.
NOTE 1—The edges of the blank for the specimen shall be cut parallelto each other.
FIG. A2.2 Location of Longitudinal Tension–Test Specimens inRings Cut from Tubular Products
A 370 – 03a
28Perancangan dan pengembangan..., Yeny Pusvyta, FT UI, 2010.
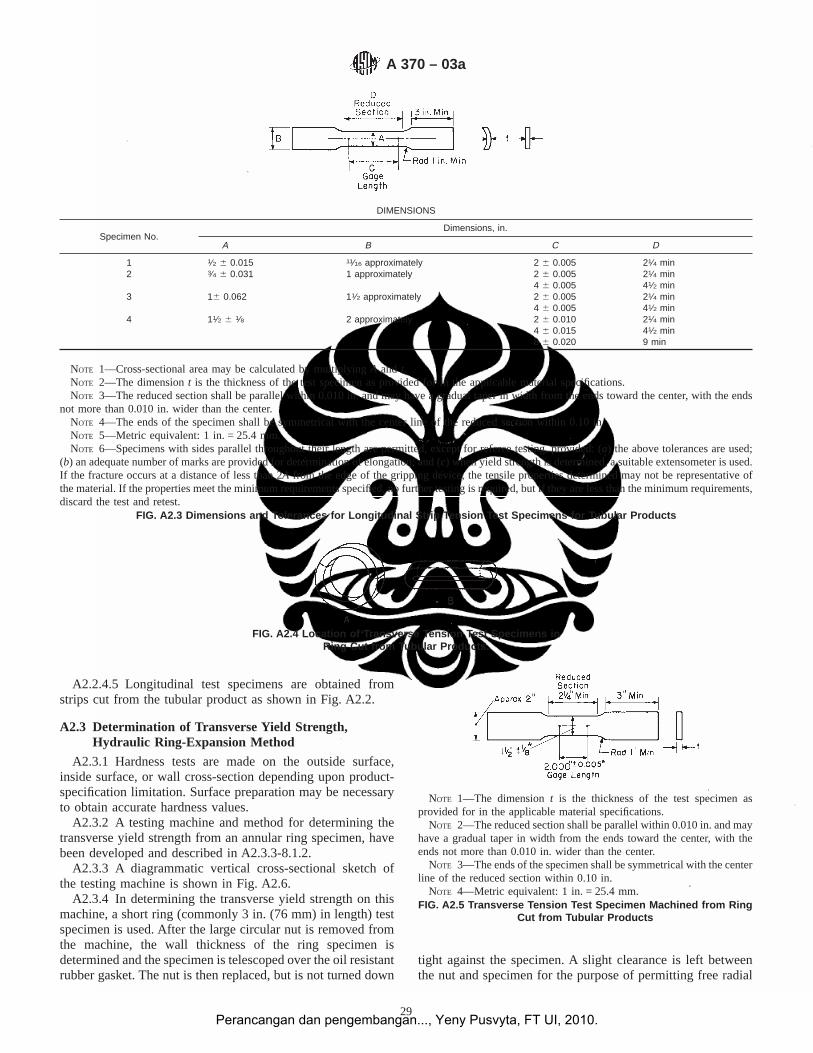
A2.2.4.5 Longitudinal test specimens are obtained fromstrips cut from the tubular product as shown in Fig. A2.2.
A2.3 Determination of Transverse Yield Strength,Hydraulic Ring-Expansion Method
A2.3.1 Hardness tests are made on the outside surface,inside surface, or wall cross-section depending upon product-specification limitation. Surface preparation may be necessaryto obtain accurate hardness values.
A2.3.2 A testing machine and method for determining thetransverse yield strength from an annular ring specimen, havebeen developed and described in A2.3.3-8.1.2.
A2.3.3 A diagrammatic vertical cross-sectional sketch ofthe testing machine is shown in Fig. A2.6.
A2.3.4 In determining the transverse yield strength on thismachine, a short ring (commonly 3 in. (76 mm) in length) testspecimen is used. After the large circular nut is removed fromthe machine, the wall thickness of the ring specimen isdetermined and the specimen is telescoped over the oil resistantrubber gasket. The nut is then replaced, but is not turned down
tight against the specimen. A slight clearance is left betweenthe nut and specimen for the purpose of permitting free radial
DIMENSIONS
Specimen No.Dimensions, in.
A B C D
1 1⁄2 6 0.015 11⁄16 approximately 2 6 0.005 21⁄4 min2 3⁄4 6 0.031 1 approximately 2 6 0.005
4 6 0.00521⁄4 min41⁄2 min
3 16 0.062 11⁄2 approximately 2 6 0.0054 6 0.005
21⁄4 min41⁄2 min
4 11⁄2 6 1⁄8 2 approximately 2 6 0.0104 6 0.0158 6 0.020
21⁄4 min41⁄2 min9 min
NOTE 1—Cross-sectional area may be calculated by multiplyingA and t.NOTE 2—The dimensiont is the thickness of the test specimen as provided for in the applicable material specifications.NOTE 3—The reduced section shall be parallel within 0.010 in. and may have a gradual taper in width from the ends toward the center, with the ends
not more than 0.010 in. wider than the center.NOTE 4—The ends of the specimen shall be symmetrical with the center line of the reduced section within 0.10 in.NOTE 5—Metric equivalent: 1 in. = 25.4 mm.NOTE 6—Specimens with sides parallel throughout their length are permitted, except for referee testing, provided: (a) the above tolerances are used;
(b) an adequate number of marks are provided for determination of elongation; and (c) when yield strength is determined, a suitable extensometer is used.If the fracture occurs at a distance of less than 2A from the edge of the gripping device, the tensile properties determined may not be representative ofthe material. If the properties meet the minimum requirements specified, no further testing is required, but if they are less than the minimum requirements,discard the test and retest.
FIG. A2.3 Dimensions and Tolerances for Longitudinal Strip Tension Test Specimens for Tubular Products
FIG. A2.4 Location of Transverse Tension Test Specimens inRing Cut from Tubular Products.
NOTE 1—The dimensiont is the thickness of the test specimen asprovided for in the applicable material specifications.
NOTE 2—The reduced section shall be parallel within 0.010 in. and mayhave a gradual taper in width from the ends toward the center, with theends not more than 0.010 in. wider than the center.
NOTE 3—The ends of the specimen shall be symmetrical with the centerline of the reduced section within 0.10 in.
NOTE 4—Metric equivalent: 1 in. = 25.4 mm.FIG. A2.5 Transverse Tension Test Specimen Machined from Ring
Cut from Tubular Products
A 370 – 03a
29Perancangan dan pengembangan..., Yeny Pusvyta, FT UI, 2010.
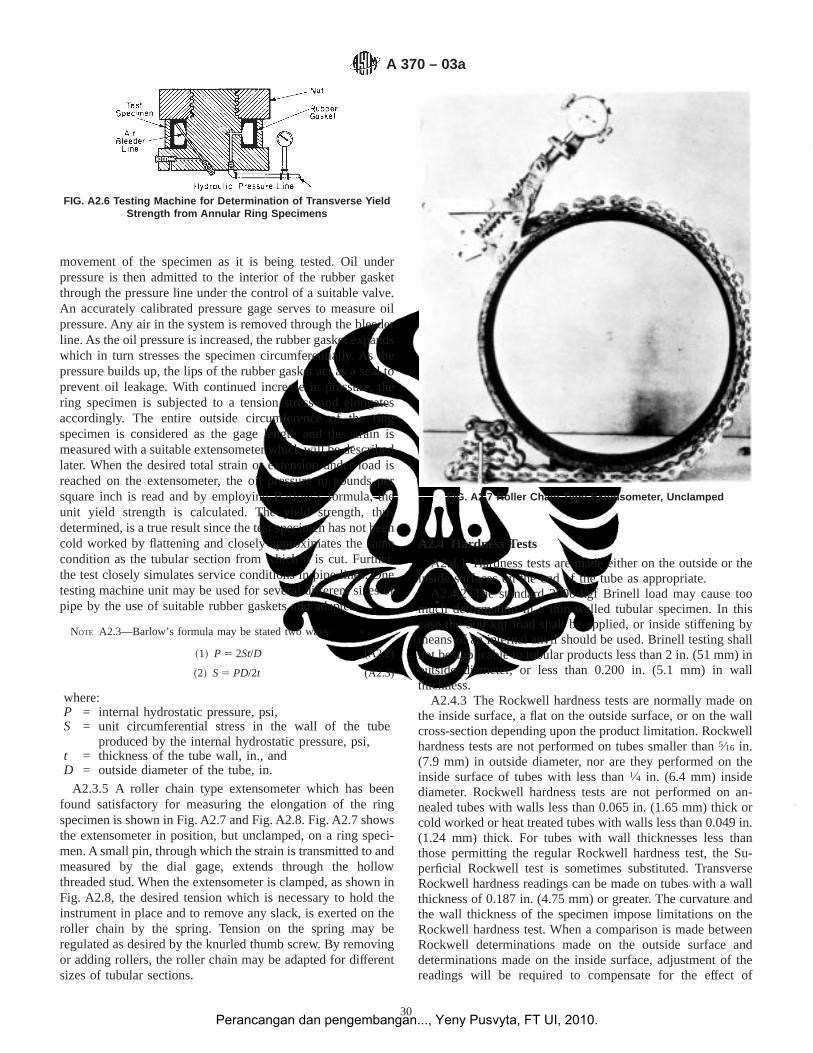
movement of the specimen as it is being tested. Oil underpressure is then admitted to the interior of the rubber gasketthrough the pressure line under the control of a suitable valve.An accurately calibrated pressure gage serves to measure oilpressure. Any air in the system is removed through the bleederline. As the oil pressure is increased, the rubber gasket expandswhich in turn stresses the specimen circumferentially. As thepressure builds up, the lips of the rubber gasket act as a seal toprevent oil leakage. With continued increase in pressure, thering specimen is subjected to a tension stress and elongatesaccordingly. The entire outside circumference of the ringspecimen is considered as the gage length and the strain ismeasured with a suitable extensometer which will be describedlater. When the desired total strain or extension under load isreached on the extensometer, the oil pressure in pounds persquare inch is read and by employing Barlow’s formula, theunit yield strength is calculated. The yield strength, thusdetermined, is a true result since the test specimen has not beencold worked by flattening and closely approximates the samecondition as the tubular section from which it is cut. Further,the test closely simulates service conditions in pipe lines. Onetesting machine unit may be used for several different sizes ofpipe by the use of suitable rubber gaskets and adapters.
NOTE A2.3—Barlow’s formula may be stated two ways:
~1! P 5 2St/D (A2.2)
~2! S5 PD/2t (A2.3)
where:P = internal hydrostatic pressure, psi,S = unit circumferential stress in the wall of the tube
produced by the internal hydrostatic pressure, psi,t = thickness of the tube wall, in., andD = outside diameter of the tube, in.
A2.3.5 A roller chain type extensometer which has beenfound satisfactory for measuring the elongation of the ringspecimen is shown in Fig. A2.7 and Fig. A2.8. Fig. A2.7 showsthe extensometer in position, but unclamped, on a ring speci-men. A small pin, through which the strain is transmitted to andmeasured by the dial gage, extends through the hollowthreaded stud. When the extensometer is clamped, as shown inFig. A2.8, the desired tension which is necessary to hold theinstrument in place and to remove any slack, is exerted on theroller chain by the spring. Tension on the spring may beregulated as desired by the knurled thumb screw. By removingor adding rollers, the roller chain may be adapted for differentsizes of tubular sections.
A2.4 Hardness Tests
A2.4.1 Hardness tests are made either on the outside or theinside surfaces on the end of the tube as appropriate.
A2.4.2 The standard 3000-kgf Brinell load may cause toomuch deformation in a thin-walled tubular specimen. In thiscase the 500-kgf load shall be applied, or inside stiffening bymeans of an internal anvil should be used. Brinell testing shallnot be applicable to tubular products less than 2 in. (51 mm) inoutside diameter, or less than 0.200 in. (5.1 mm) in wallthickness.
A2.4.3 The Rockwell hardness tests are normally made onthe inside surface, a flat on the outside surface, or on the wallcross-section depending upon the product limitation. Rockwellhardness tests are not performed on tubes smaller than5⁄16 in.(7.9 mm) in outside diameter, nor are they performed on theinside surface of tubes with less than1⁄4 in. (6.4 mm) insidediameter. Rockwell hardness tests are not performed on an-nealed tubes with walls less than 0.065 in. (1.65 mm) thick orcold worked or heat treated tubes with walls less than 0.049 in.(1.24 mm) thick. For tubes with wall thicknesses less thanthose permitting the regular Rockwell hardness test, the Su-perficial Rockwell test is sometimes substituted. TransverseRockwell hardness readings can be made on tubes with a wallthickness of 0.187 in. (4.75 mm) or greater. The curvature andthe wall thickness of the specimen impose limitations on theRockwell hardness test. When a comparison is made betweenRockwell determinations made on the outside surface anddeterminations made on the inside surface, adjustment of thereadings will be required to compensate for the effect of
FIG. A2.6 Testing Machine for Determination of Transverse YieldStrength from Annular Ring Specimens
FIG. A2.7 Roller Chain Type Extensometer, Unclamped
A 370 – 03a
30Perancangan dan pengembangan..., Yeny Pusvyta, FT UI, 2010.
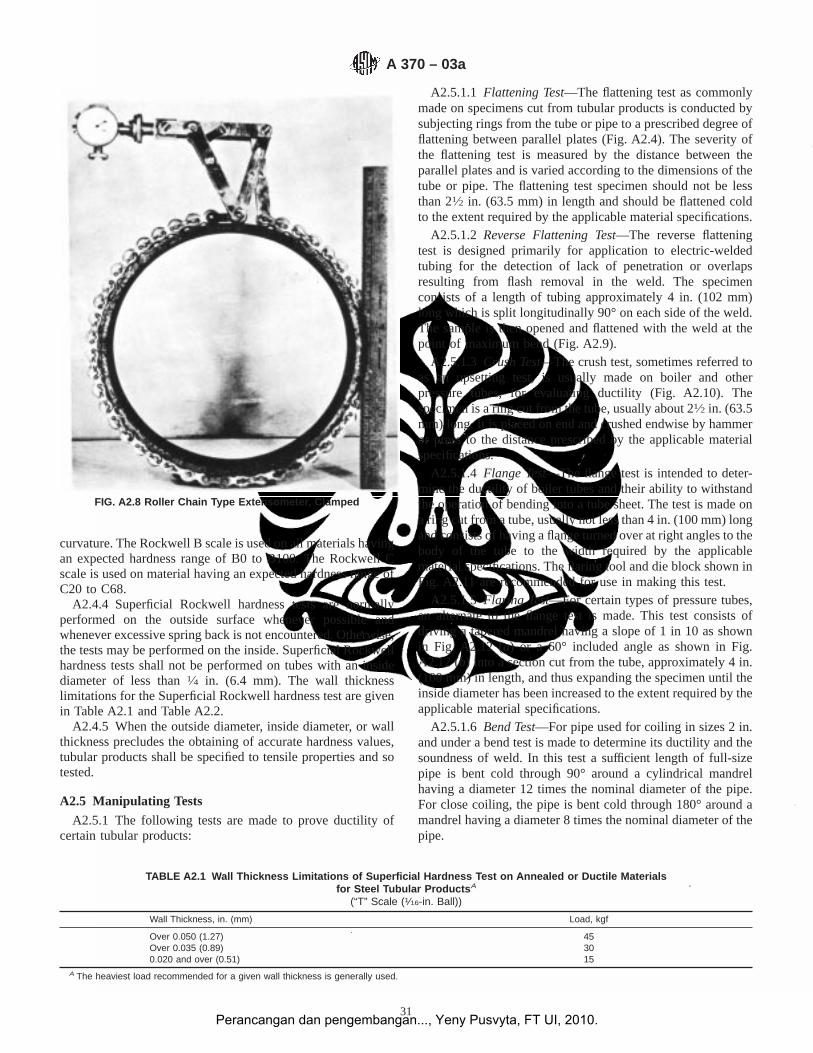
curvature. The Rockwell B scale is used on all materials havingan expected hardness range of B0 to B100. The Rockwell Cscale is used on material having an expected hardness range ofC20 to C68.
A2.4.4 Superficial Rockwell hardness tests are normallyperformed on the outside surface whenever possible andwhenever excessive spring back is not encountered. Otherwise,the tests may be performed on the inside. Superficial Rockwellhardness tests shall not be performed on tubes with an insidediameter of less than1⁄4 in. (6.4 mm). The wall thicknesslimitations for the Superficial Rockwell hardness test are givenin Table A2.1 and Table A2.2.
A2.4.5 When the outside diameter, inside diameter, or wallthickness precludes the obtaining of accurate hardness values,tubular products shall be specified to tensile properties and sotested.
A2.5 Manipulating Tests
A2.5.1 The following tests are made to prove ductility ofcertain tubular products:
A2.5.1.1 Flattening Test—The flattening test as commonlymade on specimens cut from tubular products is conducted bysubjecting rings from the tube or pipe to a prescribed degree offlattening between parallel plates (Fig. A2.4). The severity ofthe flattening test is measured by the distance between theparallel plates and is varied according to the dimensions of thetube or pipe. The flattening test specimen should not be lessthan 21⁄2 in. (63.5 mm) in length and should be flattened coldto the extent required by the applicable material specifications.
A2.5.1.2 Reverse Flattening Test—The reverse flatteningtest is designed primarily for application to electric-weldedtubing for the detection of lack of penetration or overlapsresulting from flash removal in the weld. The specimenconsists of a length of tubing approximately 4 in. (102 mm)long which is split longitudinally 90° on each side of the weld.The sample is then opened and flattened with the weld at thepoint of maximum bend (Fig. A2.9).
A2.5.1.3 Crush Test—The crush test, sometimes referred toas an upsetting test, is usually made on boiler and otherpressure tubes, for evaluating ductility (Fig. A2.10). Thespecimen is a ring cut from the tube, usually about 21⁄2 in. (63.5mm) long. It is placed on end and crushed endwise by hammeror press to the distance prescribed by the applicable materialspecifications.
A2.5.1.4 Flange Test—The flange test is intended to deter-mine the ductility of boiler tubes and their ability to withstandthe operation of bending into a tube sheet. The test is made ona ring cut from a tube, usually not less than 4 in. (100 mm) longand consists of having a flange turned over at right angles to thebody of the tube to the width required by the applicablematerial specifications. The flaring tool and die block shown inFig. A2.11 are recommended for use in making this test.
A2.5.1.5 Flaring Test—For certain types of pressure tubes,an alternate to the flange test is made. This test consists ofdriving a tapered mandrel having a slope of 1 in 10 as shownin Fig. A2.12 (a) or a 60° included angle as shown in Fig.A2.12 (b) into a section cut from the tube, approximately 4 in.(100 mm) in length, and thus expanding the specimen until theinside diameter has been increased to the extent required by theapplicable material specifications.
A2.5.1.6 Bend Test—For pipe used for coiling in sizes 2 in.and under a bend test is made to determine its ductility and thesoundness of weld. In this test a sufficient length of full-sizepipe is bent cold through 90° around a cylindrical mandrelhaving a diameter 12 times the nominal diameter of the pipe.For close coiling, the pipe is bent cold through 180° around amandrel having a diameter 8 times the nominal diameter of thepipe.
FIG. A2.8 Roller Chain Type Extensometer, Clamped
TABLE A2.1 Wall Thickness Limitations of Superficial Hardness Test on Annealed or Ductile Materialsfor Steel Tubular Products A
(“T” Scale (1⁄16-in. Ball))
Wall Thickness, in. (mm) Load, kgf
Over 0.050 (1.27) 45Over 0.035 (0.89) 300.020 and over (0.51) 15
A The heaviest load recommended for a given wall thickness is generally used.
A 370 – 03a
31Perancangan dan pengembangan..., Yeny Pusvyta, FT UI, 2010.
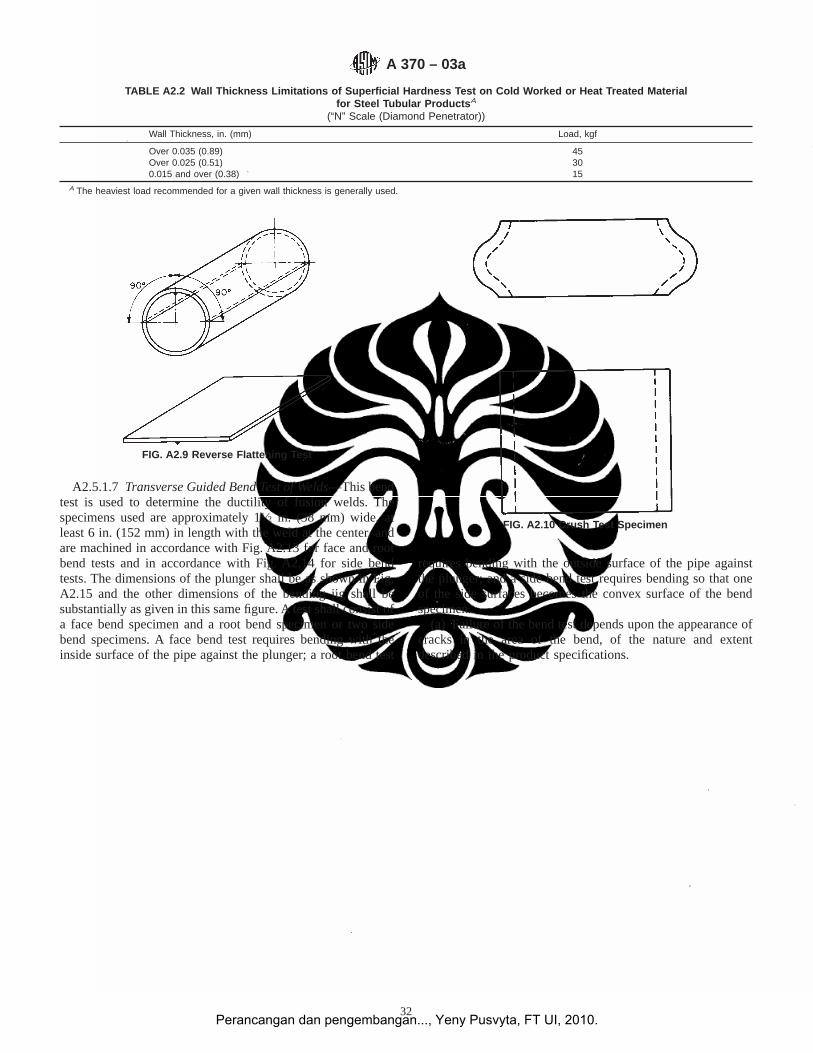
A2.5.1.7 Transverse Guided Bend Test of Welds—This bendtest is used to determine the ductility of fusion welds. Thespecimens used are approximately 11⁄2 in. (38 mm) wide, atleast 6 in. (152 mm) in length with the weld at the center, andare machined in accordance with Fig. A2.13 for face and rootbend tests and in accordance with Fig. A2.14 for side bendtests. The dimensions of the plunger shall be as shown in Fig.A2.15 and the other dimensions of the bending jig shall besubstantially as given in this same figure. A test shall consist ofa face bend specimen and a root bend specimen or two sidebend specimens. A face bend test requires bending with theinside surface of the pipe against the plunger; a root bend test
requires bending with the outside surface of the pipe againstthe plunger; and a side bend test requires bending so that oneof the side surfaces becomes the convex surface of the bendspecimen.
(a) Failure of the bend test depends upon the appearance ofcracks in the area of the bend, of the nature and extentdescribed in the product specifications.
TABLE A2.2 Wall Thickness Limitations of Superficial Hardness Test on Cold Worked or Heat Treated Materialfor Steel Tubular Products A
(“N” Scale (Diamond Penetrator))
Wall Thickness, in. (mm) Load, kgf
Over 0.035 (0.89) 45Over 0.025 (0.51) 300.015 and over (0.38) 15
A The heaviest load recommended for a given wall thickness is generally used.
FIG. A2.9 Reverse Flattening Test
FIG. A2.10 Crush Test Specimen
A 370 – 03a
32Perancangan dan pengembangan..., Yeny Pusvyta, FT UI, 2010.
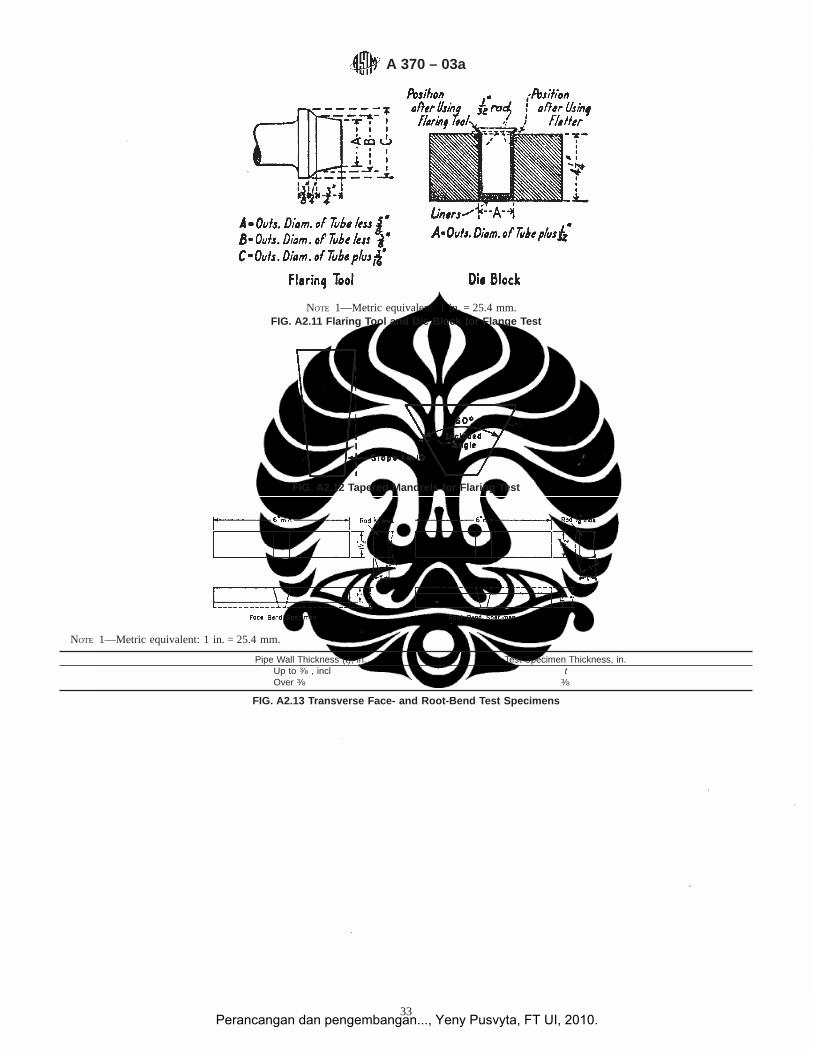
NOTE 1—Metric equivalent: 1 in. = 25.4 mm.FIG. A2.11 Flaring Tool and Die Block for Flange Test
FIG. A2.12 Tapered Mandrels for Flaring Test
NOTE 1—Metric equivalent: 1 in. = 25.4 mm.
Pipe Wall Thickness (t), in. Test Specimen Thickness, in.Up to 3⁄8 , incl tOver 3⁄8 3⁄8
FIG. A2.13 Transverse Face- and Root-Bend Test Specimens
A 370 – 03a
33Perancangan dan pengembangan..., Yeny Pusvyta, FT UI, 2010.
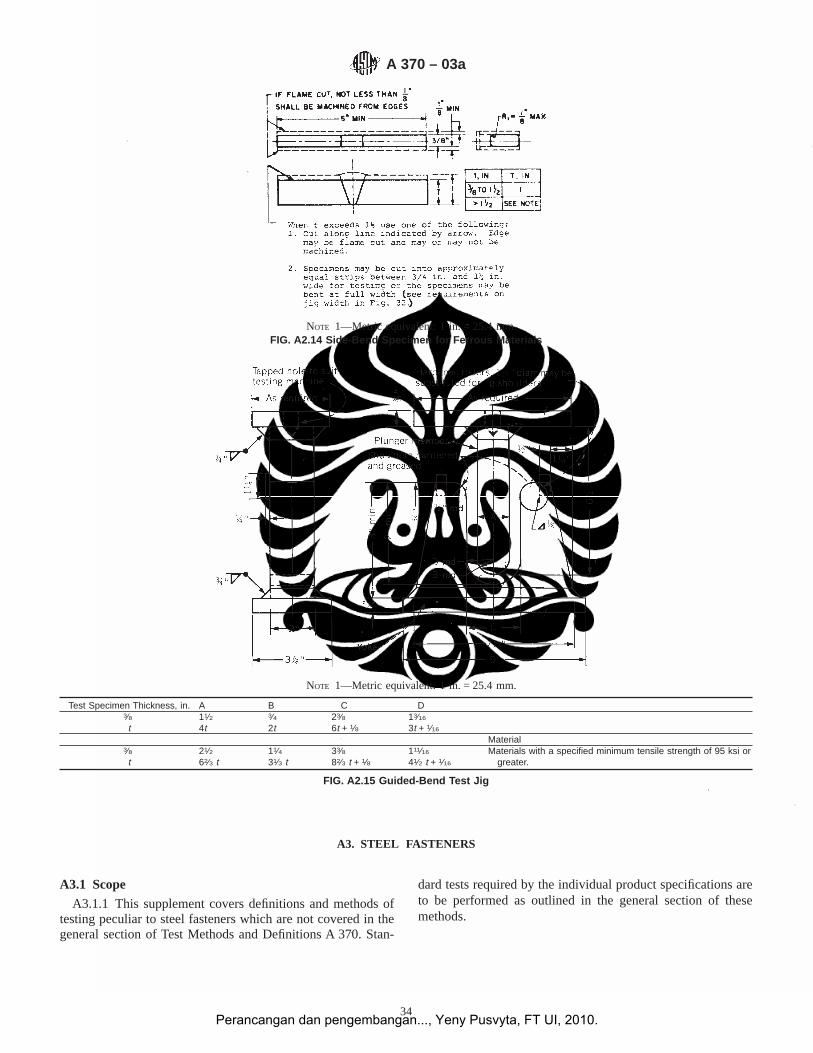
A3. STEEL FASTENERS
A3.1 Scope
A3.1.1 This supplement covers definitions and methods oftesting peculiar to steel fasteners which are not covered in thegeneral section of Test Methods and Definitions A 370. Stan-
dard tests required by the individual product specifications areto be performed as outlined in the general section of thesemethods.
NOTE 1—Metric equivalent: 1 in. = 25.4 mm.FIG. A2.14 Side-Bend Specimen for Ferrous Materials
NOTE 1—Metric equivalent: 1 in. = 25.4 mm.
Test Specimen Thickness, in. A B C D3⁄8t
11⁄24t
3⁄42t
23⁄86t + 1⁄8
13⁄16
3t + 1⁄16
Material3⁄8t
21⁄262⁄3 t
11⁄431⁄3 t
33⁄882⁄3 t + 1⁄8
111⁄16
41⁄2 t + 1⁄16
Materials with a specified minimum tensile strength of 95 ksi orgreater.
FIG. A2.15 Guided-Bend Test Jig
A 370 – 03a
34Perancangan dan pengembangan..., Yeny Pusvyta, FT UI, 2010.
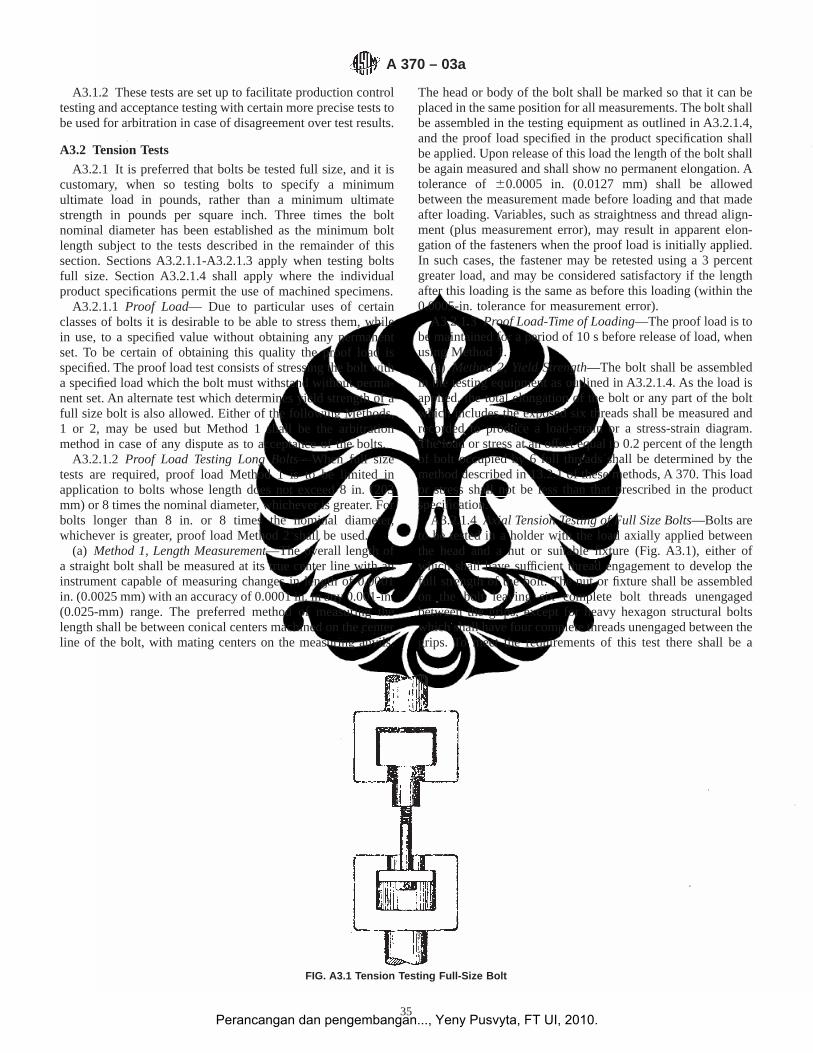
A3.1.2 These tests are set up to facilitate production controltesting and acceptance testing with certain more precise tests tobe used for arbitration in case of disagreement over test results.
A3.2 Tension Tests
A3.2.1 It is preferred that bolts be tested full size, and it iscustomary, when so testing bolts to specify a minimumultimate load in pounds, rather than a minimum ultimatestrength in pounds per square inch. Three times the boltnominal diameter has been established as the minimum boltlength subject to the tests described in the remainder of thissection. Sections A3.2.1.1-A3.2.1.3 apply when testing boltsfull size. Section A3.2.1.4 shall apply where the individualproduct specifications permit the use of machined specimens.
A3.2.1.1 Proof Load— Due to particular uses of certainclasses of bolts it is desirable to be able to stress them, whilein use, to a specified value without obtaining any permanentset. To be certain of obtaining this quality the proof load isspecified. The proof load test consists of stressing the bolt witha specified load which the bolt must withstand without perma-nent set. An alternate test which determines yield strength of afull size bolt is also allowed. Either of the following Methods,1 or 2, may be used but Method 1 shall be the arbitrationmethod in case of any dispute as to acceptance of the bolts.
A3.2.1.2 Proof Load Testing Long Bolts—When full sizetests are required, proof load Method 1 is to be limited inapplication to bolts whose length does not exceed 8 in. (203mm) or 8 times the nominal diameter, whichever is greater. Forbolts longer than 8 in. or 8 times the nominal diameter,whichever is greater, proof load Method 2 shall be used.
(a) Method 1, Length Measurement—The overall length ofa straight bolt shall be measured at its true center line with aninstrument capable of measuring changes in length of 0.0001in. (0.0025 mm) with an accuracy of 0.0001 in. in any 0.001-in.(0.025-mm) range. The preferred method of measuring thelength shall be between conical centers machined on the centerline of the bolt, with mating centers on the measuring anvils.
The head or body of the bolt shall be marked so that it can beplaced in the same position for all measurements. The bolt shallbe assembled in the testing equipment as outlined in A3.2.1.4,and the proof load specified in the product specification shallbe applied. Upon release of this load the length of the bolt shallbe again measured and shall show no permanent elongation. Atolerance of 60.0005 in. (0.0127 mm) shall be allowedbetween the measurement made before loading and that madeafter loading. Variables, such as straightness and thread align-ment (plus measurement error), may result in apparent elon-gation of the fasteners when the proof load is initially applied.In such cases, the fastener may be retested using a 3 percentgreater load, and may be considered satisfactory if the lengthafter this loading is the same as before this loading (within the0.0005-in. tolerance for measurement error).
A3.2.1.3 Proof Load-Time of Loading—The proof load is tobe maintained for a period of 10 s before release of load, whenusing Method 1.
(a) Method 2, Yield Strength—The bolt shall be assembledin the testing equipment as outlined in A3.2.1.4. As the load isapplied, the total elongation of the bolt or any part of the boltwhich includes the exposed six threads shall be measured andrecorded to produce a load-strain or a stress-strain diagram.The load or stress at an offset equal to 0.2 percent of the lengthof bolt occupied by 6 full threads shall be determined by themethod described in 13.2.1 of these methods, A 370. This loador stress shall not be less than that prescribed in the productspecification.
A3.2.1.4 Axial Tension Testing of Full Size Bolts—Bolts areto be tested in a holder with the load axially applied betweenthe head and a nut or suitable fixture (Fig. A3.1), either ofwhich shall have sufficient thread engagement to develop thefull strength of the bolt. The nut or fixture shall be assembledon the bolt leaving six complete bolt threads unengagedbetween the grips, except for heavy hexagon structural boltswhich shall have four complete threads unengaged between thegrips. To meet the requirements of this test there shall be a
FIG. A3.1 Tension Testing Full-Size Bolt
A 370 – 03a
35Perancangan dan pengembangan..., Yeny Pusvyta, FT UI, 2010.
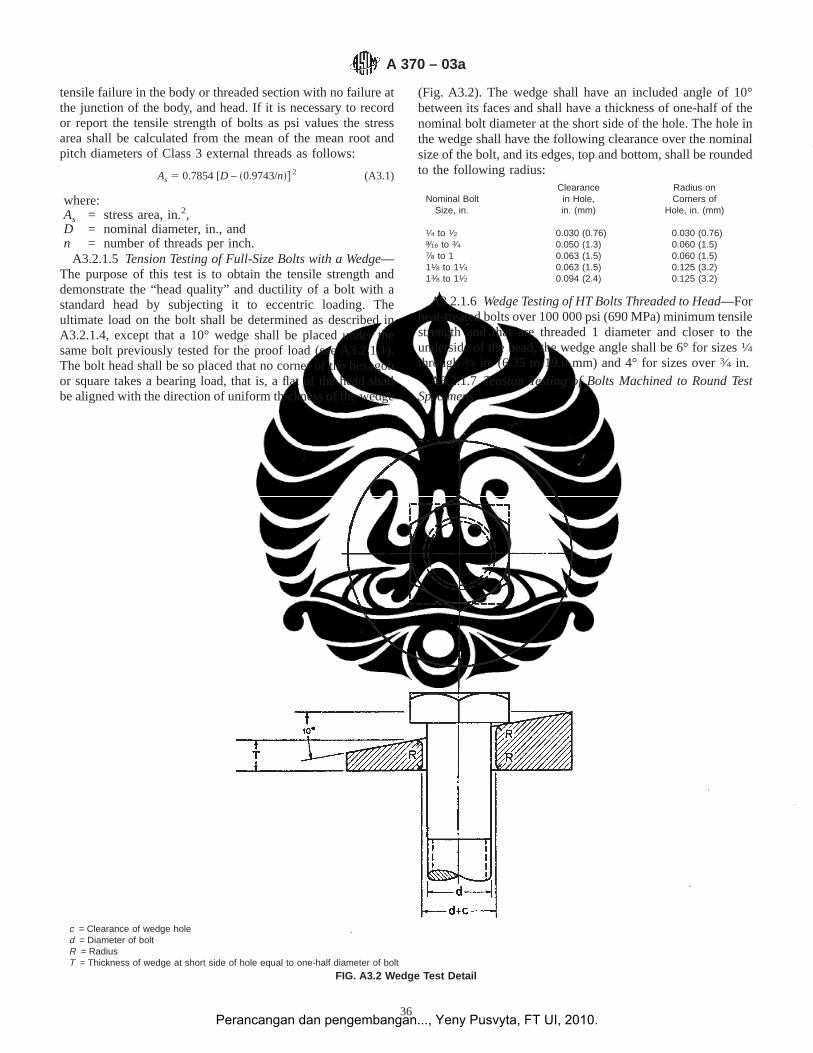
tensile failure in the body or threaded section with no failure atthe junction of the body, and head. If it is necessary to recordor report the tensile strength of bolts as psi values the stressarea shall be calculated from the mean of the mean root andpitch diameters of Class 3 external threads as follows:
As 5 0.7854 [D – ~0.9743/n!# 2 (A3.1)
where:As = stress area, in.2,D = nominal diameter, in., andn = number of threads per inch.
A3.2.1.5 Tension Testing of Full-Size Bolts with a Wedge—The purpose of this test is to obtain the tensile strength anddemonstrate the “head quality” and ductility of a bolt with astandard head by subjecting it to eccentric loading. Theultimate load on the bolt shall be determined as described inA3.2.1.4, except that a 10° wedge shall be placed under thesame bolt previously tested for the proof load (see A3.2.1.1).The bolt head shall be so placed that no corner of the hexagonor square takes a bearing load, that is, a flat of the head shallbe aligned with the direction of uniform thickness of the wedge
(Fig. A3.2). The wedge shall have an included angle of 10°between its faces and shall have a thickness of one-half of thenominal bolt diameter at the short side of the hole. The hole inthe wedge shall have the following clearance over the nominalsize of the bolt, and its edges, top and bottom, shall be roundedto the following radius:
Clearance Radius onNominal Bolt in Hole, Corners of
Size, in. in. (mm) Hole, in. (mm)
1⁄4 to 1⁄2 0.030 (0.76) 0.030 (0.76)9⁄16 to 3⁄4 0.050 (1.3) 0.060 (1.5)7⁄8 to 1 0.063 (1.5) 0.060 (1.5)11⁄8 to 11⁄4 0.063 (1.5) 0.125 (3.2)13⁄8 to 11⁄2 0.094 (2.4) 0.125 (3.2)
A3.2.1.6 Wedge Testing of HT Bolts Threaded to Head—Forheat-treated bolts over 100 000 psi (690 MPa) minimum tensilestrength and that are threaded 1 diameter and closer to theunderside of the head, the wedge angle shall be 6° for sizes1⁄4through3⁄4 in. (6.35 to 19.0 mm) and 4° for sizes over3⁄4 in.
A3.2.1.7 Tension Testing of Bolts Machined to Round TestSpecimens:
c = Clearance of wedge holed = Diameter of boltR = RadiusT = Thickness of wedge at short side of hole equal to one-half diameter of bolt
FIG. A3.2 Wedge Test Detail
A 370 – 03a
36Perancangan dan pengembangan..., Yeny Pusvyta, FT UI, 2010.
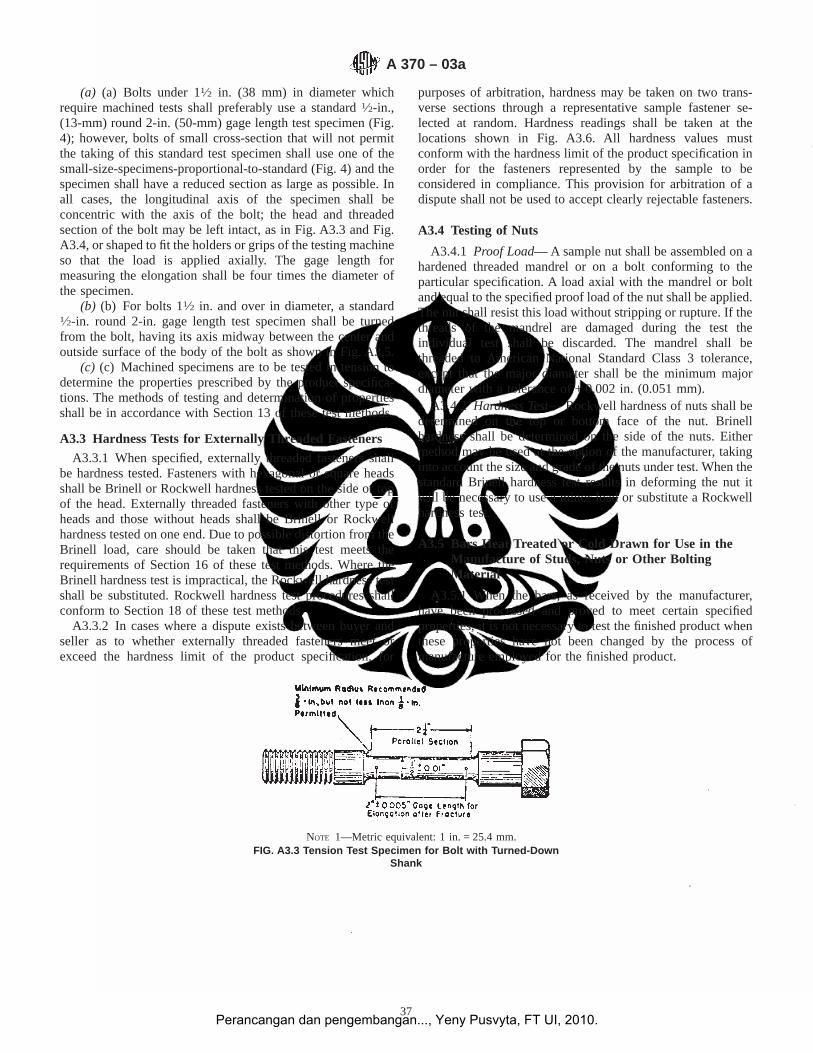
(a) (a) Bolts under 11⁄2 in. (38 mm) in diameter whichrequire machined tests shall preferably use a standard1⁄2-in.,(13-mm) round 2-in. (50-mm) gage length test specimen (Fig.4); however, bolts of small cross-section that will not permitthe taking of this standard test specimen shall use one of thesmall-size-specimens-proportional-to-standard (Fig. 4) and thespecimen shall have a reduced section as large as possible. Inall cases, the longitudinal axis of the specimen shall beconcentric with the axis of the bolt; the head and threadedsection of the bolt may be left intact, as in Fig. A3.3 and Fig.A3.4, or shaped to fit the holders or grips of the testing machineso that the load is applied axially. The gage length formeasuring the elongation shall be four times the diameter ofthe specimen.
(b) (b) For bolts 11⁄2 in. and over in diameter, a standard1⁄2-in. round 2-in. gage length test specimen shall be turnedfrom the bolt, having its axis midway between the center andoutside surface of the body of the bolt as shown in Fig. A3.5.
(c) (c) Machined specimens are to be tested in tension todetermine the properties prescribed by the product specifica-tions. The methods of testing and determination of propertiesshall be in accordance with Section 13 of these test methods.
A3.3 Hardness Tests for Externally Threaded Fasteners
A3.3.1 When specified, externally threaded fasteners shallbe hardness tested. Fasteners with hexagonal or square headsshall be Brinell or Rockwell hardness tested on the side or topof the head. Externally threaded fasteners with other type ofheads and those without heads shall be Brinell or Rockwellhardness tested on one end. Due to possible distortion from theBrinell load, care should be taken that this test meets therequirements of Section 16 of these test methods. Where theBrinell hardness test is impractical, the Rockwell hardness testshall be substituted. Rockwell hardness test procedures shallconform to Section 18 of these test methods.
A3.3.2 In cases where a dispute exists between buyer andseller as to whether externally threaded fasteners meet orexceed the hardness limit of the product specification, for
purposes of arbitration, hardness may be taken on two trans-verse sections through a representative sample fastener se-lected at random. Hardness readings shall be taken at thelocations shown in Fig. A3.6. All hardness values mustconform with the hardness limit of the product specification inorder for the fasteners represented by the sample to beconsidered in compliance. This provision for arbitration of adispute shall not be used to accept clearly rejectable fasteners.
A3.4 Testing of Nuts
A3.4.1 Proof Load— A sample nut shall be assembled on ahardened threaded mandrel or on a bolt conforming to theparticular specification. A load axial with the mandrel or boltand equal to the specified proof load of the nut shall be applied.The nut shall resist this load without stripping or rupture. If thethreads of the mandrel are damaged during the test theindividual test shall be discarded. The mandrel shall bethreaded to American National Standard Class 3 tolerance,except that the major diameter shall be the minimum majordiameter with a tolerance of + 0.002 in. (0.051 mm).
A3.4.2 Hardness Test— Rockwell hardness of nuts shall bedetermined on the top or bottom face of the nut. Brinellhardness shall be determined on the side of the nuts. Eithermethod may be used at the option of the manufacturer, takinginto account the size and grade of the nuts under test. When thestandard Brinell hardness test results in deforming the nut itwill be necessary to use a minor load or substitute a Rockwellhardness test.
A3.5 Bars Heat Treated or Cold Drawn for Use in theManufacture of Studs, Nuts or Other BoltingMaterial
A3.5.1 When the bars, as received by the manufacturer,have been processed and proved to meet certain specifiedproperties, it is not necessary to test the finished product whenthese properties have not been changed by the process ofmanufacture employed for the finished product.
NOTE 1—Metric equivalent: 1 in. = 25.4 mm.FIG. A3.3 Tension Test Specimen for Bolt with Turned-Down
Shank
A 370 – 03a
37Perancangan dan pengembangan..., Yeny Pusvyta, FT UI, 2010.
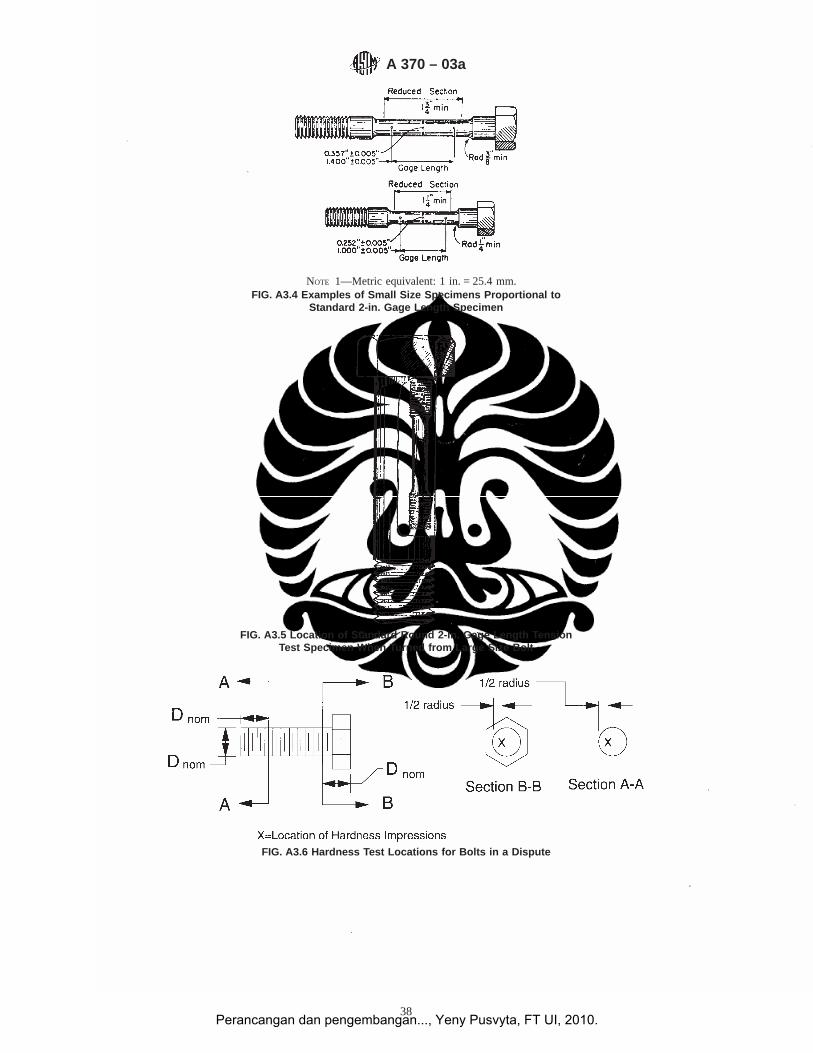
NOTE 1—Metric equivalent: 1 in. = 25.4 mm.FIG. A3.4 Examples of Small Size Specimens Proportional to
Standard 2-in. Gage Length Specimen
FIG. A3.5 Location of Standard Round 2-in. Gage Length TensionTest Specimen When Turned from Large Size Bolt
FIG. A3.6 Hardness Test Locations for Bolts in a Dispute
A 370 – 03a
38Perancangan dan pengembangan..., Yeny Pusvyta, FT UI, 2010.
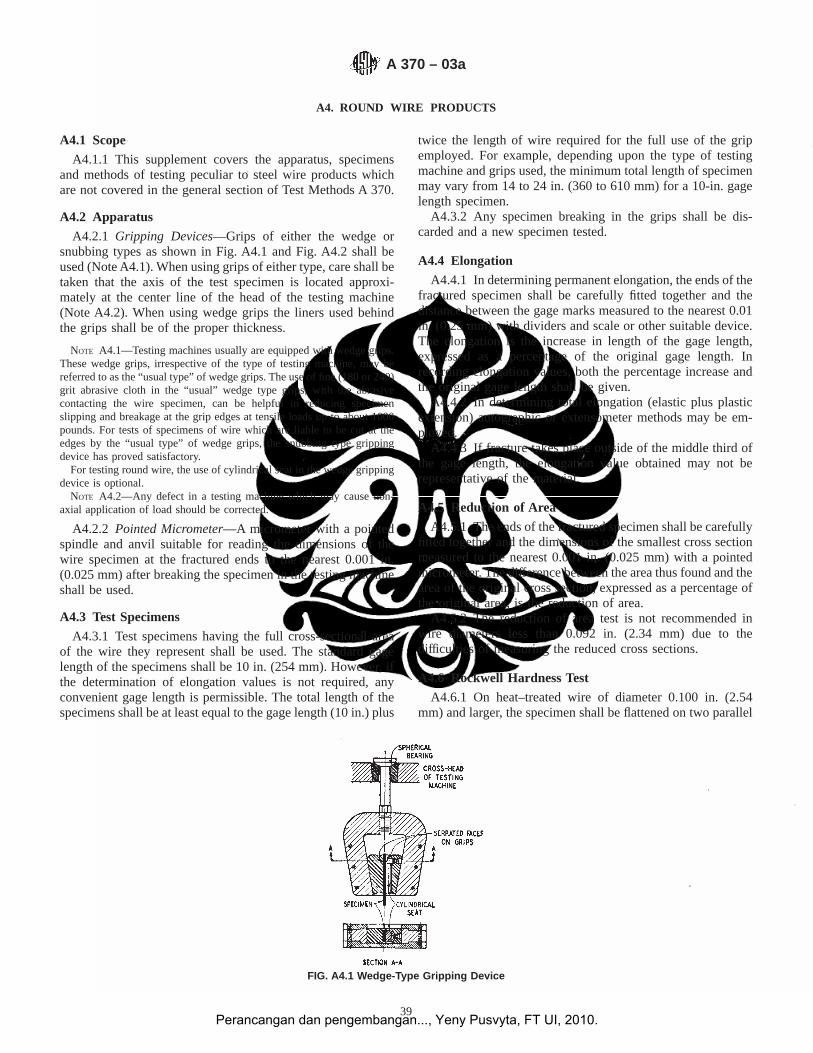
A4. ROUND WIRE PRODUCTS
A4.1 Scope
A4.1.1 This supplement covers the apparatus, specimensand methods of testing peculiar to steel wire products whichare not covered in the general section of Test Methods A 370.
A4.2 Apparatus
A4.2.1 Gripping Devices—Grips of either the wedge orsnubbing types as shown in Fig. A4.1 and Fig. A4.2 shall beused (Note A4.1). When using grips of either type, care shall betaken that the axis of the test specimen is located approxi-mately at the center line of the head of the testing machine(Note A4.2). When using wedge grips the liners used behindthe grips shall be of the proper thickness.
NOTE A4.1—Testing machines usually are equipped with wedge grips.These wedge grips, irrespective of the type of testing machine, may bereferred to as the “usual type” of wedge grips. The use of fine (180 or 240)grit abrasive cloth in the “usual” wedge type grips, with the abrasivecontacting the wire specimen, can be helpful in reducing specimenslipping and breakage at the grip edges at tensile loads up to about 1000pounds. For tests of specimens of wire which are liable to be cut at theedges by the “usual type” of wedge grips, the snubbing type grippingdevice has proved satisfactory.
For testing round wire, the use of cylindrical seat in the wedge grippingdevice is optional.
NOTE A4.2—Any defect in a testing machine which may cause non-axial application of load should be corrected.
A4.2.2 Pointed Micrometer—A micrometer with a pointedspindle and anvil suitable for reading the dimensions of thewire specimen at the fractured ends to the nearest 0.001 in.(0.025 mm) after breaking the specimen in the testing machineshall be used.
A4.3 Test Specimens
A4.3.1 Test specimens having the full cross-sectional areaof the wire they represent shall be used. The standard gagelength of the specimens shall be 10 in. (254 mm). However, ifthe determination of elongation values is not required, anyconvenient gage length is permissible. The total length of thespecimens shall be at least equal to the gage length (10 in.) plus
twice the length of wire required for the full use of the gripemployed. For example, depending upon the type of testingmachine and grips used, the minimum total length of specimenmay vary from 14 to 24 in. (360 to 610 mm) for a 10-in. gagelength specimen.
A4.3.2 Any specimen breaking in the grips shall be dis-carded and a new specimen tested.
A4.4 Elongation
A4.4.1 In determining permanent elongation, the ends of thefractured specimen shall be carefully fitted together and thedistance between the gage marks measured to the nearest 0.01in. (0.25 mm) with dividers and scale or other suitable device.The elongation is the increase in length of the gage length,expressed as a percentage of the original gage length. Inrecording elongation values, both the percentage increase andthe original gage length shall be given.
A4.4.2 In determining total elongation (elastic plus plasticextension) autographic or extensometer methods may be em-ployed.
A4.4.3 If fracture takes place outside of the middle third ofthe gage length, the elongation value obtained may not berepresentative of the material.
A4.5 Reduction of Area
A4.5.1 The ends of the fractured specimen shall be carefullyfitted together and the dimensions of the smallest cross sectionmeasured to the nearest 0.001 in. (0.025 mm) with a pointedmicrometer. The difference between the area thus found and thearea of the original cross section, expressed as a percentage ofthe original area, is the reduction of area.
A4.5.2 The reduction of area test is not recommended inwire diameters less than 0.092 in. (2.34 mm) due to thedifficulties of measuring the reduced cross sections.
A4.6 Rockwell Hardness Test
A4.6.1 On heat–treated wire of diameter 0.100 in. (2.54mm) and larger, the specimen shall be flattened on two parallel
FIG. A4.1 Wedge-Type Gripping Device
A 370 – 03a
39Perancangan dan pengembangan..., Yeny Pusvyta, FT UI, 2010.
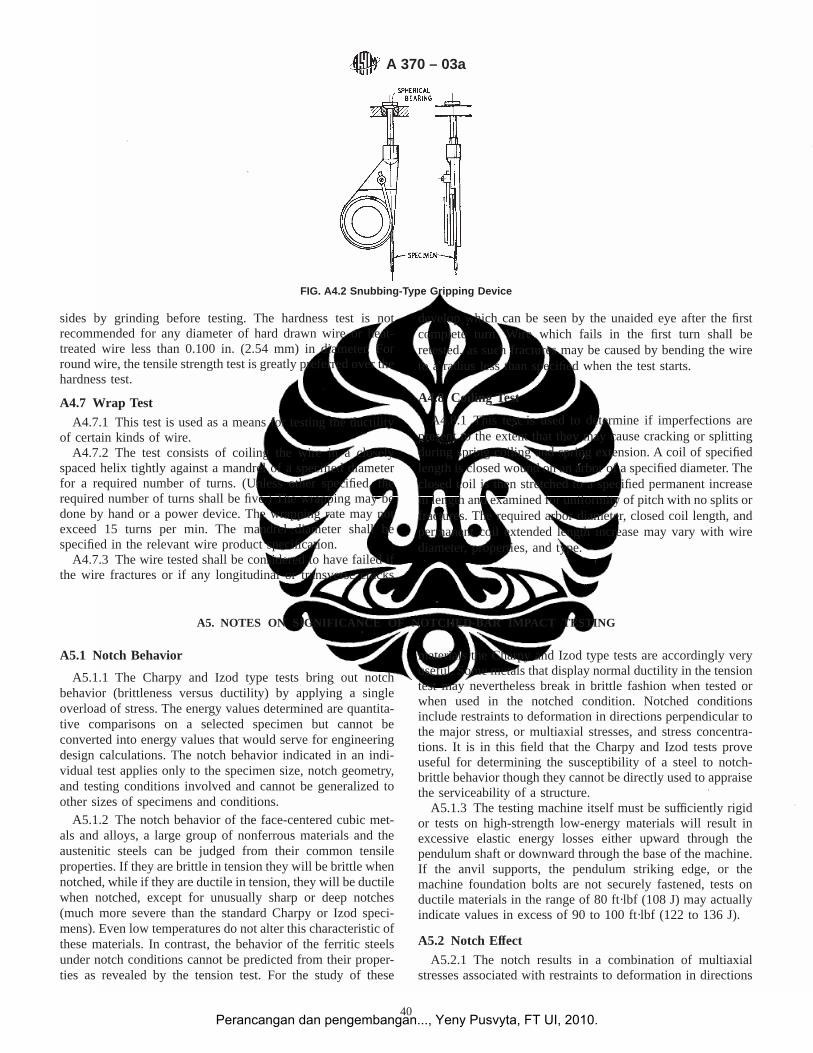
sides by grinding before testing. The hardness test is notrecommended for any diameter of hard drawn wire or heat-treated wire less than 0.100 in. (2.54 mm) in diameter. Forround wire, the tensile strength test is greatly preferred over thehardness test.
A4.7 Wrap Test
A4.7.1 This test is used as a means for testing the ductilityof certain kinds of wire.
A4.7.2 The test consists of coiling the wire in a closelyspaced helix tightly against a mandrel of a specified diameterfor a required number of turns. (Unless other specified, therequired number of turns shall be five.) The wrapping may bedone by hand or a power device. The wrapping rate may notexceed 15 turns per min. The mandrel diameter shall bespecified in the relevant wire product specification.
A4.7.3 The wire tested shall be considered to have failed ifthe wire fractures or if any longitudinal or transverse cracks
develop which can be seen by the unaided eye after the firstcomplete turn. Wire which fails in the first turn shall beretested, as such fractures may be caused by bending the wireto a radius less than specified when the test starts.
A4.8 Coiling Test
A4.8.1 This test is used to determine if imperfections arepresent to the extent that they may cause cracking or splittingduring spring coiling and spring extension. A coil of specifiedlength is closed wound on an arbor of a specified diameter. Theclosed coil is then stretched to a specified permanent increasein length and examined for uniformity of pitch with no splits orfractures. The required arbor diameter, closed coil length, andpermanent coil extended length increase may vary with wirediameter, properties, and type.
A5. NOTES ON SIGNIFICANCE OF NOTCHED-BAR IMPACT TESTING
A5.1 Notch Behavior
A5.1.1 The Charpy and Izod type tests bring out notchbehavior (brittleness versus ductility) by applying a singleoverload of stress. The energy values determined are quantita-tive comparisons on a selected specimen but cannot beconverted into energy values that would serve for engineeringdesign calculations. The notch behavior indicated in an indi-vidual test applies only to the specimen size, notch geometry,and testing conditions involved and cannot be generalized toother sizes of specimens and conditions.
A5.1.2 The notch behavior of the face-centered cubic met-als and alloys, a large group of nonferrous materials and theaustenitic steels can be judged from their common tensileproperties. If they are brittle in tension they will be brittle whennotched, while if they are ductile in tension, they will be ductilewhen notched, except for unusually sharp or deep notches(much more severe than the standard Charpy or Izod speci-mens). Even low temperatures do not alter this characteristic ofthese materials. In contrast, the behavior of the ferritic steelsunder notch conditions cannot be predicted from their proper-ties as revealed by the tension test. For the study of these
materials the Charpy and Izod type tests are accordingly veryuseful. Some metals that display normal ductility in the tensiontest may nevertheless break in brittle fashion when tested orwhen used in the notched condition. Notched conditionsinclude restraints to deformation in directions perpendicular tothe major stress, or multiaxial stresses, and stress concentra-tions. It is in this field that the Charpy and Izod tests proveuseful for determining the susceptibility of a steel to notch-brittle behavior though they cannot be directly used to appraisethe serviceability of a structure.
A5.1.3 The testing machine itself must be sufficiently rigidor tests on high-strength low-energy materials will result inexcessive elastic energy losses either upward through thependulum shaft or downward through the base of the machine.If the anvil supports, the pendulum striking edge, or themachine foundation bolts are not securely fastened, tests onductile materials in the range of 80 ft·lbf (108 J) may actuallyindicate values in excess of 90 to 100 ft·lbf (122 to 136 J).
A5.2 Notch Effect
A5.2.1 The notch results in a combination of multiaxialstresses associated with restraints to deformation in directions
FIG. A4.2 Snubbing-Type Gripping Device
A 370 – 03a
40Perancangan dan pengembangan..., Yeny Pusvyta, FT UI, 2010.
perpendicular to the major stress, and a stress concentration atthe base of the notch. A severely notched condition is generallynot desirable, and it becomes of real concern in those cases inwhich it initiates a sudden and complete failure of the brittletype. Some metals can be deformed in a ductile manner evendown to the low temperatures of liquid air, while others maycrack. This difference in behavior can be best understood byconsidering the cohesive strength of a material (or the propertythat holds it together) and its relation to the yield point. In casesof brittle fracture, the cohesive strength is exceeded beforesignificant plastic deformation occurs and the fracture appearscrystalline. In cases of the ductile or shear type of failure,considerable deformation precedes the final fracture and thebroken surface appears fibrous instead of crystalline. In inter-mediate cases the fracture comes after a moderate amount ofdeformation and is part crystalline and part fibrous in appear-ance.
A5.2.2 When a notched bar is loaded, there is a normalstress across the base of the notch which tends to initiatefracture. The property that keeps it from cleaving, or holds ittogether, is the “cohesive strength.” The bar fractures when thenormal stress exceeds the cohesive strength. When this occurswithout the bar deforming it is the condition for brittle fracture.
A5.2.3 In testing, though not in service because of sideeffects, it happens more commonly that plastic deformationprecedes fracture. In addition to the normal stress, the appliedload also sets up shear stresses which are about 45° to thenormal stress. The elastic behavior terminates as soon as theshear stress exceeds the shear strength of the material anddeformation or plastic yielding sets in. This is the condition forductile failure.
A5.2.4 This behavior, whether brittle or ductile, depends onwhether the normal stress exceeds the cohesive strength beforethe shear stress exceeds the shear strength. Several importantfacts of notch behavior follow from this. If the notch is madesharper or more drastic, the normal stress at the root of thenotch will be increased in relation to the shear stress and thebar will be more prone to brittle fracture (see Table A5.1). Also,as the speed of deformation increases, the shear strengthincreases and the likelihood of brittle fracture increases. On theother hand, by raising the temperature, leaving the notch andthe speed of deformation the same, the shear strength islowered and ductile behavior is promoted, leading to shearfailure.
A5.2.5 Variations in notch dimensions will seriously affectthe results of the tests. Tests on E 4340 steel specimens10 haveshown the effect of dimensional variations on Charpy results(see Table A5.1).
A5.3 Size Effect
A5.3.1 Increasing either the width or the depth of thespecimen tends to increase the volume of metal subject todistortion, and by this factor tends to increase the energyabsorption when breaking the specimen. However, any in-crease in size, particularly in width, also tends to increase thedegree of restraint and by tending to induce brittle fracture,may decrease the amount of energy absorbed. Where astandard-size specimen is on the verge of brittle fracture, this isparticularly true, and a double-width specimen may actuallyrequire less energy for rupture than one of standard width.
A5.3.2 In studies of such effects where the size of thematerial precludes the use of the standard specimen, as forexample when the material is1⁄4-in. plate, subsize specimensare necessarily used. Such specimens (see Fig. 6 of TestMethods E 23) are based on the Type A specimen of Fig. 4 ofTest Methods E 23.
A5.3.3 General correlation between the energy values ob-tained with specimens of different size or shape is not feasible,but limited correlations may be established for specificationpurposes on the basis of special studies of particular materialsand particular specimens. On the other hand, in a study of therelative effect of process variations, evaluation by use of somearbitrarily selected specimen with some chosen notch will inmost instances place the methods in their proper order.
A5.4 Effects of Testing Conditions
A5.4.1 The testing conditions also affect the notch behavior.So pronounced is the effect of temperature on the behavior ofsteel when notched that comparisons are frequently made byexamining specimen fractures and by plotting energy value andfracture appearance versus temperature from tests of notchedbars at a series of temperatures. When the test temperature hasbeen carried low enough to start cleavage fracture, there maybe an extremely sharp drop in impact value or there may be arelatively gradual falling off toward the lower temperatures.This drop in energy value starts when a specimen begins to
10 Fahey, N. H., “Effects of Variables in Charpy Impact Testing,”MaterialsResearch & Standards, Vol 1, No. 11, November, 1961, p. 872.
TABLE A5.1 Effect of Varying Notch Dimensions on Standard Specimens
High-EnergySpecimens, ft·lbf (J)
High-EnergySpecimens, ft·lbf (J)
Low-EnergySpecimens, ft·lbf (J)
Specimen with standard dimensions 76.0 6 3.8 (103.0 6 5.2) 44.5 6 2.2 (60.3 6 3.0) 12.5 6 1.0 (16.9 6 1.4)Depth of notch, 0.084 in. (2.13 mm)A 72.2 (97.9) 41.3 (56.0) 11.4 (15.5)Depth of notch, 0.0805 in. (2.04 mm)A 75.1 (101.8) 42.2 (57.2) 12.4 (16.8)Depth of notch, 0.0775 in. (1.77 mm)A 76.8 (104.1) 45.3 (61.4) 12.7 (17.2)Depth of notch, 0.074 in. (1.57 mm)A 79.6 (107.9) 46.0 (62.4) 12.8 (17.3)Radius at base of notch, 0.005 in. (0.127 mm)B 72.3 (98.0) 41.7 (56.5) 10.8 (14.6)Radius at base of notch, 0.015 in. (0.381 mm)B 80.0 (108.5) 47.4 (64.3) 15.8 (21.4)
A Standard 0.079 6 0.002 in. (2.00 6 0.05 mm).B Standard 0.010 6 0.001 in. (0.25 6 0.025 mm).
A 370 – 03a
41Perancangan dan pengembangan..., Yeny Pusvyta, FT UI, 2010.
exhibit some crystalline appearance in the fracture. The tran-sition temperature at which this embrittling effect takes placevaries considerably with the size of the part or test specimenand with the notch geometry.
A5.4.2 Some of the many definitions of transition tempera-ture currently being used are: (1) the lowest temperature atwhich the specimen exhibits 100 % fibrous fracture, (2) thetemperature where the fracture shows a 50 % crystalline and a50 % fibrous appearance, (3) the temperature corresponding tothe energy value 50 % of the difference between valuesobtained at 100 % and 0 % fibrous fracture, and (4) thetemperature corresponding to a specific energy value.
A5.4.3 A problem peculiar to Charpy-type tests occurswhen high-strength, low-energy specimens are tested at lowtemperatures. These specimens may not leave the machine inthe direction of the pendulum swing but rather in a sidewisedirection. To ensure that the broken halves of the specimens donot rebound off some component of the machine and contactthe pendulum before it completes its swing, modifications maybe necessary in older model machines. These modificationsdiffer with machine design. Nevertheless the basic problem isthe same in that provisions must be made to prevent rebound-ing of the fractured specimens into any part of the swingingpendulum. Where design permits, the broken specimens maybe deflected out of the sides of the machine and yet in otherdesigns it may be necessary to contain the broken specimenswithin a certain area until the pendulum passes through theanvils. Some low-energy high-strength steel specimens leaveimpact machines at speeds in excess of 50 ft (15.3 m)/salthough they were struck by a pendulum traveling at speedsapproximately 17 ft (5.2 m)/s. If the force exerted on thependulum by the broken specimens is sufficient, the pendulum
will slow down and erroneously high energy values will berecorded. This problem accounts for many of the inconsisten-cies in Charpy results reported by various investigators withinthe 10 to 25-ft·lbf (14 to 34 J) range. The Apparatus Section(the paragraph regarding Specimen Clearance) of Test MethodsE 23 discusses the two basic machine designs and a modifica-tion found to be satisfactory in minimizing jamming.
A5.5 Velocity of Straining
A5.5.1 Velocity of straining is likewise a variable thataffects the notch behavior of steel. The impact test showssomewhat higher energy absorption values than the static testsabove the transition temperature and yet, in some instances, thereverse is true below the transition temperature.
A5.6 Correlation with Service
A5.6.1 While Charpy or Izod tests may not directly predictthe ductile or brittle behavior of steel as commonly used inlarge masses or as components of large structures, these testscan be used as acceptance tests of identity for different lots ofthe same steel or in choosing between different steels, whencorrelation with reliable service behavior has been established.It may be necessary to make the tests at properly chosentemperatures other than room temperature. In this, the servicetemperature or the transition temperature of full-scale speci-mens does not give the desired transition temperatures forCharpy or Izod tests since the size and notch geometry may beso different. Chemical analysis, tension, and hardness tests maynot indicate the influence of some of the important processingfactors that affect susceptibility to brittle fracture nor do theycomprehend the effect of low temperatures in inducing brittlebehavior.
A6. PROCEDURE FOR CONVERTING PERCENTAGE ELONGATION OF A STANDARD ROUND TENSION TESTSPECIMEN TO EQUIVALENT PERCENTAGE ELONGATION OF A STANDARD FLAT SPECIMEN
A6.1 Scope
A6.1.1 This method specifies a procedure for convertingpercentage elongation after fracture obtained in a standard0.500-in. (12.7-mm) diameter by 2-in. (51-mm) gage lengthtest specimen to standard flat test specimens1⁄2 in. by 2 in. and11⁄2 in. by 8 in. (38.1 by 203 mm).
A6.2 Basic Equation
A6.2.1 The conversion data in this method are based on anequation by Bertella,11 and used by Oliver12 and others. Therelationship between elongations in the standard 0.500-in.diameter by 2.0-in. test specimen and other standard specimenscan be calculated as follows:
e5 eo [4.47~=A!/L]a (A6.1)
where:eo = percentage elongation after fracture on a standard test
specimen having a 2-in. gage length and 0.500-in.diameter,
e = percentage elongation after fracture on a standard testspecimen having a gage length L and a cross-sectionalarea A, and
a = constant characteristic of the test material.
A6.3 Application
A6.3.1 In applying the above equation the constanta ischaracteristic of the test material. The valuea = 0.4 has beenfound to give satisfactory conversions for carbon, carbon-manganese, molybdenum, and chromium-molybdenum steelswithin the tensile strength range of 40 000 to 85 000 psi (275to 585 MPa) and in the hot-rolled, in the hot-rolled andnormalized, or in the annealed condition, with or withouttempering. Note that the cold reduced and quenched and
11 Bertella, C. A.,Giornale del Genio Civile, Vol 60, 1922, p. 343.12 Oliver, D. A., Proceedings of the Institution of Mechanical Engineers, 1928,
p. 827.
A 370 – 03a
42Perancangan dan pengembangan..., Yeny Pusvyta, FT UI, 2010.
tempered states are excluded. For annealed austenitic stainlesssteels, the valuea = 0.127 has been found to give satisfactoryconversions.
A6.3.2 Table A6.1 has been calculated takinga = 0.4, withthe standard 0.500-in. (12.7-mm) diameter by 2-in. (51-mm)gage length test specimen as the reference specimen. In thecase of the subsize specimens 0.350 in. (8.89 mm) in diameterby 1.4-in. (35.6-mm) gage length, and 0.250-in. (6.35- mm)diameter by 1.0-in. (25.4-mm) gage length the factor in theequation is 4.51 instead of 4.47. The small error introduced byusing Table A6.1 for the subsized specimens may be neglected.Table A6.2 for annealed austenitic steels has been calculatedtakinga = 0.127, with the standard 0.500-in. diameter by 2-in.gage length test specimen as the reference specimen.
A6.3.3 Elongation given for a standard 0.500-in. diameterby 2-in. gage length specimen may be converted to elongationfor 1⁄2 in. by 2 in. or 11⁄2 in. by 8-in. (38.1 by 203-mm) flatspecimens by multiplying by the indicated factor in Table A6.1and Table A6.2.
A6.3.4 These elongation conversions shall not be usedwhere the width to thickness ratio of the test piece exceeds 20,as in sheet specimens under 0.025 in. (0.635 mm) in thickness.
A6.3.5 While the conversions are considered to be reliablewithin the stated limitations and may generally be used inspecification writing where it is desirable to show equivalentelongation requirements for the several standard ASTM tension
TABLE A6.1 Carbon and Alloy Steels—Material Constant a = 0.4.Multiplication Factors for Converting Percent Elongation from
1⁄2-in. Diameter by 2-in. Gage Length Standard Tension TestSpecimen to Standard 1⁄2 by 2-in. and 1 1⁄2 by 8-in. Flat Specimens
Thickness,in.
1⁄2 by2-in.
Specimen
11⁄2 by8-in.
Specimen
Thicknessin.
11⁄2 by8-in.
Specimen
0.025 0.574 . . . 0.800 0.8220.030 0.596 . . . 0.850 0.8320.035 0.614 . . . 0.900 0.8410.040 0.631 . . . 0.950 0.8500.045 0.646 . . . 1.000 0.8590.050 0.660 . . . 1.125 0.8800.055 0.672 . . . 1.250 0.8980.060 0.684 . . . 1.375 0.9160.065 0.695 . . . 1.500 0.9320.070 0.706 . . . 1.625 0.9470.075 0.715 . . . 1.750 0.9610.080 0.725 . . . 1.875 0.9740.085 0.733 . . . 2.000 0.9870.090 0.742 0.531 2.125 0.9990.100 0.758 0.542 2.250 1.0100.110 0.772 0.553 2.375 1.0210.120 0.786 0.562 2.500 1.0320.130 0.799 0.571 2.625 1.0420.140 0.810 0.580 2.750 1.0520.150 0.821 0.588 2.875 1.0610.160 0.832 0.596 3.000 1.0700.170 0.843 0.603 3.125 1.0790.180 0.852 0.610 3.250 1.0880.190 0.862 0.616 3.375 1.0960.200 0.870 0.623 3.500 1.1040.225 0.891 0.638 3.625 1.1120.250 0.910 0.651 3.750 1.1190.275 0.928 0.664 3.875 1.1270.300 0.944 0.675 4.000 1.1340.325 0.959 0.686 . . . . . .0.350 0.973 0.696 . . . . . .0.375 0.987 0.706 . . . . . .0.400 1.000 0.715 . . . . . .0.425 1.012 0.724 . . . . . .0.450 1.024 0.732 . . . . . .0.475 1.035 0.740 . . . . . .0.500 1.045 0.748 . . . . . .0.525 1.056 0.755 . . . . . .0.550 1.066 0.762 . . . . . .0.575 1.075 0.770 . . . . . .0.600 1.084 0.776 . . . . . .0.625 1.093 0.782 . . . . . .0.650 1.101 0.788 . . . . . .0.675 1.110 . . . . . . . . .0.700 1.118 0.800 . . . . . .0.725 1.126 . . . . . . . . .0.750 1.134 0.811 . . . . . .
TABLE A6.2 Annealed Austenitic Stainless Steels—MaterialConstant a = 0.127. Multiplication Factors for Converting PercentElongation from 1⁄2-in. Diameter by 2-in. Gage Length StandardTension Test Specimen to Standard 1⁄2 by 2-in. and 1 1⁄2 by 8-in.
Flat Specimens
Thickness,in.
1⁄2 by2-in.
Specimen
11⁄2 by8-in.
Specimen
Thickness,in.
11⁄2 by8-in.
Specimen
0.025 0.839 . . . 0.800 0.9400.030 0.848 . . . 0.850 0.9430.035 0.857 . . . 0.900 0.9470.040 0.864 . . . 0.950 0.9500.045 0.870 . . . 1.000 0.9530.050 0.876 . . . 1.125 0.9600.055 0.882 . . . 1.250 0.9660.060 0.886 . . . 1.375 0.9720.065 0.891 . . . 1.500 0.9780.070 0.895 . . . 1.625 0.9830.075 0.899 . . . 1.750 0.9870.080 0.903 . . . 1.875 0.9920.085 0.906 . . . 2.000 0.9960.090 0.909 0.818 2.125 1.0000.095 0.913 0.821 2.250 1.0030.100 0.916 0.823 2.375 1.0070.110 0.921 0.828 2.500 1.0100.120 0.926 0.833 2.625 1.0130.130 0.931 0.837 2.750 1.0160.140 0.935 0.841 2.875 1.0190.150 0.940 0.845 3.000 1.0220.160 0.943 0.848 3.125 1.0240.170 0.947 0.852 3.250 1.0270.180 0.950 0.855 3.375 1.0290.190 0.954 0.858 3.500 1.0320.200 0.957 0.860 3.625 1.0340.225 0.964 0.867 3.750 1.0360.250 0.970 0.873 3.875 1.0380.275 0.976 0.878 4.000 1.0410.300 0.982 0.883 . . . . . .0.325 0.987 0.887 . . . . . .0.350 0.991 0.892 . . . . . .0.375 0.996 0.895 . . . . . .0.400 1.000 0.899 . . . . . .0.425 1.004 0.903 . . . . . .0.450 1.007 0.906 . . . . . .0.475 1.011 0.909 . . . . . .0.500 1.014 0.912 . . . . . .0.525 1.017 0.915 . . . . . .0.550 1.020 0.917 . . . . . .0.575 1.023 0.920 . . . . . .0.600 1.026 0.922 . . . . . .0.625 1.029 0.925 . . . . . .0.650 1.031 0.927 . . . . . .0.675 1.034 . . . . . . . . .0.700 1.036 0.932 . . . . . .0.725 1.038 . . . . . . . . .0.750 1.041 0.936 . . . . . .
A 370 – 03a
43Perancangan dan pengembangan..., Yeny Pusvyta, FT UI, 2010.
specimens covered in Test Methods A 370, consideration mustbe given to the metallurgical effects dependent on the thicknessof the material as processed.
A7. METHOD OF TESTING MULTI-WIRE STRAND FOR PRESTRESSED CONCRETE
A7.1 Scope
A7.1.1 This method provides procedures for the tensiontesting of multi-wire strand for prestressed concrete. Thismethod is intended for use in evaluating the strand propertiesprescribed in specifications for“ prestressing steel strands.”
A7.2 General Precautions
A7.2.1 Premature failure of the test specimens may result ifthere is any appreciable notching, cutting, or bending of thespecimen by the gripping devices of the testing machine.
A7.2.2 Errors in testing may result if the seven wiresconstituting the strand are not loaded uniformly.
A7.2.3 The mechanical properties of the strand may bematerially affected by excessive heating during specimenpreparation.
A7.2.4 These difficulties may be minimized by followingthe suggested methods of gripping described in A7.4.
A7.3 Gripping Devices
A7.3.1 The true mechanical properties of the strand aredetermined by a test in which fracture of the specimen occursin the free span between the jaws of the testing machine.Therefore, it is desirable to establish a test procedure withsuitable apparatus which will consistently produce such results.Due to inherent physical characteristics of individual ma-chines, it is not practical to recommend a universal grippingprocedure that is suitable for all testing machines. Therefore, itis necessary to determine which of the methods of grippingdescribed in A7.3.2 to A7.3.8 is most suitable for the testingequipment available.
A7.3.2 Standard V-Grips with Serrated Teeth (Note A7.1).A7.3.3 Standard V-Grips with Serrated Teeth (Note A7.1),
Using Cushioning Material—In this method, some material isplaced between the grips and the specimen to minimize thenotching effect of the teeth. Among the materials which havebeen used are lead foil, aluminum foil, carborundum cloth, brashims, etc. The type and thickness of material required isdependent on the shape, condition, and coarseness of the teeth.
A7.3.4 Standard V-Grips with Serrated Teeth (Note A7.1),Using Special Preparation of the Gripped Portions of theSpecimen—One of the methods used is tinning, in which thegripped portions are cleaned, fluxed, and coated by multipledips in molten tin alloy held just above the melting point.Another method of preparation is encasing the gripped portionsin metal tubing or flexible conduit, using epoxy resin as thebonding agent. The encased portion should be approximatelytwice the length of lay of the strand.
A7.3.5 Special Grips with Smooth, Semi-CylindricalGrooves (Note A7.2)—The grooves and the gripped portions ofthe specimen are coated with an abrasive slurry which holdsthe specimen in the smooth grooves, preventing slippage. The
slurry consists of abrasive such as Grade 3-F aluminum oxideand a carrier such as water or glycerin.
A7.3.6 Standard Sockets of the Type Used for Wire Rope—The gripped portions of the specimen are anchored in thesockets with zinc. The special procedures for socketing usuallyemployed in the wire rope industry must be followed.
A7.3.7 Dead-End Eye Splices—These devices are availablein sizes designed to fit each size of strand to be tested.
A7.3.8 Chucking Devices—Use of chucking devices of thetype generally employed for applying tension to strands incasting beds is not recommended for testing purposes.
NOTE A7.1—The number of teeth should be approximately 15 to 30 perin., and the minimum effective gripping length should be approximately 4in. (102 mm).
NOTE A7.2—The radius of curvature of the grooves is approximatelythe same as the radius of the strand being tested, and is located1⁄32 in.(0.79 mm) above the flat face of the grip. This prevents the two grips fromclosing tightly when the specimen is in place.
A7.4 Specimen Preparation
A7.4.1 If the molten-metal temperatures employed duringhot-dip tinning or socketing with metallic material are too high,over approximately 700°F (370°C), the specimen may be heataffected with a subsequent loss of strength and ductility.Careful temperature controls should be maintained if suchmethods of specimen preparation are used.
A7.5 Procedure
A7.5.1 Yield Strength— For determining the yield strengthuse a Class B-1 extensometer (Note A7.3) as described inPractice E 83. Apply an initial load of 10 % of the expectedminimum breaking strength to the specimen, then attach theextensometer and adjust it to a reading of 0.001 in./in. of gagelength. Then increase the load until the extensometer indicatesan extension of 1 %. Record the load for this extension as theyield strength. The extensometer may be removed from thespecimen after the yield strength has been determined.
A7.5.2 Elongation— For determining the elongation use aClass D extensometer (Note A7.3), as described in PracticeE 83, having a gage length of not less than 24 in. (610 mm)(Note A7.4). Apply an initial load of 10 % of the requiredminimum breaking strength to the specimen, then attach theextensometer (Note A7.3) and adjust it to a zero reading. Theextensometer may be removed from the specimen prior torupture after the specified minimum elongation has beenexceeded. It is not necessary to determine the final elongationvalue.
A7.5.3 Breaking Strength—Determine the maximum load atwhich one or more wires of the strand are fractured. Recordthis load as the breaking strength of the strand.
A 370 – 03a
44Perancangan dan pengembangan..., Yeny Pusvyta, FT UI, 2010.
NOTE A7.3—The yield-strength extensometer and the elongation ex-tensometer may be the same instrument or two separate instruments. Twoseparate instruments are advisable since the more sensitive yield-strengthextensometer, which could be damaged when the strand fractures, may beremoved following the determination of yield strength. The elongationextensometer may be constructed with less sensitive parts or be con-structed in such a way that little damage would result if fracture occurswhile the extensometer is attached to the specimen.
NOTE A7.4—Specimens that break outside the extensometer or in the
jaws and yet meet the minimum specified values are considered asmeeting the mechanical property requirements of the product specifica-tion, regardless of what procedure of gripping has been used. Specimensthat break outside of the extensometer or in the jaws and do not meet theminimum specified values are subject to retest. Specimens that breakbetween the jaws and the extensometer and do not meet the minimumspecified values are subject to retest as provided in the applicablespecification.
A8. ROUNDING OF TEST DATA
A8.1 Rounding
A8.1.1 An observed value or a calculated value shall berounded off in accordance with the applicable product specifi-cation. In the absence of a specified procedure, therounding-off method of Practice E 29 shall be used.
A8.1.1.1 Values shall be rounded up or rounded down asdetermined by the rules of Practice E 29.
A8.1.1.2 In the special case of rounding the number “5”when no additional numbers other than “0” follow the “5,”rounding shall be done in the direction of the specificationlimits if following Practice E 29 would cause rejection ofmaterial.
A8.1.2 Recommended levels for rounding reported valuesof test data are given in Table A8.1. These values are designedto provide uniformity in reporting and data storage, and shouldbe used in all cases except where they conflict with specificrequirements of a product specification.
NOTE A8.1—To minimize cumulative errors, whenever possible, valuesshould be carried to at least one figure beyond that of the final (rounded)value during intervening calculations (such as calculation of stress fromload and area measurements) with rounding occurring as the finaloperation. The precision may be less than that implied by the number ofsignificant figures.
A9. METHODS FOR TESTING STEEL REINFORCING BARS
A9.1 Scope
A9.1.1 This annex covers additional details specific totesting steel reinforcing bars for use in concrete reinforcement.
A9.2 Test Specimens
A9.2.1 All test specimens shall be the full section of the baras rolled.
A9.3 Tension TestingA9.3.1 Test Specimen— Specimens for tension tests shall be
long enough to provide for an 8-in. (200-mm) gage length, adistance of at least two bar diameters between each gage markand the grips, plus sufficient additional length to fill the gripscompletely leaving some excess length protruding beyond eachgrip.
TABLE A8.1 Recommended Values for Rounding Test Data
Test Quantity Test Data Range Rounded ValueA
Yield Point, up to 50 000 psi, excl (up to 50 ksi) 100 psi (0.1 ksi)Yield Strength, 50 000 to 100 000 psi, excl (50 to 100 ksi) 500 psi (0.5 ksi)Tensile Strength 100 000 psi and above (100 ksi and above) 1000 psi (1.0 ksi)
up to 500 MPa, excl 1 MPa500 to 1000 MPa, excl 5 MPa1000 MPa and above 10 MPa
Elongation0 to 10 %, excl
10 % and above0.5 %1 %
Reduction of Area0 to 10 %, excl
10 % and above0.5 %1 %
Impact EnergyBrinell HardnessRockwell Hardness
0 to 240 ft·lbf (or 0 to 325 J)all valuesall scales
1 ft·lbf (or 1 J)B
tabular valueC
1 Rockwell NumberA Round test data to the nearest integral multiple of the values in this column. If the data value is exactly midway between two rounded values, round in accordance
with A8.1.1.2.B These units are not equivalent but the rounding occurs in the same numerical ranges for each. (1 ft·lbf = 1.356 J.)C Round the mean diameter of the Brinell impression to the nearest 0.05 mm and report the corresponding Brinell hardness number read from the table without further
rounding.
A 370 – 03a
45Perancangan dan pengembangan..., Yeny Pusvyta, FT UI, 2010.
A9.3.2 Gripping Device— The grips shall be shimmed sothat no more than1⁄2 in. (13 mm) of a grip protrudes from thehead of the testing machine.
A9.3.3 Gage Marks— The 8-in. (200-mm) gage length shallbe marked on the specimen using a preset 8-in. (200-mm)punch or, alternately, may be punch marked every 2 in. (50mm) along the 8-in. (200-mm) gage length, on one of thelongitudinal ribs, if present, or in clear spaces of the deforma-tion pattern. The punch marks shall not be put on a transversedeformation. Light punch marks are desirable because deepmarks severely indent the bar and may affect the results. Abullet-nose punch is desirable.
A9.3.4 The yield strength or yield point shall be determinedby one of the following methods:
A9.3.4.1 Extension under load using an autographic dia-gram method or an extensometer as described in 13.1.2 and13.1.3,
A9.3.4.2 By the drop of the beam or halt in the gage of thetesting machine as described in 13.1.1 where the steel tested asa sharp-kneed or well-defined type of yield point.
A9.3.5 The unit stress determinations for yield and tensilestrength on full-size specimens shall be based on the nominalbar area.
A9.4 Bend Testing
A9.4.1 Bend tests shall be made on specimens of sufficientlength to ensure free bending and with apparatus whichprovides:
A9.4.1.1 Continuous and uniform application of forcethroughout the duration of the bending operation,
A9.4.1.2 Unrestricted movement of the specimen at pointsof contact with the apparatus and bending around a pin free torotate, and
A9.4.1.3 Close wrapping of the specimen around the pinduring the bending operation.
A9.4.2 Other acceptable more severe methods of bendtesting, such as placing a specimen across two pins free torotate and applying the bending force with a fix pin, may beused.
A9.4.3 When retesting is permitted by the product specifi-cation, the following shall apply:
A9.4.3.1 Sections of bar containing identifying roll markingshall not be used.
A9.4.3.2 Bars shall be so placed that longitudinal ribs lie ina plane at right angles to the plane of bending.
A10. PROCEDURE FOR USE AND CONTROL OF HEAT-CYCLE SIMULATION
A10.1 Purpose
A10.1.1 To ensure consistent and reproducible heat treat-ments of production forgings and the test specimens thatrepresent them when the practice of heat-cycle simulation isused.
A10.2 Scope
A10.2.1 Generation and documentation of actual productiontime—temperature curves (MASTER CHARTS).
A10.2.2 Controls for duplicating the master cycle duringheat treatment of production forgings. (Heat treating within theessential variables established during A1.2.1).
A10.2.3 Preparation of program charts for the simulatorunit.
A10.2.4 Monitoring and inspection of the simulated cyclewithin the limits established by the ASME Code.
A10.2.5 Documentation and storage of all controls, inspec-tions, charts, and curves.
A10.3 Referenced Documents
A10.3.1 ASME Standards13:ASME Boiler and Pressure Vessel Code Section III, latest
edition.ASME Boiler and Pressure Vessel Code Section VIII,
Division 2, latest edition.
A10.4 Terminology
A10.4.1 Definitions:
A10.4.1.1 master chart—a record of the heat treatmentreceived from a forging essentially identical to the productionforgings that it will represent. It is a chart of time andtemperature showing the output from thermocouples imbeddedin the forging at the designated test immersion and test locationor locations.
A10.4.1.2 program chart—the metallized sheet used toprogram the simulator unit. Time-temperature data from themaster chart are manually transferred to the program chart.
A10.4.1.3 simulator chart—a record of the heat treatmentthat a test specimen had received in the simulator unit. It is achart of time and temperature and can be compared directly tothe master chart for accuracy of duplication.
A10.4.1.4 simulator cycle—one continuous heat treatmentof a set of specimens in the simulator unit. The cycle includesheating from ambient, holding at temperature, and cooling. Forexample, a simulated austenitize and quench of a set ofspecimens would be one cycle; a simulated temper of the samespecimens would be another cycle.
A10.5 Procedure
A10.5.1 Production Master Charts:A10.5.1.1 Thermocouples shall be imbedded in each forg-
ing from which a master chart is obtained. Temperature shall bemonitored by a recorder with resolution sufficient to clearlydefine all aspects of the heating, holding, and cooling process.All charts are to be clearly identified with all pertinentinformation and identification required for maintaining perma-nent records.
A10.5.1.2 Thermocouples shall be imbedded 180° apart ifthe material specification requires test locations 180° apart.
13 Available from American Society of Mechanical Engineers (ASME), ASMEInternational Headquarters, Three Park Ave., New York, NY 10016-5990.
A 370 – 03a
46Perancangan dan pengembangan..., Yeny Pusvyta, FT UI, 2010.
A10.5.1.3 One master chart (or two if required in accor-dance with A10.5.3.1) shall be produced to represent essen-tially identical forgings (same size and shape). Any change insize or geometry (exceeding rough machining tolerances) of aforging will necessitate that a new master cooling curve bedeveloped.
A10.5.1.4 If more than one curve is required per masterforging (180° apart) and a difference in cooling rate isachieved, then the most conservative curve shall be used as themaster curve.
A10.5.2 Reproducibility of Heat Treatment Parameters onProduction Forgings:
A10.5.2.1 All information pertaining to the quench andtemper of the master forging shall be recorded on an appro-priate permanent record, similar to the one shown in TableA10.1.
A10.5.2.2 All information pertaining to the quench andtemper of the production forgings shall be appropriatelyrecorded, preferably on a form similar to that used inA10.5.2.1. Quench records of production forgings shall beretained for future reference. The quench and temper record ofthe master forging shall be retained as a permanent record.
A10.5.2.3 A copy of the master forging record shall bestored with the heat treatment record of the production forging.
A10.5.2.4 The essential variables, as set forth on the heattreat record, shall be controlled within the given parameters onthe production forging.
A10.5.2.5 The temperature of the quenching medium priorto quenching each production forging shall be equal to or lowerthan the temperature of the quenching medium prior toquenching the master forging.
A10.5.2.6 The time elapsed from opening the furnace doorto quench for the production forging shall not exceed thatelapsed for the master forging.
A10.5.2.7 If the time parameter is exceeded in opening thefurnace door to beginning of quench, the forging shall beplaced back into the furnace and brought back up to equaliza-tion temperature.
A10.5.2.8 All forgings represented by the same masterforging shall be quenched with like orientation to the surface ofthe quench bath.
A10.5.2.9 All production forgings shall be quenched in thesame quench tank, with the same agitation as the masterforging.
A10.5.2.10Uniformity of Heat Treat Parameters—(1) Thedifference in actual heat treating temperature between produc-tion forgings and the master forging used to establish thesimulator cycle for them shall not exceed625°F (614°C) forthe quench cycle.(2) The tempering temperature of theproduction forgings shall not fall below the actual temperingtemperature of the master forging.(3) At least one contactsurface thermocouple shall be placed on each forging in aproduction load. Temperature shall be recorded for all surfacethermocouples on a Time Temperature Recorder and suchrecords shall be retained as permanent documentation.
A10.5.3 Heat-Cycle Simulation:A10.5.3.1 Program charts shall be made from the data
recorded on the master chart. All test specimens shall be giventhe same heating rate above, the AC1, the same holding timeand the same cooling rate as the production forgings.
A10.5.3.2 The heating cycle above the AC1, a portion of theholding cycle, and the cooling portion of the master chart shallbe duplicated and the allowable limits on temperature and time,as specified in (a)–(c), shall be established for verification ofthe adequacy of the simulated heat treatment.
(a) Heat Cycle Simulation of Test Coupon Heat Treatmentfor Quenched and Tempered Forgings and Bars—If coolingrate data for the forgings and bars and cooling rate controldevices for the test specimens are available, the test specimensmay be heat-treated in the device.
TABLE A10.1 Heat-Treat Record-Essential Variables
MasterForging
ProductionForging 1
ProductionForging 2
ProductionForging 3
ProductionForging 4
ProductionForging 5
Program chart numberTime at temperature and actual temperature of
heat treatmentMethod of coolingForging thicknessThermocouple immersionBeneath buffer (yes/no)Forging numberProductMaterialThermocouple location—0 degThermocouple location—180 degQuench tank No.Date of heat treatmentFurnace numberCycle numberHeat treaterStarting quench medium temperatureTime from furnace to quenchHeating rate above 1000°F (538°C)Temperature upon removal from quench after 5minOrientation of forging in quench
A 370 – 03a
47Perancangan dan pengembangan..., Yeny Pusvyta, FT UI, 2010.
(b) The test coupons shall be heated to substantially thesame maximum temperature as the forgings or bars. The testcoupons shall be cooled at a rate similar to and no faster thanthe cooling rate representative of the test locations and shall bewithin 25°F (14°C) and 20 s at all temperatures after coolingbegins. The test coupons shall be subsequently heat treated inaccordance with the thermal treatments below the criticaltemperature including tempering and simulated post weld heattreatment.
(c) Simulated Post Weld Heat Treatment of Test Specimens(for ferritic steel forgings and bars)—Except for carbon steel (PNumber 1, Section IX of the Code) forgings and bars with anominal thickness or diameter of 2 in. (51 mm) or less, the testspecimens shall be given a heat treatment to simulate anythermal treatments below the critical temperature that theforgings and bars may receive during fabrication. The simu-lated heat treatment shall utilize temperatures, times, andcooling rates as specified on the order. The total time attemperature(s) for the test material shall be at least 80 % of thetotal time at temperature(s) to which the forgings and bars aresubjected during postweld heat treatment. The total time attemperature(s) for the test specimens may be performed in asingle cycle.
A10.5.3.3 Prior to heat treatment in the simulator unit, testspecimens shall be machined to standard sizes that have beendetermined to allow adequately for subsequent removal ofdecarb and oxidation.
A10.5.3.4 At least one thermocouple per specimen shall beused for continuous recording of temperature on an indepen-dent external temperature-monitoring source. Due to the sen-sitivity and design peculiarities of the heating chamber ofcertain equipment, it is mandatory that the hot junctions ofcontrol and monitoring thermocouples always be placed in thesame relative position with respect to the heating source(generally infrared lamps).
A10.5.3.5 Each individual specimen shall be identified, andsuch identification shall be clearly shown on the simulatorchart and simulator cycle record.
A10.5.3.6 The simulator chart shall be compared to themaster chart for accurate reproduction of simulated quench in
accordance with A10.5.3.2(a). If any one specimen is not heattreated within the acceptable limits of temperature and time,such specimen shall be discarded and replaced by a newlymachined specimen. Documentation of such action and reasonsfor deviation from the master chart shall be shown on thesimulator chart, and on the corresponding nonconformancereport.
A10.5.4 Reheat Treatment and Retesting:A10.5.4.1 In the event of a test failure, retesting shall be
handled in accordance with rules set forth by the materialspecification.
A10.5.4.2 If retesting is permissible, a new test specimenshall be heat treated the same as previously. The productionforging that it represents will have received the same heattreatment. If the test passes, the forging shall be acceptable. Ifit fails, the forging shall be rejected or shall be subject to reheattreatment if permissible.
A10.5.4.3 If reheat treatment is permissible, proceed asfollows: (1) Reheat treatment same as original heat treatment(time, temperature, cooling rate): Using new test specimensfrom an area as close as possible to the original specimens,repeat the austenitize and quench cycles twice, followed by thetempering cycle (double quench and temper). The productionforging shall be given the identical double quench and temperas its test specimens above.(2) Reheat treatment using a newheat treatment practice. Any change in time, temperature, orcooling rate shall constitute a new heat treatment practice. Anew master curve shall be produced and the simulation andtesting shall proceed as originally set forth.
A10.5.4.4 In summation, each test specimen and its corre-sponding forging shall receive identical heat treatment or heattreatment; otherwise the testing shall be invalid.
A10.5.5 Storage, Recall, and Documentation of Heat-CycleSimulation Data—All records pertaining to heat-cycle simula-tion shall be maintained and held for a period of 10 years or asdesigned by the customer. Information shall be so organizedthat all practices can be verified by adequate documentedrecords.
SUMMARY OF CHANGES
Committee A01 has identified the location of selected changes to this standard since the last issue (A 370 – 03)that may impact the use of this standard. (Approved Oct. 1, 2003.)
(1) Tensile testing section amended to allow automatedtensile testing/elongation measurement as described in TestMethods E 8.
A 370 – 03a
48Perancangan dan pengembangan..., Yeny Pusvyta, FT UI, 2010.

Committee A01 has identified the location of selected changes to this standard since the last issue (A 370 – 02e1) that mayimpact the use of this standard. (Approved June 10, 2003.)
(1) Clarification of Section 13.2.1–Offset Method.
ASTM International takes no position respecting the validity of any patent rights asserted in connection with any item mentionedin this standard. Users of this standard are expressly advised that determination of the validity of any such patent rights, and the riskof infringement of such rights, are entirely their own responsibility.
This standard is subject to revision at any time by the responsible technical committee and must be reviewed every five years andif not revised, either reapproved or withdrawn. Your comments are invited either for revision of this standard or for additional standardsand should be addressed to ASTM International Headquarters. Your comments will receive careful consideration at a meeting of theresponsible technical committee, which you may attend. If you feel that your comments have not received a fair hearing you shouldmake your views known to the ASTM Committee on Standards, at the address shown below.
This standard is copyrighted by ASTM International, 100 Barr Harbor Drive, PO Box C700, West Conshohocken, PA 19428-2959,United States. Individual reprints (single or multiple copies) of this standard may be obtained by contacting ASTM at the aboveaddress or at 610-832-9585 (phone), 610-832-9555 (fax), or [email protected] (e-mail); or through the ASTM website(www.astm.org).
A 370 – 03a
49Perancangan dan pengembangan..., Yeny Pusvyta, FT UI, 2010.
Related Documents