Visvesvaraya Technological University Belgaum, Karnataka-590014 A PROJECT REPORT ON “LAKE WATER MONITORING SYSTEM” Submitted in partial fulfilment for the award of the degree of BACHELOR OF ENGINEERING IN Electronics and Communication Engineering Submitted By Bhavana Savanth (1NH15EC011) Sanjana Ranjan (1NH15EC741) Shubha A (1NH15EC102) UNDER THE GUIDANCE OF DR. B. MOHAN KUMAR NAIK Professor Dept. Of ECE, NHCE, Bengaluru

Welcome message from author
This document is posted to help you gain knowledge. Please leave a comment to let me know what you think about it! Share it to your friends and learn new things together.
Transcript
Visvesvaraya Technological University
Belgaum, Karnataka-590014
A PROJECT REPORT ON
“LAKE WATER MONITORING SYSTEM”
Submitted in partial fulfilment for the award of the degree of
BACHELOR OF ENGINEERING
IN
Electronics and Communication Engineering
Submitted By
Bhavana Savanth (1NH15EC011)
Sanjana Ranjan (1NH15EC741)
Shubha A (1NH15EC102)
UNDER THE GUIDANCE OF
DR. B. MOHAN KUMAR NAIK
Professor
Dept. Of ECE, NHCE, Bengaluru

DEPARTMENT OF ELECTRONICS AND COMMUNICATION
Certificate
Certified that the project work entitled “LAKE WATER MONITORING SYSTEM” carried out
by, BHAVANA SAVANTH (1NH15EC011), SANJANA RANJAN (1NH15EC741), SHUBHA A
(1NH15EC102), bonafide students of New Horizon College Of Engineering in partial fulfilment for the
award of Bachelor of Engineering in Electronics and Communication of the Visveswaraiah
Technological University, Belgaum during the year 2019. It is certified that all corrections/suggestions
indicated for Internal Assessment have been incorporated in the Report deposited in the departmental
library.
The project report has been approved as it satisfies the academic requirements in respect of Project
work prescribed for the said Degree.
GUIDE HOD PRINCIPAL
(Dr. B. Mohan Kumar Naik) (Dr.Sanjeev Sharma) (Dr. MANJUNATHA)
External Viva
Name of the examiners Signature with date
1
2

ACKNOWLEDGEMENT
It is our pleasure to present a project in partial fulfilment of the requirements for the
project work on “LAKE WATER MONITORING SYSTEM” in Bachelor of Engineering,
Department of Electronics and Communication.
We thankfully express our gratitude to Dr. Mohan Manghnani, Chairman of New Horizon
College of Engineering. We are very much thankful to Dr. Manjunatha, Principal of New
Horizon College of Engineering. They have provided me with the opportunity to reach the
most cherished goal and thus helping us to make a brighter career through Engineering.
We are very much thankful to Dr.Sanjeev Sharma, Head of the Department of Electronics
and Communication. We wish to express our gratitude to our Project Coordinators and our
guide Dr. B. Mohan Kumar Naik, Senior Associate Professor, Department of Electronics
and Communication Engineering, for their guidance and support during the course of our
project.
We express our sincere thanks to all the staff members of ECE Department for their
guidance and encouragement.
We would also like to thank our friend Mr Hariraj and Mr. Vitthal Muddapur, senior
Engineer for assisting us throughout our project.
Bhavana Savanth (1NH15EC011)
Sanjana Ranjan (1NH15EC741)
Shubha A (1NH15EC102)
DECLARATION
We, BHAVANA SAVANTH (1NH15EC011), SANJANA RANJAN (1NH15EC741), SHUBHA A
(1NH15EC102), students of 8th semester in ELECTRONICS AND COMMUNICATION ENGINEERING,
NEW HORIZON COLLEGE OF ENGINEERING, Bangalore hereby declare that the project work entitled
“LAKE WATER MONITORING SYSTEM” submitted to the Visvesvaraya Technological University
during the academic year 2018-2019, is a record of an original work done by us under the guidance of
Dr. Sanjeev Sharma, HOD, Department of Electronics and Communication, New Horizon College of
Engineering, Bangalore , DR. B. Mohan Kumar Naik, Professor, Department of Electronics and
Communication, New Horizon College of Engineering. This project work is submitted in partial
fulfilment of the requirements for the award of degree of Bachelor of Engineering in Electronics and
Communication. The results embodied in the thesis have not been submitted to any other University or
Institute for the award of any degree.
BHAVANA SAVANTH - 1NH15EC011
SANJANA RANJAN - 1NH15EC741
SHUBHA A - 1NH15EC102
PLACE: BENGALURU
DATE : 10-05-2019

ABSTRACT
With the elixir of life being fed with an influx of toxins drained in by the effluents channelled by the
ever-growing factory productions, monitoring what enters the water systems such as lakes is the need
of the hour. The innumerable health hazards and the biomagnification entering the Eco-system requires
prevention of these unmonitored pollutants from being a part of the system.
The purpose of the project is to monitor the compositions in water systems in rural and urban areas
that are prone to water pollution leading to various environmental and health hazards. This project
helps in connecting the various organizations including the Government and the factories using IOT and
transfer the real time information to keep a check on the factory outlets entering the water bodies and
hence prevent water pollution.
i
CONTENTS
Chapter-1
Introduction
1.1 Introduction ........................................................................................... 1
1.2 Problem Statement .......................................................................... …....1
1.3 Aim and Objective
1.3.1 Aim……………………………………………………………………………………………2
1.3.2 Objective.…………………………………………………………………………..………2
1.4 Motivation………………………………………………………………………………………..….2
1.5 Methodology………………………………………………………………………………………..3
1.6 Existing Methodology…………………………………………………...........................3
1.7 Proposed Methodology………………………………………………………………………..4
Chapter-2
Literature Survey
2.1 Literature survey………………………………………………………………………………….5
Chapter-3
System Design
3.1 System Architecture…………………………………………………………….................7
3.2 Data flow Diagram……………………………………………………………………………….7
3.3 Flow Chart……………………………………………………………………………………………8
3.4 Block Diagram……………………………………………………………………………………..9
3.5 Equations……………………………………………………………………………………………10
ii
Chapter-4
Hardware Description
4.1 Components……………………………………………………………………………………….11
4.2 Components Description
4.2.1 Sensors………………………………………………………………………………………12
4.2.2 Power Supply…………………………………………………………………………….16
4.2.3 Controller………………………………………………………………………………….18
4.2.4 Communication…………………………………………………………………………24
4.2.5 Display-LCD……………………………………………………………………………….26
4.2.6 GSM Module……………………………………………………………………………..27
Chapter-5
Software Description
5.1 Software Used……………………………………………………………………………………29
5.2 Software Explanation
5.2.1 Arduino IDE………………………………………………………………………………29
5.2.2 ThingSpeak………………………………………………………………………………30
5.2.3 KiCad……………………………………………………………………………………….32
iii
Chapter-6
Implementation & Working
6.1 Hardware Implementation…………………………………………………………………35
6.2 PCB Designing Steps…………………………………………………………………………..36
6.3 Software Implementation………………………………………………………………….39
6.4 Working……………………………………………………………………………………………..42
Chapter-7
Results and Snapshots
7.1 Results……………………………………………………………………………………………….44
7.2 Snapshots………………………………………………………………………………………….44
Chapter-8
Applications and Future Scope
8.1 Applications………………………………………………………………………………………47
8.2 Future Scope…………………………………………………………………………………….47
References………………………………………………………………………………….………….48
Appendix……………………………………………………………………………………………….50

LAKE WATER MONITORING SYSTEM
Dept of ECE, NHCE Page 1
CHAPTER 1
INTRODUCTION
1.1 INTRODUCTION
Healthy lakes provide us with a number of environmental benefits and influence our quality of life and
strengthen our economy. Proper lake function can ease the impact of floods and droughts by storing
large amounts of water and releasing it during shortages. They moderate the climate of the
surrounding areas and maintain an aquatic ecosystem and help in developing tourism.
Due to the vast increase in global industrial output, rural to urban drift and the over-utilization of land
and sea resources, the quality of water available to people has deteriorated greatly. The high use of
fertilizers in farms and also other chemicals in sectors such as mining and construction have
contributed immensely to the overall reduction of water quality globally.
In this paper, an IOT based water checking framework is utilized to deliver the difficulties relating to
explicit water dangers that are caused because of modern or Sewer squanders that are dumped in the
stream or lake water. This framework would be conveyed in a lake, a little repository, and so on.,
which would hand-off back the real‑time estimations of various parameters like pH, turbidity and
temperature remotely utilizing the submerged sensors in an effective and cost‑effective way. The
changein qualities sensed by the sensors can be retrieved by the ARM cortex-M3 controller.
1.2 PROBLEM STATEMENT
To have a monitoring system that can record and keep a check on the lake’s health and thus prevent
water pollution that are caused by the industrial effluents.
Due to lack of unattended effluent entry from the factories into lakes that are not accounted or
monitored and lack of documentation of periodic changes in the water contents that lead to
contamination
Utilization of technological means to combat recurring and exponentially increasing water pollution
and to intimate the concerned bodies to prevent the same.
LAKE WATER MONITORING SYSTEM
Dept of ECE, NHCE Page 2
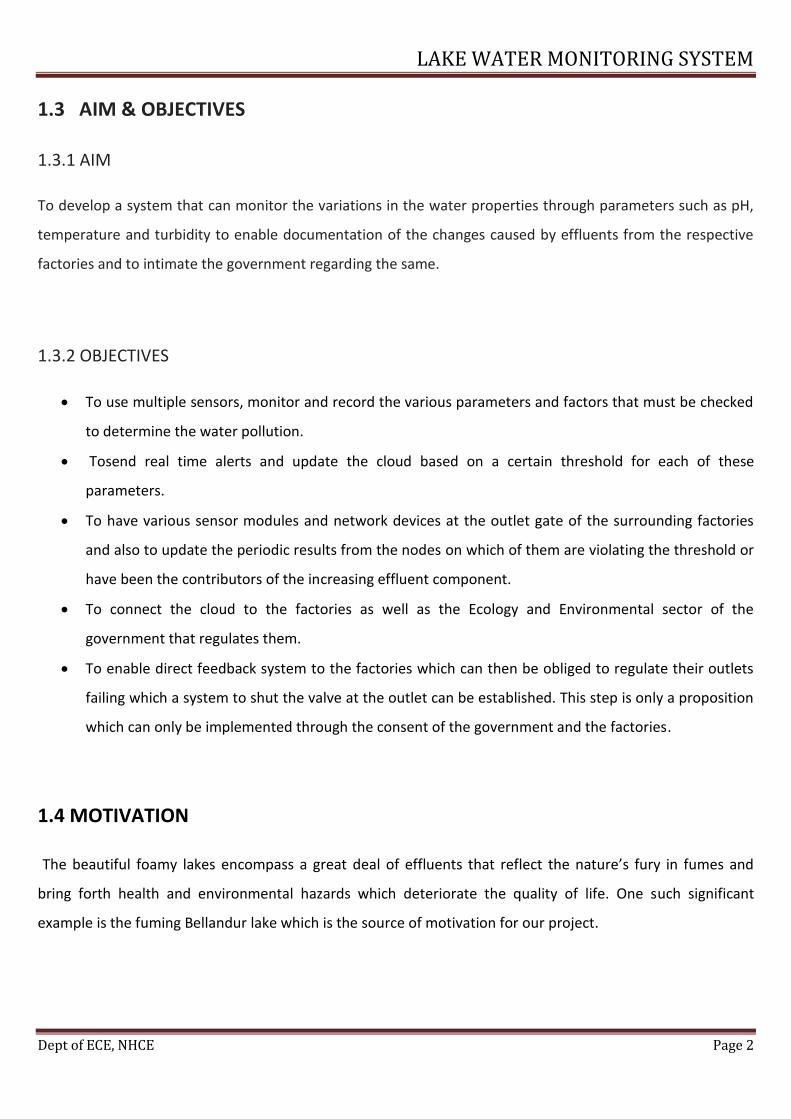
1.3 AIM & OBJECTIVES
1.3.1 AIM
To develop a system that can monitor the variations in the water properties through parameters such as pH,
temperature and turbidity to enable documentation of the changes caused by effluents from the respective
factories and to intimate the government regarding the same.
1.3.2 OBJECTIVES
To use multiple sensors, monitor and record the various parameters and factors that must be checked
to determine the water pollution.
Tosend real time alerts and update the cloud based on a certain threshold for each of these
parameters.
To have various sensor modules and network devices at the outlet gate of the surrounding factories
and also to update the periodic results from the nodes on which of them are violating the threshold or
have been the contributors of the increasing effluent component.
To connect the cloud to the factories as well as the Ecology and Environmental sector of the
government that regulates them.
To enable direct feedback system to the factories which can then be obliged to regulate their outlets
failing which a system to shut the valve at the outlet can be established. This step is only a proposition
which can only be implemented through the consent of the government and the factories.
1.4 MOTIVATION
The beautiful foamy lakes encompass a great deal of effluents that reflect the nature’s fury in fumes and
bring forth health and environmental hazards which deteriorate the quality of life. One such significant
example is the fuming Bellandur lake which is the source of motivation for our project.
LAKE WATER MONITORING SYSTEM
Dept of ECE, NHCE Page 3
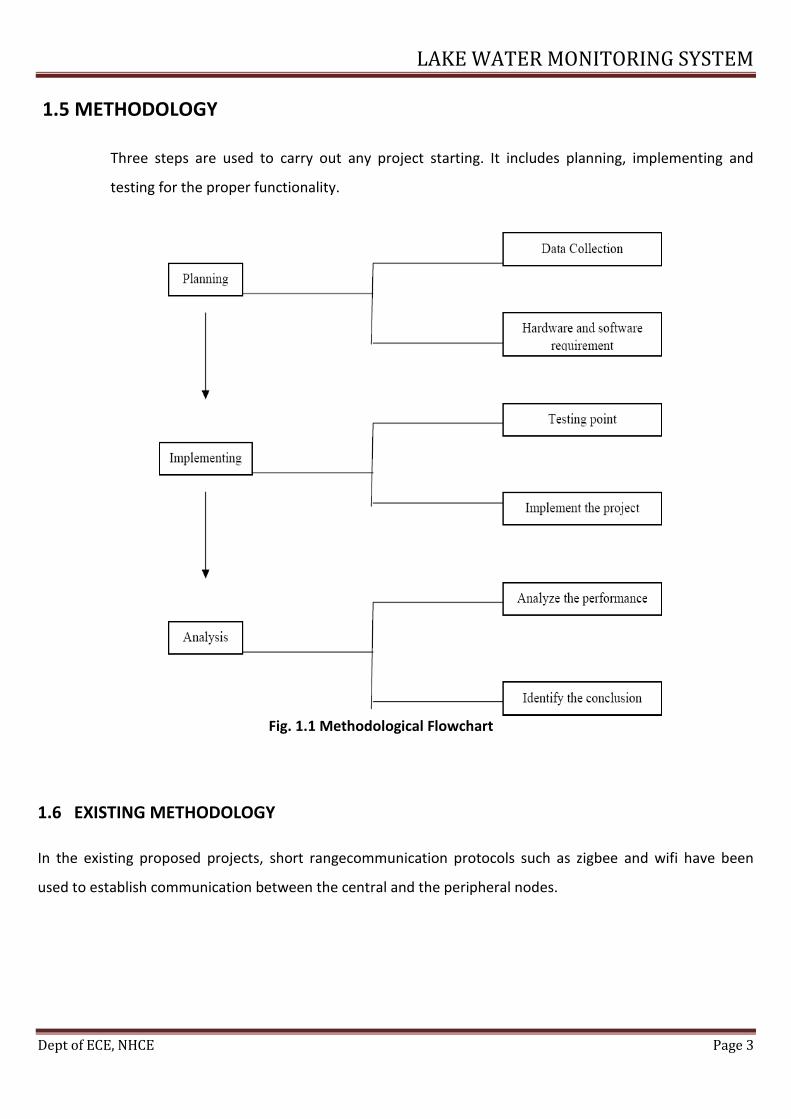
1.5 METHODOLOGY
Three steps are used to carry out any project starting. It includes planning, implementing and
testing for the proper functionality.
Fig. 1.1 Methodological Flowchart
1.6 EXISTING METHODOLOGY
In the existing proposed projects, short rangecommunication protocols such as zigbee and wifi have been
used to establish communication between the central and the peripheral nodes.

LAKE WATER MONITORING SYSTEM
Dept of ECE, NHCE Page 4
1.7 PROPOSED METHODOLOGY
In the project that we have proposed,
The concept of central and peripheral nodes
Using long range communication protocol LORA
Implementation of IOT by updating real time data to the cloud with respect to the nodes

LAKE WATER MONITORING SYSTEM
Dept of ECE, NHCE Page 5
CHAPTER 2
LITERATURE SURVEY
1. I. Kanu and Omeachi [10]
Summary:This paper is about the sources of water pollution that is caused by the various types of industries.
It is also gives the information about the Industrial effluents that affects the water quality. The industrial
effluents are characterized by their abnormal ph, temperature, total suspended salts, biological oxygen
demand, conductivity and total hardness. It is the study of the different effluents released from different
industries that are responsible for the change in the above parameters.
2. S. Geetha and S. Gouthami [1]
Summary:The paper presents a detailed survey on the smart water quality monitoring system that uses a lost
cost and less complex tools and techniques. In this, a single Launch pad with wi-fi module and is used as a
controller and sensors are embedded on the same controller. The parameters like turbidity, conductivity,
water level and ph are measured and the data is transmitted to the cloud (UBIDOTS) that provides SMS alert
to the smart phone when it’s threshold increases. The collected data is also displayed on a LED. The features
of UBIDOTS cloud include a real-time dashboard to analyze data or control devices and share the data through
the public links. It also provides the information about the applications of smart water quality monitoring,
types of controller used, parameters monitored, wireless communication technology and protocols used, type
of sensors used and the power consumption issues.
3. Vaishnavi V. Daigavane and Dr. M. A Gaikwad [4]
Summary:In this, the sensors used and working principle is explained in detail. The System consists of several
sensors like turbidity, pH, flow and temperature is connected to the core controller. The core controller can
access the sensor values and can process them to transfer the data through internet. Internet wi-fi
systemhelps in viewing the sensor data.They have deployed pH sensor, Turbidity sensor, Temperature sensor,
Flow sensor. They have used ATMEGA 328 with Wi-Fi module.Inbuilt ADC and Wi-Fi module connects the

LAKE WATER MONITORING SYSTEM
Dept of ECE, NHCE Page 6
embedded device to internet. Finally the Data will be automatically sent to the web server, when a proper
connection is established with sever device.
4. Amruta Amit Joshi [9]
Summary:This project is a water quality monitoring system using Wireless sensor Network (WSN) technology.
In this, the controller used is ARM board and the circuit is powered by Solar panel. Here a distributed sensor
nodes and a base station architecture is suggested for the real-time monitoring of the water at different sites.
The base station station and nodes are connected using the WSN technology like Zigbee. Data collected by
different sensors at the node side such as turbidity, temperature, conductivity, pH and salinity is sent to the
base station through WSN. Data collected from the remote sites can be displayed in visual format and it can
be analyzed using different simulation tools at base station. This system has various advantages like, low
power consumption, more flexibility to be deployed at remote site and no carbon emission.
5. A. N. Prasad, K. A. Mamun, F. R. Islam, H. Haqva [8]
Summary:The research involves the demonstration of a smart water quality monitoring system. They
collected water samples from 4 different water sources and were tested at the intervals of 1 hour for a
period of twelve hours in order to validate the accuracy of the system measurement. The obtained and
the expected research results matched. The system also has the GSM technology implementation that
alerts the final user to take immediate action to ensure the water quality by sending alarmon the basis of
reference parameter. In addition to this, the different water sources’ parameter references obtained will
be further used to build classifiers.
Predictive Analysis-These classifiersbuilt will be used to perform the automated analysis of the water
based on the data collected in the form of Neural Network Analysis using machine learning.
LAKE WATER MONITORING SYSTEM
Dept of ECE, NHCE Page 7
CHAPTER 3
SYSTEM DESIGN
3.1 SYSTEM ARCHITECTURE:
Large systems are always decomposed into sub-systems that provide some related set of services. The
initial design process of identifying these sub-systems and establishing a framework for sub-system control and
communication is called Architecture design.
The architectural design process is concerned with establishing a basic structural framework for a system. It
involves identifying the major components of the system and communications between these components. In
the following sub-sections we develop into the design aspects and the sub systems involved.
The project is divided into two modules
Sender site consisting of water sensors, processing unit and transceiver module for wireless
transmission.
Receiver site for monitoring received data from various transmitter nodes in the lakes.
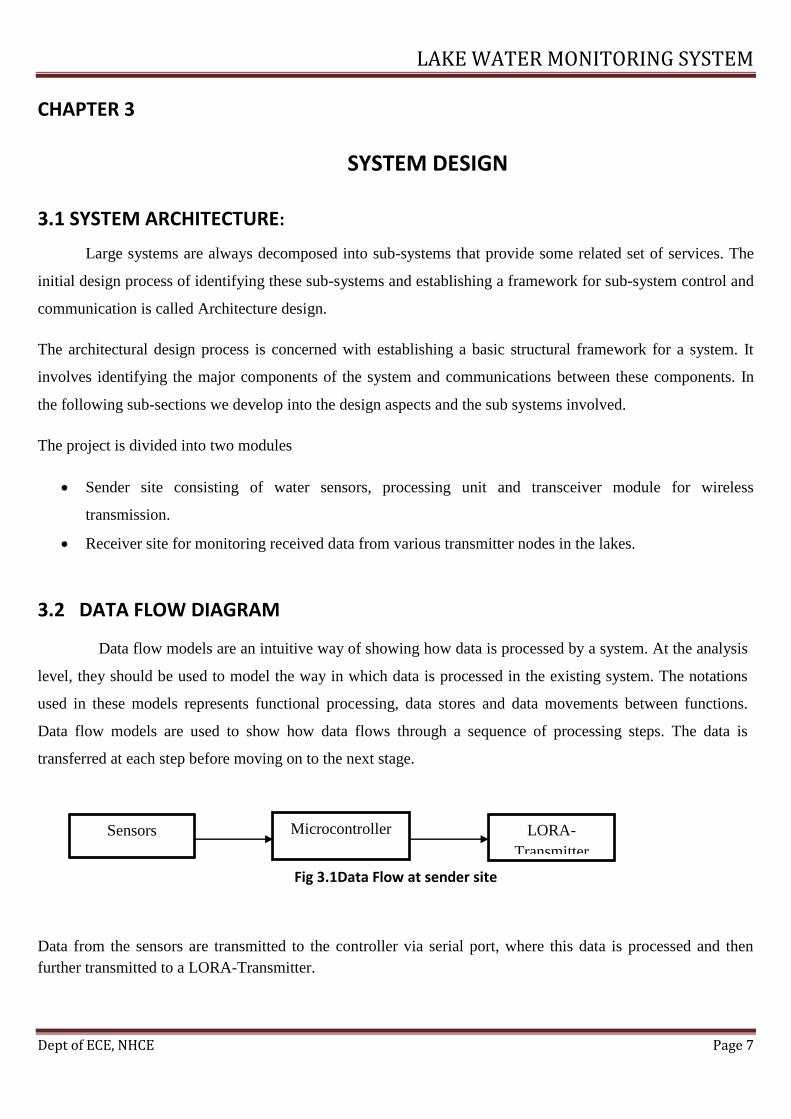
3.2 DATA FLOW DIAGRAM
Data flow models are an intuitive way of showing how data is processed by a system. At the analysis
level, they should be used to model the way in which data is processed in the existing system. The notations
used in these models represents functional processing, data stores and data movements between functions.
Data flow models are used to show how data flows through a sequence of processing steps. The data is
transferred at each step before moving on to the next stage.
Fig 3.1Data Flow at sender site
Data from the sensors are transmitted to the controller via serial port, where this data is processed and then
further transmitted to a LORA-Transmitter.
LORA-
Transmitter
Sensors Microcontroller
LAKE WATER MONITORING SYSTEM
Dept of ECE, NHCE Page 8
CLOUD
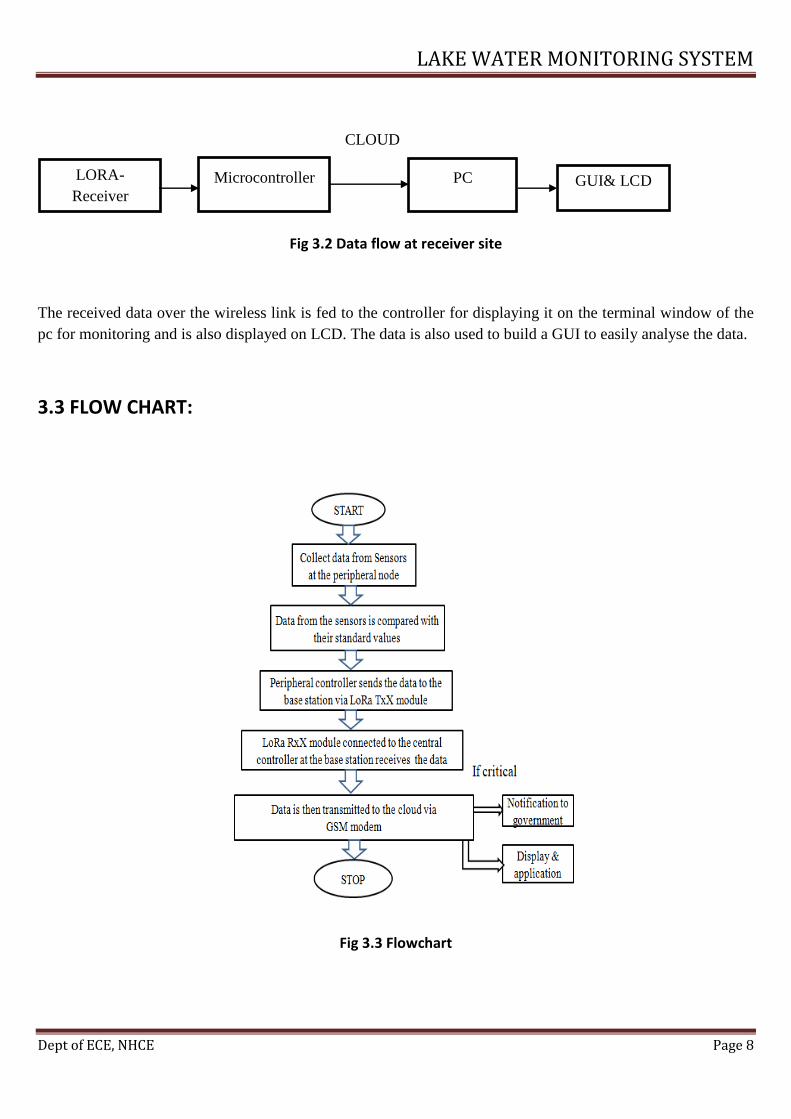
Fig 3.2 Data flow at receiver site
The received data over the wireless link is fed to the controller for displaying it on the terminal window of the
pc for monitoring and is also displayed on LCD. The data is also used to build a GUI to easily analyse the data.
3.3 FLOW CHART:
Fig 3.3 Flowchart
LORA-
Receiver
Microcontroller PC GUI& LCD
a
LAKE WATER MONITORING SYSTEM
Dept of ECE, NHCE Page 9
3.4 BLOCK DIAGRAM:
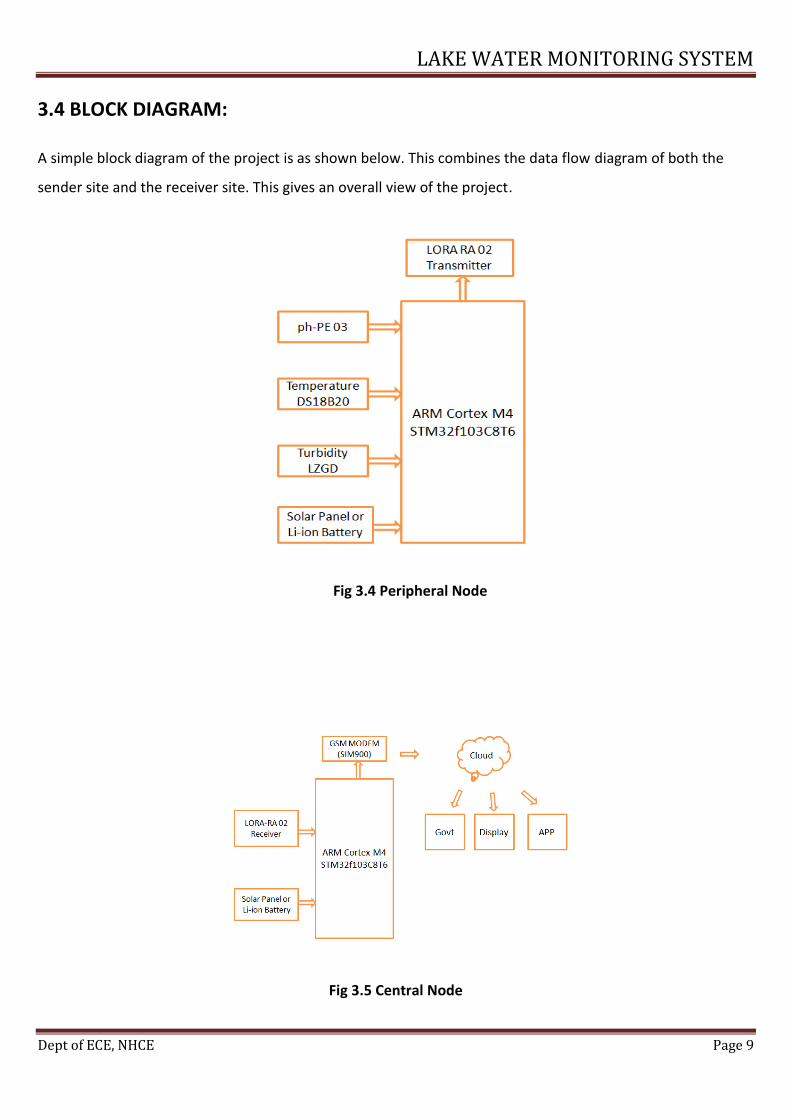
A simple block diagram of the project is as shown below. This combines the data flow diagram of both the
sender site and the receiver site. This gives an overall view of the project.
Fig 3.4 Peripheral Node
Fig 3.5 Central Node

LAKE WATER MONITORING SYSTEM
Dept of ECE, NHCE Page 10
3.5 EQUATIONS
Voltage divider equation(to make the 5V sensor values compatible with the 3.3V IO pins of the
microcontroller )
Vin(sensor)=Vout(sensor)/2 ...(Eq 3.5.1)
pH Voltage to pH value conversion
floatvout=((float)avgValue*3.3)/4096.0 ...(Eq 3.5.2)
Voltage to Temperature conversion
celsius = (float)raw / 16.0; …(Eq 3.5.3)
fahrenheit = celsius * 1.8 + 32.0; …(Eq 3.5.4)
Voltage to Turbidity value conversion
volt += ((float)analogRead(Turbidity_SensorPin)/4096)*3.3; …(Eq3.5.5)
volt = volt/800; …(Eq3.5.6)
volt=(volt*2)+Sensor_offset;
…(Eq3.5.7)

LAKE WATER MONITORING SYSTEM
Dept of ECE, NHCE Page 11
CHAPTER 4
HARDWARE DESCRIPTION
4.1 COMPONENTS:
PERIPHERAL NODE
1. Controller : STM32F103C8T6
2. SENSORS : PH sensor pH-03
Temperature sensor DS18B20
Turbidity sensor
3. Power Supply : Rechargeable Li-Ion 18650 Lithium Battery
Step up Converter boost 3V to 5V
4. Communication : LORA Ra-02
5. Display : LCD
CENTRAL NODE
1. Controller : STM32F103C8T6
2. Power Supply : Rechargeable Li-Ion 18650 Lithium Batter
Step up Converter boost 3V to 5V
3. Communication : LORA Ra-02
4. GSM Module : SIM900
LAKE WATER MONITORING SYSTEM
Dept of ECE, NHCE Page 12
4.2 COMPONENT DESCRIPTION
4.2.1 SENSORS:
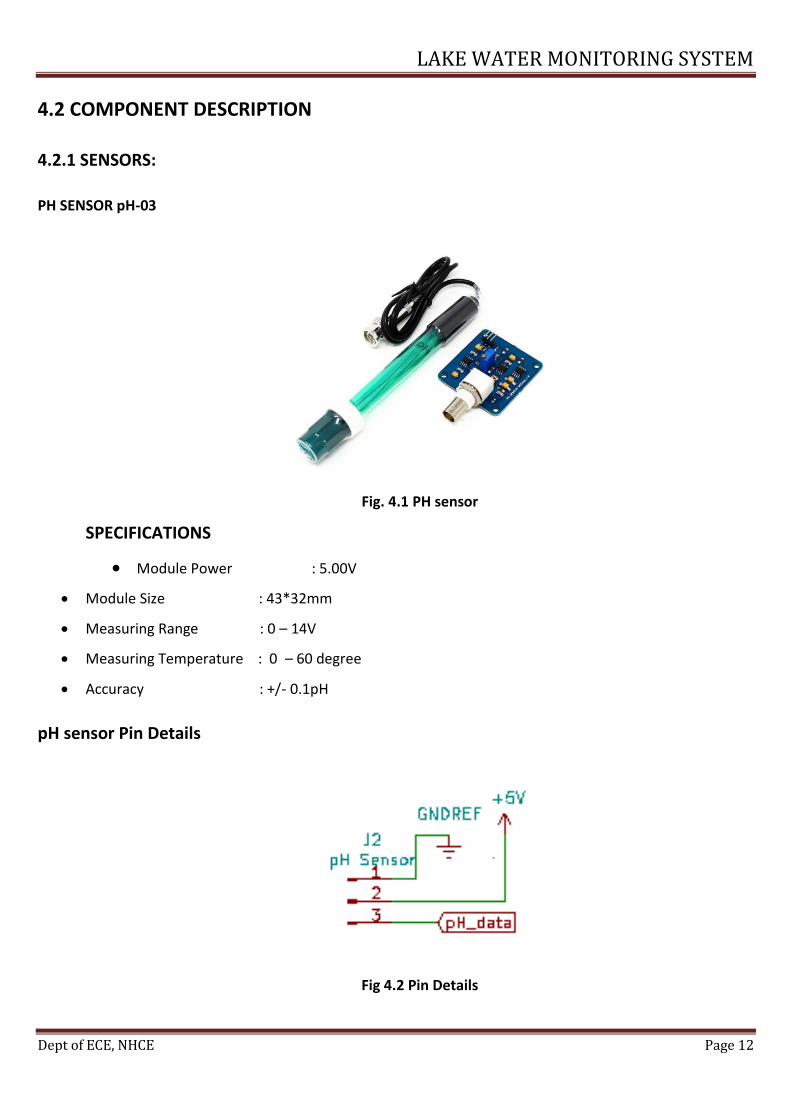
PH SENSOR pH-03
Fig. 4.1 PH sensor
SPECIFICATIONS
Module Power : 5.00V
Module Size : 43*32mm
Measuring Range : 0 – 14V
Measuring Temperature : 0 – 60 degree
Accuracy : +/- 0.1pH
pH sensor Pin Details
Fig 4.2 Pin Details
LAKE WATER MONITORING SYSTEM
Dept of ECE, NHCE Page 13
Working Principle
pH is the indication of Hydrogen ion Concentration present in certain solutions. pH value varies from 0 to 14.
The solutions are said to be acidic if their pH value lies between 0 and 7. The solutions are said to be basic if
their pH value lies between 8 and 14. The Acidic solutions will have higher hydrogen concentration and the
basic solutions will have lower hydrogen concentration. The Acidity of a solution can be measured by
measuring the pH of a solution. The solutions with the pH value 7 are the Neutral solutions.
pH sensor works on the principle that interface of two liquids produces a electric potential which can be
measured. It measures the potential difference between the two electrodes, a reference
electrode(silver/silver chloride) and a glass electrode that is sensitive to hydrogen ion. This forms the probe.
The electronic circuit is used to condition the signal appropriately.
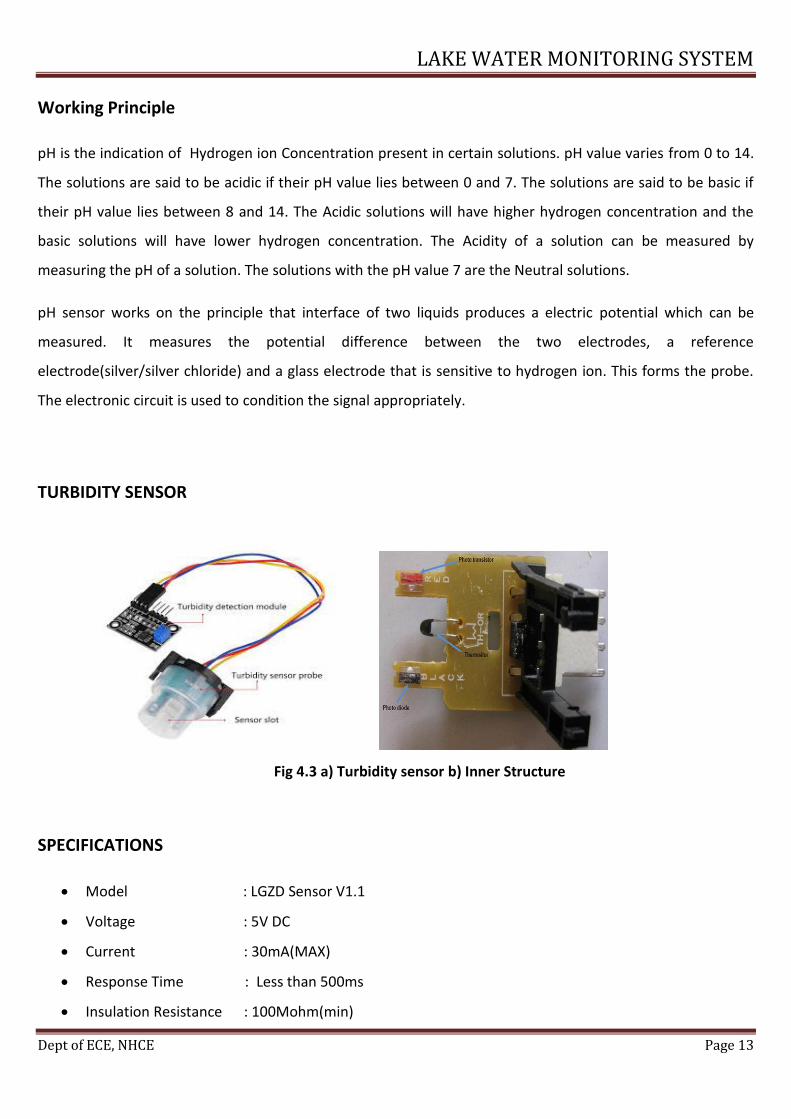
TURBIDITY SENSOR
Fig 4.3 a) Turbidity sensor b) Inner Structure
SPECIFICATIONS
Model : LGZD Sensor V1.1
Voltage : 5V DC
Current : 30mA(MAX)
Response Time : Less than 500ms
Insulation Resistance : 100Mohm(min)

LAKE WATER MONITORING SYSTEM
Dept of ECE, NHCE Page 14
Output : Analog (0-4.5v)
Digital (high 5V/ low 0V)
Operating Temperature : -30 to 80 degree.
PIN DETAILS
Fig 4.4 a) Pin details b) Connections
Working Principle
Turbidity Sensor is an electronic monitoring module that works with various Micro Controller platforms like
Arduino, ARM, PIC, Raspberry etc., It is used to detect and verify the quality of the water, by obtaining the
turbidity measurement and it is also possible to verify the results by means of digital or analog signal next to
the corresponding pins in the accompanying electronic module.
The Turbidity Sensor emits an infrared light at its end, imperceptible to human vision. This Infrared light is
capable of detecting particles that are suspended in water, measuring the light transmittance and the
dispersion rate. This measurement changes according to the Amount of TSS (Total Suspended Solids) that
increases or decreases the turbidity of the liquid whenever its levels increases or decreases. The sensor has an
end specially prepared for direct contact, having an electronic module to amplify and send the received data
to the microcontroller of the project. Hence it is used in projects involving the monitoring of water turbidity in
rivers, streams, lakes and water bodies.

LAKE WATER MONITORING SYSTEM
Dept of ECE, NHCE Page 15
TEMPERATURE SENSOR- DS18B20
Fig 4.5 DS18B20
SPECIFICATIONS
Voltage : 3.0 to 5.5V
Usable Temperature Range: -55 to 125 degree
9 to 12 bit selectable resolution
Uses 1-wire interface and requires only one digital pin for communication
Multiple sensors can share one pin
+/- 0.5 degree Accuracy
Temperature – limit alarm system
PIN DETAILS
Fig 4.6 a) Pin details b) Connections

LAKE WATER MONITORING SYSTEM
Dept of ECE, NHCE Page 16
WORKING PRINCIPLE
Temperature sensor has a 1 Meter Long Waterproof, sealed and pre-wired digital sensor probe based on
DS18B20sensor. Since it is digital, there will not be any signal degradation even over long distance.
Information is sent to/from the DS18B20 over a 1-Wire interface, so that only one wire (and ground needs to
be connected from a central microprocessor to a DS18B20. Power for reading, writing, and performing
temperature conversions can be derived from the data line itself with no need for an external power source.
When using with microcontroller a 4.7k resistor is used at the sensing pin, which is required as a pull up from
the DATA to VCC line.
4.2.2 POWER SUPPLY
RECHARGEABLE Li-Ion 18650 LITHIUM BATTERY
Fig 4.7a) Battery b) Polarity
SPECIFICATIONS
Nominal Voltage : 3.6V
Nominal Capacity : 2850mAh
Minimum discharge Voltage : 3V
Minimum discharge Current : 1C
Charging Voltage : 4.2V(max)
Charging Current : 0.5C
Charging Time : 3 hours(approx)
Charging Method : CC and CV

LAKE WATER MONITORING SYSTEM
Dept of ECE, NHCE Page 17
WORKING PRINCIPLE
The Rechargeable 18650 battery has the Lithium Ion type chemistry, due to which very high care has to be
taken while using this battery. As the name suggests, it is both charging and discharging battery. Discharging
the battery, requires more care, so that current consumption shouldn’t be more than the C rating and also
discharging shouldn’t happen below 3.0 V. Hence for a single 18650 cell, a battery protection module
like TP4056is highly recommended to charge and discharge the module safely. This circuit monitor the
discharge current and the under voltage value to cut off the battery from the load if anything goes wrong.
Care should also be taken that the battery never experiences reverse polarity or a short circuit.
C rating and mAh of a battery:
These are the two common terms associated while working with the batteries. A2850mAh rated 18650
cell rated means that the battery will consume 2.850A current from the battery and will last for 1 hour.
Similarly if its consumes only 0.285A current from the battery, it will last for 10 hours.Hence the Ah rating
allows us to calculate how long the battery based on the current consumed, which is required for our
application.
C rating for a 18650 battery is usually 1C. This indicates that we can consume a maximum of 2.85A from the
battery. Since (Ah rating * C rating) gives the maximum current that can be sucked out from the battery. In
the case of C rating for a battery 0.5C a maximum of 1.42A (2.8/2) can be consumed from the battery.
The charging voltage of 18650 cell is 4.2V and recommended charging current is 1A (0.5C). A module like
TP4056 helps in charging this module and also provides protection while discharging.Inorder to achieve higher
level of voltages, more than one 18650 cells will be connected in series or parallel.Here care should be taken
that all the cells are maintained at the same voltage levels. This process is called as cell balancing. It is usually
done using a BMS (Battery management system) which takes the responsibility of charging and discharging
the batteries uniformly.

LAKE WATER MONITORING SYSTEM
Dept of ECE, NHCE Page 18
4.2.3 Controller-STM32F103C8T6
Fig 4.8 STM32F103C8T6
PIN DESCRIPTION
Fig 4.9 Pin Description

LAKE WATER MONITORING SYSTEM
Dept of ECE, NHCE Page 19
SPECIFICATIONS
Architecture : 32-Bit ARM Cortex M3
Operating Voltage : 2.7V to 3.6V
CPU Frequency : 72MHz
Number of GPIO Pins : 37
Number of PWM Pins : 12
Analog Input Pins : 10 (12-bit)
USART Peripherals : 3
I2C Peripherals : 2
SPI Peripherals : 2
Timers : 3(16 bit)
Flash Memory : 64KB/128KB
RAM : 20KB
Reset button
LED on PIN PC13
32 kHz Real time clock crystal
Jump links on Boot0 and Boot1
Micro USB connector for power and data
ST-Link header on the top of the board.
OVERVIEW
ARM Cortex®-M3 core with embedded Flash and SRAM
The ARM Cortex®-M3 processor is the latest generation of ARM processors for embedded systems. It
has been developed to provide a low-cost platform that meets the needs of MCU implementation,
with a reduced pin count and low-power consumption, while delivering outstanding computational
performance and an advanced system response to interrupts. The ARM Cortex-M3 32-bit RISC
processor features exceptional code-efficiency, delivering the high-performance expected from an
ARM core in the memory size usually associated with 8- and 16-bit devices

LAKE WATER MONITORING SYSTEM
Dept of ECE, NHCE Page 20
Embedded Flash memory
64 or 128 Kbytes of embedded Flash is available for storing programs and data.
CRC (cyclic redundancy check) calculation unit
The CRC (cyclic redundancy check) calculation unit is used to get a CRC code from a 32-bit data word
and a fixed generator polynomial. Among other applications, CRC-based techniques are used to verify
data transmission or storage integrity.
The CRC calculation unit helps compute a signature of the software during runtime, to be compared
with a reference signature generated at linktime and stored at a given memory location.
Embedded SRAM
Twenty Kbytes of embedded SRAM accessed (read/write) at CPU clock speed with 0 wait states.
Nested vectored interrupt controller (NVIC)
The STM32F103xx performance line embeds a nested vectored interrupt controller able to handle up
to 43 maskable interrupt channels (not including the 16 interrupt lines of Cortex®- M3) and 16 priority
levels.This hardware block provides flexible interrupt management features with minimal interrupt
latency
External interrupt/event controller (EXTI)
The external interrupt/event controller consists of 19 edge detector lines used to generate
interrupt/event requests. Each line can be independently configured to select the trigger event (rising
edge, falling edge, both) and can be masked independently. A pending register maintains the status of
the interrupt requests.Up to 80 GPIOs can be connected to the 16 external interrupt lines.
Clocks and Startup
System clock selection is performed on startup, however the internal RC 8 MHz oscillator is selected as
default CPU clock on reset. An external 4-16 MHz clock can be selected, in which case it is monitored
for failure. If failure is detected, the system automatically switches back to the internal RC oscillator. A
software interrupt is generated if enabled. Similarly, full interrupt management of the PLL clock entry

LAKE WATER MONITORING SYSTEM
Dept of ECE, NHCE Page 21
is available when necessary (for example on failure of an indirectly used external crystal, resonator or
oscillator).
Boot modes
At startup, boot pins are used to select one of three boot options:
• Boot from User Flash
• Boot from System Memory
• Boot from embedded SRAM
The boot loader is located in System Memory
Power supply schemes
• VDD = 2.0 to 3.6 V: external power supply for I/Os and the internal regulator. Provided externally
through VDD pins.
• VSSA, VDDA = 2.0 to 3.6 V: external analog power supplies for ADC, reset blocks, RCs and PLL
(minimum voltage to be applied to VDDA is 2.4 V when the ADC is used). VDDA and VSSA must be
connected to VDD and VSS, respectively.
• VBAT = 1.8 to 3.6 V: power supply for RTC, external clock 32 kHz oscillator and backup registers
(through power switch) when VDD is not present.
Low-power modes
The STM32F103xx performance line supports three low-power modes to achieve the best compromise
between low-power consumption, short startup time and available wakeup sources:
Sleep mode: In Sleep mode, only the CPU is stopped. All peripherals continue to operate and
can wake up the CPU when an interrupt/event occurs.
Stop mode: The Stop mode achieves the lowest power consumption while retaining the
content of SRAM and registers. All clocks in the 1.8 V domain are stopped, the PLL, the HSI RC
and the HSE crystal oscillators are disabled. The voltage regulator can also be put either in
normal or in low-power mode.
Standby mode: The Standby mode is used to achieve the lowest power consumption. The
internal voltage regulator is switched off so that the entire 1.8 V domain is powered off. The
PLL, the HSI RC and the HSE crystal oscillators are also switched off. After entering Standby

LAKE WATER MONITORING SYSTEM
Dept of ECE, NHCE Page 22
mode, SRAM and register contents are lost except for registers in the Backup domain and
Standby circuitry.
Timers and watchdogs
1. Advanced-control timer (TIM1) :The advanced-control timer (TIM1) can be seen as a three-phase
PWM multiplexed on 6 channels. It has complementary PWM outputs with programmable inserted
dead-times. It can also be seen as a complete general-purpose timer. The 4 independent channels can
be used for • Input capture • Output compare • PWM generation (edge- or center-aligned modes) •
One-pulse mode output If configured as a general-purpose 16-bit timer, it has the same features as the
TIMx timer. If configured as the 16-bit PWM generator, it has full modulation capability (0-100%).
2. General-purpose timers (TIMx) :There are up to three synchronizable general-purpose timers
embedded in the STM32F103xx performance line devices. These timers are based on a 16-bit auto-
reload up/down counter, a 16-bit prescaler and feature 4 independent channels each for input
capture/output compare, PWM or one-pulse mode output. This gives up to 12 input captures/output
compares/PWMs on the largest packages.
3. Independent watchdog :The independent watchdog is based on a 12-bit downcounter and 8-bit
prescaler. It is clocked from an independent 40 kHz internal RC and as it operates independently of the
main clock, it can operate in Stop and Standby modes. It can be used either as a watchdog to reset the
device when a problem occurs, or as a free-running timer for application timeout management. It is
hardware- or software-configurable through the option bytes. The counter can be frozen in debug
mode. Window watchdog The window watchdog is based on a 7-bit downcounter that can be set as
free-running. It can be used as a watchdog to reset the device when a problem occurs. It is clocked
from the main clock. It has an early warning interrupt capability and the counter can be frozen in
debug mode.
4. SysTick timer: This timer is dedicated for OS, but could also be used as a standard downcounter. It
features: • A 24-bit downcounter • Autoreload capability • Maskablesystem interrupt generation
when the counter reaches 0 • Programmable clock source
LAKE WATER MONITORING SYSTEM
Dept of ECE, NHCE Page 23
I²C bus
Up to two I²C bus interfaces can operate in multimaster and slave modes. They can support standard
and fast modes. They support dual slave addressing (7-bit only) and both 7/10-bit addressing in master
mode. A hardware CRC generation/verification is embedded.
Universal synchronous/asynchronous receiver transmitter (USART)
One of the USART interfaces is able to communicate at speeds of up to 4.5 Mbit/s. The other available
interfaces communicate at up to 2.25 Mbit/s.
Serial peripheral interface (SPI)
Up to two SPIs are able to communicate up to 18 Mbits/s in slave and master modes in fullduplex and
simplex communication modes. The 3-bit prescaler gives 8 master mode frequencies and the frame is
configurable to 8 bits or 16 bits.
Universal serial bus (USB)
The STM32F103xx performance line embeds a USB device peripheral compatible with the USB full-
speed 12 Mbs. The USB interface implements a full-speed (12 Mbit/s) function interface. It has
software-configurable endpoint setting and suspend/resume support. The dedicated 48 MHz clock is
generated from the internal main PLL
GPIOs (general-purpose inputs/outputs)
Each of the GPIO pins can be configured by software as output (push-pull or open-drain), as input (with
or without pull-up or pull-down) or as peripheral alternate function. Most of the GPIO pins are shared
with digital or analog alternate functions. All GPIOs are high currentcapable. The I/Os alternate
function configuration can be locked if needed following a specific sequence in order to avoid spurious
writing to the I/Os registers.
ADC (analog-to-digital converter)
Two 12-bit analog-to-digital converters are embedded into STM32F103xx performance line devices
and each ADC shares up to 16 external channels, performing conversions in singleshot or scan modes.
In scan mode, automatic conversion is performed on a selected group of analog inputs. Additional logic
functions embedded in the ADC interface allow:
LAKE WATER MONITORING SYSTEM
Dept of ECE, NHCE Page 24
• Simultaneous sample and hold
• Interleaved sample and hold
• Single shunt
The ADC can be served by the DMA controller. An analog watchdog feature allows very precise
monitoring of the converted voltage of one, some or all selected channels. An interrupt is generated
when the converted voltage is outside the programmed thresholds.
Serial wire JTAG debug port (SWJ-DP)
The ARM SWJ-DP Interface is embedded and is a combined JTAG and serial wire debug port that
enables either a serial wire debug or a JTAG probe to be connected to the target. The JTAG TMS and
TCK pins are shared with SWDIO and SWCLK, respectively, and a specific sequence on the TMS pin is
used to switch between JTAG-DP and SW-DP.
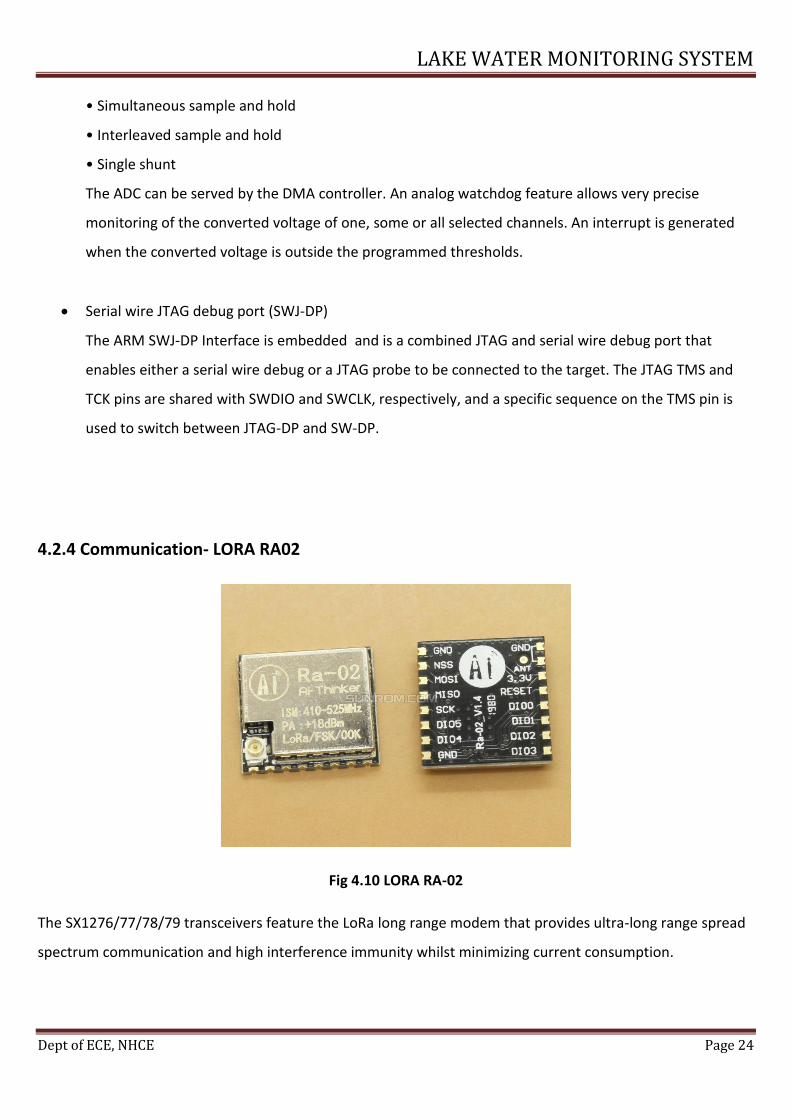
4.2.4 Communication- LORA RA02
Fig 4.10 LORA RA-02
The SX1276/77/78/79 transceivers feature the LoRa long range modem that provides ultra-long range spread
spectrum communication and high interference immunity whilst minimizing current consumption.

LAKE WATER MONITORING SYSTEM
Dept of ECE, NHCE Page 25
Features
LoRaTM Modem 168dB maximum link budget
+20dBm - 100mW constant RF output vs. V supply
+14dBm high efficiency PA
Programmable bit rate up to 300kbps
High sensitivity: down to -148dBm
Bullet-proof front end: IIP3 = -11dBm
Excellent blocking immunity
Low RX current of 9.9mA, 200nA register retention
Fully integrated synthesizer with a resolution of 61Hz
FSK, GFSK, MSK, GMSK, LoRa and OOK modulation
Built-in bit synchronizer for clock recovery
127dB Dynamic Range RSSI
Automatic RF Sense and CAD with ultra-fast AFC
Packet engine up to 256 bytes with CRC
Built-in temperature sensor and low battery indicator
Applications
Automated Meter Reading
Home and Building Automation
Wireless Alarm and Security Systems
Industrial Monitoring and Control
Long range Irrigation Systems
LAKE WATER MONITORING SYSTEM
Dept of ECE, NHCE Page 26
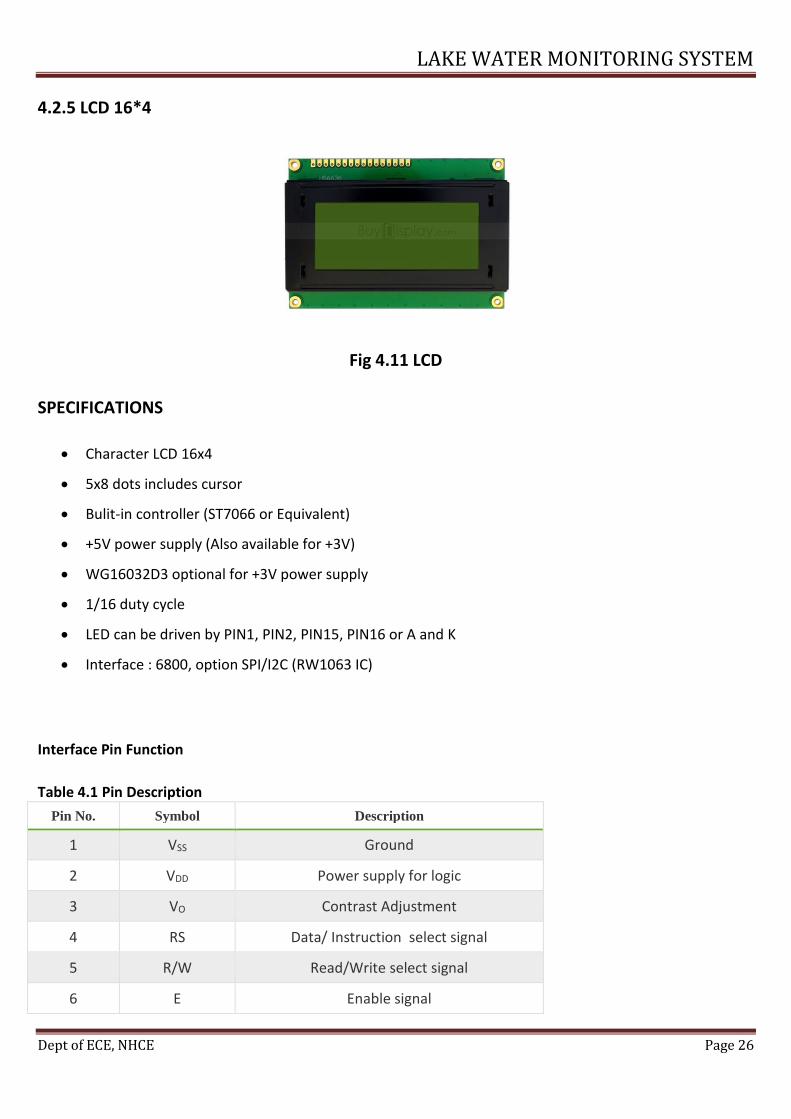
4.2.5 LCD 16*4
Fig 4.11 LCD
SPECIFICATIONS
Character LCD 16x4
5x8 dots includes cursor
Bulit-in controller (ST7066 or Equivalent)
+5V power supply (Also available for +3V)
WG16032D3 optional for +3V power supply
1/16 duty cycle
LED can be driven by PIN1, PIN2, PIN15, PIN16 or A and K
Interface : 6800, option SPI/I2C (RW1063 IC)
Interface Pin Function
Table 4.1 Pin Description
Pin No. Symbol Description
1 VSS Ground
2 VDD Power supply for logic
3 VO Contrast Adjustment
4 RS Data/ Instruction select signal
5 R/W Read/Write select signal
6 E Enable signal

LAKE WATER MONITORING SYSTEM
Dept of ECE, NHCE Page 27
7~14 DB0~DB7 Data bus line
15 A Power supply for B/L +
16 K Power supply for B/L -
4.2.6 GSM Module-SIM900
Fig 4.12 SIM900
The GPRS Shield is based on SIM900 module from SIMCOM and compatible with Arduino and its clones. The
GPRS Shield provides you a way to communicate using the GSM cell phone network. The shield allows you to
achieve SMS, MMS, GPRS and Audio via UART by sending AT commands (GSM 07.07 ,07.05 and SIMCOM
enhanced AT Commands). The shield also has the 12 GPIOs, 2 PWMs and an ADC of the SIM900 module
Features
Quad-Band 850 / 900/ 1800 / 1900 MHz – would work on GSM networks in all countries across the
world.
GPRS multi-slot class 10/8
GPRS mobile station class B
Compliant to GSM phase 2/2+
LAKE WATER MONITORING SYSTEM
Dept of ECE, NHCE Page 28
Class 4 (2 W at 850 / 900 MHz)
Class 1 (1 W at 1800 / 1900MHz)
Control via AT commands : Standard Commands: GSM 07.07 and 07.05 – Enhanced Commands:
SIMCOM AT Commands.
Short Message Service : so that you can send small amounts of data over the network (ASCII or raw
hexadecimal).
Embedded TCP/UDP stack : allows you to upload data to a web server.
RTC supported.
Selectable serial port.
Speaker and Headphone jacks
Low power consumption : 1.5mA(sleep mode)
Industrial Temperature Range – -40°C to +85 °C
Application
M2M (Machine 2 Machine) Applications.
Remote control of appliances.
Remote Weather station or a Wireless Sensor Network.
Vehicle Tracking System with a GPS module.
LAKE WATER MONITORING SYSTEM
Dept of ECE, NHCE Page 29
CHAPTER 5
SOFTWARE DESCRIPTION
5.1 SOFTWARES USED
Arduino IDE
ThingSpeak
KICAD
5.2 SOFTWARE EXPLANATION
5.2.1 ARDUINO IDE
Arduino integrated development environment popularly known as Arduino IDEis an application with a
cross-platform compatible with the Windows, mac Operating System, Linux that is written in the
popular JAVA which is a high level programming language.
It is not only used to write codes and dump programs to Arduino compatible boards but it is also used
to program on with the assistance of third party cores, various other vendor development
programmable boards.
The IDE source codes are all released under the General Public License popularly known as GNU,
which is of version 2. The Arduino IDE software supports other programming languages such as C and
C++ using special structuring coding rules.
The Arduino IDE offers a special software library from their Wiring project, which offers many
common same inputs and same output procedures. User who have written their codes only requires
two main basic functions, that is for starting the sketch and for the main program loop, that are
compiled and then linked with a program functionstub main() using a GNU tool into an executable c
executive cyclic program , also which is included with the IDE distribution.
LAKE WATER MONITORING SYSTEM
Dept of ECE, NHCE Page 30
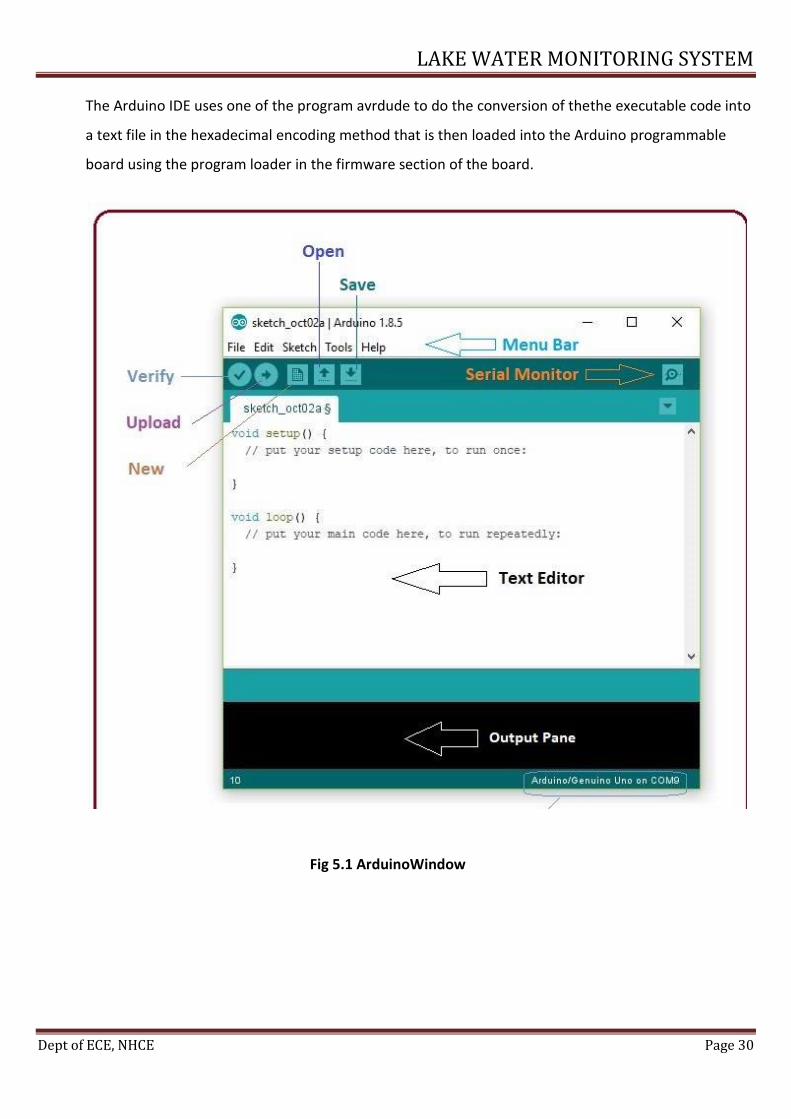
The Arduino IDE uses one of the program avrdude to do the conversion of thethe executable code into
a text file in the hexadecimal encoding method that is then loaded into the Arduino programmable
board using the program loader in the firmware section of the board.
Fig 5.1 ArduinoWindow
LAKE WATER MONITORING SYSTEM
Dept of ECE, NHCE Page 31
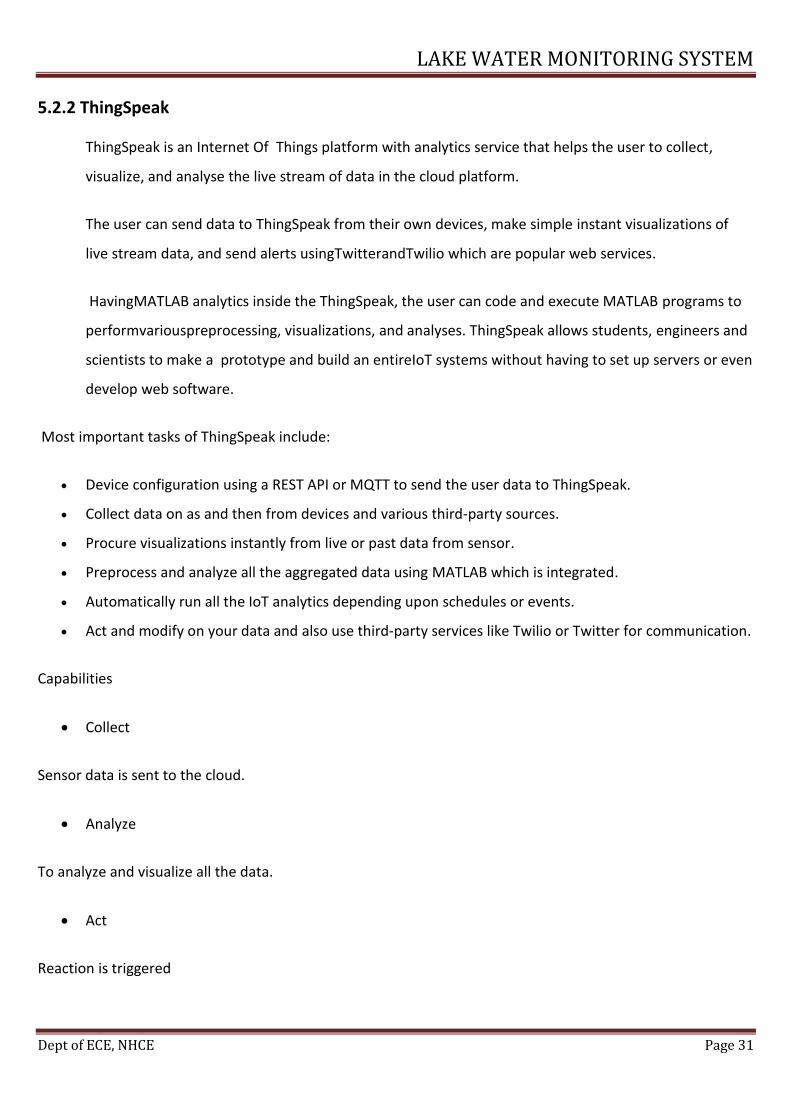
5.2.2 ThingSpeak
ThingSpeak is an Internet Of Things platform with analytics service that helps the user to collect,
visualize, and analyse the live stream of data in the cloud platform.
The user can send data to ThingSpeak from their own devices, make simple instant visualizations of
live stream data, and send alerts usingTwitterandTwilio which are popular web services.
HavingMATLAB analytics inside the ThingSpeak, the user can code and execute MATLAB programs to
performvariouspreprocessing, visualizations, and analyses. ThingSpeak allows students, engineers and
scientists to make a prototype and build an entireIoT systems without having to set up servers or even
develop web software.
Most important tasks of ThingSpeak include:
Device configuration using a REST API or MQTT to send the user data to ThingSpeak.
Collect data on as and then from devices and various third-party sources.
Procure visualizations instantly from live or past data from sensor.
Preprocess and analyze all the aggregated data using MATLAB which is integrated.
Automatically run all the IoT analytics depending upon schedules or events.
Act and modify on your data and also use third-party services like Twilio or Twitter for communication.
Capabilities
Collect
Sensor data is sent to the cloud.
Analyze
To analyze and visualize all the data.
Act
Reaction is triggered
LAKE WATER MONITORING SYSTEM
Dept of ECE, NHCE Page 32
Fig 5.2 ThingSpeak
5.2.3 KiCad
KiCad popularly pronounced as "Key-CAD" is a free suite software used for electronic design
automation popularly known as EDA. It helps the designer of the schematic to design schematics for electronic
circuits and also helps in facilitating to convert them to PCB designs.
KiCad was developed originally by Jean-Pierre Charras. It has an environment integrated to capture the
schematic and PCB layout design. There are various tools that are present within the package to make the bill
of materials, the artworks, the important Gerber files, and the 3Dimentional views and images of the PCB and
its components.
Main Parts
The important main parts of the KiCad suite are
KiCad – the main manager of the project.
Eeschema – the editor of the schematic capture.
Pcbnew – the program for PCB layout . It also has a 3D view in it.
GerbView – the view of the Gerber.
Bitmap2Component – tool used for PCB artwork in the conversion of the images to footprints

LAKE WATER MONITORING SYSTEM
Dept of ECE, NHCE Page 33
Features
Cad uses an environment thaisia integrated for all of the design stage processes that is Schematic capture,
PCB layout design, Gerber file generation or visualization, and as well as library editing.
KiCad is a program that is cross-platform, developed in C++ programming language with wxWidgets
software to run easily on FreeBSD, Linux, Microsoft Windows and Mac OperatingSsystemX.
Various libraries of components are available, and user can design and make and can also add custom
components to the library. The customized components can be available only for a particular project or can be
made global to the future projects. There are also many tools that help with importing the components from
various other EDA applications such as EAGLE. Configuration files are documented well in plain text, which
facilitates in interfacing the version control systems, as well as with interfacing the automatically generated
scripts of the component.
The software suports multiple languages
like Bulgarian, Catalan, Chinese, Czech, Dutch, English, Finnish, French, German, Greek, Hungarian, Italian, Jap
anese, Korean, Lithuanian, Polish, Portuguese, Russian, Slovak, Slovene, Spanish, and Swedish.
Eeschema
Eeschema has many features which include the schematic sheets which are hierarchical, customize symbol
creation, and an ERC populary known as electrical rules check. InEeschema, schematic symbols are very
loosely joint to the footprints in Pcbnew to promote the reuse of the footprints and as well as the symbols for
example consider a single 0805 footprint can be used for capacitors, resistors, inductors, etc..
Pcbnew
Pcbnewinternally supports maximum up to 32 layers of copper and 32 layers of technical. Dimensions of the
pcbneware stored with a precision in nanometer , a signed 32-bit integers that makes the theoretical maximal
of the PCB dimension to 231 nm, 2.14 meters approximately.
Pcbnewiscurrenlyheavily refactored, including it’s getting a brand new rendering engine called the graphics
abstraction layer, or popularly known as GAL with back ends of an OpenGL and Cairo . Pcbnew is also
developing a new framework too to help more easily allow other user developers to add more number of
tools without having to struggle with borrowing support from multiple renderers. Due to this reason, some of

LAKE WATER MONITORING SYSTEM
Dept of ECE, NHCE Page 34
the tools are only available on the XOR-based renderer legacy and some only GAL renderers have the
availability.
KiCad has a auto-router built-in for simple single connections. On the alternative side ,Java based free routing
of AlfonsWirtz's can be used toautoroute the boards externally. Toporouter of Anthony Blake's , a topological
autorouter who developed in the year 2008 for a google funded open source project gEDAmentored
by DJDelorie, has adapted for the use with KiCad as well.
A DRC popularly known as Design Rules Check is available to check for logical errors that commonly occur.
The function that is used for 3D viewing is generally based on the VRML models, and the exportation for CAD
integration of theboard model.
Some recent] additions are as follow.
An interactive router, which has the features of the ability to move around the existing traces on the way
or to shove existing traces into a new different position while still managing their connectivity.
PCB routing tools with high speed such as matching the track-length and the support the differentialpair.
SupportPython scripting.
LAKE WATER MONITORING SYSTEM
Dept of ECE, NHCE Page 35
CHAPTER 6
IMPLEMENTATION & WORKING
6.1HARDWARE IMPLEMENTATION
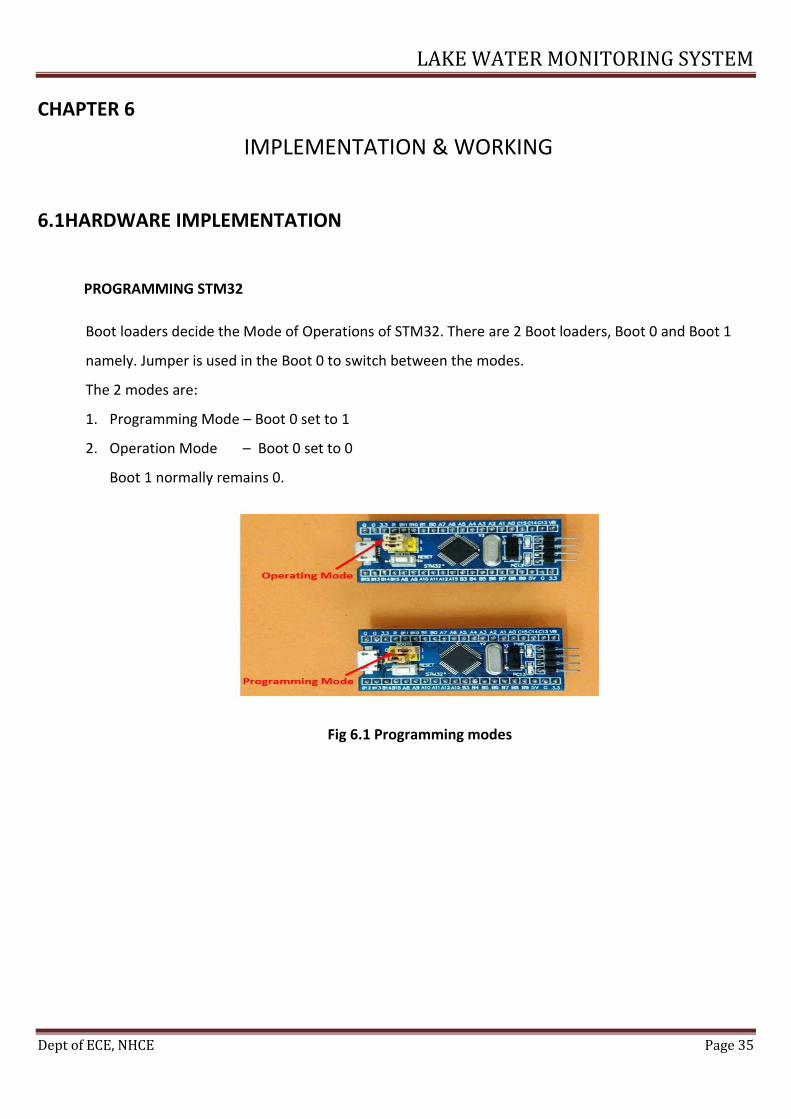
PROGRAMMING STM32
Boot loaders decide the Mode of Operations of STM32. There are 2 Boot loaders, Boot 0 and Boot 1
namely. Jumper is used in the Boot 0 to switch between the modes.
The 2 modes are:
1. Programming Mode – Boot 0 set to 1
2. Operation Mode – Boot 0 set to 0
Boot 1 normally remains 0.
Fig 6.1 Programming modes
LAKE WATER MONITORING SYSTEM
Dept of ECE, NHCE Page 36
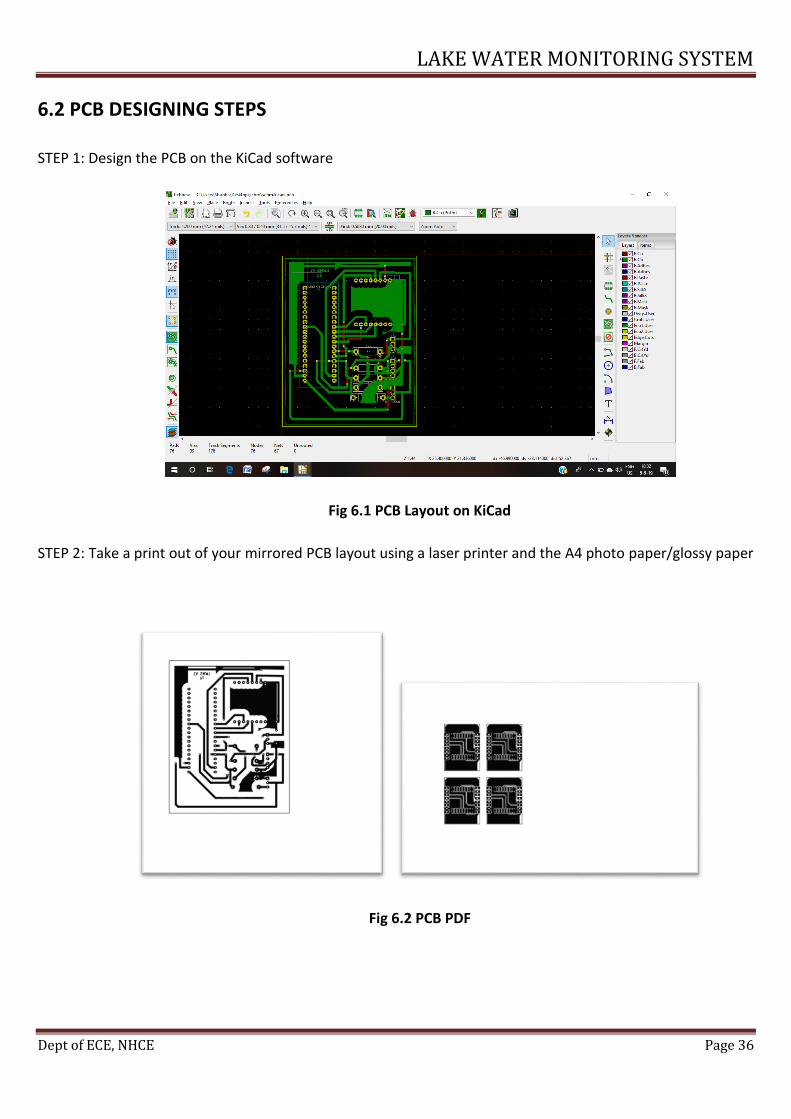
6.2 PCB DESIGNING STEPS
STEP 1: Design the PCB on the KiCad software
Fig 6.1 PCB Layout on KiCad
STEP 2: Take a print out of your mirrored PCB layout using a laser printer and the A4 photo paper/glossy paper
Fig 6.2 PCB PDF
LAKE WATER MONITORING SYSTEM
Dept of ECE, NHCE Page 37
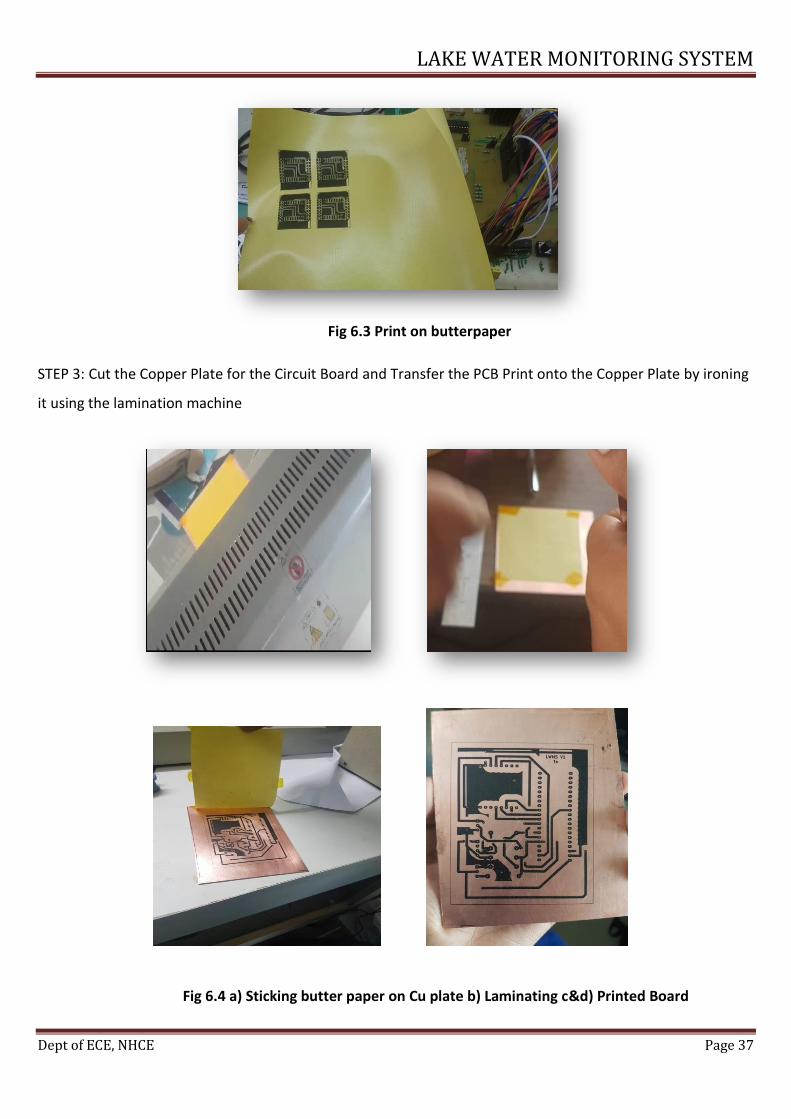
Fig 6.3 Print on butterpaper
STEP 3: Cut the Copper Plate for the Circuit Board and Transfer the PCB Print onto the Copper Plate by ironing
it using the lamination machine
Fig 6.4 a) Sticking butter paper on Cu plate b) Laminating c&d) Printed Board
LAKE WATER MONITORING SYSTEM
Dept of ECE, NHCE Page 38
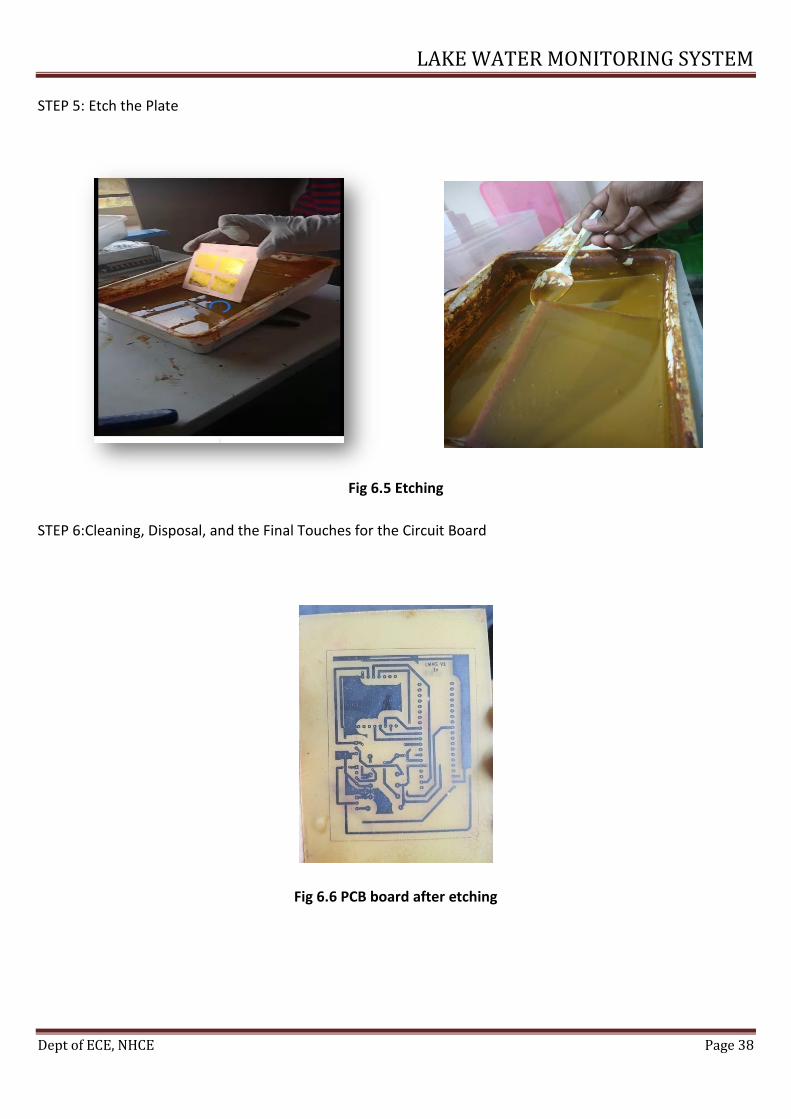
STEP 5: Etch the Plate
Fig 6.5 Etching
STEP 6:Cleaning, Disposal, and the Final Touches for the Circuit Board
Fig 6.6 PCB board after etching

LAKE WATER MONITORING SYSTEM
Dept of ECE, NHCE Page 39
STEP 7: Drill holes
Fig 6.7 Drilling
STEP 8: Remove the Black coatings on the pins that needs to be soldered
Fig 6.8 Scrapping
6.3 SOFTWARE IMPLEMENTATION
To implement a wireless network for lake water monitoring system based on STM32F103C8T6 involves usage
of many software tools, programming language and mainly wireless network. The software tools used are
ARDUINO IDE to acquire and process the data, KiCad to design the PCBs and ThingSpeak which has MATLAB
backend to upload the data to cloud and to process the and view the data in terms of graphs.
LAKE WATER MONITORING SYSTEM
Dept of ECE, NHCE Page 40
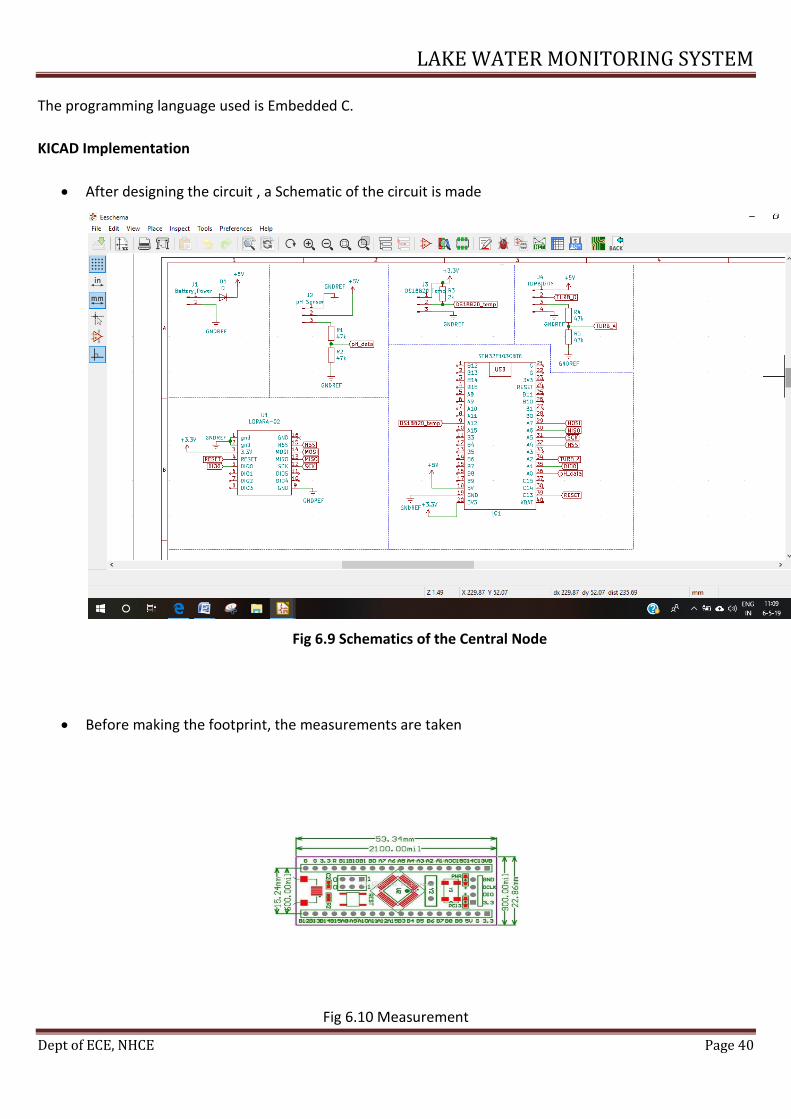
The programming language used is Embedded C.
KICAD Implementation
After designing the circuit , a Schematic of the circuit is made
Fig 6.9 Schematics of the Central Node
Before making the footprint, the measurements are taken
Fig 6.10 Measurement

LAKE WATER MONITORING SYSTEM
Dept of ECE, NHCE Page 41
Footprint is made according to the size measured
Fig 6.11 Footprint of STM32f103C8T6
Fig 6.12 Footprint of LORA

LAKE WATER MONITORING SYSTEM
Dept of ECE, NHCE Page 42
Annotation is done, where every component is give a particular name in an order
Net-list is generated
Run cvpcb by to convert the components to modules which we can use, while we actually design the
circuit board.For each component listed we must select the required footprint.it should match up with
the physical dimensions of the components in your collection
Layout is made
Fig 6.13 PCB Layout
6.4 WORKING
In this project the aim is to determine the values of the turbidity, PH and temperature usingturbidity sensor,
PH sensor and temperature to detect water contamination. As the name suggests, it determines the
contamination of water in the lakes. This data is to be sent at the receiver site for monitoring purpose. The
sensor output cannot be directly transmitted to the receiver site, it requires some processing.Thus a controller
i.e. STM32F103C8T6 is used to process the output from the sensor. It is then wirelessly transmitted to the
receiver site for monitoring.
For implementing this, the system is divided into two parts:
Sender site
Receiver site

LAKE WATER MONITORING SYSTEM
Dept of ECE, NHCE Page 43
Sender site
At the sender site, temperature sensor, PH sensor and temperature sensor are interfaced with
STM32F103C8T6. The turbidity values, PH level and temperature of water is read by sensors which are given
to controller for processing. STM32F103C8T6 contains the threshold values of the turbidity, PH and
temperature. The function of the controller is to processes the data and whenever there is a significant
change in the values detected is transmitted. A LORA RA-02 transceiver module is interfaced to the
STM32F103C8T6 which is a wireless transmission module having long range and low power consumptions
which is used to transmit the sensed data onto the receiver site.
Fig 6.14 Pin Connections to the STM32f103C8T6
The following diagram shows the pin connections at the sender site. This diagram shows exactly to which pin
the turbidity sensor, PH sensor and the temperature sensor is connected to the controller STM32F103C8T6.
Receiver site
At the receiver site the wirelessly transmitted data has to be received and processed to be displayed on the
LCD and the app. A LORA RA-02 transceiver module is used to collect the transmitted data. It is interfaced with
the STM32F103C8T6 controller to process the data so that it is vividly displayed on the PC.
The information received is then uploaded to the cloud such as ThingSpeak or Blink using SIM900 GSM board,
so that the information can be accessed by anyone having the username and password. The information can
also be accessed by the government and the factories around to monitor the contamination level of the lakes.
LAKE WATER MONITORING SYSTEM
Dept of ECE, NHCE Page 44
CHAPTER 7
RESULTS AND SNAPSHOTS
7.1 RESULTS
Monitoring and reporting the pollution gradient in lakes and the same can be extended to other
water bodies.
Preventing hazardous events in lakes such as foaming
Conservation of water bodies
Data acquisition regarding change in effluent contents in the water
Information to the government
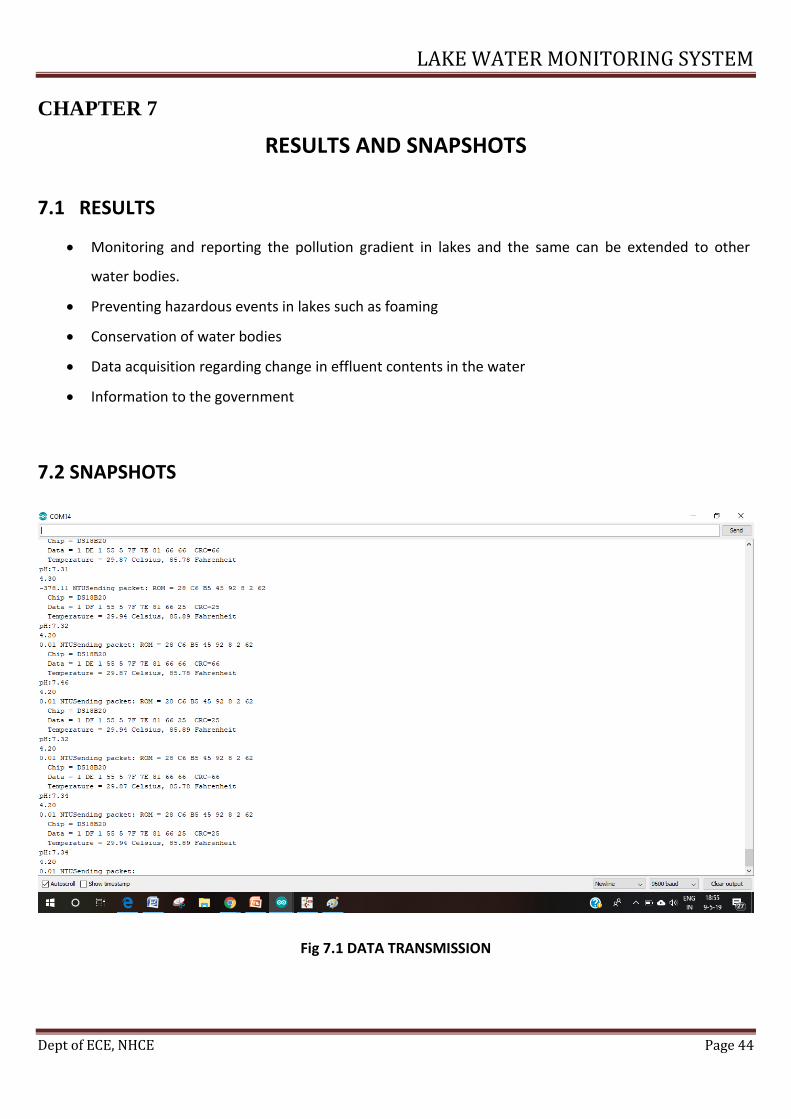
7.2 SNAPSHOTS
Fig 7.1 DATA TRANSMISSION
LAKE WATER MONITORING SYSTEM
Dept of ECE, NHCE Page 45
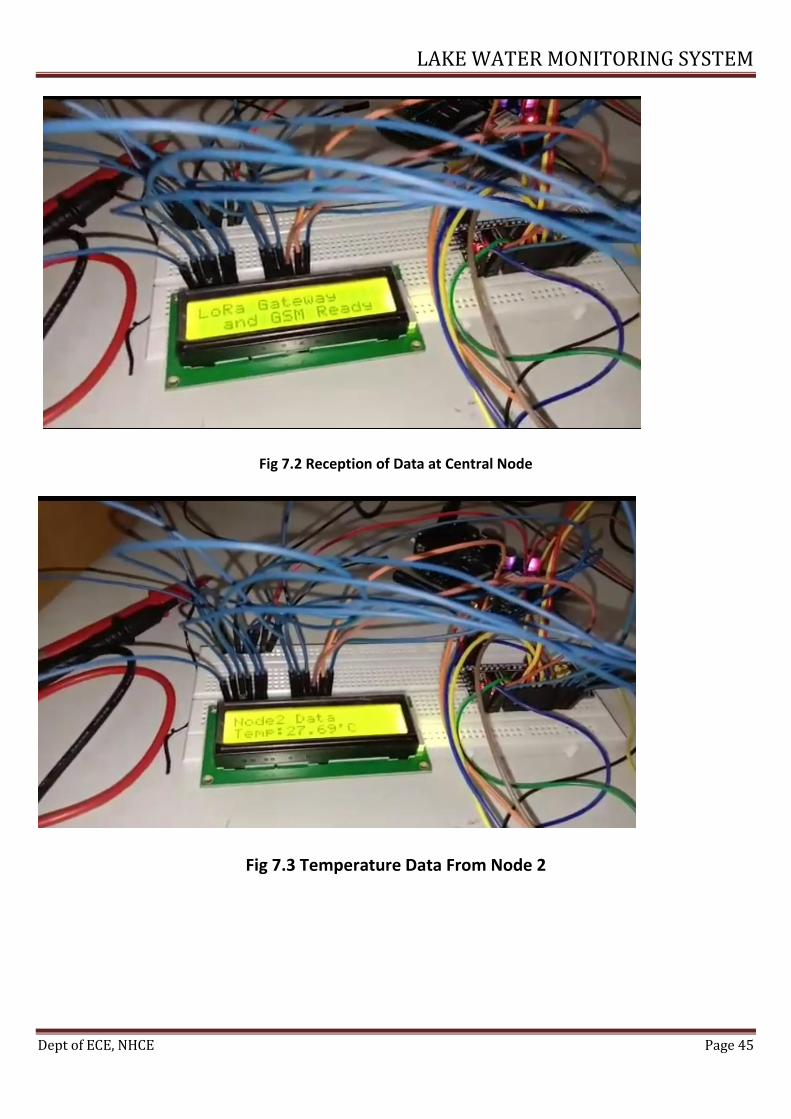
Fig 7.2 Reception of Data at Central Node
Fig 7.3 Temperature Data From Node 2
LAKE WATER MONITORING SYSTEM
Dept of ECE, NHCE Page 46
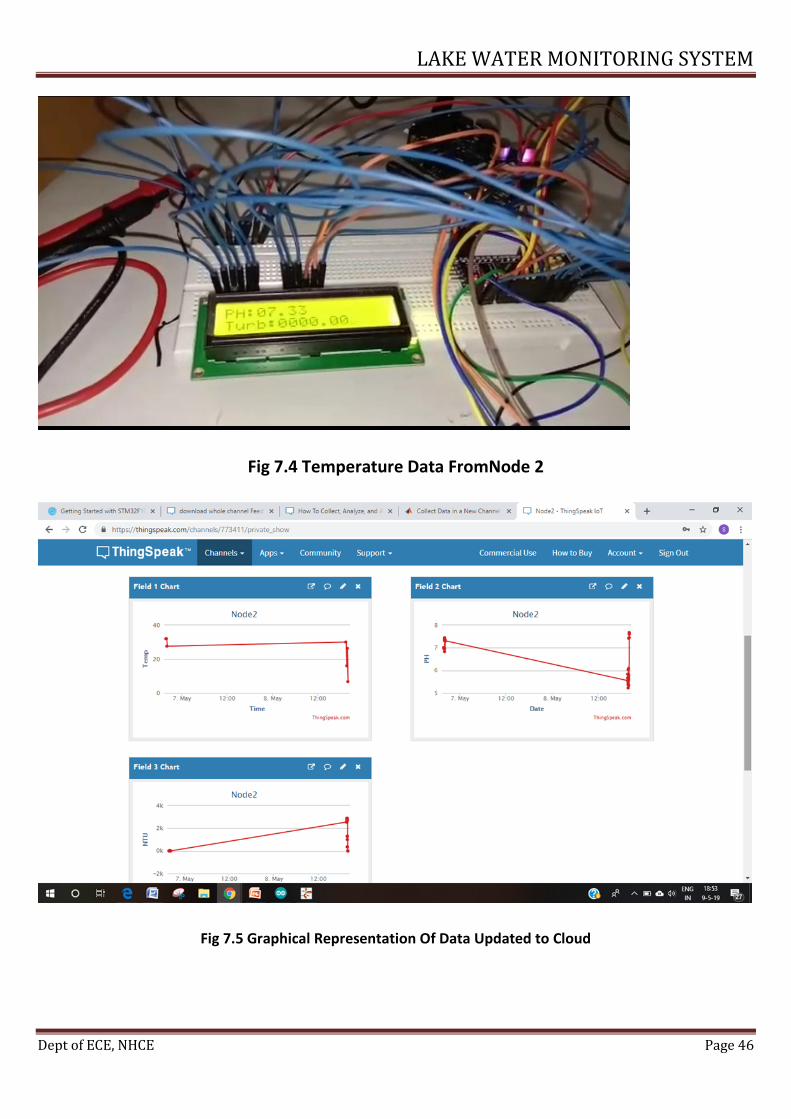
Fig 7.4 Temperature Data FromNode 2
Fig 7.5 Graphical Representation Of Data Updated to Cloud

LAKE WATER MONITORING SYSTEM
Dept of ECE, NHCE Page 47
CHAPTER 8
APPLICATION AND FUTURE SCOPE
8.1 Applications
Disaster management in water bodies
Conservation of water bodies
Health Care
Prevention of situations that call for cleaning of lakes thereby saving time and money.
Protection of living organisms in the lake
8.2 Future Scope
To have an application where public as well as the government can access the real time data procured
from the lake.
To have a display bored near the lakes which would display the effluent readings of the factories
surrounding it.
To keep this system at the factory outlets so that when the effluents exceed the threshold, the notice
can be sent to the government and the respective outlet valves can we be shut. Thus preventing the
effluents from entering the lake.

LAKE WATER MONITORING SYSTEM
Dept of ECE, NHCE Page 48
REFERENCES
1. Internet of things enabled real time water quality monitoring system S. Geethaand S. Gouthami,DOI
10.1186/s40713-017-0005-y –SpringerOpen
2. Libelium Smart Water WaspMote, Document version: v7.5 - 11/2018 -
LibeliumComunicacionesDistribuidas S.L.
3. Water Quality Monitoring System Based on IOT
4. Vaishnavi V. Daigavane and Dr. M.A Gaikwad-Advances in Wireless and Mobile Communications,ISSN
0973-6972 Volume 10, Number 5 (2017), pp. 1107-1116 -Research India Publications
5. Automatic monitoring & Reporting of water quality by using WSN Technology and different routing
methods. A.C.Khetre1, Prof.S.G.Hate2, ISSN: 2278 – 1323,International Journal of Advanced Research
in Computer Engineering & Technology (IJARCET), Volume 2, Issue 12, December 2013
6. Basir Mustafa, Mohammad Haroon Waseem -Design of a Low-cost Underwater Wireless Sensor
Network for Water Quality Monitoring- Article in IETE Journal of Research , October 2013, DOI:
10.4103/0377-2063.123758
7. Prasad M Pujar, U.P Kulkarni, , Harish Kenchannavar -Wireless Sensor Network based Water
Monitoring Systems: A survey Conference Paper · January 2016, DOI: 10.1109/ICATCCT.2016.7911983
8. Kabir Al Mamun, F.R Islam -Smart Water Quality Monitoring System, Conference Paper · December
2015, DOI: 10.1109/APWCCSE.2015.7476234
9. Water Quality Monitoring System Using Zig-Bee and Solar Power Supply by Amruta Amit Joshi-
International Journal of Advanced Research in Electrical,Electronics and Instrumentation
Engineering(An ISO 3297: 2007 Certified Organization), Vol. 4, Issue 10, October 2015
10. I Kanu, Ome Achi Industrial effluents and their impact on water quality of receiving rivers in Nigeria,
Article · January 2011
11. Design of a Water Environment Monitoring System Based on Wireless Sensor Networks, Peng Jiang
1,*, Hongbo Xia 1, Zhiye He 1 and Zheming Wang 2- OpenAccess Sensors ISSN 1424-8220
12. Gaganjot Kaur Kang, Jerry Zeyu, Gang Xie, Gao Data-driven Water Quality Analysis and Prediction: A
Survey, 2017 IEEE Conference on Big Data Computing and Applications
13. Kofi SarpongAdu-Manu, Cristiano Tappparello -Water Quality Monitoring Using Wireless Sensor
Networks: Current Trends and Future Research Directions, Article in ACM Transactions on Sensor
Networks · January 2017, DOI: 10.1145/3005719
14. Amundson and X. D. Koutsoukos. 2009. A survey on localization for mobile wireless sensor

LAKE WATER MONITORING SYSTEM
Dept of ECE, NHCE Page 49
networks.In Mobile Entity Localization and Tracking in GPS-Less Environments. Lecture Notes in
ComputerScience, Vol. 5801. Springer,235-254
15. Derbew and M. Libsie. 2014. A wireless sensor network framework for large-scale industrial water
pollution monitoring. In Proceedings of the IST-Africa Conference. IEEE, Los Alamitos, CA, 1–8

LAKE WATER MONITORING SYSTEM
Dept of ECE, NHCE Page 50
APPENDIX
CODE FOR PERIPHERAL NODE
#include <SPI.h>
#include <LoRa_STM32.h>
#include <OneWireSTM.h>
#include <math.h>
OneWire ds(12); // (a 2k resistor is necessary)(PA12)
char data[8];
floatntu;
#define PH_SensorPin 0 //pH meter Analog output to Arduino Analog Input 0s
#define Turbidity_SensorPin 2
unsigned long intavgValue; //Store the average value of the sensor feedback
float b, offset=0.12;
intbuf[10],temp;
floatSensor_offset=0.04;
void setup(void) {
Serial.begin(9600);
while (!Serial);
Serial.println("LoRa Sender");
if (!LoRa.begin(433E6)) {
Serial.println("Starting LoRa failed!");
while (1);
}
}
LAKE WATER MONITORING SYSTEM
Dept of ECE, NHCE Page 51
void loop(void) {
/*------------------------------DS12B20 Temperature Sensor -----*/
bytei;
byte present = 0;
bytetype_s;
byte data[12];
byteaddr[8];
floatcelsius, fahrenheit;
if ( !ds.search(addr)) {
ds.reset_search();
delay(250);
return;
}
Serial.print("ROM =");
for(i = 0; i< 8; i++) {
Serial.write(' ');
Serial.print(addr[i], HEX);
}
if (OneWire::crc8(addr, 7) != addr[7]) {
Serial.println("CRC is not valid!");
return;
}

LAKE WATER MONITORING SYSTEM
Dept of ECE, NHCE Page 52
Serial.println();
// the first ROM byte indicates which chip
switch (addr[0]) {
case 0x10:
Serial.println(" Chip = DS18S20"); // or old DS1820
type_s = 1;
break;
case 0x28:
Serial.println(" Chip = DS18B20");
type_s = 0;
break;
case 0x22:
Serial.println(" Chip = DS1822");
type_s = 0;
break;
default:
Serial.println("Device is not a DS18x20 family device.");
return;
}
ds.reset();
ds.select(addr);
ds.write(0x44, 1); // start conversion, with parasite power on at the end
delay(1000); // maybe 750ms is enough, maybe not

LAKE WATER MONITORING SYSTEM
Dept of ECE, NHCE Page 53
// we might do a ds.depower() here, but the reset will take care of it.
present = ds.reset();
ds.select(addr);
ds.write(0xBE); // Read Scratchpad
Serial.print(" Data = ");
Serial.print(present, HEX);
Serial.print(" ");
for ( i = 0; i< 9; i++) { // we need 9 bytes
data[i] = ds.read(); //1 wire data read
Serial.print(data[i], HEX);
Serial.print(" ");
}
Serial.print(" CRC=");
Serial.print(OneWire::crc8(data, 8), HEX);
Serial.println();
// Convert the data to actual temperature
// because the result is a 16 bit signed integer, it should
// be stored to an "int16_t" type, which is always 16 bits
// even when compiled on a 32 bit processor.
int16_t raw = (data[1] << 8) | data[0];
if (type_s) {
raw = raw << 3; // 9 bit resolution default
if (data[7] == 0x10) {

LAKE WATER MONITORING SYSTEM
Dept of ECE, NHCE Page 54
// "count remain" gives full 12 bit resolution
raw = (raw & 0xFFF0) + 12 - data[6];
}
} else {
bytecfg = (data[4] & 0x60);
// at lower res, the low bits are undefined, so let's zero them
if (cfg == 0x00) raw = raw & ~7; // 9 bit resolution, 93.75 ms
else if (cfg == 0x20) raw = raw & ~3; // 10 bit res, 187.5 ms
else if (cfg == 0x40) raw = raw & ~1; // 11 bit res, 375 ms
//// default is 12 bit resolution, 750 ms conversion time
}
celsius = (float)raw / 16.0;
fahrenheit = celsius * 1.8 + 32.0;
Serial.print(" Temperature = ");
Serial.print(celsius);
Serial.print(" Celsius, ");
Serial.print(fahrenheit);
Serial.println(" Fahrenheit");
/*-----------------------------End Temperature Sensor--------------*/
/*-------------------------------PH sensor------------------------- */
for(inti=0;i<10;i++) //Get 10 sample value from the sensor for smooth the value
{
buf[i]=analogRead(PH_SensorPin);

LAKE WATER MONITORING SYSTEM
Dept of ECE, NHCE Page 55
delay(10);
}
for(inti=0;i<9;i++) //sort the analog from small to large
{
for(int j=i+1;j<10;j++)
{
if(buf[i]>buf[j])
{
temp=buf[i];
buf[i]=buf[j];
buf[j]=temp;
}
}
}
avgValue=0;
for(inti=2;i<8;i++) //take the average value of 6 center sample
avgValue+=buf[i];
floatvout=((((float)avgValue*3.3)/4096.0)/6.0); //convert the analog into millivolt
float vin =(vout*2.0)+Sensor_offset;
floatphValue = 3.5*vin+offset;
Serial.print("pH:");
Serial.println(phValue,2);
/*---------------------End PH Sensor----------------------*/
/*-------------------Turbidity_Sensor----------------------*/
float volt = 0;

LAKE WATER MONITORING SYSTEM
Dept of ECE, NHCE Page 56
for(inti=0; i<800; i++)
{
volt += ((float)analogRead(Turbidity_SensorPin)/4096)*3.3;
}
volt = volt/800;
volt=(volt*2)+Sensor_offset;
volt = round_to_dp(volt,1);
Serial.println(volt);
if(volt < 2.5){
ntu = 3000;
}else{
ntu = -1120.4*sq(volt)+5742.3*volt-4353.8;
}
Serial.print(ntu);
if(ntu<0)
ntu=0;
Serial.print(" NTU");
/*-------------------------End Turbidity_Sensor-----------------*/
/*-------------------------LoRa Send data to the Gateway(Master)-----------*/
Serial.print("Sending packet: ");
memset(data,0,sizeof(buf));
// send packet
LoRa.beginPacket();
LoRa.print("ID=1"); //send Node ID
LAKE WATER MONITORING SYSTEM
Dept of ECE, NHCE Page 57
LoRa.print(',');
sprintf((char *)data, "%05.2f", celsius);
LoRa.print((char*)data); //Send Temperature
memset(data,0,sizeof(buf));
sprintf((char *)data, "%05.2f", phValue);
LoRa.print((char*)data); //Send PH value
memset(data,0,sizeof(buf));
sprintf((char *)data, "%07.2f", ntu);
LoRa.print((char*)data); //send NTU value
LoRa.endPacket();
delay(5000);
/*------------------------End LoRa------------------------------*/
}
floatround_to_dp( float in_value, intdecimal_place )
{
float multiplier = powf( 10.0f, decimal_place );
in_value = roundf(in_value * multiplier ) / multiplier;
returnin_value;
}
CODE FOR CENTRAL NODE WITH LCD
#include <SPI.h>
#include <LoRa_STM32.h>
#include <LiquidCrystal.h>
LAKE WATER MONITORING SYSTEM
Dept of ECE, NHCE Page 58
constintrs = PB11, en = PB10, d4 = PB0, d5 = PB1, d6 = PC14, d7 = PC15; //mention the pin names to with LCD
is connected to
LiquidCrystallcd(rs, en, d4, d5, d6, d7); //Initialize the LCD
int LoRa_Receiver_Node1=0,LoRa_Receiver_Node2=0;
String Server_name="AT+CIPSTART=\"TCP\",\"api.thingspeak.com\",\"80\""; // TCPIP start command
Server Name or IP
char url_Node_1[]="GET /update?api_key=LYLQLX3R2FODBJSO",url_Node_01[250]; //page name
char url_Node_2[]="GET /update?api_key=GCZ6YVTQL6IEEWTA",url_Node_02[250];
String svr;
char Temp1[6];
char PH1[6];
char Turbidity1[8];
char Temp2[6];
char PH2[6];
char Turbidity2[8];
voidsendToServer(String str)
{
Serial1.println(str);
delay(1000);
}
LAKE WATER MONITORING SYSTEM
Dept of ECE, NHCE Page 59
voidinitGSM()
{
connectGSM("AT","OK");
connectGSM("ATE0","OK");
connectGSM("AT+CPIN?","READY");
connectGSM("AT+CSQ","OK");
connectGSM("AT+CREG?","+CREG: 0,1");
delay(1000);
}
voidinitGPRS()
{
connectGSM("AT+CIPSHUT","OK");
connectGSM("AT+CGATT=1","OK");
delay(1000);
connectGSM("AT+CSTT=\"airtelgprs.com\",\"\",\"\"","OK");
connectGSM("AT+CIICR","OK");
delay(1000);
Serial1.println("AT+CIFSR");
delay(1000);
}
voidconnectGSM (String cmd, char *res)
{
while(1)
{
Serial.println(cmd);
Serial1.println(cmd);

LAKE WATER MONITORING SYSTEM
Dept of ECE, NHCE Page 60
delay(500);
while(Serial1.available()>0)
{
if(Serial1.find(res))
{
delay(1000);
return;
}
}
delay(1000);
}
}
void setup()
{
Serial.begin(9600);
Serial1.begin(9600); // init serial1 for GSM
lcd.begin(16, 4);//We are using a 16*4 LCD
lcd.clear(); //Clear the screen
lcd.print("LoRa Gateway and"); //Print this
lcd.setCursor(0, 1);
lcd.print("GSM initializing"); //Print this
if (!LoRa.begin(433E6)) {
Serial.println("LoRainit failed. Check your connections.");
while (true); // if failed, do nothing
LAKE WATER MONITORING SYSTEM
Dept of ECE, NHCE Page 61
}
LoRa.onReceive(onReceive);
LoRa.receive();
delay(20000);
initGSM(); // init GSM module
initGPRS(); // init GPRS in GSM Module
lcd.clear();
lcd.setCursor(0, 0); //At first row first column
lcd.print("LoRa Gateway"); //Print this
lcd.setCursor(0, 4);
lcd.print("and GSM Ready");
delay(10000);
}
void loop()
{
if(LoRa_Receiver_Node1==1)
{
LoRa_Receiver_Node1=0;
sprintf(url_Node_01,"%s&field1=%s&field2=%s&field3=%s",url_Node_1,Temp1,PH1,Turbidity1);
int len1= strlen(url_Node_01);
Server_communication(url_Node_01,len1);
Serial1.println("AT+CIPSHUT");
lcd.clear(); //Clear the screen
lcd.setCursor(4, 0);
lcd.print("Node1 Data"); //Print this
LAKE WATER MONITORING SYSTEM
Dept of ECE, NHCE Page 62
lcd.setCursor(4, 1);
lcd.print("Temp:"); //Print this
lcd.print(Temp1);
lcd.print("'C");
lcd.setCursor(0, 2);
lcd.print("PH:");
lcd.print(PH1);
lcd.setCursor(0, 3);
lcd.print("Turb:");
lcd.print(Turbidity1);
delay(10000);
}else if(LoRa_Receiver_Node2==1){
LoRa_Receiver_Node2=0;
sprintf(url_Node_02,"%s&field1=%s&field2=%s&field3=%s",url_Node_2,Temp2,PH2,Turbidity2);
int len2= strlen(url_Node_02);
Server_communication(url_Node_02,len2);
Serial1.println("AT+CIPSHUT");
lcd.clear(); //Clear the screen
lcd.setCursor(4, 0);
lcd.print("Node2 Data"); //Print this
lcd.setCursor(4, 1);
lcd.print("Temp:"); //Print this
lcd.print(Temp2);
lcd.print("'C");
lcd.setCursor(0, 2);
lcd.print("PH:");
LAKE WATER MONITORING SYSTEM
Dept of ECE, NHCE Page 63
lcd.print(PH2);
lcd.setCursor(0, 3);
lcd.print("Turb:");
lcd.print(Turbidity2);
delay(10000);
}
}
voidServer_communication(char *url,intlen){
connectGSM(Server_name,"CONNECT OK");
delay(1000);
charSendCmd[25];
Serial1.println("AT+CIPSEND");
delay(5000);
Serial1.println(url);
delay(2000);
Serial1.write(0x1a);
delay(10000);
}
voidonReceive(intpacketSize) {
String message="";
charchar_Buf[1024];
char *ptr=NULL;
while (LoRa.available()) {
LAKE WATER MONITORING SYSTEM
Dept of ECE, NHCE Page 64
message+= (char)LoRa.read();
}
Serial.print("Gateway Receive: ");
Serial.println(message);
// Length (with one extra character for the null terminator)
intstr_len = message.length() + 1;
// Prepare the character array (the buffer)
charchar_array[str_len];
// Copy it over
message.toCharArray(char_Buf, str_len);
if((ptr=strstr(char_Buf,"ID=1")),ptr != NULL){
strncpy(Temp1,ptr+5,5);
strncpy(PH1,ptr+10,5);
strncpy(Turbidity1,ptr+15,7);
Serial.println(Temp1);
Serial.println(PH1);
Serial.println(Turbidity1);
LoRa_Receiver_Node1=1;
}
if((ptr=strstr(char_Buf,"ID=2")),ptr != NULL){
strncpy(Temp2,ptr+5,5);
LAKE WATER MONITORING SYSTEM
Dept of ECE, NHCE Page 65
strncpy(PH2,ptr+10,5);
strncpy(Turbidity2,ptr+15,7);
Serial.println(Temp2);
Serial.println(PH2);
Serial.println(Turbidity2);
LoRa_Receiver_Node2=1;
}
}
Related Documents