Lake Thunderbird TMDL Monitoring Plan Implementation: Sample Year (SY) 2019- December Report SY2019 Monthly Report

Welcome message from author
This document is posted to help you gain knowledge. Please leave a comment to let me know what you think about it! Share it to your friends and learn new things together.
Transcript

Lake Thunderbird TMDL Monitoring Plan Implementation: Sample Year (SY) 2019- December Report
SY2019 Monthly Report
Lake Thunderbird TMDL Monitoring Plan Implementation:
December 2019 Monitoring Report
Oklahoma Water Resources Board Water Quality Programs Division Monitoring and Assessment Section 3800 N. Classen, Oklahoma City, Oklahoma 73118 405-530-8800 Contact Sarah Dexter, Project Leader, [email protected] Jason Murphy, Project Supervisor, [email protected] Lance Phillips, Streams Program Manager, [email protected] Bill Cauthron, Monitoring Coordinator, [email protected]

TABLE OF CONTENTS
Table of Contents ..................................................................................................................... 3 List of Tables ............................................................................................................................ 3 List of Figures .......................................................................................................................... 3 Summary of December Water Quality Sampling ................................................................... 4 Results ...................................................................................................................................... 4
LIST OF TABLES
TABLE 1 FIELD DATA FORM ................................................................................................................................. 5 TABLE 2 LABORATORY ANALYSIS SUMMARY ........................................................................................................... 6 TABLE 3 QA/QC DATA ...................................................................................................................................... 6 TABLE 4 STATION DISCHARGE SUMMARY .............................................................................................................. 6
LIST OF FIGURES
FIGURE 1 MONITORING STATION MAP ................................................................................................................. 4 FIGURE 2 DISCHARGE MEASUREMENT SUMMARY CC-1 ........................................................................................... 7 FIGURE 3 DISCHARGE MEASUREMENT SUMMARY JB-1 ........................................................................................... 8 FIGURE 4 DISCHARGE MEASUREMENT SUMMARY UDB-1 ........................................................................................ 9 FIGURE 5 DISCHARGE MEASUREMENT SUMMARY LT-1 ......................................................................................... 10 FIGURE 6 DISCHARGE MEASUREMENT SUMMARY LRC-1 ....................................................................................... 11 FIGURE 7 DISCHARGE MEASUREMENT SUMMARY TE-1 ......................................................................................... 12 FIGURE 8 DISCHARGE MEASUREMENT SUMMARY TG-1 ........................................................................................ 13 FIGURE 9 DISCHARGE MEASUREMENT SUMMARY URC-2 ...................................................................................... 14 FIGURE 10 DISCHARGE MEASUREMENT SUMMARY WC-1 ..................................................................................... 15 FIGURE 11 MONTHLY HYDROGRAPH TG-1 .......................................................................................................... 16 FIGURE 12 MONTHLY HYDROGRAPH TE-1 .......................................................................................................... 16 FIGURE 13 MONTHLY HYDROGRAPH WC-1 ......................................................................................................... 17 FIGURE 14 MONTHLY HYDROGRAPH URC-2 ....................................................................................................... 17 FIGURE 15 MONTHLY HYDROGRAPH LRC-1 ........................................................................................................ 18 FIGURE 16 MONTHLY HYDROGRAPH LDB-1 ........................................................................................................ 18 FIGURE 17 MONTHLY HYDROGRAPH JB-1 ........................................................................................................... 19 FIGURE 18 MONTHLY HYDROGRAPH UDB-1 ....................................................................................................... 19 FIGURE 19 MONTHLY HYDROGRAPH CC-1 .......................................................................................................... 20 FIGURE 20 DECEMBER MESONET DATA .............................................................................................................. 21

SUMMARY OF DECEMBER WATER QUALITY SAMPLING
Sampling for December 2019 occurred on the seventeenth and was considered a base flow collection. Water samples were collected at all ten locations, and discharge measurements were collected at nine locations. Mesonet data shows no precipitation occurring on the seventeenth, 0.02 inches of precipitation in the 72 hours prior to sampling, and no precipitation in the 72 hours after the sampling event. The total rainfall amount in Norman for the month of December was 0.58 inches. All water level gauges were operational for the month, with the exception of LT-1 and CC-1 due to equipment malfunction.
RESULTS
Figure 1 Monitoring Station Map

Table 1 Field Data Form
Monitoring
Location
ID
Monitoring
Location NameDate Time
Field
Crew
Water
Temperature
(°C)
Dissolved
Oxygen (DO)
(mg/l)
pH
Specific
Conductance
(mS/cm)
Turbidity
(NTU)Notes
CC-1 Clear Creek 12-17-2019 10:10 SD 3.3 13.34 7.93 713 4None of rps over w ater, estimated from
rp2 w hich w as closest to edge of w ater
JB-1 Jim Blue Creek 12-17-2019 10:55 SD 2.7 12.42 7.65 961 2 rp1 not over w ater
LDB-1Lower Dave Blue
Creek12-17-2019 11:30 SD 4.0 14.03 7.93 890 7
LRC-1 Lower Rock Creek 12-17-2019 13:00 SD 3.6 12.10 7.61 490 10
LT-1 Lake Laterals 12-17-2019 12:10 SD 4.9 7.01 7.40 569 2 dow nstream completely frozen
TE-1Little River
Tributary12-17-2019 15:00 SD 6.5 13.44 7.90 1137 21
TG-1Little River
Tributary12-17-2019 15:45 SD 4.2 14.48 7.90 1205 5
UDB-1Upper Dave Blue
Creek12-17-2019 9:05 SD 2.0 11.31 7.68 1003 9
URC-2 Upper Rock Creek 12-17-2019 13:45 SD 5.1 11.09 7.49 394 11 rp1 not over w ater, used rp2
WC-1 Woodcrest Creek 12-17-2019 14:30 SD 6.0 7.57 7.54 1082 3 changed dcp

Table 2 Laboratory Analysis Summary
Table 3 QA/QC Data
Quality assurance/quality control (QA/QC) of the data includes a field blank and duplicate sample from each collection event, and is qualified by the OWRB. Relative Percent Difference (RPD) of the duplicate sample can be categorized into four levels, where Level 1 likely has no QA issues and Level 4 has major QA issues, and should be used with caution.
Table 4 Station Discharge Summary
Monitoring
Location ID
Monitoring Location
Name
Nitrate and
Nitrite (mg/l)
Kjeldahl
Nitrogen (mg/l)
Phosphorus
(mg/l)
Total Suspended
Solids (mg/l)
CC-1 Clear Creek 0.16 0.12 0.020 <5.0
JB-1 Jim Blue Creek <0.05 0.23 0.021 <5.0
LDB-1 Lower Dave Blue Creek 0.06 0.44 0.036 <5.0
LRC-1 Lower Rock Creek 0.32 0.79 0.057 10.0
LT-1 Lake Laterals <0.05 0.34 0.030 12.0
TE-1 Little River Tributary <0.05 0.51 0.039 16.0
TG-1 Little River Tributary 0.10 0.32 0.033 12.0
UDB-1 Upper Dave Blue Creek <0.05 0.13 0.026 <5.0
URC-2 Upper Rock Creek 0.35 0.95 0.054 8.0
WC-1 Woodcrest Creek <0.05 0.37 0.063 <5.0
Monitoring
Location Name
Nitrate and
Nitrite (mg/l)
Kjeldahl
Nitrogen (mg/l)
Phosphorus
(mg/l)
Total Suspended
Solids (mg/l)
Field Blank <0.05 <0.10 <0.010 <5.0
Duplicate 0.16 0.11 0.019 <5.0
Duplicate RPD 0% 8.70% 5.13% 0%
Monitoring
Location ID
Monitoring Location
Name
Discharge
(cfs)
Stream Stage
(ft)
CC-1 Clear Creek 0.41 20.39
JB-1 Jim Blue Creek 0.21 15.76
LDB-1 Lower Dave Blue Creek 2.08 16.53
LRC-1 Lower Rock Creek 1.90 18.64
LT-1 Lake Laterals 0.04 4.29
TE-1 Little River Tributary 0.29 11.34
TG-1 Little River Tributary 0.71 9.00
UDB-1 Upper Dave Blue Creek 0.41 17.26
URC-2 Upper Rock Creek 0.44 11.00
WC-1 Woodcrest Creek 0.08 7.73

Figure 2 Discharge Measurement Summary CC-1

Figure 3 Discharge Measurement Summary JB-1

Figure 4 Discharge Measurement Summary UDB-1

Figure 5 Discharge Measurement Summary LT-1

Figure 6 Discharge Measurement Summary LRC-1

Figure 7 Discharge Measurement Summary TE-1

Figure 8 Discharge Measurement Summary TG-1
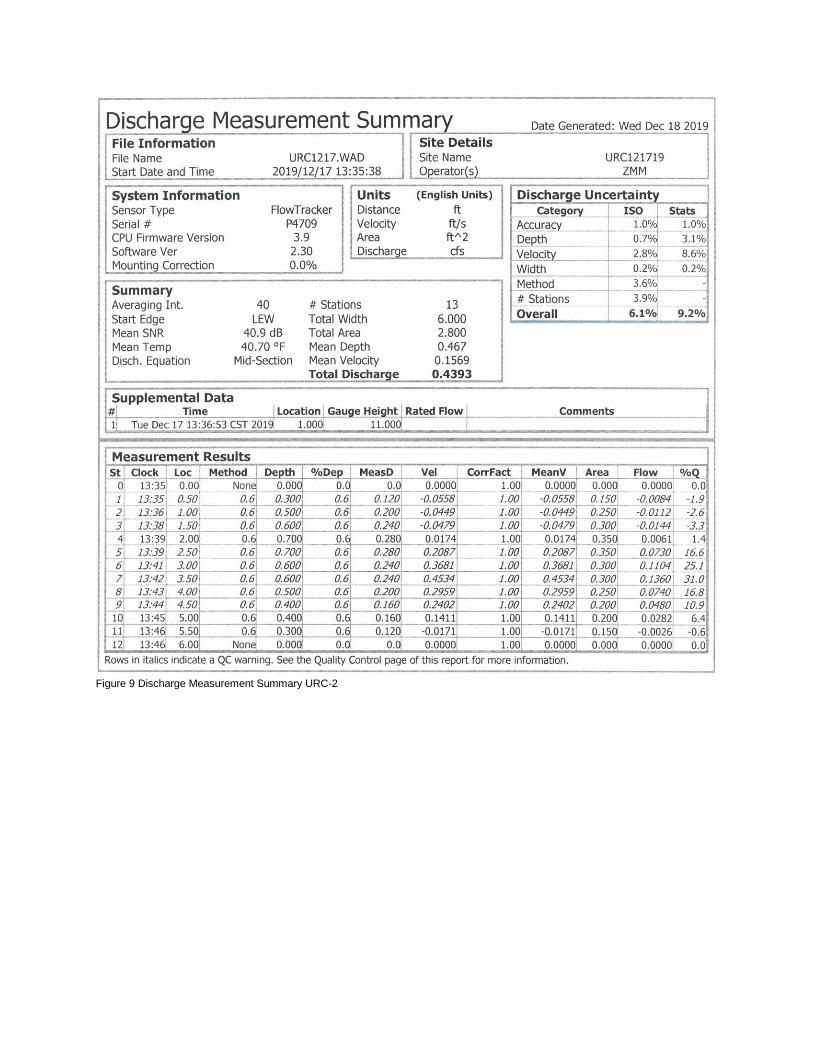
Figure 9 Discharge Measurement Summary URC-2

Figure 10 Discharge Measurement Summary WC-1

Figure 11 Monthly Hydrograph TG-1
Figure 12 Monthly Hydrograph TE-1
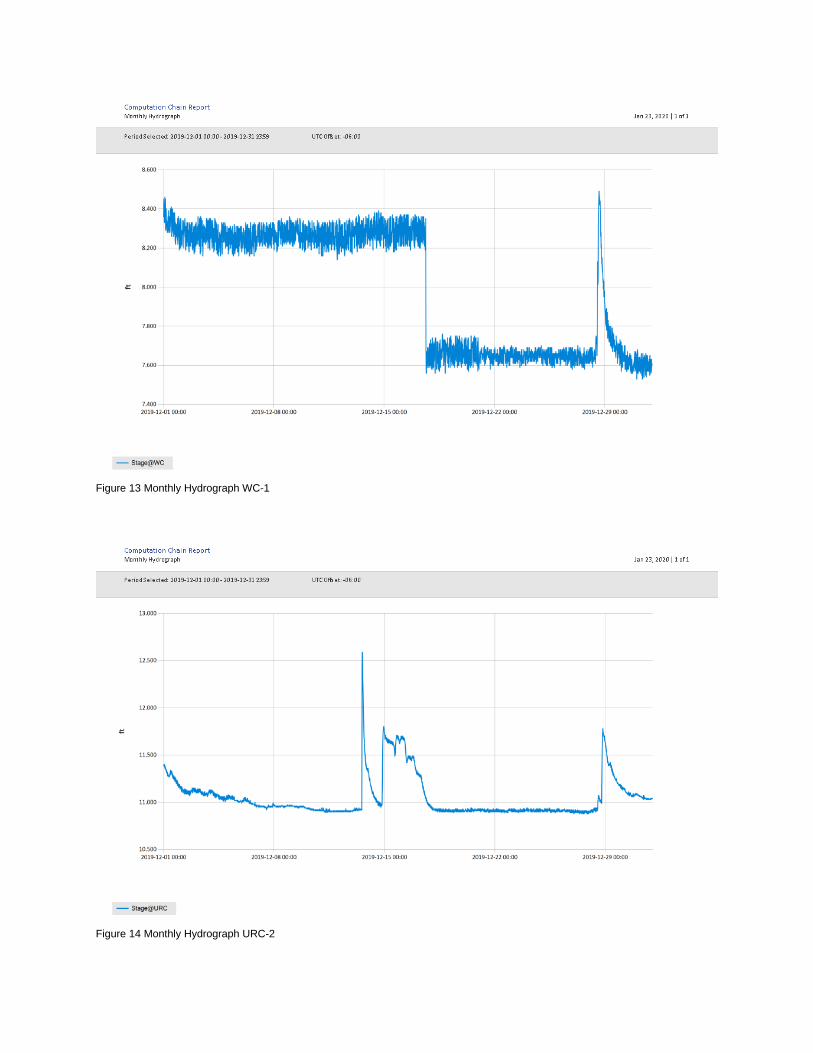
Figure 13 Monthly Hydrograph WC-1
Figure 14 Monthly Hydrograph URC-2

Figure 15 Monthly Hydrograph LRC-1
Figure 16 Monthly Hydrograph LDB-1
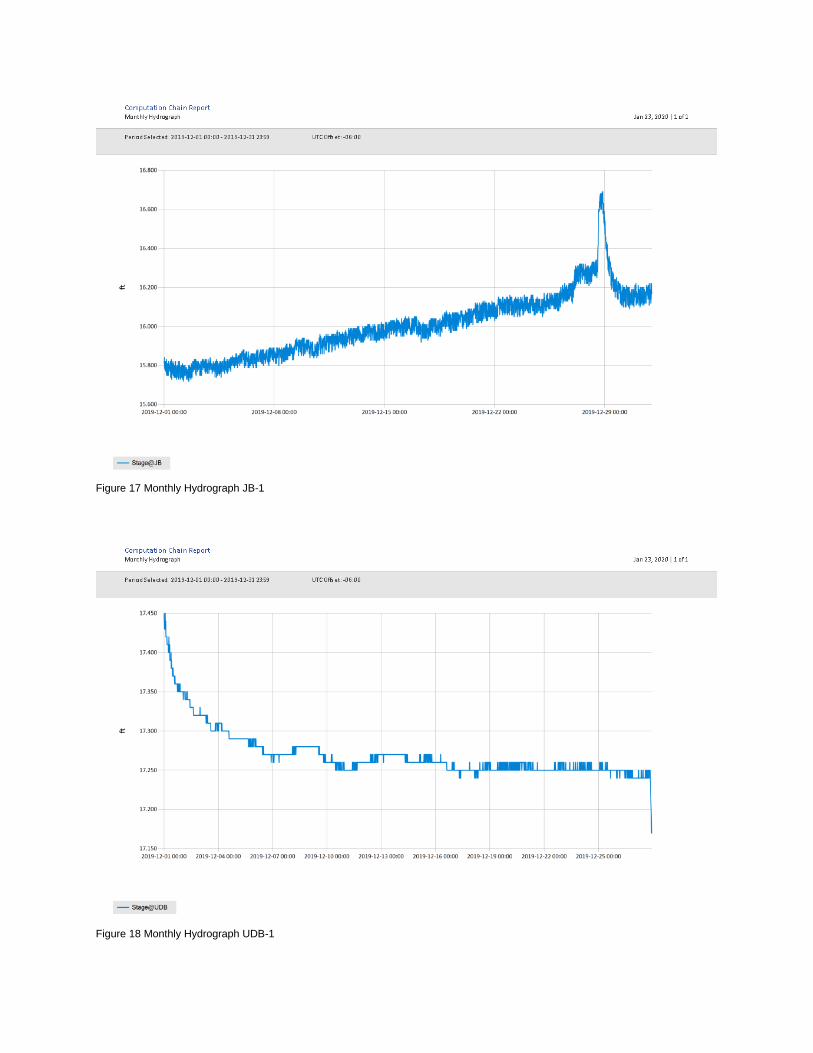
Figure 17 Monthly Hydrograph JB-1
Figure 18 Monthly Hydrograph UDB-1

Figure 19 Monthly Hydrograph CC-1

Figure 20 December Mesonet Data
Related Documents


