LAKE HAVASU CITY BRAND DEVELOPMENT SURVEY II MARCH 6, 2013 1

Welcome message from author
This document is posted to help you gain knowledge. Please leave a comment to let me know what you think about it! Share it to your friends and learn new things together.
Transcript

LAKE HAVASU CITY BRAND DEVELOPMENT SURVEY II
MARCH 6, 2013
1

BACKGROUND / METHODOLOGY The Prism Partnership launched an online survey to Lake Havasu City residents and visitors on
behalf of the Lake Havasu City Brand Development Task Force to test preferences for the
taglines and logos developed by North Star Brand Strategies
There were four sources of soliciting input:
An email invitation and 2 reminders were sent to list of 10,672 residents purchased from
an email list source.
An email invitation and 2 reminders were sent to list of 9,679 subscribers to the LHCCVB
newsletter.
A hyperlink to the survey was placed on the LHCCVB website
A hyperlink to the survey was placed on several LHC city websites
All avenues were supported by 2 news stories and an editorial in the Today’s News-Herald
The survey was available for participation from March 12 to March 26, 2013
We achieved 340 responses from the email list (a 3.2% response rate) and 781 from the
LHCCVB newsletter database (an 8.1% response rate). We also received 702 responses from
the LHCCVB website link,29 from the LHC city websites link, and 11 responses from committee
members. This resulted in a total of 1,862 completes
The composition of the total sample was 429 visitors and 1,434 residents
Based on the US Census data, there are 23,168 households in LHC
1,434 household responses yields a statistical margin of error of +/- 1.1% for residents
429 visitors yields an estimated margin of error of +/-2.0% for visitors
2
EXECUTIVE SUMMARY

EXECUTIVE SUMMARY
RESPONDENT PROFILE
Compared to the Visitors Study profile, the respondents from the LHC Newsletter database tend to: Come more frequently and stay more nights
Are more likely to come for special events and to enjoy the climate
More likely to stay in hotels
Although these respondents fit more of a “loyalist” profile, they are the most passionate about LHC and would tend to care more than the average visitor about the city’s branding
The residents respondents represent the full demographic spectrum, but in keeping with the community’s profile, is heavily represented by older and retired citizens
Both the large numbers and the types of respondents make these survey findings stable and projectable
4
EXECUTIVE SUMMARY
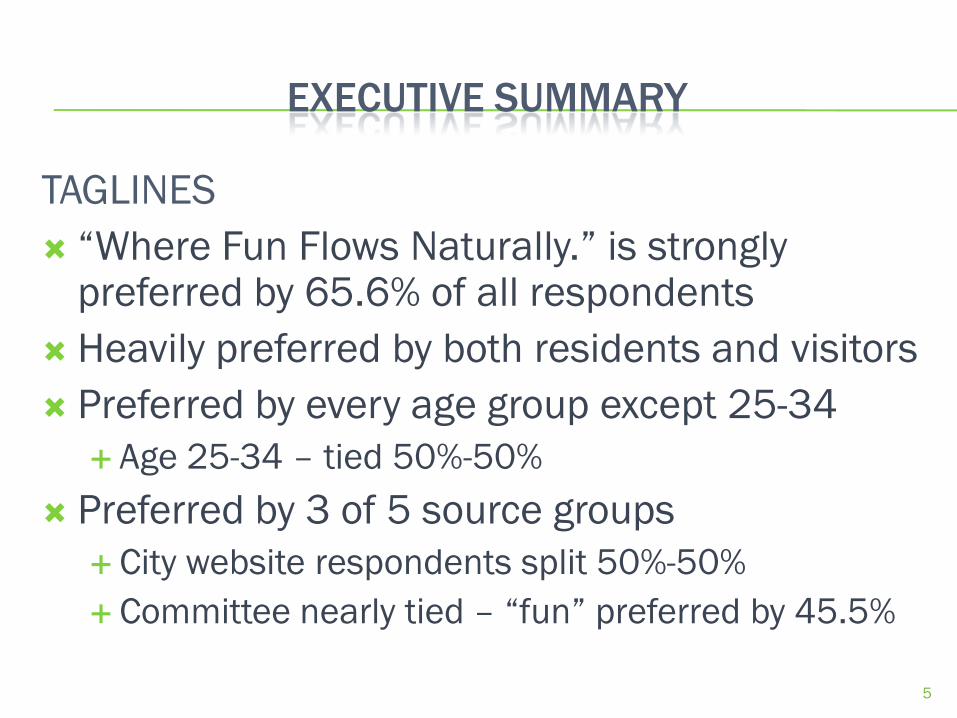
TAGLINES
“Where Fun Flows Naturally.” is strongly preferred by 65.6% of all respondents
Heavily preferred by both residents and visitors
Preferred by every age group except 25-34
Age 25-34 – tied 50%-50%
Preferred by 3 of 5 source groups
City website respondents split 50%-50%
Committee nearly tied – “fun” preferred by 45.5%
5

EXECUTIVE SUMMARY
LOGOS
With all the data considered, Logo M slightly edges out Logo X, but they are quite close
In a forced ranking, Logo M was rated #1 by 46.7% and Logo X by 38.9%
Based on attributes, Logo M leads in memorability and reflecting LHC’s personality, and Logo X leads in being appealing and reflecting a positive image of LHC. They tie in being appealing to visitors.
Logo M’s average rating on attributes was slightly higher across all audiences Particularly liked by past overnight visitors and day visitors
Logo X’s average rating on attributes was slightly lower across all audiences Liked by all visitor groups
Particularly liked by part-year residents
6
LOGO M LOGO X

EXECUTIVE SUMMARY
ACTIVITIES
The number 1 favorite activity for both residents and visitors is hiking
Other activities residents would like to see the city develop further are: auto racing, horseback riding and hiking.
Visitors would like to see the city further develop hiking, biking and hot air ballooning.
DESIRED LHC IMPROVEMENTS
Residents most want: more shopping choices, improved parks, streetlights and sidewalks
Visitors most want: a revitalized London Bridge area and more unique shops
RECEPTIVITY TO LOGO ITEMS
68% of all respondents said they would buy LHC logo branded items either for themselves or as a gift for others
52 people provided their contact information to find out about selling LHC licensed products
7

RESPONDENT PROFILE

RESPONDENT PROFILE
9
Of the 1,863 respondents, 23% (429) are visitors and 77% (1,434) are
residents. This results in a low margin of error for both groups; +/- 2.0% for
visitors and +/- 1.1% for residents.
47.2% (879)
4.8% (90) 4.8%
(90) 5.6% (105)
2.0% (38)
3.9% (69)
19.2% (358)
12.5% (234)

TAGLINE TEST RESULTS
11
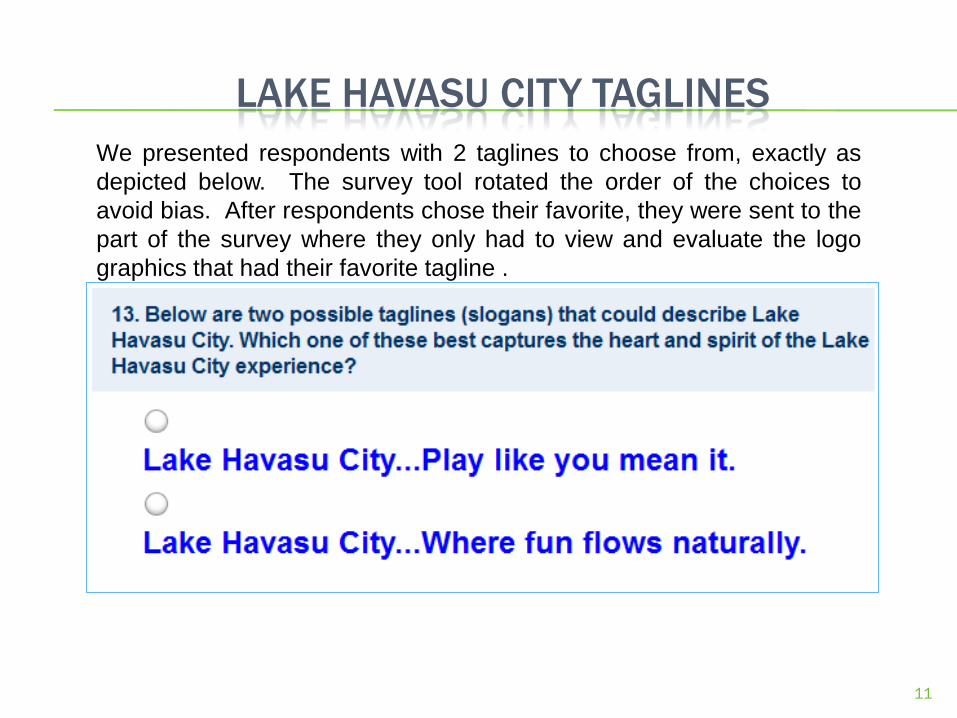
LAKE HAVASU CITY TAGLINES
We presented respondents with 2 taglines to choose from, exactly as
depicted below. The survey tool rotated the order of the choices to
avoid bias. After respondents chose their favorite, they were sent to the
part of the survey where they only had to view and evaluate the logo
graphics that had their favorite tagline .

12
OVERALL TAGLINE RESULTS
Lake Havasu City…Where fun flows naturally was preferred by
65.6% of all respondents, a margin of nearly 2 to 1. These are the
results of all respondents combined.
65.6%
34.1%
N=1863

BOTH VISITORS AND RESIDENTS PREFER “FUN”
13
36.5%
36.4%
28.0%
34.0%
331%
63.5
63.6%
66.0%
72.0%
66.9%
(Visited Overnight in past 12 months (234), Visited Overnight more than 12
months ago (105), Day trip (90), Full time LHC resident (879), Part year LHC
resident (358))

THE YOUNGER, THE CLOSER THE PREFERENCE
14
50.0%
46.4%
44.8%
31.6% 19.1%
50.0%
53.6%
55.2%
68.4%
80.9%
N=1863

15
LHC RESIDENTS PREFER “FUN” NO MATTER HOW LONG THEY’VE LIVED HERE
43.2%
34.8%
37.9%
30.8%
35.5%
56.8%
65.2%
62.1%
69.2%
64.5%
LAKE HAVASU CITY RESIDENTS
N=879

16
MOST GROUPS AND MAJORITY OF PEOPLE AGREE ON “FUN”
54.5%
45.5%
32.0%
68.0%
35.7%
Brand Development Committee [11 responses]
CVB Newsletter List [781 responses]
Resident List [340 responses]
CVB Website [702 responses]
LHC City Websites [29 responses]
50.0%
50.0% 33.6%
64.3%
66.4%
These results are shown by where the votes came from. Three groups
clearly prefer “Where fun flows naturally”, representing 1,822 people. Two
groups are split, representing 40 people.
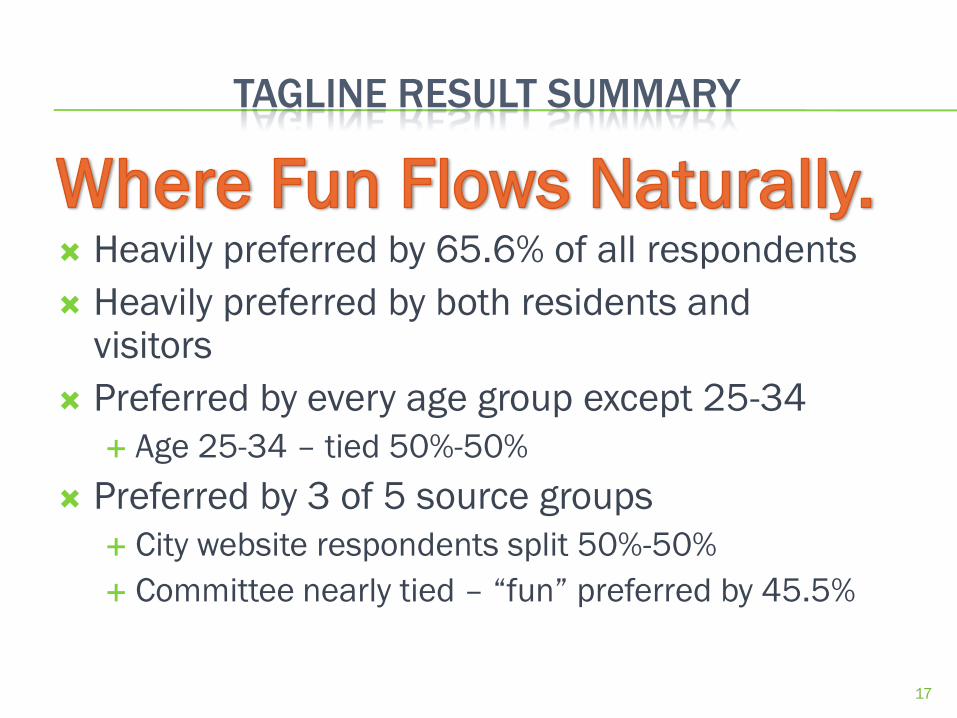
TAGLINE RESULT SUMMARY
Heavily preferred by 65.6% of all respondents
Heavily preferred by both residents and visitors
Preferred by every age group except 25-34
Age 25-34 – tied 50%-50%
Preferred by 3 of 5 source groups
City website respondents split 50%-50%
Committee nearly tied – “fun” preferred by 45.5%
17

GRAPHICS
WHAT THE RESPONDENTS SAW
After the respondents picked their favorite tagline, the survey took them directly to look at and rate logos with just their favorite tagline
This avoided having respondents view 8 different combinations, and focused on the 4 graphics combined with their favorite logo
The graphics on the following slides show exactly what respondents viewed and rated in the survey
19
PLAY LIKE YOU MEAN IT.
21
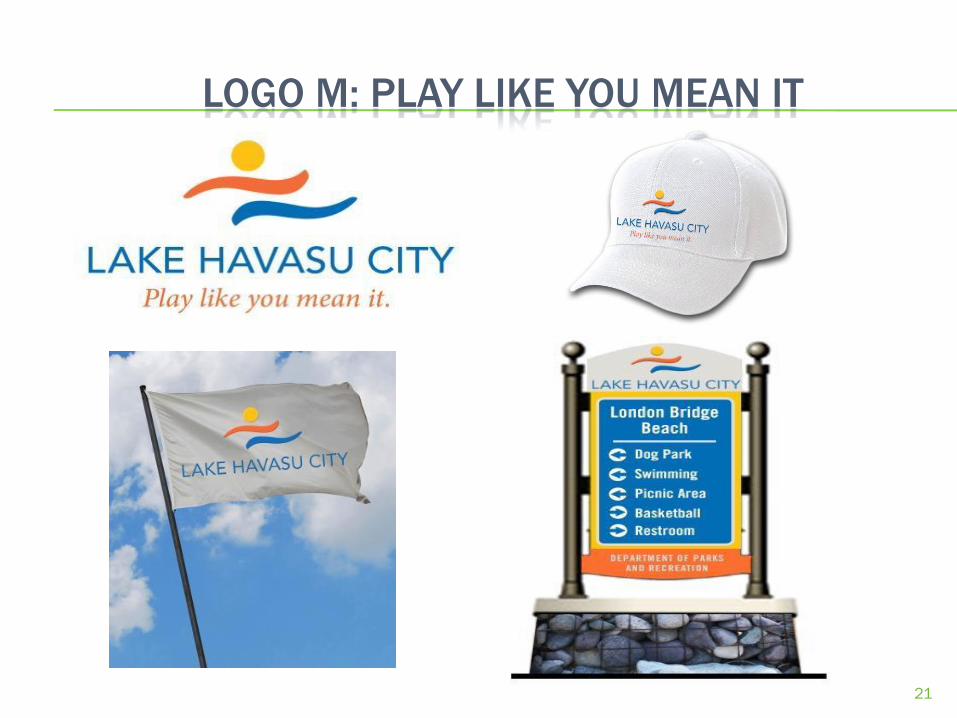
LOGO M: PLAY LIKE YOU MEAN IT

22
LOGO Q: PLAY LIKE YOU MEAN IT
23
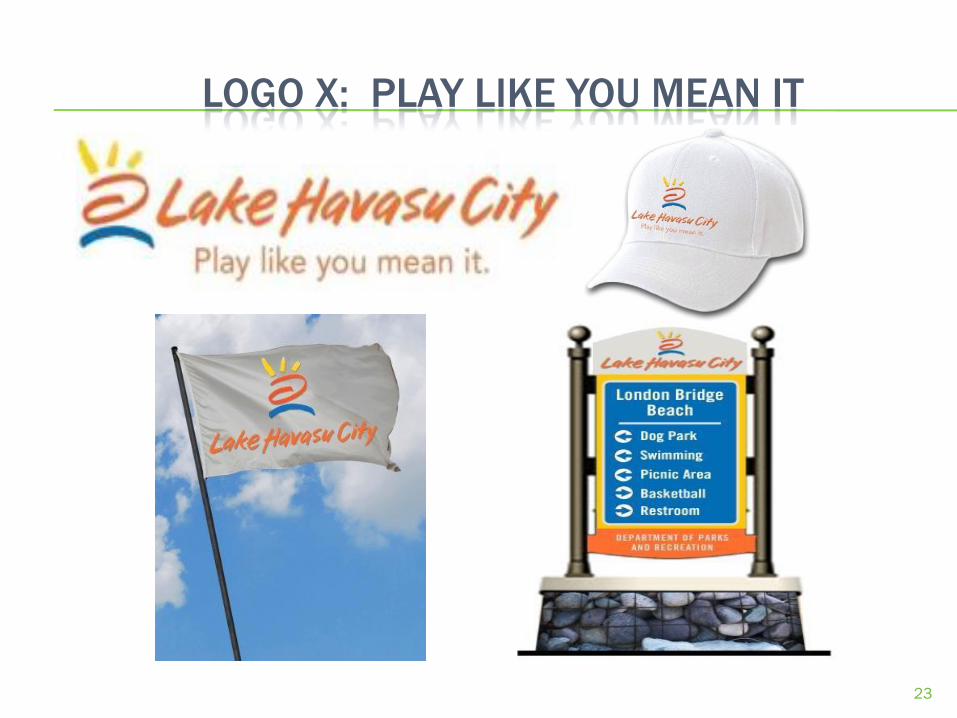
LOGO X: PLAY LIKE YOU MEAN IT

24
LOGO S: PLAY LIKE YOU MEAN IT

WHERE FUN FLOWS NATURALLY.
GRAPHICS

26
LOGO M: PLAY LIKE YOU MEAN IT
27
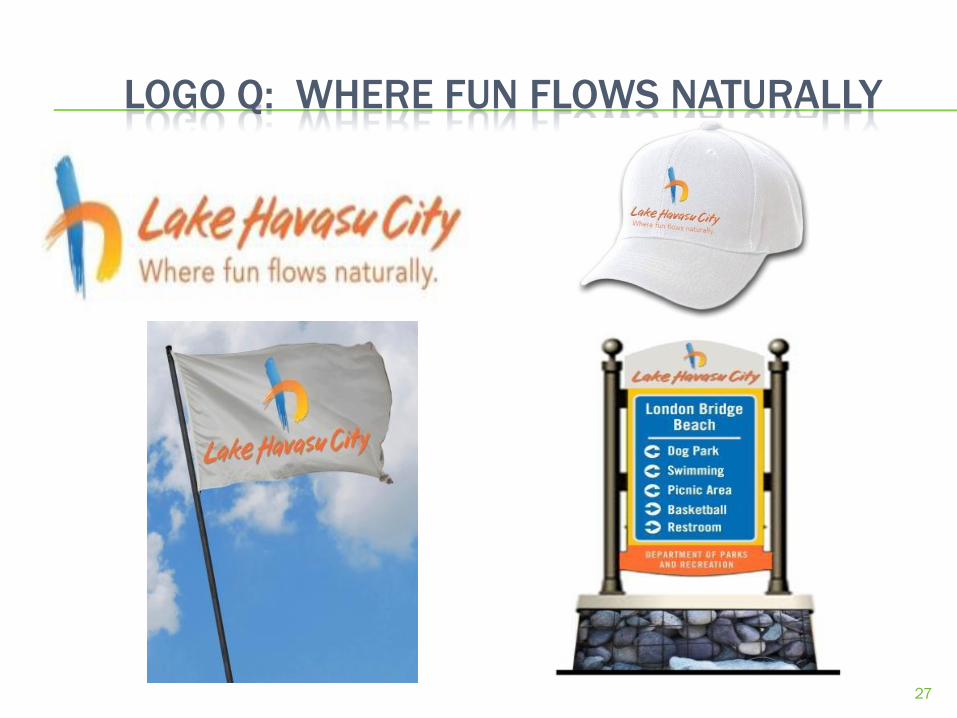
LOGO Q: WHERE FUN FLOWS NATURALLY
28
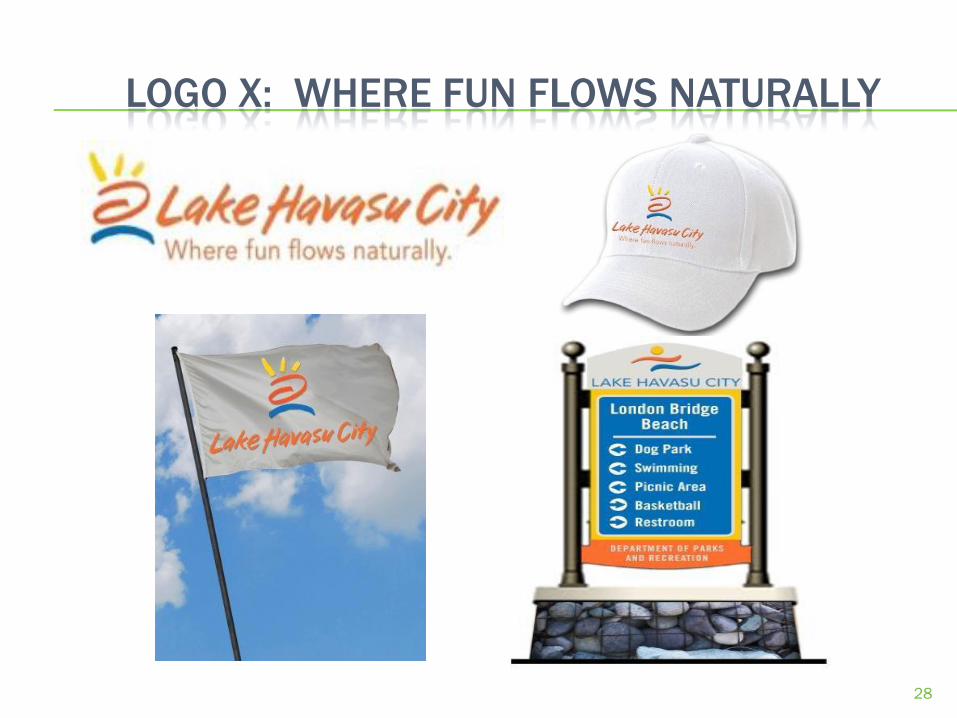
LOGO X: WHERE FUN FLOWS NATURALLY

29
LOGO S: WHERE FUN FLOWS NATURALLY

LOGO TEST RESULTS
After respondents chose their favorite, they were sent to the part of the
survey where they only had to view and evaluate the logo graphics that
had their favorite tagline .

31
TOTAL LOGO RESULTS
Logo S
Logo Q
Logo X
Logo M
3.9%
9.8%
38.9%
46.7%
Ranked Logo #1 Preference
Logo M was most liked, followed somewhat closely by Logo X. Logo Q
and Logo S ranked a very distant third and fourth place.
N=1863

COMPLETE LOGO RANKS
32
First
Second
Third
Fourth
Logo M was most liked, followed somewhat closely by Logo X. Logo Q
and Logo S ranked a very distant third and fourth place.
N=1863

33
LOGO ATTRIBUTES – TOP TWO BOX Top two box scores are the percentage who rated each attribute as
“very” + “extremely”. Logo M leads in memorability and reflecting LHC’s
personality, and Logo X leads in being appealing and reflecting a
positive image of LHC. They tie in being appealing to visitors.
Appealing Memorable Positive Image
LHC Personality
Appealing to Visitors
Logo M 50.1% 46.0% 50.1% 48.5% 47.0%
Logo X 51.1% 41.2% 56.0% 46.6% 47.0%
Logo Q 20.4% 19.1% 22.1% 20.4% 19.4%
Logo S 11.2% 11.2% 12.5% 11.2% 11.0%
N=1863

34
LOGO ATTRIBUTES – AVERAGE RATING These are the average ratings on the 1-5 scale. Logo M leads Logo X “by
a nose”. Logo Q and Logo S are a very distant third and fourth place.
Not at all Somewhat Not very Very Extremely
1 2 3 4 5
Logo S
Logo Q
Logo X
Logo M
2.4
2.6
3.4
3.5
2.3
2.6
3.2
3.4
2.4
2.6
3.5
3.5
2.3
2.5
3.3
3.4
2.3
2.5
3.3
3.4
Appealing to Visitors LHC Personality Positive Image Memorable Appealing
N=1863

LOGO M ATTRIBUTE RATINGS
35
This chart shows the average rating of Logo M on the attributes by the
resident and visitor groups. (Visited Overnight in past 12 months (234), Visited Overnight more
than 12 months ago (105), Day trip (90), Full time LHC resident (879), Part year LHC resident (358))
Appealing Memorable
Reflects positive
image of LHC
Reflects LHC’s
personality Makes LHC appealing
to visitors
Not at all
Somewhat
Not very
Very

LOGO X ATTRIBUTE RATINGS
36
Appealing Memorable
Reflects positive
image of LHC
Reflects LHC’s
personality Makes LHC appealing
to visitors
Not at all
Somewhat
Not very
Very
This chart shows the average rating of Logo X on the attributes by the
resident and visitor groups. (Visited Overnight in past 12 months (234), Visited Overnight more
than 12 months ago (105), Day trip (90), Full time LHC resident (879), Part year LHC resident (358))
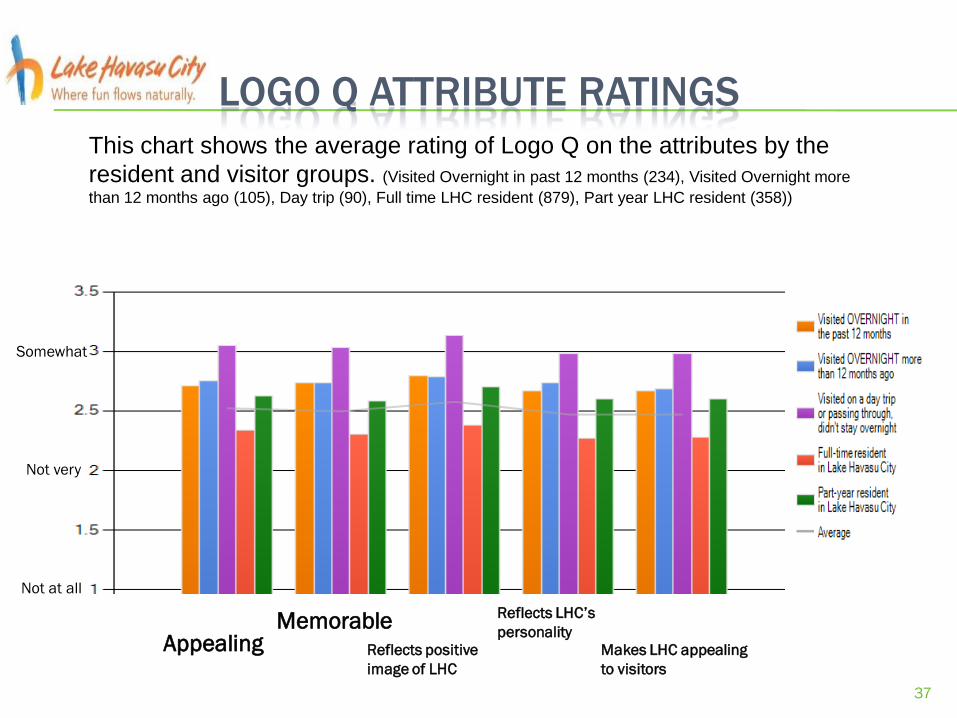
LOGO Q ATTRIBUTE RATINGS
37
Appealing Memorable
Reflects positive
image of LHC
Reflects LHC’s
personality
Makes LHC appealing
to visitors
Not at all
Somewhat
Not very
This chart shows the average rating of Logo Q on the attributes by the
resident and visitor groups. (Visited Overnight in past 12 months (234), Visited Overnight more
than 12 months ago (105), Day trip (90), Full time LHC resident (879), Part year LHC resident (358))

LOGO S ATTRIBUTE RATINGS
38
Appealing Memorable
Reflects positive
image of LHC
Reflects LHC’s
personality
Makes LHC appealing
to visitors
Not at all
Somewhat
Not very
This chart shows the average rating of Logo S on the attributes by the
resident and visitor groups. (Visited Overnight in past 12 months (234), Visited Overnight more
than 12 months ago (105), Day trip (90), Full time LHC resident (879), Part year LHC resident (358))

39
Committee (11)
LHC Newsletter
(781)
Resident List
(340)
CVB Website
(702)
City Websites
(29)
Logo M 81.9% 47.7% 48.4% 44.4% 40.0%
Logo X 18.1% 37.1% 35.9% 43.0% 33.3%
Logo Q 0.0% 10.5% 10.3% 8.2% 33.3%
Logo S 0.0% 3.3% 6.0% 3.9% 0.0%
ALL GROUPS PREFER LOGO M These results are shown by where the votes came from. All groups prefer
Logo M by varying margins. The margin was closest for those responding
on the CVB website. The margin was widest for the Branding Committee,
which clearly prefers Logo M.

40
LHC RESIDENTS OF MOST TENURES PREFER LOGO “M”
These results are shown for Lake Havasu City Residents (1,434) based on
how long they’ve lived in the city. All groups prefer Logo M by varying
margins, except those who’ve lived in the city for 3-5 years, who prefer
Logo X by a margin of 47% to 43%.
1-2 YRS 3-5 YRS 6-9 YRS 10-19 YRS
20+ YRS
Logo M 50.0% 42.9% 45.7% 46.6% 48.5%
Logo X 37.3% 47.0% 44.0% 41.1% 35.6%
Logo Q 9.6% 9.4% 5.6% 7.6% 11.3%
Logo S 2.0% 1.7% 4.3% 5.1% 3.0%
N=1434

41
OPEN-END COMMENTS ON LOGOS / TAGLINES
Misc. Suggestions / Other
Let citizens submit designs
Where are the mountains
Look outdated
I like the colors
Where's the lake
Don't like the taglines
Need better logo choices
Bad designs
Boring / generic /bland
Where's the bridge
Don't reflect LHC
I like the logos
Don't like the colors
29%
1%
1%
2%
2%
3%
3%
5%
7%
7%
8%
12%
12%
13%
Comments on Logos / Taglines
This is a summary of 708 open-ended remarks. There was a mixture of
negative and positive comments. The largest portion of comments were
about dislike for the colors in the logos, concern the logos don’t reflect
the essence of LHC and positive comments about the choices available.
A full transcript of the verbatim remarks are provided under separate
cover.

LOGO RESULT SUMMARY
With all the data considered, Logo M slightly edges out Logo X, but they are quite close
In a forced ranking, Logo M was rated #1 by 46.7% and Logo Q by 38.9%
Based on attributes, Logo M leads in memorability and reflecting LHC’s personality, and Logo X leads in being appealing and reflecting a positive image of LHC. They tie in being appealing to visitors.
Logo M’s average rating on attributes was slightly higher across all audiences Particularly liked by past overnight visitors and day visitors
Logo X’s average rating on attributes was slightly lower across all audiences Liked by all visitor groups
Particularly liked by part-year residents
42
LOGO M LOGO X

ACTIVITIES AND DESIRED
IMPROVEMENTS

44
ACTIVITIES AND SPORTS: FAVORITES 1 OF 3
These results are sorted by “Your ONE Favorite.”
N=1863
Answer Options
Your ONE
Favorite [check
one in this
column]
City should further
develop [check all
that apply in this
column]
Hiking 12.2% 25.4%
Golf 11.8% 13.0%
Fishing 11.4% 18.1%
Hot Air Ballooning 9.1% 25.0%
Auto Racing 8.5% 29.1%
Swimming 8.4% 16.9%
Kayaking 8.1% 22.5%
Biking/Cycling 6.1% 23.6%
Personal Watercraft Racing 6.0% 17.0%
Off-road racing 5.8% 21.0%
Shooting 5.5% 16.3%
Motorboat Racing 5.1% 20.8%
Horseback Riding 4.5% 27.3%
Drag Boat Racing 4.4% 23.8%
Water Skiing 4.4% 16.0%
Bowling 4.4% 9.9%
Rodeo 4.1% 18.6%
Canoeing 3.7% 23.6%
Motorcycle Racing 3.3% 16.3%
Sailing 3.2% 18.8%
The following are sports and activities available in Lake Havasu City and
the surrounding area. Please look through them, and in the first column
choose the ONE that is your personal favorite, and in the second column
choose all that you would like to see the city further develop.
RESIDENTS
Answer Options
Your ONE
Favorite [check
one in this
column]
City should further
develop [check all
that apply in this
column]
Hiking 14.8% 25.8%
Fishing 10.8% 15.1%
Swimming 9.7% 18.0%
Golf 9.1% 11.6%
Hot Air Ballooning 8.9% 23.7%
Biking/Cycling 8.6% 25.0%
Personal Watercraft Racing 8.3% 10.5%
Water Skiing 6.7% 13.2%
Kayaking 6.5% 16.1%
Drag Boat Racing 6.5% 14.5%
Canoeing 5.6% 21.0%
Motorboat Racing 5.4% 14.0%
Off-road racing 4.6% 13.2%
Auto Racing 4.3% 13.2%
Horseback Riding 4.0% 18.3%
Sailing 4.0% 14.0%
Shooting 3.5% 9.1%
Wakeboarding 3.2% 8.3%
Rock Hunting 3.0% 13.7%
Bowling 2.7% 7.8%
The following are sports and activities available in Lake Havasu City and
the surrounding area. Please look through them, and in the first column
choose the ONE that is your personal favorite, and in the second column
choose all that you would like to see the city further develop.
VISITORS

45
ACTIVITIES AND SPORTS: FAVORITES 2 OF 3
N=1863
Answer Options
Your ONE
Favorite [check
one in this
column]
City should further
develop [check all
that apply in this
column] Answer Options
Your ONE
Favorite [check
one in this
column]
City should further
develop [check all
that apply in this
column]
Wakeboarding 2.6% 12.1% Scuba Diving 2.4% 10.5%
Pickleball 2.5% 6.3% Motorcycle Racing 2.4% 9.4%
Running 2.5% 9.7% Running 2.4% 8.1%
Roller Skating 2.4% 12.8% Rodeo 1.9% 11.6%
Volleyball 2.3% 9.0% Volleyball 1.9% 8.6%
Climbing 2.1% 12.3% Frisbee (flying discs) 1.9% 7.0%
Rock Hunting 2.1% 12.1% Archery 1.9% 5.4%
RC Cars 2.1% 11.1% Hunting 1.6% 6.2%
Kite-Flying 2.0% 13.9% Horseshoes 1.6% 5.9%
RC Planes 2.0% 11.1% Hockey 1.6% 4.3%
Tennis 1.9% 8.1% Parachuting 1.3% 8.9%
Scuba Diving 1.8% 12.6% Roller Skating 1.3% 6.2%
BMX 1.8% 12.3% Skateboarding 1.3% 4.0%
Pocket Billiards/Pool 1.8% 7.1% Basketball 1.3% 3.8%
Football 1.7% 6.7% Football 1.3% 3.5%
Hockey 1.7% 5.5% Climbing 1.1% 11.3%
Basketball 1.5% 5.6% Kite-Flying 1.1% 10.5%
Archery 1.2% 12.3% Tennis 1.1% 8.1%
The following are sports and activities available in Lake Havasu City and
the surrounding area. Please look through them, and in the first column
choose the ONE that is your personal favorite, and in the second column
choose all that you would like to see the city further develop.
The following are sports and activities available in Lake Havasu City and
the surrounding area. Please look through them, and in the first column
choose the ONE that is your personal favorite, and in the second column
choose all that you would like to see the city further develop.
RESIDENTS VISITORS
These results are sorted by “Your ONE Favorite.”

46
ACTIVITIES AND SPORTS: FAVORITES 3 OF 3
N=1863
Answer Options
Your ONE
Favorite [check
one in this
column]
City should further
develop [check all
that apply in this
column] Answer Options
Your ONE
Favorite [check
one in this
column]
City should further
develop [check all
that apply in this
column]
Horseshoes 1.2% 7.4% Paintball 1.1% 4.8%
Parachuting 1.1% 11.1% Roller Derby 1.1% 3.8%
Paintball 1.1% 10.4% Gymnastics 1.1% 3.5%
Frisbee (flying discs) 1.1% 7.9% Pocket Billiards/Pool 0.5% 5.4%
Hunting 1.1% 6.4% Video Games 0.5% 3.8%
Skateboarding 1.0% 9.8% RC Cars 0.3% 5.9%
Roller Derby 0.9% 7.3% BMX 0.3% 5.4%
Video Games 0.8% 3.3% RC Planes 0.3% 5.1%
Gymnastics 0.8% 6.3% Pickleball 0.3% 4.3%
Racketball 0.8% 6.1% Wrestling 0.3% 3.5%
Wrestling 0.7% 2.5% Racketball 0.3% 3.2%
Boxing 0.6% 3.9% Boxing 0.0% 3.5%
Other 11.5% 6.7% Other 10.8% 4.0%
None of these 2.7% 1.3% None of these 3.0% 4.0%
RESIDENTS VISITORSThe following are sports and activities available in Lake Havasu City and
the surrounding area. Please look through them, and in the first column
The following are sports and activities available in Lake Havasu City and
the surrounding area. Please look through them, and in the first column
These results are sorted by “Your ONE Favorite.”

47
ACTIVITIES AND SPORTS: DEVELOPMENT WISHES – 1 OF 3
These results are sorted by “City should further develop.”
N=1863
Answer Options
Your ONE
Favorite [check
one in this
column]
City should further
develop [check all
that apply in this
column]
Auto Racing 8.5% 29.1%
Horseback Riding 4.5% 27.3%
Hiking 12.2% 25.4%
Hot Air Ballooning 9.1% 25.0%
Drag Boat Racing 4.4% 23.8%
Canoeing 3.7% 23.6%
Biking/Cycling 6.1% 23.6%
Kayaking 8.1% 22.5%
Off-road racing 5.8% 21.0%
Motorboat Racing 5.1% 20.8%
Sailing 3.2% 18.8%
Rodeo 4.1% 18.6%
Fishing 11.4% 18.1%
Personal Watercraft Racing 6.0% 17.0%
Swimming 8.4% 16.9%
Shooting 5.5% 16.3%
RESIDENTS
The following are sports and activities available in Lake Havasu City
and the surrounding area. Please look through them, and in the
first column choose the ONE that is your personal favorite, and in
the second column choose all that you would like to see the city
further develop.
Answer Options
Your ONE
Favorite [check
one in this
column]
City should further
develop [check all
that apply in this
column]
Hiking 14.8% 25.8%
Biking/Cycling 8.6% 25.0%
Hot Air Ballooning 8.9% 23.7%
Canoeing 5.6% 21.0%
Horseback Riding 4.0% 18.3%
Swimming 9.7% 18.0%
Kayaking 6.5% 16.1%
Fishing 10.8% 15.1%
Drag Boat Racing 6.5% 14.5%
Motorboat Racing 5.4% 14.0%
Sailing 4.0% 14.0%
Rock Hunting 3.0% 13.7%
Water Skiing 6.7% 13.2%
Off-road racing 4.6% 13.2%
Auto Racing 4.3% 13.2%
Rodeo 1.9% 11.6%
VISITORS
The following are sports and activities available in Lake Havasu City
and the surrounding area. Please look through them, and in the first
column choose the ONE that is your personal favorite, and in the
second column choose all that you would like to see the city further
develop.
48
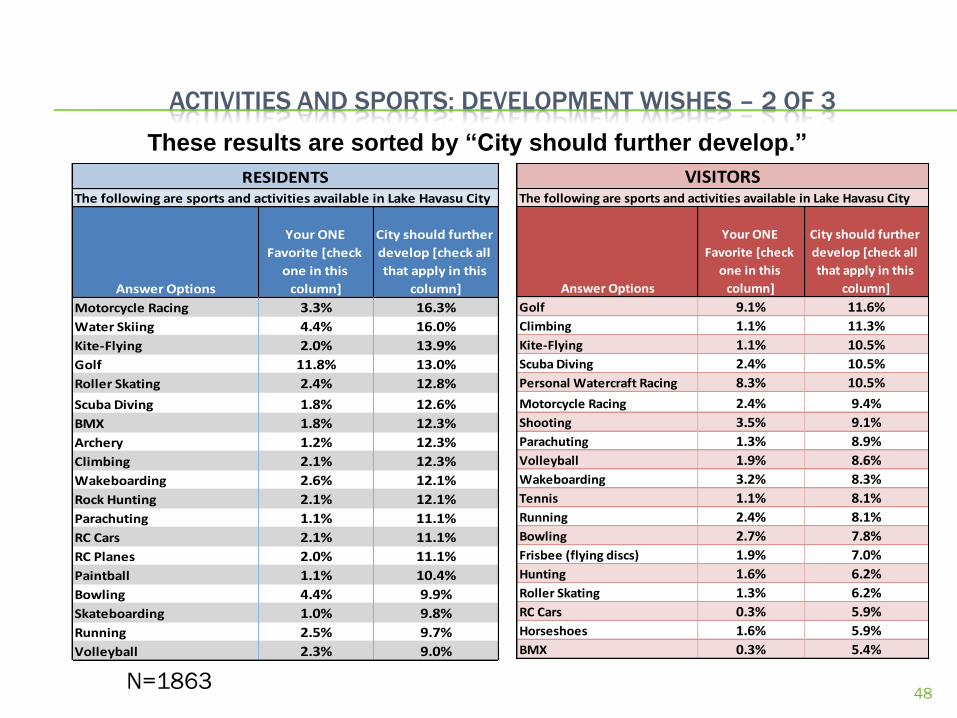
ACTIVITIES AND SPORTS: DEVELOPMENT WISHES – 2 OF 3
N=1863
Answer Options
Your ONE
Favorite [check
one in this
column]
City should further
develop [check all
that apply in this
column]
Motorcycle Racing 3.3% 16.3%
Water Skiing 4.4% 16.0%
Kite-Flying 2.0% 13.9%
Golf 11.8% 13.0%
Roller Skating 2.4% 12.8%
Scuba Diving 1.8% 12.6%
BMX 1.8% 12.3%
Archery 1.2% 12.3%
Climbing 2.1% 12.3%
Wakeboarding 2.6% 12.1%
Rock Hunting 2.1% 12.1%
Parachuting 1.1% 11.1%
RC Cars 2.1% 11.1%
RC Planes 2.0% 11.1%
Paintball 1.1% 10.4%
Bowling 4.4% 9.9%
Skateboarding 1.0% 9.8%
Running 2.5% 9.7%
Volleyball 2.3% 9.0%
RESIDENTSThe following are sports and activities available in Lake Havasu City
Answer Options
Your ONE
Favorite [check
one in this
column]
City should further
develop [check all
that apply in this
column]
Golf 9.1% 11.6%
Climbing 1.1% 11.3%
Kite-Flying 1.1% 10.5%
Scuba Diving 2.4% 10.5%
Personal Watercraft Racing 8.3% 10.5%
Motorcycle Racing 2.4% 9.4%
Shooting 3.5% 9.1%
Parachuting 1.3% 8.9%
Volleyball 1.9% 8.6%
Wakeboarding 3.2% 8.3%
Tennis 1.1% 8.1%
Running 2.4% 8.1%
Bowling 2.7% 7.8%
Frisbee (flying discs) 1.9% 7.0%
Hunting 1.6% 6.2%
Roller Skating 1.3% 6.2%
RC Cars 0.3% 5.9%
Horseshoes 1.6% 5.9%
BMX 0.3% 5.4%
VISITORSThe following are sports and activities available in Lake Havasu City
These results are sorted by “City should further develop.”

49
ACTIVITIES AND SPORTS: DEVELOPMENT WISHES – 3 OF 3
N=1863
Answer Options
Your ONE
Favorite [check
one in this
column]
City should further
develop [check all
that apply in this
column]
Tennis 1.9% 8.1%
Frisbee (flying discs) 1.1% 7.9%
Horseshoes 1.2% 7.4%
Roller Derby 0.9% 7.3%
Pocket Billiards/Pool 1.8% 7.1%
Football 1.7% 6.7%
Hunting 1.1% 6.4%
Pickleball 2.5% 6.3%
Gymnastics 0.8% 6.3%
Racketball 0.8% 6.1%
Basketball 1.5% 5.6%
Hockey 1.7% 5.5%
Boxing 0.6% 3.9%
Video Games 0.8% 3.3%
Wrestling 0.7% 2.5%
Other 11.5% 6.7%
None of these 2.7% 1.3%
RESIDENTSThe following are sports and activities available in Lake Havasu City
Answer Options
Your ONE
Favorite [check
one in this
column]
City should further
develop [check all
that apply in this
column]
Archery 1.9% 5.4%
Pocket Billiards/Pool 0.5% 5.4%
RC Planes 0.3% 5.1%
Paintball 1.1% 4.8%
Pickleball 0.3% 4.3%
Hockey 1.6% 4.3%
Skateboarding 1.3% 4.0%
Video Games 0.5% 3.8%
Roller Derby 1.1% 3.8%
Basketball 1.3% 3.8%
Gymnastics 1.1% 3.5%
Boxing 0.0% 3.5%
Football 1.3% 3.5%
Wrestling 0.3% 3.5%
Racketball 0.3% 3.2%
Other 10.8% 4.0%
None of these 3.0% 4.0%
VISITORSThe following are sports and activities available in Lake Havasu City
These results are sorted by “City should further develop.”
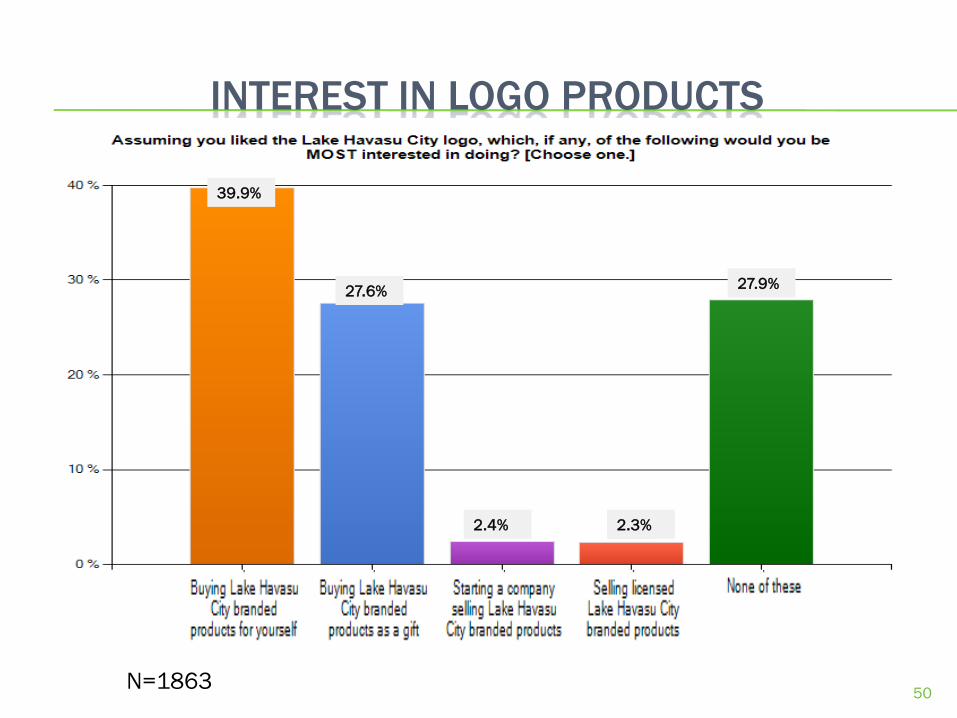
INTEREST IN LOGO PRODUCTS
50
2.3% 2.4%
27.9% 27.6%
39.9%
N=1863

51
OPEN-END COMMENTS ON DESIRED LHC IMPROVEMENTS
This is a summary of 921 open-ended remarks by residents articulating
the changes and improvements they would like to make LHC a more fun
and vibrant place to live. A full transcript of the verbatim remarks are
provided under separate cover.
Improve Beaches
Bring More Jobs
Bring an Olive Garden / more restaurant variety
Bring a Trader Joes
Love it the way it is
Better Ads for Events
Improve Channel Area
Revitalize London Bridge / English Village area
More Family-oriented Activities
Streetlights and sidewalks
Improve the Parks / citizen access free
More Businesses
More Shopping Choices
2%
2%
2%
3%
4%
5%
5%
6%
7%
7%
7%
7%
11%
Residents: Desired Changes / Improvements to LHC

52
OPEN-END COMMENTS ON DESIRED LHC IMPROVEMENTS
This is a summary of 388 open-ended remarks by visitors articulating
the changes and improvements they would like to make LHC a more fun
and frequent vacation destination. A full transcript of the verbatim
remarks are provided under separate cover.
Larger Airport
Reasonable Hotel Rates
More Events
Better / Year-round Water Park
More Restaurant Choices
More Family-friendly Activities
Love it the way it is
More Unique Shops
More Vibrant Area Around London Bridge
2%
4%
5%
5%
6%
7%
9%
9%
10%
Visitors: Desired Changes / Improvements to LHC
OVERNIGHT VISITORS -RESPONDENT PROFILES

OVERNIGHT TRIPS TO LHC – PAST 12 MONTHS
54
18.7%
4.3%
7.0%
7.0%
20.4%
42.6%
The overnight visitors who responded to this survey are more frequent and loyal LHC visitors than the average
visitor. These visitors average 3.3 visits per year, whereas the overall average from the LHC Visitors Study is 2.4
visits per year.
N=234

NIGHTS SPENT IN LHC
55
12.2%
3.9%
5.2%
12.2%
20.0%
23.9%
22.6%
The overnight visitors who responded to this survey stay an average of 3.9 nights per visit, whereas the overall
average from the LHC Visitors Study is 3.6 nights per visit.
N=339

RECENCY OF OVERNIGHT VISIT
56
6.7%
10.5%
33.7%
49.0%
The past overnight visitors who responded to this survey have visited more recently than the general sample
from the LHC Visitors Study. More than 80% of these respondents have visited in the past 5 years, whereas only
25% had done so from the LHC Visitors Study. It makes sense that the more recent visitors would be more likely
to respond to this survey.
N=339
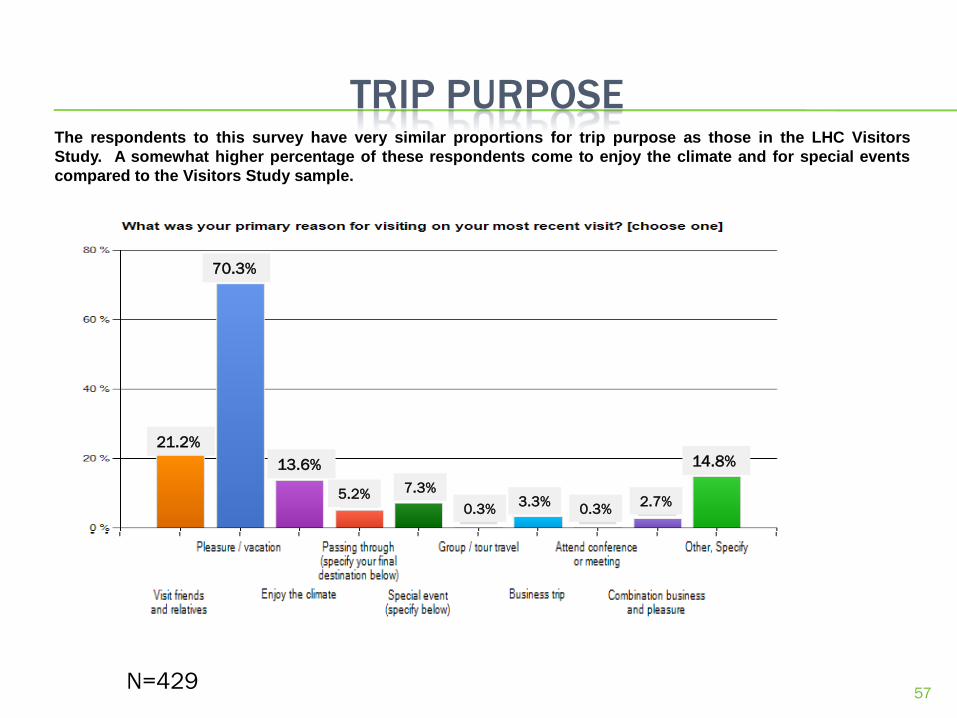
TRIP PURPOSE
57
14.8%
5.2%
13.6%
70.3%
21.2%
The respondents to this survey have very similar proportions for trip purpose as those in the LHC Visitors
Study. A somewhat higher percentage of these respondents come to enjoy the climate and for special events
compared to the Visitors Study sample.
0.3% 3.3%
0.3% 2.7%
7.3%
N=429

ACCOMMODATIONS
58
19.1%
3.0%
12.7%
6.4%
10.6%
0.6%
0.6%
47.0%
The respondents to this survey have very similar proportions for lodging as those in the LHC Visitors Study.
These respondents are more likely to be hotel stayers, 47.0%, compared to the Visitors Study sample 32.3%.
N=339
DAY VISITORS - RESPONDENT PROFILES

DAY VISITORS – WHY DIDN’T STAY OVERNIGHT
60
10.3% 2.3%
64.4%
23.0%
64.4% of day visitors said the reason they didn’t stay overnight was because LHC wasn’t their primary
destination. This compares very closely with the 65.8% of day visitor respondents to the Visitors Study sample
who didn’t stay overnight for the same reason.
N=90
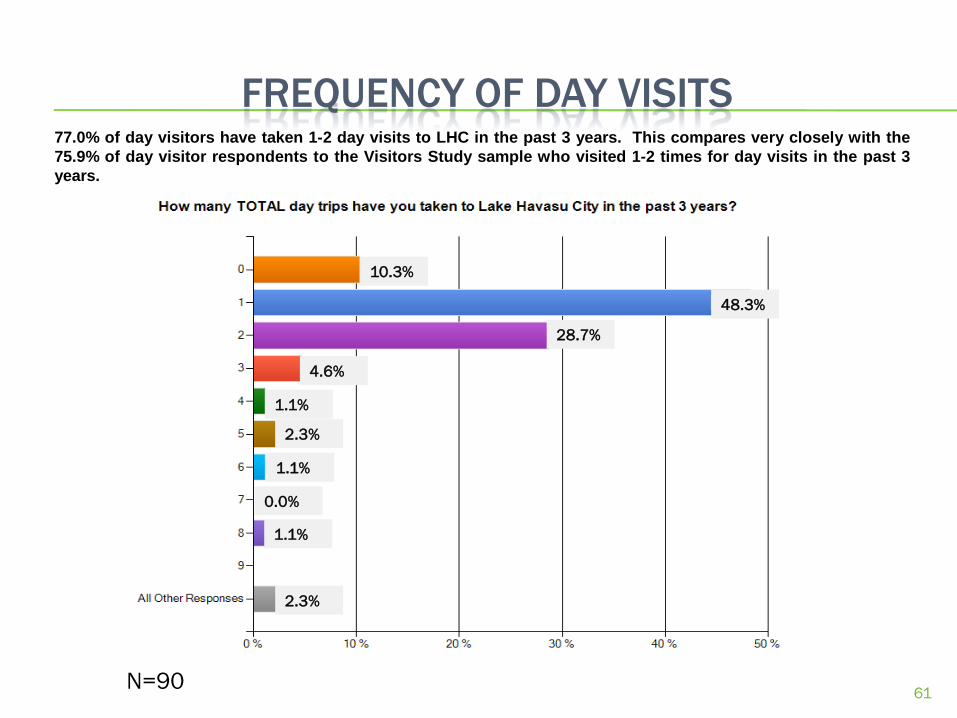
FREQUENCY OF DAY VISITS
61
28.7%
1.1%
2.3%
1.1%
0.0%
1.1%
2.3%
48.3%
10.3%
4.6%
77.0% of day visitors have taken 1-2 day visits to LHC in the past 3 years. This compares very closely with the
75.9% of day visitor respondents to the Visitors Study sample who visited 1-2 times for day visits in the past 3
years.
N=90

HEARD OF, NEVER VISITED LHC - RESPONDENT PROFILES

HEARD OF, NEVER VISITED LHC
63
2.3%
11.4% 84.1%
84.1% of respondents to this survey who haven’t visited LHC yet say they intend to visit but haven’t gotten
around to it. This compares to only 25.1% of respondents to the Visitors Study sample who haven’t visited for
that reason. It is logical that the respondents who chose to respond to this survey are more familiar with LHC
than the general population sample.
2.3%
N=90

RESIDENTS - RESPONDENT PROFILES

RESIDENTS – LENGTH OF RESIDENCY
65
11.3%
8.3%
17.9%
13.9%
28.4%
20.3%
During the first phase of this brand research, the residents who responded were much more likely to have been
longer term residents than newer residents, with 80% having lived here 10+ years. In this survey, only 48.7% are
10+ year residents. This response shows a greater balance of newer and longer term residents.
N=1434
DEMOGRAPHICS

GENDER
67
40.1%
59.9% Female
Male
The survey sample has a gender split of 60% female and 40% male, which is a little higher female representation
than the 55%-45% female to male split that we had in the Phase I survey or in the Visitors Study.
N=1863

GENDER BY AUDIENCE
68
54.5% 62.0%
59.5%
Female
Male
57.7%
40.5%
38.0%
45.5%
43.5%
42.3%
56.5%
All the audience groups reflect a very similar gender split of approximately 60% female and 40% male.
(Visited Overnight in past 12 months (234), Visited Overnight more than 12 months
ago (105), Day trip (90), Full time LHC resident (879), Part year LHC resident (358))
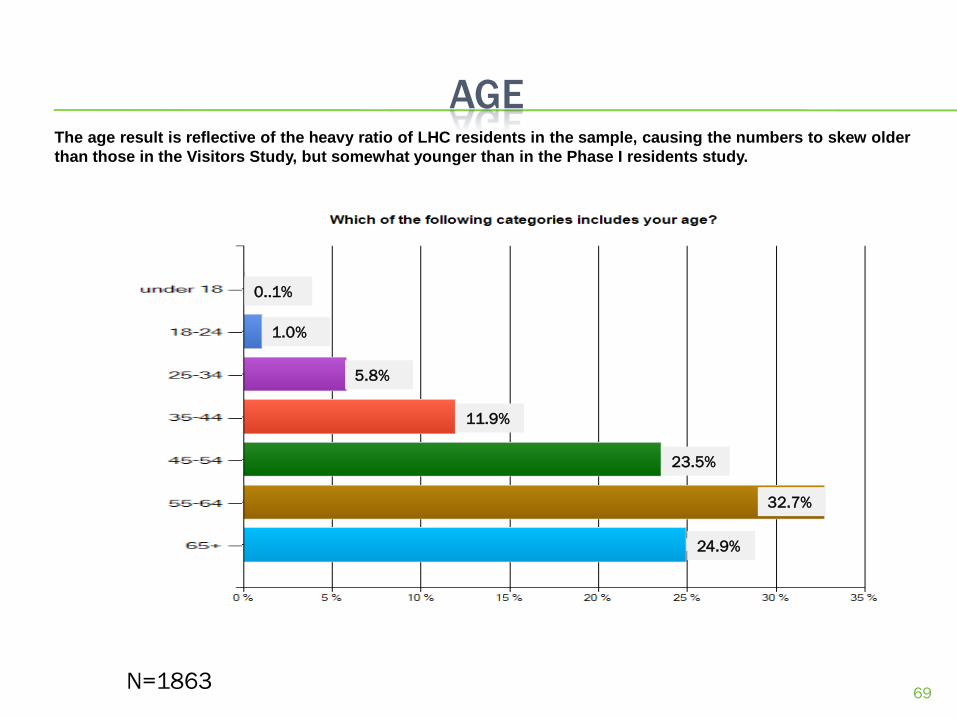
AGE
69
0..1%
1.0%
5.8%
11.9%
23.5%
32.7%
24.9%
The age result is reflective of the heavy ratio of LHC residents in the sample, causing the numbers to skew older
than those in the Visitors Study, but somewhat younger than in the Phase I residents study.
N=1863

AGE BY AUDIENCE
70
The resident groups tend to be older and the visitor groups tend to be younger.
(Visited Overnight in past 12 months (234), Visited Overnight more than 12 months
ago (105), Day trip (90), Full time LHC resident (879), Part year LHC resident (358))

MARITAL STATUS
71
17.8%
6.6%
75.6%
This is slightly higher than the Visitors Study results for proportion that are married, but are reflective of the
heavy sample of residents that responded to this survey.
N=1863

MARITAL STATUS BY AUDIENCE
72
The resident group is more likely to be married than the visitor groups.
(Visited Overnight in past 12 months (234), Visited Overnight more than 12 months
ago (105), Day trip (90), Full time LHC resident (879), Part year LHC resident (358))

PROFESSION
73
21.6%
3.9%
4.2%
5.7%
0.4%
6.3%
36.3%
1.0%
11.1%
10.6%
The resident group is more likely to be retired than the visitor groups, and the heavy proportion of residents in
this study causes the overall sample to lean more heavily in this direction.
N=1863

PROFESSION BY AUDIENCE
74
The resident group is more likely to be retired than the visitor groups, whereas the visitor groups are more likely
to be professional.
(Visited Overnight in past 12 months (234), Visited Overnight more than 12 months
ago (105), Day trip (90), Full time LHC resident (879), Part year LHC resident (358))

HOUSEHOLD INCOME
75
11.7%
16.6%
19.7%
21.7%
25.0%
5.3%
The income distribution of all respondents is slightly toward the lower end of the income spectrum when
compared to the results of the Visitor Study, influenced by the high number of retired persons in the resident
sample.
N=1863
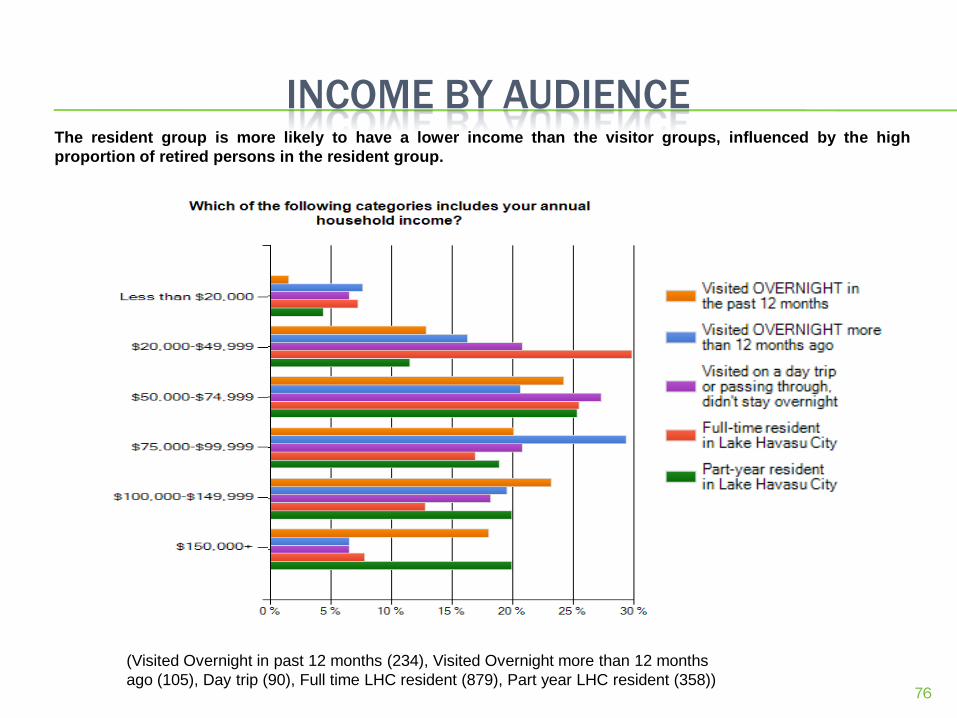
INCOME BY AUDIENCE
76
The resident group is more likely to have a lower income than the visitor groups, influenced by the high
proportion of retired persons in the resident group.
(Visited Overnight in past 12 months (234), Visited Overnight more than 12 months
ago (105), Day trip (90), Full time LHC resident (879), Part year LHC resident (358))
APPENDIX:
VERBATIM REMARKS PROVIDED UNDER
SEPARATE COVER
Related Documents