Lagging Districts Development 1 Lagging Districts Development Background Study Paper for Preparation of the Seventh Five-Year Plan Prepared by Bazlul Haque Khondker 1 Moogdho Mim Mahzab 2 1 Professor, Department of Economics, University of Dhaka, Dhaka-1000 (Email: [email protected]) 2 Research Associate, Bangladesh Institute of Development Studies (BIDS), Agargaon, Dhaka-1206

Welcome message from author
This document is posted to help you gain knowledge. Please leave a comment to let me know what you think about it! Share it to your friends and learn new things together.
Transcript
Lagging Districts Development
1
Lagging Districts Development
Background Study Paper for Preparation of the Seventh Five-Year Plan
Prepared by
Bazlul Haque Khondker1
Moogdho Mim Mahzab2
1 Professor, Department of Economics, University of Dhaka, Dhaka-1000 (Email: [email protected])
2 Research Associate, Bangladesh Institute of Development Studies (BIDS), Agargaon, Dhaka-1206

Lagging Districts Development
2
Table of Content 1.1 Background and Introduction ........................................................................................................... 4
1.2 Review of literature .......................................................................................................................... 5
2. Scope of the Study .................................................................................................................................... 8
3. Data and Methodology ............................................................................................................................. 9
4. District Level Disparity Assessment ........................................................................................................ 10
4.1 Spatial Poverty Status ................................................................................................................. 10
4.2 Income and Expenditure ................................................................................................................... 11
4.3 Demography and Health ................................................................................................................... 12
4.5 Human Capital ................................................................................................................................... 14
4.6 Infrastructure .................................................................................................................................... 15
4.7 Water supply ..................................................................................................................................... 16
4.8 Financial Inclusion ............................................................................................................................. 17
4.9 Agriculture and Rice Production ....................................................................................................... 18
4.10 Employment .................................................................................................................................... 19
4.11 Environmental Concerns ............................................................................................................. 20
4.12 ADP Allocation ............................................................................................................................ 21
5. Principal Component Analysis............................................................................................................. 23
5.2 Empirical Specification ................................................................................................................ 24
6. Convergence versus Divergence: What does panel data suggest? .................................................... 24
6.1 Test of β-convergence....................................................................................................................... 25
6.2 Long-run analysis of convergence ............................................................................................... 27
6.2.1 Model Specification ............................................................................................................ 28
7. Ordinary Least Squared Approach to seek factors behind Poverty .................................................... 30
8. Deprivation matrix .............................................................................................................................. 33
9. Conclusion and Policy recommendations ........................................................................................... 34
9.1 Narrowing Infrastructure Gap ........................................................................................................... 36
9.2 Manufacturing Opportunities in Lagging Districts ............................................................................ 37
9.3 Expanding Agriculture and Rural Economic Activities ...................................................................... 37
9.4 Creating Opportunities for International Migration ......................................................................... 38
Appendix ..................................................................................................................................................... 39
References .................................................................................................................................................. 60
Lagging Districts Development
3
List of Tables
Table 1: Head Count Poverty Rate by Districts (%) .................................................................................... 10
Table 2: Upper Poverty Rate of CHT districts .............................................................................................. 11
Table 3: Per capita Income and Expenditure .............................................................................................. 12
Table 4: Population Density ........................................................................................................................ 13
Table 5: Infant and under five mortality rate ............................................................................................. 13
Table 6: Education....................................................................................................................................... 14
Table 7: Bottom fifteen districts with least EDI scores ............................................................................... 15
Table 8: Roads and Electricity ..................................................................................................................... 16
Table 9: Water Supply ................................................................................................................................. 16
Table 10: Bank credit and deposits ............................................................................................................ 17
Table 11: Microfinance .............................................................................................................................. 17
Table 12: Productivity of rice ...................................................................................................................... 18
Table 13: Total rice production ................................................................................................................... 19
Table 14: Employment share in Agriculture and Overseas Employment ................................................... 19
Table 15: Rank of the Environmentally Exposed Districts .......................................................................... 20
Table 16: List of 15 most deprived districts-Principal component analysis (PCA) ...................................... 24
Table 17: Results of Beta Convergence....................................................................................................... 26
Table 18: Results of Unit Root Tests ........................................................................................................... 29
Table 19: OLS regression results ................................................................................................................. 31
Table 20: Results PCA .................................................................................................................................. 39
Table 21: Zila level povmap estimates (upper), 2010 ................................................................................. 40
Table 22: Population and density ............................................................................................................... 42
Table 23: Economic indicators .................................................................................................................... 44
Table 24: Human capital ............................................................................................................................. 45
Table 25: Ware, sanitation and health........................................................................................................ 47
Table 26: Infrastructure and power ............................................................................................................ 49
Table 27: Financial indicators...................................................................................................................... 51
Table 28: Agriculture land ........................................................................................................................... 53
Table 29: Agriculture production ................................................................................................................ 54
Table 30: Employment ................................................................................................................................ 56
Table 31: ADP Allocation ............................................................................................................................. 57
Table 32: Water Vulnerability Index ........................................................................................................... 59
List of Figures
Figure 1: Consumption expenditure growth (1995-2010) against initial consumption expenditure of 1995
.................................................................................................................................................................... 26
Figure 2: Per capita consumption comparison between top 15 districts and bottom 15 districts ............ 28
Lagging Districts Development
4
1.1 Background and Introduction
Bangladesh, the culture and history that it exhibits, gives a picture of a homogenous nation in
many aspects. However, when we look deep into the development of the country, historically it
can be seen that there is a disparity within the country when it comes to socio-economic
prosperity. Regional disparity within Bangladesh has now been a well established fact in the
economic discourse. Specially the term “East-West divide”, which has been coined in the early
years of this century, points out the gap of progress between the eastern districts to that of
western districts of Bangladesh. The river Jamuna is thought to divide the country’s two
distinctive districts, where the ‘East’ is thought to be the more progressive region, which
includes the Dhaka, Chittagong and Sylhet divisions. On the other hand, the less progressive
“West” constitutes the Rajshahi, Rangpur, Khulna and Barisal divisions. Regional disparity is not
something that is only been seen in Bangladesh, it is true for many countries. There are a
number of factors that foster growth to one region compared to others. Infrastructure, access
to energy and natural resources, concentration of entrepreneurship, skilled labor force,
urbanizations, public resource allocations, geographical locations are among the factors which
enables a region to develop more rapidly than others. However, with the recent advancement
of the economy of Bangladesh with the equitable and inclusive growth it has been achieving,
the historical regional disparity is diminishing. It would not be ideal to see the lagging districts
of Bangladesh from the perspective of “East-West” divide.
Most of the papers concentrating on the regional disparity of Bangladesh have analyzed the
hypothesis of inequality from the perspective of greater districts. Either they took East and
West as two broad districts or the comparison has been made among the seven divisions of
Bangladesh. This approach actually misses the relative micro picture of the economy which is
essential to address the lagging districts more precisely. It has been seen in recent data that
some districts in the west have done better than to that of some districts in the east. For that
reason this paper will analyze the whole issue from the district level development.
Lagging Districts Development
5
1.2 Review of literature
There are few studies which have focused the issue of regional disparity from both macro and
micro perspective (Zohir, 2011) has done a comprehensive work on regional inequality. One of
the special features of the paper is that it has presented a rich set of reviews of literature and
also brought a historical perspective of regional disparity in Bangladesh. The paper rightly
mentioned that most of the other studies saw regional inequality from the lens of promoting
safety net programs to tackle the disparity. This paper separately dealt with the major
economic sectors of Bangladesh, i.e. Agriculture, Non-Agriculture, Infrastructure, Health, MFI
etc. It has pointed out the limitation of disaggregated data, as most of the national data could
be found at the division level, where as it is very important to have data of the major economic
and social indicators at least of district level if not sub-district level. This paper shows the trend
of the major economic indicators mostly in divisional level and to some extent to the boarder
districts level. It is mentioned in the paper that to explore regional inequality only in term of the
“east-west” divide will not give a concrete solution of tackle the persisting regional inequality.
The paper suggests that the trend of poverty indicates a comparatively lagging southwest and
decreasing poverty rates of the northwest. However, unlike other previous papers, this one
divulges the fact about poverty in many pockets of relatively developed districts, i.e. the Haors
of north-east, Chars of Noakhali and some areas in north-central. The author explains the
phenomenon of these pockets by the lack of connectivity of these areas with the regional
growth centers, political tensions, and climate and ecological adverse effects. In the paper, two
main reasons were highlighted when it came to explaining the labor reallocations and industrial
restructuring especially after 1990s, and those two factors were access to safe drinking water
and access to gas. The paper dwells on (Shilpi, 2008) which theoretically and econometrically
dealt with convergences and divergences of integrated regions (Dhaka Sylhet, and Chittagong
divisions) and less integrated regions (Rajshahi, Khulna, Barisal) (Zohir, 2011) works on it
modeled it to find out the factors behind the convergence or divergence of those regions. The
paper made some general yet intriguing recommendations to lessen the persisting disparity
within regions by formulating policies as such that it would disseminate the positives of the
Lagging Districts Development
6
regional growth hubs to the less connected regions. However, due to the lack of unit level data
and using the boarder administrative data, the lagging districts were not exactly identified in
the paper. So in our paper we tried to bridge that gap of knowledge in the literature of regional
inequality in Bangladesh.
A recently published report by Bangladesh Institute of Development Studies (BIDS), (Sen,
Ahmed, Ali, & Yunus, 2014) looked into the factors behind the recent decline of the regional
inequality know as East-West divide. This paper tried to capture the persistent regional
disparity and the trend of it, and if there is a decline, how quantitatively and econometrically
can those be measured. There are number of reasons came out in the paper for the decline of
the inequality gap between the east and west region of Bangladesh. Firstly, according to the
authors the growth of agriculture spurred the development in the west in the last two decades,
and because initially that region was lagging behind in agricultural production but due to
prudent policies that gap had been minimized moderately. In the West, small and medium
businesses had flourished in the last decade, as a result the concentration of economic
activities had increased a lot, and this in effect helped the region a lot to come out from
extreme poverty. Another reason that the authors have mentioned and in our paper too, we
have found it to be true and influential while explaining the decline of the ‘East-West’ divide, is
the human capital factor. The authors have rightly pointed out that though historically the west
was lagging behind in income and consumption expenditure compared to that of East, but
when it came to human capital, actually west as equally as good or to some extent better than
the east, the authors mentioned that this feature is unique in the context of South Asian
inequality dimensions of other countries. Actually, the return of having better human capital
came to an effect after a lagged period that indeed helped the region to have better economic
development. The last major point the authors claimed about the decline of the regional
disparity is the growth of micro finance institutions (MFI), this claim found to be valid in our
results too. And it has been observed that the functioning and spread of the MFIs is higher in
West than in East. The authors have broadly identified three major policy interventions that
have had significant influence to bridge the gap between the two regions. Mainly investment in
Infrastructure, specially building roads, bridges, and highways have upgraded the connectivity
Lagging Districts Development
7
system of the west, which played a vital role for the region’s development. Secondly,
investment on human capital, establishing a great number of primary and secondary schools
had helped to the region to well in major educational indicators. Lastly, as the west is more
exposed and vulnerable to the natural hazards, the polices had focused to build up the
resistance and coping mechanisms for the regions, which itself had a multiple effect on
boosting confidence for the people of the region and also minimizing the risk associated with
climate vulnerabilities. The authors also econometrically tried to show the reasons of the
decline. Running quintile regressions, they have found that the role urbanization and its
benefits that the East used to enjoy had declined a lot. Also in another set of regressions they
have found that human capital and urbanization playing the major role to increase the welfare
in the west. Internal migration also stood out as an equalizing factor for the west. In search of
neighborhood effect, their regression suggested that there is strong evidence of transfer of
social and economic benefits from the East to the west.
The background paper (Khondker & Wadud, 2010) on urbanization management and emerging
regional disparity in Bangladesh for the sixth five year plan also revealed a number of important
aspects of regional heterogeneity of development. The paper mainly looked regional disparity
by digging deep into the development pattern of the seven major divisions in a number of
economic and non-economic indicators. In the paper, Rajshahi came out to be lagging behind in
terms of income from other divisions especially the density of poor people is highest in
Rajshahi. On the other hand Barishal division had the most widespread and severe poverty
among all the divisions. The paper also dealt with regional disparity in terms of different sector.
It found that other agricultural production does not actually relate to lower incidence of
poverty in any given districts and to some extent to the whole division. Districts, which have
developed manufacturing industries, have progressed better than the others. Urbanization,
internal migration, human capital, access to finance, transport connectivity, exposure to
climatic hazards are the main factors driving inequality among regions. However, like other
previous papers mentioned here, this paper also concentrate on broad regional aspects of
discriminations. It focused on divisional level information and tried to expand marginally to
district level too.
Lagging Districts Development
8
Thus, we believe our paper has made some good addition to the previous works on disparity,
especially in the context that we focus on the district level to understand the spatial
distribution of inequality in terms of economic and social indicators.
2. Scope of the Study
This study aims to reveal the extent of disparity among the 64 districts by the major
development indicators. The outcome of the study likely to bring out the districts which are
lagging behind than the rest of other districts in terms of the major social, economic and other
non-economic indicators selected for this study. Moreover, the study shows the major reasons
for backwardness of a lagged district. Furthermore, at the macro-level an econometric analysis
has been conducted to seek whether there would be a converging or diverging tendency among
the districts with regard to per capita income and expenditure. Finally, the study provides a
clear set of policy recommendation to minimize the gap between the lagging districts with the
progressive ones. The following specific issues are covered:
1. Reviewing the district level poverty incidences and ranking the least developed or lagged
districts of Bangladesh.
2. Analyzing the income, savings, expenditure and other economic factors to rank the districts
according to their level of deprivation.
3. Analysing social and other non-economic factors to identify the most deprived districts.
4. Identifying the least developed 15 districts of the country using major developmental
indicators.
5. Applying a principal component analysis to derive a composite index of the 15 lagged
districts of Bangladesh.
6. Applying a cross-sectional analysis to determine the major factors influencing the
development of a district.
7. Employing a unit root test to assess divergence versus convergence trends towards per
capita income or consumption among the 64 districts.
Lagging Districts Development
9
8. Recommending set of policy measures to reduce the extent of deprivation among the
districts.
3. Data and Methodology
The study is based entirely on secondary data sources reported by various agencies in
Bangladesh including Bangladesh Bureau of Statistics; Ministry of Planning and Finance; and
Bangladesh Bank. Three specific approaches signify the methodology of the study:
Firstly, in order to assess the degree of deprivation by the selected development indicators, the
comparisons have been conducted at the district level rather than at divisional levels or broader
regional level as was found in the previous studies.
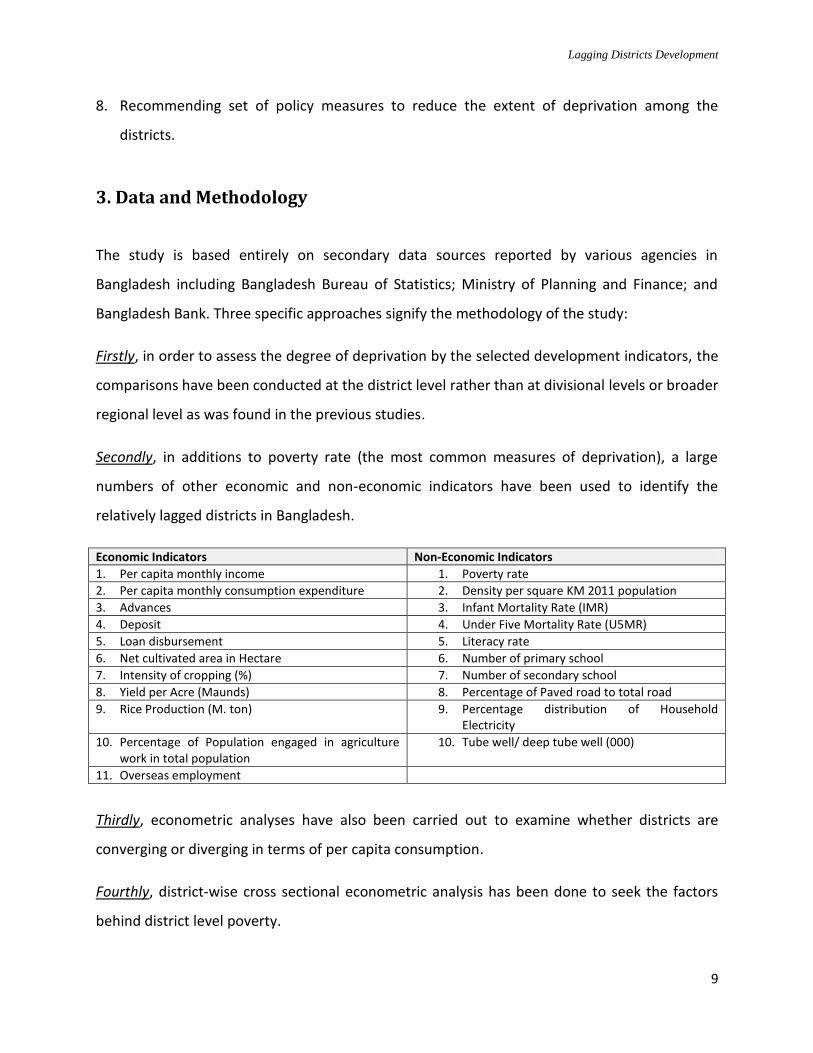
Secondly, in additions to poverty rate (the most common measures of deprivation), a large
numbers of other economic and non-economic indicators have been used to identify the
relatively lagged districts in Bangladesh.
Economic Indicators Non-Economic Indicators
1. Per capita monthly income 1. Poverty rate
2. Per capita monthly consumption expenditure 2. Density per square KM 2011 population
3. Advances 3. Infant Mortality Rate (IMR)
4. Deposit 4. Under Five Mortality Rate (U5MR)
5. Loan disbursement 5. Literacy rate
6. Net cultivated area in Hectare 6. Number of primary school
7. Intensity of cropping (%) 7. Number of secondary school
8. Yield per Acre (Maunds) 8. Percentage of Paved road to total road
9. Rice Production (M. ton) 9. Percentage distribution of Household Electricity
10. Percentage of Population engaged in agriculture work in total population
10. Tube well/ deep tube well (000)
11. Overseas employment
Thirdly, econometric analyses have also been carried out to examine whether districts are
converging or diverging in terms of per capita consumption.
Fourthly, district-wise cross sectional econometric analysis has been done to seek the factors
behind district level poverty.
Lagging Districts Development
10
4. District Level Disparity Assessment
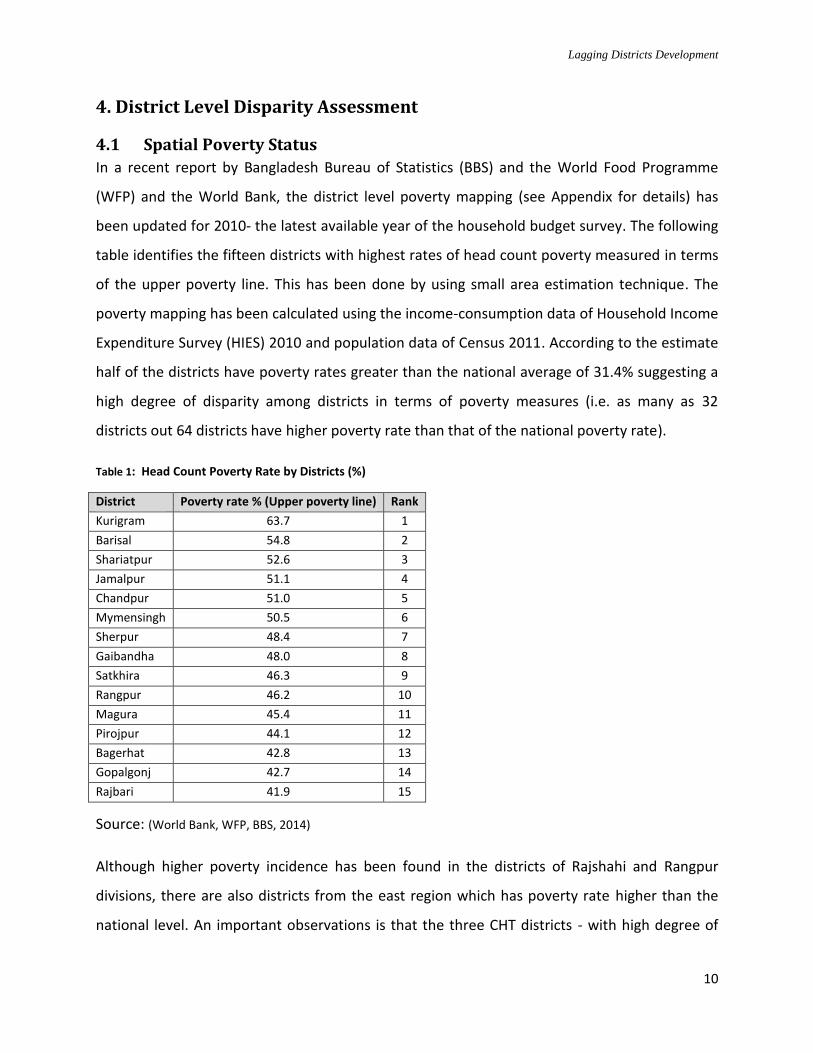
4.1 Spatial Poverty Status
In a recent report by Bangladesh Bureau of Statistics (BBS) and the World Food Programme
(WFP) and the World Bank, the district level poverty mapping (see Appendix for details) has
been updated for 2010- the latest available year of the household budget survey. The following
table identifies the fifteen districts with highest rates of head count poverty measured in terms
of the upper poverty line. This has been done by using small area estimation technique. The
poverty mapping has been calculated using the income-consumption data of Household Income
Expenditure Survey (HIES) 2010 and population data of Census 2011. According to the estimate
half of the districts have poverty rates greater than the national average of 31.4% suggesting a
high degree of disparity among districts in terms of poverty measures (i.e. as many as 32
districts out 64 districts have higher poverty rate than that of the national poverty rate).
Table 1: Head Count Poverty Rate by Districts (%)
District Poverty rate % (Upper poverty line) Rank
Kurigram 63.7 1
Barisal 54.8 2
Shariatpur 52.6 3
Jamalpur 51.1 4
Chandpur 51.0 5
Mymensingh 50.5 6
Sherpur 48.4 7
Gaibandha 48.0 8
Satkhira 46.3 9
Rangpur 46.2 10
Magura 45.4 11
Pirojpur 44.1 12
Bagerhat 42.8 13
Gopalgonj 42.7 14
Rajbari 41.9 15
Source: (World Bank, WFP, BBS, 2014)
Although higher poverty incidence has been found in the districts of Rajshahi and Rangpur
divisions, there are also districts from the east region which has poverty rate higher than the
national level. An important observations is that the three CHT districts - with high degree of
Lagging Districts Development
11
deprivations in other indicators - did not make the above list with relatively moderate of
poverty rates. Further investigation with other data sources may suggest that poverty rate
could have been higher than what is reported in the WFP/WB report.
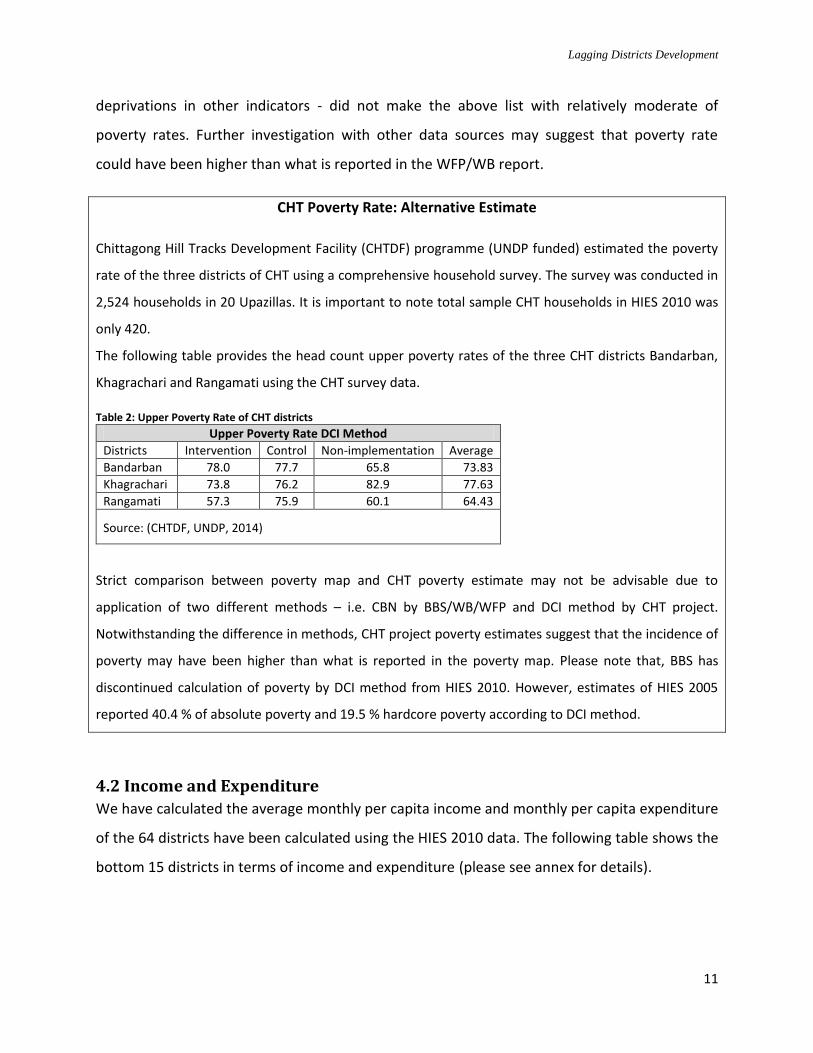
CHT Poverty Rate: Alternative Estimate
Chittagong Hill Tracks Development Facility (CHTDF) programme (UNDP funded) estimated the poverty
rate of the three districts of CHT using a comprehensive household survey. The survey was conducted in
2,524 households in 20 Upazillas. It is important to note total sample CHT households in HIES 2010 was
only 420.
The following table provides the head count upper poverty rates of the three CHT districts Bandarban,
Khagrachari and Rangamati using the CHT survey data.
Table 2: Upper Poverty Rate of CHT districts
Upper Poverty Rate DCI Method
Districts Intervention Control Non-implementation Average
Bandarban 78.0 77.7 65.8 73.83
Khagrachari 73.8 76.2 82.9 77.63
Rangamati 57.3 75.9 60.1 64.43
Source: (CHTDF, UNDP, 2014)
Strict comparison between poverty map and CHT poverty estimate may not be advisable due to
application of two different methods – i.e. CBN by BBS/WB/WFP and DCI method by CHT project.
Notwithstanding the difference in methods, CHT project poverty estimates suggest that the incidence of
poverty may have been higher than what is reported in the poverty map. Please note that, BBS has
discontinued calculation of poverty by DCI method from HIES 2010. However, estimates of HIES 2005
reported 40.4 % of absolute poverty and 19.5 % hardcore poverty according to DCI method.
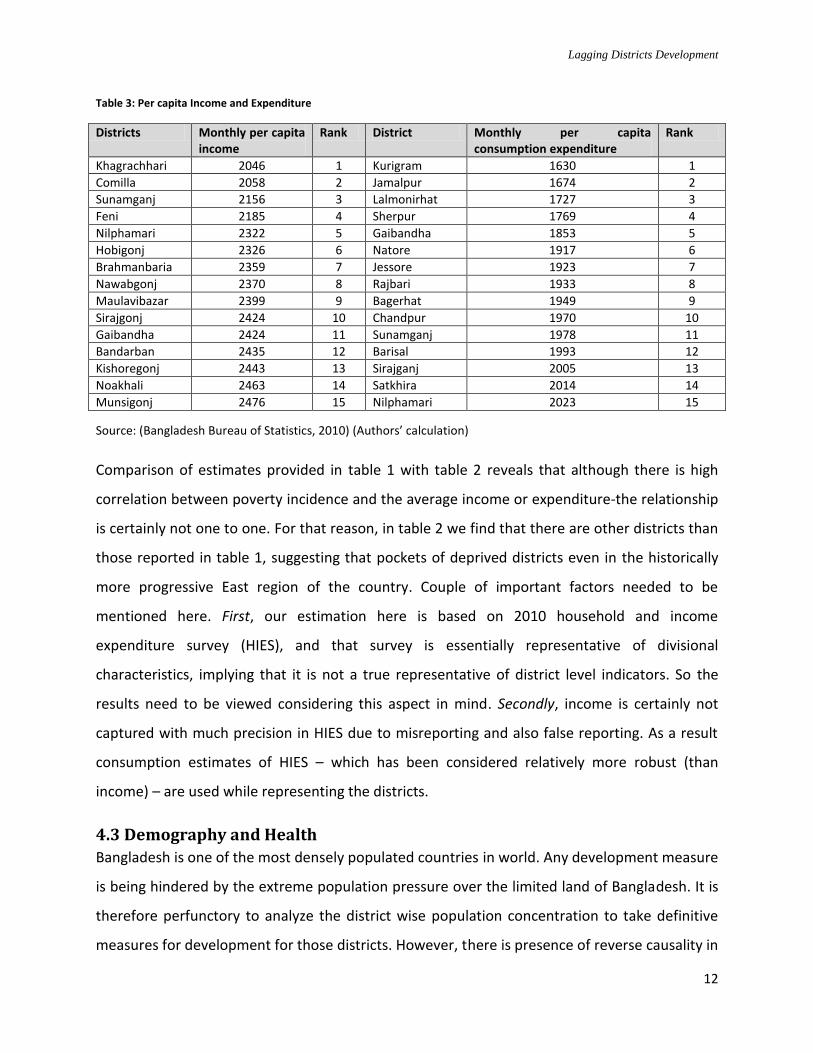
4.2 Income and Expenditure
We have calculated the average monthly per capita income and monthly per capita expenditure
of the 64 districts have been calculated using the HIES 2010 data. The following table shows the
bottom 15 districts in terms of income and expenditure (please see annex for details).
Lagging Districts Development
12
Table 3: Per capita Income and Expenditure
Districts Monthly per capita income
Rank District Monthly per capita consumption expenditure
Rank
Khagrachhari 2046 1 Kurigram 1630 1
Comilla 2058 2 Jamalpur 1674 2
Sunamganj 2156 3 Lalmonirhat 1727 3
Feni 2185 4 Sherpur 1769 4
Nilphamari 2322 5 Gaibandha 1853 5
Hobigonj 2326 6 Natore 1917 6
Brahmanbaria 2359 7 Jessore 1923 7
Nawabgonj 2370 8 Rajbari 1933 8
Maulavibazar 2399 9 Bagerhat 1949 9
Sirajgonj 2424 10 Chandpur 1970 10
Gaibandha 2424 11 Sunamganj 1978 11
Bandarban 2435 12 Barisal 1993 12
Kishoregonj 2443 13 Sirajganj 2005 13
Noakhali 2463 14 Satkhira 2014 14
Munsigonj 2476 15 Nilphamari 2023 15
Source: (Bangladesh Bureau of Statistics, 2010) (Authors’ calculation)
Comparison of estimates provided in table 1 with table 2 reveals that although there is high
correlation between poverty incidence and the average income or expenditure-the relationship
is certainly not one to one. For that reason, in table 2 we find that there are other districts than
those reported in table 1, suggesting that pockets of deprived districts even in the historically
more progressive East region of the country. Couple of important factors needed to be
mentioned here. First, our estimation here is based on 2010 household and income
expenditure survey (HIES), and that survey is essentially representative of divisional
characteristics, implying that it is not a true representative of district level indicators. So the
results need to be viewed considering this aspect in mind. Secondly, income is certainly not
captured with much precision in HIES due to misreporting and also false reporting. As a result
consumption estimates of HIES – which has been considered relatively more robust (than
income) – are used while representing the districts.
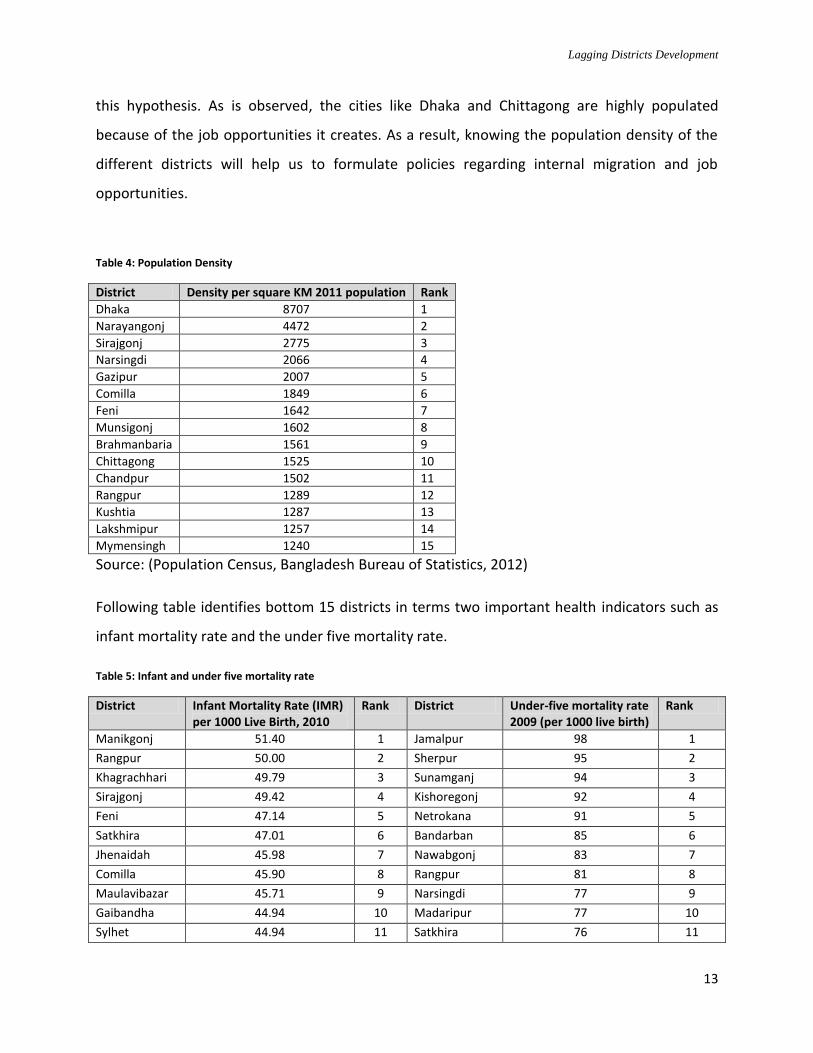
4.3 Demography and Health
Bangladesh is one of the most densely populated countries in world. Any development measure
is being hindered by the extreme population pressure over the limited land of Bangladesh. It is
therefore perfunctory to analyze the district wise population concentration to take definitive
measures for development for those districts. However, there is presence of reverse causality in
Lagging Districts Development
13
this hypothesis. As is observed, the cities like Dhaka and Chittagong are highly populated
because of the job opportunities it creates. As a result, knowing the population density of the
different districts will help us to formulate policies regarding internal migration and job
opportunities.
Table 4: Population Density
District Density per square KM 2011 population Rank
Dhaka 8707 1
Narayangonj 4472 2
Sirajgonj 2775 3
Narsingdi 2066 4
Gazipur 2007 5
Comilla 1849 6
Feni 1642 7
Munsigonj 1602 8
Brahmanbaria 1561 9
Chittagong 1525 10
Chandpur 1502 11
Rangpur 1289 12
Kushtia 1287 13
Lakshmipur 1257 14
Mymensingh 1240 15
Source: (Population Census, Bangladesh Bureau of Statistics, 2012)
Following table identifies bottom 15 districts in terms two important health indicators such as
infant mortality rate and the under five mortality rate.
Table 5: Infant and under five mortality rate
District Infant Mortality Rate (IMR) per 1000 Live Birth, 2010
Rank District Under-five mortality rate 2009 (per 1000 live birth)
Rank
Manikgonj 51.40 1 Jamalpur 98 1
Rangpur 50.00 2 Sherpur 95 2
Khagrachhari 49.79 3 Sunamganj 94 3
Sirajgonj 49.42 4 Kishoregonj 92 4
Feni 47.14 5 Netrokana 91 5
Satkhira 47.01 6 Bandarban 85 6
Jhenaidah 45.98 7 Nawabgonj 83 7
Comilla 45.90 8 Rangpur 81 8
Maulavibazar 45.71 9 Narsingdi 77 9
Gaibandha 44.94 10 Madaripur 77 10
Sylhet 44.94 11 Satkhira 76 11
Lagging Districts Development
14
District Infant Mortality Rate (IMR) per 1000 Live Birth, 2010
Rank District Under-five mortality rate 2009 (per 1000 live birth)
Rank
Rajbari 44.90 12 Gaibandha 74 12
Lalmonirhat 44.53 13 Lakshmipur 73 13
Brahmanbaria 44.32 14 Sirajgonj 72 14
Panchagar 42.17 15 Pirojpur 72 15
Source: (Bangladesh Bureau of Statistics , 2010)
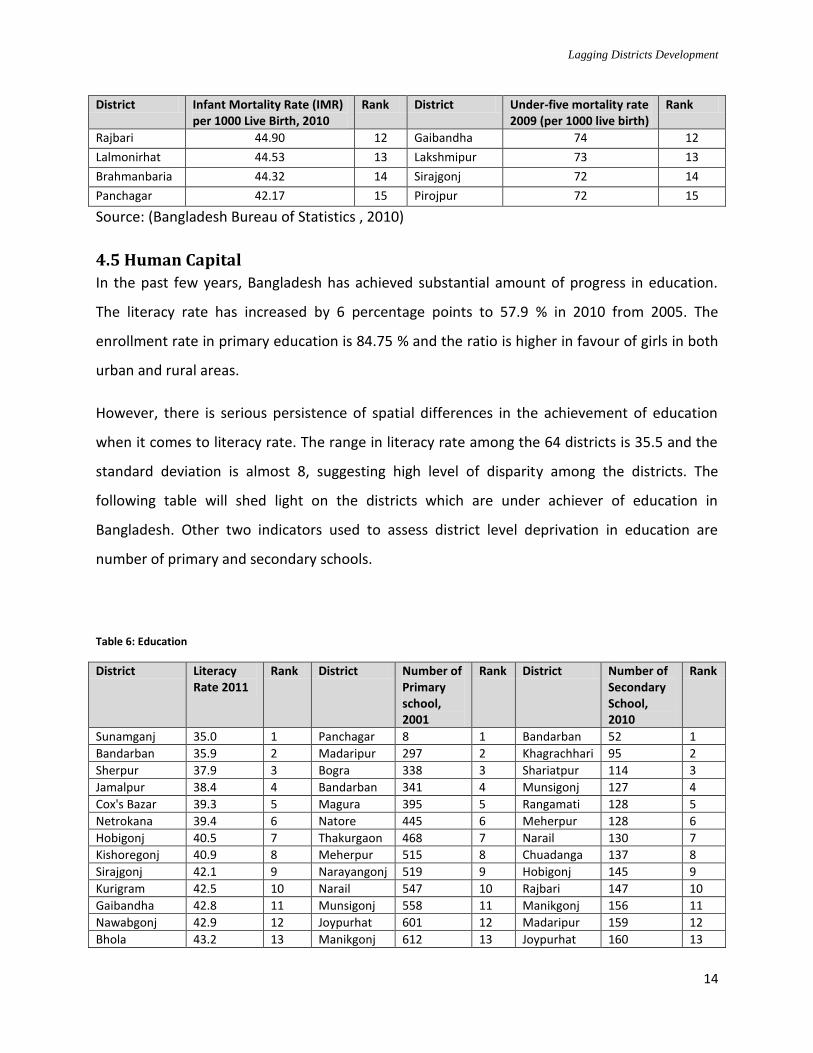
4.5 Human Capital
In the past few years, Bangladesh has achieved substantial amount of progress in education.
The literacy rate has increased by 6 percentage points to 57.9 % in 2010 from 2005. The
enrollment rate in primary education is 84.75 % and the ratio is higher in favour of girls in both
urban and rural areas.
However, there is serious persistence of spatial differences in the achievement of education
when it comes to literacy rate. The range in literacy rate among the 64 districts is 35.5 and the
standard deviation is almost 8, suggesting high level of disparity among the districts. The
following table will shed light on the districts which are under achiever of education in
Bangladesh. Other two indicators used to assess district level deprivation in education are
number of primary and secondary schools.
Table 6: Education
District Literacy Rate 2011
Rank District Number of Primary school, 2001
Rank District Number of Secondary School, 2010
Rank
Sunamganj 35.0 1 Panchagar 8 1 Bandarban 52 1
Bandarban 35.9 2 Madaripur 297 2 Khagrachhari 95 2
Sherpur 37.9 3 Bogra 338 3 Shariatpur 114 3
Jamalpur 38.4 4 Bandarban 341 4 Munsigonj 127 4
Cox's Bazar 39.3 5 Magura 395 5 Rangamati 128 5
Netrokana 39.4 6 Natore 445 6 Meherpur 128 6
Hobigonj 40.5 7 Thakurgaon 468 7 Narail 130 7
Kishoregonj 40.9 8 Meherpur 515 8 Chuadanga 137 8
Sirajgonj 42.1 9 Narayangonj 519 9 Hobigonj 145 9
Kurigram 42.5 10 Narail 547 10 Rajbari 147 10
Gaibandha 42.8 11 Munsigonj 558 11 Manikgonj 156 11
Nawabgonj 42.9 12 Joypurhat 601 12 Madaripur 159 12
Bhola 43.2 13 Manikgonj 612 13 Joypurhat 160 13
Lagging Districts Development
15
District Literacy Rate 2011
Rank District Number of Primary school, 2001
Rank District Number of Secondary School, 2010
Rank
Mymensingh 43.5 14 Sherpur 617 14 Lakshmipur 172 14
Nilphamari 44.4 15 Nawabgonj 652 15 Magura 173 15
Source: (Population Census, Bangladesh Bureau of Statistics, 2012), (Bangladesh Bureau of
Statistics , 2001), (Bangladesh Bureau of Educational Information and Statistics, 2010)
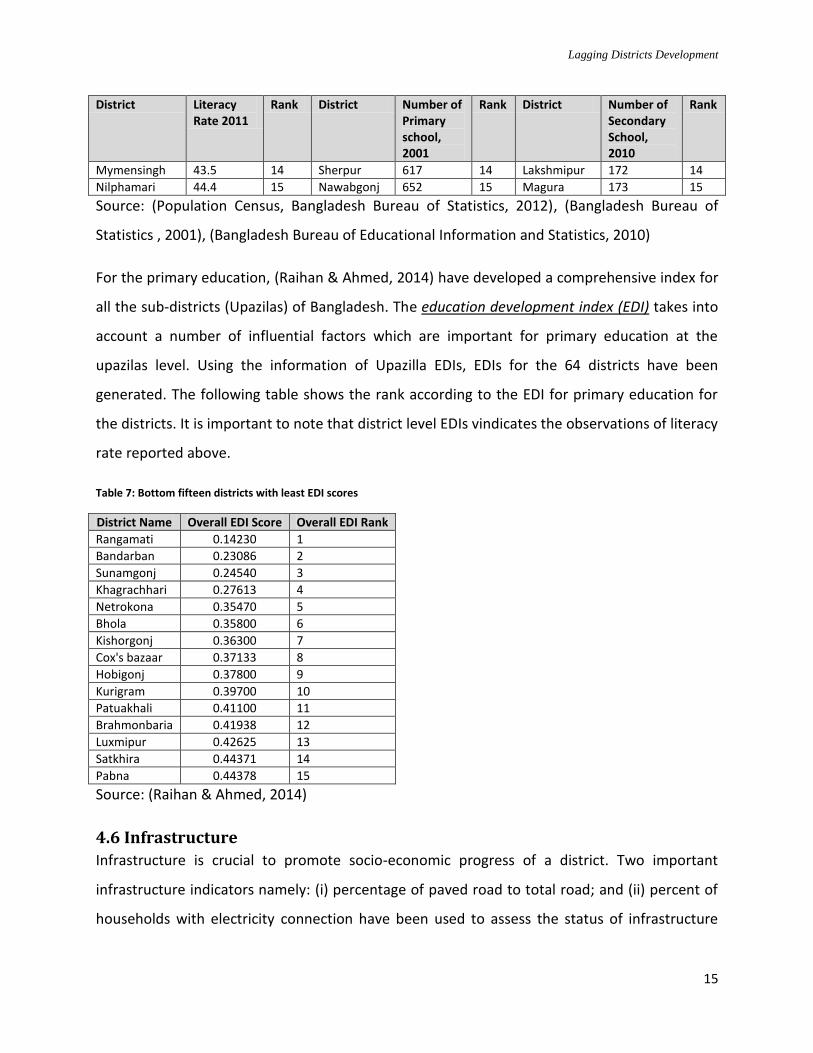
For the primary education, (Raihan & Ahmed, 2014) have developed a comprehensive index for
all the sub-districts (Upazilas) of Bangladesh. The education development index (EDI) takes into
account a number of influential factors which are important for primary education at the
upazilas level. Using the information of Upazilla EDIs, EDIs for the 64 districts have been
generated. The following table shows the rank according to the EDI for primary education for
the districts. It is important to note that district level EDIs vindicates the observations of literacy
rate reported above.
Table 7: Bottom fifteen districts with least EDI scores
District Name Overall EDI Score Overall EDI Rank
Rangamati 0.14230 1
Bandarban 0.23086 2
Sunamgonj 0.24540 3
Khagrachhari 0.27613 4
Netrokona 0.35470 5
Bhola 0.35800 6
Kishorgonj 0.36300 7
Cox's bazaar 0.37133 8
Hobigonj 0.37800 9
Kurigram 0.39700 10
Patuakhali 0.41100 11
Brahmonbaria 0.41938 12
Luxmipur 0.42625 13
Satkhira 0.44371 14
Pabna 0.44378 15
Source: (Raihan & Ahmed, 2014)
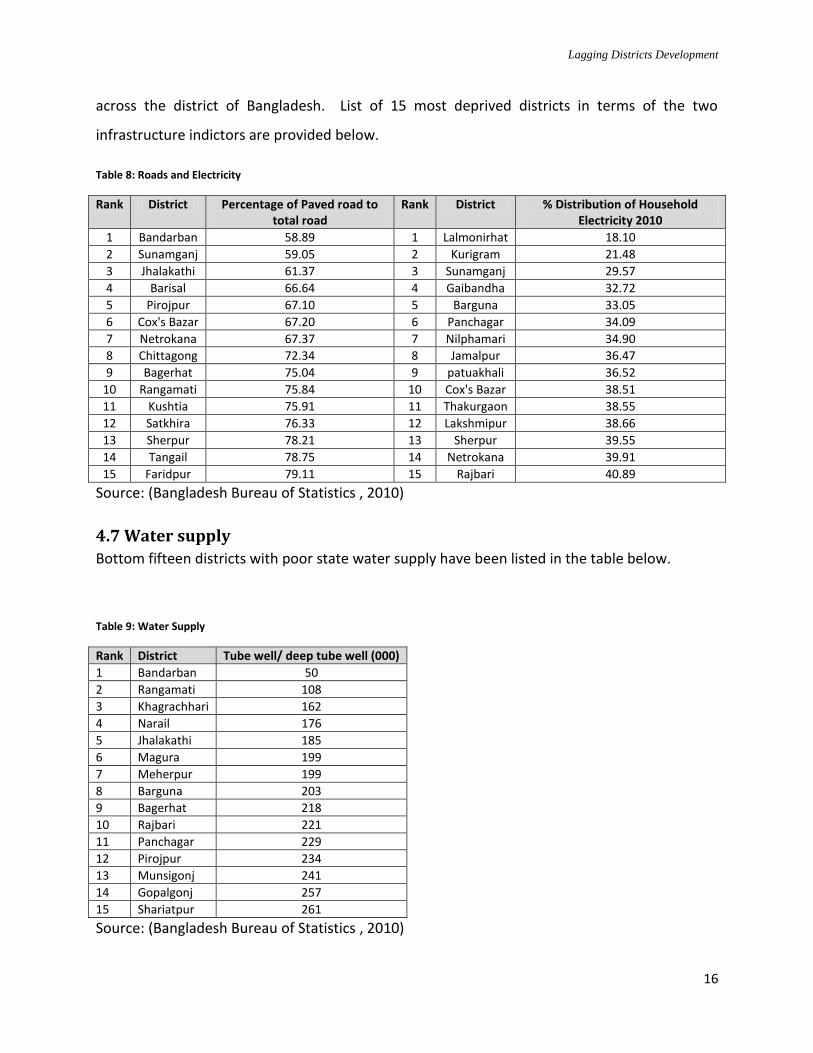
4.6 Infrastructure
Infrastructure is crucial to promote socio-economic progress of a district. Two important
infrastructure indicators namely: (i) percentage of paved road to total road; and (ii) percent of
households with electricity connection have been used to assess the status of infrastructure
Lagging Districts Development
16
across the district of Bangladesh. List of 15 most deprived districts in terms of the two
infrastructure indictors are provided below.
Table 8: Roads and Electricity
Rank District Percentage of Paved road to total road
Rank District % Distribution of Household Electricity 2010
1 Bandarban 58.89 1 Lalmonirhat 18.10
2 Sunamganj 59.05 2 Kurigram 21.48
3 Jhalakathi 61.37 3 Sunamganj 29.57
4 Barisal 66.64 4 Gaibandha 32.72
5 Pirojpur 67.10 5 Barguna 33.05
6 Cox's Bazar 67.20 6 Panchagar 34.09
7 Netrokana 67.37 7 Nilphamari 34.90
8 Chittagong 72.34 8 Jamalpur 36.47
9 Bagerhat 75.04 9 patuakhali 36.52
10 Rangamati 75.84 10 Cox's Bazar 38.51
11 Kushtia 75.91 11 Thakurgaon 38.55
12 Satkhira 76.33 12 Lakshmipur 38.66
13 Sherpur 78.21 13 Sherpur 39.55
14 Tangail 78.75 14 Netrokana 39.91
15 Faridpur 79.11 15 Rajbari 40.89
Source: (Bangladesh Bureau of Statistics , 2010)
4.7 Water supply
Bottom fifteen districts with poor state water supply have been listed in the table below.
Table 9: Water Supply
Rank District Tube well/ deep tube well (000)
1 Bandarban 50
2 Rangamati 108
3 Khagrachhari 162
4 Narail 176
5 Jhalakathi 185
6 Magura 199
7 Meherpur 199
8 Barguna 203
9 Bagerhat 218
10 Rajbari 221
11 Panchagar 229
12 Pirojpur 234
13 Munsigonj 241
14 Gopalgonj 257
15 Shariatpur 261
Source: (Bangladesh Bureau of Statistics , 2010)
Lagging Districts Development
17
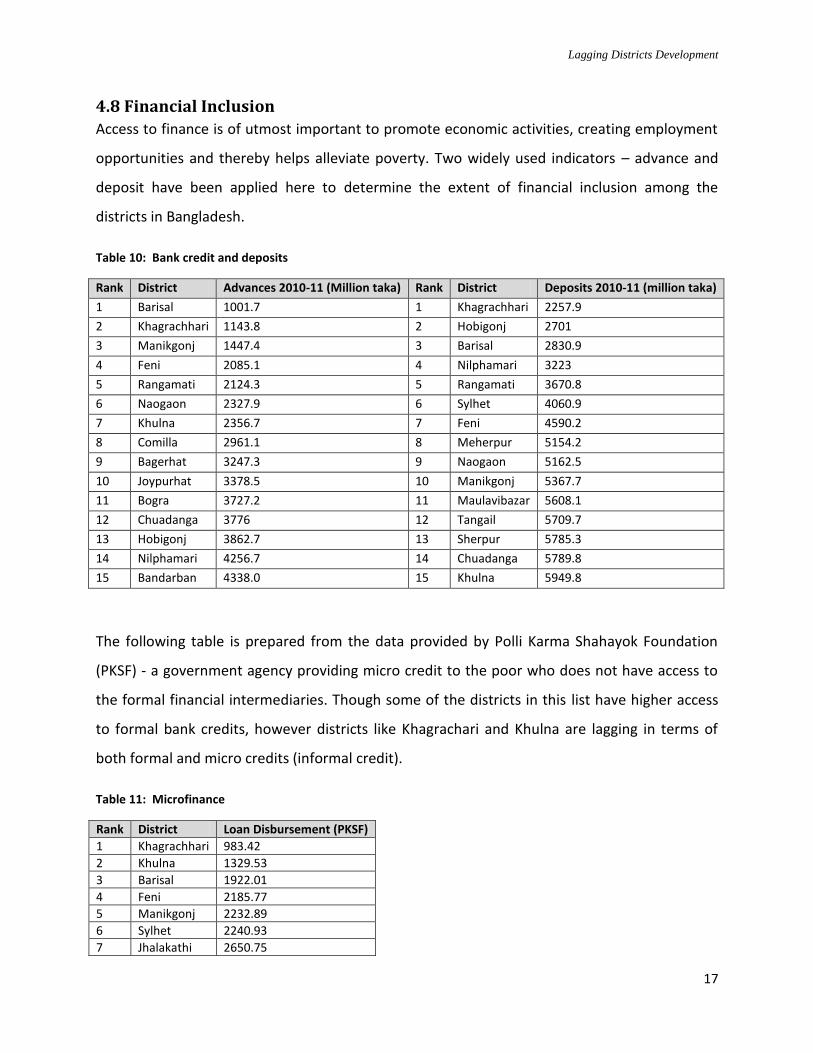
4.8 Financial Inclusion
Access to finance is of utmost important to promote economic activities, creating employment
opportunities and thereby helps alleviate poverty. Two widely used indicators – advance and
deposit have been applied here to determine the extent of financial inclusion among the
districts in Bangladesh.
Table 10: Bank credit and deposits
Rank District Advances 2010-11 (Million taka) Rank District Deposits 2010-11 (million taka)
1 Barisal 1001.7 1 Khagrachhari 2257.9
2 Khagrachhari 1143.8 2 Hobigonj 2701
3 Manikgonj 1447.4 3 Barisal 2830.9
4 Feni 2085.1 4 Nilphamari 3223
5 Rangamati 2124.3 5 Rangamati 3670.8
6 Naogaon 2327.9 6 Sylhet 4060.9
7 Khulna 2356.7 7 Feni 4590.2
8 Comilla 2961.1 8 Meherpur 5154.2
9 Bagerhat 3247.3 9 Naogaon 5162.5
10 Joypurhat 3378.5 10 Manikgonj 5367.7
11 Bogra 3727.2 11 Maulavibazar 5608.1
12 Chuadanga 3776 12 Tangail 5709.7
13 Hobigonj 3862.7 13 Sherpur 5785.3
14 Nilphamari 4256.7 14 Chuadanga 5789.8
15 Bandarban 4338.0 15 Khulna 5949.8
The following table is prepared from the data provided by Polli Karma Shahayok Foundation
(PKSF) - a government agency providing micro credit to the poor who does not have access to
the formal financial intermediaries. Though some of the districts in this list have higher access
to formal bank credits, however districts like Khagrachari and Khulna are lagging in terms of
both formal and micro credits (informal credit).
Table 11: Microfinance
Rank District Loan Disbursement (PKSF)
1 Khagrachhari 983.42
2 Khulna 1329.53
3 Barisal 1922.01
4 Feni 2185.77
5 Manikgonj 2232.89
6 Sylhet 2240.93
7 Jhalakathi 2650.75
Lagging Districts Development
18
Rank District Loan Disbursement (PKSF)
8 Meherpur 3887.91
9 Gazipur 4440.32
10 Thakurgaon 4548.45
11 Noakhali 4753.29
12 Joypurhat 4935.08
13 Chuadanga 4946.02
14 Rajshahi 5025.61
15 Bagerhat 5370.39
Source: (Polli Karma Shohyok Foundation , 2013)
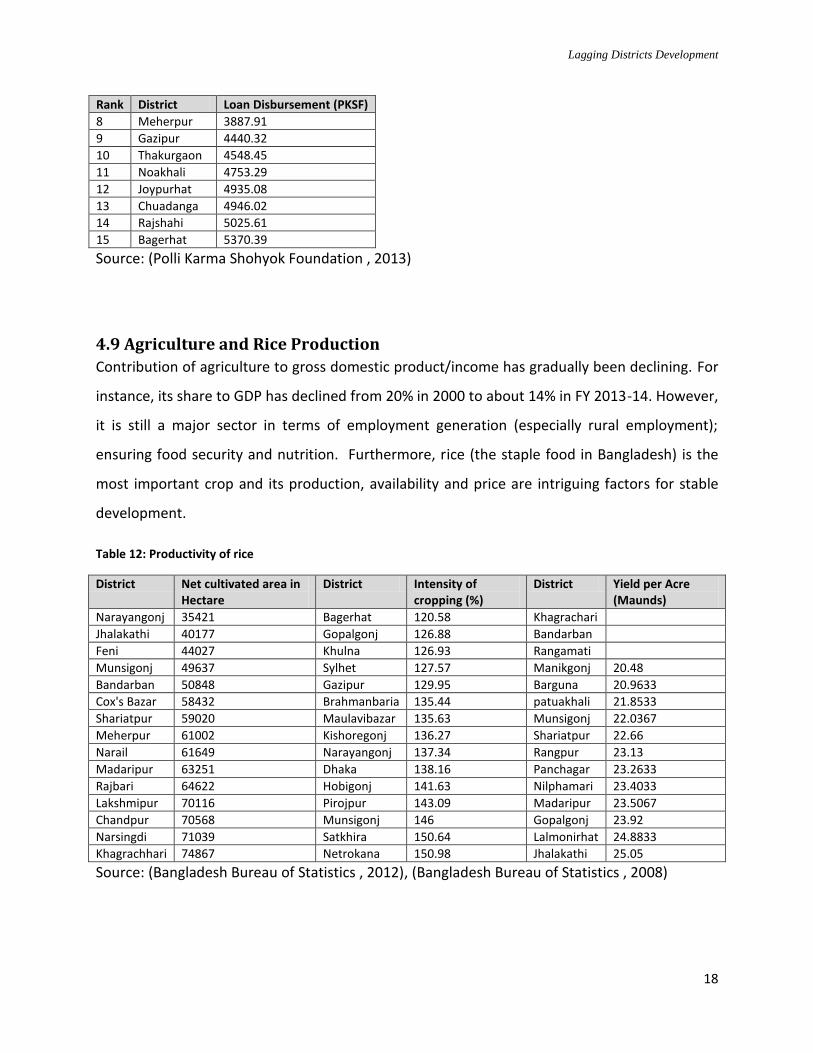
4.9 Agriculture and Rice Production
Contribution of agriculture to gross domestic product/income has gradually been declining. For
instance, its share to GDP has declined from 20% in 2000 to about 14% in FY 2013-14. However,
it is still a major sector in terms of employment generation (especially rural employment);
ensuring food security and nutrition. Furthermore, rice (the staple food in Bangladesh) is the
most important crop and its production, availability and price are intriguing factors for stable
development.
Table 12: Productivity of rice
District Net cultivated area in Hectare
District Intensity of cropping (%)
District Yield per Acre (Maunds)
Narayangonj 35421 Bagerhat 120.58 Khagrachari
Jhalakathi 40177 Gopalgonj 126.88 Bandarban
Feni 44027 Khulna 126.93 Rangamati
Munsigonj 49637 Sylhet 127.57 Manikgonj 20.48
Bandarban 50848 Gazipur 129.95 Barguna 20.9633
Cox's Bazar 58432 Brahmanbaria 135.44 patuakhali 21.8533
Shariatpur 59020 Maulavibazar 135.63 Munsigonj 22.0367
Meherpur 61002 Kishoregonj 136.27 Shariatpur 22.66
Narail 61649 Narayangonj 137.34 Rangpur 23.13
Madaripur 63251 Dhaka 138.16 Panchagar 23.2633
Rajbari 64622 Hobigonj 141.63 Nilphamari 23.4033
Lakshmipur 70116 Pirojpur 143.09 Madaripur 23.5067
Chandpur 70568 Munsigonj 146 Gopalgonj 23.92
Narsingdi 71039 Satkhira 150.64 Lalmonirhat 24.8833
Khagrachhari 74867 Netrokana 150.98 Jhalakathi 25.05
Source: (Bangladesh Bureau of Statistics , 2012), (Bangladesh Bureau of Statistics , 2008)
Lagging Districts Development
19
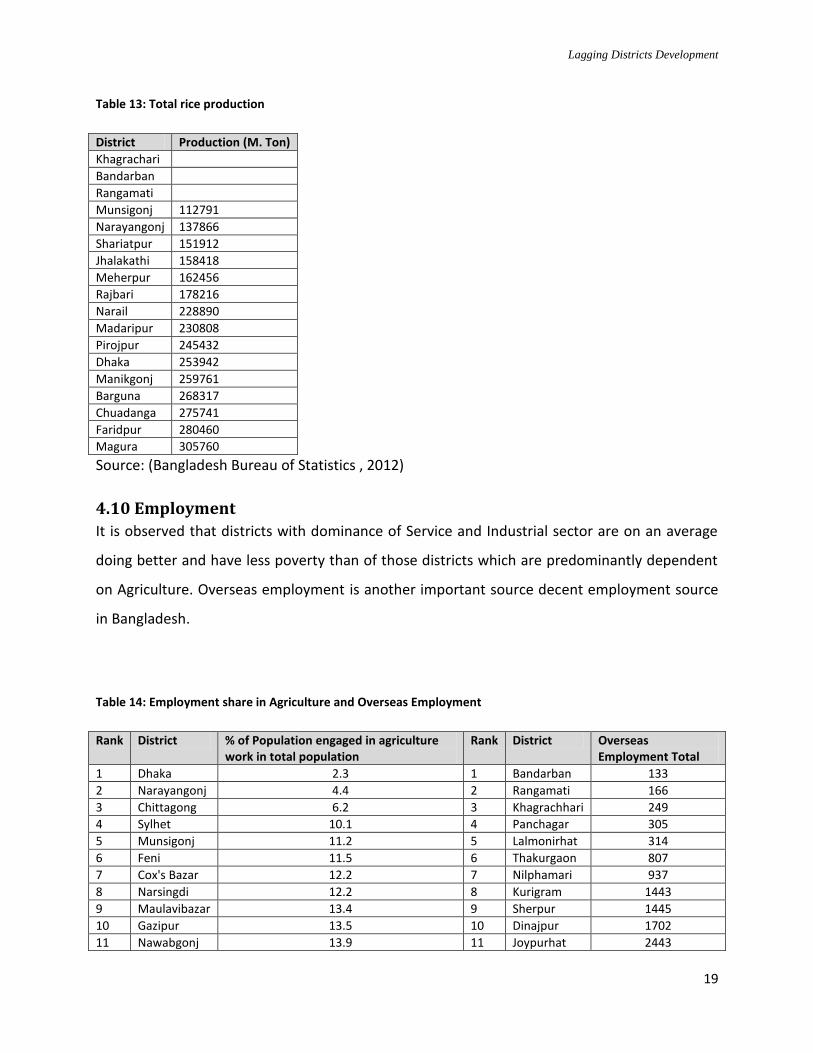
Table 13: Total rice production
Source: (Bangladesh Bureau of Statistics , 2012)
4.10 Employment
It is observed that districts with dominance of Service and Industrial sector are on an average
doing better and have less poverty than of those districts which are predominantly dependent
on Agriculture. Overseas employment is another important source decent employment source
in Bangladesh.
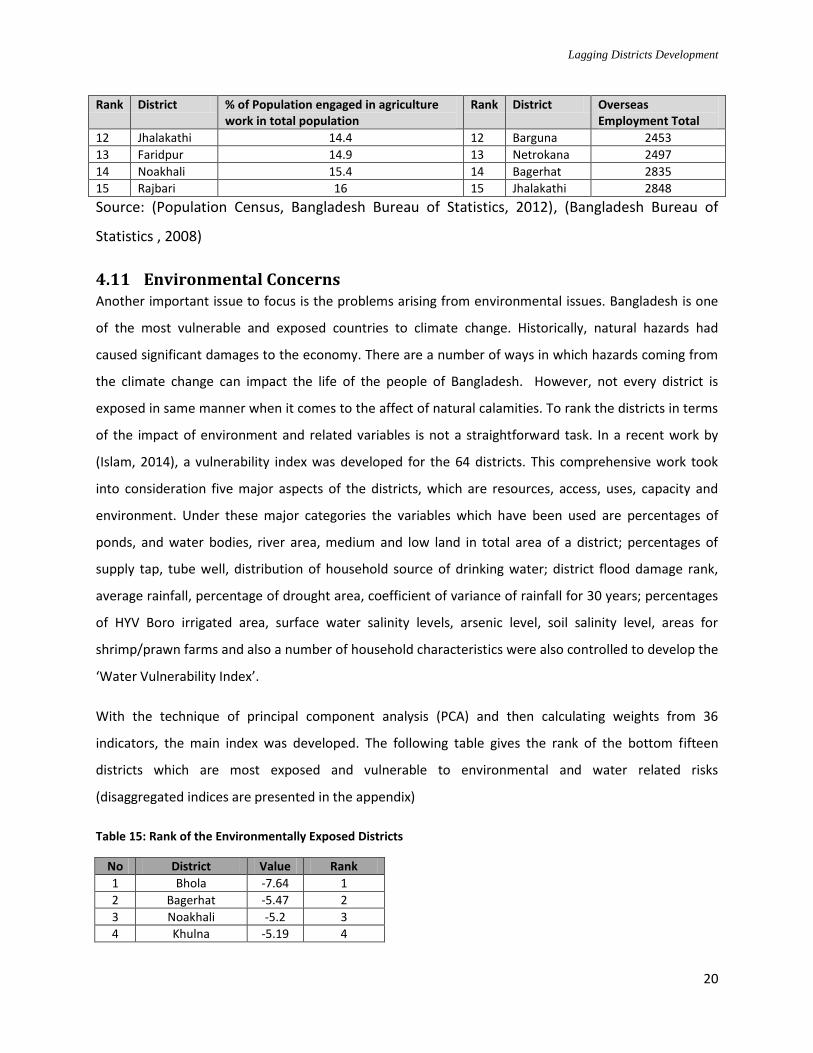
Table 14: Employment share in Agriculture and Overseas Employment
Rank District % of Population engaged in agriculture work in total population
Rank District Overseas Employment Total
1 Dhaka 2.3 1 Bandarban 133
2 Narayangonj 4.4 2 Rangamati 166
3 Chittagong 6.2 3 Khagrachhari 249
4 Sylhet 10.1 4 Panchagar 305
5 Munsigonj 11.2 5 Lalmonirhat 314
6 Feni 11.5 6 Thakurgaon 807
7 Cox's Bazar 12.2 7 Nilphamari 937
8 Narsingdi 12.2 8 Kurigram 1443
9 Maulavibazar 13.4 9 Sherpur 1445
10 Gazipur 13.5 10 Dinajpur 1702
11 Nawabgonj 13.9 11 Joypurhat 2443
District Production (M. Ton)
Khagrachari
Bandarban
Rangamati
Munsigonj 112791
Narayangonj 137866
Shariatpur 151912
Jhalakathi 158418
Meherpur 162456
Rajbari 178216
Narail 228890
Madaripur 230808
Pirojpur 245432
Dhaka 253942
Manikgonj 259761
Barguna 268317
Chuadanga 275741
Faridpur 280460
Magura 305760
Lagging Districts Development
20
Rank District % of Population engaged in agriculture work in total population
Rank District Overseas Employment Total
12 Jhalakathi 14.4 12 Barguna 2453
13 Faridpur 14.9 13 Netrokana 2497
14 Noakhali 15.4 14 Bagerhat 2835
15 Rajbari 16 15 Jhalakathi 2848
Source: (Population Census, Bangladesh Bureau of Statistics, 2012), (Bangladesh Bureau of
Statistics , 2008)
4.11 Environmental Concerns Another important issue to focus is the problems arising from environmental issues. Bangladesh is one
of the most vulnerable and exposed countries to climate change. Historically, natural hazards had
caused significant damages to the economy. There are a number of ways in which hazards coming from
the climate change can impact the life of the people of Bangladesh. However, not every district is
exposed in same manner when it comes to the affect of natural calamities. To rank the districts in terms
of the impact of environment and related variables is not a straightforward task. In a recent work by
(Islam, 2014), a vulnerability index was developed for the 64 districts. This comprehensive work took
into consideration five major aspects of the districts, which are resources, access, uses, capacity and
environment. Under these major categories the variables which have been used are percentages of
ponds, and water bodies, river area, medium and low land in total area of a district; percentages of
supply tap, tube well, distribution of household source of drinking water; district flood damage rank,
average rainfall, percentage of drought area, coefficient of variance of rainfall for 30 years; percentages
of HYV Boro irrigated area, surface water salinity levels, arsenic level, soil salinity level, areas for
shrimp/prawn farms and also a number of household characteristics were also controlled to develop the
‘Water Vulnerability Index’.
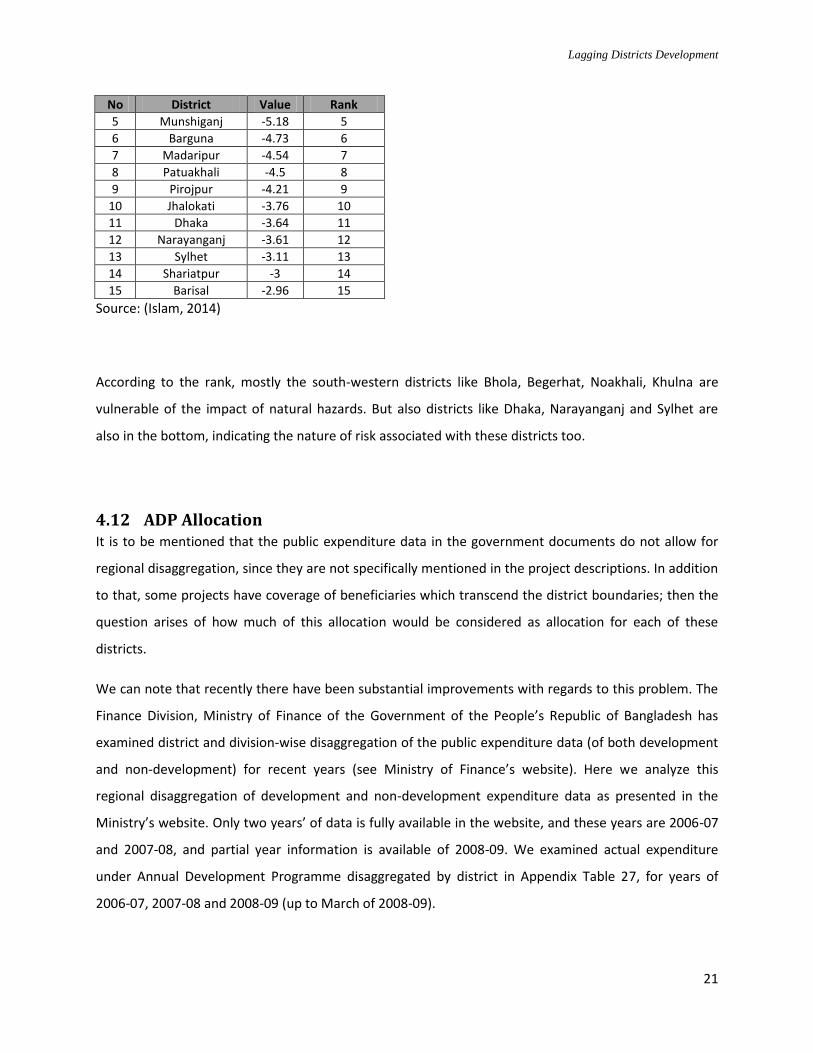
With the technique of principal component analysis (PCA) and then calculating weights from 36
indicators, the main index was developed. The following table gives the rank of the bottom fifteen
districts which are most exposed and vulnerable to environmental and water related risks
(disaggregated indices are presented in the appendix)
Table 15: Rank of the Environmentally Exposed Districts
No District Value Rank
1 Bhola -7.64 1
2 Bagerhat -5.47 2
3 Noakhali -5.2 3
4 Khulna -5.19 4
Lagging Districts Development
21
No District Value Rank
5 Munshiganj -5.18 5
6 Barguna -4.73 6
7 Madaripur -4.54 7
8 Patuakhali -4.5 8
9 Pirojpur -4.21 9
10 Jhalokati -3.76 10
11 Dhaka -3.64 11
12 Narayanganj -3.61 12
13 Sylhet -3.11 13
14 Shariatpur -3 14
15 Barisal -2.96 15
Source: (Islam, 2014)
According to the rank, mostly the south-western districts like Bhola, Begerhat, Noakhali, Khulna are
vulnerable of the impact of natural hazards. But also districts like Dhaka, Narayanganj and Sylhet are
also in the bottom, indicating the nature of risk associated with these districts too.
4.12 ADP Allocation It is to be mentioned that the public expenditure data in the government documents do not allow for
regional disaggregation, since they are not specifically mentioned in the project descriptions. In addition
to that, some projects have coverage of beneficiaries which transcend the district boundaries; then the
question arises of how much of this allocation would be considered as allocation for each of these
districts.
We can note that recently there have been substantial improvements with regards to this problem. The
Finance Division, Ministry of Finance of the Government of the People’s Republic of Bangladesh has
examined district and division-wise disaggregation of the public expenditure data (of both development
and non-development) for recent years (see Ministry of Finance’s website). Here we analyze this
regional disaggregation of development and non-development expenditure data as presented in the
Ministry’s website. Only two years’ of data is fully available in the website, and these years are 2006-07
and 2007-08, and partial year information is available of 2008-09. We examined actual expenditure
under Annual Development Programme disaggregated by district in Appendix Table 27, for years of
2006-07, 2007-08 and 2008-09 (up to March of 2008-09).
Lagging Districts Development
22
The lowest total amount of ADP in 2006-07 was spent for the district Chuadanga, and this was followed
by the districts of Jaipurhat, Thakurgaon, Narail, Magura and Rajbari. In terms of per capita figures,
Gaibandha is the lowest per capita ADP expenditure recipient district (with only 660 Taka per capita),
and this was followed by the districts of Thakurgaon, Chuadanga, Nilphamari, Rangpur and Mymensingh.
Now if we contrast this with the lowest total amount recipients’ list of 2007-08, we find Joypurhat,
Narail, Meherpur, Thakurgaon, Chuadanga and Rajbari; the lowest per capita ADP expenditure went to
the districts of Gaibandha, Thakurgaon, Dinajpur, Satkhira and Mymensingh. Again in 2008-09 the
lowest total amount went to the districts of Meherpur, Joypurhat, Thakurgaon, Narail and Chuadanga,
the lowest per capita ADP expenditure went to the districts of Thakurgaon, Jaipurhat, Dinajpur, Jessore
and Meherpur. We notice that there is a specific set of districts which is the lowest total as well as the
per capita ADP expenditure recipients. On the other side of the spectrum, there is also a common set of
districts, such as Bogra, Sylhet, Comilla, Chittagong and Dhaka which are often the highest total ADP
recipient districts. In terms of per capita ADP figures, this abovementioned list also includes less
populated districts such as Khagrachari, Bandarban and Rangamati.
There is a systematic pattern in this data set: the pattern is that generally the “lagging” districts are low
ADP expenditure recipients and the “advanced” districts are high ADP expenditure recipients, and this
pattern is observed within the time frame of the reference period. Therefore public investment
component is the annual budget to some extent is tilted towards the more advanced regions, and this
might aggravate the growth of the lagging district as well as regional disparity in the country.
In a recently completed study by BIDS on Upazila level development (Hossain & Mahzab, 2014) found
that the average allocation of the ADP to an Upazila is not high compared to Upazila’s total budget. The
study randomly chose 25 upazilas for primary survey to seek for the development needs of Upazilas and
found that on an average an upzaila’s annual budget is Taka 2,65,00,000. Among which 55% is coming
from the central government budget through ADP and the rest is mobilized from local tax and non-tax
sources by the Upazila Parishad (UP) itself. As from 2009, the government had a mandate to
strengthening local government for inclusive development. It is however important to understand the
mechanism in which Upazilas are planning their development programs. As UP has elected set of
representatives of the people of its area, it is very important that the government takes into
consideration the development needs coming from the UPs to formulate and allocate effective budget
to bolster their economic and social activities.
Lagging Districts Development
23
5. Principal Component Analysis
In the previous section we have identified the bottom fifteen districts by different selected
indicators. We have noted that according to the poverty rate the bottom fifteen districts are
not exactly same when analyzed the bottom fifteen districts in terms of Health, Education,
Infrastructure and Financial indicators. Using these 21 indicators, it is difficult to rank the
districts in terms of degree of deprivation. Hence, a principal component analysis (PCA) exercise
has been carried out using these indicators to derive a composite index for the districts.
Principal component analysis is appropriate when we can obtain measures on a number of
observed variables and wish to develop a smaller number of artificial variables (called principal
components) that will account for most of the variance in the observed variables. The principal
components may then be used as predictor or criterion variables in subsequent analyses.
Technically, a principal component can be defined as a linear combination of optimally-
weighted observed variables. In order to understand the meaning of this definition, it is
necessary to first describe how subject scores on a principal component are computed. In the
course of performing a principal component analysis, it is possible to calculate a score for each
subject on a given principal component. With a matrix algebra manipulation, this approach
creates a number of principal components such that the co variance or correlation among the
PCs will be zero (SAS, 2010)
PCA now has become an instrument in development research, with which ranking of a given
sample can be done effectively. As we get one or more principal component by using all the
necessary variables in question after post-estimation, we can rank the score of the component
generated though the principal component. As a result the districts in our concern can be
ranked from bottom to top in the context of overall deprivation from development.
Lagging Districts Development
24
5.2 Empirical Specification
Taking the principal component and then with post estimation, we obtained the rank of the 64
districts in terms of their well being (see appendix). We deliberately did not take poverty rate as
a variable here, as poverty is the outcome variable and it is technically right to develop the
index by using the exogenous variables which are influencing poverty thus welfare of districts.
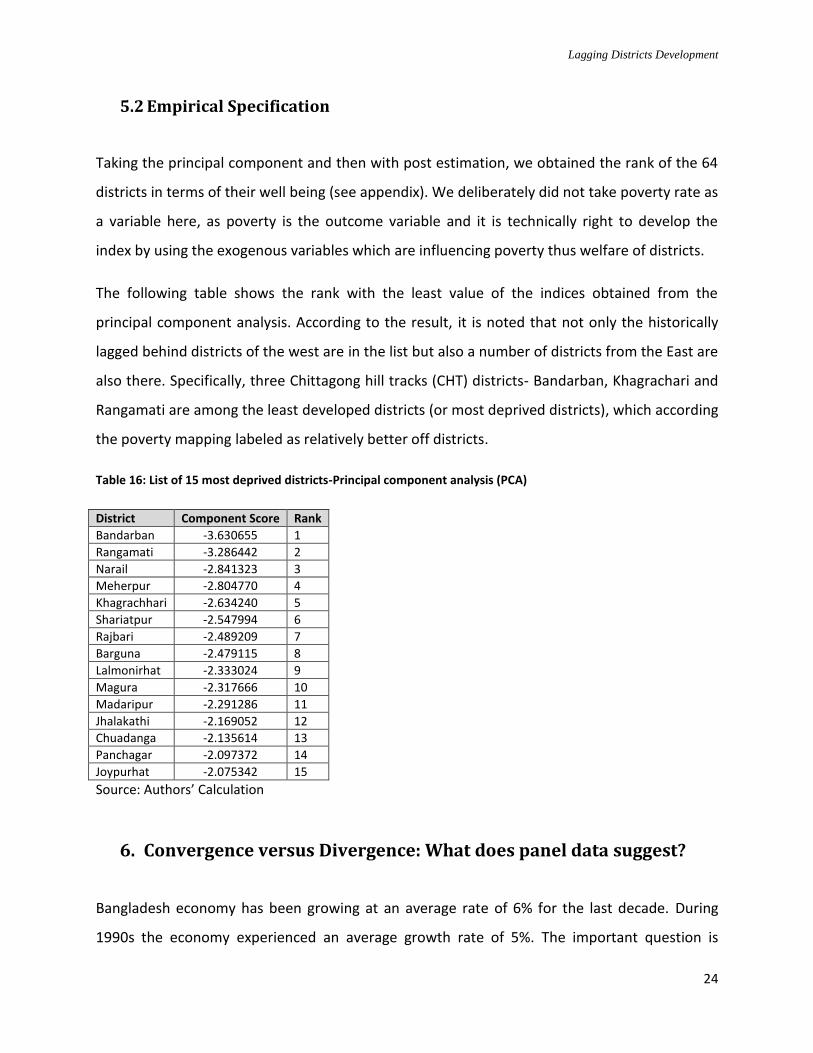
The following table shows the rank with the least value of the indices obtained from the
principal component analysis. According to the result, it is noted that not only the historically
lagged behind districts of the west are in the list but also a number of districts from the East are
also there. Specifically, three Chittagong hill tracks (CHT) districts- Bandarban, Khagrachari and
Rangamati are among the least developed districts (or most deprived districts), which according
the poverty mapping labeled as relatively better off districts.
Table 16: List of 15 most deprived districts-Principal component analysis (PCA)
District Component Score Rank
Bandarban -3.630655 1
Rangamati -3.286442 2
Narail -2.841323 3
Meherpur -2.804770 4
Khagrachhari -2.634240 5
Shariatpur -2.547994 6
Rajbari -2.489209 7
Barguna -2.479115 8
Lalmonirhat -2.333024 9
Magura -2.317666 10
Madaripur -2.291286 11
Jhalakathi -2.169052 12
Chuadanga -2.135614 13
Panchagar -2.097372 14
Joypurhat -2.075342 15
Source: Authors’ Calculation
6. Convergence versus Divergence: What does panel data suggest?
Bangladesh economy has been growing at an average rate of 6% for the last decade. During
1990s the economy experienced an average growth rate of 5%. The important question is
Lagging Districts Development
25
whether all the districts are equally benefitted from these sustained growth rates of 5% or 6%.
If all the districts are growing at the same rate or have same level of development then in the
long run all the districts should approach to a stationary value. It means they are converging
and the gap among those districts in terms of average income or expenditure is minimizing. In
other words, if the income or the expenditure of the districts is stationary in the long run it
means that the lagging districts are catching up with the progressive districts. Otherwise if they
are non-stationary in the long run then it means that the lagging districts or districts were
unable to catch up with the relatively developed districts. The application of the study of
divergence versus convergence will give a clear indication on the extent of district level
inequality and whether the extent of inequality would be increasing in the future in the
absence of intervention to tackle the divergence. These are crucial factors to understand before
pursuing macro policies for the development of the lagging districts.
6.1 Test of β-convergence
Before moving in to the long run analysis of convergence, it is customary to check the data for
the presence of Beta (β) convergence. The so called β-convergence is tested by applying the
(Barro & Sala-i-martin, 1991) regression, which involves the growth of per capita GDP and the
initial level of the GDP for a country. The idea of the presence of β-convergence is that the poor
regions grow faster than the rich region. But certainly it does not prove that in the long run it
will catch up with the richer regions. Here for our purpose, as mentioned earlier, it is not
advisable to use the income data from the HIES survey, so we used per capita consumption
expenditure to proxy for per capita income. We used the data of 64 districts over 4 points of
yearly data point to seek the presence β-convergence. So in our data, if we can find a negative
and significant relationship between the two variables, one can conclude about the presence of
β-convergence.
The following figure plot the average yearly growth of consumption expenditure of the 64
districts from 1995-2010 against the initial consumption expenditure. The figure clearly depicts
that the districts which had higher initial consumption expenditure in 1995, grew slower than
Lagging Districts Development
26
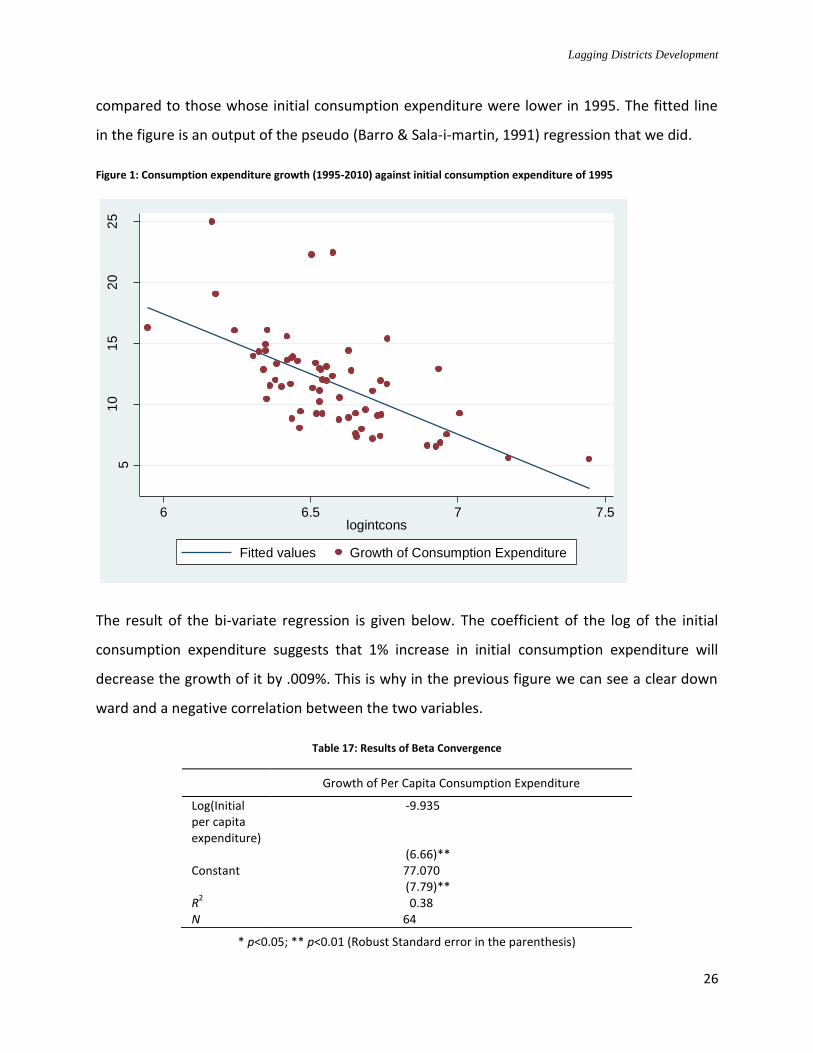
compared to those whose initial consumption expenditure were lower in 1995. The fitted line
in the figure is an output of the pseudo (Barro & Sala-i-martin, 1991) regression that we did.
Figure 1: Consumption expenditure growth (1995-2010) against initial consumption expenditure of 1995
The result of the bi-variate regression is given below. The coefficient of the log of the initial
consumption expenditure suggests that 1% increase in initial consumption expenditure will
decrease the growth of it by .009%. This is why in the previous figure we can see a clear down
ward and a negative correlation between the two variables.
Table 17: Results of Beta Convergence
Growth of Per Capita Consumption Expenditure
Log(Initial per capita expenditure)
-9.935
(6.66)** Constant 77.070 (7.79)** R
2 0.38
N 64
* p<0.05; ** p<0.01 (Robust Standard error in the parenthesis)
51
01
52
02
5
6 6.5 7 7.5logintcons
Fitted values Growth of Consumption Expenditure
Lagging Districts Development
27
However, the method of β-convergence is highly criticized in recent literature of convergence.
(Sala-i-martin, 1995), (Quah, 1993) and (Friedman, 1992) suggested that this kind of regression
would provide a biased estimation for β-convergence and actually it does not shed any light on
the question of equitability of income (here consumption) in the long run. As a result, (Sala-i-
martin, 1995) proposed a test for covariance of variation (known as Sigma convergence) of per
capita income to solve the biasness problem. Then there have been many developments of the
methods to study convergence and divergence of regions in terms of income. Due to the
structure and paucity of data, we actually could not perform a sigma convergence test directly.
Rather, we have used a more updated method of (Quah, 1993) to seek whether the districts in
terms of consumption expenditure (again used as proxy for income) are converging or diverging
to each other in the long run.
6.2 Long-run analysis of convergence
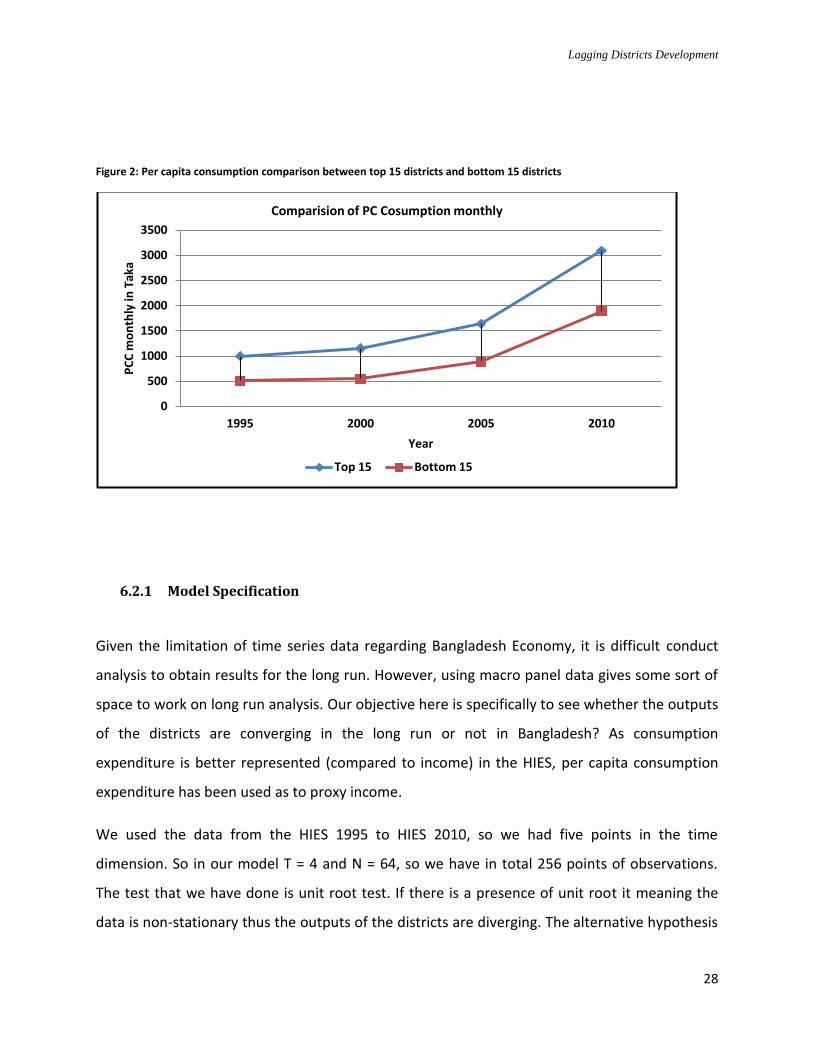
The following graph depicts the extent of inequality among districts. The blue line and the red
line show the monthly per capita consumption expenditure for the top 15 and bottom 15
districts respectively. Both groups are showing an increasing trend from 1995 in their respective
monthly per capita consumption expenditure. However, it is noted that the gap between this
two groups are widening overtime and became wider in the latest years e.g. in 2010. Now the
question is whether this divergence is significant or a short run phenomenon? Robust answer to
this question is difficult to ascertain with a data series of only 4 points and five-year
intervention. However, the following unit root test will give us an idea about their nature in the
long run without any intervention.
Following figure shows the divergence dynamics with regard to the per capita monthly
consumption expenditure between the top 15 and bottom 15 districts. The extent of
divergence has found to be widened between 2005 and 2010 compared to previous two five
years time periods. This observation suggests that without effective interventions, regional
(represented by districts) may increase in Bangladesh.
Lagging Districts Development
28
Figure 2: Per capita consumption comparison between top 15 districts and bottom 15 districts
6.2.1 Model Specification
Given the limitation of time series data regarding Bangladesh Economy, it is difficult conduct
analysis to obtain results for the long run. However, using macro panel data gives some sort of
space to work on long run analysis. Our objective here is specifically to see whether the outputs
of the districts are converging in the long run or not in Bangladesh? As consumption
expenditure is better represented (compared to income) in the HIES, per capita consumption
expenditure has been used as to proxy income.
We used the data from the HIES 1995 to HIES 2010, so we had five points in the time
dimension. So in our model T = 4 and N = 64, so we have in total 256 points of observations.
The test that we have done is unit root test. If there is a presence of unit root it meaning the
data is non-stationary thus the outputs of the districts are diverging. The alternative hypothesis
0
500
1000
1500
2000
2500
3000
3500
1995 2000 2005 2010
PC
C m
on
thly
in T
aka
Year
Comparision of PC Cosumption monthly
Top 15 Bottom 15
Lagging Districts Development
29
is that unit root is not present in the model thus there is a convergence of the data
asymptotically. To test the hypothesis, we used panel unit root tests of the Im, Pesaran, and
Shin (IPS) (2003) and Levin and Lin (2002).
Though for the IPS test, the rules of thumb is that we need at least six points of observation in
the time dimension. But because of the unavailability of such data we were not able to run the
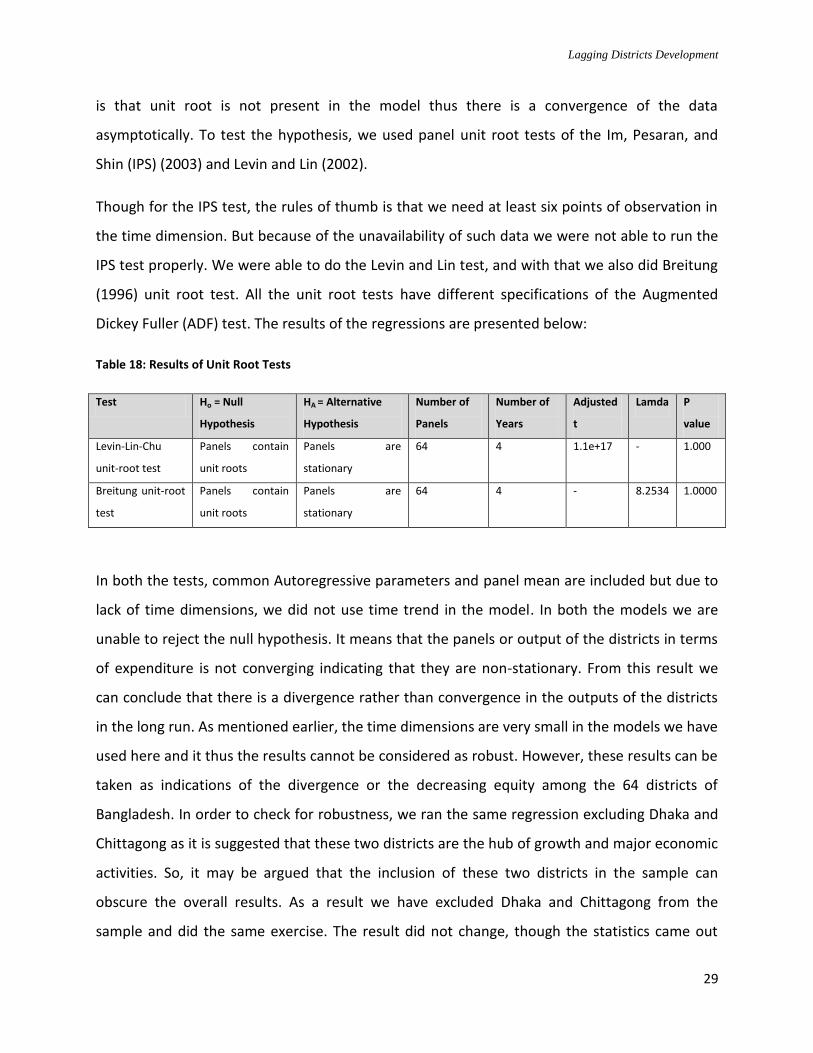
IPS test properly. We were able to do the Levin and Lin test, and with that we also did Breitung
(1996) unit root test. All the unit root tests have different specifications of the Augmented
Dickey Fuller (ADF) test. The results of the regressions are presented below:
Table 18: Results of Unit Root Tests
Test Ho = Null
Hypothesis
HA = Alternative
Hypothesis
Number of
Panels
Number of
Years
Adjusted
t
Lamda P
value
Levin-Lin-Chu
unit-root test
Panels contain
unit roots
Panels are
stationary
64 4 1.1e+17 - 1.000
Breitung unit-root
test
Panels contain
unit roots
Panels are
stationary
64 4 - 8.2534 1.0000
In both the tests, common Autoregressive parameters and panel mean are included but due to
lack of time dimensions, we did not use time trend in the model. In both the models we are
unable to reject the null hypothesis. It means that the panels or output of the districts in terms
of expenditure is not converging indicating that they are non-stationary. From this result we
can conclude that there is a divergence rather than convergence in the outputs of the districts
in the long run. As mentioned earlier, the time dimensions are very small in the models we have
used here and it thus the results cannot be considered as robust. However, these results can be
taken as indications of the divergence or the decreasing equity among the 64 districts of
Bangladesh. In order to check for robustness, we ran the same regression excluding Dhaka and
Chittagong as it is suggested that these two districts are the hub of growth and major economic
activities. So, it may be argued that the inclusion of these two districts in the sample can
obscure the overall results. As a result we have excluded Dhaka and Chittagong from the
sample and did the same exercise. The result did not change, though the statistics came out
Lagging Districts Development
30
weaker than the first round of regression with the complete set of districts; however the panel
series still remained non-stationary indicating non-convergence among the districts.
From results of both the convergence and divergence analysis, we can conclude that though
there is a presence of β-convergence but that does not imply a long-run convergence between
the districts. As we have seen the consumption growth is subsiding for the bottom districts, and
catching up process is not happening as it should be given the β-convergence.
7. Ordinary Least Squared Approach to seek factors behind Poverty
In this section, we applied cross-sectional OLS regressions to understand the factors influencing
poverty and their significance. However, to ask this questions micro-panel, consisting panel
data for few number of years would have been ideal. But again due to the limitation of data, we
opted for simple cross-sectional model. We could have developed a model based on the HIES
data of 2005 and 2010, but as mentioned earlier, harmonizing the variables that we want to use
for both the dataset is a big challenge and it would very hard to establish the robustness of the
results. And also the some of the explanatory variables we used in the regression is not
obtained from other sources (i.e. labor force survey, agricultural census), and those could not
be found exactly for the 2005 data. To develop a panel dataset for these two rounds of HIES
survey is possible but that would indeed call for a lots of effort and structuring the
specifications of the model will need an in depth analysis. For these limitations, we used data
from HIES 2010 and other sources to capture the cross-sectional dimensions of poverty across
the districts. However, as HIES is not representative of districts, rather it is for divisional level,
our results should be read with caution.
In our model, district-wise poverty rate is the dependent variable. We have used a number of
explanatory factors belonging to demography, health, education, infrastructure, employment
etc. to see whether they have any impact on poverty reduction.
These set of regressions by no means establish causality, as there is high chance of reverse
causality in these kinds of regressions. So, with these results we cannot say which way the
Lagging Districts Development
31
causality runs. Rather these results give us idea whether these variables have any significance
relationship with poverty or not. With the small sample size and limited data that we have, this
is the most we could do to see the relationship between poverty and other variables with an
OLS model. However, the results of the regression shed lights on the relative magnitude of
impact of different important variables on poverty reduction. This indeed will give the policy
makers some idea about which instrument is working better than other when it comes to
poverty reduction. Though all are not exogenous policy variables, still the story that the
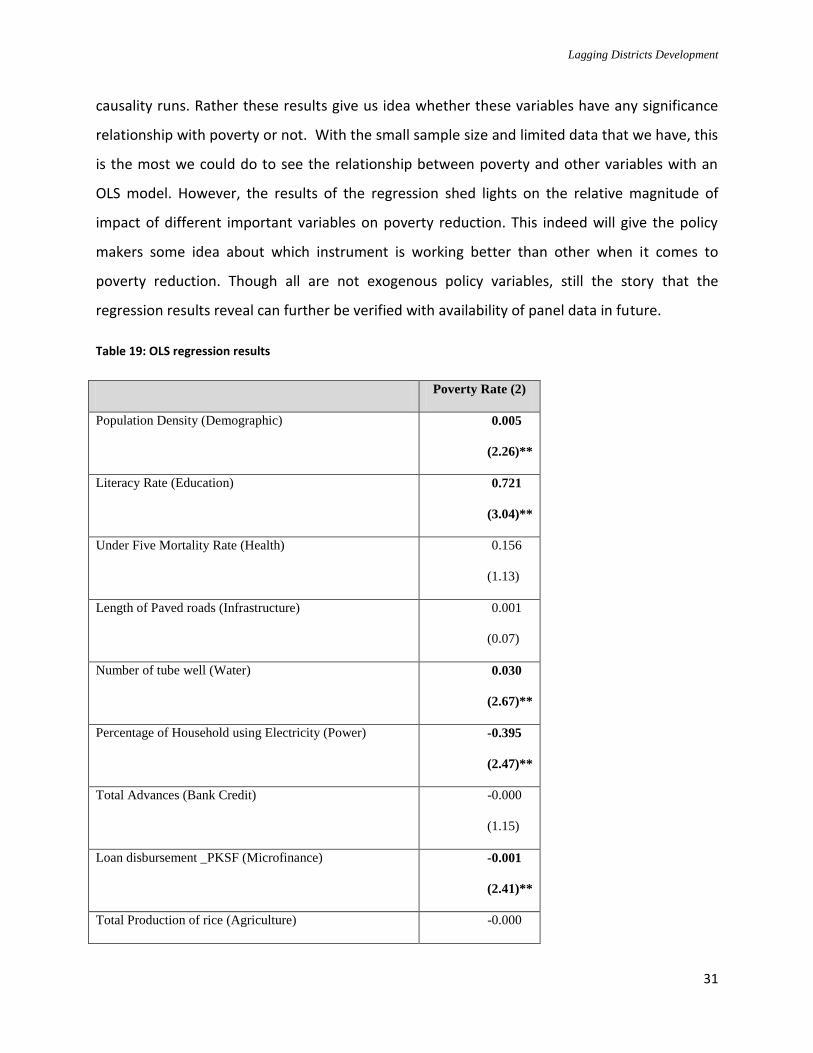
regression results reveal can further be verified with availability of panel data in future.
Table 19: OLS regression results
Poverty Rate (2)
Population Density (Demographic) 0.005
(2.26)**
Literacy Rate (Education) 0.721
(3.04)**
Under Five Mortality Rate (Health) 0.156
(1.13)
Length of Paved roads (Infrastructure) 0.001
(0.07)
Number of tube well (Water) 0.030
(2.67)**
Percentage of Household using Electricity (Power) -0.395
(2.47)**
Total Advances (Bank Credit) -0.000
(1.15)
Loan disbursement _PKSF (Microfinance) -0.001
(2.41)**
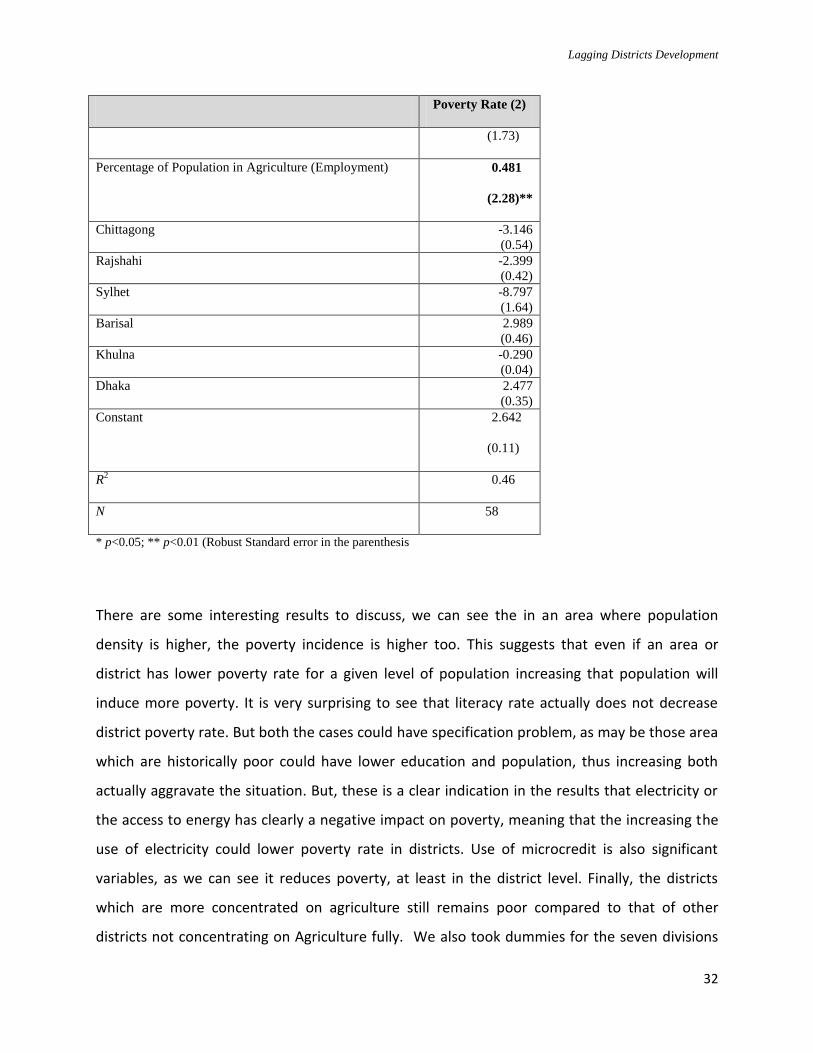
Total Production of rice (Agriculture) -0.000
Lagging Districts Development
32
Poverty Rate (2)
(1.73)
Percentage of Population in Agriculture (Employment) 0.481
(2.28)**
Chittagong -3.146
(0.54)
Rajshahi -2.399
(0.42)
Sylhet -8.797
(1.64)
Barisal 2.989
(0.46)
Khulna -0.290
(0.04)
Dhaka 2.477
(0.35)
Constant 2.642
(0.11)
R2 0.46
N 58
* p<0.05; ** p<0.01 (Robust Standard error in the parenthesis
There are some interesting results to discuss, we can see the in an area where population
density is higher, the poverty incidence is higher too. This suggests that even if an area or
district has lower poverty rate for a given level of population increasing that population will
induce more poverty. It is very surprising to see that literacy rate actually does not decrease
district poverty rate. But both the cases could have specification problem, as may be those area
which are historically poor could have lower education and population, thus increasing both
actually aggravate the situation. But, these is a clear indication in the results that electricity or
the access to energy has clearly a negative impact on poverty, meaning that the increasing the
use of electricity could lower poverty rate in districts. Use of microcredit is also significant
variables, as we can see it reduces poverty, at least in the district level. Finally, the districts
which are more concentrated on agriculture still remains poor compared to that of other
districts not concentrating on Agriculture fully. We also took dummies for the seven divisions
Lagging Districts Development
33
for controlling for the regional heterogeneity that might occur for geographical reason. Here
the benchmark category is Rangpur division. But most of the variables came out insignificant,
meaning controlling for other measures, geographical dimension is not creating extra poverty
pressure for the districts. However, there is a sharp contrast between poverty rates among the
divisions, for example Chittagong, Khulna, Rajshahi and Sylhet have lower poverty rate as a
division than that of Rangpur.
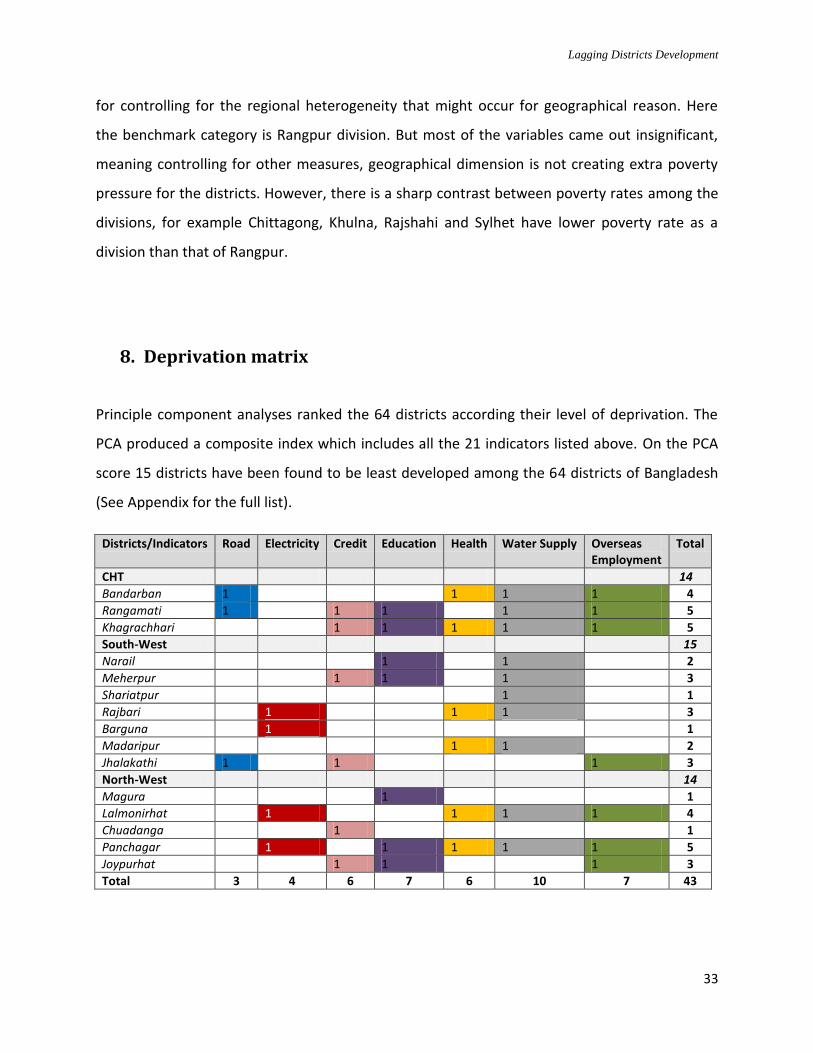
8. Deprivation matrix
Principle component analyses ranked the 64 districts according their level of deprivation. The
PCA produced a composite index which includes all the 21 indicators listed above. On the PCA
score 15 districts have been found to be least developed among the 64 districts of Bangladesh
(See Appendix for the full list).
Districts/Indicators Road Electricity Credit Education Health Water Supply Overseas Employment
Total
CHT 14
Bandarban 1 1 1 1 4
Rangamati 1 1 1 1 1 5
Khagrachhari 1 1 1 1 1 5
South-West 15
Narail 1 1 2
Meherpur 1 1 1 3
Shariatpur 1 1
Rajbari 1 1 1 3
Barguna 1 1
Madaripur 1 1 2
Jhalakathi 1 1 1 3
North-West 14
Magura 1 1
Lalmonirhat 1 1 1 1 4
Chuadanga 1 1
Panchagar 1 1 1 1 1 5
Joypurhat 1 1 1 3
Total 3 4 6 7 6 10 7 43
Lagging Districts Development
34
Out of these 15 districts, 3 belong to CHT region; 7 are from South-West region and rest 5
belongs to North-East region. The result suggests that although some of the districts are
regarded relatively better-off in terms of poverty measure, but most of them fall in the list of
most deprived districts according to the composite index.
Thus with the PCA rank, we have also came up with a deprivation matrix, which has been
constructed for the 15 bottom districts by the major indicators. The outcome of deprivation
matrix is shown above. The main observation is that there are 43 references of deprivation by
the 15 districts. Thus on average there is three areas where additional intervention may be
needed. The highest sited intervention area is water supply. Ten districts have reported to lack
water supply. Education and overseas employment has been identified as second most
deprived areas. Indeed, with the ranking of districts done using PCA and then sorting out the
lagging districts by employing the single indicators all together, give us a clear picture of the
districts which are lagging behind absolutely compared to other districts and also it enables us
to suggest specific policies for the dev elopement of those districts.
9. Conclusion and Policy recommendations
Above discussion identified a number of factors that have contributed to the district level
disparity in Bangladesh. Our discussion on various indicators revealed that the districts differ in
terms of outcomes of deprivations, most prominently in terms of consumption, infrastructure,
water, and education areas. It is also found that regional disparity may aggravate, over course
of economic growth, unless specific corrective measures are taken to reduce the gap among
districts. We believe this is a question of equity versus efficiency tradeoff in public policy. While
efficiency may suggest that private investments would concentrate in economically advanced
districts, and move away from laggard districts, on the other hand, equity requires that
standard of living and well-being of citizens in the laggard districts are not undermined because
of this. Public policy has a very important role to play in this situation. Through addressing
Lagging Districts Development
35
specific concerns of the laggard districts, and channeling public investments into these districts,
public policy can reduce the gap among the better off and deprived districts.
Our discussion leads to the conclusion that the regional disparity issue needs to be brought to
the forefront in the country’s policy making arena, and measures need to be taken to address
this issue. One plausible way this can be done is that a separate clause addressing regional
disparity in public investment projects as long as it is applicable. In addition to this, a separate
fund would have to be kept in the Annual Development Programme (ADP) for addressing this
regional (districts level) disparity issue. This would require additional fund for ADP expenditure,
and this additional fund is expected to be some reasonable percentage of overall ADP
expenditure (for example, this fund could be around 10% to 15% of overall ADP, but this one
would be in addition to the other regular ADP components, so that ADP itself will have to be
raised by 10% to 15%, such that the new ADP allocation including regional disparity fund would
be 110% - 115% of the original business-as-usual ADP allocation). The reason that we have
proposed 10%-15% fund is that per capita development expenditure in the laggard districts in
general have been found to be approximately around 15%-20% lower than the per capita
development expenditure in the more economically advanced districts. We are proposing that
per capita development expenditure has to be matched across all districts for the sake of
spatial equity and reduction of regional disparity. Thus we propose as principal, equal per capita
development expenditure for all, across advanced districts and laggard districts (to note that
there is an exception to the cases of large cities, such as Dhaka and Chittagong, where fixed
component requirements of large megaprojects may have to be implemented, so that per
capita allocation could be different from other areas). This additional 10-15% of ADP in excess
of business-as-usual allocation is required therefore to reduce the gap of per capita
development expenditure across economically active and laggard districts.
About the financing of this proposed special fund for addressing regional disparity (10%-15% of
ADP compared to the business-as-usual scenario), we would recommend that government
needs to mobilize this fund from domestic and external sources. Since the return to this
investment would be generated only in the medium to long term, the government has to incur
Lagging Districts Development
36
this cost for the sake of meeting the overall broad objective of an inclusive growth. An
alternative option is to cut down on the less effective sectors of ADP allocation, and bring the
fund to this special fund for laggard districts. This entails thorough research on examining ADP
expenditure and effectiveness indicators (if there is any), which is beyond the scope of this
current study. We would only suggest that it has been commonly perceived that not all ADP
allocations are bringing fruitful results, and it is about time to relocate funds with more
achievable and more focused targets and goals.
9.1 Narrowing Infrastructure Gap
Improvement of infrastructural facilities is one of the key interventions that can open the door
of economic opportunities in the lagging districts. Following measures are can be taken:
Communication system between the better off districts and lagging districts should be
improved in order to increase economic activities in the lagging districts. One of the major
communication projects, construction of Padma Bridge if completed is expected to open a
new door of opportunities for south-west region of the country. It should be realized that
such initiative is not enough of its own for the development of the laggard districts.
Supporting policy innervations are required to derive the fuller benefit of such massive
project.
Appropriate measures should be adopted for intensive utilization of Mongla port. Creating
export oriented industrial zone near to Mongla port can be considered along with its
international usage opportunities.
Supply of electricity should be increased in the lagging districts in priority basis since
development of manufacturing sector demands access to electricity supply. Construction of
gas transmission line to the laggard districts should be expedited.
Both inter district and intra district road communication system should be developed to
increase economic mobility within the laggard districts.
Storage facilities for agricultural and fisheries should be increased according to the demand
of such facilities in laggard districts where economic activities are mostly agricultural in
Lagging Districts Development
37
nature. Such facilities should be enhanced in the remote areas so that farmer gets most
benefit from such facilities.
Intensity of bank branches should be increased in the laggard divisions to increase financial
services for general people as well as investors of the districts.
Communication system in three hill districts should be developed to create economic
opportunities for these areas.
9.2 Manufacturing Opportunities in Lagging Districts
Manufacturing activity has to be promoted in the lagging districts. Since private investment has
less of an incentive to locate itself in the lagging districts, this process has to be implemented
with the help of government support at least in the initial stage.
Industrial policy should incorporate enough flexibility for investment in lagging districts.
Industrial zones should be established in lagging districts with all adequate infrastructural
facilities so that entrepreneurs can get benefit from economies of scale. Promulgation of
special incentive for prospective investors should proceed simultaneous to encourage faster
investment in this industrial park.
Small and medium enterprises should be encouraged with low cost financing facilities. Rate
of interest for bank finances should be lower in the laggard districts which will increase
investment,
Special fiscal incentive such as tax holidays should be offered for investment in lagging
districts.
9.3 Expanding Agriculture and Rural Economic Activities
Even though the share of agriculture in GDP is declining over time, still this is the focus point of
the rural economy. Special emphasis has to be given to development of agro-processing, non-
farm economic activities in the laggard districts. Following steps can be taken:
Rural areas of lagging districts should get special priority in agricultural credit disbursement
and agricultural subsidy program.

Lagging Districts Development
38
Microfinance institutions should be encourage to operate in poverty prone areas by
providing special incentives, e.g. providing fund to MFIs at low rate of interest if they
disburse this fund in poor districts.
Policy measures are required to attract microfinance in environmentally vulnerable areas
such as cyclone prone coastal areas, land logged and other flood prone areas and Monga
prone areas.
Non-farm economic activities should be promoted in the laggard districts through providing
training and financing facilities. Partnership building between the government and
MFIs/NGOs can play an important role in this regard.
Local government institutions such as Union Parishads should be strengthened to conduct
development activities of the government through these institutions.
9.4 Creating Opportunities for International Migration
The flow of remittance earnings is emerging as a crucial source of resources to improve local
economy. We notice that flow of remittance earnings is low towards the lagging districts, which
is causing further backwardness of these districts. Following measures need to be taken:
Number of migrants working abroad should be increased in lagging districts which receive
meager share of foreign remittances.
Technical and vocational training institutions should be established in the laggard districts
as per the demand of other countries.
Special financing scheme should be directed towards prospective migrants form laggard
districts.
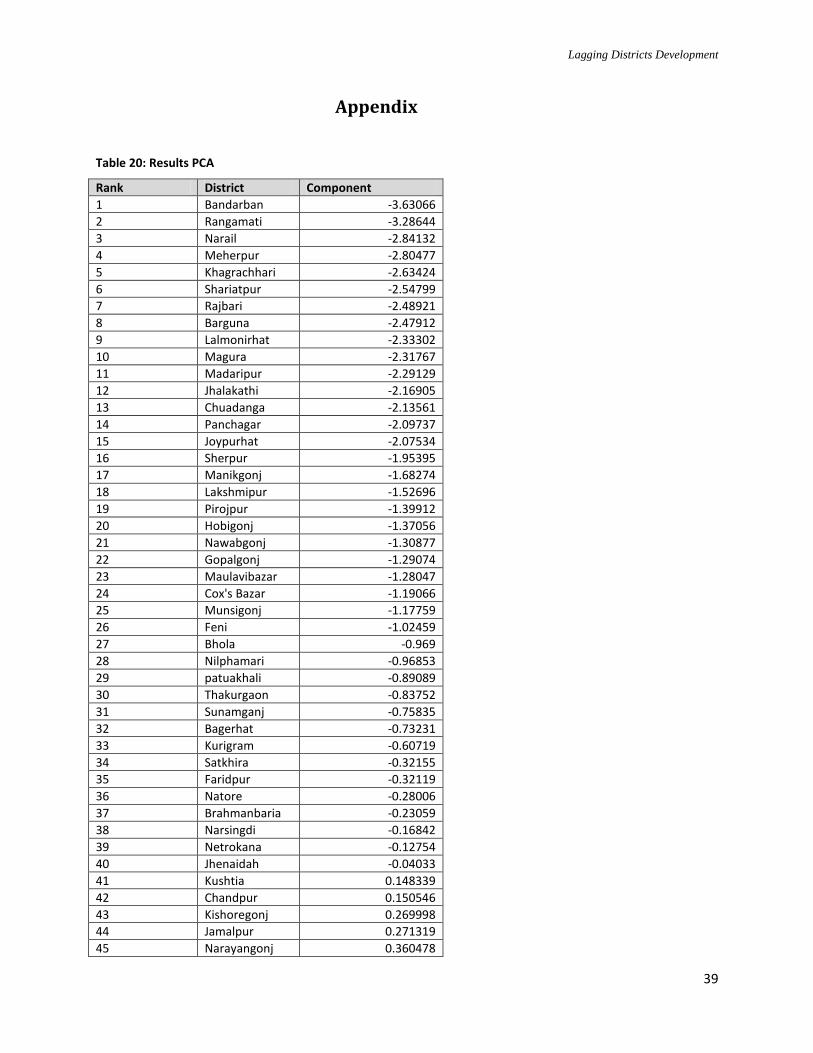
Lagging Districts Development
39
Appendix
Table 20: Results PCA
Rank District Component
1 Bandarban -3.63066
2 Rangamati -3.28644
3 Narail -2.84132
4 Meherpur -2.80477
5 Khagrachhari -2.63424
6 Shariatpur -2.54799
7 Rajbari -2.48921
8 Barguna -2.47912
9 Lalmonirhat -2.33302
10 Magura -2.31767
11 Madaripur -2.29129
12 Jhalakathi -2.16905
13 Chuadanga -2.13561
14 Panchagar -2.09737
15 Joypurhat -2.07534
16 Sherpur -1.95395
17 Manikgonj -1.68274
18 Lakshmipur -1.52696
19 Pirojpur -1.39912
20 Hobigonj -1.37056
21 Nawabgonj -1.30877
22 Gopalgonj -1.29074
23 Maulavibazar -1.28047
24 Cox's Bazar -1.19066
25 Munsigonj -1.17759
26 Feni -1.02459
27 Bhola -0.969
28 Nilphamari -0.96853
29 patuakhali -0.89089
30 Thakurgaon -0.83752
31 Sunamganj -0.75835
32 Bagerhat -0.73231
33 Kurigram -0.60719
34 Satkhira -0.32155
35 Faridpur -0.32119
36 Natore -0.28006
37 Brahmanbaria -0.23059
38 Narsingdi -0.16842
39 Netrokana -0.12754
40 Jhenaidah -0.04033
41 Kushtia 0.148339
42 Chandpur 0.150546
43 Kishoregonj 0.269998
44 Jamalpur 0.271319
45 Narayangonj 0.360478
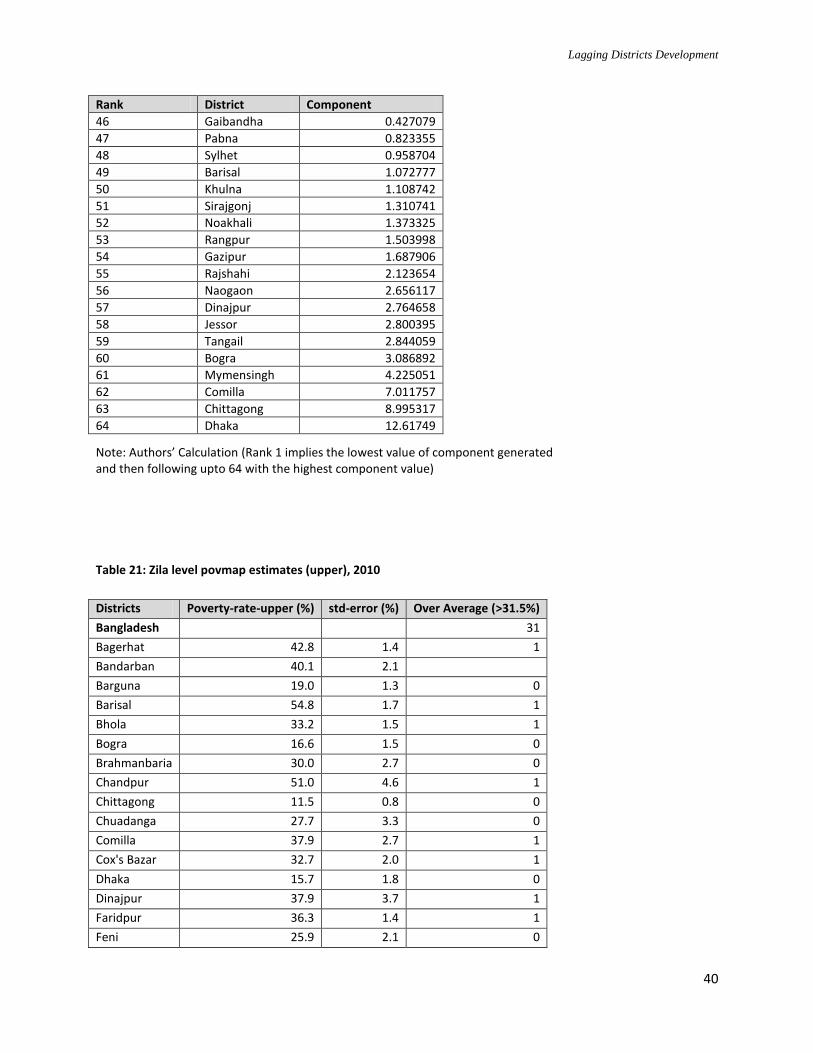
Lagging Districts Development
40
Rank District Component
46 Gaibandha 0.427079
47 Pabna 0.823355
48 Sylhet 0.958704
49 Barisal 1.072777
50 Khulna 1.108742
51 Sirajgonj 1.310741
52 Noakhali 1.373325
53 Rangpur 1.503998
54 Gazipur 1.687906
55 Rajshahi 2.123654
56 Naogaon 2.656117
57 Dinajpur 2.764658
58 Jessor 2.800395
59 Tangail 2.844059
60 Bogra 3.086892
61 Mymensingh 4.225051
62 Comilla 7.011757
63 Chittagong 8.995317
64 Dhaka 12.61749
Note: Authors’ Calculation (Rank 1 implies the lowest value of component generated and then following upto 64 with the highest component value)
Table 21: Zila level povmap estimates (upper), 2010
Districts Poverty-rate-upper (%) std-error (%) Over Average (>31.5%)
Bangladesh 31
Bagerhat 42.8 1.4 1
Bandarban 40.1 2.1
Barguna 19.0 1.3 0
Barisal 54.8 1.7 1
Bhola 33.2 1.5 1
Bogra 16.6 1.5 0
Brahmanbaria 30.0 2.7 0
Chandpur 51.0 4.6 1
Chittagong 11.5 0.8 0
Chuadanga 27.7 3.3 0
Comilla 37.9 2.7 1
Cox's Bazar 32.7 2.0 1
Dhaka 15.7 1.8 0
Dinajpur 37.9 3.7 1
Faridpur 36.3 1.4 1
Feni 25.9 2.1 0
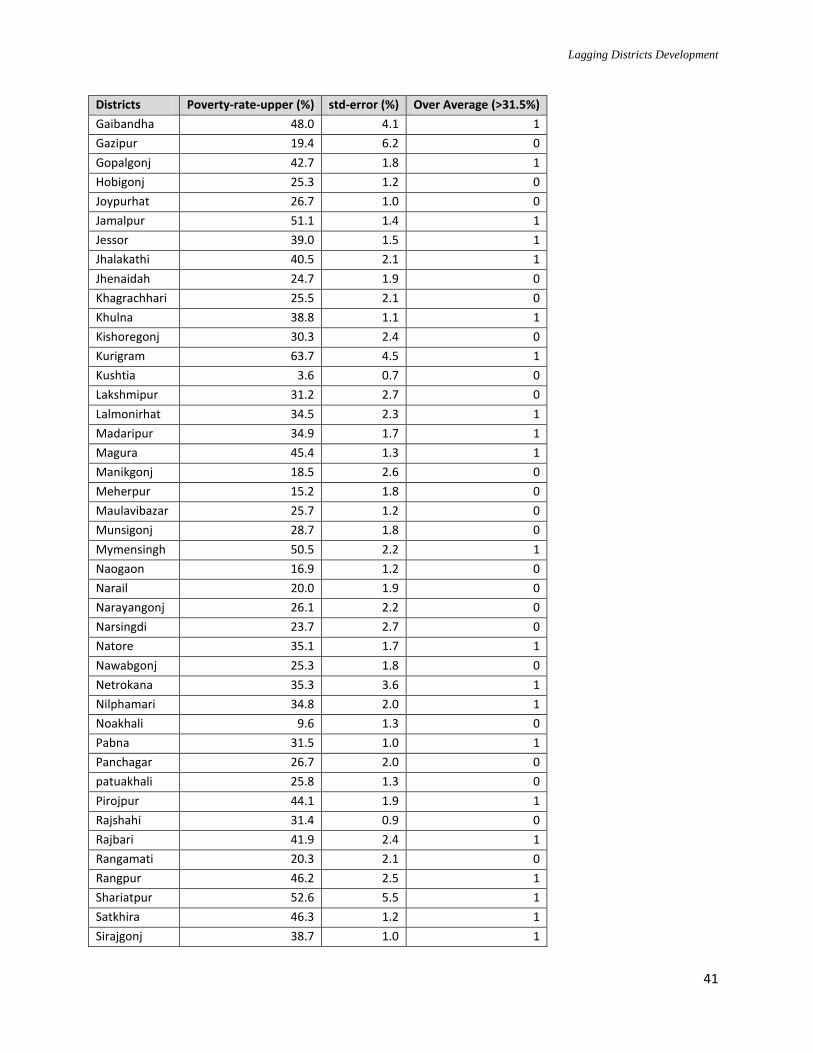
Lagging Districts Development
41
Districts Poverty-rate-upper (%) std-error (%) Over Average (>31.5%)
Gaibandha 48.0 4.1 1
Gazipur 19.4 6.2 0
Gopalgonj 42.7 1.8 1
Hobigonj 25.3 1.2 0
Joypurhat 26.7 1.0 0
Jamalpur 51.1 1.4 1
Jessor 39.0 1.5 1
Jhalakathi 40.5 2.1 1
Jhenaidah 24.7 1.9 0
Khagrachhari 25.5 2.1 0
Khulna 38.8 1.1 1
Kishoregonj 30.3 2.4 0
Kurigram 63.7 4.5 1
Kushtia 3.6 0.7 0
Lakshmipur 31.2 2.7 0
Lalmonirhat 34.5 2.3 1
Madaripur 34.9 1.7 1
Magura 45.4 1.3 1
Manikgonj 18.5 2.6 0
Meherpur 15.2 1.8 0
Maulavibazar 25.7 1.2 0
Munsigonj 28.7 1.8 0
Mymensingh 50.5 2.2 1
Naogaon 16.9 1.2 0
Narail 20.0 1.9 0
Narayangonj 26.1 2.2 0
Narsingdi 23.7 2.7 0
Natore 35.1 1.7 1
Nawabgonj 25.3 1.8 0
Netrokana 35.3 3.6 1
Nilphamari 34.8 2.0 1
Noakhali 9.6 1.3 0
Pabna 31.5 1.0 1
Panchagar 26.7 2.0 0
patuakhali 25.8 1.3 0
Pirojpur 44.1 1.9 1
Rajshahi 31.4 0.9 0
Rajbari 41.9 2.4 1
Rangamati 20.3 2.1 0
Rangpur 46.2 2.5 1
Shariatpur 52.6 5.5 1
Satkhira 46.3 1.2 1
Sirajgonj 38.7 1.0 1
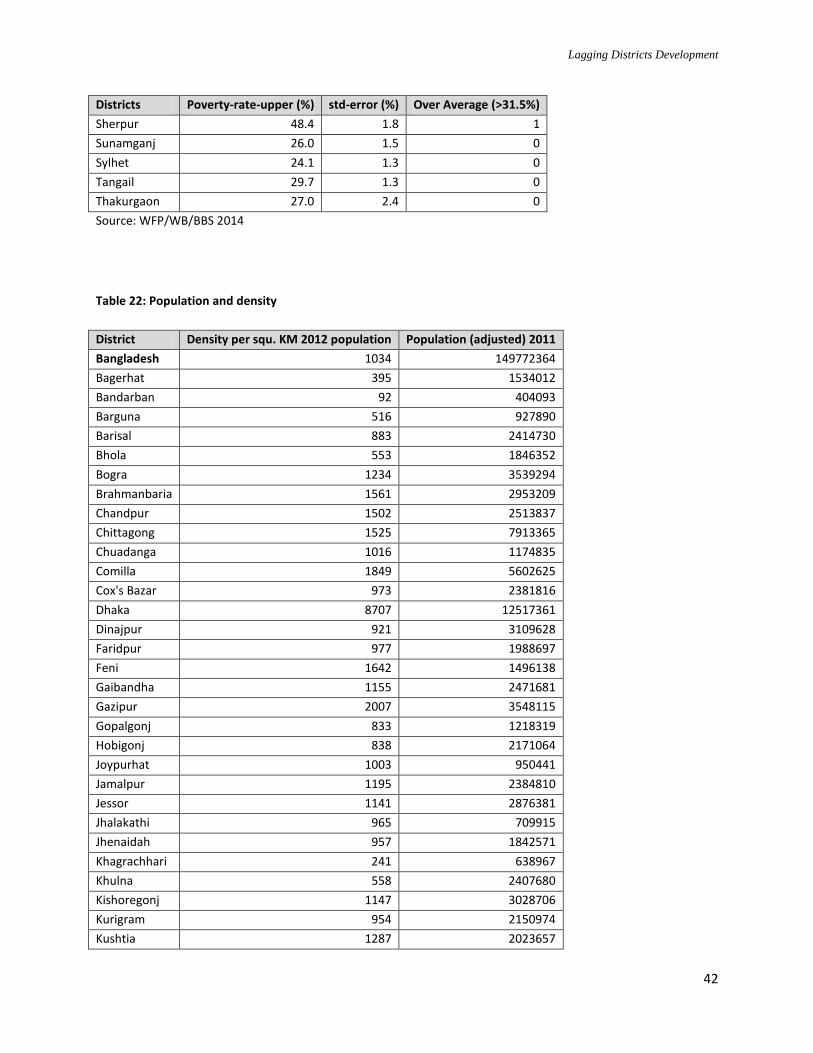
Lagging Districts Development
42
Districts Poverty-rate-upper (%) std-error (%) Over Average (>31.5%)
Sherpur 48.4 1.8 1
Sunamganj 26.0 1.5 0
Sylhet 24.1 1.3 0
Tangail 29.7 1.3 0
Thakurgaon 27.0 2.4 0
Source: WFP/WB/BBS 2014
Table 22: Population and density
District Density per squ. KM 2012 population Population (adjusted) 2011
Bangladesh 1034 149772364
Bagerhat 395 1534012
Bandarban 92 404093
Barguna 516 927890
Barisal 883 2414730
Bhola 553 1846352
Bogra 1234 3539294
Brahmanbaria 1561 2953209
Chandpur 1502 2513837
Chittagong 1525 7913365
Chuadanga 1016 1174835
Comilla 1849 5602625
Cox's Bazar 973 2381816
Dhaka 8707 12517361
Dinajpur 921 3109628
Faridpur 977 1988697
Feni 1642 1496138
Gaibandha 1155 2471681
Gazipur 2007 3548115
Gopalgonj 833 1218319
Hobigonj 838 2171064
Joypurhat 1003 950441
Jamalpur 1195 2384810
Jessor 1141 2876381
Jhalakathi 965 709915
Jhenaidah 957 1842571
Khagrachhari 241 638967
Khulna 558 2407680
Kishoregonj 1147 3028706
Kurigram 954 2150974
Kushtia 1287 2023657
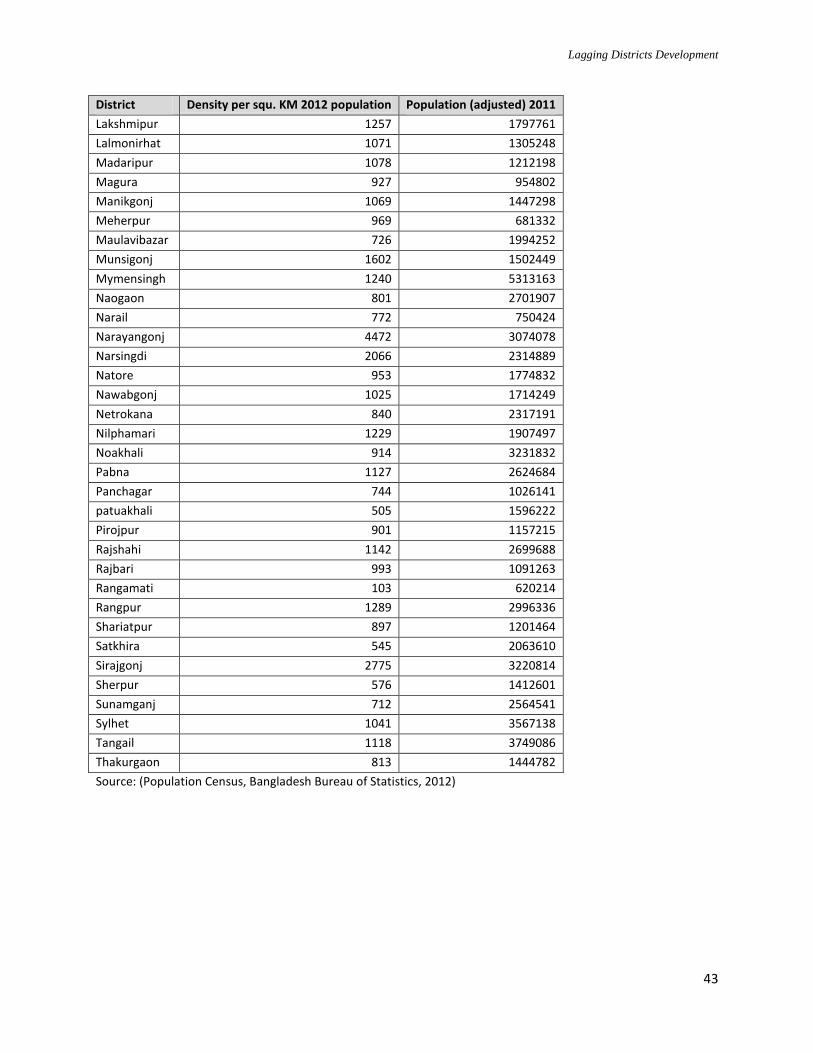
Lagging Districts Development
43
District Density per squ. KM 2012 population Population (adjusted) 2011
Lakshmipur 1257 1797761
Lalmonirhat 1071 1305248
Madaripur 1078 1212198
Magura 927 954802
Manikgonj 1069 1447298
Meherpur 969 681332
Maulavibazar 726 1994252
Munsigonj 1602 1502449
Mymensingh 1240 5313163
Naogaon 801 2701907
Narail 772 750424
Narayangonj 4472 3074078
Narsingdi 2066 2314889
Natore 953 1774832
Nawabgonj 1025 1714249
Netrokana 840 2317191
Nilphamari 1229 1907497
Noakhali 914 3231832
Pabna 1127 2624684
Panchagar 744 1026141
patuakhali 505 1596222
Pirojpur 901 1157215
Rajshahi 1142 2699688
Rajbari 993 1091263
Rangamati 103 620214
Rangpur 1289 2996336
Shariatpur 897 1201464
Satkhira 545 2063610
Sirajgonj 2775 3220814
Sherpur 576 1412601
Sunamganj 712 2564541
Sylhet 1041 3567138
Tangail 1118 3749086
Thakurgaon 813 1444782
Source: (Population Census, Bangladesh Bureau of Statistics, 2012)
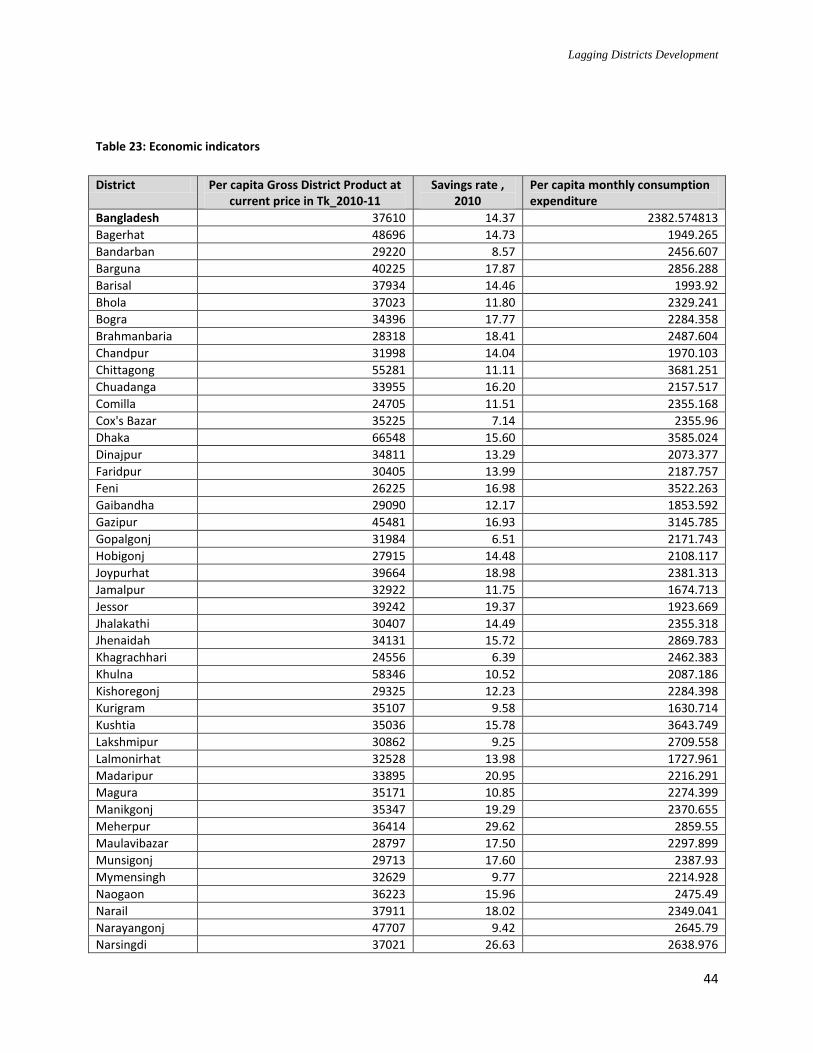
Lagging Districts Development
44
Table 23: Economic indicators
District Per capita Gross District Product at current price in Tk_2010-11
Savings rate , 2010
Per capita monthly consumption expenditure
Bangladesh 37610 14.37 2382.574813
Bagerhat 48696 14.73 1949.265
Bandarban 29220 8.57 2456.607
Barguna 40225 17.87 2856.288
Barisal 37934 14.46 1993.92
Bhola 37023 11.80 2329.241
Bogra 34396 17.77 2284.358
Brahmanbaria 28318 18.41 2487.604
Chandpur 31998 14.04 1970.103
Chittagong 55281 11.11 3681.251
Chuadanga 33955 16.20 2157.517
Comilla 24705 11.51 2355.168
Cox's Bazar 35225 7.14 2355.96
Dhaka 66548 15.60 3585.024
Dinajpur 34811 13.29 2073.377
Faridpur 30405 13.99 2187.757
Feni 26225 16.98 3522.263
Gaibandha 29090 12.17 1853.592
Gazipur 45481 16.93 3145.785
Gopalgonj 31984 6.51 2171.743
Hobigonj 27915 14.48 2108.117
Joypurhat 39664 18.98 2381.313
Jamalpur 32922 11.75 1674.713
Jessor 39242 19.37 1923.669
Jhalakathi 30407 14.49 2355.318
Jhenaidah 34131 15.72 2869.783
Khagrachhari 24556 6.39 2462.383
Khulna 58346 10.52 2087.186
Kishoregonj 29325 12.23 2284.398
Kurigram 35107 9.58 1630.714
Kushtia 35036 15.78 3643.749
Lakshmipur 30862 9.25 2709.558
Lalmonirhat 32528 13.98 1727.961
Madaripur 33895 20.95 2216.291
Magura 35171 10.85 2274.399
Manikgonj 35347 19.29 2370.655
Meherpur 36414 29.62 2859.55
Maulavibazar 28797 17.50 2297.899
Munsigonj 29713 17.60 2387.93
Mymensingh 32629 9.77 2214.928
Naogaon 36223 15.96 2475.49
Narail 37911 18.02 2349.041
Narayangonj 47707 9.42 2645.79
Narsingdi 37021 26.63 2638.976
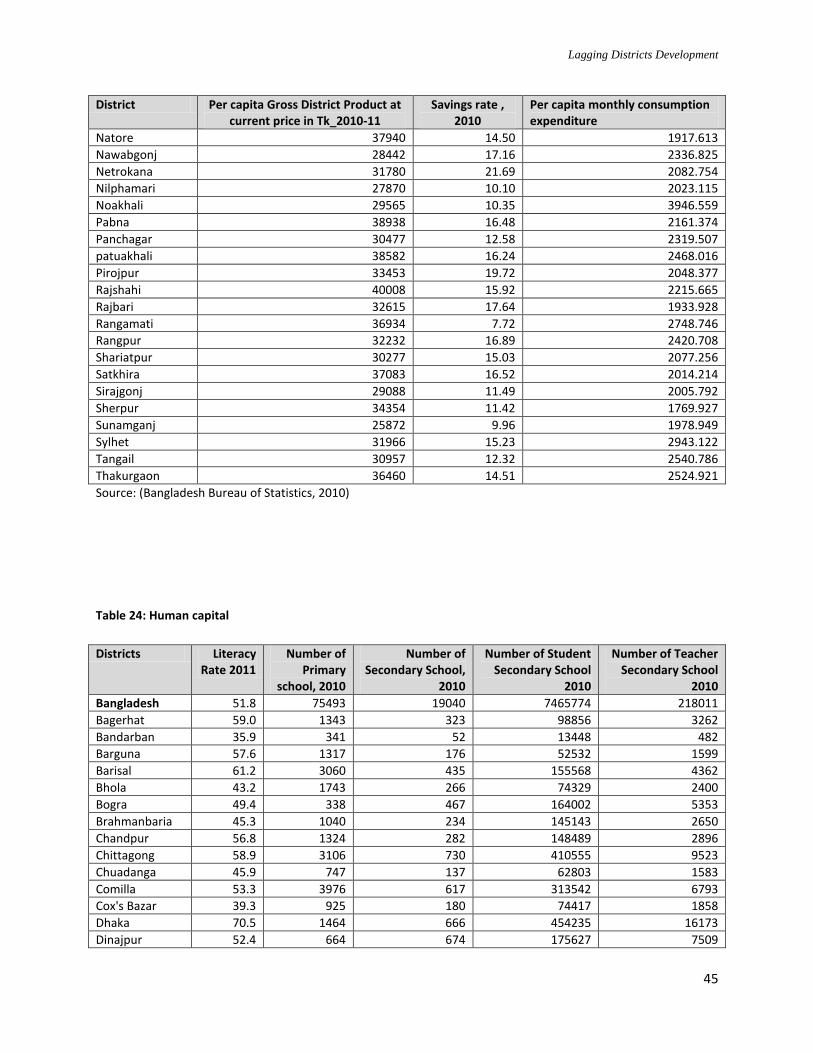
Lagging Districts Development
45
District Per capita Gross District Product at current price in Tk_2010-11
Savings rate , 2010
Per capita monthly consumption expenditure
Natore 37940 14.50 1917.613
Nawabgonj 28442 17.16 2336.825
Netrokana 31780 21.69 2082.754
Nilphamari 27870 10.10 2023.115
Noakhali 29565 10.35 3946.559
Pabna 38938 16.48 2161.374
Panchagar 30477 12.58 2319.507
patuakhali 38582 16.24 2468.016
Pirojpur 33453 19.72 2048.377
Rajshahi 40008 15.92 2215.665
Rajbari 32615 17.64 1933.928
Rangamati 36934 7.72 2748.746
Rangpur 32232 16.89 2420.708
Shariatpur 30277 15.03 2077.256
Satkhira 37083 16.52 2014.214
Sirajgonj 29088 11.49 2005.792
Sherpur 34354 11.42 1769.927
Sunamganj 25872 9.96 1978.949
Sylhet 31966 15.23 2943.122
Tangail 30957 12.32 2540.786
Thakurgaon 36460 14.51 2524.921
Source: (Bangladesh Bureau of Statistics, 2010)
Table 24: Human capital
Districts Literacy Rate 2011
Number of Primary
school, 2010
Number of Secondary School,
2010
Number of Student Secondary School
2010
Number of Teacher Secondary School
2010
Bangladesh 51.8 75493 19040 7465774 218011
Bagerhat 59.0 1343 323 98856 3262
Bandarban 35.9 341 52 13448 482
Barguna 57.6 1317 176 52532 1599
Barisal 61.2 3060 435 155568 4362
Bhola 43.2 1743 266 74329 2400
Bogra 49.4 338 467 164002 5353
Brahmanbaria 45.3 1040 234 145143 2650
Chandpur 56.8 1324 282 148489 2896
Chittagong 58.9 3106 730 410555 9523
Chuadanga 45.9 747 137 62803 1583
Comilla 53.3 3976 617 313542 6793
Cox's Bazar 39.3 925 180 74417 1858
Dhaka 70.5 1464 666 454235 16173
Dinajpur 52.4 664 674 175627 7509
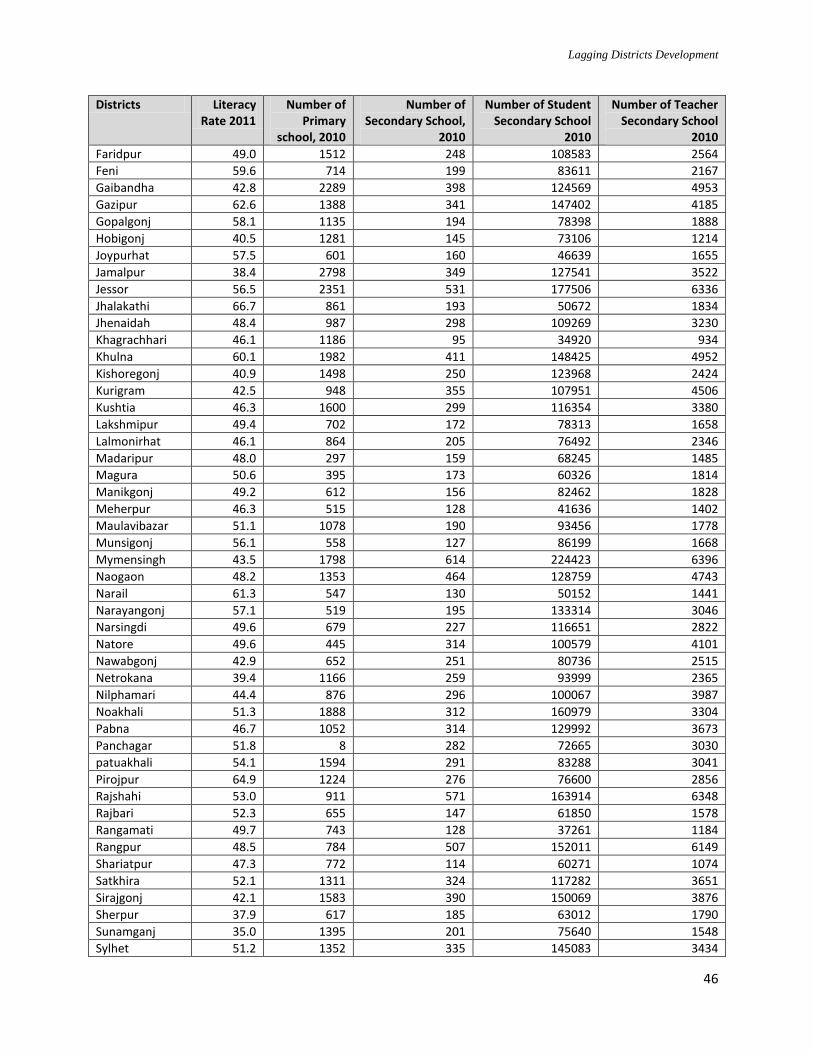
Lagging Districts Development
46
Districts Literacy Rate 2011
Number of Primary
school, 2010
Number of Secondary School,
2010
Number of Student Secondary School
2010
Number of Teacher Secondary School
2010
Faridpur 49.0 1512 248 108583 2564
Feni 59.6 714 199 83611 2167
Gaibandha 42.8 2289 398 124569 4953
Gazipur 62.6 1388 341 147402 4185
Gopalgonj 58.1 1135 194 78398 1888
Hobigonj 40.5 1281 145 73106 1214
Joypurhat 57.5 601 160 46639 1655
Jamalpur 38.4 2798 349 127541 3522
Jessor 56.5 2351 531 177506 6336
Jhalakathi 66.7 861 193 50672 1834
Jhenaidah 48.4 987 298 109269 3230
Khagrachhari 46.1 1186 95 34920 934
Khulna 60.1 1982 411 148425 4952
Kishoregonj 40.9 1498 250 123968 2424
Kurigram 42.5 948 355 107951 4506
Kushtia 46.3 1600 299 116354 3380
Lakshmipur 49.4 702 172 78313 1658
Lalmonirhat 46.1 864 205 76492 2346
Madaripur 48.0 297 159 68245 1485
Magura 50.6 395 173 60326 1814
Manikgonj 49.2 612 156 82462 1828
Meherpur 46.3 515 128 41636 1402
Maulavibazar 51.1 1078 190 93456 1778
Munsigonj 56.1 558 127 86199 1668
Mymensingh 43.5 1798 614 224423 6396
Naogaon 48.2 1353 464 128759 4743
Narail 61.3 547 130 50152 1441
Narayangonj 57.1 519 195 133314 3046
Narsingdi 49.6 679 227 116651 2822
Natore 49.6 445 314 100579 4101
Nawabgonj 42.9 652 251 80736 2515
Netrokana 39.4 1166 259 93999 2365
Nilphamari 44.4 876 296 100067 3987
Noakhali 51.3 1888 312 160979 3304
Pabna 46.7 1052 314 129992 3673
Panchagar 51.8 8 282 72665 3030
patuakhali 54.1 1594 291 83288 3041
Pirojpur 64.9 1224 276 76600 2856
Rajshahi 53.0 911 571 163914 6348
Rajbari 52.3 655 147 61850 1578
Rangamati 49.7 743 128 37261 1184
Rangpur 48.5 784 507 152011 6149
Shariatpur 47.3 772 114 60271 1074
Satkhira 52.1 1311 324 117282 3651
Sirajgonj 42.1 1583 390 150069 3876
Sherpur 37.9 617 185 63012 1790
Sunamganj 35.0 1395 201 75640 1548
Sylhet 51.2 1352 335 145083 3434
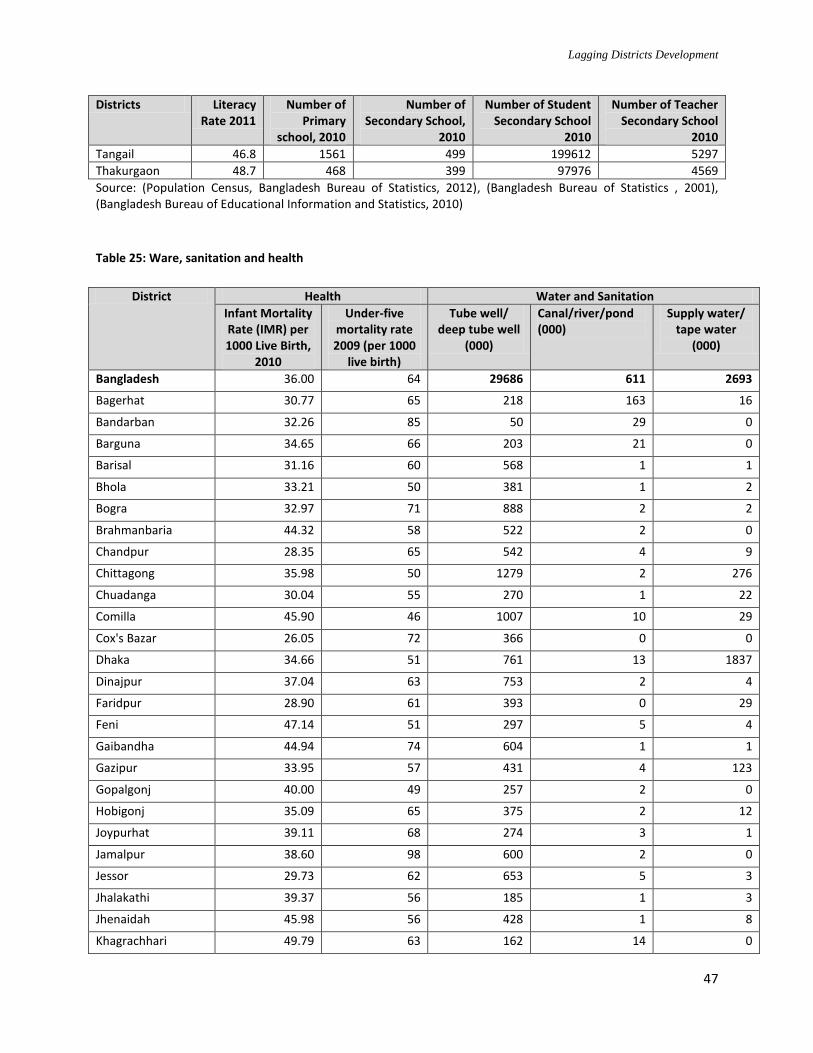
Lagging Districts Development
47
Districts Literacy Rate 2011
Number of Primary
school, 2010
Number of Secondary School,
2010
Number of Student Secondary School
2010
Number of Teacher Secondary School
2010
Tangail 46.8 1561 499 199612 5297
Thakurgaon 48.7 468 399 97976 4569
Source: (Population Census, Bangladesh Bureau of Statistics, 2012), (Bangladesh Bureau of Statistics , 2001), (Bangladesh Bureau of Educational Information and Statistics, 2010)
Table 25: Ware, sanitation and health
District Health Water and Sanitation
Infant Mortality Rate (IMR) per 1000 Live Birth,
2010
Under-five mortality rate 2009 (per 1000
live birth)
Tube well/ deep tube well
(000)
Canal/river/pond (000)
Supply water/ tape water
(000)
Bangladesh 36.00 64 29686 611 2693
Bagerhat 30.77 65 218 163 16
Bandarban 32.26 85 50 29 0
Barguna 34.65 66 203 21 0
Barisal 31.16 60 568 1 1
Bhola 33.21 50 381 1 2
Bogra 32.97 71 888 2 2
Brahmanbaria 44.32 58 522 2 0
Chandpur 28.35 65 542 4 9
Chittagong 35.98 50 1279 2 276
Chuadanga 30.04 55 270 1 22
Comilla 45.90 46 1007 10 29
Cox's Bazar 26.05 72 366 0 0
Dhaka 34.66 51 761 13 1837
Dinajpur 37.04 63 753 2 4
Faridpur 28.90 61 393 0 29
Feni 47.14 51 297 5 4
Gaibandha 44.94 74 604 1 1
Gazipur 33.95 57 431 4 123
Gopalgonj 40.00 49 257 2 0
Hobigonj 35.09 65 375 2 12
Joypurhat 39.11 68 274 3 1
Jamalpur 38.60 98 600 2 0
Jessor 29.73 62 653 5 3
Jhalakathi 39.37 56 185 1 3
Jhenaidah 45.98 56 428 1 8
Khagrachhari 49.79 63 162 14 0
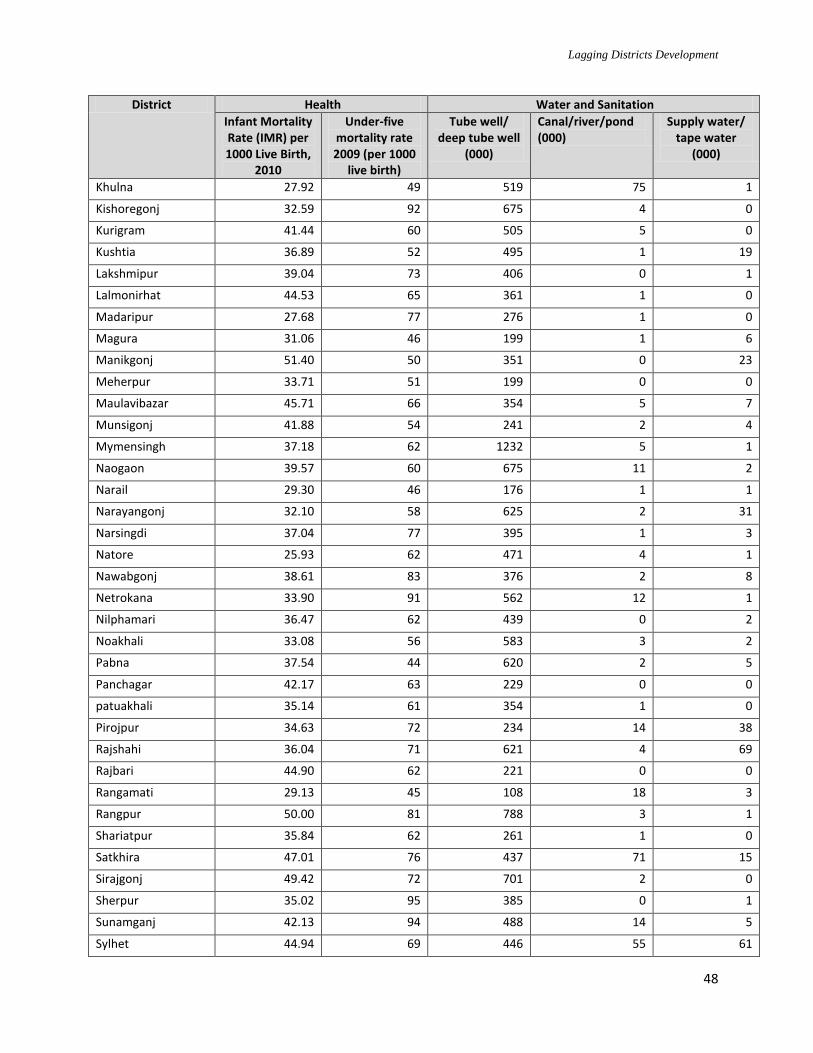
Lagging Districts Development
48
District Health Water and Sanitation
Infant Mortality Rate (IMR) per 1000 Live Birth,
2010
Under-five mortality rate 2009 (per 1000
live birth)
Tube well/ deep tube well
(000)
Canal/river/pond (000)
Supply water/ tape water
(000)
Khulna 27.92 49 519 75 1
Kishoregonj 32.59 92 675 4 0
Kurigram 41.44 60 505 5 0
Kushtia 36.89 52 495 1 19
Lakshmipur 39.04 73 406 0 1
Lalmonirhat 44.53 65 361 1 0
Madaripur 27.68 77 276 1 0
Magura 31.06 46 199 1 6
Manikgonj 51.40 50 351 0 23
Meherpur 33.71 51 199 0 0
Maulavibazar 45.71 66 354 5 7
Munsigonj 41.88 54 241 2 4
Mymensingh 37.18 62 1232 5 1
Naogaon 39.57 60 675 11 2
Narail 29.30 46 176 1 1
Narayangonj 32.10 58 625 2 31
Narsingdi 37.04 77 395 1 3
Natore 25.93 62 471 4 1
Nawabgonj 38.61 83 376 2 8
Netrokana 33.90 91 562 12 1
Nilphamari 36.47 62 439 0 2
Noakhali 33.08 56 583 3 2
Pabna 37.54 44 620 2 5
Panchagar 42.17 63 229 0 0
patuakhali 35.14 61 354 1 0
Pirojpur 34.63 72 234 14 38
Rajshahi 36.04 71 621 4 69
Rajbari 44.90 62 221 0 0
Rangamati 29.13 45 108 18 3
Rangpur 50.00 81 788 3 1
Shariatpur 35.84 62 261 1 0
Satkhira 47.01 76 437 71 15
Sirajgonj 49.42 72 701 2 0
Sherpur 35.02 95 385 0 1
Sunamganj 42.13 94 488 14 5
Sylhet 44.94 69 446 55 61
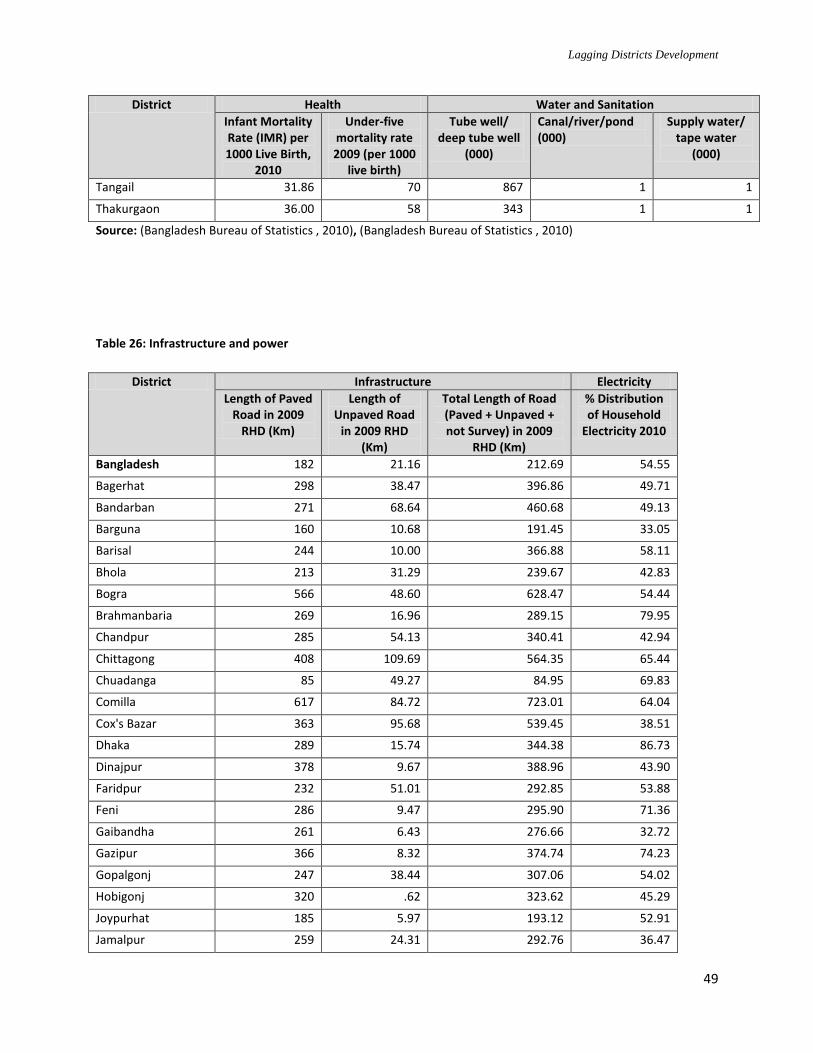
Lagging Districts Development
49
District Health Water and Sanitation
Infant Mortality Rate (IMR) per 1000 Live Birth,
2010
Under-five mortality rate 2009 (per 1000
live birth)
Tube well/ deep tube well
(000)
Canal/river/pond (000)
Supply water/ tape water
(000)
Tangail 31.86 70 867 1 1
Thakurgaon 36.00 58 343 1 1
Source: (Bangladesh Bureau of Statistics , 2010), (Bangladesh Bureau of Statistics , 2010)
Table 26: Infrastructure and power
District Infrastructure Electricity
Length of Paved Road in 2009
RHD (Km)
Length of Unpaved Road
in 2009 RHD (Km)
Total Length of Road (Paved + Unpaved + not Survey) in 2009
RHD (Km)
% Distribution of Household
Electricity 2010
Bangladesh 182 21.16 212.69 54.55
Bagerhat 298 38.47 396.86 49.71
Bandarban 271 68.64 460.68 49.13
Barguna 160 10.68 191.45 33.05
Barisal 244 10.00 366.88 58.11
Bhola 213 31.29 239.67 42.83
Bogra 566 48.60 628.47 54.44
Brahmanbaria 269 16.96 289.15 79.95
Chandpur 285 54.13 340.41 42.94
Chittagong 408 109.69 564.35 65.44
Chuadanga 85 49.27 84.95 69.83
Comilla 617 84.72 723.01 64.04
Cox's Bazar 363 95.68 539.45 38.51
Dhaka 289 15.74 344.38 86.73
Dinajpur 378 9.67 388.96 43.90
Faridpur 232 51.01 292.85 53.88
Feni 286 9.47 295.90 71.36
Gaibandha 261 6.43 276.66 32.72
Gazipur 366 8.32 374.74 74.23
Gopalgonj 247 38.44 307.06 54.02
Hobigonj 320 .62 323.62 45.29
Joypurhat 185 5.97 193.12 52.91
Jamalpur 259 24.31 292.76 36.47
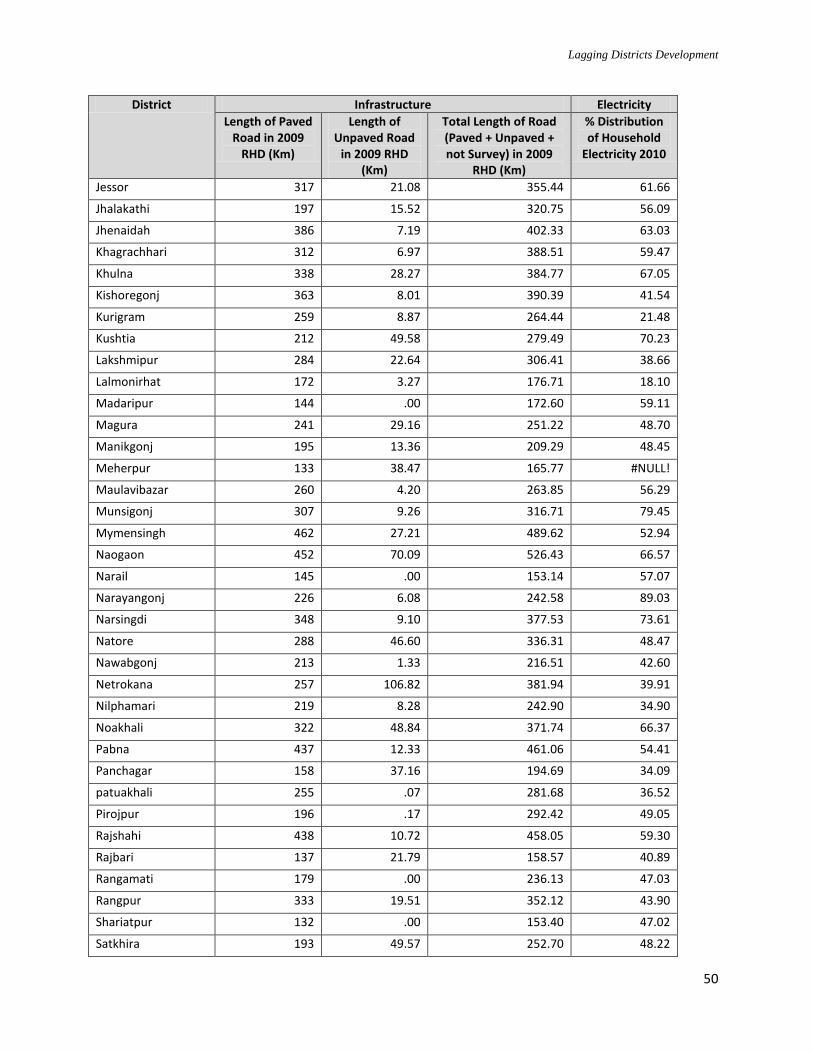
Lagging Districts Development
50
District Infrastructure Electricity
Length of Paved Road in 2009
RHD (Km)
Length of Unpaved Road
in 2009 RHD (Km)
Total Length of Road (Paved + Unpaved + not Survey) in 2009
RHD (Km)
% Distribution of Household
Electricity 2010
Jessor 317 21.08 355.44 61.66
Jhalakathi 197 15.52 320.75 56.09
Jhenaidah 386 7.19 402.33 63.03
Khagrachhari 312 6.97 388.51 59.47
Khulna 338 28.27 384.77 67.05
Kishoregonj 363 8.01 390.39 41.54
Kurigram 259 8.87 264.44 21.48
Kushtia 212 49.58 279.49 70.23
Lakshmipur 284 22.64 306.41 38.66
Lalmonirhat 172 3.27 176.71 18.10
Madaripur 144 .00 172.60 59.11
Magura 241 29.16 251.22 48.70
Manikgonj 195 13.36 209.29 48.45
Meherpur 133 38.47 165.77 #NULL!
Maulavibazar 260 4.20 263.85 56.29
Munsigonj 307 9.26 316.71 79.45
Mymensingh 462 27.21 489.62 52.94
Naogaon 452 70.09 526.43 66.57
Narail 145 .00 153.14 57.07
Narayangonj 226 6.08 242.58 89.03
Narsingdi 348 9.10 377.53 73.61
Natore 288 46.60 336.31 48.47
Nawabgonj 213 1.33 216.51 42.60
Netrokana 257 106.82 381.94 39.91
Nilphamari 219 8.28 242.90 34.90
Noakhali 322 48.84 371.74 66.37
Pabna 437 12.33 461.06 54.41
Panchagar 158 37.16 194.69 34.09
patuakhali 255 .07 281.68 36.52
Pirojpur 196 .17 292.42 49.05
Rajshahi 438 10.72 458.05 59.30
Rajbari 137 21.79 158.57 40.89
Rangamati 179 .00 236.13 47.03
Rangpur 333 19.51 352.12 43.90
Shariatpur 132 .00 153.40 47.02
Satkhira 193 49.57 252.70 48.22
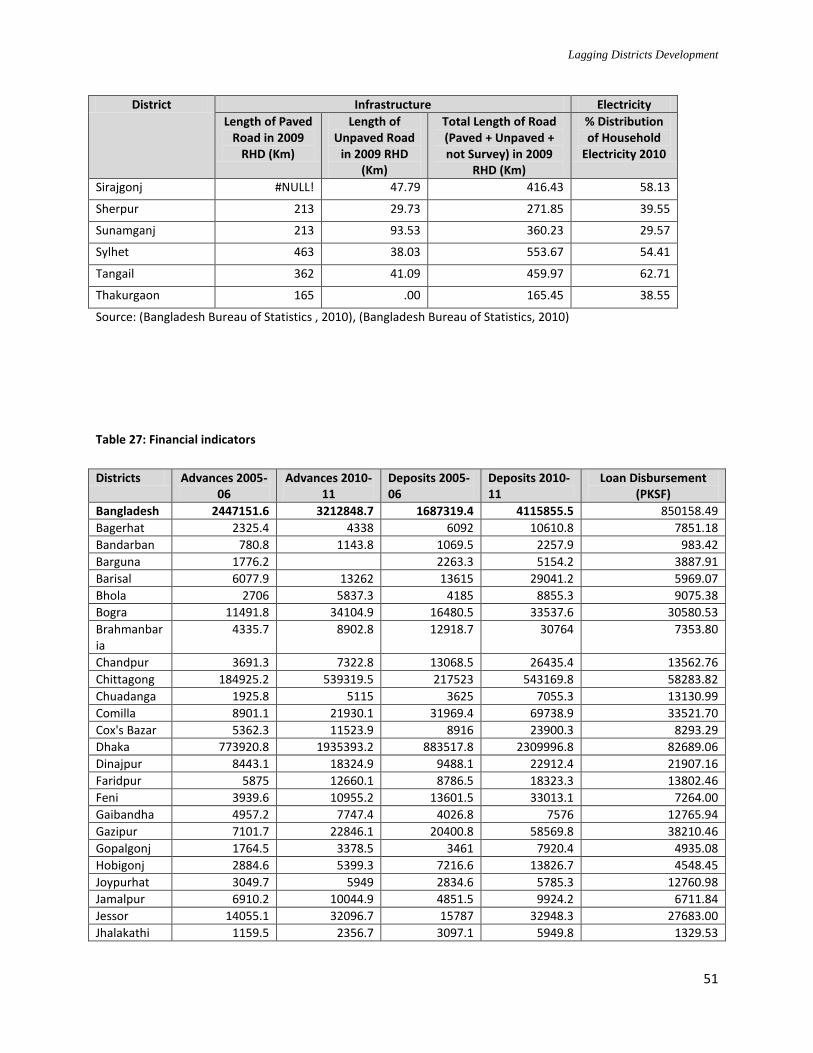
Lagging Districts Development
51
District Infrastructure Electricity
Length of Paved Road in 2009
RHD (Km)
Length of Unpaved Road
in 2009 RHD (Km)
Total Length of Road (Paved + Unpaved + not Survey) in 2009
RHD (Km)
% Distribution of Household
Electricity 2010
Sirajgonj #NULL! 47.79 416.43 58.13
Sherpur 213 29.73 271.85 39.55
Sunamganj 213 93.53 360.23 29.57
Sylhet 463 38.03 553.67 54.41
Tangail 362 41.09 459.97 62.71
Thakurgaon 165 .00 165.45 38.55
Source: (Bangladesh Bureau of Statistics , 2010), (Bangladesh Bureau of Statistics, 2010)
Table 27: Financial indicators
Districts Advances 2005-06
Advances 2010-11
Deposits 2005-06
Deposits 2010-11
Loan Disbursement (PKSF)
Bangladesh 2447151.6 3212848.7 1687319.4 4115855.5 850158.49
Bagerhat 2325.4 4338 6092 10610.8 7851.18
Bandarban 780.8 1143.8 1069.5 2257.9 983.42
Barguna 1776.2 2263.3 5154.2 3887.91
Barisal 6077.9 13262 13615 29041.2 5969.07
Bhola 2706 5837.3 4185 8855.3 9075.38
Bogra 11491.8 34104.9 16480.5 33537.6 30580.53
Brahmanbaria
4335.7 8902.8 12918.7 30764 7353.80
Chandpur 3691.3 7322.8 13068.5 26435.4 13562.76
Chittagong 184925.2 539319.5 217523 543169.8 58283.82
Chuadanga 1925.8 5115 3625 7055.3 13130.99
Comilla 8901.1 21930.1 31969.4 69738.9 33521.70
Cox's Bazar 5362.3 11523.9 8916 23900.3 8293.29
Dhaka 773920.8 1935393.2 883517.8 2309996.8 82689.06
Dinajpur 8443.1 18324.9 9488.1 22912.4 21907.16
Faridpur 5875 12660.1 8786.5 18323.3 13802.46
Feni 3939.6 10955.2 13601.5 33013.1 7264.00
Gaibandha 4957.2 7747.4 4026.8 7576 12765.94
Gazipur 7101.7 22846.1 20400.8 58569.8 38210.46
Gopalgonj 1764.5 3378.5 3461 7920.4 4935.08
Hobigonj 2884.6 5399.3 7216.6 13826.7 4548.45
Joypurhat 3049.7 5949 2834.6 5785.3 12760.98
Jamalpur 6910.2 10044.9 4851.5 9924.2 6711.84
Jessor 14055.1 32096.7 15787 32948.3 27683.00
Jhalakathi 1159.5 2356.7 3097.1 5949.8 1329.53
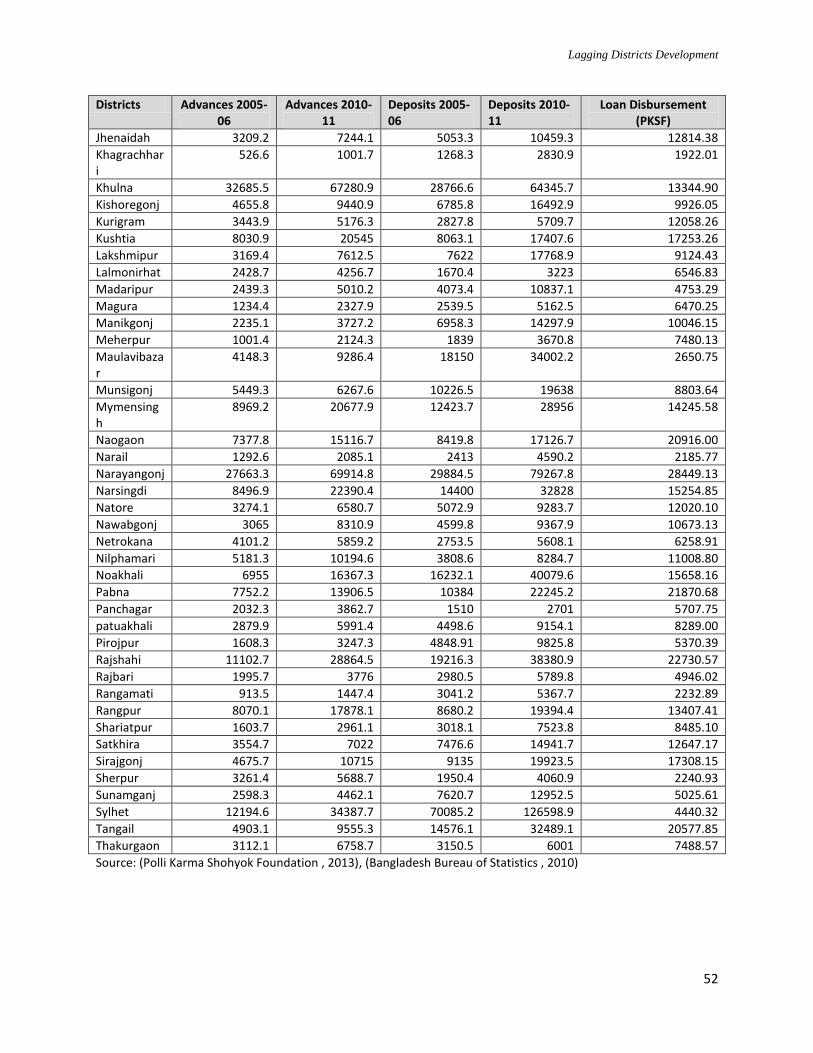
Lagging Districts Development
52
Districts Advances 2005-06
Advances 2010-11
Deposits 2005-06
Deposits 2010-11
Loan Disbursement (PKSF)
Jhenaidah 3209.2 7244.1 5053.3 10459.3 12814.38
Khagrachhari
526.6 1001.7 1268.3 2830.9 1922.01
Khulna 32685.5 67280.9 28766.6 64345.7 13344.90
Kishoregonj 4655.8 9440.9 6785.8 16492.9 9926.05
Kurigram 3443.9 5176.3 2827.8 5709.7 12058.26
Kushtia 8030.9 20545 8063.1 17407.6 17253.26
Lakshmipur 3169.4 7612.5 7622 17768.9 9124.43
Lalmonirhat 2428.7 4256.7 1670.4 3223 6546.83
Madaripur 2439.3 5010.2 4073.4 10837.1 4753.29
Magura 1234.4 2327.9 2539.5 5162.5 6470.25
Manikgonj 2235.1 3727.2 6958.3 14297.9 10046.15
Meherpur 1001.4 2124.3 1839 3670.8 7480.13
Maulavibazar
4148.3 9286.4 18150 34002.2 2650.75
Munsigonj 5449.3 6267.6 10226.5 19638 8803.64
Mymensingh
8969.2 20677.9 12423.7 28956 14245.58
Naogaon 7377.8 15116.7 8419.8 17126.7 20916.00
Narail 1292.6 2085.1 2413 4590.2 2185.77
Narayangonj 27663.3 69914.8 29884.5 79267.8 28449.13
Narsingdi 8496.9 22390.4 14400 32828 15254.85
Natore 3274.1 6580.7 5072.9 9283.7 12020.10
Nawabgonj 3065 8310.9 4599.8 9367.9 10673.13
Netrokana 4101.2 5859.2 2753.5 5608.1 6258.91
Nilphamari 5181.3 10194.6 3808.6 8284.7 11008.80
Noakhali 6955 16367.3 16232.1 40079.6 15658.16
Pabna 7752.2 13906.5 10384 22245.2 21870.68
Panchagar 2032.3 3862.7 1510 2701 5707.75
patuakhali 2879.9 5991.4 4498.6 9154.1 8289.00
Pirojpur 1608.3 3247.3 4848.91 9825.8 5370.39
Rajshahi 11102.7 28864.5 19216.3 38380.9 22730.57
Rajbari 1995.7 3776 2980.5 5789.8 4946.02
Rangamati 913.5 1447.4 3041.2 5367.7 2232.89
Rangpur 8070.1 17878.1 8680.2 19394.4 13407.41
Shariatpur 1603.7 2961.1 3018.1 7523.8 8485.10
Satkhira 3554.7 7022 7476.6 14941.7 12647.17
Sirajgonj 4675.7 10715 9135 19923.5 17308.15
Sherpur 3261.4 5688.7 1950.4 4060.9 2240.93
Sunamganj 2598.3 4462.1 7620.7 12952.5 5025.61
Sylhet 12194.6 34387.7 70085.2 126598.9 4440.32
Tangail 4903.1 9555.3 14576.1 32489.1 20577.85
Thakurgaon 3112.1 6758.7 3150.5 6001 7488.57
Source: (Polli Karma Shohyok Foundation , 2013), (Bangladesh Bureau of Statistics , 2010)
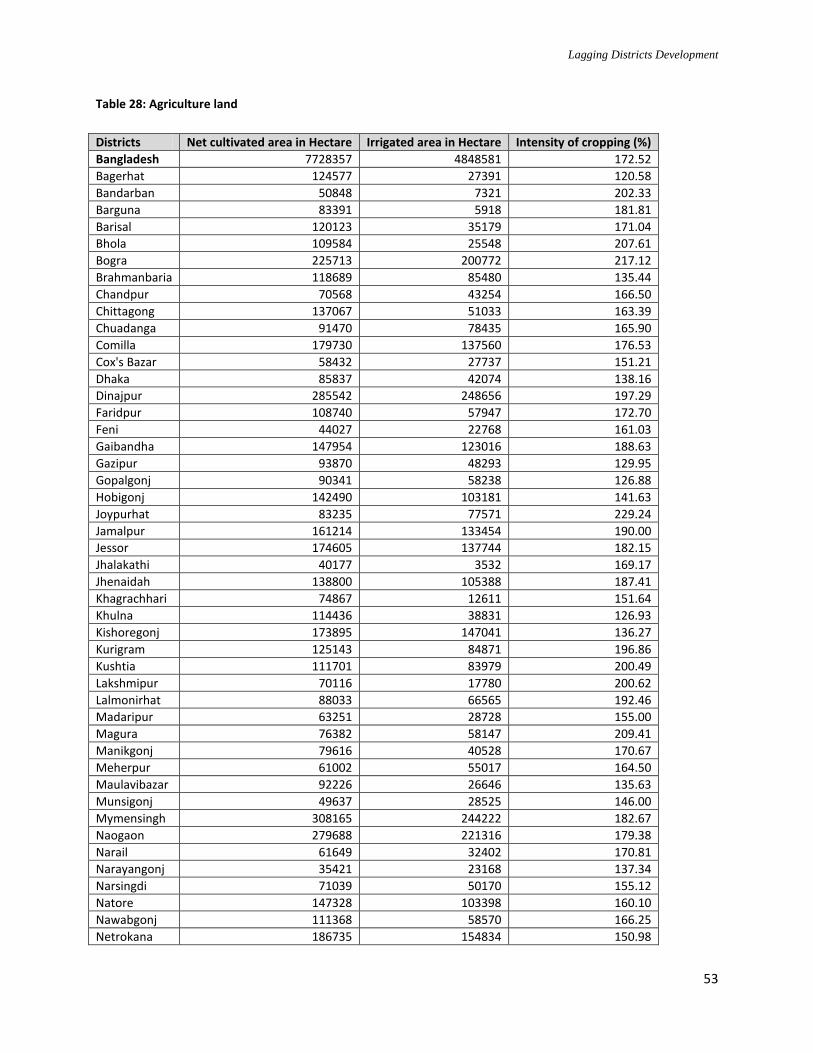
Lagging Districts Development
53
Table 28: Agriculture land
Districts Net cultivated area in Hectare Irrigated area in Hectare Intensity of cropping (%)
Bangladesh 7728357 4848581 172.52
Bagerhat 124577 27391 120.58
Bandarban 50848 7321 202.33
Barguna 83391 5918 181.81
Barisal 120123 35179 171.04
Bhola 109584 25548 207.61
Bogra 225713 200772 217.12
Brahmanbaria 118689 85480 135.44
Chandpur 70568 43254 166.50
Chittagong 137067 51033 163.39
Chuadanga 91470 78435 165.90
Comilla 179730 137560 176.53
Cox's Bazar 58432 27737 151.21
Dhaka 85837 42074 138.16
Dinajpur 285542 248656 197.29
Faridpur 108740 57947 172.70
Feni 44027 22768 161.03
Gaibandha 147954 123016 188.63
Gazipur 93870 48293 129.95
Gopalgonj 90341 58238 126.88
Hobigonj 142490 103181 141.63
Joypurhat 83235 77571 229.24
Jamalpur 161214 133454 190.00
Jessor 174605 137744 182.15
Jhalakathi 40177 3532 169.17
Jhenaidah 138800 105388 187.41
Khagrachhari 74867 12611 151.64
Khulna 114436 38831 126.93
Kishoregonj 173895 147041 136.27
Kurigram 125143 84871 196.86
Kushtia 111701 83979 200.49
Lakshmipur 70116 17780 200.62
Lalmonirhat 88033 66565 192.46
Madaripur 63251 28728 155.00
Magura 76382 58147 209.41
Manikgonj 79616 40528 170.67
Meherpur 61002 55017 164.50
Maulavibazar 92226 26646 135.63
Munsigonj 49637 28525 146.00
Mymensingh 308165 244222 182.67
Naogaon 279688 221316 179.38
Narail 61649 32402 170.81
Narayangonj 35421 23168 137.34
Narsingdi 71039 50170 155.12
Natore 147328 103398 160.10
Nawabgonj 111368 58570 166.25
Netrokana 186735 154834 150.98
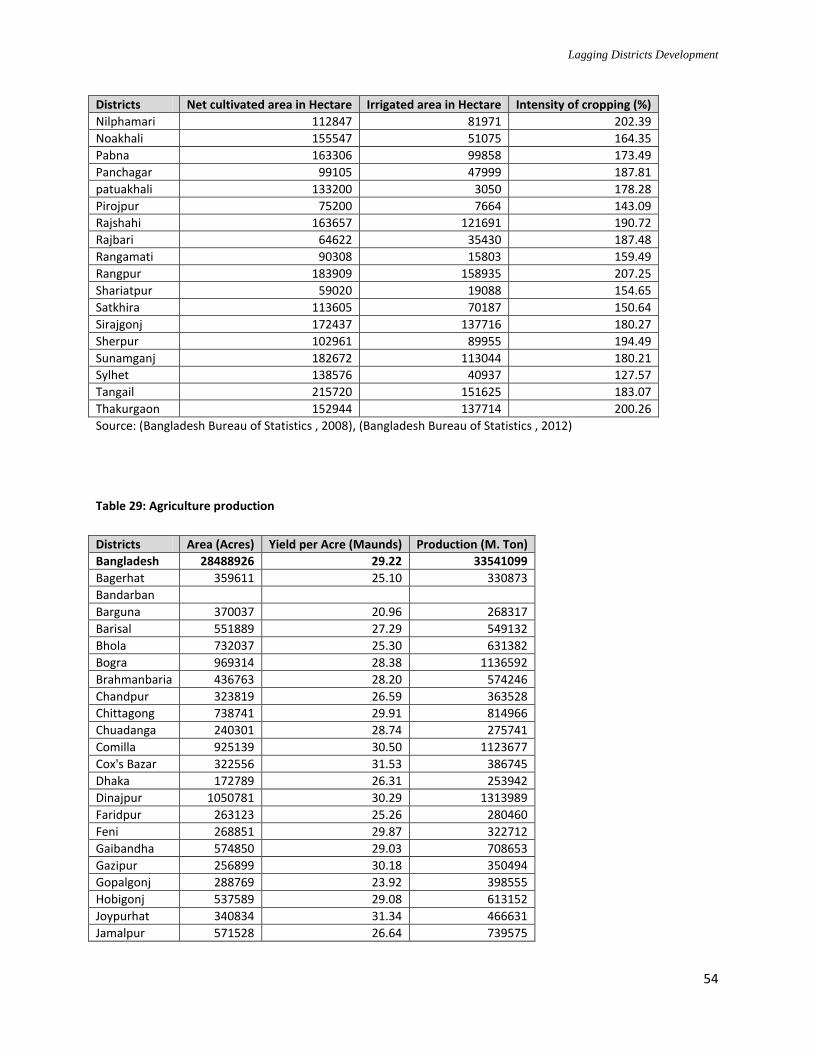
Lagging Districts Development
54
Districts Net cultivated area in Hectare Irrigated area in Hectare Intensity of cropping (%)
Nilphamari 112847 81971 202.39
Noakhali 155547 51075 164.35
Pabna 163306 99858 173.49
Panchagar 99105 47999 187.81
patuakhali 133200 3050 178.28
Pirojpur 75200 7664 143.09
Rajshahi 163657 121691 190.72
Rajbari 64622 35430 187.48
Rangamati 90308 15803 159.49
Rangpur 183909 158935 207.25
Shariatpur 59020 19088 154.65
Satkhira 113605 70187 150.64
Sirajgonj 172437 137716 180.27
Sherpur 102961 89955 194.49
Sunamganj 182672 113044 180.21
Sylhet 138576 40937 127.57
Tangail 215720 151625 183.07
Thakurgaon 152944 137714 200.26
Source: (Bangladesh Bureau of Statistics , 2008), (Bangladesh Bureau of Statistics , 2012)
Table 29: Agriculture production
Districts Area (Acres) Yield per Acre (Maunds) Production (M. Ton)
Bangladesh 28488926 29.22 33541099
Bagerhat 359611 25.10 330873
Bandarban
Barguna 370037 20.96 268317
Barisal 551889 27.29 549132
Bhola 732037 25.30 631382
Bogra 969314 28.38 1136592
Brahmanbaria 436763 28.20 574246
Chandpur 323819 26.59 363528
Chittagong 738741 29.91 814966
Chuadanga 240301 28.74 275741
Comilla 925139 30.50 1123677
Cox's Bazar 322556 31.53 386745
Dhaka 172789 26.31 253942
Dinajpur 1050781 30.29 1313989
Faridpur 263123 25.26 280460
Feni 268851 29.87 322712
Gaibandha 574850 29.03 708653
Gazipur 256899 30.18 350494
Gopalgonj 288769 23.92 398555
Hobigonj 537589 29.08 613152
Joypurhat 340834 31.34 466631
Jamalpur 571528 26.64 739575
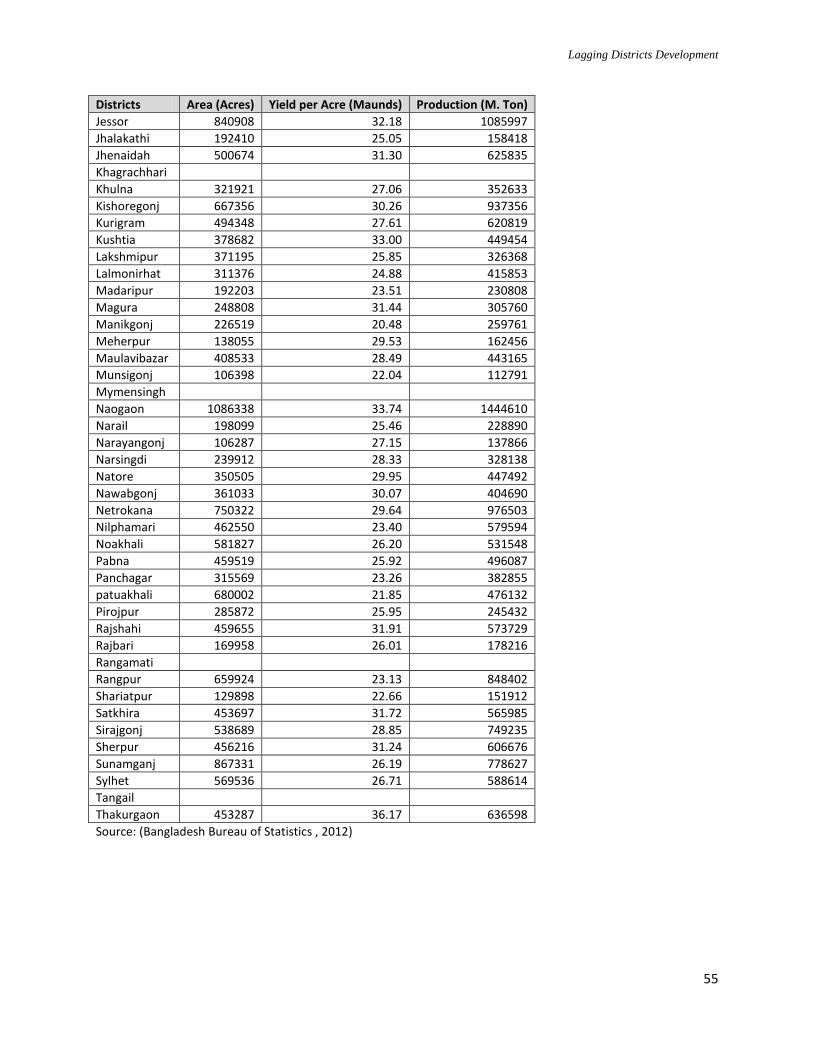
Lagging Districts Development
55
Districts Area (Acres) Yield per Acre (Maunds) Production (M. Ton)
Jessor 840908 32.18 1085997
Jhalakathi 192410 25.05 158418
Jhenaidah 500674 31.30 625835
Khagrachhari
Khulna 321921 27.06 352633
Kishoregonj 667356 30.26 937356
Kurigram 494348 27.61 620819
Kushtia 378682 33.00 449454
Lakshmipur 371195 25.85 326368
Lalmonirhat 311376 24.88 415853
Madaripur 192203 23.51 230808
Magura 248808 31.44 305760
Manikgonj 226519 20.48 259761
Meherpur 138055 29.53 162456
Maulavibazar 408533 28.49 443165
Munsigonj 106398 22.04 112791
Mymensingh
Naogaon 1086338 33.74 1444610
Narail 198099 25.46 228890
Narayangonj 106287 27.15 137866
Narsingdi 239912 28.33 328138
Natore 350505 29.95 447492
Nawabgonj 361033 30.07 404690
Netrokana 750322 29.64 976503
Nilphamari 462550 23.40 579594
Noakhali 581827 26.20 531548
Pabna 459519 25.92 496087
Panchagar 315569 23.26 382855
patuakhali 680002 21.85 476132
Pirojpur 285872 25.95 245432
Rajshahi 459655 31.91 573729
Rajbari 169958 26.01 178216
Rangamati
Rangpur 659924 23.13 848402
Shariatpur 129898 22.66 151912
Satkhira 453697 31.72 565985
Sirajgonj 538689 28.85 749235
Sherpur 456216 31.24 606676
Sunamganj 867331 26.19 778627
Sylhet 569536 26.71 588614
Tangail
Thakurgaon 453287 36.17 636598
Source: (Bangladesh Bureau of Statistics , 2012)
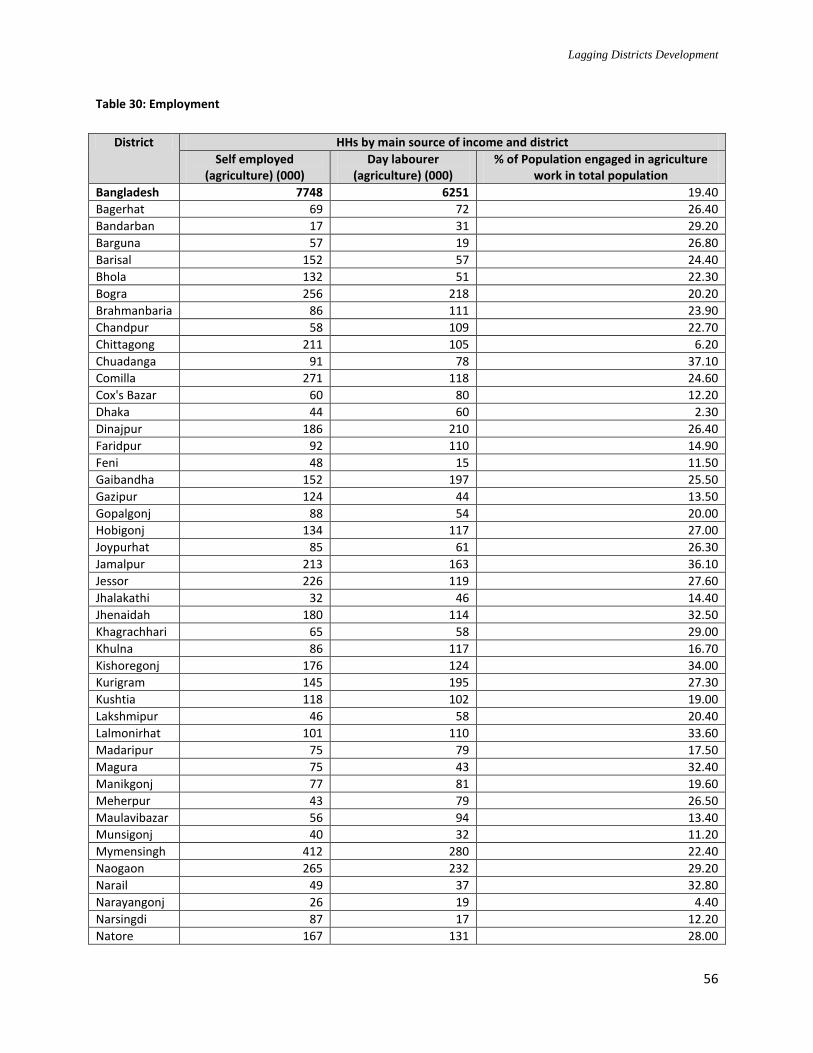
Lagging Districts Development
56
Table 30: Employment
District HHs by main source of income and district
Self employed (agriculture) (000)
Day labourer (agriculture) (000)
% of Population engaged in agriculture work in total population
Bangladesh 7748 6251 19.40
Bagerhat 69 72 26.40
Bandarban 17 31 29.20
Barguna 57 19 26.80
Barisal 152 57 24.40
Bhola 132 51 22.30
Bogra 256 218 20.20
Brahmanbaria 86 111 23.90
Chandpur 58 109 22.70
Chittagong 211 105 6.20
Chuadanga 91 78 37.10
Comilla 271 118 24.60
Cox's Bazar 60 80 12.20
Dhaka 44 60 2.30
Dinajpur 186 210 26.40
Faridpur 92 110 14.90
Feni 48 15 11.50
Gaibandha 152 197 25.50
Gazipur 124 44 13.50
Gopalgonj 88 54 20.00
Hobigonj 134 117 27.00
Joypurhat 85 61 26.30
Jamalpur 213 163 36.10
Jessor 226 119 27.60
Jhalakathi 32 46 14.40
Jhenaidah 180 114 32.50
Khagrachhari 65 58 29.00
Khulna 86 117 16.70
Kishoregonj 176 124 34.00
Kurigram 145 195 27.30
Kushtia 118 102 19.00
Lakshmipur 46 58 20.40
Lalmonirhat 101 110 33.60
Madaripur 75 79 17.50
Magura 75 43 32.40
Manikgonj 77 81 19.60
Meherpur 43 79 26.50
Maulavibazar 56 94 13.40
Munsigonj 40 32 11.20
Mymensingh 412 280 22.40
Naogaon 265 232 29.20
Narail 49 37 32.80
Narayangonj 26 19 4.40
Narsingdi 87 17 12.20
Natore 167 131 28.00
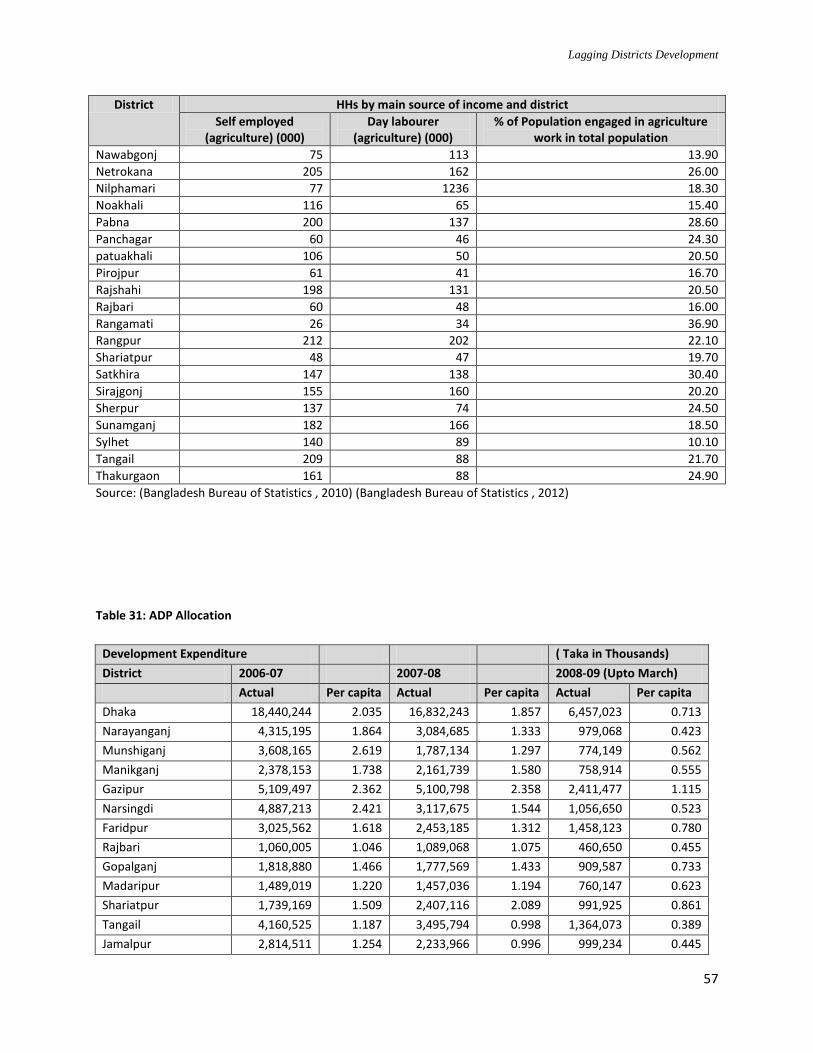
Lagging Districts Development
57
District HHs by main source of income and district
Self employed (agriculture) (000)
Day labourer (agriculture) (000)
% of Population engaged in agriculture work in total population
Nawabgonj 75 113 13.90
Netrokana 205 162 26.00
Nilphamari 77 1236 18.30
Noakhali 116 65 15.40
Pabna 200 137 28.60
Panchagar 60 46 24.30
patuakhali 106 50 20.50
Pirojpur 61 41 16.70
Rajshahi 198 131 20.50
Rajbari 60 48 16.00
Rangamati 26 34 36.90
Rangpur 212 202 22.10
Shariatpur 48 47 19.70
Satkhira 147 138 30.40
Sirajgonj 155 160 20.20
Sherpur 137 74 24.50
Sunamganj 182 166 18.50
Sylhet 140 89 10.10
Tangail 209 88 21.70
Thakurgaon 161 88 24.90
Source: (Bangladesh Bureau of Statistics , 2010) (Bangladesh Bureau of Statistics , 2012)
Table 31: ADP Allocation
Development Expenditure ( Taka in Thousands)
District 2006-07 2007-08 2008-09 (Upto March)
Actual Per capita Actual Per capita Actual Per capita
Dhaka 18,440,244 2.035 16,832,243 1.857 6,457,023 0.713
Narayanganj 4,315,195 1.864 3,084,685 1.333 979,068 0.423
Munshiganj 3,608,165 2.619 1,787,134 1.297 774,149 0.562
Manikganj 2,378,153 1.738 2,161,739 1.580 758,914 0.555
Gazipur 5,109,497 2.362 5,100,798 2.358 2,411,477 1.115
Narsingdi 4,887,213 2.421 3,117,675 1.544 1,056,650 0.523
Faridpur 3,025,562 1.618 2,453,185 1.312 1,458,123 0.780
Rajbari 1,060,005 1.046 1,089,068 1.075 460,650 0.455
Gopalganj 1,818,880 1.466 1,777,569 1.433 909,587 0.733
Madaripur 1,489,019 1.220 1,457,036 1.194 760,147 0.623
Shariatpur 1,739,169 1.509 2,407,116 2.089 991,925 0.861
Tangail 4,160,525 1.187 3,495,794 0.998 1,364,073 0.389
Jamalpur 2,814,511 1.254 2,233,966 0.996 999,234 0.445
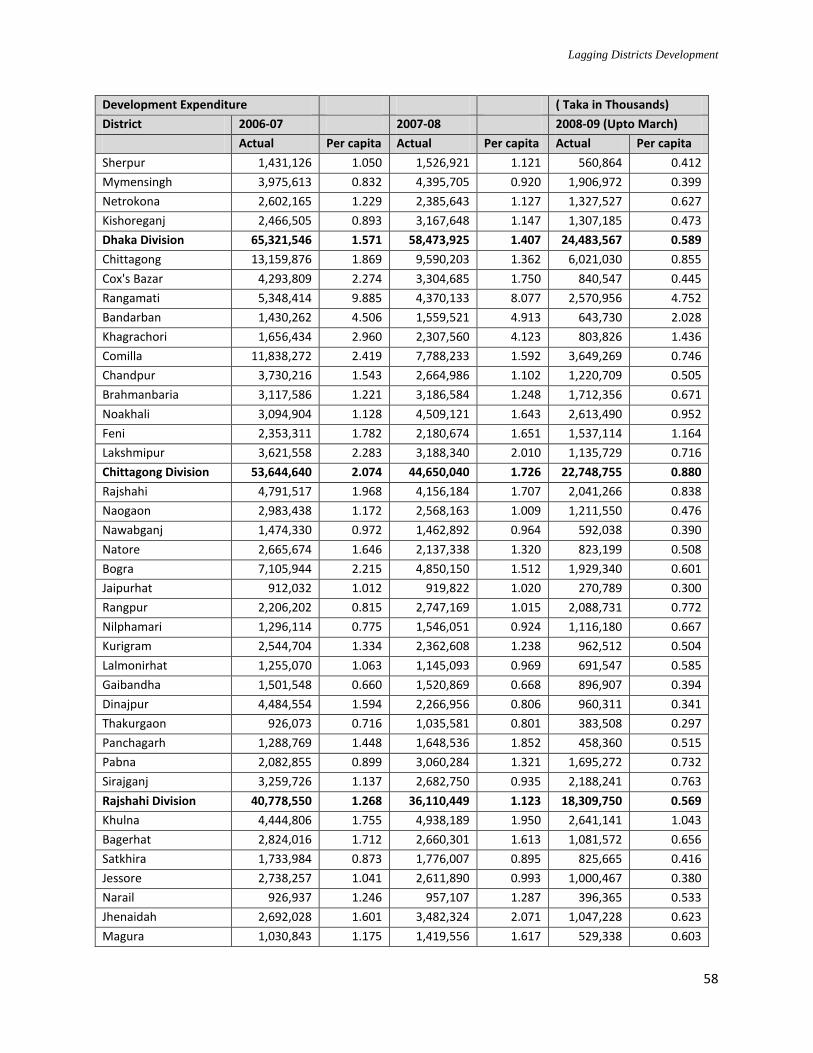
Lagging Districts Development
58
Development Expenditure ( Taka in Thousands)
District 2006-07 2007-08 2008-09 (Upto March)
Actual Per capita Actual Per capita Actual Per capita
Sherpur 1,431,126 1.050 1,526,921 1.121 560,864 0.412
Mymensingh 3,975,613 0.832 4,395,705 0.920 1,906,972 0.399
Netrokona 2,602,165 1.229 2,385,643 1.127 1,327,527 0.627
Kishoreganj 2,466,505 0.893 3,167,648 1.147 1,307,185 0.473
Dhaka Division 65,321,546 1.571 58,473,925 1.407 24,483,567 0.589
Chittagong 13,159,876 1.869 9,590,203 1.362 6,021,030 0.855
Cox's Bazar 4,293,809 2.274 3,304,685 1.750 840,547 0.445
Rangamati 5,348,414 9.885 4,370,133 8.077 2,570,956 4.752
Bandarban 1,430,262 4.506 1,559,521 4.913 643,730 2.028
Khagrachori 1,656,434 2.960 2,307,560 4.123 803,826 1.436
Comilla 11,838,272 2.419 7,788,233 1.592 3,649,269 0.746
Chandpur 3,730,216 1.543 2,664,986 1.102 1,220,709 0.505
Brahmanbaria 3,117,586 1.221 3,186,584 1.248 1,712,356 0.671
Noakhali 3,094,904 1.128 4,509,121 1.643 2,613,490 0.952
Feni 2,353,311 1.782 2,180,674 1.651 1,537,114 1.164
Lakshmipur 3,621,558 2.283 3,188,340 2.010 1,135,729 0.716
Chittagong Division 53,644,640 2.074 44,650,040 1.726 22,748,755 0.880
Rajshahi 4,791,517 1.968 4,156,184 1.707 2,041,266 0.838
Naogaon 2,983,438 1.172 2,568,163 1.009 1,211,550 0.476
Nawabganj 1,474,330 0.972 1,462,892 0.964 592,038 0.390
Natore 2,665,674 1.646 2,137,338 1.320 823,199 0.508
Bogra 7,105,944 2.215 4,850,150 1.512 1,929,340 0.601
Jaipurhat 912,032 1.012 919,822 1.020 270,789 0.300
Rangpur 2,206,202 0.815 2,747,169 1.015 2,088,731 0.772
Nilphamari 1,296,114 0.775 1,546,051 0.924 1,116,180 0.667
Kurigram 2,544,704 1.334 2,362,608 1.238 962,512 0.504
Lalmonirhat 1,255,070 1.063 1,145,093 0.969 691,547 0.585
Gaibandha 1,501,548 0.660 1,520,869 0.668 896,907 0.394
Dinajpur 4,484,554 1.594 2,266,956 0.806 960,311 0.341
Thakurgaon 926,073 0.716 1,035,581 0.801 383,508 0.297
Panchagarh 1,288,769 1.448 1,648,536 1.852 458,360 0.515
Pabna 2,082,855 0.899 3,060,284 1.321 1,695,272 0.732
Sirajganj 3,259,726 1.137 2,682,750 0.935 2,188,241 0.763
Rajshahi Division 40,778,550 1.268 36,110,449 1.123 18,309,750 0.569
Khulna 4,444,806 1.755 4,938,189 1.950 2,641,141 1.043
Bagerhat 2,824,016 1.712 2,660,301 1.613 1,081,572 0.656
Satkhira 1,733,984 0.873 1,776,007 0.895 825,665 0.416
Jessore 2,738,257 1.041 2,611,890 0.993 1,000,467 0.380
Narail 926,937 1.246 957,107 1.287 396,365 0.533
Jhenaidah 2,692,028 1.601 3,482,324 2.071 1,047,228 0.623
Magura 1,030,843 1.175 1,419,556 1.617 529,338 0.603
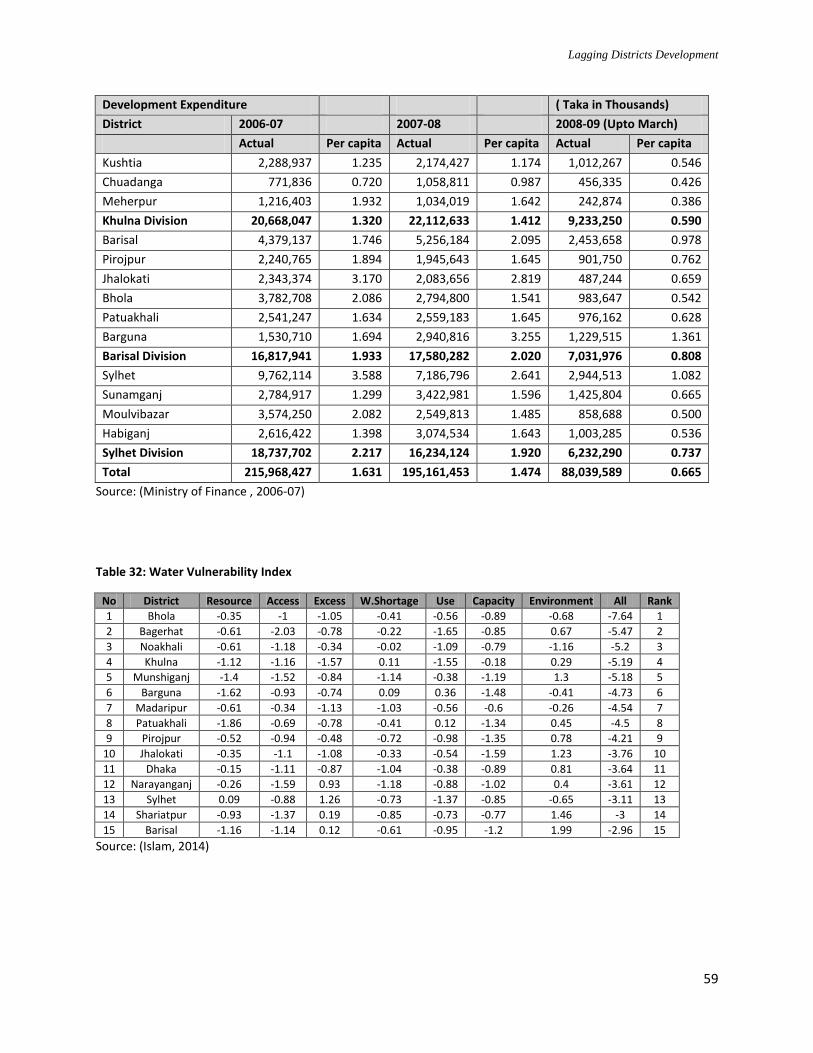
Lagging Districts Development
59
Development Expenditure ( Taka in Thousands)
District 2006-07 2007-08 2008-09 (Upto March)
Actual Per capita Actual Per capita Actual Per capita
Kushtia 2,288,937 1.235 2,174,427 1.174 1,012,267 0.546
Chuadanga 771,836 0.720 1,058,811 0.987 456,335 0.426
Meherpur 1,216,403 1.932 1,034,019 1.642 242,874 0.386
Khulna Division 20,668,047 1.320 22,112,633 1.412 9,233,250 0.590
Barisal 4,379,137 1.746 5,256,184 2.095 2,453,658 0.978
Pirojpur 2,240,765 1.894 1,945,643 1.645 901,750 0.762
Jhalokati 2,343,374 3.170 2,083,656 2.819 487,244 0.659
Bhola 3,782,708 2.086 2,794,800 1.541 983,647 0.542
Patuakhali 2,541,247 1.634 2,559,183 1.645 976,162 0.628
Barguna 1,530,710 1.694 2,940,816 3.255 1,229,515 1.361
Barisal Division 16,817,941 1.933 17,580,282 2.020 7,031,976 0.808
Sylhet 9,762,114 3.588 7,186,796 2.641 2,944,513 1.082
Sunamganj 2,784,917 1.299 3,422,981 1.596 1,425,804 0.665
Moulvibazar 3,574,250 2.082 2,549,813 1.485 858,688 0.500
Habiganj 2,616,422 1.398 3,074,534 1.643 1,003,285 0.536
Sylhet Division 18,737,702 2.217 16,234,124 1.920 6,232,290 0.737
Total 215,968,427 1.631 195,161,453 1.474 88,039,589 0.665
Source: (Ministry of Finance , 2006-07)
Table 32: Water Vulnerability Index
No District Resource Access Excess W.Shortage Use Capacity Environment All Rank
1 Bhola -0.35 -1 -1.05 -0.41 -0.56 -0.89 -0.68 -7.64 1
2 Bagerhat -0.61 -2.03 -0.78 -0.22 -1.65 -0.85 0.67 -5.47 2
3 Noakhali -0.61 -1.18 -0.34 -0.02 -1.09 -0.79 -1.16 -5.2 3
4 Khulna -1.12 -1.16 -1.57 0.11 -1.55 -0.18 0.29 -5.19 4
5 Munshiganj -1.4 -1.52 -0.84 -1.14 -0.38 -1.19 1.3 -5.18 5
6 Barguna -1.62 -0.93 -0.74 0.09 0.36 -1.48 -0.41 -4.73 6
7 Madaripur -0.61 -0.34 -1.13 -1.03 -0.56 -0.6 -0.26 -4.54 7
8 Patuakhali -1.86 -0.69 -0.78 -0.41 0.12 -1.34 0.45 -4.5 8
9 Pirojpur -0.52 -0.94 -0.48 -0.72 -0.98 -1.35 0.78 -4.21 9
10 Jhalokati -0.35 -1.1 -1.08 -0.33 -0.54 -1.59 1.23 -3.76 10
11 Dhaka -0.15 -1.11 -0.87 -1.04 -0.38 -0.89 0.81 -3.64 11
12 Narayanganj -0.26 -1.59 0.93 -1.18 -0.88 -1.02 0.4 -3.61 12
13 Sylhet 0.09 -0.88 1.26 -0.73 -1.37 -0.85 -0.65 -3.11 13
14 Shariatpur -0.93 -1.37 0.19 -0.85 -0.73 -0.77 1.46 -3 14
15 Barisal -1.16 -1.14 0.12 -0.61 -0.95 -1.2 1.99 -2.96 15
Source: (Islam, 2014)
Lagging Districts Development
60
References Bangladesh Bureau of Educational Information and Statistics. (2010). BANBEIS Report. Dhaka: BANBEIS.
Bangladesh Bureau of Statistics . (2008). Agricultural Census. Dhaka: BBS.
Bangladesh Bureau of Statistics . (2010). Bangladesh Sample Vital Registration System. Dhaka: BBS.
Bangladesh Bureau of Statistics . (2008). Gender Statistics. Dhaka: BBS.
Bangladesh Bureau of Statistics . (2010). Report on labor Force Survey. Dhaka: BBS.
Bangladesh Bureau of Statistics . (2010). Statistical Yearbook of Bangladesh . Dhaka: BBS.
Bangladesh Bureau of Statistics . (2012). Yearbook of Agricultural Statistics of Bangladesh. Dhaka: BBS.
Bangladesh Bureau of Statistics . (2001). Zila Series. Dhaka: BBS.
Bangladesh Bureau of Statistics. (2010). Household Income and Expenditure Survey. Dhaka: BBS.
Barro, R., & Sala-i-martin, X. (1991). Convergence across States and Regions . Brookings Papers on
Economic Activities .
CHTDF, UNDP. (2014). State of development in Chittagong hill tracks. Dhaka: UNDP, Bangladesh .
Friedman, M. (1992). Do Old Fallacies Ever Die? Journal of Economic Literature .
Hossain, M., & Mahzab, M. (2014). Integrated Upazila Dvelopment . Dhaka: BIDS.
Islam, K. M. (2014). Spatial assesment of Livlihood, Poverty and Water Vulnerability: Bangladesh
Integrated Water Resources Assesment Project Report . Dhaka: BIDS.
Khondker, B., & Wadud, N. (2010). Urbanization Management and Emerging Regional Disparity in
Bangladesh: Policies and Strategies for Decentralized Economic Growth. Dhaka: 6th Five Year Plan,
Ministry of Plannning.
Ministry of Finance . (2006-07). ADP allocation . Dhaka: Ministry of Finance .
Polli Karma Shohyok Foundation . (2013). Annual Reprt . Dhaka: PKSF.
Population Census, Bangladesh Bureau of Statistics. (2012). Population Census Report. Dhaka: BBS.
Quah, D. T. (1993). Empirics for economic growth and convergence. European Economic Review .
Raihan, S., & Ahmed, M. (2014). Education Development Index (EDI) for Primary. Dhaka : South Asian
Network on Economic Modeling .
Sala-i-martin, X. (1995). Regional cohesion: evidence and theories of regional growth and convergence.
European Economic Review .
Lagging Districts Development
61
SAS. (2010). Principal Component Analysis. SAS.
Sen, B., Ahmed, M., Ali, Z., & Yunus, M. (2014). REGIONAL INEQUALITY IN BANGLADESH IN THE 2000s:
Re-visitng the East-West Divide debate. Dhaka: Bangladesh Institute of Development Studies.
Shilpi, F. (2008). Migration, Sorting and Regional Inequality: Evidence from Bangladesh. Washington
D.C.: Policy Research Working Paper, World Bank.
World Bank, WFP, BBS. (2014). District Level Poverty Map. Dhaka: BBS.
Zohir, S. (2011). Regional Differences in Poverty Levels and Tresnds in Bangladesh: Are we asking the
right questions . Dhaka: Economic Research Group .
Related Documents


