Table 1 OVERVIEW OF THE WORLD ECONOMY ( A n n ua l pe r ce nt change un les s othe r wi se not e d) 1 9 92 1993 199 4 1995 World o u t p ut 2.4 2.4 3.7 3.5 I nd ustrial co unt ries 1.7 0.8 2.8 2. 1 U nited St at es 2.7 2.2 3.5 2.0 J apan 1.1 0.1 0.5 0.9 G ermany 2.2 –1.2 2.9 1.9 France 1.3 –1.5 2.9 2.4 Italy 0.7 –1.2 2.2 3.2 U nited King d om –0.5 2. 3 3.8 2. 4 Canad a 0.8 2.2 4. 6 2. 2 Seven co untries above 1.8 1. 0 2.8 2.0 Other ind ust rial countries 1.1 0.1 3. 0 2. 8 M emor andum E uropean Union 1.1 –0.5 2.8 2.6 D evelo ping co untries 6.3 6.2 6. 4 5.9 Africa 0.7 0.7 2. 4 3. 2 Asia 8.7 8.9 8.8 8. 4 Middle E ast and E urope 6.2 3.7 0.7 3.7 Western H emisphere 2. 9 3.1 4.7 0.9 C o untries in t ran sition –14.7 –8.5 –8.8 –1.3 Central an d eastern E uro pe –10.0 –5. 0 –2.9 1.4 E xclud ing B elarus and U kraine –7. 0 –0.1 3. 4 5. 2 R ussia, Transcaucasus, and cent ral Asia –18.7 –11.7 –14. 8 –4.3 World t ra d e volume ( g oods and services) 4 .8 3.8 9.0 8.7 Imports Industrial co unt ries 3.7 0.8 9.1 7. 3 D eveloping count ries 9.9 8. 9 9. 0 11.8 Countries in t ran sition –13.1 19.9 4.3 10.9 Exports Industrial co unt ries 4.3 2.4 8.2 7. 1 D eveloping co unt ries 9.9 7.5 12. 0 12. 2 Countries in t ran sition –9.4 18.1 5.3 11.8 Comm odity price s in U.S. dolla rs O il 1 –1. 6 –11.6 –5.5 8. 0 Nonfuel 2 0.1 1.8 13.6 8.5 Consume r prices I nd ustrial co unt ries 3.3 2.9 2.3 2. 4 D evelo ping co untries 35.3 42.5 48. 0 19.9 C o untries in t ran sition 674.4 614.3 264.8 128.2 Six-mont h LI BOR (in pe rce nt) 3 O n U. S. d o llar d eposits 3.9 3. 4 5.1 6.1 O n J apanese yen d epo sit s 4. 3 3. 0 2.4 1.3 O n d eut sche mark deposits 9. 4 6. 9 5.3 4.6 Source: International Monetary Fund, Worl d Eco nomi c Out loo k (May 1996). 1 Simpl e average o f spot price s of U .K. B rent, D ubai, and West Texas Int ermediate crude oil. 2 Average, based on world commodity export weights. 3 London interbank offered rate.

Welcome message from author
This document is posted to help you gain knowledge. Please leave a comment to let me know what you think about it! Share it to your friends and learn new things together.
Transcript

8/12/2019 Lag Selection-IMF Dissemination Standard
http://slidepdf.com/reader/full/lag-selection-imf-dissemination-standard 1/44
able 1
VERVIEW OF THE WORLD ECONOMYAnnua l percent change unless otherwi se noted)
1992 1993 1994
World output 2.4 2.4 3.7
dustrial countries 1.7 0.8 2.8U nited States 2.7 2.2 3.5Japan 1.1 0.1 0.5G ermany 2.2 –1.2 2.9France 1.3 –1.5 2.9I taly 0.7 –1.2 2.2U nited Kingdom –0.5 2.3 3.8C anada 0.8 2.2 4.6
Seven countries above 1.8 1.0 2.8O ther industrial countries 1.1 0.1 3.0
emorandum
uropean U nion 1.1 –0.5 2.8
eveloping countries 6.3 6.2 6.4Africa 0.7 0.7 2.4Asia 8.7 8.9 8.8Middle East and Europe 6.2 3.7 0.7Western H emisphere 2.9 3.1 4.7
ountries in transition –14.7 –8.5 –8.8C entral and eastern Europe –10.0 –5.0 –2.9
Excluding Belarus and U kraine –7.0 –0.1 3.4Russia, Transcaucasus, and central Asia –18.7 –11.7 –14.8
World trade volume (goods and services) 4.8 3.8 9.0
mportsIndustrial countries 3.7 0.8 9.1D eveloping countries 9.9 8.9 9.0C ountries in transition –13.1 19.9 4.3
xports
Industrial countries 4.3 2.4 8.2D eveloping countries 9.9 7.5 12.0C ountries in transition –9.4 18.1 5.3
ommodity prices in U.S. dollars
il1 –1.6 –11.6 –5.5onfuel2 0.1 1.8 13.6
onsumer prices
dustrial countries 3.3 2.9 2.3eveloping countries 35.3 42.5 48.0ountries in transition 674.4 614.3 264.8
ix-month LIBOR (in percent)3
n U .S. dollar deposits 3.9 3.4 5.1n Japanese yen deposits 4.3 3.0 2.4n deutsche mark deposits 9.4 6.9 5.3
Source: International Monetary Fund, Worl d Economic Out look (May 1996).1Simple average o f spot prices of U .K. B rent, D ubai, and West Texas Int ermediate crude oil.2Average, based on world commodity export weights.3London interbank offered rate.

8/12/2019 Lag Selection-IMF Dissemination Standard
http://slidepdf.com/reader/full/lag-selection-imf-dissemination-standard 2/44

8/12/2019 Lag Selection-IMF Dissemination Standard
http://slidepdf.com/reader/full/lag-selection-imf-dissemination-standard 3/44
able 3
H E SPEC IAL D ATA D ISSEMINATIO N STAND ARD : C OVERAG E, PER IO D IC ITY, AND TIMEL INE SS
Coverage_________________________________________________________________________________________Prescribed Encouraged categories_________________________________________________________
Category Components and/ or components Periodicity Timel
eal sectortional accounts: nominal, G D P by major expenditure category Saving, gross national income Q Ql, and associated prices (*) and/or by productive sector
oduction index/indices (#) Industrial, primary commodity, or M 6Wsector, as relevant (or as relevant) (M enco
or as re
Forward-looking indicator(s) M or Q M o(e.g., qualitative businesssurveys, orders, compositeleading indicato rs index)
bor market Employment, unemployment, and Q Qwag es/earning s, as relevant
ce indices C onsumer prices and producer or M Mwholesale prices
scal sectorneral government or Revenue, expenditure, balance, and Interest payments A 2Qblic sector operations, as domestic (bank and nonbank) andevant (*) foreign financing
ntral government Budgetary accounts: revenue, expen- Interest payments M Merations (#) diture, balance, and domestic (bank
and nonbank) and foreign financing
ntral g overnment deb t D o mest ic and fo reig n, as relevant , D ebt -service pro ject io ns: int erest Q Qwith a breakdown by currency (including and amort ization on medium-indexed), as relevant, and a breakdow n and long-term debt (Q for nextby maturity; debt guaranteed by central four quarters and then A) andgovernment, as relevant amortization on short-term debt (Q )
nancial sectoralytical accounts of the M oney ag greg ates, domestic credit M M
nking sector (*) by public and private sector,external position
alyt ical acco unt s o f the R eserve mo ney, d omest ic claims o n M 2W
n tral b ank (# ) pub lic and privat e sect or, ext ernal (W enco urag ed ) (W encoposition
erest rates Short-term and long-term g overnment Range of representative deposit D 1
security rates, policy variable rate and lending rates D 1
ock market Share price index, as relevant
xternal sectorlance of payments (*) G oods and services, net income Foreign direct investment and Q Q
flows, net current transfers, selected portfo lio investmentcapital (or capital and financial)account items (including reserves)
ernational reserves (#) G ross official reserves (gold, foreign Reserve-related liabilities, M Wexchange, SD Rs, and Fund position) as relevant (W encouraged)denominated in U .S. dollars
erchandise trade (#) Exports and imports Major commodity breakdowns M 8Wwith longer time lapse (4–
encou
ernational investment See text of the SD D S A 2Qsition (Q encouraged) (Q enco
change rates Spot rates and three- and six-month D 1
forw ard market rat es, as relevant
ddendum: Population Key distributions (e.g., by age A . .and sex)
No te: For periodicity and timeliness: daily (“ D ” ); weekly or with lapse of no more than o ne week (“ W” ) after the reference date or close of th e rek; monthly or with lapse of no more than one month (“ M” ); quarterly or with lapse of no more than one quarter (“ Q” ); annual (“ A” ).* C omprehensive statistical frameworks.
# Tracking categories.G iven that dat a are w idely available from private sources, dissemination o f official producers may be less time-sensitive. Althoug h d isseminatio n
d d l h l f d d f h d b d f h ( f bl h h f ) d

8/12/2019 Lag Selection-IMF Dissemination Standard
http://slidepdf.com/reader/full/lag-selection-imf-dissemination-standard 4/44
able 4
RTICLE IV CONSULTATIONS CONCLUDED IN FINANCIAL YEAR 1996
bania May 26, 1995geria May 22, 1995
ngola O ct. 18, 1995n tig ua and B arb ud a M ay 1, 1995gentina Sept. 27, 1995
menia Sept. 29, 1995ruba1 July 28, 1995
ustralia Mar. 22, 1996ustria May 31, 1995
erbaijan Nov. 17, 1995
hamas, The July 31, 1995hrain Feb. 26, 1996larus Sept. 12, 1995lgium Feb. 21, 1996lize Apr. 26, 1996
nin May 22, 1995hutan O ct. 25, 1995olivia Mar. 25, 1996otswana Feb. 12, 1996
azil D ec. 15, 1995
ulgaria D ec. 21, 1995urkina Faso D ec. 22, 1995urundi Apr. 1, 1996entral AfricanRepublic June 26, 1995
ambodia Sept. 15, 1995
anada May 3, 1995anada Apr. 1, 1996hile Sept. 8, 1995hina Apr. 1, 1996olombia Jan. 19, 1996
ôte d’Ivoire D ec. 11, 1995oatia Nov. 1, 1995
yprus Jan. 24, 1996zech Republic July 28, 1995ibouti Apr. 15, 1996
ominica June 16, 1995o minican Repub lic J une 16, 1995uador Aug. 3, 1995
gypt Sept. 22, 1995 Salvador Apr. 5, 1996
q uatorial G uinea O ct. 25, 1995i Nov. 15, 1995
nland Sept. 1, 1995ance O ct. 25, 1995abon Nov. 8, 1995
ambia, The O ct. 18, 1995eorgia Sept. 29, 1995ermany Aug. 30, 1995hana June 30, 1995reece Aug. 4, 1995
G renada May 12, 1995G uatemala May 22, 1995G uinea D ec. 20, 1995G uinea-Bissau O ct. 18, 1995G uyana June 16, 1995
H ong Kong2 Mar. 8, 1996Iceland May 3, 1995
Iceland Jan. 19, 1996India July 10, 1995Indonesia July 24, 1995
Iran, I . R. of O ct. 2, 1995Ireland June 30, 1995Israel Sept. 15, 1995Italy Mar. 15, 1996Japan July 21, 1995
Jordan Sept. 6, 1995Kazakstan Jan. 5, 1996Kenya Nov. 10, 1995Kiribati Nov. 15, 1995Korea O ct. 23, 1995
Kuwait Aug. 28, 1995Latvia O ct. 20, 1995Lesotho July 31, 1995Lithuania July 14, 1995Luxembourg Apr. 26, 1996
Macedonia, F.Y.R. May 5, 1995Madagascar June 9, 1995Malawi May 10, 1995Malaysia O ct. 2, 1995Maldives June 26, 1995
Mali O ct. 23, 1995Marshall Islands July 27, 1995Mauritania Apr. 17, 1996Mauritius Nov. 20, 1995Mexico June 30, 1995
Micronesia July 27, 1995Moldova June 21, 1995Mongolia Feb. 14, 1996Morocco O ct. 23, 1995Mozambique June 9, 1995
Myanmar O ct. 20, 1995Namibia July 31, 1995
Nepal May 24, 1995Netherlands May 1, 1995New Zealand Nov. 20, 1995
Nicaragua July 10, 1995Nigeria Nov. 1, 1995Norway Feb. 7, 1996O man O ct. 18, 1995Pakistan D ec. 13, 1995
Panama May 12P apua New G uinea July 14Paraguay July 12Peru D ec. 1Philippines Sept. 2
Poland Jan. 17Portugal O ct. 20
Romania D ec. 2Russia Sept. 1Rwanda Sept. 1
São Tomé andPríncipe June 7
Saudi Arabia O ct. 2,Senegal June 9Seychelles Apr. 17Sierra Leone D ec. 1
Singapore O ct. 2Slovak Republic Sept. 1Slovenia Sept. 1
Sri Lanka May 17St. Kitts and Nevis May 19
St. Vincent O ct. 20Sudan Feb. 13Suriname Mar. 1Swaziland D ec. 1Switzerland Feb. 26
Syrian Arab Rep. Mar. 6Tanzania Nov. 2Thailand June 2Togo D ec. 2Tonga June 1
Trinidad and Tobago Apr. 26Tunisia Feb. 23Turkmenistan Feb. 23United Arab Emirates June 1U kraine Jan. 19
U nited Kingdom O ct. 30U nited States Aug. 4U ruguay June 2Vietnam Aug. 3Western Samoa Nov. 1
Yemen, Republic o f M ay 10
Zaïre Mar. 1Zimbabwe Feb. 28
1Consultation discussions with Aruba are held in the context of the consultation with the Kingdom of the Netherlands.2C onsultation d iscussions with H ong Kong are held in the context of the consultation w ith the U nited Kingdom.

8/12/2019 Lag Selection-IMF Dissemination Standard
http://slidepdf.com/reader/full/lag-selection-imf-dissemination-standard 5/44
Table 5
U NITED STATES: SELECTED EC O NO MIC IND IC ATO RS(D ata as of Boar d di scussion in A ugust 1995; annual percent change unless otherwi se noted)
1992 1993 1994 19
Domestic economyReal G D P 2.3 3.1 4.1 2U nemployment rate (in percent of
labor force)2 7.4 6.8 6.1 5C onsumer price index 3.0 3.0 2.6 3
External economy
Exports, f.o.b. (in billions of U .S. dollars) 440.4 456.8 502.5 552mports, c.i.f. (in billions of U .S. dollars) 536.5 589.4 668.6 732
Current account balance(in percent of G D P) –1.1 –1.6 –2.2 –2
D irect investment (in billionsof U .S. dollars) –31.1 –31.5 0.1 –34
Securities, net (in billions of U .S. dollars) 21.6 –37.9 42.6 158C apital (official and private, in billions
of U .S. dollars) 85.0 63.9 165.5 84Real effective exchange rate –1.9 4.0 0.8 .G ross internat ional reserves
(in billions of SD Rs) 51.9 53.4 50.9 .
Financial variables
G eneral government balance4 –4.3 –3.4 –2.0 –1Federal5 –4.8 –4.1 –3.1 –2
Personal saving (in percent of G D P) 4.1 3.0 3.0 .G ross private investment
(in percent of G D P) 13.1 13.9 15.3 .
G rowth rate of M26
2.1 1.3 1.9 .Three-month treasury bill interest rate2 3.4 3.0 4.2 5Ten-year government bond interest rate2 7.0 5.9 7.1 6
1Projected.2Yearly average.3First quarter 1995 data on an annual basis.4On a national accounts basis and in percent of GDP.5O n a unified budget, fiscal year basis and in percent o f G D P.6Year over year, in percent.

8/12/2019 Lag Selection-IMF Dissemination Standard
http://slidepdf.com/reader/full/lag-selection-imf-dissemination-standard 6/44
Table 6
JAPAN: SELEC TED EC O NO MIC IND IC ATO RS(D ata as of Boar d di scussion in July 1995; annual percent change unless otherwi se noted)
1992 1993 1994 19
Domestic economyReal G D P 1.1 –0.2 0.5U nemployment rate (in percent) 2.2 2.5 2.9C onsumer price index 1.7 1.3 0.7
External economy
Exports, f.o.b. (in billions of U .S. dollars) 339.7 360.9 395.6 44Imports, c.i.f. (in billions of U .S. dollars) 233.0 240.7 274.7 3C urrent account balance (in b illions of
U .S. dollars)2 117.6 131.4 129.1 1Current account balance
(in percent of G D P) 3.2 3.1 2.8Net direct investment (in billions
of U .S. dollars) –14.5 –13.6 –17.0Net securities (in billions of U .S. dollars) –26.2 –62.7 –48.9Overall balance (in billions of U .S. dollars) –1.4 23.5 –2.3Real effective exchange rate (relative
normalized unit cost; 1990 = 100) 109.9 128.9 138.0Tot al internat ional reserves minus gold(in billions of U .S. dollars) 71.6 98.5 125.9
Financial variables
G eneral government balance(in percent of G D P) 1.5 –1.4 –3.1
G eneral government balance excludingsocial security (in percent of G D P) –2.0 –4.9 –6.5
G ross national saving (in percent of G D P) 34.3 33.1 31.7G ross domestic investment
(in percent of G D P) 31.1 29.9 28.8Broad money (M2 plus C D s,
period average) 0.6 1.1 2.1Three-month C D rate (average) 4.3 2.8 2.1O fficial discount rate (end of period) 3.2 1.8 1.8
1Projected.2D ata for current account balance are on the basis of the 1995 edition of the Balance of Paym

8/12/2019 Lag Selection-IMF Dissemination Standard
http://slidepdf.com/reader/full/lag-selection-imf-dissemination-standard 7/44
Table 7
G ERMANY: SELECTED EC O NO MIC IND IC ATO RS(D ata as of Boar d di scussion in A ugust 1995; annual percent change unless otherwi se noted)
1992 1993 1994 19
Domestic economy (western Germany)G D P (percent change at 1991 prices) 1.8 –1.7 2.3U nemployment rate (in percent
of labor force) 5.8 7.3 8.3C onsumer price index 4.0 4.1 3.0
Domestic economy (eastern Germany)
Real G D P 7.8 5.8 9.2U nemployment rate (in percent
of labor force) 14.7 14.8 14.6 1C onsumer price index 11.1 8.9 3.3
External economy
Exports, f.o.b. (in b illions ofdeutsche mark) 671.6 632.6 690.2
Imports, f.o.b. (in billions ofdeutsche mark) 630.2 566.9 607.8
C urrent account balance (in b illions ofdeutsche mark) –33.7 –25.8 –33.4 –2
D irect investment , net (in billions ofdeutsche mark) –26.8 –23.7 –28.7
Securities transactions, net (in b illions ofdeutsche mark) 45.3 177.3 –44.6
C apital account balance (in b illions ofdeutsche mark) 90.3 6.1 57.1
Real effective exchange rate 4.0 8.8 –0.2
Foreign exchange reserves (in billions ofdeutsche mark) 141.4 120.1 113.6
Financial variables
G eneral government balance(in percent of G D P) –2.9 –3.3 –2.5 –
G ross national saving . . . . . . . . .G ross national investment . . . . . . . . .Money and q uasi-money (M3; percent
change in annual average) 8.5 8.2 8.5 –Three month money market rate

8/12/2019 Lag Selection-IMF Dissemination Standard
http://slidepdf.com/reader/full/lag-selection-imf-dissemination-standard 8/44
Table 8
FRANC E: SELEC TED EC O NO MIC IND IC ATO RS(D ata as of Boar d di scussion in October 1995; annual percent change unless otherwi se noted)
1992 1993 1994 19
Domestic economyReal G D P 1.3 –1.5 2.9U nemployment rate (in percent of
total labor force) 10.3 11.6 12.4 1C onsumer price index 2.4 2.1 1.7
External economy
Export volume 4.9 –0.4 5.8mport volume 1.1 –3.4 6.8
Current account balance(in billions of francs) 20.4 59.5 54.1 6
Net direct investment(in billions of francs) –16.8 –0.1 0.3
Net portfo lio investment(in billions of francs) 187.1 16.9 –308.2
Capital balance (in billions of francs)2 –132.5 –79.7 50.2Effective exchange rate (MERM )3 3.7 0.5 0.7Net change in official reserves
(in billions of francs; – = increase) 5.3 30.9 –13.9
Financial variables
G eneral government balance(in percent of G D P) –4.0 –6.1 –6.0 –
G ross nat ional saving(in percent of G D P) 19.9 18.1 18.9
G ross national investment (in percent ofG D P; stockbuilding included) 19.8 17.2 18.4
Broad money (M3) 5.3 –3.2 2.0Three-month interbank money rate 10.4 8.4 5.8G overnment bond yield 8.6 6.8 7.2
1Projected.2Eq uals long-term capital plus short-term nonofficial capital, including errors and omissions.3Based on the Fund’s multilateral exchange rate model; a positive figure indicates an apprecia4Average to September 15, 1995; percent changes calculated relative to the average for the pr
ous year.5S d f h i d i

8/12/2019 Lag Selection-IMF Dissemination Standard
http://slidepdf.com/reader/full/lag-selection-imf-dissemination-standard 9/44
Table 9
U NITED KING D OM: SELECTED EC ONO MIC I ND IC ATORS(Data as of Boar d di scussion in October 1995; annual percent change unless otherwi se noted)
1992 1993 1994 19
Domestic economy
Real G D P –0.5 2.2 3.8 2Average unemployment rate
(in percent of labor force) 9.7 10.3 9.3 8Retail price index2 4.7 3.0 2.4 2
External economy
(in billions of pounds)
Exports 107.3 121.4 134.5 148mports 120.4 134.8 145.1 158
C urrent account balance –9.8 –11.0 –1.7 –7Net direct investment –1.7 –7.5 –9.7 –8Net portfolio investment –3.8 –37.7 50.4 –10Basic balance –15.3 –56.2 39.0 –28Nominal effective exchange rate
(period average, 1990 = 100) 96.99 88.98 89.25 85O fficial reserves (end of period) 27.5 29.0 28.1 29
Financial variables
G eneral go vernment receipts4
(in billions of pounds) 223.0 231.0 250.8 278G eneral go vernment expenditure4
(in billions of pounds) 267.0 281.3 296.1 305G ross national saving . . . . . . . . .G ross national investment . . . . . . . . .M0 2.4 4.9 6.4 6M4 3.1 5.0 4.2 6Three-month interbank interest rate 9.6 5.9 5.5 6
Ten-year government bond yield 9.1 7.5 8.2 7
1Projected.2Excluding mortgage interest.3January–September average.4Outturn figures from Central Statistical Office for fiscal years 1992/93, 1993/94, and 1994/95,
and from proposed budget in Financial Statement and Budget Report for fiscal year 1995/96.5January–August average.6September.

8/12/2019 Lag Selection-IMF Dissemination Standard
http://slidepdf.com/reader/full/lag-selection-imf-dissemination-standard 10/44
Table 10
ITALY: SELEC TED EC O NO MIC IND IC ATO RS(D ata as of Boar d di scussion in Mar ch 1996; annual percent change unless otherwi se noted)
1992 1993 1994 19
Domestic economyReal G D P 0.7 –1.2 2.2U nemployment rate (in percent of
total labor force)2 10.7 10.2 11.2C onsumer price index 5.2 4.5 4.0
External economy3
Export volume 3.8 8.9 10.7Import volume 3.4 –10.2 11.4
Current account balance(in percent of G D P) –2.3 1.1 1.5
Net direct investment (in billions of lire) –3,373 –5,469 –4,632 1,5Net portfo lio investment
(in billions of lire) 1,288 113,485 –8,264 44,5Capital account balance
(in billions of lire) 10,317 14,799 –22,157Real effective exchange rate –2.9 –14.9 –6.2
Total gross official reserves (in millionsof U .S. dollars, end of period) 50,818 51,138 58,607 60,4
Financial variables
G eneral government balance(in percent o f G D P)4 –9.5 –9.6 –9.0
Broad money5 5.9 8.2 1.9Six-month t reasury bill rate6 14.4 10.5 9.1Ten-year treasury bo nd rate6 13.3 11.2 10.6
1Projected.2Excluding workers in Wage Supplementat ion Fund.3Volumes are customs basis; current account is balance of payments basis.4Includes interest accruing on zero-coupon bonds.5G rowt h rate used for target monitoring; that is, moving average of last t hree months.6In percent, gross.

8/12/2019 Lag Selection-IMF Dissemination Standard
http://slidepdf.com/reader/full/lag-selection-imf-dissemination-standard 11/44
Table 11
CANADA: SELECTED ECONOMIC INDICATORS(D ata as of Boar d discussion in A pri l 1996; annual percent change unless otherwi se noted)
1993 1994 1995 199
Domestic economyReal G D P 2.2 4.6 2.2 1U nemployment rate (in percent of
labor force) 11.2 10.4 9.5 9C onsumer price index
(annual average) 1.8 0.2 2.1 1
External economy
Export volume 11.2 14.7 12.3 6
Import volume 11.1 13.6 9.8 3C urrent account balance (in b illions
of C anadian dollars) –28.8 –22.3 –13.1 –5Net direct investment (in billions of
C anadian dollars) –1.1 1.7 8.8 .Net portfolio investment (in billions of
C anadian dollars) 27.1 12.5 20.2 .Real effective exchange rate (based on
unit labor costs) –8.5 –5.5 –6.6 .
G ross official internat ional reserves(in billions of U .S. dollars) 12.8 12.5 15.2 .
Financial variables
G eneral government balance(in percent of G D P) –7.3 –5.3 –4.2 –2
G ross domestic saving (private,in percent of G D P) 17.8 18.0 18.4 16
G ross domestic investment (private,
in percent of G D P) 15.8 16.3 15.4 16M2 (mo ney and q uasi-money,
end of period) 3.1 2.7 4.0 .Three-month treasury bill rate
(in percent) 4.8 5.5 7.0 5Ten-year government bond rate
(in percent) 7.2 8.4 8.1 7
1
Projected.

8/12/2019 Lag Selection-IMF Dissemination Standard
http://slidepdf.com/reader/full/lag-selection-imf-dissemination-standard 12/44
Table 12
AU STRALIA: SELECTED EC O NO MIC I ND IC ATO RS(Data as of Boar d di scussion in Mar ch 1996; annual percent change unless otherwi se noted)
1991/ 92 1992/ 93 1993/ 94 1994/
Domestic economyReal G D P 0.7 3.2 4.4 4.U nemployment rate 10.3 11.0 10.5 8.C onsumer price index 1.9 1.0 1.8 3.
External economy
Exports, f.o.b. (in b illions ofAustralian dollars) 54.9 60.0 63.9 66.
Imports, f.o.b. (in billions of
Australian dollars) 51.1 59.4 64.4 74.C urrent account balance (in b illions of
Australian dollars) –11.6 –14.9 –16.7 –27.G ross direct investment (in b illions of
Australian dollars) . . . 112.5 121.9 128.Portfolio investment (in billions of
Australian dollars) . . . 127.5 122.9 126.C apital account (in b illions of
Australian dollars) 14.9 14.3 13.2 23.G ross external debt (in billions of
Australian dollars) 191.3 208.4 205.9 223.Real effective exchange rate
(1989/90 = 100) 89.5 82.1 77.3 78.Net international reserves (in millions
of U .S. dollars) 16.7 14.0 15.1 14.
Financial variables
G eneral government balance(in percent of G D P) –4.6 –4.7 –3.1 –2.Broad money 0.8 2.3 1.3 7.Interest rate (ten-year bond) 9.9 8.3 7.4 9.

8/12/2019 Lag Selection-IMF Dissemination Standard
http://slidepdf.com/reader/full/lag-selection-imf-dissemination-standard 13/44
Table 13
AU STRIA: SELEC TED EC O NO MIC I ND IC ATO RS(D ata as of Boar d di scussion in May 1995; annual percent change unless otherwi se noted)
1992 1993 19941 19
Domestic economyReal G D P 1.8 –0.1 2.7 3U nemployment rate 3.6 4.2 4.4 4C onsumer price index 4.1 3.6 3.0 2
External economy
Exports, f.o.b. (in billions of schillings) 487.6 467.2 512.5 560Imports, c.i.f. (in billions of schillings) 593.9 564.9 628.9 663Current account balance
(in percent of G D P) –0.1 –0.4 –1.0 –1D irect investment (in billions
of schillings) –10.2 –5.6 0.7 .Portfolio investment (in billions
of schillings) –29.8 –20.4 –48.3 .C apital and financial account balance
(in billions of schillings) 21.1 0.5 32.0 .Real effective exchange rate 1.4 1.8 –2.2 .
Net international reserves (in billionsof schillings) –119.0 –139.0 . . . .
Financial variables
G eneral government balance(in percent of G D P) –3.3 –4.6 –4.7 –4
G ross fixed investment 1.3 –2.1 5.5 5Broad money 4.2 4.0 5.3 .Interest rate (six-month interbank rate) 9.4 6.8 5.2 .
1Preliminary.2Projected.

8/12/2019 Lag Selection-IMF Dissemination Standard
http://slidepdf.com/reader/full/lag-selection-imf-dissemination-standard 14/44
Table 14
FINLAND : SELECTED EC O NO MIC IND IC ATO RS(D at a as of Boar d di scussion in September 1995; annual percent change unless otherwi se note
1992 1993 1994 19
Domestic economyReal G D P –3.6 –1.6 3.9U nemployment rate (in percent) 13.1 17.9 18.4 1C onsumer price index 2.6 2.2 1.1
External economy
Exports, f.o.b. (in billions of markkaa) 105.8 132.6 152.2 17Imports, c.i.f. (in billions of markkaa) 93.2 101.6 118.6 13Current account balance
(in percent of G D P) –4.6 –1.0 1.1D irect investment, net (in billions
of markkaa) 5.2 –4.6 –12.0Portfolio investment, net (in billions
of markkaa) 34.8 35.1 37.4C apital and financial account balance
(in billions of markkaa) 13.9 0.9 23.5External debt, net (in percent of G D P) 48.2 55.1 50.2
Real effective exchange rates –17.5 –15.9 6.3Net international reserves (in billions ofU .S. dollars) 5.3 5.5 10.7 1
Financial variables
G eneral government balance(in percent of G D P) –5.9 –7.8 –5.6 –
G ross national saving(in percent of G D P) 12.1 13.6 17.5 2
G ross fixed investment –16.9 –18.6 4.1 1Broad money –0.1 3.8 1.9 –Interest rate (three-month
money market) 13.3 7.7 5.4
1First quarter 1995.2June 1995.

8/12/2019 Lag Selection-IMF Dissemination Standard
http://slidepdf.com/reader/full/lag-selection-imf-dissemination-standard 15/44
Table 15
ARG ENTINA: SELEC TED EC O NO MIC IN D IC ATO RS(Dat a as of Boar d di scussion in September 1995; annual percent change unless otherwi se not
1992 1993 1994 19
Domestic economyReal G D P 8.7 6.0 7.4U nemployment rate 7.0 9.6 11.5 1C onsumer price index (period average) 24.9 10.6 4.1
External economy
Exports, f.o.b. (in billions of U .S. dollars) 12.2 13.1 15.8 2Imports, c.i.f. (in billions of U .S. dollars) 14.9 16.8 21.6 1Current account balance
(in percent of GDP)3 –2.8 –2.9 –3.5 –D irect investment4 71.3 50.9 –70.2 9C apital account balance
(in percent of G D P) 4.5 3.8 3.6External debt –3.8 2.8 8.1D ebt-service ratio (in percent of export s
of goods and nonfactor services) 40.8 47.1 38.1 4Real effective exchange rate 13.8 9.8 –1.3Net internat ional reserves (in billions of
U .S. dollars) 8.6 11.5 11.4 1
Financial variables
O verall public sector balance(in percent of GDP, excludingprivatization receipts) –0.2 0.9 –0.5 –
G ross national saving(in percent of G D P) 13.9 15.3 16.4 1
G ross domestic investment(in percent of G D P) 16.7 18.2 19.9 1Broad money (M3, period average) 69.4 40.9 14.1Interest rate (interfirm, period average) 18.2 8.0 8.5
1Projected.2As of May 1995.3The authorities estimate that the current account deficit in 1994–95 was narrower by about
0.3/0.5 percent of G D P on account of larger estimated interest receipts.
4Including privatizat ion.5A f S t b 1995

8/12/2019 Lag Selection-IMF Dissemination Standard
http://slidepdf.com/reader/full/lag-selection-imf-dissemination-standard 16/44
Table 16
BO TSWANA: SELEC TED EC O NO MI C IND IC ATO RS(D ata as of Boar d di scussion i n Februar y 1996; annual percent change unless otherwi se noted
1992 1993 19941 19
Domestic economyReal G D P 3 –0.3 4.1 2.1C onsumer price index (annual average) 16.1 14.4 10.6
External economy
Exports, f.o.b. (in millionsof U .S. dollars) 1,725.2 1,725.1 1,879.5 2,0
Imports, c.i.f. (in millionsof U .S. dollars) 1,539.5 1,457.9 1,508.7 1,6
Current account balance (in percentof G D P) 6.1 12.5 1.3
D irect investment, including retainedlosses (in millions of U .S. dollars) –3.3 –288.3 –49.2
Portfolio investment (in millionsof U .S. dollars) 0.1 0.2 –0.1
C apital and financial account balance(in millions of U .S. dollars) 6.6 8.5 6.0
External debt (in percent of G D P) 15.8 16.7 16.7D ebt-service ratio (in percent o f exports
of goods and services) 5.1 4.7 4.5Real effective exchange rate 1.2 3.7 –0.9G ross internat ional reserves (in millions
of U .S. dollars) 3,793 4,097 4,402 4,4
Financial variables
Central government balance (in percentof G D P) 10.6 8.9 1.7
Broad money (M2) 14.3 9.3 4.5Interest rate (prime lending) 14.5 15.0 14.5
1Preliminary.2Estimated.3National accounts year beginning in July.
8/12/2019 Lag Selection-IMF Dissemination Standard
http://slidepdf.com/reader/full/lag-selection-imf-dissemination-standard 17/44

8/12/2019 Lag Selection-IMF Dissemination Standard
http://slidepdf.com/reader/full/lag-selection-imf-dissemination-standard 18/44
Table 18
C OLO MBIA: SELECTED ECO NO MIC IND IC ATO RS(D ata as of Boar d discussion in Januar y 1996; annual per cent change unless otherwi se noted
1992 1993 1994 199
Domestic economyReal G D P 4.0 5.2 5.7U nemployment rate 10.2 8.6 8.9C onsumer price index (period average) 27.0 22.4 22.8 2
External economy
Exports, f.o .b. (in millionsof U .S. dollars) 7,263 7,428 8,756 10,72
Imports, f.o.b. (in millions
of U .S. dollars) 6,029 9,086 11,040 13,24Current account balance
(in percent of G D P) 1.8 –3.9 –4.6 –D irect investment 56.9 4.6 113.5 3Portfolio investment (in millions
of U .S. dollars) 65.0 203.0 –65.0 20Capital account balance
(in percent of G D P) 0.9 4.1 4.7External debt 35.0 34.8 32.8 2D ebt-service ratio (in percent o f exports
of goods and services) 44.9 37.2 39.6 3Real effective exchange rate
(end of period) 8.6 7.3 10.5 –Net international reserves (in millions
of U .S. dollars) 1,326 153 128 18
Financial variables
Nonfinancial public sector balance(in percent of G D P) –0.1 –0.2 0.5 –
G ross national saving(in percent of G D P) 19.0 16.0 15.3 1
G ross domestic investment(in percent of G D P) 17.2 19.9 19.8 2
Broad money 35.0 30.2 36.2 2Interest rates
90-day deposit rate 26.4 25.6 29.5 3
Lending rate 37.3 35.8 40.5 4
8/12/2019 Lag Selection-IMF Dissemination Standard
http://slidepdf.com/reader/full/lag-selection-imf-dissemination-standard 19/44
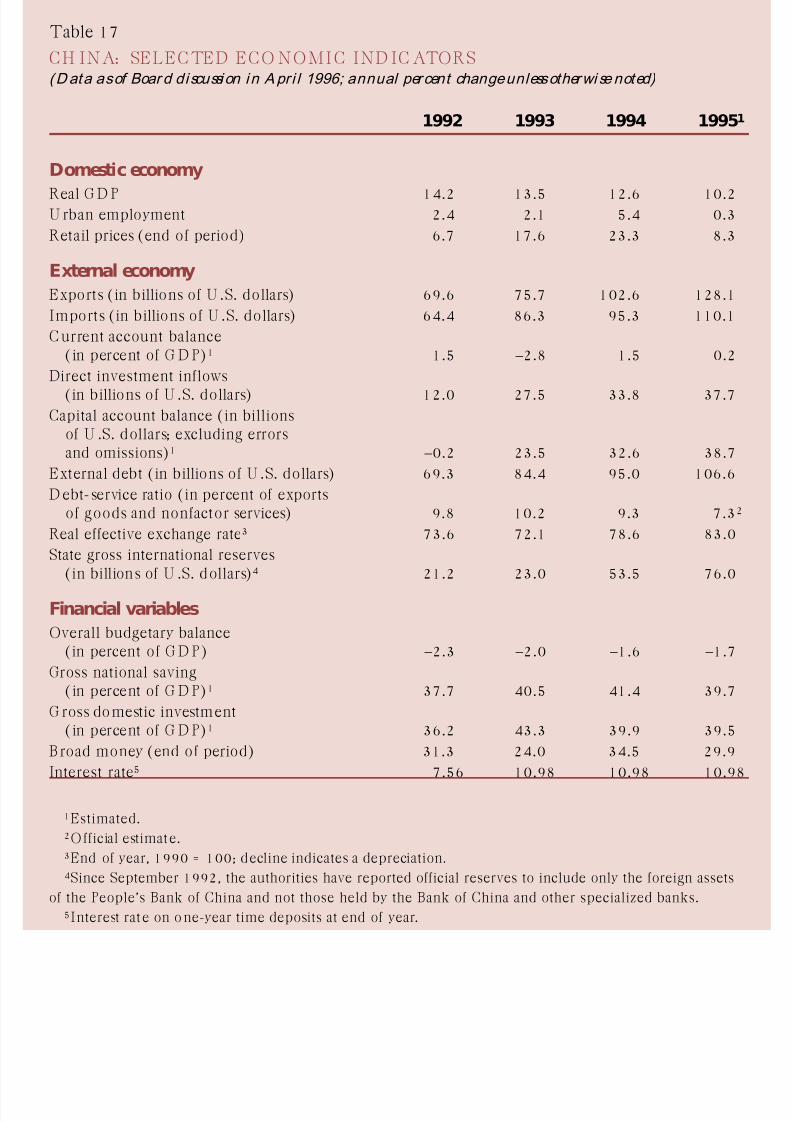
Table 19
C Ô TE D ’IVOI RE: SELECTED EC ON OMI C IND IC ATO RS(D at a as of Boar d di scussion in December 1995; annual percent change unless otherwi se note
19931 19941 199
Domestic economyG D P (at constant prices) 0.1 1.8 6C onsumer price index (end of period) 2.6 32.2 9
External economy
Exports, f.o.b. (at current prices, C FAF basis) –3.7 114.1 23Imports, f.o.b. (at current prices, C FAF basis) –5.9 87.2 32C urrent account balance (in percent o f G D P)3 –10.8 –2.3 –2C apital account balance (in millions of U .S. dollars) 47.1 656.9 138
External debt (in percent of G D P)4 158.9 200.1 175D ebt service (in percent of G D P)5 16.9 18.8 17Real effective exchang e rate6 –2.4 –38.6 9Net foreign assets7 –10.7 67.0 22
Financial variables
C onsolidated government balance (in percentof G D P, payment-order basis) –13.3 –7.6 –4
G ross national saving (in percent of G D P) –2.2 12.4 13G ross national investment (in percent of G D P) 8.6 14.8 16Money and quasi-money (M2) –4.4 46.9 19Interest rates (average, end of period)
Money market rate 7.5 5.5 6BC EAO discount rate 10.5 10.0 7
1Estimated.2Projected.3Including official transfers but excluding late interest on payments arrears to commercial bank4Including obligations to t he Fund, short-term liabilities to the Banq ue Centrale des États de
’Afrique de l’Ouest (BCEAO) operations account, and all arrears to commercial banks.5Including obligations to the Fund but excluding late interest on payments arrears to commer
banks.6Based on end-of-period changes in relative consumer prices and nominal effective exchange r
– indicates a depreciation.7End of period (percent change in beginning-of-period b road money); for 1993, ad justed on
basis of the CFAF devaluation in January 1994.

8/12/2019 Lag Selection-IMF Dissemination Standard
http://slidepdf.com/reader/full/lag-selection-imf-dissemination-standard 20/44
Table 20
IND IA: SELECTED ECO NO MIC IND IC ATO RS(D ata as of Boar d di scussion in July 1995; annual per cent change unless otherwi se noted) 1
1992/ 93 1993/ 94 1994/ 952 1995/
Domestic economyReal G D P 4.3 4.3 6.34 6.Wholesale prices (end of period) 7.0 10.8 11.0 8.0
External economy (in billions of
U.S. dollars unless otherwise noted)
Exports, f.o.b. 18.9 22.7 26.7 30.Imports, c.i.f. 23.2 24.0 29.5 35.C urrent account balance –3.9 –0.6 –1.4 –4.0
D irect investment 0.3 0.6 1.0 1.Portfolio investment 0.2 3.5 3.5 1.C apital and financial account balance 2.8 8.5 7.8 4.External debt (in percent of G D P,
end of period)5 36.9 35.8 31.2 27.D ebt-service ratio (in percent) 30.4 25.4 27.3 27.Real effective exchange rate
(annual percent change, end of period) –3.2 3.8 –5.1 . .
G ross official reserves (end of period) 6.4 15.1 20.8 20.Financial variables
Consolidated public sector deficit(in percent o f G D P)6 8.4 11.0 10.5 9.
G ross national saving(in percent of G D P) 20.0 20.2 21.4 22.
G ross national investment(in percent of G D P) 22.0 20.4 21.9 23.
Broad money (end of period) 15.7 18.4 21.2 15.Interest rates7 11.1 10.1 11.2 . .
1Fiscal years (April 1 through March 31).2Estimated.3Projected.4D ata revised subsequent to the Board discussion.5Including military debt.6For 1995/96, projection based on 1995/96 budget proposals.7Rate on 364-day treasury bills, end of period.

8/12/2019 Lag Selection-IMF Dissemination Standard
http://slidepdf.com/reader/full/lag-selection-imf-dissemination-standard 21/44

8/12/2019 Lag Selection-IMF Dissemination Standard
http://slidepdf.com/reader/full/lag-selection-imf-dissemination-standard 22/44
Table 22
SRAEL: SELECTED EC O NO MIC I ND IC ATO RS(Dat a as of Boar d discussi on i n September 1995; annual percent change unless otherwi se noted)
1992 1993 1994 19
Domestic economy
Real G D P 6.6 3.4 6.5U nemployment rate (average) 11.2 10.0 7.8C onsumer price index (average) 11.9 10.9 12.3 1
External economy
Exports, f.o.b. (in billions of U .S. dollars) 13.3 14.8 16.5 1mports, c.i.f. (in billions of U .S. dollars) –18.3 –20.4 –22.6 –2
C urrent account balance (in b illionsof U .S. dollars) 0.2 –1.4 –2.8 –
Capital account balance (in billionsof U .S. dollars) –2.1 2.0 1.1
External public debt 19.02 21.0 20.0Real effective exchang e rate3 –4.9 1.6 2.4Net debt service4 15.4 15.7 16.6G ross official reserves (end o f period )5 2.2 2.6 2.5
Financial variables
G ross nat ional saving (in percent ofnational income) 21.6 19.5 18.1 1
G ross do mestic investment (in percentof national income) 21.7 21.3 21.7
Nominal broad money (end of period) 33.0 25.0 26.0
1Fund staff estimates.2Average 1990–92.3Based on Fund staff estimates (using consumer prices); fourth quarter over fourth quarter.4As percentage o f to tal exports of g oo ds and services.5In months of t ot al imports of goods and services.

8/12/2019 Lag Selection-IMF Dissemination Standard
http://slidepdf.com/reader/full/lag-selection-imf-dissemination-standard 23/44
Table 23
KOREA: SELECTED EC ON O MIC I ND IC ATORS(D ata as of Boar d di scussion in October 1995; annual percent change unless otherwi se noted)
1992 1993 1994 19
Domestic economyReal G D P 5.1 5.8 8.4U nemployment rate 2.4 2.8 2.4C onsumer price index 6.2 4.8 6.2
External economy
Exports, f.o.b. (in billions of U .S. dollars) 75.2 80.9 93.7 12Imports, f.o.b. (in billions of U .S. dollars) 77.3 79.1 96.8 12Current account balance
(in percent of G D P) –1.5 0.1 –1.2 –D irect investment (net , in millions of
U .S. dollars) –496 –540 –1,318 –1,70Portfolio investment (net, in millions of
U .S. dollars) 5,742 10,725 6,805 8,51O verall balance (in b illions of
U .S. dollars) 3.7 3.0 4.6External debt (in percent of G D P) 14.0 13.3 14.7D ebt-service ratio (in percent of exports
of goods and nonfactor services) 6.0 9.1 6.2Real effective exchang e rate1 –0.7 –0.9 0.4G ross internat ional reserves (in billions
of U .S. dollars, end of period) 17.1 20.2 25.6 3
Financial variables
Consolidated central governmentbalance (in percent of G D P) –0.7 0.3 0.5
G ross national saving(in percent of G D P) 34.7 35.1 34.7 3
G ross domestic investment(in percent of G D P) 36.6 35.1 35.9 3
Broad money (M2) 18.4 18.6 15.6 1Interest rate (yield o n corporate bo nds,
period average) 16.2 12.6 12.9 1
1Average for D ecember over the same period o f the previous year.
2Preliminary estimate of outturn.

8/12/2019 Lag Selection-IMF Dissemination Standard
http://slidepdf.com/reader/full/lag-selection-imf-dissemination-standard 24/44
Table 24
MEXIC O: SELECTED ECO NOM IC IND IC ATORS(D at a as of Boar d di scussion in June 1995; annual percent change unless otherwi se noted)
1992 1993 1994 199
Domestic economyReal G D P 2.8 0.7 3.5 –6.O pen unemployment rate 2.8 3.4 3.7 6.C onsumer price index (end of period) 11.9 8.0 7.1 52.
External economy
Exports, f.o.b. (in billionsof U .S. dollars) 32.3 35.4 40.4 53.
Imports, f.o .b. (in billions
of U .S. dollars) 48.2 48.9 58.9 46.C urrent account balance
(in percent of G D P) –7.4 –6.5 –7.8 –0.D irect investment (in billions
of U .S. dollars) 4.4 4.4 11.0 7.Portfo lio investment (bond placements
and equity investments, in billionsof U .S. dollars) 8.3 17.0 6.4 0.
C apital account balance
(in percent of G D P) 8.0 8.4 3.0 –0.Public sector external debt2, 3 81.7 83.5 89.3 116.External debt (in percent of exports of
goods, services, and transfers)2 254.1 263.0 249.3 240.Real effective exchange rate
(average depreciation, –) 7.5 7.4 –4.0 –33.Change in net international reserves
(in billions of U .S. dollars; increase, –) –1.9 –7.1 17.9 1.
Financial variablesPrimary balance (in percent of G D P) 5.8 3.9 2.3 5.G ross nat ional saving
(in percent of G D P) 14.1 14.2 13.9 14.G ross domestic investment
(in percent of G D P) 21.5 20.6 21.7 15.Broad money (M2)2 29.4 17.6 22.8 34.Interest rate on one-month treasury bills
(average of primary auction) 15.6 15.0 14.0 48.

8/12/2019 Lag Selection-IMF Dissemination Standard
http://slidepdf.com/reader/full/lag-selection-imf-dissemination-standard 25/44
Table 25
MOZ AMBIQ U E: SELECTED ECO NOMIC I ND IC ATORS(D at a as of Boar d di scussion in June 1995; annual percent change unless otherwi se noted)
1992 1993 19941 19
Domestic economyReal G D P –0.8 19.3 5.4 4C onsumer price index
(D ecember 1989 = 100) 54.5 43.6 70.1 24
External economy
Exports, f.o.b. (in millions ofU .S. dollars) 139.3 131.8 149.5 170
mports, c.i.f. (in millions
of U .S. dollars) –855.0 –954.7 –1,018.5 –86C urrent account balance, including
grants (in millions of U .S. dollars) –239.1 –321.3 –305.4 –310D irect investment, net 25.3 32.0 35.0 45Capital account balance (in millions
of U .S. dollars) –155.1 –107.0 –22.1 25External debt (in millions
of U .S. dollars) 5,083.0 4,999.0 5,403.9 5,610D ebt-service ratio (in percent of exports)
Before debt relief 144.5 134.7 119.2 116After debt relief 3 88.3 82.8 69.7 82
Real effective exchange rate 6.4 –18.1 19.1 .G ross reserves (in millions of
U .S. do llars; end o f year)4 384.8 372.1 427.6 475
Financial variables
G ross national saving (in percent of G D P) 34.6 37.8 39.4 34
G ross national investment 53.2 59.7 60.2 55Money and quasi-money (M2) 52.8 63.0 49.3 26nterest rate (on 6- to 12-month
deposits; end of period) 43.0 43.0 69.7 .
1Preliminary.2Program target.3The ratios exclude the effects of the debt cancellation granted by the Netherlands.4G ross foreign assets of the banking system.

8/12/2019 Lag Selection-IMF Dissemination Standard
http://slidepdf.com/reader/full/lag-selection-imf-dissemination-standard 26/44
Table 26
NIG ERIA: SELECTED ECO NOM IC IND IC ATORS(D ata as of Boar d discussion in N ovember 1995; annual percent change unless otherwi se note
1992 1993 19941 19
Domestic economyReal G D P 2.9 2.3 1.3C onsumer price index (end of period) 48.8 61.3 76.8 3
External economy
Exports, f.o.b. 1.5 –8.2 –15.6 1Imports, f.o.b. 10.7 –7.0 –17.9C urrent account (in percent of
adjusted G D P) –1.9 –2.8 –2.9 –
D irect investment (in billions ofU .S. dollars) 0.8 0.6 0.6
C apital account balance (in billions ofU .S. dollars) –7.0 –2.2 –1.7 –
External debt (in percent ofadjusted G D P) 90.7 89.7 90.6 9
D ebt service (in percent of exports ofgoods and services) 69.9 43.3 47.7 4
Real effective exchange rate –17.2 9.0 83.2 –2
G ross internat ional reserves(in billions of U .S. dollars)3 0.8 0.7 0.9
Financial variables
G eneral government balance(in percent of G D P) –7.9 –18.1 –8.8 –
G ross nat ional saving(in percent of G D P) 22.6 13.7 15.2 1
G ross domestic investment
(in percent of G D P) 24.5 16.7 17.7 1Broad money 51.3 48.0 38.4 1Interest rate (discount rate) 17.5 26.0 13.5
1Estimated.2Projected.3D ata o n gross internat ional reserves provided subsequent to the Bo ard discussion by the Nige
monetary authorities are as follows: 1992, $0.7 billion; 1993, $1.3 billion; 1994, $1.7 billion; an
1995, $1.4 billion.

8/12/2019 Lag Selection-IMF Dissemination Standard
http://slidepdf.com/reader/full/lag-selection-imf-dissemination-standard 27/44
Table 27
PAKISTAN: SELEC TED EC O NO MIC IND IC ATO RS(D ata as of Boar d discussion in December 1995; annual percent change unless otherwi se note
1992/ 93 1993/ 94 1994/ 95 1995/
Domestic economyReal G D P at factor cost 2.3 4.5 4.4Consumer price index
(end of period) 9.1 11.9 12.1
External economy
Exports, f.o .b. (in millions ofU .S. dollars) 6,782 6,685 7,884 8,98
Imports, f.o.b. (in millions of
U .S. dollars) –10,049 –8,685 –10,137 –10,92Current account balance
(in millions of U .S. dollars) –3,326 –1,650 –2,091 –2,66D irect investment 310 360 440 94Portfolio investment 137 289 1,090 11Capital account balance
(in millions of U .S. dollars) 2,737 3,234 2,338 2,06External debt (in percent
of G D P) 45.5 48.2 44.7 4D ebt-service ratio (in percent
o f G DP)3 22.5 22.7 22.5 2Real effective exchange rate2 2.1 –4.9 –0.3Net internat ional reserves
(in millions of U .S. dollars) 512 –1,880 –349 51
Financial variables
G eneral government balance –9.8 –6.8 –6.7 –
G ross national saving(in percent of G D P) 13.4 14.4 12.9 1Total investment
(in percent of G D P) 20.5 18.2 16.8 1Mo ney and q uasi-money4 18.0 16.0 16.6 1Nominal interest rate(s) 12.3 12.4 11.7 1
1Fiscal years (July 1 through June 30).2Fund staff estimates.3Excludes foreign currency deposit liabilities. Medium- and long-term d ebt service in percent

8/12/2019 Lag Selection-IMF Dissemination Standard
http://slidepdf.com/reader/full/lag-selection-imf-dissemination-standard 28/44
Table 28
PERU : SELECTED EC ON OMI C IN D IC ATO RS(D at a as of Boar d di scussion in December 1995; annual percent change unless otherwi se note
1992 1993 1994 19
Domestic economyReal G D P –1.8 5.6 13.0U nemployment rate 9.4 10.1 8.8C onsumer price index 73.2 48.5 23.7 1
External economy
Exports, f.o.b. 4.2 –0.5 29.6 2Imports, c.i.f. 15.9 –0.1 38.6 3Current account balance
(in percent of G D P) –4.8 –5.2 –5.4 –C apital and financial account balance 6.4 7.0 11.5External debt 3.7 4.2 7.2D ebt-service ratio (in percent of G D P) 60.9 64.8 57.1Real effective exchange rate 2.8 –7.5 6.5Net internat ional reserves (in millions of
U .S. dollars) 308 264 2,337 90
Financial variablesG eneral go vernment balance (beforeprivatization, in percent of G D P) 0.3 0.6 0.7
G ross national saving (in percent of G D P) 11.6 13.3 16.1 1G ross domestic investment
(in percent of G D P) 16.4 18.6 21.5 2Broad money (end of year) 84.1 75.2 46.8 2Interest rate (lending, end of year) 16.9 15.2 15.2
1Projected.

8/12/2019 Lag Selection-IMF Dissemination Standard
http://slidepdf.com/reader/full/lag-selection-imf-dissemination-standard 29/44
Table 29
PHILIPPINES: SELECTED ECONOMIC INDICATORS(D at a as of Boar d di scussion in September 1995; annual percent change unless otherwi se note
1992 1993 1994 199
Domestic economyReal G NP 1.6 2.1 5.3U nemployment rate (in percent) 9.8 9.3 9.5C onsumer price index 8.9 7.6 9.0
External economy
Exports (in billions of U .S. dollars) 9.8 11.4 13.5 1Imports (in billions of U .S. dollars) 14.5 17.6 21.3 2Current account balance
(in percent of G NP) –1.6 –5.5 –4.5 –D irect and portfolio investment
(net, in millions of U .S. dollars) 737 812 1,558 2,28C apital and financial account balance
(net, in millions of U .S. dollars) 1,693 2,306 4,498 2,43External debt (in billions of U .S. dollars) 30.9 34.3 37.7 4D ebt-service ratio3 17.0 17.1 17.4 1Real effective exchange rate (period average) 12.0 –2.3 6.6
Adjusted gross official reserves(in billions of U .S. dollars)4 5.2 4.7 6.4
Financial variables (in percent of GNP
unless otherwise noted)
C onsolidated public sector balance –1.9 –2.2 –0.5 –G ross national saving 19.1 17.4 19.2 2G ross national investment 21.0 23.4 23.5 2Broad money (end of period) 27.8 31.7 34.7 3Interest rate (annual average, in percent)5 16.1 12.3 13.6 1
1D ata revised subsequent to the Board discussion.2As of June 1995.3In percent of exports of go ods and services; after rescheduling.4G ross reserves less securities and gold pledged as collateral for short-term loans.5Interest rate on 91-day t reasury bills.

8/12/2019 Lag Selection-IMF Dissemination Standard
http://slidepdf.com/reader/full/lag-selection-imf-dissemination-standard 30/44

8/12/2019 Lag Selection-IMF Dissemination Standard
http://slidepdf.com/reader/full/lag-selection-imf-dissemination-standard 31/44
Table 31
TUNISIA: SELECTED ECONOMIC INDICATORS(D ata as of Boar d di scussion in Februar y 1996; annual percent change unless otherwi se note
1992 1993 1994 199
Domestic economyReal G D P 7.8 2.3 3.4C onsumer price index, average 5.8 4.0 4.7
External economy
Exports, f.o.b. (in U .S. dollar terms) 8.2 –6.5 23.7 1Imports, c.i.f. (in U .S. dollar terms) 24.2 –4.4 6.9 2C urrent account balance, excluding
grants (in percent of G D P) –7.0 –7.7 –2.9 –D irect investment (in percent of G D P) 3.1 4.3 2.4C apital account balance
(in millions of SD Rs) 861 794 674 67External debt (in millions of SD Rs,
end of period) 5,444 5,609 5,922 6,31D ebt-service ratio3 20.2 20.6 18.5 1Real effective exchange rate4 2.1 –1.2 0.5G ross official reserves
(in months of imports) 1.8 1.9 2.8
Financial variables
C entral government balance, includingforeign grants (in percent of G D P) –2.4 –2.9 –2.7 –
G ross national saving (in percent of G D P) 22.2 21.3 21.4 2G ross investment (in percent of G D P) 29.1 28.8 23.8 2Money and quasi-money 7.2 7.0 7.8Interest rate (in percent)5 11.3 8.8 8.8
1Estimated.2Reflecting mainly the depreciation o f the U .S. dollar against the currencies of Tunisia’s Euro
pean trading partners.3As percent o f export s of goo ds and services; including Fund charges.4Information Notice System.5Money market rate.

8/12/2019 Lag Selection-IMF Dissemination Standard
http://slidepdf.com/reader/full/lag-selection-imf-dissemination-standard 32/44
Table 32
G EORG IA: SELECTED ECO NOMI C IND IC ATORS(D at a as of Boar d discussion i n September 1995; annual percent change unless otherwi se note
1992 1993 1994 1995
Domestic economyReal G D P –44.8 –25.4 –11.4 –5Employment –21.2 –9.7 –0.1 .Consumer/retail prices
(period average)3 887 3,125 18,922 160
External economy
Exports, f.o.b. (in millions ofU .S. dollars) 267 457 381 181
Imports, c.i.f. (in millions ofU .S. dollars) 645 905 744 399
C urrent account balance (in millionsof U .S. dollars) –318 –485 –446 –191
C apital account balance (in millionsof U .S. dollars) 248 306 –19.3 –56
G ross external debt (percent of G D P) 8.2 51.7 80.2 42D ebt-service ratio (percent of exports
of goods and nonfactor services) 0.7 2.9 31.1 51
Exchange rate (coupons/U .S. do llar, period average)4 . . . . . . 1,102,300 .
Net int ernational reserves (in billionsof coupons, end of period) –152 –37.4 3,308 –22,358
Financial variables
G eneral government balance (inpercent of G D P; accrual basis) –37.3 –26.2 –16.5 –5
Broad mo ney (end of period;
including foreign currency deposits) 62 3,093 73,267 55,699Interest rate (commercial bank deposit
rate for coupons) . . . . . . 12.5–15 3
1January–June unless otherwise indicated.2Projection for entire year.3Before 1993, according t o the retail price index; after December 1993 according to a 295-go
Laspeyres index.4According to the Tbilisi Interbank Currency Exchange.

8/12/2019 Lag Selection-IMF Dissemination Standard
http://slidepdf.com/reader/full/lag-selection-imf-dissemination-standard 33/44
Table 33
MONG O LIA: SELECTED ECO NO MIC IND IC ATO RS(D ata as of Boar d di scussion in Februar y 1996; annual per cent change unless otherwi se noted
1994 19951 19
Domestic economyReal G D P 2.3 6.3Employment3 –12.7 0.9C onsumer prices (end of period) 66.3 53.1 25
External economy
Exports, f.o.b. (in millions of U .S. dollars) 367.0 451.0 43Imports, c.i.f. (in millions of U .S. dollars) 370.5 473.0 50C urrent account balance (excluding
official transfers; in percent of G D P) –5.8 –7.1 –D irect investment (in millions of
U .S. dollars) 7.0 10.0 1C apital account balance (in millions of
U .S. dollars) –36.2 5.8 3External debt (in percent of G D P)4 68.6 56.6 5D ebt service (in percent o f current receipts)5 16.3 14.1 1Exchange rate (Tug/U S$, end of period) 414 474 53
Net official internat ional reserves(in millions of U .S. dollars) 37.2 50.0 6
Financial variables
O verall budget balance (in percent of G D P) –24.6 –11.1 –1G ross national saving (in percent of G D P) 15.1 16.6 1G ross capital formation (in percent of G D P) 20.9 23.7 2Broad money 81.4 27.2 3Interest rates6 72–264 72–150
1Preliminary.2Revised program targets.
3Based on a sample of the largest enterprises.4Excluding debt of 10 billion transferable rubles to Russia and other former members of the
Council for Mutual Economic Assistance (CMEA).5Excluding servicing of medium- and long -term obligat ions in transferable rubles to Russia a
other former members of the C MEA.6Central bank clearing rate, in percent a year.

8/12/2019 Lag Selection-IMF Dissemination Standard
http://slidepdf.com/reader/full/lag-selection-imf-dissemination-standard 34/44
Table 34
PO LAND : SELECTED ECO NOMI C IND IC ATORS(D ata as of Boar d di scussi on in Januar y 1996; annual percent change unless otherwi se noted)
1992 1993 1994 19
Domestic economyReal G D P 2.6 3.8 6.0U nemployment rate (end of period) 13.6 16.4 16.0C onsumer price index (period average) 43.0 35.3 32.2 2
External economy
Exports, f.o .b. (in millionsof U .S. dollars) 13,997 13,585 16,950 22,97
Imports, c.i.f. (in millions
of U .S. dollars) 13,485 15,878 17,786 24,39C urrent account balance (in millions
of U .S. do llars)2 1,575 –85 2,128 3,46D irect investment (in millions
of U .S. dollars) 284 580 542 90C apital account balance (in millions
of U .S. dollars) –1,472 –679 –330 4,78External debt (end of period;
in billions of U .S. dollars) 48.2 48.7 40.9 3
External debt-service ratio3 20.0 21.5 16.2 1Commercial exchange rate depreciation
(–) against U .S. dollar (period average) –22.4 –24.9 –20.3Net international reserves (increase;
in millions of U .S. dollars) 1,614 634 2,534 9,20
Financial variables
G eneral government balance(in percent of G D P) –6.6 –2.9 –2.0 –
G ross national saving4 (in percentof nominal G D P) 17.0 15.5 17.8 1
G ross do mestic investment (in percentof nominal G D P) 15.2 15.6 15.5 1
Broad money (money and quasi-money)5 57.5 36.0 38.3 3Warsaw interbank offered rate
(end of year, in percent) 44.3 34.1 28.4 2
1
Fund staff estimates.2Including unrecorded trade.

8/12/2019 Lag Selection-IMF Dissemination Standard
http://slidepdf.com/reader/full/lag-selection-imf-dissemination-standard 35/44
Table 35
RO MANI A: SELEC TED EC O NO MIC IN D IC ATO RS(D ata, except for 1995 outturn, as of Boar d di scussi on i n December 1995;
annual percent change unless otherwi se noted)
1995__________________1992 1993 19941 Projection Outtu
Domestic economy
Real G D P –8.8 1.3 3.9 5.0U nemployment rate 170 25.9 7.8 –10.0 –1C onsumer/retail prices (average) 210 256 137 31 3
External economy
Exports, f.o.b.
(in billions of U .S. dollars) 4.3 4.9 6.1 7.4Imports, c.i.f.
(in billions of U .S. dollars) 5.4 6.0 6.6 8.9Current account balance
(in b illions of U .S. dollars)2 –1.5 –1.2 –0.5 –1.5 –D irect investment
(in billions of U .S. dollars) . . . . . . 0.3 0.4Capital account balance
(in billions of U .S. dollars) 1.4 1.3 1.2 1.2
G ross external debt(in b illions of U .S. dollars)3 3.4 4.4 5.5 5.94
D ebt-service rat io(in percent of current receipts) 8.1 5.8 8.9 13.0 1
Lei/U .S. dollar (end of period) 460 1,276 1,767 2,5425 2,57Net internat ional reserves
(in billions of lei, end of period)6 80 368 2,389 2,1925 3,42
Financial variables
G eneral government balance(in percent of G D P) –4.6 –0.1 –1.0 –2.8 –
G ross do mestic saving(in percent of G D P) 22.9 23.8 24.9 24.9 2
G ross fixed domestic investment(in percent of G D P) 18.8 17.9 20.0 21.0 2
Broad money (end of period) 80 141 138 527 6Interest rate (weighted National
Bank of Romania average,
in percent) 44 416 78 565 6

8/12/2019 Lag Selection-IMF Dissemination Standard
http://slidepdf.com/reader/full/lag-selection-imf-dissemination-standard 36/44
Table 36
RU SSIA: SELECTED EC O NO MIC IND IC ATO RS(D ata, except for ful l year 1995, as of Boar d di scussi on in September 1995;
percent change over same per i od i n previ ous year unless otherwi se noted)
1995__________________1992 1993 1994 Jan.–Jun. Full y
Domestic economy
Real G D P 1 –19 –12 –15 –4 –4Registered unemployment2 0.8 1.1 2.1 2.7 3Open unemployment2 4.8 5.5 7.1 7.7 8C onsumer price index, average 1,353 896 302 186 190
External economy
Exports, f.o.b. (in billions ofU .S. do llars)3 52.1 58.3 69.6 36.9 78
Imports, c.i.f. (in billions ofU .S. do llars)3 46.5 44.2 55.2 28.9 60
Current account balance(in billions of U .S. dollars)3 –4.2 2.6 3.4 2.9 4
Capital account balance(in billions of U .S. dollars)3 . . . –12.3 –19.3 –2.3 0
External debt . . . . . . 120.6 . . . 115D ebt-service ratio4 . . . . . . 24.9 . . . 20Average exchange rate
(rubles/U .S. dollar) 222 1,034 2,262 4,594 4,560Net international reserves5 538 300 1 38 40
Financial variables
Federal government balance(in percent of G D P)6 –11.1 –6.9 –11.1 –3.4 –4
Enlarged government balance(in percent of G D P)7 –18.9 7.6 –10.1 –2.9 –4
G ross national saving . . . . . . 28.9 . . . 27G ross national investment . . . . . . 27.7 . . . 25Base money5 1,070 647 186 71 118Net domestic assets of the
monetary authorities3, 8 531 347 185 15 78Refinance rate of central bank
(end of period, percent) 80 210 180 180 160
1G oskomstat has recently revised its G D P stat istics for 1992 and 1994 The figures shown here

8/12/2019 Lag Selection-IMF Dissemination Standard
http://slidepdf.com/reader/full/lag-selection-imf-dissemination-standard 37/44
Table 37
SLOVAK REPU BLIC : SELECTED ECO NO MIC IND IC ATORS(D ata, except for 1995 outturn, as of Boar d di scussion in September 1995;
annual percent change unless otherwi se noted)
1995_________________1992 1993 19941 Jan.–June Outt
Domestic economy
Real G D P –7.0 –4.1 4.8 6.1 7.U nemployment rate (in percent
of labor force, period average) 11.3 12.8 14.6 14.3 13.C onsumer price index
(C PI ; 12-month change) 9.1 25.0 11.7 10.5 7.
External economyExports, f.o.b. (in billions of
U .S. dollars) 6.5 5.4 6.7 4.2 8.Imports, c.i.f. (in billions of
U .S. dollars) 7.2 6.42 6.6 4.2 8.C urrent account balance 0.03 –0.6 0.7 0.3 0.Foreign direct investment, net
(in billions of U .S. dollars) 0.1 –0.4 0.3 0.1 0.O ther medium- and long-term
capital (in billions of U .S. dollars) 0.3 0.6 0.7 0.1 0.O verall balance (in b illions of
U .S. dollars) –0.5 0.4 1.4 0.6 1.External debt (in billions of
U .S. do llars, end of period)4 2.8 3.4 3.9 . . . 4.D ebt-service ratio
(in percent of total exports) 3.3 8.9 8.7 . . . 12.Real effective exchange rate
(C PI-based; average) 1.1 0.8 –0.3 1.5 1.
O fficial reserves (end of period;in billions of U .S. dollars) 0.8 0.9 2.2 3.1 3.
Financial variables
G eneral government balance(in percent of G D P) –12.8 –7.62 –1.4 2.0 0.
G ross national saving(in percent of G D P) 23.23 18.05 22.8 21.56 . .
G ross do mestic investment
(in percent of G D P) 22.83 21.95 17.1 19.56 . .B d ( d f d)

8/12/2019 Lag Selection-IMF Dissemination Standard
http://slidepdf.com/reader/full/lag-selection-imf-dissemination-standard 38/44
Table 38
U KRAINE: SELECTED EC O NO MIC IND IC ATO RS(D ata as of Boar d di scussi on in Januar y 1996; percent change over same per iod i n previ ous ye
unless otherwi se noted)
1992 1993 1994 19
Domestic economy
Real G D P –17 –17 –23 –Employment –2.0 –2.3 –3.8C onsumer price index 1,210 4,735 891 37
External economy
Exports, f.o.b. (in billions of U .S. dollars) 11.3 12.8 11.8Imports, c.i.f. (in billions of U .S. dollars) 11.9 15.3 14.2
C urrent account balance (in millionsof U .S. dollars) –621 –854 –1,395 –1,38
D irect investment (in millionsof U .S. dollars) 170 200 91 12
C apital account balance (in millionsof U .S. dollars) –2,087 –317 –238 –2,20
External debt service (in millionsof U .S. dollars) 16 197 1,787 1,53
D ebt-service ratio 0.1 1.2 12.4
Exchange rate (Krb/U S$ auction rate;end of period) 749 25,000 104,200 183,00
Net international reserves (in millionsof U .S. dollars; end of period) . . . . . . 284 –48
Financial variables
G eneral government balance(in percent of G D P) –29.3 –11.8 –8.2 –
G ross national investment
(real percentage change) –36.9 –10.3 –22.7Broad money (M3)2 921 2,103 465 10Statutory refinance rate
(in percent a year; end of period) . . . . . . 252 10
1Fund staff estimates.2Foreign currency deposits valued at parallel exchange rates throug h September 1994. For pur
poses of comparison, foreign currency components of actual observations for 1995 are valued at
program exchange rate, which is an accounting exchange rate.
8/12/2019 Lag Selection-IMF Dissemination Standard
http://slidepdf.com/reader/full/lag-selection-imf-dissemination-standard 39/44
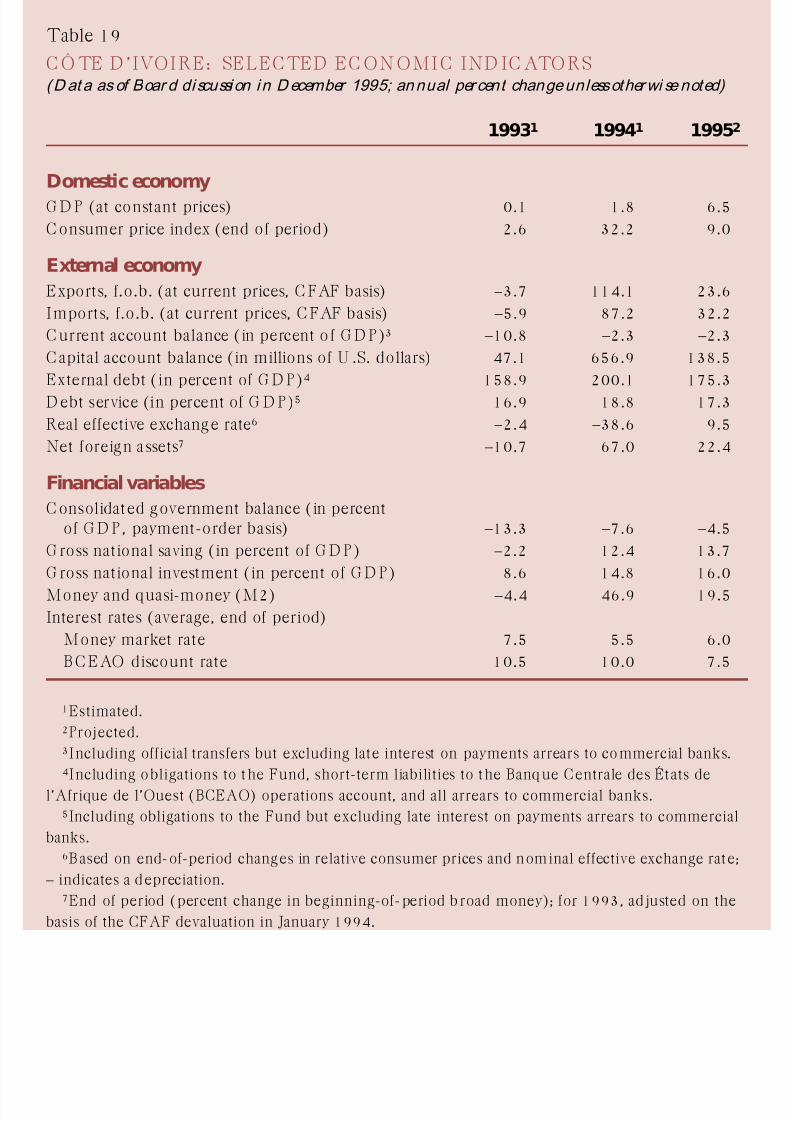
able 39
ELECTED FINANCIAL INDICATORSn m il li ons of SDRs)
Financial Year Ended April 30_________________________________________________________________________1989 1990 1991 1992 1993 1994 1995
Dur in g peri od
otal disbursements 2,682 5,266 6,823 5,903 5,877 5,903 11,178
urchases by facility (G RA)1 2,128 4,440 6,248 5,294 5,284 5,241 10,592
Stand-by and first credit tranche 1,702 1,183 1,975 2,343 2,940 1,052 7,587Extended Fund facility 188 2,449 2,146 1,571 2,254 746 1,595Co mpensatory and cont ingency
financing facility 238 808 2,127 1,381 90 718 287Systemic transformation facility — — — — — 2,725 1,123
oans under SAF/ESAF arrangements 554 826 575 608 593 662 587Special D isbursement Account resources 380 584 180 138 49 68 19ESAF Trust resources 174 242 395 470 544 594 568
y region 2,682 5,267 6,823 5,903 5,877 5,903 11,178Africa 701 1,289 577 740 377 1,185 1,022Asia 469 525 1,714 1,476 1,806 690 383Europe 338 268 1,960 1,516 1,343 3,258 2,896Middle East — 66 — 333 26 11 76Western H emisphere 1,174 3,119 2,572 1,838 2,325 758 6,801
epurchases and repayments 6,705 6,399 5,608 4,770 4,117 4,509 4,231
epurchases 6,258 6,042 5,440 4,768 4,081 4,343 3,984rust Fund and SAF/ESAF loan repayments 447 357 168 2 36 166 247
End of per iod
otal outstanding credit
provided by Fund 25,520 24,388 25,603 26,736 28,496 29,889 36,837
f which:G eneral Resources Account 23,700 22,098 22,906 23,432 24,635 25,533 32,140
Special D isbursement Account 965 1,549 1,729 1,865 1,879 1,835 1,651Administered account s
Trust Fund 682 326 158 158 158 105 102ESAF Trust2 174 416 811 1,281 1,824 2,416 2,944
ercentage change in total outstanding credit –14 –4 5 4 7 5 19umber of indebted countries 83 87 81 82 90 93 99
1Excludes reserve tranche purchases.2Includes Saudi Fund for D evelopment associated loans.

8/12/2019 Lag Selection-IMF Dissemination Standard
http://slidepdf.com/reader/full/lag-selection-imf-dissemination-standard 40/44
able 40
RREARS TO THE FUND OF COUNTRIES WITH OBLIGATIONS OVERDUE BY SIX MONTHS OR MOREn m i ll i ons of SDRs; end of per iod)
Financial Year Ended April 30_______________________________________________________________________________1991 1992 1993 1994 1995
mount of overdue obligations 3,377.7 3,496.0 3,006.4 2,911.3 2,982.6 2
umber of countries 9 10 12 9 8
Of which:G eneral D epartment 3,171.7 3,274.1 2,768.3 2,729.5 2,809.1Number of countries 9 10 12 9 8
SD R D epartment 27.3 37.5 49.9 51.4 46.3Number of countries 6 7 9 8 5
Trust Fund 178.7 184.3 188.3 130.4 127.2Number of countries 6 6 6 4 4
umber of ineligible members 8 8 7 5 5

8/12/2019 Lag Selection-IMF Dissemination Standard
http://slidepdf.com/reader/full/lag-selection-imf-dissemination-standard 41/44
able 41
RREARS TO THE FUND OF COUNTRIES WITH OBLIGATIONS OVERDUE BY SIX MONTHS OR MORE,Y TYPE AND D U RATIO N, AS OF APR IL 30, 1996n mil li ons of SDRs)
By Type By Duration_______________________________ ______________________________________General Dept. SDR Trust Less than
Total (incl. SAF) Dept. Fund one year 1–2 years 2–3 years o
aq 25.2 0.1 25.1 — 3.0 4.9 3.8beria 433.6 389.4 13.5 30.7 11.1 11.9 13.3
malia 181.3 169.0 4.6 7.7 7.2 8.1 10.2dan 1,183.3 1,101.5 — 81.8 29.2 30.3 35.3
ugo slavia, Federal Republic o f(Serbia/Montenegro) 72.0 62.1 9.9 — 8.9 14.3 23.8
aïre 279.6 279.6 — — 29.5 50.9 67.3_______ _______ ____ _____ ____ _____ _____ _otal 2,174.9 2,001.6 53.1 120.2 88.9 120.4 153.7 1

8/12/2019 Lag Selection-IMF Dissemination Standard
http://slidepdf.com/reader/full/lag-selection-imf-dissemination-standard 42/44
Table 42
C H ANG E I N SD R VALU ATIO N BASKET( I ni t i al percentage weights; amounts of cur rency uni ts
in parentheses)
Currency January 1, 1996 January 1, 199
U .S. dollar 39 (0.582) 40 (0.572)D eutsche mark 21 (0.446) 21 (0.453)Japanese yen 18 (27.2) 17 (31.8)French franc 11 (0.813) 11 (0.800)
Pound sterling 11 (0.105) 11 (0.0812)

8/12/2019 Lag Selection-IMF Dissemination Standard
http://slidepdf.com/reader/full/lag-selection-imf-dissemination-standard 43/44
able 43
RANSFERS OF SDRS
n mi lli ons of SDRs)
Annual Averages1 Financial Years Ended_____________________________________________________1/ 1/ 70– 5/ 1/ 78– 5/ 1/ 81– 5/ 1/ 83– 5/ 1/ 87– April 30 1/__________________________4/ 30/ 78 4/ 30/ 81 4/ 30/ 83 4/ 30/ 87 4/ 30/ 93 1994 1995 1996 4/
ransfers among participants
and prescribed holders
ransactions with designationFrom own holdings 221 294 815 165 — — — —From purchase of SD Rs from Fund 43 1,150 1,479 1,744 164 — — —
ransactions by agreement 439 771 1,262 3,121 6,023 3,122 8,987 8,931rescribed operations — — 277 520 1,453 406 124 1,951und-related operations — — — 43 203 436 301 704et interest on SD Rs 42 161 259 285 410 121 174 319Total 744 2,377 4,092 5,878 8,254 4,085 9,586 11,905 1
ransfers from participants
to General Resources Account
epurchases 306 809 702 991 1,956 642 1,181 5,572harges 259 620 1,233 2,574 1,887 1,425 1,386 1,985uota payments 24 1,703 175 1,591 2,151 71 24 70terest received on GeneralResources Account holdings 16 135 551 307 81 336 262 53
ssessments 1 1 2 4 4 4 4 4Total 606 3,269 2,662 5,466 6,079 2,478 2,857 7,683
ransfers from General Resources
Account to participants and
prescribed holders
urchases 208 1,474 2,227 2,554 2,067 2,676 5,970 6,460epayments of Fund borrowings — 88 86 614 1,261 300 862 —
nterest on Fund borrowings 4 27 183 443 295 162 97 —
exchange for other members’currenciesAcquisitions to pay charges — 3 95 896 388 166 99 49Acquisitions to make quota
payments — 114 — — — — — —Reconstitution 175 33 — — — — — —
emuneration 26 165 604 1,536 1,021 958 815 1,092ther 29 7 22 17 53 108 51 259Total 442 1,911 3,217 6,059 5,085 4,370 7,894 7,859
otal transfers 1,792 7,556 9,971 17,404 19,418 10,933 20,336 27,448 3
eneral Resources Account
holdings at end of period 1,371 5,445 4,335 1,960 7,930 6,038 1,001 825
1The first co lumn covers the period from t he creation of the SD R unt il the Second Amendment t o t he Articles of Agreement; the second co lume period of t he SD R allocatio ns in the third basic period and the Seventh G eneral Review quo ta increases; after an intervening period representeird column, the fourth column covers the period of the Eighth General Review quota increases and before the introduction of the two-way arranfacilitat e transactions by ag reement; and t he fifth column co vers, except for the three most recent financial years, the period since the designat io
nism became of a precautionary nat ure.

8/12/2019 Lag Selection-IMF Dissemination Standard
http://slidepdf.com/reader/full/lag-selection-imf-dissemination-standard 44/44
Table 44
TEC H NI C AL ASSISTANC E D ELI VERY( I n person-year s)
1992/ 93 1993/ 94 1994/ 95 1995/
Fund technical assistance budget 188.8 194.0 220.0 211Staff 90.0 100.9 115.7 108H eadq uarters-based consultants 21.2 20.5 22.1 23Experts 77.6 72.6 82.3 79
External technical assistance resources 55.0 68.6 80.5 97
U nited Nations D evelopment Program 28.9 19.3 16.6 25Japan 20.3 40.1 51.4 65O ther 5.8 9.2 12.4 7
Total technical assistance resources 243.8 262.6 300.6 309
Total resources provided,
by department
Monetary and Exchange Affairs D epartment 96.8 105.7 138.1 137Fiscal Affairs D epartment 82.5 94.8 95.1 99Statistics D epartment 40.5 35.5 37.9 39IMF Institute 11.2 13.0 14.6 14Legal D epartment 7.7 7.5 7.9 11O ther 5.0 6.0 7.0 7
Total regional use by department 242.9 243.3 271.1 280
African D epartment 71.0 63.8 60.6 62C entral Asia D epartment 24.6 25.6 27.7 27European I D epartment 24.3 24.6 27.8 24European I I D epartment 60.2 65.9 79.3 73
Middle Eastern D epartment 10.6 11.5 16.9 23Southeast Asia and Pacific D epartment 17.8 15.6 23.6 25Western H emisphere D epartment 34.4 30.9 27.4 32Interregional — 5.4 7.9 11
Related Documents