Written by ICON-INSTITUT Public Sector GmbH John McGrath and Jasmina Behan February - 2018 Social Europe A comparison of shortage and surplus occupations based on analyses of data from the European Public Employment Services and Labour Force Surveys Labour shortages and surpluses 2017

Welcome message from author
This document is posted to help you gain knowledge. Please leave a comment to let me know what you think about it! Share it to your friends and learn new things together.
Transcript

Written by ICON-INSTITUT Public Sector GmbH
John McGrath and Jasmina Behan
February - 2018
Social Europe
A comparison of shortage and
surplus occupations based on analyses of data from the
European Public Employment
Services and Labour Force Surveys
Labour shortages and surpluses 2017
Labour shortages and surpluses 2017
2018 2
EUROPEAN COMMISSION
Directorate-General for Employment Social Affairs and Inclusion Directorate B mdash Employment Unit B1mdash Employment Strategy
Contact Jean-Pierre Callais BenoicirctPaul
E-mail EMPL-PES-SECRETARIATeceuropaeu
European Commission B-1049 Brussels
Labour shortages and surpluses 2017
2018 3
Directorate-General for Employment Social Affairs and Inclusion European Network of Public Employment Services (PES)
A comparison of shortage and surplus occupations based on
analyses of data from the
European Public Employment Services and Labour Force
Surveys
Labour shortages and surpluses 2017
Labour shortages and surpluses 2017
2018 4
Directorate-General for Employment Social Affairs and Inclusion European Network of Public Employment Services (PES)
LEGAL NOTICE
This document has been prepared for the European Commission however it reflects the views only of the authors and the Commission cannot be held responsible for any use which may be made of the information contained therein
More information on the European Union is available on the Internet (httpwwweuropaeu)
Luxembourg Publications Office of the European Union 2016
ISBN 978-92-79-81021-3 doi 10276731262 copy European Union 2016
Europe Direct is a service to help you find answers
to your questions about the European Union
Freephone number ()
00 800 6 7 8 9 10 11
() The information given is free as are most calls (though some operators phone boxes or hotels may charge you)
Labour shortages and surpluses 2017
2018 5
Directorate-General for Employment Social Affairs and Inclusion European Network of Public Employment Services (PES)
Table of contents
Executive Summary 6
1 Introduction 9 11 The scope of the study 9 12 Identifying and evaluating shortages and surpluses 9 13 Exploring the causes of shortages 10
2 Profile of shortage and surplus occupations in 2017 11 21 Introduction 11 22 Profile of the most extensive shortage occupations 11 23 Profile of high magnitude shortages 12 24 Occupational groups by shortage magnitude 13 25 Profile of the most extensive surplus occupations 14 26 Profile of high magnitude surpluses 15 27 Broad occupational groups by surplus magnitude 16 28 Comparison of shortages and surpluses by broad occupation 17 29 Cross-check with LSF data 17 210 Conclusions 18
3 Profile of shortages and surpluses in space and time 19 31 Introduction 19 32 PES methods used for identifying shortages and surpluses 19 33 Geographic distribution of shortages and surpluses 20 34 Tracking shortages over time 23 35 3-digit vs 4-digit 24 36 Conclusions 25
4 The causes of skill shortages and potential solutions 26 41 Introduction 26 42 The role of skills and labour shortages in skills imbalances 26 43 Location of skill imbalances and cross border mobility 27 44 Assessing gender composition of surpluses 28 45 Conclusions 29
5 Conclusions and recommendations 31 51 Conclusions 31 52 Recommendations 31
Annex 1 Data collection template 35
Annex 2 Shortage occupations 37
Annex 3 Surplus occupations 42
Annex 4 The ratio of unemployed to new hires 45
Labour shortages and surpluses 2017
2018 6
Directorate-General for Employment Social Affairs and Inclusion European Network of Public Employment Services (PES)
EXECUTIVE SUMMARY
This is the third study on imbalances in the European labour market using a survey of
national Public Employment Services (PES) The top raking surplus and shortage
occupations (ranked by the number of reporting PES) in the EU Member States Norway
Iceland and Switzerland identified in this study are presented in Table 1E
Table 1E Top shortage and surplus occupations in 2017
Shortage Surplus
Cooks General office clerks
Plumbers and pipe fitters Shop sales assistants
Generalist medical practitioners Advertising and marketing professionals
Welders and flamecutters Bank tellers and related clerks
Heavy truck and lorry drivers Sociologists anthropologists etc
Metal working machine tool setters Child care workers
Nursing professionals Hairdressers
Software developers Journalists
Agric and ind machinery mechanics Cashiers and ticket clerks
Cleaners and helpers in offices hotels etc Cleaners and helpers in offices hotels etc
Commercial sales representatives Hand packers
Specialist medical practitioners Mail carriers and sorting clerks
Systems analysts Photographers
Bricklayers and related workers Receptionists (general)
Building and related electricians Tailors dressmakers furriers and hatters
Butchers fishmongers and related
Motor vehicle mechanics and repairers
Nursing associate professionals
Sheet-metal workers
Shop sales assistants
Waiters
Positive findings
The current study attracted a greater level of engagement by the PES then
previously with a higher number of PES providing data on shortagessurpluses
A comparison between the lists of shortage occupations and their rankings in
2015 2016 and 2017 showed a high level of consistency
The use of 4-digit ISCO classification of occupations provided more accurate and
detailed information than the more aggregated 3-digit classification used in the
previous studies
In general the PES demonstrated a capability to distinguish between shortages
caused primarily by skill deficits and shortages which primarily reflected an
unwillingness of appropriately qualified job-seekers to work in the occupation in
question (ie labour shortages)
Labour shortages and surpluses 2017
2018 7
Directorate-General for Employment Social Affairs and Inclusion European Network of Public Employment Services (PES)
The list of shortage and surplus occupations identified through the PES are
consistent with the recently reported Labour Force Survey (LSF) data in particular
the ratio of unemployed to new hires (the ratio is typically low for skill shortages
and high for surpluses and labour shortages)
A clear distinction has been identified between the competences associated with
shortages and surpluses Shortages were dominated by technical competences
(eg occupations at professional associate professional and craft level in the
areas of software engineering and healthcare) while surpluses with non-technical
competencies (eg sales admin arts and humanities)
Despite a relatively low number of PES providing data on surplus occupations a
considerable number of cross-border matching possibilities between shortage
occupations in some countries and surplus occupations in others were identified
The concern that shortagessurpluses reported by the PES would be skewed
towards lower skilled occupations (potentially reflecting the type of vacancies
employers select to advertise through PES and the profile of the job-seekers)
proved to be unfounded the highest number of both shortage and surplus
occupations identified were in the professional group This was partially due to the
use of sources other than PES administrative data to identify imbalances
Negative findings
A number of PES could not provide data on surpluses Typically those were PES
that relied on data sources other than administrative data (eg employer surveys
immigration data etc) In addition many of PES who submitted data on
surpluses listed very few occupations (less than 20) While this may be a
reflection of a more buoyant EEA labour market it limited the extent to which
cross-border matching possibilities could be identified
The data collected on the gender composition of shortage and surplus occupations
was poor It highlighted that gender imbalances at occupational level are best
analysed using other sources (eg LSF data) in conjunction with the PES data
The analysis highlights that only about one in three PES could provide data on
shortages and surpluses at sub-national level (NUTs 2 3 or 4)
Limiting the list of occupations to 20 irrespective of the size and characteristics of
the local labour market might have resulted in the lack of obvious patterns in the
geographical distribution of shortages and surpluses
Recommendations
A campaign should be launched to raise awareness of the importance of
comprehensive information on shortages and surpluses This could involve the
circulation of the report and presentation of key findings to the national
authorities and relevant groups (eg Advisors for European PES Affairs and the
Eures coordination group)
In order to properly assess labour market imbalances and identify possibilities for
cross-country matching of shortages and surpluses a model for the systematic
Labour shortages and surpluses 2017
2018 8
Directorate-General for Employment Social Affairs and Inclusion European Network of Public Employment Services (PES)
collection of data is proposed and summarised in Figure 1E The model draws
from the findings of three bottleneck studies over the period 2015-2017
Figure 1E Model for gathering data on shortage and surplus occupations
Sources of data on surpluses PES data from other relevant agencies (EU legislation) Dimensions of shortagessurpluses extent (number of reporting PES) and severity (high or low magnitude) Type of shortage skill vs labour shortages Classification of occupations used ISCO 08 4-digit codes (or translation into these codes) Accuracy test cross-check with LSF data (ratio of unemployed to new hires) Gender balance assessment LFS data on employment at occupational level by gender PES job seekers Regional balance assessment LSF data data from relevant agencies Number of occupations reporting should be extended beyond 20 occupations but with upper limit (eg 50) Timing of imbalance assessment September
(features added to the methodology in this study highlighted in red)
Labour shortages and surpluses 2017
2018 9
Directorate-General for Employment Social Affairs and Inclusion European Network of Public Employment Services (PES)
1 INTRODUCTION
This is the third report in a series of annual reports which provide an analysis of shortage
and since 2016 surplus occupations as identified by the European PES Each report has
a somewhat different focus The focus of this report is to ultimately draw on the findings
in the whole series and create a model which can accurately and comprehensively
identify imbalances and cross-border matching possibilities in a manner which is of
practical use to EURES and the national VET authorities in the EEA countries
Facilitating the matching of skills and jobs across borders in the EU contributes to the
better functioning of labour markets in the EU as pursued by the EURES network1
Supporting the identification of skills shortages and the better matching of skills of job-
seekers with the needs of employers is also among the objectives of the European
Network of Public Employment Services (PES Network)2
11 The scope of the study
A total of thirty-three PES were asked to submit data on shortage and surplus
occupations These PES included the national PES from twenty-seven EU Member States
and the three regional PES from Belgium As in the case of the studies in 2015 and 2016
the national PES of Iceland and Norway were also requested to submit data while the
national PES of Switzerland was included for the first time in 2017
Table 11 below shows the response of the PES to these requests A total of twenty-eight
PES submitted data on shortage occupations while a total of eighteen submitted data on
surplus occupations This represents an increase of two PES compared to the 2016 study
and an increase of five PES compared to the 2015 study in respect of the number of PES
who provided a list of shortage occupations and an increase of five PES compared to the
number of PES who provided lists of surplus occupations in 2016
As shown in chapter three below the main reason for the lower response in the case of
surplus occupations were the methods used by the PES for identifying shortage
occupations Specifically many of the PES used employer surveys as their exclusive
source of information on shortages and these do not provide data on surplus
occupations To improve on data coverage data could be collected from other bodies
Table 11 Participating PES
Public employment services which submitted data on shortage occupations
AT BE - Actiris BE - Le Forem BE - VDAB BG CH CY DE DK EE FI FR HR HU IE IT IS LT LU LV MT NL N0 PL PT SE SK SI
Public employment services which submitted data on surplus occupations
LF BG CH CY DK EE FI FR HR HU IE IS LT LV NL PL SE SK
12 Identifying and evaluating shortages and surpluses
One of the core objectives of this study was to identify shortage and surplus occupations
using the most detailed (ie ISCO rsquo08 4-digit codes) data available to the PES (in the
future where necessary PES could augment its data using other sources) The analysis
uses two dimensions to quantify shortage and surplus occupations the most widely
1 Regulation (EU) 2016589 of 13 April 2016 on a European network of employment services (EURES) workers
access to mobility services and the further integration of labour markets 2 As defined in Article 3 of the Decision 5732014EU on Enhanced Co-operation between Public Employment
Services of 15 May 2014
Labour shortages and surpluses 2017
2018 10
Directorate-General for Employment Social Affairs and Inclusion European Network of Public Employment Services (PES)
reported (ie reported by the most PES) shortage and surplus occupations and the
occupations with the most severe shortages and surpluses
Owing to limitations of space however only lists of between twenty to thirty individual
occupations could be displayed here However it should be noted that almost one
thousand shortage occupations were reported by the twenty-eight PES of which 282 were
different occupations The number of surplus occupations reported by eighteen PES were
381 of which 196 were different occupations3
An attempt is made to evaluate the accuracy of the PES identification of shortage and
surplus occupations by comparing the most widely reported shortages and surpluses with
the ratio of unemployed to new hires at EU level
13 Exploring the causes of shortages
This study differs in several respects from the two previous studies Firstly this study
attempts to identify the causes of shortage and surplus occupations Accordingly a
number of new questions were added to the questionnaire specifically on the nature of
the shortage (ie was it due to a skills deficit or to a shortage of labour) and ndash in the
case of surplus occupations - the gender composition While many of the PES provided a
classification of shortages in terms of labour versus skills shortage the response to the
question on gender share was disappointing
The data collection template (Annex 1) also inquired of the extent to which the PES could
provide the data at regional level The purpose of including this question was to assess
the feasibility of undertaken a future edition of this study at regional rather than national
level Unfortunately the response to this question was also disappointing
Despite the rather disappointing response to some of the new questions the study does
provide a wealth of data on shortage and surplus occupations The vast majority of PES
provided roughly twenty specific occupations which they considered to be in short supply
and rated the degree of severity of the shortage A number of PES provided a
significantly greater number than twenty shortage occupations
The existence of the previous two studies provided the basis for an assessment of the
extent to which the shortages persisted over time The fact that data on the shortages
and surplus occupations in the previous studies was at a higher level of aggregation (ie
the 3-digit occupation codes) also allowed an assessment to be made of the level of
aggregation which is required to accurately identify shortage and surplus occupations
The analysis herein conclusively demonstrated that the highest level of disaggregation
was required (ie the 4-digit occupation codes) for accurate identification as the 3-digit
codes contained occupations which were not in shortage or surplus (see chapter 3
below)
The analysis also explores the extent to which the same occupations are classified as
shortages in some countries and surpluses in others thereby creating the possibility that
policies designed to enhance cross-border matching between such occupations might
alleviate some skill and labour market imbalances in the EEA group of countries
3 A list of the occupations is shown in annexes two and three attached
Labour shortages and surpluses 2017
2018 11
Directorate-General for Employment Social Affairs and Inclusion European Network of Public Employment Services (PES)
2 PROFILE OF SHORTAGE AND SURPLUS OCCUPATIONS IN 2017
21 Introduction
This chapter contains a detailed analysis of the data on shortage and surplus
occupations The data is analysed from a number of perspectives such as the most
frequently reported shortages and surpluses and their relative magnitude The PES were
requested to identify a minimum of twenty shortage occupations and twenty surplus
occupations However while twenty-eight PES identified at least roughly twenty shortage
occupations only eighteen PES identified any surplus occupations
22 Profile of the most extensive shortage occupations
Table 21 shows the shortage occupations reported by the most PES in 2017 The
twenty-eight PES who submitted data on shortage occupations is two more than in the
2016 report and five more than the number that submitted such data in 2015
The Table shows that over half of all PES (sixteen) reported shortages of cooks making
lsquocooksrsquo the occupation reported by the most PES However this figure underestimates
the seriousness of the shortage of persons qualified in cooking skills because five PES
also reported shortages of chefs and four PES reported shortages of bakers and pastry-
makers
Within the top twenty-one shortage occupations the health related occupations
dominated the list with four different occupations these were lsquogeneralist medical
practitionersrsquo lsquonursing professionalsrsquo lsquospecialist medical practitionersrsquo and lsquoassociate
professional nursesrsquo The difference between professional and associate professional
nurses may reflect the fact that nursing qualifications differ across the EEA area
specifically nurses in some countries require a degree to practice in other countries
nursing is at sub-degree level
Table 21 Top 21 shortage occupations (4-digit level)
Occupation
Number of PES reporting occupation as shortage
Occupation
Number of PES reporting occupation as shortage
Cooks 16 Systems analyst 10
Plumbers and pipe fitters 13 Cleaners and helpers in offices hotels etc
10
Generalist medical practitioners 13 Bricklayers and related workers 9
Welders and flame cutters 12 Building and related electricians 9
Heavy truck and lorry drivers 11 Butchers fishmongers and related food
9
Metal workers machine tool setting and operators
11 Motor vehicle mechanics and repairers
9
Nursing professionals 11 Nursing associate professionals 9
Software developers 11 Sheet-metal workers 9
Agriculture and industrial machinery repairers
10 Shop sales assistants 9
Commercial sales representatives 10 Waiters 9
Specialist medical practitioners 10
Labour shortages and surpluses 2017
2018 12
Directorate-General for Employment Social Affairs and Inclusion European Network of Public Employment Services (PES)
There may be an argument therefore for combining the associate and professional
category when assessing the true extent of the shortage of nurses This argument is
particularly compelling in respect of those PES who report a shortage of associate
professional nurses but not a shortage of professional nurses There are four such PES
Denmark Estonia Luxemburg and Slovenia If associate professional nurses are
essentially doing the same job as professional nurses in these countries the number of
PES reporting a shortage of professional nurses is in effect fifteen rather than eleven
Indeed confining the shortage occupations to those reported by nine or more PES may
disguise the true extent of shortages in health related occupations There were many
health related occupations which were identified by less than nine PES as shortage
occupations For example seven PES reported shortages of lsquohealthcare assistantsrsquo five
reported shortages of lsquophysiotherapistsrsquo and three reported shortages of lsquomidwivesrsquo Both
Germany and France reported many shortages of specialists within the lsquonursersquo and lsquoother
healthcare professionalsrsquo categories
Shortages of both lsquosoftware developersrsquo and lsquosystems analystsrsquo appear to be quite
widespread as these occupations were reported as being in shortage by ten and eleven
PES respectively The impression of widespread shortages is supported by the fact that a
number of software-related occupations such as lsquoapplication programmersrsquo lsquoother
software and application developersrsquo and lsquoweb and multi-media developersrsquo were all
reported as shortage occupations by six PES
The main building related crafts such as lsquoelectriciansrsquo lsquoplumbersrsquo and lsquobricklayersrsquo were
also prominent in the list Indeed only the occupation of lsquocookrsquo was reported as a
shortage occupation by more PES than lsquoplumbersrsquo
In addition eight PES reported experiencing shortages of lsquoconcrete finishersrsquo and
lsquocarpenters and joinersrsquo while six PES reported shortages of lsquoroofersrsquo and lsquoplasterersrsquo
But it is the engineering occupations which demonstrate that shortages may be quite
pervasive in a group of occupations despite the fact that they are not included in the list
of specific occupations which were reported by the most PES Thus lsquocivil engineersrsquo
lsquomechanical engineersrsquo and both electrical and electronic engineering technicians just
missed inclusion in Table 21 above as they were all reported as shortage occupations by
eight PES In addition both lsquoelectronic engineersrsquo and lsquomechanical engineering
techniciansrsquo were reported as shortage occupations by seven PES
The teaching professions also just missed inclusion in Table 21 because primary school
teachers were reported as a shortage occupation by eight PES and secondary school
teachers by seven PES
Two occupations which feature in surveys on skill shortages and which are not included in
Table 21 are lsquoaccountantsrsquo and lsquotoolmakersrsquo Both occupations were reported as shortage
occupations by six PES
The total list of occupations which were identified by at least one PES as a shortage
occupation is shown in Annex 2 of this report
23 Profile of high magnitude shortages
In addition to identifying shortage occupations the PES were also asked to rank the
occupations in terms of the severity of the shortage Table 22 below lists those
occupations for which the PES identified shortages of high magnitude
The number of PES who identify occupations which have shortages of high magnitude will
be lower than the number of PES who identify occupations which have shortages
irrespective of the magnitude of those shortages As shown in Table 21 the list of the
top twenty-one shortage occupations have been identified by at least nine different PES
Labour shortages and surpluses 2017
2018 13
Directorate-General for Employment Social Affairs and Inclusion European Network of Public Employment Services (PES)
In contrast the list of occupations which have been identified by the PES as having
shortages of a high magnitude includes occupations which have been identified by as few
as two PES Therefore occupations which have not been included in the twenty one
shortage occupations identified by the most PES may qualify for inclusion in the list of
occupations with shortages of high magnitude
Table 22 High magnitude shortages (4-digit level)
Occupation Number of PES stating high magnitude of shortage
Occupation Number of PES stating high magnitude of shortage
Cooks 6 Cleaners and helpers in offices 2
Systems analysts 6 Contact centre sales persons 2
Concrete placers and concrete finishers
4 Database designers and administrators
2
Plumbers and pipe fitters 4 Heavy truck and lorry drivers 2
Shops sales assistants 4 Metal working machine tool setters 2
Waiters 4 Primary school teachers 2
Welders and flame cutters 4 Secondary school teachers 2
Nursing professionals 3 Other software and application developers
2
Application programmers 3 Software developers 2
Carpenters and joiners 3
Thus while lsquocooksrsquo retain the top ranking there are eight occupations in the list of
shortage occupations of high magnitude which are not included in the general list of
shortage occupations in Table 21 These include two lsquoteacherrsquo occupations and three new
lsquosoftwarersquo related occupations The two software occupations on the general list of
shortages in Table 21 are also included in this Table which means that five software
related occupations are considered to have shortages of high magnitude The position of
lsquosystems analystrsquo is particularly noteworthy A total of ten of twenty eight PES classify
this occupation as a shortage and six of these PES consider the shortage to be of a high
magnitude Thus shortages in this occupation appear to be both relatively widespread
and quite severe
The other finding of interest is that there are a considerable number of craft occupations
which are classified by a number of PES as shortages of high magnitude Thus four PES
rate lsquoplumbers and pipe fittersrsquo lsquoconcrete placersrsquo and lsquoweldersrsquo as shortages of high
magnitude while three PES also maintain that there are serious shortages of carpenters
24 Occupational groups by shortage magnitude
Figure 21 below shows how the PES classified shortages by broad occupational level in
terms of the severity of the shortage The figure shows that the professional shortage
occupations were classified by the most PES as high magnitude followed by the lsquocraft
and related trade workersrsquo Less than ten PES classified any other occupation as a
shortage of high magnitude but interestingly - while only four PES classified skilled
agricultural workers as a shortage - all of them ranked the shortage as being of high
magnitude Similarly while only seven PES categorised any of the clerical-related
occupations as a shortage five of the seven PES classified at least one of these
occupations as a shortage of high magnitude
Labour shortages and surpluses 2017
2018 14
Directorate-General for Employment Social Affairs and Inclusion European Network of Public Employment Services (PES)
Figure 21 Shortages by estimated shortage magnitude (1-digit level)
25 Profile of the most extensive surplus occupations
The PES were also requested to identify occupations for which there was an excess
supply and eighteen PES did so The surplus occupations identified by at least four
different PES are shown in Table 23
Intuitively one might expect that an excess supply of jobseekers is more likely to occur
in the case of occupations where the entry requirements are not associated with a high
level of qualifications or technical skills
Table 23 Surplus occupations (4-digit level)
Occupation Number of PES reporting this occupation as surplus
Occupation Number of PES reporting this occupation as surplus
Shop sales assistants 8 Tailors dressmakers furriers hat makers
4
General office clerks 8 Cashiers and ticket sales 4
Advertising and marketing professionals
6 Cleaners and helpers in offices hotels
4
Bank tellers and related clerks 6 Hand packers 4
Sociologists anthropologists and religious
6 Mail carriers and sorting clerks 4
Child care workers 5 Photographer 4
Hairdressers 5 Receptionist (general) 4
Journalists 5
In general this is the case as the occupations of lsquoshop sales assistantsrsquo lsquogeneral office
clerksrsquo lsquobank tellers and related clerksrsquo lsquocashiers and ticket salesrsquo lsquocleaners and helpersrsquo
0 5 10 15 20 25 30
Armed forces occupations
Managers
Skilled agricultural forestry and fishery workers
Clerical support workers
Elementary occupations
Plant and machine operators and assemblers
Technicians and associate professionals
Service and sales workers
Craft and related trades workers
Professionals
High Medium Low
Labour shortages and surpluses 2017
2018 15
Directorate-General for Employment Social Affairs and Inclusion European Network of Public Employment Services (PES)
lsquohand packersrsquo lsquomail carriers and sorting clerksrsquo and lsquoreceptionistsrsquo would not generally
require a high formal level of qualification
However four of the fifteen occupations lsquoadvertising and marketing professionalsrsquo
lsquosociologists and anthropologistsrsquo lsquojournalistsrsquo and lsquophotographersrsquo are professional
occupations Furthermore there are many professional and associate professional
occupations which are not included in the list of surplus occupations reported by the most
PES because they were reported by three or fewer PES These occupations include
lsquophilosophers historians and political scientistsrsquo lsquomusicians singers and composersrsquo
lsquoeconomistsrsquo lsquoother legal professionalsrsquo lsquointerior decoratorsrsquo and lsquoother artists and
associate cultural workersrsquo A list of the surplus occupations which were reported by at
least one PES is shown in Annex 3 of this report
In theory the fact that both the list of shortage occupations and the list of surplus
occupations contain many professional and associate professional occupations should
give rise to many cross-border matching possibilities However this is not the case
because virtually none of the professional or associate professional occupations appear
on both lists In general the professional and associate professional occupations
identified as being in surplus by the PES reflect disciplines in the humanities or the
creative arts In sharp contrast the professional and associate professional occupations
identified as shortage occupations by the PES are technical in nature and are dominated
by software and health related occupations
There is no doubt that many of the occupations identified by the PES as surplus
occupations are attractive to young people This is particularly so of occupations
associated with the creative arts But the analysis of PES data on shortages and
surpluses in this report would suggest that at least some of these occupations are
associated with limited career possibilities and that occupations of a technical nature
have superior career prospects
There are however two occupations lsquoshop sales assistantsrsquo and lsquocleaners and helpersrsquo
who appear in both the lists of shortages and surplus occupations and there are clearly
matching possibilities in these cases However the matching possibilities are not limited
to these two occupations there are many surplus occupations which have been identified
by less than four PES which have also been classified as shortage occupations by other
PES These cross-border matching possibilities are explored in chapter four
26 Profile of high magnitude surpluses
Only seven of the fifteen occupations listed as surplus occupations in Table 23 are not
classified as surpluses of high magnitude in Table 24 The list includes two more
professional occupations lsquobiologists botanists and zoologistsrsquo and lsquomanagement and
organisation analystsrsquo Both lsquojournalistsrsquo and lsquoadvertising and marketing professionalsrsquo
which are included in the list of surplus occupations reported by the most PES are also on
the list of occupations with high magnitude surpluses
One of the occupations which is new to the list is lsquobricklayers and related workersrsquo As
this occupation was also identified as a shortage occupation by nine PES its inclusion
does give rise to some cross-border matching possibilities
Labour shortages and surpluses 2017
2018 16
Directorate-General for Employment Social Affairs and Inclusion European Network of Public Employment Services (PES)
Table 24 High magnitude surplus occupations (4-digit level)
Occupation
Number of PES stating high magnitude of surplus
Occupation
Number of PES stating high magnitude of surplus
General office clerks 4 Journalists 2
Advertising and marketing professionals 3 Management and organisation analysts
2
Receptionist (general) 3 Manufacturing labourers 2
Shop sales assistants 3 Odd job persons 2
Biologists botanists zoologists and related
2 Photographers 2
Bricklayers and related workers 2 Bank tellers and related clerks 2
Child care workers 2 Security guards 2
Cleaners and housekeepers supervisors 2 Travel guides 2
Gardiners horticulturalists and nursery workers
2
27 Broad occupational groups by surplus magnitude
As in the case of shortages the professional group of occupations dominated the
occupations which were considered by the PES to have surpluses of high magnitude
(Figure 22) Indeed eight of the sixteen PES who rated surplus occupations by their
degree of severity identified at least one professional occupation as being in severe over-
supply
Interestingly the three PES who identified surplus occupations among plant and machine
operators and assemblers rated all the occupations they identified in this group as being
surplus occupations of high magnitude
Figure 22 Surpluses by estimated surplus magnitude
0 5 10 15 20
Managers
Plant and machine operators and assemblers
Skilled agricultural forestry and fishery workers
Craft and related trades workers
Clerical support workers
Elementary occupations
Service and sales workers
Technicians and associate professionals
Professionals
High Medium Low
Labour shortages and surpluses 2017
2018 17
Directorate-General for Employment Social Affairs and Inclusion European Network of Public Employment Services (PES)
28 Comparison of shortages and surpluses by broad
occupation
The issues which have been discussed above can be summarised in Table 25 below The
figures show that the 26 PES who reported at least one professional occupation as a
shortage represented 93 of all PES and that in total these PES identified 261
professional occupations as shortages
The situation is not quite as dramatic in respect of surplus occupations Nevertheless
fifteen PES representing 83 of all reporting PES identified a total of 88 professional
occupations as surplus occupations
However the most widespread reported surplus occupations were among the service and
sales group of occupations with almost 90 of PES reporting at least one surplus
occupation in this group The difference in the share of PES reporting shortages and
surpluses in the clerical group of occupations is also noteworthy Half the PES reported at
least one shortage occupation in this group but almost 80 of reporting PES included at
least one surplus occupation from this group
Table 25 Shortages and surpluses by broad occupation group
Broad occupation group
Number of
shortage occupatio
ns identified
Number of PES
reporting
shortages in this broad group
of PES reporting shortages
in this group
Number of surplus occupatio
ns identified
Number of PES
reporting surpluses
in this broad group
of PES reporting surpluses
in this broad group
Professionals 261 26 93 88 15 83
Craft and related trades 237 25 89 44 11 61
Associated professional technical
176 27 97 53 15 83
Services and sales 100 23 82 72 16 89
Plant and machinery 79 22 79 10 8 44
Elementary 53 14 50 37 12 67
Managers 43 11 39 16 7 39
Clerical support 34 14 50 47 14 78
Skilled agriculture 13 6 21 14 5 28
Armed forces 6 1 4 0 0 0
29 Cross-check with LSF data
Finally it is important to assess the extent to which the shortage and surplus occupations
identified by the PES in 2017 are accurate For this task we use the findings from the
2016 study which are based on the LSF data and the ratio of the unemployed to new
hires (Annex 4)
Although based on different levels of aggregation (4-digit vs 3-digit respectively) the
comparison of the PES reported shortages and surpluses in 2017 and the 2016 study LSF
ratio of unemployed and new hires suggests a high level of consistency Specifically PES
identified shortage occupations typically have the low ratio of unemployed to new hires
while the surplus occupations typically have the high ratio of unemployed to new hires
Labour shortages and surpluses 2017
2018 18
Directorate-General for Employment Social Affairs and Inclusion European Network of Public Employment Services (PES)
The only exceptions are the occupations of lsquocleanersrsquo lsquowaitersrsquo and lsquoshop sales
assistantsrsquo However this result is understandable as these occupations were classified
by the PES4 as labour shortages rather than skill shortages and consequently the
relatively high ratio could reflect the fact that there are a significant number of
unemployed available to work in these occupations
210 Conclusions
There are a number of significant conclusions which may be drawn from the analyses of
shortage and surplus occupations in this chapter
Firstly the widespread concern that using data from the PES may produce a significant
bias in the list of shortages and surpluses because the PES attract less vacancies and
job-seekers from higher skilled occupations appears to be unfounded Ironically the
professional occupations were the most frequently reported occupations in both the list of
shortages and surpluses
Secondly there is a distinct difference in the type of competences and qualifications
identified by the PES as shortages and surplus occupations and this difference was
evident throughout the different occupation groups In general the shortage occupations
embodied technical skills whether in health-related software-related or engineeringndash
related occupations at professional technical and craft levels
In sharp contrast the surplus occupations embodied selling service and clerical skills
cultural and artistic skills and competencies in the humanities
Finally the type of occupations which the PES associated with shortages and surpluses
are highly plausible In general the shortage occupations have a low ratio of unemployed
to new hires while the surplus occupations have a high ratio This consistency extended
to the occupations which the PES identified as labour shortages which exhibited a high
ratio
The classification of skill and labour shortages is one of the issues discussed in the next
chapter
4 While this is true when all three occupations are aggregated only two of five PES categorised lsquocleanersrsquo as a labour shortage ndash see chapter 3
Labour shortages and surpluses 2017
2018 19
Directorate-General for Employment Social Affairs and Inclusion European Network of Public Employment Services (PES)
3 PROFILE OF SHORTAGES AND SURPLUSES IN SPACE AND TIME
31 Introduction
In this chapter we analyse the occupations which have been identified by the European
PES as shortage and surplus occupations from the perspective of space and time We
review the geographical distribution of these occupations to ascertain if this distribution
provides an insight into what may have given rise to these shortages and surplus
occupations and we also examine the extent to which the same shortage and surplus
occupations have persisted over time using the findings from previous studies
32 PES methods used for identifying shortages and surpluses
In the previous chapter it was noted that only eighteen of twenty-eight PES submitted a
list of surplus occupations A review of the methods used by the PES to identify shortage
occupations may provide an insight into why ten PES did not provide any data on surplus
occupations
A summary of the methods used to identify shortage occupations is provided in Table 31
below The data indicates that exactly ten PES did not use any administrative data in
identifying their shortage occupations but rather used other sources such as employer
surveys national forecasting studies or immigration data It is tempting to conclude that
this is the reason why only 18 out of 28 PES provided data on surplus occupations as
these methodologies are not generally associated with the provision of information on
occupations which are in surplus
However such a conclusion would not be entirely accurate The analyses found that the
use of survey data did not necessarily preclude a PES from identifying surplus
occupations The Danish PES for example used the results of their Labour Market Balance
Survey and was able to provide a comprehensive list of surplus occupations In contrast
the Italian and Norwegian PES who relied on national forecasts and surveys respectively
were unable to provide such a list
Furthermore not all of the PES who based their identification of shortages on their
administrative data systems provided a list of surplus occupations Those who did
generally used the ratio of job-seekers to vacancies to identify whether an occupation
was a shortage or surplus occupation But a number of PES such as the German and
Luxemburg PES and the Belgium regional PES Actiris while basing their identification of
shortage and surplus occupations on administrative data used quite sophisticated
techniques such as the share of vacancies filled and the duration of vacancy filling Unlike
the ratio of job-seekers to vacancies such techniques do not readily provide an indicator
for identifying an occupation as a surplus occupation5
5 While it is reasonable to classify an occupation as a shortage occupation if the filling of vacant posts in that occupation takes on average an exceptionally long time identifying surplus occupations is somewhat more problematic using this method
Labour shortages and surpluses 2017
2018 20
Directorate-General for Employment Social Affairs and Inclusion European Network of Public Employment Services (PES)
Table 31 Methods used by the PES to identify shortage occupations
PES methods for identifying shortages and surpluses Number of PES
Combination of administrative data PES surveys and expert opinion
1
Combination of administrative data PES surveys and 3rd party data
1
Combination of administrative data and PES surveys 7
Combination of administrative data and 3rd party data 1
Combination of administrative data and expert opinion 2
PES work permit data only 2
PES administrative data only 6
PES survey data only 2
PES warehousing data only 1
3rd party surveys and forecasts 5
Total 28
The fact that only eighteen PES provided a list of surplus occupations is a serious
weakness of this study because it places a limit on the potential of the analyses to
identify cross border matching opportunities between shortage and surplus occupations
Consequently in the future every effort should be made to significantly increase the
number of PES providing a list of surplus occupations even if this means that a
significant number of PES use alternative methodologies to identify shortage and surplus
occupations rather than a single methodology to do both as has occurred in both the
2016 study and the current study6
33 Geographic distribution of shortages and surpluses
The 28 PES who submitted data on shortages cover a very wide geographic area which
include labour markets with very different characteristics It may be informative
therefore to assess the extent to which the distribution of shortage occupations differed
between different countries
Table 32 below shows the number of reported shortage occupations within their broad
occupation group and the PES who reported the occupation as a shortage7
While each PES was requested to submit a maximum of twenty shortage occupations a
total of ten PES provided more than that and in the case of the Slovenian French and the
regional Belgian PES Actiris significantly more
A total of six PES identified less than twenty shortage occupations but in most cases the
difference was negligible
The Croatian and Portuguese PES were the only PES which did not identify any
professional occupation in their list of shortage occupations This may reflect the type of
vacancies which are notified by employers to these PES because both these PES use
their own administrative data systems exclusively to identify shortage occupations
6 In the 2016 study while 26 PES provided data on shortage occupations 13 provided data on surplus
occupations 7 Three groups are excluded from the Table managers (43) skilled agricultural (13) and armed forces (1) as the figures are quite small
Labour shortages and surpluses 2017
2018 21
Directorate-General for Employment Social Affairs and Inclusion European Network of Public Employment Services (PES)
Table 32 Shortages number of mentions (4-digit) in broad occupation (1-digit)
PES Professional Technical Clerical Craft Service Plant Elementary Total
Austria 4 11 1 12 2 0 0 30
Actiris 28 22 6 11 13 2 0 82
Le Forem 6 6 0 6 0 0 0 18
VDAB 4 7 1 4 1 3 0 20
Bulgaria 7 0 0 4 5 3 2 21
Croatia 0 1 0 13 1 3 2 20
Cyprus 6 1 2 5 5 1 6 26
Denmark 5 1 0 7 3 2 1 19
Estonia 10 7 0 0 2 1 0 20
Finland 12 5 1 7 2 2 3 32
France 18 27 2 27 1 26 2 103
Germany 16 19 0 10 2 1 1 49
Hungary 2 6 6 8 14 3 12 51
Iceland 6 3 0 5 2 1 3 20
Ireland 13 2 0 4 1 1 0 21
Italy 2 2 1 7 4 1 3 20
Latvia 7 1 1 9 0 0 0 18
Lithuania 1 2 0 15 0 2 0 20
Luxemburg 8 4 0 0 0 0 0 12
Malta 5 3 3 4 6 1 4 26
Netherlands 20 11 3 23 2 1 0 60
Norway 13 3 0 10 10 4 1 41
Poland 10 6 2 2 3 3 4 30
Portugal 0 1 0 8 3 3 0 15
Slovakia 6 6 2 5 5 2 0 26
Slovenia 23 13 3 30 11 13 9 102
Sweden 15 2 0 1 2 0 0 20
Switzerland 14 4 0 0 0 0 0 18
Total 261 176 34 237 100 79 53 940
The stipulation to only provide a list of twenty shortage occupations may have prevented
any pattern from emerging in the figures For example there does not appear to be any
relationship between the numbers of employed and unemployed in a specific labour
market and the number of shortage occupations identified by its national PES
The two PES who submitted the highest volumes of shortage occupations - the French
and Slovenian PES - vary greatly in terms of the relative size of their labour force while
for example the Norwegian PES submitted significantly more shortage occupations than
much larger countries such as Germany and Poland
As a way of controlling for the variation in the total number of shortage occupations it
may be useful to compare the variation within the list of shortage occupations identified
by each PES However no obvious patterns emerge when a number of hypotheses are
tested using this approach For example there appears to be no relationship between
countries which are associated with strong apprenticeship systems such as Germany
Austria Denmark and Switzerland and their share of shortages among the craft group of
occupations The Swiss PES does not contain any craft occupations in its list of shortage
occupations while the craft group of occupations contain the most shortage occupations
in the lists provided by both the Austrian and Danish PES In the case of the German
PES the share of craft occupations is a little above the average
Labour shortages and surpluses 2017
2018 22
Directorate-General for Employment Social Affairs and Inclusion European Network of Public Employment Services (PES)
Table 33 Surpluses number of mentions (4-digit) in broad occupation (1-digit)
PES Professional Technical Clerical Craft Service Plant Elementary Total
Le Forem 2 1 1 1 6 0 8 19
Bulgaria 6 3 2 0 4 0 2 17
Switzerland 0 4 2 4 1 2 3 16
Cyprus 5 0 0 2 0 0 3 10
Denmark 3 2 3 0 6 1 4 19
Estonia 6 2 3 2 6 0 1 20
Finland 16 7 6 10 3 1 0 43
France 10 10 1 2 5 1 0 29
Croatia 4 0 0 0 0 0 0 4
Hungary 6 9 3 16 15 1 2 52
Ireland 1 1 4 3 5 1 7 22
Iceland 11 1 2 2 1 0 1 18
Lithuania 0 3 1 0 2 2 0 8
Latvia 4 4 0 0 3 1 3 15
Netherlands 3 2 9 0 9 0 1 24
Poland 0 0 0 0 1 0 0 1
Sweden 4 3 7 1 3 0 2 20
Slovakia 7 1 3 1 2 0 0 14
Total 88 53 47 44 72 10 37 351
The most striking aspect of the geographical distribution of surplus occupations is the
relatively low number of occupations which were reported Most of the reporting PES
(eleven) provided less than the twenty surplus occupations they were requested to
submit Furthermore if the contributions from the Hungarian and Finnish PES are
excluded the average number of surplus occupations submitted by the other PES is
sixteen
With the exception of the Icelandic Finnish French and Hungarian PES the list of
surplus occupations remains in single figures across all the broad occupational groups
Such low figures result in limited cross-border matching possibilities which are explored
in the next chapter
The PES were also asked to indicate the lowest regional level at which they could provide
data on both shortage and surplus occupations Their response is outlined in Table 34
above A total of twenty PES responded positively in the case of shortage occupations
and twelve in the case of surplus occupations In the case of shortage occupations nine
PES indicated that they could provide data at NUTs3 level while eight PES stated that
they could provide the data at NUTs1 level In the case of surplus occupations five PES
indicated that they could provide the data at NUTs1 level and another five PES responded
that they could provide the data at NUTs 3 level There were very few PES who indicated
that the lowest level at which they could provide data was at NUTs2 or NUTs4 levels
Labour shortages and surpluses 2017
2018 23
Directorate-General for Employment Social Affairs and Inclusion European Network of Public Employment Services (PES)
Table 34 Availability of data on shortagessurpluses at regional levels
Shortage occupations Surplus occupations
Country NUTS1 NUTS2 NUTS3 NUTS4 No
data NUTS1 NUTS2 NUTS3 NUTS4
Austria
x
Belgium Actiris
x
Belgium Le Forem
x
x
Belgium VDAB
x
Bulgaria
x
x
x
Croatia x
x
Cyprus
x
x
Denmark
x
x
Estonia x
x
Finland
x
x
France
x
x
Germany x
Hungary
x
x
Iceland x
x
Ireland x
x
Italy
x
Latvia
x
x
Lithuania
x
x
Luxembourg x
Malta
x
Netherlands
x
x
Norway
x
Poland
x
x
Portugal
x
Slovakia
x
x
Slovenia x
Sweden
x
x
Switzerland
x
x
Note Bulgaria has regional data for some occupations
34 Tracking shortages over time
This is the third annual study on lsquoBottleneck Occupationsrsquo the previous two studies were
undertaken in 2016 and 2015 The findings in both of those studies were presented in 3-
digit codes To make the findings comparable over time the 4-digit shortage and surplus
occupations from the current study are aggregated up to 3-digit occupations as shown in
Table 35
A striking aspect of the list of occupations in Table 35 is the degree of consistency
displayed over the period 2015-2017 inclusive not simply in terms of the occupations
reported by the PES but also in terms of the number of PES who identified them as
shortages (ie their ranking) Not only does the 3-digit occupation category of lsquosoftware
and applications developersrsquo occupy the top ranking in each of the years five of the top
ranking six occupations are the same The only notable exception is that the finance
professional and associate professional occupations featured in the list of most reported
shortage occupations in 2015 but slipped out of this list in 2016 and 2017
Labour shortages and surpluses 2017
2018 24
Directorate-General for Employment Social Affairs and Inclusion European Network of Public Employment Services (PES)
Table 35 Ranking of shortage occupations (3-digit)
Rank
Top occupations in 2017 2017 2016 2015
Software and application developers 1 1 1
Sheet and structural metal workers 2 3 2
Medical doctors 3 5 2
Blacksmiths toolmakers and related trades 4 3 4
Building finishes and related trade workers 4 6 4
Building frame and related trade workers 4 3 4
Cooks 4 7 7
Engineering professionals 5 6 6
Physical and engineering science technicians 6 7 na
Electrical equipment installers and repairers 7 4 5
Heavy truck and bus drivers 7 5 4
Machinery mechanics and repairers 8 7 5
Nursing and midwifery professionals 8 6 na
Sales and purchasing agents and brokers 9 2 5
Shop salespersons 10 7 8
Electro technology engineers 10 na na
Primary school and early childhood teachers 10 na na
Domestic hotel and office cleaners and helpers 10 na na
Waiters and bartenders 10 na na
35 3-digit vs 4-digit
There are advantages and disadvantages associated with using the more aggregated 3-
digit occupation classification as it was done in previous studies The bundling of
individual occupations into families provides greater visibility of shortages at a broad
skill level (eg all software related occupations)
However there are distinct disadvantages in using the 3-digit occupations and these
apply particularly to their practical usefulness to education and training providers In
many cases shortages identified at 3-digit level do not provide a reliable basis for
identifying the specific skill which is in shortage or surplus
By combining the analyses of the 4-digit and corresponding 3-digit classifications in this
report many examples are revealed of how an exclusive reliance on the 3-digit
classification could be seriously misleading Thus the findings in this report show that
within the 3-digit classification of lsquosheet and structural metal workers moulders and
weldersrsquo the 4-digit occupation which is in short supply is lsquoweldersrsquo and not for example
lsquosheet metal workersrsquo This is an important insight because in many European countries
the skills of welding and sheet metal work are provided through entirely different
vocational programmes8
There are many examples of this phenomenon in the 3-digit occupations in Table 35 For
example the analysis in this report shows that toolmakers are a shortage occupation
8 In Ireland for example sheet metal workers and welders undertake entirely different apprenticeships
Labour shortages and surpluses 2017
2018 25
Directorate-General for Employment Social Affairs and Inclusion European Network of Public Employment Services (PES)
but blacksmiths are not Furthermore the 3-digit classification disguises the extent of the
reported shortage Thus while the 3-digit occupation of professional nursing and
midwifery is shown in the current report as being shortage occupations a total of eleven
PES reported professional nursing as a shortage compared to only three PES reporting
professional midwifery as a shortage By bundling these occupations together the
significant difference in the relative severity of the shortage is not apparent
This phenomenon applies equally to the surplus occupations which were identified in this
report For example lsquochildcare workersrsquo were described as a surplus occupation by five
PES But in the 3-digit classification they are bundled together with lsquospecial needs
teachersrsquo which was not identified as a surplus occupation
36 Conclusions
There are a number of conclusions which can be drawn from the analyses in this chapter
Firstly the sources used by many of the PES to identify shortage occupations is one of
the main reasons why only eighteen PES provided data on surplus occupations Many of
the PES relied on the results of employer surveys forecasting models and immigration
data to identify shortages and these sources in general do not provide data on surplus
occupations However it was by no means the only reason why so many PES did not
provide data on surplus organisations and this issue will have to be addressed before the
commencement of the 2018 study In the future PES data should be augmented by data
collected by other bodies as outlined in the new EU Regulation
Secondly there is no obvious explanation for the geographic distribution of shortages
and surpluses In some cases countries with relatively small labour forces have a
relatively high number of shortage occupations while a strong apprenticeship system
does not appear to prevent a relatively high share of the identified shortages being in the
craft occupations It may be that the stipulation to only include twenty shortage and
surplus occupations has created a situation where some countries with a relatively large
labour force are artificially constrained to submit a much smaller number of shortage
occupations than they actually have
Thirdly there is a high degree of stability in relation to the occupations which were
identified as shortages in the 2015 2016 and 2017 editions of the Bottleneck report
Finally providing information on shortage and surplus occupations at 4-digit level is
much more useful from a policy perspective than providing the data at a more
aggregated level The results of the analyses at 4-digit level show which specific
occupations in the bundle of occupations used in the previous reports were in shortage
and which were not This is also true of the occupations which were identified as surplus
occupations A more aggregated group of occupations does not allow for the targeting of
specific individual occupations either for increasing training provision or for enhancing
cross border mobility Indeed as a number of specific examples show were providers of
vocational training or indeed policy makers to act on the basis of the 3-digit shortage and
surplus occupations identified in previous reports they could very well have assign
resources to occupations which were neither in shortage nor in surplus
Labour shortages and surpluses 2017
2018 26
Directorate-General for Employment Social Affairs and Inclusion European Network of Public Employment Services (PES)
4 THE CAUSES OF SKILL SHORTAGES AND POTENTIAL SOLUTIONS
41 Introduction
The focus of this chapter is on identifying the possible causes of skills shortages and
surpluses and exploring ways in which these imbalances may be resolved The chapter
begins with a review of the nature of skills and labour market imbalances and concludes
with an exploration of the extent to which enhanced cross-border mobility policies and
more equal gender representation could contribute to the alleviation of skills and labour
imbalances in certain shortage occupations in the EEA labour market
42 The role of skills and labour shortages in skills imbalances
One of the new questions included in the current study asks the PES to identify the
nature of the shortage (ie is it a skill shortage or a labour shortage) in relation to each
shortage occupation they identified It was explained in the questionnaire that labour
shortages occur when there are a sufficient number of appropriately qualified job-seekers
to fill the vacancies which arise but for a variety of reasons many of them do not wish
to work in the occupation in question Their response to this question is summarised in
Table 41 in respect of the twenty occupations which were reported by the most PES
A total of twenty-six PES classified their shortage occupations as skill or labour
shortages and they classified most of the occupations as skill shortages Indeed in the
case of seven occupations plumbers doctors software developers electricians
electronic engineers electronic engineering technicians bus and tram drivers and
mechanical engineers all of the reporting PES classified the shortage as a skills deficit
Each labour market within the EEA is regulated in a particular manner and conditions of
employment even within the same occupation vary throughout the region This is why
many occupations while classified by most of the PES as reflecting skill deficits
nevertheless are classified by some PES as labour shortages
However the number of PES involved is very small indeed Only in the case of three
occupations lsquowaitersrsquo lsquoshop sales assistantsrsquo and lsquoprimary school teachersrsquo are there
more PES classifying the shortage as a labour shortage then a skills deficit The first two
occupations are undoubtedly labour shortages This is because there are few if any
barriers to working in these occupations9
The inclusion of lsquoprimary school teachersrsquo as a labour shortage is however a surprise It
was identified by eight PES as a shortage occupation two of whom classified the
occupation as a shortage of high magnitude It would be necessary to conduct research
into the conditions of employment ndash including qualification criteria ndash within the countries
where the reporting PES are located to establish if this classification of the occupation as
a labour shortage is warranted
With some notable exceptions the response of the PES to classifying their shortage
occupations as skill or labour shortages demonstrates that the PES understand these
concepts Occupations such as professional nurses which are obviously suffering from a
shortage of qualified job-seekers in the EEA are overwhelmingly categorised as a skills
shortage while less skilled occupations such as cleaners are categorised as being on the
borderline between skills and labour shortages
9 Both occupations have relatively high ratios of unemployed to new hires (Annex 4)
Labour shortages and surpluses 2017
2018 27
Directorate-General for Employment Social Affairs and Inclusion European Network of Public Employment Services (PES)
Table 41 Skill and labour shortages
Occupation
Number of PES
reporting occupation
as skills shortage
Number of PES
reporting occupation as labour shortage
Number of PES
reporting occupations as skill and
labour shortage
Total number of
PES reporting on skillslabour
shortage
Cooks 9 1 0 10
Plumbers and pipe fitters 8 0 0 8
Generalist medical Practitioners 7 0 0 7
Heavy truck and lorry drivers 4 2 1 7
Metal workers machine tool setting and operators
3 3 1 7
Welders and flame cutters 4 2 1 7
Nursing professionals 5 1 0 6
Software developers 6 0 0 6
Systems analyst 5 1 0 6
Bricklayers and related trades 4 1 0 5
Building and related electricians 5 0 0 5
Butchers fishmongers and related food 3 2 0 5
Cleaners and helpers in offices 3 2 0 5
Commercial sales representatives 2 2 1 5
Electronic engineers 5 0 0 5
Manufacturing supervisors 4 1 0 5
Motor vehicle mechanics and repairers 3 1 1 5
Nursing associate professionals 4 1 0 5
Primary school teachers 2 3 0 5
Shop sales assistants 1 4 0 5
Waiters 2 3 0 5
Agriculture and industrial machinery repairers
3 1 0 4
Application programmers 3 1 0 4
Bus and tram drivers 4 0 0 4
Electronic engineering technicians 4 0 0 4
Health care assistants 3 1 0 4
Mechanical engineers 4 0 0 4
Sheet metal workers 3 1 0 4
Structural metal preparers and erectors 3 1 0 4
Total number of PES reporting 16 8 2 26
The atypical working hours associated with heavy goods vehicle driving is recognised by
two of the six PES who classify shortages in the occupation as labour shortages while the
unpleasant conditions associated with working in butchery shops and abattoirs is
reflected in the fact that two of the five PES who categorised the occupation as a
shortage occupation classify it as a labour shortage
43 Location of skill imbalances and cross border mobility
In recent years there has been considerable discussion on the potential role which
enhanced cross-border mobility could play in alleviating labour market imbalances The
attractiveness of such a policy is obvious The European Union is a very large
Labour shortages and surpluses 2017
2018 28
Directorate-General for Employment Social Affairs and Inclusion European Network of Public Employment Services (PES)
marketplace embracing a very large labour force if even some of the shortages which
are reported by EEA countries could be resolved by exploiting the surpluses which are
reported by other EEA countries it could form the basis of a number of win-win solutions
for both job-seekers and businesses
An additional attraction of this policy is that it could potentially successfully address both
skills and labour shortages as working conditions associated with some labour shortages
in one country might be perceived as significantly more attractive in a different EEA
country
Table 44 provides a list of the top twenty shortage occupations which have at least one
PES in another EEA country reporting the occupation as a surplus
There are a number of aspects of the Table which are notable Firstly the list of top
occupations has changed quite dramatically from the list in Table 21 specifically none
of the professional and associate professional occupations are now on the list including
the four professional and associate professional health-related occupations or the two
professional software occupations What the Table shows is that there are no surpluses
reported in any of the EEA countries of doctors or nurses software developers or
systems analysts While the occupation of healthcare assistants is in surplus in many
countries it was not included in the list of top occupations because it was reported as a
shortage by only two PES
The figures in Table 42 show that there are three cross-border matching possibilities in
the case of bricklayers and motor mechanics and two possibilities in the case of
plasterers health care assistants and secondary school teachers
There is just one matching possibility in respect of a wide range of occupations including
cooks truck drivers commercial sales representatives electricians carpenters civil
engineers primary school teachers manufacturing supervisors telecentre salespersons
childhood education teachers floor layers and roofers
The fact that primary school teachers have only one cross border matching possibility
suggest that the classification of the occupation as a labour shortage by three of five PES
is an error In general labour shortages would be expected to have more cross border
matching possibilities than skill shortages because there are many job-seekers eligible to
work in the occupation in question and working conditions vary quite significantly from
country to country Indeed it is notable that the two other occupations which were
classified by the PES as predominantly labour shortages waiters and shop sales
assistants have a relatively high number of matching possibilities eight in the case of
shop sales assistants and three in the case of waiters
In general the PES did not classify the same occupation as both a shortage and a
surplus A striking exception is the Danish PES which categorised four of its shortage
occupations as surplus occupations also This is most likely due to the higher level of
granularity available in the Danish data (below 4-digit) so that some job titles within an
occupation are considered labour shortage while others skill shortage
44 Assessing gender composition of surpluses
The PES were asked to estimate the share of females in the occupations which they
identified as lsquosurplusrsquo occupations The restricting of this question to surplus occupations
was to avoid giving the impression that shortages were arising because of discriminatory
recruitment policies
Labour shortages and surpluses 2017
2018 29
Directorate-General for Employment Social Affairs and Inclusion European Network of Public Employment Services (PES)
A total of 13 PES reported any data on gender composition of surpluses However the
quality of information submitted did not provide a sufficient basis for an accurate
estimation of the gender composition of surpluses in some of the cases
It is suggested that in order to address gender imbalances in relation to shortages and
surpluses data from PES on job seekers should be combined with the LSF data on
employment by occupation
45 Conclusions
The analysis in chapter four has produced a number of interesting findings The analysis
reveals that the PES in general has the capacity to distinguish between skill and labour
shortages and to identify shortage occupations which have some cross-border matching
possibilities
The relatively low number of surplus occupations reflects two factors firstly only
eighteen PES submitted a list of surplus occupations and secondly in many cases the
lists did not include the maximum number of twenty occupations which were requested
This response has to be viewed against the background of an EEA labour market where
employment is expanding and unemployment is contracting However while this is a
positive development the relatively low number of surplus occupations has placed a
significant limit on the extent to which there were cross-border possibilities of matching
shortage with surplus occupations
The data indicates that there is a limitation to the extent to which the PES can be used to
identify the gender imbalances (eg under-representation of females in some
occupations) and that other sources should be explored
Labour shortages and surpluses 2017
2018 30
Directorate-General for Employment Social Affairs and Inclusion European Network of Public Employment Services (PES)
Table 43 The potential for cross-border matching of shortage and surplus occupations
No PES
Occupation PES reporting shortage PES reporting surplus No PES
16 Cooks AT Art BG CY DK HR IE IS IT MT NL NO PT SE SI SK lsaquo―rsaquo HU 1
11 Truck drivers ART VDAB BG DK HR LT IT NL NO PT SE SI SK lsaquo―rsaquo DK 1
10 Cleaners helpers CY DK HR FI IS HU NL NO PT SI lsaquo―rsaquo DK LF NL IE 4
10 Commercial sales VDAB ART DK FI FR IT IE PT PL SI lsaquo―rsaquo DK 1
9 Sales assistants AT ART BG CY DK IT NO SI SK lsaquo―rsaquo DK LF SE NL BG CH FI IE 8
9 Bricklayers ART DE DK HR HU LT NL PT SI lsaquo―rsaquo CY HU IE 3
9 Motor mechanics AT VDAB ART LF DK IT NO PT SI lsaquo―rsaquo SK CH EE 3
9 Waiters ART BG CY IS IT MT NO PT SI lsaquo―rsaquo HU EE IE 3
9 Electricians ART VDAB DE DK IS IT NL NO SI lsaquo―rsaquo FR 1
8 Carpenters DK HR HU FI NL NO PT SI lsaquo―rsaquo HU 1
8 Civil engineers ART CH DE FI FR NO SE SI lsaquo―rsaquo CY 1
8 Primary teachers ART BG DK IS NO SE SI SK lsaquo―rsaquo CY 1
7 Healthcare assist CY DK EE NL NO SI SK lsaquo―rsaquo DK NL 2
7 Second teacher ART BG FR NL NO SI SK lsaquo―rsaquo CY FI 2
7 Man supervisors ART VDAB LF DE EE FR SK lsaquo―rsaquo BG 1
6 Plasterers HR HU FI LT NL SI lsaquo―rsaquo HU IE 2
6 Tele centre sales ART HU FI FR MT NO lsaquo―rsaquo EE 1
6 Childhood educ FI LT NO SE SI SK lsaquo―rsaquo CY 1
6 Floor layers HU HR FI FR LT LV lsaquo―rsaquo HU 1
6 Roofers HR FI FR LT LV SI lsaquo―rsaquo HU 1
Bottlenecks Occupations 2017
2017 31
Directorate-General for Employment Social Affairs and Inclusion European Network of Public Employment Services (PES)
5 CONCLUSIONS AND RECOMMENDATIONS
51 Conclusions
The terms of reference for this study emphasise the desirability of creating a process for
the systematic collection of data on surplus and shortage occupations in the EEA area
which could be effectively used by EURES for cross border matching of shortage
occupations in some EEA countries with surplus occupations in others
The authors have responded to this emphasis by using a process which ensures that the
data gathered on shortage and surplus occupations is comprehensive accurate and of
practical use to EURES and the providers of education and training programmes The
process is comprehensive because it gathers information both on the extent of shortages
and surpluses and on their relative severity It is accurate because the list of shortage
and surplus occupations are shown to be consistent with the estimated value of the ratio
of unemployed to new hires Finally the process provides information which is of
practical use to EURES and the national providers of VET because the data gathered is on
individual occupations rather than on lsquobundles of occupationsrsquo as in previous studies The
analyses in this report shows that while these bundles of occupations contain some
occupations which are identified by the PES as shortage and surplus occupations they
also contain occupations which are neither in shortage nor in surplus and it is impossible
to distinguish one from the other
The data gathering process used in this report however was not devoid of weaknesses
Fortunately these weaknesses reflect the modus operandi of the PES and may be
rectified by including other institutions and agencies in the process For example the PES
use the same sources for the identification of both shortage and surplus occupations
This may have advantages in terms of accuracy when those sources include employersrsquo
surveys immigration data and the results of forecasting exercises However these
sources are not suitable for gathering data on surplus occupations and they are the main
reason why the number of surplus occupations provided by the PES were almost half the
number requested In the future PES data could be augmented by data gathered by
other bodies as outlined in recent EU Regulation 2016589
In addition the response to the question on the capacity of the PES to deliver data on
shortage and surplus occupations at a regional level was also disappointing perhaps
reflecting a misalignment in some EEA countries between the geographic configuration of
the local PES network and the NUTs regions
The analysis highlighted that in order to assess gender imbalances of shortages and
surpluses PES data needs to be augmented by other sources
Finally despite the low number of surplus occupations submitted by the PES it was
nevertheless possible to identify twenty shortage occupations in the EEA labour market
which had at least one cross-border matching possibility and many more than one in the
case of some shortage occupations
52 Recommendations
Based on the findings from the three bottleneck studies undertaken to date a model for
the gathering of data on shortages and surpluses is proposed (Figure 51) The model
includes features of the methodology applied in this study which were successful It also
includes a number of features which should be introduced to the process in order to
address some of the weaknesses which were identified in this study (highlighted in red)
Labour shortages and surpluses 2017
2017 32
Directorate-General for Employment Social Affairs and Inclusion European Network of Public Employment Services (PES)
However before this methodology is implemented it would be prudent to discuss data
requirements with PES and invite a broader range of institutions and agencies to
participate in aspects of the data gathering process in addition to the PES EURES
Regulation (EU) 2016589 of the European Parliament and of the Council which obliges
the appropriate national authorities to furnish such data annually is fortuitous in this
regard and should facilitate the implementation of this recommendation
In addition the results of these and other relevant studies should be disseminated to
PES Eures coordination group and other relevant agencies and institutions in order to
emphasise the importance of data and analysis in informing policy at EU and national
level which aims to resolve labour market imbalances
Labour shortages and surpluses 2017
2017 33
Directorate-General for Employment Social Affairs and Inclusion European Network of Public Employment Services (PES)
Figure 51 Model for gathering data on shortage and surplus occupations
Sources of data on surpluses PES data from other relevant agencies
In those cases where the source used by the PES to identify shortage occupations cannot
be used to identify surplus occupations other institutions or other sources or both should be availed of to ensure that comprehensive data on surplus occupations are provided to the appropriate national authority
Dimensions of shortagessurpluses extent (number of reporting PES) and severity (high or low
magnitude)
Data should be systematically gathered on both the extent of shortage and surplus
occupations in the EEA and on their relative severity
Type of shortage skill vs labour shortages
The providers of the data on shortage occupations must also distinguish between skill and labour shortages because this distinction is necessary for the accurate identification of
shortage occupations and for the choice of the appropriate policy response to identified shortages
Classification of occupations used ISCO 08 4-digit codes (or translation into these codes)
All data should be either initially gathered in ISCO 08 4-digit codes or translated into these
codes This ensures that the data refers to specific individual occupations and is of practical use to EURES and the national providers of VET
Accuracy test cross-check with LSF data (ratio of unemployed to new hires)
The accuracy of the submitted lists of shortage and surplus occupations should be assessed
by comparing the most widely reported surplus and shortage occupations with the estimated values of the ratios of employed (by previous occupation) to new hires at the aggregated EU28 level These ratios should be based on an analysis of the most up-to date
Labour Force Survey (LFS) data
Gender balance assessment LFS data on employment at occupational level by gender PES job
seekers
The gender composition of shortage and surplus occupations should be based on the most
up to date analyses of LFS data on employment by gender and the PES job seeker data
Regional balance assessment LSF data data from relevant agencies
Where regional data is required other agencies and institutions should be requested to
provide the data in those cases where the data cannot be provided by the regional PES network because it is not geographically aligned to the NUTs regions
Labour shortages and surpluses 2017
2017 34
Directorate-General for Employment Social Affairs and Inclusion European Network of Public Employment Services (PES)
Number of occupations reporting should be extended beyond 20 occupations but with upper
limit (eg 50)
Consideration should be given to allowing the agencies responsible for identifying shortage
and surplus occupations a greater range of flexibility in terms of the numbers of occupations which should be identified A minimum to maximum range would be a more realistic approach as it would reflect the fact that the labour markets of the EEA vary significantly in size and performance
Timing of imbalance assessment September
It is proposed that the data gathering exercise should be brought forward to early September and that expert advice should be available on line throughout the data
gathering exercise
Labour shortages and surpluses 2017
2017 35
Directorate-General for Employment Social Affairs and Inclusion European Network of Public Employment Services (PES)
ANNEX 1 DATA COLLECTION TEMPLATE Information sought Explanation
Occupation title (text) Type in free text a list of occupations (one row one occupation) for which shortages and surpluses exist first list occupations for which there is a shortage the list should contain a maximum of 20 occupations if your list contains less than 20 occupations please provide a brief explanation in your email response for why the number is lower than 20 second list occupations for which there is a surplus the list should contain a maximum of 20 occupations if your list contains less than 20 occupations please provide a brief explanation in your email response for why the number is lower than 20
Shortagesurplus indicator For each occupation indicate if it refers to a shortage by typing in shortage or surplus by typing in surplus to identify surplus occupations you can examine for each occupation the ratio of the number of job seekers to the number of vacancies at the end of each year for example if there are 5000 shop assistants seeking employment and there are 200 vacancies at the end of the reference period the ratio is 251 you can rank the calculated ratios and report the occupations associated with the 20 highest ratios
Occupational classification used in your country
For each occupation indicate what occupational classification (if any) was used to identify this occupation for instance you can report a country specific classification ISCO ROME SOC etc If you donrsquot use occupational classifications type None
Occupation code to the lowest level of disaggregation (eg ISCO at 4 digits)
If you have indicated a classification used type the code for each occupation use the lowest level of disaggregation (eg 4 digit ISCO code) if you donrsquot use occupational classification leave black
ISCO-08 code at 4-digit level (or lower if 4-digit not available)
If you use occupational classification which is not ISCO-08 and if it is possible provide a translation of the national code to ISCO-08 code ISCO is the International Standard Classification of Occupations which is used to report to Eurostat code should be at 4 digits if this is not available than the lowest level of disaggregation that is available should be reported (3 digits if 4-digit code is not available 2 digits if neither 4-digit nor 3-digit code is available 1 digit if neither 4-digit 3-digit nor 2-digit code is available) if it is not possible to provide translation to ISCO-08 leave black if you have already reported ISCO-08 code in column 3 leave this column black
Estimate of shortagesurplus magnitude (high (gt3 of employment) medium (1-3 of employment) low (lt1 of employment))
For each occupation indicate a broad estimate of the magnitude of the shortagesurplus if you estimate that the shortagesurplus is less than 1 of the total employment in the occupation in question type low if between 1-3 type medium if greater than 3 type high if you cannot provide a rough estimate of magnitude type dont know
Current shortagesurplus (C) future short term (FST) future medium term (FMT) future long term (FLT) donrsquot know (indicate all that apply)
Against each occupation indicate if the identified shortagesurplus refers to present situation by typing C if the shortage is expected to occur in the short term future ie within 12 months by typing FST if it is expected to occur over the medium term (within 1-5 years) by typing FMT if it is expected to occur in the long term (in 5 or more years) by typing FLT if more than one time period applies indicate all relevant ones (eg for current shortagessurpluses that are expected to persist over the short term type C FST) if you dont know type dont know
Source of information on shortagessurpluses (eg PES administrative data (vacancies job seekers) PES survey third party survey Occupational forecasts other (specify) etc)
Indicate the source used to identify shortagesurplus for this occupation did you derive it from the PES administrative data on PES vacancies andor job seekers did you conduct a survey did you commission a third party to conduct a survey for you did you have occupational forecasts available did you use other research type in free text the full description of the source(s) eg National Employment Survey conducted by PES etc
Labour shortages and surpluses 2017
2017 36
Directorate-General for Employment Social Affairs and Inclusion European Network of Public Employment Services (PES)
Date for source of information Indicate the year that the information on shortagessurpluses (column 7) refers to eg type 2016 for a survey of difficult to fill vacancies conducted in 2016 even if the report was published in 2017
What indicator(s) suggested that there is a shortagesurplus
Indicate what criteria was used to conclude that this occupation is associated with a shortagesurplus for instance employers views sourcing from abroad to fill vacancies growth in employment faster than growth in educationtraining output time required to fill
vacancies higher than average etc
Share of females among job seekers in this occupation (surplus occupations only)
Indicate the percentage share of females among all job seekers in this occupation this is only applicable to surplus occupations
Skill or labour shortage Indicate if a shortage refers to a skill or labour shortage a skill shortage occurs where there is an insufficient supply of persons with the appropriate skills labour shortages occur where there is a sufficient number of skilled persons however an insufficient number of them is willing to take up employment in the occupation in question
Indicate the availability of data on shortagessurpluses at regional level (NUTS1 NUTS2 NUTS3 No data)
Indicate if data is available on the regional breakdown of shortagessurpluses by indicating the level of regional data available if multiple levels of regional disaggregation are available indicate the lowest level of disaggregation (eg NUTS3 rather than NUTS2) if there is no regional data available use no data
Labour shortages and surpluses 2017
2017 37
Directorate-General for Employment Social Affairs and Inclusion European Network of Public Employment Services (PES)
ANNEX 2 SHORTAGE OCCUPATIONS
Shortage occupation PES count
Cooks 16 Plumbers and pipe fitters 13 Generalist medical practitioners 12 Welders and flamecutters 12 Heavy truck and lorry drivers 11 Metal working machine tool setters and operators 11 Nursing professionals 11 Software developers 11 Agricultural and industrial machinery mechanics and repairers 10 Cleaners and helpers in offices hotels and other establishments 10 Commercial sales representatives 10 Specialist medical practitioners 10 Systems analysts 10 Bricklayers and related workers 9 Building and related electricians 9 Butchers fishmongers and related food preparers 9 Motor vehicle mechanics and repairers 9 Nursing associate professionals 9 Sheet-metal workers 9 Shop sales assistants 9 Waiters 9 Carpenters and joiners 8 Civil engineers 8 Concrete placers concrete finishers and related workers 8 Electrical engineering technicians 8 Electronics engineering technicians 8 Mechanical engineers 8 Primary school teachers 8 Structural-metal preparers and erectors 8 Electronics engineers 7
Health care assistants 7 Manufacturing supervisors 7 Mechanical engineering technicians 7 Secondary education teachers 7 Accountants 6 Applications programmers 6 Bus and tram drivers 6 Contact centre salespersons 6 Early childhood educators 6 Electrical mechanics and fitters 6 Floor layers and tile setters 6 Plasterers 6 Roofers 6 Sewing machine operators 6 Software and applications developers and analysts not elsewhere classified 6 Toolmakers and related workers 6 Web and multimedia developers 6 Air conditioning and refrigeration mechanics 5 Building frame and related trades workers not elsewhere classified 5 Chefs 5 Civil engineering labourers 5 Construction supervisors 5 Earthmoving and related plant operators 5 Electrical engineers 5 Electrical line installers and repairers 5 Engineering professionals not elsewhere classified 5 Hairdressers 5 Information and communications technology operations technicians 5 Manufacturing managers 5 Physiotherapists 5 Real estate agents and property managers 5 Research and development managers 5 Spray painters and varnishers 5 Accounting associate professionals 4 Bakers pastry-cooks and confectionery makers 4
Labour shortages and surpluses 2017
2017 38
Directorate-General for Employment Social Affairs and Inclusion European Network of Public Employment Services (PES)
Shortage occupation PES count
Blacksmiths hammersmiths and forging press workers 4 Civil engineering technicians 4 Crane hoist and related plant operators 4 Database designers and administrators 4 Industrial and production engineers 4 Painters and related workers 4 Physical and engineering science technicians not elsewhere classified 4 Plastic products machine operators 4 Social work and counselling professionals 4 Accounting and bookkeeping clerks 3 Administrative and executive secretaries 3 Ambulance workers 3 Building construction labourers 3 Car taxi and van drivers 3 Cartographers and surveyors 3 Cleaning and housekeeping supervisors in offices hotels and other establishments 3 Contact centre information clerks 3 Draughtspersons 3 Fast food preparers 3 Freight handlers 3 Gardeners horticultural and nursery growers 3 Home-based personal care workers 3 Hotel receptionists 3 Information and communications technology installers and servicers 3 Insulation workers 3 Kitchen helpers 3 Manufacturing labourers not elsewhere classified 3 Medical imaging and therapeutic equipment technicians 3 Metal moulders and coremakers 3 Metal polishers wheel grinders and tool sharpeners 3 Midwifery professionals 3 Other language teachers 3 Personal services workers not elsewhere classified 3
Pharmacists 3 Policy administration professionals 3 Printers 3 Process control technicians not elsewhere classified 3 Sales and marketing managers 3 Shop supervisors 3 Special needs teachers 3 Stock clerks 3 Supply distribution and related managers 3 Survey and market research interviewers 3 Systems administrators 3 Technical and medical sales professionals (excluding ICT) 3 Translators interpreters and other linguists 3 Transport clerks 3 Vocational education teachers 3 Advertising and marketing professionals 2 Audiologists and speech therapists 2 Bartenders 2 Beauticians and related workers 2 Cashiers and ticket clerks 2 Chemical engineers 2 Child care workers 2 Computer network and systems technicians 2 Computer network professionals 2 Construction managers 2 Craft and related workers not elsewhere classified 2 Credit and loans officers 2 Crop farm labourers 2 Database and network professionals not elsewhere classified 2 Dentists 2 Domestic cleaners and helpers 2 Door to door salespersons 2 Driving instructors 2 Electrical and electronic equipment assemblers 2 Electronics mechanics and servicers 2 Elementary workers not elsewhere classified 2 Employment agents and contractors 2
Labour shortages and surpluses 2017
2017 39
Directorate-General for Employment Social Affairs and Inclusion European Network of Public Employment Services (PES)
Shortage occupation PES count
Field crop and vegetable growers 2 Financial analysts 2 Financial and investment advisers 2 Forestry and related workers 2 Garbage and recycling collectors 2 General office clerks 2 Graphic and multimedia designers 2 Information and communications technology service managers 2 Insurance representatives 2 Locomotive engine drivers 2 Mail carriers and sorting clerks 2 Management and organization analysts 2 Mathematicians actuaries and statisticians 2 Mechanical machinery assemblers 2 Medical and dental prosthetic technicians 2 Medical assistants 2 Messengers package deliverers and luggage porters 2 Metal finishing plating and coating machine operators 2 Metal processing plant operators 2 Optometrists and ophthalmic opticians 2 Personal care workers in health services not elsewhere classified 2 Police officers 2 Policy and planning managers 2 Production clerks 2 Restaurant managers 2 Retail and wholesale trade managers 2 Sales workers not elsewhere classified 2 Sewing embroidery and related workers 2 Street food salespersons 2 Tailors dressmakers furriers and hatters 2 Telecommunications engineers 2 Advertising and public relations managers 1 Aged care services managers 1
Agricultural technicians 1 Aircraft engine mechanics and repairers 1 Aircraft pilots and related associate professionals 1 Assemblers not elsewhere classified 1 Authors and related writers 1 Bank tellers and related clerks 1 Bleaching dyeing and fabric cleaning machine operators 1 Bookmakers croupiers and related gaming workers 1 Business services agents not elsewhere classified 1 Buyers 1 Cabinet-makers and related workers 1 Cement stone and other mineral products machine operators 1 Chemical and physical science technicians 1 Chemical engineering technicians 1 Chemical processing plant controllers 1 Chemical products plant and machine operators 1 Chemists 1 Conference and event planners 1 Customs and border inspectors 1 Data entry clerks 1 Dental assistants and therapists 1 Dieticians and nutritionists 1 Dispensing opticians 1 Domestic housekeepers 1 Economists 1 Education methods specialists 1 Environmental and occupational health and hygiene professionals 1 Environmental and occupational health inspectors and associates 1 Fibre preparing spinning and winding machine operators 1 Finance managers 1 Financial and insurance services branch managers 1 Fire-fighters 1 Fitness and recreation instructors and program leaders 1 Food and beverage tasters and graders 1 Food and related products machine operators 1
Labour shortages and surpluses 2017
2017 40
Directorate-General for Employment Social Affairs and Inclusion European Network of Public Employment Services (PES)
Shortage occupation PES count
Food service counter attendants 1 Forestry labourers 1 Fruit vegetable and related preservers 1 Fur and leather preparing machine operators 1 Glass and ceramics plant operators 1 Hand launderers and pressers 1 Hand packers 1 Handicraft workers in textile leather and related materials 1 Health associate professionals not elsewhere classified 1 Health professionals not elsewhere classified 1 House builders 1 Human resource managers 1 Incinerator and water treatment plant operators 1 Information and communications technology user support technicians 1 Judges 1 Lawyers 1 Legal and related associate professionals 1 Legal professionals not elsewhere classified 1 Library clerks 1 Lifting truck operators 1 Livestock and dairy producers 1 Livestock farm labourers 1 Medical and pathology laboratory technicians 1 Medical secretaries 1 Metal production process controllers 1 Mining and quarrying labourers 1 Mining engineers metallurgists and related professionals 1 Mixed crop and animal producers 1 Mixed crop growers 1 Motorcycle drivers 1 Odd job persons 1 Other cleaning workers 1 Other music teachers 1
Paper products machine operators 1 Personnel and careers professionals 1 Personnel clerks 1 Pet groomers and animal care workers 1 Physicists and astronomers 1 Physiotherapy technicians and assistants 1 Potters and related workers 1 Power production plant operators 1 Prison guards 1 Product and garment designers 1 Psychologists 1 Pulp and papermaking plant operators 1 Railway brake signal and switch operators 1 Receptionists (general) 1 Refuse sorters 1 Riggers and cable splicers 1 Scribes and related workers 1 Secretaries (general) 1 Securities and finance dealers and brokers 1 Security guards 1 Senior government officials 1 Senior officials of special-interest organizations 1 Shelf fillers 1 Ships engineers 1 Shoemaking and related machine operators 1 Social work associate professionals 1 Stall and market salespersons 1 Stationary plant and machine operators not elsewhere classified 1 Stonemasons stone cutters splitters and carvers 1 Street and related service workers 1 Sweepers and related labourers 1 Teaching professionals not elsewhere classified 1 Telecommunications engineering technicians 1 Textile fur and leather products machine operators not elsewhere classified 1 Trade brokers 1 Travel attendants and travel stewards 1 Travel guides 1
Labour shortages and surpluses 2017
2017 41
Directorate-General for Employment Social Affairs and Inclusion European Network of Public Employment Services (PES)
Shortage occupation PES count
Tree and shrub crop growers 1 Underwater divers 1 University and higher education teachers 1 Vehicle cleaners 1 Veterinarians 1 Weaving and knitting machine operators 1 Web technicians 1 Wood processing plant operators 1 Woodworking-machine tool setters and operators 1
Labour shortages and surpluses 2017
2017 42
Directorate-General for Employment Social Affairs and Inclusion European Network of Public Employment Services (PES)
ANNEX 3 SURPLUS OCCUPATIONS
Surplus occupation PES count
General office clerks 8 Shop sales assistants 8 Advertising and marketing professionals 6 Bank tellers and related clerks 6 Sociologists anthropologists and related professionals 6 Child care workers 5 Hairdressers 5 Journalists 5 Cashiers and ticket clerks 4 Cleaners and helpers in offices hotels and other establishments 4 Hand packers 4 Mail carriers and sorting clerks 4 Photographers 4 Receptionists (general) 4 Tailors dressmakers furriers and hatters 4 Accounting and bookkeeping clerks 3 Administrative and executive secretaries 3 Beauticians and related workers 3 Biologists botanists zoologists and related professionals 3 Bricklayers and related workers 3 Broadcasting and audio-visual technicians 3 Civil engineering labourers 3 Economists 3 Gardeners horticultural and nursery growers 3 Interior designers and decorators 3 Kitchen helpers 3 Legal professionals not elsewhere classified 3 Manufacturing labourers not elsewhere classified 3 Motor vehicle mechanics and repairers 3
Musicians singers and composers 3 Other artistic and cultural associate professionals 3 Painters and related workers 3 Philosophers historians and political scientists 3 Security guards 3 Sweepers and related labourers 3 Travel consultants and clerks 3 Waiters 3 Actors 2 Archivists and curators 2 Bakers pastry-cooks and confectionery makers 2 Bartenders 2 Building construction labourers 2 Business services and administration managers not elsewhere classified 2 Cabinet-makers and related workers 2 Car taxi and van drivers 2 Chemists 2 Cleaning and housekeeping supervisors in offices hotels and other establishments 2 Credit and loans officers 2 Customs and border inspectors 2 Elementary workers not elsewhere classified 2 Film stage and related directors and producers 2 Financial analysts 2 Forestry and related workers 2 Freight handlers 2 Graphic and multimedia designers 2 Health care assistants 2 Hotel receptionists 2 Lawyers 2 Legal and related associate professionals 2 Library clerks 2 Livestock and dairy producers 2 Management and organization analysts 2 Messengers package deliverers and luggage porters 2 Odd job persons 2 Office supervisors 2 Plasterers 2
Labour shortages and surpluses 2017
2017 43
Directorate-General for Employment Social Affairs and Inclusion European Network of Public Employment Services (PES)
Surplus occupation PES count
Police officers 2 Pre-press technicians 2 Print finishing and binding workers 2 Printers 2 Prison guards 2 Product and garment designers 2 Psychologists 2 Public relations professionals 2 Religious professionals 2 Secondary education teachers 2 Secretaries (general) 2 Social work and counselling professionals 2 Stall and market salespersons 2 Stock clerks 2 Teachers aides 2 Telephone switchboard operators 2 Travel guides 2 Visual artists 2 Advertising and public relations managers 1 Agricultural technicians 1 Announcers on radio television and other media 1 Assemblers not elsewhere classified 1 Building and related electricians 1 Building architects 1 Building caretakers 1 Building frame and related trades workers not elsewhere classified 1 Business services agents not elsewhere classified 1 Buyers 1 Carpenters and joiners 1 Chemical engineers 1 Civil engineers 1 Clearing and forwarding agents 1 Clerical support workers not elsewhere classified 1
Commercial sales representatives 1 Conference and event planners 1 Contact centre information clerks 1 Contact centre salespersons 1 Cooks 1 Crane hoist and related plant operators 1 Creative and performing artists not elsewhere classified 1 Dancers and choreographers 1 Data entry clerks 1 Database designers and administrators 1 Domestic cleaners and helpers 1 Domestic housekeepers 1 Draughtspersons 1 Driving instructors 1 Early childhood educators 1 Electronics mechanics and servicers 1 Farming forestry and fisheries advisers 1 Fashion and other models 1 Fast food preparers 1 Field crop and vegetable growers 1 Filing and copying clerks 1 Finance managers 1 Financial and insurance services branch managers 1 Financial and investment advisers 1 Fire-fighters 1 Fitness and recreation instructors and program leaders 1 Floor layers and tile setters 1 Food service counter attendants 1 Fruit vegetable and related preservers 1 Gallery museum and library technicians 1 Garbage and recycling collectors 1 Garment and related pattern-makers and cutters 1 Glass and ceramics plant operators 1 Government tax and excise officials 1 Hand launderers and pressers 1
Labour shortages and surpluses 2017
2017 44
Directorate-General for Employment Social Affairs and Inclusion European Network of Public Employment Services (PES)
Surplus occupation PES count
Heavy truck and lorry drivers 1 House builders 1 Hunters and trappers 1 Information and communications technology installers and servicers 1 Information and communications technology user support technicians 1 Insurance representatives 1 Jewellery and precious-metal workers 1 Judges 1 Legal secretaries 1 Librarians and related information professionals 1 Life science technicians (excluding medical) 1 Lifting truck operators 1 Managing directors and chief executives 1 Manufacturing supervisors 1 Medical and dental prosthetic technicians 1 Metal moulders and coremakers 1 Mining and quarrying labourers 1 Mixed crop and animal producers 1 Mixed crop growers 1 Mobile farm and forestry plant operators 1 Musical instrument makers and tuners 1 Other language teachers 1 Pawnbrokers and money-lenders 1 Personnel and careers professionals 1 Pet groomers and animal care workers 1 Photographic products machine operators 1 Physical and engineering science technicians not elsewhere classified 1 Physicists and astronomers 1 Police inspectors and detectives 1 Precision-instrument makers and repairers 1 Primary school teachers 1 Process control technicians not elsewhere classified 1 Product graders and testers (excluding foods and beverages) 1
Production clerks 1 Professional services managers not elsewhere classified 1 Protective services workers not elsewhere classified 1 Research and development managers 1 Retail and wholesale trade managers 1 Roofers 1 Sales workers not elsewhere classified 1 Senior government officials 1 Service station attendants 1 Shelf fillers 1 Shop supervisors 1 Social work associate professionals 1 Special needs teachers 1 Spray painters and varnishers 1 Statistical mathematical and related associate professionals 1 Stonemasons stone cutters splitters and carvers 1 Street food salespersons 1 Supply distribution and related managers 1 Teaching professionals not elsewhere classified 1 Technical and medical sales professionals (excluding ICT) 1 Training and staff development professionals 1 Translators interpreters and other linguists 1 Transport conductors 1 Tree and shrub crop growers 1 Typists and word processing operators 1 Undertakers and embalmers 1 Vocational education teachers 1 Weaving and knitting machine operators 1 Woodworking-machine tool setters and operators 1
Labour shortages and surpluses 2017
2017 45
Directorate-General for Employment Social Affairs and Inclusion European Network of Public Employment Services (PES)
ANNEX 4 THE RATIO OF UNEMPLOYED TO NEW HIRES
ISCO-08 title
2015
UE
Recruited in the
last year (lt12
months)
Ratio of UE to new recruits
Street and related service workers 85 104 08 Agricultural forestry and fishery labourers 3913 5343 07 Mining and construction labourers 1937 3525 05 Creative and performing artists 610 1115 05 Refuse workers 1036 1923 05 Painters building structure cleaners and related trades workers 1116 2117 05 Street and market salespersons 195 389 05 Building frame and related trades workers 3632 7353 05 Mining manufacturing and construction supervisors 626 1315 05 Ships deck crews and related workers 53 114 05 Market gardeners and crop growers 1471 3207 05 Managing directors and chief executives 304 667 05 Travel attendants conductors and guides 229 538 04 Wood treaters cabinet-makers and related trades workers 491 1159 04 Manufacturing labourers 1640 3909 04 Domestic hotel and office cleaners and helpers 5679 13545 04 Other stationary plant and machine operators 822 1961 04 Mobile plant operators 1038 2497 04 Building finishers and related trades workers 1519 3680 04 Textile fur and leather products machine operators 431 1048 04 Garment and related trades workers 422 1047 04 Chemical and photographic products plant and machine operators 157 389 04 Food processing and related trades workers 930 2330 04 Vehicle window laundry and other hand cleaning workers 291 754 04 Sheet and structural metal workers moulders and welders and related workers
996 2603 04
Waiters and bartenders 4399 11595 04 Cooks 1529 4039 04 Metal processing and finishing plant operators 208 557 04 Printing trades workers 203 548 04 Forestry and related workers 130 351 04 Protective services workers 1347 3658 04 Transport and storage labourers 2532 6939 04 Fishery workers hunters and trappers 46 128 04 Material-recording and transport clerks 1671 4630 04 Process control technicians 179 517 03 Mining and mineral processing plant operators 94 274 03 Telecommunications and broadcasting technicians 177 519 03 Blacksmiths toolmakers and related trades workers 816 2409 03 Building and housekeeping supervisors 678 2045 03
Secretaries (general) 1072 3259 03 Assemblers 850 2586 03 Other craft and related workers 258 810 03 Shop salespersons 6600 21042 03 Electrical equipment installers and repairers 958 3060 03 Food and related products machine operators 437 1400 03 Other sales workers 1087 3510 03 Food preparation assistants 1646 5337 03 Mixed crop and animal producers 387 1260 03 Car van and motorcycle drivers 1155 3764 03 Client information workers 1993 6531 03 Sports and fitness workers 605 1984 03 Handicraft workers 194 638 03 Life science technicians and related associate professionals 82 271 03 Keyboard operators 283 940 03 Electronics and telecommunications installers and repairers 290 963 03 Other personal services workers 313 1047 03 Vocational education teachers 279 940 03 Other teaching professionals 744 2518 03 General office clerks 966 3272 03 Authors journalists and linguists 335 1135 03 Hairdressers beauticians and related workers 806 2796 03
Labour shortages and surpluses 2017
2017 46
Directorate-General for Employment Social Affairs and Inclusion European Network of Public Employment Services (PES)
ISCO-08 title
2015
UE
Recruited in the
last year (lt12
months)
Ratio of UE to new recruits
Animal producers 189 660 03 Other elementary workers 976 3401 03 Machinery mechanics and repairers 1134 3962 03 Ship and aircraft controllers and technicians 80 281 03 Hotel and restaurant managers 344 1220 03 Cashiers and ticket clerks 908 3220 03 Retail and wholesale trade managers 224 809 03 Sales marketing and development managers 311 1124 03 Physical and engineering science technicians 1204 4366 03 Administrative and specialised secretaries 1106 4040 03 Sales and purchasing agents and brokers 1294 4754 03 Rubber plastic and paper products machine operators 256 941 03 Artistic cultural and culinary associate professionals 511 1906 03 Numerical clerks 944 3532 03 Other services managers 184 691 03 Child care workers and teachers aides 1335 5005 03 Heavy truck and bus drivers 1426 5349 03 Business services and administration managers 383 1439 03 Information and communications technology service managers 67 257 03 Regulatory government associate professionals 209 807 03 Life science professionals 176 681 03 Wood processing and papermaking plant operators 97 379 03 Locomotive engine drivers and related workers 46 179 03 Legal professionals 315 1245 03 Personal care workers in health services 2195 8787 02 Physical and earth science professionals 85 345 02 Street vendors (excluding food) 50 204 02 Architects planners surveyors and designers 515 2092 02 Other clerical support workers 901 3657 02 Business services agents 510 2114 02 Manufacturing mining construction and distribution managers 361 1507 02 Tellers money collectors and related clerks 381 1612 02 Librarians archivists and curators 58 248 02 Medical and pharmaceutical technicians 255 1099 02 University and higher education teachers 301 1333 02 Information and communications technology operations and user support technicians
418 1888 02
Legal social and religious associate professionals 920 4348 02 Financial and mathematical associate professionals 601 2852 02 Sales marketing and public relations professionals 865 4172 02 Finance professionals 472 2281 02 Engineering professionals (excluding electrotechnology) 635 3118 02 Other health associate professionals 531 2657 02
Social and religious professionals 460 2317 02 Professional services managers 176 891 02 Nursing and midwifery associate professionals 556 2855 02 Legislators and senior officials 53 286 02 Database and network professionals 83 455 02 Administration professionals 641 3673 02 Primary school and early childhood teachers 575 3345 02 Electrotechnology engineers 142 827 02 Secondary education teachers 471 2812 02 Other health professionals 346 2083 02 Nursing and midwifery professionals 273 1760 02 Software and applications developers and analysts 631 4159 02 Medical doctors 293 1944 02 No occupation 152894 00
No answer 2531 578 44 Total 249561 294937 08
Labour shortages and surpluses 2017
2017 47
Directorate-General for Employment Social Affairs and Inclusion European Network of Public Employment Services (PES)
HOW TO OBTAIN EU PUBLICATIONS
Free publications
bull one copy
via EU Bookshop (httpbookshopeuropaeu)
bull more than one copy or postersmaps
from the European Unionrsquos representations (httpeceuropaeurepresent_enhtm)
from the delegations in non-EU countries
(httpeeaseuropaeudelegationsindex_enhtm)
by contacting the Europe Direct service (httpeuropaeueuropedirectindex_enhtm)
or calling 00 800 6 7 8 9 10 11 (free phone number from anywhere in the EU) () () The information given is free as are most calls (though some operators phone boxes or hotels may charge you)
Priced publications
bull via EU Bookshop (httpbookshopeuropaeu)
Priced subscriptions
bull via one of the sales agents of the Publications Office of the European Union
(httppublicationseuropaeuothersagentsindex_enhtm)
doi 10276731262
KE-0
1-1
8-2
63-E
N-N
[Ca
talo
gu
e n
um
be
r]

Labour shortages and surpluses 2017
2018 4
Directorate-General for Employment Social Affairs and Inclusion European Network of Public Employment Services (PES)
LEGAL NOTICE
This document has been prepared for the European Commission however it reflects the views only of the authors and the Commission cannot be held responsible for any use which may be made of the information contained therein
More information on the European Union is available on the Internet (httpwwweuropaeu)
Luxembourg Publications Office of the European Union 2016
ISBN 978-92-79-81021-3 doi 10276731262 copy European Union 2016
Europe Direct is a service to help you find answers
to your questions about the European Union
Freephone number ()
00 800 6 7 8 9 10 11
() The information given is free as are most calls (though some operators phone boxes or hotels may charge you)
Labour shortages and surpluses 2017
2018 5
Directorate-General for Employment Social Affairs and Inclusion European Network of Public Employment Services (PES)
Table of contents
Executive Summary 6
1 Introduction 9 11 The scope of the study 9 12 Identifying and evaluating shortages and surpluses 9 13 Exploring the causes of shortages 10
2 Profile of shortage and surplus occupations in 2017 11 21 Introduction 11 22 Profile of the most extensive shortage occupations 11 23 Profile of high magnitude shortages 12 24 Occupational groups by shortage magnitude 13 25 Profile of the most extensive surplus occupations 14 26 Profile of high magnitude surpluses 15 27 Broad occupational groups by surplus magnitude 16 28 Comparison of shortages and surpluses by broad occupation 17 29 Cross-check with LSF data 17 210 Conclusions 18
3 Profile of shortages and surpluses in space and time 19 31 Introduction 19 32 PES methods used for identifying shortages and surpluses 19 33 Geographic distribution of shortages and surpluses 20 34 Tracking shortages over time 23 35 3-digit vs 4-digit 24 36 Conclusions 25
4 The causes of skill shortages and potential solutions 26 41 Introduction 26 42 The role of skills and labour shortages in skills imbalances 26 43 Location of skill imbalances and cross border mobility 27 44 Assessing gender composition of surpluses 28 45 Conclusions 29
5 Conclusions and recommendations 31 51 Conclusions 31 52 Recommendations 31
Annex 1 Data collection template 35
Annex 2 Shortage occupations 37
Annex 3 Surplus occupations 42
Annex 4 The ratio of unemployed to new hires 45
Labour shortages and surpluses 2017
2018 6
Directorate-General for Employment Social Affairs and Inclusion European Network of Public Employment Services (PES)
EXECUTIVE SUMMARY
This is the third study on imbalances in the European labour market using a survey of
national Public Employment Services (PES) The top raking surplus and shortage
occupations (ranked by the number of reporting PES) in the EU Member States Norway
Iceland and Switzerland identified in this study are presented in Table 1E
Table 1E Top shortage and surplus occupations in 2017
Shortage Surplus
Cooks General office clerks
Plumbers and pipe fitters Shop sales assistants
Generalist medical practitioners Advertising and marketing professionals
Welders and flamecutters Bank tellers and related clerks
Heavy truck and lorry drivers Sociologists anthropologists etc
Metal working machine tool setters Child care workers
Nursing professionals Hairdressers
Software developers Journalists
Agric and ind machinery mechanics Cashiers and ticket clerks
Cleaners and helpers in offices hotels etc Cleaners and helpers in offices hotels etc
Commercial sales representatives Hand packers
Specialist medical practitioners Mail carriers and sorting clerks
Systems analysts Photographers
Bricklayers and related workers Receptionists (general)
Building and related electricians Tailors dressmakers furriers and hatters
Butchers fishmongers and related
Motor vehicle mechanics and repairers
Nursing associate professionals
Sheet-metal workers
Shop sales assistants
Waiters
Positive findings
The current study attracted a greater level of engagement by the PES then
previously with a higher number of PES providing data on shortagessurpluses
A comparison between the lists of shortage occupations and their rankings in
2015 2016 and 2017 showed a high level of consistency
The use of 4-digit ISCO classification of occupations provided more accurate and
detailed information than the more aggregated 3-digit classification used in the
previous studies
In general the PES demonstrated a capability to distinguish between shortages
caused primarily by skill deficits and shortages which primarily reflected an
unwillingness of appropriately qualified job-seekers to work in the occupation in
question (ie labour shortages)
Labour shortages and surpluses 2017
2018 7
Directorate-General for Employment Social Affairs and Inclusion European Network of Public Employment Services (PES)
The list of shortage and surplus occupations identified through the PES are
consistent with the recently reported Labour Force Survey (LSF) data in particular
the ratio of unemployed to new hires (the ratio is typically low for skill shortages
and high for surpluses and labour shortages)
A clear distinction has been identified between the competences associated with
shortages and surpluses Shortages were dominated by technical competences
(eg occupations at professional associate professional and craft level in the
areas of software engineering and healthcare) while surpluses with non-technical
competencies (eg sales admin arts and humanities)
Despite a relatively low number of PES providing data on surplus occupations a
considerable number of cross-border matching possibilities between shortage
occupations in some countries and surplus occupations in others were identified
The concern that shortagessurpluses reported by the PES would be skewed
towards lower skilled occupations (potentially reflecting the type of vacancies
employers select to advertise through PES and the profile of the job-seekers)
proved to be unfounded the highest number of both shortage and surplus
occupations identified were in the professional group This was partially due to the
use of sources other than PES administrative data to identify imbalances
Negative findings
A number of PES could not provide data on surpluses Typically those were PES
that relied on data sources other than administrative data (eg employer surveys
immigration data etc) In addition many of PES who submitted data on
surpluses listed very few occupations (less than 20) While this may be a
reflection of a more buoyant EEA labour market it limited the extent to which
cross-border matching possibilities could be identified
The data collected on the gender composition of shortage and surplus occupations
was poor It highlighted that gender imbalances at occupational level are best
analysed using other sources (eg LSF data) in conjunction with the PES data
The analysis highlights that only about one in three PES could provide data on
shortages and surpluses at sub-national level (NUTs 2 3 or 4)
Limiting the list of occupations to 20 irrespective of the size and characteristics of
the local labour market might have resulted in the lack of obvious patterns in the
geographical distribution of shortages and surpluses
Recommendations
A campaign should be launched to raise awareness of the importance of
comprehensive information on shortages and surpluses This could involve the
circulation of the report and presentation of key findings to the national
authorities and relevant groups (eg Advisors for European PES Affairs and the
Eures coordination group)
In order to properly assess labour market imbalances and identify possibilities for
cross-country matching of shortages and surpluses a model for the systematic
Labour shortages and surpluses 2017
2018 8
Directorate-General for Employment Social Affairs and Inclusion European Network of Public Employment Services (PES)
collection of data is proposed and summarised in Figure 1E The model draws
from the findings of three bottleneck studies over the period 2015-2017
Figure 1E Model for gathering data on shortage and surplus occupations
Sources of data on surpluses PES data from other relevant agencies (EU legislation) Dimensions of shortagessurpluses extent (number of reporting PES) and severity (high or low magnitude) Type of shortage skill vs labour shortages Classification of occupations used ISCO 08 4-digit codes (or translation into these codes) Accuracy test cross-check with LSF data (ratio of unemployed to new hires) Gender balance assessment LFS data on employment at occupational level by gender PES job seekers Regional balance assessment LSF data data from relevant agencies Number of occupations reporting should be extended beyond 20 occupations but with upper limit (eg 50) Timing of imbalance assessment September
(features added to the methodology in this study highlighted in red)
Labour shortages and surpluses 2017
2018 9
Directorate-General for Employment Social Affairs and Inclusion European Network of Public Employment Services (PES)
1 INTRODUCTION
This is the third report in a series of annual reports which provide an analysis of shortage
and since 2016 surplus occupations as identified by the European PES Each report has
a somewhat different focus The focus of this report is to ultimately draw on the findings
in the whole series and create a model which can accurately and comprehensively
identify imbalances and cross-border matching possibilities in a manner which is of
practical use to EURES and the national VET authorities in the EEA countries
Facilitating the matching of skills and jobs across borders in the EU contributes to the
better functioning of labour markets in the EU as pursued by the EURES network1
Supporting the identification of skills shortages and the better matching of skills of job-
seekers with the needs of employers is also among the objectives of the European
Network of Public Employment Services (PES Network)2
11 The scope of the study
A total of thirty-three PES were asked to submit data on shortage and surplus
occupations These PES included the national PES from twenty-seven EU Member States
and the three regional PES from Belgium As in the case of the studies in 2015 and 2016
the national PES of Iceland and Norway were also requested to submit data while the
national PES of Switzerland was included for the first time in 2017
Table 11 below shows the response of the PES to these requests A total of twenty-eight
PES submitted data on shortage occupations while a total of eighteen submitted data on
surplus occupations This represents an increase of two PES compared to the 2016 study
and an increase of five PES compared to the 2015 study in respect of the number of PES
who provided a list of shortage occupations and an increase of five PES compared to the
number of PES who provided lists of surplus occupations in 2016
As shown in chapter three below the main reason for the lower response in the case of
surplus occupations were the methods used by the PES for identifying shortage
occupations Specifically many of the PES used employer surveys as their exclusive
source of information on shortages and these do not provide data on surplus
occupations To improve on data coverage data could be collected from other bodies
Table 11 Participating PES
Public employment services which submitted data on shortage occupations
AT BE - Actiris BE - Le Forem BE - VDAB BG CH CY DE DK EE FI FR HR HU IE IT IS LT LU LV MT NL N0 PL PT SE SK SI
Public employment services which submitted data on surplus occupations
LF BG CH CY DK EE FI FR HR HU IE IS LT LV NL PL SE SK
12 Identifying and evaluating shortages and surpluses
One of the core objectives of this study was to identify shortage and surplus occupations
using the most detailed (ie ISCO rsquo08 4-digit codes) data available to the PES (in the
future where necessary PES could augment its data using other sources) The analysis
uses two dimensions to quantify shortage and surplus occupations the most widely
1 Regulation (EU) 2016589 of 13 April 2016 on a European network of employment services (EURES) workers
access to mobility services and the further integration of labour markets 2 As defined in Article 3 of the Decision 5732014EU on Enhanced Co-operation between Public Employment
Services of 15 May 2014
Labour shortages and surpluses 2017
2018 10
Directorate-General for Employment Social Affairs and Inclusion European Network of Public Employment Services (PES)
reported (ie reported by the most PES) shortage and surplus occupations and the
occupations with the most severe shortages and surpluses
Owing to limitations of space however only lists of between twenty to thirty individual
occupations could be displayed here However it should be noted that almost one
thousand shortage occupations were reported by the twenty-eight PES of which 282 were
different occupations The number of surplus occupations reported by eighteen PES were
381 of which 196 were different occupations3
An attempt is made to evaluate the accuracy of the PES identification of shortage and
surplus occupations by comparing the most widely reported shortages and surpluses with
the ratio of unemployed to new hires at EU level
13 Exploring the causes of shortages
This study differs in several respects from the two previous studies Firstly this study
attempts to identify the causes of shortage and surplus occupations Accordingly a
number of new questions were added to the questionnaire specifically on the nature of
the shortage (ie was it due to a skills deficit or to a shortage of labour) and ndash in the
case of surplus occupations - the gender composition While many of the PES provided a
classification of shortages in terms of labour versus skills shortage the response to the
question on gender share was disappointing
The data collection template (Annex 1) also inquired of the extent to which the PES could
provide the data at regional level The purpose of including this question was to assess
the feasibility of undertaken a future edition of this study at regional rather than national
level Unfortunately the response to this question was also disappointing
Despite the rather disappointing response to some of the new questions the study does
provide a wealth of data on shortage and surplus occupations The vast majority of PES
provided roughly twenty specific occupations which they considered to be in short supply
and rated the degree of severity of the shortage A number of PES provided a
significantly greater number than twenty shortage occupations
The existence of the previous two studies provided the basis for an assessment of the
extent to which the shortages persisted over time The fact that data on the shortages
and surplus occupations in the previous studies was at a higher level of aggregation (ie
the 3-digit occupation codes) also allowed an assessment to be made of the level of
aggregation which is required to accurately identify shortage and surplus occupations
The analysis herein conclusively demonstrated that the highest level of disaggregation
was required (ie the 4-digit occupation codes) for accurate identification as the 3-digit
codes contained occupations which were not in shortage or surplus (see chapter 3
below)
The analysis also explores the extent to which the same occupations are classified as
shortages in some countries and surpluses in others thereby creating the possibility that
policies designed to enhance cross-border matching between such occupations might
alleviate some skill and labour market imbalances in the EEA group of countries
3 A list of the occupations is shown in annexes two and three attached
Labour shortages and surpluses 2017
2018 11
Directorate-General for Employment Social Affairs and Inclusion European Network of Public Employment Services (PES)
2 PROFILE OF SHORTAGE AND SURPLUS OCCUPATIONS IN 2017
21 Introduction
This chapter contains a detailed analysis of the data on shortage and surplus
occupations The data is analysed from a number of perspectives such as the most
frequently reported shortages and surpluses and their relative magnitude The PES were
requested to identify a minimum of twenty shortage occupations and twenty surplus
occupations However while twenty-eight PES identified at least roughly twenty shortage
occupations only eighteen PES identified any surplus occupations
22 Profile of the most extensive shortage occupations
Table 21 shows the shortage occupations reported by the most PES in 2017 The
twenty-eight PES who submitted data on shortage occupations is two more than in the
2016 report and five more than the number that submitted such data in 2015
The Table shows that over half of all PES (sixteen) reported shortages of cooks making
lsquocooksrsquo the occupation reported by the most PES However this figure underestimates
the seriousness of the shortage of persons qualified in cooking skills because five PES
also reported shortages of chefs and four PES reported shortages of bakers and pastry-
makers
Within the top twenty-one shortage occupations the health related occupations
dominated the list with four different occupations these were lsquogeneralist medical
practitionersrsquo lsquonursing professionalsrsquo lsquospecialist medical practitionersrsquo and lsquoassociate
professional nursesrsquo The difference between professional and associate professional
nurses may reflect the fact that nursing qualifications differ across the EEA area
specifically nurses in some countries require a degree to practice in other countries
nursing is at sub-degree level
Table 21 Top 21 shortage occupations (4-digit level)
Occupation
Number of PES reporting occupation as shortage
Occupation
Number of PES reporting occupation as shortage
Cooks 16 Systems analyst 10
Plumbers and pipe fitters 13 Cleaners and helpers in offices hotels etc
10
Generalist medical practitioners 13 Bricklayers and related workers 9
Welders and flame cutters 12 Building and related electricians 9
Heavy truck and lorry drivers 11 Butchers fishmongers and related food
9
Metal workers machine tool setting and operators
11 Motor vehicle mechanics and repairers
9
Nursing professionals 11 Nursing associate professionals 9
Software developers 11 Sheet-metal workers 9
Agriculture and industrial machinery repairers
10 Shop sales assistants 9
Commercial sales representatives 10 Waiters 9
Specialist medical practitioners 10
Labour shortages and surpluses 2017
2018 12
Directorate-General for Employment Social Affairs and Inclusion European Network of Public Employment Services (PES)
There may be an argument therefore for combining the associate and professional
category when assessing the true extent of the shortage of nurses This argument is
particularly compelling in respect of those PES who report a shortage of associate
professional nurses but not a shortage of professional nurses There are four such PES
Denmark Estonia Luxemburg and Slovenia If associate professional nurses are
essentially doing the same job as professional nurses in these countries the number of
PES reporting a shortage of professional nurses is in effect fifteen rather than eleven
Indeed confining the shortage occupations to those reported by nine or more PES may
disguise the true extent of shortages in health related occupations There were many
health related occupations which were identified by less than nine PES as shortage
occupations For example seven PES reported shortages of lsquohealthcare assistantsrsquo five
reported shortages of lsquophysiotherapistsrsquo and three reported shortages of lsquomidwivesrsquo Both
Germany and France reported many shortages of specialists within the lsquonursersquo and lsquoother
healthcare professionalsrsquo categories
Shortages of both lsquosoftware developersrsquo and lsquosystems analystsrsquo appear to be quite
widespread as these occupations were reported as being in shortage by ten and eleven
PES respectively The impression of widespread shortages is supported by the fact that a
number of software-related occupations such as lsquoapplication programmersrsquo lsquoother
software and application developersrsquo and lsquoweb and multi-media developersrsquo were all
reported as shortage occupations by six PES
The main building related crafts such as lsquoelectriciansrsquo lsquoplumbersrsquo and lsquobricklayersrsquo were
also prominent in the list Indeed only the occupation of lsquocookrsquo was reported as a
shortage occupation by more PES than lsquoplumbersrsquo
In addition eight PES reported experiencing shortages of lsquoconcrete finishersrsquo and
lsquocarpenters and joinersrsquo while six PES reported shortages of lsquoroofersrsquo and lsquoplasterersrsquo
But it is the engineering occupations which demonstrate that shortages may be quite
pervasive in a group of occupations despite the fact that they are not included in the list
of specific occupations which were reported by the most PES Thus lsquocivil engineersrsquo
lsquomechanical engineersrsquo and both electrical and electronic engineering technicians just
missed inclusion in Table 21 above as they were all reported as shortage occupations by
eight PES In addition both lsquoelectronic engineersrsquo and lsquomechanical engineering
techniciansrsquo were reported as shortage occupations by seven PES
The teaching professions also just missed inclusion in Table 21 because primary school
teachers were reported as a shortage occupation by eight PES and secondary school
teachers by seven PES
Two occupations which feature in surveys on skill shortages and which are not included in
Table 21 are lsquoaccountantsrsquo and lsquotoolmakersrsquo Both occupations were reported as shortage
occupations by six PES
The total list of occupations which were identified by at least one PES as a shortage
occupation is shown in Annex 2 of this report
23 Profile of high magnitude shortages
In addition to identifying shortage occupations the PES were also asked to rank the
occupations in terms of the severity of the shortage Table 22 below lists those
occupations for which the PES identified shortages of high magnitude
The number of PES who identify occupations which have shortages of high magnitude will
be lower than the number of PES who identify occupations which have shortages
irrespective of the magnitude of those shortages As shown in Table 21 the list of the
top twenty-one shortage occupations have been identified by at least nine different PES
Labour shortages and surpluses 2017
2018 13
Directorate-General for Employment Social Affairs and Inclusion European Network of Public Employment Services (PES)
In contrast the list of occupations which have been identified by the PES as having
shortages of a high magnitude includes occupations which have been identified by as few
as two PES Therefore occupations which have not been included in the twenty one
shortage occupations identified by the most PES may qualify for inclusion in the list of
occupations with shortages of high magnitude
Table 22 High magnitude shortages (4-digit level)
Occupation Number of PES stating high magnitude of shortage
Occupation Number of PES stating high magnitude of shortage
Cooks 6 Cleaners and helpers in offices 2
Systems analysts 6 Contact centre sales persons 2
Concrete placers and concrete finishers
4 Database designers and administrators
2
Plumbers and pipe fitters 4 Heavy truck and lorry drivers 2
Shops sales assistants 4 Metal working machine tool setters 2
Waiters 4 Primary school teachers 2
Welders and flame cutters 4 Secondary school teachers 2
Nursing professionals 3 Other software and application developers
2
Application programmers 3 Software developers 2
Carpenters and joiners 3
Thus while lsquocooksrsquo retain the top ranking there are eight occupations in the list of
shortage occupations of high magnitude which are not included in the general list of
shortage occupations in Table 21 These include two lsquoteacherrsquo occupations and three new
lsquosoftwarersquo related occupations The two software occupations on the general list of
shortages in Table 21 are also included in this Table which means that five software
related occupations are considered to have shortages of high magnitude The position of
lsquosystems analystrsquo is particularly noteworthy A total of ten of twenty eight PES classify
this occupation as a shortage and six of these PES consider the shortage to be of a high
magnitude Thus shortages in this occupation appear to be both relatively widespread
and quite severe
The other finding of interest is that there are a considerable number of craft occupations
which are classified by a number of PES as shortages of high magnitude Thus four PES
rate lsquoplumbers and pipe fittersrsquo lsquoconcrete placersrsquo and lsquoweldersrsquo as shortages of high
magnitude while three PES also maintain that there are serious shortages of carpenters
24 Occupational groups by shortage magnitude
Figure 21 below shows how the PES classified shortages by broad occupational level in
terms of the severity of the shortage The figure shows that the professional shortage
occupations were classified by the most PES as high magnitude followed by the lsquocraft
and related trade workersrsquo Less than ten PES classified any other occupation as a
shortage of high magnitude but interestingly - while only four PES classified skilled
agricultural workers as a shortage - all of them ranked the shortage as being of high
magnitude Similarly while only seven PES categorised any of the clerical-related
occupations as a shortage five of the seven PES classified at least one of these
occupations as a shortage of high magnitude
Labour shortages and surpluses 2017
2018 14
Directorate-General for Employment Social Affairs and Inclusion European Network of Public Employment Services (PES)
Figure 21 Shortages by estimated shortage magnitude (1-digit level)
25 Profile of the most extensive surplus occupations
The PES were also requested to identify occupations for which there was an excess
supply and eighteen PES did so The surplus occupations identified by at least four
different PES are shown in Table 23
Intuitively one might expect that an excess supply of jobseekers is more likely to occur
in the case of occupations where the entry requirements are not associated with a high
level of qualifications or technical skills
Table 23 Surplus occupations (4-digit level)
Occupation Number of PES reporting this occupation as surplus
Occupation Number of PES reporting this occupation as surplus
Shop sales assistants 8 Tailors dressmakers furriers hat makers
4
General office clerks 8 Cashiers and ticket sales 4
Advertising and marketing professionals
6 Cleaners and helpers in offices hotels
4
Bank tellers and related clerks 6 Hand packers 4
Sociologists anthropologists and religious
6 Mail carriers and sorting clerks 4
Child care workers 5 Photographer 4
Hairdressers 5 Receptionist (general) 4
Journalists 5
In general this is the case as the occupations of lsquoshop sales assistantsrsquo lsquogeneral office
clerksrsquo lsquobank tellers and related clerksrsquo lsquocashiers and ticket salesrsquo lsquocleaners and helpersrsquo
0 5 10 15 20 25 30
Armed forces occupations
Managers
Skilled agricultural forestry and fishery workers
Clerical support workers
Elementary occupations
Plant and machine operators and assemblers
Technicians and associate professionals
Service and sales workers
Craft and related trades workers
Professionals
High Medium Low
Labour shortages and surpluses 2017
2018 15
Directorate-General for Employment Social Affairs and Inclusion European Network of Public Employment Services (PES)
lsquohand packersrsquo lsquomail carriers and sorting clerksrsquo and lsquoreceptionistsrsquo would not generally
require a high formal level of qualification
However four of the fifteen occupations lsquoadvertising and marketing professionalsrsquo
lsquosociologists and anthropologistsrsquo lsquojournalistsrsquo and lsquophotographersrsquo are professional
occupations Furthermore there are many professional and associate professional
occupations which are not included in the list of surplus occupations reported by the most
PES because they were reported by three or fewer PES These occupations include
lsquophilosophers historians and political scientistsrsquo lsquomusicians singers and composersrsquo
lsquoeconomistsrsquo lsquoother legal professionalsrsquo lsquointerior decoratorsrsquo and lsquoother artists and
associate cultural workersrsquo A list of the surplus occupations which were reported by at
least one PES is shown in Annex 3 of this report
In theory the fact that both the list of shortage occupations and the list of surplus
occupations contain many professional and associate professional occupations should
give rise to many cross-border matching possibilities However this is not the case
because virtually none of the professional or associate professional occupations appear
on both lists In general the professional and associate professional occupations
identified as being in surplus by the PES reflect disciplines in the humanities or the
creative arts In sharp contrast the professional and associate professional occupations
identified as shortage occupations by the PES are technical in nature and are dominated
by software and health related occupations
There is no doubt that many of the occupations identified by the PES as surplus
occupations are attractive to young people This is particularly so of occupations
associated with the creative arts But the analysis of PES data on shortages and
surpluses in this report would suggest that at least some of these occupations are
associated with limited career possibilities and that occupations of a technical nature
have superior career prospects
There are however two occupations lsquoshop sales assistantsrsquo and lsquocleaners and helpersrsquo
who appear in both the lists of shortages and surplus occupations and there are clearly
matching possibilities in these cases However the matching possibilities are not limited
to these two occupations there are many surplus occupations which have been identified
by less than four PES which have also been classified as shortage occupations by other
PES These cross-border matching possibilities are explored in chapter four
26 Profile of high magnitude surpluses
Only seven of the fifteen occupations listed as surplus occupations in Table 23 are not
classified as surpluses of high magnitude in Table 24 The list includes two more
professional occupations lsquobiologists botanists and zoologistsrsquo and lsquomanagement and
organisation analystsrsquo Both lsquojournalistsrsquo and lsquoadvertising and marketing professionalsrsquo
which are included in the list of surplus occupations reported by the most PES are also on
the list of occupations with high magnitude surpluses
One of the occupations which is new to the list is lsquobricklayers and related workersrsquo As
this occupation was also identified as a shortage occupation by nine PES its inclusion
does give rise to some cross-border matching possibilities
Labour shortages and surpluses 2017
2018 16
Directorate-General for Employment Social Affairs and Inclusion European Network of Public Employment Services (PES)
Table 24 High magnitude surplus occupations (4-digit level)
Occupation
Number of PES stating high magnitude of surplus
Occupation
Number of PES stating high magnitude of surplus
General office clerks 4 Journalists 2
Advertising and marketing professionals 3 Management and organisation analysts
2
Receptionist (general) 3 Manufacturing labourers 2
Shop sales assistants 3 Odd job persons 2
Biologists botanists zoologists and related
2 Photographers 2
Bricklayers and related workers 2 Bank tellers and related clerks 2
Child care workers 2 Security guards 2
Cleaners and housekeepers supervisors 2 Travel guides 2
Gardiners horticulturalists and nursery workers
2
27 Broad occupational groups by surplus magnitude
As in the case of shortages the professional group of occupations dominated the
occupations which were considered by the PES to have surpluses of high magnitude
(Figure 22) Indeed eight of the sixteen PES who rated surplus occupations by their
degree of severity identified at least one professional occupation as being in severe over-
supply
Interestingly the three PES who identified surplus occupations among plant and machine
operators and assemblers rated all the occupations they identified in this group as being
surplus occupations of high magnitude
Figure 22 Surpluses by estimated surplus magnitude
0 5 10 15 20
Managers
Plant and machine operators and assemblers
Skilled agricultural forestry and fishery workers
Craft and related trades workers
Clerical support workers
Elementary occupations
Service and sales workers
Technicians and associate professionals
Professionals
High Medium Low
Labour shortages and surpluses 2017
2018 17
Directorate-General for Employment Social Affairs and Inclusion European Network of Public Employment Services (PES)
28 Comparison of shortages and surpluses by broad
occupation
The issues which have been discussed above can be summarised in Table 25 below The
figures show that the 26 PES who reported at least one professional occupation as a
shortage represented 93 of all PES and that in total these PES identified 261
professional occupations as shortages
The situation is not quite as dramatic in respect of surplus occupations Nevertheless
fifteen PES representing 83 of all reporting PES identified a total of 88 professional
occupations as surplus occupations
However the most widespread reported surplus occupations were among the service and
sales group of occupations with almost 90 of PES reporting at least one surplus
occupation in this group The difference in the share of PES reporting shortages and
surpluses in the clerical group of occupations is also noteworthy Half the PES reported at
least one shortage occupation in this group but almost 80 of reporting PES included at
least one surplus occupation from this group
Table 25 Shortages and surpluses by broad occupation group
Broad occupation group
Number of
shortage occupatio
ns identified
Number of PES
reporting
shortages in this broad group
of PES reporting shortages
in this group
Number of surplus occupatio
ns identified
Number of PES
reporting surpluses
in this broad group
of PES reporting surpluses
in this broad group
Professionals 261 26 93 88 15 83
Craft and related trades 237 25 89 44 11 61
Associated professional technical
176 27 97 53 15 83
Services and sales 100 23 82 72 16 89
Plant and machinery 79 22 79 10 8 44
Elementary 53 14 50 37 12 67
Managers 43 11 39 16 7 39
Clerical support 34 14 50 47 14 78
Skilled agriculture 13 6 21 14 5 28
Armed forces 6 1 4 0 0 0
29 Cross-check with LSF data
Finally it is important to assess the extent to which the shortage and surplus occupations
identified by the PES in 2017 are accurate For this task we use the findings from the
2016 study which are based on the LSF data and the ratio of the unemployed to new
hires (Annex 4)
Although based on different levels of aggregation (4-digit vs 3-digit respectively) the
comparison of the PES reported shortages and surpluses in 2017 and the 2016 study LSF
ratio of unemployed and new hires suggests a high level of consistency Specifically PES
identified shortage occupations typically have the low ratio of unemployed to new hires
while the surplus occupations typically have the high ratio of unemployed to new hires
Labour shortages and surpluses 2017
2018 18
Directorate-General for Employment Social Affairs and Inclusion European Network of Public Employment Services (PES)
The only exceptions are the occupations of lsquocleanersrsquo lsquowaitersrsquo and lsquoshop sales
assistantsrsquo However this result is understandable as these occupations were classified
by the PES4 as labour shortages rather than skill shortages and consequently the
relatively high ratio could reflect the fact that there are a significant number of
unemployed available to work in these occupations
210 Conclusions
There are a number of significant conclusions which may be drawn from the analyses of
shortage and surplus occupations in this chapter
Firstly the widespread concern that using data from the PES may produce a significant
bias in the list of shortages and surpluses because the PES attract less vacancies and
job-seekers from higher skilled occupations appears to be unfounded Ironically the
professional occupations were the most frequently reported occupations in both the list of
shortages and surpluses
Secondly there is a distinct difference in the type of competences and qualifications
identified by the PES as shortages and surplus occupations and this difference was
evident throughout the different occupation groups In general the shortage occupations
embodied technical skills whether in health-related software-related or engineeringndash
related occupations at professional technical and craft levels
In sharp contrast the surplus occupations embodied selling service and clerical skills
cultural and artistic skills and competencies in the humanities
Finally the type of occupations which the PES associated with shortages and surpluses
are highly plausible In general the shortage occupations have a low ratio of unemployed
to new hires while the surplus occupations have a high ratio This consistency extended
to the occupations which the PES identified as labour shortages which exhibited a high
ratio
The classification of skill and labour shortages is one of the issues discussed in the next
chapter
4 While this is true when all three occupations are aggregated only two of five PES categorised lsquocleanersrsquo as a labour shortage ndash see chapter 3
Labour shortages and surpluses 2017
2018 19
Directorate-General for Employment Social Affairs and Inclusion European Network of Public Employment Services (PES)
3 PROFILE OF SHORTAGES AND SURPLUSES IN SPACE AND TIME
31 Introduction
In this chapter we analyse the occupations which have been identified by the European
PES as shortage and surplus occupations from the perspective of space and time We
review the geographical distribution of these occupations to ascertain if this distribution
provides an insight into what may have given rise to these shortages and surplus
occupations and we also examine the extent to which the same shortage and surplus
occupations have persisted over time using the findings from previous studies
32 PES methods used for identifying shortages and surpluses
In the previous chapter it was noted that only eighteen of twenty-eight PES submitted a
list of surplus occupations A review of the methods used by the PES to identify shortage
occupations may provide an insight into why ten PES did not provide any data on surplus
occupations
A summary of the methods used to identify shortage occupations is provided in Table 31
below The data indicates that exactly ten PES did not use any administrative data in
identifying their shortage occupations but rather used other sources such as employer
surveys national forecasting studies or immigration data It is tempting to conclude that
this is the reason why only 18 out of 28 PES provided data on surplus occupations as
these methodologies are not generally associated with the provision of information on
occupations which are in surplus
However such a conclusion would not be entirely accurate The analyses found that the
use of survey data did not necessarily preclude a PES from identifying surplus
occupations The Danish PES for example used the results of their Labour Market Balance
Survey and was able to provide a comprehensive list of surplus occupations In contrast
the Italian and Norwegian PES who relied on national forecasts and surveys respectively
were unable to provide such a list
Furthermore not all of the PES who based their identification of shortages on their
administrative data systems provided a list of surplus occupations Those who did
generally used the ratio of job-seekers to vacancies to identify whether an occupation
was a shortage or surplus occupation But a number of PES such as the German and
Luxemburg PES and the Belgium regional PES Actiris while basing their identification of
shortage and surplus occupations on administrative data used quite sophisticated
techniques such as the share of vacancies filled and the duration of vacancy filling Unlike
the ratio of job-seekers to vacancies such techniques do not readily provide an indicator
for identifying an occupation as a surplus occupation5
5 While it is reasonable to classify an occupation as a shortage occupation if the filling of vacant posts in that occupation takes on average an exceptionally long time identifying surplus occupations is somewhat more problematic using this method
Labour shortages and surpluses 2017
2018 20
Directorate-General for Employment Social Affairs and Inclusion European Network of Public Employment Services (PES)
Table 31 Methods used by the PES to identify shortage occupations
PES methods for identifying shortages and surpluses Number of PES
Combination of administrative data PES surveys and expert opinion
1
Combination of administrative data PES surveys and 3rd party data
1
Combination of administrative data and PES surveys 7
Combination of administrative data and 3rd party data 1
Combination of administrative data and expert opinion 2
PES work permit data only 2
PES administrative data only 6
PES survey data only 2
PES warehousing data only 1
3rd party surveys and forecasts 5
Total 28
The fact that only eighteen PES provided a list of surplus occupations is a serious
weakness of this study because it places a limit on the potential of the analyses to
identify cross border matching opportunities between shortage and surplus occupations
Consequently in the future every effort should be made to significantly increase the
number of PES providing a list of surplus occupations even if this means that a
significant number of PES use alternative methodologies to identify shortage and surplus
occupations rather than a single methodology to do both as has occurred in both the
2016 study and the current study6
33 Geographic distribution of shortages and surpluses
The 28 PES who submitted data on shortages cover a very wide geographic area which
include labour markets with very different characteristics It may be informative
therefore to assess the extent to which the distribution of shortage occupations differed
between different countries
Table 32 below shows the number of reported shortage occupations within their broad
occupation group and the PES who reported the occupation as a shortage7
While each PES was requested to submit a maximum of twenty shortage occupations a
total of ten PES provided more than that and in the case of the Slovenian French and the
regional Belgian PES Actiris significantly more
A total of six PES identified less than twenty shortage occupations but in most cases the
difference was negligible
The Croatian and Portuguese PES were the only PES which did not identify any
professional occupation in their list of shortage occupations This may reflect the type of
vacancies which are notified by employers to these PES because both these PES use
their own administrative data systems exclusively to identify shortage occupations
6 In the 2016 study while 26 PES provided data on shortage occupations 13 provided data on surplus
occupations 7 Three groups are excluded from the Table managers (43) skilled agricultural (13) and armed forces (1) as the figures are quite small
Labour shortages and surpluses 2017
2018 21
Directorate-General for Employment Social Affairs and Inclusion European Network of Public Employment Services (PES)
Table 32 Shortages number of mentions (4-digit) in broad occupation (1-digit)
PES Professional Technical Clerical Craft Service Plant Elementary Total
Austria 4 11 1 12 2 0 0 30
Actiris 28 22 6 11 13 2 0 82
Le Forem 6 6 0 6 0 0 0 18
VDAB 4 7 1 4 1 3 0 20
Bulgaria 7 0 0 4 5 3 2 21
Croatia 0 1 0 13 1 3 2 20
Cyprus 6 1 2 5 5 1 6 26
Denmark 5 1 0 7 3 2 1 19
Estonia 10 7 0 0 2 1 0 20
Finland 12 5 1 7 2 2 3 32
France 18 27 2 27 1 26 2 103
Germany 16 19 0 10 2 1 1 49
Hungary 2 6 6 8 14 3 12 51
Iceland 6 3 0 5 2 1 3 20
Ireland 13 2 0 4 1 1 0 21
Italy 2 2 1 7 4 1 3 20
Latvia 7 1 1 9 0 0 0 18
Lithuania 1 2 0 15 0 2 0 20
Luxemburg 8 4 0 0 0 0 0 12
Malta 5 3 3 4 6 1 4 26
Netherlands 20 11 3 23 2 1 0 60
Norway 13 3 0 10 10 4 1 41
Poland 10 6 2 2 3 3 4 30
Portugal 0 1 0 8 3 3 0 15
Slovakia 6 6 2 5 5 2 0 26
Slovenia 23 13 3 30 11 13 9 102
Sweden 15 2 0 1 2 0 0 20
Switzerland 14 4 0 0 0 0 0 18
Total 261 176 34 237 100 79 53 940
The stipulation to only provide a list of twenty shortage occupations may have prevented
any pattern from emerging in the figures For example there does not appear to be any
relationship between the numbers of employed and unemployed in a specific labour
market and the number of shortage occupations identified by its national PES
The two PES who submitted the highest volumes of shortage occupations - the French
and Slovenian PES - vary greatly in terms of the relative size of their labour force while
for example the Norwegian PES submitted significantly more shortage occupations than
much larger countries such as Germany and Poland
As a way of controlling for the variation in the total number of shortage occupations it
may be useful to compare the variation within the list of shortage occupations identified
by each PES However no obvious patterns emerge when a number of hypotheses are
tested using this approach For example there appears to be no relationship between
countries which are associated with strong apprenticeship systems such as Germany
Austria Denmark and Switzerland and their share of shortages among the craft group of
occupations The Swiss PES does not contain any craft occupations in its list of shortage
occupations while the craft group of occupations contain the most shortage occupations
in the lists provided by both the Austrian and Danish PES In the case of the German
PES the share of craft occupations is a little above the average
Labour shortages and surpluses 2017
2018 22
Directorate-General for Employment Social Affairs and Inclusion European Network of Public Employment Services (PES)
Table 33 Surpluses number of mentions (4-digit) in broad occupation (1-digit)
PES Professional Technical Clerical Craft Service Plant Elementary Total
Le Forem 2 1 1 1 6 0 8 19
Bulgaria 6 3 2 0 4 0 2 17
Switzerland 0 4 2 4 1 2 3 16
Cyprus 5 0 0 2 0 0 3 10
Denmark 3 2 3 0 6 1 4 19
Estonia 6 2 3 2 6 0 1 20
Finland 16 7 6 10 3 1 0 43
France 10 10 1 2 5 1 0 29
Croatia 4 0 0 0 0 0 0 4
Hungary 6 9 3 16 15 1 2 52
Ireland 1 1 4 3 5 1 7 22
Iceland 11 1 2 2 1 0 1 18
Lithuania 0 3 1 0 2 2 0 8
Latvia 4 4 0 0 3 1 3 15
Netherlands 3 2 9 0 9 0 1 24
Poland 0 0 0 0 1 0 0 1
Sweden 4 3 7 1 3 0 2 20
Slovakia 7 1 3 1 2 0 0 14
Total 88 53 47 44 72 10 37 351
The most striking aspect of the geographical distribution of surplus occupations is the
relatively low number of occupations which were reported Most of the reporting PES
(eleven) provided less than the twenty surplus occupations they were requested to
submit Furthermore if the contributions from the Hungarian and Finnish PES are
excluded the average number of surplus occupations submitted by the other PES is
sixteen
With the exception of the Icelandic Finnish French and Hungarian PES the list of
surplus occupations remains in single figures across all the broad occupational groups
Such low figures result in limited cross-border matching possibilities which are explored
in the next chapter
The PES were also asked to indicate the lowest regional level at which they could provide
data on both shortage and surplus occupations Their response is outlined in Table 34
above A total of twenty PES responded positively in the case of shortage occupations
and twelve in the case of surplus occupations In the case of shortage occupations nine
PES indicated that they could provide data at NUTs3 level while eight PES stated that
they could provide the data at NUTs1 level In the case of surplus occupations five PES
indicated that they could provide the data at NUTs1 level and another five PES responded
that they could provide the data at NUTs 3 level There were very few PES who indicated
that the lowest level at which they could provide data was at NUTs2 or NUTs4 levels
Labour shortages and surpluses 2017
2018 23
Directorate-General for Employment Social Affairs and Inclusion European Network of Public Employment Services (PES)
Table 34 Availability of data on shortagessurpluses at regional levels
Shortage occupations Surplus occupations
Country NUTS1 NUTS2 NUTS3 NUTS4 No
data NUTS1 NUTS2 NUTS3 NUTS4
Austria
x
Belgium Actiris
x
Belgium Le Forem
x
x
Belgium VDAB
x
Bulgaria
x
x
x
Croatia x
x
Cyprus
x
x
Denmark
x
x
Estonia x
x
Finland
x
x
France
x
x
Germany x
Hungary
x
x
Iceland x
x
Ireland x
x
Italy
x
Latvia
x
x
Lithuania
x
x
Luxembourg x
Malta
x
Netherlands
x
x
Norway
x
Poland
x
x
Portugal
x
Slovakia
x
x
Slovenia x
Sweden
x
x
Switzerland
x
x
Note Bulgaria has regional data for some occupations
34 Tracking shortages over time
This is the third annual study on lsquoBottleneck Occupationsrsquo the previous two studies were
undertaken in 2016 and 2015 The findings in both of those studies were presented in 3-
digit codes To make the findings comparable over time the 4-digit shortage and surplus
occupations from the current study are aggregated up to 3-digit occupations as shown in
Table 35
A striking aspect of the list of occupations in Table 35 is the degree of consistency
displayed over the period 2015-2017 inclusive not simply in terms of the occupations
reported by the PES but also in terms of the number of PES who identified them as
shortages (ie their ranking) Not only does the 3-digit occupation category of lsquosoftware
and applications developersrsquo occupy the top ranking in each of the years five of the top
ranking six occupations are the same The only notable exception is that the finance
professional and associate professional occupations featured in the list of most reported
shortage occupations in 2015 but slipped out of this list in 2016 and 2017
Labour shortages and surpluses 2017
2018 24
Directorate-General for Employment Social Affairs and Inclusion European Network of Public Employment Services (PES)
Table 35 Ranking of shortage occupations (3-digit)
Rank
Top occupations in 2017 2017 2016 2015
Software and application developers 1 1 1
Sheet and structural metal workers 2 3 2
Medical doctors 3 5 2
Blacksmiths toolmakers and related trades 4 3 4
Building finishes and related trade workers 4 6 4
Building frame and related trade workers 4 3 4
Cooks 4 7 7
Engineering professionals 5 6 6
Physical and engineering science technicians 6 7 na
Electrical equipment installers and repairers 7 4 5
Heavy truck and bus drivers 7 5 4
Machinery mechanics and repairers 8 7 5
Nursing and midwifery professionals 8 6 na
Sales and purchasing agents and brokers 9 2 5
Shop salespersons 10 7 8
Electro technology engineers 10 na na
Primary school and early childhood teachers 10 na na
Domestic hotel and office cleaners and helpers 10 na na
Waiters and bartenders 10 na na
35 3-digit vs 4-digit
There are advantages and disadvantages associated with using the more aggregated 3-
digit occupation classification as it was done in previous studies The bundling of
individual occupations into families provides greater visibility of shortages at a broad
skill level (eg all software related occupations)
However there are distinct disadvantages in using the 3-digit occupations and these
apply particularly to their practical usefulness to education and training providers In
many cases shortages identified at 3-digit level do not provide a reliable basis for
identifying the specific skill which is in shortage or surplus
By combining the analyses of the 4-digit and corresponding 3-digit classifications in this
report many examples are revealed of how an exclusive reliance on the 3-digit
classification could be seriously misleading Thus the findings in this report show that
within the 3-digit classification of lsquosheet and structural metal workers moulders and
weldersrsquo the 4-digit occupation which is in short supply is lsquoweldersrsquo and not for example
lsquosheet metal workersrsquo This is an important insight because in many European countries
the skills of welding and sheet metal work are provided through entirely different
vocational programmes8
There are many examples of this phenomenon in the 3-digit occupations in Table 35 For
example the analysis in this report shows that toolmakers are a shortage occupation
8 In Ireland for example sheet metal workers and welders undertake entirely different apprenticeships
Labour shortages and surpluses 2017
2018 25
Directorate-General for Employment Social Affairs and Inclusion European Network of Public Employment Services (PES)
but blacksmiths are not Furthermore the 3-digit classification disguises the extent of the
reported shortage Thus while the 3-digit occupation of professional nursing and
midwifery is shown in the current report as being shortage occupations a total of eleven
PES reported professional nursing as a shortage compared to only three PES reporting
professional midwifery as a shortage By bundling these occupations together the
significant difference in the relative severity of the shortage is not apparent
This phenomenon applies equally to the surplus occupations which were identified in this
report For example lsquochildcare workersrsquo were described as a surplus occupation by five
PES But in the 3-digit classification they are bundled together with lsquospecial needs
teachersrsquo which was not identified as a surplus occupation
36 Conclusions
There are a number of conclusions which can be drawn from the analyses in this chapter
Firstly the sources used by many of the PES to identify shortage occupations is one of
the main reasons why only eighteen PES provided data on surplus occupations Many of
the PES relied on the results of employer surveys forecasting models and immigration
data to identify shortages and these sources in general do not provide data on surplus
occupations However it was by no means the only reason why so many PES did not
provide data on surplus organisations and this issue will have to be addressed before the
commencement of the 2018 study In the future PES data should be augmented by data
collected by other bodies as outlined in the new EU Regulation
Secondly there is no obvious explanation for the geographic distribution of shortages
and surpluses In some cases countries with relatively small labour forces have a
relatively high number of shortage occupations while a strong apprenticeship system
does not appear to prevent a relatively high share of the identified shortages being in the
craft occupations It may be that the stipulation to only include twenty shortage and
surplus occupations has created a situation where some countries with a relatively large
labour force are artificially constrained to submit a much smaller number of shortage
occupations than they actually have
Thirdly there is a high degree of stability in relation to the occupations which were
identified as shortages in the 2015 2016 and 2017 editions of the Bottleneck report
Finally providing information on shortage and surplus occupations at 4-digit level is
much more useful from a policy perspective than providing the data at a more
aggregated level The results of the analyses at 4-digit level show which specific
occupations in the bundle of occupations used in the previous reports were in shortage
and which were not This is also true of the occupations which were identified as surplus
occupations A more aggregated group of occupations does not allow for the targeting of
specific individual occupations either for increasing training provision or for enhancing
cross border mobility Indeed as a number of specific examples show were providers of
vocational training or indeed policy makers to act on the basis of the 3-digit shortage and
surplus occupations identified in previous reports they could very well have assign
resources to occupations which were neither in shortage nor in surplus
Labour shortages and surpluses 2017
2018 26
Directorate-General for Employment Social Affairs and Inclusion European Network of Public Employment Services (PES)
4 THE CAUSES OF SKILL SHORTAGES AND POTENTIAL SOLUTIONS
41 Introduction
The focus of this chapter is on identifying the possible causes of skills shortages and
surpluses and exploring ways in which these imbalances may be resolved The chapter
begins with a review of the nature of skills and labour market imbalances and concludes
with an exploration of the extent to which enhanced cross-border mobility policies and
more equal gender representation could contribute to the alleviation of skills and labour
imbalances in certain shortage occupations in the EEA labour market
42 The role of skills and labour shortages in skills imbalances
One of the new questions included in the current study asks the PES to identify the
nature of the shortage (ie is it a skill shortage or a labour shortage) in relation to each
shortage occupation they identified It was explained in the questionnaire that labour
shortages occur when there are a sufficient number of appropriately qualified job-seekers
to fill the vacancies which arise but for a variety of reasons many of them do not wish
to work in the occupation in question Their response to this question is summarised in
Table 41 in respect of the twenty occupations which were reported by the most PES
A total of twenty-six PES classified their shortage occupations as skill or labour
shortages and they classified most of the occupations as skill shortages Indeed in the
case of seven occupations plumbers doctors software developers electricians
electronic engineers electronic engineering technicians bus and tram drivers and
mechanical engineers all of the reporting PES classified the shortage as a skills deficit
Each labour market within the EEA is regulated in a particular manner and conditions of
employment even within the same occupation vary throughout the region This is why
many occupations while classified by most of the PES as reflecting skill deficits
nevertheless are classified by some PES as labour shortages
However the number of PES involved is very small indeed Only in the case of three
occupations lsquowaitersrsquo lsquoshop sales assistantsrsquo and lsquoprimary school teachersrsquo are there
more PES classifying the shortage as a labour shortage then a skills deficit The first two
occupations are undoubtedly labour shortages This is because there are few if any
barriers to working in these occupations9
The inclusion of lsquoprimary school teachersrsquo as a labour shortage is however a surprise It
was identified by eight PES as a shortage occupation two of whom classified the
occupation as a shortage of high magnitude It would be necessary to conduct research
into the conditions of employment ndash including qualification criteria ndash within the countries
where the reporting PES are located to establish if this classification of the occupation as
a labour shortage is warranted
With some notable exceptions the response of the PES to classifying their shortage
occupations as skill or labour shortages demonstrates that the PES understand these
concepts Occupations such as professional nurses which are obviously suffering from a
shortage of qualified job-seekers in the EEA are overwhelmingly categorised as a skills
shortage while less skilled occupations such as cleaners are categorised as being on the
borderline between skills and labour shortages
9 Both occupations have relatively high ratios of unemployed to new hires (Annex 4)
Labour shortages and surpluses 2017
2018 27
Directorate-General for Employment Social Affairs and Inclusion European Network of Public Employment Services (PES)
Table 41 Skill and labour shortages
Occupation
Number of PES
reporting occupation
as skills shortage
Number of PES
reporting occupation as labour shortage
Number of PES
reporting occupations as skill and
labour shortage
Total number of
PES reporting on skillslabour
shortage
Cooks 9 1 0 10
Plumbers and pipe fitters 8 0 0 8
Generalist medical Practitioners 7 0 0 7
Heavy truck and lorry drivers 4 2 1 7
Metal workers machine tool setting and operators
3 3 1 7
Welders and flame cutters 4 2 1 7
Nursing professionals 5 1 0 6
Software developers 6 0 0 6
Systems analyst 5 1 0 6
Bricklayers and related trades 4 1 0 5
Building and related electricians 5 0 0 5
Butchers fishmongers and related food 3 2 0 5
Cleaners and helpers in offices 3 2 0 5
Commercial sales representatives 2 2 1 5
Electronic engineers 5 0 0 5
Manufacturing supervisors 4 1 0 5
Motor vehicle mechanics and repairers 3 1 1 5
Nursing associate professionals 4 1 0 5
Primary school teachers 2 3 0 5
Shop sales assistants 1 4 0 5
Waiters 2 3 0 5
Agriculture and industrial machinery repairers
3 1 0 4
Application programmers 3 1 0 4
Bus and tram drivers 4 0 0 4
Electronic engineering technicians 4 0 0 4
Health care assistants 3 1 0 4
Mechanical engineers 4 0 0 4
Sheet metal workers 3 1 0 4
Structural metal preparers and erectors 3 1 0 4
Total number of PES reporting 16 8 2 26
The atypical working hours associated with heavy goods vehicle driving is recognised by
two of the six PES who classify shortages in the occupation as labour shortages while the
unpleasant conditions associated with working in butchery shops and abattoirs is
reflected in the fact that two of the five PES who categorised the occupation as a
shortage occupation classify it as a labour shortage
43 Location of skill imbalances and cross border mobility
In recent years there has been considerable discussion on the potential role which
enhanced cross-border mobility could play in alleviating labour market imbalances The
attractiveness of such a policy is obvious The European Union is a very large
Labour shortages and surpluses 2017
2018 28
Directorate-General for Employment Social Affairs and Inclusion European Network of Public Employment Services (PES)
marketplace embracing a very large labour force if even some of the shortages which
are reported by EEA countries could be resolved by exploiting the surpluses which are
reported by other EEA countries it could form the basis of a number of win-win solutions
for both job-seekers and businesses
An additional attraction of this policy is that it could potentially successfully address both
skills and labour shortages as working conditions associated with some labour shortages
in one country might be perceived as significantly more attractive in a different EEA
country
Table 44 provides a list of the top twenty shortage occupations which have at least one
PES in another EEA country reporting the occupation as a surplus
There are a number of aspects of the Table which are notable Firstly the list of top
occupations has changed quite dramatically from the list in Table 21 specifically none
of the professional and associate professional occupations are now on the list including
the four professional and associate professional health-related occupations or the two
professional software occupations What the Table shows is that there are no surpluses
reported in any of the EEA countries of doctors or nurses software developers or
systems analysts While the occupation of healthcare assistants is in surplus in many
countries it was not included in the list of top occupations because it was reported as a
shortage by only two PES
The figures in Table 42 show that there are three cross-border matching possibilities in
the case of bricklayers and motor mechanics and two possibilities in the case of
plasterers health care assistants and secondary school teachers
There is just one matching possibility in respect of a wide range of occupations including
cooks truck drivers commercial sales representatives electricians carpenters civil
engineers primary school teachers manufacturing supervisors telecentre salespersons
childhood education teachers floor layers and roofers
The fact that primary school teachers have only one cross border matching possibility
suggest that the classification of the occupation as a labour shortage by three of five PES
is an error In general labour shortages would be expected to have more cross border
matching possibilities than skill shortages because there are many job-seekers eligible to
work in the occupation in question and working conditions vary quite significantly from
country to country Indeed it is notable that the two other occupations which were
classified by the PES as predominantly labour shortages waiters and shop sales
assistants have a relatively high number of matching possibilities eight in the case of
shop sales assistants and three in the case of waiters
In general the PES did not classify the same occupation as both a shortage and a
surplus A striking exception is the Danish PES which categorised four of its shortage
occupations as surplus occupations also This is most likely due to the higher level of
granularity available in the Danish data (below 4-digit) so that some job titles within an
occupation are considered labour shortage while others skill shortage
44 Assessing gender composition of surpluses
The PES were asked to estimate the share of females in the occupations which they
identified as lsquosurplusrsquo occupations The restricting of this question to surplus occupations
was to avoid giving the impression that shortages were arising because of discriminatory
recruitment policies
Labour shortages and surpluses 2017
2018 29
Directorate-General for Employment Social Affairs and Inclusion European Network of Public Employment Services (PES)
A total of 13 PES reported any data on gender composition of surpluses However the
quality of information submitted did not provide a sufficient basis for an accurate
estimation of the gender composition of surpluses in some of the cases
It is suggested that in order to address gender imbalances in relation to shortages and
surpluses data from PES on job seekers should be combined with the LSF data on
employment by occupation
45 Conclusions
The analysis in chapter four has produced a number of interesting findings The analysis
reveals that the PES in general has the capacity to distinguish between skill and labour
shortages and to identify shortage occupations which have some cross-border matching
possibilities
The relatively low number of surplus occupations reflects two factors firstly only
eighteen PES submitted a list of surplus occupations and secondly in many cases the
lists did not include the maximum number of twenty occupations which were requested
This response has to be viewed against the background of an EEA labour market where
employment is expanding and unemployment is contracting However while this is a
positive development the relatively low number of surplus occupations has placed a
significant limit on the extent to which there were cross-border possibilities of matching
shortage with surplus occupations
The data indicates that there is a limitation to the extent to which the PES can be used to
identify the gender imbalances (eg under-representation of females in some
occupations) and that other sources should be explored
Labour shortages and surpluses 2017
2018 30
Directorate-General for Employment Social Affairs and Inclusion European Network of Public Employment Services (PES)
Table 43 The potential for cross-border matching of shortage and surplus occupations
No PES
Occupation PES reporting shortage PES reporting surplus No PES
16 Cooks AT Art BG CY DK HR IE IS IT MT NL NO PT SE SI SK lsaquo―rsaquo HU 1
11 Truck drivers ART VDAB BG DK HR LT IT NL NO PT SE SI SK lsaquo―rsaquo DK 1
10 Cleaners helpers CY DK HR FI IS HU NL NO PT SI lsaquo―rsaquo DK LF NL IE 4
10 Commercial sales VDAB ART DK FI FR IT IE PT PL SI lsaquo―rsaquo DK 1
9 Sales assistants AT ART BG CY DK IT NO SI SK lsaquo―rsaquo DK LF SE NL BG CH FI IE 8
9 Bricklayers ART DE DK HR HU LT NL PT SI lsaquo―rsaquo CY HU IE 3
9 Motor mechanics AT VDAB ART LF DK IT NO PT SI lsaquo―rsaquo SK CH EE 3
9 Waiters ART BG CY IS IT MT NO PT SI lsaquo―rsaquo HU EE IE 3
9 Electricians ART VDAB DE DK IS IT NL NO SI lsaquo―rsaquo FR 1
8 Carpenters DK HR HU FI NL NO PT SI lsaquo―rsaquo HU 1
8 Civil engineers ART CH DE FI FR NO SE SI lsaquo―rsaquo CY 1
8 Primary teachers ART BG DK IS NO SE SI SK lsaquo―rsaquo CY 1
7 Healthcare assist CY DK EE NL NO SI SK lsaquo―rsaquo DK NL 2
7 Second teacher ART BG FR NL NO SI SK lsaquo―rsaquo CY FI 2
7 Man supervisors ART VDAB LF DE EE FR SK lsaquo―rsaquo BG 1
6 Plasterers HR HU FI LT NL SI lsaquo―rsaquo HU IE 2
6 Tele centre sales ART HU FI FR MT NO lsaquo―rsaquo EE 1
6 Childhood educ FI LT NO SE SI SK lsaquo―rsaquo CY 1
6 Floor layers HU HR FI FR LT LV lsaquo―rsaquo HU 1
6 Roofers HR FI FR LT LV SI lsaquo―rsaquo HU 1
Bottlenecks Occupations 2017
2017 31
Directorate-General for Employment Social Affairs and Inclusion European Network of Public Employment Services (PES)
5 CONCLUSIONS AND RECOMMENDATIONS
51 Conclusions
The terms of reference for this study emphasise the desirability of creating a process for
the systematic collection of data on surplus and shortage occupations in the EEA area
which could be effectively used by EURES for cross border matching of shortage
occupations in some EEA countries with surplus occupations in others
The authors have responded to this emphasis by using a process which ensures that the
data gathered on shortage and surplus occupations is comprehensive accurate and of
practical use to EURES and the providers of education and training programmes The
process is comprehensive because it gathers information both on the extent of shortages
and surpluses and on their relative severity It is accurate because the list of shortage
and surplus occupations are shown to be consistent with the estimated value of the ratio
of unemployed to new hires Finally the process provides information which is of
practical use to EURES and the national providers of VET because the data gathered is on
individual occupations rather than on lsquobundles of occupationsrsquo as in previous studies The
analyses in this report shows that while these bundles of occupations contain some
occupations which are identified by the PES as shortage and surplus occupations they
also contain occupations which are neither in shortage nor in surplus and it is impossible
to distinguish one from the other
The data gathering process used in this report however was not devoid of weaknesses
Fortunately these weaknesses reflect the modus operandi of the PES and may be
rectified by including other institutions and agencies in the process For example the PES
use the same sources for the identification of both shortage and surplus occupations
This may have advantages in terms of accuracy when those sources include employersrsquo
surveys immigration data and the results of forecasting exercises However these
sources are not suitable for gathering data on surplus occupations and they are the main
reason why the number of surplus occupations provided by the PES were almost half the
number requested In the future PES data could be augmented by data gathered by
other bodies as outlined in recent EU Regulation 2016589
In addition the response to the question on the capacity of the PES to deliver data on
shortage and surplus occupations at a regional level was also disappointing perhaps
reflecting a misalignment in some EEA countries between the geographic configuration of
the local PES network and the NUTs regions
The analysis highlighted that in order to assess gender imbalances of shortages and
surpluses PES data needs to be augmented by other sources
Finally despite the low number of surplus occupations submitted by the PES it was
nevertheless possible to identify twenty shortage occupations in the EEA labour market
which had at least one cross-border matching possibility and many more than one in the
case of some shortage occupations
52 Recommendations
Based on the findings from the three bottleneck studies undertaken to date a model for
the gathering of data on shortages and surpluses is proposed (Figure 51) The model
includes features of the methodology applied in this study which were successful It also
includes a number of features which should be introduced to the process in order to
address some of the weaknesses which were identified in this study (highlighted in red)
Labour shortages and surpluses 2017
2017 32
Directorate-General for Employment Social Affairs and Inclusion European Network of Public Employment Services (PES)
However before this methodology is implemented it would be prudent to discuss data
requirements with PES and invite a broader range of institutions and agencies to
participate in aspects of the data gathering process in addition to the PES EURES
Regulation (EU) 2016589 of the European Parliament and of the Council which obliges
the appropriate national authorities to furnish such data annually is fortuitous in this
regard and should facilitate the implementation of this recommendation
In addition the results of these and other relevant studies should be disseminated to
PES Eures coordination group and other relevant agencies and institutions in order to
emphasise the importance of data and analysis in informing policy at EU and national
level which aims to resolve labour market imbalances
Labour shortages and surpluses 2017
2017 33
Directorate-General for Employment Social Affairs and Inclusion European Network of Public Employment Services (PES)
Figure 51 Model for gathering data on shortage and surplus occupations
Sources of data on surpluses PES data from other relevant agencies
In those cases where the source used by the PES to identify shortage occupations cannot
be used to identify surplus occupations other institutions or other sources or both should be availed of to ensure that comprehensive data on surplus occupations are provided to the appropriate national authority
Dimensions of shortagessurpluses extent (number of reporting PES) and severity (high or low
magnitude)
Data should be systematically gathered on both the extent of shortage and surplus
occupations in the EEA and on their relative severity
Type of shortage skill vs labour shortages
The providers of the data on shortage occupations must also distinguish between skill and labour shortages because this distinction is necessary for the accurate identification of
shortage occupations and for the choice of the appropriate policy response to identified shortages
Classification of occupations used ISCO 08 4-digit codes (or translation into these codes)
All data should be either initially gathered in ISCO 08 4-digit codes or translated into these
codes This ensures that the data refers to specific individual occupations and is of practical use to EURES and the national providers of VET
Accuracy test cross-check with LSF data (ratio of unemployed to new hires)
The accuracy of the submitted lists of shortage and surplus occupations should be assessed
by comparing the most widely reported surplus and shortage occupations with the estimated values of the ratios of employed (by previous occupation) to new hires at the aggregated EU28 level These ratios should be based on an analysis of the most up-to date
Labour Force Survey (LFS) data
Gender balance assessment LFS data on employment at occupational level by gender PES job
seekers
The gender composition of shortage and surplus occupations should be based on the most
up to date analyses of LFS data on employment by gender and the PES job seeker data
Regional balance assessment LSF data data from relevant agencies
Where regional data is required other agencies and institutions should be requested to
provide the data in those cases where the data cannot be provided by the regional PES network because it is not geographically aligned to the NUTs regions
Labour shortages and surpluses 2017
2017 34
Directorate-General for Employment Social Affairs and Inclusion European Network of Public Employment Services (PES)
Number of occupations reporting should be extended beyond 20 occupations but with upper
limit (eg 50)
Consideration should be given to allowing the agencies responsible for identifying shortage
and surplus occupations a greater range of flexibility in terms of the numbers of occupations which should be identified A minimum to maximum range would be a more realistic approach as it would reflect the fact that the labour markets of the EEA vary significantly in size and performance
Timing of imbalance assessment September
It is proposed that the data gathering exercise should be brought forward to early September and that expert advice should be available on line throughout the data
gathering exercise
Labour shortages and surpluses 2017
2017 35
Directorate-General for Employment Social Affairs and Inclusion European Network of Public Employment Services (PES)
ANNEX 1 DATA COLLECTION TEMPLATE Information sought Explanation
Occupation title (text) Type in free text a list of occupations (one row one occupation) for which shortages and surpluses exist first list occupations for which there is a shortage the list should contain a maximum of 20 occupations if your list contains less than 20 occupations please provide a brief explanation in your email response for why the number is lower than 20 second list occupations for which there is a surplus the list should contain a maximum of 20 occupations if your list contains less than 20 occupations please provide a brief explanation in your email response for why the number is lower than 20
Shortagesurplus indicator For each occupation indicate if it refers to a shortage by typing in shortage or surplus by typing in surplus to identify surplus occupations you can examine for each occupation the ratio of the number of job seekers to the number of vacancies at the end of each year for example if there are 5000 shop assistants seeking employment and there are 200 vacancies at the end of the reference period the ratio is 251 you can rank the calculated ratios and report the occupations associated with the 20 highest ratios
Occupational classification used in your country
For each occupation indicate what occupational classification (if any) was used to identify this occupation for instance you can report a country specific classification ISCO ROME SOC etc If you donrsquot use occupational classifications type None
Occupation code to the lowest level of disaggregation (eg ISCO at 4 digits)
If you have indicated a classification used type the code for each occupation use the lowest level of disaggregation (eg 4 digit ISCO code) if you donrsquot use occupational classification leave black
ISCO-08 code at 4-digit level (or lower if 4-digit not available)
If you use occupational classification which is not ISCO-08 and if it is possible provide a translation of the national code to ISCO-08 code ISCO is the International Standard Classification of Occupations which is used to report to Eurostat code should be at 4 digits if this is not available than the lowest level of disaggregation that is available should be reported (3 digits if 4-digit code is not available 2 digits if neither 4-digit nor 3-digit code is available 1 digit if neither 4-digit 3-digit nor 2-digit code is available) if it is not possible to provide translation to ISCO-08 leave black if you have already reported ISCO-08 code in column 3 leave this column black
Estimate of shortagesurplus magnitude (high (gt3 of employment) medium (1-3 of employment) low (lt1 of employment))
For each occupation indicate a broad estimate of the magnitude of the shortagesurplus if you estimate that the shortagesurplus is less than 1 of the total employment in the occupation in question type low if between 1-3 type medium if greater than 3 type high if you cannot provide a rough estimate of magnitude type dont know
Current shortagesurplus (C) future short term (FST) future medium term (FMT) future long term (FLT) donrsquot know (indicate all that apply)
Against each occupation indicate if the identified shortagesurplus refers to present situation by typing C if the shortage is expected to occur in the short term future ie within 12 months by typing FST if it is expected to occur over the medium term (within 1-5 years) by typing FMT if it is expected to occur in the long term (in 5 or more years) by typing FLT if more than one time period applies indicate all relevant ones (eg for current shortagessurpluses that are expected to persist over the short term type C FST) if you dont know type dont know
Source of information on shortagessurpluses (eg PES administrative data (vacancies job seekers) PES survey third party survey Occupational forecasts other (specify) etc)
Indicate the source used to identify shortagesurplus for this occupation did you derive it from the PES administrative data on PES vacancies andor job seekers did you conduct a survey did you commission a third party to conduct a survey for you did you have occupational forecasts available did you use other research type in free text the full description of the source(s) eg National Employment Survey conducted by PES etc
Labour shortages and surpluses 2017
2017 36
Directorate-General for Employment Social Affairs and Inclusion European Network of Public Employment Services (PES)
Date for source of information Indicate the year that the information on shortagessurpluses (column 7) refers to eg type 2016 for a survey of difficult to fill vacancies conducted in 2016 even if the report was published in 2017
What indicator(s) suggested that there is a shortagesurplus
Indicate what criteria was used to conclude that this occupation is associated with a shortagesurplus for instance employers views sourcing from abroad to fill vacancies growth in employment faster than growth in educationtraining output time required to fill
vacancies higher than average etc
Share of females among job seekers in this occupation (surplus occupations only)
Indicate the percentage share of females among all job seekers in this occupation this is only applicable to surplus occupations
Skill or labour shortage Indicate if a shortage refers to a skill or labour shortage a skill shortage occurs where there is an insufficient supply of persons with the appropriate skills labour shortages occur where there is a sufficient number of skilled persons however an insufficient number of them is willing to take up employment in the occupation in question
Indicate the availability of data on shortagessurpluses at regional level (NUTS1 NUTS2 NUTS3 No data)
Indicate if data is available on the regional breakdown of shortagessurpluses by indicating the level of regional data available if multiple levels of regional disaggregation are available indicate the lowest level of disaggregation (eg NUTS3 rather than NUTS2) if there is no regional data available use no data
Labour shortages and surpluses 2017
2017 37
Directorate-General for Employment Social Affairs and Inclusion European Network of Public Employment Services (PES)
ANNEX 2 SHORTAGE OCCUPATIONS
Shortage occupation PES count
Cooks 16 Plumbers and pipe fitters 13 Generalist medical practitioners 12 Welders and flamecutters 12 Heavy truck and lorry drivers 11 Metal working machine tool setters and operators 11 Nursing professionals 11 Software developers 11 Agricultural and industrial machinery mechanics and repairers 10 Cleaners and helpers in offices hotels and other establishments 10 Commercial sales representatives 10 Specialist medical practitioners 10 Systems analysts 10 Bricklayers and related workers 9 Building and related electricians 9 Butchers fishmongers and related food preparers 9 Motor vehicle mechanics and repairers 9 Nursing associate professionals 9 Sheet-metal workers 9 Shop sales assistants 9 Waiters 9 Carpenters and joiners 8 Civil engineers 8 Concrete placers concrete finishers and related workers 8 Electrical engineering technicians 8 Electronics engineering technicians 8 Mechanical engineers 8 Primary school teachers 8 Structural-metal preparers and erectors 8 Electronics engineers 7
Health care assistants 7 Manufacturing supervisors 7 Mechanical engineering technicians 7 Secondary education teachers 7 Accountants 6 Applications programmers 6 Bus and tram drivers 6 Contact centre salespersons 6 Early childhood educators 6 Electrical mechanics and fitters 6 Floor layers and tile setters 6 Plasterers 6 Roofers 6 Sewing machine operators 6 Software and applications developers and analysts not elsewhere classified 6 Toolmakers and related workers 6 Web and multimedia developers 6 Air conditioning and refrigeration mechanics 5 Building frame and related trades workers not elsewhere classified 5 Chefs 5 Civil engineering labourers 5 Construction supervisors 5 Earthmoving and related plant operators 5 Electrical engineers 5 Electrical line installers and repairers 5 Engineering professionals not elsewhere classified 5 Hairdressers 5 Information and communications technology operations technicians 5 Manufacturing managers 5 Physiotherapists 5 Real estate agents and property managers 5 Research and development managers 5 Spray painters and varnishers 5 Accounting associate professionals 4 Bakers pastry-cooks and confectionery makers 4
Labour shortages and surpluses 2017
2017 38
Directorate-General for Employment Social Affairs and Inclusion European Network of Public Employment Services (PES)
Shortage occupation PES count
Blacksmiths hammersmiths and forging press workers 4 Civil engineering technicians 4 Crane hoist and related plant operators 4 Database designers and administrators 4 Industrial and production engineers 4 Painters and related workers 4 Physical and engineering science technicians not elsewhere classified 4 Plastic products machine operators 4 Social work and counselling professionals 4 Accounting and bookkeeping clerks 3 Administrative and executive secretaries 3 Ambulance workers 3 Building construction labourers 3 Car taxi and van drivers 3 Cartographers and surveyors 3 Cleaning and housekeeping supervisors in offices hotels and other establishments 3 Contact centre information clerks 3 Draughtspersons 3 Fast food preparers 3 Freight handlers 3 Gardeners horticultural and nursery growers 3 Home-based personal care workers 3 Hotel receptionists 3 Information and communications technology installers and servicers 3 Insulation workers 3 Kitchen helpers 3 Manufacturing labourers not elsewhere classified 3 Medical imaging and therapeutic equipment technicians 3 Metal moulders and coremakers 3 Metal polishers wheel grinders and tool sharpeners 3 Midwifery professionals 3 Other language teachers 3 Personal services workers not elsewhere classified 3
Pharmacists 3 Policy administration professionals 3 Printers 3 Process control technicians not elsewhere classified 3 Sales and marketing managers 3 Shop supervisors 3 Special needs teachers 3 Stock clerks 3 Supply distribution and related managers 3 Survey and market research interviewers 3 Systems administrators 3 Technical and medical sales professionals (excluding ICT) 3 Translators interpreters and other linguists 3 Transport clerks 3 Vocational education teachers 3 Advertising and marketing professionals 2 Audiologists and speech therapists 2 Bartenders 2 Beauticians and related workers 2 Cashiers and ticket clerks 2 Chemical engineers 2 Child care workers 2 Computer network and systems technicians 2 Computer network professionals 2 Construction managers 2 Craft and related workers not elsewhere classified 2 Credit and loans officers 2 Crop farm labourers 2 Database and network professionals not elsewhere classified 2 Dentists 2 Domestic cleaners and helpers 2 Door to door salespersons 2 Driving instructors 2 Electrical and electronic equipment assemblers 2 Electronics mechanics and servicers 2 Elementary workers not elsewhere classified 2 Employment agents and contractors 2
Labour shortages and surpluses 2017
2017 39
Directorate-General for Employment Social Affairs and Inclusion European Network of Public Employment Services (PES)
Shortage occupation PES count
Field crop and vegetable growers 2 Financial analysts 2 Financial and investment advisers 2 Forestry and related workers 2 Garbage and recycling collectors 2 General office clerks 2 Graphic and multimedia designers 2 Information and communications technology service managers 2 Insurance representatives 2 Locomotive engine drivers 2 Mail carriers and sorting clerks 2 Management and organization analysts 2 Mathematicians actuaries and statisticians 2 Mechanical machinery assemblers 2 Medical and dental prosthetic technicians 2 Medical assistants 2 Messengers package deliverers and luggage porters 2 Metal finishing plating and coating machine operators 2 Metal processing plant operators 2 Optometrists and ophthalmic opticians 2 Personal care workers in health services not elsewhere classified 2 Police officers 2 Policy and planning managers 2 Production clerks 2 Restaurant managers 2 Retail and wholesale trade managers 2 Sales workers not elsewhere classified 2 Sewing embroidery and related workers 2 Street food salespersons 2 Tailors dressmakers furriers and hatters 2 Telecommunications engineers 2 Advertising and public relations managers 1 Aged care services managers 1
Agricultural technicians 1 Aircraft engine mechanics and repairers 1 Aircraft pilots and related associate professionals 1 Assemblers not elsewhere classified 1 Authors and related writers 1 Bank tellers and related clerks 1 Bleaching dyeing and fabric cleaning machine operators 1 Bookmakers croupiers and related gaming workers 1 Business services agents not elsewhere classified 1 Buyers 1 Cabinet-makers and related workers 1 Cement stone and other mineral products machine operators 1 Chemical and physical science technicians 1 Chemical engineering technicians 1 Chemical processing plant controllers 1 Chemical products plant and machine operators 1 Chemists 1 Conference and event planners 1 Customs and border inspectors 1 Data entry clerks 1 Dental assistants and therapists 1 Dieticians and nutritionists 1 Dispensing opticians 1 Domestic housekeepers 1 Economists 1 Education methods specialists 1 Environmental and occupational health and hygiene professionals 1 Environmental and occupational health inspectors and associates 1 Fibre preparing spinning and winding machine operators 1 Finance managers 1 Financial and insurance services branch managers 1 Fire-fighters 1 Fitness and recreation instructors and program leaders 1 Food and beverage tasters and graders 1 Food and related products machine operators 1
Labour shortages and surpluses 2017
2017 40
Directorate-General for Employment Social Affairs and Inclusion European Network of Public Employment Services (PES)
Shortage occupation PES count
Food service counter attendants 1 Forestry labourers 1 Fruit vegetable and related preservers 1 Fur and leather preparing machine operators 1 Glass and ceramics plant operators 1 Hand launderers and pressers 1 Hand packers 1 Handicraft workers in textile leather and related materials 1 Health associate professionals not elsewhere classified 1 Health professionals not elsewhere classified 1 House builders 1 Human resource managers 1 Incinerator and water treatment plant operators 1 Information and communications technology user support technicians 1 Judges 1 Lawyers 1 Legal and related associate professionals 1 Legal professionals not elsewhere classified 1 Library clerks 1 Lifting truck operators 1 Livestock and dairy producers 1 Livestock farm labourers 1 Medical and pathology laboratory technicians 1 Medical secretaries 1 Metal production process controllers 1 Mining and quarrying labourers 1 Mining engineers metallurgists and related professionals 1 Mixed crop and animal producers 1 Mixed crop growers 1 Motorcycle drivers 1 Odd job persons 1 Other cleaning workers 1 Other music teachers 1
Paper products machine operators 1 Personnel and careers professionals 1 Personnel clerks 1 Pet groomers and animal care workers 1 Physicists and astronomers 1 Physiotherapy technicians and assistants 1 Potters and related workers 1 Power production plant operators 1 Prison guards 1 Product and garment designers 1 Psychologists 1 Pulp and papermaking plant operators 1 Railway brake signal and switch operators 1 Receptionists (general) 1 Refuse sorters 1 Riggers and cable splicers 1 Scribes and related workers 1 Secretaries (general) 1 Securities and finance dealers and brokers 1 Security guards 1 Senior government officials 1 Senior officials of special-interest organizations 1 Shelf fillers 1 Ships engineers 1 Shoemaking and related machine operators 1 Social work associate professionals 1 Stall and market salespersons 1 Stationary plant and machine operators not elsewhere classified 1 Stonemasons stone cutters splitters and carvers 1 Street and related service workers 1 Sweepers and related labourers 1 Teaching professionals not elsewhere classified 1 Telecommunications engineering technicians 1 Textile fur and leather products machine operators not elsewhere classified 1 Trade brokers 1 Travel attendants and travel stewards 1 Travel guides 1
Labour shortages and surpluses 2017
2017 41
Directorate-General for Employment Social Affairs and Inclusion European Network of Public Employment Services (PES)
Shortage occupation PES count
Tree and shrub crop growers 1 Underwater divers 1 University and higher education teachers 1 Vehicle cleaners 1 Veterinarians 1 Weaving and knitting machine operators 1 Web technicians 1 Wood processing plant operators 1 Woodworking-machine tool setters and operators 1
Labour shortages and surpluses 2017
2017 42
Directorate-General for Employment Social Affairs and Inclusion European Network of Public Employment Services (PES)
ANNEX 3 SURPLUS OCCUPATIONS
Surplus occupation PES count
General office clerks 8 Shop sales assistants 8 Advertising and marketing professionals 6 Bank tellers and related clerks 6 Sociologists anthropologists and related professionals 6 Child care workers 5 Hairdressers 5 Journalists 5 Cashiers and ticket clerks 4 Cleaners and helpers in offices hotels and other establishments 4 Hand packers 4 Mail carriers and sorting clerks 4 Photographers 4 Receptionists (general) 4 Tailors dressmakers furriers and hatters 4 Accounting and bookkeeping clerks 3 Administrative and executive secretaries 3 Beauticians and related workers 3 Biologists botanists zoologists and related professionals 3 Bricklayers and related workers 3 Broadcasting and audio-visual technicians 3 Civil engineering labourers 3 Economists 3 Gardeners horticultural and nursery growers 3 Interior designers and decorators 3 Kitchen helpers 3 Legal professionals not elsewhere classified 3 Manufacturing labourers not elsewhere classified 3 Motor vehicle mechanics and repairers 3
Musicians singers and composers 3 Other artistic and cultural associate professionals 3 Painters and related workers 3 Philosophers historians and political scientists 3 Security guards 3 Sweepers and related labourers 3 Travel consultants and clerks 3 Waiters 3 Actors 2 Archivists and curators 2 Bakers pastry-cooks and confectionery makers 2 Bartenders 2 Building construction labourers 2 Business services and administration managers not elsewhere classified 2 Cabinet-makers and related workers 2 Car taxi and van drivers 2 Chemists 2 Cleaning and housekeeping supervisors in offices hotels and other establishments 2 Credit and loans officers 2 Customs and border inspectors 2 Elementary workers not elsewhere classified 2 Film stage and related directors and producers 2 Financial analysts 2 Forestry and related workers 2 Freight handlers 2 Graphic and multimedia designers 2 Health care assistants 2 Hotel receptionists 2 Lawyers 2 Legal and related associate professionals 2 Library clerks 2 Livestock and dairy producers 2 Management and organization analysts 2 Messengers package deliverers and luggage porters 2 Odd job persons 2 Office supervisors 2 Plasterers 2
Labour shortages and surpluses 2017
2017 43
Directorate-General for Employment Social Affairs and Inclusion European Network of Public Employment Services (PES)
Surplus occupation PES count
Police officers 2 Pre-press technicians 2 Print finishing and binding workers 2 Printers 2 Prison guards 2 Product and garment designers 2 Psychologists 2 Public relations professionals 2 Religious professionals 2 Secondary education teachers 2 Secretaries (general) 2 Social work and counselling professionals 2 Stall and market salespersons 2 Stock clerks 2 Teachers aides 2 Telephone switchboard operators 2 Travel guides 2 Visual artists 2 Advertising and public relations managers 1 Agricultural technicians 1 Announcers on radio television and other media 1 Assemblers not elsewhere classified 1 Building and related electricians 1 Building architects 1 Building caretakers 1 Building frame and related trades workers not elsewhere classified 1 Business services agents not elsewhere classified 1 Buyers 1 Carpenters and joiners 1 Chemical engineers 1 Civil engineers 1 Clearing and forwarding agents 1 Clerical support workers not elsewhere classified 1
Commercial sales representatives 1 Conference and event planners 1 Contact centre information clerks 1 Contact centre salespersons 1 Cooks 1 Crane hoist and related plant operators 1 Creative and performing artists not elsewhere classified 1 Dancers and choreographers 1 Data entry clerks 1 Database designers and administrators 1 Domestic cleaners and helpers 1 Domestic housekeepers 1 Draughtspersons 1 Driving instructors 1 Early childhood educators 1 Electronics mechanics and servicers 1 Farming forestry and fisheries advisers 1 Fashion and other models 1 Fast food preparers 1 Field crop and vegetable growers 1 Filing and copying clerks 1 Finance managers 1 Financial and insurance services branch managers 1 Financial and investment advisers 1 Fire-fighters 1 Fitness and recreation instructors and program leaders 1 Floor layers and tile setters 1 Food service counter attendants 1 Fruit vegetable and related preservers 1 Gallery museum and library technicians 1 Garbage and recycling collectors 1 Garment and related pattern-makers and cutters 1 Glass and ceramics plant operators 1 Government tax and excise officials 1 Hand launderers and pressers 1
Labour shortages and surpluses 2017
2017 44
Directorate-General for Employment Social Affairs and Inclusion European Network of Public Employment Services (PES)
Surplus occupation PES count
Heavy truck and lorry drivers 1 House builders 1 Hunters and trappers 1 Information and communications technology installers and servicers 1 Information and communications technology user support technicians 1 Insurance representatives 1 Jewellery and precious-metal workers 1 Judges 1 Legal secretaries 1 Librarians and related information professionals 1 Life science technicians (excluding medical) 1 Lifting truck operators 1 Managing directors and chief executives 1 Manufacturing supervisors 1 Medical and dental prosthetic technicians 1 Metal moulders and coremakers 1 Mining and quarrying labourers 1 Mixed crop and animal producers 1 Mixed crop growers 1 Mobile farm and forestry plant operators 1 Musical instrument makers and tuners 1 Other language teachers 1 Pawnbrokers and money-lenders 1 Personnel and careers professionals 1 Pet groomers and animal care workers 1 Photographic products machine operators 1 Physical and engineering science technicians not elsewhere classified 1 Physicists and astronomers 1 Police inspectors and detectives 1 Precision-instrument makers and repairers 1 Primary school teachers 1 Process control technicians not elsewhere classified 1 Product graders and testers (excluding foods and beverages) 1
Production clerks 1 Professional services managers not elsewhere classified 1 Protective services workers not elsewhere classified 1 Research and development managers 1 Retail and wholesale trade managers 1 Roofers 1 Sales workers not elsewhere classified 1 Senior government officials 1 Service station attendants 1 Shelf fillers 1 Shop supervisors 1 Social work associate professionals 1 Special needs teachers 1 Spray painters and varnishers 1 Statistical mathematical and related associate professionals 1 Stonemasons stone cutters splitters and carvers 1 Street food salespersons 1 Supply distribution and related managers 1 Teaching professionals not elsewhere classified 1 Technical and medical sales professionals (excluding ICT) 1 Training and staff development professionals 1 Translators interpreters and other linguists 1 Transport conductors 1 Tree and shrub crop growers 1 Typists and word processing operators 1 Undertakers and embalmers 1 Vocational education teachers 1 Weaving and knitting machine operators 1 Woodworking-machine tool setters and operators 1
Labour shortages and surpluses 2017
2017 45
Directorate-General for Employment Social Affairs and Inclusion European Network of Public Employment Services (PES)
ANNEX 4 THE RATIO OF UNEMPLOYED TO NEW HIRES
ISCO-08 title
2015
UE
Recruited in the
last year (lt12
months)
Ratio of UE to new recruits
Street and related service workers 85 104 08 Agricultural forestry and fishery labourers 3913 5343 07 Mining and construction labourers 1937 3525 05 Creative and performing artists 610 1115 05 Refuse workers 1036 1923 05 Painters building structure cleaners and related trades workers 1116 2117 05 Street and market salespersons 195 389 05 Building frame and related trades workers 3632 7353 05 Mining manufacturing and construction supervisors 626 1315 05 Ships deck crews and related workers 53 114 05 Market gardeners and crop growers 1471 3207 05 Managing directors and chief executives 304 667 05 Travel attendants conductors and guides 229 538 04 Wood treaters cabinet-makers and related trades workers 491 1159 04 Manufacturing labourers 1640 3909 04 Domestic hotel and office cleaners and helpers 5679 13545 04 Other stationary plant and machine operators 822 1961 04 Mobile plant operators 1038 2497 04 Building finishers and related trades workers 1519 3680 04 Textile fur and leather products machine operators 431 1048 04 Garment and related trades workers 422 1047 04 Chemical and photographic products plant and machine operators 157 389 04 Food processing and related trades workers 930 2330 04 Vehicle window laundry and other hand cleaning workers 291 754 04 Sheet and structural metal workers moulders and welders and related workers
996 2603 04
Waiters and bartenders 4399 11595 04 Cooks 1529 4039 04 Metal processing and finishing plant operators 208 557 04 Printing trades workers 203 548 04 Forestry and related workers 130 351 04 Protective services workers 1347 3658 04 Transport and storage labourers 2532 6939 04 Fishery workers hunters and trappers 46 128 04 Material-recording and transport clerks 1671 4630 04 Process control technicians 179 517 03 Mining and mineral processing plant operators 94 274 03 Telecommunications and broadcasting technicians 177 519 03 Blacksmiths toolmakers and related trades workers 816 2409 03 Building and housekeeping supervisors 678 2045 03
Secretaries (general) 1072 3259 03 Assemblers 850 2586 03 Other craft and related workers 258 810 03 Shop salespersons 6600 21042 03 Electrical equipment installers and repairers 958 3060 03 Food and related products machine operators 437 1400 03 Other sales workers 1087 3510 03 Food preparation assistants 1646 5337 03 Mixed crop and animal producers 387 1260 03 Car van and motorcycle drivers 1155 3764 03 Client information workers 1993 6531 03 Sports and fitness workers 605 1984 03 Handicraft workers 194 638 03 Life science technicians and related associate professionals 82 271 03 Keyboard operators 283 940 03 Electronics and telecommunications installers and repairers 290 963 03 Other personal services workers 313 1047 03 Vocational education teachers 279 940 03 Other teaching professionals 744 2518 03 General office clerks 966 3272 03 Authors journalists and linguists 335 1135 03 Hairdressers beauticians and related workers 806 2796 03
Labour shortages and surpluses 2017
2017 46
Directorate-General for Employment Social Affairs and Inclusion European Network of Public Employment Services (PES)
ISCO-08 title
2015
UE
Recruited in the
last year (lt12
months)
Ratio of UE to new recruits
Animal producers 189 660 03 Other elementary workers 976 3401 03 Machinery mechanics and repairers 1134 3962 03 Ship and aircraft controllers and technicians 80 281 03 Hotel and restaurant managers 344 1220 03 Cashiers and ticket clerks 908 3220 03 Retail and wholesale trade managers 224 809 03 Sales marketing and development managers 311 1124 03 Physical and engineering science technicians 1204 4366 03 Administrative and specialised secretaries 1106 4040 03 Sales and purchasing agents and brokers 1294 4754 03 Rubber plastic and paper products machine operators 256 941 03 Artistic cultural and culinary associate professionals 511 1906 03 Numerical clerks 944 3532 03 Other services managers 184 691 03 Child care workers and teachers aides 1335 5005 03 Heavy truck and bus drivers 1426 5349 03 Business services and administration managers 383 1439 03 Information and communications technology service managers 67 257 03 Regulatory government associate professionals 209 807 03 Life science professionals 176 681 03 Wood processing and papermaking plant operators 97 379 03 Locomotive engine drivers and related workers 46 179 03 Legal professionals 315 1245 03 Personal care workers in health services 2195 8787 02 Physical and earth science professionals 85 345 02 Street vendors (excluding food) 50 204 02 Architects planners surveyors and designers 515 2092 02 Other clerical support workers 901 3657 02 Business services agents 510 2114 02 Manufacturing mining construction and distribution managers 361 1507 02 Tellers money collectors and related clerks 381 1612 02 Librarians archivists and curators 58 248 02 Medical and pharmaceutical technicians 255 1099 02 University and higher education teachers 301 1333 02 Information and communications technology operations and user support technicians
418 1888 02
Legal social and religious associate professionals 920 4348 02 Financial and mathematical associate professionals 601 2852 02 Sales marketing and public relations professionals 865 4172 02 Finance professionals 472 2281 02 Engineering professionals (excluding electrotechnology) 635 3118 02 Other health associate professionals 531 2657 02
Social and religious professionals 460 2317 02 Professional services managers 176 891 02 Nursing and midwifery associate professionals 556 2855 02 Legislators and senior officials 53 286 02 Database and network professionals 83 455 02 Administration professionals 641 3673 02 Primary school and early childhood teachers 575 3345 02 Electrotechnology engineers 142 827 02 Secondary education teachers 471 2812 02 Other health professionals 346 2083 02 Nursing and midwifery professionals 273 1760 02 Software and applications developers and analysts 631 4159 02 Medical doctors 293 1944 02 No occupation 152894 00
No answer 2531 578 44 Total 249561 294937 08
Labour shortages and surpluses 2017
2017 47
Directorate-General for Employment Social Affairs and Inclusion European Network of Public Employment Services (PES)
HOW TO OBTAIN EU PUBLICATIONS
Free publications
bull one copy
via EU Bookshop (httpbookshopeuropaeu)
bull more than one copy or postersmaps
from the European Unionrsquos representations (httpeceuropaeurepresent_enhtm)
from the delegations in non-EU countries
(httpeeaseuropaeudelegationsindex_enhtm)
by contacting the Europe Direct service (httpeuropaeueuropedirectindex_enhtm)
or calling 00 800 6 7 8 9 10 11 (free phone number from anywhere in the EU) () () The information given is free as are most calls (though some operators phone boxes or hotels may charge you)
Priced publications
bull via EU Bookshop (httpbookshopeuropaeu)
Priced subscriptions
bull via one of the sales agents of the Publications Office of the European Union
(httppublicationseuropaeuothersagentsindex_enhtm)
doi 10276731262
KE-0
1-1
8-2
63-E
N-N
[Ca
talo
gu
e n
um
be
r]
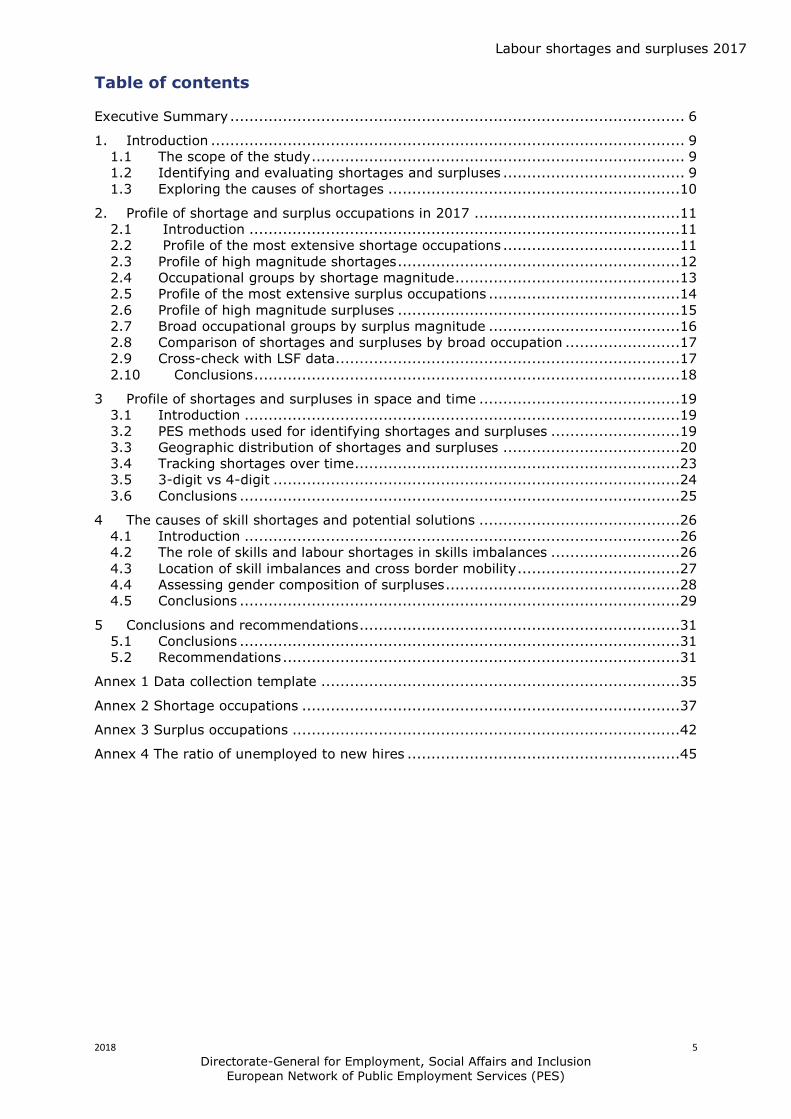
Labour shortages and surpluses 2017
2018 5
Directorate-General for Employment Social Affairs and Inclusion European Network of Public Employment Services (PES)
Table of contents
Executive Summary 6
1 Introduction 9 11 The scope of the study 9 12 Identifying and evaluating shortages and surpluses 9 13 Exploring the causes of shortages 10
2 Profile of shortage and surplus occupations in 2017 11 21 Introduction 11 22 Profile of the most extensive shortage occupations 11 23 Profile of high magnitude shortages 12 24 Occupational groups by shortage magnitude 13 25 Profile of the most extensive surplus occupations 14 26 Profile of high magnitude surpluses 15 27 Broad occupational groups by surplus magnitude 16 28 Comparison of shortages and surpluses by broad occupation 17 29 Cross-check with LSF data 17 210 Conclusions 18
3 Profile of shortages and surpluses in space and time 19 31 Introduction 19 32 PES methods used for identifying shortages and surpluses 19 33 Geographic distribution of shortages and surpluses 20 34 Tracking shortages over time 23 35 3-digit vs 4-digit 24 36 Conclusions 25
4 The causes of skill shortages and potential solutions 26 41 Introduction 26 42 The role of skills and labour shortages in skills imbalances 26 43 Location of skill imbalances and cross border mobility 27 44 Assessing gender composition of surpluses 28 45 Conclusions 29
5 Conclusions and recommendations 31 51 Conclusions 31 52 Recommendations 31
Annex 1 Data collection template 35
Annex 2 Shortage occupations 37
Annex 3 Surplus occupations 42
Annex 4 The ratio of unemployed to new hires 45
Labour shortages and surpluses 2017
2018 6
Directorate-General for Employment Social Affairs and Inclusion European Network of Public Employment Services (PES)
EXECUTIVE SUMMARY
This is the third study on imbalances in the European labour market using a survey of
national Public Employment Services (PES) The top raking surplus and shortage
occupations (ranked by the number of reporting PES) in the EU Member States Norway
Iceland and Switzerland identified in this study are presented in Table 1E
Table 1E Top shortage and surplus occupations in 2017
Shortage Surplus
Cooks General office clerks
Plumbers and pipe fitters Shop sales assistants
Generalist medical practitioners Advertising and marketing professionals
Welders and flamecutters Bank tellers and related clerks
Heavy truck and lorry drivers Sociologists anthropologists etc
Metal working machine tool setters Child care workers
Nursing professionals Hairdressers
Software developers Journalists
Agric and ind machinery mechanics Cashiers and ticket clerks
Cleaners and helpers in offices hotels etc Cleaners and helpers in offices hotels etc
Commercial sales representatives Hand packers
Specialist medical practitioners Mail carriers and sorting clerks
Systems analysts Photographers
Bricklayers and related workers Receptionists (general)
Building and related electricians Tailors dressmakers furriers and hatters
Butchers fishmongers and related
Motor vehicle mechanics and repairers
Nursing associate professionals
Sheet-metal workers
Shop sales assistants
Waiters
Positive findings
The current study attracted a greater level of engagement by the PES then
previously with a higher number of PES providing data on shortagessurpluses
A comparison between the lists of shortage occupations and their rankings in
2015 2016 and 2017 showed a high level of consistency
The use of 4-digit ISCO classification of occupations provided more accurate and
detailed information than the more aggregated 3-digit classification used in the
previous studies
In general the PES demonstrated a capability to distinguish between shortages
caused primarily by skill deficits and shortages which primarily reflected an
unwillingness of appropriately qualified job-seekers to work in the occupation in
question (ie labour shortages)
Labour shortages and surpluses 2017
2018 7
Directorate-General for Employment Social Affairs and Inclusion European Network of Public Employment Services (PES)
The list of shortage and surplus occupations identified through the PES are
consistent with the recently reported Labour Force Survey (LSF) data in particular
the ratio of unemployed to new hires (the ratio is typically low for skill shortages
and high for surpluses and labour shortages)
A clear distinction has been identified between the competences associated with
shortages and surpluses Shortages were dominated by technical competences
(eg occupations at professional associate professional and craft level in the
areas of software engineering and healthcare) while surpluses with non-technical
competencies (eg sales admin arts and humanities)
Despite a relatively low number of PES providing data on surplus occupations a
considerable number of cross-border matching possibilities between shortage
occupations in some countries and surplus occupations in others were identified
The concern that shortagessurpluses reported by the PES would be skewed
towards lower skilled occupations (potentially reflecting the type of vacancies
employers select to advertise through PES and the profile of the job-seekers)
proved to be unfounded the highest number of both shortage and surplus
occupations identified were in the professional group This was partially due to the
use of sources other than PES administrative data to identify imbalances
Negative findings
A number of PES could not provide data on surpluses Typically those were PES
that relied on data sources other than administrative data (eg employer surveys
immigration data etc) In addition many of PES who submitted data on
surpluses listed very few occupations (less than 20) While this may be a
reflection of a more buoyant EEA labour market it limited the extent to which
cross-border matching possibilities could be identified
The data collected on the gender composition of shortage and surplus occupations
was poor It highlighted that gender imbalances at occupational level are best
analysed using other sources (eg LSF data) in conjunction with the PES data
The analysis highlights that only about one in three PES could provide data on
shortages and surpluses at sub-national level (NUTs 2 3 or 4)
Limiting the list of occupations to 20 irrespective of the size and characteristics of
the local labour market might have resulted in the lack of obvious patterns in the
geographical distribution of shortages and surpluses
Recommendations
A campaign should be launched to raise awareness of the importance of
comprehensive information on shortages and surpluses This could involve the
circulation of the report and presentation of key findings to the national
authorities and relevant groups (eg Advisors for European PES Affairs and the
Eures coordination group)
In order to properly assess labour market imbalances and identify possibilities for
cross-country matching of shortages and surpluses a model for the systematic
Labour shortages and surpluses 2017
2018 8
Directorate-General for Employment Social Affairs and Inclusion European Network of Public Employment Services (PES)
collection of data is proposed and summarised in Figure 1E The model draws
from the findings of three bottleneck studies over the period 2015-2017
Figure 1E Model for gathering data on shortage and surplus occupations
Sources of data on surpluses PES data from other relevant agencies (EU legislation) Dimensions of shortagessurpluses extent (number of reporting PES) and severity (high or low magnitude) Type of shortage skill vs labour shortages Classification of occupations used ISCO 08 4-digit codes (or translation into these codes) Accuracy test cross-check with LSF data (ratio of unemployed to new hires) Gender balance assessment LFS data on employment at occupational level by gender PES job seekers Regional balance assessment LSF data data from relevant agencies Number of occupations reporting should be extended beyond 20 occupations but with upper limit (eg 50) Timing of imbalance assessment September
(features added to the methodology in this study highlighted in red)
Labour shortages and surpluses 2017
2018 9
Directorate-General for Employment Social Affairs and Inclusion European Network of Public Employment Services (PES)
1 INTRODUCTION
This is the third report in a series of annual reports which provide an analysis of shortage
and since 2016 surplus occupations as identified by the European PES Each report has
a somewhat different focus The focus of this report is to ultimately draw on the findings
in the whole series and create a model which can accurately and comprehensively
identify imbalances and cross-border matching possibilities in a manner which is of
practical use to EURES and the national VET authorities in the EEA countries
Facilitating the matching of skills and jobs across borders in the EU contributes to the
better functioning of labour markets in the EU as pursued by the EURES network1
Supporting the identification of skills shortages and the better matching of skills of job-
seekers with the needs of employers is also among the objectives of the European
Network of Public Employment Services (PES Network)2
11 The scope of the study
A total of thirty-three PES were asked to submit data on shortage and surplus
occupations These PES included the national PES from twenty-seven EU Member States
and the three regional PES from Belgium As in the case of the studies in 2015 and 2016
the national PES of Iceland and Norway were also requested to submit data while the
national PES of Switzerland was included for the first time in 2017
Table 11 below shows the response of the PES to these requests A total of twenty-eight
PES submitted data on shortage occupations while a total of eighteen submitted data on
surplus occupations This represents an increase of two PES compared to the 2016 study
and an increase of five PES compared to the 2015 study in respect of the number of PES
who provided a list of shortage occupations and an increase of five PES compared to the
number of PES who provided lists of surplus occupations in 2016
As shown in chapter three below the main reason for the lower response in the case of
surplus occupations were the methods used by the PES for identifying shortage
occupations Specifically many of the PES used employer surveys as their exclusive
source of information on shortages and these do not provide data on surplus
occupations To improve on data coverage data could be collected from other bodies
Table 11 Participating PES
Public employment services which submitted data on shortage occupations
AT BE - Actiris BE - Le Forem BE - VDAB BG CH CY DE DK EE FI FR HR HU IE IT IS LT LU LV MT NL N0 PL PT SE SK SI
Public employment services which submitted data on surplus occupations
LF BG CH CY DK EE FI FR HR HU IE IS LT LV NL PL SE SK
12 Identifying and evaluating shortages and surpluses
One of the core objectives of this study was to identify shortage and surplus occupations
using the most detailed (ie ISCO rsquo08 4-digit codes) data available to the PES (in the
future where necessary PES could augment its data using other sources) The analysis
uses two dimensions to quantify shortage and surplus occupations the most widely
1 Regulation (EU) 2016589 of 13 April 2016 on a European network of employment services (EURES) workers
access to mobility services and the further integration of labour markets 2 As defined in Article 3 of the Decision 5732014EU on Enhanced Co-operation between Public Employment
Services of 15 May 2014
Labour shortages and surpluses 2017
2018 10
Directorate-General for Employment Social Affairs and Inclusion European Network of Public Employment Services (PES)
reported (ie reported by the most PES) shortage and surplus occupations and the
occupations with the most severe shortages and surpluses
Owing to limitations of space however only lists of between twenty to thirty individual
occupations could be displayed here However it should be noted that almost one
thousand shortage occupations were reported by the twenty-eight PES of which 282 were
different occupations The number of surplus occupations reported by eighteen PES were
381 of which 196 were different occupations3
An attempt is made to evaluate the accuracy of the PES identification of shortage and
surplus occupations by comparing the most widely reported shortages and surpluses with
the ratio of unemployed to new hires at EU level
13 Exploring the causes of shortages
This study differs in several respects from the two previous studies Firstly this study
attempts to identify the causes of shortage and surplus occupations Accordingly a
number of new questions were added to the questionnaire specifically on the nature of
the shortage (ie was it due to a skills deficit or to a shortage of labour) and ndash in the
case of surplus occupations - the gender composition While many of the PES provided a
classification of shortages in terms of labour versus skills shortage the response to the
question on gender share was disappointing
The data collection template (Annex 1) also inquired of the extent to which the PES could
provide the data at regional level The purpose of including this question was to assess
the feasibility of undertaken a future edition of this study at regional rather than national
level Unfortunately the response to this question was also disappointing
Despite the rather disappointing response to some of the new questions the study does
provide a wealth of data on shortage and surplus occupations The vast majority of PES
provided roughly twenty specific occupations which they considered to be in short supply
and rated the degree of severity of the shortage A number of PES provided a
significantly greater number than twenty shortage occupations
The existence of the previous two studies provided the basis for an assessment of the
extent to which the shortages persisted over time The fact that data on the shortages
and surplus occupations in the previous studies was at a higher level of aggregation (ie
the 3-digit occupation codes) also allowed an assessment to be made of the level of
aggregation which is required to accurately identify shortage and surplus occupations
The analysis herein conclusively demonstrated that the highest level of disaggregation
was required (ie the 4-digit occupation codes) for accurate identification as the 3-digit
codes contained occupations which were not in shortage or surplus (see chapter 3
below)
The analysis also explores the extent to which the same occupations are classified as
shortages in some countries and surpluses in others thereby creating the possibility that
policies designed to enhance cross-border matching between such occupations might
alleviate some skill and labour market imbalances in the EEA group of countries
3 A list of the occupations is shown in annexes two and three attached
Labour shortages and surpluses 2017
2018 11
Directorate-General for Employment Social Affairs and Inclusion European Network of Public Employment Services (PES)
2 PROFILE OF SHORTAGE AND SURPLUS OCCUPATIONS IN 2017
21 Introduction
This chapter contains a detailed analysis of the data on shortage and surplus
occupations The data is analysed from a number of perspectives such as the most
frequently reported shortages and surpluses and their relative magnitude The PES were
requested to identify a minimum of twenty shortage occupations and twenty surplus
occupations However while twenty-eight PES identified at least roughly twenty shortage
occupations only eighteen PES identified any surplus occupations
22 Profile of the most extensive shortage occupations
Table 21 shows the shortage occupations reported by the most PES in 2017 The
twenty-eight PES who submitted data on shortage occupations is two more than in the
2016 report and five more than the number that submitted such data in 2015
The Table shows that over half of all PES (sixteen) reported shortages of cooks making
lsquocooksrsquo the occupation reported by the most PES However this figure underestimates
the seriousness of the shortage of persons qualified in cooking skills because five PES
also reported shortages of chefs and four PES reported shortages of bakers and pastry-
makers
Within the top twenty-one shortage occupations the health related occupations
dominated the list with four different occupations these were lsquogeneralist medical
practitionersrsquo lsquonursing professionalsrsquo lsquospecialist medical practitionersrsquo and lsquoassociate
professional nursesrsquo The difference between professional and associate professional
nurses may reflect the fact that nursing qualifications differ across the EEA area
specifically nurses in some countries require a degree to practice in other countries
nursing is at sub-degree level
Table 21 Top 21 shortage occupations (4-digit level)
Occupation
Number of PES reporting occupation as shortage
Occupation
Number of PES reporting occupation as shortage
Cooks 16 Systems analyst 10
Plumbers and pipe fitters 13 Cleaners and helpers in offices hotels etc
10
Generalist medical practitioners 13 Bricklayers and related workers 9
Welders and flame cutters 12 Building and related electricians 9
Heavy truck and lorry drivers 11 Butchers fishmongers and related food
9
Metal workers machine tool setting and operators
11 Motor vehicle mechanics and repairers
9
Nursing professionals 11 Nursing associate professionals 9
Software developers 11 Sheet-metal workers 9
Agriculture and industrial machinery repairers
10 Shop sales assistants 9
Commercial sales representatives 10 Waiters 9
Specialist medical practitioners 10
Labour shortages and surpluses 2017
2018 12
Directorate-General for Employment Social Affairs and Inclusion European Network of Public Employment Services (PES)
There may be an argument therefore for combining the associate and professional
category when assessing the true extent of the shortage of nurses This argument is
particularly compelling in respect of those PES who report a shortage of associate
professional nurses but not a shortage of professional nurses There are four such PES
Denmark Estonia Luxemburg and Slovenia If associate professional nurses are
essentially doing the same job as professional nurses in these countries the number of
PES reporting a shortage of professional nurses is in effect fifteen rather than eleven
Indeed confining the shortage occupations to those reported by nine or more PES may
disguise the true extent of shortages in health related occupations There were many
health related occupations which were identified by less than nine PES as shortage
occupations For example seven PES reported shortages of lsquohealthcare assistantsrsquo five
reported shortages of lsquophysiotherapistsrsquo and three reported shortages of lsquomidwivesrsquo Both
Germany and France reported many shortages of specialists within the lsquonursersquo and lsquoother
healthcare professionalsrsquo categories
Shortages of both lsquosoftware developersrsquo and lsquosystems analystsrsquo appear to be quite
widespread as these occupations were reported as being in shortage by ten and eleven
PES respectively The impression of widespread shortages is supported by the fact that a
number of software-related occupations such as lsquoapplication programmersrsquo lsquoother
software and application developersrsquo and lsquoweb and multi-media developersrsquo were all
reported as shortage occupations by six PES
The main building related crafts such as lsquoelectriciansrsquo lsquoplumbersrsquo and lsquobricklayersrsquo were
also prominent in the list Indeed only the occupation of lsquocookrsquo was reported as a
shortage occupation by more PES than lsquoplumbersrsquo
In addition eight PES reported experiencing shortages of lsquoconcrete finishersrsquo and
lsquocarpenters and joinersrsquo while six PES reported shortages of lsquoroofersrsquo and lsquoplasterersrsquo
But it is the engineering occupations which demonstrate that shortages may be quite
pervasive in a group of occupations despite the fact that they are not included in the list
of specific occupations which were reported by the most PES Thus lsquocivil engineersrsquo
lsquomechanical engineersrsquo and both electrical and electronic engineering technicians just
missed inclusion in Table 21 above as they were all reported as shortage occupations by
eight PES In addition both lsquoelectronic engineersrsquo and lsquomechanical engineering
techniciansrsquo were reported as shortage occupations by seven PES
The teaching professions also just missed inclusion in Table 21 because primary school
teachers were reported as a shortage occupation by eight PES and secondary school
teachers by seven PES
Two occupations which feature in surveys on skill shortages and which are not included in
Table 21 are lsquoaccountantsrsquo and lsquotoolmakersrsquo Both occupations were reported as shortage
occupations by six PES
The total list of occupations which were identified by at least one PES as a shortage
occupation is shown in Annex 2 of this report
23 Profile of high magnitude shortages
In addition to identifying shortage occupations the PES were also asked to rank the
occupations in terms of the severity of the shortage Table 22 below lists those
occupations for which the PES identified shortages of high magnitude
The number of PES who identify occupations which have shortages of high magnitude will
be lower than the number of PES who identify occupations which have shortages
irrespective of the magnitude of those shortages As shown in Table 21 the list of the
top twenty-one shortage occupations have been identified by at least nine different PES
Labour shortages and surpluses 2017
2018 13
Directorate-General for Employment Social Affairs and Inclusion European Network of Public Employment Services (PES)
In contrast the list of occupations which have been identified by the PES as having
shortages of a high magnitude includes occupations which have been identified by as few
as two PES Therefore occupations which have not been included in the twenty one
shortage occupations identified by the most PES may qualify for inclusion in the list of
occupations with shortages of high magnitude
Table 22 High magnitude shortages (4-digit level)
Occupation Number of PES stating high magnitude of shortage
Occupation Number of PES stating high magnitude of shortage
Cooks 6 Cleaners and helpers in offices 2
Systems analysts 6 Contact centre sales persons 2
Concrete placers and concrete finishers
4 Database designers and administrators
2
Plumbers and pipe fitters 4 Heavy truck and lorry drivers 2
Shops sales assistants 4 Metal working machine tool setters 2
Waiters 4 Primary school teachers 2
Welders and flame cutters 4 Secondary school teachers 2
Nursing professionals 3 Other software and application developers
2
Application programmers 3 Software developers 2
Carpenters and joiners 3
Thus while lsquocooksrsquo retain the top ranking there are eight occupations in the list of
shortage occupations of high magnitude which are not included in the general list of
shortage occupations in Table 21 These include two lsquoteacherrsquo occupations and three new
lsquosoftwarersquo related occupations The two software occupations on the general list of
shortages in Table 21 are also included in this Table which means that five software
related occupations are considered to have shortages of high magnitude The position of
lsquosystems analystrsquo is particularly noteworthy A total of ten of twenty eight PES classify
this occupation as a shortage and six of these PES consider the shortage to be of a high
magnitude Thus shortages in this occupation appear to be both relatively widespread
and quite severe
The other finding of interest is that there are a considerable number of craft occupations
which are classified by a number of PES as shortages of high magnitude Thus four PES
rate lsquoplumbers and pipe fittersrsquo lsquoconcrete placersrsquo and lsquoweldersrsquo as shortages of high
magnitude while three PES also maintain that there are serious shortages of carpenters
24 Occupational groups by shortage magnitude
Figure 21 below shows how the PES classified shortages by broad occupational level in
terms of the severity of the shortage The figure shows that the professional shortage
occupations were classified by the most PES as high magnitude followed by the lsquocraft
and related trade workersrsquo Less than ten PES classified any other occupation as a
shortage of high magnitude but interestingly - while only four PES classified skilled
agricultural workers as a shortage - all of them ranked the shortage as being of high
magnitude Similarly while only seven PES categorised any of the clerical-related
occupations as a shortage five of the seven PES classified at least one of these
occupations as a shortage of high magnitude
Labour shortages and surpluses 2017
2018 14
Directorate-General for Employment Social Affairs and Inclusion European Network of Public Employment Services (PES)
Figure 21 Shortages by estimated shortage magnitude (1-digit level)
25 Profile of the most extensive surplus occupations
The PES were also requested to identify occupations for which there was an excess
supply and eighteen PES did so The surplus occupations identified by at least four
different PES are shown in Table 23
Intuitively one might expect that an excess supply of jobseekers is more likely to occur
in the case of occupations where the entry requirements are not associated with a high
level of qualifications or technical skills
Table 23 Surplus occupations (4-digit level)
Occupation Number of PES reporting this occupation as surplus
Occupation Number of PES reporting this occupation as surplus
Shop sales assistants 8 Tailors dressmakers furriers hat makers
4
General office clerks 8 Cashiers and ticket sales 4
Advertising and marketing professionals
6 Cleaners and helpers in offices hotels
4
Bank tellers and related clerks 6 Hand packers 4
Sociologists anthropologists and religious
6 Mail carriers and sorting clerks 4
Child care workers 5 Photographer 4
Hairdressers 5 Receptionist (general) 4
Journalists 5
In general this is the case as the occupations of lsquoshop sales assistantsrsquo lsquogeneral office
clerksrsquo lsquobank tellers and related clerksrsquo lsquocashiers and ticket salesrsquo lsquocleaners and helpersrsquo
0 5 10 15 20 25 30
Armed forces occupations
Managers
Skilled agricultural forestry and fishery workers
Clerical support workers
Elementary occupations
Plant and machine operators and assemblers
Technicians and associate professionals
Service and sales workers
Craft and related trades workers
Professionals
High Medium Low
Labour shortages and surpluses 2017
2018 15
Directorate-General for Employment Social Affairs and Inclusion European Network of Public Employment Services (PES)
lsquohand packersrsquo lsquomail carriers and sorting clerksrsquo and lsquoreceptionistsrsquo would not generally
require a high formal level of qualification
However four of the fifteen occupations lsquoadvertising and marketing professionalsrsquo
lsquosociologists and anthropologistsrsquo lsquojournalistsrsquo and lsquophotographersrsquo are professional
occupations Furthermore there are many professional and associate professional
occupations which are not included in the list of surplus occupations reported by the most
PES because they were reported by three or fewer PES These occupations include
lsquophilosophers historians and political scientistsrsquo lsquomusicians singers and composersrsquo
lsquoeconomistsrsquo lsquoother legal professionalsrsquo lsquointerior decoratorsrsquo and lsquoother artists and
associate cultural workersrsquo A list of the surplus occupations which were reported by at
least one PES is shown in Annex 3 of this report
In theory the fact that both the list of shortage occupations and the list of surplus
occupations contain many professional and associate professional occupations should
give rise to many cross-border matching possibilities However this is not the case
because virtually none of the professional or associate professional occupations appear
on both lists In general the professional and associate professional occupations
identified as being in surplus by the PES reflect disciplines in the humanities or the
creative arts In sharp contrast the professional and associate professional occupations
identified as shortage occupations by the PES are technical in nature and are dominated
by software and health related occupations
There is no doubt that many of the occupations identified by the PES as surplus
occupations are attractive to young people This is particularly so of occupations
associated with the creative arts But the analysis of PES data on shortages and
surpluses in this report would suggest that at least some of these occupations are
associated with limited career possibilities and that occupations of a technical nature
have superior career prospects
There are however two occupations lsquoshop sales assistantsrsquo and lsquocleaners and helpersrsquo
who appear in both the lists of shortages and surplus occupations and there are clearly
matching possibilities in these cases However the matching possibilities are not limited
to these two occupations there are many surplus occupations which have been identified
by less than four PES which have also been classified as shortage occupations by other
PES These cross-border matching possibilities are explored in chapter four
26 Profile of high magnitude surpluses
Only seven of the fifteen occupations listed as surplus occupations in Table 23 are not
classified as surpluses of high magnitude in Table 24 The list includes two more
professional occupations lsquobiologists botanists and zoologistsrsquo and lsquomanagement and
organisation analystsrsquo Both lsquojournalistsrsquo and lsquoadvertising and marketing professionalsrsquo
which are included in the list of surplus occupations reported by the most PES are also on
the list of occupations with high magnitude surpluses
One of the occupations which is new to the list is lsquobricklayers and related workersrsquo As
this occupation was also identified as a shortage occupation by nine PES its inclusion
does give rise to some cross-border matching possibilities
Labour shortages and surpluses 2017
2018 16
Directorate-General for Employment Social Affairs and Inclusion European Network of Public Employment Services (PES)
Table 24 High magnitude surplus occupations (4-digit level)
Occupation
Number of PES stating high magnitude of surplus
Occupation
Number of PES stating high magnitude of surplus
General office clerks 4 Journalists 2
Advertising and marketing professionals 3 Management and organisation analysts
2
Receptionist (general) 3 Manufacturing labourers 2
Shop sales assistants 3 Odd job persons 2
Biologists botanists zoologists and related
2 Photographers 2
Bricklayers and related workers 2 Bank tellers and related clerks 2
Child care workers 2 Security guards 2
Cleaners and housekeepers supervisors 2 Travel guides 2
Gardiners horticulturalists and nursery workers
2
27 Broad occupational groups by surplus magnitude
As in the case of shortages the professional group of occupations dominated the
occupations which were considered by the PES to have surpluses of high magnitude
(Figure 22) Indeed eight of the sixteen PES who rated surplus occupations by their
degree of severity identified at least one professional occupation as being in severe over-
supply
Interestingly the three PES who identified surplus occupations among plant and machine
operators and assemblers rated all the occupations they identified in this group as being
surplus occupations of high magnitude
Figure 22 Surpluses by estimated surplus magnitude
0 5 10 15 20
Managers
Plant and machine operators and assemblers
Skilled agricultural forestry and fishery workers
Craft and related trades workers
Clerical support workers
Elementary occupations
Service and sales workers
Technicians and associate professionals
Professionals
High Medium Low
Labour shortages and surpluses 2017
2018 17
Directorate-General for Employment Social Affairs and Inclusion European Network of Public Employment Services (PES)
28 Comparison of shortages and surpluses by broad
occupation
The issues which have been discussed above can be summarised in Table 25 below The
figures show that the 26 PES who reported at least one professional occupation as a
shortage represented 93 of all PES and that in total these PES identified 261
professional occupations as shortages
The situation is not quite as dramatic in respect of surplus occupations Nevertheless
fifteen PES representing 83 of all reporting PES identified a total of 88 professional
occupations as surplus occupations
However the most widespread reported surplus occupations were among the service and
sales group of occupations with almost 90 of PES reporting at least one surplus
occupation in this group The difference in the share of PES reporting shortages and
surpluses in the clerical group of occupations is also noteworthy Half the PES reported at
least one shortage occupation in this group but almost 80 of reporting PES included at
least one surplus occupation from this group
Table 25 Shortages and surpluses by broad occupation group
Broad occupation group
Number of
shortage occupatio
ns identified
Number of PES
reporting
shortages in this broad group
of PES reporting shortages
in this group
Number of surplus occupatio
ns identified
Number of PES
reporting surpluses
in this broad group
of PES reporting surpluses
in this broad group
Professionals 261 26 93 88 15 83
Craft and related trades 237 25 89 44 11 61
Associated professional technical
176 27 97 53 15 83
Services and sales 100 23 82 72 16 89
Plant and machinery 79 22 79 10 8 44
Elementary 53 14 50 37 12 67
Managers 43 11 39 16 7 39
Clerical support 34 14 50 47 14 78
Skilled agriculture 13 6 21 14 5 28
Armed forces 6 1 4 0 0 0
29 Cross-check with LSF data
Finally it is important to assess the extent to which the shortage and surplus occupations
identified by the PES in 2017 are accurate For this task we use the findings from the
2016 study which are based on the LSF data and the ratio of the unemployed to new
hires (Annex 4)
Although based on different levels of aggregation (4-digit vs 3-digit respectively) the
comparison of the PES reported shortages and surpluses in 2017 and the 2016 study LSF
ratio of unemployed and new hires suggests a high level of consistency Specifically PES
identified shortage occupations typically have the low ratio of unemployed to new hires
while the surplus occupations typically have the high ratio of unemployed to new hires
Labour shortages and surpluses 2017
2018 18
Directorate-General for Employment Social Affairs and Inclusion European Network of Public Employment Services (PES)
The only exceptions are the occupations of lsquocleanersrsquo lsquowaitersrsquo and lsquoshop sales
assistantsrsquo However this result is understandable as these occupations were classified
by the PES4 as labour shortages rather than skill shortages and consequently the
relatively high ratio could reflect the fact that there are a significant number of
unemployed available to work in these occupations
210 Conclusions
There are a number of significant conclusions which may be drawn from the analyses of
shortage and surplus occupations in this chapter
Firstly the widespread concern that using data from the PES may produce a significant
bias in the list of shortages and surpluses because the PES attract less vacancies and
job-seekers from higher skilled occupations appears to be unfounded Ironically the
professional occupations were the most frequently reported occupations in both the list of
shortages and surpluses
Secondly there is a distinct difference in the type of competences and qualifications
identified by the PES as shortages and surplus occupations and this difference was
evident throughout the different occupation groups In general the shortage occupations
embodied technical skills whether in health-related software-related or engineeringndash
related occupations at professional technical and craft levels
In sharp contrast the surplus occupations embodied selling service and clerical skills
cultural and artistic skills and competencies in the humanities
Finally the type of occupations which the PES associated with shortages and surpluses
are highly plausible In general the shortage occupations have a low ratio of unemployed
to new hires while the surplus occupations have a high ratio This consistency extended
to the occupations which the PES identified as labour shortages which exhibited a high
ratio
The classification of skill and labour shortages is one of the issues discussed in the next
chapter
4 While this is true when all three occupations are aggregated only two of five PES categorised lsquocleanersrsquo as a labour shortage ndash see chapter 3
Labour shortages and surpluses 2017
2018 19
Directorate-General for Employment Social Affairs and Inclusion European Network of Public Employment Services (PES)
3 PROFILE OF SHORTAGES AND SURPLUSES IN SPACE AND TIME
31 Introduction
In this chapter we analyse the occupations which have been identified by the European
PES as shortage and surplus occupations from the perspective of space and time We
review the geographical distribution of these occupations to ascertain if this distribution
provides an insight into what may have given rise to these shortages and surplus
occupations and we also examine the extent to which the same shortage and surplus
occupations have persisted over time using the findings from previous studies
32 PES methods used for identifying shortages and surpluses
In the previous chapter it was noted that only eighteen of twenty-eight PES submitted a
list of surplus occupations A review of the methods used by the PES to identify shortage
occupations may provide an insight into why ten PES did not provide any data on surplus
occupations
A summary of the methods used to identify shortage occupations is provided in Table 31
below The data indicates that exactly ten PES did not use any administrative data in
identifying their shortage occupations but rather used other sources such as employer
surveys national forecasting studies or immigration data It is tempting to conclude that
this is the reason why only 18 out of 28 PES provided data on surplus occupations as
these methodologies are not generally associated with the provision of information on
occupations which are in surplus
However such a conclusion would not be entirely accurate The analyses found that the
use of survey data did not necessarily preclude a PES from identifying surplus
occupations The Danish PES for example used the results of their Labour Market Balance
Survey and was able to provide a comprehensive list of surplus occupations In contrast
the Italian and Norwegian PES who relied on national forecasts and surveys respectively
were unable to provide such a list
Furthermore not all of the PES who based their identification of shortages on their
administrative data systems provided a list of surplus occupations Those who did
generally used the ratio of job-seekers to vacancies to identify whether an occupation
was a shortage or surplus occupation But a number of PES such as the German and
Luxemburg PES and the Belgium regional PES Actiris while basing their identification of
shortage and surplus occupations on administrative data used quite sophisticated
techniques such as the share of vacancies filled and the duration of vacancy filling Unlike
the ratio of job-seekers to vacancies such techniques do not readily provide an indicator
for identifying an occupation as a surplus occupation5
5 While it is reasonable to classify an occupation as a shortage occupation if the filling of vacant posts in that occupation takes on average an exceptionally long time identifying surplus occupations is somewhat more problematic using this method
Labour shortages and surpluses 2017
2018 20
Directorate-General for Employment Social Affairs and Inclusion European Network of Public Employment Services (PES)
Table 31 Methods used by the PES to identify shortage occupations
PES methods for identifying shortages and surpluses Number of PES
Combination of administrative data PES surveys and expert opinion
1
Combination of administrative data PES surveys and 3rd party data
1
Combination of administrative data and PES surveys 7
Combination of administrative data and 3rd party data 1
Combination of administrative data and expert opinion 2
PES work permit data only 2
PES administrative data only 6
PES survey data only 2
PES warehousing data only 1
3rd party surveys and forecasts 5
Total 28
The fact that only eighteen PES provided a list of surplus occupations is a serious
weakness of this study because it places a limit on the potential of the analyses to
identify cross border matching opportunities between shortage and surplus occupations
Consequently in the future every effort should be made to significantly increase the
number of PES providing a list of surplus occupations even if this means that a
significant number of PES use alternative methodologies to identify shortage and surplus
occupations rather than a single methodology to do both as has occurred in both the
2016 study and the current study6
33 Geographic distribution of shortages and surpluses
The 28 PES who submitted data on shortages cover a very wide geographic area which
include labour markets with very different characteristics It may be informative
therefore to assess the extent to which the distribution of shortage occupations differed
between different countries
Table 32 below shows the number of reported shortage occupations within their broad
occupation group and the PES who reported the occupation as a shortage7
While each PES was requested to submit a maximum of twenty shortage occupations a
total of ten PES provided more than that and in the case of the Slovenian French and the
regional Belgian PES Actiris significantly more
A total of six PES identified less than twenty shortage occupations but in most cases the
difference was negligible
The Croatian and Portuguese PES were the only PES which did not identify any
professional occupation in their list of shortage occupations This may reflect the type of
vacancies which are notified by employers to these PES because both these PES use
their own administrative data systems exclusively to identify shortage occupations
6 In the 2016 study while 26 PES provided data on shortage occupations 13 provided data on surplus
occupations 7 Three groups are excluded from the Table managers (43) skilled agricultural (13) and armed forces (1) as the figures are quite small
Labour shortages and surpluses 2017
2018 21
Directorate-General for Employment Social Affairs and Inclusion European Network of Public Employment Services (PES)
Table 32 Shortages number of mentions (4-digit) in broad occupation (1-digit)
PES Professional Technical Clerical Craft Service Plant Elementary Total
Austria 4 11 1 12 2 0 0 30
Actiris 28 22 6 11 13 2 0 82
Le Forem 6 6 0 6 0 0 0 18
VDAB 4 7 1 4 1 3 0 20
Bulgaria 7 0 0 4 5 3 2 21
Croatia 0 1 0 13 1 3 2 20
Cyprus 6 1 2 5 5 1 6 26
Denmark 5 1 0 7 3 2 1 19
Estonia 10 7 0 0 2 1 0 20
Finland 12 5 1 7 2 2 3 32
France 18 27 2 27 1 26 2 103
Germany 16 19 0 10 2 1 1 49
Hungary 2 6 6 8 14 3 12 51
Iceland 6 3 0 5 2 1 3 20
Ireland 13 2 0 4 1 1 0 21
Italy 2 2 1 7 4 1 3 20
Latvia 7 1 1 9 0 0 0 18
Lithuania 1 2 0 15 0 2 0 20
Luxemburg 8 4 0 0 0 0 0 12
Malta 5 3 3 4 6 1 4 26
Netherlands 20 11 3 23 2 1 0 60
Norway 13 3 0 10 10 4 1 41
Poland 10 6 2 2 3 3 4 30
Portugal 0 1 0 8 3 3 0 15
Slovakia 6 6 2 5 5 2 0 26
Slovenia 23 13 3 30 11 13 9 102
Sweden 15 2 0 1 2 0 0 20
Switzerland 14 4 0 0 0 0 0 18
Total 261 176 34 237 100 79 53 940
The stipulation to only provide a list of twenty shortage occupations may have prevented
any pattern from emerging in the figures For example there does not appear to be any
relationship between the numbers of employed and unemployed in a specific labour
market and the number of shortage occupations identified by its national PES
The two PES who submitted the highest volumes of shortage occupations - the French
and Slovenian PES - vary greatly in terms of the relative size of their labour force while
for example the Norwegian PES submitted significantly more shortage occupations than
much larger countries such as Germany and Poland
As a way of controlling for the variation in the total number of shortage occupations it
may be useful to compare the variation within the list of shortage occupations identified
by each PES However no obvious patterns emerge when a number of hypotheses are
tested using this approach For example there appears to be no relationship between
countries which are associated with strong apprenticeship systems such as Germany
Austria Denmark and Switzerland and their share of shortages among the craft group of
occupations The Swiss PES does not contain any craft occupations in its list of shortage
occupations while the craft group of occupations contain the most shortage occupations
in the lists provided by both the Austrian and Danish PES In the case of the German
PES the share of craft occupations is a little above the average
Labour shortages and surpluses 2017
2018 22
Directorate-General for Employment Social Affairs and Inclusion European Network of Public Employment Services (PES)
Table 33 Surpluses number of mentions (4-digit) in broad occupation (1-digit)
PES Professional Technical Clerical Craft Service Plant Elementary Total
Le Forem 2 1 1 1 6 0 8 19
Bulgaria 6 3 2 0 4 0 2 17
Switzerland 0 4 2 4 1 2 3 16
Cyprus 5 0 0 2 0 0 3 10
Denmark 3 2 3 0 6 1 4 19
Estonia 6 2 3 2 6 0 1 20
Finland 16 7 6 10 3 1 0 43
France 10 10 1 2 5 1 0 29
Croatia 4 0 0 0 0 0 0 4
Hungary 6 9 3 16 15 1 2 52
Ireland 1 1 4 3 5 1 7 22
Iceland 11 1 2 2 1 0 1 18
Lithuania 0 3 1 0 2 2 0 8
Latvia 4 4 0 0 3 1 3 15
Netherlands 3 2 9 0 9 0 1 24
Poland 0 0 0 0 1 0 0 1
Sweden 4 3 7 1 3 0 2 20
Slovakia 7 1 3 1 2 0 0 14
Total 88 53 47 44 72 10 37 351
The most striking aspect of the geographical distribution of surplus occupations is the
relatively low number of occupations which were reported Most of the reporting PES
(eleven) provided less than the twenty surplus occupations they were requested to
submit Furthermore if the contributions from the Hungarian and Finnish PES are
excluded the average number of surplus occupations submitted by the other PES is
sixteen
With the exception of the Icelandic Finnish French and Hungarian PES the list of
surplus occupations remains in single figures across all the broad occupational groups
Such low figures result in limited cross-border matching possibilities which are explored
in the next chapter
The PES were also asked to indicate the lowest regional level at which they could provide
data on both shortage and surplus occupations Their response is outlined in Table 34
above A total of twenty PES responded positively in the case of shortage occupations
and twelve in the case of surplus occupations In the case of shortage occupations nine
PES indicated that they could provide data at NUTs3 level while eight PES stated that
they could provide the data at NUTs1 level In the case of surplus occupations five PES
indicated that they could provide the data at NUTs1 level and another five PES responded
that they could provide the data at NUTs 3 level There were very few PES who indicated
that the lowest level at which they could provide data was at NUTs2 or NUTs4 levels
Labour shortages and surpluses 2017
2018 23
Directorate-General for Employment Social Affairs and Inclusion European Network of Public Employment Services (PES)
Table 34 Availability of data on shortagessurpluses at regional levels
Shortage occupations Surplus occupations
Country NUTS1 NUTS2 NUTS3 NUTS4 No
data NUTS1 NUTS2 NUTS3 NUTS4
Austria
x
Belgium Actiris
x
Belgium Le Forem
x
x
Belgium VDAB
x
Bulgaria
x
x
x
Croatia x
x
Cyprus
x
x
Denmark
x
x
Estonia x
x
Finland
x
x
France
x
x
Germany x
Hungary
x
x
Iceland x
x
Ireland x
x
Italy
x
Latvia
x
x
Lithuania
x
x
Luxembourg x
Malta
x
Netherlands
x
x
Norway
x
Poland
x
x
Portugal
x
Slovakia
x
x
Slovenia x
Sweden
x
x
Switzerland
x
x
Note Bulgaria has regional data for some occupations
34 Tracking shortages over time
This is the third annual study on lsquoBottleneck Occupationsrsquo the previous two studies were
undertaken in 2016 and 2015 The findings in both of those studies were presented in 3-
digit codes To make the findings comparable over time the 4-digit shortage and surplus
occupations from the current study are aggregated up to 3-digit occupations as shown in
Table 35
A striking aspect of the list of occupations in Table 35 is the degree of consistency
displayed over the period 2015-2017 inclusive not simply in terms of the occupations
reported by the PES but also in terms of the number of PES who identified them as
shortages (ie their ranking) Not only does the 3-digit occupation category of lsquosoftware
and applications developersrsquo occupy the top ranking in each of the years five of the top
ranking six occupations are the same The only notable exception is that the finance
professional and associate professional occupations featured in the list of most reported
shortage occupations in 2015 but slipped out of this list in 2016 and 2017
Labour shortages and surpluses 2017
2018 24
Directorate-General for Employment Social Affairs and Inclusion European Network of Public Employment Services (PES)
Table 35 Ranking of shortage occupations (3-digit)
Rank
Top occupations in 2017 2017 2016 2015
Software and application developers 1 1 1
Sheet and structural metal workers 2 3 2
Medical doctors 3 5 2
Blacksmiths toolmakers and related trades 4 3 4
Building finishes and related trade workers 4 6 4
Building frame and related trade workers 4 3 4
Cooks 4 7 7
Engineering professionals 5 6 6
Physical and engineering science technicians 6 7 na
Electrical equipment installers and repairers 7 4 5
Heavy truck and bus drivers 7 5 4
Machinery mechanics and repairers 8 7 5
Nursing and midwifery professionals 8 6 na
Sales and purchasing agents and brokers 9 2 5
Shop salespersons 10 7 8
Electro technology engineers 10 na na
Primary school and early childhood teachers 10 na na
Domestic hotel and office cleaners and helpers 10 na na
Waiters and bartenders 10 na na
35 3-digit vs 4-digit
There are advantages and disadvantages associated with using the more aggregated 3-
digit occupation classification as it was done in previous studies The bundling of
individual occupations into families provides greater visibility of shortages at a broad
skill level (eg all software related occupations)
However there are distinct disadvantages in using the 3-digit occupations and these
apply particularly to their practical usefulness to education and training providers In
many cases shortages identified at 3-digit level do not provide a reliable basis for
identifying the specific skill which is in shortage or surplus
By combining the analyses of the 4-digit and corresponding 3-digit classifications in this
report many examples are revealed of how an exclusive reliance on the 3-digit
classification could be seriously misleading Thus the findings in this report show that
within the 3-digit classification of lsquosheet and structural metal workers moulders and
weldersrsquo the 4-digit occupation which is in short supply is lsquoweldersrsquo and not for example
lsquosheet metal workersrsquo This is an important insight because in many European countries
the skills of welding and sheet metal work are provided through entirely different
vocational programmes8
There are many examples of this phenomenon in the 3-digit occupations in Table 35 For
example the analysis in this report shows that toolmakers are a shortage occupation
8 In Ireland for example sheet metal workers and welders undertake entirely different apprenticeships
Labour shortages and surpluses 2017
2018 25
Directorate-General for Employment Social Affairs and Inclusion European Network of Public Employment Services (PES)
but blacksmiths are not Furthermore the 3-digit classification disguises the extent of the
reported shortage Thus while the 3-digit occupation of professional nursing and
midwifery is shown in the current report as being shortage occupations a total of eleven
PES reported professional nursing as a shortage compared to only three PES reporting
professional midwifery as a shortage By bundling these occupations together the
significant difference in the relative severity of the shortage is not apparent
This phenomenon applies equally to the surplus occupations which were identified in this
report For example lsquochildcare workersrsquo were described as a surplus occupation by five
PES But in the 3-digit classification they are bundled together with lsquospecial needs
teachersrsquo which was not identified as a surplus occupation
36 Conclusions
There are a number of conclusions which can be drawn from the analyses in this chapter
Firstly the sources used by many of the PES to identify shortage occupations is one of
the main reasons why only eighteen PES provided data on surplus occupations Many of
the PES relied on the results of employer surveys forecasting models and immigration
data to identify shortages and these sources in general do not provide data on surplus
occupations However it was by no means the only reason why so many PES did not
provide data on surplus organisations and this issue will have to be addressed before the
commencement of the 2018 study In the future PES data should be augmented by data
collected by other bodies as outlined in the new EU Regulation
Secondly there is no obvious explanation for the geographic distribution of shortages
and surpluses In some cases countries with relatively small labour forces have a
relatively high number of shortage occupations while a strong apprenticeship system
does not appear to prevent a relatively high share of the identified shortages being in the
craft occupations It may be that the stipulation to only include twenty shortage and
surplus occupations has created a situation where some countries with a relatively large
labour force are artificially constrained to submit a much smaller number of shortage
occupations than they actually have
Thirdly there is a high degree of stability in relation to the occupations which were
identified as shortages in the 2015 2016 and 2017 editions of the Bottleneck report
Finally providing information on shortage and surplus occupations at 4-digit level is
much more useful from a policy perspective than providing the data at a more
aggregated level The results of the analyses at 4-digit level show which specific
occupations in the bundle of occupations used in the previous reports were in shortage
and which were not This is also true of the occupations which were identified as surplus
occupations A more aggregated group of occupations does not allow for the targeting of
specific individual occupations either for increasing training provision or for enhancing
cross border mobility Indeed as a number of specific examples show were providers of
vocational training or indeed policy makers to act on the basis of the 3-digit shortage and
surplus occupations identified in previous reports they could very well have assign
resources to occupations which were neither in shortage nor in surplus
Labour shortages and surpluses 2017
2018 26
Directorate-General for Employment Social Affairs and Inclusion European Network of Public Employment Services (PES)
4 THE CAUSES OF SKILL SHORTAGES AND POTENTIAL SOLUTIONS
41 Introduction
The focus of this chapter is on identifying the possible causes of skills shortages and
surpluses and exploring ways in which these imbalances may be resolved The chapter
begins with a review of the nature of skills and labour market imbalances and concludes
with an exploration of the extent to which enhanced cross-border mobility policies and
more equal gender representation could contribute to the alleviation of skills and labour
imbalances in certain shortage occupations in the EEA labour market
42 The role of skills and labour shortages in skills imbalances
One of the new questions included in the current study asks the PES to identify the
nature of the shortage (ie is it a skill shortage or a labour shortage) in relation to each
shortage occupation they identified It was explained in the questionnaire that labour
shortages occur when there are a sufficient number of appropriately qualified job-seekers
to fill the vacancies which arise but for a variety of reasons many of them do not wish
to work in the occupation in question Their response to this question is summarised in
Table 41 in respect of the twenty occupations which were reported by the most PES
A total of twenty-six PES classified their shortage occupations as skill or labour
shortages and they classified most of the occupations as skill shortages Indeed in the
case of seven occupations plumbers doctors software developers electricians
electronic engineers electronic engineering technicians bus and tram drivers and
mechanical engineers all of the reporting PES classified the shortage as a skills deficit
Each labour market within the EEA is regulated in a particular manner and conditions of
employment even within the same occupation vary throughout the region This is why
many occupations while classified by most of the PES as reflecting skill deficits
nevertheless are classified by some PES as labour shortages
However the number of PES involved is very small indeed Only in the case of three
occupations lsquowaitersrsquo lsquoshop sales assistantsrsquo and lsquoprimary school teachersrsquo are there
more PES classifying the shortage as a labour shortage then a skills deficit The first two
occupations are undoubtedly labour shortages This is because there are few if any
barriers to working in these occupations9
The inclusion of lsquoprimary school teachersrsquo as a labour shortage is however a surprise It
was identified by eight PES as a shortage occupation two of whom classified the
occupation as a shortage of high magnitude It would be necessary to conduct research
into the conditions of employment ndash including qualification criteria ndash within the countries
where the reporting PES are located to establish if this classification of the occupation as
a labour shortage is warranted
With some notable exceptions the response of the PES to classifying their shortage
occupations as skill or labour shortages demonstrates that the PES understand these
concepts Occupations such as professional nurses which are obviously suffering from a
shortage of qualified job-seekers in the EEA are overwhelmingly categorised as a skills
shortage while less skilled occupations such as cleaners are categorised as being on the
borderline between skills and labour shortages
9 Both occupations have relatively high ratios of unemployed to new hires (Annex 4)
Labour shortages and surpluses 2017
2018 27
Directorate-General for Employment Social Affairs and Inclusion European Network of Public Employment Services (PES)
Table 41 Skill and labour shortages
Occupation
Number of PES
reporting occupation
as skills shortage
Number of PES
reporting occupation as labour shortage
Number of PES
reporting occupations as skill and
labour shortage
Total number of
PES reporting on skillslabour
shortage
Cooks 9 1 0 10
Plumbers and pipe fitters 8 0 0 8
Generalist medical Practitioners 7 0 0 7
Heavy truck and lorry drivers 4 2 1 7
Metal workers machine tool setting and operators
3 3 1 7
Welders and flame cutters 4 2 1 7
Nursing professionals 5 1 0 6
Software developers 6 0 0 6
Systems analyst 5 1 0 6
Bricklayers and related trades 4 1 0 5
Building and related electricians 5 0 0 5
Butchers fishmongers and related food 3 2 0 5
Cleaners and helpers in offices 3 2 0 5
Commercial sales representatives 2 2 1 5
Electronic engineers 5 0 0 5
Manufacturing supervisors 4 1 0 5
Motor vehicle mechanics and repairers 3 1 1 5
Nursing associate professionals 4 1 0 5
Primary school teachers 2 3 0 5
Shop sales assistants 1 4 0 5
Waiters 2 3 0 5
Agriculture and industrial machinery repairers
3 1 0 4
Application programmers 3 1 0 4
Bus and tram drivers 4 0 0 4
Electronic engineering technicians 4 0 0 4
Health care assistants 3 1 0 4
Mechanical engineers 4 0 0 4
Sheet metal workers 3 1 0 4
Structural metal preparers and erectors 3 1 0 4
Total number of PES reporting 16 8 2 26
The atypical working hours associated with heavy goods vehicle driving is recognised by
two of the six PES who classify shortages in the occupation as labour shortages while the
unpleasant conditions associated with working in butchery shops and abattoirs is
reflected in the fact that two of the five PES who categorised the occupation as a
shortage occupation classify it as a labour shortage
43 Location of skill imbalances and cross border mobility
In recent years there has been considerable discussion on the potential role which
enhanced cross-border mobility could play in alleviating labour market imbalances The
attractiveness of such a policy is obvious The European Union is a very large
Labour shortages and surpluses 2017
2018 28
Directorate-General for Employment Social Affairs and Inclusion European Network of Public Employment Services (PES)
marketplace embracing a very large labour force if even some of the shortages which
are reported by EEA countries could be resolved by exploiting the surpluses which are
reported by other EEA countries it could form the basis of a number of win-win solutions
for both job-seekers and businesses
An additional attraction of this policy is that it could potentially successfully address both
skills and labour shortages as working conditions associated with some labour shortages
in one country might be perceived as significantly more attractive in a different EEA
country
Table 44 provides a list of the top twenty shortage occupations which have at least one
PES in another EEA country reporting the occupation as a surplus
There are a number of aspects of the Table which are notable Firstly the list of top
occupations has changed quite dramatically from the list in Table 21 specifically none
of the professional and associate professional occupations are now on the list including
the four professional and associate professional health-related occupations or the two
professional software occupations What the Table shows is that there are no surpluses
reported in any of the EEA countries of doctors or nurses software developers or
systems analysts While the occupation of healthcare assistants is in surplus in many
countries it was not included in the list of top occupations because it was reported as a
shortage by only two PES
The figures in Table 42 show that there are three cross-border matching possibilities in
the case of bricklayers and motor mechanics and two possibilities in the case of
plasterers health care assistants and secondary school teachers
There is just one matching possibility in respect of a wide range of occupations including
cooks truck drivers commercial sales representatives electricians carpenters civil
engineers primary school teachers manufacturing supervisors telecentre salespersons
childhood education teachers floor layers and roofers
The fact that primary school teachers have only one cross border matching possibility
suggest that the classification of the occupation as a labour shortage by three of five PES
is an error In general labour shortages would be expected to have more cross border
matching possibilities than skill shortages because there are many job-seekers eligible to
work in the occupation in question and working conditions vary quite significantly from
country to country Indeed it is notable that the two other occupations which were
classified by the PES as predominantly labour shortages waiters and shop sales
assistants have a relatively high number of matching possibilities eight in the case of
shop sales assistants and three in the case of waiters
In general the PES did not classify the same occupation as both a shortage and a
surplus A striking exception is the Danish PES which categorised four of its shortage
occupations as surplus occupations also This is most likely due to the higher level of
granularity available in the Danish data (below 4-digit) so that some job titles within an
occupation are considered labour shortage while others skill shortage
44 Assessing gender composition of surpluses
The PES were asked to estimate the share of females in the occupations which they
identified as lsquosurplusrsquo occupations The restricting of this question to surplus occupations
was to avoid giving the impression that shortages were arising because of discriminatory
recruitment policies
Labour shortages and surpluses 2017
2018 29
Directorate-General for Employment Social Affairs and Inclusion European Network of Public Employment Services (PES)
A total of 13 PES reported any data on gender composition of surpluses However the
quality of information submitted did not provide a sufficient basis for an accurate
estimation of the gender composition of surpluses in some of the cases
It is suggested that in order to address gender imbalances in relation to shortages and
surpluses data from PES on job seekers should be combined with the LSF data on
employment by occupation
45 Conclusions
The analysis in chapter four has produced a number of interesting findings The analysis
reveals that the PES in general has the capacity to distinguish between skill and labour
shortages and to identify shortage occupations which have some cross-border matching
possibilities
The relatively low number of surplus occupations reflects two factors firstly only
eighteen PES submitted a list of surplus occupations and secondly in many cases the
lists did not include the maximum number of twenty occupations which were requested
This response has to be viewed against the background of an EEA labour market where
employment is expanding and unemployment is contracting However while this is a
positive development the relatively low number of surplus occupations has placed a
significant limit on the extent to which there were cross-border possibilities of matching
shortage with surplus occupations
The data indicates that there is a limitation to the extent to which the PES can be used to
identify the gender imbalances (eg under-representation of females in some
occupations) and that other sources should be explored
Labour shortages and surpluses 2017
2018 30
Directorate-General for Employment Social Affairs and Inclusion European Network of Public Employment Services (PES)
Table 43 The potential for cross-border matching of shortage and surplus occupations
No PES
Occupation PES reporting shortage PES reporting surplus No PES
16 Cooks AT Art BG CY DK HR IE IS IT MT NL NO PT SE SI SK lsaquo―rsaquo HU 1
11 Truck drivers ART VDAB BG DK HR LT IT NL NO PT SE SI SK lsaquo―rsaquo DK 1
10 Cleaners helpers CY DK HR FI IS HU NL NO PT SI lsaquo―rsaquo DK LF NL IE 4
10 Commercial sales VDAB ART DK FI FR IT IE PT PL SI lsaquo―rsaquo DK 1
9 Sales assistants AT ART BG CY DK IT NO SI SK lsaquo―rsaquo DK LF SE NL BG CH FI IE 8
9 Bricklayers ART DE DK HR HU LT NL PT SI lsaquo―rsaquo CY HU IE 3
9 Motor mechanics AT VDAB ART LF DK IT NO PT SI lsaquo―rsaquo SK CH EE 3
9 Waiters ART BG CY IS IT MT NO PT SI lsaquo―rsaquo HU EE IE 3
9 Electricians ART VDAB DE DK IS IT NL NO SI lsaquo―rsaquo FR 1
8 Carpenters DK HR HU FI NL NO PT SI lsaquo―rsaquo HU 1
8 Civil engineers ART CH DE FI FR NO SE SI lsaquo―rsaquo CY 1
8 Primary teachers ART BG DK IS NO SE SI SK lsaquo―rsaquo CY 1
7 Healthcare assist CY DK EE NL NO SI SK lsaquo―rsaquo DK NL 2
7 Second teacher ART BG FR NL NO SI SK lsaquo―rsaquo CY FI 2
7 Man supervisors ART VDAB LF DE EE FR SK lsaquo―rsaquo BG 1
6 Plasterers HR HU FI LT NL SI lsaquo―rsaquo HU IE 2
6 Tele centre sales ART HU FI FR MT NO lsaquo―rsaquo EE 1
6 Childhood educ FI LT NO SE SI SK lsaquo―rsaquo CY 1
6 Floor layers HU HR FI FR LT LV lsaquo―rsaquo HU 1
6 Roofers HR FI FR LT LV SI lsaquo―rsaquo HU 1
Bottlenecks Occupations 2017
2017 31
Directorate-General for Employment Social Affairs and Inclusion European Network of Public Employment Services (PES)
5 CONCLUSIONS AND RECOMMENDATIONS
51 Conclusions
The terms of reference for this study emphasise the desirability of creating a process for
the systematic collection of data on surplus and shortage occupations in the EEA area
which could be effectively used by EURES for cross border matching of shortage
occupations in some EEA countries with surplus occupations in others
The authors have responded to this emphasis by using a process which ensures that the
data gathered on shortage and surplus occupations is comprehensive accurate and of
practical use to EURES and the providers of education and training programmes The
process is comprehensive because it gathers information both on the extent of shortages
and surpluses and on their relative severity It is accurate because the list of shortage
and surplus occupations are shown to be consistent with the estimated value of the ratio
of unemployed to new hires Finally the process provides information which is of
practical use to EURES and the national providers of VET because the data gathered is on
individual occupations rather than on lsquobundles of occupationsrsquo as in previous studies The
analyses in this report shows that while these bundles of occupations contain some
occupations which are identified by the PES as shortage and surplus occupations they
also contain occupations which are neither in shortage nor in surplus and it is impossible
to distinguish one from the other
The data gathering process used in this report however was not devoid of weaknesses
Fortunately these weaknesses reflect the modus operandi of the PES and may be
rectified by including other institutions and agencies in the process For example the PES
use the same sources for the identification of both shortage and surplus occupations
This may have advantages in terms of accuracy when those sources include employersrsquo
surveys immigration data and the results of forecasting exercises However these
sources are not suitable for gathering data on surplus occupations and they are the main
reason why the number of surplus occupations provided by the PES were almost half the
number requested In the future PES data could be augmented by data gathered by
other bodies as outlined in recent EU Regulation 2016589
In addition the response to the question on the capacity of the PES to deliver data on
shortage and surplus occupations at a regional level was also disappointing perhaps
reflecting a misalignment in some EEA countries between the geographic configuration of
the local PES network and the NUTs regions
The analysis highlighted that in order to assess gender imbalances of shortages and
surpluses PES data needs to be augmented by other sources
Finally despite the low number of surplus occupations submitted by the PES it was
nevertheless possible to identify twenty shortage occupations in the EEA labour market
which had at least one cross-border matching possibility and many more than one in the
case of some shortage occupations
52 Recommendations
Based on the findings from the three bottleneck studies undertaken to date a model for
the gathering of data on shortages and surpluses is proposed (Figure 51) The model
includes features of the methodology applied in this study which were successful It also
includes a number of features which should be introduced to the process in order to
address some of the weaknesses which were identified in this study (highlighted in red)
Labour shortages and surpluses 2017
2017 32
Directorate-General for Employment Social Affairs and Inclusion European Network of Public Employment Services (PES)
However before this methodology is implemented it would be prudent to discuss data
requirements with PES and invite a broader range of institutions and agencies to
participate in aspects of the data gathering process in addition to the PES EURES
Regulation (EU) 2016589 of the European Parliament and of the Council which obliges
the appropriate national authorities to furnish such data annually is fortuitous in this
regard and should facilitate the implementation of this recommendation
In addition the results of these and other relevant studies should be disseminated to
PES Eures coordination group and other relevant agencies and institutions in order to
emphasise the importance of data and analysis in informing policy at EU and national
level which aims to resolve labour market imbalances
Labour shortages and surpluses 2017
2017 33
Directorate-General for Employment Social Affairs and Inclusion European Network of Public Employment Services (PES)
Figure 51 Model for gathering data on shortage and surplus occupations
Sources of data on surpluses PES data from other relevant agencies
In those cases where the source used by the PES to identify shortage occupations cannot
be used to identify surplus occupations other institutions or other sources or both should be availed of to ensure that comprehensive data on surplus occupations are provided to the appropriate national authority
Dimensions of shortagessurpluses extent (number of reporting PES) and severity (high or low
magnitude)
Data should be systematically gathered on both the extent of shortage and surplus
occupations in the EEA and on their relative severity
Type of shortage skill vs labour shortages
The providers of the data on shortage occupations must also distinguish between skill and labour shortages because this distinction is necessary for the accurate identification of
shortage occupations and for the choice of the appropriate policy response to identified shortages
Classification of occupations used ISCO 08 4-digit codes (or translation into these codes)
All data should be either initially gathered in ISCO 08 4-digit codes or translated into these
codes This ensures that the data refers to specific individual occupations and is of practical use to EURES and the national providers of VET
Accuracy test cross-check with LSF data (ratio of unemployed to new hires)
The accuracy of the submitted lists of shortage and surplus occupations should be assessed
by comparing the most widely reported surplus and shortage occupations with the estimated values of the ratios of employed (by previous occupation) to new hires at the aggregated EU28 level These ratios should be based on an analysis of the most up-to date
Labour Force Survey (LFS) data
Gender balance assessment LFS data on employment at occupational level by gender PES job
seekers
The gender composition of shortage and surplus occupations should be based on the most
up to date analyses of LFS data on employment by gender and the PES job seeker data
Regional balance assessment LSF data data from relevant agencies
Where regional data is required other agencies and institutions should be requested to
provide the data in those cases where the data cannot be provided by the regional PES network because it is not geographically aligned to the NUTs regions
Labour shortages and surpluses 2017
2017 34
Directorate-General for Employment Social Affairs and Inclusion European Network of Public Employment Services (PES)
Number of occupations reporting should be extended beyond 20 occupations but with upper
limit (eg 50)
Consideration should be given to allowing the agencies responsible for identifying shortage
and surplus occupations a greater range of flexibility in terms of the numbers of occupations which should be identified A minimum to maximum range would be a more realistic approach as it would reflect the fact that the labour markets of the EEA vary significantly in size and performance
Timing of imbalance assessment September
It is proposed that the data gathering exercise should be brought forward to early September and that expert advice should be available on line throughout the data
gathering exercise
Labour shortages and surpluses 2017
2017 35
Directorate-General for Employment Social Affairs and Inclusion European Network of Public Employment Services (PES)
ANNEX 1 DATA COLLECTION TEMPLATE Information sought Explanation
Occupation title (text) Type in free text a list of occupations (one row one occupation) for which shortages and surpluses exist first list occupations for which there is a shortage the list should contain a maximum of 20 occupations if your list contains less than 20 occupations please provide a brief explanation in your email response for why the number is lower than 20 second list occupations for which there is a surplus the list should contain a maximum of 20 occupations if your list contains less than 20 occupations please provide a brief explanation in your email response for why the number is lower than 20
Shortagesurplus indicator For each occupation indicate if it refers to a shortage by typing in shortage or surplus by typing in surplus to identify surplus occupations you can examine for each occupation the ratio of the number of job seekers to the number of vacancies at the end of each year for example if there are 5000 shop assistants seeking employment and there are 200 vacancies at the end of the reference period the ratio is 251 you can rank the calculated ratios and report the occupations associated with the 20 highest ratios
Occupational classification used in your country
For each occupation indicate what occupational classification (if any) was used to identify this occupation for instance you can report a country specific classification ISCO ROME SOC etc If you donrsquot use occupational classifications type None
Occupation code to the lowest level of disaggregation (eg ISCO at 4 digits)
If you have indicated a classification used type the code for each occupation use the lowest level of disaggregation (eg 4 digit ISCO code) if you donrsquot use occupational classification leave black
ISCO-08 code at 4-digit level (or lower if 4-digit not available)
If you use occupational classification which is not ISCO-08 and if it is possible provide a translation of the national code to ISCO-08 code ISCO is the International Standard Classification of Occupations which is used to report to Eurostat code should be at 4 digits if this is not available than the lowest level of disaggregation that is available should be reported (3 digits if 4-digit code is not available 2 digits if neither 4-digit nor 3-digit code is available 1 digit if neither 4-digit 3-digit nor 2-digit code is available) if it is not possible to provide translation to ISCO-08 leave black if you have already reported ISCO-08 code in column 3 leave this column black
Estimate of shortagesurplus magnitude (high (gt3 of employment) medium (1-3 of employment) low (lt1 of employment))
For each occupation indicate a broad estimate of the magnitude of the shortagesurplus if you estimate that the shortagesurplus is less than 1 of the total employment in the occupation in question type low if between 1-3 type medium if greater than 3 type high if you cannot provide a rough estimate of magnitude type dont know
Current shortagesurplus (C) future short term (FST) future medium term (FMT) future long term (FLT) donrsquot know (indicate all that apply)
Against each occupation indicate if the identified shortagesurplus refers to present situation by typing C if the shortage is expected to occur in the short term future ie within 12 months by typing FST if it is expected to occur over the medium term (within 1-5 years) by typing FMT if it is expected to occur in the long term (in 5 or more years) by typing FLT if more than one time period applies indicate all relevant ones (eg for current shortagessurpluses that are expected to persist over the short term type C FST) if you dont know type dont know
Source of information on shortagessurpluses (eg PES administrative data (vacancies job seekers) PES survey third party survey Occupational forecasts other (specify) etc)
Indicate the source used to identify shortagesurplus for this occupation did you derive it from the PES administrative data on PES vacancies andor job seekers did you conduct a survey did you commission a third party to conduct a survey for you did you have occupational forecasts available did you use other research type in free text the full description of the source(s) eg National Employment Survey conducted by PES etc
Labour shortages and surpluses 2017
2017 36
Directorate-General for Employment Social Affairs and Inclusion European Network of Public Employment Services (PES)
Date for source of information Indicate the year that the information on shortagessurpluses (column 7) refers to eg type 2016 for a survey of difficult to fill vacancies conducted in 2016 even if the report was published in 2017
What indicator(s) suggested that there is a shortagesurplus
Indicate what criteria was used to conclude that this occupation is associated with a shortagesurplus for instance employers views sourcing from abroad to fill vacancies growth in employment faster than growth in educationtraining output time required to fill
vacancies higher than average etc
Share of females among job seekers in this occupation (surplus occupations only)
Indicate the percentage share of females among all job seekers in this occupation this is only applicable to surplus occupations
Skill or labour shortage Indicate if a shortage refers to a skill or labour shortage a skill shortage occurs where there is an insufficient supply of persons with the appropriate skills labour shortages occur where there is a sufficient number of skilled persons however an insufficient number of them is willing to take up employment in the occupation in question
Indicate the availability of data on shortagessurpluses at regional level (NUTS1 NUTS2 NUTS3 No data)
Indicate if data is available on the regional breakdown of shortagessurpluses by indicating the level of regional data available if multiple levels of regional disaggregation are available indicate the lowest level of disaggregation (eg NUTS3 rather than NUTS2) if there is no regional data available use no data
Labour shortages and surpluses 2017
2017 37
Directorate-General for Employment Social Affairs and Inclusion European Network of Public Employment Services (PES)
ANNEX 2 SHORTAGE OCCUPATIONS
Shortage occupation PES count
Cooks 16 Plumbers and pipe fitters 13 Generalist medical practitioners 12 Welders and flamecutters 12 Heavy truck and lorry drivers 11 Metal working machine tool setters and operators 11 Nursing professionals 11 Software developers 11 Agricultural and industrial machinery mechanics and repairers 10 Cleaners and helpers in offices hotels and other establishments 10 Commercial sales representatives 10 Specialist medical practitioners 10 Systems analysts 10 Bricklayers and related workers 9 Building and related electricians 9 Butchers fishmongers and related food preparers 9 Motor vehicle mechanics and repairers 9 Nursing associate professionals 9 Sheet-metal workers 9 Shop sales assistants 9 Waiters 9 Carpenters and joiners 8 Civil engineers 8 Concrete placers concrete finishers and related workers 8 Electrical engineering technicians 8 Electronics engineering technicians 8 Mechanical engineers 8 Primary school teachers 8 Structural-metal preparers and erectors 8 Electronics engineers 7
Health care assistants 7 Manufacturing supervisors 7 Mechanical engineering technicians 7 Secondary education teachers 7 Accountants 6 Applications programmers 6 Bus and tram drivers 6 Contact centre salespersons 6 Early childhood educators 6 Electrical mechanics and fitters 6 Floor layers and tile setters 6 Plasterers 6 Roofers 6 Sewing machine operators 6 Software and applications developers and analysts not elsewhere classified 6 Toolmakers and related workers 6 Web and multimedia developers 6 Air conditioning and refrigeration mechanics 5 Building frame and related trades workers not elsewhere classified 5 Chefs 5 Civil engineering labourers 5 Construction supervisors 5 Earthmoving and related plant operators 5 Electrical engineers 5 Electrical line installers and repairers 5 Engineering professionals not elsewhere classified 5 Hairdressers 5 Information and communications technology operations technicians 5 Manufacturing managers 5 Physiotherapists 5 Real estate agents and property managers 5 Research and development managers 5 Spray painters and varnishers 5 Accounting associate professionals 4 Bakers pastry-cooks and confectionery makers 4
Labour shortages and surpluses 2017
2017 38
Directorate-General for Employment Social Affairs and Inclusion European Network of Public Employment Services (PES)
Shortage occupation PES count
Blacksmiths hammersmiths and forging press workers 4 Civil engineering technicians 4 Crane hoist and related plant operators 4 Database designers and administrators 4 Industrial and production engineers 4 Painters and related workers 4 Physical and engineering science technicians not elsewhere classified 4 Plastic products machine operators 4 Social work and counselling professionals 4 Accounting and bookkeeping clerks 3 Administrative and executive secretaries 3 Ambulance workers 3 Building construction labourers 3 Car taxi and van drivers 3 Cartographers and surveyors 3 Cleaning and housekeeping supervisors in offices hotels and other establishments 3 Contact centre information clerks 3 Draughtspersons 3 Fast food preparers 3 Freight handlers 3 Gardeners horticultural and nursery growers 3 Home-based personal care workers 3 Hotel receptionists 3 Information and communications technology installers and servicers 3 Insulation workers 3 Kitchen helpers 3 Manufacturing labourers not elsewhere classified 3 Medical imaging and therapeutic equipment technicians 3 Metal moulders and coremakers 3 Metal polishers wheel grinders and tool sharpeners 3 Midwifery professionals 3 Other language teachers 3 Personal services workers not elsewhere classified 3
Pharmacists 3 Policy administration professionals 3 Printers 3 Process control technicians not elsewhere classified 3 Sales and marketing managers 3 Shop supervisors 3 Special needs teachers 3 Stock clerks 3 Supply distribution and related managers 3 Survey and market research interviewers 3 Systems administrators 3 Technical and medical sales professionals (excluding ICT) 3 Translators interpreters and other linguists 3 Transport clerks 3 Vocational education teachers 3 Advertising and marketing professionals 2 Audiologists and speech therapists 2 Bartenders 2 Beauticians and related workers 2 Cashiers and ticket clerks 2 Chemical engineers 2 Child care workers 2 Computer network and systems technicians 2 Computer network professionals 2 Construction managers 2 Craft and related workers not elsewhere classified 2 Credit and loans officers 2 Crop farm labourers 2 Database and network professionals not elsewhere classified 2 Dentists 2 Domestic cleaners and helpers 2 Door to door salespersons 2 Driving instructors 2 Electrical and electronic equipment assemblers 2 Electronics mechanics and servicers 2 Elementary workers not elsewhere classified 2 Employment agents and contractors 2
Labour shortages and surpluses 2017
2017 39
Directorate-General for Employment Social Affairs and Inclusion European Network of Public Employment Services (PES)
Shortage occupation PES count
Field crop and vegetable growers 2 Financial analysts 2 Financial and investment advisers 2 Forestry and related workers 2 Garbage and recycling collectors 2 General office clerks 2 Graphic and multimedia designers 2 Information and communications technology service managers 2 Insurance representatives 2 Locomotive engine drivers 2 Mail carriers and sorting clerks 2 Management and organization analysts 2 Mathematicians actuaries and statisticians 2 Mechanical machinery assemblers 2 Medical and dental prosthetic technicians 2 Medical assistants 2 Messengers package deliverers and luggage porters 2 Metal finishing plating and coating machine operators 2 Metal processing plant operators 2 Optometrists and ophthalmic opticians 2 Personal care workers in health services not elsewhere classified 2 Police officers 2 Policy and planning managers 2 Production clerks 2 Restaurant managers 2 Retail and wholesale trade managers 2 Sales workers not elsewhere classified 2 Sewing embroidery and related workers 2 Street food salespersons 2 Tailors dressmakers furriers and hatters 2 Telecommunications engineers 2 Advertising and public relations managers 1 Aged care services managers 1
Agricultural technicians 1 Aircraft engine mechanics and repairers 1 Aircraft pilots and related associate professionals 1 Assemblers not elsewhere classified 1 Authors and related writers 1 Bank tellers and related clerks 1 Bleaching dyeing and fabric cleaning machine operators 1 Bookmakers croupiers and related gaming workers 1 Business services agents not elsewhere classified 1 Buyers 1 Cabinet-makers and related workers 1 Cement stone and other mineral products machine operators 1 Chemical and physical science technicians 1 Chemical engineering technicians 1 Chemical processing plant controllers 1 Chemical products plant and machine operators 1 Chemists 1 Conference and event planners 1 Customs and border inspectors 1 Data entry clerks 1 Dental assistants and therapists 1 Dieticians and nutritionists 1 Dispensing opticians 1 Domestic housekeepers 1 Economists 1 Education methods specialists 1 Environmental and occupational health and hygiene professionals 1 Environmental and occupational health inspectors and associates 1 Fibre preparing spinning and winding machine operators 1 Finance managers 1 Financial and insurance services branch managers 1 Fire-fighters 1 Fitness and recreation instructors and program leaders 1 Food and beverage tasters and graders 1 Food and related products machine operators 1
Labour shortages and surpluses 2017
2017 40
Directorate-General for Employment Social Affairs and Inclusion European Network of Public Employment Services (PES)
Shortage occupation PES count
Food service counter attendants 1 Forestry labourers 1 Fruit vegetable and related preservers 1 Fur and leather preparing machine operators 1 Glass and ceramics plant operators 1 Hand launderers and pressers 1 Hand packers 1 Handicraft workers in textile leather and related materials 1 Health associate professionals not elsewhere classified 1 Health professionals not elsewhere classified 1 House builders 1 Human resource managers 1 Incinerator and water treatment plant operators 1 Information and communications technology user support technicians 1 Judges 1 Lawyers 1 Legal and related associate professionals 1 Legal professionals not elsewhere classified 1 Library clerks 1 Lifting truck operators 1 Livestock and dairy producers 1 Livestock farm labourers 1 Medical and pathology laboratory technicians 1 Medical secretaries 1 Metal production process controllers 1 Mining and quarrying labourers 1 Mining engineers metallurgists and related professionals 1 Mixed crop and animal producers 1 Mixed crop growers 1 Motorcycle drivers 1 Odd job persons 1 Other cleaning workers 1 Other music teachers 1
Paper products machine operators 1 Personnel and careers professionals 1 Personnel clerks 1 Pet groomers and animal care workers 1 Physicists and astronomers 1 Physiotherapy technicians and assistants 1 Potters and related workers 1 Power production plant operators 1 Prison guards 1 Product and garment designers 1 Psychologists 1 Pulp and papermaking plant operators 1 Railway brake signal and switch operators 1 Receptionists (general) 1 Refuse sorters 1 Riggers and cable splicers 1 Scribes and related workers 1 Secretaries (general) 1 Securities and finance dealers and brokers 1 Security guards 1 Senior government officials 1 Senior officials of special-interest organizations 1 Shelf fillers 1 Ships engineers 1 Shoemaking and related machine operators 1 Social work associate professionals 1 Stall and market salespersons 1 Stationary plant and machine operators not elsewhere classified 1 Stonemasons stone cutters splitters and carvers 1 Street and related service workers 1 Sweepers and related labourers 1 Teaching professionals not elsewhere classified 1 Telecommunications engineering technicians 1 Textile fur and leather products machine operators not elsewhere classified 1 Trade brokers 1 Travel attendants and travel stewards 1 Travel guides 1
Labour shortages and surpluses 2017
2017 41
Directorate-General for Employment Social Affairs and Inclusion European Network of Public Employment Services (PES)
Shortage occupation PES count
Tree and shrub crop growers 1 Underwater divers 1 University and higher education teachers 1 Vehicle cleaners 1 Veterinarians 1 Weaving and knitting machine operators 1 Web technicians 1 Wood processing plant operators 1 Woodworking-machine tool setters and operators 1
Labour shortages and surpluses 2017
2017 42
Directorate-General for Employment Social Affairs and Inclusion European Network of Public Employment Services (PES)
ANNEX 3 SURPLUS OCCUPATIONS
Surplus occupation PES count
General office clerks 8 Shop sales assistants 8 Advertising and marketing professionals 6 Bank tellers and related clerks 6 Sociologists anthropologists and related professionals 6 Child care workers 5 Hairdressers 5 Journalists 5 Cashiers and ticket clerks 4 Cleaners and helpers in offices hotels and other establishments 4 Hand packers 4 Mail carriers and sorting clerks 4 Photographers 4 Receptionists (general) 4 Tailors dressmakers furriers and hatters 4 Accounting and bookkeeping clerks 3 Administrative and executive secretaries 3 Beauticians and related workers 3 Biologists botanists zoologists and related professionals 3 Bricklayers and related workers 3 Broadcasting and audio-visual technicians 3 Civil engineering labourers 3 Economists 3 Gardeners horticultural and nursery growers 3 Interior designers and decorators 3 Kitchen helpers 3 Legal professionals not elsewhere classified 3 Manufacturing labourers not elsewhere classified 3 Motor vehicle mechanics and repairers 3
Musicians singers and composers 3 Other artistic and cultural associate professionals 3 Painters and related workers 3 Philosophers historians and political scientists 3 Security guards 3 Sweepers and related labourers 3 Travel consultants and clerks 3 Waiters 3 Actors 2 Archivists and curators 2 Bakers pastry-cooks and confectionery makers 2 Bartenders 2 Building construction labourers 2 Business services and administration managers not elsewhere classified 2 Cabinet-makers and related workers 2 Car taxi and van drivers 2 Chemists 2 Cleaning and housekeeping supervisors in offices hotels and other establishments 2 Credit and loans officers 2 Customs and border inspectors 2 Elementary workers not elsewhere classified 2 Film stage and related directors and producers 2 Financial analysts 2 Forestry and related workers 2 Freight handlers 2 Graphic and multimedia designers 2 Health care assistants 2 Hotel receptionists 2 Lawyers 2 Legal and related associate professionals 2 Library clerks 2 Livestock and dairy producers 2 Management and organization analysts 2 Messengers package deliverers and luggage porters 2 Odd job persons 2 Office supervisors 2 Plasterers 2
Labour shortages and surpluses 2017
2017 43
Directorate-General for Employment Social Affairs and Inclusion European Network of Public Employment Services (PES)
Surplus occupation PES count
Police officers 2 Pre-press technicians 2 Print finishing and binding workers 2 Printers 2 Prison guards 2 Product and garment designers 2 Psychologists 2 Public relations professionals 2 Religious professionals 2 Secondary education teachers 2 Secretaries (general) 2 Social work and counselling professionals 2 Stall and market salespersons 2 Stock clerks 2 Teachers aides 2 Telephone switchboard operators 2 Travel guides 2 Visual artists 2 Advertising and public relations managers 1 Agricultural technicians 1 Announcers on radio television and other media 1 Assemblers not elsewhere classified 1 Building and related electricians 1 Building architects 1 Building caretakers 1 Building frame and related trades workers not elsewhere classified 1 Business services agents not elsewhere classified 1 Buyers 1 Carpenters and joiners 1 Chemical engineers 1 Civil engineers 1 Clearing and forwarding agents 1 Clerical support workers not elsewhere classified 1
Commercial sales representatives 1 Conference and event planners 1 Contact centre information clerks 1 Contact centre salespersons 1 Cooks 1 Crane hoist and related plant operators 1 Creative and performing artists not elsewhere classified 1 Dancers and choreographers 1 Data entry clerks 1 Database designers and administrators 1 Domestic cleaners and helpers 1 Domestic housekeepers 1 Draughtspersons 1 Driving instructors 1 Early childhood educators 1 Electronics mechanics and servicers 1 Farming forestry and fisheries advisers 1 Fashion and other models 1 Fast food preparers 1 Field crop and vegetable growers 1 Filing and copying clerks 1 Finance managers 1 Financial and insurance services branch managers 1 Financial and investment advisers 1 Fire-fighters 1 Fitness and recreation instructors and program leaders 1 Floor layers and tile setters 1 Food service counter attendants 1 Fruit vegetable and related preservers 1 Gallery museum and library technicians 1 Garbage and recycling collectors 1 Garment and related pattern-makers and cutters 1 Glass and ceramics plant operators 1 Government tax and excise officials 1 Hand launderers and pressers 1
Labour shortages and surpluses 2017
2017 44
Directorate-General for Employment Social Affairs and Inclusion European Network of Public Employment Services (PES)
Surplus occupation PES count
Heavy truck and lorry drivers 1 House builders 1 Hunters and trappers 1 Information and communications technology installers and servicers 1 Information and communications technology user support technicians 1 Insurance representatives 1 Jewellery and precious-metal workers 1 Judges 1 Legal secretaries 1 Librarians and related information professionals 1 Life science technicians (excluding medical) 1 Lifting truck operators 1 Managing directors and chief executives 1 Manufacturing supervisors 1 Medical and dental prosthetic technicians 1 Metal moulders and coremakers 1 Mining and quarrying labourers 1 Mixed crop and animal producers 1 Mixed crop growers 1 Mobile farm and forestry plant operators 1 Musical instrument makers and tuners 1 Other language teachers 1 Pawnbrokers and money-lenders 1 Personnel and careers professionals 1 Pet groomers and animal care workers 1 Photographic products machine operators 1 Physical and engineering science technicians not elsewhere classified 1 Physicists and astronomers 1 Police inspectors and detectives 1 Precision-instrument makers and repairers 1 Primary school teachers 1 Process control technicians not elsewhere classified 1 Product graders and testers (excluding foods and beverages) 1
Production clerks 1 Professional services managers not elsewhere classified 1 Protective services workers not elsewhere classified 1 Research and development managers 1 Retail and wholesale trade managers 1 Roofers 1 Sales workers not elsewhere classified 1 Senior government officials 1 Service station attendants 1 Shelf fillers 1 Shop supervisors 1 Social work associate professionals 1 Special needs teachers 1 Spray painters and varnishers 1 Statistical mathematical and related associate professionals 1 Stonemasons stone cutters splitters and carvers 1 Street food salespersons 1 Supply distribution and related managers 1 Teaching professionals not elsewhere classified 1 Technical and medical sales professionals (excluding ICT) 1 Training and staff development professionals 1 Translators interpreters and other linguists 1 Transport conductors 1 Tree and shrub crop growers 1 Typists and word processing operators 1 Undertakers and embalmers 1 Vocational education teachers 1 Weaving and knitting machine operators 1 Woodworking-machine tool setters and operators 1
Labour shortages and surpluses 2017
2017 45
Directorate-General for Employment Social Affairs and Inclusion European Network of Public Employment Services (PES)
ANNEX 4 THE RATIO OF UNEMPLOYED TO NEW HIRES
ISCO-08 title
2015
UE
Recruited in the
last year (lt12
months)
Ratio of UE to new recruits
Street and related service workers 85 104 08 Agricultural forestry and fishery labourers 3913 5343 07 Mining and construction labourers 1937 3525 05 Creative and performing artists 610 1115 05 Refuse workers 1036 1923 05 Painters building structure cleaners and related trades workers 1116 2117 05 Street and market salespersons 195 389 05 Building frame and related trades workers 3632 7353 05 Mining manufacturing and construction supervisors 626 1315 05 Ships deck crews and related workers 53 114 05 Market gardeners and crop growers 1471 3207 05 Managing directors and chief executives 304 667 05 Travel attendants conductors and guides 229 538 04 Wood treaters cabinet-makers and related trades workers 491 1159 04 Manufacturing labourers 1640 3909 04 Domestic hotel and office cleaners and helpers 5679 13545 04 Other stationary plant and machine operators 822 1961 04 Mobile plant operators 1038 2497 04 Building finishers and related trades workers 1519 3680 04 Textile fur and leather products machine operators 431 1048 04 Garment and related trades workers 422 1047 04 Chemical and photographic products plant and machine operators 157 389 04 Food processing and related trades workers 930 2330 04 Vehicle window laundry and other hand cleaning workers 291 754 04 Sheet and structural metal workers moulders and welders and related workers
996 2603 04
Waiters and bartenders 4399 11595 04 Cooks 1529 4039 04 Metal processing and finishing plant operators 208 557 04 Printing trades workers 203 548 04 Forestry and related workers 130 351 04 Protective services workers 1347 3658 04 Transport and storage labourers 2532 6939 04 Fishery workers hunters and trappers 46 128 04 Material-recording and transport clerks 1671 4630 04 Process control technicians 179 517 03 Mining and mineral processing plant operators 94 274 03 Telecommunications and broadcasting technicians 177 519 03 Blacksmiths toolmakers and related trades workers 816 2409 03 Building and housekeeping supervisors 678 2045 03
Secretaries (general) 1072 3259 03 Assemblers 850 2586 03 Other craft and related workers 258 810 03 Shop salespersons 6600 21042 03 Electrical equipment installers and repairers 958 3060 03 Food and related products machine operators 437 1400 03 Other sales workers 1087 3510 03 Food preparation assistants 1646 5337 03 Mixed crop and animal producers 387 1260 03 Car van and motorcycle drivers 1155 3764 03 Client information workers 1993 6531 03 Sports and fitness workers 605 1984 03 Handicraft workers 194 638 03 Life science technicians and related associate professionals 82 271 03 Keyboard operators 283 940 03 Electronics and telecommunications installers and repairers 290 963 03 Other personal services workers 313 1047 03 Vocational education teachers 279 940 03 Other teaching professionals 744 2518 03 General office clerks 966 3272 03 Authors journalists and linguists 335 1135 03 Hairdressers beauticians and related workers 806 2796 03
Labour shortages and surpluses 2017
2017 46
Directorate-General for Employment Social Affairs and Inclusion European Network of Public Employment Services (PES)
ISCO-08 title
2015
UE
Recruited in the
last year (lt12
months)
Ratio of UE to new recruits
Animal producers 189 660 03 Other elementary workers 976 3401 03 Machinery mechanics and repairers 1134 3962 03 Ship and aircraft controllers and technicians 80 281 03 Hotel and restaurant managers 344 1220 03 Cashiers and ticket clerks 908 3220 03 Retail and wholesale trade managers 224 809 03 Sales marketing and development managers 311 1124 03 Physical and engineering science technicians 1204 4366 03 Administrative and specialised secretaries 1106 4040 03 Sales and purchasing agents and brokers 1294 4754 03 Rubber plastic and paper products machine operators 256 941 03 Artistic cultural and culinary associate professionals 511 1906 03 Numerical clerks 944 3532 03 Other services managers 184 691 03 Child care workers and teachers aides 1335 5005 03 Heavy truck and bus drivers 1426 5349 03 Business services and administration managers 383 1439 03 Information and communications technology service managers 67 257 03 Regulatory government associate professionals 209 807 03 Life science professionals 176 681 03 Wood processing and papermaking plant operators 97 379 03 Locomotive engine drivers and related workers 46 179 03 Legal professionals 315 1245 03 Personal care workers in health services 2195 8787 02 Physical and earth science professionals 85 345 02 Street vendors (excluding food) 50 204 02 Architects planners surveyors and designers 515 2092 02 Other clerical support workers 901 3657 02 Business services agents 510 2114 02 Manufacturing mining construction and distribution managers 361 1507 02 Tellers money collectors and related clerks 381 1612 02 Librarians archivists and curators 58 248 02 Medical and pharmaceutical technicians 255 1099 02 University and higher education teachers 301 1333 02 Information and communications technology operations and user support technicians
418 1888 02
Legal social and religious associate professionals 920 4348 02 Financial and mathematical associate professionals 601 2852 02 Sales marketing and public relations professionals 865 4172 02 Finance professionals 472 2281 02 Engineering professionals (excluding electrotechnology) 635 3118 02 Other health associate professionals 531 2657 02
Social and religious professionals 460 2317 02 Professional services managers 176 891 02 Nursing and midwifery associate professionals 556 2855 02 Legislators and senior officials 53 286 02 Database and network professionals 83 455 02 Administration professionals 641 3673 02 Primary school and early childhood teachers 575 3345 02 Electrotechnology engineers 142 827 02 Secondary education teachers 471 2812 02 Other health professionals 346 2083 02 Nursing and midwifery professionals 273 1760 02 Software and applications developers and analysts 631 4159 02 Medical doctors 293 1944 02 No occupation 152894 00
No answer 2531 578 44 Total 249561 294937 08
Labour shortages and surpluses 2017
2017 47
Directorate-General for Employment Social Affairs and Inclusion European Network of Public Employment Services (PES)
HOW TO OBTAIN EU PUBLICATIONS
Free publications
bull one copy
via EU Bookshop (httpbookshopeuropaeu)
bull more than one copy or postersmaps
from the European Unionrsquos representations (httpeceuropaeurepresent_enhtm)
from the delegations in non-EU countries
(httpeeaseuropaeudelegationsindex_enhtm)
by contacting the Europe Direct service (httpeuropaeueuropedirectindex_enhtm)
or calling 00 800 6 7 8 9 10 11 (free phone number from anywhere in the EU) () () The information given is free as are most calls (though some operators phone boxes or hotels may charge you)
Priced publications
bull via EU Bookshop (httpbookshopeuropaeu)
Priced subscriptions
bull via one of the sales agents of the Publications Office of the European Union
(httppublicationseuropaeuothersagentsindex_enhtm)
doi 10276731262
KE-0
1-1
8-2
63-E
N-N
[Ca
talo
gu
e n
um
be
r]
Labour shortages and surpluses 2017
2018 10
Directorate-General for Employment Social Affairs and Inclusion European Network of Public Employment Services (PES)
reported (ie reported by the most PES) shortage and surplus occupations and the
occupations with the most severe shortages and surpluses
Owing to limitations of space however only lists of between twenty to thirty individual
occupations could be displayed here However it should be noted that almost one
thousand shortage occupations were reported by the twenty-eight PES of which 282 were
different occupations The number of surplus occupations reported by eighteen PES were
381 of which 196 were different occupations3
An attempt is made to evaluate the accuracy of the PES identification of shortage and
surplus occupations by comparing the most widely reported shortages and surpluses with
the ratio of unemployed to new hires at EU level
13 Exploring the causes of shortages
This study differs in several respects from the two previous studies Firstly this study
attempts to identify the causes of shortage and surplus occupations Accordingly a
number of new questions were added to the questionnaire specifically on the nature of
the shortage (ie was it due to a skills deficit or to a shortage of labour) and ndash in the
case of surplus occupations - the gender composition While many of the PES provided a
classification of shortages in terms of labour versus skills shortage the response to the
question on gender share was disappointing
The data collection template (Annex 1) also inquired of the extent to which the PES could
provide the data at regional level The purpose of including this question was to assess
the feasibility of undertaken a future edition of this study at regional rather than national
level Unfortunately the response to this question was also disappointing
Despite the rather disappointing response to some of the new questions the study does
provide a wealth of data on shortage and surplus occupations The vast majority of PES
provided roughly twenty specific occupations which they considered to be in short supply
and rated the degree of severity of the shortage A number of PES provided a
significantly greater number than twenty shortage occupations
The existence of the previous two studies provided the basis for an assessment of the
extent to which the shortages persisted over time The fact that data on the shortages
and surplus occupations in the previous studies was at a higher level of aggregation (ie
the 3-digit occupation codes) also allowed an assessment to be made of the level of
aggregation which is required to accurately identify shortage and surplus occupations
The analysis herein conclusively demonstrated that the highest level of disaggregation
was required (ie the 4-digit occupation codes) for accurate identification as the 3-digit
codes contained occupations which were not in shortage or surplus (see chapter 3
below)
The analysis also explores the extent to which the same occupations are classified as
shortages in some countries and surpluses in others thereby creating the possibility that
policies designed to enhance cross-border matching between such occupations might
alleviate some skill and labour market imbalances in the EEA group of countries
3 A list of the occupations is shown in annexes two and three attached
Labour shortages and surpluses 2017
2018 11
Directorate-General for Employment Social Affairs and Inclusion European Network of Public Employment Services (PES)
2 PROFILE OF SHORTAGE AND SURPLUS OCCUPATIONS IN 2017
21 Introduction
This chapter contains a detailed analysis of the data on shortage and surplus
occupations The data is analysed from a number of perspectives such as the most
frequently reported shortages and surpluses and their relative magnitude The PES were
requested to identify a minimum of twenty shortage occupations and twenty surplus
occupations However while twenty-eight PES identified at least roughly twenty shortage
occupations only eighteen PES identified any surplus occupations
22 Profile of the most extensive shortage occupations
Table 21 shows the shortage occupations reported by the most PES in 2017 The
twenty-eight PES who submitted data on shortage occupations is two more than in the
2016 report and five more than the number that submitted such data in 2015
The Table shows that over half of all PES (sixteen) reported shortages of cooks making
lsquocooksrsquo the occupation reported by the most PES However this figure underestimates
the seriousness of the shortage of persons qualified in cooking skills because five PES
also reported shortages of chefs and four PES reported shortages of bakers and pastry-
makers
Within the top twenty-one shortage occupations the health related occupations
dominated the list with four different occupations these were lsquogeneralist medical
practitionersrsquo lsquonursing professionalsrsquo lsquospecialist medical practitionersrsquo and lsquoassociate
professional nursesrsquo The difference between professional and associate professional
nurses may reflect the fact that nursing qualifications differ across the EEA area
specifically nurses in some countries require a degree to practice in other countries
nursing is at sub-degree level
Table 21 Top 21 shortage occupations (4-digit level)
Occupation
Number of PES reporting occupation as shortage
Occupation
Number of PES reporting occupation as shortage
Cooks 16 Systems analyst 10
Plumbers and pipe fitters 13 Cleaners and helpers in offices hotels etc
10
Generalist medical practitioners 13 Bricklayers and related workers 9
Welders and flame cutters 12 Building and related electricians 9
Heavy truck and lorry drivers 11 Butchers fishmongers and related food
9
Metal workers machine tool setting and operators
11 Motor vehicle mechanics and repairers
9
Nursing professionals 11 Nursing associate professionals 9
Software developers 11 Sheet-metal workers 9
Agriculture and industrial machinery repairers
10 Shop sales assistants 9
Commercial sales representatives 10 Waiters 9
Specialist medical practitioners 10
Labour shortages and surpluses 2017
2018 12
Directorate-General for Employment Social Affairs and Inclusion European Network of Public Employment Services (PES)
There may be an argument therefore for combining the associate and professional
category when assessing the true extent of the shortage of nurses This argument is
particularly compelling in respect of those PES who report a shortage of associate
professional nurses but not a shortage of professional nurses There are four such PES
Denmark Estonia Luxemburg and Slovenia If associate professional nurses are
essentially doing the same job as professional nurses in these countries the number of
PES reporting a shortage of professional nurses is in effect fifteen rather than eleven
Indeed confining the shortage occupations to those reported by nine or more PES may
disguise the true extent of shortages in health related occupations There were many
health related occupations which were identified by less than nine PES as shortage
occupations For example seven PES reported shortages of lsquohealthcare assistantsrsquo five
reported shortages of lsquophysiotherapistsrsquo and three reported shortages of lsquomidwivesrsquo Both
Germany and France reported many shortages of specialists within the lsquonursersquo and lsquoother
healthcare professionalsrsquo categories
Shortages of both lsquosoftware developersrsquo and lsquosystems analystsrsquo appear to be quite
widespread as these occupations were reported as being in shortage by ten and eleven
PES respectively The impression of widespread shortages is supported by the fact that a
number of software-related occupations such as lsquoapplication programmersrsquo lsquoother
software and application developersrsquo and lsquoweb and multi-media developersrsquo were all
reported as shortage occupations by six PES
The main building related crafts such as lsquoelectriciansrsquo lsquoplumbersrsquo and lsquobricklayersrsquo were
also prominent in the list Indeed only the occupation of lsquocookrsquo was reported as a
shortage occupation by more PES than lsquoplumbersrsquo
In addition eight PES reported experiencing shortages of lsquoconcrete finishersrsquo and
lsquocarpenters and joinersrsquo while six PES reported shortages of lsquoroofersrsquo and lsquoplasterersrsquo
But it is the engineering occupations which demonstrate that shortages may be quite
pervasive in a group of occupations despite the fact that they are not included in the list
of specific occupations which were reported by the most PES Thus lsquocivil engineersrsquo
lsquomechanical engineersrsquo and both electrical and electronic engineering technicians just
missed inclusion in Table 21 above as they were all reported as shortage occupations by
eight PES In addition both lsquoelectronic engineersrsquo and lsquomechanical engineering
techniciansrsquo were reported as shortage occupations by seven PES
The teaching professions also just missed inclusion in Table 21 because primary school
teachers were reported as a shortage occupation by eight PES and secondary school
teachers by seven PES
Two occupations which feature in surveys on skill shortages and which are not included in
Table 21 are lsquoaccountantsrsquo and lsquotoolmakersrsquo Both occupations were reported as shortage
occupations by six PES
The total list of occupations which were identified by at least one PES as a shortage
occupation is shown in Annex 2 of this report
23 Profile of high magnitude shortages
In addition to identifying shortage occupations the PES were also asked to rank the
occupations in terms of the severity of the shortage Table 22 below lists those
occupations for which the PES identified shortages of high magnitude
The number of PES who identify occupations which have shortages of high magnitude will
be lower than the number of PES who identify occupations which have shortages
irrespective of the magnitude of those shortages As shown in Table 21 the list of the
top twenty-one shortage occupations have been identified by at least nine different PES
Labour shortages and surpluses 2017
2018 13
Directorate-General for Employment Social Affairs and Inclusion European Network of Public Employment Services (PES)
In contrast the list of occupations which have been identified by the PES as having
shortages of a high magnitude includes occupations which have been identified by as few
as two PES Therefore occupations which have not been included in the twenty one
shortage occupations identified by the most PES may qualify for inclusion in the list of
occupations with shortages of high magnitude
Table 22 High magnitude shortages (4-digit level)
Occupation Number of PES stating high magnitude of shortage
Occupation Number of PES stating high magnitude of shortage
Cooks 6 Cleaners and helpers in offices 2
Systems analysts 6 Contact centre sales persons 2
Concrete placers and concrete finishers
4 Database designers and administrators
2
Plumbers and pipe fitters 4 Heavy truck and lorry drivers 2
Shops sales assistants 4 Metal working machine tool setters 2
Waiters 4 Primary school teachers 2
Welders and flame cutters 4 Secondary school teachers 2
Nursing professionals 3 Other software and application developers
2
Application programmers 3 Software developers 2
Carpenters and joiners 3
Thus while lsquocooksrsquo retain the top ranking there are eight occupations in the list of
shortage occupations of high magnitude which are not included in the general list of
shortage occupations in Table 21 These include two lsquoteacherrsquo occupations and three new
lsquosoftwarersquo related occupations The two software occupations on the general list of
shortages in Table 21 are also included in this Table which means that five software
related occupations are considered to have shortages of high magnitude The position of
lsquosystems analystrsquo is particularly noteworthy A total of ten of twenty eight PES classify
this occupation as a shortage and six of these PES consider the shortage to be of a high
magnitude Thus shortages in this occupation appear to be both relatively widespread
and quite severe
The other finding of interest is that there are a considerable number of craft occupations
which are classified by a number of PES as shortages of high magnitude Thus four PES
rate lsquoplumbers and pipe fittersrsquo lsquoconcrete placersrsquo and lsquoweldersrsquo as shortages of high
magnitude while three PES also maintain that there are serious shortages of carpenters
24 Occupational groups by shortage magnitude
Figure 21 below shows how the PES classified shortages by broad occupational level in
terms of the severity of the shortage The figure shows that the professional shortage
occupations were classified by the most PES as high magnitude followed by the lsquocraft
and related trade workersrsquo Less than ten PES classified any other occupation as a
shortage of high magnitude but interestingly - while only four PES classified skilled
agricultural workers as a shortage - all of them ranked the shortage as being of high
magnitude Similarly while only seven PES categorised any of the clerical-related
occupations as a shortage five of the seven PES classified at least one of these
occupations as a shortage of high magnitude
Labour shortages and surpluses 2017
2018 14
Directorate-General for Employment Social Affairs and Inclusion European Network of Public Employment Services (PES)
Figure 21 Shortages by estimated shortage magnitude (1-digit level)
25 Profile of the most extensive surplus occupations
The PES were also requested to identify occupations for which there was an excess
supply and eighteen PES did so The surplus occupations identified by at least four
different PES are shown in Table 23
Intuitively one might expect that an excess supply of jobseekers is more likely to occur
in the case of occupations where the entry requirements are not associated with a high
level of qualifications or technical skills
Table 23 Surplus occupations (4-digit level)
Occupation Number of PES reporting this occupation as surplus
Occupation Number of PES reporting this occupation as surplus
Shop sales assistants 8 Tailors dressmakers furriers hat makers
4
General office clerks 8 Cashiers and ticket sales 4
Advertising and marketing professionals
6 Cleaners and helpers in offices hotels
4
Bank tellers and related clerks 6 Hand packers 4
Sociologists anthropologists and religious
6 Mail carriers and sorting clerks 4
Child care workers 5 Photographer 4
Hairdressers 5 Receptionist (general) 4
Journalists 5
In general this is the case as the occupations of lsquoshop sales assistantsrsquo lsquogeneral office
clerksrsquo lsquobank tellers and related clerksrsquo lsquocashiers and ticket salesrsquo lsquocleaners and helpersrsquo
0 5 10 15 20 25 30
Armed forces occupations
Managers
Skilled agricultural forestry and fishery workers
Clerical support workers
Elementary occupations
Plant and machine operators and assemblers
Technicians and associate professionals
Service and sales workers
Craft and related trades workers
Professionals
High Medium Low
Labour shortages and surpluses 2017
2018 15
Directorate-General for Employment Social Affairs and Inclusion European Network of Public Employment Services (PES)
lsquohand packersrsquo lsquomail carriers and sorting clerksrsquo and lsquoreceptionistsrsquo would not generally
require a high formal level of qualification
However four of the fifteen occupations lsquoadvertising and marketing professionalsrsquo
lsquosociologists and anthropologistsrsquo lsquojournalistsrsquo and lsquophotographersrsquo are professional
occupations Furthermore there are many professional and associate professional
occupations which are not included in the list of surplus occupations reported by the most
PES because they were reported by three or fewer PES These occupations include
lsquophilosophers historians and political scientistsrsquo lsquomusicians singers and composersrsquo
lsquoeconomistsrsquo lsquoother legal professionalsrsquo lsquointerior decoratorsrsquo and lsquoother artists and
associate cultural workersrsquo A list of the surplus occupations which were reported by at
least one PES is shown in Annex 3 of this report
In theory the fact that both the list of shortage occupations and the list of surplus
occupations contain many professional and associate professional occupations should
give rise to many cross-border matching possibilities However this is not the case
because virtually none of the professional or associate professional occupations appear
on both lists In general the professional and associate professional occupations
identified as being in surplus by the PES reflect disciplines in the humanities or the
creative arts In sharp contrast the professional and associate professional occupations
identified as shortage occupations by the PES are technical in nature and are dominated
by software and health related occupations
There is no doubt that many of the occupations identified by the PES as surplus
occupations are attractive to young people This is particularly so of occupations
associated with the creative arts But the analysis of PES data on shortages and
surpluses in this report would suggest that at least some of these occupations are
associated with limited career possibilities and that occupations of a technical nature
have superior career prospects
There are however two occupations lsquoshop sales assistantsrsquo and lsquocleaners and helpersrsquo
who appear in both the lists of shortages and surplus occupations and there are clearly
matching possibilities in these cases However the matching possibilities are not limited
to these two occupations there are many surplus occupations which have been identified
by less than four PES which have also been classified as shortage occupations by other
PES These cross-border matching possibilities are explored in chapter four
26 Profile of high magnitude surpluses
Only seven of the fifteen occupations listed as surplus occupations in Table 23 are not
classified as surpluses of high magnitude in Table 24 The list includes two more
professional occupations lsquobiologists botanists and zoologistsrsquo and lsquomanagement and
organisation analystsrsquo Both lsquojournalistsrsquo and lsquoadvertising and marketing professionalsrsquo
which are included in the list of surplus occupations reported by the most PES are also on
the list of occupations with high magnitude surpluses
One of the occupations which is new to the list is lsquobricklayers and related workersrsquo As
this occupation was also identified as a shortage occupation by nine PES its inclusion
does give rise to some cross-border matching possibilities
Labour shortages and surpluses 2017
2018 16
Directorate-General for Employment Social Affairs and Inclusion European Network of Public Employment Services (PES)
Table 24 High magnitude surplus occupations (4-digit level)
Occupation
Number of PES stating high magnitude of surplus
Occupation
Number of PES stating high magnitude of surplus
General office clerks 4 Journalists 2
Advertising and marketing professionals 3 Management and organisation analysts
2
Receptionist (general) 3 Manufacturing labourers 2
Shop sales assistants 3 Odd job persons 2
Biologists botanists zoologists and related
2 Photographers 2
Bricklayers and related workers 2 Bank tellers and related clerks 2
Child care workers 2 Security guards 2
Cleaners and housekeepers supervisors 2 Travel guides 2
Gardiners horticulturalists and nursery workers
2
27 Broad occupational groups by surplus magnitude
As in the case of shortages the professional group of occupations dominated the
occupations which were considered by the PES to have surpluses of high magnitude
(Figure 22) Indeed eight of the sixteen PES who rated surplus occupations by their
degree of severity identified at least one professional occupation as being in severe over-
supply
Interestingly the three PES who identified surplus occupations among plant and machine
operators and assemblers rated all the occupations they identified in this group as being
surplus occupations of high magnitude
Figure 22 Surpluses by estimated surplus magnitude
0 5 10 15 20
Managers
Plant and machine operators and assemblers
Skilled agricultural forestry and fishery workers
Craft and related trades workers
Clerical support workers
Elementary occupations
Service and sales workers
Technicians and associate professionals
Professionals
High Medium Low
Labour shortages and surpluses 2017
2018 17
Directorate-General for Employment Social Affairs and Inclusion European Network of Public Employment Services (PES)
28 Comparison of shortages and surpluses by broad
occupation
The issues which have been discussed above can be summarised in Table 25 below The
figures show that the 26 PES who reported at least one professional occupation as a
shortage represented 93 of all PES and that in total these PES identified 261
professional occupations as shortages
The situation is not quite as dramatic in respect of surplus occupations Nevertheless
fifteen PES representing 83 of all reporting PES identified a total of 88 professional
occupations as surplus occupations
However the most widespread reported surplus occupations were among the service and
sales group of occupations with almost 90 of PES reporting at least one surplus
occupation in this group The difference in the share of PES reporting shortages and
surpluses in the clerical group of occupations is also noteworthy Half the PES reported at
least one shortage occupation in this group but almost 80 of reporting PES included at
least one surplus occupation from this group
Table 25 Shortages and surpluses by broad occupation group
Broad occupation group
Number of
shortage occupatio
ns identified
Number of PES
reporting
shortages in this broad group
of PES reporting shortages
in this group
Number of surplus occupatio
ns identified
Number of PES
reporting surpluses
in this broad group
of PES reporting surpluses
in this broad group
Professionals 261 26 93 88 15 83
Craft and related trades 237 25 89 44 11 61
Associated professional technical
176 27 97 53 15 83
Services and sales 100 23 82 72 16 89
Plant and machinery 79 22 79 10 8 44
Elementary 53 14 50 37 12 67
Managers 43 11 39 16 7 39
Clerical support 34 14 50 47 14 78
Skilled agriculture 13 6 21 14 5 28
Armed forces 6 1 4 0 0 0
29 Cross-check with LSF data
Finally it is important to assess the extent to which the shortage and surplus occupations
identified by the PES in 2017 are accurate For this task we use the findings from the
2016 study which are based on the LSF data and the ratio of the unemployed to new
hires (Annex 4)
Although based on different levels of aggregation (4-digit vs 3-digit respectively) the
comparison of the PES reported shortages and surpluses in 2017 and the 2016 study LSF
ratio of unemployed and new hires suggests a high level of consistency Specifically PES
identified shortage occupations typically have the low ratio of unemployed to new hires
while the surplus occupations typically have the high ratio of unemployed to new hires
Labour shortages and surpluses 2017
2018 18
Directorate-General for Employment Social Affairs and Inclusion European Network of Public Employment Services (PES)
The only exceptions are the occupations of lsquocleanersrsquo lsquowaitersrsquo and lsquoshop sales
assistantsrsquo However this result is understandable as these occupations were classified
by the PES4 as labour shortages rather than skill shortages and consequently the
relatively high ratio could reflect the fact that there are a significant number of
unemployed available to work in these occupations
210 Conclusions
There are a number of significant conclusions which may be drawn from the analyses of
shortage and surplus occupations in this chapter
Firstly the widespread concern that using data from the PES may produce a significant
bias in the list of shortages and surpluses because the PES attract less vacancies and
job-seekers from higher skilled occupations appears to be unfounded Ironically the
professional occupations were the most frequently reported occupations in both the list of
shortages and surpluses
Secondly there is a distinct difference in the type of competences and qualifications
identified by the PES as shortages and surplus occupations and this difference was
evident throughout the different occupation groups In general the shortage occupations
embodied technical skills whether in health-related software-related or engineeringndash
related occupations at professional technical and craft levels
In sharp contrast the surplus occupations embodied selling service and clerical skills
cultural and artistic skills and competencies in the humanities
Finally the type of occupations which the PES associated with shortages and surpluses
are highly plausible In general the shortage occupations have a low ratio of unemployed
to new hires while the surplus occupations have a high ratio This consistency extended
to the occupations which the PES identified as labour shortages which exhibited a high
ratio
The classification of skill and labour shortages is one of the issues discussed in the next
chapter
4 While this is true when all three occupations are aggregated only two of five PES categorised lsquocleanersrsquo as a labour shortage ndash see chapter 3
Labour shortages and surpluses 2017
2018 19
Directorate-General for Employment Social Affairs and Inclusion European Network of Public Employment Services (PES)
3 PROFILE OF SHORTAGES AND SURPLUSES IN SPACE AND TIME
31 Introduction
In this chapter we analyse the occupations which have been identified by the European
PES as shortage and surplus occupations from the perspective of space and time We
review the geographical distribution of these occupations to ascertain if this distribution
provides an insight into what may have given rise to these shortages and surplus
occupations and we also examine the extent to which the same shortage and surplus
occupations have persisted over time using the findings from previous studies
32 PES methods used for identifying shortages and surpluses
In the previous chapter it was noted that only eighteen of twenty-eight PES submitted a
list of surplus occupations A review of the methods used by the PES to identify shortage
occupations may provide an insight into why ten PES did not provide any data on surplus
occupations
A summary of the methods used to identify shortage occupations is provided in Table 31
below The data indicates that exactly ten PES did not use any administrative data in
identifying their shortage occupations but rather used other sources such as employer
surveys national forecasting studies or immigration data It is tempting to conclude that
this is the reason why only 18 out of 28 PES provided data on surplus occupations as
these methodologies are not generally associated with the provision of information on
occupations which are in surplus
However such a conclusion would not be entirely accurate The analyses found that the
use of survey data did not necessarily preclude a PES from identifying surplus
occupations The Danish PES for example used the results of their Labour Market Balance
Survey and was able to provide a comprehensive list of surplus occupations In contrast
the Italian and Norwegian PES who relied on national forecasts and surveys respectively
were unable to provide such a list
Furthermore not all of the PES who based their identification of shortages on their
administrative data systems provided a list of surplus occupations Those who did
generally used the ratio of job-seekers to vacancies to identify whether an occupation
was a shortage or surplus occupation But a number of PES such as the German and
Luxemburg PES and the Belgium regional PES Actiris while basing their identification of
shortage and surplus occupations on administrative data used quite sophisticated
techniques such as the share of vacancies filled and the duration of vacancy filling Unlike
the ratio of job-seekers to vacancies such techniques do not readily provide an indicator
for identifying an occupation as a surplus occupation5
5 While it is reasonable to classify an occupation as a shortage occupation if the filling of vacant posts in that occupation takes on average an exceptionally long time identifying surplus occupations is somewhat more problematic using this method
Labour shortages and surpluses 2017
2018 20
Directorate-General for Employment Social Affairs and Inclusion European Network of Public Employment Services (PES)
Table 31 Methods used by the PES to identify shortage occupations
PES methods for identifying shortages and surpluses Number of PES
Combination of administrative data PES surveys and expert opinion
1
Combination of administrative data PES surveys and 3rd party data
1
Combination of administrative data and PES surveys 7
Combination of administrative data and 3rd party data 1
Combination of administrative data and expert opinion 2
PES work permit data only 2
PES administrative data only 6
PES survey data only 2
PES warehousing data only 1
3rd party surveys and forecasts 5
Total 28
The fact that only eighteen PES provided a list of surplus occupations is a serious
weakness of this study because it places a limit on the potential of the analyses to
identify cross border matching opportunities between shortage and surplus occupations
Consequently in the future every effort should be made to significantly increase the
number of PES providing a list of surplus occupations even if this means that a
significant number of PES use alternative methodologies to identify shortage and surplus
occupations rather than a single methodology to do both as has occurred in both the
2016 study and the current study6
33 Geographic distribution of shortages and surpluses
The 28 PES who submitted data on shortages cover a very wide geographic area which
include labour markets with very different characteristics It may be informative
therefore to assess the extent to which the distribution of shortage occupations differed
between different countries
Table 32 below shows the number of reported shortage occupations within their broad
occupation group and the PES who reported the occupation as a shortage7
While each PES was requested to submit a maximum of twenty shortage occupations a
total of ten PES provided more than that and in the case of the Slovenian French and the
regional Belgian PES Actiris significantly more
A total of six PES identified less than twenty shortage occupations but in most cases the
difference was negligible
The Croatian and Portuguese PES were the only PES which did not identify any
professional occupation in their list of shortage occupations This may reflect the type of
vacancies which are notified by employers to these PES because both these PES use
their own administrative data systems exclusively to identify shortage occupations
6 In the 2016 study while 26 PES provided data on shortage occupations 13 provided data on surplus
occupations 7 Three groups are excluded from the Table managers (43) skilled agricultural (13) and armed forces (1) as the figures are quite small
Labour shortages and surpluses 2017
2018 21
Directorate-General for Employment Social Affairs and Inclusion European Network of Public Employment Services (PES)
Table 32 Shortages number of mentions (4-digit) in broad occupation (1-digit)
PES Professional Technical Clerical Craft Service Plant Elementary Total
Austria 4 11 1 12 2 0 0 30
Actiris 28 22 6 11 13 2 0 82
Le Forem 6 6 0 6 0 0 0 18
VDAB 4 7 1 4 1 3 0 20
Bulgaria 7 0 0 4 5 3 2 21
Croatia 0 1 0 13 1 3 2 20
Cyprus 6 1 2 5 5 1 6 26
Denmark 5 1 0 7 3 2 1 19
Estonia 10 7 0 0 2 1 0 20
Finland 12 5 1 7 2 2 3 32
France 18 27 2 27 1 26 2 103
Germany 16 19 0 10 2 1 1 49
Hungary 2 6 6 8 14 3 12 51
Iceland 6 3 0 5 2 1 3 20
Ireland 13 2 0 4 1 1 0 21
Italy 2 2 1 7 4 1 3 20
Latvia 7 1 1 9 0 0 0 18
Lithuania 1 2 0 15 0 2 0 20
Luxemburg 8 4 0 0 0 0 0 12
Malta 5 3 3 4 6 1 4 26
Netherlands 20 11 3 23 2 1 0 60
Norway 13 3 0 10 10 4 1 41
Poland 10 6 2 2 3 3 4 30
Portugal 0 1 0 8 3 3 0 15
Slovakia 6 6 2 5 5 2 0 26
Slovenia 23 13 3 30 11 13 9 102
Sweden 15 2 0 1 2 0 0 20
Switzerland 14 4 0 0 0 0 0 18
Total 261 176 34 237 100 79 53 940
The stipulation to only provide a list of twenty shortage occupations may have prevented
any pattern from emerging in the figures For example there does not appear to be any
relationship between the numbers of employed and unemployed in a specific labour
market and the number of shortage occupations identified by its national PES
The two PES who submitted the highest volumes of shortage occupations - the French
and Slovenian PES - vary greatly in terms of the relative size of their labour force while
for example the Norwegian PES submitted significantly more shortage occupations than
much larger countries such as Germany and Poland
As a way of controlling for the variation in the total number of shortage occupations it
may be useful to compare the variation within the list of shortage occupations identified
by each PES However no obvious patterns emerge when a number of hypotheses are
tested using this approach For example there appears to be no relationship between
countries which are associated with strong apprenticeship systems such as Germany
Austria Denmark and Switzerland and their share of shortages among the craft group of
occupations The Swiss PES does not contain any craft occupations in its list of shortage
occupations while the craft group of occupations contain the most shortage occupations
in the lists provided by both the Austrian and Danish PES In the case of the German
PES the share of craft occupations is a little above the average
Labour shortages and surpluses 2017
2018 22
Directorate-General for Employment Social Affairs and Inclusion European Network of Public Employment Services (PES)
Table 33 Surpluses number of mentions (4-digit) in broad occupation (1-digit)
PES Professional Technical Clerical Craft Service Plant Elementary Total
Le Forem 2 1 1 1 6 0 8 19
Bulgaria 6 3 2 0 4 0 2 17
Switzerland 0 4 2 4 1 2 3 16
Cyprus 5 0 0 2 0 0 3 10
Denmark 3 2 3 0 6 1 4 19
Estonia 6 2 3 2 6 0 1 20
Finland 16 7 6 10 3 1 0 43
France 10 10 1 2 5 1 0 29
Croatia 4 0 0 0 0 0 0 4
Hungary 6 9 3 16 15 1 2 52
Ireland 1 1 4 3 5 1 7 22
Iceland 11 1 2 2 1 0 1 18
Lithuania 0 3 1 0 2 2 0 8
Latvia 4 4 0 0 3 1 3 15
Netherlands 3 2 9 0 9 0 1 24
Poland 0 0 0 0 1 0 0 1
Sweden 4 3 7 1 3 0 2 20
Slovakia 7 1 3 1 2 0 0 14
Total 88 53 47 44 72 10 37 351
The most striking aspect of the geographical distribution of surplus occupations is the
relatively low number of occupations which were reported Most of the reporting PES
(eleven) provided less than the twenty surplus occupations they were requested to
submit Furthermore if the contributions from the Hungarian and Finnish PES are
excluded the average number of surplus occupations submitted by the other PES is
sixteen
With the exception of the Icelandic Finnish French and Hungarian PES the list of
surplus occupations remains in single figures across all the broad occupational groups
Such low figures result in limited cross-border matching possibilities which are explored
in the next chapter
The PES were also asked to indicate the lowest regional level at which they could provide
data on both shortage and surplus occupations Their response is outlined in Table 34
above A total of twenty PES responded positively in the case of shortage occupations
and twelve in the case of surplus occupations In the case of shortage occupations nine
PES indicated that they could provide data at NUTs3 level while eight PES stated that
they could provide the data at NUTs1 level In the case of surplus occupations five PES
indicated that they could provide the data at NUTs1 level and another five PES responded
that they could provide the data at NUTs 3 level There were very few PES who indicated
that the lowest level at which they could provide data was at NUTs2 or NUTs4 levels
Labour shortages and surpluses 2017
2018 23
Directorate-General for Employment Social Affairs and Inclusion European Network of Public Employment Services (PES)
Table 34 Availability of data on shortagessurpluses at regional levels
Shortage occupations Surplus occupations
Country NUTS1 NUTS2 NUTS3 NUTS4 No
data NUTS1 NUTS2 NUTS3 NUTS4
Austria
x
Belgium Actiris
x
Belgium Le Forem
x
x
Belgium VDAB
x
Bulgaria
x
x
x
Croatia x
x
Cyprus
x
x
Denmark
x
x
Estonia x
x
Finland
x
x
France
x
x
Germany x
Hungary
x
x
Iceland x
x
Ireland x
x
Italy
x
Latvia
x
x
Lithuania
x
x
Luxembourg x
Malta
x
Netherlands
x
x
Norway
x
Poland
x
x
Portugal
x
Slovakia
x
x
Slovenia x
Sweden
x
x
Switzerland
x
x
Note Bulgaria has regional data for some occupations
34 Tracking shortages over time
This is the third annual study on lsquoBottleneck Occupationsrsquo the previous two studies were
undertaken in 2016 and 2015 The findings in both of those studies were presented in 3-
digit codes To make the findings comparable over time the 4-digit shortage and surplus
occupations from the current study are aggregated up to 3-digit occupations as shown in
Table 35
A striking aspect of the list of occupations in Table 35 is the degree of consistency
displayed over the period 2015-2017 inclusive not simply in terms of the occupations
reported by the PES but also in terms of the number of PES who identified them as
shortages (ie their ranking) Not only does the 3-digit occupation category of lsquosoftware
and applications developersrsquo occupy the top ranking in each of the years five of the top
ranking six occupations are the same The only notable exception is that the finance
professional and associate professional occupations featured in the list of most reported
shortage occupations in 2015 but slipped out of this list in 2016 and 2017
Labour shortages and surpluses 2017
2018 24
Directorate-General for Employment Social Affairs and Inclusion European Network of Public Employment Services (PES)
Table 35 Ranking of shortage occupations (3-digit)
Rank
Top occupations in 2017 2017 2016 2015
Software and application developers 1 1 1
Sheet and structural metal workers 2 3 2
Medical doctors 3 5 2
Blacksmiths toolmakers and related trades 4 3 4
Building finishes and related trade workers 4 6 4
Building frame and related trade workers 4 3 4
Cooks 4 7 7
Engineering professionals 5 6 6
Physical and engineering science technicians 6 7 na
Electrical equipment installers and repairers 7 4 5
Heavy truck and bus drivers 7 5 4
Machinery mechanics and repairers 8 7 5
Nursing and midwifery professionals 8 6 na
Sales and purchasing agents and brokers 9 2 5
Shop salespersons 10 7 8
Electro technology engineers 10 na na
Primary school and early childhood teachers 10 na na
Domestic hotel and office cleaners and helpers 10 na na
Waiters and bartenders 10 na na
35 3-digit vs 4-digit
There are advantages and disadvantages associated with using the more aggregated 3-
digit occupation classification as it was done in previous studies The bundling of
individual occupations into families provides greater visibility of shortages at a broad
skill level (eg all software related occupations)
However there are distinct disadvantages in using the 3-digit occupations and these
apply particularly to their practical usefulness to education and training providers In
many cases shortages identified at 3-digit level do not provide a reliable basis for
identifying the specific skill which is in shortage or surplus
By combining the analyses of the 4-digit and corresponding 3-digit classifications in this
report many examples are revealed of how an exclusive reliance on the 3-digit
classification could be seriously misleading Thus the findings in this report show that
within the 3-digit classification of lsquosheet and structural metal workers moulders and
weldersrsquo the 4-digit occupation which is in short supply is lsquoweldersrsquo and not for example
lsquosheet metal workersrsquo This is an important insight because in many European countries
the skills of welding and sheet metal work are provided through entirely different
vocational programmes8
There are many examples of this phenomenon in the 3-digit occupations in Table 35 For
example the analysis in this report shows that toolmakers are a shortage occupation
8 In Ireland for example sheet metal workers and welders undertake entirely different apprenticeships
Labour shortages and surpluses 2017
2018 25
Directorate-General for Employment Social Affairs and Inclusion European Network of Public Employment Services (PES)
but blacksmiths are not Furthermore the 3-digit classification disguises the extent of the
reported shortage Thus while the 3-digit occupation of professional nursing and
midwifery is shown in the current report as being shortage occupations a total of eleven
PES reported professional nursing as a shortage compared to only three PES reporting
professional midwifery as a shortage By bundling these occupations together the
significant difference in the relative severity of the shortage is not apparent
This phenomenon applies equally to the surplus occupations which were identified in this
report For example lsquochildcare workersrsquo were described as a surplus occupation by five
PES But in the 3-digit classification they are bundled together with lsquospecial needs
teachersrsquo which was not identified as a surplus occupation
36 Conclusions
There are a number of conclusions which can be drawn from the analyses in this chapter
Firstly the sources used by many of the PES to identify shortage occupations is one of
the main reasons why only eighteen PES provided data on surplus occupations Many of
the PES relied on the results of employer surveys forecasting models and immigration
data to identify shortages and these sources in general do not provide data on surplus
occupations However it was by no means the only reason why so many PES did not
provide data on surplus organisations and this issue will have to be addressed before the
commencement of the 2018 study In the future PES data should be augmented by data
collected by other bodies as outlined in the new EU Regulation
Secondly there is no obvious explanation for the geographic distribution of shortages
and surpluses In some cases countries with relatively small labour forces have a
relatively high number of shortage occupations while a strong apprenticeship system
does not appear to prevent a relatively high share of the identified shortages being in the
craft occupations It may be that the stipulation to only include twenty shortage and
surplus occupations has created a situation where some countries with a relatively large
labour force are artificially constrained to submit a much smaller number of shortage
occupations than they actually have
Thirdly there is a high degree of stability in relation to the occupations which were
identified as shortages in the 2015 2016 and 2017 editions of the Bottleneck report
Finally providing information on shortage and surplus occupations at 4-digit level is
much more useful from a policy perspective than providing the data at a more
aggregated level The results of the analyses at 4-digit level show which specific
occupations in the bundle of occupations used in the previous reports were in shortage
and which were not This is also true of the occupations which were identified as surplus
occupations A more aggregated group of occupations does not allow for the targeting of
specific individual occupations either for increasing training provision or for enhancing
cross border mobility Indeed as a number of specific examples show were providers of
vocational training or indeed policy makers to act on the basis of the 3-digit shortage and
surplus occupations identified in previous reports they could very well have assign
resources to occupations which were neither in shortage nor in surplus
Labour shortages and surpluses 2017
2018 26
Directorate-General for Employment Social Affairs and Inclusion European Network of Public Employment Services (PES)
4 THE CAUSES OF SKILL SHORTAGES AND POTENTIAL SOLUTIONS
41 Introduction
The focus of this chapter is on identifying the possible causes of skills shortages and
surpluses and exploring ways in which these imbalances may be resolved The chapter
begins with a review of the nature of skills and labour market imbalances and concludes
with an exploration of the extent to which enhanced cross-border mobility policies and
more equal gender representation could contribute to the alleviation of skills and labour
imbalances in certain shortage occupations in the EEA labour market
42 The role of skills and labour shortages in skills imbalances
One of the new questions included in the current study asks the PES to identify the
nature of the shortage (ie is it a skill shortage or a labour shortage) in relation to each
shortage occupation they identified It was explained in the questionnaire that labour
shortages occur when there are a sufficient number of appropriately qualified job-seekers
to fill the vacancies which arise but for a variety of reasons many of them do not wish
to work in the occupation in question Their response to this question is summarised in
Table 41 in respect of the twenty occupations which were reported by the most PES
A total of twenty-six PES classified their shortage occupations as skill or labour
shortages and they classified most of the occupations as skill shortages Indeed in the
case of seven occupations plumbers doctors software developers electricians
electronic engineers electronic engineering technicians bus and tram drivers and
mechanical engineers all of the reporting PES classified the shortage as a skills deficit
Each labour market within the EEA is regulated in a particular manner and conditions of
employment even within the same occupation vary throughout the region This is why
many occupations while classified by most of the PES as reflecting skill deficits
nevertheless are classified by some PES as labour shortages
However the number of PES involved is very small indeed Only in the case of three
occupations lsquowaitersrsquo lsquoshop sales assistantsrsquo and lsquoprimary school teachersrsquo are there
more PES classifying the shortage as a labour shortage then a skills deficit The first two
occupations are undoubtedly labour shortages This is because there are few if any
barriers to working in these occupations9
The inclusion of lsquoprimary school teachersrsquo as a labour shortage is however a surprise It
was identified by eight PES as a shortage occupation two of whom classified the
occupation as a shortage of high magnitude It would be necessary to conduct research
into the conditions of employment ndash including qualification criteria ndash within the countries
where the reporting PES are located to establish if this classification of the occupation as
a labour shortage is warranted
With some notable exceptions the response of the PES to classifying their shortage
occupations as skill or labour shortages demonstrates that the PES understand these
concepts Occupations such as professional nurses which are obviously suffering from a
shortage of qualified job-seekers in the EEA are overwhelmingly categorised as a skills
shortage while less skilled occupations such as cleaners are categorised as being on the
borderline between skills and labour shortages
9 Both occupations have relatively high ratios of unemployed to new hires (Annex 4)
Labour shortages and surpluses 2017
2018 27
Directorate-General for Employment Social Affairs and Inclusion European Network of Public Employment Services (PES)
Table 41 Skill and labour shortages
Occupation
Number of PES
reporting occupation
as skills shortage
Number of PES
reporting occupation as labour shortage
Number of PES
reporting occupations as skill and
labour shortage
Total number of
PES reporting on skillslabour
shortage
Cooks 9 1 0 10
Plumbers and pipe fitters 8 0 0 8
Generalist medical Practitioners 7 0 0 7
Heavy truck and lorry drivers 4 2 1 7
Metal workers machine tool setting and operators
3 3 1 7
Welders and flame cutters 4 2 1 7
Nursing professionals 5 1 0 6
Software developers 6 0 0 6
Systems analyst 5 1 0 6
Bricklayers and related trades 4 1 0 5
Building and related electricians 5 0 0 5
Butchers fishmongers and related food 3 2 0 5
Cleaners and helpers in offices 3 2 0 5
Commercial sales representatives 2 2 1 5
Electronic engineers 5 0 0 5
Manufacturing supervisors 4 1 0 5
Motor vehicle mechanics and repairers 3 1 1 5
Nursing associate professionals 4 1 0 5
Primary school teachers 2 3 0 5
Shop sales assistants 1 4 0 5
Waiters 2 3 0 5
Agriculture and industrial machinery repairers
3 1 0 4
Application programmers 3 1 0 4
Bus and tram drivers 4 0 0 4
Electronic engineering technicians 4 0 0 4
Health care assistants 3 1 0 4
Mechanical engineers 4 0 0 4
Sheet metal workers 3 1 0 4
Structural metal preparers and erectors 3 1 0 4
Total number of PES reporting 16 8 2 26
The atypical working hours associated with heavy goods vehicle driving is recognised by
two of the six PES who classify shortages in the occupation as labour shortages while the
unpleasant conditions associated with working in butchery shops and abattoirs is
reflected in the fact that two of the five PES who categorised the occupation as a
shortage occupation classify it as a labour shortage
43 Location of skill imbalances and cross border mobility
In recent years there has been considerable discussion on the potential role which
enhanced cross-border mobility could play in alleviating labour market imbalances The
attractiveness of such a policy is obvious The European Union is a very large
Labour shortages and surpluses 2017
2018 28
Directorate-General for Employment Social Affairs and Inclusion European Network of Public Employment Services (PES)
marketplace embracing a very large labour force if even some of the shortages which
are reported by EEA countries could be resolved by exploiting the surpluses which are
reported by other EEA countries it could form the basis of a number of win-win solutions
for both job-seekers and businesses
An additional attraction of this policy is that it could potentially successfully address both
skills and labour shortages as working conditions associated with some labour shortages
in one country might be perceived as significantly more attractive in a different EEA
country
Table 44 provides a list of the top twenty shortage occupations which have at least one
PES in another EEA country reporting the occupation as a surplus
There are a number of aspects of the Table which are notable Firstly the list of top
occupations has changed quite dramatically from the list in Table 21 specifically none
of the professional and associate professional occupations are now on the list including
the four professional and associate professional health-related occupations or the two
professional software occupations What the Table shows is that there are no surpluses
reported in any of the EEA countries of doctors or nurses software developers or
systems analysts While the occupation of healthcare assistants is in surplus in many
countries it was not included in the list of top occupations because it was reported as a
shortage by only two PES
The figures in Table 42 show that there are three cross-border matching possibilities in
the case of bricklayers and motor mechanics and two possibilities in the case of
plasterers health care assistants and secondary school teachers
There is just one matching possibility in respect of a wide range of occupations including
cooks truck drivers commercial sales representatives electricians carpenters civil
engineers primary school teachers manufacturing supervisors telecentre salespersons
childhood education teachers floor layers and roofers
The fact that primary school teachers have only one cross border matching possibility
suggest that the classification of the occupation as a labour shortage by three of five PES
is an error In general labour shortages would be expected to have more cross border
matching possibilities than skill shortages because there are many job-seekers eligible to
work in the occupation in question and working conditions vary quite significantly from
country to country Indeed it is notable that the two other occupations which were
classified by the PES as predominantly labour shortages waiters and shop sales
assistants have a relatively high number of matching possibilities eight in the case of
shop sales assistants and three in the case of waiters
In general the PES did not classify the same occupation as both a shortage and a
surplus A striking exception is the Danish PES which categorised four of its shortage
occupations as surplus occupations also This is most likely due to the higher level of
granularity available in the Danish data (below 4-digit) so that some job titles within an
occupation are considered labour shortage while others skill shortage
44 Assessing gender composition of surpluses
The PES were asked to estimate the share of females in the occupations which they
identified as lsquosurplusrsquo occupations The restricting of this question to surplus occupations
was to avoid giving the impression that shortages were arising because of discriminatory
recruitment policies
Labour shortages and surpluses 2017
2018 29
Directorate-General for Employment Social Affairs and Inclusion European Network of Public Employment Services (PES)
A total of 13 PES reported any data on gender composition of surpluses However the
quality of information submitted did not provide a sufficient basis for an accurate
estimation of the gender composition of surpluses in some of the cases
It is suggested that in order to address gender imbalances in relation to shortages and
surpluses data from PES on job seekers should be combined with the LSF data on
employment by occupation
45 Conclusions
The analysis in chapter four has produced a number of interesting findings The analysis
reveals that the PES in general has the capacity to distinguish between skill and labour
shortages and to identify shortage occupations which have some cross-border matching
possibilities
The relatively low number of surplus occupations reflects two factors firstly only
eighteen PES submitted a list of surplus occupations and secondly in many cases the
lists did not include the maximum number of twenty occupations which were requested
This response has to be viewed against the background of an EEA labour market where
employment is expanding and unemployment is contracting However while this is a
positive development the relatively low number of surplus occupations has placed a
significant limit on the extent to which there were cross-border possibilities of matching
shortage with surplus occupations
The data indicates that there is a limitation to the extent to which the PES can be used to
identify the gender imbalances (eg under-representation of females in some
occupations) and that other sources should be explored
Labour shortages and surpluses 2017
2018 30
Directorate-General for Employment Social Affairs and Inclusion European Network of Public Employment Services (PES)
Table 43 The potential for cross-border matching of shortage and surplus occupations
No PES
Occupation PES reporting shortage PES reporting surplus No PES
16 Cooks AT Art BG CY DK HR IE IS IT MT NL NO PT SE SI SK lsaquo―rsaquo HU 1
11 Truck drivers ART VDAB BG DK HR LT IT NL NO PT SE SI SK lsaquo―rsaquo DK 1
10 Cleaners helpers CY DK HR FI IS HU NL NO PT SI lsaquo―rsaquo DK LF NL IE 4
10 Commercial sales VDAB ART DK FI FR IT IE PT PL SI lsaquo―rsaquo DK 1
9 Sales assistants AT ART BG CY DK IT NO SI SK lsaquo―rsaquo DK LF SE NL BG CH FI IE 8
9 Bricklayers ART DE DK HR HU LT NL PT SI lsaquo―rsaquo CY HU IE 3
9 Motor mechanics AT VDAB ART LF DK IT NO PT SI lsaquo―rsaquo SK CH EE 3
9 Waiters ART BG CY IS IT MT NO PT SI lsaquo―rsaquo HU EE IE 3
9 Electricians ART VDAB DE DK IS IT NL NO SI lsaquo―rsaquo FR 1
8 Carpenters DK HR HU FI NL NO PT SI lsaquo―rsaquo HU 1
8 Civil engineers ART CH DE FI FR NO SE SI lsaquo―rsaquo CY 1
8 Primary teachers ART BG DK IS NO SE SI SK lsaquo―rsaquo CY 1
7 Healthcare assist CY DK EE NL NO SI SK lsaquo―rsaquo DK NL 2
7 Second teacher ART BG FR NL NO SI SK lsaquo―rsaquo CY FI 2
7 Man supervisors ART VDAB LF DE EE FR SK lsaquo―rsaquo BG 1
6 Plasterers HR HU FI LT NL SI lsaquo―rsaquo HU IE 2
6 Tele centre sales ART HU FI FR MT NO lsaquo―rsaquo EE 1
6 Childhood educ FI LT NO SE SI SK lsaquo―rsaquo CY 1
6 Floor layers HU HR FI FR LT LV lsaquo―rsaquo HU 1
6 Roofers HR FI FR LT LV SI lsaquo―rsaquo HU 1
Bottlenecks Occupations 2017
2017 31
Directorate-General for Employment Social Affairs and Inclusion European Network of Public Employment Services (PES)
5 CONCLUSIONS AND RECOMMENDATIONS
51 Conclusions
The terms of reference for this study emphasise the desirability of creating a process for
the systematic collection of data on surplus and shortage occupations in the EEA area
which could be effectively used by EURES for cross border matching of shortage
occupations in some EEA countries with surplus occupations in others
The authors have responded to this emphasis by using a process which ensures that the
data gathered on shortage and surplus occupations is comprehensive accurate and of
practical use to EURES and the providers of education and training programmes The
process is comprehensive because it gathers information both on the extent of shortages
and surpluses and on their relative severity It is accurate because the list of shortage
and surplus occupations are shown to be consistent with the estimated value of the ratio
of unemployed to new hires Finally the process provides information which is of
practical use to EURES and the national providers of VET because the data gathered is on
individual occupations rather than on lsquobundles of occupationsrsquo as in previous studies The
analyses in this report shows that while these bundles of occupations contain some
occupations which are identified by the PES as shortage and surplus occupations they
also contain occupations which are neither in shortage nor in surplus and it is impossible
to distinguish one from the other
The data gathering process used in this report however was not devoid of weaknesses
Fortunately these weaknesses reflect the modus operandi of the PES and may be
rectified by including other institutions and agencies in the process For example the PES
use the same sources for the identification of both shortage and surplus occupations
This may have advantages in terms of accuracy when those sources include employersrsquo
surveys immigration data and the results of forecasting exercises However these
sources are not suitable for gathering data on surplus occupations and they are the main
reason why the number of surplus occupations provided by the PES were almost half the
number requested In the future PES data could be augmented by data gathered by
other bodies as outlined in recent EU Regulation 2016589
In addition the response to the question on the capacity of the PES to deliver data on
shortage and surplus occupations at a regional level was also disappointing perhaps
reflecting a misalignment in some EEA countries between the geographic configuration of
the local PES network and the NUTs regions
The analysis highlighted that in order to assess gender imbalances of shortages and
surpluses PES data needs to be augmented by other sources
Finally despite the low number of surplus occupations submitted by the PES it was
nevertheless possible to identify twenty shortage occupations in the EEA labour market
which had at least one cross-border matching possibility and many more than one in the
case of some shortage occupations
52 Recommendations
Based on the findings from the three bottleneck studies undertaken to date a model for
the gathering of data on shortages and surpluses is proposed (Figure 51) The model
includes features of the methodology applied in this study which were successful It also
includes a number of features which should be introduced to the process in order to
address some of the weaknesses which were identified in this study (highlighted in red)
Labour shortages and surpluses 2017
2017 32
Directorate-General for Employment Social Affairs and Inclusion European Network of Public Employment Services (PES)
However before this methodology is implemented it would be prudent to discuss data
requirements with PES and invite a broader range of institutions and agencies to
participate in aspects of the data gathering process in addition to the PES EURES
Regulation (EU) 2016589 of the European Parliament and of the Council which obliges
the appropriate national authorities to furnish such data annually is fortuitous in this
regard and should facilitate the implementation of this recommendation
In addition the results of these and other relevant studies should be disseminated to
PES Eures coordination group and other relevant agencies and institutions in order to
emphasise the importance of data and analysis in informing policy at EU and national
level which aims to resolve labour market imbalances
Labour shortages and surpluses 2017
2017 33
Directorate-General for Employment Social Affairs and Inclusion European Network of Public Employment Services (PES)
Figure 51 Model for gathering data on shortage and surplus occupations
Sources of data on surpluses PES data from other relevant agencies
In those cases where the source used by the PES to identify shortage occupations cannot
be used to identify surplus occupations other institutions or other sources or both should be availed of to ensure that comprehensive data on surplus occupations are provided to the appropriate national authority
Dimensions of shortagessurpluses extent (number of reporting PES) and severity (high or low
magnitude)
Data should be systematically gathered on both the extent of shortage and surplus
occupations in the EEA and on their relative severity
Type of shortage skill vs labour shortages
The providers of the data on shortage occupations must also distinguish between skill and labour shortages because this distinction is necessary for the accurate identification of
shortage occupations and for the choice of the appropriate policy response to identified shortages
Classification of occupations used ISCO 08 4-digit codes (or translation into these codes)
All data should be either initially gathered in ISCO 08 4-digit codes or translated into these
codes This ensures that the data refers to specific individual occupations and is of practical use to EURES and the national providers of VET
Accuracy test cross-check with LSF data (ratio of unemployed to new hires)
The accuracy of the submitted lists of shortage and surplus occupations should be assessed
by comparing the most widely reported surplus and shortage occupations with the estimated values of the ratios of employed (by previous occupation) to new hires at the aggregated EU28 level These ratios should be based on an analysis of the most up-to date
Labour Force Survey (LFS) data
Gender balance assessment LFS data on employment at occupational level by gender PES job
seekers
The gender composition of shortage and surplus occupations should be based on the most
up to date analyses of LFS data on employment by gender and the PES job seeker data
Regional balance assessment LSF data data from relevant agencies
Where regional data is required other agencies and institutions should be requested to
provide the data in those cases where the data cannot be provided by the regional PES network because it is not geographically aligned to the NUTs regions
Labour shortages and surpluses 2017
2017 34
Directorate-General for Employment Social Affairs and Inclusion European Network of Public Employment Services (PES)
Number of occupations reporting should be extended beyond 20 occupations but with upper
limit (eg 50)
Consideration should be given to allowing the agencies responsible for identifying shortage
and surplus occupations a greater range of flexibility in terms of the numbers of occupations which should be identified A minimum to maximum range would be a more realistic approach as it would reflect the fact that the labour markets of the EEA vary significantly in size and performance
Timing of imbalance assessment September
It is proposed that the data gathering exercise should be brought forward to early September and that expert advice should be available on line throughout the data
gathering exercise
Labour shortages and surpluses 2017
2017 35
Directorate-General for Employment Social Affairs and Inclusion European Network of Public Employment Services (PES)
ANNEX 1 DATA COLLECTION TEMPLATE Information sought Explanation
Occupation title (text) Type in free text a list of occupations (one row one occupation) for which shortages and surpluses exist first list occupations for which there is a shortage the list should contain a maximum of 20 occupations if your list contains less than 20 occupations please provide a brief explanation in your email response for why the number is lower than 20 second list occupations for which there is a surplus the list should contain a maximum of 20 occupations if your list contains less than 20 occupations please provide a brief explanation in your email response for why the number is lower than 20
Shortagesurplus indicator For each occupation indicate if it refers to a shortage by typing in shortage or surplus by typing in surplus to identify surplus occupations you can examine for each occupation the ratio of the number of job seekers to the number of vacancies at the end of each year for example if there are 5000 shop assistants seeking employment and there are 200 vacancies at the end of the reference period the ratio is 251 you can rank the calculated ratios and report the occupations associated with the 20 highest ratios
Occupational classification used in your country
For each occupation indicate what occupational classification (if any) was used to identify this occupation for instance you can report a country specific classification ISCO ROME SOC etc If you donrsquot use occupational classifications type None
Occupation code to the lowest level of disaggregation (eg ISCO at 4 digits)
If you have indicated a classification used type the code for each occupation use the lowest level of disaggregation (eg 4 digit ISCO code) if you donrsquot use occupational classification leave black
ISCO-08 code at 4-digit level (or lower if 4-digit not available)
If you use occupational classification which is not ISCO-08 and if it is possible provide a translation of the national code to ISCO-08 code ISCO is the International Standard Classification of Occupations which is used to report to Eurostat code should be at 4 digits if this is not available than the lowest level of disaggregation that is available should be reported (3 digits if 4-digit code is not available 2 digits if neither 4-digit nor 3-digit code is available 1 digit if neither 4-digit 3-digit nor 2-digit code is available) if it is not possible to provide translation to ISCO-08 leave black if you have already reported ISCO-08 code in column 3 leave this column black
Estimate of shortagesurplus magnitude (high (gt3 of employment) medium (1-3 of employment) low (lt1 of employment))
For each occupation indicate a broad estimate of the magnitude of the shortagesurplus if you estimate that the shortagesurplus is less than 1 of the total employment in the occupation in question type low if between 1-3 type medium if greater than 3 type high if you cannot provide a rough estimate of magnitude type dont know
Current shortagesurplus (C) future short term (FST) future medium term (FMT) future long term (FLT) donrsquot know (indicate all that apply)
Against each occupation indicate if the identified shortagesurplus refers to present situation by typing C if the shortage is expected to occur in the short term future ie within 12 months by typing FST if it is expected to occur over the medium term (within 1-5 years) by typing FMT if it is expected to occur in the long term (in 5 or more years) by typing FLT if more than one time period applies indicate all relevant ones (eg for current shortagessurpluses that are expected to persist over the short term type C FST) if you dont know type dont know
Source of information on shortagessurpluses (eg PES administrative data (vacancies job seekers) PES survey third party survey Occupational forecasts other (specify) etc)
Indicate the source used to identify shortagesurplus for this occupation did you derive it from the PES administrative data on PES vacancies andor job seekers did you conduct a survey did you commission a third party to conduct a survey for you did you have occupational forecasts available did you use other research type in free text the full description of the source(s) eg National Employment Survey conducted by PES etc
Labour shortages and surpluses 2017
2017 36
Directorate-General for Employment Social Affairs and Inclusion European Network of Public Employment Services (PES)
Date for source of information Indicate the year that the information on shortagessurpluses (column 7) refers to eg type 2016 for a survey of difficult to fill vacancies conducted in 2016 even if the report was published in 2017
What indicator(s) suggested that there is a shortagesurplus
Indicate what criteria was used to conclude that this occupation is associated with a shortagesurplus for instance employers views sourcing from abroad to fill vacancies growth in employment faster than growth in educationtraining output time required to fill
vacancies higher than average etc
Share of females among job seekers in this occupation (surplus occupations only)
Indicate the percentage share of females among all job seekers in this occupation this is only applicable to surplus occupations
Skill or labour shortage Indicate if a shortage refers to a skill or labour shortage a skill shortage occurs where there is an insufficient supply of persons with the appropriate skills labour shortages occur where there is a sufficient number of skilled persons however an insufficient number of them is willing to take up employment in the occupation in question
Indicate the availability of data on shortagessurpluses at regional level (NUTS1 NUTS2 NUTS3 No data)
Indicate if data is available on the regional breakdown of shortagessurpluses by indicating the level of regional data available if multiple levels of regional disaggregation are available indicate the lowest level of disaggregation (eg NUTS3 rather than NUTS2) if there is no regional data available use no data
Labour shortages and surpluses 2017
2017 37
Directorate-General for Employment Social Affairs and Inclusion European Network of Public Employment Services (PES)
ANNEX 2 SHORTAGE OCCUPATIONS
Shortage occupation PES count
Cooks 16 Plumbers and pipe fitters 13 Generalist medical practitioners 12 Welders and flamecutters 12 Heavy truck and lorry drivers 11 Metal working machine tool setters and operators 11 Nursing professionals 11 Software developers 11 Agricultural and industrial machinery mechanics and repairers 10 Cleaners and helpers in offices hotels and other establishments 10 Commercial sales representatives 10 Specialist medical practitioners 10 Systems analysts 10 Bricklayers and related workers 9 Building and related electricians 9 Butchers fishmongers and related food preparers 9 Motor vehicle mechanics and repairers 9 Nursing associate professionals 9 Sheet-metal workers 9 Shop sales assistants 9 Waiters 9 Carpenters and joiners 8 Civil engineers 8 Concrete placers concrete finishers and related workers 8 Electrical engineering technicians 8 Electronics engineering technicians 8 Mechanical engineers 8 Primary school teachers 8 Structural-metal preparers and erectors 8 Electronics engineers 7
Health care assistants 7 Manufacturing supervisors 7 Mechanical engineering technicians 7 Secondary education teachers 7 Accountants 6 Applications programmers 6 Bus and tram drivers 6 Contact centre salespersons 6 Early childhood educators 6 Electrical mechanics and fitters 6 Floor layers and tile setters 6 Plasterers 6 Roofers 6 Sewing machine operators 6 Software and applications developers and analysts not elsewhere classified 6 Toolmakers and related workers 6 Web and multimedia developers 6 Air conditioning and refrigeration mechanics 5 Building frame and related trades workers not elsewhere classified 5 Chefs 5 Civil engineering labourers 5 Construction supervisors 5 Earthmoving and related plant operators 5 Electrical engineers 5 Electrical line installers and repairers 5 Engineering professionals not elsewhere classified 5 Hairdressers 5 Information and communications technology operations technicians 5 Manufacturing managers 5 Physiotherapists 5 Real estate agents and property managers 5 Research and development managers 5 Spray painters and varnishers 5 Accounting associate professionals 4 Bakers pastry-cooks and confectionery makers 4
Labour shortages and surpluses 2017
2017 38
Directorate-General for Employment Social Affairs and Inclusion European Network of Public Employment Services (PES)
Shortage occupation PES count
Blacksmiths hammersmiths and forging press workers 4 Civil engineering technicians 4 Crane hoist and related plant operators 4 Database designers and administrators 4 Industrial and production engineers 4 Painters and related workers 4 Physical and engineering science technicians not elsewhere classified 4 Plastic products machine operators 4 Social work and counselling professionals 4 Accounting and bookkeeping clerks 3 Administrative and executive secretaries 3 Ambulance workers 3 Building construction labourers 3 Car taxi and van drivers 3 Cartographers and surveyors 3 Cleaning and housekeeping supervisors in offices hotels and other establishments 3 Contact centre information clerks 3 Draughtspersons 3 Fast food preparers 3 Freight handlers 3 Gardeners horticultural and nursery growers 3 Home-based personal care workers 3 Hotel receptionists 3 Information and communications technology installers and servicers 3 Insulation workers 3 Kitchen helpers 3 Manufacturing labourers not elsewhere classified 3 Medical imaging and therapeutic equipment technicians 3 Metal moulders and coremakers 3 Metal polishers wheel grinders and tool sharpeners 3 Midwifery professionals 3 Other language teachers 3 Personal services workers not elsewhere classified 3
Pharmacists 3 Policy administration professionals 3 Printers 3 Process control technicians not elsewhere classified 3 Sales and marketing managers 3 Shop supervisors 3 Special needs teachers 3 Stock clerks 3 Supply distribution and related managers 3 Survey and market research interviewers 3 Systems administrators 3 Technical and medical sales professionals (excluding ICT) 3 Translators interpreters and other linguists 3 Transport clerks 3 Vocational education teachers 3 Advertising and marketing professionals 2 Audiologists and speech therapists 2 Bartenders 2 Beauticians and related workers 2 Cashiers and ticket clerks 2 Chemical engineers 2 Child care workers 2 Computer network and systems technicians 2 Computer network professionals 2 Construction managers 2 Craft and related workers not elsewhere classified 2 Credit and loans officers 2 Crop farm labourers 2 Database and network professionals not elsewhere classified 2 Dentists 2 Domestic cleaners and helpers 2 Door to door salespersons 2 Driving instructors 2 Electrical and electronic equipment assemblers 2 Electronics mechanics and servicers 2 Elementary workers not elsewhere classified 2 Employment agents and contractors 2
Labour shortages and surpluses 2017
2017 39
Directorate-General for Employment Social Affairs and Inclusion European Network of Public Employment Services (PES)
Shortage occupation PES count
Field crop and vegetable growers 2 Financial analysts 2 Financial and investment advisers 2 Forestry and related workers 2 Garbage and recycling collectors 2 General office clerks 2 Graphic and multimedia designers 2 Information and communications technology service managers 2 Insurance representatives 2 Locomotive engine drivers 2 Mail carriers and sorting clerks 2 Management and organization analysts 2 Mathematicians actuaries and statisticians 2 Mechanical machinery assemblers 2 Medical and dental prosthetic technicians 2 Medical assistants 2 Messengers package deliverers and luggage porters 2 Metal finishing plating and coating machine operators 2 Metal processing plant operators 2 Optometrists and ophthalmic opticians 2 Personal care workers in health services not elsewhere classified 2 Police officers 2 Policy and planning managers 2 Production clerks 2 Restaurant managers 2 Retail and wholesale trade managers 2 Sales workers not elsewhere classified 2 Sewing embroidery and related workers 2 Street food salespersons 2 Tailors dressmakers furriers and hatters 2 Telecommunications engineers 2 Advertising and public relations managers 1 Aged care services managers 1
Agricultural technicians 1 Aircraft engine mechanics and repairers 1 Aircraft pilots and related associate professionals 1 Assemblers not elsewhere classified 1 Authors and related writers 1 Bank tellers and related clerks 1 Bleaching dyeing and fabric cleaning machine operators 1 Bookmakers croupiers and related gaming workers 1 Business services agents not elsewhere classified 1 Buyers 1 Cabinet-makers and related workers 1 Cement stone and other mineral products machine operators 1 Chemical and physical science technicians 1 Chemical engineering technicians 1 Chemical processing plant controllers 1 Chemical products plant and machine operators 1 Chemists 1 Conference and event planners 1 Customs and border inspectors 1 Data entry clerks 1 Dental assistants and therapists 1 Dieticians and nutritionists 1 Dispensing opticians 1 Domestic housekeepers 1 Economists 1 Education methods specialists 1 Environmental and occupational health and hygiene professionals 1 Environmental and occupational health inspectors and associates 1 Fibre preparing spinning and winding machine operators 1 Finance managers 1 Financial and insurance services branch managers 1 Fire-fighters 1 Fitness and recreation instructors and program leaders 1 Food and beverage tasters and graders 1 Food and related products machine operators 1
Labour shortages and surpluses 2017
2017 40
Directorate-General for Employment Social Affairs and Inclusion European Network of Public Employment Services (PES)
Shortage occupation PES count
Food service counter attendants 1 Forestry labourers 1 Fruit vegetable and related preservers 1 Fur and leather preparing machine operators 1 Glass and ceramics plant operators 1 Hand launderers and pressers 1 Hand packers 1 Handicraft workers in textile leather and related materials 1 Health associate professionals not elsewhere classified 1 Health professionals not elsewhere classified 1 House builders 1 Human resource managers 1 Incinerator and water treatment plant operators 1 Information and communications technology user support technicians 1 Judges 1 Lawyers 1 Legal and related associate professionals 1 Legal professionals not elsewhere classified 1 Library clerks 1 Lifting truck operators 1 Livestock and dairy producers 1 Livestock farm labourers 1 Medical and pathology laboratory technicians 1 Medical secretaries 1 Metal production process controllers 1 Mining and quarrying labourers 1 Mining engineers metallurgists and related professionals 1 Mixed crop and animal producers 1 Mixed crop growers 1 Motorcycle drivers 1 Odd job persons 1 Other cleaning workers 1 Other music teachers 1
Paper products machine operators 1 Personnel and careers professionals 1 Personnel clerks 1 Pet groomers and animal care workers 1 Physicists and astronomers 1 Physiotherapy technicians and assistants 1 Potters and related workers 1 Power production plant operators 1 Prison guards 1 Product and garment designers 1 Psychologists 1 Pulp and papermaking plant operators 1 Railway brake signal and switch operators 1 Receptionists (general) 1 Refuse sorters 1 Riggers and cable splicers 1 Scribes and related workers 1 Secretaries (general) 1 Securities and finance dealers and brokers 1 Security guards 1 Senior government officials 1 Senior officials of special-interest organizations 1 Shelf fillers 1 Ships engineers 1 Shoemaking and related machine operators 1 Social work associate professionals 1 Stall and market salespersons 1 Stationary plant and machine operators not elsewhere classified 1 Stonemasons stone cutters splitters and carvers 1 Street and related service workers 1 Sweepers and related labourers 1 Teaching professionals not elsewhere classified 1 Telecommunications engineering technicians 1 Textile fur and leather products machine operators not elsewhere classified 1 Trade brokers 1 Travel attendants and travel stewards 1 Travel guides 1
Labour shortages and surpluses 2017
2017 41
Directorate-General for Employment Social Affairs and Inclusion European Network of Public Employment Services (PES)
Shortage occupation PES count
Tree and shrub crop growers 1 Underwater divers 1 University and higher education teachers 1 Vehicle cleaners 1 Veterinarians 1 Weaving and knitting machine operators 1 Web technicians 1 Wood processing plant operators 1 Woodworking-machine tool setters and operators 1
Labour shortages and surpluses 2017
2017 42
Directorate-General for Employment Social Affairs and Inclusion European Network of Public Employment Services (PES)
ANNEX 3 SURPLUS OCCUPATIONS
Surplus occupation PES count
General office clerks 8 Shop sales assistants 8 Advertising and marketing professionals 6 Bank tellers and related clerks 6 Sociologists anthropologists and related professionals 6 Child care workers 5 Hairdressers 5 Journalists 5 Cashiers and ticket clerks 4 Cleaners and helpers in offices hotels and other establishments 4 Hand packers 4 Mail carriers and sorting clerks 4 Photographers 4 Receptionists (general) 4 Tailors dressmakers furriers and hatters 4 Accounting and bookkeeping clerks 3 Administrative and executive secretaries 3 Beauticians and related workers 3 Biologists botanists zoologists and related professionals 3 Bricklayers and related workers 3 Broadcasting and audio-visual technicians 3 Civil engineering labourers 3 Economists 3 Gardeners horticultural and nursery growers 3 Interior designers and decorators 3 Kitchen helpers 3 Legal professionals not elsewhere classified 3 Manufacturing labourers not elsewhere classified 3 Motor vehicle mechanics and repairers 3
Musicians singers and composers 3 Other artistic and cultural associate professionals 3 Painters and related workers 3 Philosophers historians and political scientists 3 Security guards 3 Sweepers and related labourers 3 Travel consultants and clerks 3 Waiters 3 Actors 2 Archivists and curators 2 Bakers pastry-cooks and confectionery makers 2 Bartenders 2 Building construction labourers 2 Business services and administration managers not elsewhere classified 2 Cabinet-makers and related workers 2 Car taxi and van drivers 2 Chemists 2 Cleaning and housekeeping supervisors in offices hotels and other establishments 2 Credit and loans officers 2 Customs and border inspectors 2 Elementary workers not elsewhere classified 2 Film stage and related directors and producers 2 Financial analysts 2 Forestry and related workers 2 Freight handlers 2 Graphic and multimedia designers 2 Health care assistants 2 Hotel receptionists 2 Lawyers 2 Legal and related associate professionals 2 Library clerks 2 Livestock and dairy producers 2 Management and organization analysts 2 Messengers package deliverers and luggage porters 2 Odd job persons 2 Office supervisors 2 Plasterers 2
Labour shortages and surpluses 2017
2017 43
Directorate-General for Employment Social Affairs and Inclusion European Network of Public Employment Services (PES)
Surplus occupation PES count
Police officers 2 Pre-press technicians 2 Print finishing and binding workers 2 Printers 2 Prison guards 2 Product and garment designers 2 Psychologists 2 Public relations professionals 2 Religious professionals 2 Secondary education teachers 2 Secretaries (general) 2 Social work and counselling professionals 2 Stall and market salespersons 2 Stock clerks 2 Teachers aides 2 Telephone switchboard operators 2 Travel guides 2 Visual artists 2 Advertising and public relations managers 1 Agricultural technicians 1 Announcers on radio television and other media 1 Assemblers not elsewhere classified 1 Building and related electricians 1 Building architects 1 Building caretakers 1 Building frame and related trades workers not elsewhere classified 1 Business services agents not elsewhere classified 1 Buyers 1 Carpenters and joiners 1 Chemical engineers 1 Civil engineers 1 Clearing and forwarding agents 1 Clerical support workers not elsewhere classified 1
Commercial sales representatives 1 Conference and event planners 1 Contact centre information clerks 1 Contact centre salespersons 1 Cooks 1 Crane hoist and related plant operators 1 Creative and performing artists not elsewhere classified 1 Dancers and choreographers 1 Data entry clerks 1 Database designers and administrators 1 Domestic cleaners and helpers 1 Domestic housekeepers 1 Draughtspersons 1 Driving instructors 1 Early childhood educators 1 Electronics mechanics and servicers 1 Farming forestry and fisheries advisers 1 Fashion and other models 1 Fast food preparers 1 Field crop and vegetable growers 1 Filing and copying clerks 1 Finance managers 1 Financial and insurance services branch managers 1 Financial and investment advisers 1 Fire-fighters 1 Fitness and recreation instructors and program leaders 1 Floor layers and tile setters 1 Food service counter attendants 1 Fruit vegetable and related preservers 1 Gallery museum and library technicians 1 Garbage and recycling collectors 1 Garment and related pattern-makers and cutters 1 Glass and ceramics plant operators 1 Government tax and excise officials 1 Hand launderers and pressers 1
Labour shortages and surpluses 2017
2017 44
Directorate-General for Employment Social Affairs and Inclusion European Network of Public Employment Services (PES)
Surplus occupation PES count
Heavy truck and lorry drivers 1 House builders 1 Hunters and trappers 1 Information and communications technology installers and servicers 1 Information and communications technology user support technicians 1 Insurance representatives 1 Jewellery and precious-metal workers 1 Judges 1 Legal secretaries 1 Librarians and related information professionals 1 Life science technicians (excluding medical) 1 Lifting truck operators 1 Managing directors and chief executives 1 Manufacturing supervisors 1 Medical and dental prosthetic technicians 1 Metal moulders and coremakers 1 Mining and quarrying labourers 1 Mixed crop and animal producers 1 Mixed crop growers 1 Mobile farm and forestry plant operators 1 Musical instrument makers and tuners 1 Other language teachers 1 Pawnbrokers and money-lenders 1 Personnel and careers professionals 1 Pet groomers and animal care workers 1 Photographic products machine operators 1 Physical and engineering science technicians not elsewhere classified 1 Physicists and astronomers 1 Police inspectors and detectives 1 Precision-instrument makers and repairers 1 Primary school teachers 1 Process control technicians not elsewhere classified 1 Product graders and testers (excluding foods and beverages) 1
Production clerks 1 Professional services managers not elsewhere classified 1 Protective services workers not elsewhere classified 1 Research and development managers 1 Retail and wholesale trade managers 1 Roofers 1 Sales workers not elsewhere classified 1 Senior government officials 1 Service station attendants 1 Shelf fillers 1 Shop supervisors 1 Social work associate professionals 1 Special needs teachers 1 Spray painters and varnishers 1 Statistical mathematical and related associate professionals 1 Stonemasons stone cutters splitters and carvers 1 Street food salespersons 1 Supply distribution and related managers 1 Teaching professionals not elsewhere classified 1 Technical and medical sales professionals (excluding ICT) 1 Training and staff development professionals 1 Translators interpreters and other linguists 1 Transport conductors 1 Tree and shrub crop growers 1 Typists and word processing operators 1 Undertakers and embalmers 1 Vocational education teachers 1 Weaving and knitting machine operators 1 Woodworking-machine tool setters and operators 1
Labour shortages and surpluses 2017
2017 45
Directorate-General for Employment Social Affairs and Inclusion European Network of Public Employment Services (PES)
ANNEX 4 THE RATIO OF UNEMPLOYED TO NEW HIRES
ISCO-08 title
2015
UE
Recruited in the
last year (lt12
months)
Ratio of UE to new recruits
Street and related service workers 85 104 08 Agricultural forestry and fishery labourers 3913 5343 07 Mining and construction labourers 1937 3525 05 Creative and performing artists 610 1115 05 Refuse workers 1036 1923 05 Painters building structure cleaners and related trades workers 1116 2117 05 Street and market salespersons 195 389 05 Building frame and related trades workers 3632 7353 05 Mining manufacturing and construction supervisors 626 1315 05 Ships deck crews and related workers 53 114 05 Market gardeners and crop growers 1471 3207 05 Managing directors and chief executives 304 667 05 Travel attendants conductors and guides 229 538 04 Wood treaters cabinet-makers and related trades workers 491 1159 04 Manufacturing labourers 1640 3909 04 Domestic hotel and office cleaners and helpers 5679 13545 04 Other stationary plant and machine operators 822 1961 04 Mobile plant operators 1038 2497 04 Building finishers and related trades workers 1519 3680 04 Textile fur and leather products machine operators 431 1048 04 Garment and related trades workers 422 1047 04 Chemical and photographic products plant and machine operators 157 389 04 Food processing and related trades workers 930 2330 04 Vehicle window laundry and other hand cleaning workers 291 754 04 Sheet and structural metal workers moulders and welders and related workers
996 2603 04
Waiters and bartenders 4399 11595 04 Cooks 1529 4039 04 Metal processing and finishing plant operators 208 557 04 Printing trades workers 203 548 04 Forestry and related workers 130 351 04 Protective services workers 1347 3658 04 Transport and storage labourers 2532 6939 04 Fishery workers hunters and trappers 46 128 04 Material-recording and transport clerks 1671 4630 04 Process control technicians 179 517 03 Mining and mineral processing plant operators 94 274 03 Telecommunications and broadcasting technicians 177 519 03 Blacksmiths toolmakers and related trades workers 816 2409 03 Building and housekeeping supervisors 678 2045 03
Secretaries (general) 1072 3259 03 Assemblers 850 2586 03 Other craft and related workers 258 810 03 Shop salespersons 6600 21042 03 Electrical equipment installers and repairers 958 3060 03 Food and related products machine operators 437 1400 03 Other sales workers 1087 3510 03 Food preparation assistants 1646 5337 03 Mixed crop and animal producers 387 1260 03 Car van and motorcycle drivers 1155 3764 03 Client information workers 1993 6531 03 Sports and fitness workers 605 1984 03 Handicraft workers 194 638 03 Life science technicians and related associate professionals 82 271 03 Keyboard operators 283 940 03 Electronics and telecommunications installers and repairers 290 963 03 Other personal services workers 313 1047 03 Vocational education teachers 279 940 03 Other teaching professionals 744 2518 03 General office clerks 966 3272 03 Authors journalists and linguists 335 1135 03 Hairdressers beauticians and related workers 806 2796 03
Labour shortages and surpluses 2017
2017 46
Directorate-General for Employment Social Affairs and Inclusion European Network of Public Employment Services (PES)
ISCO-08 title
2015
UE
Recruited in the
last year (lt12
months)
Ratio of UE to new recruits
Animal producers 189 660 03 Other elementary workers 976 3401 03 Machinery mechanics and repairers 1134 3962 03 Ship and aircraft controllers and technicians 80 281 03 Hotel and restaurant managers 344 1220 03 Cashiers and ticket clerks 908 3220 03 Retail and wholesale trade managers 224 809 03 Sales marketing and development managers 311 1124 03 Physical and engineering science technicians 1204 4366 03 Administrative and specialised secretaries 1106 4040 03 Sales and purchasing agents and brokers 1294 4754 03 Rubber plastic and paper products machine operators 256 941 03 Artistic cultural and culinary associate professionals 511 1906 03 Numerical clerks 944 3532 03 Other services managers 184 691 03 Child care workers and teachers aides 1335 5005 03 Heavy truck and bus drivers 1426 5349 03 Business services and administration managers 383 1439 03 Information and communications technology service managers 67 257 03 Regulatory government associate professionals 209 807 03 Life science professionals 176 681 03 Wood processing and papermaking plant operators 97 379 03 Locomotive engine drivers and related workers 46 179 03 Legal professionals 315 1245 03 Personal care workers in health services 2195 8787 02 Physical and earth science professionals 85 345 02 Street vendors (excluding food) 50 204 02 Architects planners surveyors and designers 515 2092 02 Other clerical support workers 901 3657 02 Business services agents 510 2114 02 Manufacturing mining construction and distribution managers 361 1507 02 Tellers money collectors and related clerks 381 1612 02 Librarians archivists and curators 58 248 02 Medical and pharmaceutical technicians 255 1099 02 University and higher education teachers 301 1333 02 Information and communications technology operations and user support technicians
418 1888 02
Legal social and religious associate professionals 920 4348 02 Financial and mathematical associate professionals 601 2852 02 Sales marketing and public relations professionals 865 4172 02 Finance professionals 472 2281 02 Engineering professionals (excluding electrotechnology) 635 3118 02 Other health associate professionals 531 2657 02
Social and religious professionals 460 2317 02 Professional services managers 176 891 02 Nursing and midwifery associate professionals 556 2855 02 Legislators and senior officials 53 286 02 Database and network professionals 83 455 02 Administration professionals 641 3673 02 Primary school and early childhood teachers 575 3345 02 Electrotechnology engineers 142 827 02 Secondary education teachers 471 2812 02 Other health professionals 346 2083 02 Nursing and midwifery professionals 273 1760 02 Software and applications developers and analysts 631 4159 02 Medical doctors 293 1944 02 No occupation 152894 00
No answer 2531 578 44 Total 249561 294937 08
Labour shortages and surpluses 2017
2017 47
Directorate-General for Employment Social Affairs and Inclusion European Network of Public Employment Services (PES)
HOW TO OBTAIN EU PUBLICATIONS
Free publications
bull one copy
via EU Bookshop (httpbookshopeuropaeu)
bull more than one copy or postersmaps
from the European Unionrsquos representations (httpeceuropaeurepresent_enhtm)
from the delegations in non-EU countries
(httpeeaseuropaeudelegationsindex_enhtm)
by contacting the Europe Direct service (httpeuropaeueuropedirectindex_enhtm)
or calling 00 800 6 7 8 9 10 11 (free phone number from anywhere in the EU) () () The information given is free as are most calls (though some operators phone boxes or hotels may charge you)
Priced publications
bull via EU Bookshop (httpbookshopeuropaeu)
Priced subscriptions
bull via one of the sales agents of the Publications Office of the European Union
(httppublicationseuropaeuothersagentsindex_enhtm)
doi 10276731262
KE-0
1-1
8-2
63-E
N-N
[Ca
talo
gu
e n
um
be
r]
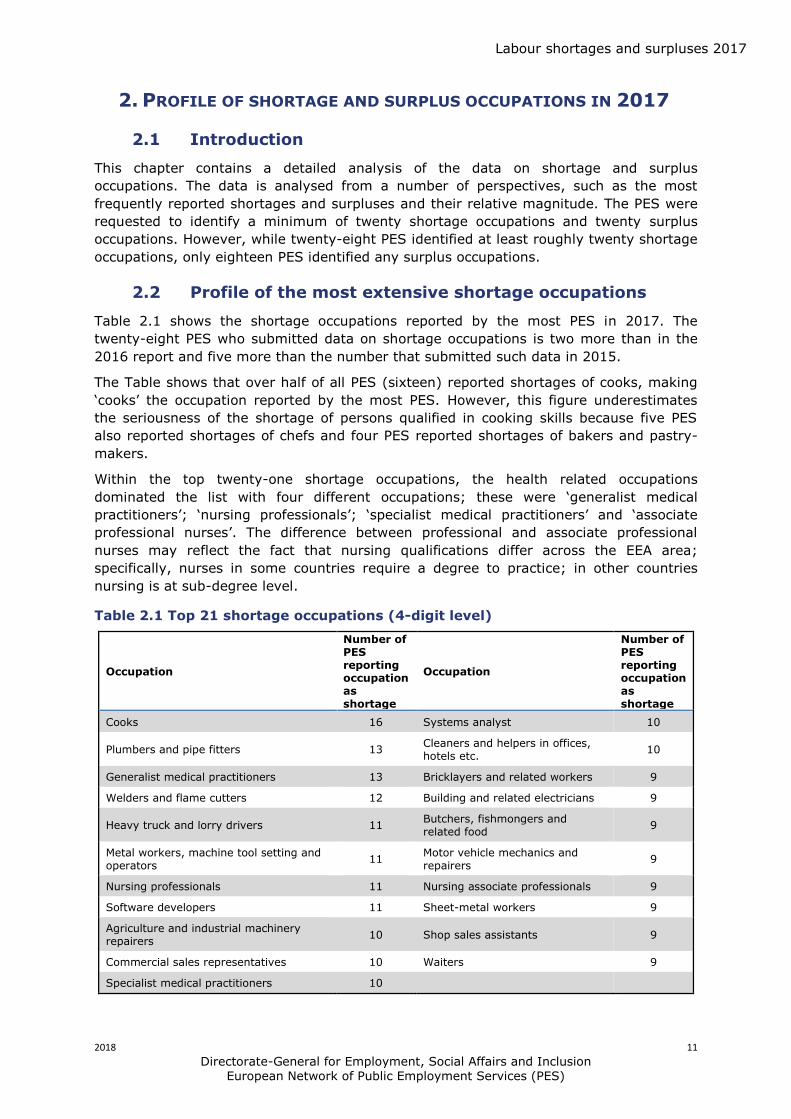
Labour shortages and surpluses 2017
2018 13
Directorate-General for Employment Social Affairs and Inclusion European Network of Public Employment Services (PES)
In contrast the list of occupations which have been identified by the PES as having
shortages of a high magnitude includes occupations which have been identified by as few
as two PES Therefore occupations which have not been included in the twenty one
shortage occupations identified by the most PES may qualify for inclusion in the list of
occupations with shortages of high magnitude
Table 22 High magnitude shortages (4-digit level)
Occupation Number of PES stating high magnitude of shortage
Occupation Number of PES stating high magnitude of shortage
Cooks 6 Cleaners and helpers in offices 2
Systems analysts 6 Contact centre sales persons 2
Concrete placers and concrete finishers
4 Database designers and administrators
2
Plumbers and pipe fitters 4 Heavy truck and lorry drivers 2
Shops sales assistants 4 Metal working machine tool setters 2
Waiters 4 Primary school teachers 2
Welders and flame cutters 4 Secondary school teachers 2
Nursing professionals 3 Other software and application developers
2
Application programmers 3 Software developers 2
Carpenters and joiners 3
Thus while lsquocooksrsquo retain the top ranking there are eight occupations in the list of
shortage occupations of high magnitude which are not included in the general list of
shortage occupations in Table 21 These include two lsquoteacherrsquo occupations and three new
lsquosoftwarersquo related occupations The two software occupations on the general list of
shortages in Table 21 are also included in this Table which means that five software
related occupations are considered to have shortages of high magnitude The position of
lsquosystems analystrsquo is particularly noteworthy A total of ten of twenty eight PES classify
this occupation as a shortage and six of these PES consider the shortage to be of a high
magnitude Thus shortages in this occupation appear to be both relatively widespread
and quite severe
The other finding of interest is that there are a considerable number of craft occupations
which are classified by a number of PES as shortages of high magnitude Thus four PES
rate lsquoplumbers and pipe fittersrsquo lsquoconcrete placersrsquo and lsquoweldersrsquo as shortages of high
magnitude while three PES also maintain that there are serious shortages of carpenters
24 Occupational groups by shortage magnitude
Figure 21 below shows how the PES classified shortages by broad occupational level in
terms of the severity of the shortage The figure shows that the professional shortage
occupations were classified by the most PES as high magnitude followed by the lsquocraft
and related trade workersrsquo Less than ten PES classified any other occupation as a
shortage of high magnitude but interestingly - while only four PES classified skilled
agricultural workers as a shortage - all of them ranked the shortage as being of high
magnitude Similarly while only seven PES categorised any of the clerical-related
occupations as a shortage five of the seven PES classified at least one of these
occupations as a shortage of high magnitude
Labour shortages and surpluses 2017
2018 14
Directorate-General for Employment Social Affairs and Inclusion European Network of Public Employment Services (PES)
Figure 21 Shortages by estimated shortage magnitude (1-digit level)
25 Profile of the most extensive surplus occupations
The PES were also requested to identify occupations for which there was an excess
supply and eighteen PES did so The surplus occupations identified by at least four
different PES are shown in Table 23
Intuitively one might expect that an excess supply of jobseekers is more likely to occur
in the case of occupations where the entry requirements are not associated with a high
level of qualifications or technical skills
Table 23 Surplus occupations (4-digit level)
Occupation Number of PES reporting this occupation as surplus
Occupation Number of PES reporting this occupation as surplus
Shop sales assistants 8 Tailors dressmakers furriers hat makers
4
General office clerks 8 Cashiers and ticket sales 4
Advertising and marketing professionals
6 Cleaners and helpers in offices hotels
4
Bank tellers and related clerks 6 Hand packers 4
Sociologists anthropologists and religious
6 Mail carriers and sorting clerks 4
Child care workers 5 Photographer 4
Hairdressers 5 Receptionist (general) 4
Journalists 5
In general this is the case as the occupations of lsquoshop sales assistantsrsquo lsquogeneral office
clerksrsquo lsquobank tellers and related clerksrsquo lsquocashiers and ticket salesrsquo lsquocleaners and helpersrsquo
0 5 10 15 20 25 30
Armed forces occupations
Managers
Skilled agricultural forestry and fishery workers
Clerical support workers
Elementary occupations
Plant and machine operators and assemblers
Technicians and associate professionals
Service and sales workers
Craft and related trades workers
Professionals
High Medium Low
Labour shortages and surpluses 2017
2018 15
Directorate-General for Employment Social Affairs and Inclusion European Network of Public Employment Services (PES)
lsquohand packersrsquo lsquomail carriers and sorting clerksrsquo and lsquoreceptionistsrsquo would not generally
require a high formal level of qualification
However four of the fifteen occupations lsquoadvertising and marketing professionalsrsquo
lsquosociologists and anthropologistsrsquo lsquojournalistsrsquo and lsquophotographersrsquo are professional
occupations Furthermore there are many professional and associate professional
occupations which are not included in the list of surplus occupations reported by the most
PES because they were reported by three or fewer PES These occupations include
lsquophilosophers historians and political scientistsrsquo lsquomusicians singers and composersrsquo
lsquoeconomistsrsquo lsquoother legal professionalsrsquo lsquointerior decoratorsrsquo and lsquoother artists and
associate cultural workersrsquo A list of the surplus occupations which were reported by at
least one PES is shown in Annex 3 of this report
In theory the fact that both the list of shortage occupations and the list of surplus
occupations contain many professional and associate professional occupations should
give rise to many cross-border matching possibilities However this is not the case
because virtually none of the professional or associate professional occupations appear
on both lists In general the professional and associate professional occupations
identified as being in surplus by the PES reflect disciplines in the humanities or the
creative arts In sharp contrast the professional and associate professional occupations
identified as shortage occupations by the PES are technical in nature and are dominated
by software and health related occupations
There is no doubt that many of the occupations identified by the PES as surplus
occupations are attractive to young people This is particularly so of occupations
associated with the creative arts But the analysis of PES data on shortages and
surpluses in this report would suggest that at least some of these occupations are
associated with limited career possibilities and that occupations of a technical nature
have superior career prospects
There are however two occupations lsquoshop sales assistantsrsquo and lsquocleaners and helpersrsquo
who appear in both the lists of shortages and surplus occupations and there are clearly
matching possibilities in these cases However the matching possibilities are not limited
to these two occupations there are many surplus occupations which have been identified
by less than four PES which have also been classified as shortage occupations by other
PES These cross-border matching possibilities are explored in chapter four
26 Profile of high magnitude surpluses
Only seven of the fifteen occupations listed as surplus occupations in Table 23 are not
classified as surpluses of high magnitude in Table 24 The list includes two more
professional occupations lsquobiologists botanists and zoologistsrsquo and lsquomanagement and
organisation analystsrsquo Both lsquojournalistsrsquo and lsquoadvertising and marketing professionalsrsquo
which are included in the list of surplus occupations reported by the most PES are also on
the list of occupations with high magnitude surpluses
One of the occupations which is new to the list is lsquobricklayers and related workersrsquo As
this occupation was also identified as a shortage occupation by nine PES its inclusion
does give rise to some cross-border matching possibilities
Labour shortages and surpluses 2017
2018 16
Directorate-General for Employment Social Affairs and Inclusion European Network of Public Employment Services (PES)
Table 24 High magnitude surplus occupations (4-digit level)
Occupation
Number of PES stating high magnitude of surplus
Occupation
Number of PES stating high magnitude of surplus
General office clerks 4 Journalists 2
Advertising and marketing professionals 3 Management and organisation analysts
2
Receptionist (general) 3 Manufacturing labourers 2
Shop sales assistants 3 Odd job persons 2
Biologists botanists zoologists and related
2 Photographers 2
Bricklayers and related workers 2 Bank tellers and related clerks 2
Child care workers 2 Security guards 2
Cleaners and housekeepers supervisors 2 Travel guides 2
Gardiners horticulturalists and nursery workers
2
27 Broad occupational groups by surplus magnitude
As in the case of shortages the professional group of occupations dominated the
occupations which were considered by the PES to have surpluses of high magnitude
(Figure 22) Indeed eight of the sixteen PES who rated surplus occupations by their
degree of severity identified at least one professional occupation as being in severe over-
supply
Interestingly the three PES who identified surplus occupations among plant and machine
operators and assemblers rated all the occupations they identified in this group as being
surplus occupations of high magnitude
Figure 22 Surpluses by estimated surplus magnitude
0 5 10 15 20
Managers
Plant and machine operators and assemblers
Skilled agricultural forestry and fishery workers
Craft and related trades workers
Clerical support workers
Elementary occupations
Service and sales workers
Technicians and associate professionals
Professionals
High Medium Low
Labour shortages and surpluses 2017
2018 17
Directorate-General for Employment Social Affairs and Inclusion European Network of Public Employment Services (PES)
28 Comparison of shortages and surpluses by broad
occupation
The issues which have been discussed above can be summarised in Table 25 below The
figures show that the 26 PES who reported at least one professional occupation as a
shortage represented 93 of all PES and that in total these PES identified 261
professional occupations as shortages
The situation is not quite as dramatic in respect of surplus occupations Nevertheless
fifteen PES representing 83 of all reporting PES identified a total of 88 professional
occupations as surplus occupations
However the most widespread reported surplus occupations were among the service and
sales group of occupations with almost 90 of PES reporting at least one surplus
occupation in this group The difference in the share of PES reporting shortages and
surpluses in the clerical group of occupations is also noteworthy Half the PES reported at
least one shortage occupation in this group but almost 80 of reporting PES included at
least one surplus occupation from this group
Table 25 Shortages and surpluses by broad occupation group
Broad occupation group
Number of
shortage occupatio
ns identified
Number of PES
reporting
shortages in this broad group
of PES reporting shortages
in this group
Number of surplus occupatio
ns identified
Number of PES
reporting surpluses
in this broad group
of PES reporting surpluses
in this broad group
Professionals 261 26 93 88 15 83
Craft and related trades 237 25 89 44 11 61
Associated professional technical
176 27 97 53 15 83
Services and sales 100 23 82 72 16 89
Plant and machinery 79 22 79 10 8 44
Elementary 53 14 50 37 12 67
Managers 43 11 39 16 7 39
Clerical support 34 14 50 47 14 78
Skilled agriculture 13 6 21 14 5 28
Armed forces 6 1 4 0 0 0
29 Cross-check with LSF data
Finally it is important to assess the extent to which the shortage and surplus occupations
identified by the PES in 2017 are accurate For this task we use the findings from the
2016 study which are based on the LSF data and the ratio of the unemployed to new
hires (Annex 4)
Although based on different levels of aggregation (4-digit vs 3-digit respectively) the
comparison of the PES reported shortages and surpluses in 2017 and the 2016 study LSF
ratio of unemployed and new hires suggests a high level of consistency Specifically PES
identified shortage occupations typically have the low ratio of unemployed to new hires
while the surplus occupations typically have the high ratio of unemployed to new hires
Labour shortages and surpluses 2017
2018 18
Directorate-General for Employment Social Affairs and Inclusion European Network of Public Employment Services (PES)
The only exceptions are the occupations of lsquocleanersrsquo lsquowaitersrsquo and lsquoshop sales
assistantsrsquo However this result is understandable as these occupations were classified
by the PES4 as labour shortages rather than skill shortages and consequently the
relatively high ratio could reflect the fact that there are a significant number of
unemployed available to work in these occupations
210 Conclusions
There are a number of significant conclusions which may be drawn from the analyses of
shortage and surplus occupations in this chapter
Firstly the widespread concern that using data from the PES may produce a significant
bias in the list of shortages and surpluses because the PES attract less vacancies and
job-seekers from higher skilled occupations appears to be unfounded Ironically the
professional occupations were the most frequently reported occupations in both the list of
shortages and surpluses
Secondly there is a distinct difference in the type of competences and qualifications
identified by the PES as shortages and surplus occupations and this difference was
evident throughout the different occupation groups In general the shortage occupations
embodied technical skills whether in health-related software-related or engineeringndash
related occupations at professional technical and craft levels
In sharp contrast the surplus occupations embodied selling service and clerical skills
cultural and artistic skills and competencies in the humanities
Finally the type of occupations which the PES associated with shortages and surpluses
are highly plausible In general the shortage occupations have a low ratio of unemployed
to new hires while the surplus occupations have a high ratio This consistency extended
to the occupations which the PES identified as labour shortages which exhibited a high
ratio
The classification of skill and labour shortages is one of the issues discussed in the next
chapter
4 While this is true when all three occupations are aggregated only two of five PES categorised lsquocleanersrsquo as a labour shortage ndash see chapter 3
Labour shortages and surpluses 2017
2018 19
Directorate-General for Employment Social Affairs and Inclusion European Network of Public Employment Services (PES)
3 PROFILE OF SHORTAGES AND SURPLUSES IN SPACE AND TIME
31 Introduction
In this chapter we analyse the occupations which have been identified by the European
PES as shortage and surplus occupations from the perspective of space and time We
review the geographical distribution of these occupations to ascertain if this distribution
provides an insight into what may have given rise to these shortages and surplus
occupations and we also examine the extent to which the same shortage and surplus
occupations have persisted over time using the findings from previous studies
32 PES methods used for identifying shortages and surpluses
In the previous chapter it was noted that only eighteen of twenty-eight PES submitted a
list of surplus occupations A review of the methods used by the PES to identify shortage
occupations may provide an insight into why ten PES did not provide any data on surplus
occupations
A summary of the methods used to identify shortage occupations is provided in Table 31
below The data indicates that exactly ten PES did not use any administrative data in
identifying their shortage occupations but rather used other sources such as employer
surveys national forecasting studies or immigration data It is tempting to conclude that
this is the reason why only 18 out of 28 PES provided data on surplus occupations as
these methodologies are not generally associated with the provision of information on
occupations which are in surplus
However such a conclusion would not be entirely accurate The analyses found that the
use of survey data did not necessarily preclude a PES from identifying surplus
occupations The Danish PES for example used the results of their Labour Market Balance
Survey and was able to provide a comprehensive list of surplus occupations In contrast
the Italian and Norwegian PES who relied on national forecasts and surveys respectively
were unable to provide such a list
Furthermore not all of the PES who based their identification of shortages on their
administrative data systems provided a list of surplus occupations Those who did
generally used the ratio of job-seekers to vacancies to identify whether an occupation
was a shortage or surplus occupation But a number of PES such as the German and
Luxemburg PES and the Belgium regional PES Actiris while basing their identification of
shortage and surplus occupations on administrative data used quite sophisticated
techniques such as the share of vacancies filled and the duration of vacancy filling Unlike
the ratio of job-seekers to vacancies such techniques do not readily provide an indicator
for identifying an occupation as a surplus occupation5
5 While it is reasonable to classify an occupation as a shortage occupation if the filling of vacant posts in that occupation takes on average an exceptionally long time identifying surplus occupations is somewhat more problematic using this method
Labour shortages and surpluses 2017
2018 20
Directorate-General for Employment Social Affairs and Inclusion European Network of Public Employment Services (PES)
Table 31 Methods used by the PES to identify shortage occupations
PES methods for identifying shortages and surpluses Number of PES
Combination of administrative data PES surveys and expert opinion
1
Combination of administrative data PES surveys and 3rd party data
1
Combination of administrative data and PES surveys 7
Combination of administrative data and 3rd party data 1
Combination of administrative data and expert opinion 2
PES work permit data only 2
PES administrative data only 6
PES survey data only 2
PES warehousing data only 1
3rd party surveys and forecasts 5
Total 28
The fact that only eighteen PES provided a list of surplus occupations is a serious
weakness of this study because it places a limit on the potential of the analyses to
identify cross border matching opportunities between shortage and surplus occupations
Consequently in the future every effort should be made to significantly increase the
number of PES providing a list of surplus occupations even if this means that a
significant number of PES use alternative methodologies to identify shortage and surplus
occupations rather than a single methodology to do both as has occurred in both the
2016 study and the current study6
33 Geographic distribution of shortages and surpluses
The 28 PES who submitted data on shortages cover a very wide geographic area which
include labour markets with very different characteristics It may be informative
therefore to assess the extent to which the distribution of shortage occupations differed
between different countries
Table 32 below shows the number of reported shortage occupations within their broad
occupation group and the PES who reported the occupation as a shortage7
While each PES was requested to submit a maximum of twenty shortage occupations a
total of ten PES provided more than that and in the case of the Slovenian French and the
regional Belgian PES Actiris significantly more
A total of six PES identified less than twenty shortage occupations but in most cases the
difference was negligible
The Croatian and Portuguese PES were the only PES which did not identify any
professional occupation in their list of shortage occupations This may reflect the type of
vacancies which are notified by employers to these PES because both these PES use
their own administrative data systems exclusively to identify shortage occupations
6 In the 2016 study while 26 PES provided data on shortage occupations 13 provided data on surplus
occupations 7 Three groups are excluded from the Table managers (43) skilled agricultural (13) and armed forces (1) as the figures are quite small
Labour shortages and surpluses 2017
2018 21
Directorate-General for Employment Social Affairs and Inclusion European Network of Public Employment Services (PES)
Table 32 Shortages number of mentions (4-digit) in broad occupation (1-digit)
PES Professional Technical Clerical Craft Service Plant Elementary Total
Austria 4 11 1 12 2 0 0 30
Actiris 28 22 6 11 13 2 0 82
Le Forem 6 6 0 6 0 0 0 18
VDAB 4 7 1 4 1 3 0 20
Bulgaria 7 0 0 4 5 3 2 21
Croatia 0 1 0 13 1 3 2 20
Cyprus 6 1 2 5 5 1 6 26
Denmark 5 1 0 7 3 2 1 19
Estonia 10 7 0 0 2 1 0 20
Finland 12 5 1 7 2 2 3 32
France 18 27 2 27 1 26 2 103
Germany 16 19 0 10 2 1 1 49
Hungary 2 6 6 8 14 3 12 51
Iceland 6 3 0 5 2 1 3 20
Ireland 13 2 0 4 1 1 0 21
Italy 2 2 1 7 4 1 3 20
Latvia 7 1 1 9 0 0 0 18
Lithuania 1 2 0 15 0 2 0 20
Luxemburg 8 4 0 0 0 0 0 12
Malta 5 3 3 4 6 1 4 26
Netherlands 20 11 3 23 2 1 0 60
Norway 13 3 0 10 10 4 1 41
Poland 10 6 2 2 3 3 4 30
Portugal 0 1 0 8 3 3 0 15
Slovakia 6 6 2 5 5 2 0 26
Slovenia 23 13 3 30 11 13 9 102
Sweden 15 2 0 1 2 0 0 20
Switzerland 14 4 0 0 0 0 0 18
Total 261 176 34 237 100 79 53 940
The stipulation to only provide a list of twenty shortage occupations may have prevented
any pattern from emerging in the figures For example there does not appear to be any
relationship between the numbers of employed and unemployed in a specific labour
market and the number of shortage occupations identified by its national PES
The two PES who submitted the highest volumes of shortage occupations - the French
and Slovenian PES - vary greatly in terms of the relative size of their labour force while
for example the Norwegian PES submitted significantly more shortage occupations than
much larger countries such as Germany and Poland
As a way of controlling for the variation in the total number of shortage occupations it
may be useful to compare the variation within the list of shortage occupations identified
by each PES However no obvious patterns emerge when a number of hypotheses are
tested using this approach For example there appears to be no relationship between
countries which are associated with strong apprenticeship systems such as Germany
Austria Denmark and Switzerland and their share of shortages among the craft group of
occupations The Swiss PES does not contain any craft occupations in its list of shortage
occupations while the craft group of occupations contain the most shortage occupations
in the lists provided by both the Austrian and Danish PES In the case of the German
PES the share of craft occupations is a little above the average
Labour shortages and surpluses 2017
2018 22
Directorate-General for Employment Social Affairs and Inclusion European Network of Public Employment Services (PES)
Table 33 Surpluses number of mentions (4-digit) in broad occupation (1-digit)
PES Professional Technical Clerical Craft Service Plant Elementary Total
Le Forem 2 1 1 1 6 0 8 19
Bulgaria 6 3 2 0 4 0 2 17
Switzerland 0 4 2 4 1 2 3 16
Cyprus 5 0 0 2 0 0 3 10
Denmark 3 2 3 0 6 1 4 19
Estonia 6 2 3 2 6 0 1 20
Finland 16 7 6 10 3 1 0 43
France 10 10 1 2 5 1 0 29
Croatia 4 0 0 0 0 0 0 4
Hungary 6 9 3 16 15 1 2 52
Ireland 1 1 4 3 5 1 7 22
Iceland 11 1 2 2 1 0 1 18
Lithuania 0 3 1 0 2 2 0 8
Latvia 4 4 0 0 3 1 3 15
Netherlands 3 2 9 0 9 0 1 24
Poland 0 0 0 0 1 0 0 1
Sweden 4 3 7 1 3 0 2 20
Slovakia 7 1 3 1 2 0 0 14
Total 88 53 47 44 72 10 37 351
The most striking aspect of the geographical distribution of surplus occupations is the
relatively low number of occupations which were reported Most of the reporting PES
(eleven) provided less than the twenty surplus occupations they were requested to
submit Furthermore if the contributions from the Hungarian and Finnish PES are
excluded the average number of surplus occupations submitted by the other PES is
sixteen
With the exception of the Icelandic Finnish French and Hungarian PES the list of
surplus occupations remains in single figures across all the broad occupational groups
Such low figures result in limited cross-border matching possibilities which are explored
in the next chapter
The PES were also asked to indicate the lowest regional level at which they could provide
data on both shortage and surplus occupations Their response is outlined in Table 34
above A total of twenty PES responded positively in the case of shortage occupations
and twelve in the case of surplus occupations In the case of shortage occupations nine
PES indicated that they could provide data at NUTs3 level while eight PES stated that
they could provide the data at NUTs1 level In the case of surplus occupations five PES
indicated that they could provide the data at NUTs1 level and another five PES responded
that they could provide the data at NUTs 3 level There were very few PES who indicated
that the lowest level at which they could provide data was at NUTs2 or NUTs4 levels
Labour shortages and surpluses 2017
2018 23
Directorate-General for Employment Social Affairs and Inclusion European Network of Public Employment Services (PES)
Table 34 Availability of data on shortagessurpluses at regional levels
Shortage occupations Surplus occupations
Country NUTS1 NUTS2 NUTS3 NUTS4 No
data NUTS1 NUTS2 NUTS3 NUTS4
Austria
x
Belgium Actiris
x
Belgium Le Forem
x
x
Belgium VDAB
x
Bulgaria
x
x
x
Croatia x
x
Cyprus
x
x
Denmark
x
x
Estonia x
x
Finland
x
x
France
x
x
Germany x
Hungary
x
x
Iceland x
x
Ireland x
x
Italy
x
Latvia
x
x
Lithuania
x
x
Luxembourg x
Malta
x
Netherlands
x
x
Norway
x
Poland
x
x
Portugal
x
Slovakia
x
x
Slovenia x
Sweden
x
x
Switzerland
x
x
Note Bulgaria has regional data for some occupations
34 Tracking shortages over time
This is the third annual study on lsquoBottleneck Occupationsrsquo the previous two studies were
undertaken in 2016 and 2015 The findings in both of those studies were presented in 3-
digit codes To make the findings comparable over time the 4-digit shortage and surplus
occupations from the current study are aggregated up to 3-digit occupations as shown in
Table 35
A striking aspect of the list of occupations in Table 35 is the degree of consistency
displayed over the period 2015-2017 inclusive not simply in terms of the occupations
reported by the PES but also in terms of the number of PES who identified them as
shortages (ie their ranking) Not only does the 3-digit occupation category of lsquosoftware
and applications developersrsquo occupy the top ranking in each of the years five of the top
ranking six occupations are the same The only notable exception is that the finance
professional and associate professional occupations featured in the list of most reported
shortage occupations in 2015 but slipped out of this list in 2016 and 2017
Labour shortages and surpluses 2017
2018 24
Directorate-General for Employment Social Affairs and Inclusion European Network of Public Employment Services (PES)
Table 35 Ranking of shortage occupations (3-digit)
Rank
Top occupations in 2017 2017 2016 2015
Software and application developers 1 1 1
Sheet and structural metal workers 2 3 2
Medical doctors 3 5 2
Blacksmiths toolmakers and related trades 4 3 4
Building finishes and related trade workers 4 6 4
Building frame and related trade workers 4 3 4
Cooks 4 7 7
Engineering professionals 5 6 6
Physical and engineering science technicians 6 7 na
Electrical equipment installers and repairers 7 4 5
Heavy truck and bus drivers 7 5 4
Machinery mechanics and repairers 8 7 5
Nursing and midwifery professionals 8 6 na
Sales and purchasing agents and brokers 9 2 5
Shop salespersons 10 7 8
Electro technology engineers 10 na na
Primary school and early childhood teachers 10 na na
Domestic hotel and office cleaners and helpers 10 na na
Waiters and bartenders 10 na na
35 3-digit vs 4-digit
There are advantages and disadvantages associated with using the more aggregated 3-
digit occupation classification as it was done in previous studies The bundling of
individual occupations into families provides greater visibility of shortages at a broad
skill level (eg all software related occupations)
However there are distinct disadvantages in using the 3-digit occupations and these
apply particularly to their practical usefulness to education and training providers In
many cases shortages identified at 3-digit level do not provide a reliable basis for
identifying the specific skill which is in shortage or surplus
By combining the analyses of the 4-digit and corresponding 3-digit classifications in this
report many examples are revealed of how an exclusive reliance on the 3-digit
classification could be seriously misleading Thus the findings in this report show that
within the 3-digit classification of lsquosheet and structural metal workers moulders and
weldersrsquo the 4-digit occupation which is in short supply is lsquoweldersrsquo and not for example
lsquosheet metal workersrsquo This is an important insight because in many European countries
the skills of welding and sheet metal work are provided through entirely different
vocational programmes8
There are many examples of this phenomenon in the 3-digit occupations in Table 35 For
example the analysis in this report shows that toolmakers are a shortage occupation
8 In Ireland for example sheet metal workers and welders undertake entirely different apprenticeships
Labour shortages and surpluses 2017
2018 25
Directorate-General for Employment Social Affairs and Inclusion European Network of Public Employment Services (PES)
but blacksmiths are not Furthermore the 3-digit classification disguises the extent of the
reported shortage Thus while the 3-digit occupation of professional nursing and
midwifery is shown in the current report as being shortage occupations a total of eleven
PES reported professional nursing as a shortage compared to only three PES reporting
professional midwifery as a shortage By bundling these occupations together the
significant difference in the relative severity of the shortage is not apparent
This phenomenon applies equally to the surplus occupations which were identified in this
report For example lsquochildcare workersrsquo were described as a surplus occupation by five
PES But in the 3-digit classification they are bundled together with lsquospecial needs
teachersrsquo which was not identified as a surplus occupation
36 Conclusions
There are a number of conclusions which can be drawn from the analyses in this chapter
Firstly the sources used by many of the PES to identify shortage occupations is one of
the main reasons why only eighteen PES provided data on surplus occupations Many of
the PES relied on the results of employer surveys forecasting models and immigration
data to identify shortages and these sources in general do not provide data on surplus
occupations However it was by no means the only reason why so many PES did not
provide data on surplus organisations and this issue will have to be addressed before the
commencement of the 2018 study In the future PES data should be augmented by data
collected by other bodies as outlined in the new EU Regulation
Secondly there is no obvious explanation for the geographic distribution of shortages
and surpluses In some cases countries with relatively small labour forces have a
relatively high number of shortage occupations while a strong apprenticeship system
does not appear to prevent a relatively high share of the identified shortages being in the
craft occupations It may be that the stipulation to only include twenty shortage and
surplus occupations has created a situation where some countries with a relatively large
labour force are artificially constrained to submit a much smaller number of shortage
occupations than they actually have
Thirdly there is a high degree of stability in relation to the occupations which were
identified as shortages in the 2015 2016 and 2017 editions of the Bottleneck report
Finally providing information on shortage and surplus occupations at 4-digit level is
much more useful from a policy perspective than providing the data at a more
aggregated level The results of the analyses at 4-digit level show which specific
occupations in the bundle of occupations used in the previous reports were in shortage
and which were not This is also true of the occupations which were identified as surplus
occupations A more aggregated group of occupations does not allow for the targeting of
specific individual occupations either for increasing training provision or for enhancing
cross border mobility Indeed as a number of specific examples show were providers of
vocational training or indeed policy makers to act on the basis of the 3-digit shortage and
surplus occupations identified in previous reports they could very well have assign
resources to occupations which were neither in shortage nor in surplus
Labour shortages and surpluses 2017
2018 26
Directorate-General for Employment Social Affairs and Inclusion European Network of Public Employment Services (PES)
4 THE CAUSES OF SKILL SHORTAGES AND POTENTIAL SOLUTIONS
41 Introduction
The focus of this chapter is on identifying the possible causes of skills shortages and
surpluses and exploring ways in which these imbalances may be resolved The chapter
begins with a review of the nature of skills and labour market imbalances and concludes
with an exploration of the extent to which enhanced cross-border mobility policies and
more equal gender representation could contribute to the alleviation of skills and labour
imbalances in certain shortage occupations in the EEA labour market
42 The role of skills and labour shortages in skills imbalances
One of the new questions included in the current study asks the PES to identify the
nature of the shortage (ie is it a skill shortage or a labour shortage) in relation to each
shortage occupation they identified It was explained in the questionnaire that labour
shortages occur when there are a sufficient number of appropriately qualified job-seekers
to fill the vacancies which arise but for a variety of reasons many of them do not wish
to work in the occupation in question Their response to this question is summarised in
Table 41 in respect of the twenty occupations which were reported by the most PES
A total of twenty-six PES classified their shortage occupations as skill or labour
shortages and they classified most of the occupations as skill shortages Indeed in the
case of seven occupations plumbers doctors software developers electricians
electronic engineers electronic engineering technicians bus and tram drivers and
mechanical engineers all of the reporting PES classified the shortage as a skills deficit
Each labour market within the EEA is regulated in a particular manner and conditions of
employment even within the same occupation vary throughout the region This is why
many occupations while classified by most of the PES as reflecting skill deficits
nevertheless are classified by some PES as labour shortages
However the number of PES involved is very small indeed Only in the case of three
occupations lsquowaitersrsquo lsquoshop sales assistantsrsquo and lsquoprimary school teachersrsquo are there
more PES classifying the shortage as a labour shortage then a skills deficit The first two
occupations are undoubtedly labour shortages This is because there are few if any
barriers to working in these occupations9
The inclusion of lsquoprimary school teachersrsquo as a labour shortage is however a surprise It
was identified by eight PES as a shortage occupation two of whom classified the
occupation as a shortage of high magnitude It would be necessary to conduct research
into the conditions of employment ndash including qualification criteria ndash within the countries
where the reporting PES are located to establish if this classification of the occupation as
a labour shortage is warranted
With some notable exceptions the response of the PES to classifying their shortage
occupations as skill or labour shortages demonstrates that the PES understand these
concepts Occupations such as professional nurses which are obviously suffering from a
shortage of qualified job-seekers in the EEA are overwhelmingly categorised as a skills
shortage while less skilled occupations such as cleaners are categorised as being on the
borderline between skills and labour shortages
9 Both occupations have relatively high ratios of unemployed to new hires (Annex 4)
Labour shortages and surpluses 2017
2018 27
Directorate-General for Employment Social Affairs and Inclusion European Network of Public Employment Services (PES)
Table 41 Skill and labour shortages
Occupation
Number of PES
reporting occupation
as skills shortage
Number of PES
reporting occupation as labour shortage
Number of PES
reporting occupations as skill and
labour shortage
Total number of
PES reporting on skillslabour
shortage
Cooks 9 1 0 10
Plumbers and pipe fitters 8 0 0 8
Generalist medical Practitioners 7 0 0 7
Heavy truck and lorry drivers 4 2 1 7
Metal workers machine tool setting and operators
3 3 1 7
Welders and flame cutters 4 2 1 7
Nursing professionals 5 1 0 6
Software developers 6 0 0 6
Systems analyst 5 1 0 6
Bricklayers and related trades 4 1 0 5
Building and related electricians 5 0 0 5
Butchers fishmongers and related food 3 2 0 5
Cleaners and helpers in offices 3 2 0 5
Commercial sales representatives 2 2 1 5
Electronic engineers 5 0 0 5
Manufacturing supervisors 4 1 0 5
Motor vehicle mechanics and repairers 3 1 1 5
Nursing associate professionals 4 1 0 5
Primary school teachers 2 3 0 5
Shop sales assistants 1 4 0 5
Waiters 2 3 0 5
Agriculture and industrial machinery repairers
3 1 0 4
Application programmers 3 1 0 4
Bus and tram drivers 4 0 0 4
Electronic engineering technicians 4 0 0 4
Health care assistants 3 1 0 4
Mechanical engineers 4 0 0 4
Sheet metal workers 3 1 0 4
Structural metal preparers and erectors 3 1 0 4
Total number of PES reporting 16 8 2 26
The atypical working hours associated with heavy goods vehicle driving is recognised by
two of the six PES who classify shortages in the occupation as labour shortages while the
unpleasant conditions associated with working in butchery shops and abattoirs is
reflected in the fact that two of the five PES who categorised the occupation as a
shortage occupation classify it as a labour shortage
43 Location of skill imbalances and cross border mobility
In recent years there has been considerable discussion on the potential role which
enhanced cross-border mobility could play in alleviating labour market imbalances The
attractiveness of such a policy is obvious The European Union is a very large
Labour shortages and surpluses 2017
2018 28
Directorate-General for Employment Social Affairs and Inclusion European Network of Public Employment Services (PES)
marketplace embracing a very large labour force if even some of the shortages which
are reported by EEA countries could be resolved by exploiting the surpluses which are
reported by other EEA countries it could form the basis of a number of win-win solutions
for both job-seekers and businesses
An additional attraction of this policy is that it could potentially successfully address both
skills and labour shortages as working conditions associated with some labour shortages
in one country might be perceived as significantly more attractive in a different EEA
country
Table 44 provides a list of the top twenty shortage occupations which have at least one
PES in another EEA country reporting the occupation as a surplus
There are a number of aspects of the Table which are notable Firstly the list of top
occupations has changed quite dramatically from the list in Table 21 specifically none
of the professional and associate professional occupations are now on the list including
the four professional and associate professional health-related occupations or the two
professional software occupations What the Table shows is that there are no surpluses
reported in any of the EEA countries of doctors or nurses software developers or
systems analysts While the occupation of healthcare assistants is in surplus in many
countries it was not included in the list of top occupations because it was reported as a
shortage by only two PES
The figures in Table 42 show that there are three cross-border matching possibilities in
the case of bricklayers and motor mechanics and two possibilities in the case of
plasterers health care assistants and secondary school teachers
There is just one matching possibility in respect of a wide range of occupations including
cooks truck drivers commercial sales representatives electricians carpenters civil
engineers primary school teachers manufacturing supervisors telecentre salespersons
childhood education teachers floor layers and roofers
The fact that primary school teachers have only one cross border matching possibility
suggest that the classification of the occupation as a labour shortage by three of five PES
is an error In general labour shortages would be expected to have more cross border
matching possibilities than skill shortages because there are many job-seekers eligible to
work in the occupation in question and working conditions vary quite significantly from
country to country Indeed it is notable that the two other occupations which were
classified by the PES as predominantly labour shortages waiters and shop sales
assistants have a relatively high number of matching possibilities eight in the case of
shop sales assistants and three in the case of waiters
In general the PES did not classify the same occupation as both a shortage and a
surplus A striking exception is the Danish PES which categorised four of its shortage
occupations as surplus occupations also This is most likely due to the higher level of
granularity available in the Danish data (below 4-digit) so that some job titles within an
occupation are considered labour shortage while others skill shortage
44 Assessing gender composition of surpluses
The PES were asked to estimate the share of females in the occupations which they
identified as lsquosurplusrsquo occupations The restricting of this question to surplus occupations
was to avoid giving the impression that shortages were arising because of discriminatory
recruitment policies
Labour shortages and surpluses 2017
2018 29
Directorate-General for Employment Social Affairs and Inclusion European Network of Public Employment Services (PES)
A total of 13 PES reported any data on gender composition of surpluses However the
quality of information submitted did not provide a sufficient basis for an accurate
estimation of the gender composition of surpluses in some of the cases
It is suggested that in order to address gender imbalances in relation to shortages and
surpluses data from PES on job seekers should be combined with the LSF data on
employment by occupation
45 Conclusions
The analysis in chapter four has produced a number of interesting findings The analysis
reveals that the PES in general has the capacity to distinguish between skill and labour
shortages and to identify shortage occupations which have some cross-border matching
possibilities
The relatively low number of surplus occupations reflects two factors firstly only
eighteen PES submitted a list of surplus occupations and secondly in many cases the
lists did not include the maximum number of twenty occupations which were requested
This response has to be viewed against the background of an EEA labour market where
employment is expanding and unemployment is contracting However while this is a
positive development the relatively low number of surplus occupations has placed a
significant limit on the extent to which there were cross-border possibilities of matching
shortage with surplus occupations
The data indicates that there is a limitation to the extent to which the PES can be used to
identify the gender imbalances (eg under-representation of females in some
occupations) and that other sources should be explored
Labour shortages and surpluses 2017
2018 30
Directorate-General for Employment Social Affairs and Inclusion European Network of Public Employment Services (PES)
Table 43 The potential for cross-border matching of shortage and surplus occupations
No PES
Occupation PES reporting shortage PES reporting surplus No PES
16 Cooks AT Art BG CY DK HR IE IS IT MT NL NO PT SE SI SK lsaquo―rsaquo HU 1
11 Truck drivers ART VDAB BG DK HR LT IT NL NO PT SE SI SK lsaquo―rsaquo DK 1
10 Cleaners helpers CY DK HR FI IS HU NL NO PT SI lsaquo―rsaquo DK LF NL IE 4
10 Commercial sales VDAB ART DK FI FR IT IE PT PL SI lsaquo―rsaquo DK 1
9 Sales assistants AT ART BG CY DK IT NO SI SK lsaquo―rsaquo DK LF SE NL BG CH FI IE 8
9 Bricklayers ART DE DK HR HU LT NL PT SI lsaquo―rsaquo CY HU IE 3
9 Motor mechanics AT VDAB ART LF DK IT NO PT SI lsaquo―rsaquo SK CH EE 3
9 Waiters ART BG CY IS IT MT NO PT SI lsaquo―rsaquo HU EE IE 3
9 Electricians ART VDAB DE DK IS IT NL NO SI lsaquo―rsaquo FR 1
8 Carpenters DK HR HU FI NL NO PT SI lsaquo―rsaquo HU 1
8 Civil engineers ART CH DE FI FR NO SE SI lsaquo―rsaquo CY 1
8 Primary teachers ART BG DK IS NO SE SI SK lsaquo―rsaquo CY 1
7 Healthcare assist CY DK EE NL NO SI SK lsaquo―rsaquo DK NL 2
7 Second teacher ART BG FR NL NO SI SK lsaquo―rsaquo CY FI 2
7 Man supervisors ART VDAB LF DE EE FR SK lsaquo―rsaquo BG 1
6 Plasterers HR HU FI LT NL SI lsaquo―rsaquo HU IE 2
6 Tele centre sales ART HU FI FR MT NO lsaquo―rsaquo EE 1
6 Childhood educ FI LT NO SE SI SK lsaquo―rsaquo CY 1
6 Floor layers HU HR FI FR LT LV lsaquo―rsaquo HU 1
6 Roofers HR FI FR LT LV SI lsaquo―rsaquo HU 1
Bottlenecks Occupations 2017
2017 31
Directorate-General for Employment Social Affairs and Inclusion European Network of Public Employment Services (PES)
5 CONCLUSIONS AND RECOMMENDATIONS
51 Conclusions
The terms of reference for this study emphasise the desirability of creating a process for
the systematic collection of data on surplus and shortage occupations in the EEA area
which could be effectively used by EURES for cross border matching of shortage
occupations in some EEA countries with surplus occupations in others
The authors have responded to this emphasis by using a process which ensures that the
data gathered on shortage and surplus occupations is comprehensive accurate and of
practical use to EURES and the providers of education and training programmes The
process is comprehensive because it gathers information both on the extent of shortages
and surpluses and on their relative severity It is accurate because the list of shortage
and surplus occupations are shown to be consistent with the estimated value of the ratio
of unemployed to new hires Finally the process provides information which is of
practical use to EURES and the national providers of VET because the data gathered is on
individual occupations rather than on lsquobundles of occupationsrsquo as in previous studies The
analyses in this report shows that while these bundles of occupations contain some
occupations which are identified by the PES as shortage and surplus occupations they
also contain occupations which are neither in shortage nor in surplus and it is impossible
to distinguish one from the other
The data gathering process used in this report however was not devoid of weaknesses
Fortunately these weaknesses reflect the modus operandi of the PES and may be
rectified by including other institutions and agencies in the process For example the PES
use the same sources for the identification of both shortage and surplus occupations
This may have advantages in terms of accuracy when those sources include employersrsquo
surveys immigration data and the results of forecasting exercises However these
sources are not suitable for gathering data on surplus occupations and they are the main
reason why the number of surplus occupations provided by the PES were almost half the
number requested In the future PES data could be augmented by data gathered by
other bodies as outlined in recent EU Regulation 2016589
In addition the response to the question on the capacity of the PES to deliver data on
shortage and surplus occupations at a regional level was also disappointing perhaps
reflecting a misalignment in some EEA countries between the geographic configuration of
the local PES network and the NUTs regions
The analysis highlighted that in order to assess gender imbalances of shortages and
surpluses PES data needs to be augmented by other sources
Finally despite the low number of surplus occupations submitted by the PES it was
nevertheless possible to identify twenty shortage occupations in the EEA labour market
which had at least one cross-border matching possibility and many more than one in the
case of some shortage occupations
52 Recommendations
Based on the findings from the three bottleneck studies undertaken to date a model for
the gathering of data on shortages and surpluses is proposed (Figure 51) The model
includes features of the methodology applied in this study which were successful It also
includes a number of features which should be introduced to the process in order to
address some of the weaknesses which were identified in this study (highlighted in red)
Labour shortages and surpluses 2017
2017 32
Directorate-General for Employment Social Affairs and Inclusion European Network of Public Employment Services (PES)
However before this methodology is implemented it would be prudent to discuss data
requirements with PES and invite a broader range of institutions and agencies to
participate in aspects of the data gathering process in addition to the PES EURES
Regulation (EU) 2016589 of the European Parliament and of the Council which obliges
the appropriate national authorities to furnish such data annually is fortuitous in this
regard and should facilitate the implementation of this recommendation
In addition the results of these and other relevant studies should be disseminated to
PES Eures coordination group and other relevant agencies and institutions in order to
emphasise the importance of data and analysis in informing policy at EU and national
level which aims to resolve labour market imbalances
Labour shortages and surpluses 2017
2017 33
Directorate-General for Employment Social Affairs and Inclusion European Network of Public Employment Services (PES)
Figure 51 Model for gathering data on shortage and surplus occupations
Sources of data on surpluses PES data from other relevant agencies
In those cases where the source used by the PES to identify shortage occupations cannot
be used to identify surplus occupations other institutions or other sources or both should be availed of to ensure that comprehensive data on surplus occupations are provided to the appropriate national authority
Dimensions of shortagessurpluses extent (number of reporting PES) and severity (high or low
magnitude)
Data should be systematically gathered on both the extent of shortage and surplus
occupations in the EEA and on their relative severity
Type of shortage skill vs labour shortages
The providers of the data on shortage occupations must also distinguish between skill and labour shortages because this distinction is necessary for the accurate identification of
shortage occupations and for the choice of the appropriate policy response to identified shortages
Classification of occupations used ISCO 08 4-digit codes (or translation into these codes)
All data should be either initially gathered in ISCO 08 4-digit codes or translated into these
codes This ensures that the data refers to specific individual occupations and is of practical use to EURES and the national providers of VET
Accuracy test cross-check with LSF data (ratio of unemployed to new hires)
The accuracy of the submitted lists of shortage and surplus occupations should be assessed
by comparing the most widely reported surplus and shortage occupations with the estimated values of the ratios of employed (by previous occupation) to new hires at the aggregated EU28 level These ratios should be based on an analysis of the most up-to date
Labour Force Survey (LFS) data
Gender balance assessment LFS data on employment at occupational level by gender PES job
seekers
The gender composition of shortage and surplus occupations should be based on the most
up to date analyses of LFS data on employment by gender and the PES job seeker data
Regional balance assessment LSF data data from relevant agencies
Where regional data is required other agencies and institutions should be requested to
provide the data in those cases where the data cannot be provided by the regional PES network because it is not geographically aligned to the NUTs regions
Labour shortages and surpluses 2017
2017 34
Directorate-General for Employment Social Affairs and Inclusion European Network of Public Employment Services (PES)
Number of occupations reporting should be extended beyond 20 occupations but with upper
limit (eg 50)
Consideration should be given to allowing the agencies responsible for identifying shortage
and surplus occupations a greater range of flexibility in terms of the numbers of occupations which should be identified A minimum to maximum range would be a more realistic approach as it would reflect the fact that the labour markets of the EEA vary significantly in size and performance
Timing of imbalance assessment September
It is proposed that the data gathering exercise should be brought forward to early September and that expert advice should be available on line throughout the data
gathering exercise
Labour shortages and surpluses 2017
2017 35
Directorate-General for Employment Social Affairs and Inclusion European Network of Public Employment Services (PES)
ANNEX 1 DATA COLLECTION TEMPLATE Information sought Explanation
Occupation title (text) Type in free text a list of occupations (one row one occupation) for which shortages and surpluses exist first list occupations for which there is a shortage the list should contain a maximum of 20 occupations if your list contains less than 20 occupations please provide a brief explanation in your email response for why the number is lower than 20 second list occupations for which there is a surplus the list should contain a maximum of 20 occupations if your list contains less than 20 occupations please provide a brief explanation in your email response for why the number is lower than 20
Shortagesurplus indicator For each occupation indicate if it refers to a shortage by typing in shortage or surplus by typing in surplus to identify surplus occupations you can examine for each occupation the ratio of the number of job seekers to the number of vacancies at the end of each year for example if there are 5000 shop assistants seeking employment and there are 200 vacancies at the end of the reference period the ratio is 251 you can rank the calculated ratios and report the occupations associated with the 20 highest ratios
Occupational classification used in your country
For each occupation indicate what occupational classification (if any) was used to identify this occupation for instance you can report a country specific classification ISCO ROME SOC etc If you donrsquot use occupational classifications type None
Occupation code to the lowest level of disaggregation (eg ISCO at 4 digits)
If you have indicated a classification used type the code for each occupation use the lowest level of disaggregation (eg 4 digit ISCO code) if you donrsquot use occupational classification leave black
ISCO-08 code at 4-digit level (or lower if 4-digit not available)
If you use occupational classification which is not ISCO-08 and if it is possible provide a translation of the national code to ISCO-08 code ISCO is the International Standard Classification of Occupations which is used to report to Eurostat code should be at 4 digits if this is not available than the lowest level of disaggregation that is available should be reported (3 digits if 4-digit code is not available 2 digits if neither 4-digit nor 3-digit code is available 1 digit if neither 4-digit 3-digit nor 2-digit code is available) if it is not possible to provide translation to ISCO-08 leave black if you have already reported ISCO-08 code in column 3 leave this column black
Estimate of shortagesurplus magnitude (high (gt3 of employment) medium (1-3 of employment) low (lt1 of employment))
For each occupation indicate a broad estimate of the magnitude of the shortagesurplus if you estimate that the shortagesurplus is less than 1 of the total employment in the occupation in question type low if between 1-3 type medium if greater than 3 type high if you cannot provide a rough estimate of magnitude type dont know
Current shortagesurplus (C) future short term (FST) future medium term (FMT) future long term (FLT) donrsquot know (indicate all that apply)
Against each occupation indicate if the identified shortagesurplus refers to present situation by typing C if the shortage is expected to occur in the short term future ie within 12 months by typing FST if it is expected to occur over the medium term (within 1-5 years) by typing FMT if it is expected to occur in the long term (in 5 or more years) by typing FLT if more than one time period applies indicate all relevant ones (eg for current shortagessurpluses that are expected to persist over the short term type C FST) if you dont know type dont know
Source of information on shortagessurpluses (eg PES administrative data (vacancies job seekers) PES survey third party survey Occupational forecasts other (specify) etc)
Indicate the source used to identify shortagesurplus for this occupation did you derive it from the PES administrative data on PES vacancies andor job seekers did you conduct a survey did you commission a third party to conduct a survey for you did you have occupational forecasts available did you use other research type in free text the full description of the source(s) eg National Employment Survey conducted by PES etc
Labour shortages and surpluses 2017
2017 36
Directorate-General for Employment Social Affairs and Inclusion European Network of Public Employment Services (PES)
Date for source of information Indicate the year that the information on shortagessurpluses (column 7) refers to eg type 2016 for a survey of difficult to fill vacancies conducted in 2016 even if the report was published in 2017
What indicator(s) suggested that there is a shortagesurplus
Indicate what criteria was used to conclude that this occupation is associated with a shortagesurplus for instance employers views sourcing from abroad to fill vacancies growth in employment faster than growth in educationtraining output time required to fill
vacancies higher than average etc
Share of females among job seekers in this occupation (surplus occupations only)
Indicate the percentage share of females among all job seekers in this occupation this is only applicable to surplus occupations
Skill or labour shortage Indicate if a shortage refers to a skill or labour shortage a skill shortage occurs where there is an insufficient supply of persons with the appropriate skills labour shortages occur where there is a sufficient number of skilled persons however an insufficient number of them is willing to take up employment in the occupation in question
Indicate the availability of data on shortagessurpluses at regional level (NUTS1 NUTS2 NUTS3 No data)
Indicate if data is available on the regional breakdown of shortagessurpluses by indicating the level of regional data available if multiple levels of regional disaggregation are available indicate the lowest level of disaggregation (eg NUTS3 rather than NUTS2) if there is no regional data available use no data
Labour shortages and surpluses 2017
2017 37
Directorate-General for Employment Social Affairs and Inclusion European Network of Public Employment Services (PES)
ANNEX 2 SHORTAGE OCCUPATIONS
Shortage occupation PES count
Cooks 16 Plumbers and pipe fitters 13 Generalist medical practitioners 12 Welders and flamecutters 12 Heavy truck and lorry drivers 11 Metal working machine tool setters and operators 11 Nursing professionals 11 Software developers 11 Agricultural and industrial machinery mechanics and repairers 10 Cleaners and helpers in offices hotels and other establishments 10 Commercial sales representatives 10 Specialist medical practitioners 10 Systems analysts 10 Bricklayers and related workers 9 Building and related electricians 9 Butchers fishmongers and related food preparers 9 Motor vehicle mechanics and repairers 9 Nursing associate professionals 9 Sheet-metal workers 9 Shop sales assistants 9 Waiters 9 Carpenters and joiners 8 Civil engineers 8 Concrete placers concrete finishers and related workers 8 Electrical engineering technicians 8 Electronics engineering technicians 8 Mechanical engineers 8 Primary school teachers 8 Structural-metal preparers and erectors 8 Electronics engineers 7
Health care assistants 7 Manufacturing supervisors 7 Mechanical engineering technicians 7 Secondary education teachers 7 Accountants 6 Applications programmers 6 Bus and tram drivers 6 Contact centre salespersons 6 Early childhood educators 6 Electrical mechanics and fitters 6 Floor layers and tile setters 6 Plasterers 6 Roofers 6 Sewing machine operators 6 Software and applications developers and analysts not elsewhere classified 6 Toolmakers and related workers 6 Web and multimedia developers 6 Air conditioning and refrigeration mechanics 5 Building frame and related trades workers not elsewhere classified 5 Chefs 5 Civil engineering labourers 5 Construction supervisors 5 Earthmoving and related plant operators 5 Electrical engineers 5 Electrical line installers and repairers 5 Engineering professionals not elsewhere classified 5 Hairdressers 5 Information and communications technology operations technicians 5 Manufacturing managers 5 Physiotherapists 5 Real estate agents and property managers 5 Research and development managers 5 Spray painters and varnishers 5 Accounting associate professionals 4 Bakers pastry-cooks and confectionery makers 4
Labour shortages and surpluses 2017
2017 38
Directorate-General for Employment Social Affairs and Inclusion European Network of Public Employment Services (PES)
Shortage occupation PES count
Blacksmiths hammersmiths and forging press workers 4 Civil engineering technicians 4 Crane hoist and related plant operators 4 Database designers and administrators 4 Industrial and production engineers 4 Painters and related workers 4 Physical and engineering science technicians not elsewhere classified 4 Plastic products machine operators 4 Social work and counselling professionals 4 Accounting and bookkeeping clerks 3 Administrative and executive secretaries 3 Ambulance workers 3 Building construction labourers 3 Car taxi and van drivers 3 Cartographers and surveyors 3 Cleaning and housekeeping supervisors in offices hotels and other establishments 3 Contact centre information clerks 3 Draughtspersons 3 Fast food preparers 3 Freight handlers 3 Gardeners horticultural and nursery growers 3 Home-based personal care workers 3 Hotel receptionists 3 Information and communications technology installers and servicers 3 Insulation workers 3 Kitchen helpers 3 Manufacturing labourers not elsewhere classified 3 Medical imaging and therapeutic equipment technicians 3 Metal moulders and coremakers 3 Metal polishers wheel grinders and tool sharpeners 3 Midwifery professionals 3 Other language teachers 3 Personal services workers not elsewhere classified 3
Pharmacists 3 Policy administration professionals 3 Printers 3 Process control technicians not elsewhere classified 3 Sales and marketing managers 3 Shop supervisors 3 Special needs teachers 3 Stock clerks 3 Supply distribution and related managers 3 Survey and market research interviewers 3 Systems administrators 3 Technical and medical sales professionals (excluding ICT) 3 Translators interpreters and other linguists 3 Transport clerks 3 Vocational education teachers 3 Advertising and marketing professionals 2 Audiologists and speech therapists 2 Bartenders 2 Beauticians and related workers 2 Cashiers and ticket clerks 2 Chemical engineers 2 Child care workers 2 Computer network and systems technicians 2 Computer network professionals 2 Construction managers 2 Craft and related workers not elsewhere classified 2 Credit and loans officers 2 Crop farm labourers 2 Database and network professionals not elsewhere classified 2 Dentists 2 Domestic cleaners and helpers 2 Door to door salespersons 2 Driving instructors 2 Electrical and electronic equipment assemblers 2 Electronics mechanics and servicers 2 Elementary workers not elsewhere classified 2 Employment agents and contractors 2
Labour shortages and surpluses 2017
2017 39
Directorate-General for Employment Social Affairs and Inclusion European Network of Public Employment Services (PES)
Shortage occupation PES count
Field crop and vegetable growers 2 Financial analysts 2 Financial and investment advisers 2 Forestry and related workers 2 Garbage and recycling collectors 2 General office clerks 2 Graphic and multimedia designers 2 Information and communications technology service managers 2 Insurance representatives 2 Locomotive engine drivers 2 Mail carriers and sorting clerks 2 Management and organization analysts 2 Mathematicians actuaries and statisticians 2 Mechanical machinery assemblers 2 Medical and dental prosthetic technicians 2 Medical assistants 2 Messengers package deliverers and luggage porters 2 Metal finishing plating and coating machine operators 2 Metal processing plant operators 2 Optometrists and ophthalmic opticians 2 Personal care workers in health services not elsewhere classified 2 Police officers 2 Policy and planning managers 2 Production clerks 2 Restaurant managers 2 Retail and wholesale trade managers 2 Sales workers not elsewhere classified 2 Sewing embroidery and related workers 2 Street food salespersons 2 Tailors dressmakers furriers and hatters 2 Telecommunications engineers 2 Advertising and public relations managers 1 Aged care services managers 1
Agricultural technicians 1 Aircraft engine mechanics and repairers 1 Aircraft pilots and related associate professionals 1 Assemblers not elsewhere classified 1 Authors and related writers 1 Bank tellers and related clerks 1 Bleaching dyeing and fabric cleaning machine operators 1 Bookmakers croupiers and related gaming workers 1 Business services agents not elsewhere classified 1 Buyers 1 Cabinet-makers and related workers 1 Cement stone and other mineral products machine operators 1 Chemical and physical science technicians 1 Chemical engineering technicians 1 Chemical processing plant controllers 1 Chemical products plant and machine operators 1 Chemists 1 Conference and event planners 1 Customs and border inspectors 1 Data entry clerks 1 Dental assistants and therapists 1 Dieticians and nutritionists 1 Dispensing opticians 1 Domestic housekeepers 1 Economists 1 Education methods specialists 1 Environmental and occupational health and hygiene professionals 1 Environmental and occupational health inspectors and associates 1 Fibre preparing spinning and winding machine operators 1 Finance managers 1 Financial and insurance services branch managers 1 Fire-fighters 1 Fitness and recreation instructors and program leaders 1 Food and beverage tasters and graders 1 Food and related products machine operators 1
Labour shortages and surpluses 2017
2017 40
Directorate-General for Employment Social Affairs and Inclusion European Network of Public Employment Services (PES)
Shortage occupation PES count
Food service counter attendants 1 Forestry labourers 1 Fruit vegetable and related preservers 1 Fur and leather preparing machine operators 1 Glass and ceramics plant operators 1 Hand launderers and pressers 1 Hand packers 1 Handicraft workers in textile leather and related materials 1 Health associate professionals not elsewhere classified 1 Health professionals not elsewhere classified 1 House builders 1 Human resource managers 1 Incinerator and water treatment plant operators 1 Information and communications technology user support technicians 1 Judges 1 Lawyers 1 Legal and related associate professionals 1 Legal professionals not elsewhere classified 1 Library clerks 1 Lifting truck operators 1 Livestock and dairy producers 1 Livestock farm labourers 1 Medical and pathology laboratory technicians 1 Medical secretaries 1 Metal production process controllers 1 Mining and quarrying labourers 1 Mining engineers metallurgists and related professionals 1 Mixed crop and animal producers 1 Mixed crop growers 1 Motorcycle drivers 1 Odd job persons 1 Other cleaning workers 1 Other music teachers 1
Paper products machine operators 1 Personnel and careers professionals 1 Personnel clerks 1 Pet groomers and animal care workers 1 Physicists and astronomers 1 Physiotherapy technicians and assistants 1 Potters and related workers 1 Power production plant operators 1 Prison guards 1 Product and garment designers 1 Psychologists 1 Pulp and papermaking plant operators 1 Railway brake signal and switch operators 1 Receptionists (general) 1 Refuse sorters 1 Riggers and cable splicers 1 Scribes and related workers 1 Secretaries (general) 1 Securities and finance dealers and brokers 1 Security guards 1 Senior government officials 1 Senior officials of special-interest organizations 1 Shelf fillers 1 Ships engineers 1 Shoemaking and related machine operators 1 Social work associate professionals 1 Stall and market salespersons 1 Stationary plant and machine operators not elsewhere classified 1 Stonemasons stone cutters splitters and carvers 1 Street and related service workers 1 Sweepers and related labourers 1 Teaching professionals not elsewhere classified 1 Telecommunications engineering technicians 1 Textile fur and leather products machine operators not elsewhere classified 1 Trade brokers 1 Travel attendants and travel stewards 1 Travel guides 1
Labour shortages and surpluses 2017
2017 41
Directorate-General for Employment Social Affairs and Inclusion European Network of Public Employment Services (PES)
Shortage occupation PES count
Tree and shrub crop growers 1 Underwater divers 1 University and higher education teachers 1 Vehicle cleaners 1 Veterinarians 1 Weaving and knitting machine operators 1 Web technicians 1 Wood processing plant operators 1 Woodworking-machine tool setters and operators 1
Labour shortages and surpluses 2017
2017 42
Directorate-General for Employment Social Affairs and Inclusion European Network of Public Employment Services (PES)
ANNEX 3 SURPLUS OCCUPATIONS
Surplus occupation PES count
General office clerks 8 Shop sales assistants 8 Advertising and marketing professionals 6 Bank tellers and related clerks 6 Sociologists anthropologists and related professionals 6 Child care workers 5 Hairdressers 5 Journalists 5 Cashiers and ticket clerks 4 Cleaners and helpers in offices hotels and other establishments 4 Hand packers 4 Mail carriers and sorting clerks 4 Photographers 4 Receptionists (general) 4 Tailors dressmakers furriers and hatters 4 Accounting and bookkeeping clerks 3 Administrative and executive secretaries 3 Beauticians and related workers 3 Biologists botanists zoologists and related professionals 3 Bricklayers and related workers 3 Broadcasting and audio-visual technicians 3 Civil engineering labourers 3 Economists 3 Gardeners horticultural and nursery growers 3 Interior designers and decorators 3 Kitchen helpers 3 Legal professionals not elsewhere classified 3 Manufacturing labourers not elsewhere classified 3 Motor vehicle mechanics and repairers 3
Musicians singers and composers 3 Other artistic and cultural associate professionals 3 Painters and related workers 3 Philosophers historians and political scientists 3 Security guards 3 Sweepers and related labourers 3 Travel consultants and clerks 3 Waiters 3 Actors 2 Archivists and curators 2 Bakers pastry-cooks and confectionery makers 2 Bartenders 2 Building construction labourers 2 Business services and administration managers not elsewhere classified 2 Cabinet-makers and related workers 2 Car taxi and van drivers 2 Chemists 2 Cleaning and housekeeping supervisors in offices hotels and other establishments 2 Credit and loans officers 2 Customs and border inspectors 2 Elementary workers not elsewhere classified 2 Film stage and related directors and producers 2 Financial analysts 2 Forestry and related workers 2 Freight handlers 2 Graphic and multimedia designers 2 Health care assistants 2 Hotel receptionists 2 Lawyers 2 Legal and related associate professionals 2 Library clerks 2 Livestock and dairy producers 2 Management and organization analysts 2 Messengers package deliverers and luggage porters 2 Odd job persons 2 Office supervisors 2 Plasterers 2
Labour shortages and surpluses 2017
2017 43
Directorate-General for Employment Social Affairs and Inclusion European Network of Public Employment Services (PES)
Surplus occupation PES count
Police officers 2 Pre-press technicians 2 Print finishing and binding workers 2 Printers 2 Prison guards 2 Product and garment designers 2 Psychologists 2 Public relations professionals 2 Religious professionals 2 Secondary education teachers 2 Secretaries (general) 2 Social work and counselling professionals 2 Stall and market salespersons 2 Stock clerks 2 Teachers aides 2 Telephone switchboard operators 2 Travel guides 2 Visual artists 2 Advertising and public relations managers 1 Agricultural technicians 1 Announcers on radio television and other media 1 Assemblers not elsewhere classified 1 Building and related electricians 1 Building architects 1 Building caretakers 1 Building frame and related trades workers not elsewhere classified 1 Business services agents not elsewhere classified 1 Buyers 1 Carpenters and joiners 1 Chemical engineers 1 Civil engineers 1 Clearing and forwarding agents 1 Clerical support workers not elsewhere classified 1
Commercial sales representatives 1 Conference and event planners 1 Contact centre information clerks 1 Contact centre salespersons 1 Cooks 1 Crane hoist and related plant operators 1 Creative and performing artists not elsewhere classified 1 Dancers and choreographers 1 Data entry clerks 1 Database designers and administrators 1 Domestic cleaners and helpers 1 Domestic housekeepers 1 Draughtspersons 1 Driving instructors 1 Early childhood educators 1 Electronics mechanics and servicers 1 Farming forestry and fisheries advisers 1 Fashion and other models 1 Fast food preparers 1 Field crop and vegetable growers 1 Filing and copying clerks 1 Finance managers 1 Financial and insurance services branch managers 1 Financial and investment advisers 1 Fire-fighters 1 Fitness and recreation instructors and program leaders 1 Floor layers and tile setters 1 Food service counter attendants 1 Fruit vegetable and related preservers 1 Gallery museum and library technicians 1 Garbage and recycling collectors 1 Garment and related pattern-makers and cutters 1 Glass and ceramics plant operators 1 Government tax and excise officials 1 Hand launderers and pressers 1
Labour shortages and surpluses 2017
2017 44
Directorate-General for Employment Social Affairs and Inclusion European Network of Public Employment Services (PES)
Surplus occupation PES count
Heavy truck and lorry drivers 1 House builders 1 Hunters and trappers 1 Information and communications technology installers and servicers 1 Information and communications technology user support technicians 1 Insurance representatives 1 Jewellery and precious-metal workers 1 Judges 1 Legal secretaries 1 Librarians and related information professionals 1 Life science technicians (excluding medical) 1 Lifting truck operators 1 Managing directors and chief executives 1 Manufacturing supervisors 1 Medical and dental prosthetic technicians 1 Metal moulders and coremakers 1 Mining and quarrying labourers 1 Mixed crop and animal producers 1 Mixed crop growers 1 Mobile farm and forestry plant operators 1 Musical instrument makers and tuners 1 Other language teachers 1 Pawnbrokers and money-lenders 1 Personnel and careers professionals 1 Pet groomers and animal care workers 1 Photographic products machine operators 1 Physical and engineering science technicians not elsewhere classified 1 Physicists and astronomers 1 Police inspectors and detectives 1 Precision-instrument makers and repairers 1 Primary school teachers 1 Process control technicians not elsewhere classified 1 Product graders and testers (excluding foods and beverages) 1
Production clerks 1 Professional services managers not elsewhere classified 1 Protective services workers not elsewhere classified 1 Research and development managers 1 Retail and wholesale trade managers 1 Roofers 1 Sales workers not elsewhere classified 1 Senior government officials 1 Service station attendants 1 Shelf fillers 1 Shop supervisors 1 Social work associate professionals 1 Special needs teachers 1 Spray painters and varnishers 1 Statistical mathematical and related associate professionals 1 Stonemasons stone cutters splitters and carvers 1 Street food salespersons 1 Supply distribution and related managers 1 Teaching professionals not elsewhere classified 1 Technical and medical sales professionals (excluding ICT) 1 Training and staff development professionals 1 Translators interpreters and other linguists 1 Transport conductors 1 Tree and shrub crop growers 1 Typists and word processing operators 1 Undertakers and embalmers 1 Vocational education teachers 1 Weaving and knitting machine operators 1 Woodworking-machine tool setters and operators 1
Labour shortages and surpluses 2017
2017 45
Directorate-General for Employment Social Affairs and Inclusion European Network of Public Employment Services (PES)
ANNEX 4 THE RATIO OF UNEMPLOYED TO NEW HIRES
ISCO-08 title
2015
UE
Recruited in the
last year (lt12
months)
Ratio of UE to new recruits
Street and related service workers 85 104 08 Agricultural forestry and fishery labourers 3913 5343 07 Mining and construction labourers 1937 3525 05 Creative and performing artists 610 1115 05 Refuse workers 1036 1923 05 Painters building structure cleaners and related trades workers 1116 2117 05 Street and market salespersons 195 389 05 Building frame and related trades workers 3632 7353 05 Mining manufacturing and construction supervisors 626 1315 05 Ships deck crews and related workers 53 114 05 Market gardeners and crop growers 1471 3207 05 Managing directors and chief executives 304 667 05 Travel attendants conductors and guides 229 538 04 Wood treaters cabinet-makers and related trades workers 491 1159 04 Manufacturing labourers 1640 3909 04 Domestic hotel and office cleaners and helpers 5679 13545 04 Other stationary plant and machine operators 822 1961 04 Mobile plant operators 1038 2497 04 Building finishers and related trades workers 1519 3680 04 Textile fur and leather products machine operators 431 1048 04 Garment and related trades workers 422 1047 04 Chemical and photographic products plant and machine operators 157 389 04 Food processing and related trades workers 930 2330 04 Vehicle window laundry and other hand cleaning workers 291 754 04 Sheet and structural metal workers moulders and welders and related workers
996 2603 04
Waiters and bartenders 4399 11595 04 Cooks 1529 4039 04 Metal processing and finishing plant operators 208 557 04 Printing trades workers 203 548 04 Forestry and related workers 130 351 04 Protective services workers 1347 3658 04 Transport and storage labourers 2532 6939 04 Fishery workers hunters and trappers 46 128 04 Material-recording and transport clerks 1671 4630 04 Process control technicians 179 517 03 Mining and mineral processing plant operators 94 274 03 Telecommunications and broadcasting technicians 177 519 03 Blacksmiths toolmakers and related trades workers 816 2409 03 Building and housekeeping supervisors 678 2045 03
Secretaries (general) 1072 3259 03 Assemblers 850 2586 03 Other craft and related workers 258 810 03 Shop salespersons 6600 21042 03 Electrical equipment installers and repairers 958 3060 03 Food and related products machine operators 437 1400 03 Other sales workers 1087 3510 03 Food preparation assistants 1646 5337 03 Mixed crop and animal producers 387 1260 03 Car van and motorcycle drivers 1155 3764 03 Client information workers 1993 6531 03 Sports and fitness workers 605 1984 03 Handicraft workers 194 638 03 Life science technicians and related associate professionals 82 271 03 Keyboard operators 283 940 03 Electronics and telecommunications installers and repairers 290 963 03 Other personal services workers 313 1047 03 Vocational education teachers 279 940 03 Other teaching professionals 744 2518 03 General office clerks 966 3272 03 Authors journalists and linguists 335 1135 03 Hairdressers beauticians and related workers 806 2796 03
Labour shortages and surpluses 2017
2017 46
Directorate-General for Employment Social Affairs and Inclusion European Network of Public Employment Services (PES)
ISCO-08 title
2015
UE
Recruited in the
last year (lt12
months)
Ratio of UE to new recruits
Animal producers 189 660 03 Other elementary workers 976 3401 03 Machinery mechanics and repairers 1134 3962 03 Ship and aircraft controllers and technicians 80 281 03 Hotel and restaurant managers 344 1220 03 Cashiers and ticket clerks 908 3220 03 Retail and wholesale trade managers 224 809 03 Sales marketing and development managers 311 1124 03 Physical and engineering science technicians 1204 4366 03 Administrative and specialised secretaries 1106 4040 03 Sales and purchasing agents and brokers 1294 4754 03 Rubber plastic and paper products machine operators 256 941 03 Artistic cultural and culinary associate professionals 511 1906 03 Numerical clerks 944 3532 03 Other services managers 184 691 03 Child care workers and teachers aides 1335 5005 03 Heavy truck and bus drivers 1426 5349 03 Business services and administration managers 383 1439 03 Information and communications technology service managers 67 257 03 Regulatory government associate professionals 209 807 03 Life science professionals 176 681 03 Wood processing and papermaking plant operators 97 379 03 Locomotive engine drivers and related workers 46 179 03 Legal professionals 315 1245 03 Personal care workers in health services 2195 8787 02 Physical and earth science professionals 85 345 02 Street vendors (excluding food) 50 204 02 Architects planners surveyors and designers 515 2092 02 Other clerical support workers 901 3657 02 Business services agents 510 2114 02 Manufacturing mining construction and distribution managers 361 1507 02 Tellers money collectors and related clerks 381 1612 02 Librarians archivists and curators 58 248 02 Medical and pharmaceutical technicians 255 1099 02 University and higher education teachers 301 1333 02 Information and communications technology operations and user support technicians
418 1888 02
Legal social and religious associate professionals 920 4348 02 Financial and mathematical associate professionals 601 2852 02 Sales marketing and public relations professionals 865 4172 02 Finance professionals 472 2281 02 Engineering professionals (excluding electrotechnology) 635 3118 02 Other health associate professionals 531 2657 02
Social and religious professionals 460 2317 02 Professional services managers 176 891 02 Nursing and midwifery associate professionals 556 2855 02 Legislators and senior officials 53 286 02 Database and network professionals 83 455 02 Administration professionals 641 3673 02 Primary school and early childhood teachers 575 3345 02 Electrotechnology engineers 142 827 02 Secondary education teachers 471 2812 02 Other health professionals 346 2083 02 Nursing and midwifery professionals 273 1760 02 Software and applications developers and analysts 631 4159 02 Medical doctors 293 1944 02 No occupation 152894 00
No answer 2531 578 44 Total 249561 294937 08
Labour shortages and surpluses 2017
2017 47
Directorate-General for Employment Social Affairs and Inclusion European Network of Public Employment Services (PES)
HOW TO OBTAIN EU PUBLICATIONS
Free publications
bull one copy
via EU Bookshop (httpbookshopeuropaeu)
bull more than one copy or postersmaps
from the European Unionrsquos representations (httpeceuropaeurepresent_enhtm)
from the delegations in non-EU countries
(httpeeaseuropaeudelegationsindex_enhtm)
by contacting the Europe Direct service (httpeuropaeueuropedirectindex_enhtm)
or calling 00 800 6 7 8 9 10 11 (free phone number from anywhere in the EU) () () The information given is free as are most calls (though some operators phone boxes or hotels may charge you)
Priced publications
bull via EU Bookshop (httpbookshopeuropaeu)
Priced subscriptions
bull via one of the sales agents of the Publications Office of the European Union
(httppublicationseuropaeuothersagentsindex_enhtm)
doi 10276731262
KE-0
1-1
8-2
63-E
N-N
[Ca
talo
gu
e n
um
be
r]
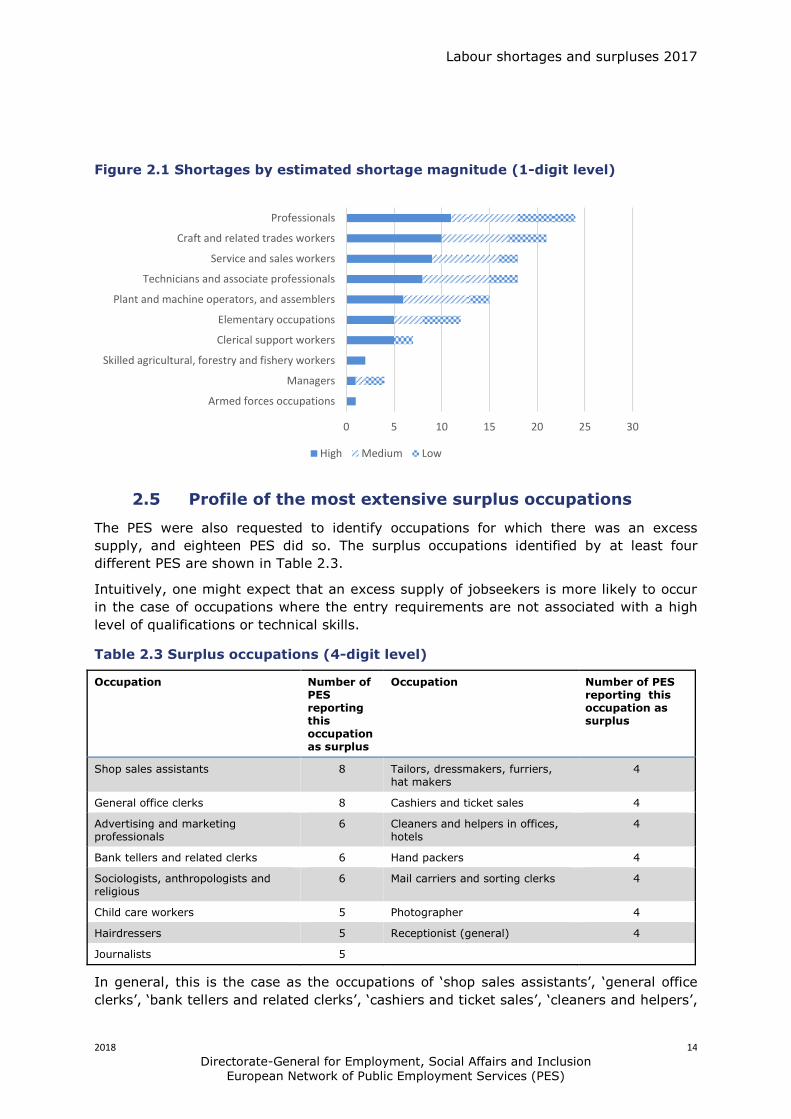
Labour shortages and surpluses 2017
2018 14
Directorate-General for Employment Social Affairs and Inclusion European Network of Public Employment Services (PES)
Figure 21 Shortages by estimated shortage magnitude (1-digit level)
25 Profile of the most extensive surplus occupations
The PES were also requested to identify occupations for which there was an excess
supply and eighteen PES did so The surplus occupations identified by at least four
different PES are shown in Table 23
Intuitively one might expect that an excess supply of jobseekers is more likely to occur
in the case of occupations where the entry requirements are not associated with a high
level of qualifications or technical skills
Table 23 Surplus occupations (4-digit level)
Occupation Number of PES reporting this occupation as surplus
Occupation Number of PES reporting this occupation as surplus
Shop sales assistants 8 Tailors dressmakers furriers hat makers
4
General office clerks 8 Cashiers and ticket sales 4
Advertising and marketing professionals
6 Cleaners and helpers in offices hotels
4
Bank tellers and related clerks 6 Hand packers 4
Sociologists anthropologists and religious
6 Mail carriers and sorting clerks 4
Child care workers 5 Photographer 4
Hairdressers 5 Receptionist (general) 4
Journalists 5
In general this is the case as the occupations of lsquoshop sales assistantsrsquo lsquogeneral office
clerksrsquo lsquobank tellers and related clerksrsquo lsquocashiers and ticket salesrsquo lsquocleaners and helpersrsquo
0 5 10 15 20 25 30
Armed forces occupations
Managers
Skilled agricultural forestry and fishery workers
Clerical support workers
Elementary occupations
Plant and machine operators and assemblers
Technicians and associate professionals
Service and sales workers
Craft and related trades workers
Professionals
High Medium Low
Labour shortages and surpluses 2017
2018 15
Directorate-General for Employment Social Affairs and Inclusion European Network of Public Employment Services (PES)
lsquohand packersrsquo lsquomail carriers and sorting clerksrsquo and lsquoreceptionistsrsquo would not generally
require a high formal level of qualification
However four of the fifteen occupations lsquoadvertising and marketing professionalsrsquo
lsquosociologists and anthropologistsrsquo lsquojournalistsrsquo and lsquophotographersrsquo are professional
occupations Furthermore there are many professional and associate professional
occupations which are not included in the list of surplus occupations reported by the most
PES because they were reported by three or fewer PES These occupations include
lsquophilosophers historians and political scientistsrsquo lsquomusicians singers and composersrsquo
lsquoeconomistsrsquo lsquoother legal professionalsrsquo lsquointerior decoratorsrsquo and lsquoother artists and
associate cultural workersrsquo A list of the surplus occupations which were reported by at
least one PES is shown in Annex 3 of this report
In theory the fact that both the list of shortage occupations and the list of surplus
occupations contain many professional and associate professional occupations should
give rise to many cross-border matching possibilities However this is not the case
because virtually none of the professional or associate professional occupations appear
on both lists In general the professional and associate professional occupations
identified as being in surplus by the PES reflect disciplines in the humanities or the
creative arts In sharp contrast the professional and associate professional occupations
identified as shortage occupations by the PES are technical in nature and are dominated
by software and health related occupations
There is no doubt that many of the occupations identified by the PES as surplus
occupations are attractive to young people This is particularly so of occupations
associated with the creative arts But the analysis of PES data on shortages and
surpluses in this report would suggest that at least some of these occupations are
associated with limited career possibilities and that occupations of a technical nature
have superior career prospects
There are however two occupations lsquoshop sales assistantsrsquo and lsquocleaners and helpersrsquo
who appear in both the lists of shortages and surplus occupations and there are clearly
matching possibilities in these cases However the matching possibilities are not limited
to these two occupations there are many surplus occupations which have been identified
by less than four PES which have also been classified as shortage occupations by other
PES These cross-border matching possibilities are explored in chapter four
26 Profile of high magnitude surpluses
Only seven of the fifteen occupations listed as surplus occupations in Table 23 are not
classified as surpluses of high magnitude in Table 24 The list includes two more
professional occupations lsquobiologists botanists and zoologistsrsquo and lsquomanagement and
organisation analystsrsquo Both lsquojournalistsrsquo and lsquoadvertising and marketing professionalsrsquo
which are included in the list of surplus occupations reported by the most PES are also on
the list of occupations with high magnitude surpluses
One of the occupations which is new to the list is lsquobricklayers and related workersrsquo As
this occupation was also identified as a shortage occupation by nine PES its inclusion
does give rise to some cross-border matching possibilities
Labour shortages and surpluses 2017
2018 16
Directorate-General for Employment Social Affairs and Inclusion European Network of Public Employment Services (PES)
Table 24 High magnitude surplus occupations (4-digit level)
Occupation
Number of PES stating high magnitude of surplus
Occupation
Number of PES stating high magnitude of surplus
General office clerks 4 Journalists 2
Advertising and marketing professionals 3 Management and organisation analysts
2
Receptionist (general) 3 Manufacturing labourers 2
Shop sales assistants 3 Odd job persons 2
Biologists botanists zoologists and related
2 Photographers 2
Bricklayers and related workers 2 Bank tellers and related clerks 2
Child care workers 2 Security guards 2
Cleaners and housekeepers supervisors 2 Travel guides 2
Gardiners horticulturalists and nursery workers
2
27 Broad occupational groups by surplus magnitude
As in the case of shortages the professional group of occupations dominated the
occupations which were considered by the PES to have surpluses of high magnitude
(Figure 22) Indeed eight of the sixteen PES who rated surplus occupations by their
degree of severity identified at least one professional occupation as being in severe over-
supply
Interestingly the three PES who identified surplus occupations among plant and machine
operators and assemblers rated all the occupations they identified in this group as being
surplus occupations of high magnitude
Figure 22 Surpluses by estimated surplus magnitude
0 5 10 15 20
Managers
Plant and machine operators and assemblers
Skilled agricultural forestry and fishery workers
Craft and related trades workers
Clerical support workers
Elementary occupations
Service and sales workers
Technicians and associate professionals
Professionals
High Medium Low
Labour shortages and surpluses 2017
2018 17
Directorate-General for Employment Social Affairs and Inclusion European Network of Public Employment Services (PES)
28 Comparison of shortages and surpluses by broad
occupation
The issues which have been discussed above can be summarised in Table 25 below The
figures show that the 26 PES who reported at least one professional occupation as a
shortage represented 93 of all PES and that in total these PES identified 261
professional occupations as shortages
The situation is not quite as dramatic in respect of surplus occupations Nevertheless
fifteen PES representing 83 of all reporting PES identified a total of 88 professional
occupations as surplus occupations
However the most widespread reported surplus occupations were among the service and
sales group of occupations with almost 90 of PES reporting at least one surplus
occupation in this group The difference in the share of PES reporting shortages and
surpluses in the clerical group of occupations is also noteworthy Half the PES reported at
least one shortage occupation in this group but almost 80 of reporting PES included at
least one surplus occupation from this group
Table 25 Shortages and surpluses by broad occupation group
Broad occupation group
Number of
shortage occupatio
ns identified
Number of PES
reporting
shortages in this broad group
of PES reporting shortages
in this group
Number of surplus occupatio
ns identified
Number of PES
reporting surpluses
in this broad group
of PES reporting surpluses
in this broad group
Professionals 261 26 93 88 15 83
Craft and related trades 237 25 89 44 11 61
Associated professional technical
176 27 97 53 15 83
Services and sales 100 23 82 72 16 89
Plant and machinery 79 22 79 10 8 44
Elementary 53 14 50 37 12 67
Managers 43 11 39 16 7 39
Clerical support 34 14 50 47 14 78
Skilled agriculture 13 6 21 14 5 28
Armed forces 6 1 4 0 0 0
29 Cross-check with LSF data
Finally it is important to assess the extent to which the shortage and surplus occupations
identified by the PES in 2017 are accurate For this task we use the findings from the
2016 study which are based on the LSF data and the ratio of the unemployed to new
hires (Annex 4)
Although based on different levels of aggregation (4-digit vs 3-digit respectively) the
comparison of the PES reported shortages and surpluses in 2017 and the 2016 study LSF
ratio of unemployed and new hires suggests a high level of consistency Specifically PES
identified shortage occupations typically have the low ratio of unemployed to new hires
while the surplus occupations typically have the high ratio of unemployed to new hires
Labour shortages and surpluses 2017
2018 18
Directorate-General for Employment Social Affairs and Inclusion European Network of Public Employment Services (PES)
The only exceptions are the occupations of lsquocleanersrsquo lsquowaitersrsquo and lsquoshop sales
assistantsrsquo However this result is understandable as these occupations were classified
by the PES4 as labour shortages rather than skill shortages and consequently the
relatively high ratio could reflect the fact that there are a significant number of
unemployed available to work in these occupations
210 Conclusions
There are a number of significant conclusions which may be drawn from the analyses of
shortage and surplus occupations in this chapter
Firstly the widespread concern that using data from the PES may produce a significant
bias in the list of shortages and surpluses because the PES attract less vacancies and
job-seekers from higher skilled occupations appears to be unfounded Ironically the
professional occupations were the most frequently reported occupations in both the list of
shortages and surpluses
Secondly there is a distinct difference in the type of competences and qualifications
identified by the PES as shortages and surplus occupations and this difference was
evident throughout the different occupation groups In general the shortage occupations
embodied technical skills whether in health-related software-related or engineeringndash
related occupations at professional technical and craft levels
In sharp contrast the surplus occupations embodied selling service and clerical skills
cultural and artistic skills and competencies in the humanities
Finally the type of occupations which the PES associated with shortages and surpluses
are highly plausible In general the shortage occupations have a low ratio of unemployed
to new hires while the surplus occupations have a high ratio This consistency extended
to the occupations which the PES identified as labour shortages which exhibited a high
ratio
The classification of skill and labour shortages is one of the issues discussed in the next
chapter
4 While this is true when all three occupations are aggregated only two of five PES categorised lsquocleanersrsquo as a labour shortage ndash see chapter 3
Labour shortages and surpluses 2017
2018 19
Directorate-General for Employment Social Affairs and Inclusion European Network of Public Employment Services (PES)
3 PROFILE OF SHORTAGES AND SURPLUSES IN SPACE AND TIME
31 Introduction
In this chapter we analyse the occupations which have been identified by the European
PES as shortage and surplus occupations from the perspective of space and time We
review the geographical distribution of these occupations to ascertain if this distribution
provides an insight into what may have given rise to these shortages and surplus
occupations and we also examine the extent to which the same shortage and surplus
occupations have persisted over time using the findings from previous studies
32 PES methods used for identifying shortages and surpluses
In the previous chapter it was noted that only eighteen of twenty-eight PES submitted a
list of surplus occupations A review of the methods used by the PES to identify shortage
occupations may provide an insight into why ten PES did not provide any data on surplus
occupations
A summary of the methods used to identify shortage occupations is provided in Table 31
below The data indicates that exactly ten PES did not use any administrative data in
identifying their shortage occupations but rather used other sources such as employer
surveys national forecasting studies or immigration data It is tempting to conclude that
this is the reason why only 18 out of 28 PES provided data on surplus occupations as
these methodologies are not generally associated with the provision of information on
occupations which are in surplus
However such a conclusion would not be entirely accurate The analyses found that the
use of survey data did not necessarily preclude a PES from identifying surplus
occupations The Danish PES for example used the results of their Labour Market Balance
Survey and was able to provide a comprehensive list of surplus occupations In contrast
the Italian and Norwegian PES who relied on national forecasts and surveys respectively
were unable to provide such a list
Furthermore not all of the PES who based their identification of shortages on their
administrative data systems provided a list of surplus occupations Those who did
generally used the ratio of job-seekers to vacancies to identify whether an occupation
was a shortage or surplus occupation But a number of PES such as the German and
Luxemburg PES and the Belgium regional PES Actiris while basing their identification of
shortage and surplus occupations on administrative data used quite sophisticated
techniques such as the share of vacancies filled and the duration of vacancy filling Unlike
the ratio of job-seekers to vacancies such techniques do not readily provide an indicator
for identifying an occupation as a surplus occupation5
5 While it is reasonable to classify an occupation as a shortage occupation if the filling of vacant posts in that occupation takes on average an exceptionally long time identifying surplus occupations is somewhat more problematic using this method
Labour shortages and surpluses 2017
2018 20
Directorate-General for Employment Social Affairs and Inclusion European Network of Public Employment Services (PES)
Table 31 Methods used by the PES to identify shortage occupations
PES methods for identifying shortages and surpluses Number of PES
Combination of administrative data PES surveys and expert opinion
1
Combination of administrative data PES surveys and 3rd party data
1
Combination of administrative data and PES surveys 7
Combination of administrative data and 3rd party data 1
Combination of administrative data and expert opinion 2
PES work permit data only 2
PES administrative data only 6
PES survey data only 2
PES warehousing data only 1
3rd party surveys and forecasts 5
Total 28
The fact that only eighteen PES provided a list of surplus occupations is a serious
weakness of this study because it places a limit on the potential of the analyses to
identify cross border matching opportunities between shortage and surplus occupations
Consequently in the future every effort should be made to significantly increase the
number of PES providing a list of surplus occupations even if this means that a
significant number of PES use alternative methodologies to identify shortage and surplus
occupations rather than a single methodology to do both as has occurred in both the
2016 study and the current study6
33 Geographic distribution of shortages and surpluses
The 28 PES who submitted data on shortages cover a very wide geographic area which
include labour markets with very different characteristics It may be informative
therefore to assess the extent to which the distribution of shortage occupations differed
between different countries
Table 32 below shows the number of reported shortage occupations within their broad
occupation group and the PES who reported the occupation as a shortage7
While each PES was requested to submit a maximum of twenty shortage occupations a
total of ten PES provided more than that and in the case of the Slovenian French and the
regional Belgian PES Actiris significantly more
A total of six PES identified less than twenty shortage occupations but in most cases the
difference was negligible
The Croatian and Portuguese PES were the only PES which did not identify any
professional occupation in their list of shortage occupations This may reflect the type of
vacancies which are notified by employers to these PES because both these PES use
their own administrative data systems exclusively to identify shortage occupations
6 In the 2016 study while 26 PES provided data on shortage occupations 13 provided data on surplus
occupations 7 Three groups are excluded from the Table managers (43) skilled agricultural (13) and armed forces (1) as the figures are quite small
Labour shortages and surpluses 2017
2018 21
Directorate-General for Employment Social Affairs and Inclusion European Network of Public Employment Services (PES)
Table 32 Shortages number of mentions (4-digit) in broad occupation (1-digit)
PES Professional Technical Clerical Craft Service Plant Elementary Total
Austria 4 11 1 12 2 0 0 30
Actiris 28 22 6 11 13 2 0 82
Le Forem 6 6 0 6 0 0 0 18
VDAB 4 7 1 4 1 3 0 20
Bulgaria 7 0 0 4 5 3 2 21
Croatia 0 1 0 13 1 3 2 20
Cyprus 6 1 2 5 5 1 6 26
Denmark 5 1 0 7 3 2 1 19
Estonia 10 7 0 0 2 1 0 20
Finland 12 5 1 7 2 2 3 32
France 18 27 2 27 1 26 2 103
Germany 16 19 0 10 2 1 1 49
Hungary 2 6 6 8 14 3 12 51
Iceland 6 3 0 5 2 1 3 20
Ireland 13 2 0 4 1 1 0 21
Italy 2 2 1 7 4 1 3 20
Latvia 7 1 1 9 0 0 0 18
Lithuania 1 2 0 15 0 2 0 20
Luxemburg 8 4 0 0 0 0 0 12
Malta 5 3 3 4 6 1 4 26
Netherlands 20 11 3 23 2 1 0 60
Norway 13 3 0 10 10 4 1 41
Poland 10 6 2 2 3 3 4 30
Portugal 0 1 0 8 3 3 0 15
Slovakia 6 6 2 5 5 2 0 26
Slovenia 23 13 3 30 11 13 9 102
Sweden 15 2 0 1 2 0 0 20
Switzerland 14 4 0 0 0 0 0 18
Total 261 176 34 237 100 79 53 940
The stipulation to only provide a list of twenty shortage occupations may have prevented
any pattern from emerging in the figures For example there does not appear to be any
relationship between the numbers of employed and unemployed in a specific labour
market and the number of shortage occupations identified by its national PES
The two PES who submitted the highest volumes of shortage occupations - the French
and Slovenian PES - vary greatly in terms of the relative size of their labour force while
for example the Norwegian PES submitted significantly more shortage occupations than
much larger countries such as Germany and Poland
As a way of controlling for the variation in the total number of shortage occupations it
may be useful to compare the variation within the list of shortage occupations identified
by each PES However no obvious patterns emerge when a number of hypotheses are
tested using this approach For example there appears to be no relationship between
countries which are associated with strong apprenticeship systems such as Germany
Austria Denmark and Switzerland and their share of shortages among the craft group of
occupations The Swiss PES does not contain any craft occupations in its list of shortage
occupations while the craft group of occupations contain the most shortage occupations
in the lists provided by both the Austrian and Danish PES In the case of the German
PES the share of craft occupations is a little above the average
Labour shortages and surpluses 2017
2018 22
Directorate-General for Employment Social Affairs and Inclusion European Network of Public Employment Services (PES)
Table 33 Surpluses number of mentions (4-digit) in broad occupation (1-digit)
PES Professional Technical Clerical Craft Service Plant Elementary Total
Le Forem 2 1 1 1 6 0 8 19
Bulgaria 6 3 2 0 4 0 2 17
Switzerland 0 4 2 4 1 2 3 16
Cyprus 5 0 0 2 0 0 3 10
Denmark 3 2 3 0 6 1 4 19
Estonia 6 2 3 2 6 0 1 20
Finland 16 7 6 10 3 1 0 43
France 10 10 1 2 5 1 0 29
Croatia 4 0 0 0 0 0 0 4
Hungary 6 9 3 16 15 1 2 52
Ireland 1 1 4 3 5 1 7 22
Iceland 11 1 2 2 1 0 1 18
Lithuania 0 3 1 0 2 2 0 8
Latvia 4 4 0 0 3 1 3 15
Netherlands 3 2 9 0 9 0 1 24
Poland 0 0 0 0 1 0 0 1
Sweden 4 3 7 1 3 0 2 20
Slovakia 7 1 3 1 2 0 0 14
Total 88 53 47 44 72 10 37 351
The most striking aspect of the geographical distribution of surplus occupations is the
relatively low number of occupations which were reported Most of the reporting PES
(eleven) provided less than the twenty surplus occupations they were requested to
submit Furthermore if the contributions from the Hungarian and Finnish PES are
excluded the average number of surplus occupations submitted by the other PES is
sixteen
With the exception of the Icelandic Finnish French and Hungarian PES the list of
surplus occupations remains in single figures across all the broad occupational groups
Such low figures result in limited cross-border matching possibilities which are explored
in the next chapter
The PES were also asked to indicate the lowest regional level at which they could provide
data on both shortage and surplus occupations Their response is outlined in Table 34
above A total of twenty PES responded positively in the case of shortage occupations
and twelve in the case of surplus occupations In the case of shortage occupations nine
PES indicated that they could provide data at NUTs3 level while eight PES stated that
they could provide the data at NUTs1 level In the case of surplus occupations five PES
indicated that they could provide the data at NUTs1 level and another five PES responded
that they could provide the data at NUTs 3 level There were very few PES who indicated
that the lowest level at which they could provide data was at NUTs2 or NUTs4 levels
Labour shortages and surpluses 2017
2018 23
Directorate-General for Employment Social Affairs and Inclusion European Network of Public Employment Services (PES)
Table 34 Availability of data on shortagessurpluses at regional levels
Shortage occupations Surplus occupations
Country NUTS1 NUTS2 NUTS3 NUTS4 No
data NUTS1 NUTS2 NUTS3 NUTS4
Austria
x
Belgium Actiris
x
Belgium Le Forem
x
x
Belgium VDAB
x
Bulgaria
x
x
x
Croatia x
x
Cyprus
x
x
Denmark
x
x
Estonia x
x
Finland
x
x
France
x
x
Germany x
Hungary
x
x
Iceland x
x
Ireland x
x
Italy
x
Latvia
x
x
Lithuania
x
x
Luxembourg x
Malta
x
Netherlands
x
x
Norway
x
Poland
x
x
Portugal
x
Slovakia
x
x
Slovenia x
Sweden
x
x
Switzerland
x
x
Note Bulgaria has regional data for some occupations
34 Tracking shortages over time
This is the third annual study on lsquoBottleneck Occupationsrsquo the previous two studies were
undertaken in 2016 and 2015 The findings in both of those studies were presented in 3-
digit codes To make the findings comparable over time the 4-digit shortage and surplus
occupations from the current study are aggregated up to 3-digit occupations as shown in
Table 35
A striking aspect of the list of occupations in Table 35 is the degree of consistency
displayed over the period 2015-2017 inclusive not simply in terms of the occupations
reported by the PES but also in terms of the number of PES who identified them as
shortages (ie their ranking) Not only does the 3-digit occupation category of lsquosoftware
and applications developersrsquo occupy the top ranking in each of the years five of the top
ranking six occupations are the same The only notable exception is that the finance
professional and associate professional occupations featured in the list of most reported
shortage occupations in 2015 but slipped out of this list in 2016 and 2017
Labour shortages and surpluses 2017
2018 24
Directorate-General for Employment Social Affairs and Inclusion European Network of Public Employment Services (PES)
Table 35 Ranking of shortage occupations (3-digit)
Rank
Top occupations in 2017 2017 2016 2015
Software and application developers 1 1 1
Sheet and structural metal workers 2 3 2
Medical doctors 3 5 2
Blacksmiths toolmakers and related trades 4 3 4
Building finishes and related trade workers 4 6 4
Building frame and related trade workers 4 3 4
Cooks 4 7 7
Engineering professionals 5 6 6
Physical and engineering science technicians 6 7 na
Electrical equipment installers and repairers 7 4 5
Heavy truck and bus drivers 7 5 4
Machinery mechanics and repairers 8 7 5
Nursing and midwifery professionals 8 6 na
Sales and purchasing agents and brokers 9 2 5
Shop salespersons 10 7 8
Electro technology engineers 10 na na
Primary school and early childhood teachers 10 na na
Domestic hotel and office cleaners and helpers 10 na na
Waiters and bartenders 10 na na
35 3-digit vs 4-digit
There are advantages and disadvantages associated with using the more aggregated 3-
digit occupation classification as it was done in previous studies The bundling of
individual occupations into families provides greater visibility of shortages at a broad
skill level (eg all software related occupations)
However there are distinct disadvantages in using the 3-digit occupations and these
apply particularly to their practical usefulness to education and training providers In
many cases shortages identified at 3-digit level do not provide a reliable basis for
identifying the specific skill which is in shortage or surplus
By combining the analyses of the 4-digit and corresponding 3-digit classifications in this
report many examples are revealed of how an exclusive reliance on the 3-digit
classification could be seriously misleading Thus the findings in this report show that
within the 3-digit classification of lsquosheet and structural metal workers moulders and
weldersrsquo the 4-digit occupation which is in short supply is lsquoweldersrsquo and not for example
lsquosheet metal workersrsquo This is an important insight because in many European countries
the skills of welding and sheet metal work are provided through entirely different
vocational programmes8
There are many examples of this phenomenon in the 3-digit occupations in Table 35 For
example the analysis in this report shows that toolmakers are a shortage occupation
8 In Ireland for example sheet metal workers and welders undertake entirely different apprenticeships
Labour shortages and surpluses 2017
2018 25
Directorate-General for Employment Social Affairs and Inclusion European Network of Public Employment Services (PES)
but blacksmiths are not Furthermore the 3-digit classification disguises the extent of the
reported shortage Thus while the 3-digit occupation of professional nursing and
midwifery is shown in the current report as being shortage occupations a total of eleven
PES reported professional nursing as a shortage compared to only three PES reporting
professional midwifery as a shortage By bundling these occupations together the
significant difference in the relative severity of the shortage is not apparent
This phenomenon applies equally to the surplus occupations which were identified in this
report For example lsquochildcare workersrsquo were described as a surplus occupation by five
PES But in the 3-digit classification they are bundled together with lsquospecial needs
teachersrsquo which was not identified as a surplus occupation
36 Conclusions
There are a number of conclusions which can be drawn from the analyses in this chapter
Firstly the sources used by many of the PES to identify shortage occupations is one of
the main reasons why only eighteen PES provided data on surplus occupations Many of
the PES relied on the results of employer surveys forecasting models and immigration
data to identify shortages and these sources in general do not provide data on surplus
occupations However it was by no means the only reason why so many PES did not
provide data on surplus organisations and this issue will have to be addressed before the
commencement of the 2018 study In the future PES data should be augmented by data
collected by other bodies as outlined in the new EU Regulation
Secondly there is no obvious explanation for the geographic distribution of shortages
and surpluses In some cases countries with relatively small labour forces have a
relatively high number of shortage occupations while a strong apprenticeship system
does not appear to prevent a relatively high share of the identified shortages being in the
craft occupations It may be that the stipulation to only include twenty shortage and
surplus occupations has created a situation where some countries with a relatively large
labour force are artificially constrained to submit a much smaller number of shortage
occupations than they actually have
Thirdly there is a high degree of stability in relation to the occupations which were
identified as shortages in the 2015 2016 and 2017 editions of the Bottleneck report
Finally providing information on shortage and surplus occupations at 4-digit level is
much more useful from a policy perspective than providing the data at a more
aggregated level The results of the analyses at 4-digit level show which specific
occupations in the bundle of occupations used in the previous reports were in shortage
and which were not This is also true of the occupations which were identified as surplus
occupations A more aggregated group of occupations does not allow for the targeting of
specific individual occupations either for increasing training provision or for enhancing
cross border mobility Indeed as a number of specific examples show were providers of
vocational training or indeed policy makers to act on the basis of the 3-digit shortage and
surplus occupations identified in previous reports they could very well have assign
resources to occupations which were neither in shortage nor in surplus
Labour shortages and surpluses 2017
2018 26
Directorate-General for Employment Social Affairs and Inclusion European Network of Public Employment Services (PES)
4 THE CAUSES OF SKILL SHORTAGES AND POTENTIAL SOLUTIONS
41 Introduction
The focus of this chapter is on identifying the possible causes of skills shortages and
surpluses and exploring ways in which these imbalances may be resolved The chapter
begins with a review of the nature of skills and labour market imbalances and concludes
with an exploration of the extent to which enhanced cross-border mobility policies and
more equal gender representation could contribute to the alleviation of skills and labour
imbalances in certain shortage occupations in the EEA labour market
42 The role of skills and labour shortages in skills imbalances
One of the new questions included in the current study asks the PES to identify the
nature of the shortage (ie is it a skill shortage or a labour shortage) in relation to each
shortage occupation they identified It was explained in the questionnaire that labour
shortages occur when there are a sufficient number of appropriately qualified job-seekers
to fill the vacancies which arise but for a variety of reasons many of them do not wish
to work in the occupation in question Their response to this question is summarised in
Table 41 in respect of the twenty occupations which were reported by the most PES
A total of twenty-six PES classified their shortage occupations as skill or labour
shortages and they classified most of the occupations as skill shortages Indeed in the
case of seven occupations plumbers doctors software developers electricians
electronic engineers electronic engineering technicians bus and tram drivers and
mechanical engineers all of the reporting PES classified the shortage as a skills deficit
Each labour market within the EEA is regulated in a particular manner and conditions of
employment even within the same occupation vary throughout the region This is why
many occupations while classified by most of the PES as reflecting skill deficits
nevertheless are classified by some PES as labour shortages
However the number of PES involved is very small indeed Only in the case of three
occupations lsquowaitersrsquo lsquoshop sales assistantsrsquo and lsquoprimary school teachersrsquo are there
more PES classifying the shortage as a labour shortage then a skills deficit The first two
occupations are undoubtedly labour shortages This is because there are few if any
barriers to working in these occupations9
The inclusion of lsquoprimary school teachersrsquo as a labour shortage is however a surprise It
was identified by eight PES as a shortage occupation two of whom classified the
occupation as a shortage of high magnitude It would be necessary to conduct research
into the conditions of employment ndash including qualification criteria ndash within the countries
where the reporting PES are located to establish if this classification of the occupation as
a labour shortage is warranted
With some notable exceptions the response of the PES to classifying their shortage
occupations as skill or labour shortages demonstrates that the PES understand these
concepts Occupations such as professional nurses which are obviously suffering from a
shortage of qualified job-seekers in the EEA are overwhelmingly categorised as a skills
shortage while less skilled occupations such as cleaners are categorised as being on the
borderline between skills and labour shortages
9 Both occupations have relatively high ratios of unemployed to new hires (Annex 4)
Labour shortages and surpluses 2017
2018 27
Directorate-General for Employment Social Affairs and Inclusion European Network of Public Employment Services (PES)
Table 41 Skill and labour shortages
Occupation
Number of PES
reporting occupation
as skills shortage
Number of PES
reporting occupation as labour shortage
Number of PES
reporting occupations as skill and
labour shortage
Total number of
PES reporting on skillslabour
shortage
Cooks 9 1 0 10
Plumbers and pipe fitters 8 0 0 8
Generalist medical Practitioners 7 0 0 7
Heavy truck and lorry drivers 4 2 1 7
Metal workers machine tool setting and operators
3 3 1 7
Welders and flame cutters 4 2 1 7
Nursing professionals 5 1 0 6
Software developers 6 0 0 6
Systems analyst 5 1 0 6
Bricklayers and related trades 4 1 0 5
Building and related electricians 5 0 0 5
Butchers fishmongers and related food 3 2 0 5
Cleaners and helpers in offices 3 2 0 5
Commercial sales representatives 2 2 1 5
Electronic engineers 5 0 0 5
Manufacturing supervisors 4 1 0 5
Motor vehicle mechanics and repairers 3 1 1 5
Nursing associate professionals 4 1 0 5
Primary school teachers 2 3 0 5
Shop sales assistants 1 4 0 5
Waiters 2 3 0 5
Agriculture and industrial machinery repairers
3 1 0 4
Application programmers 3 1 0 4
Bus and tram drivers 4 0 0 4
Electronic engineering technicians 4 0 0 4
Health care assistants 3 1 0 4
Mechanical engineers 4 0 0 4
Sheet metal workers 3 1 0 4
Structural metal preparers and erectors 3 1 0 4
Total number of PES reporting 16 8 2 26
The atypical working hours associated with heavy goods vehicle driving is recognised by
two of the six PES who classify shortages in the occupation as labour shortages while the
unpleasant conditions associated with working in butchery shops and abattoirs is
reflected in the fact that two of the five PES who categorised the occupation as a
shortage occupation classify it as a labour shortage
43 Location of skill imbalances and cross border mobility
In recent years there has been considerable discussion on the potential role which
enhanced cross-border mobility could play in alleviating labour market imbalances The
attractiveness of such a policy is obvious The European Union is a very large
Labour shortages and surpluses 2017
2018 28
Directorate-General for Employment Social Affairs and Inclusion European Network of Public Employment Services (PES)
marketplace embracing a very large labour force if even some of the shortages which
are reported by EEA countries could be resolved by exploiting the surpluses which are
reported by other EEA countries it could form the basis of a number of win-win solutions
for both job-seekers and businesses
An additional attraction of this policy is that it could potentially successfully address both
skills and labour shortages as working conditions associated with some labour shortages
in one country might be perceived as significantly more attractive in a different EEA
country
Table 44 provides a list of the top twenty shortage occupations which have at least one
PES in another EEA country reporting the occupation as a surplus
There are a number of aspects of the Table which are notable Firstly the list of top
occupations has changed quite dramatically from the list in Table 21 specifically none
of the professional and associate professional occupations are now on the list including
the four professional and associate professional health-related occupations or the two
professional software occupations What the Table shows is that there are no surpluses
reported in any of the EEA countries of doctors or nurses software developers or
systems analysts While the occupation of healthcare assistants is in surplus in many
countries it was not included in the list of top occupations because it was reported as a
shortage by only two PES
The figures in Table 42 show that there are three cross-border matching possibilities in
the case of bricklayers and motor mechanics and two possibilities in the case of
plasterers health care assistants and secondary school teachers
There is just one matching possibility in respect of a wide range of occupations including
cooks truck drivers commercial sales representatives electricians carpenters civil
engineers primary school teachers manufacturing supervisors telecentre salespersons
childhood education teachers floor layers and roofers
The fact that primary school teachers have only one cross border matching possibility
suggest that the classification of the occupation as a labour shortage by three of five PES
is an error In general labour shortages would be expected to have more cross border
matching possibilities than skill shortages because there are many job-seekers eligible to
work in the occupation in question and working conditions vary quite significantly from
country to country Indeed it is notable that the two other occupations which were
classified by the PES as predominantly labour shortages waiters and shop sales
assistants have a relatively high number of matching possibilities eight in the case of
shop sales assistants and three in the case of waiters
In general the PES did not classify the same occupation as both a shortage and a
surplus A striking exception is the Danish PES which categorised four of its shortage
occupations as surplus occupations also This is most likely due to the higher level of
granularity available in the Danish data (below 4-digit) so that some job titles within an
occupation are considered labour shortage while others skill shortage
44 Assessing gender composition of surpluses
The PES were asked to estimate the share of females in the occupations which they
identified as lsquosurplusrsquo occupations The restricting of this question to surplus occupations
was to avoid giving the impression that shortages were arising because of discriminatory
recruitment policies
Labour shortages and surpluses 2017
2018 29
Directorate-General for Employment Social Affairs and Inclusion European Network of Public Employment Services (PES)
A total of 13 PES reported any data on gender composition of surpluses However the
quality of information submitted did not provide a sufficient basis for an accurate
estimation of the gender composition of surpluses in some of the cases
It is suggested that in order to address gender imbalances in relation to shortages and
surpluses data from PES on job seekers should be combined with the LSF data on
employment by occupation
45 Conclusions
The analysis in chapter four has produced a number of interesting findings The analysis
reveals that the PES in general has the capacity to distinguish between skill and labour
shortages and to identify shortage occupations which have some cross-border matching
possibilities
The relatively low number of surplus occupations reflects two factors firstly only
eighteen PES submitted a list of surplus occupations and secondly in many cases the
lists did not include the maximum number of twenty occupations which were requested
This response has to be viewed against the background of an EEA labour market where
employment is expanding and unemployment is contracting However while this is a
positive development the relatively low number of surplus occupations has placed a
significant limit on the extent to which there were cross-border possibilities of matching
shortage with surplus occupations
The data indicates that there is a limitation to the extent to which the PES can be used to
identify the gender imbalances (eg under-representation of females in some
occupations) and that other sources should be explored
Labour shortages and surpluses 2017
2018 30
Directorate-General for Employment Social Affairs and Inclusion European Network of Public Employment Services (PES)
Table 43 The potential for cross-border matching of shortage and surplus occupations
No PES
Occupation PES reporting shortage PES reporting surplus No PES
16 Cooks AT Art BG CY DK HR IE IS IT MT NL NO PT SE SI SK lsaquo―rsaquo HU 1
11 Truck drivers ART VDAB BG DK HR LT IT NL NO PT SE SI SK lsaquo―rsaquo DK 1
10 Cleaners helpers CY DK HR FI IS HU NL NO PT SI lsaquo―rsaquo DK LF NL IE 4
10 Commercial sales VDAB ART DK FI FR IT IE PT PL SI lsaquo―rsaquo DK 1
9 Sales assistants AT ART BG CY DK IT NO SI SK lsaquo―rsaquo DK LF SE NL BG CH FI IE 8
9 Bricklayers ART DE DK HR HU LT NL PT SI lsaquo―rsaquo CY HU IE 3
9 Motor mechanics AT VDAB ART LF DK IT NO PT SI lsaquo―rsaquo SK CH EE 3
9 Waiters ART BG CY IS IT MT NO PT SI lsaquo―rsaquo HU EE IE 3
9 Electricians ART VDAB DE DK IS IT NL NO SI lsaquo―rsaquo FR 1
8 Carpenters DK HR HU FI NL NO PT SI lsaquo―rsaquo HU 1
8 Civil engineers ART CH DE FI FR NO SE SI lsaquo―rsaquo CY 1
8 Primary teachers ART BG DK IS NO SE SI SK lsaquo―rsaquo CY 1
7 Healthcare assist CY DK EE NL NO SI SK lsaquo―rsaquo DK NL 2
7 Second teacher ART BG FR NL NO SI SK lsaquo―rsaquo CY FI 2
7 Man supervisors ART VDAB LF DE EE FR SK lsaquo―rsaquo BG 1
6 Plasterers HR HU FI LT NL SI lsaquo―rsaquo HU IE 2
6 Tele centre sales ART HU FI FR MT NO lsaquo―rsaquo EE 1
6 Childhood educ FI LT NO SE SI SK lsaquo―rsaquo CY 1
6 Floor layers HU HR FI FR LT LV lsaquo―rsaquo HU 1
6 Roofers HR FI FR LT LV SI lsaquo―rsaquo HU 1
Bottlenecks Occupations 2017
2017 31
Directorate-General for Employment Social Affairs and Inclusion European Network of Public Employment Services (PES)
5 CONCLUSIONS AND RECOMMENDATIONS
51 Conclusions
The terms of reference for this study emphasise the desirability of creating a process for
the systematic collection of data on surplus and shortage occupations in the EEA area
which could be effectively used by EURES for cross border matching of shortage
occupations in some EEA countries with surplus occupations in others
The authors have responded to this emphasis by using a process which ensures that the
data gathered on shortage and surplus occupations is comprehensive accurate and of
practical use to EURES and the providers of education and training programmes The
process is comprehensive because it gathers information both on the extent of shortages
and surpluses and on their relative severity It is accurate because the list of shortage
and surplus occupations are shown to be consistent with the estimated value of the ratio
of unemployed to new hires Finally the process provides information which is of
practical use to EURES and the national providers of VET because the data gathered is on
individual occupations rather than on lsquobundles of occupationsrsquo as in previous studies The
analyses in this report shows that while these bundles of occupations contain some
occupations which are identified by the PES as shortage and surplus occupations they
also contain occupations which are neither in shortage nor in surplus and it is impossible
to distinguish one from the other
The data gathering process used in this report however was not devoid of weaknesses
Fortunately these weaknesses reflect the modus operandi of the PES and may be
rectified by including other institutions and agencies in the process For example the PES
use the same sources for the identification of both shortage and surplus occupations
This may have advantages in terms of accuracy when those sources include employersrsquo
surveys immigration data and the results of forecasting exercises However these
sources are not suitable for gathering data on surplus occupations and they are the main
reason why the number of surplus occupations provided by the PES were almost half the
number requested In the future PES data could be augmented by data gathered by
other bodies as outlined in recent EU Regulation 2016589
In addition the response to the question on the capacity of the PES to deliver data on
shortage and surplus occupations at a regional level was also disappointing perhaps
reflecting a misalignment in some EEA countries between the geographic configuration of
the local PES network and the NUTs regions
The analysis highlighted that in order to assess gender imbalances of shortages and
surpluses PES data needs to be augmented by other sources
Finally despite the low number of surplus occupations submitted by the PES it was
nevertheless possible to identify twenty shortage occupations in the EEA labour market
which had at least one cross-border matching possibility and many more than one in the
case of some shortage occupations
52 Recommendations
Based on the findings from the three bottleneck studies undertaken to date a model for
the gathering of data on shortages and surpluses is proposed (Figure 51) The model
includes features of the methodology applied in this study which were successful It also
includes a number of features which should be introduced to the process in order to
address some of the weaknesses which were identified in this study (highlighted in red)
Labour shortages and surpluses 2017
2017 32
Directorate-General for Employment Social Affairs and Inclusion European Network of Public Employment Services (PES)
However before this methodology is implemented it would be prudent to discuss data
requirements with PES and invite a broader range of institutions and agencies to
participate in aspects of the data gathering process in addition to the PES EURES
Regulation (EU) 2016589 of the European Parliament and of the Council which obliges
the appropriate national authorities to furnish such data annually is fortuitous in this
regard and should facilitate the implementation of this recommendation
In addition the results of these and other relevant studies should be disseminated to
PES Eures coordination group and other relevant agencies and institutions in order to
emphasise the importance of data and analysis in informing policy at EU and national
level which aims to resolve labour market imbalances
Labour shortages and surpluses 2017
2017 33
Directorate-General for Employment Social Affairs and Inclusion European Network of Public Employment Services (PES)
Figure 51 Model for gathering data on shortage and surplus occupations
Sources of data on surpluses PES data from other relevant agencies
In those cases where the source used by the PES to identify shortage occupations cannot
be used to identify surplus occupations other institutions or other sources or both should be availed of to ensure that comprehensive data on surplus occupations are provided to the appropriate national authority
Dimensions of shortagessurpluses extent (number of reporting PES) and severity (high or low
magnitude)
Data should be systematically gathered on both the extent of shortage and surplus
occupations in the EEA and on their relative severity
Type of shortage skill vs labour shortages
The providers of the data on shortage occupations must also distinguish between skill and labour shortages because this distinction is necessary for the accurate identification of
shortage occupations and for the choice of the appropriate policy response to identified shortages
Classification of occupations used ISCO 08 4-digit codes (or translation into these codes)
All data should be either initially gathered in ISCO 08 4-digit codes or translated into these
codes This ensures that the data refers to specific individual occupations and is of practical use to EURES and the national providers of VET
Accuracy test cross-check with LSF data (ratio of unemployed to new hires)
The accuracy of the submitted lists of shortage and surplus occupations should be assessed
by comparing the most widely reported surplus and shortage occupations with the estimated values of the ratios of employed (by previous occupation) to new hires at the aggregated EU28 level These ratios should be based on an analysis of the most up-to date
Labour Force Survey (LFS) data
Gender balance assessment LFS data on employment at occupational level by gender PES job
seekers
The gender composition of shortage and surplus occupations should be based on the most
up to date analyses of LFS data on employment by gender and the PES job seeker data
Regional balance assessment LSF data data from relevant agencies
Where regional data is required other agencies and institutions should be requested to
provide the data in those cases where the data cannot be provided by the regional PES network because it is not geographically aligned to the NUTs regions
Labour shortages and surpluses 2017
2017 34
Directorate-General for Employment Social Affairs and Inclusion European Network of Public Employment Services (PES)
Number of occupations reporting should be extended beyond 20 occupations but with upper
limit (eg 50)
Consideration should be given to allowing the agencies responsible for identifying shortage
and surplus occupations a greater range of flexibility in terms of the numbers of occupations which should be identified A minimum to maximum range would be a more realistic approach as it would reflect the fact that the labour markets of the EEA vary significantly in size and performance
Timing of imbalance assessment September
It is proposed that the data gathering exercise should be brought forward to early September and that expert advice should be available on line throughout the data
gathering exercise
Labour shortages and surpluses 2017
2017 35
Directorate-General for Employment Social Affairs and Inclusion European Network of Public Employment Services (PES)
ANNEX 1 DATA COLLECTION TEMPLATE Information sought Explanation
Occupation title (text) Type in free text a list of occupations (one row one occupation) for which shortages and surpluses exist first list occupations for which there is a shortage the list should contain a maximum of 20 occupations if your list contains less than 20 occupations please provide a brief explanation in your email response for why the number is lower than 20 second list occupations for which there is a surplus the list should contain a maximum of 20 occupations if your list contains less than 20 occupations please provide a brief explanation in your email response for why the number is lower than 20
Shortagesurplus indicator For each occupation indicate if it refers to a shortage by typing in shortage or surplus by typing in surplus to identify surplus occupations you can examine for each occupation the ratio of the number of job seekers to the number of vacancies at the end of each year for example if there are 5000 shop assistants seeking employment and there are 200 vacancies at the end of the reference period the ratio is 251 you can rank the calculated ratios and report the occupations associated with the 20 highest ratios
Occupational classification used in your country
For each occupation indicate what occupational classification (if any) was used to identify this occupation for instance you can report a country specific classification ISCO ROME SOC etc If you donrsquot use occupational classifications type None
Occupation code to the lowest level of disaggregation (eg ISCO at 4 digits)
If you have indicated a classification used type the code for each occupation use the lowest level of disaggregation (eg 4 digit ISCO code) if you donrsquot use occupational classification leave black
ISCO-08 code at 4-digit level (or lower if 4-digit not available)
If you use occupational classification which is not ISCO-08 and if it is possible provide a translation of the national code to ISCO-08 code ISCO is the International Standard Classification of Occupations which is used to report to Eurostat code should be at 4 digits if this is not available than the lowest level of disaggregation that is available should be reported (3 digits if 4-digit code is not available 2 digits if neither 4-digit nor 3-digit code is available 1 digit if neither 4-digit 3-digit nor 2-digit code is available) if it is not possible to provide translation to ISCO-08 leave black if you have already reported ISCO-08 code in column 3 leave this column black
Estimate of shortagesurplus magnitude (high (gt3 of employment) medium (1-3 of employment) low (lt1 of employment))
For each occupation indicate a broad estimate of the magnitude of the shortagesurplus if you estimate that the shortagesurplus is less than 1 of the total employment in the occupation in question type low if between 1-3 type medium if greater than 3 type high if you cannot provide a rough estimate of magnitude type dont know
Current shortagesurplus (C) future short term (FST) future medium term (FMT) future long term (FLT) donrsquot know (indicate all that apply)
Against each occupation indicate if the identified shortagesurplus refers to present situation by typing C if the shortage is expected to occur in the short term future ie within 12 months by typing FST if it is expected to occur over the medium term (within 1-5 years) by typing FMT if it is expected to occur in the long term (in 5 or more years) by typing FLT if more than one time period applies indicate all relevant ones (eg for current shortagessurpluses that are expected to persist over the short term type C FST) if you dont know type dont know
Source of information on shortagessurpluses (eg PES administrative data (vacancies job seekers) PES survey third party survey Occupational forecasts other (specify) etc)
Indicate the source used to identify shortagesurplus for this occupation did you derive it from the PES administrative data on PES vacancies andor job seekers did you conduct a survey did you commission a third party to conduct a survey for you did you have occupational forecasts available did you use other research type in free text the full description of the source(s) eg National Employment Survey conducted by PES etc
Labour shortages and surpluses 2017
2017 36
Directorate-General for Employment Social Affairs and Inclusion European Network of Public Employment Services (PES)
Date for source of information Indicate the year that the information on shortagessurpluses (column 7) refers to eg type 2016 for a survey of difficult to fill vacancies conducted in 2016 even if the report was published in 2017
What indicator(s) suggested that there is a shortagesurplus
Indicate what criteria was used to conclude that this occupation is associated with a shortagesurplus for instance employers views sourcing from abroad to fill vacancies growth in employment faster than growth in educationtraining output time required to fill
vacancies higher than average etc
Share of females among job seekers in this occupation (surplus occupations only)
Indicate the percentage share of females among all job seekers in this occupation this is only applicable to surplus occupations
Skill or labour shortage Indicate if a shortage refers to a skill or labour shortage a skill shortage occurs where there is an insufficient supply of persons with the appropriate skills labour shortages occur where there is a sufficient number of skilled persons however an insufficient number of them is willing to take up employment in the occupation in question
Indicate the availability of data on shortagessurpluses at regional level (NUTS1 NUTS2 NUTS3 No data)
Indicate if data is available on the regional breakdown of shortagessurpluses by indicating the level of regional data available if multiple levels of regional disaggregation are available indicate the lowest level of disaggregation (eg NUTS3 rather than NUTS2) if there is no regional data available use no data
Labour shortages and surpluses 2017
2017 37
Directorate-General for Employment Social Affairs and Inclusion European Network of Public Employment Services (PES)
ANNEX 2 SHORTAGE OCCUPATIONS
Shortage occupation PES count
Cooks 16 Plumbers and pipe fitters 13 Generalist medical practitioners 12 Welders and flamecutters 12 Heavy truck and lorry drivers 11 Metal working machine tool setters and operators 11 Nursing professionals 11 Software developers 11 Agricultural and industrial machinery mechanics and repairers 10 Cleaners and helpers in offices hotels and other establishments 10 Commercial sales representatives 10 Specialist medical practitioners 10 Systems analysts 10 Bricklayers and related workers 9 Building and related electricians 9 Butchers fishmongers and related food preparers 9 Motor vehicle mechanics and repairers 9 Nursing associate professionals 9 Sheet-metal workers 9 Shop sales assistants 9 Waiters 9 Carpenters and joiners 8 Civil engineers 8 Concrete placers concrete finishers and related workers 8 Electrical engineering technicians 8 Electronics engineering technicians 8 Mechanical engineers 8 Primary school teachers 8 Structural-metal preparers and erectors 8 Electronics engineers 7
Health care assistants 7 Manufacturing supervisors 7 Mechanical engineering technicians 7 Secondary education teachers 7 Accountants 6 Applications programmers 6 Bus and tram drivers 6 Contact centre salespersons 6 Early childhood educators 6 Electrical mechanics and fitters 6 Floor layers and tile setters 6 Plasterers 6 Roofers 6 Sewing machine operators 6 Software and applications developers and analysts not elsewhere classified 6 Toolmakers and related workers 6 Web and multimedia developers 6 Air conditioning and refrigeration mechanics 5 Building frame and related trades workers not elsewhere classified 5 Chefs 5 Civil engineering labourers 5 Construction supervisors 5 Earthmoving and related plant operators 5 Electrical engineers 5 Electrical line installers and repairers 5 Engineering professionals not elsewhere classified 5 Hairdressers 5 Information and communications technology operations technicians 5 Manufacturing managers 5 Physiotherapists 5 Real estate agents and property managers 5 Research and development managers 5 Spray painters and varnishers 5 Accounting associate professionals 4 Bakers pastry-cooks and confectionery makers 4
Labour shortages and surpluses 2017
2017 38
Directorate-General for Employment Social Affairs and Inclusion European Network of Public Employment Services (PES)
Shortage occupation PES count
Blacksmiths hammersmiths and forging press workers 4 Civil engineering technicians 4 Crane hoist and related plant operators 4 Database designers and administrators 4 Industrial and production engineers 4 Painters and related workers 4 Physical and engineering science technicians not elsewhere classified 4 Plastic products machine operators 4 Social work and counselling professionals 4 Accounting and bookkeeping clerks 3 Administrative and executive secretaries 3 Ambulance workers 3 Building construction labourers 3 Car taxi and van drivers 3 Cartographers and surveyors 3 Cleaning and housekeeping supervisors in offices hotels and other establishments 3 Contact centre information clerks 3 Draughtspersons 3 Fast food preparers 3 Freight handlers 3 Gardeners horticultural and nursery growers 3 Home-based personal care workers 3 Hotel receptionists 3 Information and communications technology installers and servicers 3 Insulation workers 3 Kitchen helpers 3 Manufacturing labourers not elsewhere classified 3 Medical imaging and therapeutic equipment technicians 3 Metal moulders and coremakers 3 Metal polishers wheel grinders and tool sharpeners 3 Midwifery professionals 3 Other language teachers 3 Personal services workers not elsewhere classified 3
Pharmacists 3 Policy administration professionals 3 Printers 3 Process control technicians not elsewhere classified 3 Sales and marketing managers 3 Shop supervisors 3 Special needs teachers 3 Stock clerks 3 Supply distribution and related managers 3 Survey and market research interviewers 3 Systems administrators 3 Technical and medical sales professionals (excluding ICT) 3 Translators interpreters and other linguists 3 Transport clerks 3 Vocational education teachers 3 Advertising and marketing professionals 2 Audiologists and speech therapists 2 Bartenders 2 Beauticians and related workers 2 Cashiers and ticket clerks 2 Chemical engineers 2 Child care workers 2 Computer network and systems technicians 2 Computer network professionals 2 Construction managers 2 Craft and related workers not elsewhere classified 2 Credit and loans officers 2 Crop farm labourers 2 Database and network professionals not elsewhere classified 2 Dentists 2 Domestic cleaners and helpers 2 Door to door salespersons 2 Driving instructors 2 Electrical and electronic equipment assemblers 2 Electronics mechanics and servicers 2 Elementary workers not elsewhere classified 2 Employment agents and contractors 2
Labour shortages and surpluses 2017
2017 39
Directorate-General for Employment Social Affairs and Inclusion European Network of Public Employment Services (PES)
Shortage occupation PES count
Field crop and vegetable growers 2 Financial analysts 2 Financial and investment advisers 2 Forestry and related workers 2 Garbage and recycling collectors 2 General office clerks 2 Graphic and multimedia designers 2 Information and communications technology service managers 2 Insurance representatives 2 Locomotive engine drivers 2 Mail carriers and sorting clerks 2 Management and organization analysts 2 Mathematicians actuaries and statisticians 2 Mechanical machinery assemblers 2 Medical and dental prosthetic technicians 2 Medical assistants 2 Messengers package deliverers and luggage porters 2 Metal finishing plating and coating machine operators 2 Metal processing plant operators 2 Optometrists and ophthalmic opticians 2 Personal care workers in health services not elsewhere classified 2 Police officers 2 Policy and planning managers 2 Production clerks 2 Restaurant managers 2 Retail and wholesale trade managers 2 Sales workers not elsewhere classified 2 Sewing embroidery and related workers 2 Street food salespersons 2 Tailors dressmakers furriers and hatters 2 Telecommunications engineers 2 Advertising and public relations managers 1 Aged care services managers 1
Agricultural technicians 1 Aircraft engine mechanics and repairers 1 Aircraft pilots and related associate professionals 1 Assemblers not elsewhere classified 1 Authors and related writers 1 Bank tellers and related clerks 1 Bleaching dyeing and fabric cleaning machine operators 1 Bookmakers croupiers and related gaming workers 1 Business services agents not elsewhere classified 1 Buyers 1 Cabinet-makers and related workers 1 Cement stone and other mineral products machine operators 1 Chemical and physical science technicians 1 Chemical engineering technicians 1 Chemical processing plant controllers 1 Chemical products plant and machine operators 1 Chemists 1 Conference and event planners 1 Customs and border inspectors 1 Data entry clerks 1 Dental assistants and therapists 1 Dieticians and nutritionists 1 Dispensing opticians 1 Domestic housekeepers 1 Economists 1 Education methods specialists 1 Environmental and occupational health and hygiene professionals 1 Environmental and occupational health inspectors and associates 1 Fibre preparing spinning and winding machine operators 1 Finance managers 1 Financial and insurance services branch managers 1 Fire-fighters 1 Fitness and recreation instructors and program leaders 1 Food and beverage tasters and graders 1 Food and related products machine operators 1
Labour shortages and surpluses 2017
2017 40
Directorate-General for Employment Social Affairs and Inclusion European Network of Public Employment Services (PES)
Shortage occupation PES count
Food service counter attendants 1 Forestry labourers 1 Fruit vegetable and related preservers 1 Fur and leather preparing machine operators 1 Glass and ceramics plant operators 1 Hand launderers and pressers 1 Hand packers 1 Handicraft workers in textile leather and related materials 1 Health associate professionals not elsewhere classified 1 Health professionals not elsewhere classified 1 House builders 1 Human resource managers 1 Incinerator and water treatment plant operators 1 Information and communications technology user support technicians 1 Judges 1 Lawyers 1 Legal and related associate professionals 1 Legal professionals not elsewhere classified 1 Library clerks 1 Lifting truck operators 1 Livestock and dairy producers 1 Livestock farm labourers 1 Medical and pathology laboratory technicians 1 Medical secretaries 1 Metal production process controllers 1 Mining and quarrying labourers 1 Mining engineers metallurgists and related professionals 1 Mixed crop and animal producers 1 Mixed crop growers 1 Motorcycle drivers 1 Odd job persons 1 Other cleaning workers 1 Other music teachers 1
Paper products machine operators 1 Personnel and careers professionals 1 Personnel clerks 1 Pet groomers and animal care workers 1 Physicists and astronomers 1 Physiotherapy technicians and assistants 1 Potters and related workers 1 Power production plant operators 1 Prison guards 1 Product and garment designers 1 Psychologists 1 Pulp and papermaking plant operators 1 Railway brake signal and switch operators 1 Receptionists (general) 1 Refuse sorters 1 Riggers and cable splicers 1 Scribes and related workers 1 Secretaries (general) 1 Securities and finance dealers and brokers 1 Security guards 1 Senior government officials 1 Senior officials of special-interest organizations 1 Shelf fillers 1 Ships engineers 1 Shoemaking and related machine operators 1 Social work associate professionals 1 Stall and market salespersons 1 Stationary plant and machine operators not elsewhere classified 1 Stonemasons stone cutters splitters and carvers 1 Street and related service workers 1 Sweepers and related labourers 1 Teaching professionals not elsewhere classified 1 Telecommunications engineering technicians 1 Textile fur and leather products machine operators not elsewhere classified 1 Trade brokers 1 Travel attendants and travel stewards 1 Travel guides 1
Labour shortages and surpluses 2017
2017 41
Directorate-General for Employment Social Affairs and Inclusion European Network of Public Employment Services (PES)
Shortage occupation PES count
Tree and shrub crop growers 1 Underwater divers 1 University and higher education teachers 1 Vehicle cleaners 1 Veterinarians 1 Weaving and knitting machine operators 1 Web technicians 1 Wood processing plant operators 1 Woodworking-machine tool setters and operators 1
Labour shortages and surpluses 2017
2017 42
Directorate-General for Employment Social Affairs and Inclusion European Network of Public Employment Services (PES)
ANNEX 3 SURPLUS OCCUPATIONS
Surplus occupation PES count
General office clerks 8 Shop sales assistants 8 Advertising and marketing professionals 6 Bank tellers and related clerks 6 Sociologists anthropologists and related professionals 6 Child care workers 5 Hairdressers 5 Journalists 5 Cashiers and ticket clerks 4 Cleaners and helpers in offices hotels and other establishments 4 Hand packers 4 Mail carriers and sorting clerks 4 Photographers 4 Receptionists (general) 4 Tailors dressmakers furriers and hatters 4 Accounting and bookkeeping clerks 3 Administrative and executive secretaries 3 Beauticians and related workers 3 Biologists botanists zoologists and related professionals 3 Bricklayers and related workers 3 Broadcasting and audio-visual technicians 3 Civil engineering labourers 3 Economists 3 Gardeners horticultural and nursery growers 3 Interior designers and decorators 3 Kitchen helpers 3 Legal professionals not elsewhere classified 3 Manufacturing labourers not elsewhere classified 3 Motor vehicle mechanics and repairers 3
Musicians singers and composers 3 Other artistic and cultural associate professionals 3 Painters and related workers 3 Philosophers historians and political scientists 3 Security guards 3 Sweepers and related labourers 3 Travel consultants and clerks 3 Waiters 3 Actors 2 Archivists and curators 2 Bakers pastry-cooks and confectionery makers 2 Bartenders 2 Building construction labourers 2 Business services and administration managers not elsewhere classified 2 Cabinet-makers and related workers 2 Car taxi and van drivers 2 Chemists 2 Cleaning and housekeeping supervisors in offices hotels and other establishments 2 Credit and loans officers 2 Customs and border inspectors 2 Elementary workers not elsewhere classified 2 Film stage and related directors and producers 2 Financial analysts 2 Forestry and related workers 2 Freight handlers 2 Graphic and multimedia designers 2 Health care assistants 2 Hotel receptionists 2 Lawyers 2 Legal and related associate professionals 2 Library clerks 2 Livestock and dairy producers 2 Management and organization analysts 2 Messengers package deliverers and luggage porters 2 Odd job persons 2 Office supervisors 2 Plasterers 2
Labour shortages and surpluses 2017
2017 43
Directorate-General for Employment Social Affairs and Inclusion European Network of Public Employment Services (PES)
Surplus occupation PES count
Police officers 2 Pre-press technicians 2 Print finishing and binding workers 2 Printers 2 Prison guards 2 Product and garment designers 2 Psychologists 2 Public relations professionals 2 Religious professionals 2 Secondary education teachers 2 Secretaries (general) 2 Social work and counselling professionals 2 Stall and market salespersons 2 Stock clerks 2 Teachers aides 2 Telephone switchboard operators 2 Travel guides 2 Visual artists 2 Advertising and public relations managers 1 Agricultural technicians 1 Announcers on radio television and other media 1 Assemblers not elsewhere classified 1 Building and related electricians 1 Building architects 1 Building caretakers 1 Building frame and related trades workers not elsewhere classified 1 Business services agents not elsewhere classified 1 Buyers 1 Carpenters and joiners 1 Chemical engineers 1 Civil engineers 1 Clearing and forwarding agents 1 Clerical support workers not elsewhere classified 1
Commercial sales representatives 1 Conference and event planners 1 Contact centre information clerks 1 Contact centre salespersons 1 Cooks 1 Crane hoist and related plant operators 1 Creative and performing artists not elsewhere classified 1 Dancers and choreographers 1 Data entry clerks 1 Database designers and administrators 1 Domestic cleaners and helpers 1 Domestic housekeepers 1 Draughtspersons 1 Driving instructors 1 Early childhood educators 1 Electronics mechanics and servicers 1 Farming forestry and fisheries advisers 1 Fashion and other models 1 Fast food preparers 1 Field crop and vegetable growers 1 Filing and copying clerks 1 Finance managers 1 Financial and insurance services branch managers 1 Financial and investment advisers 1 Fire-fighters 1 Fitness and recreation instructors and program leaders 1 Floor layers and tile setters 1 Food service counter attendants 1 Fruit vegetable and related preservers 1 Gallery museum and library technicians 1 Garbage and recycling collectors 1 Garment and related pattern-makers and cutters 1 Glass and ceramics plant operators 1 Government tax and excise officials 1 Hand launderers and pressers 1
Labour shortages and surpluses 2017
2017 44
Directorate-General for Employment Social Affairs and Inclusion European Network of Public Employment Services (PES)
Surplus occupation PES count
Heavy truck and lorry drivers 1 House builders 1 Hunters and trappers 1 Information and communications technology installers and servicers 1 Information and communications technology user support technicians 1 Insurance representatives 1 Jewellery and precious-metal workers 1 Judges 1 Legal secretaries 1 Librarians and related information professionals 1 Life science technicians (excluding medical) 1 Lifting truck operators 1 Managing directors and chief executives 1 Manufacturing supervisors 1 Medical and dental prosthetic technicians 1 Metal moulders and coremakers 1 Mining and quarrying labourers 1 Mixed crop and animal producers 1 Mixed crop growers 1 Mobile farm and forestry plant operators 1 Musical instrument makers and tuners 1 Other language teachers 1 Pawnbrokers and money-lenders 1 Personnel and careers professionals 1 Pet groomers and animal care workers 1 Photographic products machine operators 1 Physical and engineering science technicians not elsewhere classified 1 Physicists and astronomers 1 Police inspectors and detectives 1 Precision-instrument makers and repairers 1 Primary school teachers 1 Process control technicians not elsewhere classified 1 Product graders and testers (excluding foods and beverages) 1
Production clerks 1 Professional services managers not elsewhere classified 1 Protective services workers not elsewhere classified 1 Research and development managers 1 Retail and wholesale trade managers 1 Roofers 1 Sales workers not elsewhere classified 1 Senior government officials 1 Service station attendants 1 Shelf fillers 1 Shop supervisors 1 Social work associate professionals 1 Special needs teachers 1 Spray painters and varnishers 1 Statistical mathematical and related associate professionals 1 Stonemasons stone cutters splitters and carvers 1 Street food salespersons 1 Supply distribution and related managers 1 Teaching professionals not elsewhere classified 1 Technical and medical sales professionals (excluding ICT) 1 Training and staff development professionals 1 Translators interpreters and other linguists 1 Transport conductors 1 Tree and shrub crop growers 1 Typists and word processing operators 1 Undertakers and embalmers 1 Vocational education teachers 1 Weaving and knitting machine operators 1 Woodworking-machine tool setters and operators 1
Labour shortages and surpluses 2017
2017 45
Directorate-General for Employment Social Affairs and Inclusion European Network of Public Employment Services (PES)
ANNEX 4 THE RATIO OF UNEMPLOYED TO NEW HIRES
ISCO-08 title
2015
UE
Recruited in the
last year (lt12
months)
Ratio of UE to new recruits
Street and related service workers 85 104 08 Agricultural forestry and fishery labourers 3913 5343 07 Mining and construction labourers 1937 3525 05 Creative and performing artists 610 1115 05 Refuse workers 1036 1923 05 Painters building structure cleaners and related trades workers 1116 2117 05 Street and market salespersons 195 389 05 Building frame and related trades workers 3632 7353 05 Mining manufacturing and construction supervisors 626 1315 05 Ships deck crews and related workers 53 114 05 Market gardeners and crop growers 1471 3207 05 Managing directors and chief executives 304 667 05 Travel attendants conductors and guides 229 538 04 Wood treaters cabinet-makers and related trades workers 491 1159 04 Manufacturing labourers 1640 3909 04 Domestic hotel and office cleaners and helpers 5679 13545 04 Other stationary plant and machine operators 822 1961 04 Mobile plant operators 1038 2497 04 Building finishers and related trades workers 1519 3680 04 Textile fur and leather products machine operators 431 1048 04 Garment and related trades workers 422 1047 04 Chemical and photographic products plant and machine operators 157 389 04 Food processing and related trades workers 930 2330 04 Vehicle window laundry and other hand cleaning workers 291 754 04 Sheet and structural metal workers moulders and welders and related workers
996 2603 04
Waiters and bartenders 4399 11595 04 Cooks 1529 4039 04 Metal processing and finishing plant operators 208 557 04 Printing trades workers 203 548 04 Forestry and related workers 130 351 04 Protective services workers 1347 3658 04 Transport and storage labourers 2532 6939 04 Fishery workers hunters and trappers 46 128 04 Material-recording and transport clerks 1671 4630 04 Process control technicians 179 517 03 Mining and mineral processing plant operators 94 274 03 Telecommunications and broadcasting technicians 177 519 03 Blacksmiths toolmakers and related trades workers 816 2409 03 Building and housekeeping supervisors 678 2045 03
Secretaries (general) 1072 3259 03 Assemblers 850 2586 03 Other craft and related workers 258 810 03 Shop salespersons 6600 21042 03 Electrical equipment installers and repairers 958 3060 03 Food and related products machine operators 437 1400 03 Other sales workers 1087 3510 03 Food preparation assistants 1646 5337 03 Mixed crop and animal producers 387 1260 03 Car van and motorcycle drivers 1155 3764 03 Client information workers 1993 6531 03 Sports and fitness workers 605 1984 03 Handicraft workers 194 638 03 Life science technicians and related associate professionals 82 271 03 Keyboard operators 283 940 03 Electronics and telecommunications installers and repairers 290 963 03 Other personal services workers 313 1047 03 Vocational education teachers 279 940 03 Other teaching professionals 744 2518 03 General office clerks 966 3272 03 Authors journalists and linguists 335 1135 03 Hairdressers beauticians and related workers 806 2796 03
Labour shortages and surpluses 2017
2017 46
Directorate-General for Employment Social Affairs and Inclusion European Network of Public Employment Services (PES)
ISCO-08 title
2015
UE
Recruited in the
last year (lt12
months)
Ratio of UE to new recruits
Animal producers 189 660 03 Other elementary workers 976 3401 03 Machinery mechanics and repairers 1134 3962 03 Ship and aircraft controllers and technicians 80 281 03 Hotel and restaurant managers 344 1220 03 Cashiers and ticket clerks 908 3220 03 Retail and wholesale trade managers 224 809 03 Sales marketing and development managers 311 1124 03 Physical and engineering science technicians 1204 4366 03 Administrative and specialised secretaries 1106 4040 03 Sales and purchasing agents and brokers 1294 4754 03 Rubber plastic and paper products machine operators 256 941 03 Artistic cultural and culinary associate professionals 511 1906 03 Numerical clerks 944 3532 03 Other services managers 184 691 03 Child care workers and teachers aides 1335 5005 03 Heavy truck and bus drivers 1426 5349 03 Business services and administration managers 383 1439 03 Information and communications technology service managers 67 257 03 Regulatory government associate professionals 209 807 03 Life science professionals 176 681 03 Wood processing and papermaking plant operators 97 379 03 Locomotive engine drivers and related workers 46 179 03 Legal professionals 315 1245 03 Personal care workers in health services 2195 8787 02 Physical and earth science professionals 85 345 02 Street vendors (excluding food) 50 204 02 Architects planners surveyors and designers 515 2092 02 Other clerical support workers 901 3657 02 Business services agents 510 2114 02 Manufacturing mining construction and distribution managers 361 1507 02 Tellers money collectors and related clerks 381 1612 02 Librarians archivists and curators 58 248 02 Medical and pharmaceutical technicians 255 1099 02 University and higher education teachers 301 1333 02 Information and communications technology operations and user support technicians
418 1888 02
Legal social and religious associate professionals 920 4348 02 Financial and mathematical associate professionals 601 2852 02 Sales marketing and public relations professionals 865 4172 02 Finance professionals 472 2281 02 Engineering professionals (excluding electrotechnology) 635 3118 02 Other health associate professionals 531 2657 02
Social and religious professionals 460 2317 02 Professional services managers 176 891 02 Nursing and midwifery associate professionals 556 2855 02 Legislators and senior officials 53 286 02 Database and network professionals 83 455 02 Administration professionals 641 3673 02 Primary school and early childhood teachers 575 3345 02 Electrotechnology engineers 142 827 02 Secondary education teachers 471 2812 02 Other health professionals 346 2083 02 Nursing and midwifery professionals 273 1760 02 Software and applications developers and analysts 631 4159 02 Medical doctors 293 1944 02 No occupation 152894 00
No answer 2531 578 44 Total 249561 294937 08
Labour shortages and surpluses 2017
2017 47
Directorate-General for Employment Social Affairs and Inclusion European Network of Public Employment Services (PES)
HOW TO OBTAIN EU PUBLICATIONS
Free publications
bull one copy
via EU Bookshop (httpbookshopeuropaeu)
bull more than one copy or postersmaps
from the European Unionrsquos representations (httpeceuropaeurepresent_enhtm)
from the delegations in non-EU countries
(httpeeaseuropaeudelegationsindex_enhtm)
by contacting the Europe Direct service (httpeuropaeueuropedirectindex_enhtm)
or calling 00 800 6 7 8 9 10 11 (free phone number from anywhere in the EU) () () The information given is free as are most calls (though some operators phone boxes or hotels may charge you)
Priced publications
bull via EU Bookshop (httpbookshopeuropaeu)
Priced subscriptions
bull via one of the sales agents of the Publications Office of the European Union
(httppublicationseuropaeuothersagentsindex_enhtm)
doi 10276731262
KE-0
1-1
8-2
63-E
N-N
[Ca
talo
gu
e n
um
be
r]
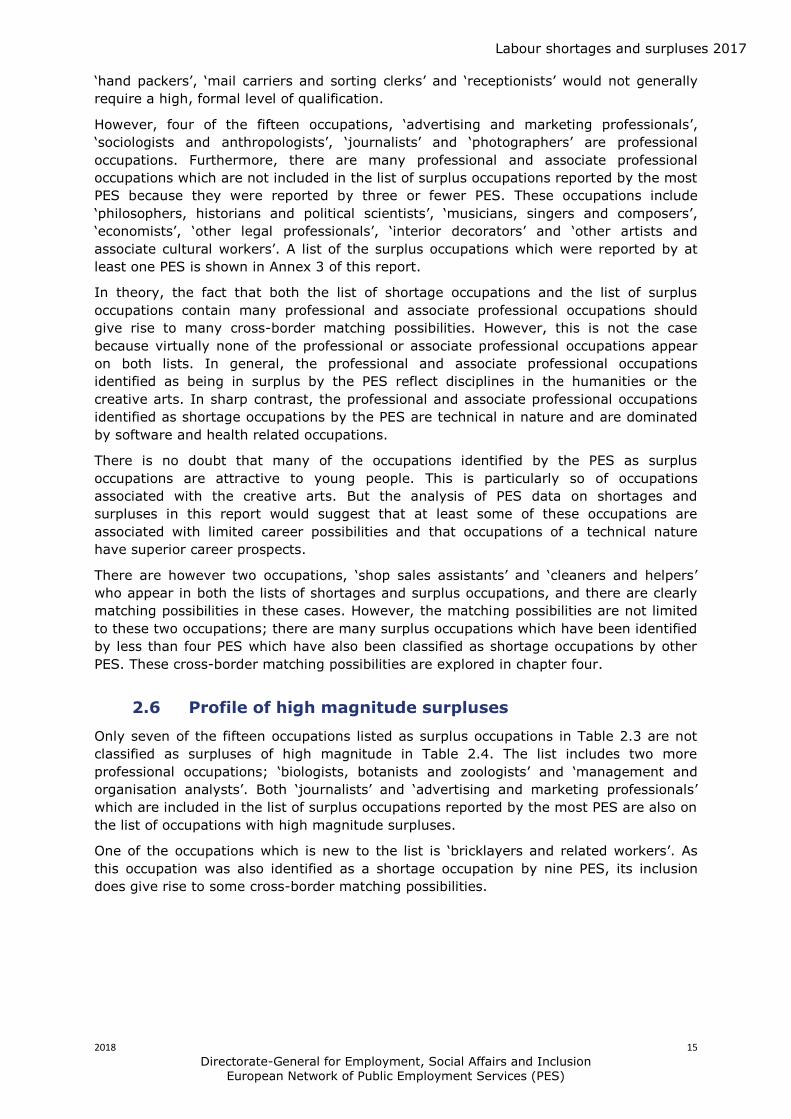
Labour shortages and surpluses 2017
2018 16
Directorate-General for Employment Social Affairs and Inclusion European Network of Public Employment Services (PES)
Table 24 High magnitude surplus occupations (4-digit level)
Occupation
Number of PES stating high magnitude of surplus
Occupation
Number of PES stating high magnitude of surplus
General office clerks 4 Journalists 2
Advertising and marketing professionals 3 Management and organisation analysts
2
Receptionist (general) 3 Manufacturing labourers 2
Shop sales assistants 3 Odd job persons 2
Biologists botanists zoologists and related
2 Photographers 2
Bricklayers and related workers 2 Bank tellers and related clerks 2
Child care workers 2 Security guards 2
Cleaners and housekeepers supervisors 2 Travel guides 2
Gardiners horticulturalists and nursery workers
2
27 Broad occupational groups by surplus magnitude
As in the case of shortages the professional group of occupations dominated the
occupations which were considered by the PES to have surpluses of high magnitude
(Figure 22) Indeed eight of the sixteen PES who rated surplus occupations by their
degree of severity identified at least one professional occupation as being in severe over-
supply
Interestingly the three PES who identified surplus occupations among plant and machine
operators and assemblers rated all the occupations they identified in this group as being
surplus occupations of high magnitude
Figure 22 Surpluses by estimated surplus magnitude
0 5 10 15 20
Managers
Plant and machine operators and assemblers
Skilled agricultural forestry and fishery workers
Craft and related trades workers
Clerical support workers
Elementary occupations
Service and sales workers
Technicians and associate professionals
Professionals
High Medium Low
Labour shortages and surpluses 2017
2018 17
Directorate-General for Employment Social Affairs and Inclusion European Network of Public Employment Services (PES)
28 Comparison of shortages and surpluses by broad
occupation
The issues which have been discussed above can be summarised in Table 25 below The
figures show that the 26 PES who reported at least one professional occupation as a
shortage represented 93 of all PES and that in total these PES identified 261
professional occupations as shortages
The situation is not quite as dramatic in respect of surplus occupations Nevertheless
fifteen PES representing 83 of all reporting PES identified a total of 88 professional
occupations as surplus occupations
However the most widespread reported surplus occupations were among the service and
sales group of occupations with almost 90 of PES reporting at least one surplus
occupation in this group The difference in the share of PES reporting shortages and
surpluses in the clerical group of occupations is also noteworthy Half the PES reported at
least one shortage occupation in this group but almost 80 of reporting PES included at
least one surplus occupation from this group
Table 25 Shortages and surpluses by broad occupation group
Broad occupation group
Number of
shortage occupatio
ns identified
Number of PES
reporting
shortages in this broad group
of PES reporting shortages
in this group
Number of surplus occupatio
ns identified
Number of PES
reporting surpluses
in this broad group
of PES reporting surpluses
in this broad group
Professionals 261 26 93 88 15 83
Craft and related trades 237 25 89 44 11 61
Associated professional technical
176 27 97 53 15 83
Services and sales 100 23 82 72 16 89
Plant and machinery 79 22 79 10 8 44
Elementary 53 14 50 37 12 67
Managers 43 11 39 16 7 39
Clerical support 34 14 50 47 14 78
Skilled agriculture 13 6 21 14 5 28
Armed forces 6 1 4 0 0 0
29 Cross-check with LSF data
Finally it is important to assess the extent to which the shortage and surplus occupations
identified by the PES in 2017 are accurate For this task we use the findings from the
2016 study which are based on the LSF data and the ratio of the unemployed to new
hires (Annex 4)
Although based on different levels of aggregation (4-digit vs 3-digit respectively) the
comparison of the PES reported shortages and surpluses in 2017 and the 2016 study LSF
ratio of unemployed and new hires suggests a high level of consistency Specifically PES
identified shortage occupations typically have the low ratio of unemployed to new hires
while the surplus occupations typically have the high ratio of unemployed to new hires
Labour shortages and surpluses 2017
2018 18
Directorate-General for Employment Social Affairs and Inclusion European Network of Public Employment Services (PES)
The only exceptions are the occupations of lsquocleanersrsquo lsquowaitersrsquo and lsquoshop sales
assistantsrsquo However this result is understandable as these occupations were classified
by the PES4 as labour shortages rather than skill shortages and consequently the
relatively high ratio could reflect the fact that there are a significant number of
unemployed available to work in these occupations
210 Conclusions
There are a number of significant conclusions which may be drawn from the analyses of
shortage and surplus occupations in this chapter
Firstly the widespread concern that using data from the PES may produce a significant
bias in the list of shortages and surpluses because the PES attract less vacancies and
job-seekers from higher skilled occupations appears to be unfounded Ironically the
professional occupations were the most frequently reported occupations in both the list of
shortages and surpluses
Secondly there is a distinct difference in the type of competences and qualifications
identified by the PES as shortages and surplus occupations and this difference was
evident throughout the different occupation groups In general the shortage occupations
embodied technical skills whether in health-related software-related or engineeringndash
related occupations at professional technical and craft levels
In sharp contrast the surplus occupations embodied selling service and clerical skills
cultural and artistic skills and competencies in the humanities
Finally the type of occupations which the PES associated with shortages and surpluses
are highly plausible In general the shortage occupations have a low ratio of unemployed
to new hires while the surplus occupations have a high ratio This consistency extended
to the occupations which the PES identified as labour shortages which exhibited a high
ratio
The classification of skill and labour shortages is one of the issues discussed in the next
chapter
4 While this is true when all three occupations are aggregated only two of five PES categorised lsquocleanersrsquo as a labour shortage ndash see chapter 3
Labour shortages and surpluses 2017
2018 19
Directorate-General for Employment Social Affairs and Inclusion European Network of Public Employment Services (PES)
3 PROFILE OF SHORTAGES AND SURPLUSES IN SPACE AND TIME
31 Introduction
In this chapter we analyse the occupations which have been identified by the European
PES as shortage and surplus occupations from the perspective of space and time We
review the geographical distribution of these occupations to ascertain if this distribution
provides an insight into what may have given rise to these shortages and surplus
occupations and we also examine the extent to which the same shortage and surplus
occupations have persisted over time using the findings from previous studies
32 PES methods used for identifying shortages and surpluses
In the previous chapter it was noted that only eighteen of twenty-eight PES submitted a
list of surplus occupations A review of the methods used by the PES to identify shortage
occupations may provide an insight into why ten PES did not provide any data on surplus
occupations
A summary of the methods used to identify shortage occupations is provided in Table 31
below The data indicates that exactly ten PES did not use any administrative data in
identifying their shortage occupations but rather used other sources such as employer
surveys national forecasting studies or immigration data It is tempting to conclude that
this is the reason why only 18 out of 28 PES provided data on surplus occupations as
these methodologies are not generally associated with the provision of information on
occupations which are in surplus
However such a conclusion would not be entirely accurate The analyses found that the
use of survey data did not necessarily preclude a PES from identifying surplus
occupations The Danish PES for example used the results of their Labour Market Balance
Survey and was able to provide a comprehensive list of surplus occupations In contrast
the Italian and Norwegian PES who relied on national forecasts and surveys respectively
were unable to provide such a list
Furthermore not all of the PES who based their identification of shortages on their
administrative data systems provided a list of surplus occupations Those who did
generally used the ratio of job-seekers to vacancies to identify whether an occupation
was a shortage or surplus occupation But a number of PES such as the German and
Luxemburg PES and the Belgium regional PES Actiris while basing their identification of
shortage and surplus occupations on administrative data used quite sophisticated
techniques such as the share of vacancies filled and the duration of vacancy filling Unlike
the ratio of job-seekers to vacancies such techniques do not readily provide an indicator
for identifying an occupation as a surplus occupation5
5 While it is reasonable to classify an occupation as a shortage occupation if the filling of vacant posts in that occupation takes on average an exceptionally long time identifying surplus occupations is somewhat more problematic using this method
Labour shortages and surpluses 2017
2018 20
Directorate-General for Employment Social Affairs and Inclusion European Network of Public Employment Services (PES)
Table 31 Methods used by the PES to identify shortage occupations
PES methods for identifying shortages and surpluses Number of PES
Combination of administrative data PES surveys and expert opinion
1
Combination of administrative data PES surveys and 3rd party data
1
Combination of administrative data and PES surveys 7
Combination of administrative data and 3rd party data 1
Combination of administrative data and expert opinion 2
PES work permit data only 2
PES administrative data only 6
PES survey data only 2
PES warehousing data only 1
3rd party surveys and forecasts 5
Total 28
The fact that only eighteen PES provided a list of surplus occupations is a serious
weakness of this study because it places a limit on the potential of the analyses to
identify cross border matching opportunities between shortage and surplus occupations
Consequently in the future every effort should be made to significantly increase the
number of PES providing a list of surplus occupations even if this means that a
significant number of PES use alternative methodologies to identify shortage and surplus
occupations rather than a single methodology to do both as has occurred in both the
2016 study and the current study6
33 Geographic distribution of shortages and surpluses
The 28 PES who submitted data on shortages cover a very wide geographic area which
include labour markets with very different characteristics It may be informative
therefore to assess the extent to which the distribution of shortage occupations differed
between different countries
Table 32 below shows the number of reported shortage occupations within their broad
occupation group and the PES who reported the occupation as a shortage7
While each PES was requested to submit a maximum of twenty shortage occupations a
total of ten PES provided more than that and in the case of the Slovenian French and the
regional Belgian PES Actiris significantly more
A total of six PES identified less than twenty shortage occupations but in most cases the
difference was negligible
The Croatian and Portuguese PES were the only PES which did not identify any
professional occupation in their list of shortage occupations This may reflect the type of
vacancies which are notified by employers to these PES because both these PES use
their own administrative data systems exclusively to identify shortage occupations
6 In the 2016 study while 26 PES provided data on shortage occupations 13 provided data on surplus
occupations 7 Three groups are excluded from the Table managers (43) skilled agricultural (13) and armed forces (1) as the figures are quite small
Labour shortages and surpluses 2017
2018 21
Directorate-General for Employment Social Affairs and Inclusion European Network of Public Employment Services (PES)
Table 32 Shortages number of mentions (4-digit) in broad occupation (1-digit)
PES Professional Technical Clerical Craft Service Plant Elementary Total
Austria 4 11 1 12 2 0 0 30
Actiris 28 22 6 11 13 2 0 82
Le Forem 6 6 0 6 0 0 0 18
VDAB 4 7 1 4 1 3 0 20
Bulgaria 7 0 0 4 5 3 2 21
Croatia 0 1 0 13 1 3 2 20
Cyprus 6 1 2 5 5 1 6 26
Denmark 5 1 0 7 3 2 1 19
Estonia 10 7 0 0 2 1 0 20
Finland 12 5 1 7 2 2 3 32
France 18 27 2 27 1 26 2 103
Germany 16 19 0 10 2 1 1 49
Hungary 2 6 6 8 14 3 12 51
Iceland 6 3 0 5 2 1 3 20
Ireland 13 2 0 4 1 1 0 21
Italy 2 2 1 7 4 1 3 20
Latvia 7 1 1 9 0 0 0 18
Lithuania 1 2 0 15 0 2 0 20
Luxemburg 8 4 0 0 0 0 0 12
Malta 5 3 3 4 6 1 4 26
Netherlands 20 11 3 23 2 1 0 60
Norway 13 3 0 10 10 4 1 41
Poland 10 6 2 2 3 3 4 30
Portugal 0 1 0 8 3 3 0 15
Slovakia 6 6 2 5 5 2 0 26
Slovenia 23 13 3 30 11 13 9 102
Sweden 15 2 0 1 2 0 0 20
Switzerland 14 4 0 0 0 0 0 18
Total 261 176 34 237 100 79 53 940
The stipulation to only provide a list of twenty shortage occupations may have prevented
any pattern from emerging in the figures For example there does not appear to be any
relationship between the numbers of employed and unemployed in a specific labour
market and the number of shortage occupations identified by its national PES
The two PES who submitted the highest volumes of shortage occupations - the French
and Slovenian PES - vary greatly in terms of the relative size of their labour force while
for example the Norwegian PES submitted significantly more shortage occupations than
much larger countries such as Germany and Poland
As a way of controlling for the variation in the total number of shortage occupations it
may be useful to compare the variation within the list of shortage occupations identified
by each PES However no obvious patterns emerge when a number of hypotheses are
tested using this approach For example there appears to be no relationship between
countries which are associated with strong apprenticeship systems such as Germany
Austria Denmark and Switzerland and their share of shortages among the craft group of
occupations The Swiss PES does not contain any craft occupations in its list of shortage
occupations while the craft group of occupations contain the most shortage occupations
in the lists provided by both the Austrian and Danish PES In the case of the German
PES the share of craft occupations is a little above the average
Labour shortages and surpluses 2017
2018 22
Directorate-General for Employment Social Affairs and Inclusion European Network of Public Employment Services (PES)
Table 33 Surpluses number of mentions (4-digit) in broad occupation (1-digit)
PES Professional Technical Clerical Craft Service Plant Elementary Total
Le Forem 2 1 1 1 6 0 8 19
Bulgaria 6 3 2 0 4 0 2 17
Switzerland 0 4 2 4 1 2 3 16
Cyprus 5 0 0 2 0 0 3 10
Denmark 3 2 3 0 6 1 4 19
Estonia 6 2 3 2 6 0 1 20
Finland 16 7 6 10 3 1 0 43
France 10 10 1 2 5 1 0 29
Croatia 4 0 0 0 0 0 0 4
Hungary 6 9 3 16 15 1 2 52
Ireland 1 1 4 3 5 1 7 22
Iceland 11 1 2 2 1 0 1 18
Lithuania 0 3 1 0 2 2 0 8
Latvia 4 4 0 0 3 1 3 15
Netherlands 3 2 9 0 9 0 1 24
Poland 0 0 0 0 1 0 0 1
Sweden 4 3 7 1 3 0 2 20
Slovakia 7 1 3 1 2 0 0 14
Total 88 53 47 44 72 10 37 351
The most striking aspect of the geographical distribution of surplus occupations is the
relatively low number of occupations which were reported Most of the reporting PES
(eleven) provided less than the twenty surplus occupations they were requested to
submit Furthermore if the contributions from the Hungarian and Finnish PES are
excluded the average number of surplus occupations submitted by the other PES is
sixteen
With the exception of the Icelandic Finnish French and Hungarian PES the list of
surplus occupations remains in single figures across all the broad occupational groups
Such low figures result in limited cross-border matching possibilities which are explored
in the next chapter
The PES were also asked to indicate the lowest regional level at which they could provide
data on both shortage and surplus occupations Their response is outlined in Table 34
above A total of twenty PES responded positively in the case of shortage occupations
and twelve in the case of surplus occupations In the case of shortage occupations nine
PES indicated that they could provide data at NUTs3 level while eight PES stated that
they could provide the data at NUTs1 level In the case of surplus occupations five PES
indicated that they could provide the data at NUTs1 level and another five PES responded
that they could provide the data at NUTs 3 level There were very few PES who indicated
that the lowest level at which they could provide data was at NUTs2 or NUTs4 levels
Labour shortages and surpluses 2017
2018 23
Directorate-General for Employment Social Affairs and Inclusion European Network of Public Employment Services (PES)
Table 34 Availability of data on shortagessurpluses at regional levels
Shortage occupations Surplus occupations
Country NUTS1 NUTS2 NUTS3 NUTS4 No
data NUTS1 NUTS2 NUTS3 NUTS4
Austria
x
Belgium Actiris
x
Belgium Le Forem
x
x
Belgium VDAB
x
Bulgaria
x
x
x
Croatia x
x
Cyprus
x
x
Denmark
x
x
Estonia x
x
Finland
x
x
France
x
x
Germany x
Hungary
x
x
Iceland x
x
Ireland x
x
Italy
x
Latvia
x
x
Lithuania
x
x
Luxembourg x
Malta
x
Netherlands
x
x
Norway
x
Poland
x
x
Portugal
x
Slovakia
x
x
Slovenia x
Sweden
x
x
Switzerland
x
x
Note Bulgaria has regional data for some occupations
34 Tracking shortages over time
This is the third annual study on lsquoBottleneck Occupationsrsquo the previous two studies were
undertaken in 2016 and 2015 The findings in both of those studies were presented in 3-
digit codes To make the findings comparable over time the 4-digit shortage and surplus
occupations from the current study are aggregated up to 3-digit occupations as shown in
Table 35
A striking aspect of the list of occupations in Table 35 is the degree of consistency
displayed over the period 2015-2017 inclusive not simply in terms of the occupations
reported by the PES but also in terms of the number of PES who identified them as
shortages (ie their ranking) Not only does the 3-digit occupation category of lsquosoftware
and applications developersrsquo occupy the top ranking in each of the years five of the top
ranking six occupations are the same The only notable exception is that the finance
professional and associate professional occupations featured in the list of most reported
shortage occupations in 2015 but slipped out of this list in 2016 and 2017
Labour shortages and surpluses 2017
2018 24
Directorate-General for Employment Social Affairs and Inclusion European Network of Public Employment Services (PES)
Table 35 Ranking of shortage occupations (3-digit)
Rank
Top occupations in 2017 2017 2016 2015
Software and application developers 1 1 1
Sheet and structural metal workers 2 3 2
Medical doctors 3 5 2
Blacksmiths toolmakers and related trades 4 3 4
Building finishes and related trade workers 4 6 4
Building frame and related trade workers 4 3 4
Cooks 4 7 7
Engineering professionals 5 6 6
Physical and engineering science technicians 6 7 na
Electrical equipment installers and repairers 7 4 5
Heavy truck and bus drivers 7 5 4
Machinery mechanics and repairers 8 7 5
Nursing and midwifery professionals 8 6 na
Sales and purchasing agents and brokers 9 2 5
Shop salespersons 10 7 8
Electro technology engineers 10 na na
Primary school and early childhood teachers 10 na na
Domestic hotel and office cleaners and helpers 10 na na
Waiters and bartenders 10 na na
35 3-digit vs 4-digit
There are advantages and disadvantages associated with using the more aggregated 3-
digit occupation classification as it was done in previous studies The bundling of
individual occupations into families provides greater visibility of shortages at a broad
skill level (eg all software related occupations)
However there are distinct disadvantages in using the 3-digit occupations and these
apply particularly to their practical usefulness to education and training providers In
many cases shortages identified at 3-digit level do not provide a reliable basis for
identifying the specific skill which is in shortage or surplus
By combining the analyses of the 4-digit and corresponding 3-digit classifications in this
report many examples are revealed of how an exclusive reliance on the 3-digit
classification could be seriously misleading Thus the findings in this report show that
within the 3-digit classification of lsquosheet and structural metal workers moulders and
weldersrsquo the 4-digit occupation which is in short supply is lsquoweldersrsquo and not for example
lsquosheet metal workersrsquo This is an important insight because in many European countries
the skills of welding and sheet metal work are provided through entirely different
vocational programmes8
There are many examples of this phenomenon in the 3-digit occupations in Table 35 For
example the analysis in this report shows that toolmakers are a shortage occupation
8 In Ireland for example sheet metal workers and welders undertake entirely different apprenticeships
Labour shortages and surpluses 2017
2018 25
Directorate-General for Employment Social Affairs and Inclusion European Network of Public Employment Services (PES)
but blacksmiths are not Furthermore the 3-digit classification disguises the extent of the
reported shortage Thus while the 3-digit occupation of professional nursing and
midwifery is shown in the current report as being shortage occupations a total of eleven
PES reported professional nursing as a shortage compared to only three PES reporting
professional midwifery as a shortage By bundling these occupations together the
significant difference in the relative severity of the shortage is not apparent
This phenomenon applies equally to the surplus occupations which were identified in this
report For example lsquochildcare workersrsquo were described as a surplus occupation by five
PES But in the 3-digit classification they are bundled together with lsquospecial needs
teachersrsquo which was not identified as a surplus occupation
36 Conclusions
There are a number of conclusions which can be drawn from the analyses in this chapter
Firstly the sources used by many of the PES to identify shortage occupations is one of
the main reasons why only eighteen PES provided data on surplus occupations Many of
the PES relied on the results of employer surveys forecasting models and immigration
data to identify shortages and these sources in general do not provide data on surplus
occupations However it was by no means the only reason why so many PES did not
provide data on surplus organisations and this issue will have to be addressed before the
commencement of the 2018 study In the future PES data should be augmented by data
collected by other bodies as outlined in the new EU Regulation
Secondly there is no obvious explanation for the geographic distribution of shortages
and surpluses In some cases countries with relatively small labour forces have a
relatively high number of shortage occupations while a strong apprenticeship system
does not appear to prevent a relatively high share of the identified shortages being in the
craft occupations It may be that the stipulation to only include twenty shortage and
surplus occupations has created a situation where some countries with a relatively large
labour force are artificially constrained to submit a much smaller number of shortage
occupations than they actually have
Thirdly there is a high degree of stability in relation to the occupations which were
identified as shortages in the 2015 2016 and 2017 editions of the Bottleneck report
Finally providing information on shortage and surplus occupations at 4-digit level is
much more useful from a policy perspective than providing the data at a more
aggregated level The results of the analyses at 4-digit level show which specific
occupations in the bundle of occupations used in the previous reports were in shortage
and which were not This is also true of the occupations which were identified as surplus
occupations A more aggregated group of occupations does not allow for the targeting of
specific individual occupations either for increasing training provision or for enhancing
cross border mobility Indeed as a number of specific examples show were providers of
vocational training or indeed policy makers to act on the basis of the 3-digit shortage and
surplus occupations identified in previous reports they could very well have assign
resources to occupations which were neither in shortage nor in surplus
Labour shortages and surpluses 2017
2018 26
Directorate-General for Employment Social Affairs and Inclusion European Network of Public Employment Services (PES)
4 THE CAUSES OF SKILL SHORTAGES AND POTENTIAL SOLUTIONS
41 Introduction
The focus of this chapter is on identifying the possible causes of skills shortages and
surpluses and exploring ways in which these imbalances may be resolved The chapter
begins with a review of the nature of skills and labour market imbalances and concludes
with an exploration of the extent to which enhanced cross-border mobility policies and
more equal gender representation could contribute to the alleviation of skills and labour
imbalances in certain shortage occupations in the EEA labour market
42 The role of skills and labour shortages in skills imbalances
One of the new questions included in the current study asks the PES to identify the
nature of the shortage (ie is it a skill shortage or a labour shortage) in relation to each
shortage occupation they identified It was explained in the questionnaire that labour
shortages occur when there are a sufficient number of appropriately qualified job-seekers
to fill the vacancies which arise but for a variety of reasons many of them do not wish
to work in the occupation in question Their response to this question is summarised in
Table 41 in respect of the twenty occupations which were reported by the most PES
A total of twenty-six PES classified their shortage occupations as skill or labour
shortages and they classified most of the occupations as skill shortages Indeed in the
case of seven occupations plumbers doctors software developers electricians
electronic engineers electronic engineering technicians bus and tram drivers and
mechanical engineers all of the reporting PES classified the shortage as a skills deficit
Each labour market within the EEA is regulated in a particular manner and conditions of
employment even within the same occupation vary throughout the region This is why
many occupations while classified by most of the PES as reflecting skill deficits
nevertheless are classified by some PES as labour shortages
However the number of PES involved is very small indeed Only in the case of three
occupations lsquowaitersrsquo lsquoshop sales assistantsrsquo and lsquoprimary school teachersrsquo are there
more PES classifying the shortage as a labour shortage then a skills deficit The first two
occupations are undoubtedly labour shortages This is because there are few if any
barriers to working in these occupations9
The inclusion of lsquoprimary school teachersrsquo as a labour shortage is however a surprise It
was identified by eight PES as a shortage occupation two of whom classified the
occupation as a shortage of high magnitude It would be necessary to conduct research
into the conditions of employment ndash including qualification criteria ndash within the countries
where the reporting PES are located to establish if this classification of the occupation as
a labour shortage is warranted
With some notable exceptions the response of the PES to classifying their shortage
occupations as skill or labour shortages demonstrates that the PES understand these
concepts Occupations such as professional nurses which are obviously suffering from a
shortage of qualified job-seekers in the EEA are overwhelmingly categorised as a skills
shortage while less skilled occupations such as cleaners are categorised as being on the
borderline between skills and labour shortages
9 Both occupations have relatively high ratios of unemployed to new hires (Annex 4)
Labour shortages and surpluses 2017
2018 27
Directorate-General for Employment Social Affairs and Inclusion European Network of Public Employment Services (PES)
Table 41 Skill and labour shortages
Occupation
Number of PES
reporting occupation
as skills shortage
Number of PES
reporting occupation as labour shortage
Number of PES
reporting occupations as skill and
labour shortage
Total number of
PES reporting on skillslabour
shortage
Cooks 9 1 0 10
Plumbers and pipe fitters 8 0 0 8
Generalist medical Practitioners 7 0 0 7
Heavy truck and lorry drivers 4 2 1 7
Metal workers machine tool setting and operators
3 3 1 7
Welders and flame cutters 4 2 1 7
Nursing professionals 5 1 0 6
Software developers 6 0 0 6
Systems analyst 5 1 0 6
Bricklayers and related trades 4 1 0 5
Building and related electricians 5 0 0 5
Butchers fishmongers and related food 3 2 0 5
Cleaners and helpers in offices 3 2 0 5
Commercial sales representatives 2 2 1 5
Electronic engineers 5 0 0 5
Manufacturing supervisors 4 1 0 5
Motor vehicle mechanics and repairers 3 1 1 5
Nursing associate professionals 4 1 0 5
Primary school teachers 2 3 0 5
Shop sales assistants 1 4 0 5
Waiters 2 3 0 5
Agriculture and industrial machinery repairers
3 1 0 4
Application programmers 3 1 0 4
Bus and tram drivers 4 0 0 4
Electronic engineering technicians 4 0 0 4
Health care assistants 3 1 0 4
Mechanical engineers 4 0 0 4
Sheet metal workers 3 1 0 4
Structural metal preparers and erectors 3 1 0 4
Total number of PES reporting 16 8 2 26
The atypical working hours associated with heavy goods vehicle driving is recognised by
two of the six PES who classify shortages in the occupation as labour shortages while the
unpleasant conditions associated with working in butchery shops and abattoirs is
reflected in the fact that two of the five PES who categorised the occupation as a
shortage occupation classify it as a labour shortage
43 Location of skill imbalances and cross border mobility
In recent years there has been considerable discussion on the potential role which
enhanced cross-border mobility could play in alleviating labour market imbalances The
attractiveness of such a policy is obvious The European Union is a very large
Labour shortages and surpluses 2017
2018 28
Directorate-General for Employment Social Affairs and Inclusion European Network of Public Employment Services (PES)
marketplace embracing a very large labour force if even some of the shortages which
are reported by EEA countries could be resolved by exploiting the surpluses which are
reported by other EEA countries it could form the basis of a number of win-win solutions
for both job-seekers and businesses
An additional attraction of this policy is that it could potentially successfully address both
skills and labour shortages as working conditions associated with some labour shortages
in one country might be perceived as significantly more attractive in a different EEA
country
Table 44 provides a list of the top twenty shortage occupations which have at least one
PES in another EEA country reporting the occupation as a surplus
There are a number of aspects of the Table which are notable Firstly the list of top
occupations has changed quite dramatically from the list in Table 21 specifically none
of the professional and associate professional occupations are now on the list including
the four professional and associate professional health-related occupations or the two
professional software occupations What the Table shows is that there are no surpluses
reported in any of the EEA countries of doctors or nurses software developers or
systems analysts While the occupation of healthcare assistants is in surplus in many
countries it was not included in the list of top occupations because it was reported as a
shortage by only two PES
The figures in Table 42 show that there are three cross-border matching possibilities in
the case of bricklayers and motor mechanics and two possibilities in the case of
plasterers health care assistants and secondary school teachers
There is just one matching possibility in respect of a wide range of occupations including
cooks truck drivers commercial sales representatives electricians carpenters civil
engineers primary school teachers manufacturing supervisors telecentre salespersons
childhood education teachers floor layers and roofers
The fact that primary school teachers have only one cross border matching possibility
suggest that the classification of the occupation as a labour shortage by three of five PES
is an error In general labour shortages would be expected to have more cross border
matching possibilities than skill shortages because there are many job-seekers eligible to
work in the occupation in question and working conditions vary quite significantly from
country to country Indeed it is notable that the two other occupations which were
classified by the PES as predominantly labour shortages waiters and shop sales
assistants have a relatively high number of matching possibilities eight in the case of
shop sales assistants and three in the case of waiters
In general the PES did not classify the same occupation as both a shortage and a
surplus A striking exception is the Danish PES which categorised four of its shortage
occupations as surplus occupations also This is most likely due to the higher level of
granularity available in the Danish data (below 4-digit) so that some job titles within an
occupation are considered labour shortage while others skill shortage
44 Assessing gender composition of surpluses
The PES were asked to estimate the share of females in the occupations which they
identified as lsquosurplusrsquo occupations The restricting of this question to surplus occupations
was to avoid giving the impression that shortages were arising because of discriminatory
recruitment policies
Labour shortages and surpluses 2017
2018 29
Directorate-General for Employment Social Affairs and Inclusion European Network of Public Employment Services (PES)
A total of 13 PES reported any data on gender composition of surpluses However the
quality of information submitted did not provide a sufficient basis for an accurate
estimation of the gender composition of surpluses in some of the cases
It is suggested that in order to address gender imbalances in relation to shortages and
surpluses data from PES on job seekers should be combined with the LSF data on
employment by occupation
45 Conclusions
The analysis in chapter four has produced a number of interesting findings The analysis
reveals that the PES in general has the capacity to distinguish between skill and labour
shortages and to identify shortage occupations which have some cross-border matching
possibilities
The relatively low number of surplus occupations reflects two factors firstly only
eighteen PES submitted a list of surplus occupations and secondly in many cases the
lists did not include the maximum number of twenty occupations which were requested
This response has to be viewed against the background of an EEA labour market where
employment is expanding and unemployment is contracting However while this is a
positive development the relatively low number of surplus occupations has placed a
significant limit on the extent to which there were cross-border possibilities of matching
shortage with surplus occupations
The data indicates that there is a limitation to the extent to which the PES can be used to
identify the gender imbalances (eg under-representation of females in some
occupations) and that other sources should be explored
Labour shortages and surpluses 2017
2018 30
Directorate-General for Employment Social Affairs and Inclusion European Network of Public Employment Services (PES)
Table 43 The potential for cross-border matching of shortage and surplus occupations
No PES
Occupation PES reporting shortage PES reporting surplus No PES
16 Cooks AT Art BG CY DK HR IE IS IT MT NL NO PT SE SI SK lsaquo―rsaquo HU 1
11 Truck drivers ART VDAB BG DK HR LT IT NL NO PT SE SI SK lsaquo―rsaquo DK 1
10 Cleaners helpers CY DK HR FI IS HU NL NO PT SI lsaquo―rsaquo DK LF NL IE 4
10 Commercial sales VDAB ART DK FI FR IT IE PT PL SI lsaquo―rsaquo DK 1
9 Sales assistants AT ART BG CY DK IT NO SI SK lsaquo―rsaquo DK LF SE NL BG CH FI IE 8
9 Bricklayers ART DE DK HR HU LT NL PT SI lsaquo―rsaquo CY HU IE 3
9 Motor mechanics AT VDAB ART LF DK IT NO PT SI lsaquo―rsaquo SK CH EE 3
9 Waiters ART BG CY IS IT MT NO PT SI lsaquo―rsaquo HU EE IE 3
9 Electricians ART VDAB DE DK IS IT NL NO SI lsaquo―rsaquo FR 1
8 Carpenters DK HR HU FI NL NO PT SI lsaquo―rsaquo HU 1
8 Civil engineers ART CH DE FI FR NO SE SI lsaquo―rsaquo CY 1
8 Primary teachers ART BG DK IS NO SE SI SK lsaquo―rsaquo CY 1
7 Healthcare assist CY DK EE NL NO SI SK lsaquo―rsaquo DK NL 2
7 Second teacher ART BG FR NL NO SI SK lsaquo―rsaquo CY FI 2
7 Man supervisors ART VDAB LF DE EE FR SK lsaquo―rsaquo BG 1
6 Plasterers HR HU FI LT NL SI lsaquo―rsaquo HU IE 2
6 Tele centre sales ART HU FI FR MT NO lsaquo―rsaquo EE 1
6 Childhood educ FI LT NO SE SI SK lsaquo―rsaquo CY 1
6 Floor layers HU HR FI FR LT LV lsaquo―rsaquo HU 1
6 Roofers HR FI FR LT LV SI lsaquo―rsaquo HU 1
Bottlenecks Occupations 2017
2017 31
Directorate-General for Employment Social Affairs and Inclusion European Network of Public Employment Services (PES)
5 CONCLUSIONS AND RECOMMENDATIONS
51 Conclusions
The terms of reference for this study emphasise the desirability of creating a process for
the systematic collection of data on surplus and shortage occupations in the EEA area
which could be effectively used by EURES for cross border matching of shortage
occupations in some EEA countries with surplus occupations in others
The authors have responded to this emphasis by using a process which ensures that the
data gathered on shortage and surplus occupations is comprehensive accurate and of
practical use to EURES and the providers of education and training programmes The
process is comprehensive because it gathers information both on the extent of shortages
and surpluses and on their relative severity It is accurate because the list of shortage
and surplus occupations are shown to be consistent with the estimated value of the ratio
of unemployed to new hires Finally the process provides information which is of
practical use to EURES and the national providers of VET because the data gathered is on
individual occupations rather than on lsquobundles of occupationsrsquo as in previous studies The
analyses in this report shows that while these bundles of occupations contain some
occupations which are identified by the PES as shortage and surplus occupations they
also contain occupations which are neither in shortage nor in surplus and it is impossible
to distinguish one from the other
The data gathering process used in this report however was not devoid of weaknesses
Fortunately these weaknesses reflect the modus operandi of the PES and may be
rectified by including other institutions and agencies in the process For example the PES
use the same sources for the identification of both shortage and surplus occupations
This may have advantages in terms of accuracy when those sources include employersrsquo
surveys immigration data and the results of forecasting exercises However these
sources are not suitable for gathering data on surplus occupations and they are the main
reason why the number of surplus occupations provided by the PES were almost half the
number requested In the future PES data could be augmented by data gathered by
other bodies as outlined in recent EU Regulation 2016589
In addition the response to the question on the capacity of the PES to deliver data on
shortage and surplus occupations at a regional level was also disappointing perhaps
reflecting a misalignment in some EEA countries between the geographic configuration of
the local PES network and the NUTs regions
The analysis highlighted that in order to assess gender imbalances of shortages and
surpluses PES data needs to be augmented by other sources
Finally despite the low number of surplus occupations submitted by the PES it was
nevertheless possible to identify twenty shortage occupations in the EEA labour market
which had at least one cross-border matching possibility and many more than one in the
case of some shortage occupations
52 Recommendations
Based on the findings from the three bottleneck studies undertaken to date a model for
the gathering of data on shortages and surpluses is proposed (Figure 51) The model
includes features of the methodology applied in this study which were successful It also
includes a number of features which should be introduced to the process in order to
address some of the weaknesses which were identified in this study (highlighted in red)
Labour shortages and surpluses 2017
2017 32
Directorate-General for Employment Social Affairs and Inclusion European Network of Public Employment Services (PES)
However before this methodology is implemented it would be prudent to discuss data
requirements with PES and invite a broader range of institutions and agencies to
participate in aspects of the data gathering process in addition to the PES EURES
Regulation (EU) 2016589 of the European Parliament and of the Council which obliges
the appropriate national authorities to furnish such data annually is fortuitous in this
regard and should facilitate the implementation of this recommendation
In addition the results of these and other relevant studies should be disseminated to
PES Eures coordination group and other relevant agencies and institutions in order to
emphasise the importance of data and analysis in informing policy at EU and national
level which aims to resolve labour market imbalances
Labour shortages and surpluses 2017
2017 33
Directorate-General for Employment Social Affairs and Inclusion European Network of Public Employment Services (PES)
Figure 51 Model for gathering data on shortage and surplus occupations
Sources of data on surpluses PES data from other relevant agencies
In those cases where the source used by the PES to identify shortage occupations cannot
be used to identify surplus occupations other institutions or other sources or both should be availed of to ensure that comprehensive data on surplus occupations are provided to the appropriate national authority
Dimensions of shortagessurpluses extent (number of reporting PES) and severity (high or low
magnitude)
Data should be systematically gathered on both the extent of shortage and surplus
occupations in the EEA and on their relative severity
Type of shortage skill vs labour shortages
The providers of the data on shortage occupations must also distinguish between skill and labour shortages because this distinction is necessary for the accurate identification of
shortage occupations and for the choice of the appropriate policy response to identified shortages
Classification of occupations used ISCO 08 4-digit codes (or translation into these codes)
All data should be either initially gathered in ISCO 08 4-digit codes or translated into these
codes This ensures that the data refers to specific individual occupations and is of practical use to EURES and the national providers of VET
Accuracy test cross-check with LSF data (ratio of unemployed to new hires)
The accuracy of the submitted lists of shortage and surplus occupations should be assessed
by comparing the most widely reported surplus and shortage occupations with the estimated values of the ratios of employed (by previous occupation) to new hires at the aggregated EU28 level These ratios should be based on an analysis of the most up-to date
Labour Force Survey (LFS) data
Gender balance assessment LFS data on employment at occupational level by gender PES job
seekers
The gender composition of shortage and surplus occupations should be based on the most
up to date analyses of LFS data on employment by gender and the PES job seeker data
Regional balance assessment LSF data data from relevant agencies
Where regional data is required other agencies and institutions should be requested to
provide the data in those cases where the data cannot be provided by the regional PES network because it is not geographically aligned to the NUTs regions
Labour shortages and surpluses 2017
2017 34
Directorate-General for Employment Social Affairs and Inclusion European Network of Public Employment Services (PES)
Number of occupations reporting should be extended beyond 20 occupations but with upper
limit (eg 50)
Consideration should be given to allowing the agencies responsible for identifying shortage
and surplus occupations a greater range of flexibility in terms of the numbers of occupations which should be identified A minimum to maximum range would be a more realistic approach as it would reflect the fact that the labour markets of the EEA vary significantly in size and performance
Timing of imbalance assessment September
It is proposed that the data gathering exercise should be brought forward to early September and that expert advice should be available on line throughout the data
gathering exercise
Labour shortages and surpluses 2017
2017 35
Directorate-General for Employment Social Affairs and Inclusion European Network of Public Employment Services (PES)
ANNEX 1 DATA COLLECTION TEMPLATE Information sought Explanation
Occupation title (text) Type in free text a list of occupations (one row one occupation) for which shortages and surpluses exist first list occupations for which there is a shortage the list should contain a maximum of 20 occupations if your list contains less than 20 occupations please provide a brief explanation in your email response for why the number is lower than 20 second list occupations for which there is a surplus the list should contain a maximum of 20 occupations if your list contains less than 20 occupations please provide a brief explanation in your email response for why the number is lower than 20
Shortagesurplus indicator For each occupation indicate if it refers to a shortage by typing in shortage or surplus by typing in surplus to identify surplus occupations you can examine for each occupation the ratio of the number of job seekers to the number of vacancies at the end of each year for example if there are 5000 shop assistants seeking employment and there are 200 vacancies at the end of the reference period the ratio is 251 you can rank the calculated ratios and report the occupations associated with the 20 highest ratios
Occupational classification used in your country
For each occupation indicate what occupational classification (if any) was used to identify this occupation for instance you can report a country specific classification ISCO ROME SOC etc If you donrsquot use occupational classifications type None
Occupation code to the lowest level of disaggregation (eg ISCO at 4 digits)
If you have indicated a classification used type the code for each occupation use the lowest level of disaggregation (eg 4 digit ISCO code) if you donrsquot use occupational classification leave black
ISCO-08 code at 4-digit level (or lower if 4-digit not available)
If you use occupational classification which is not ISCO-08 and if it is possible provide a translation of the national code to ISCO-08 code ISCO is the International Standard Classification of Occupations which is used to report to Eurostat code should be at 4 digits if this is not available than the lowest level of disaggregation that is available should be reported (3 digits if 4-digit code is not available 2 digits if neither 4-digit nor 3-digit code is available 1 digit if neither 4-digit 3-digit nor 2-digit code is available) if it is not possible to provide translation to ISCO-08 leave black if you have already reported ISCO-08 code in column 3 leave this column black
Estimate of shortagesurplus magnitude (high (gt3 of employment) medium (1-3 of employment) low (lt1 of employment))
For each occupation indicate a broad estimate of the magnitude of the shortagesurplus if you estimate that the shortagesurplus is less than 1 of the total employment in the occupation in question type low if between 1-3 type medium if greater than 3 type high if you cannot provide a rough estimate of magnitude type dont know
Current shortagesurplus (C) future short term (FST) future medium term (FMT) future long term (FLT) donrsquot know (indicate all that apply)
Against each occupation indicate if the identified shortagesurplus refers to present situation by typing C if the shortage is expected to occur in the short term future ie within 12 months by typing FST if it is expected to occur over the medium term (within 1-5 years) by typing FMT if it is expected to occur in the long term (in 5 or more years) by typing FLT if more than one time period applies indicate all relevant ones (eg for current shortagessurpluses that are expected to persist over the short term type C FST) if you dont know type dont know
Source of information on shortagessurpluses (eg PES administrative data (vacancies job seekers) PES survey third party survey Occupational forecasts other (specify) etc)
Indicate the source used to identify shortagesurplus for this occupation did you derive it from the PES administrative data on PES vacancies andor job seekers did you conduct a survey did you commission a third party to conduct a survey for you did you have occupational forecasts available did you use other research type in free text the full description of the source(s) eg National Employment Survey conducted by PES etc
Labour shortages and surpluses 2017
2017 36
Directorate-General for Employment Social Affairs and Inclusion European Network of Public Employment Services (PES)
Date for source of information Indicate the year that the information on shortagessurpluses (column 7) refers to eg type 2016 for a survey of difficult to fill vacancies conducted in 2016 even if the report was published in 2017
What indicator(s) suggested that there is a shortagesurplus
Indicate what criteria was used to conclude that this occupation is associated with a shortagesurplus for instance employers views sourcing from abroad to fill vacancies growth in employment faster than growth in educationtraining output time required to fill
vacancies higher than average etc
Share of females among job seekers in this occupation (surplus occupations only)
Indicate the percentage share of females among all job seekers in this occupation this is only applicable to surplus occupations
Skill or labour shortage Indicate if a shortage refers to a skill or labour shortage a skill shortage occurs where there is an insufficient supply of persons with the appropriate skills labour shortages occur where there is a sufficient number of skilled persons however an insufficient number of them is willing to take up employment in the occupation in question
Indicate the availability of data on shortagessurpluses at regional level (NUTS1 NUTS2 NUTS3 No data)
Indicate if data is available on the regional breakdown of shortagessurpluses by indicating the level of regional data available if multiple levels of regional disaggregation are available indicate the lowest level of disaggregation (eg NUTS3 rather than NUTS2) if there is no regional data available use no data
Labour shortages and surpluses 2017
2017 37
Directorate-General for Employment Social Affairs and Inclusion European Network of Public Employment Services (PES)
ANNEX 2 SHORTAGE OCCUPATIONS
Shortage occupation PES count
Cooks 16 Plumbers and pipe fitters 13 Generalist medical practitioners 12 Welders and flamecutters 12 Heavy truck and lorry drivers 11 Metal working machine tool setters and operators 11 Nursing professionals 11 Software developers 11 Agricultural and industrial machinery mechanics and repairers 10 Cleaners and helpers in offices hotels and other establishments 10 Commercial sales representatives 10 Specialist medical practitioners 10 Systems analysts 10 Bricklayers and related workers 9 Building and related electricians 9 Butchers fishmongers and related food preparers 9 Motor vehicle mechanics and repairers 9 Nursing associate professionals 9 Sheet-metal workers 9 Shop sales assistants 9 Waiters 9 Carpenters and joiners 8 Civil engineers 8 Concrete placers concrete finishers and related workers 8 Electrical engineering technicians 8 Electronics engineering technicians 8 Mechanical engineers 8 Primary school teachers 8 Structural-metal preparers and erectors 8 Electronics engineers 7
Health care assistants 7 Manufacturing supervisors 7 Mechanical engineering technicians 7 Secondary education teachers 7 Accountants 6 Applications programmers 6 Bus and tram drivers 6 Contact centre salespersons 6 Early childhood educators 6 Electrical mechanics and fitters 6 Floor layers and tile setters 6 Plasterers 6 Roofers 6 Sewing machine operators 6 Software and applications developers and analysts not elsewhere classified 6 Toolmakers and related workers 6 Web and multimedia developers 6 Air conditioning and refrigeration mechanics 5 Building frame and related trades workers not elsewhere classified 5 Chefs 5 Civil engineering labourers 5 Construction supervisors 5 Earthmoving and related plant operators 5 Electrical engineers 5 Electrical line installers and repairers 5 Engineering professionals not elsewhere classified 5 Hairdressers 5 Information and communications technology operations technicians 5 Manufacturing managers 5 Physiotherapists 5 Real estate agents and property managers 5 Research and development managers 5 Spray painters and varnishers 5 Accounting associate professionals 4 Bakers pastry-cooks and confectionery makers 4
Labour shortages and surpluses 2017
2017 38
Directorate-General for Employment Social Affairs and Inclusion European Network of Public Employment Services (PES)
Shortage occupation PES count
Blacksmiths hammersmiths and forging press workers 4 Civil engineering technicians 4 Crane hoist and related plant operators 4 Database designers and administrators 4 Industrial and production engineers 4 Painters and related workers 4 Physical and engineering science technicians not elsewhere classified 4 Plastic products machine operators 4 Social work and counselling professionals 4 Accounting and bookkeeping clerks 3 Administrative and executive secretaries 3 Ambulance workers 3 Building construction labourers 3 Car taxi and van drivers 3 Cartographers and surveyors 3 Cleaning and housekeeping supervisors in offices hotels and other establishments 3 Contact centre information clerks 3 Draughtspersons 3 Fast food preparers 3 Freight handlers 3 Gardeners horticultural and nursery growers 3 Home-based personal care workers 3 Hotel receptionists 3 Information and communications technology installers and servicers 3 Insulation workers 3 Kitchen helpers 3 Manufacturing labourers not elsewhere classified 3 Medical imaging and therapeutic equipment technicians 3 Metal moulders and coremakers 3 Metal polishers wheel grinders and tool sharpeners 3 Midwifery professionals 3 Other language teachers 3 Personal services workers not elsewhere classified 3
Pharmacists 3 Policy administration professionals 3 Printers 3 Process control technicians not elsewhere classified 3 Sales and marketing managers 3 Shop supervisors 3 Special needs teachers 3 Stock clerks 3 Supply distribution and related managers 3 Survey and market research interviewers 3 Systems administrators 3 Technical and medical sales professionals (excluding ICT) 3 Translators interpreters and other linguists 3 Transport clerks 3 Vocational education teachers 3 Advertising and marketing professionals 2 Audiologists and speech therapists 2 Bartenders 2 Beauticians and related workers 2 Cashiers and ticket clerks 2 Chemical engineers 2 Child care workers 2 Computer network and systems technicians 2 Computer network professionals 2 Construction managers 2 Craft and related workers not elsewhere classified 2 Credit and loans officers 2 Crop farm labourers 2 Database and network professionals not elsewhere classified 2 Dentists 2 Domestic cleaners and helpers 2 Door to door salespersons 2 Driving instructors 2 Electrical and electronic equipment assemblers 2 Electronics mechanics and servicers 2 Elementary workers not elsewhere classified 2 Employment agents and contractors 2
Labour shortages and surpluses 2017
2017 39
Directorate-General for Employment Social Affairs and Inclusion European Network of Public Employment Services (PES)
Shortage occupation PES count
Field crop and vegetable growers 2 Financial analysts 2 Financial and investment advisers 2 Forestry and related workers 2 Garbage and recycling collectors 2 General office clerks 2 Graphic and multimedia designers 2 Information and communications technology service managers 2 Insurance representatives 2 Locomotive engine drivers 2 Mail carriers and sorting clerks 2 Management and organization analysts 2 Mathematicians actuaries and statisticians 2 Mechanical machinery assemblers 2 Medical and dental prosthetic technicians 2 Medical assistants 2 Messengers package deliverers and luggage porters 2 Metal finishing plating and coating machine operators 2 Metal processing plant operators 2 Optometrists and ophthalmic opticians 2 Personal care workers in health services not elsewhere classified 2 Police officers 2 Policy and planning managers 2 Production clerks 2 Restaurant managers 2 Retail and wholesale trade managers 2 Sales workers not elsewhere classified 2 Sewing embroidery and related workers 2 Street food salespersons 2 Tailors dressmakers furriers and hatters 2 Telecommunications engineers 2 Advertising and public relations managers 1 Aged care services managers 1
Agricultural technicians 1 Aircraft engine mechanics and repairers 1 Aircraft pilots and related associate professionals 1 Assemblers not elsewhere classified 1 Authors and related writers 1 Bank tellers and related clerks 1 Bleaching dyeing and fabric cleaning machine operators 1 Bookmakers croupiers and related gaming workers 1 Business services agents not elsewhere classified 1 Buyers 1 Cabinet-makers and related workers 1 Cement stone and other mineral products machine operators 1 Chemical and physical science technicians 1 Chemical engineering technicians 1 Chemical processing plant controllers 1 Chemical products plant and machine operators 1 Chemists 1 Conference and event planners 1 Customs and border inspectors 1 Data entry clerks 1 Dental assistants and therapists 1 Dieticians and nutritionists 1 Dispensing opticians 1 Domestic housekeepers 1 Economists 1 Education methods specialists 1 Environmental and occupational health and hygiene professionals 1 Environmental and occupational health inspectors and associates 1 Fibre preparing spinning and winding machine operators 1 Finance managers 1 Financial and insurance services branch managers 1 Fire-fighters 1 Fitness and recreation instructors and program leaders 1 Food and beverage tasters and graders 1 Food and related products machine operators 1
Labour shortages and surpluses 2017
2017 40
Directorate-General for Employment Social Affairs and Inclusion European Network of Public Employment Services (PES)
Shortage occupation PES count
Food service counter attendants 1 Forestry labourers 1 Fruit vegetable and related preservers 1 Fur and leather preparing machine operators 1 Glass and ceramics plant operators 1 Hand launderers and pressers 1 Hand packers 1 Handicraft workers in textile leather and related materials 1 Health associate professionals not elsewhere classified 1 Health professionals not elsewhere classified 1 House builders 1 Human resource managers 1 Incinerator and water treatment plant operators 1 Information and communications technology user support technicians 1 Judges 1 Lawyers 1 Legal and related associate professionals 1 Legal professionals not elsewhere classified 1 Library clerks 1 Lifting truck operators 1 Livestock and dairy producers 1 Livestock farm labourers 1 Medical and pathology laboratory technicians 1 Medical secretaries 1 Metal production process controllers 1 Mining and quarrying labourers 1 Mining engineers metallurgists and related professionals 1 Mixed crop and animal producers 1 Mixed crop growers 1 Motorcycle drivers 1 Odd job persons 1 Other cleaning workers 1 Other music teachers 1
Paper products machine operators 1 Personnel and careers professionals 1 Personnel clerks 1 Pet groomers and animal care workers 1 Physicists and astronomers 1 Physiotherapy technicians and assistants 1 Potters and related workers 1 Power production plant operators 1 Prison guards 1 Product and garment designers 1 Psychologists 1 Pulp and papermaking plant operators 1 Railway brake signal and switch operators 1 Receptionists (general) 1 Refuse sorters 1 Riggers and cable splicers 1 Scribes and related workers 1 Secretaries (general) 1 Securities and finance dealers and brokers 1 Security guards 1 Senior government officials 1 Senior officials of special-interest organizations 1 Shelf fillers 1 Ships engineers 1 Shoemaking and related machine operators 1 Social work associate professionals 1 Stall and market salespersons 1 Stationary plant and machine operators not elsewhere classified 1 Stonemasons stone cutters splitters and carvers 1 Street and related service workers 1 Sweepers and related labourers 1 Teaching professionals not elsewhere classified 1 Telecommunications engineering technicians 1 Textile fur and leather products machine operators not elsewhere classified 1 Trade brokers 1 Travel attendants and travel stewards 1 Travel guides 1
Labour shortages and surpluses 2017
2017 41
Directorate-General for Employment Social Affairs and Inclusion European Network of Public Employment Services (PES)
Shortage occupation PES count
Tree and shrub crop growers 1 Underwater divers 1 University and higher education teachers 1 Vehicle cleaners 1 Veterinarians 1 Weaving and knitting machine operators 1 Web technicians 1 Wood processing plant operators 1 Woodworking-machine tool setters and operators 1
Labour shortages and surpluses 2017
2017 42
Directorate-General for Employment Social Affairs and Inclusion European Network of Public Employment Services (PES)
ANNEX 3 SURPLUS OCCUPATIONS
Surplus occupation PES count
General office clerks 8 Shop sales assistants 8 Advertising and marketing professionals 6 Bank tellers and related clerks 6 Sociologists anthropologists and related professionals 6 Child care workers 5 Hairdressers 5 Journalists 5 Cashiers and ticket clerks 4 Cleaners and helpers in offices hotels and other establishments 4 Hand packers 4 Mail carriers and sorting clerks 4 Photographers 4 Receptionists (general) 4 Tailors dressmakers furriers and hatters 4 Accounting and bookkeeping clerks 3 Administrative and executive secretaries 3 Beauticians and related workers 3 Biologists botanists zoologists and related professionals 3 Bricklayers and related workers 3 Broadcasting and audio-visual technicians 3 Civil engineering labourers 3 Economists 3 Gardeners horticultural and nursery growers 3 Interior designers and decorators 3 Kitchen helpers 3 Legal professionals not elsewhere classified 3 Manufacturing labourers not elsewhere classified 3 Motor vehicle mechanics and repairers 3
Musicians singers and composers 3 Other artistic and cultural associate professionals 3 Painters and related workers 3 Philosophers historians and political scientists 3 Security guards 3 Sweepers and related labourers 3 Travel consultants and clerks 3 Waiters 3 Actors 2 Archivists and curators 2 Bakers pastry-cooks and confectionery makers 2 Bartenders 2 Building construction labourers 2 Business services and administration managers not elsewhere classified 2 Cabinet-makers and related workers 2 Car taxi and van drivers 2 Chemists 2 Cleaning and housekeeping supervisors in offices hotels and other establishments 2 Credit and loans officers 2 Customs and border inspectors 2 Elementary workers not elsewhere classified 2 Film stage and related directors and producers 2 Financial analysts 2 Forestry and related workers 2 Freight handlers 2 Graphic and multimedia designers 2 Health care assistants 2 Hotel receptionists 2 Lawyers 2 Legal and related associate professionals 2 Library clerks 2 Livestock and dairy producers 2 Management and organization analysts 2 Messengers package deliverers and luggage porters 2 Odd job persons 2 Office supervisors 2 Plasterers 2
Labour shortages and surpluses 2017
2017 43
Directorate-General for Employment Social Affairs and Inclusion European Network of Public Employment Services (PES)
Surplus occupation PES count
Police officers 2 Pre-press technicians 2 Print finishing and binding workers 2 Printers 2 Prison guards 2 Product and garment designers 2 Psychologists 2 Public relations professionals 2 Religious professionals 2 Secondary education teachers 2 Secretaries (general) 2 Social work and counselling professionals 2 Stall and market salespersons 2 Stock clerks 2 Teachers aides 2 Telephone switchboard operators 2 Travel guides 2 Visual artists 2 Advertising and public relations managers 1 Agricultural technicians 1 Announcers on radio television and other media 1 Assemblers not elsewhere classified 1 Building and related electricians 1 Building architects 1 Building caretakers 1 Building frame and related trades workers not elsewhere classified 1 Business services agents not elsewhere classified 1 Buyers 1 Carpenters and joiners 1 Chemical engineers 1 Civil engineers 1 Clearing and forwarding agents 1 Clerical support workers not elsewhere classified 1
Commercial sales representatives 1 Conference and event planners 1 Contact centre information clerks 1 Contact centre salespersons 1 Cooks 1 Crane hoist and related plant operators 1 Creative and performing artists not elsewhere classified 1 Dancers and choreographers 1 Data entry clerks 1 Database designers and administrators 1 Domestic cleaners and helpers 1 Domestic housekeepers 1 Draughtspersons 1 Driving instructors 1 Early childhood educators 1 Electronics mechanics and servicers 1 Farming forestry and fisheries advisers 1 Fashion and other models 1 Fast food preparers 1 Field crop and vegetable growers 1 Filing and copying clerks 1 Finance managers 1 Financial and insurance services branch managers 1 Financial and investment advisers 1 Fire-fighters 1 Fitness and recreation instructors and program leaders 1 Floor layers and tile setters 1 Food service counter attendants 1 Fruit vegetable and related preservers 1 Gallery museum and library technicians 1 Garbage and recycling collectors 1 Garment and related pattern-makers and cutters 1 Glass and ceramics plant operators 1 Government tax and excise officials 1 Hand launderers and pressers 1
Labour shortages and surpluses 2017
2017 44
Directorate-General for Employment Social Affairs and Inclusion European Network of Public Employment Services (PES)
Surplus occupation PES count
Heavy truck and lorry drivers 1 House builders 1 Hunters and trappers 1 Information and communications technology installers and servicers 1 Information and communications technology user support technicians 1 Insurance representatives 1 Jewellery and precious-metal workers 1 Judges 1 Legal secretaries 1 Librarians and related information professionals 1 Life science technicians (excluding medical) 1 Lifting truck operators 1 Managing directors and chief executives 1 Manufacturing supervisors 1 Medical and dental prosthetic technicians 1 Metal moulders and coremakers 1 Mining and quarrying labourers 1 Mixed crop and animal producers 1 Mixed crop growers 1 Mobile farm and forestry plant operators 1 Musical instrument makers and tuners 1 Other language teachers 1 Pawnbrokers and money-lenders 1 Personnel and careers professionals 1 Pet groomers and animal care workers 1 Photographic products machine operators 1 Physical and engineering science technicians not elsewhere classified 1 Physicists and astronomers 1 Police inspectors and detectives 1 Precision-instrument makers and repairers 1 Primary school teachers 1 Process control technicians not elsewhere classified 1 Product graders and testers (excluding foods and beverages) 1
Production clerks 1 Professional services managers not elsewhere classified 1 Protective services workers not elsewhere classified 1 Research and development managers 1 Retail and wholesale trade managers 1 Roofers 1 Sales workers not elsewhere classified 1 Senior government officials 1 Service station attendants 1 Shelf fillers 1 Shop supervisors 1 Social work associate professionals 1 Special needs teachers 1 Spray painters and varnishers 1 Statistical mathematical and related associate professionals 1 Stonemasons stone cutters splitters and carvers 1 Street food salespersons 1 Supply distribution and related managers 1 Teaching professionals not elsewhere classified 1 Technical and medical sales professionals (excluding ICT) 1 Training and staff development professionals 1 Translators interpreters and other linguists 1 Transport conductors 1 Tree and shrub crop growers 1 Typists and word processing operators 1 Undertakers and embalmers 1 Vocational education teachers 1 Weaving and knitting machine operators 1 Woodworking-machine tool setters and operators 1
Labour shortages and surpluses 2017
2017 45
Directorate-General for Employment Social Affairs and Inclusion European Network of Public Employment Services (PES)
ANNEX 4 THE RATIO OF UNEMPLOYED TO NEW HIRES
ISCO-08 title
2015
UE
Recruited in the
last year (lt12
months)
Ratio of UE to new recruits
Street and related service workers 85 104 08 Agricultural forestry and fishery labourers 3913 5343 07 Mining and construction labourers 1937 3525 05 Creative and performing artists 610 1115 05 Refuse workers 1036 1923 05 Painters building structure cleaners and related trades workers 1116 2117 05 Street and market salespersons 195 389 05 Building frame and related trades workers 3632 7353 05 Mining manufacturing and construction supervisors 626 1315 05 Ships deck crews and related workers 53 114 05 Market gardeners and crop growers 1471 3207 05 Managing directors and chief executives 304 667 05 Travel attendants conductors and guides 229 538 04 Wood treaters cabinet-makers and related trades workers 491 1159 04 Manufacturing labourers 1640 3909 04 Domestic hotel and office cleaners and helpers 5679 13545 04 Other stationary plant and machine operators 822 1961 04 Mobile plant operators 1038 2497 04 Building finishers and related trades workers 1519 3680 04 Textile fur and leather products machine operators 431 1048 04 Garment and related trades workers 422 1047 04 Chemical and photographic products plant and machine operators 157 389 04 Food processing and related trades workers 930 2330 04 Vehicle window laundry and other hand cleaning workers 291 754 04 Sheet and structural metal workers moulders and welders and related workers
996 2603 04
Waiters and bartenders 4399 11595 04 Cooks 1529 4039 04 Metal processing and finishing plant operators 208 557 04 Printing trades workers 203 548 04 Forestry and related workers 130 351 04 Protective services workers 1347 3658 04 Transport and storage labourers 2532 6939 04 Fishery workers hunters and trappers 46 128 04 Material-recording and transport clerks 1671 4630 04 Process control technicians 179 517 03 Mining and mineral processing plant operators 94 274 03 Telecommunications and broadcasting technicians 177 519 03 Blacksmiths toolmakers and related trades workers 816 2409 03 Building and housekeeping supervisors 678 2045 03
Secretaries (general) 1072 3259 03 Assemblers 850 2586 03 Other craft and related workers 258 810 03 Shop salespersons 6600 21042 03 Electrical equipment installers and repairers 958 3060 03 Food and related products machine operators 437 1400 03 Other sales workers 1087 3510 03 Food preparation assistants 1646 5337 03 Mixed crop and animal producers 387 1260 03 Car van and motorcycle drivers 1155 3764 03 Client information workers 1993 6531 03 Sports and fitness workers 605 1984 03 Handicraft workers 194 638 03 Life science technicians and related associate professionals 82 271 03 Keyboard operators 283 940 03 Electronics and telecommunications installers and repairers 290 963 03 Other personal services workers 313 1047 03 Vocational education teachers 279 940 03 Other teaching professionals 744 2518 03 General office clerks 966 3272 03 Authors journalists and linguists 335 1135 03 Hairdressers beauticians and related workers 806 2796 03
Labour shortages and surpluses 2017
2017 46
Directorate-General for Employment Social Affairs and Inclusion European Network of Public Employment Services (PES)
ISCO-08 title
2015
UE
Recruited in the
last year (lt12
months)
Ratio of UE to new recruits
Animal producers 189 660 03 Other elementary workers 976 3401 03 Machinery mechanics and repairers 1134 3962 03 Ship and aircraft controllers and technicians 80 281 03 Hotel and restaurant managers 344 1220 03 Cashiers and ticket clerks 908 3220 03 Retail and wholesale trade managers 224 809 03 Sales marketing and development managers 311 1124 03 Physical and engineering science technicians 1204 4366 03 Administrative and specialised secretaries 1106 4040 03 Sales and purchasing agents and brokers 1294 4754 03 Rubber plastic and paper products machine operators 256 941 03 Artistic cultural and culinary associate professionals 511 1906 03 Numerical clerks 944 3532 03 Other services managers 184 691 03 Child care workers and teachers aides 1335 5005 03 Heavy truck and bus drivers 1426 5349 03 Business services and administration managers 383 1439 03 Information and communications technology service managers 67 257 03 Regulatory government associate professionals 209 807 03 Life science professionals 176 681 03 Wood processing and papermaking plant operators 97 379 03 Locomotive engine drivers and related workers 46 179 03 Legal professionals 315 1245 03 Personal care workers in health services 2195 8787 02 Physical and earth science professionals 85 345 02 Street vendors (excluding food) 50 204 02 Architects planners surveyors and designers 515 2092 02 Other clerical support workers 901 3657 02 Business services agents 510 2114 02 Manufacturing mining construction and distribution managers 361 1507 02 Tellers money collectors and related clerks 381 1612 02 Librarians archivists and curators 58 248 02 Medical and pharmaceutical technicians 255 1099 02 University and higher education teachers 301 1333 02 Information and communications technology operations and user support technicians
418 1888 02
Legal social and religious associate professionals 920 4348 02 Financial and mathematical associate professionals 601 2852 02 Sales marketing and public relations professionals 865 4172 02 Finance professionals 472 2281 02 Engineering professionals (excluding electrotechnology) 635 3118 02 Other health associate professionals 531 2657 02
Social and religious professionals 460 2317 02 Professional services managers 176 891 02 Nursing and midwifery associate professionals 556 2855 02 Legislators and senior officials 53 286 02 Database and network professionals 83 455 02 Administration professionals 641 3673 02 Primary school and early childhood teachers 575 3345 02 Electrotechnology engineers 142 827 02 Secondary education teachers 471 2812 02 Other health professionals 346 2083 02 Nursing and midwifery professionals 273 1760 02 Software and applications developers and analysts 631 4159 02 Medical doctors 293 1944 02 No occupation 152894 00
No answer 2531 578 44 Total 249561 294937 08
Labour shortages and surpluses 2017
2017 47
Directorate-General for Employment Social Affairs and Inclusion European Network of Public Employment Services (PES)
HOW TO OBTAIN EU PUBLICATIONS
Free publications
bull one copy
via EU Bookshop (httpbookshopeuropaeu)
bull more than one copy or postersmaps
from the European Unionrsquos representations (httpeceuropaeurepresent_enhtm)
from the delegations in non-EU countries
(httpeeaseuropaeudelegationsindex_enhtm)
by contacting the Europe Direct service (httpeuropaeueuropedirectindex_enhtm)
or calling 00 800 6 7 8 9 10 11 (free phone number from anywhere in the EU) () () The information given is free as are most calls (though some operators phone boxes or hotels may charge you)
Priced publications
bull via EU Bookshop (httpbookshopeuropaeu)
Priced subscriptions
bull via one of the sales agents of the Publications Office of the European Union
(httppublicationseuropaeuothersagentsindex_enhtm)
doi 10276731262
KE-0
1-1
8-2
63-E
N-N
[Ca
talo
gu
e n
um
be
r]
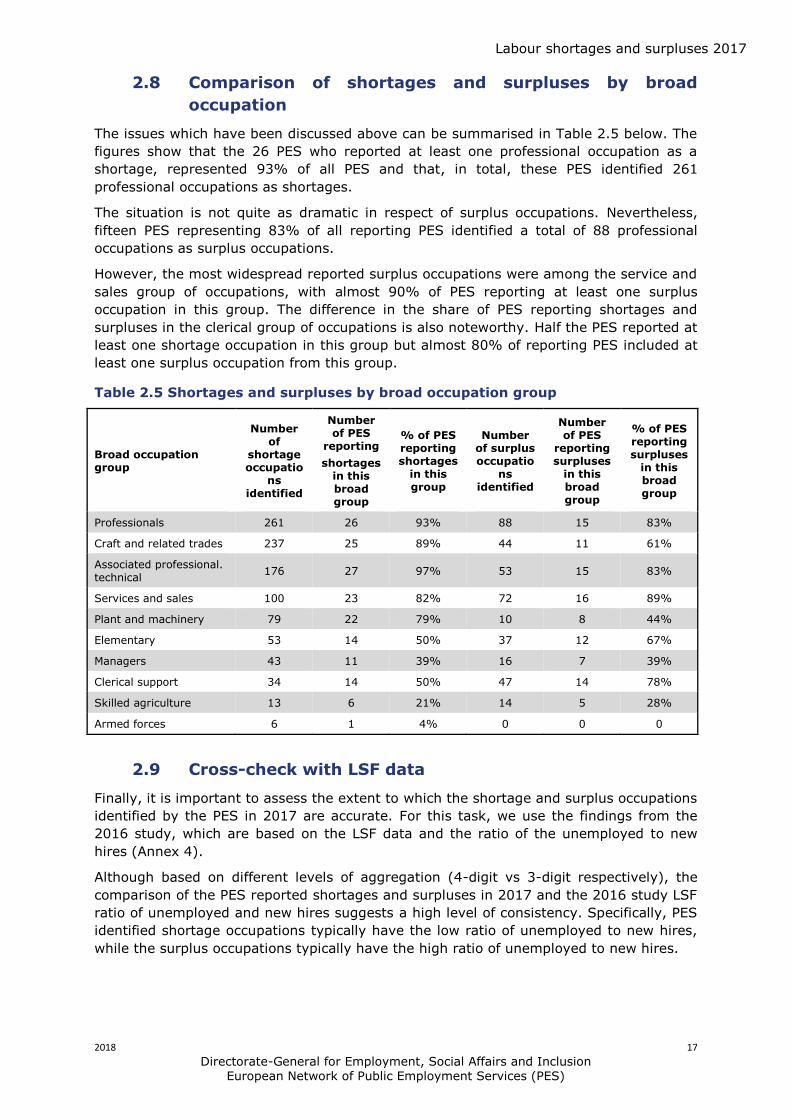
Labour shortages and surpluses 2017
2018 17
Directorate-General for Employment Social Affairs and Inclusion European Network of Public Employment Services (PES)
28 Comparison of shortages and surpluses by broad
occupation
The issues which have been discussed above can be summarised in Table 25 below The
figures show that the 26 PES who reported at least one professional occupation as a
shortage represented 93 of all PES and that in total these PES identified 261
professional occupations as shortages
The situation is not quite as dramatic in respect of surplus occupations Nevertheless
fifteen PES representing 83 of all reporting PES identified a total of 88 professional
occupations as surplus occupations
However the most widespread reported surplus occupations were among the service and
sales group of occupations with almost 90 of PES reporting at least one surplus
occupation in this group The difference in the share of PES reporting shortages and
surpluses in the clerical group of occupations is also noteworthy Half the PES reported at
least one shortage occupation in this group but almost 80 of reporting PES included at
least one surplus occupation from this group
Table 25 Shortages and surpluses by broad occupation group
Broad occupation group
Number of
shortage occupatio
ns identified
Number of PES
reporting
shortages in this broad group
of PES reporting shortages
in this group
Number of surplus occupatio
ns identified
Number of PES
reporting surpluses
in this broad group
of PES reporting surpluses
in this broad group
Professionals 261 26 93 88 15 83
Craft and related trades 237 25 89 44 11 61
Associated professional technical
176 27 97 53 15 83
Services and sales 100 23 82 72 16 89
Plant and machinery 79 22 79 10 8 44
Elementary 53 14 50 37 12 67
Managers 43 11 39 16 7 39
Clerical support 34 14 50 47 14 78
Skilled agriculture 13 6 21 14 5 28
Armed forces 6 1 4 0 0 0
29 Cross-check with LSF data
Finally it is important to assess the extent to which the shortage and surplus occupations
identified by the PES in 2017 are accurate For this task we use the findings from the
2016 study which are based on the LSF data and the ratio of the unemployed to new
hires (Annex 4)
Although based on different levels of aggregation (4-digit vs 3-digit respectively) the
comparison of the PES reported shortages and surpluses in 2017 and the 2016 study LSF
ratio of unemployed and new hires suggests a high level of consistency Specifically PES
identified shortage occupations typically have the low ratio of unemployed to new hires
while the surplus occupations typically have the high ratio of unemployed to new hires
Labour shortages and surpluses 2017
2018 18
Directorate-General for Employment Social Affairs and Inclusion European Network of Public Employment Services (PES)
The only exceptions are the occupations of lsquocleanersrsquo lsquowaitersrsquo and lsquoshop sales
assistantsrsquo However this result is understandable as these occupations were classified
by the PES4 as labour shortages rather than skill shortages and consequently the
relatively high ratio could reflect the fact that there are a significant number of
unemployed available to work in these occupations
210 Conclusions
There are a number of significant conclusions which may be drawn from the analyses of
shortage and surplus occupations in this chapter
Firstly the widespread concern that using data from the PES may produce a significant
bias in the list of shortages and surpluses because the PES attract less vacancies and
job-seekers from higher skilled occupations appears to be unfounded Ironically the
professional occupations were the most frequently reported occupations in both the list of
shortages and surpluses
Secondly there is a distinct difference in the type of competences and qualifications
identified by the PES as shortages and surplus occupations and this difference was
evident throughout the different occupation groups In general the shortage occupations
embodied technical skills whether in health-related software-related or engineeringndash
related occupations at professional technical and craft levels
In sharp contrast the surplus occupations embodied selling service and clerical skills
cultural and artistic skills and competencies in the humanities
Finally the type of occupations which the PES associated with shortages and surpluses
are highly plausible In general the shortage occupations have a low ratio of unemployed
to new hires while the surplus occupations have a high ratio This consistency extended
to the occupations which the PES identified as labour shortages which exhibited a high
ratio
The classification of skill and labour shortages is one of the issues discussed in the next
chapter
4 While this is true when all three occupations are aggregated only two of five PES categorised lsquocleanersrsquo as a labour shortage ndash see chapter 3
Labour shortages and surpluses 2017
2018 19
Directorate-General for Employment Social Affairs and Inclusion European Network of Public Employment Services (PES)
3 PROFILE OF SHORTAGES AND SURPLUSES IN SPACE AND TIME
31 Introduction
In this chapter we analyse the occupations which have been identified by the European
PES as shortage and surplus occupations from the perspective of space and time We
review the geographical distribution of these occupations to ascertain if this distribution
provides an insight into what may have given rise to these shortages and surplus
occupations and we also examine the extent to which the same shortage and surplus
occupations have persisted over time using the findings from previous studies
32 PES methods used for identifying shortages and surpluses
In the previous chapter it was noted that only eighteen of twenty-eight PES submitted a
list of surplus occupations A review of the methods used by the PES to identify shortage
occupations may provide an insight into why ten PES did not provide any data on surplus
occupations
A summary of the methods used to identify shortage occupations is provided in Table 31
below The data indicates that exactly ten PES did not use any administrative data in
identifying their shortage occupations but rather used other sources such as employer
surveys national forecasting studies or immigration data It is tempting to conclude that
this is the reason why only 18 out of 28 PES provided data on surplus occupations as
these methodologies are not generally associated with the provision of information on
occupations which are in surplus
However such a conclusion would not be entirely accurate The analyses found that the
use of survey data did not necessarily preclude a PES from identifying surplus
occupations The Danish PES for example used the results of their Labour Market Balance
Survey and was able to provide a comprehensive list of surplus occupations In contrast
the Italian and Norwegian PES who relied on national forecasts and surveys respectively
were unable to provide such a list
Furthermore not all of the PES who based their identification of shortages on their
administrative data systems provided a list of surplus occupations Those who did
generally used the ratio of job-seekers to vacancies to identify whether an occupation
was a shortage or surplus occupation But a number of PES such as the German and
Luxemburg PES and the Belgium regional PES Actiris while basing their identification of
shortage and surplus occupations on administrative data used quite sophisticated
techniques such as the share of vacancies filled and the duration of vacancy filling Unlike
the ratio of job-seekers to vacancies such techniques do not readily provide an indicator
for identifying an occupation as a surplus occupation5
5 While it is reasonable to classify an occupation as a shortage occupation if the filling of vacant posts in that occupation takes on average an exceptionally long time identifying surplus occupations is somewhat more problematic using this method
Labour shortages and surpluses 2017
2018 20
Directorate-General for Employment Social Affairs and Inclusion European Network of Public Employment Services (PES)
Table 31 Methods used by the PES to identify shortage occupations
PES methods for identifying shortages and surpluses Number of PES
Combination of administrative data PES surveys and expert opinion
1
Combination of administrative data PES surveys and 3rd party data
1
Combination of administrative data and PES surveys 7
Combination of administrative data and 3rd party data 1
Combination of administrative data and expert opinion 2
PES work permit data only 2
PES administrative data only 6
PES survey data only 2
PES warehousing data only 1
3rd party surveys and forecasts 5
Total 28
The fact that only eighteen PES provided a list of surplus occupations is a serious
weakness of this study because it places a limit on the potential of the analyses to
identify cross border matching opportunities between shortage and surplus occupations
Consequently in the future every effort should be made to significantly increase the
number of PES providing a list of surplus occupations even if this means that a
significant number of PES use alternative methodologies to identify shortage and surplus
occupations rather than a single methodology to do both as has occurred in both the
2016 study and the current study6
33 Geographic distribution of shortages and surpluses
The 28 PES who submitted data on shortages cover a very wide geographic area which
include labour markets with very different characteristics It may be informative
therefore to assess the extent to which the distribution of shortage occupations differed
between different countries
Table 32 below shows the number of reported shortage occupations within their broad
occupation group and the PES who reported the occupation as a shortage7
While each PES was requested to submit a maximum of twenty shortage occupations a
total of ten PES provided more than that and in the case of the Slovenian French and the
regional Belgian PES Actiris significantly more
A total of six PES identified less than twenty shortage occupations but in most cases the
difference was negligible
The Croatian and Portuguese PES were the only PES which did not identify any
professional occupation in their list of shortage occupations This may reflect the type of
vacancies which are notified by employers to these PES because both these PES use
their own administrative data systems exclusively to identify shortage occupations
6 In the 2016 study while 26 PES provided data on shortage occupations 13 provided data on surplus
occupations 7 Three groups are excluded from the Table managers (43) skilled agricultural (13) and armed forces (1) as the figures are quite small
Labour shortages and surpluses 2017
2018 21
Directorate-General for Employment Social Affairs and Inclusion European Network of Public Employment Services (PES)
Table 32 Shortages number of mentions (4-digit) in broad occupation (1-digit)
PES Professional Technical Clerical Craft Service Plant Elementary Total
Austria 4 11 1 12 2 0 0 30
Actiris 28 22 6 11 13 2 0 82
Le Forem 6 6 0 6 0 0 0 18
VDAB 4 7 1 4 1 3 0 20
Bulgaria 7 0 0 4 5 3 2 21
Croatia 0 1 0 13 1 3 2 20
Cyprus 6 1 2 5 5 1 6 26
Denmark 5 1 0 7 3 2 1 19
Estonia 10 7 0 0 2 1 0 20
Finland 12 5 1 7 2 2 3 32
France 18 27 2 27 1 26 2 103
Germany 16 19 0 10 2 1 1 49
Hungary 2 6 6 8 14 3 12 51
Iceland 6 3 0 5 2 1 3 20
Ireland 13 2 0 4 1 1 0 21
Italy 2 2 1 7 4 1 3 20
Latvia 7 1 1 9 0 0 0 18
Lithuania 1 2 0 15 0 2 0 20
Luxemburg 8 4 0 0 0 0 0 12
Malta 5 3 3 4 6 1 4 26
Netherlands 20 11 3 23 2 1 0 60
Norway 13 3 0 10 10 4 1 41
Poland 10 6 2 2 3 3 4 30
Portugal 0 1 0 8 3 3 0 15
Slovakia 6 6 2 5 5 2 0 26
Slovenia 23 13 3 30 11 13 9 102
Sweden 15 2 0 1 2 0 0 20
Switzerland 14 4 0 0 0 0 0 18
Total 261 176 34 237 100 79 53 940
The stipulation to only provide a list of twenty shortage occupations may have prevented
any pattern from emerging in the figures For example there does not appear to be any
relationship between the numbers of employed and unemployed in a specific labour
market and the number of shortage occupations identified by its national PES
The two PES who submitted the highest volumes of shortage occupations - the French
and Slovenian PES - vary greatly in terms of the relative size of their labour force while
for example the Norwegian PES submitted significantly more shortage occupations than
much larger countries such as Germany and Poland
As a way of controlling for the variation in the total number of shortage occupations it
may be useful to compare the variation within the list of shortage occupations identified
by each PES However no obvious patterns emerge when a number of hypotheses are
tested using this approach For example there appears to be no relationship between
countries which are associated with strong apprenticeship systems such as Germany
Austria Denmark and Switzerland and their share of shortages among the craft group of
occupations The Swiss PES does not contain any craft occupations in its list of shortage
occupations while the craft group of occupations contain the most shortage occupations
in the lists provided by both the Austrian and Danish PES In the case of the German
PES the share of craft occupations is a little above the average
Labour shortages and surpluses 2017
2018 22
Directorate-General for Employment Social Affairs and Inclusion European Network of Public Employment Services (PES)
Table 33 Surpluses number of mentions (4-digit) in broad occupation (1-digit)
PES Professional Technical Clerical Craft Service Plant Elementary Total
Le Forem 2 1 1 1 6 0 8 19
Bulgaria 6 3 2 0 4 0 2 17
Switzerland 0 4 2 4 1 2 3 16
Cyprus 5 0 0 2 0 0 3 10
Denmark 3 2 3 0 6 1 4 19
Estonia 6 2 3 2 6 0 1 20
Finland 16 7 6 10 3 1 0 43
France 10 10 1 2 5 1 0 29
Croatia 4 0 0 0 0 0 0 4
Hungary 6 9 3 16 15 1 2 52
Ireland 1 1 4 3 5 1 7 22
Iceland 11 1 2 2 1 0 1 18
Lithuania 0 3 1 0 2 2 0 8
Latvia 4 4 0 0 3 1 3 15
Netherlands 3 2 9 0 9 0 1 24
Poland 0 0 0 0 1 0 0 1
Sweden 4 3 7 1 3 0 2 20
Slovakia 7 1 3 1 2 0 0 14
Total 88 53 47 44 72 10 37 351
The most striking aspect of the geographical distribution of surplus occupations is the
relatively low number of occupations which were reported Most of the reporting PES
(eleven) provided less than the twenty surplus occupations they were requested to
submit Furthermore if the contributions from the Hungarian and Finnish PES are
excluded the average number of surplus occupations submitted by the other PES is
sixteen
With the exception of the Icelandic Finnish French and Hungarian PES the list of
surplus occupations remains in single figures across all the broad occupational groups
Such low figures result in limited cross-border matching possibilities which are explored
in the next chapter
The PES were also asked to indicate the lowest regional level at which they could provide
data on both shortage and surplus occupations Their response is outlined in Table 34
above A total of twenty PES responded positively in the case of shortage occupations
and twelve in the case of surplus occupations In the case of shortage occupations nine
PES indicated that they could provide data at NUTs3 level while eight PES stated that
they could provide the data at NUTs1 level In the case of surplus occupations five PES
indicated that they could provide the data at NUTs1 level and another five PES responded
that they could provide the data at NUTs 3 level There were very few PES who indicated
that the lowest level at which they could provide data was at NUTs2 or NUTs4 levels
Labour shortages and surpluses 2017
2018 23
Directorate-General for Employment Social Affairs and Inclusion European Network of Public Employment Services (PES)
Table 34 Availability of data on shortagessurpluses at regional levels
Shortage occupations Surplus occupations
Country NUTS1 NUTS2 NUTS3 NUTS4 No
data NUTS1 NUTS2 NUTS3 NUTS4
Austria
x
Belgium Actiris
x
Belgium Le Forem
x
x
Belgium VDAB
x
Bulgaria
x
x
x
Croatia x
x
Cyprus
x
x
Denmark
x
x
Estonia x
x
Finland
x
x
France
x
x
Germany x
Hungary
x
x
Iceland x
x
Ireland x
x
Italy
x
Latvia
x
x
Lithuania
x
x
Luxembourg x
Malta
x
Netherlands
x
x
Norway
x
Poland
x
x
Portugal
x
Slovakia
x
x
Slovenia x
Sweden
x
x
Switzerland
x
x
Note Bulgaria has regional data for some occupations
34 Tracking shortages over time
This is the third annual study on lsquoBottleneck Occupationsrsquo the previous two studies were
undertaken in 2016 and 2015 The findings in both of those studies were presented in 3-
digit codes To make the findings comparable over time the 4-digit shortage and surplus
occupations from the current study are aggregated up to 3-digit occupations as shown in
Table 35
A striking aspect of the list of occupations in Table 35 is the degree of consistency
displayed over the period 2015-2017 inclusive not simply in terms of the occupations
reported by the PES but also in terms of the number of PES who identified them as
shortages (ie their ranking) Not only does the 3-digit occupation category of lsquosoftware
and applications developersrsquo occupy the top ranking in each of the years five of the top
ranking six occupations are the same The only notable exception is that the finance
professional and associate professional occupations featured in the list of most reported
shortage occupations in 2015 but slipped out of this list in 2016 and 2017
Labour shortages and surpluses 2017
2018 24
Directorate-General for Employment Social Affairs and Inclusion European Network of Public Employment Services (PES)
Table 35 Ranking of shortage occupations (3-digit)
Rank
Top occupations in 2017 2017 2016 2015
Software and application developers 1 1 1
Sheet and structural metal workers 2 3 2
Medical doctors 3 5 2
Blacksmiths toolmakers and related trades 4 3 4
Building finishes and related trade workers 4 6 4
Building frame and related trade workers 4 3 4
Cooks 4 7 7
Engineering professionals 5 6 6
Physical and engineering science technicians 6 7 na
Electrical equipment installers and repairers 7 4 5
Heavy truck and bus drivers 7 5 4
Machinery mechanics and repairers 8 7 5
Nursing and midwifery professionals 8 6 na
Sales and purchasing agents and brokers 9 2 5
Shop salespersons 10 7 8
Electro technology engineers 10 na na
Primary school and early childhood teachers 10 na na
Domestic hotel and office cleaners and helpers 10 na na
Waiters and bartenders 10 na na
35 3-digit vs 4-digit
There are advantages and disadvantages associated with using the more aggregated 3-
digit occupation classification as it was done in previous studies The bundling of
individual occupations into families provides greater visibility of shortages at a broad
skill level (eg all software related occupations)
However there are distinct disadvantages in using the 3-digit occupations and these
apply particularly to their practical usefulness to education and training providers In
many cases shortages identified at 3-digit level do not provide a reliable basis for
identifying the specific skill which is in shortage or surplus
By combining the analyses of the 4-digit and corresponding 3-digit classifications in this
report many examples are revealed of how an exclusive reliance on the 3-digit
classification could be seriously misleading Thus the findings in this report show that
within the 3-digit classification of lsquosheet and structural metal workers moulders and
weldersrsquo the 4-digit occupation which is in short supply is lsquoweldersrsquo and not for example
lsquosheet metal workersrsquo This is an important insight because in many European countries
the skills of welding and sheet metal work are provided through entirely different
vocational programmes8
There are many examples of this phenomenon in the 3-digit occupations in Table 35 For
example the analysis in this report shows that toolmakers are a shortage occupation
8 In Ireland for example sheet metal workers and welders undertake entirely different apprenticeships
Labour shortages and surpluses 2017
2018 25
Directorate-General for Employment Social Affairs and Inclusion European Network of Public Employment Services (PES)
but blacksmiths are not Furthermore the 3-digit classification disguises the extent of the
reported shortage Thus while the 3-digit occupation of professional nursing and
midwifery is shown in the current report as being shortage occupations a total of eleven
PES reported professional nursing as a shortage compared to only three PES reporting
professional midwifery as a shortage By bundling these occupations together the
significant difference in the relative severity of the shortage is not apparent
This phenomenon applies equally to the surplus occupations which were identified in this
report For example lsquochildcare workersrsquo were described as a surplus occupation by five
PES But in the 3-digit classification they are bundled together with lsquospecial needs
teachersrsquo which was not identified as a surplus occupation
36 Conclusions
There are a number of conclusions which can be drawn from the analyses in this chapter
Firstly the sources used by many of the PES to identify shortage occupations is one of
the main reasons why only eighteen PES provided data on surplus occupations Many of
the PES relied on the results of employer surveys forecasting models and immigration
data to identify shortages and these sources in general do not provide data on surplus
occupations However it was by no means the only reason why so many PES did not
provide data on surplus organisations and this issue will have to be addressed before the
commencement of the 2018 study In the future PES data should be augmented by data
collected by other bodies as outlined in the new EU Regulation
Secondly there is no obvious explanation for the geographic distribution of shortages
and surpluses In some cases countries with relatively small labour forces have a
relatively high number of shortage occupations while a strong apprenticeship system
does not appear to prevent a relatively high share of the identified shortages being in the
craft occupations It may be that the stipulation to only include twenty shortage and
surplus occupations has created a situation where some countries with a relatively large
labour force are artificially constrained to submit a much smaller number of shortage
occupations than they actually have
Thirdly there is a high degree of stability in relation to the occupations which were
identified as shortages in the 2015 2016 and 2017 editions of the Bottleneck report
Finally providing information on shortage and surplus occupations at 4-digit level is
much more useful from a policy perspective than providing the data at a more
aggregated level The results of the analyses at 4-digit level show which specific
occupations in the bundle of occupations used in the previous reports were in shortage
and which were not This is also true of the occupations which were identified as surplus
occupations A more aggregated group of occupations does not allow for the targeting of
specific individual occupations either for increasing training provision or for enhancing
cross border mobility Indeed as a number of specific examples show were providers of
vocational training or indeed policy makers to act on the basis of the 3-digit shortage and
surplus occupations identified in previous reports they could very well have assign
resources to occupations which were neither in shortage nor in surplus
Labour shortages and surpluses 2017
2018 26
Directorate-General for Employment Social Affairs and Inclusion European Network of Public Employment Services (PES)
4 THE CAUSES OF SKILL SHORTAGES AND POTENTIAL SOLUTIONS
41 Introduction
The focus of this chapter is on identifying the possible causes of skills shortages and
surpluses and exploring ways in which these imbalances may be resolved The chapter
begins with a review of the nature of skills and labour market imbalances and concludes
with an exploration of the extent to which enhanced cross-border mobility policies and
more equal gender representation could contribute to the alleviation of skills and labour
imbalances in certain shortage occupations in the EEA labour market
42 The role of skills and labour shortages in skills imbalances
One of the new questions included in the current study asks the PES to identify the
nature of the shortage (ie is it a skill shortage or a labour shortage) in relation to each
shortage occupation they identified It was explained in the questionnaire that labour
shortages occur when there are a sufficient number of appropriately qualified job-seekers
to fill the vacancies which arise but for a variety of reasons many of them do not wish
to work in the occupation in question Their response to this question is summarised in
Table 41 in respect of the twenty occupations which were reported by the most PES
A total of twenty-six PES classified their shortage occupations as skill or labour
shortages and they classified most of the occupations as skill shortages Indeed in the
case of seven occupations plumbers doctors software developers electricians
electronic engineers electronic engineering technicians bus and tram drivers and
mechanical engineers all of the reporting PES classified the shortage as a skills deficit
Each labour market within the EEA is regulated in a particular manner and conditions of
employment even within the same occupation vary throughout the region This is why
many occupations while classified by most of the PES as reflecting skill deficits
nevertheless are classified by some PES as labour shortages
However the number of PES involved is very small indeed Only in the case of three
occupations lsquowaitersrsquo lsquoshop sales assistantsrsquo and lsquoprimary school teachersrsquo are there
more PES classifying the shortage as a labour shortage then a skills deficit The first two
occupations are undoubtedly labour shortages This is because there are few if any
barriers to working in these occupations9
The inclusion of lsquoprimary school teachersrsquo as a labour shortage is however a surprise It
was identified by eight PES as a shortage occupation two of whom classified the
occupation as a shortage of high magnitude It would be necessary to conduct research
into the conditions of employment ndash including qualification criteria ndash within the countries
where the reporting PES are located to establish if this classification of the occupation as
a labour shortage is warranted
With some notable exceptions the response of the PES to classifying their shortage
occupations as skill or labour shortages demonstrates that the PES understand these
concepts Occupations such as professional nurses which are obviously suffering from a
shortage of qualified job-seekers in the EEA are overwhelmingly categorised as a skills
shortage while less skilled occupations such as cleaners are categorised as being on the
borderline between skills and labour shortages
9 Both occupations have relatively high ratios of unemployed to new hires (Annex 4)
Labour shortages and surpluses 2017
2018 27
Directorate-General for Employment Social Affairs and Inclusion European Network of Public Employment Services (PES)
Table 41 Skill and labour shortages
Occupation
Number of PES
reporting occupation
as skills shortage
Number of PES
reporting occupation as labour shortage
Number of PES
reporting occupations as skill and
labour shortage
Total number of
PES reporting on skillslabour
shortage
Cooks 9 1 0 10
Plumbers and pipe fitters 8 0 0 8
Generalist medical Practitioners 7 0 0 7
Heavy truck and lorry drivers 4 2 1 7
Metal workers machine tool setting and operators
3 3 1 7
Welders and flame cutters 4 2 1 7
Nursing professionals 5 1 0 6
Software developers 6 0 0 6
Systems analyst 5 1 0 6
Bricklayers and related trades 4 1 0 5
Building and related electricians 5 0 0 5
Butchers fishmongers and related food 3 2 0 5
Cleaners and helpers in offices 3 2 0 5
Commercial sales representatives 2 2 1 5
Electronic engineers 5 0 0 5
Manufacturing supervisors 4 1 0 5
Motor vehicle mechanics and repairers 3 1 1 5
Nursing associate professionals 4 1 0 5
Primary school teachers 2 3 0 5
Shop sales assistants 1 4 0 5
Waiters 2 3 0 5
Agriculture and industrial machinery repairers
3 1 0 4
Application programmers 3 1 0 4
Bus and tram drivers 4 0 0 4
Electronic engineering technicians 4 0 0 4
Health care assistants 3 1 0 4
Mechanical engineers 4 0 0 4
Sheet metal workers 3 1 0 4
Structural metal preparers and erectors 3 1 0 4
Total number of PES reporting 16 8 2 26
The atypical working hours associated with heavy goods vehicle driving is recognised by
two of the six PES who classify shortages in the occupation as labour shortages while the
unpleasant conditions associated with working in butchery shops and abattoirs is
reflected in the fact that two of the five PES who categorised the occupation as a
shortage occupation classify it as a labour shortage
43 Location of skill imbalances and cross border mobility
In recent years there has been considerable discussion on the potential role which
enhanced cross-border mobility could play in alleviating labour market imbalances The
attractiveness of such a policy is obvious The European Union is a very large
Labour shortages and surpluses 2017
2018 28
Directorate-General for Employment Social Affairs and Inclusion European Network of Public Employment Services (PES)
marketplace embracing a very large labour force if even some of the shortages which
are reported by EEA countries could be resolved by exploiting the surpluses which are
reported by other EEA countries it could form the basis of a number of win-win solutions
for both job-seekers and businesses
An additional attraction of this policy is that it could potentially successfully address both
skills and labour shortages as working conditions associated with some labour shortages
in one country might be perceived as significantly more attractive in a different EEA
country
Table 44 provides a list of the top twenty shortage occupations which have at least one
PES in another EEA country reporting the occupation as a surplus
There are a number of aspects of the Table which are notable Firstly the list of top
occupations has changed quite dramatically from the list in Table 21 specifically none
of the professional and associate professional occupations are now on the list including
the four professional and associate professional health-related occupations or the two
professional software occupations What the Table shows is that there are no surpluses
reported in any of the EEA countries of doctors or nurses software developers or
systems analysts While the occupation of healthcare assistants is in surplus in many
countries it was not included in the list of top occupations because it was reported as a
shortage by only two PES
The figures in Table 42 show that there are three cross-border matching possibilities in
the case of bricklayers and motor mechanics and two possibilities in the case of
plasterers health care assistants and secondary school teachers
There is just one matching possibility in respect of a wide range of occupations including
cooks truck drivers commercial sales representatives electricians carpenters civil
engineers primary school teachers manufacturing supervisors telecentre salespersons
childhood education teachers floor layers and roofers
The fact that primary school teachers have only one cross border matching possibility
suggest that the classification of the occupation as a labour shortage by three of five PES
is an error In general labour shortages would be expected to have more cross border
matching possibilities than skill shortages because there are many job-seekers eligible to
work in the occupation in question and working conditions vary quite significantly from
country to country Indeed it is notable that the two other occupations which were
classified by the PES as predominantly labour shortages waiters and shop sales
assistants have a relatively high number of matching possibilities eight in the case of
shop sales assistants and three in the case of waiters
In general the PES did not classify the same occupation as both a shortage and a
surplus A striking exception is the Danish PES which categorised four of its shortage
occupations as surplus occupations also This is most likely due to the higher level of
granularity available in the Danish data (below 4-digit) so that some job titles within an
occupation are considered labour shortage while others skill shortage
44 Assessing gender composition of surpluses
The PES were asked to estimate the share of females in the occupations which they
identified as lsquosurplusrsquo occupations The restricting of this question to surplus occupations
was to avoid giving the impression that shortages were arising because of discriminatory
recruitment policies
Labour shortages and surpluses 2017
2018 29
Directorate-General for Employment Social Affairs and Inclusion European Network of Public Employment Services (PES)
A total of 13 PES reported any data on gender composition of surpluses However the
quality of information submitted did not provide a sufficient basis for an accurate
estimation of the gender composition of surpluses in some of the cases
It is suggested that in order to address gender imbalances in relation to shortages and
surpluses data from PES on job seekers should be combined with the LSF data on
employment by occupation
45 Conclusions
The analysis in chapter four has produced a number of interesting findings The analysis
reveals that the PES in general has the capacity to distinguish between skill and labour
shortages and to identify shortage occupations which have some cross-border matching
possibilities
The relatively low number of surplus occupations reflects two factors firstly only
eighteen PES submitted a list of surplus occupations and secondly in many cases the
lists did not include the maximum number of twenty occupations which were requested
This response has to be viewed against the background of an EEA labour market where
employment is expanding and unemployment is contracting However while this is a
positive development the relatively low number of surplus occupations has placed a
significant limit on the extent to which there were cross-border possibilities of matching
shortage with surplus occupations
The data indicates that there is a limitation to the extent to which the PES can be used to
identify the gender imbalances (eg under-representation of females in some
occupations) and that other sources should be explored
Labour shortages and surpluses 2017
2018 30
Directorate-General for Employment Social Affairs and Inclusion European Network of Public Employment Services (PES)
Table 43 The potential for cross-border matching of shortage and surplus occupations
No PES
Occupation PES reporting shortage PES reporting surplus No PES
16 Cooks AT Art BG CY DK HR IE IS IT MT NL NO PT SE SI SK lsaquo―rsaquo HU 1
11 Truck drivers ART VDAB BG DK HR LT IT NL NO PT SE SI SK lsaquo―rsaquo DK 1
10 Cleaners helpers CY DK HR FI IS HU NL NO PT SI lsaquo―rsaquo DK LF NL IE 4
10 Commercial sales VDAB ART DK FI FR IT IE PT PL SI lsaquo―rsaquo DK 1
9 Sales assistants AT ART BG CY DK IT NO SI SK lsaquo―rsaquo DK LF SE NL BG CH FI IE 8
9 Bricklayers ART DE DK HR HU LT NL PT SI lsaquo―rsaquo CY HU IE 3
9 Motor mechanics AT VDAB ART LF DK IT NO PT SI lsaquo―rsaquo SK CH EE 3
9 Waiters ART BG CY IS IT MT NO PT SI lsaquo―rsaquo HU EE IE 3
9 Electricians ART VDAB DE DK IS IT NL NO SI lsaquo―rsaquo FR 1
8 Carpenters DK HR HU FI NL NO PT SI lsaquo―rsaquo HU 1
8 Civil engineers ART CH DE FI FR NO SE SI lsaquo―rsaquo CY 1
8 Primary teachers ART BG DK IS NO SE SI SK lsaquo―rsaquo CY 1
7 Healthcare assist CY DK EE NL NO SI SK lsaquo―rsaquo DK NL 2
7 Second teacher ART BG FR NL NO SI SK lsaquo―rsaquo CY FI 2
7 Man supervisors ART VDAB LF DE EE FR SK lsaquo―rsaquo BG 1
6 Plasterers HR HU FI LT NL SI lsaquo―rsaquo HU IE 2
6 Tele centre sales ART HU FI FR MT NO lsaquo―rsaquo EE 1
6 Childhood educ FI LT NO SE SI SK lsaquo―rsaquo CY 1
6 Floor layers HU HR FI FR LT LV lsaquo―rsaquo HU 1
6 Roofers HR FI FR LT LV SI lsaquo―rsaquo HU 1
Bottlenecks Occupations 2017
2017 31
Directorate-General for Employment Social Affairs and Inclusion European Network of Public Employment Services (PES)
5 CONCLUSIONS AND RECOMMENDATIONS
51 Conclusions
The terms of reference for this study emphasise the desirability of creating a process for
the systematic collection of data on surplus and shortage occupations in the EEA area
which could be effectively used by EURES for cross border matching of shortage
occupations in some EEA countries with surplus occupations in others
The authors have responded to this emphasis by using a process which ensures that the
data gathered on shortage and surplus occupations is comprehensive accurate and of
practical use to EURES and the providers of education and training programmes The
process is comprehensive because it gathers information both on the extent of shortages
and surpluses and on their relative severity It is accurate because the list of shortage
and surplus occupations are shown to be consistent with the estimated value of the ratio
of unemployed to new hires Finally the process provides information which is of
practical use to EURES and the national providers of VET because the data gathered is on
individual occupations rather than on lsquobundles of occupationsrsquo as in previous studies The
analyses in this report shows that while these bundles of occupations contain some
occupations which are identified by the PES as shortage and surplus occupations they
also contain occupations which are neither in shortage nor in surplus and it is impossible
to distinguish one from the other
The data gathering process used in this report however was not devoid of weaknesses
Fortunately these weaknesses reflect the modus operandi of the PES and may be
rectified by including other institutions and agencies in the process For example the PES
use the same sources for the identification of both shortage and surplus occupations
This may have advantages in terms of accuracy when those sources include employersrsquo
surveys immigration data and the results of forecasting exercises However these
sources are not suitable for gathering data on surplus occupations and they are the main
reason why the number of surplus occupations provided by the PES were almost half the
number requested In the future PES data could be augmented by data gathered by
other bodies as outlined in recent EU Regulation 2016589
In addition the response to the question on the capacity of the PES to deliver data on
shortage and surplus occupations at a regional level was also disappointing perhaps
reflecting a misalignment in some EEA countries between the geographic configuration of
the local PES network and the NUTs regions
The analysis highlighted that in order to assess gender imbalances of shortages and
surpluses PES data needs to be augmented by other sources
Finally despite the low number of surplus occupations submitted by the PES it was
nevertheless possible to identify twenty shortage occupations in the EEA labour market
which had at least one cross-border matching possibility and many more than one in the
case of some shortage occupations
52 Recommendations
Based on the findings from the three bottleneck studies undertaken to date a model for
the gathering of data on shortages and surpluses is proposed (Figure 51) The model
includes features of the methodology applied in this study which were successful It also
includes a number of features which should be introduced to the process in order to
address some of the weaknesses which were identified in this study (highlighted in red)
Labour shortages and surpluses 2017
2017 32
Directorate-General for Employment Social Affairs and Inclusion European Network of Public Employment Services (PES)
However before this methodology is implemented it would be prudent to discuss data
requirements with PES and invite a broader range of institutions and agencies to
participate in aspects of the data gathering process in addition to the PES EURES
Regulation (EU) 2016589 of the European Parliament and of the Council which obliges
the appropriate national authorities to furnish such data annually is fortuitous in this
regard and should facilitate the implementation of this recommendation
In addition the results of these and other relevant studies should be disseminated to
PES Eures coordination group and other relevant agencies and institutions in order to
emphasise the importance of data and analysis in informing policy at EU and national
level which aims to resolve labour market imbalances
Labour shortages and surpluses 2017
2017 33
Directorate-General for Employment Social Affairs and Inclusion European Network of Public Employment Services (PES)
Figure 51 Model for gathering data on shortage and surplus occupations
Sources of data on surpluses PES data from other relevant agencies
In those cases where the source used by the PES to identify shortage occupations cannot
be used to identify surplus occupations other institutions or other sources or both should be availed of to ensure that comprehensive data on surplus occupations are provided to the appropriate national authority
Dimensions of shortagessurpluses extent (number of reporting PES) and severity (high or low
magnitude)
Data should be systematically gathered on both the extent of shortage and surplus
occupations in the EEA and on their relative severity
Type of shortage skill vs labour shortages
The providers of the data on shortage occupations must also distinguish between skill and labour shortages because this distinction is necessary for the accurate identification of
shortage occupations and for the choice of the appropriate policy response to identified shortages
Classification of occupations used ISCO 08 4-digit codes (or translation into these codes)
All data should be either initially gathered in ISCO 08 4-digit codes or translated into these
codes This ensures that the data refers to specific individual occupations and is of practical use to EURES and the national providers of VET
Accuracy test cross-check with LSF data (ratio of unemployed to new hires)
The accuracy of the submitted lists of shortage and surplus occupations should be assessed
by comparing the most widely reported surplus and shortage occupations with the estimated values of the ratios of employed (by previous occupation) to new hires at the aggregated EU28 level These ratios should be based on an analysis of the most up-to date
Labour Force Survey (LFS) data
Gender balance assessment LFS data on employment at occupational level by gender PES job
seekers
The gender composition of shortage and surplus occupations should be based on the most
up to date analyses of LFS data on employment by gender and the PES job seeker data
Regional balance assessment LSF data data from relevant agencies
Where regional data is required other agencies and institutions should be requested to
provide the data in those cases where the data cannot be provided by the regional PES network because it is not geographically aligned to the NUTs regions
Labour shortages and surpluses 2017
2017 34
Directorate-General for Employment Social Affairs and Inclusion European Network of Public Employment Services (PES)
Number of occupations reporting should be extended beyond 20 occupations but with upper
limit (eg 50)
Consideration should be given to allowing the agencies responsible for identifying shortage
and surplus occupations a greater range of flexibility in terms of the numbers of occupations which should be identified A minimum to maximum range would be a more realistic approach as it would reflect the fact that the labour markets of the EEA vary significantly in size and performance
Timing of imbalance assessment September
It is proposed that the data gathering exercise should be brought forward to early September and that expert advice should be available on line throughout the data
gathering exercise
Labour shortages and surpluses 2017
2017 35
Directorate-General for Employment Social Affairs and Inclusion European Network of Public Employment Services (PES)
ANNEX 1 DATA COLLECTION TEMPLATE Information sought Explanation
Occupation title (text) Type in free text a list of occupations (one row one occupation) for which shortages and surpluses exist first list occupations for which there is a shortage the list should contain a maximum of 20 occupations if your list contains less than 20 occupations please provide a brief explanation in your email response for why the number is lower than 20 second list occupations for which there is a surplus the list should contain a maximum of 20 occupations if your list contains less than 20 occupations please provide a brief explanation in your email response for why the number is lower than 20
Shortagesurplus indicator For each occupation indicate if it refers to a shortage by typing in shortage or surplus by typing in surplus to identify surplus occupations you can examine for each occupation the ratio of the number of job seekers to the number of vacancies at the end of each year for example if there are 5000 shop assistants seeking employment and there are 200 vacancies at the end of the reference period the ratio is 251 you can rank the calculated ratios and report the occupations associated with the 20 highest ratios
Occupational classification used in your country
For each occupation indicate what occupational classification (if any) was used to identify this occupation for instance you can report a country specific classification ISCO ROME SOC etc If you donrsquot use occupational classifications type None
Occupation code to the lowest level of disaggregation (eg ISCO at 4 digits)
If you have indicated a classification used type the code for each occupation use the lowest level of disaggregation (eg 4 digit ISCO code) if you donrsquot use occupational classification leave black
ISCO-08 code at 4-digit level (or lower if 4-digit not available)
If you use occupational classification which is not ISCO-08 and if it is possible provide a translation of the national code to ISCO-08 code ISCO is the International Standard Classification of Occupations which is used to report to Eurostat code should be at 4 digits if this is not available than the lowest level of disaggregation that is available should be reported (3 digits if 4-digit code is not available 2 digits if neither 4-digit nor 3-digit code is available 1 digit if neither 4-digit 3-digit nor 2-digit code is available) if it is not possible to provide translation to ISCO-08 leave black if you have already reported ISCO-08 code in column 3 leave this column black
Estimate of shortagesurplus magnitude (high (gt3 of employment) medium (1-3 of employment) low (lt1 of employment))
For each occupation indicate a broad estimate of the magnitude of the shortagesurplus if you estimate that the shortagesurplus is less than 1 of the total employment in the occupation in question type low if between 1-3 type medium if greater than 3 type high if you cannot provide a rough estimate of magnitude type dont know
Current shortagesurplus (C) future short term (FST) future medium term (FMT) future long term (FLT) donrsquot know (indicate all that apply)
Against each occupation indicate if the identified shortagesurplus refers to present situation by typing C if the shortage is expected to occur in the short term future ie within 12 months by typing FST if it is expected to occur over the medium term (within 1-5 years) by typing FMT if it is expected to occur in the long term (in 5 or more years) by typing FLT if more than one time period applies indicate all relevant ones (eg for current shortagessurpluses that are expected to persist over the short term type C FST) if you dont know type dont know
Source of information on shortagessurpluses (eg PES administrative data (vacancies job seekers) PES survey third party survey Occupational forecasts other (specify) etc)
Indicate the source used to identify shortagesurplus for this occupation did you derive it from the PES administrative data on PES vacancies andor job seekers did you conduct a survey did you commission a third party to conduct a survey for you did you have occupational forecasts available did you use other research type in free text the full description of the source(s) eg National Employment Survey conducted by PES etc
Labour shortages and surpluses 2017
2017 36
Directorate-General for Employment Social Affairs and Inclusion European Network of Public Employment Services (PES)
Date for source of information Indicate the year that the information on shortagessurpluses (column 7) refers to eg type 2016 for a survey of difficult to fill vacancies conducted in 2016 even if the report was published in 2017
What indicator(s) suggested that there is a shortagesurplus
Indicate what criteria was used to conclude that this occupation is associated with a shortagesurplus for instance employers views sourcing from abroad to fill vacancies growth in employment faster than growth in educationtraining output time required to fill
vacancies higher than average etc
Share of females among job seekers in this occupation (surplus occupations only)
Indicate the percentage share of females among all job seekers in this occupation this is only applicable to surplus occupations
Skill or labour shortage Indicate if a shortage refers to a skill or labour shortage a skill shortage occurs where there is an insufficient supply of persons with the appropriate skills labour shortages occur where there is a sufficient number of skilled persons however an insufficient number of them is willing to take up employment in the occupation in question
Indicate the availability of data on shortagessurpluses at regional level (NUTS1 NUTS2 NUTS3 No data)
Indicate if data is available on the regional breakdown of shortagessurpluses by indicating the level of regional data available if multiple levels of regional disaggregation are available indicate the lowest level of disaggregation (eg NUTS3 rather than NUTS2) if there is no regional data available use no data
Labour shortages and surpluses 2017
2017 37
Directorate-General for Employment Social Affairs and Inclusion European Network of Public Employment Services (PES)
ANNEX 2 SHORTAGE OCCUPATIONS
Shortage occupation PES count
Cooks 16 Plumbers and pipe fitters 13 Generalist medical practitioners 12 Welders and flamecutters 12 Heavy truck and lorry drivers 11 Metal working machine tool setters and operators 11 Nursing professionals 11 Software developers 11 Agricultural and industrial machinery mechanics and repairers 10 Cleaners and helpers in offices hotels and other establishments 10 Commercial sales representatives 10 Specialist medical practitioners 10 Systems analysts 10 Bricklayers and related workers 9 Building and related electricians 9 Butchers fishmongers and related food preparers 9 Motor vehicle mechanics and repairers 9 Nursing associate professionals 9 Sheet-metal workers 9 Shop sales assistants 9 Waiters 9 Carpenters and joiners 8 Civil engineers 8 Concrete placers concrete finishers and related workers 8 Electrical engineering technicians 8 Electronics engineering technicians 8 Mechanical engineers 8 Primary school teachers 8 Structural-metal preparers and erectors 8 Electronics engineers 7
Health care assistants 7 Manufacturing supervisors 7 Mechanical engineering technicians 7 Secondary education teachers 7 Accountants 6 Applications programmers 6 Bus and tram drivers 6 Contact centre salespersons 6 Early childhood educators 6 Electrical mechanics and fitters 6 Floor layers and tile setters 6 Plasterers 6 Roofers 6 Sewing machine operators 6 Software and applications developers and analysts not elsewhere classified 6 Toolmakers and related workers 6 Web and multimedia developers 6 Air conditioning and refrigeration mechanics 5 Building frame and related trades workers not elsewhere classified 5 Chefs 5 Civil engineering labourers 5 Construction supervisors 5 Earthmoving and related plant operators 5 Electrical engineers 5 Electrical line installers and repairers 5 Engineering professionals not elsewhere classified 5 Hairdressers 5 Information and communications technology operations technicians 5 Manufacturing managers 5 Physiotherapists 5 Real estate agents and property managers 5 Research and development managers 5 Spray painters and varnishers 5 Accounting associate professionals 4 Bakers pastry-cooks and confectionery makers 4
Labour shortages and surpluses 2017
2017 38
Directorate-General for Employment Social Affairs and Inclusion European Network of Public Employment Services (PES)
Shortage occupation PES count
Blacksmiths hammersmiths and forging press workers 4 Civil engineering technicians 4 Crane hoist and related plant operators 4 Database designers and administrators 4 Industrial and production engineers 4 Painters and related workers 4 Physical and engineering science technicians not elsewhere classified 4 Plastic products machine operators 4 Social work and counselling professionals 4 Accounting and bookkeeping clerks 3 Administrative and executive secretaries 3 Ambulance workers 3 Building construction labourers 3 Car taxi and van drivers 3 Cartographers and surveyors 3 Cleaning and housekeeping supervisors in offices hotels and other establishments 3 Contact centre information clerks 3 Draughtspersons 3 Fast food preparers 3 Freight handlers 3 Gardeners horticultural and nursery growers 3 Home-based personal care workers 3 Hotel receptionists 3 Information and communications technology installers and servicers 3 Insulation workers 3 Kitchen helpers 3 Manufacturing labourers not elsewhere classified 3 Medical imaging and therapeutic equipment technicians 3 Metal moulders and coremakers 3 Metal polishers wheel grinders and tool sharpeners 3 Midwifery professionals 3 Other language teachers 3 Personal services workers not elsewhere classified 3
Pharmacists 3 Policy administration professionals 3 Printers 3 Process control technicians not elsewhere classified 3 Sales and marketing managers 3 Shop supervisors 3 Special needs teachers 3 Stock clerks 3 Supply distribution and related managers 3 Survey and market research interviewers 3 Systems administrators 3 Technical and medical sales professionals (excluding ICT) 3 Translators interpreters and other linguists 3 Transport clerks 3 Vocational education teachers 3 Advertising and marketing professionals 2 Audiologists and speech therapists 2 Bartenders 2 Beauticians and related workers 2 Cashiers and ticket clerks 2 Chemical engineers 2 Child care workers 2 Computer network and systems technicians 2 Computer network professionals 2 Construction managers 2 Craft and related workers not elsewhere classified 2 Credit and loans officers 2 Crop farm labourers 2 Database and network professionals not elsewhere classified 2 Dentists 2 Domestic cleaners and helpers 2 Door to door salespersons 2 Driving instructors 2 Electrical and electronic equipment assemblers 2 Electronics mechanics and servicers 2 Elementary workers not elsewhere classified 2 Employment agents and contractors 2
Labour shortages and surpluses 2017
2017 39
Directorate-General for Employment Social Affairs and Inclusion European Network of Public Employment Services (PES)
Shortage occupation PES count
Field crop and vegetable growers 2 Financial analysts 2 Financial and investment advisers 2 Forestry and related workers 2 Garbage and recycling collectors 2 General office clerks 2 Graphic and multimedia designers 2 Information and communications technology service managers 2 Insurance representatives 2 Locomotive engine drivers 2 Mail carriers and sorting clerks 2 Management and organization analysts 2 Mathematicians actuaries and statisticians 2 Mechanical machinery assemblers 2 Medical and dental prosthetic technicians 2 Medical assistants 2 Messengers package deliverers and luggage porters 2 Metal finishing plating and coating machine operators 2 Metal processing plant operators 2 Optometrists and ophthalmic opticians 2 Personal care workers in health services not elsewhere classified 2 Police officers 2 Policy and planning managers 2 Production clerks 2 Restaurant managers 2 Retail and wholesale trade managers 2 Sales workers not elsewhere classified 2 Sewing embroidery and related workers 2 Street food salespersons 2 Tailors dressmakers furriers and hatters 2 Telecommunications engineers 2 Advertising and public relations managers 1 Aged care services managers 1
Agricultural technicians 1 Aircraft engine mechanics and repairers 1 Aircraft pilots and related associate professionals 1 Assemblers not elsewhere classified 1 Authors and related writers 1 Bank tellers and related clerks 1 Bleaching dyeing and fabric cleaning machine operators 1 Bookmakers croupiers and related gaming workers 1 Business services agents not elsewhere classified 1 Buyers 1 Cabinet-makers and related workers 1 Cement stone and other mineral products machine operators 1 Chemical and physical science technicians 1 Chemical engineering technicians 1 Chemical processing plant controllers 1 Chemical products plant and machine operators 1 Chemists 1 Conference and event planners 1 Customs and border inspectors 1 Data entry clerks 1 Dental assistants and therapists 1 Dieticians and nutritionists 1 Dispensing opticians 1 Domestic housekeepers 1 Economists 1 Education methods specialists 1 Environmental and occupational health and hygiene professionals 1 Environmental and occupational health inspectors and associates 1 Fibre preparing spinning and winding machine operators 1 Finance managers 1 Financial and insurance services branch managers 1 Fire-fighters 1 Fitness and recreation instructors and program leaders 1 Food and beverage tasters and graders 1 Food and related products machine operators 1
Labour shortages and surpluses 2017
2017 40
Directorate-General for Employment Social Affairs and Inclusion European Network of Public Employment Services (PES)
Shortage occupation PES count
Food service counter attendants 1 Forestry labourers 1 Fruit vegetable and related preservers 1 Fur and leather preparing machine operators 1 Glass and ceramics plant operators 1 Hand launderers and pressers 1 Hand packers 1 Handicraft workers in textile leather and related materials 1 Health associate professionals not elsewhere classified 1 Health professionals not elsewhere classified 1 House builders 1 Human resource managers 1 Incinerator and water treatment plant operators 1 Information and communications technology user support technicians 1 Judges 1 Lawyers 1 Legal and related associate professionals 1 Legal professionals not elsewhere classified 1 Library clerks 1 Lifting truck operators 1 Livestock and dairy producers 1 Livestock farm labourers 1 Medical and pathology laboratory technicians 1 Medical secretaries 1 Metal production process controllers 1 Mining and quarrying labourers 1 Mining engineers metallurgists and related professionals 1 Mixed crop and animal producers 1 Mixed crop growers 1 Motorcycle drivers 1 Odd job persons 1 Other cleaning workers 1 Other music teachers 1
Paper products machine operators 1 Personnel and careers professionals 1 Personnel clerks 1 Pet groomers and animal care workers 1 Physicists and astronomers 1 Physiotherapy technicians and assistants 1 Potters and related workers 1 Power production plant operators 1 Prison guards 1 Product and garment designers 1 Psychologists 1 Pulp and papermaking plant operators 1 Railway brake signal and switch operators 1 Receptionists (general) 1 Refuse sorters 1 Riggers and cable splicers 1 Scribes and related workers 1 Secretaries (general) 1 Securities and finance dealers and brokers 1 Security guards 1 Senior government officials 1 Senior officials of special-interest organizations 1 Shelf fillers 1 Ships engineers 1 Shoemaking and related machine operators 1 Social work associate professionals 1 Stall and market salespersons 1 Stationary plant and machine operators not elsewhere classified 1 Stonemasons stone cutters splitters and carvers 1 Street and related service workers 1 Sweepers and related labourers 1 Teaching professionals not elsewhere classified 1 Telecommunications engineering technicians 1 Textile fur and leather products machine operators not elsewhere classified 1 Trade brokers 1 Travel attendants and travel stewards 1 Travel guides 1
Labour shortages and surpluses 2017
2017 41
Directorate-General for Employment Social Affairs and Inclusion European Network of Public Employment Services (PES)
Shortage occupation PES count
Tree and shrub crop growers 1 Underwater divers 1 University and higher education teachers 1 Vehicle cleaners 1 Veterinarians 1 Weaving and knitting machine operators 1 Web technicians 1 Wood processing plant operators 1 Woodworking-machine tool setters and operators 1
Labour shortages and surpluses 2017
2017 42
Directorate-General for Employment Social Affairs and Inclusion European Network of Public Employment Services (PES)
ANNEX 3 SURPLUS OCCUPATIONS
Surplus occupation PES count
General office clerks 8 Shop sales assistants 8 Advertising and marketing professionals 6 Bank tellers and related clerks 6 Sociologists anthropologists and related professionals 6 Child care workers 5 Hairdressers 5 Journalists 5 Cashiers and ticket clerks 4 Cleaners and helpers in offices hotels and other establishments 4 Hand packers 4 Mail carriers and sorting clerks 4 Photographers 4 Receptionists (general) 4 Tailors dressmakers furriers and hatters 4 Accounting and bookkeeping clerks 3 Administrative and executive secretaries 3 Beauticians and related workers 3 Biologists botanists zoologists and related professionals 3 Bricklayers and related workers 3 Broadcasting and audio-visual technicians 3 Civil engineering labourers 3 Economists 3 Gardeners horticultural and nursery growers 3 Interior designers and decorators 3 Kitchen helpers 3 Legal professionals not elsewhere classified 3 Manufacturing labourers not elsewhere classified 3 Motor vehicle mechanics and repairers 3
Musicians singers and composers 3 Other artistic and cultural associate professionals 3 Painters and related workers 3 Philosophers historians and political scientists 3 Security guards 3 Sweepers and related labourers 3 Travel consultants and clerks 3 Waiters 3 Actors 2 Archivists and curators 2 Bakers pastry-cooks and confectionery makers 2 Bartenders 2 Building construction labourers 2 Business services and administration managers not elsewhere classified 2 Cabinet-makers and related workers 2 Car taxi and van drivers 2 Chemists 2 Cleaning and housekeeping supervisors in offices hotels and other establishments 2 Credit and loans officers 2 Customs and border inspectors 2 Elementary workers not elsewhere classified 2 Film stage and related directors and producers 2 Financial analysts 2 Forestry and related workers 2 Freight handlers 2 Graphic and multimedia designers 2 Health care assistants 2 Hotel receptionists 2 Lawyers 2 Legal and related associate professionals 2 Library clerks 2 Livestock and dairy producers 2 Management and organization analysts 2 Messengers package deliverers and luggage porters 2 Odd job persons 2 Office supervisors 2 Plasterers 2
Labour shortages and surpluses 2017
2017 43
Directorate-General for Employment Social Affairs and Inclusion European Network of Public Employment Services (PES)
Surplus occupation PES count
Police officers 2 Pre-press technicians 2 Print finishing and binding workers 2 Printers 2 Prison guards 2 Product and garment designers 2 Psychologists 2 Public relations professionals 2 Religious professionals 2 Secondary education teachers 2 Secretaries (general) 2 Social work and counselling professionals 2 Stall and market salespersons 2 Stock clerks 2 Teachers aides 2 Telephone switchboard operators 2 Travel guides 2 Visual artists 2 Advertising and public relations managers 1 Agricultural technicians 1 Announcers on radio television and other media 1 Assemblers not elsewhere classified 1 Building and related electricians 1 Building architects 1 Building caretakers 1 Building frame and related trades workers not elsewhere classified 1 Business services agents not elsewhere classified 1 Buyers 1 Carpenters and joiners 1 Chemical engineers 1 Civil engineers 1 Clearing and forwarding agents 1 Clerical support workers not elsewhere classified 1
Commercial sales representatives 1 Conference and event planners 1 Contact centre information clerks 1 Contact centre salespersons 1 Cooks 1 Crane hoist and related plant operators 1 Creative and performing artists not elsewhere classified 1 Dancers and choreographers 1 Data entry clerks 1 Database designers and administrators 1 Domestic cleaners and helpers 1 Domestic housekeepers 1 Draughtspersons 1 Driving instructors 1 Early childhood educators 1 Electronics mechanics and servicers 1 Farming forestry and fisheries advisers 1 Fashion and other models 1 Fast food preparers 1 Field crop and vegetable growers 1 Filing and copying clerks 1 Finance managers 1 Financial and insurance services branch managers 1 Financial and investment advisers 1 Fire-fighters 1 Fitness and recreation instructors and program leaders 1 Floor layers and tile setters 1 Food service counter attendants 1 Fruit vegetable and related preservers 1 Gallery museum and library technicians 1 Garbage and recycling collectors 1 Garment and related pattern-makers and cutters 1 Glass and ceramics plant operators 1 Government tax and excise officials 1 Hand launderers and pressers 1
Labour shortages and surpluses 2017
2017 44
Directorate-General for Employment Social Affairs and Inclusion European Network of Public Employment Services (PES)
Surplus occupation PES count
Heavy truck and lorry drivers 1 House builders 1 Hunters and trappers 1 Information and communications technology installers and servicers 1 Information and communications technology user support technicians 1 Insurance representatives 1 Jewellery and precious-metal workers 1 Judges 1 Legal secretaries 1 Librarians and related information professionals 1 Life science technicians (excluding medical) 1 Lifting truck operators 1 Managing directors and chief executives 1 Manufacturing supervisors 1 Medical and dental prosthetic technicians 1 Metal moulders and coremakers 1 Mining and quarrying labourers 1 Mixed crop and animal producers 1 Mixed crop growers 1 Mobile farm and forestry plant operators 1 Musical instrument makers and tuners 1 Other language teachers 1 Pawnbrokers and money-lenders 1 Personnel and careers professionals 1 Pet groomers and animal care workers 1 Photographic products machine operators 1 Physical and engineering science technicians not elsewhere classified 1 Physicists and astronomers 1 Police inspectors and detectives 1 Precision-instrument makers and repairers 1 Primary school teachers 1 Process control technicians not elsewhere classified 1 Product graders and testers (excluding foods and beverages) 1
Production clerks 1 Professional services managers not elsewhere classified 1 Protective services workers not elsewhere classified 1 Research and development managers 1 Retail and wholesale trade managers 1 Roofers 1 Sales workers not elsewhere classified 1 Senior government officials 1 Service station attendants 1 Shelf fillers 1 Shop supervisors 1 Social work associate professionals 1 Special needs teachers 1 Spray painters and varnishers 1 Statistical mathematical and related associate professionals 1 Stonemasons stone cutters splitters and carvers 1 Street food salespersons 1 Supply distribution and related managers 1 Teaching professionals not elsewhere classified 1 Technical and medical sales professionals (excluding ICT) 1 Training and staff development professionals 1 Translators interpreters and other linguists 1 Transport conductors 1 Tree and shrub crop growers 1 Typists and word processing operators 1 Undertakers and embalmers 1 Vocational education teachers 1 Weaving and knitting machine operators 1 Woodworking-machine tool setters and operators 1
Labour shortages and surpluses 2017
2017 45
Directorate-General for Employment Social Affairs and Inclusion European Network of Public Employment Services (PES)
ANNEX 4 THE RATIO OF UNEMPLOYED TO NEW HIRES
ISCO-08 title
2015
UE
Recruited in the
last year (lt12
months)
Ratio of UE to new recruits
Street and related service workers 85 104 08 Agricultural forestry and fishery labourers 3913 5343 07 Mining and construction labourers 1937 3525 05 Creative and performing artists 610 1115 05 Refuse workers 1036 1923 05 Painters building structure cleaners and related trades workers 1116 2117 05 Street and market salespersons 195 389 05 Building frame and related trades workers 3632 7353 05 Mining manufacturing and construction supervisors 626 1315 05 Ships deck crews and related workers 53 114 05 Market gardeners and crop growers 1471 3207 05 Managing directors and chief executives 304 667 05 Travel attendants conductors and guides 229 538 04 Wood treaters cabinet-makers and related trades workers 491 1159 04 Manufacturing labourers 1640 3909 04 Domestic hotel and office cleaners and helpers 5679 13545 04 Other stationary plant and machine operators 822 1961 04 Mobile plant operators 1038 2497 04 Building finishers and related trades workers 1519 3680 04 Textile fur and leather products machine operators 431 1048 04 Garment and related trades workers 422 1047 04 Chemical and photographic products plant and machine operators 157 389 04 Food processing and related trades workers 930 2330 04 Vehicle window laundry and other hand cleaning workers 291 754 04 Sheet and structural metal workers moulders and welders and related workers
996 2603 04
Waiters and bartenders 4399 11595 04 Cooks 1529 4039 04 Metal processing and finishing plant operators 208 557 04 Printing trades workers 203 548 04 Forestry and related workers 130 351 04 Protective services workers 1347 3658 04 Transport and storage labourers 2532 6939 04 Fishery workers hunters and trappers 46 128 04 Material-recording and transport clerks 1671 4630 04 Process control technicians 179 517 03 Mining and mineral processing plant operators 94 274 03 Telecommunications and broadcasting technicians 177 519 03 Blacksmiths toolmakers and related trades workers 816 2409 03 Building and housekeeping supervisors 678 2045 03
Secretaries (general) 1072 3259 03 Assemblers 850 2586 03 Other craft and related workers 258 810 03 Shop salespersons 6600 21042 03 Electrical equipment installers and repairers 958 3060 03 Food and related products machine operators 437 1400 03 Other sales workers 1087 3510 03 Food preparation assistants 1646 5337 03 Mixed crop and animal producers 387 1260 03 Car van and motorcycle drivers 1155 3764 03 Client information workers 1993 6531 03 Sports and fitness workers 605 1984 03 Handicraft workers 194 638 03 Life science technicians and related associate professionals 82 271 03 Keyboard operators 283 940 03 Electronics and telecommunications installers and repairers 290 963 03 Other personal services workers 313 1047 03 Vocational education teachers 279 940 03 Other teaching professionals 744 2518 03 General office clerks 966 3272 03 Authors journalists and linguists 335 1135 03 Hairdressers beauticians and related workers 806 2796 03
Labour shortages and surpluses 2017
2017 46
Directorate-General for Employment Social Affairs and Inclusion European Network of Public Employment Services (PES)
ISCO-08 title
2015
UE
Recruited in the
last year (lt12
months)
Ratio of UE to new recruits
Animal producers 189 660 03 Other elementary workers 976 3401 03 Machinery mechanics and repairers 1134 3962 03 Ship and aircraft controllers and technicians 80 281 03 Hotel and restaurant managers 344 1220 03 Cashiers and ticket clerks 908 3220 03 Retail and wholesale trade managers 224 809 03 Sales marketing and development managers 311 1124 03 Physical and engineering science technicians 1204 4366 03 Administrative and specialised secretaries 1106 4040 03 Sales and purchasing agents and brokers 1294 4754 03 Rubber plastic and paper products machine operators 256 941 03 Artistic cultural and culinary associate professionals 511 1906 03 Numerical clerks 944 3532 03 Other services managers 184 691 03 Child care workers and teachers aides 1335 5005 03 Heavy truck and bus drivers 1426 5349 03 Business services and administration managers 383 1439 03 Information and communications technology service managers 67 257 03 Regulatory government associate professionals 209 807 03 Life science professionals 176 681 03 Wood processing and papermaking plant operators 97 379 03 Locomotive engine drivers and related workers 46 179 03 Legal professionals 315 1245 03 Personal care workers in health services 2195 8787 02 Physical and earth science professionals 85 345 02 Street vendors (excluding food) 50 204 02 Architects planners surveyors and designers 515 2092 02 Other clerical support workers 901 3657 02 Business services agents 510 2114 02 Manufacturing mining construction and distribution managers 361 1507 02 Tellers money collectors and related clerks 381 1612 02 Librarians archivists and curators 58 248 02 Medical and pharmaceutical technicians 255 1099 02 University and higher education teachers 301 1333 02 Information and communications technology operations and user support technicians
418 1888 02
Legal social and religious associate professionals 920 4348 02 Financial and mathematical associate professionals 601 2852 02 Sales marketing and public relations professionals 865 4172 02 Finance professionals 472 2281 02 Engineering professionals (excluding electrotechnology) 635 3118 02 Other health associate professionals 531 2657 02
Social and religious professionals 460 2317 02 Professional services managers 176 891 02 Nursing and midwifery associate professionals 556 2855 02 Legislators and senior officials 53 286 02 Database and network professionals 83 455 02 Administration professionals 641 3673 02 Primary school and early childhood teachers 575 3345 02 Electrotechnology engineers 142 827 02 Secondary education teachers 471 2812 02 Other health professionals 346 2083 02 Nursing and midwifery professionals 273 1760 02 Software and applications developers and analysts 631 4159 02 Medical doctors 293 1944 02 No occupation 152894 00
No answer 2531 578 44 Total 249561 294937 08
Labour shortages and surpluses 2017
2017 47
Directorate-General for Employment Social Affairs and Inclusion European Network of Public Employment Services (PES)
HOW TO OBTAIN EU PUBLICATIONS
Free publications
bull one copy
via EU Bookshop (httpbookshopeuropaeu)
bull more than one copy or postersmaps
from the European Unionrsquos representations (httpeceuropaeurepresent_enhtm)
from the delegations in non-EU countries
(httpeeaseuropaeudelegationsindex_enhtm)
by contacting the Europe Direct service (httpeuropaeueuropedirectindex_enhtm)
or calling 00 800 6 7 8 9 10 11 (free phone number from anywhere in the EU) () () The information given is free as are most calls (though some operators phone boxes or hotels may charge you)
Priced publications
bull via EU Bookshop (httpbookshopeuropaeu)
Priced subscriptions
bull via one of the sales agents of the Publications Office of the European Union
(httppublicationseuropaeuothersagentsindex_enhtm)
doi 10276731262
KE-0
1-1
8-2
63-E
N-N
[Ca
talo
gu
e n
um
be
r]
Labour shortages and surpluses 2017
2018 18
Directorate-General for Employment Social Affairs and Inclusion European Network of Public Employment Services (PES)
The only exceptions are the occupations of lsquocleanersrsquo lsquowaitersrsquo and lsquoshop sales
assistantsrsquo However this result is understandable as these occupations were classified
by the PES4 as labour shortages rather than skill shortages and consequently the
relatively high ratio could reflect the fact that there are a significant number of
unemployed available to work in these occupations
210 Conclusions
There are a number of significant conclusions which may be drawn from the analyses of
shortage and surplus occupations in this chapter
Firstly the widespread concern that using data from the PES may produce a significant
bias in the list of shortages and surpluses because the PES attract less vacancies and
job-seekers from higher skilled occupations appears to be unfounded Ironically the
professional occupations were the most frequently reported occupations in both the list of
shortages and surpluses
Secondly there is a distinct difference in the type of competences and qualifications
identified by the PES as shortages and surplus occupations and this difference was
evident throughout the different occupation groups In general the shortage occupations
embodied technical skills whether in health-related software-related or engineeringndash
related occupations at professional technical and craft levels
In sharp contrast the surplus occupations embodied selling service and clerical skills
cultural and artistic skills and competencies in the humanities
Finally the type of occupations which the PES associated with shortages and surpluses
are highly plausible In general the shortage occupations have a low ratio of unemployed
to new hires while the surplus occupations have a high ratio This consistency extended
to the occupations which the PES identified as labour shortages which exhibited a high
ratio
The classification of skill and labour shortages is one of the issues discussed in the next
chapter
4 While this is true when all three occupations are aggregated only two of five PES categorised lsquocleanersrsquo as a labour shortage ndash see chapter 3
Labour shortages and surpluses 2017
2018 19
Directorate-General for Employment Social Affairs and Inclusion European Network of Public Employment Services (PES)
3 PROFILE OF SHORTAGES AND SURPLUSES IN SPACE AND TIME
31 Introduction
In this chapter we analyse the occupations which have been identified by the European
PES as shortage and surplus occupations from the perspective of space and time We
review the geographical distribution of these occupations to ascertain if this distribution
provides an insight into what may have given rise to these shortages and surplus
occupations and we also examine the extent to which the same shortage and surplus
occupations have persisted over time using the findings from previous studies
32 PES methods used for identifying shortages and surpluses
In the previous chapter it was noted that only eighteen of twenty-eight PES submitted a
list of surplus occupations A review of the methods used by the PES to identify shortage
occupations may provide an insight into why ten PES did not provide any data on surplus
occupations
A summary of the methods used to identify shortage occupations is provided in Table 31
below The data indicates that exactly ten PES did not use any administrative data in
identifying their shortage occupations but rather used other sources such as employer
surveys national forecasting studies or immigration data It is tempting to conclude that
this is the reason why only 18 out of 28 PES provided data on surplus occupations as
these methodologies are not generally associated with the provision of information on
occupations which are in surplus
However such a conclusion would not be entirely accurate The analyses found that the
use of survey data did not necessarily preclude a PES from identifying surplus
occupations The Danish PES for example used the results of their Labour Market Balance
Survey and was able to provide a comprehensive list of surplus occupations In contrast
the Italian and Norwegian PES who relied on national forecasts and surveys respectively
were unable to provide such a list
Furthermore not all of the PES who based their identification of shortages on their
administrative data systems provided a list of surplus occupations Those who did
generally used the ratio of job-seekers to vacancies to identify whether an occupation
was a shortage or surplus occupation But a number of PES such as the German and
Luxemburg PES and the Belgium regional PES Actiris while basing their identification of
shortage and surplus occupations on administrative data used quite sophisticated
techniques such as the share of vacancies filled and the duration of vacancy filling Unlike
the ratio of job-seekers to vacancies such techniques do not readily provide an indicator
for identifying an occupation as a surplus occupation5
5 While it is reasonable to classify an occupation as a shortage occupation if the filling of vacant posts in that occupation takes on average an exceptionally long time identifying surplus occupations is somewhat more problematic using this method
Labour shortages and surpluses 2017
2018 20
Directorate-General for Employment Social Affairs and Inclusion European Network of Public Employment Services (PES)
Table 31 Methods used by the PES to identify shortage occupations
PES methods for identifying shortages and surpluses Number of PES
Combination of administrative data PES surveys and expert opinion
1
Combination of administrative data PES surveys and 3rd party data
1
Combination of administrative data and PES surveys 7
Combination of administrative data and 3rd party data 1
Combination of administrative data and expert opinion 2
PES work permit data only 2
PES administrative data only 6
PES survey data only 2
PES warehousing data only 1
3rd party surveys and forecasts 5
Total 28
The fact that only eighteen PES provided a list of surplus occupations is a serious
weakness of this study because it places a limit on the potential of the analyses to
identify cross border matching opportunities between shortage and surplus occupations
Consequently in the future every effort should be made to significantly increase the
number of PES providing a list of surplus occupations even if this means that a
significant number of PES use alternative methodologies to identify shortage and surplus
occupations rather than a single methodology to do both as has occurred in both the
2016 study and the current study6
33 Geographic distribution of shortages and surpluses
The 28 PES who submitted data on shortages cover a very wide geographic area which
include labour markets with very different characteristics It may be informative
therefore to assess the extent to which the distribution of shortage occupations differed
between different countries
Table 32 below shows the number of reported shortage occupations within their broad
occupation group and the PES who reported the occupation as a shortage7
While each PES was requested to submit a maximum of twenty shortage occupations a
total of ten PES provided more than that and in the case of the Slovenian French and the
regional Belgian PES Actiris significantly more
A total of six PES identified less than twenty shortage occupations but in most cases the
difference was negligible
The Croatian and Portuguese PES were the only PES which did not identify any
professional occupation in their list of shortage occupations This may reflect the type of
vacancies which are notified by employers to these PES because both these PES use
their own administrative data systems exclusively to identify shortage occupations
6 In the 2016 study while 26 PES provided data on shortage occupations 13 provided data on surplus
occupations 7 Three groups are excluded from the Table managers (43) skilled agricultural (13) and armed forces (1) as the figures are quite small
Labour shortages and surpluses 2017
2018 21
Directorate-General for Employment Social Affairs and Inclusion European Network of Public Employment Services (PES)
Table 32 Shortages number of mentions (4-digit) in broad occupation (1-digit)
PES Professional Technical Clerical Craft Service Plant Elementary Total
Austria 4 11 1 12 2 0 0 30
Actiris 28 22 6 11 13 2 0 82
Le Forem 6 6 0 6 0 0 0 18
VDAB 4 7 1 4 1 3 0 20
Bulgaria 7 0 0 4 5 3 2 21
Croatia 0 1 0 13 1 3 2 20
Cyprus 6 1 2 5 5 1 6 26
Denmark 5 1 0 7 3 2 1 19
Estonia 10 7 0 0 2 1 0 20
Finland 12 5 1 7 2 2 3 32
France 18 27 2 27 1 26 2 103
Germany 16 19 0 10 2 1 1 49
Hungary 2 6 6 8 14 3 12 51
Iceland 6 3 0 5 2 1 3 20
Ireland 13 2 0 4 1 1 0 21
Italy 2 2 1 7 4 1 3 20
Latvia 7 1 1 9 0 0 0 18
Lithuania 1 2 0 15 0 2 0 20
Luxemburg 8 4 0 0 0 0 0 12
Malta 5 3 3 4 6 1 4 26
Netherlands 20 11 3 23 2 1 0 60
Norway 13 3 0 10 10 4 1 41
Poland 10 6 2 2 3 3 4 30
Portugal 0 1 0 8 3 3 0 15
Slovakia 6 6 2 5 5 2 0 26
Slovenia 23 13 3 30 11 13 9 102
Sweden 15 2 0 1 2 0 0 20
Switzerland 14 4 0 0 0 0 0 18
Total 261 176 34 237 100 79 53 940
The stipulation to only provide a list of twenty shortage occupations may have prevented
any pattern from emerging in the figures For example there does not appear to be any
relationship between the numbers of employed and unemployed in a specific labour
market and the number of shortage occupations identified by its national PES
The two PES who submitted the highest volumes of shortage occupations - the French
and Slovenian PES - vary greatly in terms of the relative size of their labour force while
for example the Norwegian PES submitted significantly more shortage occupations than
much larger countries such as Germany and Poland
As a way of controlling for the variation in the total number of shortage occupations it
may be useful to compare the variation within the list of shortage occupations identified
by each PES However no obvious patterns emerge when a number of hypotheses are
tested using this approach For example there appears to be no relationship between
countries which are associated with strong apprenticeship systems such as Germany
Austria Denmark and Switzerland and their share of shortages among the craft group of
occupations The Swiss PES does not contain any craft occupations in its list of shortage
occupations while the craft group of occupations contain the most shortage occupations
in the lists provided by both the Austrian and Danish PES In the case of the German
PES the share of craft occupations is a little above the average
Labour shortages and surpluses 2017
2018 22
Directorate-General for Employment Social Affairs and Inclusion European Network of Public Employment Services (PES)
Table 33 Surpluses number of mentions (4-digit) in broad occupation (1-digit)
PES Professional Technical Clerical Craft Service Plant Elementary Total
Le Forem 2 1 1 1 6 0 8 19
Bulgaria 6 3 2 0 4 0 2 17
Switzerland 0 4 2 4 1 2 3 16
Cyprus 5 0 0 2 0 0 3 10
Denmark 3 2 3 0 6 1 4 19
Estonia 6 2 3 2 6 0 1 20
Finland 16 7 6 10 3 1 0 43
France 10 10 1 2 5 1 0 29
Croatia 4 0 0 0 0 0 0 4
Hungary 6 9 3 16 15 1 2 52
Ireland 1 1 4 3 5 1 7 22
Iceland 11 1 2 2 1 0 1 18
Lithuania 0 3 1 0 2 2 0 8
Latvia 4 4 0 0 3 1 3 15
Netherlands 3 2 9 0 9 0 1 24
Poland 0 0 0 0 1 0 0 1
Sweden 4 3 7 1 3 0 2 20
Slovakia 7 1 3 1 2 0 0 14
Total 88 53 47 44 72 10 37 351
The most striking aspect of the geographical distribution of surplus occupations is the
relatively low number of occupations which were reported Most of the reporting PES
(eleven) provided less than the twenty surplus occupations they were requested to
submit Furthermore if the contributions from the Hungarian and Finnish PES are
excluded the average number of surplus occupations submitted by the other PES is
sixteen
With the exception of the Icelandic Finnish French and Hungarian PES the list of
surplus occupations remains in single figures across all the broad occupational groups
Such low figures result in limited cross-border matching possibilities which are explored
in the next chapter
The PES were also asked to indicate the lowest regional level at which they could provide
data on both shortage and surplus occupations Their response is outlined in Table 34
above A total of twenty PES responded positively in the case of shortage occupations
and twelve in the case of surplus occupations In the case of shortage occupations nine
PES indicated that they could provide data at NUTs3 level while eight PES stated that
they could provide the data at NUTs1 level In the case of surplus occupations five PES
indicated that they could provide the data at NUTs1 level and another five PES responded
that they could provide the data at NUTs 3 level There were very few PES who indicated
that the lowest level at which they could provide data was at NUTs2 or NUTs4 levels
Labour shortages and surpluses 2017
2018 23
Directorate-General for Employment Social Affairs and Inclusion European Network of Public Employment Services (PES)
Table 34 Availability of data on shortagessurpluses at regional levels
Shortage occupations Surplus occupations
Country NUTS1 NUTS2 NUTS3 NUTS4 No
data NUTS1 NUTS2 NUTS3 NUTS4
Austria
x
Belgium Actiris
x
Belgium Le Forem
x
x
Belgium VDAB
x
Bulgaria
x
x
x
Croatia x
x
Cyprus
x
x
Denmark
x
x
Estonia x
x
Finland
x
x
France
x
x
Germany x
Hungary
x
x
Iceland x
x
Ireland x
x
Italy
x
Latvia
x
x
Lithuania
x
x
Luxembourg x
Malta
x
Netherlands
x
x
Norway
x
Poland
x
x
Portugal
x
Slovakia
x
x
Slovenia x
Sweden
x
x
Switzerland
x
x
Note Bulgaria has regional data for some occupations
34 Tracking shortages over time
This is the third annual study on lsquoBottleneck Occupationsrsquo the previous two studies were
undertaken in 2016 and 2015 The findings in both of those studies were presented in 3-
digit codes To make the findings comparable over time the 4-digit shortage and surplus
occupations from the current study are aggregated up to 3-digit occupations as shown in
Table 35
A striking aspect of the list of occupations in Table 35 is the degree of consistency
displayed over the period 2015-2017 inclusive not simply in terms of the occupations
reported by the PES but also in terms of the number of PES who identified them as
shortages (ie their ranking) Not only does the 3-digit occupation category of lsquosoftware
and applications developersrsquo occupy the top ranking in each of the years five of the top
ranking six occupations are the same The only notable exception is that the finance
professional and associate professional occupations featured in the list of most reported
shortage occupations in 2015 but slipped out of this list in 2016 and 2017
Labour shortages and surpluses 2017
2018 24
Directorate-General for Employment Social Affairs and Inclusion European Network of Public Employment Services (PES)
Table 35 Ranking of shortage occupations (3-digit)
Rank
Top occupations in 2017 2017 2016 2015
Software and application developers 1 1 1
Sheet and structural metal workers 2 3 2
Medical doctors 3 5 2
Blacksmiths toolmakers and related trades 4 3 4
Building finishes and related trade workers 4 6 4
Building frame and related trade workers 4 3 4
Cooks 4 7 7
Engineering professionals 5 6 6
Physical and engineering science technicians 6 7 na
Electrical equipment installers and repairers 7 4 5
Heavy truck and bus drivers 7 5 4
Machinery mechanics and repairers 8 7 5
Nursing and midwifery professionals 8 6 na
Sales and purchasing agents and brokers 9 2 5
Shop salespersons 10 7 8
Electro technology engineers 10 na na
Primary school and early childhood teachers 10 na na
Domestic hotel and office cleaners and helpers 10 na na
Waiters and bartenders 10 na na
35 3-digit vs 4-digit
There are advantages and disadvantages associated with using the more aggregated 3-
digit occupation classification as it was done in previous studies The bundling of
individual occupations into families provides greater visibility of shortages at a broad
skill level (eg all software related occupations)
However there are distinct disadvantages in using the 3-digit occupations and these
apply particularly to their practical usefulness to education and training providers In
many cases shortages identified at 3-digit level do not provide a reliable basis for
identifying the specific skill which is in shortage or surplus
By combining the analyses of the 4-digit and corresponding 3-digit classifications in this
report many examples are revealed of how an exclusive reliance on the 3-digit
classification could be seriously misleading Thus the findings in this report show that
within the 3-digit classification of lsquosheet and structural metal workers moulders and
weldersrsquo the 4-digit occupation which is in short supply is lsquoweldersrsquo and not for example
lsquosheet metal workersrsquo This is an important insight because in many European countries
the skills of welding and sheet metal work are provided through entirely different
vocational programmes8
There are many examples of this phenomenon in the 3-digit occupations in Table 35 For
example the analysis in this report shows that toolmakers are a shortage occupation
8 In Ireland for example sheet metal workers and welders undertake entirely different apprenticeships
Labour shortages and surpluses 2017
2018 25
Directorate-General for Employment Social Affairs and Inclusion European Network of Public Employment Services (PES)
but blacksmiths are not Furthermore the 3-digit classification disguises the extent of the
reported shortage Thus while the 3-digit occupation of professional nursing and
midwifery is shown in the current report as being shortage occupations a total of eleven
PES reported professional nursing as a shortage compared to only three PES reporting
professional midwifery as a shortage By bundling these occupations together the
significant difference in the relative severity of the shortage is not apparent
This phenomenon applies equally to the surplus occupations which were identified in this
report For example lsquochildcare workersrsquo were described as a surplus occupation by five
PES But in the 3-digit classification they are bundled together with lsquospecial needs
teachersrsquo which was not identified as a surplus occupation
36 Conclusions
There are a number of conclusions which can be drawn from the analyses in this chapter
Firstly the sources used by many of the PES to identify shortage occupations is one of
the main reasons why only eighteen PES provided data on surplus occupations Many of
the PES relied on the results of employer surveys forecasting models and immigration
data to identify shortages and these sources in general do not provide data on surplus
occupations However it was by no means the only reason why so many PES did not
provide data on surplus organisations and this issue will have to be addressed before the
commencement of the 2018 study In the future PES data should be augmented by data
collected by other bodies as outlined in the new EU Regulation
Secondly there is no obvious explanation for the geographic distribution of shortages
and surpluses In some cases countries with relatively small labour forces have a
relatively high number of shortage occupations while a strong apprenticeship system
does not appear to prevent a relatively high share of the identified shortages being in the
craft occupations It may be that the stipulation to only include twenty shortage and
surplus occupations has created a situation where some countries with a relatively large
labour force are artificially constrained to submit a much smaller number of shortage
occupations than they actually have
Thirdly there is a high degree of stability in relation to the occupations which were
identified as shortages in the 2015 2016 and 2017 editions of the Bottleneck report
Finally providing information on shortage and surplus occupations at 4-digit level is
much more useful from a policy perspective than providing the data at a more
aggregated level The results of the analyses at 4-digit level show which specific
occupations in the bundle of occupations used in the previous reports were in shortage
and which were not This is also true of the occupations which were identified as surplus
occupations A more aggregated group of occupations does not allow for the targeting of
specific individual occupations either for increasing training provision or for enhancing
cross border mobility Indeed as a number of specific examples show were providers of
vocational training or indeed policy makers to act on the basis of the 3-digit shortage and
surplus occupations identified in previous reports they could very well have assign
resources to occupations which were neither in shortage nor in surplus
Labour shortages and surpluses 2017
2018 26
Directorate-General for Employment Social Affairs and Inclusion European Network of Public Employment Services (PES)
4 THE CAUSES OF SKILL SHORTAGES AND POTENTIAL SOLUTIONS
41 Introduction
The focus of this chapter is on identifying the possible causes of skills shortages and
surpluses and exploring ways in which these imbalances may be resolved The chapter
begins with a review of the nature of skills and labour market imbalances and concludes
with an exploration of the extent to which enhanced cross-border mobility policies and
more equal gender representation could contribute to the alleviation of skills and labour
imbalances in certain shortage occupations in the EEA labour market
42 The role of skills and labour shortages in skills imbalances
One of the new questions included in the current study asks the PES to identify the
nature of the shortage (ie is it a skill shortage or a labour shortage) in relation to each
shortage occupation they identified It was explained in the questionnaire that labour
shortages occur when there are a sufficient number of appropriately qualified job-seekers
to fill the vacancies which arise but for a variety of reasons many of them do not wish
to work in the occupation in question Their response to this question is summarised in
Table 41 in respect of the twenty occupations which were reported by the most PES
A total of twenty-six PES classified their shortage occupations as skill or labour
shortages and they classified most of the occupations as skill shortages Indeed in the
case of seven occupations plumbers doctors software developers electricians
electronic engineers electronic engineering technicians bus and tram drivers and
mechanical engineers all of the reporting PES classified the shortage as a skills deficit
Each labour market within the EEA is regulated in a particular manner and conditions of
employment even within the same occupation vary throughout the region This is why
many occupations while classified by most of the PES as reflecting skill deficits
nevertheless are classified by some PES as labour shortages
However the number of PES involved is very small indeed Only in the case of three
occupations lsquowaitersrsquo lsquoshop sales assistantsrsquo and lsquoprimary school teachersrsquo are there
more PES classifying the shortage as a labour shortage then a skills deficit The first two
occupations are undoubtedly labour shortages This is because there are few if any
barriers to working in these occupations9
The inclusion of lsquoprimary school teachersrsquo as a labour shortage is however a surprise It
was identified by eight PES as a shortage occupation two of whom classified the
occupation as a shortage of high magnitude It would be necessary to conduct research
into the conditions of employment ndash including qualification criteria ndash within the countries
where the reporting PES are located to establish if this classification of the occupation as
a labour shortage is warranted
With some notable exceptions the response of the PES to classifying their shortage
occupations as skill or labour shortages demonstrates that the PES understand these
concepts Occupations such as professional nurses which are obviously suffering from a
shortage of qualified job-seekers in the EEA are overwhelmingly categorised as a skills
shortage while less skilled occupations such as cleaners are categorised as being on the
borderline between skills and labour shortages
9 Both occupations have relatively high ratios of unemployed to new hires (Annex 4)
Labour shortages and surpluses 2017
2018 27
Directorate-General for Employment Social Affairs and Inclusion European Network of Public Employment Services (PES)
Table 41 Skill and labour shortages
Occupation
Number of PES
reporting occupation
as skills shortage
Number of PES
reporting occupation as labour shortage
Number of PES
reporting occupations as skill and
labour shortage
Total number of
PES reporting on skillslabour
shortage
Cooks 9 1 0 10
Plumbers and pipe fitters 8 0 0 8
Generalist medical Practitioners 7 0 0 7
Heavy truck and lorry drivers 4 2 1 7
Metal workers machine tool setting and operators
3 3 1 7
Welders and flame cutters 4 2 1 7
Nursing professionals 5 1 0 6
Software developers 6 0 0 6
Systems analyst 5 1 0 6
Bricklayers and related trades 4 1 0 5
Building and related electricians 5 0 0 5
Butchers fishmongers and related food 3 2 0 5
Cleaners and helpers in offices 3 2 0 5
Commercial sales representatives 2 2 1 5
Electronic engineers 5 0 0 5
Manufacturing supervisors 4 1 0 5
Motor vehicle mechanics and repairers 3 1 1 5
Nursing associate professionals 4 1 0 5
Primary school teachers 2 3 0 5
Shop sales assistants 1 4 0 5
Waiters 2 3 0 5
Agriculture and industrial machinery repairers
3 1 0 4
Application programmers 3 1 0 4
Bus and tram drivers 4 0 0 4
Electronic engineering technicians 4 0 0 4
Health care assistants 3 1 0 4
Mechanical engineers 4 0 0 4
Sheet metal workers 3 1 0 4
Structural metal preparers and erectors 3 1 0 4
Total number of PES reporting 16 8 2 26
The atypical working hours associated with heavy goods vehicle driving is recognised by
two of the six PES who classify shortages in the occupation as labour shortages while the
unpleasant conditions associated with working in butchery shops and abattoirs is
reflected in the fact that two of the five PES who categorised the occupation as a
shortage occupation classify it as a labour shortage
43 Location of skill imbalances and cross border mobility
In recent years there has been considerable discussion on the potential role which
enhanced cross-border mobility could play in alleviating labour market imbalances The
attractiveness of such a policy is obvious The European Union is a very large
Labour shortages and surpluses 2017
2018 28
Directorate-General for Employment Social Affairs and Inclusion European Network of Public Employment Services (PES)
marketplace embracing a very large labour force if even some of the shortages which
are reported by EEA countries could be resolved by exploiting the surpluses which are
reported by other EEA countries it could form the basis of a number of win-win solutions
for both job-seekers and businesses
An additional attraction of this policy is that it could potentially successfully address both
skills and labour shortages as working conditions associated with some labour shortages
in one country might be perceived as significantly more attractive in a different EEA
country
Table 44 provides a list of the top twenty shortage occupations which have at least one
PES in another EEA country reporting the occupation as a surplus
There are a number of aspects of the Table which are notable Firstly the list of top
occupations has changed quite dramatically from the list in Table 21 specifically none
of the professional and associate professional occupations are now on the list including
the four professional and associate professional health-related occupations or the two
professional software occupations What the Table shows is that there are no surpluses
reported in any of the EEA countries of doctors or nurses software developers or
systems analysts While the occupation of healthcare assistants is in surplus in many
countries it was not included in the list of top occupations because it was reported as a
shortage by only two PES
The figures in Table 42 show that there are three cross-border matching possibilities in
the case of bricklayers and motor mechanics and two possibilities in the case of
plasterers health care assistants and secondary school teachers
There is just one matching possibility in respect of a wide range of occupations including
cooks truck drivers commercial sales representatives electricians carpenters civil
engineers primary school teachers manufacturing supervisors telecentre salespersons
childhood education teachers floor layers and roofers
The fact that primary school teachers have only one cross border matching possibility
suggest that the classification of the occupation as a labour shortage by three of five PES
is an error In general labour shortages would be expected to have more cross border
matching possibilities than skill shortages because there are many job-seekers eligible to
work in the occupation in question and working conditions vary quite significantly from
country to country Indeed it is notable that the two other occupations which were
classified by the PES as predominantly labour shortages waiters and shop sales
assistants have a relatively high number of matching possibilities eight in the case of
shop sales assistants and three in the case of waiters
In general the PES did not classify the same occupation as both a shortage and a
surplus A striking exception is the Danish PES which categorised four of its shortage
occupations as surplus occupations also This is most likely due to the higher level of
granularity available in the Danish data (below 4-digit) so that some job titles within an
occupation are considered labour shortage while others skill shortage
44 Assessing gender composition of surpluses
The PES were asked to estimate the share of females in the occupations which they
identified as lsquosurplusrsquo occupations The restricting of this question to surplus occupations
was to avoid giving the impression that shortages were arising because of discriminatory
recruitment policies
Labour shortages and surpluses 2017
2018 29
Directorate-General for Employment Social Affairs and Inclusion European Network of Public Employment Services (PES)
A total of 13 PES reported any data on gender composition of surpluses However the
quality of information submitted did not provide a sufficient basis for an accurate
estimation of the gender composition of surpluses in some of the cases
It is suggested that in order to address gender imbalances in relation to shortages and
surpluses data from PES on job seekers should be combined with the LSF data on
employment by occupation
45 Conclusions
The analysis in chapter four has produced a number of interesting findings The analysis
reveals that the PES in general has the capacity to distinguish between skill and labour
shortages and to identify shortage occupations which have some cross-border matching
possibilities
The relatively low number of surplus occupations reflects two factors firstly only
eighteen PES submitted a list of surplus occupations and secondly in many cases the
lists did not include the maximum number of twenty occupations which were requested
This response has to be viewed against the background of an EEA labour market where
employment is expanding and unemployment is contracting However while this is a
positive development the relatively low number of surplus occupations has placed a
significant limit on the extent to which there were cross-border possibilities of matching
shortage with surplus occupations
The data indicates that there is a limitation to the extent to which the PES can be used to
identify the gender imbalances (eg under-representation of females in some
occupations) and that other sources should be explored
Labour shortages and surpluses 2017
2018 30
Directorate-General for Employment Social Affairs and Inclusion European Network of Public Employment Services (PES)
Table 43 The potential for cross-border matching of shortage and surplus occupations
No PES
Occupation PES reporting shortage PES reporting surplus No PES
16 Cooks AT Art BG CY DK HR IE IS IT MT NL NO PT SE SI SK lsaquo―rsaquo HU 1
11 Truck drivers ART VDAB BG DK HR LT IT NL NO PT SE SI SK lsaquo―rsaquo DK 1
10 Cleaners helpers CY DK HR FI IS HU NL NO PT SI lsaquo―rsaquo DK LF NL IE 4
10 Commercial sales VDAB ART DK FI FR IT IE PT PL SI lsaquo―rsaquo DK 1
9 Sales assistants AT ART BG CY DK IT NO SI SK lsaquo―rsaquo DK LF SE NL BG CH FI IE 8
9 Bricklayers ART DE DK HR HU LT NL PT SI lsaquo―rsaquo CY HU IE 3
9 Motor mechanics AT VDAB ART LF DK IT NO PT SI lsaquo―rsaquo SK CH EE 3
9 Waiters ART BG CY IS IT MT NO PT SI lsaquo―rsaquo HU EE IE 3
9 Electricians ART VDAB DE DK IS IT NL NO SI lsaquo―rsaquo FR 1
8 Carpenters DK HR HU FI NL NO PT SI lsaquo―rsaquo HU 1
8 Civil engineers ART CH DE FI FR NO SE SI lsaquo―rsaquo CY 1
8 Primary teachers ART BG DK IS NO SE SI SK lsaquo―rsaquo CY 1
7 Healthcare assist CY DK EE NL NO SI SK lsaquo―rsaquo DK NL 2
7 Second teacher ART BG FR NL NO SI SK lsaquo―rsaquo CY FI 2
7 Man supervisors ART VDAB LF DE EE FR SK lsaquo―rsaquo BG 1
6 Plasterers HR HU FI LT NL SI lsaquo―rsaquo HU IE 2
6 Tele centre sales ART HU FI FR MT NO lsaquo―rsaquo EE 1
6 Childhood educ FI LT NO SE SI SK lsaquo―rsaquo CY 1
6 Floor layers HU HR FI FR LT LV lsaquo―rsaquo HU 1
6 Roofers HR FI FR LT LV SI lsaquo―rsaquo HU 1
Bottlenecks Occupations 2017
2017 31
Directorate-General for Employment Social Affairs and Inclusion European Network of Public Employment Services (PES)
5 CONCLUSIONS AND RECOMMENDATIONS
51 Conclusions
The terms of reference for this study emphasise the desirability of creating a process for
the systematic collection of data on surplus and shortage occupations in the EEA area
which could be effectively used by EURES for cross border matching of shortage
occupations in some EEA countries with surplus occupations in others
The authors have responded to this emphasis by using a process which ensures that the
data gathered on shortage and surplus occupations is comprehensive accurate and of
practical use to EURES and the providers of education and training programmes The
process is comprehensive because it gathers information both on the extent of shortages
and surpluses and on their relative severity It is accurate because the list of shortage
and surplus occupations are shown to be consistent with the estimated value of the ratio
of unemployed to new hires Finally the process provides information which is of
practical use to EURES and the national providers of VET because the data gathered is on
individual occupations rather than on lsquobundles of occupationsrsquo as in previous studies The
analyses in this report shows that while these bundles of occupations contain some
occupations which are identified by the PES as shortage and surplus occupations they
also contain occupations which are neither in shortage nor in surplus and it is impossible
to distinguish one from the other
The data gathering process used in this report however was not devoid of weaknesses
Fortunately these weaknesses reflect the modus operandi of the PES and may be
rectified by including other institutions and agencies in the process For example the PES
use the same sources for the identification of both shortage and surplus occupations
This may have advantages in terms of accuracy when those sources include employersrsquo
surveys immigration data and the results of forecasting exercises However these
sources are not suitable for gathering data on surplus occupations and they are the main
reason why the number of surplus occupations provided by the PES were almost half the
number requested In the future PES data could be augmented by data gathered by
other bodies as outlined in recent EU Regulation 2016589
In addition the response to the question on the capacity of the PES to deliver data on
shortage and surplus occupations at a regional level was also disappointing perhaps
reflecting a misalignment in some EEA countries between the geographic configuration of
the local PES network and the NUTs regions
The analysis highlighted that in order to assess gender imbalances of shortages and
surpluses PES data needs to be augmented by other sources
Finally despite the low number of surplus occupations submitted by the PES it was
nevertheless possible to identify twenty shortage occupations in the EEA labour market
which had at least one cross-border matching possibility and many more than one in the
case of some shortage occupations
52 Recommendations
Based on the findings from the three bottleneck studies undertaken to date a model for
the gathering of data on shortages and surpluses is proposed (Figure 51) The model
includes features of the methodology applied in this study which were successful It also
includes a number of features which should be introduced to the process in order to
address some of the weaknesses which were identified in this study (highlighted in red)
Labour shortages and surpluses 2017
2017 32
Directorate-General for Employment Social Affairs and Inclusion European Network of Public Employment Services (PES)
However before this methodology is implemented it would be prudent to discuss data
requirements with PES and invite a broader range of institutions and agencies to
participate in aspects of the data gathering process in addition to the PES EURES
Regulation (EU) 2016589 of the European Parliament and of the Council which obliges
the appropriate national authorities to furnish such data annually is fortuitous in this
regard and should facilitate the implementation of this recommendation
In addition the results of these and other relevant studies should be disseminated to
PES Eures coordination group and other relevant agencies and institutions in order to
emphasise the importance of data and analysis in informing policy at EU and national
level which aims to resolve labour market imbalances
Labour shortages and surpluses 2017
2017 33
Directorate-General for Employment Social Affairs and Inclusion European Network of Public Employment Services (PES)
Figure 51 Model for gathering data on shortage and surplus occupations
Sources of data on surpluses PES data from other relevant agencies
In those cases where the source used by the PES to identify shortage occupations cannot
be used to identify surplus occupations other institutions or other sources or both should be availed of to ensure that comprehensive data on surplus occupations are provided to the appropriate national authority
Dimensions of shortagessurpluses extent (number of reporting PES) and severity (high or low
magnitude)
Data should be systematically gathered on both the extent of shortage and surplus
occupations in the EEA and on their relative severity
Type of shortage skill vs labour shortages
The providers of the data on shortage occupations must also distinguish between skill and labour shortages because this distinction is necessary for the accurate identification of
shortage occupations and for the choice of the appropriate policy response to identified shortages
Classification of occupations used ISCO 08 4-digit codes (or translation into these codes)
All data should be either initially gathered in ISCO 08 4-digit codes or translated into these
codes This ensures that the data refers to specific individual occupations and is of practical use to EURES and the national providers of VET
Accuracy test cross-check with LSF data (ratio of unemployed to new hires)
The accuracy of the submitted lists of shortage and surplus occupations should be assessed
by comparing the most widely reported surplus and shortage occupations with the estimated values of the ratios of employed (by previous occupation) to new hires at the aggregated EU28 level These ratios should be based on an analysis of the most up-to date
Labour Force Survey (LFS) data
Gender balance assessment LFS data on employment at occupational level by gender PES job
seekers
The gender composition of shortage and surplus occupations should be based on the most
up to date analyses of LFS data on employment by gender and the PES job seeker data
Regional balance assessment LSF data data from relevant agencies
Where regional data is required other agencies and institutions should be requested to
provide the data in those cases where the data cannot be provided by the regional PES network because it is not geographically aligned to the NUTs regions
Labour shortages and surpluses 2017
2017 34
Directorate-General for Employment Social Affairs and Inclusion European Network of Public Employment Services (PES)
Number of occupations reporting should be extended beyond 20 occupations but with upper
limit (eg 50)
Consideration should be given to allowing the agencies responsible for identifying shortage
and surplus occupations a greater range of flexibility in terms of the numbers of occupations which should be identified A minimum to maximum range would be a more realistic approach as it would reflect the fact that the labour markets of the EEA vary significantly in size and performance
Timing of imbalance assessment September
It is proposed that the data gathering exercise should be brought forward to early September and that expert advice should be available on line throughout the data
gathering exercise
Labour shortages and surpluses 2017
2017 35
Directorate-General for Employment Social Affairs and Inclusion European Network of Public Employment Services (PES)
ANNEX 1 DATA COLLECTION TEMPLATE Information sought Explanation
Occupation title (text) Type in free text a list of occupations (one row one occupation) for which shortages and surpluses exist first list occupations for which there is a shortage the list should contain a maximum of 20 occupations if your list contains less than 20 occupations please provide a brief explanation in your email response for why the number is lower than 20 second list occupations for which there is a surplus the list should contain a maximum of 20 occupations if your list contains less than 20 occupations please provide a brief explanation in your email response for why the number is lower than 20
Shortagesurplus indicator For each occupation indicate if it refers to a shortage by typing in shortage or surplus by typing in surplus to identify surplus occupations you can examine for each occupation the ratio of the number of job seekers to the number of vacancies at the end of each year for example if there are 5000 shop assistants seeking employment and there are 200 vacancies at the end of the reference period the ratio is 251 you can rank the calculated ratios and report the occupations associated with the 20 highest ratios
Occupational classification used in your country
For each occupation indicate what occupational classification (if any) was used to identify this occupation for instance you can report a country specific classification ISCO ROME SOC etc If you donrsquot use occupational classifications type None
Occupation code to the lowest level of disaggregation (eg ISCO at 4 digits)
If you have indicated a classification used type the code for each occupation use the lowest level of disaggregation (eg 4 digit ISCO code) if you donrsquot use occupational classification leave black
ISCO-08 code at 4-digit level (or lower if 4-digit not available)
If you use occupational classification which is not ISCO-08 and if it is possible provide a translation of the national code to ISCO-08 code ISCO is the International Standard Classification of Occupations which is used to report to Eurostat code should be at 4 digits if this is not available than the lowest level of disaggregation that is available should be reported (3 digits if 4-digit code is not available 2 digits if neither 4-digit nor 3-digit code is available 1 digit if neither 4-digit 3-digit nor 2-digit code is available) if it is not possible to provide translation to ISCO-08 leave black if you have already reported ISCO-08 code in column 3 leave this column black
Estimate of shortagesurplus magnitude (high (gt3 of employment) medium (1-3 of employment) low (lt1 of employment))
For each occupation indicate a broad estimate of the magnitude of the shortagesurplus if you estimate that the shortagesurplus is less than 1 of the total employment in the occupation in question type low if between 1-3 type medium if greater than 3 type high if you cannot provide a rough estimate of magnitude type dont know
Current shortagesurplus (C) future short term (FST) future medium term (FMT) future long term (FLT) donrsquot know (indicate all that apply)
Against each occupation indicate if the identified shortagesurplus refers to present situation by typing C if the shortage is expected to occur in the short term future ie within 12 months by typing FST if it is expected to occur over the medium term (within 1-5 years) by typing FMT if it is expected to occur in the long term (in 5 or more years) by typing FLT if more than one time period applies indicate all relevant ones (eg for current shortagessurpluses that are expected to persist over the short term type C FST) if you dont know type dont know
Source of information on shortagessurpluses (eg PES administrative data (vacancies job seekers) PES survey third party survey Occupational forecasts other (specify) etc)
Indicate the source used to identify shortagesurplus for this occupation did you derive it from the PES administrative data on PES vacancies andor job seekers did you conduct a survey did you commission a third party to conduct a survey for you did you have occupational forecasts available did you use other research type in free text the full description of the source(s) eg National Employment Survey conducted by PES etc
Labour shortages and surpluses 2017
2017 36
Directorate-General for Employment Social Affairs and Inclusion European Network of Public Employment Services (PES)
Date for source of information Indicate the year that the information on shortagessurpluses (column 7) refers to eg type 2016 for a survey of difficult to fill vacancies conducted in 2016 even if the report was published in 2017
What indicator(s) suggested that there is a shortagesurplus
Indicate what criteria was used to conclude that this occupation is associated with a shortagesurplus for instance employers views sourcing from abroad to fill vacancies growth in employment faster than growth in educationtraining output time required to fill
vacancies higher than average etc
Share of females among job seekers in this occupation (surplus occupations only)
Indicate the percentage share of females among all job seekers in this occupation this is only applicable to surplus occupations
Skill or labour shortage Indicate if a shortage refers to a skill or labour shortage a skill shortage occurs where there is an insufficient supply of persons with the appropriate skills labour shortages occur where there is a sufficient number of skilled persons however an insufficient number of them is willing to take up employment in the occupation in question
Indicate the availability of data on shortagessurpluses at regional level (NUTS1 NUTS2 NUTS3 No data)
Indicate if data is available on the regional breakdown of shortagessurpluses by indicating the level of regional data available if multiple levels of regional disaggregation are available indicate the lowest level of disaggregation (eg NUTS3 rather than NUTS2) if there is no regional data available use no data
Labour shortages and surpluses 2017
2017 37
Directorate-General for Employment Social Affairs and Inclusion European Network of Public Employment Services (PES)
ANNEX 2 SHORTAGE OCCUPATIONS
Shortage occupation PES count
Cooks 16 Plumbers and pipe fitters 13 Generalist medical practitioners 12 Welders and flamecutters 12 Heavy truck and lorry drivers 11 Metal working machine tool setters and operators 11 Nursing professionals 11 Software developers 11 Agricultural and industrial machinery mechanics and repairers 10 Cleaners and helpers in offices hotels and other establishments 10 Commercial sales representatives 10 Specialist medical practitioners 10 Systems analysts 10 Bricklayers and related workers 9 Building and related electricians 9 Butchers fishmongers and related food preparers 9 Motor vehicle mechanics and repairers 9 Nursing associate professionals 9 Sheet-metal workers 9 Shop sales assistants 9 Waiters 9 Carpenters and joiners 8 Civil engineers 8 Concrete placers concrete finishers and related workers 8 Electrical engineering technicians 8 Electronics engineering technicians 8 Mechanical engineers 8 Primary school teachers 8 Structural-metal preparers and erectors 8 Electronics engineers 7
Health care assistants 7 Manufacturing supervisors 7 Mechanical engineering technicians 7 Secondary education teachers 7 Accountants 6 Applications programmers 6 Bus and tram drivers 6 Contact centre salespersons 6 Early childhood educators 6 Electrical mechanics and fitters 6 Floor layers and tile setters 6 Plasterers 6 Roofers 6 Sewing machine operators 6 Software and applications developers and analysts not elsewhere classified 6 Toolmakers and related workers 6 Web and multimedia developers 6 Air conditioning and refrigeration mechanics 5 Building frame and related trades workers not elsewhere classified 5 Chefs 5 Civil engineering labourers 5 Construction supervisors 5 Earthmoving and related plant operators 5 Electrical engineers 5 Electrical line installers and repairers 5 Engineering professionals not elsewhere classified 5 Hairdressers 5 Information and communications technology operations technicians 5 Manufacturing managers 5 Physiotherapists 5 Real estate agents and property managers 5 Research and development managers 5 Spray painters and varnishers 5 Accounting associate professionals 4 Bakers pastry-cooks and confectionery makers 4
Labour shortages and surpluses 2017
2017 38
Directorate-General for Employment Social Affairs and Inclusion European Network of Public Employment Services (PES)
Shortage occupation PES count
Blacksmiths hammersmiths and forging press workers 4 Civil engineering technicians 4 Crane hoist and related plant operators 4 Database designers and administrators 4 Industrial and production engineers 4 Painters and related workers 4 Physical and engineering science technicians not elsewhere classified 4 Plastic products machine operators 4 Social work and counselling professionals 4 Accounting and bookkeeping clerks 3 Administrative and executive secretaries 3 Ambulance workers 3 Building construction labourers 3 Car taxi and van drivers 3 Cartographers and surveyors 3 Cleaning and housekeeping supervisors in offices hotels and other establishments 3 Contact centre information clerks 3 Draughtspersons 3 Fast food preparers 3 Freight handlers 3 Gardeners horticultural and nursery growers 3 Home-based personal care workers 3 Hotel receptionists 3 Information and communications technology installers and servicers 3 Insulation workers 3 Kitchen helpers 3 Manufacturing labourers not elsewhere classified 3 Medical imaging and therapeutic equipment technicians 3 Metal moulders and coremakers 3 Metal polishers wheel grinders and tool sharpeners 3 Midwifery professionals 3 Other language teachers 3 Personal services workers not elsewhere classified 3
Pharmacists 3 Policy administration professionals 3 Printers 3 Process control technicians not elsewhere classified 3 Sales and marketing managers 3 Shop supervisors 3 Special needs teachers 3 Stock clerks 3 Supply distribution and related managers 3 Survey and market research interviewers 3 Systems administrators 3 Technical and medical sales professionals (excluding ICT) 3 Translators interpreters and other linguists 3 Transport clerks 3 Vocational education teachers 3 Advertising and marketing professionals 2 Audiologists and speech therapists 2 Bartenders 2 Beauticians and related workers 2 Cashiers and ticket clerks 2 Chemical engineers 2 Child care workers 2 Computer network and systems technicians 2 Computer network professionals 2 Construction managers 2 Craft and related workers not elsewhere classified 2 Credit and loans officers 2 Crop farm labourers 2 Database and network professionals not elsewhere classified 2 Dentists 2 Domestic cleaners and helpers 2 Door to door salespersons 2 Driving instructors 2 Electrical and electronic equipment assemblers 2 Electronics mechanics and servicers 2 Elementary workers not elsewhere classified 2 Employment agents and contractors 2
Labour shortages and surpluses 2017
2017 39
Directorate-General for Employment Social Affairs and Inclusion European Network of Public Employment Services (PES)
Shortage occupation PES count
Field crop and vegetable growers 2 Financial analysts 2 Financial and investment advisers 2 Forestry and related workers 2 Garbage and recycling collectors 2 General office clerks 2 Graphic and multimedia designers 2 Information and communications technology service managers 2 Insurance representatives 2 Locomotive engine drivers 2 Mail carriers and sorting clerks 2 Management and organization analysts 2 Mathematicians actuaries and statisticians 2 Mechanical machinery assemblers 2 Medical and dental prosthetic technicians 2 Medical assistants 2 Messengers package deliverers and luggage porters 2 Metal finishing plating and coating machine operators 2 Metal processing plant operators 2 Optometrists and ophthalmic opticians 2 Personal care workers in health services not elsewhere classified 2 Police officers 2 Policy and planning managers 2 Production clerks 2 Restaurant managers 2 Retail and wholesale trade managers 2 Sales workers not elsewhere classified 2 Sewing embroidery and related workers 2 Street food salespersons 2 Tailors dressmakers furriers and hatters 2 Telecommunications engineers 2 Advertising and public relations managers 1 Aged care services managers 1
Agricultural technicians 1 Aircraft engine mechanics and repairers 1 Aircraft pilots and related associate professionals 1 Assemblers not elsewhere classified 1 Authors and related writers 1 Bank tellers and related clerks 1 Bleaching dyeing and fabric cleaning machine operators 1 Bookmakers croupiers and related gaming workers 1 Business services agents not elsewhere classified 1 Buyers 1 Cabinet-makers and related workers 1 Cement stone and other mineral products machine operators 1 Chemical and physical science technicians 1 Chemical engineering technicians 1 Chemical processing plant controllers 1 Chemical products plant and machine operators 1 Chemists 1 Conference and event planners 1 Customs and border inspectors 1 Data entry clerks 1 Dental assistants and therapists 1 Dieticians and nutritionists 1 Dispensing opticians 1 Domestic housekeepers 1 Economists 1 Education methods specialists 1 Environmental and occupational health and hygiene professionals 1 Environmental and occupational health inspectors and associates 1 Fibre preparing spinning and winding machine operators 1 Finance managers 1 Financial and insurance services branch managers 1 Fire-fighters 1 Fitness and recreation instructors and program leaders 1 Food and beverage tasters and graders 1 Food and related products machine operators 1
Labour shortages and surpluses 2017
2017 40
Directorate-General for Employment Social Affairs and Inclusion European Network of Public Employment Services (PES)
Shortage occupation PES count
Food service counter attendants 1 Forestry labourers 1 Fruit vegetable and related preservers 1 Fur and leather preparing machine operators 1 Glass and ceramics plant operators 1 Hand launderers and pressers 1 Hand packers 1 Handicraft workers in textile leather and related materials 1 Health associate professionals not elsewhere classified 1 Health professionals not elsewhere classified 1 House builders 1 Human resource managers 1 Incinerator and water treatment plant operators 1 Information and communications technology user support technicians 1 Judges 1 Lawyers 1 Legal and related associate professionals 1 Legal professionals not elsewhere classified 1 Library clerks 1 Lifting truck operators 1 Livestock and dairy producers 1 Livestock farm labourers 1 Medical and pathology laboratory technicians 1 Medical secretaries 1 Metal production process controllers 1 Mining and quarrying labourers 1 Mining engineers metallurgists and related professionals 1 Mixed crop and animal producers 1 Mixed crop growers 1 Motorcycle drivers 1 Odd job persons 1 Other cleaning workers 1 Other music teachers 1
Paper products machine operators 1 Personnel and careers professionals 1 Personnel clerks 1 Pet groomers and animal care workers 1 Physicists and astronomers 1 Physiotherapy technicians and assistants 1 Potters and related workers 1 Power production plant operators 1 Prison guards 1 Product and garment designers 1 Psychologists 1 Pulp and papermaking plant operators 1 Railway brake signal and switch operators 1 Receptionists (general) 1 Refuse sorters 1 Riggers and cable splicers 1 Scribes and related workers 1 Secretaries (general) 1 Securities and finance dealers and brokers 1 Security guards 1 Senior government officials 1 Senior officials of special-interest organizations 1 Shelf fillers 1 Ships engineers 1 Shoemaking and related machine operators 1 Social work associate professionals 1 Stall and market salespersons 1 Stationary plant and machine operators not elsewhere classified 1 Stonemasons stone cutters splitters and carvers 1 Street and related service workers 1 Sweepers and related labourers 1 Teaching professionals not elsewhere classified 1 Telecommunications engineering technicians 1 Textile fur and leather products machine operators not elsewhere classified 1 Trade brokers 1 Travel attendants and travel stewards 1 Travel guides 1
Labour shortages and surpluses 2017
2017 41
Directorate-General for Employment Social Affairs and Inclusion European Network of Public Employment Services (PES)
Shortage occupation PES count
Tree and shrub crop growers 1 Underwater divers 1 University and higher education teachers 1 Vehicle cleaners 1 Veterinarians 1 Weaving and knitting machine operators 1 Web technicians 1 Wood processing plant operators 1 Woodworking-machine tool setters and operators 1
Labour shortages and surpluses 2017
2017 42
Directorate-General for Employment Social Affairs and Inclusion European Network of Public Employment Services (PES)
ANNEX 3 SURPLUS OCCUPATIONS
Surplus occupation PES count
General office clerks 8 Shop sales assistants 8 Advertising and marketing professionals 6 Bank tellers and related clerks 6 Sociologists anthropologists and related professionals 6 Child care workers 5 Hairdressers 5 Journalists 5 Cashiers and ticket clerks 4 Cleaners and helpers in offices hotels and other establishments 4 Hand packers 4 Mail carriers and sorting clerks 4 Photographers 4 Receptionists (general) 4 Tailors dressmakers furriers and hatters 4 Accounting and bookkeeping clerks 3 Administrative and executive secretaries 3 Beauticians and related workers 3 Biologists botanists zoologists and related professionals 3 Bricklayers and related workers 3 Broadcasting and audio-visual technicians 3 Civil engineering labourers 3 Economists 3 Gardeners horticultural and nursery growers 3 Interior designers and decorators 3 Kitchen helpers 3 Legal professionals not elsewhere classified 3 Manufacturing labourers not elsewhere classified 3 Motor vehicle mechanics and repairers 3
Musicians singers and composers 3 Other artistic and cultural associate professionals 3 Painters and related workers 3 Philosophers historians and political scientists 3 Security guards 3 Sweepers and related labourers 3 Travel consultants and clerks 3 Waiters 3 Actors 2 Archivists and curators 2 Bakers pastry-cooks and confectionery makers 2 Bartenders 2 Building construction labourers 2 Business services and administration managers not elsewhere classified 2 Cabinet-makers and related workers 2 Car taxi and van drivers 2 Chemists 2 Cleaning and housekeeping supervisors in offices hotels and other establishments 2 Credit and loans officers 2 Customs and border inspectors 2 Elementary workers not elsewhere classified 2 Film stage and related directors and producers 2 Financial analysts 2 Forestry and related workers 2 Freight handlers 2 Graphic and multimedia designers 2 Health care assistants 2 Hotel receptionists 2 Lawyers 2 Legal and related associate professionals 2 Library clerks 2 Livestock and dairy producers 2 Management and organization analysts 2 Messengers package deliverers and luggage porters 2 Odd job persons 2 Office supervisors 2 Plasterers 2
Labour shortages and surpluses 2017
2017 43
Directorate-General for Employment Social Affairs and Inclusion European Network of Public Employment Services (PES)
Surplus occupation PES count
Police officers 2 Pre-press technicians 2 Print finishing and binding workers 2 Printers 2 Prison guards 2 Product and garment designers 2 Psychologists 2 Public relations professionals 2 Religious professionals 2 Secondary education teachers 2 Secretaries (general) 2 Social work and counselling professionals 2 Stall and market salespersons 2 Stock clerks 2 Teachers aides 2 Telephone switchboard operators 2 Travel guides 2 Visual artists 2 Advertising and public relations managers 1 Agricultural technicians 1 Announcers on radio television and other media 1 Assemblers not elsewhere classified 1 Building and related electricians 1 Building architects 1 Building caretakers 1 Building frame and related trades workers not elsewhere classified 1 Business services agents not elsewhere classified 1 Buyers 1 Carpenters and joiners 1 Chemical engineers 1 Civil engineers 1 Clearing and forwarding agents 1 Clerical support workers not elsewhere classified 1
Commercial sales representatives 1 Conference and event planners 1 Contact centre information clerks 1 Contact centre salespersons 1 Cooks 1 Crane hoist and related plant operators 1 Creative and performing artists not elsewhere classified 1 Dancers and choreographers 1 Data entry clerks 1 Database designers and administrators 1 Domestic cleaners and helpers 1 Domestic housekeepers 1 Draughtspersons 1 Driving instructors 1 Early childhood educators 1 Electronics mechanics and servicers 1 Farming forestry and fisheries advisers 1 Fashion and other models 1 Fast food preparers 1 Field crop and vegetable growers 1 Filing and copying clerks 1 Finance managers 1 Financial and insurance services branch managers 1 Financial and investment advisers 1 Fire-fighters 1 Fitness and recreation instructors and program leaders 1 Floor layers and tile setters 1 Food service counter attendants 1 Fruit vegetable and related preservers 1 Gallery museum and library technicians 1 Garbage and recycling collectors 1 Garment and related pattern-makers and cutters 1 Glass and ceramics plant operators 1 Government tax and excise officials 1 Hand launderers and pressers 1
Labour shortages and surpluses 2017
2017 44
Directorate-General for Employment Social Affairs and Inclusion European Network of Public Employment Services (PES)
Surplus occupation PES count
Heavy truck and lorry drivers 1 House builders 1 Hunters and trappers 1 Information and communications technology installers and servicers 1 Information and communications technology user support technicians 1 Insurance representatives 1 Jewellery and precious-metal workers 1 Judges 1 Legal secretaries 1 Librarians and related information professionals 1 Life science technicians (excluding medical) 1 Lifting truck operators 1 Managing directors and chief executives 1 Manufacturing supervisors 1 Medical and dental prosthetic technicians 1 Metal moulders and coremakers 1 Mining and quarrying labourers 1 Mixed crop and animal producers 1 Mixed crop growers 1 Mobile farm and forestry plant operators 1 Musical instrument makers and tuners 1 Other language teachers 1 Pawnbrokers and money-lenders 1 Personnel and careers professionals 1 Pet groomers and animal care workers 1 Photographic products machine operators 1 Physical and engineering science technicians not elsewhere classified 1 Physicists and astronomers 1 Police inspectors and detectives 1 Precision-instrument makers and repairers 1 Primary school teachers 1 Process control technicians not elsewhere classified 1 Product graders and testers (excluding foods and beverages) 1
Production clerks 1 Professional services managers not elsewhere classified 1 Protective services workers not elsewhere classified 1 Research and development managers 1 Retail and wholesale trade managers 1 Roofers 1 Sales workers not elsewhere classified 1 Senior government officials 1 Service station attendants 1 Shelf fillers 1 Shop supervisors 1 Social work associate professionals 1 Special needs teachers 1 Spray painters and varnishers 1 Statistical mathematical and related associate professionals 1 Stonemasons stone cutters splitters and carvers 1 Street food salespersons 1 Supply distribution and related managers 1 Teaching professionals not elsewhere classified 1 Technical and medical sales professionals (excluding ICT) 1 Training and staff development professionals 1 Translators interpreters and other linguists 1 Transport conductors 1 Tree and shrub crop growers 1 Typists and word processing operators 1 Undertakers and embalmers 1 Vocational education teachers 1 Weaving and knitting machine operators 1 Woodworking-machine tool setters and operators 1
Labour shortages and surpluses 2017
2017 45
Directorate-General for Employment Social Affairs and Inclusion European Network of Public Employment Services (PES)
ANNEX 4 THE RATIO OF UNEMPLOYED TO NEW HIRES
ISCO-08 title
2015
UE
Recruited in the
last year (lt12
months)
Ratio of UE to new recruits
Street and related service workers 85 104 08 Agricultural forestry and fishery labourers 3913 5343 07 Mining and construction labourers 1937 3525 05 Creative and performing artists 610 1115 05 Refuse workers 1036 1923 05 Painters building structure cleaners and related trades workers 1116 2117 05 Street and market salespersons 195 389 05 Building frame and related trades workers 3632 7353 05 Mining manufacturing and construction supervisors 626 1315 05 Ships deck crews and related workers 53 114 05 Market gardeners and crop growers 1471 3207 05 Managing directors and chief executives 304 667 05 Travel attendants conductors and guides 229 538 04 Wood treaters cabinet-makers and related trades workers 491 1159 04 Manufacturing labourers 1640 3909 04 Domestic hotel and office cleaners and helpers 5679 13545 04 Other stationary plant and machine operators 822 1961 04 Mobile plant operators 1038 2497 04 Building finishers and related trades workers 1519 3680 04 Textile fur and leather products machine operators 431 1048 04 Garment and related trades workers 422 1047 04 Chemical and photographic products plant and machine operators 157 389 04 Food processing and related trades workers 930 2330 04 Vehicle window laundry and other hand cleaning workers 291 754 04 Sheet and structural metal workers moulders and welders and related workers
996 2603 04
Waiters and bartenders 4399 11595 04 Cooks 1529 4039 04 Metal processing and finishing plant operators 208 557 04 Printing trades workers 203 548 04 Forestry and related workers 130 351 04 Protective services workers 1347 3658 04 Transport and storage labourers 2532 6939 04 Fishery workers hunters and trappers 46 128 04 Material-recording and transport clerks 1671 4630 04 Process control technicians 179 517 03 Mining and mineral processing plant operators 94 274 03 Telecommunications and broadcasting technicians 177 519 03 Blacksmiths toolmakers and related trades workers 816 2409 03 Building and housekeeping supervisors 678 2045 03
Secretaries (general) 1072 3259 03 Assemblers 850 2586 03 Other craft and related workers 258 810 03 Shop salespersons 6600 21042 03 Electrical equipment installers and repairers 958 3060 03 Food and related products machine operators 437 1400 03 Other sales workers 1087 3510 03 Food preparation assistants 1646 5337 03 Mixed crop and animal producers 387 1260 03 Car van and motorcycle drivers 1155 3764 03 Client information workers 1993 6531 03 Sports and fitness workers 605 1984 03 Handicraft workers 194 638 03 Life science technicians and related associate professionals 82 271 03 Keyboard operators 283 940 03 Electronics and telecommunications installers and repairers 290 963 03 Other personal services workers 313 1047 03 Vocational education teachers 279 940 03 Other teaching professionals 744 2518 03 General office clerks 966 3272 03 Authors journalists and linguists 335 1135 03 Hairdressers beauticians and related workers 806 2796 03
Labour shortages and surpluses 2017
2017 46
Directorate-General for Employment Social Affairs and Inclusion European Network of Public Employment Services (PES)
ISCO-08 title
2015
UE
Recruited in the
last year (lt12
months)
Ratio of UE to new recruits
Animal producers 189 660 03 Other elementary workers 976 3401 03 Machinery mechanics and repairers 1134 3962 03 Ship and aircraft controllers and technicians 80 281 03 Hotel and restaurant managers 344 1220 03 Cashiers and ticket clerks 908 3220 03 Retail and wholesale trade managers 224 809 03 Sales marketing and development managers 311 1124 03 Physical and engineering science technicians 1204 4366 03 Administrative and specialised secretaries 1106 4040 03 Sales and purchasing agents and brokers 1294 4754 03 Rubber plastic and paper products machine operators 256 941 03 Artistic cultural and culinary associate professionals 511 1906 03 Numerical clerks 944 3532 03 Other services managers 184 691 03 Child care workers and teachers aides 1335 5005 03 Heavy truck and bus drivers 1426 5349 03 Business services and administration managers 383 1439 03 Information and communications technology service managers 67 257 03 Regulatory government associate professionals 209 807 03 Life science professionals 176 681 03 Wood processing and papermaking plant operators 97 379 03 Locomotive engine drivers and related workers 46 179 03 Legal professionals 315 1245 03 Personal care workers in health services 2195 8787 02 Physical and earth science professionals 85 345 02 Street vendors (excluding food) 50 204 02 Architects planners surveyors and designers 515 2092 02 Other clerical support workers 901 3657 02 Business services agents 510 2114 02 Manufacturing mining construction and distribution managers 361 1507 02 Tellers money collectors and related clerks 381 1612 02 Librarians archivists and curators 58 248 02 Medical and pharmaceutical technicians 255 1099 02 University and higher education teachers 301 1333 02 Information and communications technology operations and user support technicians
418 1888 02
Legal social and religious associate professionals 920 4348 02 Financial and mathematical associate professionals 601 2852 02 Sales marketing and public relations professionals 865 4172 02 Finance professionals 472 2281 02 Engineering professionals (excluding electrotechnology) 635 3118 02 Other health associate professionals 531 2657 02
Social and religious professionals 460 2317 02 Professional services managers 176 891 02 Nursing and midwifery associate professionals 556 2855 02 Legislators and senior officials 53 286 02 Database and network professionals 83 455 02 Administration professionals 641 3673 02 Primary school and early childhood teachers 575 3345 02 Electrotechnology engineers 142 827 02 Secondary education teachers 471 2812 02 Other health professionals 346 2083 02 Nursing and midwifery professionals 273 1760 02 Software and applications developers and analysts 631 4159 02 Medical doctors 293 1944 02 No occupation 152894 00
No answer 2531 578 44 Total 249561 294937 08
Labour shortages and surpluses 2017
2017 47
Directorate-General for Employment Social Affairs and Inclusion European Network of Public Employment Services (PES)
HOW TO OBTAIN EU PUBLICATIONS
Free publications
bull one copy
via EU Bookshop (httpbookshopeuropaeu)
bull more than one copy or postersmaps
from the European Unionrsquos representations (httpeceuropaeurepresent_enhtm)
from the delegations in non-EU countries
(httpeeaseuropaeudelegationsindex_enhtm)
by contacting the Europe Direct service (httpeuropaeueuropedirectindex_enhtm)
or calling 00 800 6 7 8 9 10 11 (free phone number from anywhere in the EU) () () The information given is free as are most calls (though some operators phone boxes or hotels may charge you)
Priced publications
bull via EU Bookshop (httpbookshopeuropaeu)
Priced subscriptions
bull via one of the sales agents of the Publications Office of the European Union
(httppublicationseuropaeuothersagentsindex_enhtm)
doi 10276731262
KE-0
1-1
8-2
63-E
N-N
[Ca
talo
gu
e n
um
be
r]

Labour shortages and surpluses 2017
2018 20
Directorate-General for Employment Social Affairs and Inclusion European Network of Public Employment Services (PES)
Table 31 Methods used by the PES to identify shortage occupations
PES methods for identifying shortages and surpluses Number of PES
Combination of administrative data PES surveys and expert opinion
1
Combination of administrative data PES surveys and 3rd party data
1
Combination of administrative data and PES surveys 7
Combination of administrative data and 3rd party data 1
Combination of administrative data and expert opinion 2
PES work permit data only 2
PES administrative data only 6
PES survey data only 2
PES warehousing data only 1
3rd party surveys and forecasts 5
Total 28
The fact that only eighteen PES provided a list of surplus occupations is a serious
weakness of this study because it places a limit on the potential of the analyses to
identify cross border matching opportunities between shortage and surplus occupations
Consequently in the future every effort should be made to significantly increase the
number of PES providing a list of surplus occupations even if this means that a
significant number of PES use alternative methodologies to identify shortage and surplus
occupations rather than a single methodology to do both as has occurred in both the
2016 study and the current study6
33 Geographic distribution of shortages and surpluses
The 28 PES who submitted data on shortages cover a very wide geographic area which
include labour markets with very different characteristics It may be informative
therefore to assess the extent to which the distribution of shortage occupations differed
between different countries
Table 32 below shows the number of reported shortage occupations within their broad
occupation group and the PES who reported the occupation as a shortage7
While each PES was requested to submit a maximum of twenty shortage occupations a
total of ten PES provided more than that and in the case of the Slovenian French and the
regional Belgian PES Actiris significantly more
A total of six PES identified less than twenty shortage occupations but in most cases the
difference was negligible
The Croatian and Portuguese PES were the only PES which did not identify any
professional occupation in their list of shortage occupations This may reflect the type of
vacancies which are notified by employers to these PES because both these PES use
their own administrative data systems exclusively to identify shortage occupations
6 In the 2016 study while 26 PES provided data on shortage occupations 13 provided data on surplus
occupations 7 Three groups are excluded from the Table managers (43) skilled agricultural (13) and armed forces (1) as the figures are quite small
Labour shortages and surpluses 2017
2018 21
Directorate-General for Employment Social Affairs and Inclusion European Network of Public Employment Services (PES)
Table 32 Shortages number of mentions (4-digit) in broad occupation (1-digit)
PES Professional Technical Clerical Craft Service Plant Elementary Total
Austria 4 11 1 12 2 0 0 30
Actiris 28 22 6 11 13 2 0 82
Le Forem 6 6 0 6 0 0 0 18
VDAB 4 7 1 4 1 3 0 20
Bulgaria 7 0 0 4 5 3 2 21
Croatia 0 1 0 13 1 3 2 20
Cyprus 6 1 2 5 5 1 6 26
Denmark 5 1 0 7 3 2 1 19
Estonia 10 7 0 0 2 1 0 20
Finland 12 5 1 7 2 2 3 32
France 18 27 2 27 1 26 2 103
Germany 16 19 0 10 2 1 1 49
Hungary 2 6 6 8 14 3 12 51
Iceland 6 3 0 5 2 1 3 20
Ireland 13 2 0 4 1 1 0 21
Italy 2 2 1 7 4 1 3 20
Latvia 7 1 1 9 0 0 0 18
Lithuania 1 2 0 15 0 2 0 20
Luxemburg 8 4 0 0 0 0 0 12
Malta 5 3 3 4 6 1 4 26
Netherlands 20 11 3 23 2 1 0 60
Norway 13 3 0 10 10 4 1 41
Poland 10 6 2 2 3 3 4 30
Portugal 0 1 0 8 3 3 0 15
Slovakia 6 6 2 5 5 2 0 26
Slovenia 23 13 3 30 11 13 9 102
Sweden 15 2 0 1 2 0 0 20
Switzerland 14 4 0 0 0 0 0 18
Total 261 176 34 237 100 79 53 940
The stipulation to only provide a list of twenty shortage occupations may have prevented
any pattern from emerging in the figures For example there does not appear to be any
relationship between the numbers of employed and unemployed in a specific labour
market and the number of shortage occupations identified by its national PES
The two PES who submitted the highest volumes of shortage occupations - the French
and Slovenian PES - vary greatly in terms of the relative size of their labour force while
for example the Norwegian PES submitted significantly more shortage occupations than
much larger countries such as Germany and Poland
As a way of controlling for the variation in the total number of shortage occupations it
may be useful to compare the variation within the list of shortage occupations identified
by each PES However no obvious patterns emerge when a number of hypotheses are
tested using this approach For example there appears to be no relationship between
countries which are associated with strong apprenticeship systems such as Germany
Austria Denmark and Switzerland and their share of shortages among the craft group of
occupations The Swiss PES does not contain any craft occupations in its list of shortage
occupations while the craft group of occupations contain the most shortage occupations
in the lists provided by both the Austrian and Danish PES In the case of the German
PES the share of craft occupations is a little above the average
Labour shortages and surpluses 2017
2018 22
Directorate-General for Employment Social Affairs and Inclusion European Network of Public Employment Services (PES)
Table 33 Surpluses number of mentions (4-digit) in broad occupation (1-digit)
PES Professional Technical Clerical Craft Service Plant Elementary Total
Le Forem 2 1 1 1 6 0 8 19
Bulgaria 6 3 2 0 4 0 2 17
Switzerland 0 4 2 4 1 2 3 16
Cyprus 5 0 0 2 0 0 3 10
Denmark 3 2 3 0 6 1 4 19
Estonia 6 2 3 2 6 0 1 20
Finland 16 7 6 10 3 1 0 43
France 10 10 1 2 5 1 0 29
Croatia 4 0 0 0 0 0 0 4
Hungary 6 9 3 16 15 1 2 52
Ireland 1 1 4 3 5 1 7 22
Iceland 11 1 2 2 1 0 1 18
Lithuania 0 3 1 0 2 2 0 8
Latvia 4 4 0 0 3 1 3 15
Netherlands 3 2 9 0 9 0 1 24
Poland 0 0 0 0 1 0 0 1
Sweden 4 3 7 1 3 0 2 20
Slovakia 7 1 3 1 2 0 0 14
Total 88 53 47 44 72 10 37 351
The most striking aspect of the geographical distribution of surplus occupations is the
relatively low number of occupations which were reported Most of the reporting PES
(eleven) provided less than the twenty surplus occupations they were requested to
submit Furthermore if the contributions from the Hungarian and Finnish PES are
excluded the average number of surplus occupations submitted by the other PES is
sixteen
With the exception of the Icelandic Finnish French and Hungarian PES the list of
surplus occupations remains in single figures across all the broad occupational groups
Such low figures result in limited cross-border matching possibilities which are explored
in the next chapter
The PES were also asked to indicate the lowest regional level at which they could provide
data on both shortage and surplus occupations Their response is outlined in Table 34
above A total of twenty PES responded positively in the case of shortage occupations
and twelve in the case of surplus occupations In the case of shortage occupations nine
PES indicated that they could provide data at NUTs3 level while eight PES stated that
they could provide the data at NUTs1 level In the case of surplus occupations five PES
indicated that they could provide the data at NUTs1 level and another five PES responded
that they could provide the data at NUTs 3 level There were very few PES who indicated
that the lowest level at which they could provide data was at NUTs2 or NUTs4 levels
Labour shortages and surpluses 2017
2018 23
Directorate-General for Employment Social Affairs and Inclusion European Network of Public Employment Services (PES)
Table 34 Availability of data on shortagessurpluses at regional levels
Shortage occupations Surplus occupations
Country NUTS1 NUTS2 NUTS3 NUTS4 No
data NUTS1 NUTS2 NUTS3 NUTS4
Austria
x
Belgium Actiris
x
Belgium Le Forem
x
x
Belgium VDAB
x
Bulgaria
x
x
x
Croatia x
x
Cyprus
x
x
Denmark
x
x
Estonia x
x
Finland
x
x
France
x
x
Germany x
Hungary
x
x
Iceland x
x
Ireland x
x
Italy
x
Latvia
x
x
Lithuania
x
x
Luxembourg x
Malta
x
Netherlands
x
x
Norway
x
Poland
x
x
Portugal
x
Slovakia
x
x
Slovenia x
Sweden
x
x
Switzerland
x
x
Note Bulgaria has regional data for some occupations
34 Tracking shortages over time
This is the third annual study on lsquoBottleneck Occupationsrsquo the previous two studies were
undertaken in 2016 and 2015 The findings in both of those studies were presented in 3-
digit codes To make the findings comparable over time the 4-digit shortage and surplus
occupations from the current study are aggregated up to 3-digit occupations as shown in
Table 35
A striking aspect of the list of occupations in Table 35 is the degree of consistency
displayed over the period 2015-2017 inclusive not simply in terms of the occupations
reported by the PES but also in terms of the number of PES who identified them as
shortages (ie their ranking) Not only does the 3-digit occupation category of lsquosoftware
and applications developersrsquo occupy the top ranking in each of the years five of the top
ranking six occupations are the same The only notable exception is that the finance
professional and associate professional occupations featured in the list of most reported
shortage occupations in 2015 but slipped out of this list in 2016 and 2017
Labour shortages and surpluses 2017
2018 24
Directorate-General for Employment Social Affairs and Inclusion European Network of Public Employment Services (PES)
Table 35 Ranking of shortage occupations (3-digit)
Rank
Top occupations in 2017 2017 2016 2015
Software and application developers 1 1 1
Sheet and structural metal workers 2 3 2
Medical doctors 3 5 2
Blacksmiths toolmakers and related trades 4 3 4
Building finishes and related trade workers 4 6 4
Building frame and related trade workers 4 3 4
Cooks 4 7 7
Engineering professionals 5 6 6
Physical and engineering science technicians 6 7 na
Electrical equipment installers and repairers 7 4 5
Heavy truck and bus drivers 7 5 4
Machinery mechanics and repairers 8 7 5
Nursing and midwifery professionals 8 6 na
Sales and purchasing agents and brokers 9 2 5
Shop salespersons 10 7 8
Electro technology engineers 10 na na
Primary school and early childhood teachers 10 na na
Domestic hotel and office cleaners and helpers 10 na na
Waiters and bartenders 10 na na
35 3-digit vs 4-digit
There are advantages and disadvantages associated with using the more aggregated 3-
digit occupation classification as it was done in previous studies The bundling of
individual occupations into families provides greater visibility of shortages at a broad
skill level (eg all software related occupations)
However there are distinct disadvantages in using the 3-digit occupations and these
apply particularly to their practical usefulness to education and training providers In
many cases shortages identified at 3-digit level do not provide a reliable basis for
identifying the specific skill which is in shortage or surplus
By combining the analyses of the 4-digit and corresponding 3-digit classifications in this
report many examples are revealed of how an exclusive reliance on the 3-digit
classification could be seriously misleading Thus the findings in this report show that
within the 3-digit classification of lsquosheet and structural metal workers moulders and
weldersrsquo the 4-digit occupation which is in short supply is lsquoweldersrsquo and not for example
lsquosheet metal workersrsquo This is an important insight because in many European countries
the skills of welding and sheet metal work are provided through entirely different
vocational programmes8
There are many examples of this phenomenon in the 3-digit occupations in Table 35 For
example the analysis in this report shows that toolmakers are a shortage occupation
8 In Ireland for example sheet metal workers and welders undertake entirely different apprenticeships
Labour shortages and surpluses 2017
2018 25
Directorate-General for Employment Social Affairs and Inclusion European Network of Public Employment Services (PES)
but blacksmiths are not Furthermore the 3-digit classification disguises the extent of the
reported shortage Thus while the 3-digit occupation of professional nursing and
midwifery is shown in the current report as being shortage occupations a total of eleven
PES reported professional nursing as a shortage compared to only three PES reporting
professional midwifery as a shortage By bundling these occupations together the
significant difference in the relative severity of the shortage is not apparent
This phenomenon applies equally to the surplus occupations which were identified in this
report For example lsquochildcare workersrsquo were described as a surplus occupation by five
PES But in the 3-digit classification they are bundled together with lsquospecial needs
teachersrsquo which was not identified as a surplus occupation
36 Conclusions
There are a number of conclusions which can be drawn from the analyses in this chapter
Firstly the sources used by many of the PES to identify shortage occupations is one of
the main reasons why only eighteen PES provided data on surplus occupations Many of
the PES relied on the results of employer surveys forecasting models and immigration
data to identify shortages and these sources in general do not provide data on surplus
occupations However it was by no means the only reason why so many PES did not
provide data on surplus organisations and this issue will have to be addressed before the
commencement of the 2018 study In the future PES data should be augmented by data
collected by other bodies as outlined in the new EU Regulation
Secondly there is no obvious explanation for the geographic distribution of shortages
and surpluses In some cases countries with relatively small labour forces have a
relatively high number of shortage occupations while a strong apprenticeship system
does not appear to prevent a relatively high share of the identified shortages being in the
craft occupations It may be that the stipulation to only include twenty shortage and
surplus occupations has created a situation where some countries with a relatively large
labour force are artificially constrained to submit a much smaller number of shortage
occupations than they actually have
Thirdly there is a high degree of stability in relation to the occupations which were
identified as shortages in the 2015 2016 and 2017 editions of the Bottleneck report
Finally providing information on shortage and surplus occupations at 4-digit level is
much more useful from a policy perspective than providing the data at a more
aggregated level The results of the analyses at 4-digit level show which specific
occupations in the bundle of occupations used in the previous reports were in shortage
and which were not This is also true of the occupations which were identified as surplus
occupations A more aggregated group of occupations does not allow for the targeting of
specific individual occupations either for increasing training provision or for enhancing
cross border mobility Indeed as a number of specific examples show were providers of
vocational training or indeed policy makers to act on the basis of the 3-digit shortage and
surplus occupations identified in previous reports they could very well have assign
resources to occupations which were neither in shortage nor in surplus
Labour shortages and surpluses 2017
2018 26
Directorate-General for Employment Social Affairs and Inclusion European Network of Public Employment Services (PES)
4 THE CAUSES OF SKILL SHORTAGES AND POTENTIAL SOLUTIONS
41 Introduction
The focus of this chapter is on identifying the possible causes of skills shortages and
surpluses and exploring ways in which these imbalances may be resolved The chapter
begins with a review of the nature of skills and labour market imbalances and concludes
with an exploration of the extent to which enhanced cross-border mobility policies and
more equal gender representation could contribute to the alleviation of skills and labour
imbalances in certain shortage occupations in the EEA labour market
42 The role of skills and labour shortages in skills imbalances
One of the new questions included in the current study asks the PES to identify the
nature of the shortage (ie is it a skill shortage or a labour shortage) in relation to each
shortage occupation they identified It was explained in the questionnaire that labour
shortages occur when there are a sufficient number of appropriately qualified job-seekers
to fill the vacancies which arise but for a variety of reasons many of them do not wish
to work in the occupation in question Their response to this question is summarised in
Table 41 in respect of the twenty occupations which were reported by the most PES
A total of twenty-six PES classified their shortage occupations as skill or labour
shortages and they classified most of the occupations as skill shortages Indeed in the
case of seven occupations plumbers doctors software developers electricians
electronic engineers electronic engineering technicians bus and tram drivers and
mechanical engineers all of the reporting PES classified the shortage as a skills deficit
Each labour market within the EEA is regulated in a particular manner and conditions of
employment even within the same occupation vary throughout the region This is why
many occupations while classified by most of the PES as reflecting skill deficits
nevertheless are classified by some PES as labour shortages
However the number of PES involved is very small indeed Only in the case of three
occupations lsquowaitersrsquo lsquoshop sales assistantsrsquo and lsquoprimary school teachersrsquo are there
more PES classifying the shortage as a labour shortage then a skills deficit The first two
occupations are undoubtedly labour shortages This is because there are few if any
barriers to working in these occupations9
The inclusion of lsquoprimary school teachersrsquo as a labour shortage is however a surprise It
was identified by eight PES as a shortage occupation two of whom classified the
occupation as a shortage of high magnitude It would be necessary to conduct research
into the conditions of employment ndash including qualification criteria ndash within the countries
where the reporting PES are located to establish if this classification of the occupation as
a labour shortage is warranted
With some notable exceptions the response of the PES to classifying their shortage
occupations as skill or labour shortages demonstrates that the PES understand these
concepts Occupations such as professional nurses which are obviously suffering from a
shortage of qualified job-seekers in the EEA are overwhelmingly categorised as a skills
shortage while less skilled occupations such as cleaners are categorised as being on the
borderline between skills and labour shortages
9 Both occupations have relatively high ratios of unemployed to new hires (Annex 4)
Labour shortages and surpluses 2017
2018 27
Directorate-General for Employment Social Affairs and Inclusion European Network of Public Employment Services (PES)
Table 41 Skill and labour shortages
Occupation
Number of PES
reporting occupation
as skills shortage
Number of PES
reporting occupation as labour shortage
Number of PES
reporting occupations as skill and
labour shortage
Total number of
PES reporting on skillslabour
shortage
Cooks 9 1 0 10
Plumbers and pipe fitters 8 0 0 8
Generalist medical Practitioners 7 0 0 7
Heavy truck and lorry drivers 4 2 1 7
Metal workers machine tool setting and operators
3 3 1 7
Welders and flame cutters 4 2 1 7
Nursing professionals 5 1 0 6
Software developers 6 0 0 6
Systems analyst 5 1 0 6
Bricklayers and related trades 4 1 0 5
Building and related electricians 5 0 0 5
Butchers fishmongers and related food 3 2 0 5
Cleaners and helpers in offices 3 2 0 5
Commercial sales representatives 2 2 1 5
Electronic engineers 5 0 0 5
Manufacturing supervisors 4 1 0 5
Motor vehicle mechanics and repairers 3 1 1 5
Nursing associate professionals 4 1 0 5
Primary school teachers 2 3 0 5
Shop sales assistants 1 4 0 5
Waiters 2 3 0 5
Agriculture and industrial machinery repairers
3 1 0 4
Application programmers 3 1 0 4
Bus and tram drivers 4 0 0 4
Electronic engineering technicians 4 0 0 4
Health care assistants 3 1 0 4
Mechanical engineers 4 0 0 4
Sheet metal workers 3 1 0 4
Structural metal preparers and erectors 3 1 0 4
Total number of PES reporting 16 8 2 26
The atypical working hours associated with heavy goods vehicle driving is recognised by
two of the six PES who classify shortages in the occupation as labour shortages while the
unpleasant conditions associated with working in butchery shops and abattoirs is
reflected in the fact that two of the five PES who categorised the occupation as a
shortage occupation classify it as a labour shortage
43 Location of skill imbalances and cross border mobility
In recent years there has been considerable discussion on the potential role which
enhanced cross-border mobility could play in alleviating labour market imbalances The
attractiveness of such a policy is obvious The European Union is a very large
Labour shortages and surpluses 2017
2018 28
Directorate-General for Employment Social Affairs and Inclusion European Network of Public Employment Services (PES)
marketplace embracing a very large labour force if even some of the shortages which
are reported by EEA countries could be resolved by exploiting the surpluses which are
reported by other EEA countries it could form the basis of a number of win-win solutions
for both job-seekers and businesses
An additional attraction of this policy is that it could potentially successfully address both
skills and labour shortages as working conditions associated with some labour shortages
in one country might be perceived as significantly more attractive in a different EEA
country
Table 44 provides a list of the top twenty shortage occupations which have at least one
PES in another EEA country reporting the occupation as a surplus
There are a number of aspects of the Table which are notable Firstly the list of top
occupations has changed quite dramatically from the list in Table 21 specifically none
of the professional and associate professional occupations are now on the list including
the four professional and associate professional health-related occupations or the two
professional software occupations What the Table shows is that there are no surpluses
reported in any of the EEA countries of doctors or nurses software developers or
systems analysts While the occupation of healthcare assistants is in surplus in many
countries it was not included in the list of top occupations because it was reported as a
shortage by only two PES
The figures in Table 42 show that there are three cross-border matching possibilities in
the case of bricklayers and motor mechanics and two possibilities in the case of
plasterers health care assistants and secondary school teachers
There is just one matching possibility in respect of a wide range of occupations including
cooks truck drivers commercial sales representatives electricians carpenters civil
engineers primary school teachers manufacturing supervisors telecentre salespersons
childhood education teachers floor layers and roofers
The fact that primary school teachers have only one cross border matching possibility
suggest that the classification of the occupation as a labour shortage by three of five PES
is an error In general labour shortages would be expected to have more cross border
matching possibilities than skill shortages because there are many job-seekers eligible to
work in the occupation in question and working conditions vary quite significantly from
country to country Indeed it is notable that the two other occupations which were
classified by the PES as predominantly labour shortages waiters and shop sales
assistants have a relatively high number of matching possibilities eight in the case of
shop sales assistants and three in the case of waiters
In general the PES did not classify the same occupation as both a shortage and a
surplus A striking exception is the Danish PES which categorised four of its shortage
occupations as surplus occupations also This is most likely due to the higher level of
granularity available in the Danish data (below 4-digit) so that some job titles within an
occupation are considered labour shortage while others skill shortage
44 Assessing gender composition of surpluses
The PES were asked to estimate the share of females in the occupations which they
identified as lsquosurplusrsquo occupations The restricting of this question to surplus occupations
was to avoid giving the impression that shortages were arising because of discriminatory
recruitment policies
Labour shortages and surpluses 2017
2018 29
Directorate-General for Employment Social Affairs and Inclusion European Network of Public Employment Services (PES)
A total of 13 PES reported any data on gender composition of surpluses However the
quality of information submitted did not provide a sufficient basis for an accurate
estimation of the gender composition of surpluses in some of the cases
It is suggested that in order to address gender imbalances in relation to shortages and
surpluses data from PES on job seekers should be combined with the LSF data on
employment by occupation
45 Conclusions
The analysis in chapter four has produced a number of interesting findings The analysis
reveals that the PES in general has the capacity to distinguish between skill and labour
shortages and to identify shortage occupations which have some cross-border matching
possibilities
The relatively low number of surplus occupations reflects two factors firstly only
eighteen PES submitted a list of surplus occupations and secondly in many cases the
lists did not include the maximum number of twenty occupations which were requested
This response has to be viewed against the background of an EEA labour market where
employment is expanding and unemployment is contracting However while this is a
positive development the relatively low number of surplus occupations has placed a
significant limit on the extent to which there were cross-border possibilities of matching
shortage with surplus occupations
The data indicates that there is a limitation to the extent to which the PES can be used to
identify the gender imbalances (eg under-representation of females in some
occupations) and that other sources should be explored
Labour shortages and surpluses 2017
2018 30
Directorate-General for Employment Social Affairs and Inclusion European Network of Public Employment Services (PES)
Table 43 The potential for cross-border matching of shortage and surplus occupations
No PES
Occupation PES reporting shortage PES reporting surplus No PES
16 Cooks AT Art BG CY DK HR IE IS IT MT NL NO PT SE SI SK lsaquo―rsaquo HU 1
11 Truck drivers ART VDAB BG DK HR LT IT NL NO PT SE SI SK lsaquo―rsaquo DK 1
10 Cleaners helpers CY DK HR FI IS HU NL NO PT SI lsaquo―rsaquo DK LF NL IE 4
10 Commercial sales VDAB ART DK FI FR IT IE PT PL SI lsaquo―rsaquo DK 1
9 Sales assistants AT ART BG CY DK IT NO SI SK lsaquo―rsaquo DK LF SE NL BG CH FI IE 8
9 Bricklayers ART DE DK HR HU LT NL PT SI lsaquo―rsaquo CY HU IE 3
9 Motor mechanics AT VDAB ART LF DK IT NO PT SI lsaquo―rsaquo SK CH EE 3
9 Waiters ART BG CY IS IT MT NO PT SI lsaquo―rsaquo HU EE IE 3
9 Electricians ART VDAB DE DK IS IT NL NO SI lsaquo―rsaquo FR 1
8 Carpenters DK HR HU FI NL NO PT SI lsaquo―rsaquo HU 1
8 Civil engineers ART CH DE FI FR NO SE SI lsaquo―rsaquo CY 1
8 Primary teachers ART BG DK IS NO SE SI SK lsaquo―rsaquo CY 1
7 Healthcare assist CY DK EE NL NO SI SK lsaquo―rsaquo DK NL 2
7 Second teacher ART BG FR NL NO SI SK lsaquo―rsaquo CY FI 2
7 Man supervisors ART VDAB LF DE EE FR SK lsaquo―rsaquo BG 1
6 Plasterers HR HU FI LT NL SI lsaquo―rsaquo HU IE 2
6 Tele centre sales ART HU FI FR MT NO lsaquo―rsaquo EE 1
6 Childhood educ FI LT NO SE SI SK lsaquo―rsaquo CY 1
6 Floor layers HU HR FI FR LT LV lsaquo―rsaquo HU 1
6 Roofers HR FI FR LT LV SI lsaquo―rsaquo HU 1
Bottlenecks Occupations 2017
2017 31
Directorate-General for Employment Social Affairs and Inclusion European Network of Public Employment Services (PES)
5 CONCLUSIONS AND RECOMMENDATIONS
51 Conclusions
The terms of reference for this study emphasise the desirability of creating a process for
the systematic collection of data on surplus and shortage occupations in the EEA area
which could be effectively used by EURES for cross border matching of shortage
occupations in some EEA countries with surplus occupations in others
The authors have responded to this emphasis by using a process which ensures that the
data gathered on shortage and surplus occupations is comprehensive accurate and of
practical use to EURES and the providers of education and training programmes The
process is comprehensive because it gathers information both on the extent of shortages
and surpluses and on their relative severity It is accurate because the list of shortage
and surplus occupations are shown to be consistent with the estimated value of the ratio
of unemployed to new hires Finally the process provides information which is of
practical use to EURES and the national providers of VET because the data gathered is on
individual occupations rather than on lsquobundles of occupationsrsquo as in previous studies The
analyses in this report shows that while these bundles of occupations contain some
occupations which are identified by the PES as shortage and surplus occupations they
also contain occupations which are neither in shortage nor in surplus and it is impossible
to distinguish one from the other
The data gathering process used in this report however was not devoid of weaknesses
Fortunately these weaknesses reflect the modus operandi of the PES and may be
rectified by including other institutions and agencies in the process For example the PES
use the same sources for the identification of both shortage and surplus occupations
This may have advantages in terms of accuracy when those sources include employersrsquo
surveys immigration data and the results of forecasting exercises However these
sources are not suitable for gathering data on surplus occupations and they are the main
reason why the number of surplus occupations provided by the PES were almost half the
number requested In the future PES data could be augmented by data gathered by
other bodies as outlined in recent EU Regulation 2016589
In addition the response to the question on the capacity of the PES to deliver data on
shortage and surplus occupations at a regional level was also disappointing perhaps
reflecting a misalignment in some EEA countries between the geographic configuration of
the local PES network and the NUTs regions
The analysis highlighted that in order to assess gender imbalances of shortages and
surpluses PES data needs to be augmented by other sources
Finally despite the low number of surplus occupations submitted by the PES it was
nevertheless possible to identify twenty shortage occupations in the EEA labour market
which had at least one cross-border matching possibility and many more than one in the
case of some shortage occupations
52 Recommendations
Based on the findings from the three bottleneck studies undertaken to date a model for
the gathering of data on shortages and surpluses is proposed (Figure 51) The model
includes features of the methodology applied in this study which were successful It also
includes a number of features which should be introduced to the process in order to
address some of the weaknesses which were identified in this study (highlighted in red)
Labour shortages and surpluses 2017
2017 32
Directorate-General for Employment Social Affairs and Inclusion European Network of Public Employment Services (PES)
However before this methodology is implemented it would be prudent to discuss data
requirements with PES and invite a broader range of institutions and agencies to
participate in aspects of the data gathering process in addition to the PES EURES
Regulation (EU) 2016589 of the European Parliament and of the Council which obliges
the appropriate national authorities to furnish such data annually is fortuitous in this
regard and should facilitate the implementation of this recommendation
In addition the results of these and other relevant studies should be disseminated to
PES Eures coordination group and other relevant agencies and institutions in order to
emphasise the importance of data and analysis in informing policy at EU and national
level which aims to resolve labour market imbalances
Labour shortages and surpluses 2017
2017 33
Directorate-General for Employment Social Affairs and Inclusion European Network of Public Employment Services (PES)
Figure 51 Model for gathering data on shortage and surplus occupations
Sources of data on surpluses PES data from other relevant agencies
In those cases where the source used by the PES to identify shortage occupations cannot
be used to identify surplus occupations other institutions or other sources or both should be availed of to ensure that comprehensive data on surplus occupations are provided to the appropriate national authority
Dimensions of shortagessurpluses extent (number of reporting PES) and severity (high or low
magnitude)
Data should be systematically gathered on both the extent of shortage and surplus
occupations in the EEA and on their relative severity
Type of shortage skill vs labour shortages
The providers of the data on shortage occupations must also distinguish between skill and labour shortages because this distinction is necessary for the accurate identification of
shortage occupations and for the choice of the appropriate policy response to identified shortages
Classification of occupations used ISCO 08 4-digit codes (or translation into these codes)
All data should be either initially gathered in ISCO 08 4-digit codes or translated into these
codes This ensures that the data refers to specific individual occupations and is of practical use to EURES and the national providers of VET
Accuracy test cross-check with LSF data (ratio of unemployed to new hires)
The accuracy of the submitted lists of shortage and surplus occupations should be assessed
by comparing the most widely reported surplus and shortage occupations with the estimated values of the ratios of employed (by previous occupation) to new hires at the aggregated EU28 level These ratios should be based on an analysis of the most up-to date
Labour Force Survey (LFS) data
Gender balance assessment LFS data on employment at occupational level by gender PES job
seekers
The gender composition of shortage and surplus occupations should be based on the most
up to date analyses of LFS data on employment by gender and the PES job seeker data
Regional balance assessment LSF data data from relevant agencies
Where regional data is required other agencies and institutions should be requested to
provide the data in those cases where the data cannot be provided by the regional PES network because it is not geographically aligned to the NUTs regions
Labour shortages and surpluses 2017
2017 34
Directorate-General for Employment Social Affairs and Inclusion European Network of Public Employment Services (PES)
Number of occupations reporting should be extended beyond 20 occupations but with upper
limit (eg 50)
Consideration should be given to allowing the agencies responsible for identifying shortage
and surplus occupations a greater range of flexibility in terms of the numbers of occupations which should be identified A minimum to maximum range would be a more realistic approach as it would reflect the fact that the labour markets of the EEA vary significantly in size and performance
Timing of imbalance assessment September
It is proposed that the data gathering exercise should be brought forward to early September and that expert advice should be available on line throughout the data
gathering exercise
Labour shortages and surpluses 2017
2017 35
Directorate-General for Employment Social Affairs and Inclusion European Network of Public Employment Services (PES)
ANNEX 1 DATA COLLECTION TEMPLATE Information sought Explanation
Occupation title (text) Type in free text a list of occupations (one row one occupation) for which shortages and surpluses exist first list occupations for which there is a shortage the list should contain a maximum of 20 occupations if your list contains less than 20 occupations please provide a brief explanation in your email response for why the number is lower than 20 second list occupations for which there is a surplus the list should contain a maximum of 20 occupations if your list contains less than 20 occupations please provide a brief explanation in your email response for why the number is lower than 20
Shortagesurplus indicator For each occupation indicate if it refers to a shortage by typing in shortage or surplus by typing in surplus to identify surplus occupations you can examine for each occupation the ratio of the number of job seekers to the number of vacancies at the end of each year for example if there are 5000 shop assistants seeking employment and there are 200 vacancies at the end of the reference period the ratio is 251 you can rank the calculated ratios and report the occupations associated with the 20 highest ratios
Occupational classification used in your country
For each occupation indicate what occupational classification (if any) was used to identify this occupation for instance you can report a country specific classification ISCO ROME SOC etc If you donrsquot use occupational classifications type None
Occupation code to the lowest level of disaggregation (eg ISCO at 4 digits)
If you have indicated a classification used type the code for each occupation use the lowest level of disaggregation (eg 4 digit ISCO code) if you donrsquot use occupational classification leave black
ISCO-08 code at 4-digit level (or lower if 4-digit not available)
If you use occupational classification which is not ISCO-08 and if it is possible provide a translation of the national code to ISCO-08 code ISCO is the International Standard Classification of Occupations which is used to report to Eurostat code should be at 4 digits if this is not available than the lowest level of disaggregation that is available should be reported (3 digits if 4-digit code is not available 2 digits if neither 4-digit nor 3-digit code is available 1 digit if neither 4-digit 3-digit nor 2-digit code is available) if it is not possible to provide translation to ISCO-08 leave black if you have already reported ISCO-08 code in column 3 leave this column black
Estimate of shortagesurplus magnitude (high (gt3 of employment) medium (1-3 of employment) low (lt1 of employment))
For each occupation indicate a broad estimate of the magnitude of the shortagesurplus if you estimate that the shortagesurplus is less than 1 of the total employment in the occupation in question type low if between 1-3 type medium if greater than 3 type high if you cannot provide a rough estimate of magnitude type dont know
Current shortagesurplus (C) future short term (FST) future medium term (FMT) future long term (FLT) donrsquot know (indicate all that apply)
Against each occupation indicate if the identified shortagesurplus refers to present situation by typing C if the shortage is expected to occur in the short term future ie within 12 months by typing FST if it is expected to occur over the medium term (within 1-5 years) by typing FMT if it is expected to occur in the long term (in 5 or more years) by typing FLT if more than one time period applies indicate all relevant ones (eg for current shortagessurpluses that are expected to persist over the short term type C FST) if you dont know type dont know
Source of information on shortagessurpluses (eg PES administrative data (vacancies job seekers) PES survey third party survey Occupational forecasts other (specify) etc)
Indicate the source used to identify shortagesurplus for this occupation did you derive it from the PES administrative data on PES vacancies andor job seekers did you conduct a survey did you commission a third party to conduct a survey for you did you have occupational forecasts available did you use other research type in free text the full description of the source(s) eg National Employment Survey conducted by PES etc
Labour shortages and surpluses 2017
2017 36
Directorate-General for Employment Social Affairs and Inclusion European Network of Public Employment Services (PES)
Date for source of information Indicate the year that the information on shortagessurpluses (column 7) refers to eg type 2016 for a survey of difficult to fill vacancies conducted in 2016 even if the report was published in 2017
What indicator(s) suggested that there is a shortagesurplus
Indicate what criteria was used to conclude that this occupation is associated with a shortagesurplus for instance employers views sourcing from abroad to fill vacancies growth in employment faster than growth in educationtraining output time required to fill
vacancies higher than average etc
Share of females among job seekers in this occupation (surplus occupations only)
Indicate the percentage share of females among all job seekers in this occupation this is only applicable to surplus occupations
Skill or labour shortage Indicate if a shortage refers to a skill or labour shortage a skill shortage occurs where there is an insufficient supply of persons with the appropriate skills labour shortages occur where there is a sufficient number of skilled persons however an insufficient number of them is willing to take up employment in the occupation in question
Indicate the availability of data on shortagessurpluses at regional level (NUTS1 NUTS2 NUTS3 No data)
Indicate if data is available on the regional breakdown of shortagessurpluses by indicating the level of regional data available if multiple levels of regional disaggregation are available indicate the lowest level of disaggregation (eg NUTS3 rather than NUTS2) if there is no regional data available use no data
Labour shortages and surpluses 2017
2017 37
Directorate-General for Employment Social Affairs and Inclusion European Network of Public Employment Services (PES)
ANNEX 2 SHORTAGE OCCUPATIONS
Shortage occupation PES count
Cooks 16 Plumbers and pipe fitters 13 Generalist medical practitioners 12 Welders and flamecutters 12 Heavy truck and lorry drivers 11 Metal working machine tool setters and operators 11 Nursing professionals 11 Software developers 11 Agricultural and industrial machinery mechanics and repairers 10 Cleaners and helpers in offices hotels and other establishments 10 Commercial sales representatives 10 Specialist medical practitioners 10 Systems analysts 10 Bricklayers and related workers 9 Building and related electricians 9 Butchers fishmongers and related food preparers 9 Motor vehicle mechanics and repairers 9 Nursing associate professionals 9 Sheet-metal workers 9 Shop sales assistants 9 Waiters 9 Carpenters and joiners 8 Civil engineers 8 Concrete placers concrete finishers and related workers 8 Electrical engineering technicians 8 Electronics engineering technicians 8 Mechanical engineers 8 Primary school teachers 8 Structural-metal preparers and erectors 8 Electronics engineers 7
Health care assistants 7 Manufacturing supervisors 7 Mechanical engineering technicians 7 Secondary education teachers 7 Accountants 6 Applications programmers 6 Bus and tram drivers 6 Contact centre salespersons 6 Early childhood educators 6 Electrical mechanics and fitters 6 Floor layers and tile setters 6 Plasterers 6 Roofers 6 Sewing machine operators 6 Software and applications developers and analysts not elsewhere classified 6 Toolmakers and related workers 6 Web and multimedia developers 6 Air conditioning and refrigeration mechanics 5 Building frame and related trades workers not elsewhere classified 5 Chefs 5 Civil engineering labourers 5 Construction supervisors 5 Earthmoving and related plant operators 5 Electrical engineers 5 Electrical line installers and repairers 5 Engineering professionals not elsewhere classified 5 Hairdressers 5 Information and communications technology operations technicians 5 Manufacturing managers 5 Physiotherapists 5 Real estate agents and property managers 5 Research and development managers 5 Spray painters and varnishers 5 Accounting associate professionals 4 Bakers pastry-cooks and confectionery makers 4
Labour shortages and surpluses 2017
2017 38
Directorate-General for Employment Social Affairs and Inclusion European Network of Public Employment Services (PES)
Shortage occupation PES count
Blacksmiths hammersmiths and forging press workers 4 Civil engineering technicians 4 Crane hoist and related plant operators 4 Database designers and administrators 4 Industrial and production engineers 4 Painters and related workers 4 Physical and engineering science technicians not elsewhere classified 4 Plastic products machine operators 4 Social work and counselling professionals 4 Accounting and bookkeeping clerks 3 Administrative and executive secretaries 3 Ambulance workers 3 Building construction labourers 3 Car taxi and van drivers 3 Cartographers and surveyors 3 Cleaning and housekeeping supervisors in offices hotels and other establishments 3 Contact centre information clerks 3 Draughtspersons 3 Fast food preparers 3 Freight handlers 3 Gardeners horticultural and nursery growers 3 Home-based personal care workers 3 Hotel receptionists 3 Information and communications technology installers and servicers 3 Insulation workers 3 Kitchen helpers 3 Manufacturing labourers not elsewhere classified 3 Medical imaging and therapeutic equipment technicians 3 Metal moulders and coremakers 3 Metal polishers wheel grinders and tool sharpeners 3 Midwifery professionals 3 Other language teachers 3 Personal services workers not elsewhere classified 3
Pharmacists 3 Policy administration professionals 3 Printers 3 Process control technicians not elsewhere classified 3 Sales and marketing managers 3 Shop supervisors 3 Special needs teachers 3 Stock clerks 3 Supply distribution and related managers 3 Survey and market research interviewers 3 Systems administrators 3 Technical and medical sales professionals (excluding ICT) 3 Translators interpreters and other linguists 3 Transport clerks 3 Vocational education teachers 3 Advertising and marketing professionals 2 Audiologists and speech therapists 2 Bartenders 2 Beauticians and related workers 2 Cashiers and ticket clerks 2 Chemical engineers 2 Child care workers 2 Computer network and systems technicians 2 Computer network professionals 2 Construction managers 2 Craft and related workers not elsewhere classified 2 Credit and loans officers 2 Crop farm labourers 2 Database and network professionals not elsewhere classified 2 Dentists 2 Domestic cleaners and helpers 2 Door to door salespersons 2 Driving instructors 2 Electrical and electronic equipment assemblers 2 Electronics mechanics and servicers 2 Elementary workers not elsewhere classified 2 Employment agents and contractors 2
Labour shortages and surpluses 2017
2017 39
Directorate-General for Employment Social Affairs and Inclusion European Network of Public Employment Services (PES)
Shortage occupation PES count
Field crop and vegetable growers 2 Financial analysts 2 Financial and investment advisers 2 Forestry and related workers 2 Garbage and recycling collectors 2 General office clerks 2 Graphic and multimedia designers 2 Information and communications technology service managers 2 Insurance representatives 2 Locomotive engine drivers 2 Mail carriers and sorting clerks 2 Management and organization analysts 2 Mathematicians actuaries and statisticians 2 Mechanical machinery assemblers 2 Medical and dental prosthetic technicians 2 Medical assistants 2 Messengers package deliverers and luggage porters 2 Metal finishing plating and coating machine operators 2 Metal processing plant operators 2 Optometrists and ophthalmic opticians 2 Personal care workers in health services not elsewhere classified 2 Police officers 2 Policy and planning managers 2 Production clerks 2 Restaurant managers 2 Retail and wholesale trade managers 2 Sales workers not elsewhere classified 2 Sewing embroidery and related workers 2 Street food salespersons 2 Tailors dressmakers furriers and hatters 2 Telecommunications engineers 2 Advertising and public relations managers 1 Aged care services managers 1
Agricultural technicians 1 Aircraft engine mechanics and repairers 1 Aircraft pilots and related associate professionals 1 Assemblers not elsewhere classified 1 Authors and related writers 1 Bank tellers and related clerks 1 Bleaching dyeing and fabric cleaning machine operators 1 Bookmakers croupiers and related gaming workers 1 Business services agents not elsewhere classified 1 Buyers 1 Cabinet-makers and related workers 1 Cement stone and other mineral products machine operators 1 Chemical and physical science technicians 1 Chemical engineering technicians 1 Chemical processing plant controllers 1 Chemical products plant and machine operators 1 Chemists 1 Conference and event planners 1 Customs and border inspectors 1 Data entry clerks 1 Dental assistants and therapists 1 Dieticians and nutritionists 1 Dispensing opticians 1 Domestic housekeepers 1 Economists 1 Education methods specialists 1 Environmental and occupational health and hygiene professionals 1 Environmental and occupational health inspectors and associates 1 Fibre preparing spinning and winding machine operators 1 Finance managers 1 Financial and insurance services branch managers 1 Fire-fighters 1 Fitness and recreation instructors and program leaders 1 Food and beverage tasters and graders 1 Food and related products machine operators 1
Labour shortages and surpluses 2017
2017 40
Directorate-General for Employment Social Affairs and Inclusion European Network of Public Employment Services (PES)
Shortage occupation PES count
Food service counter attendants 1 Forestry labourers 1 Fruit vegetable and related preservers 1 Fur and leather preparing machine operators 1 Glass and ceramics plant operators 1 Hand launderers and pressers 1 Hand packers 1 Handicraft workers in textile leather and related materials 1 Health associate professionals not elsewhere classified 1 Health professionals not elsewhere classified 1 House builders 1 Human resource managers 1 Incinerator and water treatment plant operators 1 Information and communications technology user support technicians 1 Judges 1 Lawyers 1 Legal and related associate professionals 1 Legal professionals not elsewhere classified 1 Library clerks 1 Lifting truck operators 1 Livestock and dairy producers 1 Livestock farm labourers 1 Medical and pathology laboratory technicians 1 Medical secretaries 1 Metal production process controllers 1 Mining and quarrying labourers 1 Mining engineers metallurgists and related professionals 1 Mixed crop and animal producers 1 Mixed crop growers 1 Motorcycle drivers 1 Odd job persons 1 Other cleaning workers 1 Other music teachers 1
Paper products machine operators 1 Personnel and careers professionals 1 Personnel clerks 1 Pet groomers and animal care workers 1 Physicists and astronomers 1 Physiotherapy technicians and assistants 1 Potters and related workers 1 Power production plant operators 1 Prison guards 1 Product and garment designers 1 Psychologists 1 Pulp and papermaking plant operators 1 Railway brake signal and switch operators 1 Receptionists (general) 1 Refuse sorters 1 Riggers and cable splicers 1 Scribes and related workers 1 Secretaries (general) 1 Securities and finance dealers and brokers 1 Security guards 1 Senior government officials 1 Senior officials of special-interest organizations 1 Shelf fillers 1 Ships engineers 1 Shoemaking and related machine operators 1 Social work associate professionals 1 Stall and market salespersons 1 Stationary plant and machine operators not elsewhere classified 1 Stonemasons stone cutters splitters and carvers 1 Street and related service workers 1 Sweepers and related labourers 1 Teaching professionals not elsewhere classified 1 Telecommunications engineering technicians 1 Textile fur and leather products machine operators not elsewhere classified 1 Trade brokers 1 Travel attendants and travel stewards 1 Travel guides 1
Labour shortages and surpluses 2017
2017 41
Directorate-General for Employment Social Affairs and Inclusion European Network of Public Employment Services (PES)
Shortage occupation PES count
Tree and shrub crop growers 1 Underwater divers 1 University and higher education teachers 1 Vehicle cleaners 1 Veterinarians 1 Weaving and knitting machine operators 1 Web technicians 1 Wood processing plant operators 1 Woodworking-machine tool setters and operators 1
Labour shortages and surpluses 2017
2017 42
Directorate-General for Employment Social Affairs and Inclusion European Network of Public Employment Services (PES)
ANNEX 3 SURPLUS OCCUPATIONS
Surplus occupation PES count
General office clerks 8 Shop sales assistants 8 Advertising and marketing professionals 6 Bank tellers and related clerks 6 Sociologists anthropologists and related professionals 6 Child care workers 5 Hairdressers 5 Journalists 5 Cashiers and ticket clerks 4 Cleaners and helpers in offices hotels and other establishments 4 Hand packers 4 Mail carriers and sorting clerks 4 Photographers 4 Receptionists (general) 4 Tailors dressmakers furriers and hatters 4 Accounting and bookkeeping clerks 3 Administrative and executive secretaries 3 Beauticians and related workers 3 Biologists botanists zoologists and related professionals 3 Bricklayers and related workers 3 Broadcasting and audio-visual technicians 3 Civil engineering labourers 3 Economists 3 Gardeners horticultural and nursery growers 3 Interior designers and decorators 3 Kitchen helpers 3 Legal professionals not elsewhere classified 3 Manufacturing labourers not elsewhere classified 3 Motor vehicle mechanics and repairers 3
Musicians singers and composers 3 Other artistic and cultural associate professionals 3 Painters and related workers 3 Philosophers historians and political scientists 3 Security guards 3 Sweepers and related labourers 3 Travel consultants and clerks 3 Waiters 3 Actors 2 Archivists and curators 2 Bakers pastry-cooks and confectionery makers 2 Bartenders 2 Building construction labourers 2 Business services and administration managers not elsewhere classified 2 Cabinet-makers and related workers 2 Car taxi and van drivers 2 Chemists 2 Cleaning and housekeeping supervisors in offices hotels and other establishments 2 Credit and loans officers 2 Customs and border inspectors 2 Elementary workers not elsewhere classified 2 Film stage and related directors and producers 2 Financial analysts 2 Forestry and related workers 2 Freight handlers 2 Graphic and multimedia designers 2 Health care assistants 2 Hotel receptionists 2 Lawyers 2 Legal and related associate professionals 2 Library clerks 2 Livestock and dairy producers 2 Management and organization analysts 2 Messengers package deliverers and luggage porters 2 Odd job persons 2 Office supervisors 2 Plasterers 2
Labour shortages and surpluses 2017
2017 43
Directorate-General for Employment Social Affairs and Inclusion European Network of Public Employment Services (PES)
Surplus occupation PES count
Police officers 2 Pre-press technicians 2 Print finishing and binding workers 2 Printers 2 Prison guards 2 Product and garment designers 2 Psychologists 2 Public relations professionals 2 Religious professionals 2 Secondary education teachers 2 Secretaries (general) 2 Social work and counselling professionals 2 Stall and market salespersons 2 Stock clerks 2 Teachers aides 2 Telephone switchboard operators 2 Travel guides 2 Visual artists 2 Advertising and public relations managers 1 Agricultural technicians 1 Announcers on radio television and other media 1 Assemblers not elsewhere classified 1 Building and related electricians 1 Building architects 1 Building caretakers 1 Building frame and related trades workers not elsewhere classified 1 Business services agents not elsewhere classified 1 Buyers 1 Carpenters and joiners 1 Chemical engineers 1 Civil engineers 1 Clearing and forwarding agents 1 Clerical support workers not elsewhere classified 1
Commercial sales representatives 1 Conference and event planners 1 Contact centre information clerks 1 Contact centre salespersons 1 Cooks 1 Crane hoist and related plant operators 1 Creative and performing artists not elsewhere classified 1 Dancers and choreographers 1 Data entry clerks 1 Database designers and administrators 1 Domestic cleaners and helpers 1 Domestic housekeepers 1 Draughtspersons 1 Driving instructors 1 Early childhood educators 1 Electronics mechanics and servicers 1 Farming forestry and fisheries advisers 1 Fashion and other models 1 Fast food preparers 1 Field crop and vegetable growers 1 Filing and copying clerks 1 Finance managers 1 Financial and insurance services branch managers 1 Financial and investment advisers 1 Fire-fighters 1 Fitness and recreation instructors and program leaders 1 Floor layers and tile setters 1 Food service counter attendants 1 Fruit vegetable and related preservers 1 Gallery museum and library technicians 1 Garbage and recycling collectors 1 Garment and related pattern-makers and cutters 1 Glass and ceramics plant operators 1 Government tax and excise officials 1 Hand launderers and pressers 1
Labour shortages and surpluses 2017
2017 44
Directorate-General for Employment Social Affairs and Inclusion European Network of Public Employment Services (PES)
Surplus occupation PES count
Heavy truck and lorry drivers 1 House builders 1 Hunters and trappers 1 Information and communications technology installers and servicers 1 Information and communications technology user support technicians 1 Insurance representatives 1 Jewellery and precious-metal workers 1 Judges 1 Legal secretaries 1 Librarians and related information professionals 1 Life science technicians (excluding medical) 1 Lifting truck operators 1 Managing directors and chief executives 1 Manufacturing supervisors 1 Medical and dental prosthetic technicians 1 Metal moulders and coremakers 1 Mining and quarrying labourers 1 Mixed crop and animal producers 1 Mixed crop growers 1 Mobile farm and forestry plant operators 1 Musical instrument makers and tuners 1 Other language teachers 1 Pawnbrokers and money-lenders 1 Personnel and careers professionals 1 Pet groomers and animal care workers 1 Photographic products machine operators 1 Physical and engineering science technicians not elsewhere classified 1 Physicists and astronomers 1 Police inspectors and detectives 1 Precision-instrument makers and repairers 1 Primary school teachers 1 Process control technicians not elsewhere classified 1 Product graders and testers (excluding foods and beverages) 1
Production clerks 1 Professional services managers not elsewhere classified 1 Protective services workers not elsewhere classified 1 Research and development managers 1 Retail and wholesale trade managers 1 Roofers 1 Sales workers not elsewhere classified 1 Senior government officials 1 Service station attendants 1 Shelf fillers 1 Shop supervisors 1 Social work associate professionals 1 Special needs teachers 1 Spray painters and varnishers 1 Statistical mathematical and related associate professionals 1 Stonemasons stone cutters splitters and carvers 1 Street food salespersons 1 Supply distribution and related managers 1 Teaching professionals not elsewhere classified 1 Technical and medical sales professionals (excluding ICT) 1 Training and staff development professionals 1 Translators interpreters and other linguists 1 Transport conductors 1 Tree and shrub crop growers 1 Typists and word processing operators 1 Undertakers and embalmers 1 Vocational education teachers 1 Weaving and knitting machine operators 1 Woodworking-machine tool setters and operators 1
Labour shortages and surpluses 2017
2017 45
Directorate-General for Employment Social Affairs and Inclusion European Network of Public Employment Services (PES)
ANNEX 4 THE RATIO OF UNEMPLOYED TO NEW HIRES
ISCO-08 title
2015
UE
Recruited in the
last year (lt12
months)
Ratio of UE to new recruits
Street and related service workers 85 104 08 Agricultural forestry and fishery labourers 3913 5343 07 Mining and construction labourers 1937 3525 05 Creative and performing artists 610 1115 05 Refuse workers 1036 1923 05 Painters building structure cleaners and related trades workers 1116 2117 05 Street and market salespersons 195 389 05 Building frame and related trades workers 3632 7353 05 Mining manufacturing and construction supervisors 626 1315 05 Ships deck crews and related workers 53 114 05 Market gardeners and crop growers 1471 3207 05 Managing directors and chief executives 304 667 05 Travel attendants conductors and guides 229 538 04 Wood treaters cabinet-makers and related trades workers 491 1159 04 Manufacturing labourers 1640 3909 04 Domestic hotel and office cleaners and helpers 5679 13545 04 Other stationary plant and machine operators 822 1961 04 Mobile plant operators 1038 2497 04 Building finishers and related trades workers 1519 3680 04 Textile fur and leather products machine operators 431 1048 04 Garment and related trades workers 422 1047 04 Chemical and photographic products plant and machine operators 157 389 04 Food processing and related trades workers 930 2330 04 Vehicle window laundry and other hand cleaning workers 291 754 04 Sheet and structural metal workers moulders and welders and related workers
996 2603 04
Waiters and bartenders 4399 11595 04 Cooks 1529 4039 04 Metal processing and finishing plant operators 208 557 04 Printing trades workers 203 548 04 Forestry and related workers 130 351 04 Protective services workers 1347 3658 04 Transport and storage labourers 2532 6939 04 Fishery workers hunters and trappers 46 128 04 Material-recording and transport clerks 1671 4630 04 Process control technicians 179 517 03 Mining and mineral processing plant operators 94 274 03 Telecommunications and broadcasting technicians 177 519 03 Blacksmiths toolmakers and related trades workers 816 2409 03 Building and housekeeping supervisors 678 2045 03
Secretaries (general) 1072 3259 03 Assemblers 850 2586 03 Other craft and related workers 258 810 03 Shop salespersons 6600 21042 03 Electrical equipment installers and repairers 958 3060 03 Food and related products machine operators 437 1400 03 Other sales workers 1087 3510 03 Food preparation assistants 1646 5337 03 Mixed crop and animal producers 387 1260 03 Car van and motorcycle drivers 1155 3764 03 Client information workers 1993 6531 03 Sports and fitness workers 605 1984 03 Handicraft workers 194 638 03 Life science technicians and related associate professionals 82 271 03 Keyboard operators 283 940 03 Electronics and telecommunications installers and repairers 290 963 03 Other personal services workers 313 1047 03 Vocational education teachers 279 940 03 Other teaching professionals 744 2518 03 General office clerks 966 3272 03 Authors journalists and linguists 335 1135 03 Hairdressers beauticians and related workers 806 2796 03
Labour shortages and surpluses 2017
2017 46
Directorate-General for Employment Social Affairs and Inclusion European Network of Public Employment Services (PES)
ISCO-08 title
2015
UE
Recruited in the
last year (lt12
months)
Ratio of UE to new recruits
Animal producers 189 660 03 Other elementary workers 976 3401 03 Machinery mechanics and repairers 1134 3962 03 Ship and aircraft controllers and technicians 80 281 03 Hotel and restaurant managers 344 1220 03 Cashiers and ticket clerks 908 3220 03 Retail and wholesale trade managers 224 809 03 Sales marketing and development managers 311 1124 03 Physical and engineering science technicians 1204 4366 03 Administrative and specialised secretaries 1106 4040 03 Sales and purchasing agents and brokers 1294 4754 03 Rubber plastic and paper products machine operators 256 941 03 Artistic cultural and culinary associate professionals 511 1906 03 Numerical clerks 944 3532 03 Other services managers 184 691 03 Child care workers and teachers aides 1335 5005 03 Heavy truck and bus drivers 1426 5349 03 Business services and administration managers 383 1439 03 Information and communications technology service managers 67 257 03 Regulatory government associate professionals 209 807 03 Life science professionals 176 681 03 Wood processing and papermaking plant operators 97 379 03 Locomotive engine drivers and related workers 46 179 03 Legal professionals 315 1245 03 Personal care workers in health services 2195 8787 02 Physical and earth science professionals 85 345 02 Street vendors (excluding food) 50 204 02 Architects planners surveyors and designers 515 2092 02 Other clerical support workers 901 3657 02 Business services agents 510 2114 02 Manufacturing mining construction and distribution managers 361 1507 02 Tellers money collectors and related clerks 381 1612 02 Librarians archivists and curators 58 248 02 Medical and pharmaceutical technicians 255 1099 02 University and higher education teachers 301 1333 02 Information and communications technology operations and user support technicians
418 1888 02
Legal social and religious associate professionals 920 4348 02 Financial and mathematical associate professionals 601 2852 02 Sales marketing and public relations professionals 865 4172 02 Finance professionals 472 2281 02 Engineering professionals (excluding electrotechnology) 635 3118 02 Other health associate professionals 531 2657 02
Social and religious professionals 460 2317 02 Professional services managers 176 891 02 Nursing and midwifery associate professionals 556 2855 02 Legislators and senior officials 53 286 02 Database and network professionals 83 455 02 Administration professionals 641 3673 02 Primary school and early childhood teachers 575 3345 02 Electrotechnology engineers 142 827 02 Secondary education teachers 471 2812 02 Other health professionals 346 2083 02 Nursing and midwifery professionals 273 1760 02 Software and applications developers and analysts 631 4159 02 Medical doctors 293 1944 02 No occupation 152894 00
No answer 2531 578 44 Total 249561 294937 08
Labour shortages and surpluses 2017
2017 47
Directorate-General for Employment Social Affairs and Inclusion European Network of Public Employment Services (PES)
HOW TO OBTAIN EU PUBLICATIONS
Free publications
bull one copy
via EU Bookshop (httpbookshopeuropaeu)
bull more than one copy or postersmaps
from the European Unionrsquos representations (httpeceuropaeurepresent_enhtm)
from the delegations in non-EU countries
(httpeeaseuropaeudelegationsindex_enhtm)
by contacting the Europe Direct service (httpeuropaeueuropedirectindex_enhtm)
or calling 00 800 6 7 8 9 10 11 (free phone number from anywhere in the EU) () () The information given is free as are most calls (though some operators phone boxes or hotels may charge you)
Priced publications
bull via EU Bookshop (httpbookshopeuropaeu)
Priced subscriptions
bull via one of the sales agents of the Publications Office of the European Union
(httppublicationseuropaeuothersagentsindex_enhtm)
doi 10276731262
KE-0
1-1
8-2
63-E
N-N
[Ca
talo
gu
e n
um
be
r]
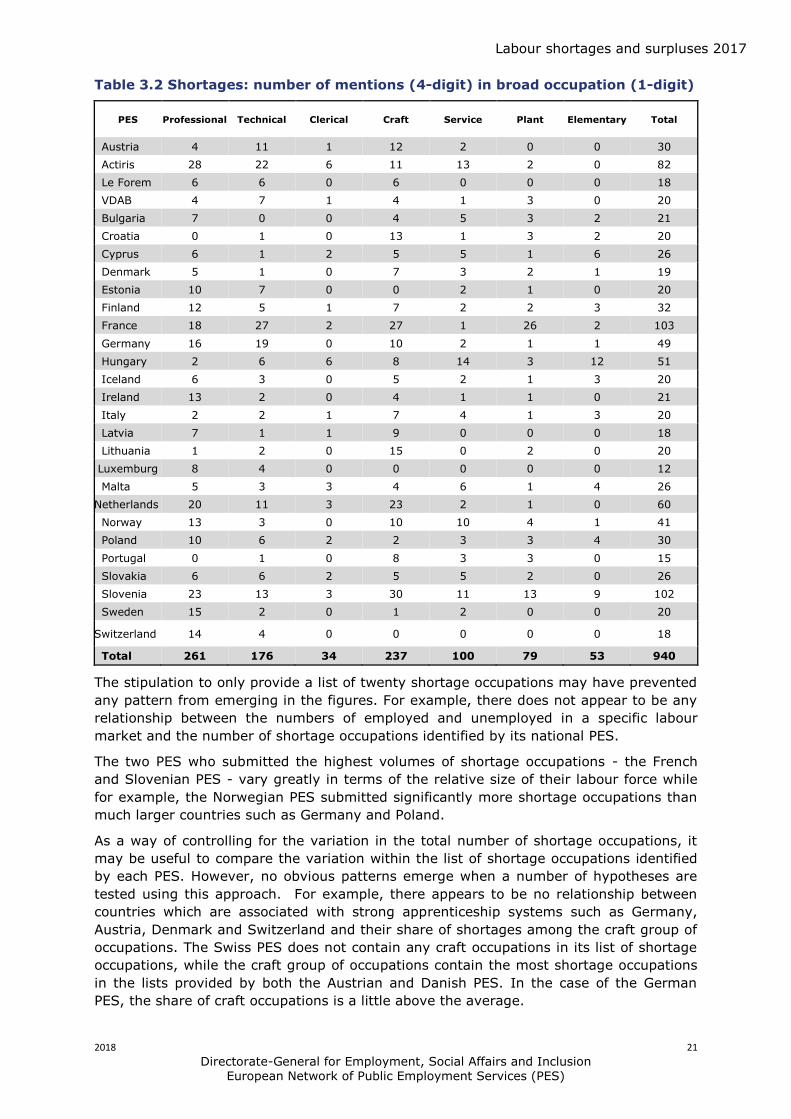
Labour shortages and surpluses 2017
2018 21
Directorate-General for Employment Social Affairs and Inclusion European Network of Public Employment Services (PES)
Table 32 Shortages number of mentions (4-digit) in broad occupation (1-digit)
PES Professional Technical Clerical Craft Service Plant Elementary Total
Austria 4 11 1 12 2 0 0 30
Actiris 28 22 6 11 13 2 0 82
Le Forem 6 6 0 6 0 0 0 18
VDAB 4 7 1 4 1 3 0 20
Bulgaria 7 0 0 4 5 3 2 21
Croatia 0 1 0 13 1 3 2 20
Cyprus 6 1 2 5 5 1 6 26
Denmark 5 1 0 7 3 2 1 19
Estonia 10 7 0 0 2 1 0 20
Finland 12 5 1 7 2 2 3 32
France 18 27 2 27 1 26 2 103
Germany 16 19 0 10 2 1 1 49
Hungary 2 6 6 8 14 3 12 51
Iceland 6 3 0 5 2 1 3 20
Ireland 13 2 0 4 1 1 0 21
Italy 2 2 1 7 4 1 3 20
Latvia 7 1 1 9 0 0 0 18
Lithuania 1 2 0 15 0 2 0 20
Luxemburg 8 4 0 0 0 0 0 12
Malta 5 3 3 4 6 1 4 26
Netherlands 20 11 3 23 2 1 0 60
Norway 13 3 0 10 10 4 1 41
Poland 10 6 2 2 3 3 4 30
Portugal 0 1 0 8 3 3 0 15
Slovakia 6 6 2 5 5 2 0 26
Slovenia 23 13 3 30 11 13 9 102
Sweden 15 2 0 1 2 0 0 20
Switzerland 14 4 0 0 0 0 0 18
Total 261 176 34 237 100 79 53 940
The stipulation to only provide a list of twenty shortage occupations may have prevented
any pattern from emerging in the figures For example there does not appear to be any
relationship between the numbers of employed and unemployed in a specific labour
market and the number of shortage occupations identified by its national PES
The two PES who submitted the highest volumes of shortage occupations - the French
and Slovenian PES - vary greatly in terms of the relative size of their labour force while
for example the Norwegian PES submitted significantly more shortage occupations than
much larger countries such as Germany and Poland
As a way of controlling for the variation in the total number of shortage occupations it
may be useful to compare the variation within the list of shortage occupations identified
by each PES However no obvious patterns emerge when a number of hypotheses are
tested using this approach For example there appears to be no relationship between
countries which are associated with strong apprenticeship systems such as Germany
Austria Denmark and Switzerland and their share of shortages among the craft group of
occupations The Swiss PES does not contain any craft occupations in its list of shortage
occupations while the craft group of occupations contain the most shortage occupations
in the lists provided by both the Austrian and Danish PES In the case of the German
PES the share of craft occupations is a little above the average
Labour shortages and surpluses 2017
2018 22
Directorate-General for Employment Social Affairs and Inclusion European Network of Public Employment Services (PES)
Table 33 Surpluses number of mentions (4-digit) in broad occupation (1-digit)
PES Professional Technical Clerical Craft Service Plant Elementary Total
Le Forem 2 1 1 1 6 0 8 19
Bulgaria 6 3 2 0 4 0 2 17
Switzerland 0 4 2 4 1 2 3 16
Cyprus 5 0 0 2 0 0 3 10
Denmark 3 2 3 0 6 1 4 19
Estonia 6 2 3 2 6 0 1 20
Finland 16 7 6 10 3 1 0 43
France 10 10 1 2 5 1 0 29
Croatia 4 0 0 0 0 0 0 4
Hungary 6 9 3 16 15 1 2 52
Ireland 1 1 4 3 5 1 7 22
Iceland 11 1 2 2 1 0 1 18
Lithuania 0 3 1 0 2 2 0 8
Latvia 4 4 0 0 3 1 3 15
Netherlands 3 2 9 0 9 0 1 24
Poland 0 0 0 0 1 0 0 1
Sweden 4 3 7 1 3 0 2 20
Slovakia 7 1 3 1 2 0 0 14
Total 88 53 47 44 72 10 37 351
The most striking aspect of the geographical distribution of surplus occupations is the
relatively low number of occupations which were reported Most of the reporting PES
(eleven) provided less than the twenty surplus occupations they were requested to
submit Furthermore if the contributions from the Hungarian and Finnish PES are
excluded the average number of surplus occupations submitted by the other PES is
sixteen
With the exception of the Icelandic Finnish French and Hungarian PES the list of
surplus occupations remains in single figures across all the broad occupational groups
Such low figures result in limited cross-border matching possibilities which are explored
in the next chapter
The PES were also asked to indicate the lowest regional level at which they could provide
data on both shortage and surplus occupations Their response is outlined in Table 34
above A total of twenty PES responded positively in the case of shortage occupations
and twelve in the case of surplus occupations In the case of shortage occupations nine
PES indicated that they could provide data at NUTs3 level while eight PES stated that
they could provide the data at NUTs1 level In the case of surplus occupations five PES
indicated that they could provide the data at NUTs1 level and another five PES responded
that they could provide the data at NUTs 3 level There were very few PES who indicated
that the lowest level at which they could provide data was at NUTs2 or NUTs4 levels
Labour shortages and surpluses 2017
2018 23
Directorate-General for Employment Social Affairs and Inclusion European Network of Public Employment Services (PES)
Table 34 Availability of data on shortagessurpluses at regional levels
Shortage occupations Surplus occupations
Country NUTS1 NUTS2 NUTS3 NUTS4 No
data NUTS1 NUTS2 NUTS3 NUTS4
Austria
x
Belgium Actiris
x
Belgium Le Forem
x
x
Belgium VDAB
x
Bulgaria
x
x
x
Croatia x
x
Cyprus
x
x
Denmark
x
x
Estonia x
x
Finland
x
x
France
x
x
Germany x
Hungary
x
x
Iceland x
x
Ireland x
x
Italy
x
Latvia
x
x
Lithuania
x
x
Luxembourg x
Malta
x
Netherlands
x
x
Norway
x
Poland
x
x
Portugal
x
Slovakia
x
x
Slovenia x
Sweden
x
x
Switzerland
x
x
Note Bulgaria has regional data for some occupations
34 Tracking shortages over time
This is the third annual study on lsquoBottleneck Occupationsrsquo the previous two studies were
undertaken in 2016 and 2015 The findings in both of those studies were presented in 3-
digit codes To make the findings comparable over time the 4-digit shortage and surplus
occupations from the current study are aggregated up to 3-digit occupations as shown in
Table 35
A striking aspect of the list of occupations in Table 35 is the degree of consistency
displayed over the period 2015-2017 inclusive not simply in terms of the occupations
reported by the PES but also in terms of the number of PES who identified them as
shortages (ie their ranking) Not only does the 3-digit occupation category of lsquosoftware
and applications developersrsquo occupy the top ranking in each of the years five of the top
ranking six occupations are the same The only notable exception is that the finance
professional and associate professional occupations featured in the list of most reported
shortage occupations in 2015 but slipped out of this list in 2016 and 2017
Labour shortages and surpluses 2017
2018 24
Directorate-General for Employment Social Affairs and Inclusion European Network of Public Employment Services (PES)
Table 35 Ranking of shortage occupations (3-digit)
Rank
Top occupations in 2017 2017 2016 2015
Software and application developers 1 1 1
Sheet and structural metal workers 2 3 2
Medical doctors 3 5 2
Blacksmiths toolmakers and related trades 4 3 4
Building finishes and related trade workers 4 6 4
Building frame and related trade workers 4 3 4
Cooks 4 7 7
Engineering professionals 5 6 6
Physical and engineering science technicians 6 7 na
Electrical equipment installers and repairers 7 4 5
Heavy truck and bus drivers 7 5 4
Machinery mechanics and repairers 8 7 5
Nursing and midwifery professionals 8 6 na
Sales and purchasing agents and brokers 9 2 5
Shop salespersons 10 7 8
Electro technology engineers 10 na na
Primary school and early childhood teachers 10 na na
Domestic hotel and office cleaners and helpers 10 na na
Waiters and bartenders 10 na na
35 3-digit vs 4-digit
There are advantages and disadvantages associated with using the more aggregated 3-
digit occupation classification as it was done in previous studies The bundling of
individual occupations into families provides greater visibility of shortages at a broad
skill level (eg all software related occupations)
However there are distinct disadvantages in using the 3-digit occupations and these
apply particularly to their practical usefulness to education and training providers In
many cases shortages identified at 3-digit level do not provide a reliable basis for
identifying the specific skill which is in shortage or surplus
By combining the analyses of the 4-digit and corresponding 3-digit classifications in this
report many examples are revealed of how an exclusive reliance on the 3-digit
classification could be seriously misleading Thus the findings in this report show that
within the 3-digit classification of lsquosheet and structural metal workers moulders and
weldersrsquo the 4-digit occupation which is in short supply is lsquoweldersrsquo and not for example
lsquosheet metal workersrsquo This is an important insight because in many European countries
the skills of welding and sheet metal work are provided through entirely different
vocational programmes8
There are many examples of this phenomenon in the 3-digit occupations in Table 35 For
example the analysis in this report shows that toolmakers are a shortage occupation
8 In Ireland for example sheet metal workers and welders undertake entirely different apprenticeships
Labour shortages and surpluses 2017
2018 25
Directorate-General for Employment Social Affairs and Inclusion European Network of Public Employment Services (PES)
but blacksmiths are not Furthermore the 3-digit classification disguises the extent of the
reported shortage Thus while the 3-digit occupation of professional nursing and
midwifery is shown in the current report as being shortage occupations a total of eleven
PES reported professional nursing as a shortage compared to only three PES reporting
professional midwifery as a shortage By bundling these occupations together the
significant difference in the relative severity of the shortage is not apparent
This phenomenon applies equally to the surplus occupations which were identified in this
report For example lsquochildcare workersrsquo were described as a surplus occupation by five
PES But in the 3-digit classification they are bundled together with lsquospecial needs
teachersrsquo which was not identified as a surplus occupation
36 Conclusions
There are a number of conclusions which can be drawn from the analyses in this chapter
Firstly the sources used by many of the PES to identify shortage occupations is one of
the main reasons why only eighteen PES provided data on surplus occupations Many of
the PES relied on the results of employer surveys forecasting models and immigration
data to identify shortages and these sources in general do not provide data on surplus
occupations However it was by no means the only reason why so many PES did not
provide data on surplus organisations and this issue will have to be addressed before the
commencement of the 2018 study In the future PES data should be augmented by data
collected by other bodies as outlined in the new EU Regulation
Secondly there is no obvious explanation for the geographic distribution of shortages
and surpluses In some cases countries with relatively small labour forces have a
relatively high number of shortage occupations while a strong apprenticeship system
does not appear to prevent a relatively high share of the identified shortages being in the
craft occupations It may be that the stipulation to only include twenty shortage and
surplus occupations has created a situation where some countries with a relatively large
labour force are artificially constrained to submit a much smaller number of shortage
occupations than they actually have
Thirdly there is a high degree of stability in relation to the occupations which were
identified as shortages in the 2015 2016 and 2017 editions of the Bottleneck report
Finally providing information on shortage and surplus occupations at 4-digit level is
much more useful from a policy perspective than providing the data at a more
aggregated level The results of the analyses at 4-digit level show which specific
occupations in the bundle of occupations used in the previous reports were in shortage
and which were not This is also true of the occupations which were identified as surplus
occupations A more aggregated group of occupations does not allow for the targeting of
specific individual occupations either for increasing training provision or for enhancing
cross border mobility Indeed as a number of specific examples show were providers of
vocational training or indeed policy makers to act on the basis of the 3-digit shortage and
surplus occupations identified in previous reports they could very well have assign
resources to occupations which were neither in shortage nor in surplus
Labour shortages and surpluses 2017
2018 26
Directorate-General for Employment Social Affairs and Inclusion European Network of Public Employment Services (PES)
4 THE CAUSES OF SKILL SHORTAGES AND POTENTIAL SOLUTIONS
41 Introduction
The focus of this chapter is on identifying the possible causes of skills shortages and
surpluses and exploring ways in which these imbalances may be resolved The chapter
begins with a review of the nature of skills and labour market imbalances and concludes
with an exploration of the extent to which enhanced cross-border mobility policies and
more equal gender representation could contribute to the alleviation of skills and labour
imbalances in certain shortage occupations in the EEA labour market
42 The role of skills and labour shortages in skills imbalances
One of the new questions included in the current study asks the PES to identify the
nature of the shortage (ie is it a skill shortage or a labour shortage) in relation to each
shortage occupation they identified It was explained in the questionnaire that labour
shortages occur when there are a sufficient number of appropriately qualified job-seekers
to fill the vacancies which arise but for a variety of reasons many of them do not wish
to work in the occupation in question Their response to this question is summarised in
Table 41 in respect of the twenty occupations which were reported by the most PES
A total of twenty-six PES classified their shortage occupations as skill or labour
shortages and they classified most of the occupations as skill shortages Indeed in the
case of seven occupations plumbers doctors software developers electricians
electronic engineers electronic engineering technicians bus and tram drivers and
mechanical engineers all of the reporting PES classified the shortage as a skills deficit
Each labour market within the EEA is regulated in a particular manner and conditions of
employment even within the same occupation vary throughout the region This is why
many occupations while classified by most of the PES as reflecting skill deficits
nevertheless are classified by some PES as labour shortages
However the number of PES involved is very small indeed Only in the case of three
occupations lsquowaitersrsquo lsquoshop sales assistantsrsquo and lsquoprimary school teachersrsquo are there
more PES classifying the shortage as a labour shortage then a skills deficit The first two
occupations are undoubtedly labour shortages This is because there are few if any
barriers to working in these occupations9
The inclusion of lsquoprimary school teachersrsquo as a labour shortage is however a surprise It
was identified by eight PES as a shortage occupation two of whom classified the
occupation as a shortage of high magnitude It would be necessary to conduct research
into the conditions of employment ndash including qualification criteria ndash within the countries
where the reporting PES are located to establish if this classification of the occupation as
a labour shortage is warranted
With some notable exceptions the response of the PES to classifying their shortage
occupations as skill or labour shortages demonstrates that the PES understand these
concepts Occupations such as professional nurses which are obviously suffering from a
shortage of qualified job-seekers in the EEA are overwhelmingly categorised as a skills
shortage while less skilled occupations such as cleaners are categorised as being on the
borderline between skills and labour shortages
9 Both occupations have relatively high ratios of unemployed to new hires (Annex 4)
Labour shortages and surpluses 2017
2018 27
Directorate-General for Employment Social Affairs and Inclusion European Network of Public Employment Services (PES)
Table 41 Skill and labour shortages
Occupation
Number of PES
reporting occupation
as skills shortage
Number of PES
reporting occupation as labour shortage
Number of PES
reporting occupations as skill and
labour shortage
Total number of
PES reporting on skillslabour
shortage
Cooks 9 1 0 10
Plumbers and pipe fitters 8 0 0 8
Generalist medical Practitioners 7 0 0 7
Heavy truck and lorry drivers 4 2 1 7
Metal workers machine tool setting and operators
3 3 1 7
Welders and flame cutters 4 2 1 7
Nursing professionals 5 1 0 6
Software developers 6 0 0 6
Systems analyst 5 1 0 6
Bricklayers and related trades 4 1 0 5
Building and related electricians 5 0 0 5
Butchers fishmongers and related food 3 2 0 5
Cleaners and helpers in offices 3 2 0 5
Commercial sales representatives 2 2 1 5
Electronic engineers 5 0 0 5
Manufacturing supervisors 4 1 0 5
Motor vehicle mechanics and repairers 3 1 1 5
Nursing associate professionals 4 1 0 5
Primary school teachers 2 3 0 5
Shop sales assistants 1 4 0 5
Waiters 2 3 0 5
Agriculture and industrial machinery repairers
3 1 0 4
Application programmers 3 1 0 4
Bus and tram drivers 4 0 0 4
Electronic engineering technicians 4 0 0 4
Health care assistants 3 1 0 4
Mechanical engineers 4 0 0 4
Sheet metal workers 3 1 0 4
Structural metal preparers and erectors 3 1 0 4
Total number of PES reporting 16 8 2 26
The atypical working hours associated with heavy goods vehicle driving is recognised by
two of the six PES who classify shortages in the occupation as labour shortages while the
unpleasant conditions associated with working in butchery shops and abattoirs is
reflected in the fact that two of the five PES who categorised the occupation as a
shortage occupation classify it as a labour shortage
43 Location of skill imbalances and cross border mobility
In recent years there has been considerable discussion on the potential role which
enhanced cross-border mobility could play in alleviating labour market imbalances The
attractiveness of such a policy is obvious The European Union is a very large
Labour shortages and surpluses 2017
2018 28
Directorate-General for Employment Social Affairs and Inclusion European Network of Public Employment Services (PES)
marketplace embracing a very large labour force if even some of the shortages which
are reported by EEA countries could be resolved by exploiting the surpluses which are
reported by other EEA countries it could form the basis of a number of win-win solutions
for both job-seekers and businesses
An additional attraction of this policy is that it could potentially successfully address both
skills and labour shortages as working conditions associated with some labour shortages
in one country might be perceived as significantly more attractive in a different EEA
country
Table 44 provides a list of the top twenty shortage occupations which have at least one
PES in another EEA country reporting the occupation as a surplus
There are a number of aspects of the Table which are notable Firstly the list of top
occupations has changed quite dramatically from the list in Table 21 specifically none
of the professional and associate professional occupations are now on the list including
the four professional and associate professional health-related occupations or the two
professional software occupations What the Table shows is that there are no surpluses
reported in any of the EEA countries of doctors or nurses software developers or
systems analysts While the occupation of healthcare assistants is in surplus in many
countries it was not included in the list of top occupations because it was reported as a
shortage by only two PES
The figures in Table 42 show that there are three cross-border matching possibilities in
the case of bricklayers and motor mechanics and two possibilities in the case of
plasterers health care assistants and secondary school teachers
There is just one matching possibility in respect of a wide range of occupations including
cooks truck drivers commercial sales representatives electricians carpenters civil
engineers primary school teachers manufacturing supervisors telecentre salespersons
childhood education teachers floor layers and roofers
The fact that primary school teachers have only one cross border matching possibility
suggest that the classification of the occupation as a labour shortage by three of five PES
is an error In general labour shortages would be expected to have more cross border
matching possibilities than skill shortages because there are many job-seekers eligible to
work in the occupation in question and working conditions vary quite significantly from
country to country Indeed it is notable that the two other occupations which were
classified by the PES as predominantly labour shortages waiters and shop sales
assistants have a relatively high number of matching possibilities eight in the case of
shop sales assistants and three in the case of waiters
In general the PES did not classify the same occupation as both a shortage and a
surplus A striking exception is the Danish PES which categorised four of its shortage
occupations as surplus occupations also This is most likely due to the higher level of
granularity available in the Danish data (below 4-digit) so that some job titles within an
occupation are considered labour shortage while others skill shortage
44 Assessing gender composition of surpluses
The PES were asked to estimate the share of females in the occupations which they
identified as lsquosurplusrsquo occupations The restricting of this question to surplus occupations
was to avoid giving the impression that shortages were arising because of discriminatory
recruitment policies
Labour shortages and surpluses 2017
2018 29
Directorate-General for Employment Social Affairs and Inclusion European Network of Public Employment Services (PES)
A total of 13 PES reported any data on gender composition of surpluses However the
quality of information submitted did not provide a sufficient basis for an accurate
estimation of the gender composition of surpluses in some of the cases
It is suggested that in order to address gender imbalances in relation to shortages and
surpluses data from PES on job seekers should be combined with the LSF data on
employment by occupation
45 Conclusions
The analysis in chapter four has produced a number of interesting findings The analysis
reveals that the PES in general has the capacity to distinguish between skill and labour
shortages and to identify shortage occupations which have some cross-border matching
possibilities
The relatively low number of surplus occupations reflects two factors firstly only
eighteen PES submitted a list of surplus occupations and secondly in many cases the
lists did not include the maximum number of twenty occupations which were requested
This response has to be viewed against the background of an EEA labour market where
employment is expanding and unemployment is contracting However while this is a
positive development the relatively low number of surplus occupations has placed a
significant limit on the extent to which there were cross-border possibilities of matching
shortage with surplus occupations
The data indicates that there is a limitation to the extent to which the PES can be used to
identify the gender imbalances (eg under-representation of females in some
occupations) and that other sources should be explored
Labour shortages and surpluses 2017
2018 30
Directorate-General for Employment Social Affairs and Inclusion European Network of Public Employment Services (PES)
Table 43 The potential for cross-border matching of shortage and surplus occupations
No PES
Occupation PES reporting shortage PES reporting surplus No PES
16 Cooks AT Art BG CY DK HR IE IS IT MT NL NO PT SE SI SK lsaquo―rsaquo HU 1
11 Truck drivers ART VDAB BG DK HR LT IT NL NO PT SE SI SK lsaquo―rsaquo DK 1
10 Cleaners helpers CY DK HR FI IS HU NL NO PT SI lsaquo―rsaquo DK LF NL IE 4
10 Commercial sales VDAB ART DK FI FR IT IE PT PL SI lsaquo―rsaquo DK 1
9 Sales assistants AT ART BG CY DK IT NO SI SK lsaquo―rsaquo DK LF SE NL BG CH FI IE 8
9 Bricklayers ART DE DK HR HU LT NL PT SI lsaquo―rsaquo CY HU IE 3
9 Motor mechanics AT VDAB ART LF DK IT NO PT SI lsaquo―rsaquo SK CH EE 3
9 Waiters ART BG CY IS IT MT NO PT SI lsaquo―rsaquo HU EE IE 3
9 Electricians ART VDAB DE DK IS IT NL NO SI lsaquo―rsaquo FR 1
8 Carpenters DK HR HU FI NL NO PT SI lsaquo―rsaquo HU 1
8 Civil engineers ART CH DE FI FR NO SE SI lsaquo―rsaquo CY 1
8 Primary teachers ART BG DK IS NO SE SI SK lsaquo―rsaquo CY 1
7 Healthcare assist CY DK EE NL NO SI SK lsaquo―rsaquo DK NL 2
7 Second teacher ART BG FR NL NO SI SK lsaquo―rsaquo CY FI 2
7 Man supervisors ART VDAB LF DE EE FR SK lsaquo―rsaquo BG 1
6 Plasterers HR HU FI LT NL SI lsaquo―rsaquo HU IE 2
6 Tele centre sales ART HU FI FR MT NO lsaquo―rsaquo EE 1
6 Childhood educ FI LT NO SE SI SK lsaquo―rsaquo CY 1
6 Floor layers HU HR FI FR LT LV lsaquo―rsaquo HU 1
6 Roofers HR FI FR LT LV SI lsaquo―rsaquo HU 1
Bottlenecks Occupations 2017
2017 31
Directorate-General for Employment Social Affairs and Inclusion European Network of Public Employment Services (PES)
5 CONCLUSIONS AND RECOMMENDATIONS
51 Conclusions
The terms of reference for this study emphasise the desirability of creating a process for
the systematic collection of data on surplus and shortage occupations in the EEA area
which could be effectively used by EURES for cross border matching of shortage
occupations in some EEA countries with surplus occupations in others
The authors have responded to this emphasis by using a process which ensures that the
data gathered on shortage and surplus occupations is comprehensive accurate and of
practical use to EURES and the providers of education and training programmes The
process is comprehensive because it gathers information both on the extent of shortages
and surpluses and on their relative severity It is accurate because the list of shortage
and surplus occupations are shown to be consistent with the estimated value of the ratio
of unemployed to new hires Finally the process provides information which is of
practical use to EURES and the national providers of VET because the data gathered is on
individual occupations rather than on lsquobundles of occupationsrsquo as in previous studies The
analyses in this report shows that while these bundles of occupations contain some
occupations which are identified by the PES as shortage and surplus occupations they
also contain occupations which are neither in shortage nor in surplus and it is impossible
to distinguish one from the other
The data gathering process used in this report however was not devoid of weaknesses
Fortunately these weaknesses reflect the modus operandi of the PES and may be
rectified by including other institutions and agencies in the process For example the PES
use the same sources for the identification of both shortage and surplus occupations
This may have advantages in terms of accuracy when those sources include employersrsquo
surveys immigration data and the results of forecasting exercises However these
sources are not suitable for gathering data on surplus occupations and they are the main
reason why the number of surplus occupations provided by the PES were almost half the
number requested In the future PES data could be augmented by data gathered by
other bodies as outlined in recent EU Regulation 2016589
In addition the response to the question on the capacity of the PES to deliver data on
shortage and surplus occupations at a regional level was also disappointing perhaps
reflecting a misalignment in some EEA countries between the geographic configuration of
the local PES network and the NUTs regions
The analysis highlighted that in order to assess gender imbalances of shortages and
surpluses PES data needs to be augmented by other sources
Finally despite the low number of surplus occupations submitted by the PES it was
nevertheless possible to identify twenty shortage occupations in the EEA labour market
which had at least one cross-border matching possibility and many more than one in the
case of some shortage occupations
52 Recommendations
Based on the findings from the three bottleneck studies undertaken to date a model for
the gathering of data on shortages and surpluses is proposed (Figure 51) The model
includes features of the methodology applied in this study which were successful It also
includes a number of features which should be introduced to the process in order to
address some of the weaknesses which were identified in this study (highlighted in red)
Labour shortages and surpluses 2017
2017 32
Directorate-General for Employment Social Affairs and Inclusion European Network of Public Employment Services (PES)
However before this methodology is implemented it would be prudent to discuss data
requirements with PES and invite a broader range of institutions and agencies to
participate in aspects of the data gathering process in addition to the PES EURES
Regulation (EU) 2016589 of the European Parliament and of the Council which obliges
the appropriate national authorities to furnish such data annually is fortuitous in this
regard and should facilitate the implementation of this recommendation
In addition the results of these and other relevant studies should be disseminated to
PES Eures coordination group and other relevant agencies and institutions in order to
emphasise the importance of data and analysis in informing policy at EU and national
level which aims to resolve labour market imbalances
Labour shortages and surpluses 2017
2017 33
Directorate-General for Employment Social Affairs and Inclusion European Network of Public Employment Services (PES)
Figure 51 Model for gathering data on shortage and surplus occupations
Sources of data on surpluses PES data from other relevant agencies
In those cases where the source used by the PES to identify shortage occupations cannot
be used to identify surplus occupations other institutions or other sources or both should be availed of to ensure that comprehensive data on surplus occupations are provided to the appropriate national authority
Dimensions of shortagessurpluses extent (number of reporting PES) and severity (high or low
magnitude)
Data should be systematically gathered on both the extent of shortage and surplus
occupations in the EEA and on their relative severity
Type of shortage skill vs labour shortages
The providers of the data on shortage occupations must also distinguish between skill and labour shortages because this distinction is necessary for the accurate identification of
shortage occupations and for the choice of the appropriate policy response to identified shortages
Classification of occupations used ISCO 08 4-digit codes (or translation into these codes)
All data should be either initially gathered in ISCO 08 4-digit codes or translated into these
codes This ensures that the data refers to specific individual occupations and is of practical use to EURES and the national providers of VET
Accuracy test cross-check with LSF data (ratio of unemployed to new hires)
The accuracy of the submitted lists of shortage and surplus occupations should be assessed
by comparing the most widely reported surplus and shortage occupations with the estimated values of the ratios of employed (by previous occupation) to new hires at the aggregated EU28 level These ratios should be based on an analysis of the most up-to date
Labour Force Survey (LFS) data
Gender balance assessment LFS data on employment at occupational level by gender PES job
seekers
The gender composition of shortage and surplus occupations should be based on the most
up to date analyses of LFS data on employment by gender and the PES job seeker data
Regional balance assessment LSF data data from relevant agencies
Where regional data is required other agencies and institutions should be requested to
provide the data in those cases where the data cannot be provided by the regional PES network because it is not geographically aligned to the NUTs regions
Labour shortages and surpluses 2017
2017 34
Directorate-General for Employment Social Affairs and Inclusion European Network of Public Employment Services (PES)
Number of occupations reporting should be extended beyond 20 occupations but with upper
limit (eg 50)
Consideration should be given to allowing the agencies responsible for identifying shortage
and surplus occupations a greater range of flexibility in terms of the numbers of occupations which should be identified A minimum to maximum range would be a more realistic approach as it would reflect the fact that the labour markets of the EEA vary significantly in size and performance
Timing of imbalance assessment September
It is proposed that the data gathering exercise should be brought forward to early September and that expert advice should be available on line throughout the data
gathering exercise
Labour shortages and surpluses 2017
2017 35
Directorate-General for Employment Social Affairs and Inclusion European Network of Public Employment Services (PES)
ANNEX 1 DATA COLLECTION TEMPLATE Information sought Explanation
Occupation title (text) Type in free text a list of occupations (one row one occupation) for which shortages and surpluses exist first list occupations for which there is a shortage the list should contain a maximum of 20 occupations if your list contains less than 20 occupations please provide a brief explanation in your email response for why the number is lower than 20 second list occupations for which there is a surplus the list should contain a maximum of 20 occupations if your list contains less than 20 occupations please provide a brief explanation in your email response for why the number is lower than 20
Shortagesurplus indicator For each occupation indicate if it refers to a shortage by typing in shortage or surplus by typing in surplus to identify surplus occupations you can examine for each occupation the ratio of the number of job seekers to the number of vacancies at the end of each year for example if there are 5000 shop assistants seeking employment and there are 200 vacancies at the end of the reference period the ratio is 251 you can rank the calculated ratios and report the occupations associated with the 20 highest ratios
Occupational classification used in your country
For each occupation indicate what occupational classification (if any) was used to identify this occupation for instance you can report a country specific classification ISCO ROME SOC etc If you donrsquot use occupational classifications type None
Occupation code to the lowest level of disaggregation (eg ISCO at 4 digits)
If you have indicated a classification used type the code for each occupation use the lowest level of disaggregation (eg 4 digit ISCO code) if you donrsquot use occupational classification leave black
ISCO-08 code at 4-digit level (or lower if 4-digit not available)
If you use occupational classification which is not ISCO-08 and if it is possible provide a translation of the national code to ISCO-08 code ISCO is the International Standard Classification of Occupations which is used to report to Eurostat code should be at 4 digits if this is not available than the lowest level of disaggregation that is available should be reported (3 digits if 4-digit code is not available 2 digits if neither 4-digit nor 3-digit code is available 1 digit if neither 4-digit 3-digit nor 2-digit code is available) if it is not possible to provide translation to ISCO-08 leave black if you have already reported ISCO-08 code in column 3 leave this column black
Estimate of shortagesurplus magnitude (high (gt3 of employment) medium (1-3 of employment) low (lt1 of employment))
For each occupation indicate a broad estimate of the magnitude of the shortagesurplus if you estimate that the shortagesurplus is less than 1 of the total employment in the occupation in question type low if between 1-3 type medium if greater than 3 type high if you cannot provide a rough estimate of magnitude type dont know
Current shortagesurplus (C) future short term (FST) future medium term (FMT) future long term (FLT) donrsquot know (indicate all that apply)
Against each occupation indicate if the identified shortagesurplus refers to present situation by typing C if the shortage is expected to occur in the short term future ie within 12 months by typing FST if it is expected to occur over the medium term (within 1-5 years) by typing FMT if it is expected to occur in the long term (in 5 or more years) by typing FLT if more than one time period applies indicate all relevant ones (eg for current shortagessurpluses that are expected to persist over the short term type C FST) if you dont know type dont know
Source of information on shortagessurpluses (eg PES administrative data (vacancies job seekers) PES survey third party survey Occupational forecasts other (specify) etc)
Indicate the source used to identify shortagesurplus for this occupation did you derive it from the PES administrative data on PES vacancies andor job seekers did you conduct a survey did you commission a third party to conduct a survey for you did you have occupational forecasts available did you use other research type in free text the full description of the source(s) eg National Employment Survey conducted by PES etc
Labour shortages and surpluses 2017
2017 36
Directorate-General for Employment Social Affairs and Inclusion European Network of Public Employment Services (PES)
Date for source of information Indicate the year that the information on shortagessurpluses (column 7) refers to eg type 2016 for a survey of difficult to fill vacancies conducted in 2016 even if the report was published in 2017
What indicator(s) suggested that there is a shortagesurplus
Indicate what criteria was used to conclude that this occupation is associated with a shortagesurplus for instance employers views sourcing from abroad to fill vacancies growth in employment faster than growth in educationtraining output time required to fill
vacancies higher than average etc
Share of females among job seekers in this occupation (surplus occupations only)
Indicate the percentage share of females among all job seekers in this occupation this is only applicable to surplus occupations
Skill or labour shortage Indicate if a shortage refers to a skill or labour shortage a skill shortage occurs where there is an insufficient supply of persons with the appropriate skills labour shortages occur where there is a sufficient number of skilled persons however an insufficient number of them is willing to take up employment in the occupation in question
Indicate the availability of data on shortagessurpluses at regional level (NUTS1 NUTS2 NUTS3 No data)
Indicate if data is available on the regional breakdown of shortagessurpluses by indicating the level of regional data available if multiple levels of regional disaggregation are available indicate the lowest level of disaggregation (eg NUTS3 rather than NUTS2) if there is no regional data available use no data
Labour shortages and surpluses 2017
2017 37
Directorate-General for Employment Social Affairs and Inclusion European Network of Public Employment Services (PES)
ANNEX 2 SHORTAGE OCCUPATIONS
Shortage occupation PES count
Cooks 16 Plumbers and pipe fitters 13 Generalist medical practitioners 12 Welders and flamecutters 12 Heavy truck and lorry drivers 11 Metal working machine tool setters and operators 11 Nursing professionals 11 Software developers 11 Agricultural and industrial machinery mechanics and repairers 10 Cleaners and helpers in offices hotels and other establishments 10 Commercial sales representatives 10 Specialist medical practitioners 10 Systems analysts 10 Bricklayers and related workers 9 Building and related electricians 9 Butchers fishmongers and related food preparers 9 Motor vehicle mechanics and repairers 9 Nursing associate professionals 9 Sheet-metal workers 9 Shop sales assistants 9 Waiters 9 Carpenters and joiners 8 Civil engineers 8 Concrete placers concrete finishers and related workers 8 Electrical engineering technicians 8 Electronics engineering technicians 8 Mechanical engineers 8 Primary school teachers 8 Structural-metal preparers and erectors 8 Electronics engineers 7
Health care assistants 7 Manufacturing supervisors 7 Mechanical engineering technicians 7 Secondary education teachers 7 Accountants 6 Applications programmers 6 Bus and tram drivers 6 Contact centre salespersons 6 Early childhood educators 6 Electrical mechanics and fitters 6 Floor layers and tile setters 6 Plasterers 6 Roofers 6 Sewing machine operators 6 Software and applications developers and analysts not elsewhere classified 6 Toolmakers and related workers 6 Web and multimedia developers 6 Air conditioning and refrigeration mechanics 5 Building frame and related trades workers not elsewhere classified 5 Chefs 5 Civil engineering labourers 5 Construction supervisors 5 Earthmoving and related plant operators 5 Electrical engineers 5 Electrical line installers and repairers 5 Engineering professionals not elsewhere classified 5 Hairdressers 5 Information and communications technology operations technicians 5 Manufacturing managers 5 Physiotherapists 5 Real estate agents and property managers 5 Research and development managers 5 Spray painters and varnishers 5 Accounting associate professionals 4 Bakers pastry-cooks and confectionery makers 4
Labour shortages and surpluses 2017
2017 38
Directorate-General for Employment Social Affairs and Inclusion European Network of Public Employment Services (PES)
Shortage occupation PES count
Blacksmiths hammersmiths and forging press workers 4 Civil engineering technicians 4 Crane hoist and related plant operators 4 Database designers and administrators 4 Industrial and production engineers 4 Painters and related workers 4 Physical and engineering science technicians not elsewhere classified 4 Plastic products machine operators 4 Social work and counselling professionals 4 Accounting and bookkeeping clerks 3 Administrative and executive secretaries 3 Ambulance workers 3 Building construction labourers 3 Car taxi and van drivers 3 Cartographers and surveyors 3 Cleaning and housekeeping supervisors in offices hotels and other establishments 3 Contact centre information clerks 3 Draughtspersons 3 Fast food preparers 3 Freight handlers 3 Gardeners horticultural and nursery growers 3 Home-based personal care workers 3 Hotel receptionists 3 Information and communications technology installers and servicers 3 Insulation workers 3 Kitchen helpers 3 Manufacturing labourers not elsewhere classified 3 Medical imaging and therapeutic equipment technicians 3 Metal moulders and coremakers 3 Metal polishers wheel grinders and tool sharpeners 3 Midwifery professionals 3 Other language teachers 3 Personal services workers not elsewhere classified 3
Pharmacists 3 Policy administration professionals 3 Printers 3 Process control technicians not elsewhere classified 3 Sales and marketing managers 3 Shop supervisors 3 Special needs teachers 3 Stock clerks 3 Supply distribution and related managers 3 Survey and market research interviewers 3 Systems administrators 3 Technical and medical sales professionals (excluding ICT) 3 Translators interpreters and other linguists 3 Transport clerks 3 Vocational education teachers 3 Advertising and marketing professionals 2 Audiologists and speech therapists 2 Bartenders 2 Beauticians and related workers 2 Cashiers and ticket clerks 2 Chemical engineers 2 Child care workers 2 Computer network and systems technicians 2 Computer network professionals 2 Construction managers 2 Craft and related workers not elsewhere classified 2 Credit and loans officers 2 Crop farm labourers 2 Database and network professionals not elsewhere classified 2 Dentists 2 Domestic cleaners and helpers 2 Door to door salespersons 2 Driving instructors 2 Electrical and electronic equipment assemblers 2 Electronics mechanics and servicers 2 Elementary workers not elsewhere classified 2 Employment agents and contractors 2
Labour shortages and surpluses 2017
2017 39
Directorate-General for Employment Social Affairs and Inclusion European Network of Public Employment Services (PES)
Shortage occupation PES count
Field crop and vegetable growers 2 Financial analysts 2 Financial and investment advisers 2 Forestry and related workers 2 Garbage and recycling collectors 2 General office clerks 2 Graphic and multimedia designers 2 Information and communications technology service managers 2 Insurance representatives 2 Locomotive engine drivers 2 Mail carriers and sorting clerks 2 Management and organization analysts 2 Mathematicians actuaries and statisticians 2 Mechanical machinery assemblers 2 Medical and dental prosthetic technicians 2 Medical assistants 2 Messengers package deliverers and luggage porters 2 Metal finishing plating and coating machine operators 2 Metal processing plant operators 2 Optometrists and ophthalmic opticians 2 Personal care workers in health services not elsewhere classified 2 Police officers 2 Policy and planning managers 2 Production clerks 2 Restaurant managers 2 Retail and wholesale trade managers 2 Sales workers not elsewhere classified 2 Sewing embroidery and related workers 2 Street food salespersons 2 Tailors dressmakers furriers and hatters 2 Telecommunications engineers 2 Advertising and public relations managers 1 Aged care services managers 1
Agricultural technicians 1 Aircraft engine mechanics and repairers 1 Aircraft pilots and related associate professionals 1 Assemblers not elsewhere classified 1 Authors and related writers 1 Bank tellers and related clerks 1 Bleaching dyeing and fabric cleaning machine operators 1 Bookmakers croupiers and related gaming workers 1 Business services agents not elsewhere classified 1 Buyers 1 Cabinet-makers and related workers 1 Cement stone and other mineral products machine operators 1 Chemical and physical science technicians 1 Chemical engineering technicians 1 Chemical processing plant controllers 1 Chemical products plant and machine operators 1 Chemists 1 Conference and event planners 1 Customs and border inspectors 1 Data entry clerks 1 Dental assistants and therapists 1 Dieticians and nutritionists 1 Dispensing opticians 1 Domestic housekeepers 1 Economists 1 Education methods specialists 1 Environmental and occupational health and hygiene professionals 1 Environmental and occupational health inspectors and associates 1 Fibre preparing spinning and winding machine operators 1 Finance managers 1 Financial and insurance services branch managers 1 Fire-fighters 1 Fitness and recreation instructors and program leaders 1 Food and beverage tasters and graders 1 Food and related products machine operators 1
Labour shortages and surpluses 2017
2017 40
Directorate-General for Employment Social Affairs and Inclusion European Network of Public Employment Services (PES)
Shortage occupation PES count
Food service counter attendants 1 Forestry labourers 1 Fruit vegetable and related preservers 1 Fur and leather preparing machine operators 1 Glass and ceramics plant operators 1 Hand launderers and pressers 1 Hand packers 1 Handicraft workers in textile leather and related materials 1 Health associate professionals not elsewhere classified 1 Health professionals not elsewhere classified 1 House builders 1 Human resource managers 1 Incinerator and water treatment plant operators 1 Information and communications technology user support technicians 1 Judges 1 Lawyers 1 Legal and related associate professionals 1 Legal professionals not elsewhere classified 1 Library clerks 1 Lifting truck operators 1 Livestock and dairy producers 1 Livestock farm labourers 1 Medical and pathology laboratory technicians 1 Medical secretaries 1 Metal production process controllers 1 Mining and quarrying labourers 1 Mining engineers metallurgists and related professionals 1 Mixed crop and animal producers 1 Mixed crop growers 1 Motorcycle drivers 1 Odd job persons 1 Other cleaning workers 1 Other music teachers 1
Paper products machine operators 1 Personnel and careers professionals 1 Personnel clerks 1 Pet groomers and animal care workers 1 Physicists and astronomers 1 Physiotherapy technicians and assistants 1 Potters and related workers 1 Power production plant operators 1 Prison guards 1 Product and garment designers 1 Psychologists 1 Pulp and papermaking plant operators 1 Railway brake signal and switch operators 1 Receptionists (general) 1 Refuse sorters 1 Riggers and cable splicers 1 Scribes and related workers 1 Secretaries (general) 1 Securities and finance dealers and brokers 1 Security guards 1 Senior government officials 1 Senior officials of special-interest organizations 1 Shelf fillers 1 Ships engineers 1 Shoemaking and related machine operators 1 Social work associate professionals 1 Stall and market salespersons 1 Stationary plant and machine operators not elsewhere classified 1 Stonemasons stone cutters splitters and carvers 1 Street and related service workers 1 Sweepers and related labourers 1 Teaching professionals not elsewhere classified 1 Telecommunications engineering technicians 1 Textile fur and leather products machine operators not elsewhere classified 1 Trade brokers 1 Travel attendants and travel stewards 1 Travel guides 1
Labour shortages and surpluses 2017
2017 41
Directorate-General for Employment Social Affairs and Inclusion European Network of Public Employment Services (PES)
Shortage occupation PES count
Tree and shrub crop growers 1 Underwater divers 1 University and higher education teachers 1 Vehicle cleaners 1 Veterinarians 1 Weaving and knitting machine operators 1 Web technicians 1 Wood processing plant operators 1 Woodworking-machine tool setters and operators 1
Labour shortages and surpluses 2017
2017 42
Directorate-General for Employment Social Affairs and Inclusion European Network of Public Employment Services (PES)
ANNEX 3 SURPLUS OCCUPATIONS
Surplus occupation PES count
General office clerks 8 Shop sales assistants 8 Advertising and marketing professionals 6 Bank tellers and related clerks 6 Sociologists anthropologists and related professionals 6 Child care workers 5 Hairdressers 5 Journalists 5 Cashiers and ticket clerks 4 Cleaners and helpers in offices hotels and other establishments 4 Hand packers 4 Mail carriers and sorting clerks 4 Photographers 4 Receptionists (general) 4 Tailors dressmakers furriers and hatters 4 Accounting and bookkeeping clerks 3 Administrative and executive secretaries 3 Beauticians and related workers 3 Biologists botanists zoologists and related professionals 3 Bricklayers and related workers 3 Broadcasting and audio-visual technicians 3 Civil engineering labourers 3 Economists 3 Gardeners horticultural and nursery growers 3 Interior designers and decorators 3 Kitchen helpers 3 Legal professionals not elsewhere classified 3 Manufacturing labourers not elsewhere classified 3 Motor vehicle mechanics and repairers 3
Musicians singers and composers 3 Other artistic and cultural associate professionals 3 Painters and related workers 3 Philosophers historians and political scientists 3 Security guards 3 Sweepers and related labourers 3 Travel consultants and clerks 3 Waiters 3 Actors 2 Archivists and curators 2 Bakers pastry-cooks and confectionery makers 2 Bartenders 2 Building construction labourers 2 Business services and administration managers not elsewhere classified 2 Cabinet-makers and related workers 2 Car taxi and van drivers 2 Chemists 2 Cleaning and housekeeping supervisors in offices hotels and other establishments 2 Credit and loans officers 2 Customs and border inspectors 2 Elementary workers not elsewhere classified 2 Film stage and related directors and producers 2 Financial analysts 2 Forestry and related workers 2 Freight handlers 2 Graphic and multimedia designers 2 Health care assistants 2 Hotel receptionists 2 Lawyers 2 Legal and related associate professionals 2 Library clerks 2 Livestock and dairy producers 2 Management and organization analysts 2 Messengers package deliverers and luggage porters 2 Odd job persons 2 Office supervisors 2 Plasterers 2
Labour shortages and surpluses 2017
2017 43
Directorate-General for Employment Social Affairs and Inclusion European Network of Public Employment Services (PES)
Surplus occupation PES count
Police officers 2 Pre-press technicians 2 Print finishing and binding workers 2 Printers 2 Prison guards 2 Product and garment designers 2 Psychologists 2 Public relations professionals 2 Religious professionals 2 Secondary education teachers 2 Secretaries (general) 2 Social work and counselling professionals 2 Stall and market salespersons 2 Stock clerks 2 Teachers aides 2 Telephone switchboard operators 2 Travel guides 2 Visual artists 2 Advertising and public relations managers 1 Agricultural technicians 1 Announcers on radio television and other media 1 Assemblers not elsewhere classified 1 Building and related electricians 1 Building architects 1 Building caretakers 1 Building frame and related trades workers not elsewhere classified 1 Business services agents not elsewhere classified 1 Buyers 1 Carpenters and joiners 1 Chemical engineers 1 Civil engineers 1 Clearing and forwarding agents 1 Clerical support workers not elsewhere classified 1
Commercial sales representatives 1 Conference and event planners 1 Contact centre information clerks 1 Contact centre salespersons 1 Cooks 1 Crane hoist and related plant operators 1 Creative and performing artists not elsewhere classified 1 Dancers and choreographers 1 Data entry clerks 1 Database designers and administrators 1 Domestic cleaners and helpers 1 Domestic housekeepers 1 Draughtspersons 1 Driving instructors 1 Early childhood educators 1 Electronics mechanics and servicers 1 Farming forestry and fisheries advisers 1 Fashion and other models 1 Fast food preparers 1 Field crop and vegetable growers 1 Filing and copying clerks 1 Finance managers 1 Financial and insurance services branch managers 1 Financial and investment advisers 1 Fire-fighters 1 Fitness and recreation instructors and program leaders 1 Floor layers and tile setters 1 Food service counter attendants 1 Fruit vegetable and related preservers 1 Gallery museum and library technicians 1 Garbage and recycling collectors 1 Garment and related pattern-makers and cutters 1 Glass and ceramics plant operators 1 Government tax and excise officials 1 Hand launderers and pressers 1
Labour shortages and surpluses 2017
2017 44
Directorate-General for Employment Social Affairs and Inclusion European Network of Public Employment Services (PES)
Surplus occupation PES count
Heavy truck and lorry drivers 1 House builders 1 Hunters and trappers 1 Information and communications technology installers and servicers 1 Information and communications technology user support technicians 1 Insurance representatives 1 Jewellery and precious-metal workers 1 Judges 1 Legal secretaries 1 Librarians and related information professionals 1 Life science technicians (excluding medical) 1 Lifting truck operators 1 Managing directors and chief executives 1 Manufacturing supervisors 1 Medical and dental prosthetic technicians 1 Metal moulders and coremakers 1 Mining and quarrying labourers 1 Mixed crop and animal producers 1 Mixed crop growers 1 Mobile farm and forestry plant operators 1 Musical instrument makers and tuners 1 Other language teachers 1 Pawnbrokers and money-lenders 1 Personnel and careers professionals 1 Pet groomers and animal care workers 1 Photographic products machine operators 1 Physical and engineering science technicians not elsewhere classified 1 Physicists and astronomers 1 Police inspectors and detectives 1 Precision-instrument makers and repairers 1 Primary school teachers 1 Process control technicians not elsewhere classified 1 Product graders and testers (excluding foods and beverages) 1
Production clerks 1 Professional services managers not elsewhere classified 1 Protective services workers not elsewhere classified 1 Research and development managers 1 Retail and wholesale trade managers 1 Roofers 1 Sales workers not elsewhere classified 1 Senior government officials 1 Service station attendants 1 Shelf fillers 1 Shop supervisors 1 Social work associate professionals 1 Special needs teachers 1 Spray painters and varnishers 1 Statistical mathematical and related associate professionals 1 Stonemasons stone cutters splitters and carvers 1 Street food salespersons 1 Supply distribution and related managers 1 Teaching professionals not elsewhere classified 1 Technical and medical sales professionals (excluding ICT) 1 Training and staff development professionals 1 Translators interpreters and other linguists 1 Transport conductors 1 Tree and shrub crop growers 1 Typists and word processing operators 1 Undertakers and embalmers 1 Vocational education teachers 1 Weaving and knitting machine operators 1 Woodworking-machine tool setters and operators 1
Labour shortages and surpluses 2017
2017 45
Directorate-General for Employment Social Affairs and Inclusion European Network of Public Employment Services (PES)
ANNEX 4 THE RATIO OF UNEMPLOYED TO NEW HIRES
ISCO-08 title
2015
UE
Recruited in the
last year (lt12
months)
Ratio of UE to new recruits
Street and related service workers 85 104 08 Agricultural forestry and fishery labourers 3913 5343 07 Mining and construction labourers 1937 3525 05 Creative and performing artists 610 1115 05 Refuse workers 1036 1923 05 Painters building structure cleaners and related trades workers 1116 2117 05 Street and market salespersons 195 389 05 Building frame and related trades workers 3632 7353 05 Mining manufacturing and construction supervisors 626 1315 05 Ships deck crews and related workers 53 114 05 Market gardeners and crop growers 1471 3207 05 Managing directors and chief executives 304 667 05 Travel attendants conductors and guides 229 538 04 Wood treaters cabinet-makers and related trades workers 491 1159 04 Manufacturing labourers 1640 3909 04 Domestic hotel and office cleaners and helpers 5679 13545 04 Other stationary plant and machine operators 822 1961 04 Mobile plant operators 1038 2497 04 Building finishers and related trades workers 1519 3680 04 Textile fur and leather products machine operators 431 1048 04 Garment and related trades workers 422 1047 04 Chemical and photographic products plant and machine operators 157 389 04 Food processing and related trades workers 930 2330 04 Vehicle window laundry and other hand cleaning workers 291 754 04 Sheet and structural metal workers moulders and welders and related workers
996 2603 04
Waiters and bartenders 4399 11595 04 Cooks 1529 4039 04 Metal processing and finishing plant operators 208 557 04 Printing trades workers 203 548 04 Forestry and related workers 130 351 04 Protective services workers 1347 3658 04 Transport and storage labourers 2532 6939 04 Fishery workers hunters and trappers 46 128 04 Material-recording and transport clerks 1671 4630 04 Process control technicians 179 517 03 Mining and mineral processing plant operators 94 274 03 Telecommunications and broadcasting technicians 177 519 03 Blacksmiths toolmakers and related trades workers 816 2409 03 Building and housekeeping supervisors 678 2045 03
Secretaries (general) 1072 3259 03 Assemblers 850 2586 03 Other craft and related workers 258 810 03 Shop salespersons 6600 21042 03 Electrical equipment installers and repairers 958 3060 03 Food and related products machine operators 437 1400 03 Other sales workers 1087 3510 03 Food preparation assistants 1646 5337 03 Mixed crop and animal producers 387 1260 03 Car van and motorcycle drivers 1155 3764 03 Client information workers 1993 6531 03 Sports and fitness workers 605 1984 03 Handicraft workers 194 638 03 Life science technicians and related associate professionals 82 271 03 Keyboard operators 283 940 03 Electronics and telecommunications installers and repairers 290 963 03 Other personal services workers 313 1047 03 Vocational education teachers 279 940 03 Other teaching professionals 744 2518 03 General office clerks 966 3272 03 Authors journalists and linguists 335 1135 03 Hairdressers beauticians and related workers 806 2796 03
Labour shortages and surpluses 2017
2017 46
Directorate-General for Employment Social Affairs and Inclusion European Network of Public Employment Services (PES)
ISCO-08 title
2015
UE
Recruited in the
last year (lt12
months)
Ratio of UE to new recruits
Animal producers 189 660 03 Other elementary workers 976 3401 03 Machinery mechanics and repairers 1134 3962 03 Ship and aircraft controllers and technicians 80 281 03 Hotel and restaurant managers 344 1220 03 Cashiers and ticket clerks 908 3220 03 Retail and wholesale trade managers 224 809 03 Sales marketing and development managers 311 1124 03 Physical and engineering science technicians 1204 4366 03 Administrative and specialised secretaries 1106 4040 03 Sales and purchasing agents and brokers 1294 4754 03 Rubber plastic and paper products machine operators 256 941 03 Artistic cultural and culinary associate professionals 511 1906 03 Numerical clerks 944 3532 03 Other services managers 184 691 03 Child care workers and teachers aides 1335 5005 03 Heavy truck and bus drivers 1426 5349 03 Business services and administration managers 383 1439 03 Information and communications technology service managers 67 257 03 Regulatory government associate professionals 209 807 03 Life science professionals 176 681 03 Wood processing and papermaking plant operators 97 379 03 Locomotive engine drivers and related workers 46 179 03 Legal professionals 315 1245 03 Personal care workers in health services 2195 8787 02 Physical and earth science professionals 85 345 02 Street vendors (excluding food) 50 204 02 Architects planners surveyors and designers 515 2092 02 Other clerical support workers 901 3657 02 Business services agents 510 2114 02 Manufacturing mining construction and distribution managers 361 1507 02 Tellers money collectors and related clerks 381 1612 02 Librarians archivists and curators 58 248 02 Medical and pharmaceutical technicians 255 1099 02 University and higher education teachers 301 1333 02 Information and communications technology operations and user support technicians
418 1888 02
Legal social and religious associate professionals 920 4348 02 Financial and mathematical associate professionals 601 2852 02 Sales marketing and public relations professionals 865 4172 02 Finance professionals 472 2281 02 Engineering professionals (excluding electrotechnology) 635 3118 02 Other health associate professionals 531 2657 02
Social and religious professionals 460 2317 02 Professional services managers 176 891 02 Nursing and midwifery associate professionals 556 2855 02 Legislators and senior officials 53 286 02 Database and network professionals 83 455 02 Administration professionals 641 3673 02 Primary school and early childhood teachers 575 3345 02 Electrotechnology engineers 142 827 02 Secondary education teachers 471 2812 02 Other health professionals 346 2083 02 Nursing and midwifery professionals 273 1760 02 Software and applications developers and analysts 631 4159 02 Medical doctors 293 1944 02 No occupation 152894 00
No answer 2531 578 44 Total 249561 294937 08
Labour shortages and surpluses 2017
2017 47
Directorate-General for Employment Social Affairs and Inclusion European Network of Public Employment Services (PES)
HOW TO OBTAIN EU PUBLICATIONS
Free publications
bull one copy
via EU Bookshop (httpbookshopeuropaeu)
bull more than one copy or postersmaps
from the European Unionrsquos representations (httpeceuropaeurepresent_enhtm)
from the delegations in non-EU countries
(httpeeaseuropaeudelegationsindex_enhtm)
by contacting the Europe Direct service (httpeuropaeueuropedirectindex_enhtm)
or calling 00 800 6 7 8 9 10 11 (free phone number from anywhere in the EU) () () The information given is free as are most calls (though some operators phone boxes or hotels may charge you)
Priced publications
bull via EU Bookshop (httpbookshopeuropaeu)
Priced subscriptions
bull via one of the sales agents of the Publications Office of the European Union
(httppublicationseuropaeuothersagentsindex_enhtm)
doi 10276731262
KE-0
1-1
8-2
63-E
N-N
[Ca
talo
gu
e n
um
be
r]
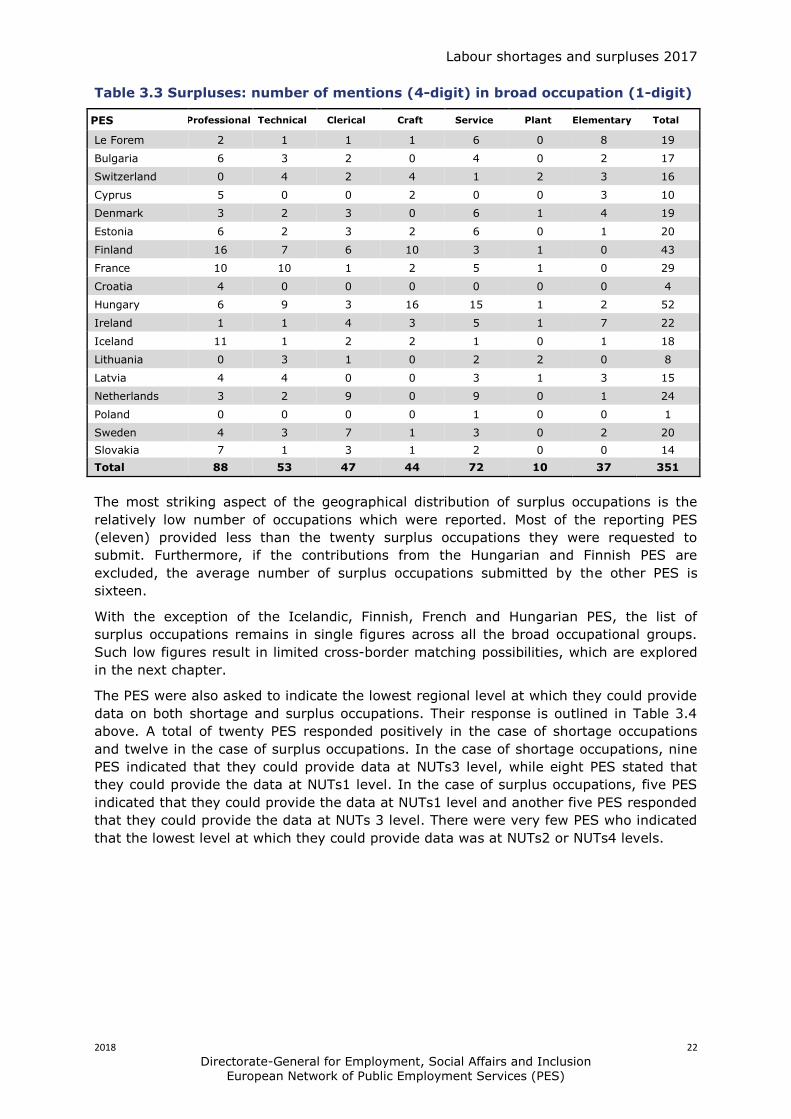
Labour shortages and surpluses 2017
2018 22
Directorate-General for Employment Social Affairs and Inclusion European Network of Public Employment Services (PES)
Table 33 Surpluses number of mentions (4-digit) in broad occupation (1-digit)
PES Professional Technical Clerical Craft Service Plant Elementary Total
Le Forem 2 1 1 1 6 0 8 19
Bulgaria 6 3 2 0 4 0 2 17
Switzerland 0 4 2 4 1 2 3 16
Cyprus 5 0 0 2 0 0 3 10
Denmark 3 2 3 0 6 1 4 19
Estonia 6 2 3 2 6 0 1 20
Finland 16 7 6 10 3 1 0 43
France 10 10 1 2 5 1 0 29
Croatia 4 0 0 0 0 0 0 4
Hungary 6 9 3 16 15 1 2 52
Ireland 1 1 4 3 5 1 7 22
Iceland 11 1 2 2 1 0 1 18
Lithuania 0 3 1 0 2 2 0 8
Latvia 4 4 0 0 3 1 3 15
Netherlands 3 2 9 0 9 0 1 24
Poland 0 0 0 0 1 0 0 1
Sweden 4 3 7 1 3 0 2 20
Slovakia 7 1 3 1 2 0 0 14
Total 88 53 47 44 72 10 37 351
The most striking aspect of the geographical distribution of surplus occupations is the
relatively low number of occupations which were reported Most of the reporting PES
(eleven) provided less than the twenty surplus occupations they were requested to
submit Furthermore if the contributions from the Hungarian and Finnish PES are
excluded the average number of surplus occupations submitted by the other PES is
sixteen
With the exception of the Icelandic Finnish French and Hungarian PES the list of
surplus occupations remains in single figures across all the broad occupational groups
Such low figures result in limited cross-border matching possibilities which are explored
in the next chapter
The PES were also asked to indicate the lowest regional level at which they could provide
data on both shortage and surplus occupations Their response is outlined in Table 34
above A total of twenty PES responded positively in the case of shortage occupations
and twelve in the case of surplus occupations In the case of shortage occupations nine
PES indicated that they could provide data at NUTs3 level while eight PES stated that
they could provide the data at NUTs1 level In the case of surplus occupations five PES
indicated that they could provide the data at NUTs1 level and another five PES responded
that they could provide the data at NUTs 3 level There were very few PES who indicated
that the lowest level at which they could provide data was at NUTs2 or NUTs4 levels
Labour shortages and surpluses 2017
2018 23
Directorate-General for Employment Social Affairs and Inclusion European Network of Public Employment Services (PES)
Table 34 Availability of data on shortagessurpluses at regional levels
Shortage occupations Surplus occupations
Country NUTS1 NUTS2 NUTS3 NUTS4 No
data NUTS1 NUTS2 NUTS3 NUTS4
Austria
x
Belgium Actiris
x
Belgium Le Forem
x
x
Belgium VDAB
x
Bulgaria
x
x
x
Croatia x
x
Cyprus
x
x
Denmark
x
x
Estonia x
x
Finland
x
x
France
x
x
Germany x
Hungary
x
x
Iceland x
x
Ireland x
x
Italy
x
Latvia
x
x
Lithuania
x
x
Luxembourg x
Malta
x
Netherlands
x
x
Norway
x
Poland
x
x
Portugal
x
Slovakia
x
x
Slovenia x
Sweden
x
x
Switzerland
x
x
Note Bulgaria has regional data for some occupations
34 Tracking shortages over time
This is the third annual study on lsquoBottleneck Occupationsrsquo the previous two studies were
undertaken in 2016 and 2015 The findings in both of those studies were presented in 3-
digit codes To make the findings comparable over time the 4-digit shortage and surplus
occupations from the current study are aggregated up to 3-digit occupations as shown in
Table 35
A striking aspect of the list of occupations in Table 35 is the degree of consistency
displayed over the period 2015-2017 inclusive not simply in terms of the occupations
reported by the PES but also in terms of the number of PES who identified them as
shortages (ie their ranking) Not only does the 3-digit occupation category of lsquosoftware
and applications developersrsquo occupy the top ranking in each of the years five of the top
ranking six occupations are the same The only notable exception is that the finance
professional and associate professional occupations featured in the list of most reported
shortage occupations in 2015 but slipped out of this list in 2016 and 2017
Labour shortages and surpluses 2017
2018 24
Directorate-General for Employment Social Affairs and Inclusion European Network of Public Employment Services (PES)
Table 35 Ranking of shortage occupations (3-digit)
Rank
Top occupations in 2017 2017 2016 2015
Software and application developers 1 1 1
Sheet and structural metal workers 2 3 2
Medical doctors 3 5 2
Blacksmiths toolmakers and related trades 4 3 4
Building finishes and related trade workers 4 6 4
Building frame and related trade workers 4 3 4
Cooks 4 7 7
Engineering professionals 5 6 6
Physical and engineering science technicians 6 7 na
Electrical equipment installers and repairers 7 4 5
Heavy truck and bus drivers 7 5 4
Machinery mechanics and repairers 8 7 5
Nursing and midwifery professionals 8 6 na
Sales and purchasing agents and brokers 9 2 5
Shop salespersons 10 7 8
Electro technology engineers 10 na na
Primary school and early childhood teachers 10 na na
Domestic hotel and office cleaners and helpers 10 na na
Waiters and bartenders 10 na na
35 3-digit vs 4-digit
There are advantages and disadvantages associated with using the more aggregated 3-
digit occupation classification as it was done in previous studies The bundling of
individual occupations into families provides greater visibility of shortages at a broad
skill level (eg all software related occupations)
However there are distinct disadvantages in using the 3-digit occupations and these
apply particularly to their practical usefulness to education and training providers In
many cases shortages identified at 3-digit level do not provide a reliable basis for
identifying the specific skill which is in shortage or surplus
By combining the analyses of the 4-digit and corresponding 3-digit classifications in this
report many examples are revealed of how an exclusive reliance on the 3-digit
classification could be seriously misleading Thus the findings in this report show that
within the 3-digit classification of lsquosheet and structural metal workers moulders and
weldersrsquo the 4-digit occupation which is in short supply is lsquoweldersrsquo and not for example
lsquosheet metal workersrsquo This is an important insight because in many European countries
the skills of welding and sheet metal work are provided through entirely different
vocational programmes8
There are many examples of this phenomenon in the 3-digit occupations in Table 35 For
example the analysis in this report shows that toolmakers are a shortage occupation
8 In Ireland for example sheet metal workers and welders undertake entirely different apprenticeships
Labour shortages and surpluses 2017
2018 25
Directorate-General for Employment Social Affairs and Inclusion European Network of Public Employment Services (PES)
but blacksmiths are not Furthermore the 3-digit classification disguises the extent of the
reported shortage Thus while the 3-digit occupation of professional nursing and
midwifery is shown in the current report as being shortage occupations a total of eleven
PES reported professional nursing as a shortage compared to only three PES reporting
professional midwifery as a shortage By bundling these occupations together the
significant difference in the relative severity of the shortage is not apparent
This phenomenon applies equally to the surplus occupations which were identified in this
report For example lsquochildcare workersrsquo were described as a surplus occupation by five
PES But in the 3-digit classification they are bundled together with lsquospecial needs
teachersrsquo which was not identified as a surplus occupation
36 Conclusions
There are a number of conclusions which can be drawn from the analyses in this chapter
Firstly the sources used by many of the PES to identify shortage occupations is one of
the main reasons why only eighteen PES provided data on surplus occupations Many of
the PES relied on the results of employer surveys forecasting models and immigration
data to identify shortages and these sources in general do not provide data on surplus
occupations However it was by no means the only reason why so many PES did not
provide data on surplus organisations and this issue will have to be addressed before the
commencement of the 2018 study In the future PES data should be augmented by data
collected by other bodies as outlined in the new EU Regulation
Secondly there is no obvious explanation for the geographic distribution of shortages
and surpluses In some cases countries with relatively small labour forces have a
relatively high number of shortage occupations while a strong apprenticeship system
does not appear to prevent a relatively high share of the identified shortages being in the
craft occupations It may be that the stipulation to only include twenty shortage and
surplus occupations has created a situation where some countries with a relatively large
labour force are artificially constrained to submit a much smaller number of shortage
occupations than they actually have
Thirdly there is a high degree of stability in relation to the occupations which were
identified as shortages in the 2015 2016 and 2017 editions of the Bottleneck report
Finally providing information on shortage and surplus occupations at 4-digit level is
much more useful from a policy perspective than providing the data at a more
aggregated level The results of the analyses at 4-digit level show which specific
occupations in the bundle of occupations used in the previous reports were in shortage
and which were not This is also true of the occupations which were identified as surplus
occupations A more aggregated group of occupations does not allow for the targeting of
specific individual occupations either for increasing training provision or for enhancing
cross border mobility Indeed as a number of specific examples show were providers of
vocational training or indeed policy makers to act on the basis of the 3-digit shortage and
surplus occupations identified in previous reports they could very well have assign
resources to occupations which were neither in shortage nor in surplus
Labour shortages and surpluses 2017
2018 26
Directorate-General for Employment Social Affairs and Inclusion European Network of Public Employment Services (PES)
4 THE CAUSES OF SKILL SHORTAGES AND POTENTIAL SOLUTIONS
41 Introduction
The focus of this chapter is on identifying the possible causes of skills shortages and
surpluses and exploring ways in which these imbalances may be resolved The chapter
begins with a review of the nature of skills and labour market imbalances and concludes
with an exploration of the extent to which enhanced cross-border mobility policies and
more equal gender representation could contribute to the alleviation of skills and labour
imbalances in certain shortage occupations in the EEA labour market
42 The role of skills and labour shortages in skills imbalances
One of the new questions included in the current study asks the PES to identify the
nature of the shortage (ie is it a skill shortage or a labour shortage) in relation to each
shortage occupation they identified It was explained in the questionnaire that labour
shortages occur when there are a sufficient number of appropriately qualified job-seekers
to fill the vacancies which arise but for a variety of reasons many of them do not wish
to work in the occupation in question Their response to this question is summarised in
Table 41 in respect of the twenty occupations which were reported by the most PES
A total of twenty-six PES classified their shortage occupations as skill or labour
shortages and they classified most of the occupations as skill shortages Indeed in the
case of seven occupations plumbers doctors software developers electricians
electronic engineers electronic engineering technicians bus and tram drivers and
mechanical engineers all of the reporting PES classified the shortage as a skills deficit
Each labour market within the EEA is regulated in a particular manner and conditions of
employment even within the same occupation vary throughout the region This is why
many occupations while classified by most of the PES as reflecting skill deficits
nevertheless are classified by some PES as labour shortages
However the number of PES involved is very small indeed Only in the case of three
occupations lsquowaitersrsquo lsquoshop sales assistantsrsquo and lsquoprimary school teachersrsquo are there
more PES classifying the shortage as a labour shortage then a skills deficit The first two
occupations are undoubtedly labour shortages This is because there are few if any
barriers to working in these occupations9
The inclusion of lsquoprimary school teachersrsquo as a labour shortage is however a surprise It
was identified by eight PES as a shortage occupation two of whom classified the
occupation as a shortage of high magnitude It would be necessary to conduct research
into the conditions of employment ndash including qualification criteria ndash within the countries
where the reporting PES are located to establish if this classification of the occupation as
a labour shortage is warranted
With some notable exceptions the response of the PES to classifying their shortage
occupations as skill or labour shortages demonstrates that the PES understand these
concepts Occupations such as professional nurses which are obviously suffering from a
shortage of qualified job-seekers in the EEA are overwhelmingly categorised as a skills
shortage while less skilled occupations such as cleaners are categorised as being on the
borderline between skills and labour shortages
9 Both occupations have relatively high ratios of unemployed to new hires (Annex 4)
Labour shortages and surpluses 2017
2018 27
Directorate-General for Employment Social Affairs and Inclusion European Network of Public Employment Services (PES)
Table 41 Skill and labour shortages
Occupation
Number of PES
reporting occupation
as skills shortage
Number of PES
reporting occupation as labour shortage
Number of PES
reporting occupations as skill and
labour shortage
Total number of
PES reporting on skillslabour
shortage
Cooks 9 1 0 10
Plumbers and pipe fitters 8 0 0 8
Generalist medical Practitioners 7 0 0 7
Heavy truck and lorry drivers 4 2 1 7
Metal workers machine tool setting and operators
3 3 1 7
Welders and flame cutters 4 2 1 7
Nursing professionals 5 1 0 6
Software developers 6 0 0 6
Systems analyst 5 1 0 6
Bricklayers and related trades 4 1 0 5
Building and related electricians 5 0 0 5
Butchers fishmongers and related food 3 2 0 5
Cleaners and helpers in offices 3 2 0 5
Commercial sales representatives 2 2 1 5
Electronic engineers 5 0 0 5
Manufacturing supervisors 4 1 0 5
Motor vehicle mechanics and repairers 3 1 1 5
Nursing associate professionals 4 1 0 5
Primary school teachers 2 3 0 5
Shop sales assistants 1 4 0 5
Waiters 2 3 0 5
Agriculture and industrial machinery repairers
3 1 0 4
Application programmers 3 1 0 4
Bus and tram drivers 4 0 0 4
Electronic engineering technicians 4 0 0 4
Health care assistants 3 1 0 4
Mechanical engineers 4 0 0 4
Sheet metal workers 3 1 0 4
Structural metal preparers and erectors 3 1 0 4
Total number of PES reporting 16 8 2 26
The atypical working hours associated with heavy goods vehicle driving is recognised by
two of the six PES who classify shortages in the occupation as labour shortages while the
unpleasant conditions associated with working in butchery shops and abattoirs is
reflected in the fact that two of the five PES who categorised the occupation as a
shortage occupation classify it as a labour shortage
43 Location of skill imbalances and cross border mobility
In recent years there has been considerable discussion on the potential role which
enhanced cross-border mobility could play in alleviating labour market imbalances The
attractiveness of such a policy is obvious The European Union is a very large
Labour shortages and surpluses 2017
2018 28
Directorate-General for Employment Social Affairs and Inclusion European Network of Public Employment Services (PES)
marketplace embracing a very large labour force if even some of the shortages which
are reported by EEA countries could be resolved by exploiting the surpluses which are
reported by other EEA countries it could form the basis of a number of win-win solutions
for both job-seekers and businesses
An additional attraction of this policy is that it could potentially successfully address both
skills and labour shortages as working conditions associated with some labour shortages
in one country might be perceived as significantly more attractive in a different EEA
country
Table 44 provides a list of the top twenty shortage occupations which have at least one
PES in another EEA country reporting the occupation as a surplus
There are a number of aspects of the Table which are notable Firstly the list of top
occupations has changed quite dramatically from the list in Table 21 specifically none
of the professional and associate professional occupations are now on the list including
the four professional and associate professional health-related occupations or the two
professional software occupations What the Table shows is that there are no surpluses
reported in any of the EEA countries of doctors or nurses software developers or
systems analysts While the occupation of healthcare assistants is in surplus in many
countries it was not included in the list of top occupations because it was reported as a
shortage by only two PES
The figures in Table 42 show that there are three cross-border matching possibilities in
the case of bricklayers and motor mechanics and two possibilities in the case of
plasterers health care assistants and secondary school teachers
There is just one matching possibility in respect of a wide range of occupations including
cooks truck drivers commercial sales representatives electricians carpenters civil
engineers primary school teachers manufacturing supervisors telecentre salespersons
childhood education teachers floor layers and roofers
The fact that primary school teachers have only one cross border matching possibility
suggest that the classification of the occupation as a labour shortage by three of five PES
is an error In general labour shortages would be expected to have more cross border
matching possibilities than skill shortages because there are many job-seekers eligible to
work in the occupation in question and working conditions vary quite significantly from
country to country Indeed it is notable that the two other occupations which were
classified by the PES as predominantly labour shortages waiters and shop sales
assistants have a relatively high number of matching possibilities eight in the case of
shop sales assistants and three in the case of waiters
In general the PES did not classify the same occupation as both a shortage and a
surplus A striking exception is the Danish PES which categorised four of its shortage
occupations as surplus occupations also This is most likely due to the higher level of
granularity available in the Danish data (below 4-digit) so that some job titles within an
occupation are considered labour shortage while others skill shortage
44 Assessing gender composition of surpluses
The PES were asked to estimate the share of females in the occupations which they
identified as lsquosurplusrsquo occupations The restricting of this question to surplus occupations
was to avoid giving the impression that shortages were arising because of discriminatory
recruitment policies
Labour shortages and surpluses 2017
2018 29
Directorate-General for Employment Social Affairs and Inclusion European Network of Public Employment Services (PES)
A total of 13 PES reported any data on gender composition of surpluses However the
quality of information submitted did not provide a sufficient basis for an accurate
estimation of the gender composition of surpluses in some of the cases
It is suggested that in order to address gender imbalances in relation to shortages and
surpluses data from PES on job seekers should be combined with the LSF data on
employment by occupation
45 Conclusions
The analysis in chapter four has produced a number of interesting findings The analysis
reveals that the PES in general has the capacity to distinguish between skill and labour
shortages and to identify shortage occupations which have some cross-border matching
possibilities
The relatively low number of surplus occupations reflects two factors firstly only
eighteen PES submitted a list of surplus occupations and secondly in many cases the
lists did not include the maximum number of twenty occupations which were requested
This response has to be viewed against the background of an EEA labour market where
employment is expanding and unemployment is contracting However while this is a
positive development the relatively low number of surplus occupations has placed a
significant limit on the extent to which there were cross-border possibilities of matching
shortage with surplus occupations
The data indicates that there is a limitation to the extent to which the PES can be used to
identify the gender imbalances (eg under-representation of females in some
occupations) and that other sources should be explored
Labour shortages and surpluses 2017
2018 30
Directorate-General for Employment Social Affairs and Inclusion European Network of Public Employment Services (PES)
Table 43 The potential for cross-border matching of shortage and surplus occupations
No PES
Occupation PES reporting shortage PES reporting surplus No PES
16 Cooks AT Art BG CY DK HR IE IS IT MT NL NO PT SE SI SK lsaquo―rsaquo HU 1
11 Truck drivers ART VDAB BG DK HR LT IT NL NO PT SE SI SK lsaquo―rsaquo DK 1
10 Cleaners helpers CY DK HR FI IS HU NL NO PT SI lsaquo―rsaquo DK LF NL IE 4
10 Commercial sales VDAB ART DK FI FR IT IE PT PL SI lsaquo―rsaquo DK 1
9 Sales assistants AT ART BG CY DK IT NO SI SK lsaquo―rsaquo DK LF SE NL BG CH FI IE 8
9 Bricklayers ART DE DK HR HU LT NL PT SI lsaquo―rsaquo CY HU IE 3
9 Motor mechanics AT VDAB ART LF DK IT NO PT SI lsaquo―rsaquo SK CH EE 3
9 Waiters ART BG CY IS IT MT NO PT SI lsaquo―rsaquo HU EE IE 3
9 Electricians ART VDAB DE DK IS IT NL NO SI lsaquo―rsaquo FR 1
8 Carpenters DK HR HU FI NL NO PT SI lsaquo―rsaquo HU 1
8 Civil engineers ART CH DE FI FR NO SE SI lsaquo―rsaquo CY 1
8 Primary teachers ART BG DK IS NO SE SI SK lsaquo―rsaquo CY 1
7 Healthcare assist CY DK EE NL NO SI SK lsaquo―rsaquo DK NL 2
7 Second teacher ART BG FR NL NO SI SK lsaquo―rsaquo CY FI 2
7 Man supervisors ART VDAB LF DE EE FR SK lsaquo―rsaquo BG 1
6 Plasterers HR HU FI LT NL SI lsaquo―rsaquo HU IE 2
6 Tele centre sales ART HU FI FR MT NO lsaquo―rsaquo EE 1
6 Childhood educ FI LT NO SE SI SK lsaquo―rsaquo CY 1
6 Floor layers HU HR FI FR LT LV lsaquo―rsaquo HU 1
6 Roofers HR FI FR LT LV SI lsaquo―rsaquo HU 1
Bottlenecks Occupations 2017
2017 31
Directorate-General for Employment Social Affairs and Inclusion European Network of Public Employment Services (PES)
5 CONCLUSIONS AND RECOMMENDATIONS
51 Conclusions
The terms of reference for this study emphasise the desirability of creating a process for
the systematic collection of data on surplus and shortage occupations in the EEA area
which could be effectively used by EURES for cross border matching of shortage
occupations in some EEA countries with surplus occupations in others
The authors have responded to this emphasis by using a process which ensures that the
data gathered on shortage and surplus occupations is comprehensive accurate and of
practical use to EURES and the providers of education and training programmes The
process is comprehensive because it gathers information both on the extent of shortages
and surpluses and on their relative severity It is accurate because the list of shortage
and surplus occupations are shown to be consistent with the estimated value of the ratio
of unemployed to new hires Finally the process provides information which is of
practical use to EURES and the national providers of VET because the data gathered is on
individual occupations rather than on lsquobundles of occupationsrsquo as in previous studies The
analyses in this report shows that while these bundles of occupations contain some
occupations which are identified by the PES as shortage and surplus occupations they
also contain occupations which are neither in shortage nor in surplus and it is impossible
to distinguish one from the other
The data gathering process used in this report however was not devoid of weaknesses
Fortunately these weaknesses reflect the modus operandi of the PES and may be
rectified by including other institutions and agencies in the process For example the PES
use the same sources for the identification of both shortage and surplus occupations
This may have advantages in terms of accuracy when those sources include employersrsquo
surveys immigration data and the results of forecasting exercises However these
sources are not suitable for gathering data on surplus occupations and they are the main
reason why the number of surplus occupations provided by the PES were almost half the
number requested In the future PES data could be augmented by data gathered by
other bodies as outlined in recent EU Regulation 2016589
In addition the response to the question on the capacity of the PES to deliver data on
shortage and surplus occupations at a regional level was also disappointing perhaps
reflecting a misalignment in some EEA countries between the geographic configuration of
the local PES network and the NUTs regions
The analysis highlighted that in order to assess gender imbalances of shortages and
surpluses PES data needs to be augmented by other sources
Finally despite the low number of surplus occupations submitted by the PES it was
nevertheless possible to identify twenty shortage occupations in the EEA labour market
which had at least one cross-border matching possibility and many more than one in the
case of some shortage occupations
52 Recommendations
Based on the findings from the three bottleneck studies undertaken to date a model for
the gathering of data on shortages and surpluses is proposed (Figure 51) The model
includes features of the methodology applied in this study which were successful It also
includes a number of features which should be introduced to the process in order to
address some of the weaknesses which were identified in this study (highlighted in red)
Labour shortages and surpluses 2017
2017 32
Directorate-General for Employment Social Affairs and Inclusion European Network of Public Employment Services (PES)
However before this methodology is implemented it would be prudent to discuss data
requirements with PES and invite a broader range of institutions and agencies to
participate in aspects of the data gathering process in addition to the PES EURES
Regulation (EU) 2016589 of the European Parliament and of the Council which obliges
the appropriate national authorities to furnish such data annually is fortuitous in this
regard and should facilitate the implementation of this recommendation
In addition the results of these and other relevant studies should be disseminated to
PES Eures coordination group and other relevant agencies and institutions in order to
emphasise the importance of data and analysis in informing policy at EU and national
level which aims to resolve labour market imbalances
Labour shortages and surpluses 2017
2017 33
Directorate-General for Employment Social Affairs and Inclusion European Network of Public Employment Services (PES)
Figure 51 Model for gathering data on shortage and surplus occupations
Sources of data on surpluses PES data from other relevant agencies
In those cases where the source used by the PES to identify shortage occupations cannot
be used to identify surplus occupations other institutions or other sources or both should be availed of to ensure that comprehensive data on surplus occupations are provided to the appropriate national authority
Dimensions of shortagessurpluses extent (number of reporting PES) and severity (high or low
magnitude)
Data should be systematically gathered on both the extent of shortage and surplus
occupations in the EEA and on their relative severity
Type of shortage skill vs labour shortages
The providers of the data on shortage occupations must also distinguish between skill and labour shortages because this distinction is necessary for the accurate identification of
shortage occupations and for the choice of the appropriate policy response to identified shortages
Classification of occupations used ISCO 08 4-digit codes (or translation into these codes)
All data should be either initially gathered in ISCO 08 4-digit codes or translated into these
codes This ensures that the data refers to specific individual occupations and is of practical use to EURES and the national providers of VET
Accuracy test cross-check with LSF data (ratio of unemployed to new hires)
The accuracy of the submitted lists of shortage and surplus occupations should be assessed
by comparing the most widely reported surplus and shortage occupations with the estimated values of the ratios of employed (by previous occupation) to new hires at the aggregated EU28 level These ratios should be based on an analysis of the most up-to date
Labour Force Survey (LFS) data
Gender balance assessment LFS data on employment at occupational level by gender PES job
seekers
The gender composition of shortage and surplus occupations should be based on the most
up to date analyses of LFS data on employment by gender and the PES job seeker data
Regional balance assessment LSF data data from relevant agencies
Where regional data is required other agencies and institutions should be requested to
provide the data in those cases where the data cannot be provided by the regional PES network because it is not geographically aligned to the NUTs regions
Labour shortages and surpluses 2017
2017 34
Directorate-General for Employment Social Affairs and Inclusion European Network of Public Employment Services (PES)
Number of occupations reporting should be extended beyond 20 occupations but with upper
limit (eg 50)
Consideration should be given to allowing the agencies responsible for identifying shortage
and surplus occupations a greater range of flexibility in terms of the numbers of occupations which should be identified A minimum to maximum range would be a more realistic approach as it would reflect the fact that the labour markets of the EEA vary significantly in size and performance
Timing of imbalance assessment September
It is proposed that the data gathering exercise should be brought forward to early September and that expert advice should be available on line throughout the data
gathering exercise
Labour shortages and surpluses 2017
2017 35
Directorate-General for Employment Social Affairs and Inclusion European Network of Public Employment Services (PES)
ANNEX 1 DATA COLLECTION TEMPLATE Information sought Explanation
Occupation title (text) Type in free text a list of occupations (one row one occupation) for which shortages and surpluses exist first list occupations for which there is a shortage the list should contain a maximum of 20 occupations if your list contains less than 20 occupations please provide a brief explanation in your email response for why the number is lower than 20 second list occupations for which there is a surplus the list should contain a maximum of 20 occupations if your list contains less than 20 occupations please provide a brief explanation in your email response for why the number is lower than 20
Shortagesurplus indicator For each occupation indicate if it refers to a shortage by typing in shortage or surplus by typing in surplus to identify surplus occupations you can examine for each occupation the ratio of the number of job seekers to the number of vacancies at the end of each year for example if there are 5000 shop assistants seeking employment and there are 200 vacancies at the end of the reference period the ratio is 251 you can rank the calculated ratios and report the occupations associated with the 20 highest ratios
Occupational classification used in your country
For each occupation indicate what occupational classification (if any) was used to identify this occupation for instance you can report a country specific classification ISCO ROME SOC etc If you donrsquot use occupational classifications type None
Occupation code to the lowest level of disaggregation (eg ISCO at 4 digits)
If you have indicated a classification used type the code for each occupation use the lowest level of disaggregation (eg 4 digit ISCO code) if you donrsquot use occupational classification leave black
ISCO-08 code at 4-digit level (or lower if 4-digit not available)
If you use occupational classification which is not ISCO-08 and if it is possible provide a translation of the national code to ISCO-08 code ISCO is the International Standard Classification of Occupations which is used to report to Eurostat code should be at 4 digits if this is not available than the lowest level of disaggregation that is available should be reported (3 digits if 4-digit code is not available 2 digits if neither 4-digit nor 3-digit code is available 1 digit if neither 4-digit 3-digit nor 2-digit code is available) if it is not possible to provide translation to ISCO-08 leave black if you have already reported ISCO-08 code in column 3 leave this column black
Estimate of shortagesurplus magnitude (high (gt3 of employment) medium (1-3 of employment) low (lt1 of employment))
For each occupation indicate a broad estimate of the magnitude of the shortagesurplus if you estimate that the shortagesurplus is less than 1 of the total employment in the occupation in question type low if between 1-3 type medium if greater than 3 type high if you cannot provide a rough estimate of magnitude type dont know
Current shortagesurplus (C) future short term (FST) future medium term (FMT) future long term (FLT) donrsquot know (indicate all that apply)
Against each occupation indicate if the identified shortagesurplus refers to present situation by typing C if the shortage is expected to occur in the short term future ie within 12 months by typing FST if it is expected to occur over the medium term (within 1-5 years) by typing FMT if it is expected to occur in the long term (in 5 or more years) by typing FLT if more than one time period applies indicate all relevant ones (eg for current shortagessurpluses that are expected to persist over the short term type C FST) if you dont know type dont know
Source of information on shortagessurpluses (eg PES administrative data (vacancies job seekers) PES survey third party survey Occupational forecasts other (specify) etc)
Indicate the source used to identify shortagesurplus for this occupation did you derive it from the PES administrative data on PES vacancies andor job seekers did you conduct a survey did you commission a third party to conduct a survey for you did you have occupational forecasts available did you use other research type in free text the full description of the source(s) eg National Employment Survey conducted by PES etc
Labour shortages and surpluses 2017
2017 36
Directorate-General for Employment Social Affairs and Inclusion European Network of Public Employment Services (PES)
Date for source of information Indicate the year that the information on shortagessurpluses (column 7) refers to eg type 2016 for a survey of difficult to fill vacancies conducted in 2016 even if the report was published in 2017
What indicator(s) suggested that there is a shortagesurplus
Indicate what criteria was used to conclude that this occupation is associated with a shortagesurplus for instance employers views sourcing from abroad to fill vacancies growth in employment faster than growth in educationtraining output time required to fill
vacancies higher than average etc
Share of females among job seekers in this occupation (surplus occupations only)
Indicate the percentage share of females among all job seekers in this occupation this is only applicable to surplus occupations
Skill or labour shortage Indicate if a shortage refers to a skill or labour shortage a skill shortage occurs where there is an insufficient supply of persons with the appropriate skills labour shortages occur where there is a sufficient number of skilled persons however an insufficient number of them is willing to take up employment in the occupation in question
Indicate the availability of data on shortagessurpluses at regional level (NUTS1 NUTS2 NUTS3 No data)
Indicate if data is available on the regional breakdown of shortagessurpluses by indicating the level of regional data available if multiple levels of regional disaggregation are available indicate the lowest level of disaggregation (eg NUTS3 rather than NUTS2) if there is no regional data available use no data
Labour shortages and surpluses 2017
2017 37
Directorate-General for Employment Social Affairs and Inclusion European Network of Public Employment Services (PES)
ANNEX 2 SHORTAGE OCCUPATIONS
Shortage occupation PES count
Cooks 16 Plumbers and pipe fitters 13 Generalist medical practitioners 12 Welders and flamecutters 12 Heavy truck and lorry drivers 11 Metal working machine tool setters and operators 11 Nursing professionals 11 Software developers 11 Agricultural and industrial machinery mechanics and repairers 10 Cleaners and helpers in offices hotels and other establishments 10 Commercial sales representatives 10 Specialist medical practitioners 10 Systems analysts 10 Bricklayers and related workers 9 Building and related electricians 9 Butchers fishmongers and related food preparers 9 Motor vehicle mechanics and repairers 9 Nursing associate professionals 9 Sheet-metal workers 9 Shop sales assistants 9 Waiters 9 Carpenters and joiners 8 Civil engineers 8 Concrete placers concrete finishers and related workers 8 Electrical engineering technicians 8 Electronics engineering technicians 8 Mechanical engineers 8 Primary school teachers 8 Structural-metal preparers and erectors 8 Electronics engineers 7
Health care assistants 7 Manufacturing supervisors 7 Mechanical engineering technicians 7 Secondary education teachers 7 Accountants 6 Applications programmers 6 Bus and tram drivers 6 Contact centre salespersons 6 Early childhood educators 6 Electrical mechanics and fitters 6 Floor layers and tile setters 6 Plasterers 6 Roofers 6 Sewing machine operators 6 Software and applications developers and analysts not elsewhere classified 6 Toolmakers and related workers 6 Web and multimedia developers 6 Air conditioning and refrigeration mechanics 5 Building frame and related trades workers not elsewhere classified 5 Chefs 5 Civil engineering labourers 5 Construction supervisors 5 Earthmoving and related plant operators 5 Electrical engineers 5 Electrical line installers and repairers 5 Engineering professionals not elsewhere classified 5 Hairdressers 5 Information and communications technology operations technicians 5 Manufacturing managers 5 Physiotherapists 5 Real estate agents and property managers 5 Research and development managers 5 Spray painters and varnishers 5 Accounting associate professionals 4 Bakers pastry-cooks and confectionery makers 4
Labour shortages and surpluses 2017
2017 38
Directorate-General for Employment Social Affairs and Inclusion European Network of Public Employment Services (PES)
Shortage occupation PES count
Blacksmiths hammersmiths and forging press workers 4 Civil engineering technicians 4 Crane hoist and related plant operators 4 Database designers and administrators 4 Industrial and production engineers 4 Painters and related workers 4 Physical and engineering science technicians not elsewhere classified 4 Plastic products machine operators 4 Social work and counselling professionals 4 Accounting and bookkeeping clerks 3 Administrative and executive secretaries 3 Ambulance workers 3 Building construction labourers 3 Car taxi and van drivers 3 Cartographers and surveyors 3 Cleaning and housekeeping supervisors in offices hotels and other establishments 3 Contact centre information clerks 3 Draughtspersons 3 Fast food preparers 3 Freight handlers 3 Gardeners horticultural and nursery growers 3 Home-based personal care workers 3 Hotel receptionists 3 Information and communications technology installers and servicers 3 Insulation workers 3 Kitchen helpers 3 Manufacturing labourers not elsewhere classified 3 Medical imaging and therapeutic equipment technicians 3 Metal moulders and coremakers 3 Metal polishers wheel grinders and tool sharpeners 3 Midwifery professionals 3 Other language teachers 3 Personal services workers not elsewhere classified 3
Pharmacists 3 Policy administration professionals 3 Printers 3 Process control technicians not elsewhere classified 3 Sales and marketing managers 3 Shop supervisors 3 Special needs teachers 3 Stock clerks 3 Supply distribution and related managers 3 Survey and market research interviewers 3 Systems administrators 3 Technical and medical sales professionals (excluding ICT) 3 Translators interpreters and other linguists 3 Transport clerks 3 Vocational education teachers 3 Advertising and marketing professionals 2 Audiologists and speech therapists 2 Bartenders 2 Beauticians and related workers 2 Cashiers and ticket clerks 2 Chemical engineers 2 Child care workers 2 Computer network and systems technicians 2 Computer network professionals 2 Construction managers 2 Craft and related workers not elsewhere classified 2 Credit and loans officers 2 Crop farm labourers 2 Database and network professionals not elsewhere classified 2 Dentists 2 Domestic cleaners and helpers 2 Door to door salespersons 2 Driving instructors 2 Electrical and electronic equipment assemblers 2 Electronics mechanics and servicers 2 Elementary workers not elsewhere classified 2 Employment agents and contractors 2
Labour shortages and surpluses 2017
2017 39
Directorate-General for Employment Social Affairs and Inclusion European Network of Public Employment Services (PES)
Shortage occupation PES count
Field crop and vegetable growers 2 Financial analysts 2 Financial and investment advisers 2 Forestry and related workers 2 Garbage and recycling collectors 2 General office clerks 2 Graphic and multimedia designers 2 Information and communications technology service managers 2 Insurance representatives 2 Locomotive engine drivers 2 Mail carriers and sorting clerks 2 Management and organization analysts 2 Mathematicians actuaries and statisticians 2 Mechanical machinery assemblers 2 Medical and dental prosthetic technicians 2 Medical assistants 2 Messengers package deliverers and luggage porters 2 Metal finishing plating and coating machine operators 2 Metal processing plant operators 2 Optometrists and ophthalmic opticians 2 Personal care workers in health services not elsewhere classified 2 Police officers 2 Policy and planning managers 2 Production clerks 2 Restaurant managers 2 Retail and wholesale trade managers 2 Sales workers not elsewhere classified 2 Sewing embroidery and related workers 2 Street food salespersons 2 Tailors dressmakers furriers and hatters 2 Telecommunications engineers 2 Advertising and public relations managers 1 Aged care services managers 1
Agricultural technicians 1 Aircraft engine mechanics and repairers 1 Aircraft pilots and related associate professionals 1 Assemblers not elsewhere classified 1 Authors and related writers 1 Bank tellers and related clerks 1 Bleaching dyeing and fabric cleaning machine operators 1 Bookmakers croupiers and related gaming workers 1 Business services agents not elsewhere classified 1 Buyers 1 Cabinet-makers and related workers 1 Cement stone and other mineral products machine operators 1 Chemical and physical science technicians 1 Chemical engineering technicians 1 Chemical processing plant controllers 1 Chemical products plant and machine operators 1 Chemists 1 Conference and event planners 1 Customs and border inspectors 1 Data entry clerks 1 Dental assistants and therapists 1 Dieticians and nutritionists 1 Dispensing opticians 1 Domestic housekeepers 1 Economists 1 Education methods specialists 1 Environmental and occupational health and hygiene professionals 1 Environmental and occupational health inspectors and associates 1 Fibre preparing spinning and winding machine operators 1 Finance managers 1 Financial and insurance services branch managers 1 Fire-fighters 1 Fitness and recreation instructors and program leaders 1 Food and beverage tasters and graders 1 Food and related products machine operators 1
Labour shortages and surpluses 2017
2017 40
Directorate-General for Employment Social Affairs and Inclusion European Network of Public Employment Services (PES)
Shortage occupation PES count
Food service counter attendants 1 Forestry labourers 1 Fruit vegetable and related preservers 1 Fur and leather preparing machine operators 1 Glass and ceramics plant operators 1 Hand launderers and pressers 1 Hand packers 1 Handicraft workers in textile leather and related materials 1 Health associate professionals not elsewhere classified 1 Health professionals not elsewhere classified 1 House builders 1 Human resource managers 1 Incinerator and water treatment plant operators 1 Information and communications technology user support technicians 1 Judges 1 Lawyers 1 Legal and related associate professionals 1 Legal professionals not elsewhere classified 1 Library clerks 1 Lifting truck operators 1 Livestock and dairy producers 1 Livestock farm labourers 1 Medical and pathology laboratory technicians 1 Medical secretaries 1 Metal production process controllers 1 Mining and quarrying labourers 1 Mining engineers metallurgists and related professionals 1 Mixed crop and animal producers 1 Mixed crop growers 1 Motorcycle drivers 1 Odd job persons 1 Other cleaning workers 1 Other music teachers 1
Paper products machine operators 1 Personnel and careers professionals 1 Personnel clerks 1 Pet groomers and animal care workers 1 Physicists and astronomers 1 Physiotherapy technicians and assistants 1 Potters and related workers 1 Power production plant operators 1 Prison guards 1 Product and garment designers 1 Psychologists 1 Pulp and papermaking plant operators 1 Railway brake signal and switch operators 1 Receptionists (general) 1 Refuse sorters 1 Riggers and cable splicers 1 Scribes and related workers 1 Secretaries (general) 1 Securities and finance dealers and brokers 1 Security guards 1 Senior government officials 1 Senior officials of special-interest organizations 1 Shelf fillers 1 Ships engineers 1 Shoemaking and related machine operators 1 Social work associate professionals 1 Stall and market salespersons 1 Stationary plant and machine operators not elsewhere classified 1 Stonemasons stone cutters splitters and carvers 1 Street and related service workers 1 Sweepers and related labourers 1 Teaching professionals not elsewhere classified 1 Telecommunications engineering technicians 1 Textile fur and leather products machine operators not elsewhere classified 1 Trade brokers 1 Travel attendants and travel stewards 1 Travel guides 1
Labour shortages and surpluses 2017
2017 41
Directorate-General for Employment Social Affairs and Inclusion European Network of Public Employment Services (PES)
Shortage occupation PES count
Tree and shrub crop growers 1 Underwater divers 1 University and higher education teachers 1 Vehicle cleaners 1 Veterinarians 1 Weaving and knitting machine operators 1 Web technicians 1 Wood processing plant operators 1 Woodworking-machine tool setters and operators 1
Labour shortages and surpluses 2017
2017 42
Directorate-General for Employment Social Affairs and Inclusion European Network of Public Employment Services (PES)
ANNEX 3 SURPLUS OCCUPATIONS
Surplus occupation PES count
General office clerks 8 Shop sales assistants 8 Advertising and marketing professionals 6 Bank tellers and related clerks 6 Sociologists anthropologists and related professionals 6 Child care workers 5 Hairdressers 5 Journalists 5 Cashiers and ticket clerks 4 Cleaners and helpers in offices hotels and other establishments 4 Hand packers 4 Mail carriers and sorting clerks 4 Photographers 4 Receptionists (general) 4 Tailors dressmakers furriers and hatters 4 Accounting and bookkeeping clerks 3 Administrative and executive secretaries 3 Beauticians and related workers 3 Biologists botanists zoologists and related professionals 3 Bricklayers and related workers 3 Broadcasting and audio-visual technicians 3 Civil engineering labourers 3 Economists 3 Gardeners horticultural and nursery growers 3 Interior designers and decorators 3 Kitchen helpers 3 Legal professionals not elsewhere classified 3 Manufacturing labourers not elsewhere classified 3 Motor vehicle mechanics and repairers 3
Musicians singers and composers 3 Other artistic and cultural associate professionals 3 Painters and related workers 3 Philosophers historians and political scientists 3 Security guards 3 Sweepers and related labourers 3 Travel consultants and clerks 3 Waiters 3 Actors 2 Archivists and curators 2 Bakers pastry-cooks and confectionery makers 2 Bartenders 2 Building construction labourers 2 Business services and administration managers not elsewhere classified 2 Cabinet-makers and related workers 2 Car taxi and van drivers 2 Chemists 2 Cleaning and housekeeping supervisors in offices hotels and other establishments 2 Credit and loans officers 2 Customs and border inspectors 2 Elementary workers not elsewhere classified 2 Film stage and related directors and producers 2 Financial analysts 2 Forestry and related workers 2 Freight handlers 2 Graphic and multimedia designers 2 Health care assistants 2 Hotel receptionists 2 Lawyers 2 Legal and related associate professionals 2 Library clerks 2 Livestock and dairy producers 2 Management and organization analysts 2 Messengers package deliverers and luggage porters 2 Odd job persons 2 Office supervisors 2 Plasterers 2
Labour shortages and surpluses 2017
2017 43
Directorate-General for Employment Social Affairs and Inclusion European Network of Public Employment Services (PES)
Surplus occupation PES count
Police officers 2 Pre-press technicians 2 Print finishing and binding workers 2 Printers 2 Prison guards 2 Product and garment designers 2 Psychologists 2 Public relations professionals 2 Religious professionals 2 Secondary education teachers 2 Secretaries (general) 2 Social work and counselling professionals 2 Stall and market salespersons 2 Stock clerks 2 Teachers aides 2 Telephone switchboard operators 2 Travel guides 2 Visual artists 2 Advertising and public relations managers 1 Agricultural technicians 1 Announcers on radio television and other media 1 Assemblers not elsewhere classified 1 Building and related electricians 1 Building architects 1 Building caretakers 1 Building frame and related trades workers not elsewhere classified 1 Business services agents not elsewhere classified 1 Buyers 1 Carpenters and joiners 1 Chemical engineers 1 Civil engineers 1 Clearing and forwarding agents 1 Clerical support workers not elsewhere classified 1
Commercial sales representatives 1 Conference and event planners 1 Contact centre information clerks 1 Contact centre salespersons 1 Cooks 1 Crane hoist and related plant operators 1 Creative and performing artists not elsewhere classified 1 Dancers and choreographers 1 Data entry clerks 1 Database designers and administrators 1 Domestic cleaners and helpers 1 Domestic housekeepers 1 Draughtspersons 1 Driving instructors 1 Early childhood educators 1 Electronics mechanics and servicers 1 Farming forestry and fisheries advisers 1 Fashion and other models 1 Fast food preparers 1 Field crop and vegetable growers 1 Filing and copying clerks 1 Finance managers 1 Financial and insurance services branch managers 1 Financial and investment advisers 1 Fire-fighters 1 Fitness and recreation instructors and program leaders 1 Floor layers and tile setters 1 Food service counter attendants 1 Fruit vegetable and related preservers 1 Gallery museum and library technicians 1 Garbage and recycling collectors 1 Garment and related pattern-makers and cutters 1 Glass and ceramics plant operators 1 Government tax and excise officials 1 Hand launderers and pressers 1
Labour shortages and surpluses 2017
2017 44
Directorate-General for Employment Social Affairs and Inclusion European Network of Public Employment Services (PES)
Surplus occupation PES count
Heavy truck and lorry drivers 1 House builders 1 Hunters and trappers 1 Information and communications technology installers and servicers 1 Information and communications technology user support technicians 1 Insurance representatives 1 Jewellery and precious-metal workers 1 Judges 1 Legal secretaries 1 Librarians and related information professionals 1 Life science technicians (excluding medical) 1 Lifting truck operators 1 Managing directors and chief executives 1 Manufacturing supervisors 1 Medical and dental prosthetic technicians 1 Metal moulders and coremakers 1 Mining and quarrying labourers 1 Mixed crop and animal producers 1 Mixed crop growers 1 Mobile farm and forestry plant operators 1 Musical instrument makers and tuners 1 Other language teachers 1 Pawnbrokers and money-lenders 1 Personnel and careers professionals 1 Pet groomers and animal care workers 1 Photographic products machine operators 1 Physical and engineering science technicians not elsewhere classified 1 Physicists and astronomers 1 Police inspectors and detectives 1 Precision-instrument makers and repairers 1 Primary school teachers 1 Process control technicians not elsewhere classified 1 Product graders and testers (excluding foods and beverages) 1
Production clerks 1 Professional services managers not elsewhere classified 1 Protective services workers not elsewhere classified 1 Research and development managers 1 Retail and wholesale trade managers 1 Roofers 1 Sales workers not elsewhere classified 1 Senior government officials 1 Service station attendants 1 Shelf fillers 1 Shop supervisors 1 Social work associate professionals 1 Special needs teachers 1 Spray painters and varnishers 1 Statistical mathematical and related associate professionals 1 Stonemasons stone cutters splitters and carvers 1 Street food salespersons 1 Supply distribution and related managers 1 Teaching professionals not elsewhere classified 1 Technical and medical sales professionals (excluding ICT) 1 Training and staff development professionals 1 Translators interpreters and other linguists 1 Transport conductors 1 Tree and shrub crop growers 1 Typists and word processing operators 1 Undertakers and embalmers 1 Vocational education teachers 1 Weaving and knitting machine operators 1 Woodworking-machine tool setters and operators 1
Labour shortages and surpluses 2017
2017 45
Directorate-General for Employment Social Affairs and Inclusion European Network of Public Employment Services (PES)
ANNEX 4 THE RATIO OF UNEMPLOYED TO NEW HIRES
ISCO-08 title
2015
UE
Recruited in the
last year (lt12
months)
Ratio of UE to new recruits
Street and related service workers 85 104 08 Agricultural forestry and fishery labourers 3913 5343 07 Mining and construction labourers 1937 3525 05 Creative and performing artists 610 1115 05 Refuse workers 1036 1923 05 Painters building structure cleaners and related trades workers 1116 2117 05 Street and market salespersons 195 389 05 Building frame and related trades workers 3632 7353 05 Mining manufacturing and construction supervisors 626 1315 05 Ships deck crews and related workers 53 114 05 Market gardeners and crop growers 1471 3207 05 Managing directors and chief executives 304 667 05 Travel attendants conductors and guides 229 538 04 Wood treaters cabinet-makers and related trades workers 491 1159 04 Manufacturing labourers 1640 3909 04 Domestic hotel and office cleaners and helpers 5679 13545 04 Other stationary plant and machine operators 822 1961 04 Mobile plant operators 1038 2497 04 Building finishers and related trades workers 1519 3680 04 Textile fur and leather products machine operators 431 1048 04 Garment and related trades workers 422 1047 04 Chemical and photographic products plant and machine operators 157 389 04 Food processing and related trades workers 930 2330 04 Vehicle window laundry and other hand cleaning workers 291 754 04 Sheet and structural metal workers moulders and welders and related workers
996 2603 04
Waiters and bartenders 4399 11595 04 Cooks 1529 4039 04 Metal processing and finishing plant operators 208 557 04 Printing trades workers 203 548 04 Forestry and related workers 130 351 04 Protective services workers 1347 3658 04 Transport and storage labourers 2532 6939 04 Fishery workers hunters and trappers 46 128 04 Material-recording and transport clerks 1671 4630 04 Process control technicians 179 517 03 Mining and mineral processing plant operators 94 274 03 Telecommunications and broadcasting technicians 177 519 03 Blacksmiths toolmakers and related trades workers 816 2409 03 Building and housekeeping supervisors 678 2045 03
Secretaries (general) 1072 3259 03 Assemblers 850 2586 03 Other craft and related workers 258 810 03 Shop salespersons 6600 21042 03 Electrical equipment installers and repairers 958 3060 03 Food and related products machine operators 437 1400 03 Other sales workers 1087 3510 03 Food preparation assistants 1646 5337 03 Mixed crop and animal producers 387 1260 03 Car van and motorcycle drivers 1155 3764 03 Client information workers 1993 6531 03 Sports and fitness workers 605 1984 03 Handicraft workers 194 638 03 Life science technicians and related associate professionals 82 271 03 Keyboard operators 283 940 03 Electronics and telecommunications installers and repairers 290 963 03 Other personal services workers 313 1047 03 Vocational education teachers 279 940 03 Other teaching professionals 744 2518 03 General office clerks 966 3272 03 Authors journalists and linguists 335 1135 03 Hairdressers beauticians and related workers 806 2796 03
Labour shortages and surpluses 2017
2017 46
Directorate-General for Employment Social Affairs and Inclusion European Network of Public Employment Services (PES)
ISCO-08 title
2015
UE
Recruited in the
last year (lt12
months)
Ratio of UE to new recruits
Animal producers 189 660 03 Other elementary workers 976 3401 03 Machinery mechanics and repairers 1134 3962 03 Ship and aircraft controllers and technicians 80 281 03 Hotel and restaurant managers 344 1220 03 Cashiers and ticket clerks 908 3220 03 Retail and wholesale trade managers 224 809 03 Sales marketing and development managers 311 1124 03 Physical and engineering science technicians 1204 4366 03 Administrative and specialised secretaries 1106 4040 03 Sales and purchasing agents and brokers 1294 4754 03 Rubber plastic and paper products machine operators 256 941 03 Artistic cultural and culinary associate professionals 511 1906 03 Numerical clerks 944 3532 03 Other services managers 184 691 03 Child care workers and teachers aides 1335 5005 03 Heavy truck and bus drivers 1426 5349 03 Business services and administration managers 383 1439 03 Information and communications technology service managers 67 257 03 Regulatory government associate professionals 209 807 03 Life science professionals 176 681 03 Wood processing and papermaking plant operators 97 379 03 Locomotive engine drivers and related workers 46 179 03 Legal professionals 315 1245 03 Personal care workers in health services 2195 8787 02 Physical and earth science professionals 85 345 02 Street vendors (excluding food) 50 204 02 Architects planners surveyors and designers 515 2092 02 Other clerical support workers 901 3657 02 Business services agents 510 2114 02 Manufacturing mining construction and distribution managers 361 1507 02 Tellers money collectors and related clerks 381 1612 02 Librarians archivists and curators 58 248 02 Medical and pharmaceutical technicians 255 1099 02 University and higher education teachers 301 1333 02 Information and communications technology operations and user support technicians
418 1888 02
Legal social and religious associate professionals 920 4348 02 Financial and mathematical associate professionals 601 2852 02 Sales marketing and public relations professionals 865 4172 02 Finance professionals 472 2281 02 Engineering professionals (excluding electrotechnology) 635 3118 02 Other health associate professionals 531 2657 02
Social and religious professionals 460 2317 02 Professional services managers 176 891 02 Nursing and midwifery associate professionals 556 2855 02 Legislators and senior officials 53 286 02 Database and network professionals 83 455 02 Administration professionals 641 3673 02 Primary school and early childhood teachers 575 3345 02 Electrotechnology engineers 142 827 02 Secondary education teachers 471 2812 02 Other health professionals 346 2083 02 Nursing and midwifery professionals 273 1760 02 Software and applications developers and analysts 631 4159 02 Medical doctors 293 1944 02 No occupation 152894 00
No answer 2531 578 44 Total 249561 294937 08
Labour shortages and surpluses 2017
2017 47
Directorate-General for Employment Social Affairs and Inclusion European Network of Public Employment Services (PES)
HOW TO OBTAIN EU PUBLICATIONS
Free publications
bull one copy
via EU Bookshop (httpbookshopeuropaeu)
bull more than one copy or postersmaps
from the European Unionrsquos representations (httpeceuropaeurepresent_enhtm)
from the delegations in non-EU countries
(httpeeaseuropaeudelegationsindex_enhtm)
by contacting the Europe Direct service (httpeuropaeueuropedirectindex_enhtm)
or calling 00 800 6 7 8 9 10 11 (free phone number from anywhere in the EU) () () The information given is free as are most calls (though some operators phone boxes or hotels may charge you)
Priced publications
bull via EU Bookshop (httpbookshopeuropaeu)
Priced subscriptions
bull via one of the sales agents of the Publications Office of the European Union
(httppublicationseuropaeuothersagentsindex_enhtm)
doi 10276731262
KE-0
1-1
8-2
63-E
N-N
[Ca
talo
gu
e n
um
be
r]
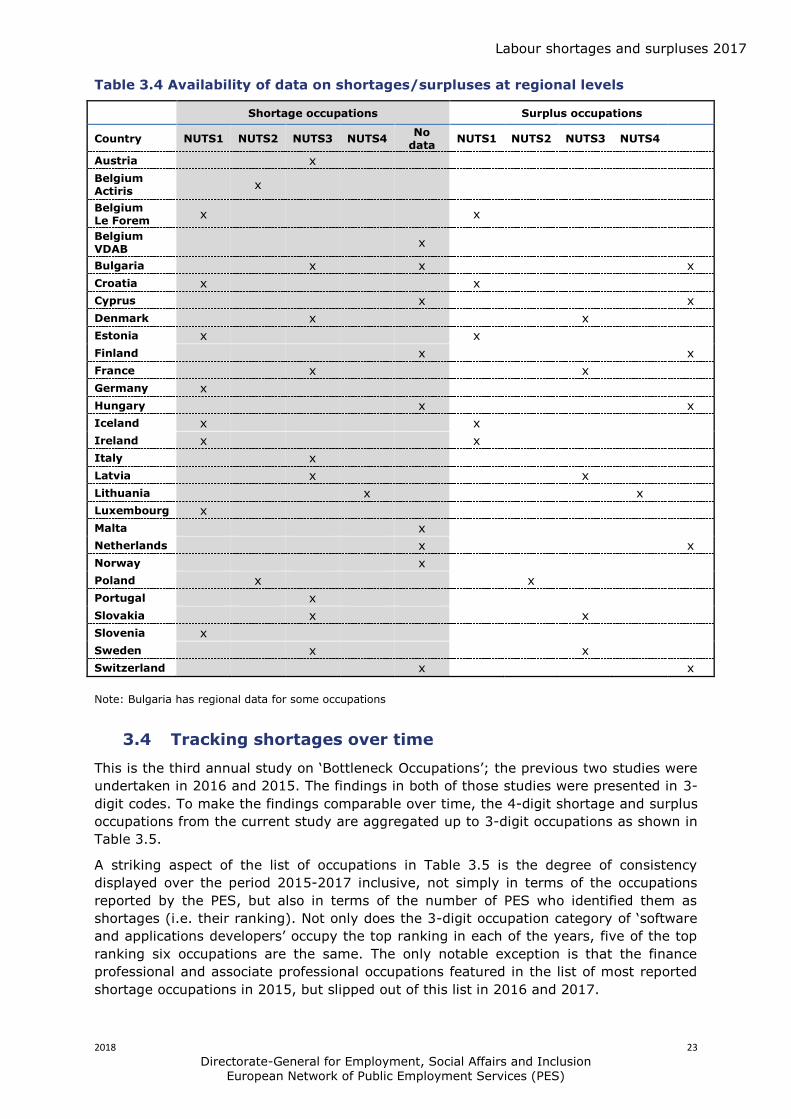
Labour shortages and surpluses 2017
2018 23
Directorate-General for Employment Social Affairs and Inclusion European Network of Public Employment Services (PES)
Table 34 Availability of data on shortagessurpluses at regional levels
Shortage occupations Surplus occupations
Country NUTS1 NUTS2 NUTS3 NUTS4 No
data NUTS1 NUTS2 NUTS3 NUTS4
Austria
x
Belgium Actiris
x
Belgium Le Forem
x
x
Belgium VDAB
x
Bulgaria
x
x
x
Croatia x
x
Cyprus
x
x
Denmark
x
x
Estonia x
x
Finland
x
x
France
x
x
Germany x
Hungary
x
x
Iceland x
x
Ireland x
x
Italy
x
Latvia
x
x
Lithuania
x
x
Luxembourg x
Malta
x
Netherlands
x
x
Norway
x
Poland
x
x
Portugal
x
Slovakia
x
x
Slovenia x
Sweden
x
x
Switzerland
x
x
Note Bulgaria has regional data for some occupations
34 Tracking shortages over time
This is the third annual study on lsquoBottleneck Occupationsrsquo the previous two studies were
undertaken in 2016 and 2015 The findings in both of those studies were presented in 3-
digit codes To make the findings comparable over time the 4-digit shortage and surplus
occupations from the current study are aggregated up to 3-digit occupations as shown in
Table 35
A striking aspect of the list of occupations in Table 35 is the degree of consistency
displayed over the period 2015-2017 inclusive not simply in terms of the occupations
reported by the PES but also in terms of the number of PES who identified them as
shortages (ie their ranking) Not only does the 3-digit occupation category of lsquosoftware
and applications developersrsquo occupy the top ranking in each of the years five of the top
ranking six occupations are the same The only notable exception is that the finance
professional and associate professional occupations featured in the list of most reported
shortage occupations in 2015 but slipped out of this list in 2016 and 2017
Labour shortages and surpluses 2017
2018 24
Directorate-General for Employment Social Affairs and Inclusion European Network of Public Employment Services (PES)
Table 35 Ranking of shortage occupations (3-digit)
Rank
Top occupations in 2017 2017 2016 2015
Software and application developers 1 1 1
Sheet and structural metal workers 2 3 2
Medical doctors 3 5 2
Blacksmiths toolmakers and related trades 4 3 4
Building finishes and related trade workers 4 6 4
Building frame and related trade workers 4 3 4
Cooks 4 7 7
Engineering professionals 5 6 6
Physical and engineering science technicians 6 7 na
Electrical equipment installers and repairers 7 4 5
Heavy truck and bus drivers 7 5 4
Machinery mechanics and repairers 8 7 5
Nursing and midwifery professionals 8 6 na
Sales and purchasing agents and brokers 9 2 5
Shop salespersons 10 7 8
Electro technology engineers 10 na na
Primary school and early childhood teachers 10 na na
Domestic hotel and office cleaners and helpers 10 na na
Waiters and bartenders 10 na na
35 3-digit vs 4-digit
There are advantages and disadvantages associated with using the more aggregated 3-
digit occupation classification as it was done in previous studies The bundling of
individual occupations into families provides greater visibility of shortages at a broad
skill level (eg all software related occupations)
However there are distinct disadvantages in using the 3-digit occupations and these
apply particularly to their practical usefulness to education and training providers In
many cases shortages identified at 3-digit level do not provide a reliable basis for
identifying the specific skill which is in shortage or surplus
By combining the analyses of the 4-digit and corresponding 3-digit classifications in this
report many examples are revealed of how an exclusive reliance on the 3-digit
classification could be seriously misleading Thus the findings in this report show that
within the 3-digit classification of lsquosheet and structural metal workers moulders and
weldersrsquo the 4-digit occupation which is in short supply is lsquoweldersrsquo and not for example
lsquosheet metal workersrsquo This is an important insight because in many European countries
the skills of welding and sheet metal work are provided through entirely different
vocational programmes8
There are many examples of this phenomenon in the 3-digit occupations in Table 35 For
example the analysis in this report shows that toolmakers are a shortage occupation
8 In Ireland for example sheet metal workers and welders undertake entirely different apprenticeships
Labour shortages and surpluses 2017
2018 25
Directorate-General for Employment Social Affairs and Inclusion European Network of Public Employment Services (PES)
but blacksmiths are not Furthermore the 3-digit classification disguises the extent of the
reported shortage Thus while the 3-digit occupation of professional nursing and
midwifery is shown in the current report as being shortage occupations a total of eleven
PES reported professional nursing as a shortage compared to only three PES reporting
professional midwifery as a shortage By bundling these occupations together the
significant difference in the relative severity of the shortage is not apparent
This phenomenon applies equally to the surplus occupations which were identified in this
report For example lsquochildcare workersrsquo were described as a surplus occupation by five
PES But in the 3-digit classification they are bundled together with lsquospecial needs
teachersrsquo which was not identified as a surplus occupation
36 Conclusions
There are a number of conclusions which can be drawn from the analyses in this chapter
Firstly the sources used by many of the PES to identify shortage occupations is one of
the main reasons why only eighteen PES provided data on surplus occupations Many of
the PES relied on the results of employer surveys forecasting models and immigration
data to identify shortages and these sources in general do not provide data on surplus
occupations However it was by no means the only reason why so many PES did not
provide data on surplus organisations and this issue will have to be addressed before the
commencement of the 2018 study In the future PES data should be augmented by data
collected by other bodies as outlined in the new EU Regulation
Secondly there is no obvious explanation for the geographic distribution of shortages
and surpluses In some cases countries with relatively small labour forces have a
relatively high number of shortage occupations while a strong apprenticeship system
does not appear to prevent a relatively high share of the identified shortages being in the
craft occupations It may be that the stipulation to only include twenty shortage and
surplus occupations has created a situation where some countries with a relatively large
labour force are artificially constrained to submit a much smaller number of shortage
occupations than they actually have
Thirdly there is a high degree of stability in relation to the occupations which were
identified as shortages in the 2015 2016 and 2017 editions of the Bottleneck report
Finally providing information on shortage and surplus occupations at 4-digit level is
much more useful from a policy perspective than providing the data at a more
aggregated level The results of the analyses at 4-digit level show which specific
occupations in the bundle of occupations used in the previous reports were in shortage
and which were not This is also true of the occupations which were identified as surplus
occupations A more aggregated group of occupations does not allow for the targeting of
specific individual occupations either for increasing training provision or for enhancing
cross border mobility Indeed as a number of specific examples show were providers of
vocational training or indeed policy makers to act on the basis of the 3-digit shortage and
surplus occupations identified in previous reports they could very well have assign
resources to occupations which were neither in shortage nor in surplus
Labour shortages and surpluses 2017
2018 26
Directorate-General for Employment Social Affairs and Inclusion European Network of Public Employment Services (PES)
4 THE CAUSES OF SKILL SHORTAGES AND POTENTIAL SOLUTIONS
41 Introduction
The focus of this chapter is on identifying the possible causes of skills shortages and
surpluses and exploring ways in which these imbalances may be resolved The chapter
begins with a review of the nature of skills and labour market imbalances and concludes
with an exploration of the extent to which enhanced cross-border mobility policies and
more equal gender representation could contribute to the alleviation of skills and labour
imbalances in certain shortage occupations in the EEA labour market
42 The role of skills and labour shortages in skills imbalances
One of the new questions included in the current study asks the PES to identify the
nature of the shortage (ie is it a skill shortage or a labour shortage) in relation to each
shortage occupation they identified It was explained in the questionnaire that labour
shortages occur when there are a sufficient number of appropriately qualified job-seekers
to fill the vacancies which arise but for a variety of reasons many of them do not wish
to work in the occupation in question Their response to this question is summarised in
Table 41 in respect of the twenty occupations which were reported by the most PES
A total of twenty-six PES classified their shortage occupations as skill or labour
shortages and they classified most of the occupations as skill shortages Indeed in the
case of seven occupations plumbers doctors software developers electricians
electronic engineers electronic engineering technicians bus and tram drivers and
mechanical engineers all of the reporting PES classified the shortage as a skills deficit
Each labour market within the EEA is regulated in a particular manner and conditions of
employment even within the same occupation vary throughout the region This is why
many occupations while classified by most of the PES as reflecting skill deficits
nevertheless are classified by some PES as labour shortages
However the number of PES involved is very small indeed Only in the case of three
occupations lsquowaitersrsquo lsquoshop sales assistantsrsquo and lsquoprimary school teachersrsquo are there
more PES classifying the shortage as a labour shortage then a skills deficit The first two
occupations are undoubtedly labour shortages This is because there are few if any
barriers to working in these occupations9
The inclusion of lsquoprimary school teachersrsquo as a labour shortage is however a surprise It
was identified by eight PES as a shortage occupation two of whom classified the
occupation as a shortage of high magnitude It would be necessary to conduct research
into the conditions of employment ndash including qualification criteria ndash within the countries
where the reporting PES are located to establish if this classification of the occupation as
a labour shortage is warranted
With some notable exceptions the response of the PES to classifying their shortage
occupations as skill or labour shortages demonstrates that the PES understand these
concepts Occupations such as professional nurses which are obviously suffering from a
shortage of qualified job-seekers in the EEA are overwhelmingly categorised as a skills
shortage while less skilled occupations such as cleaners are categorised as being on the
borderline between skills and labour shortages
9 Both occupations have relatively high ratios of unemployed to new hires (Annex 4)
Labour shortages and surpluses 2017
2018 27
Directorate-General for Employment Social Affairs and Inclusion European Network of Public Employment Services (PES)
Table 41 Skill and labour shortages
Occupation
Number of PES
reporting occupation
as skills shortage
Number of PES
reporting occupation as labour shortage
Number of PES
reporting occupations as skill and
labour shortage
Total number of
PES reporting on skillslabour
shortage
Cooks 9 1 0 10
Plumbers and pipe fitters 8 0 0 8
Generalist medical Practitioners 7 0 0 7
Heavy truck and lorry drivers 4 2 1 7
Metal workers machine tool setting and operators
3 3 1 7
Welders and flame cutters 4 2 1 7
Nursing professionals 5 1 0 6
Software developers 6 0 0 6
Systems analyst 5 1 0 6
Bricklayers and related trades 4 1 0 5
Building and related electricians 5 0 0 5
Butchers fishmongers and related food 3 2 0 5
Cleaners and helpers in offices 3 2 0 5
Commercial sales representatives 2 2 1 5
Electronic engineers 5 0 0 5
Manufacturing supervisors 4 1 0 5
Motor vehicle mechanics and repairers 3 1 1 5
Nursing associate professionals 4 1 0 5
Primary school teachers 2 3 0 5
Shop sales assistants 1 4 0 5
Waiters 2 3 0 5
Agriculture and industrial machinery repairers
3 1 0 4
Application programmers 3 1 0 4
Bus and tram drivers 4 0 0 4
Electronic engineering technicians 4 0 0 4
Health care assistants 3 1 0 4
Mechanical engineers 4 0 0 4
Sheet metal workers 3 1 0 4
Structural metal preparers and erectors 3 1 0 4
Total number of PES reporting 16 8 2 26
The atypical working hours associated with heavy goods vehicle driving is recognised by
two of the six PES who classify shortages in the occupation as labour shortages while the
unpleasant conditions associated with working in butchery shops and abattoirs is
reflected in the fact that two of the five PES who categorised the occupation as a
shortage occupation classify it as a labour shortage
43 Location of skill imbalances and cross border mobility
In recent years there has been considerable discussion on the potential role which
enhanced cross-border mobility could play in alleviating labour market imbalances The
attractiveness of such a policy is obvious The European Union is a very large
Labour shortages and surpluses 2017
2018 28
Directorate-General for Employment Social Affairs and Inclusion European Network of Public Employment Services (PES)
marketplace embracing a very large labour force if even some of the shortages which
are reported by EEA countries could be resolved by exploiting the surpluses which are
reported by other EEA countries it could form the basis of a number of win-win solutions
for both job-seekers and businesses
An additional attraction of this policy is that it could potentially successfully address both
skills and labour shortages as working conditions associated with some labour shortages
in one country might be perceived as significantly more attractive in a different EEA
country
Table 44 provides a list of the top twenty shortage occupations which have at least one
PES in another EEA country reporting the occupation as a surplus
There are a number of aspects of the Table which are notable Firstly the list of top
occupations has changed quite dramatically from the list in Table 21 specifically none
of the professional and associate professional occupations are now on the list including
the four professional and associate professional health-related occupations or the two
professional software occupations What the Table shows is that there are no surpluses
reported in any of the EEA countries of doctors or nurses software developers or
systems analysts While the occupation of healthcare assistants is in surplus in many
countries it was not included in the list of top occupations because it was reported as a
shortage by only two PES
The figures in Table 42 show that there are three cross-border matching possibilities in
the case of bricklayers and motor mechanics and two possibilities in the case of
plasterers health care assistants and secondary school teachers
There is just one matching possibility in respect of a wide range of occupations including
cooks truck drivers commercial sales representatives electricians carpenters civil
engineers primary school teachers manufacturing supervisors telecentre salespersons
childhood education teachers floor layers and roofers
The fact that primary school teachers have only one cross border matching possibility
suggest that the classification of the occupation as a labour shortage by three of five PES
is an error In general labour shortages would be expected to have more cross border
matching possibilities than skill shortages because there are many job-seekers eligible to
work in the occupation in question and working conditions vary quite significantly from
country to country Indeed it is notable that the two other occupations which were
classified by the PES as predominantly labour shortages waiters and shop sales
assistants have a relatively high number of matching possibilities eight in the case of
shop sales assistants and three in the case of waiters
In general the PES did not classify the same occupation as both a shortage and a
surplus A striking exception is the Danish PES which categorised four of its shortage
occupations as surplus occupations also This is most likely due to the higher level of
granularity available in the Danish data (below 4-digit) so that some job titles within an
occupation are considered labour shortage while others skill shortage
44 Assessing gender composition of surpluses
The PES were asked to estimate the share of females in the occupations which they
identified as lsquosurplusrsquo occupations The restricting of this question to surplus occupations
was to avoid giving the impression that shortages were arising because of discriminatory
recruitment policies
Labour shortages and surpluses 2017
2018 29
Directorate-General for Employment Social Affairs and Inclusion European Network of Public Employment Services (PES)
A total of 13 PES reported any data on gender composition of surpluses However the
quality of information submitted did not provide a sufficient basis for an accurate
estimation of the gender composition of surpluses in some of the cases
It is suggested that in order to address gender imbalances in relation to shortages and
surpluses data from PES on job seekers should be combined with the LSF data on
employment by occupation
45 Conclusions
The analysis in chapter four has produced a number of interesting findings The analysis
reveals that the PES in general has the capacity to distinguish between skill and labour
shortages and to identify shortage occupations which have some cross-border matching
possibilities
The relatively low number of surplus occupations reflects two factors firstly only
eighteen PES submitted a list of surplus occupations and secondly in many cases the
lists did not include the maximum number of twenty occupations which were requested
This response has to be viewed against the background of an EEA labour market where
employment is expanding and unemployment is contracting However while this is a
positive development the relatively low number of surplus occupations has placed a
significant limit on the extent to which there were cross-border possibilities of matching
shortage with surplus occupations
The data indicates that there is a limitation to the extent to which the PES can be used to
identify the gender imbalances (eg under-representation of females in some
occupations) and that other sources should be explored
Labour shortages and surpluses 2017
2018 30
Directorate-General for Employment Social Affairs and Inclusion European Network of Public Employment Services (PES)
Table 43 The potential for cross-border matching of shortage and surplus occupations
No PES
Occupation PES reporting shortage PES reporting surplus No PES
16 Cooks AT Art BG CY DK HR IE IS IT MT NL NO PT SE SI SK lsaquo―rsaquo HU 1
11 Truck drivers ART VDAB BG DK HR LT IT NL NO PT SE SI SK lsaquo―rsaquo DK 1
10 Cleaners helpers CY DK HR FI IS HU NL NO PT SI lsaquo―rsaquo DK LF NL IE 4
10 Commercial sales VDAB ART DK FI FR IT IE PT PL SI lsaquo―rsaquo DK 1
9 Sales assistants AT ART BG CY DK IT NO SI SK lsaquo―rsaquo DK LF SE NL BG CH FI IE 8
9 Bricklayers ART DE DK HR HU LT NL PT SI lsaquo―rsaquo CY HU IE 3
9 Motor mechanics AT VDAB ART LF DK IT NO PT SI lsaquo―rsaquo SK CH EE 3
9 Waiters ART BG CY IS IT MT NO PT SI lsaquo―rsaquo HU EE IE 3
9 Electricians ART VDAB DE DK IS IT NL NO SI lsaquo―rsaquo FR 1
8 Carpenters DK HR HU FI NL NO PT SI lsaquo―rsaquo HU 1
8 Civil engineers ART CH DE FI FR NO SE SI lsaquo―rsaquo CY 1
8 Primary teachers ART BG DK IS NO SE SI SK lsaquo―rsaquo CY 1
7 Healthcare assist CY DK EE NL NO SI SK lsaquo―rsaquo DK NL 2
7 Second teacher ART BG FR NL NO SI SK lsaquo―rsaquo CY FI 2
7 Man supervisors ART VDAB LF DE EE FR SK lsaquo―rsaquo BG 1
6 Plasterers HR HU FI LT NL SI lsaquo―rsaquo HU IE 2
6 Tele centre sales ART HU FI FR MT NO lsaquo―rsaquo EE 1
6 Childhood educ FI LT NO SE SI SK lsaquo―rsaquo CY 1
6 Floor layers HU HR FI FR LT LV lsaquo―rsaquo HU 1
6 Roofers HR FI FR LT LV SI lsaquo―rsaquo HU 1
Bottlenecks Occupations 2017
2017 31
Directorate-General for Employment Social Affairs and Inclusion European Network of Public Employment Services (PES)
5 CONCLUSIONS AND RECOMMENDATIONS
51 Conclusions
The terms of reference for this study emphasise the desirability of creating a process for
the systematic collection of data on surplus and shortage occupations in the EEA area
which could be effectively used by EURES for cross border matching of shortage
occupations in some EEA countries with surplus occupations in others
The authors have responded to this emphasis by using a process which ensures that the
data gathered on shortage and surplus occupations is comprehensive accurate and of
practical use to EURES and the providers of education and training programmes The
process is comprehensive because it gathers information both on the extent of shortages
and surpluses and on their relative severity It is accurate because the list of shortage
and surplus occupations are shown to be consistent with the estimated value of the ratio
of unemployed to new hires Finally the process provides information which is of
practical use to EURES and the national providers of VET because the data gathered is on
individual occupations rather than on lsquobundles of occupationsrsquo as in previous studies The
analyses in this report shows that while these bundles of occupations contain some
occupations which are identified by the PES as shortage and surplus occupations they
also contain occupations which are neither in shortage nor in surplus and it is impossible
to distinguish one from the other
The data gathering process used in this report however was not devoid of weaknesses
Fortunately these weaknesses reflect the modus operandi of the PES and may be
rectified by including other institutions and agencies in the process For example the PES
use the same sources for the identification of both shortage and surplus occupations
This may have advantages in terms of accuracy when those sources include employersrsquo
surveys immigration data and the results of forecasting exercises However these
sources are not suitable for gathering data on surplus occupations and they are the main
reason why the number of surplus occupations provided by the PES were almost half the
number requested In the future PES data could be augmented by data gathered by
other bodies as outlined in recent EU Regulation 2016589
In addition the response to the question on the capacity of the PES to deliver data on
shortage and surplus occupations at a regional level was also disappointing perhaps
reflecting a misalignment in some EEA countries between the geographic configuration of
the local PES network and the NUTs regions
The analysis highlighted that in order to assess gender imbalances of shortages and
surpluses PES data needs to be augmented by other sources
Finally despite the low number of surplus occupations submitted by the PES it was
nevertheless possible to identify twenty shortage occupations in the EEA labour market
which had at least one cross-border matching possibility and many more than one in the
case of some shortage occupations
52 Recommendations
Based on the findings from the three bottleneck studies undertaken to date a model for
the gathering of data on shortages and surpluses is proposed (Figure 51) The model
includes features of the methodology applied in this study which were successful It also
includes a number of features which should be introduced to the process in order to
address some of the weaknesses which were identified in this study (highlighted in red)
Labour shortages and surpluses 2017
2017 32
Directorate-General for Employment Social Affairs and Inclusion European Network of Public Employment Services (PES)
However before this methodology is implemented it would be prudent to discuss data
requirements with PES and invite a broader range of institutions and agencies to
participate in aspects of the data gathering process in addition to the PES EURES
Regulation (EU) 2016589 of the European Parliament and of the Council which obliges
the appropriate national authorities to furnish such data annually is fortuitous in this
regard and should facilitate the implementation of this recommendation
In addition the results of these and other relevant studies should be disseminated to
PES Eures coordination group and other relevant agencies and institutions in order to
emphasise the importance of data and analysis in informing policy at EU and national
level which aims to resolve labour market imbalances
Labour shortages and surpluses 2017
2017 33
Directorate-General for Employment Social Affairs and Inclusion European Network of Public Employment Services (PES)
Figure 51 Model for gathering data on shortage and surplus occupations
Sources of data on surpluses PES data from other relevant agencies
In those cases where the source used by the PES to identify shortage occupations cannot
be used to identify surplus occupations other institutions or other sources or both should be availed of to ensure that comprehensive data on surplus occupations are provided to the appropriate national authority
Dimensions of shortagessurpluses extent (number of reporting PES) and severity (high or low
magnitude)
Data should be systematically gathered on both the extent of shortage and surplus
occupations in the EEA and on their relative severity
Type of shortage skill vs labour shortages
The providers of the data on shortage occupations must also distinguish between skill and labour shortages because this distinction is necessary for the accurate identification of
shortage occupations and for the choice of the appropriate policy response to identified shortages
Classification of occupations used ISCO 08 4-digit codes (or translation into these codes)
All data should be either initially gathered in ISCO 08 4-digit codes or translated into these
codes This ensures that the data refers to specific individual occupations and is of practical use to EURES and the national providers of VET
Accuracy test cross-check with LSF data (ratio of unemployed to new hires)
The accuracy of the submitted lists of shortage and surplus occupations should be assessed
by comparing the most widely reported surplus and shortage occupations with the estimated values of the ratios of employed (by previous occupation) to new hires at the aggregated EU28 level These ratios should be based on an analysis of the most up-to date
Labour Force Survey (LFS) data
Gender balance assessment LFS data on employment at occupational level by gender PES job
seekers
The gender composition of shortage and surplus occupations should be based on the most
up to date analyses of LFS data on employment by gender and the PES job seeker data
Regional balance assessment LSF data data from relevant agencies
Where regional data is required other agencies and institutions should be requested to
provide the data in those cases where the data cannot be provided by the regional PES network because it is not geographically aligned to the NUTs regions
Labour shortages and surpluses 2017
2017 34
Directorate-General for Employment Social Affairs and Inclusion European Network of Public Employment Services (PES)
Number of occupations reporting should be extended beyond 20 occupations but with upper
limit (eg 50)
Consideration should be given to allowing the agencies responsible for identifying shortage
and surplus occupations a greater range of flexibility in terms of the numbers of occupations which should be identified A minimum to maximum range would be a more realistic approach as it would reflect the fact that the labour markets of the EEA vary significantly in size and performance
Timing of imbalance assessment September
It is proposed that the data gathering exercise should be brought forward to early September and that expert advice should be available on line throughout the data
gathering exercise
Labour shortages and surpluses 2017
2017 35
Directorate-General for Employment Social Affairs and Inclusion European Network of Public Employment Services (PES)
ANNEX 1 DATA COLLECTION TEMPLATE Information sought Explanation
Occupation title (text) Type in free text a list of occupations (one row one occupation) for which shortages and surpluses exist first list occupations for which there is a shortage the list should contain a maximum of 20 occupations if your list contains less than 20 occupations please provide a brief explanation in your email response for why the number is lower than 20 second list occupations for which there is a surplus the list should contain a maximum of 20 occupations if your list contains less than 20 occupations please provide a brief explanation in your email response for why the number is lower than 20
Shortagesurplus indicator For each occupation indicate if it refers to a shortage by typing in shortage or surplus by typing in surplus to identify surplus occupations you can examine for each occupation the ratio of the number of job seekers to the number of vacancies at the end of each year for example if there are 5000 shop assistants seeking employment and there are 200 vacancies at the end of the reference period the ratio is 251 you can rank the calculated ratios and report the occupations associated with the 20 highest ratios
Occupational classification used in your country
For each occupation indicate what occupational classification (if any) was used to identify this occupation for instance you can report a country specific classification ISCO ROME SOC etc If you donrsquot use occupational classifications type None
Occupation code to the lowest level of disaggregation (eg ISCO at 4 digits)
If you have indicated a classification used type the code for each occupation use the lowest level of disaggregation (eg 4 digit ISCO code) if you donrsquot use occupational classification leave black
ISCO-08 code at 4-digit level (or lower if 4-digit not available)
If you use occupational classification which is not ISCO-08 and if it is possible provide a translation of the national code to ISCO-08 code ISCO is the International Standard Classification of Occupations which is used to report to Eurostat code should be at 4 digits if this is not available than the lowest level of disaggregation that is available should be reported (3 digits if 4-digit code is not available 2 digits if neither 4-digit nor 3-digit code is available 1 digit if neither 4-digit 3-digit nor 2-digit code is available) if it is not possible to provide translation to ISCO-08 leave black if you have already reported ISCO-08 code in column 3 leave this column black
Estimate of shortagesurplus magnitude (high (gt3 of employment) medium (1-3 of employment) low (lt1 of employment))
For each occupation indicate a broad estimate of the magnitude of the shortagesurplus if you estimate that the shortagesurplus is less than 1 of the total employment in the occupation in question type low if between 1-3 type medium if greater than 3 type high if you cannot provide a rough estimate of magnitude type dont know
Current shortagesurplus (C) future short term (FST) future medium term (FMT) future long term (FLT) donrsquot know (indicate all that apply)
Against each occupation indicate if the identified shortagesurplus refers to present situation by typing C if the shortage is expected to occur in the short term future ie within 12 months by typing FST if it is expected to occur over the medium term (within 1-5 years) by typing FMT if it is expected to occur in the long term (in 5 or more years) by typing FLT if more than one time period applies indicate all relevant ones (eg for current shortagessurpluses that are expected to persist over the short term type C FST) if you dont know type dont know
Source of information on shortagessurpluses (eg PES administrative data (vacancies job seekers) PES survey third party survey Occupational forecasts other (specify) etc)
Indicate the source used to identify shortagesurplus for this occupation did you derive it from the PES administrative data on PES vacancies andor job seekers did you conduct a survey did you commission a third party to conduct a survey for you did you have occupational forecasts available did you use other research type in free text the full description of the source(s) eg National Employment Survey conducted by PES etc
Labour shortages and surpluses 2017
2017 36
Directorate-General for Employment Social Affairs and Inclusion European Network of Public Employment Services (PES)
Date for source of information Indicate the year that the information on shortagessurpluses (column 7) refers to eg type 2016 for a survey of difficult to fill vacancies conducted in 2016 even if the report was published in 2017
What indicator(s) suggested that there is a shortagesurplus
Indicate what criteria was used to conclude that this occupation is associated with a shortagesurplus for instance employers views sourcing from abroad to fill vacancies growth in employment faster than growth in educationtraining output time required to fill
vacancies higher than average etc
Share of females among job seekers in this occupation (surplus occupations only)
Indicate the percentage share of females among all job seekers in this occupation this is only applicable to surplus occupations
Skill or labour shortage Indicate if a shortage refers to a skill or labour shortage a skill shortage occurs where there is an insufficient supply of persons with the appropriate skills labour shortages occur where there is a sufficient number of skilled persons however an insufficient number of them is willing to take up employment in the occupation in question
Indicate the availability of data on shortagessurpluses at regional level (NUTS1 NUTS2 NUTS3 No data)
Indicate if data is available on the regional breakdown of shortagessurpluses by indicating the level of regional data available if multiple levels of regional disaggregation are available indicate the lowest level of disaggregation (eg NUTS3 rather than NUTS2) if there is no regional data available use no data
Labour shortages and surpluses 2017
2017 37
Directorate-General for Employment Social Affairs and Inclusion European Network of Public Employment Services (PES)
ANNEX 2 SHORTAGE OCCUPATIONS
Shortage occupation PES count
Cooks 16 Plumbers and pipe fitters 13 Generalist medical practitioners 12 Welders and flamecutters 12 Heavy truck and lorry drivers 11 Metal working machine tool setters and operators 11 Nursing professionals 11 Software developers 11 Agricultural and industrial machinery mechanics and repairers 10 Cleaners and helpers in offices hotels and other establishments 10 Commercial sales representatives 10 Specialist medical practitioners 10 Systems analysts 10 Bricklayers and related workers 9 Building and related electricians 9 Butchers fishmongers and related food preparers 9 Motor vehicle mechanics and repairers 9 Nursing associate professionals 9 Sheet-metal workers 9 Shop sales assistants 9 Waiters 9 Carpenters and joiners 8 Civil engineers 8 Concrete placers concrete finishers and related workers 8 Electrical engineering technicians 8 Electronics engineering technicians 8 Mechanical engineers 8 Primary school teachers 8 Structural-metal preparers and erectors 8 Electronics engineers 7
Health care assistants 7 Manufacturing supervisors 7 Mechanical engineering technicians 7 Secondary education teachers 7 Accountants 6 Applications programmers 6 Bus and tram drivers 6 Contact centre salespersons 6 Early childhood educators 6 Electrical mechanics and fitters 6 Floor layers and tile setters 6 Plasterers 6 Roofers 6 Sewing machine operators 6 Software and applications developers and analysts not elsewhere classified 6 Toolmakers and related workers 6 Web and multimedia developers 6 Air conditioning and refrigeration mechanics 5 Building frame and related trades workers not elsewhere classified 5 Chefs 5 Civil engineering labourers 5 Construction supervisors 5 Earthmoving and related plant operators 5 Electrical engineers 5 Electrical line installers and repairers 5 Engineering professionals not elsewhere classified 5 Hairdressers 5 Information and communications technology operations technicians 5 Manufacturing managers 5 Physiotherapists 5 Real estate agents and property managers 5 Research and development managers 5 Spray painters and varnishers 5 Accounting associate professionals 4 Bakers pastry-cooks and confectionery makers 4
Labour shortages and surpluses 2017
2017 38
Directorate-General for Employment Social Affairs and Inclusion European Network of Public Employment Services (PES)
Shortage occupation PES count
Blacksmiths hammersmiths and forging press workers 4 Civil engineering technicians 4 Crane hoist and related plant operators 4 Database designers and administrators 4 Industrial and production engineers 4 Painters and related workers 4 Physical and engineering science technicians not elsewhere classified 4 Plastic products machine operators 4 Social work and counselling professionals 4 Accounting and bookkeeping clerks 3 Administrative and executive secretaries 3 Ambulance workers 3 Building construction labourers 3 Car taxi and van drivers 3 Cartographers and surveyors 3 Cleaning and housekeeping supervisors in offices hotels and other establishments 3 Contact centre information clerks 3 Draughtspersons 3 Fast food preparers 3 Freight handlers 3 Gardeners horticultural and nursery growers 3 Home-based personal care workers 3 Hotel receptionists 3 Information and communications technology installers and servicers 3 Insulation workers 3 Kitchen helpers 3 Manufacturing labourers not elsewhere classified 3 Medical imaging and therapeutic equipment technicians 3 Metal moulders and coremakers 3 Metal polishers wheel grinders and tool sharpeners 3 Midwifery professionals 3 Other language teachers 3 Personal services workers not elsewhere classified 3
Pharmacists 3 Policy administration professionals 3 Printers 3 Process control technicians not elsewhere classified 3 Sales and marketing managers 3 Shop supervisors 3 Special needs teachers 3 Stock clerks 3 Supply distribution and related managers 3 Survey and market research interviewers 3 Systems administrators 3 Technical and medical sales professionals (excluding ICT) 3 Translators interpreters and other linguists 3 Transport clerks 3 Vocational education teachers 3 Advertising and marketing professionals 2 Audiologists and speech therapists 2 Bartenders 2 Beauticians and related workers 2 Cashiers and ticket clerks 2 Chemical engineers 2 Child care workers 2 Computer network and systems technicians 2 Computer network professionals 2 Construction managers 2 Craft and related workers not elsewhere classified 2 Credit and loans officers 2 Crop farm labourers 2 Database and network professionals not elsewhere classified 2 Dentists 2 Domestic cleaners and helpers 2 Door to door salespersons 2 Driving instructors 2 Electrical and electronic equipment assemblers 2 Electronics mechanics and servicers 2 Elementary workers not elsewhere classified 2 Employment agents and contractors 2
Labour shortages and surpluses 2017
2017 39
Directorate-General for Employment Social Affairs and Inclusion European Network of Public Employment Services (PES)
Shortage occupation PES count
Field crop and vegetable growers 2 Financial analysts 2 Financial and investment advisers 2 Forestry and related workers 2 Garbage and recycling collectors 2 General office clerks 2 Graphic and multimedia designers 2 Information and communications technology service managers 2 Insurance representatives 2 Locomotive engine drivers 2 Mail carriers and sorting clerks 2 Management and organization analysts 2 Mathematicians actuaries and statisticians 2 Mechanical machinery assemblers 2 Medical and dental prosthetic technicians 2 Medical assistants 2 Messengers package deliverers and luggage porters 2 Metal finishing plating and coating machine operators 2 Metal processing plant operators 2 Optometrists and ophthalmic opticians 2 Personal care workers in health services not elsewhere classified 2 Police officers 2 Policy and planning managers 2 Production clerks 2 Restaurant managers 2 Retail and wholesale trade managers 2 Sales workers not elsewhere classified 2 Sewing embroidery and related workers 2 Street food salespersons 2 Tailors dressmakers furriers and hatters 2 Telecommunications engineers 2 Advertising and public relations managers 1 Aged care services managers 1
Agricultural technicians 1 Aircraft engine mechanics and repairers 1 Aircraft pilots and related associate professionals 1 Assemblers not elsewhere classified 1 Authors and related writers 1 Bank tellers and related clerks 1 Bleaching dyeing and fabric cleaning machine operators 1 Bookmakers croupiers and related gaming workers 1 Business services agents not elsewhere classified 1 Buyers 1 Cabinet-makers and related workers 1 Cement stone and other mineral products machine operators 1 Chemical and physical science technicians 1 Chemical engineering technicians 1 Chemical processing plant controllers 1 Chemical products plant and machine operators 1 Chemists 1 Conference and event planners 1 Customs and border inspectors 1 Data entry clerks 1 Dental assistants and therapists 1 Dieticians and nutritionists 1 Dispensing opticians 1 Domestic housekeepers 1 Economists 1 Education methods specialists 1 Environmental and occupational health and hygiene professionals 1 Environmental and occupational health inspectors and associates 1 Fibre preparing spinning and winding machine operators 1 Finance managers 1 Financial and insurance services branch managers 1 Fire-fighters 1 Fitness and recreation instructors and program leaders 1 Food and beverage tasters and graders 1 Food and related products machine operators 1
Labour shortages and surpluses 2017
2017 40
Directorate-General for Employment Social Affairs and Inclusion European Network of Public Employment Services (PES)
Shortage occupation PES count
Food service counter attendants 1 Forestry labourers 1 Fruit vegetable and related preservers 1 Fur and leather preparing machine operators 1 Glass and ceramics plant operators 1 Hand launderers and pressers 1 Hand packers 1 Handicraft workers in textile leather and related materials 1 Health associate professionals not elsewhere classified 1 Health professionals not elsewhere classified 1 House builders 1 Human resource managers 1 Incinerator and water treatment plant operators 1 Information and communications technology user support technicians 1 Judges 1 Lawyers 1 Legal and related associate professionals 1 Legal professionals not elsewhere classified 1 Library clerks 1 Lifting truck operators 1 Livestock and dairy producers 1 Livestock farm labourers 1 Medical and pathology laboratory technicians 1 Medical secretaries 1 Metal production process controllers 1 Mining and quarrying labourers 1 Mining engineers metallurgists and related professionals 1 Mixed crop and animal producers 1 Mixed crop growers 1 Motorcycle drivers 1 Odd job persons 1 Other cleaning workers 1 Other music teachers 1
Paper products machine operators 1 Personnel and careers professionals 1 Personnel clerks 1 Pet groomers and animal care workers 1 Physicists and astronomers 1 Physiotherapy technicians and assistants 1 Potters and related workers 1 Power production plant operators 1 Prison guards 1 Product and garment designers 1 Psychologists 1 Pulp and papermaking plant operators 1 Railway brake signal and switch operators 1 Receptionists (general) 1 Refuse sorters 1 Riggers and cable splicers 1 Scribes and related workers 1 Secretaries (general) 1 Securities and finance dealers and brokers 1 Security guards 1 Senior government officials 1 Senior officials of special-interest organizations 1 Shelf fillers 1 Ships engineers 1 Shoemaking and related machine operators 1 Social work associate professionals 1 Stall and market salespersons 1 Stationary plant and machine operators not elsewhere classified 1 Stonemasons stone cutters splitters and carvers 1 Street and related service workers 1 Sweepers and related labourers 1 Teaching professionals not elsewhere classified 1 Telecommunications engineering technicians 1 Textile fur and leather products machine operators not elsewhere classified 1 Trade brokers 1 Travel attendants and travel stewards 1 Travel guides 1
Labour shortages and surpluses 2017
2017 41
Directorate-General for Employment Social Affairs and Inclusion European Network of Public Employment Services (PES)
Shortage occupation PES count
Tree and shrub crop growers 1 Underwater divers 1 University and higher education teachers 1 Vehicle cleaners 1 Veterinarians 1 Weaving and knitting machine operators 1 Web technicians 1 Wood processing plant operators 1 Woodworking-machine tool setters and operators 1
Labour shortages and surpluses 2017
2017 42
Directorate-General for Employment Social Affairs and Inclusion European Network of Public Employment Services (PES)
ANNEX 3 SURPLUS OCCUPATIONS
Surplus occupation PES count
General office clerks 8 Shop sales assistants 8 Advertising and marketing professionals 6 Bank tellers and related clerks 6 Sociologists anthropologists and related professionals 6 Child care workers 5 Hairdressers 5 Journalists 5 Cashiers and ticket clerks 4 Cleaners and helpers in offices hotels and other establishments 4 Hand packers 4 Mail carriers and sorting clerks 4 Photographers 4 Receptionists (general) 4 Tailors dressmakers furriers and hatters 4 Accounting and bookkeeping clerks 3 Administrative and executive secretaries 3 Beauticians and related workers 3 Biologists botanists zoologists and related professionals 3 Bricklayers and related workers 3 Broadcasting and audio-visual technicians 3 Civil engineering labourers 3 Economists 3 Gardeners horticultural and nursery growers 3 Interior designers and decorators 3 Kitchen helpers 3 Legal professionals not elsewhere classified 3 Manufacturing labourers not elsewhere classified 3 Motor vehicle mechanics and repairers 3
Musicians singers and composers 3 Other artistic and cultural associate professionals 3 Painters and related workers 3 Philosophers historians and political scientists 3 Security guards 3 Sweepers and related labourers 3 Travel consultants and clerks 3 Waiters 3 Actors 2 Archivists and curators 2 Bakers pastry-cooks and confectionery makers 2 Bartenders 2 Building construction labourers 2 Business services and administration managers not elsewhere classified 2 Cabinet-makers and related workers 2 Car taxi and van drivers 2 Chemists 2 Cleaning and housekeeping supervisors in offices hotels and other establishments 2 Credit and loans officers 2 Customs and border inspectors 2 Elementary workers not elsewhere classified 2 Film stage and related directors and producers 2 Financial analysts 2 Forestry and related workers 2 Freight handlers 2 Graphic and multimedia designers 2 Health care assistants 2 Hotel receptionists 2 Lawyers 2 Legal and related associate professionals 2 Library clerks 2 Livestock and dairy producers 2 Management and organization analysts 2 Messengers package deliverers and luggage porters 2 Odd job persons 2 Office supervisors 2 Plasterers 2
Labour shortages and surpluses 2017
2017 43
Directorate-General for Employment Social Affairs and Inclusion European Network of Public Employment Services (PES)
Surplus occupation PES count
Police officers 2 Pre-press technicians 2 Print finishing and binding workers 2 Printers 2 Prison guards 2 Product and garment designers 2 Psychologists 2 Public relations professionals 2 Religious professionals 2 Secondary education teachers 2 Secretaries (general) 2 Social work and counselling professionals 2 Stall and market salespersons 2 Stock clerks 2 Teachers aides 2 Telephone switchboard operators 2 Travel guides 2 Visual artists 2 Advertising and public relations managers 1 Agricultural technicians 1 Announcers on radio television and other media 1 Assemblers not elsewhere classified 1 Building and related electricians 1 Building architects 1 Building caretakers 1 Building frame and related trades workers not elsewhere classified 1 Business services agents not elsewhere classified 1 Buyers 1 Carpenters and joiners 1 Chemical engineers 1 Civil engineers 1 Clearing and forwarding agents 1 Clerical support workers not elsewhere classified 1
Commercial sales representatives 1 Conference and event planners 1 Contact centre information clerks 1 Contact centre salespersons 1 Cooks 1 Crane hoist and related plant operators 1 Creative and performing artists not elsewhere classified 1 Dancers and choreographers 1 Data entry clerks 1 Database designers and administrators 1 Domestic cleaners and helpers 1 Domestic housekeepers 1 Draughtspersons 1 Driving instructors 1 Early childhood educators 1 Electronics mechanics and servicers 1 Farming forestry and fisheries advisers 1 Fashion and other models 1 Fast food preparers 1 Field crop and vegetable growers 1 Filing and copying clerks 1 Finance managers 1 Financial and insurance services branch managers 1 Financial and investment advisers 1 Fire-fighters 1 Fitness and recreation instructors and program leaders 1 Floor layers and tile setters 1 Food service counter attendants 1 Fruit vegetable and related preservers 1 Gallery museum and library technicians 1 Garbage and recycling collectors 1 Garment and related pattern-makers and cutters 1 Glass and ceramics plant operators 1 Government tax and excise officials 1 Hand launderers and pressers 1
Labour shortages and surpluses 2017
2017 44
Directorate-General for Employment Social Affairs and Inclusion European Network of Public Employment Services (PES)
Surplus occupation PES count
Heavy truck and lorry drivers 1 House builders 1 Hunters and trappers 1 Information and communications technology installers and servicers 1 Information and communications technology user support technicians 1 Insurance representatives 1 Jewellery and precious-metal workers 1 Judges 1 Legal secretaries 1 Librarians and related information professionals 1 Life science technicians (excluding medical) 1 Lifting truck operators 1 Managing directors and chief executives 1 Manufacturing supervisors 1 Medical and dental prosthetic technicians 1 Metal moulders and coremakers 1 Mining and quarrying labourers 1 Mixed crop and animal producers 1 Mixed crop growers 1 Mobile farm and forestry plant operators 1 Musical instrument makers and tuners 1 Other language teachers 1 Pawnbrokers and money-lenders 1 Personnel and careers professionals 1 Pet groomers and animal care workers 1 Photographic products machine operators 1 Physical and engineering science technicians not elsewhere classified 1 Physicists and astronomers 1 Police inspectors and detectives 1 Precision-instrument makers and repairers 1 Primary school teachers 1 Process control technicians not elsewhere classified 1 Product graders and testers (excluding foods and beverages) 1
Production clerks 1 Professional services managers not elsewhere classified 1 Protective services workers not elsewhere classified 1 Research and development managers 1 Retail and wholesale trade managers 1 Roofers 1 Sales workers not elsewhere classified 1 Senior government officials 1 Service station attendants 1 Shelf fillers 1 Shop supervisors 1 Social work associate professionals 1 Special needs teachers 1 Spray painters and varnishers 1 Statistical mathematical and related associate professionals 1 Stonemasons stone cutters splitters and carvers 1 Street food salespersons 1 Supply distribution and related managers 1 Teaching professionals not elsewhere classified 1 Technical and medical sales professionals (excluding ICT) 1 Training and staff development professionals 1 Translators interpreters and other linguists 1 Transport conductors 1 Tree and shrub crop growers 1 Typists and word processing operators 1 Undertakers and embalmers 1 Vocational education teachers 1 Weaving and knitting machine operators 1 Woodworking-machine tool setters and operators 1
Labour shortages and surpluses 2017
2017 45
Directorate-General for Employment Social Affairs and Inclusion European Network of Public Employment Services (PES)
ANNEX 4 THE RATIO OF UNEMPLOYED TO NEW HIRES
ISCO-08 title
2015
UE
Recruited in the
last year (lt12
months)
Ratio of UE to new recruits
Street and related service workers 85 104 08 Agricultural forestry and fishery labourers 3913 5343 07 Mining and construction labourers 1937 3525 05 Creative and performing artists 610 1115 05 Refuse workers 1036 1923 05 Painters building structure cleaners and related trades workers 1116 2117 05 Street and market salespersons 195 389 05 Building frame and related trades workers 3632 7353 05 Mining manufacturing and construction supervisors 626 1315 05 Ships deck crews and related workers 53 114 05 Market gardeners and crop growers 1471 3207 05 Managing directors and chief executives 304 667 05 Travel attendants conductors and guides 229 538 04 Wood treaters cabinet-makers and related trades workers 491 1159 04 Manufacturing labourers 1640 3909 04 Domestic hotel and office cleaners and helpers 5679 13545 04 Other stationary plant and machine operators 822 1961 04 Mobile plant operators 1038 2497 04 Building finishers and related trades workers 1519 3680 04 Textile fur and leather products machine operators 431 1048 04 Garment and related trades workers 422 1047 04 Chemical and photographic products plant and machine operators 157 389 04 Food processing and related trades workers 930 2330 04 Vehicle window laundry and other hand cleaning workers 291 754 04 Sheet and structural metal workers moulders and welders and related workers
996 2603 04
Waiters and bartenders 4399 11595 04 Cooks 1529 4039 04 Metal processing and finishing plant operators 208 557 04 Printing trades workers 203 548 04 Forestry and related workers 130 351 04 Protective services workers 1347 3658 04 Transport and storage labourers 2532 6939 04 Fishery workers hunters and trappers 46 128 04 Material-recording and transport clerks 1671 4630 04 Process control technicians 179 517 03 Mining and mineral processing plant operators 94 274 03 Telecommunications and broadcasting technicians 177 519 03 Blacksmiths toolmakers and related trades workers 816 2409 03 Building and housekeeping supervisors 678 2045 03
Secretaries (general) 1072 3259 03 Assemblers 850 2586 03 Other craft and related workers 258 810 03 Shop salespersons 6600 21042 03 Electrical equipment installers and repairers 958 3060 03 Food and related products machine operators 437 1400 03 Other sales workers 1087 3510 03 Food preparation assistants 1646 5337 03 Mixed crop and animal producers 387 1260 03 Car van and motorcycle drivers 1155 3764 03 Client information workers 1993 6531 03 Sports and fitness workers 605 1984 03 Handicraft workers 194 638 03 Life science technicians and related associate professionals 82 271 03 Keyboard operators 283 940 03 Electronics and telecommunications installers and repairers 290 963 03 Other personal services workers 313 1047 03 Vocational education teachers 279 940 03 Other teaching professionals 744 2518 03 General office clerks 966 3272 03 Authors journalists and linguists 335 1135 03 Hairdressers beauticians and related workers 806 2796 03
Labour shortages and surpluses 2017
2017 46
Directorate-General for Employment Social Affairs and Inclusion European Network of Public Employment Services (PES)
ISCO-08 title
2015
UE
Recruited in the
last year (lt12
months)
Ratio of UE to new recruits
Animal producers 189 660 03 Other elementary workers 976 3401 03 Machinery mechanics and repairers 1134 3962 03 Ship and aircraft controllers and technicians 80 281 03 Hotel and restaurant managers 344 1220 03 Cashiers and ticket clerks 908 3220 03 Retail and wholesale trade managers 224 809 03 Sales marketing and development managers 311 1124 03 Physical and engineering science technicians 1204 4366 03 Administrative and specialised secretaries 1106 4040 03 Sales and purchasing agents and brokers 1294 4754 03 Rubber plastic and paper products machine operators 256 941 03 Artistic cultural and culinary associate professionals 511 1906 03 Numerical clerks 944 3532 03 Other services managers 184 691 03 Child care workers and teachers aides 1335 5005 03 Heavy truck and bus drivers 1426 5349 03 Business services and administration managers 383 1439 03 Information and communications technology service managers 67 257 03 Regulatory government associate professionals 209 807 03 Life science professionals 176 681 03 Wood processing and papermaking plant operators 97 379 03 Locomotive engine drivers and related workers 46 179 03 Legal professionals 315 1245 03 Personal care workers in health services 2195 8787 02 Physical and earth science professionals 85 345 02 Street vendors (excluding food) 50 204 02 Architects planners surveyors and designers 515 2092 02 Other clerical support workers 901 3657 02 Business services agents 510 2114 02 Manufacturing mining construction and distribution managers 361 1507 02 Tellers money collectors and related clerks 381 1612 02 Librarians archivists and curators 58 248 02 Medical and pharmaceutical technicians 255 1099 02 University and higher education teachers 301 1333 02 Information and communications technology operations and user support technicians
418 1888 02
Legal social and religious associate professionals 920 4348 02 Financial and mathematical associate professionals 601 2852 02 Sales marketing and public relations professionals 865 4172 02 Finance professionals 472 2281 02 Engineering professionals (excluding electrotechnology) 635 3118 02 Other health associate professionals 531 2657 02
Social and religious professionals 460 2317 02 Professional services managers 176 891 02 Nursing and midwifery associate professionals 556 2855 02 Legislators and senior officials 53 286 02 Database and network professionals 83 455 02 Administration professionals 641 3673 02 Primary school and early childhood teachers 575 3345 02 Electrotechnology engineers 142 827 02 Secondary education teachers 471 2812 02 Other health professionals 346 2083 02 Nursing and midwifery professionals 273 1760 02 Software and applications developers and analysts 631 4159 02 Medical doctors 293 1944 02 No occupation 152894 00
No answer 2531 578 44 Total 249561 294937 08
Labour shortages and surpluses 2017
2017 47
Directorate-General for Employment Social Affairs and Inclusion European Network of Public Employment Services (PES)
HOW TO OBTAIN EU PUBLICATIONS
Free publications
bull one copy
via EU Bookshop (httpbookshopeuropaeu)
bull more than one copy or postersmaps
from the European Unionrsquos representations (httpeceuropaeurepresent_enhtm)
from the delegations in non-EU countries
(httpeeaseuropaeudelegationsindex_enhtm)
by contacting the Europe Direct service (httpeuropaeueuropedirectindex_enhtm)
or calling 00 800 6 7 8 9 10 11 (free phone number from anywhere in the EU) () () The information given is free as are most calls (though some operators phone boxes or hotels may charge you)
Priced publications
bull via EU Bookshop (httpbookshopeuropaeu)
Priced subscriptions
bull via one of the sales agents of the Publications Office of the European Union
(httppublicationseuropaeuothersagentsindex_enhtm)
doi 10276731262
KE-0
1-1
8-2
63-E
N-N
[Ca
talo
gu
e n
um
be
r]
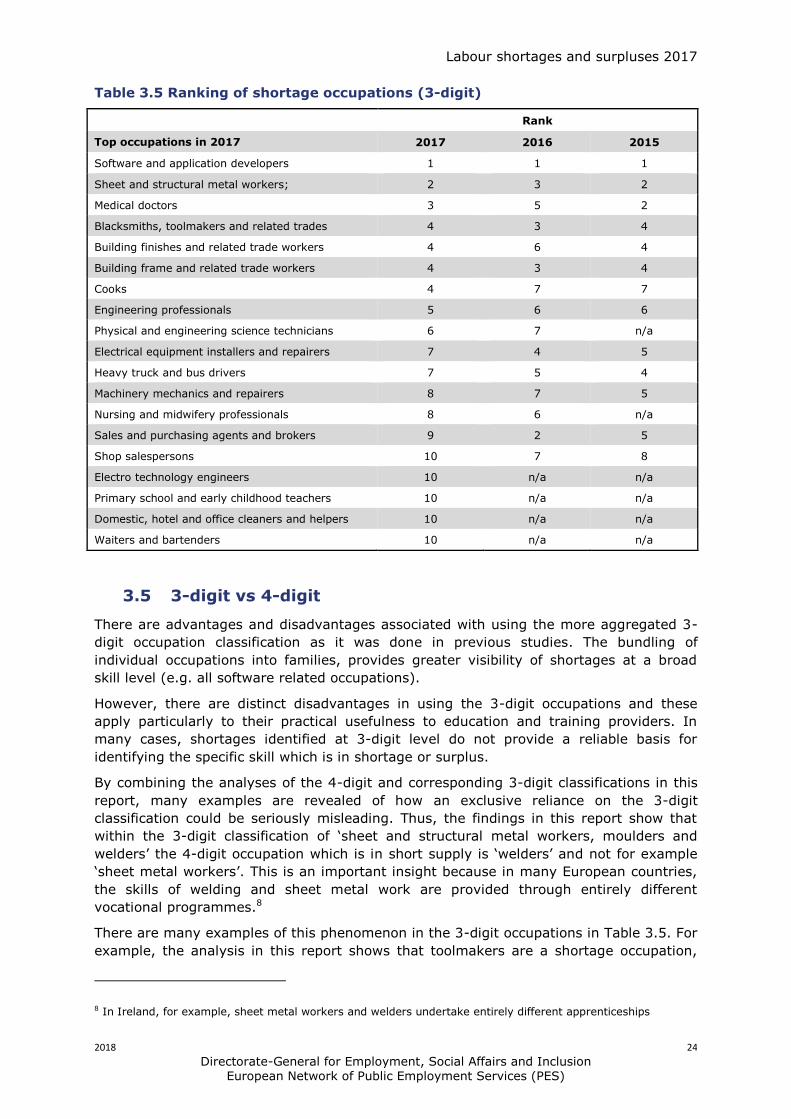
Labour shortages and surpluses 2017
2018 24
Directorate-General for Employment Social Affairs and Inclusion European Network of Public Employment Services (PES)
Table 35 Ranking of shortage occupations (3-digit)
Rank
Top occupations in 2017 2017 2016 2015
Software and application developers 1 1 1
Sheet and structural metal workers 2 3 2
Medical doctors 3 5 2
Blacksmiths toolmakers and related trades 4 3 4
Building finishes and related trade workers 4 6 4
Building frame and related trade workers 4 3 4
Cooks 4 7 7
Engineering professionals 5 6 6
Physical and engineering science technicians 6 7 na
Electrical equipment installers and repairers 7 4 5
Heavy truck and bus drivers 7 5 4
Machinery mechanics and repairers 8 7 5
Nursing and midwifery professionals 8 6 na
Sales and purchasing agents and brokers 9 2 5
Shop salespersons 10 7 8
Electro technology engineers 10 na na
Primary school and early childhood teachers 10 na na
Domestic hotel and office cleaners and helpers 10 na na
Waiters and bartenders 10 na na
35 3-digit vs 4-digit
There are advantages and disadvantages associated with using the more aggregated 3-
digit occupation classification as it was done in previous studies The bundling of
individual occupations into families provides greater visibility of shortages at a broad
skill level (eg all software related occupations)
However there are distinct disadvantages in using the 3-digit occupations and these
apply particularly to their practical usefulness to education and training providers In
many cases shortages identified at 3-digit level do not provide a reliable basis for
identifying the specific skill which is in shortage or surplus
By combining the analyses of the 4-digit and corresponding 3-digit classifications in this
report many examples are revealed of how an exclusive reliance on the 3-digit
classification could be seriously misleading Thus the findings in this report show that
within the 3-digit classification of lsquosheet and structural metal workers moulders and
weldersrsquo the 4-digit occupation which is in short supply is lsquoweldersrsquo and not for example
lsquosheet metal workersrsquo This is an important insight because in many European countries
the skills of welding and sheet metal work are provided through entirely different
vocational programmes8
There are many examples of this phenomenon in the 3-digit occupations in Table 35 For
example the analysis in this report shows that toolmakers are a shortage occupation
8 In Ireland for example sheet metal workers and welders undertake entirely different apprenticeships
Labour shortages and surpluses 2017
2018 25
Directorate-General for Employment Social Affairs and Inclusion European Network of Public Employment Services (PES)
but blacksmiths are not Furthermore the 3-digit classification disguises the extent of the
reported shortage Thus while the 3-digit occupation of professional nursing and
midwifery is shown in the current report as being shortage occupations a total of eleven
PES reported professional nursing as a shortage compared to only three PES reporting
professional midwifery as a shortage By bundling these occupations together the
significant difference in the relative severity of the shortage is not apparent
This phenomenon applies equally to the surplus occupations which were identified in this
report For example lsquochildcare workersrsquo were described as a surplus occupation by five
PES But in the 3-digit classification they are bundled together with lsquospecial needs
teachersrsquo which was not identified as a surplus occupation
36 Conclusions
There are a number of conclusions which can be drawn from the analyses in this chapter
Firstly the sources used by many of the PES to identify shortage occupations is one of
the main reasons why only eighteen PES provided data on surplus occupations Many of
the PES relied on the results of employer surveys forecasting models and immigration
data to identify shortages and these sources in general do not provide data on surplus
occupations However it was by no means the only reason why so many PES did not
provide data on surplus organisations and this issue will have to be addressed before the
commencement of the 2018 study In the future PES data should be augmented by data
collected by other bodies as outlined in the new EU Regulation
Secondly there is no obvious explanation for the geographic distribution of shortages
and surpluses In some cases countries with relatively small labour forces have a
relatively high number of shortage occupations while a strong apprenticeship system
does not appear to prevent a relatively high share of the identified shortages being in the
craft occupations It may be that the stipulation to only include twenty shortage and
surplus occupations has created a situation where some countries with a relatively large
labour force are artificially constrained to submit a much smaller number of shortage
occupations than they actually have
Thirdly there is a high degree of stability in relation to the occupations which were
identified as shortages in the 2015 2016 and 2017 editions of the Bottleneck report
Finally providing information on shortage and surplus occupations at 4-digit level is
much more useful from a policy perspective than providing the data at a more
aggregated level The results of the analyses at 4-digit level show which specific
occupations in the bundle of occupations used in the previous reports were in shortage
and which were not This is also true of the occupations which were identified as surplus
occupations A more aggregated group of occupations does not allow for the targeting of
specific individual occupations either for increasing training provision or for enhancing
cross border mobility Indeed as a number of specific examples show were providers of
vocational training or indeed policy makers to act on the basis of the 3-digit shortage and
surplus occupations identified in previous reports they could very well have assign
resources to occupations which were neither in shortage nor in surplus
Labour shortages and surpluses 2017
2018 26
Directorate-General for Employment Social Affairs and Inclusion European Network of Public Employment Services (PES)
4 THE CAUSES OF SKILL SHORTAGES AND POTENTIAL SOLUTIONS
41 Introduction
The focus of this chapter is on identifying the possible causes of skills shortages and
surpluses and exploring ways in which these imbalances may be resolved The chapter
begins with a review of the nature of skills and labour market imbalances and concludes
with an exploration of the extent to which enhanced cross-border mobility policies and
more equal gender representation could contribute to the alleviation of skills and labour
imbalances in certain shortage occupations in the EEA labour market
42 The role of skills and labour shortages in skills imbalances
One of the new questions included in the current study asks the PES to identify the
nature of the shortage (ie is it a skill shortage or a labour shortage) in relation to each
shortage occupation they identified It was explained in the questionnaire that labour
shortages occur when there are a sufficient number of appropriately qualified job-seekers
to fill the vacancies which arise but for a variety of reasons many of them do not wish
to work in the occupation in question Their response to this question is summarised in
Table 41 in respect of the twenty occupations which were reported by the most PES
A total of twenty-six PES classified their shortage occupations as skill or labour
shortages and they classified most of the occupations as skill shortages Indeed in the
case of seven occupations plumbers doctors software developers electricians
electronic engineers electronic engineering technicians bus and tram drivers and
mechanical engineers all of the reporting PES classified the shortage as a skills deficit
Each labour market within the EEA is regulated in a particular manner and conditions of
employment even within the same occupation vary throughout the region This is why
many occupations while classified by most of the PES as reflecting skill deficits
nevertheless are classified by some PES as labour shortages
However the number of PES involved is very small indeed Only in the case of three
occupations lsquowaitersrsquo lsquoshop sales assistantsrsquo and lsquoprimary school teachersrsquo are there
more PES classifying the shortage as a labour shortage then a skills deficit The first two
occupations are undoubtedly labour shortages This is because there are few if any
barriers to working in these occupations9
The inclusion of lsquoprimary school teachersrsquo as a labour shortage is however a surprise It
was identified by eight PES as a shortage occupation two of whom classified the
occupation as a shortage of high magnitude It would be necessary to conduct research
into the conditions of employment ndash including qualification criteria ndash within the countries
where the reporting PES are located to establish if this classification of the occupation as
a labour shortage is warranted
With some notable exceptions the response of the PES to classifying their shortage
occupations as skill or labour shortages demonstrates that the PES understand these
concepts Occupations such as professional nurses which are obviously suffering from a
shortage of qualified job-seekers in the EEA are overwhelmingly categorised as a skills
shortage while less skilled occupations such as cleaners are categorised as being on the
borderline between skills and labour shortages
9 Both occupations have relatively high ratios of unemployed to new hires (Annex 4)
Labour shortages and surpluses 2017
2018 27
Directorate-General for Employment Social Affairs and Inclusion European Network of Public Employment Services (PES)
Table 41 Skill and labour shortages
Occupation
Number of PES
reporting occupation
as skills shortage
Number of PES
reporting occupation as labour shortage
Number of PES
reporting occupations as skill and
labour shortage
Total number of
PES reporting on skillslabour
shortage
Cooks 9 1 0 10
Plumbers and pipe fitters 8 0 0 8
Generalist medical Practitioners 7 0 0 7
Heavy truck and lorry drivers 4 2 1 7
Metal workers machine tool setting and operators
3 3 1 7
Welders and flame cutters 4 2 1 7
Nursing professionals 5 1 0 6
Software developers 6 0 0 6
Systems analyst 5 1 0 6
Bricklayers and related trades 4 1 0 5
Building and related electricians 5 0 0 5
Butchers fishmongers and related food 3 2 0 5
Cleaners and helpers in offices 3 2 0 5
Commercial sales representatives 2 2 1 5
Electronic engineers 5 0 0 5
Manufacturing supervisors 4 1 0 5
Motor vehicle mechanics and repairers 3 1 1 5
Nursing associate professionals 4 1 0 5
Primary school teachers 2 3 0 5
Shop sales assistants 1 4 0 5
Waiters 2 3 0 5
Agriculture and industrial machinery repairers
3 1 0 4
Application programmers 3 1 0 4
Bus and tram drivers 4 0 0 4
Electronic engineering technicians 4 0 0 4
Health care assistants 3 1 0 4
Mechanical engineers 4 0 0 4
Sheet metal workers 3 1 0 4
Structural metal preparers and erectors 3 1 0 4
Total number of PES reporting 16 8 2 26
The atypical working hours associated with heavy goods vehicle driving is recognised by
two of the six PES who classify shortages in the occupation as labour shortages while the
unpleasant conditions associated with working in butchery shops and abattoirs is
reflected in the fact that two of the five PES who categorised the occupation as a
shortage occupation classify it as a labour shortage
43 Location of skill imbalances and cross border mobility
In recent years there has been considerable discussion on the potential role which
enhanced cross-border mobility could play in alleviating labour market imbalances The
attractiveness of such a policy is obvious The European Union is a very large
Labour shortages and surpluses 2017
2018 28
Directorate-General for Employment Social Affairs and Inclusion European Network of Public Employment Services (PES)
marketplace embracing a very large labour force if even some of the shortages which
are reported by EEA countries could be resolved by exploiting the surpluses which are
reported by other EEA countries it could form the basis of a number of win-win solutions
for both job-seekers and businesses
An additional attraction of this policy is that it could potentially successfully address both
skills and labour shortages as working conditions associated with some labour shortages
in one country might be perceived as significantly more attractive in a different EEA
country
Table 44 provides a list of the top twenty shortage occupations which have at least one
PES in another EEA country reporting the occupation as a surplus
There are a number of aspects of the Table which are notable Firstly the list of top
occupations has changed quite dramatically from the list in Table 21 specifically none
of the professional and associate professional occupations are now on the list including
the four professional and associate professional health-related occupations or the two
professional software occupations What the Table shows is that there are no surpluses
reported in any of the EEA countries of doctors or nurses software developers or
systems analysts While the occupation of healthcare assistants is in surplus in many
countries it was not included in the list of top occupations because it was reported as a
shortage by only two PES
The figures in Table 42 show that there are three cross-border matching possibilities in
the case of bricklayers and motor mechanics and two possibilities in the case of
plasterers health care assistants and secondary school teachers
There is just one matching possibility in respect of a wide range of occupations including
cooks truck drivers commercial sales representatives electricians carpenters civil
engineers primary school teachers manufacturing supervisors telecentre salespersons
childhood education teachers floor layers and roofers
The fact that primary school teachers have only one cross border matching possibility
suggest that the classification of the occupation as a labour shortage by three of five PES
is an error In general labour shortages would be expected to have more cross border
matching possibilities than skill shortages because there are many job-seekers eligible to
work in the occupation in question and working conditions vary quite significantly from
country to country Indeed it is notable that the two other occupations which were
classified by the PES as predominantly labour shortages waiters and shop sales
assistants have a relatively high number of matching possibilities eight in the case of
shop sales assistants and three in the case of waiters
In general the PES did not classify the same occupation as both a shortage and a
surplus A striking exception is the Danish PES which categorised four of its shortage
occupations as surplus occupations also This is most likely due to the higher level of
granularity available in the Danish data (below 4-digit) so that some job titles within an
occupation are considered labour shortage while others skill shortage
44 Assessing gender composition of surpluses
The PES were asked to estimate the share of females in the occupations which they
identified as lsquosurplusrsquo occupations The restricting of this question to surplus occupations
was to avoid giving the impression that shortages were arising because of discriminatory
recruitment policies
Labour shortages and surpluses 2017
2018 29
Directorate-General for Employment Social Affairs and Inclusion European Network of Public Employment Services (PES)
A total of 13 PES reported any data on gender composition of surpluses However the
quality of information submitted did not provide a sufficient basis for an accurate
estimation of the gender composition of surpluses in some of the cases
It is suggested that in order to address gender imbalances in relation to shortages and
surpluses data from PES on job seekers should be combined with the LSF data on
employment by occupation
45 Conclusions
The analysis in chapter four has produced a number of interesting findings The analysis
reveals that the PES in general has the capacity to distinguish between skill and labour
shortages and to identify shortage occupations which have some cross-border matching
possibilities
The relatively low number of surplus occupations reflects two factors firstly only
eighteen PES submitted a list of surplus occupations and secondly in many cases the
lists did not include the maximum number of twenty occupations which were requested
This response has to be viewed against the background of an EEA labour market where
employment is expanding and unemployment is contracting However while this is a
positive development the relatively low number of surplus occupations has placed a
significant limit on the extent to which there were cross-border possibilities of matching
shortage with surplus occupations
The data indicates that there is a limitation to the extent to which the PES can be used to
identify the gender imbalances (eg under-representation of females in some
occupations) and that other sources should be explored
Labour shortages and surpluses 2017
2018 30
Directorate-General for Employment Social Affairs and Inclusion European Network of Public Employment Services (PES)
Table 43 The potential for cross-border matching of shortage and surplus occupations
No PES
Occupation PES reporting shortage PES reporting surplus No PES
16 Cooks AT Art BG CY DK HR IE IS IT MT NL NO PT SE SI SK lsaquo―rsaquo HU 1
11 Truck drivers ART VDAB BG DK HR LT IT NL NO PT SE SI SK lsaquo―rsaquo DK 1
10 Cleaners helpers CY DK HR FI IS HU NL NO PT SI lsaquo―rsaquo DK LF NL IE 4
10 Commercial sales VDAB ART DK FI FR IT IE PT PL SI lsaquo―rsaquo DK 1
9 Sales assistants AT ART BG CY DK IT NO SI SK lsaquo―rsaquo DK LF SE NL BG CH FI IE 8
9 Bricklayers ART DE DK HR HU LT NL PT SI lsaquo―rsaquo CY HU IE 3
9 Motor mechanics AT VDAB ART LF DK IT NO PT SI lsaquo―rsaquo SK CH EE 3
9 Waiters ART BG CY IS IT MT NO PT SI lsaquo―rsaquo HU EE IE 3
9 Electricians ART VDAB DE DK IS IT NL NO SI lsaquo―rsaquo FR 1
8 Carpenters DK HR HU FI NL NO PT SI lsaquo―rsaquo HU 1
8 Civil engineers ART CH DE FI FR NO SE SI lsaquo―rsaquo CY 1
8 Primary teachers ART BG DK IS NO SE SI SK lsaquo―rsaquo CY 1
7 Healthcare assist CY DK EE NL NO SI SK lsaquo―rsaquo DK NL 2
7 Second teacher ART BG FR NL NO SI SK lsaquo―rsaquo CY FI 2
7 Man supervisors ART VDAB LF DE EE FR SK lsaquo―rsaquo BG 1
6 Plasterers HR HU FI LT NL SI lsaquo―rsaquo HU IE 2
6 Tele centre sales ART HU FI FR MT NO lsaquo―rsaquo EE 1
6 Childhood educ FI LT NO SE SI SK lsaquo―rsaquo CY 1
6 Floor layers HU HR FI FR LT LV lsaquo―rsaquo HU 1
6 Roofers HR FI FR LT LV SI lsaquo―rsaquo HU 1
Bottlenecks Occupations 2017
2017 31
Directorate-General for Employment Social Affairs and Inclusion European Network of Public Employment Services (PES)
5 CONCLUSIONS AND RECOMMENDATIONS
51 Conclusions
The terms of reference for this study emphasise the desirability of creating a process for
the systematic collection of data on surplus and shortage occupations in the EEA area
which could be effectively used by EURES for cross border matching of shortage
occupations in some EEA countries with surplus occupations in others
The authors have responded to this emphasis by using a process which ensures that the
data gathered on shortage and surplus occupations is comprehensive accurate and of
practical use to EURES and the providers of education and training programmes The
process is comprehensive because it gathers information both on the extent of shortages
and surpluses and on their relative severity It is accurate because the list of shortage
and surplus occupations are shown to be consistent with the estimated value of the ratio
of unemployed to new hires Finally the process provides information which is of
practical use to EURES and the national providers of VET because the data gathered is on
individual occupations rather than on lsquobundles of occupationsrsquo as in previous studies The
analyses in this report shows that while these bundles of occupations contain some
occupations which are identified by the PES as shortage and surplus occupations they
also contain occupations which are neither in shortage nor in surplus and it is impossible
to distinguish one from the other
The data gathering process used in this report however was not devoid of weaknesses
Fortunately these weaknesses reflect the modus operandi of the PES and may be
rectified by including other institutions and agencies in the process For example the PES
use the same sources for the identification of both shortage and surplus occupations
This may have advantages in terms of accuracy when those sources include employersrsquo
surveys immigration data and the results of forecasting exercises However these
sources are not suitable for gathering data on surplus occupations and they are the main
reason why the number of surplus occupations provided by the PES were almost half the
number requested In the future PES data could be augmented by data gathered by
other bodies as outlined in recent EU Regulation 2016589
In addition the response to the question on the capacity of the PES to deliver data on
shortage and surplus occupations at a regional level was also disappointing perhaps
reflecting a misalignment in some EEA countries between the geographic configuration of
the local PES network and the NUTs regions
The analysis highlighted that in order to assess gender imbalances of shortages and
surpluses PES data needs to be augmented by other sources
Finally despite the low number of surplus occupations submitted by the PES it was
nevertheless possible to identify twenty shortage occupations in the EEA labour market
which had at least one cross-border matching possibility and many more than one in the
case of some shortage occupations
52 Recommendations
Based on the findings from the three bottleneck studies undertaken to date a model for
the gathering of data on shortages and surpluses is proposed (Figure 51) The model
includes features of the methodology applied in this study which were successful It also
includes a number of features which should be introduced to the process in order to
address some of the weaknesses which were identified in this study (highlighted in red)
Labour shortages and surpluses 2017
2017 32
Directorate-General for Employment Social Affairs and Inclusion European Network of Public Employment Services (PES)
However before this methodology is implemented it would be prudent to discuss data
requirements with PES and invite a broader range of institutions and agencies to
participate in aspects of the data gathering process in addition to the PES EURES
Regulation (EU) 2016589 of the European Parliament and of the Council which obliges
the appropriate national authorities to furnish such data annually is fortuitous in this
regard and should facilitate the implementation of this recommendation
In addition the results of these and other relevant studies should be disseminated to
PES Eures coordination group and other relevant agencies and institutions in order to
emphasise the importance of data and analysis in informing policy at EU and national
level which aims to resolve labour market imbalances
Labour shortages and surpluses 2017
2017 33
Directorate-General for Employment Social Affairs and Inclusion European Network of Public Employment Services (PES)
Figure 51 Model for gathering data on shortage and surplus occupations
Sources of data on surpluses PES data from other relevant agencies
In those cases where the source used by the PES to identify shortage occupations cannot
be used to identify surplus occupations other institutions or other sources or both should be availed of to ensure that comprehensive data on surplus occupations are provided to the appropriate national authority
Dimensions of shortagessurpluses extent (number of reporting PES) and severity (high or low
magnitude)
Data should be systematically gathered on both the extent of shortage and surplus
occupations in the EEA and on their relative severity
Type of shortage skill vs labour shortages
The providers of the data on shortage occupations must also distinguish between skill and labour shortages because this distinction is necessary for the accurate identification of
shortage occupations and for the choice of the appropriate policy response to identified shortages
Classification of occupations used ISCO 08 4-digit codes (or translation into these codes)
All data should be either initially gathered in ISCO 08 4-digit codes or translated into these
codes This ensures that the data refers to specific individual occupations and is of practical use to EURES and the national providers of VET
Accuracy test cross-check with LSF data (ratio of unemployed to new hires)
The accuracy of the submitted lists of shortage and surplus occupations should be assessed
by comparing the most widely reported surplus and shortage occupations with the estimated values of the ratios of employed (by previous occupation) to new hires at the aggregated EU28 level These ratios should be based on an analysis of the most up-to date
Labour Force Survey (LFS) data
Gender balance assessment LFS data on employment at occupational level by gender PES job
seekers
The gender composition of shortage and surplus occupations should be based on the most
up to date analyses of LFS data on employment by gender and the PES job seeker data
Regional balance assessment LSF data data from relevant agencies
Where regional data is required other agencies and institutions should be requested to
provide the data in those cases where the data cannot be provided by the regional PES network because it is not geographically aligned to the NUTs regions
Labour shortages and surpluses 2017
2017 34
Directorate-General for Employment Social Affairs and Inclusion European Network of Public Employment Services (PES)
Number of occupations reporting should be extended beyond 20 occupations but with upper
limit (eg 50)
Consideration should be given to allowing the agencies responsible for identifying shortage
and surplus occupations a greater range of flexibility in terms of the numbers of occupations which should be identified A minimum to maximum range would be a more realistic approach as it would reflect the fact that the labour markets of the EEA vary significantly in size and performance
Timing of imbalance assessment September
It is proposed that the data gathering exercise should be brought forward to early September and that expert advice should be available on line throughout the data
gathering exercise
Labour shortages and surpluses 2017
2017 35
Directorate-General for Employment Social Affairs and Inclusion European Network of Public Employment Services (PES)
ANNEX 1 DATA COLLECTION TEMPLATE Information sought Explanation
Occupation title (text) Type in free text a list of occupations (one row one occupation) for which shortages and surpluses exist first list occupations for which there is a shortage the list should contain a maximum of 20 occupations if your list contains less than 20 occupations please provide a brief explanation in your email response for why the number is lower than 20 second list occupations for which there is a surplus the list should contain a maximum of 20 occupations if your list contains less than 20 occupations please provide a brief explanation in your email response for why the number is lower than 20
Shortagesurplus indicator For each occupation indicate if it refers to a shortage by typing in shortage or surplus by typing in surplus to identify surplus occupations you can examine for each occupation the ratio of the number of job seekers to the number of vacancies at the end of each year for example if there are 5000 shop assistants seeking employment and there are 200 vacancies at the end of the reference period the ratio is 251 you can rank the calculated ratios and report the occupations associated with the 20 highest ratios
Occupational classification used in your country
For each occupation indicate what occupational classification (if any) was used to identify this occupation for instance you can report a country specific classification ISCO ROME SOC etc If you donrsquot use occupational classifications type None
Occupation code to the lowest level of disaggregation (eg ISCO at 4 digits)
If you have indicated a classification used type the code for each occupation use the lowest level of disaggregation (eg 4 digit ISCO code) if you donrsquot use occupational classification leave black
ISCO-08 code at 4-digit level (or lower if 4-digit not available)
If you use occupational classification which is not ISCO-08 and if it is possible provide a translation of the national code to ISCO-08 code ISCO is the International Standard Classification of Occupations which is used to report to Eurostat code should be at 4 digits if this is not available than the lowest level of disaggregation that is available should be reported (3 digits if 4-digit code is not available 2 digits if neither 4-digit nor 3-digit code is available 1 digit if neither 4-digit 3-digit nor 2-digit code is available) if it is not possible to provide translation to ISCO-08 leave black if you have already reported ISCO-08 code in column 3 leave this column black
Estimate of shortagesurplus magnitude (high (gt3 of employment) medium (1-3 of employment) low (lt1 of employment))
For each occupation indicate a broad estimate of the magnitude of the shortagesurplus if you estimate that the shortagesurplus is less than 1 of the total employment in the occupation in question type low if between 1-3 type medium if greater than 3 type high if you cannot provide a rough estimate of magnitude type dont know
Current shortagesurplus (C) future short term (FST) future medium term (FMT) future long term (FLT) donrsquot know (indicate all that apply)
Against each occupation indicate if the identified shortagesurplus refers to present situation by typing C if the shortage is expected to occur in the short term future ie within 12 months by typing FST if it is expected to occur over the medium term (within 1-5 years) by typing FMT if it is expected to occur in the long term (in 5 or more years) by typing FLT if more than one time period applies indicate all relevant ones (eg for current shortagessurpluses that are expected to persist over the short term type C FST) if you dont know type dont know
Source of information on shortagessurpluses (eg PES administrative data (vacancies job seekers) PES survey third party survey Occupational forecasts other (specify) etc)
Indicate the source used to identify shortagesurplus for this occupation did you derive it from the PES administrative data on PES vacancies andor job seekers did you conduct a survey did you commission a third party to conduct a survey for you did you have occupational forecasts available did you use other research type in free text the full description of the source(s) eg National Employment Survey conducted by PES etc
Labour shortages and surpluses 2017
2017 36
Directorate-General for Employment Social Affairs and Inclusion European Network of Public Employment Services (PES)
Date for source of information Indicate the year that the information on shortagessurpluses (column 7) refers to eg type 2016 for a survey of difficult to fill vacancies conducted in 2016 even if the report was published in 2017
What indicator(s) suggested that there is a shortagesurplus
Indicate what criteria was used to conclude that this occupation is associated with a shortagesurplus for instance employers views sourcing from abroad to fill vacancies growth in employment faster than growth in educationtraining output time required to fill
vacancies higher than average etc
Share of females among job seekers in this occupation (surplus occupations only)
Indicate the percentage share of females among all job seekers in this occupation this is only applicable to surplus occupations
Skill or labour shortage Indicate if a shortage refers to a skill or labour shortage a skill shortage occurs where there is an insufficient supply of persons with the appropriate skills labour shortages occur where there is a sufficient number of skilled persons however an insufficient number of them is willing to take up employment in the occupation in question
Indicate the availability of data on shortagessurpluses at regional level (NUTS1 NUTS2 NUTS3 No data)
Indicate if data is available on the regional breakdown of shortagessurpluses by indicating the level of regional data available if multiple levels of regional disaggregation are available indicate the lowest level of disaggregation (eg NUTS3 rather than NUTS2) if there is no regional data available use no data
Labour shortages and surpluses 2017
2017 37
Directorate-General for Employment Social Affairs and Inclusion European Network of Public Employment Services (PES)
ANNEX 2 SHORTAGE OCCUPATIONS
Shortage occupation PES count
Cooks 16 Plumbers and pipe fitters 13 Generalist medical practitioners 12 Welders and flamecutters 12 Heavy truck and lorry drivers 11 Metal working machine tool setters and operators 11 Nursing professionals 11 Software developers 11 Agricultural and industrial machinery mechanics and repairers 10 Cleaners and helpers in offices hotels and other establishments 10 Commercial sales representatives 10 Specialist medical practitioners 10 Systems analysts 10 Bricklayers and related workers 9 Building and related electricians 9 Butchers fishmongers and related food preparers 9 Motor vehicle mechanics and repairers 9 Nursing associate professionals 9 Sheet-metal workers 9 Shop sales assistants 9 Waiters 9 Carpenters and joiners 8 Civil engineers 8 Concrete placers concrete finishers and related workers 8 Electrical engineering technicians 8 Electronics engineering technicians 8 Mechanical engineers 8 Primary school teachers 8 Structural-metal preparers and erectors 8 Electronics engineers 7
Health care assistants 7 Manufacturing supervisors 7 Mechanical engineering technicians 7 Secondary education teachers 7 Accountants 6 Applications programmers 6 Bus and tram drivers 6 Contact centre salespersons 6 Early childhood educators 6 Electrical mechanics and fitters 6 Floor layers and tile setters 6 Plasterers 6 Roofers 6 Sewing machine operators 6 Software and applications developers and analysts not elsewhere classified 6 Toolmakers and related workers 6 Web and multimedia developers 6 Air conditioning and refrigeration mechanics 5 Building frame and related trades workers not elsewhere classified 5 Chefs 5 Civil engineering labourers 5 Construction supervisors 5 Earthmoving and related plant operators 5 Electrical engineers 5 Electrical line installers and repairers 5 Engineering professionals not elsewhere classified 5 Hairdressers 5 Information and communications technology operations technicians 5 Manufacturing managers 5 Physiotherapists 5 Real estate agents and property managers 5 Research and development managers 5 Spray painters and varnishers 5 Accounting associate professionals 4 Bakers pastry-cooks and confectionery makers 4
Labour shortages and surpluses 2017
2017 38
Directorate-General for Employment Social Affairs and Inclusion European Network of Public Employment Services (PES)
Shortage occupation PES count
Blacksmiths hammersmiths and forging press workers 4 Civil engineering technicians 4 Crane hoist and related plant operators 4 Database designers and administrators 4 Industrial and production engineers 4 Painters and related workers 4 Physical and engineering science technicians not elsewhere classified 4 Plastic products machine operators 4 Social work and counselling professionals 4 Accounting and bookkeeping clerks 3 Administrative and executive secretaries 3 Ambulance workers 3 Building construction labourers 3 Car taxi and van drivers 3 Cartographers and surveyors 3 Cleaning and housekeeping supervisors in offices hotels and other establishments 3 Contact centre information clerks 3 Draughtspersons 3 Fast food preparers 3 Freight handlers 3 Gardeners horticultural and nursery growers 3 Home-based personal care workers 3 Hotel receptionists 3 Information and communications technology installers and servicers 3 Insulation workers 3 Kitchen helpers 3 Manufacturing labourers not elsewhere classified 3 Medical imaging and therapeutic equipment technicians 3 Metal moulders and coremakers 3 Metal polishers wheel grinders and tool sharpeners 3 Midwifery professionals 3 Other language teachers 3 Personal services workers not elsewhere classified 3
Pharmacists 3 Policy administration professionals 3 Printers 3 Process control technicians not elsewhere classified 3 Sales and marketing managers 3 Shop supervisors 3 Special needs teachers 3 Stock clerks 3 Supply distribution and related managers 3 Survey and market research interviewers 3 Systems administrators 3 Technical and medical sales professionals (excluding ICT) 3 Translators interpreters and other linguists 3 Transport clerks 3 Vocational education teachers 3 Advertising and marketing professionals 2 Audiologists and speech therapists 2 Bartenders 2 Beauticians and related workers 2 Cashiers and ticket clerks 2 Chemical engineers 2 Child care workers 2 Computer network and systems technicians 2 Computer network professionals 2 Construction managers 2 Craft and related workers not elsewhere classified 2 Credit and loans officers 2 Crop farm labourers 2 Database and network professionals not elsewhere classified 2 Dentists 2 Domestic cleaners and helpers 2 Door to door salespersons 2 Driving instructors 2 Electrical and electronic equipment assemblers 2 Electronics mechanics and servicers 2 Elementary workers not elsewhere classified 2 Employment agents and contractors 2
Labour shortages and surpluses 2017
2017 39
Directorate-General for Employment Social Affairs and Inclusion European Network of Public Employment Services (PES)
Shortage occupation PES count
Field crop and vegetable growers 2 Financial analysts 2 Financial and investment advisers 2 Forestry and related workers 2 Garbage and recycling collectors 2 General office clerks 2 Graphic and multimedia designers 2 Information and communications technology service managers 2 Insurance representatives 2 Locomotive engine drivers 2 Mail carriers and sorting clerks 2 Management and organization analysts 2 Mathematicians actuaries and statisticians 2 Mechanical machinery assemblers 2 Medical and dental prosthetic technicians 2 Medical assistants 2 Messengers package deliverers and luggage porters 2 Metal finishing plating and coating machine operators 2 Metal processing plant operators 2 Optometrists and ophthalmic opticians 2 Personal care workers in health services not elsewhere classified 2 Police officers 2 Policy and planning managers 2 Production clerks 2 Restaurant managers 2 Retail and wholesale trade managers 2 Sales workers not elsewhere classified 2 Sewing embroidery and related workers 2 Street food salespersons 2 Tailors dressmakers furriers and hatters 2 Telecommunications engineers 2 Advertising and public relations managers 1 Aged care services managers 1
Agricultural technicians 1 Aircraft engine mechanics and repairers 1 Aircraft pilots and related associate professionals 1 Assemblers not elsewhere classified 1 Authors and related writers 1 Bank tellers and related clerks 1 Bleaching dyeing and fabric cleaning machine operators 1 Bookmakers croupiers and related gaming workers 1 Business services agents not elsewhere classified 1 Buyers 1 Cabinet-makers and related workers 1 Cement stone and other mineral products machine operators 1 Chemical and physical science technicians 1 Chemical engineering technicians 1 Chemical processing plant controllers 1 Chemical products plant and machine operators 1 Chemists 1 Conference and event planners 1 Customs and border inspectors 1 Data entry clerks 1 Dental assistants and therapists 1 Dieticians and nutritionists 1 Dispensing opticians 1 Domestic housekeepers 1 Economists 1 Education methods specialists 1 Environmental and occupational health and hygiene professionals 1 Environmental and occupational health inspectors and associates 1 Fibre preparing spinning and winding machine operators 1 Finance managers 1 Financial and insurance services branch managers 1 Fire-fighters 1 Fitness and recreation instructors and program leaders 1 Food and beverage tasters and graders 1 Food and related products machine operators 1
Labour shortages and surpluses 2017
2017 40
Directorate-General for Employment Social Affairs and Inclusion European Network of Public Employment Services (PES)
Shortage occupation PES count
Food service counter attendants 1 Forestry labourers 1 Fruit vegetable and related preservers 1 Fur and leather preparing machine operators 1 Glass and ceramics plant operators 1 Hand launderers and pressers 1 Hand packers 1 Handicraft workers in textile leather and related materials 1 Health associate professionals not elsewhere classified 1 Health professionals not elsewhere classified 1 House builders 1 Human resource managers 1 Incinerator and water treatment plant operators 1 Information and communications technology user support technicians 1 Judges 1 Lawyers 1 Legal and related associate professionals 1 Legal professionals not elsewhere classified 1 Library clerks 1 Lifting truck operators 1 Livestock and dairy producers 1 Livestock farm labourers 1 Medical and pathology laboratory technicians 1 Medical secretaries 1 Metal production process controllers 1 Mining and quarrying labourers 1 Mining engineers metallurgists and related professionals 1 Mixed crop and animal producers 1 Mixed crop growers 1 Motorcycle drivers 1 Odd job persons 1 Other cleaning workers 1 Other music teachers 1
Paper products machine operators 1 Personnel and careers professionals 1 Personnel clerks 1 Pet groomers and animal care workers 1 Physicists and astronomers 1 Physiotherapy technicians and assistants 1 Potters and related workers 1 Power production plant operators 1 Prison guards 1 Product and garment designers 1 Psychologists 1 Pulp and papermaking plant operators 1 Railway brake signal and switch operators 1 Receptionists (general) 1 Refuse sorters 1 Riggers and cable splicers 1 Scribes and related workers 1 Secretaries (general) 1 Securities and finance dealers and brokers 1 Security guards 1 Senior government officials 1 Senior officials of special-interest organizations 1 Shelf fillers 1 Ships engineers 1 Shoemaking and related machine operators 1 Social work associate professionals 1 Stall and market salespersons 1 Stationary plant and machine operators not elsewhere classified 1 Stonemasons stone cutters splitters and carvers 1 Street and related service workers 1 Sweepers and related labourers 1 Teaching professionals not elsewhere classified 1 Telecommunications engineering technicians 1 Textile fur and leather products machine operators not elsewhere classified 1 Trade brokers 1 Travel attendants and travel stewards 1 Travel guides 1
Labour shortages and surpluses 2017
2017 41
Directorate-General for Employment Social Affairs and Inclusion European Network of Public Employment Services (PES)
Shortage occupation PES count
Tree and shrub crop growers 1 Underwater divers 1 University and higher education teachers 1 Vehicle cleaners 1 Veterinarians 1 Weaving and knitting machine operators 1 Web technicians 1 Wood processing plant operators 1 Woodworking-machine tool setters and operators 1
Labour shortages and surpluses 2017
2017 42
Directorate-General for Employment Social Affairs and Inclusion European Network of Public Employment Services (PES)
ANNEX 3 SURPLUS OCCUPATIONS
Surplus occupation PES count
General office clerks 8 Shop sales assistants 8 Advertising and marketing professionals 6 Bank tellers and related clerks 6 Sociologists anthropologists and related professionals 6 Child care workers 5 Hairdressers 5 Journalists 5 Cashiers and ticket clerks 4 Cleaners and helpers in offices hotels and other establishments 4 Hand packers 4 Mail carriers and sorting clerks 4 Photographers 4 Receptionists (general) 4 Tailors dressmakers furriers and hatters 4 Accounting and bookkeeping clerks 3 Administrative and executive secretaries 3 Beauticians and related workers 3 Biologists botanists zoologists and related professionals 3 Bricklayers and related workers 3 Broadcasting and audio-visual technicians 3 Civil engineering labourers 3 Economists 3 Gardeners horticultural and nursery growers 3 Interior designers and decorators 3 Kitchen helpers 3 Legal professionals not elsewhere classified 3 Manufacturing labourers not elsewhere classified 3 Motor vehicle mechanics and repairers 3
Musicians singers and composers 3 Other artistic and cultural associate professionals 3 Painters and related workers 3 Philosophers historians and political scientists 3 Security guards 3 Sweepers and related labourers 3 Travel consultants and clerks 3 Waiters 3 Actors 2 Archivists and curators 2 Bakers pastry-cooks and confectionery makers 2 Bartenders 2 Building construction labourers 2 Business services and administration managers not elsewhere classified 2 Cabinet-makers and related workers 2 Car taxi and van drivers 2 Chemists 2 Cleaning and housekeeping supervisors in offices hotels and other establishments 2 Credit and loans officers 2 Customs and border inspectors 2 Elementary workers not elsewhere classified 2 Film stage and related directors and producers 2 Financial analysts 2 Forestry and related workers 2 Freight handlers 2 Graphic and multimedia designers 2 Health care assistants 2 Hotel receptionists 2 Lawyers 2 Legal and related associate professionals 2 Library clerks 2 Livestock and dairy producers 2 Management and organization analysts 2 Messengers package deliverers and luggage porters 2 Odd job persons 2 Office supervisors 2 Plasterers 2
Labour shortages and surpluses 2017
2017 43
Directorate-General for Employment Social Affairs and Inclusion European Network of Public Employment Services (PES)
Surplus occupation PES count
Police officers 2 Pre-press technicians 2 Print finishing and binding workers 2 Printers 2 Prison guards 2 Product and garment designers 2 Psychologists 2 Public relations professionals 2 Religious professionals 2 Secondary education teachers 2 Secretaries (general) 2 Social work and counselling professionals 2 Stall and market salespersons 2 Stock clerks 2 Teachers aides 2 Telephone switchboard operators 2 Travel guides 2 Visual artists 2 Advertising and public relations managers 1 Agricultural technicians 1 Announcers on radio television and other media 1 Assemblers not elsewhere classified 1 Building and related electricians 1 Building architects 1 Building caretakers 1 Building frame and related trades workers not elsewhere classified 1 Business services agents not elsewhere classified 1 Buyers 1 Carpenters and joiners 1 Chemical engineers 1 Civil engineers 1 Clearing and forwarding agents 1 Clerical support workers not elsewhere classified 1
Commercial sales representatives 1 Conference and event planners 1 Contact centre information clerks 1 Contact centre salespersons 1 Cooks 1 Crane hoist and related plant operators 1 Creative and performing artists not elsewhere classified 1 Dancers and choreographers 1 Data entry clerks 1 Database designers and administrators 1 Domestic cleaners and helpers 1 Domestic housekeepers 1 Draughtspersons 1 Driving instructors 1 Early childhood educators 1 Electronics mechanics and servicers 1 Farming forestry and fisheries advisers 1 Fashion and other models 1 Fast food preparers 1 Field crop and vegetable growers 1 Filing and copying clerks 1 Finance managers 1 Financial and insurance services branch managers 1 Financial and investment advisers 1 Fire-fighters 1 Fitness and recreation instructors and program leaders 1 Floor layers and tile setters 1 Food service counter attendants 1 Fruit vegetable and related preservers 1 Gallery museum and library technicians 1 Garbage and recycling collectors 1 Garment and related pattern-makers and cutters 1 Glass and ceramics plant operators 1 Government tax and excise officials 1 Hand launderers and pressers 1
Labour shortages and surpluses 2017
2017 44
Directorate-General for Employment Social Affairs and Inclusion European Network of Public Employment Services (PES)
Surplus occupation PES count
Heavy truck and lorry drivers 1 House builders 1 Hunters and trappers 1 Information and communications technology installers and servicers 1 Information and communications technology user support technicians 1 Insurance representatives 1 Jewellery and precious-metal workers 1 Judges 1 Legal secretaries 1 Librarians and related information professionals 1 Life science technicians (excluding medical) 1 Lifting truck operators 1 Managing directors and chief executives 1 Manufacturing supervisors 1 Medical and dental prosthetic technicians 1 Metal moulders and coremakers 1 Mining and quarrying labourers 1 Mixed crop and animal producers 1 Mixed crop growers 1 Mobile farm and forestry plant operators 1 Musical instrument makers and tuners 1 Other language teachers 1 Pawnbrokers and money-lenders 1 Personnel and careers professionals 1 Pet groomers and animal care workers 1 Photographic products machine operators 1 Physical and engineering science technicians not elsewhere classified 1 Physicists and astronomers 1 Police inspectors and detectives 1 Precision-instrument makers and repairers 1 Primary school teachers 1 Process control technicians not elsewhere classified 1 Product graders and testers (excluding foods and beverages) 1
Production clerks 1 Professional services managers not elsewhere classified 1 Protective services workers not elsewhere classified 1 Research and development managers 1 Retail and wholesale trade managers 1 Roofers 1 Sales workers not elsewhere classified 1 Senior government officials 1 Service station attendants 1 Shelf fillers 1 Shop supervisors 1 Social work associate professionals 1 Special needs teachers 1 Spray painters and varnishers 1 Statistical mathematical and related associate professionals 1 Stonemasons stone cutters splitters and carvers 1 Street food salespersons 1 Supply distribution and related managers 1 Teaching professionals not elsewhere classified 1 Technical and medical sales professionals (excluding ICT) 1 Training and staff development professionals 1 Translators interpreters and other linguists 1 Transport conductors 1 Tree and shrub crop growers 1 Typists and word processing operators 1 Undertakers and embalmers 1 Vocational education teachers 1 Weaving and knitting machine operators 1 Woodworking-machine tool setters and operators 1
Labour shortages and surpluses 2017
2017 45
Directorate-General for Employment Social Affairs and Inclusion European Network of Public Employment Services (PES)
ANNEX 4 THE RATIO OF UNEMPLOYED TO NEW HIRES
ISCO-08 title
2015
UE
Recruited in the
last year (lt12
months)
Ratio of UE to new recruits
Street and related service workers 85 104 08 Agricultural forestry and fishery labourers 3913 5343 07 Mining and construction labourers 1937 3525 05 Creative and performing artists 610 1115 05 Refuse workers 1036 1923 05 Painters building structure cleaners and related trades workers 1116 2117 05 Street and market salespersons 195 389 05 Building frame and related trades workers 3632 7353 05 Mining manufacturing and construction supervisors 626 1315 05 Ships deck crews and related workers 53 114 05 Market gardeners and crop growers 1471 3207 05 Managing directors and chief executives 304 667 05 Travel attendants conductors and guides 229 538 04 Wood treaters cabinet-makers and related trades workers 491 1159 04 Manufacturing labourers 1640 3909 04 Domestic hotel and office cleaners and helpers 5679 13545 04 Other stationary plant and machine operators 822 1961 04 Mobile plant operators 1038 2497 04 Building finishers and related trades workers 1519 3680 04 Textile fur and leather products machine operators 431 1048 04 Garment and related trades workers 422 1047 04 Chemical and photographic products plant and machine operators 157 389 04 Food processing and related trades workers 930 2330 04 Vehicle window laundry and other hand cleaning workers 291 754 04 Sheet and structural metal workers moulders and welders and related workers
996 2603 04
Waiters and bartenders 4399 11595 04 Cooks 1529 4039 04 Metal processing and finishing plant operators 208 557 04 Printing trades workers 203 548 04 Forestry and related workers 130 351 04 Protective services workers 1347 3658 04 Transport and storage labourers 2532 6939 04 Fishery workers hunters and trappers 46 128 04 Material-recording and transport clerks 1671 4630 04 Process control technicians 179 517 03 Mining and mineral processing plant operators 94 274 03 Telecommunications and broadcasting technicians 177 519 03 Blacksmiths toolmakers and related trades workers 816 2409 03 Building and housekeeping supervisors 678 2045 03
Secretaries (general) 1072 3259 03 Assemblers 850 2586 03 Other craft and related workers 258 810 03 Shop salespersons 6600 21042 03 Electrical equipment installers and repairers 958 3060 03 Food and related products machine operators 437 1400 03 Other sales workers 1087 3510 03 Food preparation assistants 1646 5337 03 Mixed crop and animal producers 387 1260 03 Car van and motorcycle drivers 1155 3764 03 Client information workers 1993 6531 03 Sports and fitness workers 605 1984 03 Handicraft workers 194 638 03 Life science technicians and related associate professionals 82 271 03 Keyboard operators 283 940 03 Electronics and telecommunications installers and repairers 290 963 03 Other personal services workers 313 1047 03 Vocational education teachers 279 940 03 Other teaching professionals 744 2518 03 General office clerks 966 3272 03 Authors journalists and linguists 335 1135 03 Hairdressers beauticians and related workers 806 2796 03
Labour shortages and surpluses 2017
2017 46
Directorate-General for Employment Social Affairs and Inclusion European Network of Public Employment Services (PES)
ISCO-08 title
2015
UE
Recruited in the
last year (lt12
months)
Ratio of UE to new recruits
Animal producers 189 660 03 Other elementary workers 976 3401 03 Machinery mechanics and repairers 1134 3962 03 Ship and aircraft controllers and technicians 80 281 03 Hotel and restaurant managers 344 1220 03 Cashiers and ticket clerks 908 3220 03 Retail and wholesale trade managers 224 809 03 Sales marketing and development managers 311 1124 03 Physical and engineering science technicians 1204 4366 03 Administrative and specialised secretaries 1106 4040 03 Sales and purchasing agents and brokers 1294 4754 03 Rubber plastic and paper products machine operators 256 941 03 Artistic cultural and culinary associate professionals 511 1906 03 Numerical clerks 944 3532 03 Other services managers 184 691 03 Child care workers and teachers aides 1335 5005 03 Heavy truck and bus drivers 1426 5349 03 Business services and administration managers 383 1439 03 Information and communications technology service managers 67 257 03 Regulatory government associate professionals 209 807 03 Life science professionals 176 681 03 Wood processing and papermaking plant operators 97 379 03 Locomotive engine drivers and related workers 46 179 03 Legal professionals 315 1245 03 Personal care workers in health services 2195 8787 02 Physical and earth science professionals 85 345 02 Street vendors (excluding food) 50 204 02 Architects planners surveyors and designers 515 2092 02 Other clerical support workers 901 3657 02 Business services agents 510 2114 02 Manufacturing mining construction and distribution managers 361 1507 02 Tellers money collectors and related clerks 381 1612 02 Librarians archivists and curators 58 248 02 Medical and pharmaceutical technicians 255 1099 02 University and higher education teachers 301 1333 02 Information and communications technology operations and user support technicians
418 1888 02
Legal social and religious associate professionals 920 4348 02 Financial and mathematical associate professionals 601 2852 02 Sales marketing and public relations professionals 865 4172 02 Finance professionals 472 2281 02 Engineering professionals (excluding electrotechnology) 635 3118 02 Other health associate professionals 531 2657 02
Social and religious professionals 460 2317 02 Professional services managers 176 891 02 Nursing and midwifery associate professionals 556 2855 02 Legislators and senior officials 53 286 02 Database and network professionals 83 455 02 Administration professionals 641 3673 02 Primary school and early childhood teachers 575 3345 02 Electrotechnology engineers 142 827 02 Secondary education teachers 471 2812 02 Other health professionals 346 2083 02 Nursing and midwifery professionals 273 1760 02 Software and applications developers and analysts 631 4159 02 Medical doctors 293 1944 02 No occupation 152894 00
No answer 2531 578 44 Total 249561 294937 08
Labour shortages and surpluses 2017
2017 47
Directorate-General for Employment Social Affairs and Inclusion European Network of Public Employment Services (PES)
HOW TO OBTAIN EU PUBLICATIONS
Free publications
bull one copy
via EU Bookshop (httpbookshopeuropaeu)
bull more than one copy or postersmaps
from the European Unionrsquos representations (httpeceuropaeurepresent_enhtm)
from the delegations in non-EU countries
(httpeeaseuropaeudelegationsindex_enhtm)
by contacting the Europe Direct service (httpeuropaeueuropedirectindex_enhtm)
or calling 00 800 6 7 8 9 10 11 (free phone number from anywhere in the EU) () () The information given is free as are most calls (though some operators phone boxes or hotels may charge you)
Priced publications
bull via EU Bookshop (httpbookshopeuropaeu)
Priced subscriptions
bull via one of the sales agents of the Publications Office of the European Union
(httppublicationseuropaeuothersagentsindex_enhtm)
doi 10276731262
KE-0
1-1
8-2
63-E
N-N
[Ca
talo
gu
e n
um
be
r]
Labour shortages and surpluses 2017
2018 26
Directorate-General for Employment Social Affairs and Inclusion European Network of Public Employment Services (PES)
4 THE CAUSES OF SKILL SHORTAGES AND POTENTIAL SOLUTIONS
41 Introduction
The focus of this chapter is on identifying the possible causes of skills shortages and
surpluses and exploring ways in which these imbalances may be resolved The chapter
begins with a review of the nature of skills and labour market imbalances and concludes
with an exploration of the extent to which enhanced cross-border mobility policies and
more equal gender representation could contribute to the alleviation of skills and labour
imbalances in certain shortage occupations in the EEA labour market
42 The role of skills and labour shortages in skills imbalances
One of the new questions included in the current study asks the PES to identify the
nature of the shortage (ie is it a skill shortage or a labour shortage) in relation to each
shortage occupation they identified It was explained in the questionnaire that labour
shortages occur when there are a sufficient number of appropriately qualified job-seekers
to fill the vacancies which arise but for a variety of reasons many of them do not wish
to work in the occupation in question Their response to this question is summarised in
Table 41 in respect of the twenty occupations which were reported by the most PES
A total of twenty-six PES classified their shortage occupations as skill or labour
shortages and they classified most of the occupations as skill shortages Indeed in the
case of seven occupations plumbers doctors software developers electricians
electronic engineers electronic engineering technicians bus and tram drivers and
mechanical engineers all of the reporting PES classified the shortage as a skills deficit
Each labour market within the EEA is regulated in a particular manner and conditions of
employment even within the same occupation vary throughout the region This is why
many occupations while classified by most of the PES as reflecting skill deficits
nevertheless are classified by some PES as labour shortages
However the number of PES involved is very small indeed Only in the case of three
occupations lsquowaitersrsquo lsquoshop sales assistantsrsquo and lsquoprimary school teachersrsquo are there
more PES classifying the shortage as a labour shortage then a skills deficit The first two
occupations are undoubtedly labour shortages This is because there are few if any
barriers to working in these occupations9
The inclusion of lsquoprimary school teachersrsquo as a labour shortage is however a surprise It
was identified by eight PES as a shortage occupation two of whom classified the
occupation as a shortage of high magnitude It would be necessary to conduct research
into the conditions of employment ndash including qualification criteria ndash within the countries
where the reporting PES are located to establish if this classification of the occupation as
a labour shortage is warranted
With some notable exceptions the response of the PES to classifying their shortage
occupations as skill or labour shortages demonstrates that the PES understand these
concepts Occupations such as professional nurses which are obviously suffering from a
shortage of qualified job-seekers in the EEA are overwhelmingly categorised as a skills
shortage while less skilled occupations such as cleaners are categorised as being on the
borderline between skills and labour shortages
9 Both occupations have relatively high ratios of unemployed to new hires (Annex 4)
Labour shortages and surpluses 2017
2018 27
Directorate-General for Employment Social Affairs and Inclusion European Network of Public Employment Services (PES)
Table 41 Skill and labour shortages
Occupation
Number of PES
reporting occupation
as skills shortage
Number of PES
reporting occupation as labour shortage
Number of PES
reporting occupations as skill and
labour shortage
Total number of
PES reporting on skillslabour
shortage
Cooks 9 1 0 10
Plumbers and pipe fitters 8 0 0 8
Generalist medical Practitioners 7 0 0 7
Heavy truck and lorry drivers 4 2 1 7
Metal workers machine tool setting and operators
3 3 1 7
Welders and flame cutters 4 2 1 7
Nursing professionals 5 1 0 6
Software developers 6 0 0 6
Systems analyst 5 1 0 6
Bricklayers and related trades 4 1 0 5
Building and related electricians 5 0 0 5
Butchers fishmongers and related food 3 2 0 5
Cleaners and helpers in offices 3 2 0 5
Commercial sales representatives 2 2 1 5
Electronic engineers 5 0 0 5
Manufacturing supervisors 4 1 0 5
Motor vehicle mechanics and repairers 3 1 1 5
Nursing associate professionals 4 1 0 5
Primary school teachers 2 3 0 5
Shop sales assistants 1 4 0 5
Waiters 2 3 0 5
Agriculture and industrial machinery repairers
3 1 0 4
Application programmers 3 1 0 4
Bus and tram drivers 4 0 0 4
Electronic engineering technicians 4 0 0 4
Health care assistants 3 1 0 4
Mechanical engineers 4 0 0 4
Sheet metal workers 3 1 0 4
Structural metal preparers and erectors 3 1 0 4
Total number of PES reporting 16 8 2 26
The atypical working hours associated with heavy goods vehicle driving is recognised by
two of the six PES who classify shortages in the occupation as labour shortages while the
unpleasant conditions associated with working in butchery shops and abattoirs is
reflected in the fact that two of the five PES who categorised the occupation as a
shortage occupation classify it as a labour shortage
43 Location of skill imbalances and cross border mobility
In recent years there has been considerable discussion on the potential role which
enhanced cross-border mobility could play in alleviating labour market imbalances The
attractiveness of such a policy is obvious The European Union is a very large
Labour shortages and surpluses 2017
2018 28
Directorate-General for Employment Social Affairs and Inclusion European Network of Public Employment Services (PES)
marketplace embracing a very large labour force if even some of the shortages which
are reported by EEA countries could be resolved by exploiting the surpluses which are
reported by other EEA countries it could form the basis of a number of win-win solutions
for both job-seekers and businesses
An additional attraction of this policy is that it could potentially successfully address both
skills and labour shortages as working conditions associated with some labour shortages
in one country might be perceived as significantly more attractive in a different EEA
country
Table 44 provides a list of the top twenty shortage occupations which have at least one
PES in another EEA country reporting the occupation as a surplus
There are a number of aspects of the Table which are notable Firstly the list of top
occupations has changed quite dramatically from the list in Table 21 specifically none
of the professional and associate professional occupations are now on the list including
the four professional and associate professional health-related occupations or the two
professional software occupations What the Table shows is that there are no surpluses
reported in any of the EEA countries of doctors or nurses software developers or
systems analysts While the occupation of healthcare assistants is in surplus in many
countries it was not included in the list of top occupations because it was reported as a
shortage by only two PES
The figures in Table 42 show that there are three cross-border matching possibilities in
the case of bricklayers and motor mechanics and two possibilities in the case of
plasterers health care assistants and secondary school teachers
There is just one matching possibility in respect of a wide range of occupations including
cooks truck drivers commercial sales representatives electricians carpenters civil
engineers primary school teachers manufacturing supervisors telecentre salespersons
childhood education teachers floor layers and roofers
The fact that primary school teachers have only one cross border matching possibility
suggest that the classification of the occupation as a labour shortage by three of five PES
is an error In general labour shortages would be expected to have more cross border
matching possibilities than skill shortages because there are many job-seekers eligible to
work in the occupation in question and working conditions vary quite significantly from
country to country Indeed it is notable that the two other occupations which were
classified by the PES as predominantly labour shortages waiters and shop sales
assistants have a relatively high number of matching possibilities eight in the case of
shop sales assistants and three in the case of waiters
In general the PES did not classify the same occupation as both a shortage and a
surplus A striking exception is the Danish PES which categorised four of its shortage
occupations as surplus occupations also This is most likely due to the higher level of
granularity available in the Danish data (below 4-digit) so that some job titles within an
occupation are considered labour shortage while others skill shortage
44 Assessing gender composition of surpluses
The PES were asked to estimate the share of females in the occupations which they
identified as lsquosurplusrsquo occupations The restricting of this question to surplus occupations
was to avoid giving the impression that shortages were arising because of discriminatory
recruitment policies
Labour shortages and surpluses 2017
2018 29
Directorate-General for Employment Social Affairs and Inclusion European Network of Public Employment Services (PES)
A total of 13 PES reported any data on gender composition of surpluses However the
quality of information submitted did not provide a sufficient basis for an accurate
estimation of the gender composition of surpluses in some of the cases
It is suggested that in order to address gender imbalances in relation to shortages and
surpluses data from PES on job seekers should be combined with the LSF data on
employment by occupation
45 Conclusions
The analysis in chapter four has produced a number of interesting findings The analysis
reveals that the PES in general has the capacity to distinguish between skill and labour
shortages and to identify shortage occupations which have some cross-border matching
possibilities
The relatively low number of surplus occupations reflects two factors firstly only
eighteen PES submitted a list of surplus occupations and secondly in many cases the
lists did not include the maximum number of twenty occupations which were requested
This response has to be viewed against the background of an EEA labour market where
employment is expanding and unemployment is contracting However while this is a
positive development the relatively low number of surplus occupations has placed a
significant limit on the extent to which there were cross-border possibilities of matching
shortage with surplus occupations
The data indicates that there is a limitation to the extent to which the PES can be used to
identify the gender imbalances (eg under-representation of females in some
occupations) and that other sources should be explored
Labour shortages and surpluses 2017
2018 30
Directorate-General for Employment Social Affairs and Inclusion European Network of Public Employment Services (PES)
Table 43 The potential for cross-border matching of shortage and surplus occupations
No PES
Occupation PES reporting shortage PES reporting surplus No PES
16 Cooks AT Art BG CY DK HR IE IS IT MT NL NO PT SE SI SK lsaquo―rsaquo HU 1
11 Truck drivers ART VDAB BG DK HR LT IT NL NO PT SE SI SK lsaquo―rsaquo DK 1
10 Cleaners helpers CY DK HR FI IS HU NL NO PT SI lsaquo―rsaquo DK LF NL IE 4
10 Commercial sales VDAB ART DK FI FR IT IE PT PL SI lsaquo―rsaquo DK 1
9 Sales assistants AT ART BG CY DK IT NO SI SK lsaquo―rsaquo DK LF SE NL BG CH FI IE 8
9 Bricklayers ART DE DK HR HU LT NL PT SI lsaquo―rsaquo CY HU IE 3
9 Motor mechanics AT VDAB ART LF DK IT NO PT SI lsaquo―rsaquo SK CH EE 3
9 Waiters ART BG CY IS IT MT NO PT SI lsaquo―rsaquo HU EE IE 3
9 Electricians ART VDAB DE DK IS IT NL NO SI lsaquo―rsaquo FR 1
8 Carpenters DK HR HU FI NL NO PT SI lsaquo―rsaquo HU 1
8 Civil engineers ART CH DE FI FR NO SE SI lsaquo―rsaquo CY 1
8 Primary teachers ART BG DK IS NO SE SI SK lsaquo―rsaquo CY 1
7 Healthcare assist CY DK EE NL NO SI SK lsaquo―rsaquo DK NL 2
7 Second teacher ART BG FR NL NO SI SK lsaquo―rsaquo CY FI 2
7 Man supervisors ART VDAB LF DE EE FR SK lsaquo―rsaquo BG 1
6 Plasterers HR HU FI LT NL SI lsaquo―rsaquo HU IE 2
6 Tele centre sales ART HU FI FR MT NO lsaquo―rsaquo EE 1
6 Childhood educ FI LT NO SE SI SK lsaquo―rsaquo CY 1
6 Floor layers HU HR FI FR LT LV lsaquo―rsaquo HU 1
6 Roofers HR FI FR LT LV SI lsaquo―rsaquo HU 1
Bottlenecks Occupations 2017
2017 31
Directorate-General for Employment Social Affairs and Inclusion European Network of Public Employment Services (PES)
5 CONCLUSIONS AND RECOMMENDATIONS
51 Conclusions
The terms of reference for this study emphasise the desirability of creating a process for
the systematic collection of data on surplus and shortage occupations in the EEA area
which could be effectively used by EURES for cross border matching of shortage
occupations in some EEA countries with surplus occupations in others
The authors have responded to this emphasis by using a process which ensures that the
data gathered on shortage and surplus occupations is comprehensive accurate and of
practical use to EURES and the providers of education and training programmes The
process is comprehensive because it gathers information both on the extent of shortages
and surpluses and on their relative severity It is accurate because the list of shortage
and surplus occupations are shown to be consistent with the estimated value of the ratio
of unemployed to new hires Finally the process provides information which is of
practical use to EURES and the national providers of VET because the data gathered is on
individual occupations rather than on lsquobundles of occupationsrsquo as in previous studies The
analyses in this report shows that while these bundles of occupations contain some
occupations which are identified by the PES as shortage and surplus occupations they
also contain occupations which are neither in shortage nor in surplus and it is impossible
to distinguish one from the other
The data gathering process used in this report however was not devoid of weaknesses
Fortunately these weaknesses reflect the modus operandi of the PES and may be
rectified by including other institutions and agencies in the process For example the PES
use the same sources for the identification of both shortage and surplus occupations
This may have advantages in terms of accuracy when those sources include employersrsquo
surveys immigration data and the results of forecasting exercises However these
sources are not suitable for gathering data on surplus occupations and they are the main
reason why the number of surplus occupations provided by the PES were almost half the
number requested In the future PES data could be augmented by data gathered by
other bodies as outlined in recent EU Regulation 2016589
In addition the response to the question on the capacity of the PES to deliver data on
shortage and surplus occupations at a regional level was also disappointing perhaps
reflecting a misalignment in some EEA countries between the geographic configuration of
the local PES network and the NUTs regions
The analysis highlighted that in order to assess gender imbalances of shortages and
surpluses PES data needs to be augmented by other sources
Finally despite the low number of surplus occupations submitted by the PES it was
nevertheless possible to identify twenty shortage occupations in the EEA labour market
which had at least one cross-border matching possibility and many more than one in the
case of some shortage occupations
52 Recommendations
Based on the findings from the three bottleneck studies undertaken to date a model for
the gathering of data on shortages and surpluses is proposed (Figure 51) The model
includes features of the methodology applied in this study which were successful It also
includes a number of features which should be introduced to the process in order to
address some of the weaknesses which were identified in this study (highlighted in red)
Labour shortages and surpluses 2017
2017 32
Directorate-General for Employment Social Affairs and Inclusion European Network of Public Employment Services (PES)
However before this methodology is implemented it would be prudent to discuss data
requirements with PES and invite a broader range of institutions and agencies to
participate in aspects of the data gathering process in addition to the PES EURES
Regulation (EU) 2016589 of the European Parliament and of the Council which obliges
the appropriate national authorities to furnish such data annually is fortuitous in this
regard and should facilitate the implementation of this recommendation
In addition the results of these and other relevant studies should be disseminated to
PES Eures coordination group and other relevant agencies and institutions in order to
emphasise the importance of data and analysis in informing policy at EU and national
level which aims to resolve labour market imbalances
Labour shortages and surpluses 2017
2017 33
Directorate-General for Employment Social Affairs and Inclusion European Network of Public Employment Services (PES)
Figure 51 Model for gathering data on shortage and surplus occupations
Sources of data on surpluses PES data from other relevant agencies
In those cases where the source used by the PES to identify shortage occupations cannot
be used to identify surplus occupations other institutions or other sources or both should be availed of to ensure that comprehensive data on surplus occupations are provided to the appropriate national authority
Dimensions of shortagessurpluses extent (number of reporting PES) and severity (high or low
magnitude)
Data should be systematically gathered on both the extent of shortage and surplus
occupations in the EEA and on their relative severity
Type of shortage skill vs labour shortages
The providers of the data on shortage occupations must also distinguish between skill and labour shortages because this distinction is necessary for the accurate identification of
shortage occupations and for the choice of the appropriate policy response to identified shortages
Classification of occupations used ISCO 08 4-digit codes (or translation into these codes)
All data should be either initially gathered in ISCO 08 4-digit codes or translated into these
codes This ensures that the data refers to specific individual occupations and is of practical use to EURES and the national providers of VET
Accuracy test cross-check with LSF data (ratio of unemployed to new hires)
The accuracy of the submitted lists of shortage and surplus occupations should be assessed
by comparing the most widely reported surplus and shortage occupations with the estimated values of the ratios of employed (by previous occupation) to new hires at the aggregated EU28 level These ratios should be based on an analysis of the most up-to date
Labour Force Survey (LFS) data
Gender balance assessment LFS data on employment at occupational level by gender PES job
seekers
The gender composition of shortage and surplus occupations should be based on the most
up to date analyses of LFS data on employment by gender and the PES job seeker data
Regional balance assessment LSF data data from relevant agencies
Where regional data is required other agencies and institutions should be requested to
provide the data in those cases where the data cannot be provided by the regional PES network because it is not geographically aligned to the NUTs regions
Labour shortages and surpluses 2017
2017 34
Directorate-General for Employment Social Affairs and Inclusion European Network of Public Employment Services (PES)
Number of occupations reporting should be extended beyond 20 occupations but with upper
limit (eg 50)
Consideration should be given to allowing the agencies responsible for identifying shortage
and surplus occupations a greater range of flexibility in terms of the numbers of occupations which should be identified A minimum to maximum range would be a more realistic approach as it would reflect the fact that the labour markets of the EEA vary significantly in size and performance
Timing of imbalance assessment September
It is proposed that the data gathering exercise should be brought forward to early September and that expert advice should be available on line throughout the data
gathering exercise
Labour shortages and surpluses 2017
2017 35
Directorate-General for Employment Social Affairs and Inclusion European Network of Public Employment Services (PES)
ANNEX 1 DATA COLLECTION TEMPLATE Information sought Explanation
Occupation title (text) Type in free text a list of occupations (one row one occupation) for which shortages and surpluses exist first list occupations for which there is a shortage the list should contain a maximum of 20 occupations if your list contains less than 20 occupations please provide a brief explanation in your email response for why the number is lower than 20 second list occupations for which there is a surplus the list should contain a maximum of 20 occupations if your list contains less than 20 occupations please provide a brief explanation in your email response for why the number is lower than 20
Shortagesurplus indicator For each occupation indicate if it refers to a shortage by typing in shortage or surplus by typing in surplus to identify surplus occupations you can examine for each occupation the ratio of the number of job seekers to the number of vacancies at the end of each year for example if there are 5000 shop assistants seeking employment and there are 200 vacancies at the end of the reference period the ratio is 251 you can rank the calculated ratios and report the occupations associated with the 20 highest ratios
Occupational classification used in your country
For each occupation indicate what occupational classification (if any) was used to identify this occupation for instance you can report a country specific classification ISCO ROME SOC etc If you donrsquot use occupational classifications type None
Occupation code to the lowest level of disaggregation (eg ISCO at 4 digits)
If you have indicated a classification used type the code for each occupation use the lowest level of disaggregation (eg 4 digit ISCO code) if you donrsquot use occupational classification leave black
ISCO-08 code at 4-digit level (or lower if 4-digit not available)
If you use occupational classification which is not ISCO-08 and if it is possible provide a translation of the national code to ISCO-08 code ISCO is the International Standard Classification of Occupations which is used to report to Eurostat code should be at 4 digits if this is not available than the lowest level of disaggregation that is available should be reported (3 digits if 4-digit code is not available 2 digits if neither 4-digit nor 3-digit code is available 1 digit if neither 4-digit 3-digit nor 2-digit code is available) if it is not possible to provide translation to ISCO-08 leave black if you have already reported ISCO-08 code in column 3 leave this column black
Estimate of shortagesurplus magnitude (high (gt3 of employment) medium (1-3 of employment) low (lt1 of employment))
For each occupation indicate a broad estimate of the magnitude of the shortagesurplus if you estimate that the shortagesurplus is less than 1 of the total employment in the occupation in question type low if between 1-3 type medium if greater than 3 type high if you cannot provide a rough estimate of magnitude type dont know
Current shortagesurplus (C) future short term (FST) future medium term (FMT) future long term (FLT) donrsquot know (indicate all that apply)
Against each occupation indicate if the identified shortagesurplus refers to present situation by typing C if the shortage is expected to occur in the short term future ie within 12 months by typing FST if it is expected to occur over the medium term (within 1-5 years) by typing FMT if it is expected to occur in the long term (in 5 or more years) by typing FLT if more than one time period applies indicate all relevant ones (eg for current shortagessurpluses that are expected to persist over the short term type C FST) if you dont know type dont know
Source of information on shortagessurpluses (eg PES administrative data (vacancies job seekers) PES survey third party survey Occupational forecasts other (specify) etc)
Indicate the source used to identify shortagesurplus for this occupation did you derive it from the PES administrative data on PES vacancies andor job seekers did you conduct a survey did you commission a third party to conduct a survey for you did you have occupational forecasts available did you use other research type in free text the full description of the source(s) eg National Employment Survey conducted by PES etc
Labour shortages and surpluses 2017
2017 36
Directorate-General for Employment Social Affairs and Inclusion European Network of Public Employment Services (PES)
Date for source of information Indicate the year that the information on shortagessurpluses (column 7) refers to eg type 2016 for a survey of difficult to fill vacancies conducted in 2016 even if the report was published in 2017
What indicator(s) suggested that there is a shortagesurplus
Indicate what criteria was used to conclude that this occupation is associated with a shortagesurplus for instance employers views sourcing from abroad to fill vacancies growth in employment faster than growth in educationtraining output time required to fill
vacancies higher than average etc
Share of females among job seekers in this occupation (surplus occupations only)
Indicate the percentage share of females among all job seekers in this occupation this is only applicable to surplus occupations
Skill or labour shortage Indicate if a shortage refers to a skill or labour shortage a skill shortage occurs where there is an insufficient supply of persons with the appropriate skills labour shortages occur where there is a sufficient number of skilled persons however an insufficient number of them is willing to take up employment in the occupation in question
Indicate the availability of data on shortagessurpluses at regional level (NUTS1 NUTS2 NUTS3 No data)
Indicate if data is available on the regional breakdown of shortagessurpluses by indicating the level of regional data available if multiple levels of regional disaggregation are available indicate the lowest level of disaggregation (eg NUTS3 rather than NUTS2) if there is no regional data available use no data
Labour shortages and surpluses 2017
2017 37
Directorate-General for Employment Social Affairs and Inclusion European Network of Public Employment Services (PES)
ANNEX 2 SHORTAGE OCCUPATIONS
Shortage occupation PES count
Cooks 16 Plumbers and pipe fitters 13 Generalist medical practitioners 12 Welders and flamecutters 12 Heavy truck and lorry drivers 11 Metal working machine tool setters and operators 11 Nursing professionals 11 Software developers 11 Agricultural and industrial machinery mechanics and repairers 10 Cleaners and helpers in offices hotels and other establishments 10 Commercial sales representatives 10 Specialist medical practitioners 10 Systems analysts 10 Bricklayers and related workers 9 Building and related electricians 9 Butchers fishmongers and related food preparers 9 Motor vehicle mechanics and repairers 9 Nursing associate professionals 9 Sheet-metal workers 9 Shop sales assistants 9 Waiters 9 Carpenters and joiners 8 Civil engineers 8 Concrete placers concrete finishers and related workers 8 Electrical engineering technicians 8 Electronics engineering technicians 8 Mechanical engineers 8 Primary school teachers 8 Structural-metal preparers and erectors 8 Electronics engineers 7
Health care assistants 7 Manufacturing supervisors 7 Mechanical engineering technicians 7 Secondary education teachers 7 Accountants 6 Applications programmers 6 Bus and tram drivers 6 Contact centre salespersons 6 Early childhood educators 6 Electrical mechanics and fitters 6 Floor layers and tile setters 6 Plasterers 6 Roofers 6 Sewing machine operators 6 Software and applications developers and analysts not elsewhere classified 6 Toolmakers and related workers 6 Web and multimedia developers 6 Air conditioning and refrigeration mechanics 5 Building frame and related trades workers not elsewhere classified 5 Chefs 5 Civil engineering labourers 5 Construction supervisors 5 Earthmoving and related plant operators 5 Electrical engineers 5 Electrical line installers and repairers 5 Engineering professionals not elsewhere classified 5 Hairdressers 5 Information and communications technology operations technicians 5 Manufacturing managers 5 Physiotherapists 5 Real estate agents and property managers 5 Research and development managers 5 Spray painters and varnishers 5 Accounting associate professionals 4 Bakers pastry-cooks and confectionery makers 4
Labour shortages and surpluses 2017
2017 38
Directorate-General for Employment Social Affairs and Inclusion European Network of Public Employment Services (PES)
Shortage occupation PES count
Blacksmiths hammersmiths and forging press workers 4 Civil engineering technicians 4 Crane hoist and related plant operators 4 Database designers and administrators 4 Industrial and production engineers 4 Painters and related workers 4 Physical and engineering science technicians not elsewhere classified 4 Plastic products machine operators 4 Social work and counselling professionals 4 Accounting and bookkeeping clerks 3 Administrative and executive secretaries 3 Ambulance workers 3 Building construction labourers 3 Car taxi and van drivers 3 Cartographers and surveyors 3 Cleaning and housekeeping supervisors in offices hotels and other establishments 3 Contact centre information clerks 3 Draughtspersons 3 Fast food preparers 3 Freight handlers 3 Gardeners horticultural and nursery growers 3 Home-based personal care workers 3 Hotel receptionists 3 Information and communications technology installers and servicers 3 Insulation workers 3 Kitchen helpers 3 Manufacturing labourers not elsewhere classified 3 Medical imaging and therapeutic equipment technicians 3 Metal moulders and coremakers 3 Metal polishers wheel grinders and tool sharpeners 3 Midwifery professionals 3 Other language teachers 3 Personal services workers not elsewhere classified 3
Pharmacists 3 Policy administration professionals 3 Printers 3 Process control technicians not elsewhere classified 3 Sales and marketing managers 3 Shop supervisors 3 Special needs teachers 3 Stock clerks 3 Supply distribution and related managers 3 Survey and market research interviewers 3 Systems administrators 3 Technical and medical sales professionals (excluding ICT) 3 Translators interpreters and other linguists 3 Transport clerks 3 Vocational education teachers 3 Advertising and marketing professionals 2 Audiologists and speech therapists 2 Bartenders 2 Beauticians and related workers 2 Cashiers and ticket clerks 2 Chemical engineers 2 Child care workers 2 Computer network and systems technicians 2 Computer network professionals 2 Construction managers 2 Craft and related workers not elsewhere classified 2 Credit and loans officers 2 Crop farm labourers 2 Database and network professionals not elsewhere classified 2 Dentists 2 Domestic cleaners and helpers 2 Door to door salespersons 2 Driving instructors 2 Electrical and electronic equipment assemblers 2 Electronics mechanics and servicers 2 Elementary workers not elsewhere classified 2 Employment agents and contractors 2
Labour shortages and surpluses 2017
2017 39
Directorate-General for Employment Social Affairs and Inclusion European Network of Public Employment Services (PES)
Shortage occupation PES count
Field crop and vegetable growers 2 Financial analysts 2 Financial and investment advisers 2 Forestry and related workers 2 Garbage and recycling collectors 2 General office clerks 2 Graphic and multimedia designers 2 Information and communications technology service managers 2 Insurance representatives 2 Locomotive engine drivers 2 Mail carriers and sorting clerks 2 Management and organization analysts 2 Mathematicians actuaries and statisticians 2 Mechanical machinery assemblers 2 Medical and dental prosthetic technicians 2 Medical assistants 2 Messengers package deliverers and luggage porters 2 Metal finishing plating and coating machine operators 2 Metal processing plant operators 2 Optometrists and ophthalmic opticians 2 Personal care workers in health services not elsewhere classified 2 Police officers 2 Policy and planning managers 2 Production clerks 2 Restaurant managers 2 Retail and wholesale trade managers 2 Sales workers not elsewhere classified 2 Sewing embroidery and related workers 2 Street food salespersons 2 Tailors dressmakers furriers and hatters 2 Telecommunications engineers 2 Advertising and public relations managers 1 Aged care services managers 1
Agricultural technicians 1 Aircraft engine mechanics and repairers 1 Aircraft pilots and related associate professionals 1 Assemblers not elsewhere classified 1 Authors and related writers 1 Bank tellers and related clerks 1 Bleaching dyeing and fabric cleaning machine operators 1 Bookmakers croupiers and related gaming workers 1 Business services agents not elsewhere classified 1 Buyers 1 Cabinet-makers and related workers 1 Cement stone and other mineral products machine operators 1 Chemical and physical science technicians 1 Chemical engineering technicians 1 Chemical processing plant controllers 1 Chemical products plant and machine operators 1 Chemists 1 Conference and event planners 1 Customs and border inspectors 1 Data entry clerks 1 Dental assistants and therapists 1 Dieticians and nutritionists 1 Dispensing opticians 1 Domestic housekeepers 1 Economists 1 Education methods specialists 1 Environmental and occupational health and hygiene professionals 1 Environmental and occupational health inspectors and associates 1 Fibre preparing spinning and winding machine operators 1 Finance managers 1 Financial and insurance services branch managers 1 Fire-fighters 1 Fitness and recreation instructors and program leaders 1 Food and beverage tasters and graders 1 Food and related products machine operators 1
Labour shortages and surpluses 2017
2017 40
Directorate-General for Employment Social Affairs and Inclusion European Network of Public Employment Services (PES)
Shortage occupation PES count
Food service counter attendants 1 Forestry labourers 1 Fruit vegetable and related preservers 1 Fur and leather preparing machine operators 1 Glass and ceramics plant operators 1 Hand launderers and pressers 1 Hand packers 1 Handicraft workers in textile leather and related materials 1 Health associate professionals not elsewhere classified 1 Health professionals not elsewhere classified 1 House builders 1 Human resource managers 1 Incinerator and water treatment plant operators 1 Information and communications technology user support technicians 1 Judges 1 Lawyers 1 Legal and related associate professionals 1 Legal professionals not elsewhere classified 1 Library clerks 1 Lifting truck operators 1 Livestock and dairy producers 1 Livestock farm labourers 1 Medical and pathology laboratory technicians 1 Medical secretaries 1 Metal production process controllers 1 Mining and quarrying labourers 1 Mining engineers metallurgists and related professionals 1 Mixed crop and animal producers 1 Mixed crop growers 1 Motorcycle drivers 1 Odd job persons 1 Other cleaning workers 1 Other music teachers 1
Paper products machine operators 1 Personnel and careers professionals 1 Personnel clerks 1 Pet groomers and animal care workers 1 Physicists and astronomers 1 Physiotherapy technicians and assistants 1 Potters and related workers 1 Power production plant operators 1 Prison guards 1 Product and garment designers 1 Psychologists 1 Pulp and papermaking plant operators 1 Railway brake signal and switch operators 1 Receptionists (general) 1 Refuse sorters 1 Riggers and cable splicers 1 Scribes and related workers 1 Secretaries (general) 1 Securities and finance dealers and brokers 1 Security guards 1 Senior government officials 1 Senior officials of special-interest organizations 1 Shelf fillers 1 Ships engineers 1 Shoemaking and related machine operators 1 Social work associate professionals 1 Stall and market salespersons 1 Stationary plant and machine operators not elsewhere classified 1 Stonemasons stone cutters splitters and carvers 1 Street and related service workers 1 Sweepers and related labourers 1 Teaching professionals not elsewhere classified 1 Telecommunications engineering technicians 1 Textile fur and leather products machine operators not elsewhere classified 1 Trade brokers 1 Travel attendants and travel stewards 1 Travel guides 1
Labour shortages and surpluses 2017
2017 41
Directorate-General for Employment Social Affairs and Inclusion European Network of Public Employment Services (PES)
Shortage occupation PES count
Tree and shrub crop growers 1 Underwater divers 1 University and higher education teachers 1 Vehicle cleaners 1 Veterinarians 1 Weaving and knitting machine operators 1 Web technicians 1 Wood processing plant operators 1 Woodworking-machine tool setters and operators 1
Labour shortages and surpluses 2017
2017 42
Directorate-General for Employment Social Affairs and Inclusion European Network of Public Employment Services (PES)
ANNEX 3 SURPLUS OCCUPATIONS
Surplus occupation PES count
General office clerks 8 Shop sales assistants 8 Advertising and marketing professionals 6 Bank tellers and related clerks 6 Sociologists anthropologists and related professionals 6 Child care workers 5 Hairdressers 5 Journalists 5 Cashiers and ticket clerks 4 Cleaners and helpers in offices hotels and other establishments 4 Hand packers 4 Mail carriers and sorting clerks 4 Photographers 4 Receptionists (general) 4 Tailors dressmakers furriers and hatters 4 Accounting and bookkeeping clerks 3 Administrative and executive secretaries 3 Beauticians and related workers 3 Biologists botanists zoologists and related professionals 3 Bricklayers and related workers 3 Broadcasting and audio-visual technicians 3 Civil engineering labourers 3 Economists 3 Gardeners horticultural and nursery growers 3 Interior designers and decorators 3 Kitchen helpers 3 Legal professionals not elsewhere classified 3 Manufacturing labourers not elsewhere classified 3 Motor vehicle mechanics and repairers 3
Musicians singers and composers 3 Other artistic and cultural associate professionals 3 Painters and related workers 3 Philosophers historians and political scientists 3 Security guards 3 Sweepers and related labourers 3 Travel consultants and clerks 3 Waiters 3 Actors 2 Archivists and curators 2 Bakers pastry-cooks and confectionery makers 2 Bartenders 2 Building construction labourers 2 Business services and administration managers not elsewhere classified 2 Cabinet-makers and related workers 2 Car taxi and van drivers 2 Chemists 2 Cleaning and housekeeping supervisors in offices hotels and other establishments 2 Credit and loans officers 2 Customs and border inspectors 2 Elementary workers not elsewhere classified 2 Film stage and related directors and producers 2 Financial analysts 2 Forestry and related workers 2 Freight handlers 2 Graphic and multimedia designers 2 Health care assistants 2 Hotel receptionists 2 Lawyers 2 Legal and related associate professionals 2 Library clerks 2 Livestock and dairy producers 2 Management and organization analysts 2 Messengers package deliverers and luggage porters 2 Odd job persons 2 Office supervisors 2 Plasterers 2
Labour shortages and surpluses 2017
2017 43
Directorate-General for Employment Social Affairs and Inclusion European Network of Public Employment Services (PES)
Surplus occupation PES count
Police officers 2 Pre-press technicians 2 Print finishing and binding workers 2 Printers 2 Prison guards 2 Product and garment designers 2 Psychologists 2 Public relations professionals 2 Religious professionals 2 Secondary education teachers 2 Secretaries (general) 2 Social work and counselling professionals 2 Stall and market salespersons 2 Stock clerks 2 Teachers aides 2 Telephone switchboard operators 2 Travel guides 2 Visual artists 2 Advertising and public relations managers 1 Agricultural technicians 1 Announcers on radio television and other media 1 Assemblers not elsewhere classified 1 Building and related electricians 1 Building architects 1 Building caretakers 1 Building frame and related trades workers not elsewhere classified 1 Business services agents not elsewhere classified 1 Buyers 1 Carpenters and joiners 1 Chemical engineers 1 Civil engineers 1 Clearing and forwarding agents 1 Clerical support workers not elsewhere classified 1
Commercial sales representatives 1 Conference and event planners 1 Contact centre information clerks 1 Contact centre salespersons 1 Cooks 1 Crane hoist and related plant operators 1 Creative and performing artists not elsewhere classified 1 Dancers and choreographers 1 Data entry clerks 1 Database designers and administrators 1 Domestic cleaners and helpers 1 Domestic housekeepers 1 Draughtspersons 1 Driving instructors 1 Early childhood educators 1 Electronics mechanics and servicers 1 Farming forestry and fisheries advisers 1 Fashion and other models 1 Fast food preparers 1 Field crop and vegetable growers 1 Filing and copying clerks 1 Finance managers 1 Financial and insurance services branch managers 1 Financial and investment advisers 1 Fire-fighters 1 Fitness and recreation instructors and program leaders 1 Floor layers and tile setters 1 Food service counter attendants 1 Fruit vegetable and related preservers 1 Gallery museum and library technicians 1 Garbage and recycling collectors 1 Garment and related pattern-makers and cutters 1 Glass and ceramics plant operators 1 Government tax and excise officials 1 Hand launderers and pressers 1
Labour shortages and surpluses 2017
2017 44
Directorate-General for Employment Social Affairs and Inclusion European Network of Public Employment Services (PES)
Surplus occupation PES count
Heavy truck and lorry drivers 1 House builders 1 Hunters and trappers 1 Information and communications technology installers and servicers 1 Information and communications technology user support technicians 1 Insurance representatives 1 Jewellery and precious-metal workers 1 Judges 1 Legal secretaries 1 Librarians and related information professionals 1 Life science technicians (excluding medical) 1 Lifting truck operators 1 Managing directors and chief executives 1 Manufacturing supervisors 1 Medical and dental prosthetic technicians 1 Metal moulders and coremakers 1 Mining and quarrying labourers 1 Mixed crop and animal producers 1 Mixed crop growers 1 Mobile farm and forestry plant operators 1 Musical instrument makers and tuners 1 Other language teachers 1 Pawnbrokers and money-lenders 1 Personnel and careers professionals 1 Pet groomers and animal care workers 1 Photographic products machine operators 1 Physical and engineering science technicians not elsewhere classified 1 Physicists and astronomers 1 Police inspectors and detectives 1 Precision-instrument makers and repairers 1 Primary school teachers 1 Process control technicians not elsewhere classified 1 Product graders and testers (excluding foods and beverages) 1
Production clerks 1 Professional services managers not elsewhere classified 1 Protective services workers not elsewhere classified 1 Research and development managers 1 Retail and wholesale trade managers 1 Roofers 1 Sales workers not elsewhere classified 1 Senior government officials 1 Service station attendants 1 Shelf fillers 1 Shop supervisors 1 Social work associate professionals 1 Special needs teachers 1 Spray painters and varnishers 1 Statistical mathematical and related associate professionals 1 Stonemasons stone cutters splitters and carvers 1 Street food salespersons 1 Supply distribution and related managers 1 Teaching professionals not elsewhere classified 1 Technical and medical sales professionals (excluding ICT) 1 Training and staff development professionals 1 Translators interpreters and other linguists 1 Transport conductors 1 Tree and shrub crop growers 1 Typists and word processing operators 1 Undertakers and embalmers 1 Vocational education teachers 1 Weaving and knitting machine operators 1 Woodworking-machine tool setters and operators 1
Labour shortages and surpluses 2017
2017 45
Directorate-General for Employment Social Affairs and Inclusion European Network of Public Employment Services (PES)
ANNEX 4 THE RATIO OF UNEMPLOYED TO NEW HIRES
ISCO-08 title
2015
UE
Recruited in the
last year (lt12
months)
Ratio of UE to new recruits
Street and related service workers 85 104 08 Agricultural forestry and fishery labourers 3913 5343 07 Mining and construction labourers 1937 3525 05 Creative and performing artists 610 1115 05 Refuse workers 1036 1923 05 Painters building structure cleaners and related trades workers 1116 2117 05 Street and market salespersons 195 389 05 Building frame and related trades workers 3632 7353 05 Mining manufacturing and construction supervisors 626 1315 05 Ships deck crews and related workers 53 114 05 Market gardeners and crop growers 1471 3207 05 Managing directors and chief executives 304 667 05 Travel attendants conductors and guides 229 538 04 Wood treaters cabinet-makers and related trades workers 491 1159 04 Manufacturing labourers 1640 3909 04 Domestic hotel and office cleaners and helpers 5679 13545 04 Other stationary plant and machine operators 822 1961 04 Mobile plant operators 1038 2497 04 Building finishers and related trades workers 1519 3680 04 Textile fur and leather products machine operators 431 1048 04 Garment and related trades workers 422 1047 04 Chemical and photographic products plant and machine operators 157 389 04 Food processing and related trades workers 930 2330 04 Vehicle window laundry and other hand cleaning workers 291 754 04 Sheet and structural metal workers moulders and welders and related workers
996 2603 04
Waiters and bartenders 4399 11595 04 Cooks 1529 4039 04 Metal processing and finishing plant operators 208 557 04 Printing trades workers 203 548 04 Forestry and related workers 130 351 04 Protective services workers 1347 3658 04 Transport and storage labourers 2532 6939 04 Fishery workers hunters and trappers 46 128 04 Material-recording and transport clerks 1671 4630 04 Process control technicians 179 517 03 Mining and mineral processing plant operators 94 274 03 Telecommunications and broadcasting technicians 177 519 03 Blacksmiths toolmakers and related trades workers 816 2409 03 Building and housekeeping supervisors 678 2045 03
Secretaries (general) 1072 3259 03 Assemblers 850 2586 03 Other craft and related workers 258 810 03 Shop salespersons 6600 21042 03 Electrical equipment installers and repairers 958 3060 03 Food and related products machine operators 437 1400 03 Other sales workers 1087 3510 03 Food preparation assistants 1646 5337 03 Mixed crop and animal producers 387 1260 03 Car van and motorcycle drivers 1155 3764 03 Client information workers 1993 6531 03 Sports and fitness workers 605 1984 03 Handicraft workers 194 638 03 Life science technicians and related associate professionals 82 271 03 Keyboard operators 283 940 03 Electronics and telecommunications installers and repairers 290 963 03 Other personal services workers 313 1047 03 Vocational education teachers 279 940 03 Other teaching professionals 744 2518 03 General office clerks 966 3272 03 Authors journalists and linguists 335 1135 03 Hairdressers beauticians and related workers 806 2796 03
Labour shortages and surpluses 2017
2017 46
Directorate-General for Employment Social Affairs and Inclusion European Network of Public Employment Services (PES)
ISCO-08 title
2015
UE
Recruited in the
last year (lt12
months)
Ratio of UE to new recruits
Animal producers 189 660 03 Other elementary workers 976 3401 03 Machinery mechanics and repairers 1134 3962 03 Ship and aircraft controllers and technicians 80 281 03 Hotel and restaurant managers 344 1220 03 Cashiers and ticket clerks 908 3220 03 Retail and wholesale trade managers 224 809 03 Sales marketing and development managers 311 1124 03 Physical and engineering science technicians 1204 4366 03 Administrative and specialised secretaries 1106 4040 03 Sales and purchasing agents and brokers 1294 4754 03 Rubber plastic and paper products machine operators 256 941 03 Artistic cultural and culinary associate professionals 511 1906 03 Numerical clerks 944 3532 03 Other services managers 184 691 03 Child care workers and teachers aides 1335 5005 03 Heavy truck and bus drivers 1426 5349 03 Business services and administration managers 383 1439 03 Information and communications technology service managers 67 257 03 Regulatory government associate professionals 209 807 03 Life science professionals 176 681 03 Wood processing and papermaking plant operators 97 379 03 Locomotive engine drivers and related workers 46 179 03 Legal professionals 315 1245 03 Personal care workers in health services 2195 8787 02 Physical and earth science professionals 85 345 02 Street vendors (excluding food) 50 204 02 Architects planners surveyors and designers 515 2092 02 Other clerical support workers 901 3657 02 Business services agents 510 2114 02 Manufacturing mining construction and distribution managers 361 1507 02 Tellers money collectors and related clerks 381 1612 02 Librarians archivists and curators 58 248 02 Medical and pharmaceutical technicians 255 1099 02 University and higher education teachers 301 1333 02 Information and communications technology operations and user support technicians
418 1888 02
Legal social and religious associate professionals 920 4348 02 Financial and mathematical associate professionals 601 2852 02 Sales marketing and public relations professionals 865 4172 02 Finance professionals 472 2281 02 Engineering professionals (excluding electrotechnology) 635 3118 02 Other health associate professionals 531 2657 02
Social and religious professionals 460 2317 02 Professional services managers 176 891 02 Nursing and midwifery associate professionals 556 2855 02 Legislators and senior officials 53 286 02 Database and network professionals 83 455 02 Administration professionals 641 3673 02 Primary school and early childhood teachers 575 3345 02 Electrotechnology engineers 142 827 02 Secondary education teachers 471 2812 02 Other health professionals 346 2083 02 Nursing and midwifery professionals 273 1760 02 Software and applications developers and analysts 631 4159 02 Medical doctors 293 1944 02 No occupation 152894 00
No answer 2531 578 44 Total 249561 294937 08
Labour shortages and surpluses 2017
2017 47
Directorate-General for Employment Social Affairs and Inclusion European Network of Public Employment Services (PES)
HOW TO OBTAIN EU PUBLICATIONS
Free publications
bull one copy
via EU Bookshop (httpbookshopeuropaeu)
bull more than one copy or postersmaps
from the European Unionrsquos representations (httpeceuropaeurepresent_enhtm)
from the delegations in non-EU countries
(httpeeaseuropaeudelegationsindex_enhtm)
by contacting the Europe Direct service (httpeuropaeueuropedirectindex_enhtm)
or calling 00 800 6 7 8 9 10 11 (free phone number from anywhere in the EU) () () The information given is free as are most calls (though some operators phone boxes or hotels may charge you)
Priced publications
bull via EU Bookshop (httpbookshopeuropaeu)
Priced subscriptions
bull via one of the sales agents of the Publications Office of the European Union
(httppublicationseuropaeuothersagentsindex_enhtm)
doi 10276731262
KE-0
1-1
8-2
63-E
N-N
[Ca
talo
gu
e n
um
be
r]
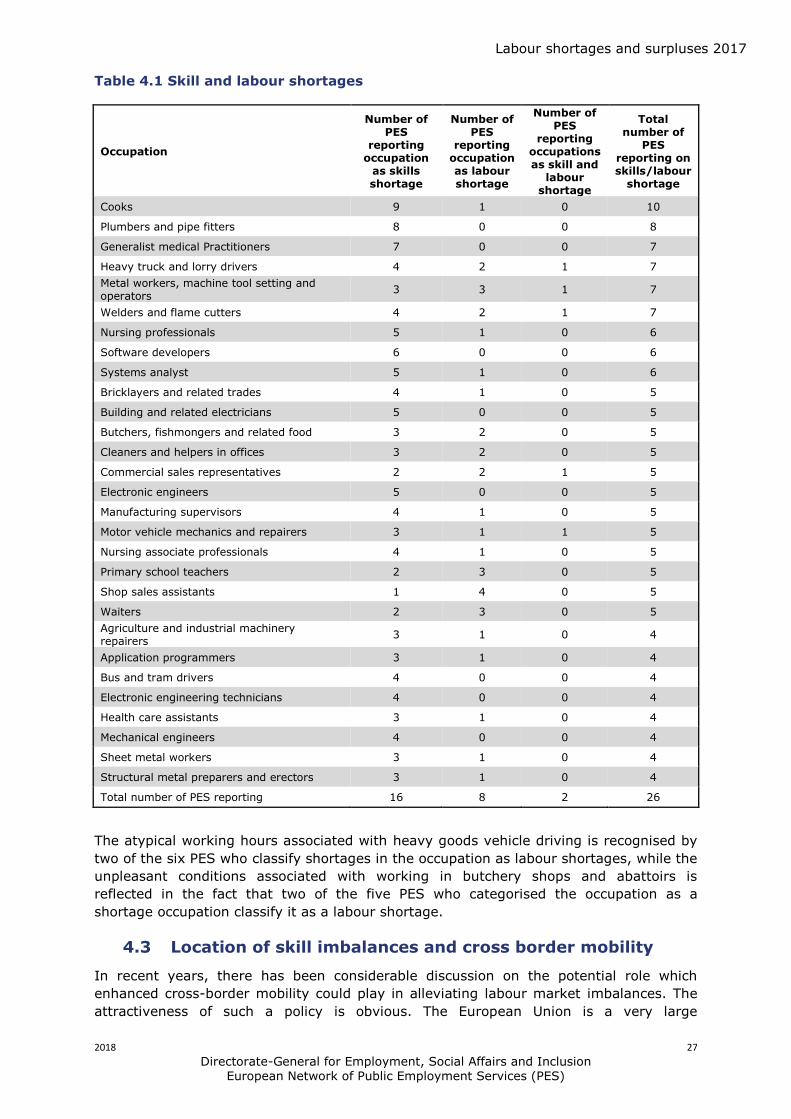
Labour shortages and surpluses 2017
2018 28
Directorate-General for Employment Social Affairs and Inclusion European Network of Public Employment Services (PES)
marketplace embracing a very large labour force if even some of the shortages which
are reported by EEA countries could be resolved by exploiting the surpluses which are
reported by other EEA countries it could form the basis of a number of win-win solutions
for both job-seekers and businesses
An additional attraction of this policy is that it could potentially successfully address both
skills and labour shortages as working conditions associated with some labour shortages
in one country might be perceived as significantly more attractive in a different EEA
country
Table 44 provides a list of the top twenty shortage occupations which have at least one
PES in another EEA country reporting the occupation as a surplus
There are a number of aspects of the Table which are notable Firstly the list of top
occupations has changed quite dramatically from the list in Table 21 specifically none
of the professional and associate professional occupations are now on the list including
the four professional and associate professional health-related occupations or the two
professional software occupations What the Table shows is that there are no surpluses
reported in any of the EEA countries of doctors or nurses software developers or
systems analysts While the occupation of healthcare assistants is in surplus in many
countries it was not included in the list of top occupations because it was reported as a
shortage by only two PES
The figures in Table 42 show that there are three cross-border matching possibilities in
the case of bricklayers and motor mechanics and two possibilities in the case of
plasterers health care assistants and secondary school teachers
There is just one matching possibility in respect of a wide range of occupations including
cooks truck drivers commercial sales representatives electricians carpenters civil
engineers primary school teachers manufacturing supervisors telecentre salespersons
childhood education teachers floor layers and roofers
The fact that primary school teachers have only one cross border matching possibility
suggest that the classification of the occupation as a labour shortage by three of five PES
is an error In general labour shortages would be expected to have more cross border
matching possibilities than skill shortages because there are many job-seekers eligible to
work in the occupation in question and working conditions vary quite significantly from
country to country Indeed it is notable that the two other occupations which were
classified by the PES as predominantly labour shortages waiters and shop sales
assistants have a relatively high number of matching possibilities eight in the case of
shop sales assistants and three in the case of waiters
In general the PES did not classify the same occupation as both a shortage and a
surplus A striking exception is the Danish PES which categorised four of its shortage
occupations as surplus occupations also This is most likely due to the higher level of
granularity available in the Danish data (below 4-digit) so that some job titles within an
occupation are considered labour shortage while others skill shortage
44 Assessing gender composition of surpluses
The PES were asked to estimate the share of females in the occupations which they
identified as lsquosurplusrsquo occupations The restricting of this question to surplus occupations
was to avoid giving the impression that shortages were arising because of discriminatory
recruitment policies
Labour shortages and surpluses 2017
2018 29
Directorate-General for Employment Social Affairs and Inclusion European Network of Public Employment Services (PES)
A total of 13 PES reported any data on gender composition of surpluses However the
quality of information submitted did not provide a sufficient basis for an accurate
estimation of the gender composition of surpluses in some of the cases
It is suggested that in order to address gender imbalances in relation to shortages and
surpluses data from PES on job seekers should be combined with the LSF data on
employment by occupation
45 Conclusions
The analysis in chapter four has produced a number of interesting findings The analysis
reveals that the PES in general has the capacity to distinguish between skill and labour
shortages and to identify shortage occupations which have some cross-border matching
possibilities
The relatively low number of surplus occupations reflects two factors firstly only
eighteen PES submitted a list of surplus occupations and secondly in many cases the
lists did not include the maximum number of twenty occupations which were requested
This response has to be viewed against the background of an EEA labour market where
employment is expanding and unemployment is contracting However while this is a
positive development the relatively low number of surplus occupations has placed a
significant limit on the extent to which there were cross-border possibilities of matching
shortage with surplus occupations
The data indicates that there is a limitation to the extent to which the PES can be used to
identify the gender imbalances (eg under-representation of females in some
occupations) and that other sources should be explored
Labour shortages and surpluses 2017
2018 30
Directorate-General for Employment Social Affairs and Inclusion European Network of Public Employment Services (PES)
Table 43 The potential for cross-border matching of shortage and surplus occupations
No PES
Occupation PES reporting shortage PES reporting surplus No PES
16 Cooks AT Art BG CY DK HR IE IS IT MT NL NO PT SE SI SK lsaquo―rsaquo HU 1
11 Truck drivers ART VDAB BG DK HR LT IT NL NO PT SE SI SK lsaquo―rsaquo DK 1
10 Cleaners helpers CY DK HR FI IS HU NL NO PT SI lsaquo―rsaquo DK LF NL IE 4
10 Commercial sales VDAB ART DK FI FR IT IE PT PL SI lsaquo―rsaquo DK 1
9 Sales assistants AT ART BG CY DK IT NO SI SK lsaquo―rsaquo DK LF SE NL BG CH FI IE 8
9 Bricklayers ART DE DK HR HU LT NL PT SI lsaquo―rsaquo CY HU IE 3
9 Motor mechanics AT VDAB ART LF DK IT NO PT SI lsaquo―rsaquo SK CH EE 3
9 Waiters ART BG CY IS IT MT NO PT SI lsaquo―rsaquo HU EE IE 3
9 Electricians ART VDAB DE DK IS IT NL NO SI lsaquo―rsaquo FR 1
8 Carpenters DK HR HU FI NL NO PT SI lsaquo―rsaquo HU 1
8 Civil engineers ART CH DE FI FR NO SE SI lsaquo―rsaquo CY 1
8 Primary teachers ART BG DK IS NO SE SI SK lsaquo―rsaquo CY 1
7 Healthcare assist CY DK EE NL NO SI SK lsaquo―rsaquo DK NL 2
7 Second teacher ART BG FR NL NO SI SK lsaquo―rsaquo CY FI 2
7 Man supervisors ART VDAB LF DE EE FR SK lsaquo―rsaquo BG 1
6 Plasterers HR HU FI LT NL SI lsaquo―rsaquo HU IE 2
6 Tele centre sales ART HU FI FR MT NO lsaquo―rsaquo EE 1
6 Childhood educ FI LT NO SE SI SK lsaquo―rsaquo CY 1
6 Floor layers HU HR FI FR LT LV lsaquo―rsaquo HU 1
6 Roofers HR FI FR LT LV SI lsaquo―rsaquo HU 1
Bottlenecks Occupations 2017
2017 31
Directorate-General for Employment Social Affairs and Inclusion European Network of Public Employment Services (PES)
5 CONCLUSIONS AND RECOMMENDATIONS
51 Conclusions
The terms of reference for this study emphasise the desirability of creating a process for
the systematic collection of data on surplus and shortage occupations in the EEA area
which could be effectively used by EURES for cross border matching of shortage
occupations in some EEA countries with surplus occupations in others
The authors have responded to this emphasis by using a process which ensures that the
data gathered on shortage and surplus occupations is comprehensive accurate and of
practical use to EURES and the providers of education and training programmes The
process is comprehensive because it gathers information both on the extent of shortages
and surpluses and on their relative severity It is accurate because the list of shortage
and surplus occupations are shown to be consistent with the estimated value of the ratio
of unemployed to new hires Finally the process provides information which is of
practical use to EURES and the national providers of VET because the data gathered is on
individual occupations rather than on lsquobundles of occupationsrsquo as in previous studies The
analyses in this report shows that while these bundles of occupations contain some
occupations which are identified by the PES as shortage and surplus occupations they
also contain occupations which are neither in shortage nor in surplus and it is impossible
to distinguish one from the other
The data gathering process used in this report however was not devoid of weaknesses
Fortunately these weaknesses reflect the modus operandi of the PES and may be
rectified by including other institutions and agencies in the process For example the PES
use the same sources for the identification of both shortage and surplus occupations
This may have advantages in terms of accuracy when those sources include employersrsquo
surveys immigration data and the results of forecasting exercises However these
sources are not suitable for gathering data on surplus occupations and they are the main
reason why the number of surplus occupations provided by the PES were almost half the
number requested In the future PES data could be augmented by data gathered by
other bodies as outlined in recent EU Regulation 2016589
In addition the response to the question on the capacity of the PES to deliver data on
shortage and surplus occupations at a regional level was also disappointing perhaps
reflecting a misalignment in some EEA countries between the geographic configuration of
the local PES network and the NUTs regions
The analysis highlighted that in order to assess gender imbalances of shortages and
surpluses PES data needs to be augmented by other sources
Finally despite the low number of surplus occupations submitted by the PES it was
nevertheless possible to identify twenty shortage occupations in the EEA labour market
which had at least one cross-border matching possibility and many more than one in the
case of some shortage occupations
52 Recommendations
Based on the findings from the three bottleneck studies undertaken to date a model for
the gathering of data on shortages and surpluses is proposed (Figure 51) The model
includes features of the methodology applied in this study which were successful It also
includes a number of features which should be introduced to the process in order to
address some of the weaknesses which were identified in this study (highlighted in red)
Labour shortages and surpluses 2017
2017 32
Directorate-General for Employment Social Affairs and Inclusion European Network of Public Employment Services (PES)
However before this methodology is implemented it would be prudent to discuss data
requirements with PES and invite a broader range of institutions and agencies to
participate in aspects of the data gathering process in addition to the PES EURES
Regulation (EU) 2016589 of the European Parliament and of the Council which obliges
the appropriate national authorities to furnish such data annually is fortuitous in this
regard and should facilitate the implementation of this recommendation
In addition the results of these and other relevant studies should be disseminated to
PES Eures coordination group and other relevant agencies and institutions in order to
emphasise the importance of data and analysis in informing policy at EU and national
level which aims to resolve labour market imbalances
Labour shortages and surpluses 2017
2017 33
Directorate-General for Employment Social Affairs and Inclusion European Network of Public Employment Services (PES)
Figure 51 Model for gathering data on shortage and surplus occupations
Sources of data on surpluses PES data from other relevant agencies
In those cases where the source used by the PES to identify shortage occupations cannot
be used to identify surplus occupations other institutions or other sources or both should be availed of to ensure that comprehensive data on surplus occupations are provided to the appropriate national authority
Dimensions of shortagessurpluses extent (number of reporting PES) and severity (high or low
magnitude)
Data should be systematically gathered on both the extent of shortage and surplus
occupations in the EEA and on their relative severity
Type of shortage skill vs labour shortages
The providers of the data on shortage occupations must also distinguish between skill and labour shortages because this distinction is necessary for the accurate identification of
shortage occupations and for the choice of the appropriate policy response to identified shortages
Classification of occupations used ISCO 08 4-digit codes (or translation into these codes)
All data should be either initially gathered in ISCO 08 4-digit codes or translated into these
codes This ensures that the data refers to specific individual occupations and is of practical use to EURES and the national providers of VET
Accuracy test cross-check with LSF data (ratio of unemployed to new hires)
The accuracy of the submitted lists of shortage and surplus occupations should be assessed
by comparing the most widely reported surplus and shortage occupations with the estimated values of the ratios of employed (by previous occupation) to new hires at the aggregated EU28 level These ratios should be based on an analysis of the most up-to date
Labour Force Survey (LFS) data
Gender balance assessment LFS data on employment at occupational level by gender PES job
seekers
The gender composition of shortage and surplus occupations should be based on the most
up to date analyses of LFS data on employment by gender and the PES job seeker data
Regional balance assessment LSF data data from relevant agencies
Where regional data is required other agencies and institutions should be requested to
provide the data in those cases where the data cannot be provided by the regional PES network because it is not geographically aligned to the NUTs regions
Labour shortages and surpluses 2017
2017 34
Directorate-General for Employment Social Affairs and Inclusion European Network of Public Employment Services (PES)
Number of occupations reporting should be extended beyond 20 occupations but with upper
limit (eg 50)
Consideration should be given to allowing the agencies responsible for identifying shortage
and surplus occupations a greater range of flexibility in terms of the numbers of occupations which should be identified A minimum to maximum range would be a more realistic approach as it would reflect the fact that the labour markets of the EEA vary significantly in size and performance
Timing of imbalance assessment September
It is proposed that the data gathering exercise should be brought forward to early September and that expert advice should be available on line throughout the data
gathering exercise
Labour shortages and surpluses 2017
2017 35
Directorate-General for Employment Social Affairs and Inclusion European Network of Public Employment Services (PES)
ANNEX 1 DATA COLLECTION TEMPLATE Information sought Explanation
Occupation title (text) Type in free text a list of occupations (one row one occupation) for which shortages and surpluses exist first list occupations for which there is a shortage the list should contain a maximum of 20 occupations if your list contains less than 20 occupations please provide a brief explanation in your email response for why the number is lower than 20 second list occupations for which there is a surplus the list should contain a maximum of 20 occupations if your list contains less than 20 occupations please provide a brief explanation in your email response for why the number is lower than 20
Shortagesurplus indicator For each occupation indicate if it refers to a shortage by typing in shortage or surplus by typing in surplus to identify surplus occupations you can examine for each occupation the ratio of the number of job seekers to the number of vacancies at the end of each year for example if there are 5000 shop assistants seeking employment and there are 200 vacancies at the end of the reference period the ratio is 251 you can rank the calculated ratios and report the occupations associated with the 20 highest ratios
Occupational classification used in your country
For each occupation indicate what occupational classification (if any) was used to identify this occupation for instance you can report a country specific classification ISCO ROME SOC etc If you donrsquot use occupational classifications type None
Occupation code to the lowest level of disaggregation (eg ISCO at 4 digits)
If you have indicated a classification used type the code for each occupation use the lowest level of disaggregation (eg 4 digit ISCO code) if you donrsquot use occupational classification leave black
ISCO-08 code at 4-digit level (or lower if 4-digit not available)
If you use occupational classification which is not ISCO-08 and if it is possible provide a translation of the national code to ISCO-08 code ISCO is the International Standard Classification of Occupations which is used to report to Eurostat code should be at 4 digits if this is not available than the lowest level of disaggregation that is available should be reported (3 digits if 4-digit code is not available 2 digits if neither 4-digit nor 3-digit code is available 1 digit if neither 4-digit 3-digit nor 2-digit code is available) if it is not possible to provide translation to ISCO-08 leave black if you have already reported ISCO-08 code in column 3 leave this column black
Estimate of shortagesurplus magnitude (high (gt3 of employment) medium (1-3 of employment) low (lt1 of employment))
For each occupation indicate a broad estimate of the magnitude of the shortagesurplus if you estimate that the shortagesurplus is less than 1 of the total employment in the occupation in question type low if between 1-3 type medium if greater than 3 type high if you cannot provide a rough estimate of magnitude type dont know
Current shortagesurplus (C) future short term (FST) future medium term (FMT) future long term (FLT) donrsquot know (indicate all that apply)
Against each occupation indicate if the identified shortagesurplus refers to present situation by typing C if the shortage is expected to occur in the short term future ie within 12 months by typing FST if it is expected to occur over the medium term (within 1-5 years) by typing FMT if it is expected to occur in the long term (in 5 or more years) by typing FLT if more than one time period applies indicate all relevant ones (eg for current shortagessurpluses that are expected to persist over the short term type C FST) if you dont know type dont know
Source of information on shortagessurpluses (eg PES administrative data (vacancies job seekers) PES survey third party survey Occupational forecasts other (specify) etc)
Indicate the source used to identify shortagesurplus for this occupation did you derive it from the PES administrative data on PES vacancies andor job seekers did you conduct a survey did you commission a third party to conduct a survey for you did you have occupational forecasts available did you use other research type in free text the full description of the source(s) eg National Employment Survey conducted by PES etc
Labour shortages and surpluses 2017
2017 36
Directorate-General for Employment Social Affairs and Inclusion European Network of Public Employment Services (PES)
Date for source of information Indicate the year that the information on shortagessurpluses (column 7) refers to eg type 2016 for a survey of difficult to fill vacancies conducted in 2016 even if the report was published in 2017
What indicator(s) suggested that there is a shortagesurplus
Indicate what criteria was used to conclude that this occupation is associated with a shortagesurplus for instance employers views sourcing from abroad to fill vacancies growth in employment faster than growth in educationtraining output time required to fill
vacancies higher than average etc
Share of females among job seekers in this occupation (surplus occupations only)
Indicate the percentage share of females among all job seekers in this occupation this is only applicable to surplus occupations
Skill or labour shortage Indicate if a shortage refers to a skill or labour shortage a skill shortage occurs where there is an insufficient supply of persons with the appropriate skills labour shortages occur where there is a sufficient number of skilled persons however an insufficient number of them is willing to take up employment in the occupation in question
Indicate the availability of data on shortagessurpluses at regional level (NUTS1 NUTS2 NUTS3 No data)
Indicate if data is available on the regional breakdown of shortagessurpluses by indicating the level of regional data available if multiple levels of regional disaggregation are available indicate the lowest level of disaggregation (eg NUTS3 rather than NUTS2) if there is no regional data available use no data
Labour shortages and surpluses 2017
2017 37
Directorate-General for Employment Social Affairs and Inclusion European Network of Public Employment Services (PES)
ANNEX 2 SHORTAGE OCCUPATIONS
Shortage occupation PES count
Cooks 16 Plumbers and pipe fitters 13 Generalist medical practitioners 12 Welders and flamecutters 12 Heavy truck and lorry drivers 11 Metal working machine tool setters and operators 11 Nursing professionals 11 Software developers 11 Agricultural and industrial machinery mechanics and repairers 10 Cleaners and helpers in offices hotels and other establishments 10 Commercial sales representatives 10 Specialist medical practitioners 10 Systems analysts 10 Bricklayers and related workers 9 Building and related electricians 9 Butchers fishmongers and related food preparers 9 Motor vehicle mechanics and repairers 9 Nursing associate professionals 9 Sheet-metal workers 9 Shop sales assistants 9 Waiters 9 Carpenters and joiners 8 Civil engineers 8 Concrete placers concrete finishers and related workers 8 Electrical engineering technicians 8 Electronics engineering technicians 8 Mechanical engineers 8 Primary school teachers 8 Structural-metal preparers and erectors 8 Electronics engineers 7
Health care assistants 7 Manufacturing supervisors 7 Mechanical engineering technicians 7 Secondary education teachers 7 Accountants 6 Applications programmers 6 Bus and tram drivers 6 Contact centre salespersons 6 Early childhood educators 6 Electrical mechanics and fitters 6 Floor layers and tile setters 6 Plasterers 6 Roofers 6 Sewing machine operators 6 Software and applications developers and analysts not elsewhere classified 6 Toolmakers and related workers 6 Web and multimedia developers 6 Air conditioning and refrigeration mechanics 5 Building frame and related trades workers not elsewhere classified 5 Chefs 5 Civil engineering labourers 5 Construction supervisors 5 Earthmoving and related plant operators 5 Electrical engineers 5 Electrical line installers and repairers 5 Engineering professionals not elsewhere classified 5 Hairdressers 5 Information and communications technology operations technicians 5 Manufacturing managers 5 Physiotherapists 5 Real estate agents and property managers 5 Research and development managers 5 Spray painters and varnishers 5 Accounting associate professionals 4 Bakers pastry-cooks and confectionery makers 4
Labour shortages and surpluses 2017
2017 38
Directorate-General for Employment Social Affairs and Inclusion European Network of Public Employment Services (PES)
Shortage occupation PES count
Blacksmiths hammersmiths and forging press workers 4 Civil engineering technicians 4 Crane hoist and related plant operators 4 Database designers and administrators 4 Industrial and production engineers 4 Painters and related workers 4 Physical and engineering science technicians not elsewhere classified 4 Plastic products machine operators 4 Social work and counselling professionals 4 Accounting and bookkeeping clerks 3 Administrative and executive secretaries 3 Ambulance workers 3 Building construction labourers 3 Car taxi and van drivers 3 Cartographers and surveyors 3 Cleaning and housekeeping supervisors in offices hotels and other establishments 3 Contact centre information clerks 3 Draughtspersons 3 Fast food preparers 3 Freight handlers 3 Gardeners horticultural and nursery growers 3 Home-based personal care workers 3 Hotel receptionists 3 Information and communications technology installers and servicers 3 Insulation workers 3 Kitchen helpers 3 Manufacturing labourers not elsewhere classified 3 Medical imaging and therapeutic equipment technicians 3 Metal moulders and coremakers 3 Metal polishers wheel grinders and tool sharpeners 3 Midwifery professionals 3 Other language teachers 3 Personal services workers not elsewhere classified 3
Pharmacists 3 Policy administration professionals 3 Printers 3 Process control technicians not elsewhere classified 3 Sales and marketing managers 3 Shop supervisors 3 Special needs teachers 3 Stock clerks 3 Supply distribution and related managers 3 Survey and market research interviewers 3 Systems administrators 3 Technical and medical sales professionals (excluding ICT) 3 Translators interpreters and other linguists 3 Transport clerks 3 Vocational education teachers 3 Advertising and marketing professionals 2 Audiologists and speech therapists 2 Bartenders 2 Beauticians and related workers 2 Cashiers and ticket clerks 2 Chemical engineers 2 Child care workers 2 Computer network and systems technicians 2 Computer network professionals 2 Construction managers 2 Craft and related workers not elsewhere classified 2 Credit and loans officers 2 Crop farm labourers 2 Database and network professionals not elsewhere classified 2 Dentists 2 Domestic cleaners and helpers 2 Door to door salespersons 2 Driving instructors 2 Electrical and electronic equipment assemblers 2 Electronics mechanics and servicers 2 Elementary workers not elsewhere classified 2 Employment agents and contractors 2
Labour shortages and surpluses 2017
2017 39
Directorate-General for Employment Social Affairs and Inclusion European Network of Public Employment Services (PES)
Shortage occupation PES count
Field crop and vegetable growers 2 Financial analysts 2 Financial and investment advisers 2 Forestry and related workers 2 Garbage and recycling collectors 2 General office clerks 2 Graphic and multimedia designers 2 Information and communications technology service managers 2 Insurance representatives 2 Locomotive engine drivers 2 Mail carriers and sorting clerks 2 Management and organization analysts 2 Mathematicians actuaries and statisticians 2 Mechanical machinery assemblers 2 Medical and dental prosthetic technicians 2 Medical assistants 2 Messengers package deliverers and luggage porters 2 Metal finishing plating and coating machine operators 2 Metal processing plant operators 2 Optometrists and ophthalmic opticians 2 Personal care workers in health services not elsewhere classified 2 Police officers 2 Policy and planning managers 2 Production clerks 2 Restaurant managers 2 Retail and wholesale trade managers 2 Sales workers not elsewhere classified 2 Sewing embroidery and related workers 2 Street food salespersons 2 Tailors dressmakers furriers and hatters 2 Telecommunications engineers 2 Advertising and public relations managers 1 Aged care services managers 1
Agricultural technicians 1 Aircraft engine mechanics and repairers 1 Aircraft pilots and related associate professionals 1 Assemblers not elsewhere classified 1 Authors and related writers 1 Bank tellers and related clerks 1 Bleaching dyeing and fabric cleaning machine operators 1 Bookmakers croupiers and related gaming workers 1 Business services agents not elsewhere classified 1 Buyers 1 Cabinet-makers and related workers 1 Cement stone and other mineral products machine operators 1 Chemical and physical science technicians 1 Chemical engineering technicians 1 Chemical processing plant controllers 1 Chemical products plant and machine operators 1 Chemists 1 Conference and event planners 1 Customs and border inspectors 1 Data entry clerks 1 Dental assistants and therapists 1 Dieticians and nutritionists 1 Dispensing opticians 1 Domestic housekeepers 1 Economists 1 Education methods specialists 1 Environmental and occupational health and hygiene professionals 1 Environmental and occupational health inspectors and associates 1 Fibre preparing spinning and winding machine operators 1 Finance managers 1 Financial and insurance services branch managers 1 Fire-fighters 1 Fitness and recreation instructors and program leaders 1 Food and beverage tasters and graders 1 Food and related products machine operators 1
Labour shortages and surpluses 2017
2017 40
Directorate-General for Employment Social Affairs and Inclusion European Network of Public Employment Services (PES)
Shortage occupation PES count
Food service counter attendants 1 Forestry labourers 1 Fruit vegetable and related preservers 1 Fur and leather preparing machine operators 1 Glass and ceramics plant operators 1 Hand launderers and pressers 1 Hand packers 1 Handicraft workers in textile leather and related materials 1 Health associate professionals not elsewhere classified 1 Health professionals not elsewhere classified 1 House builders 1 Human resource managers 1 Incinerator and water treatment plant operators 1 Information and communications technology user support technicians 1 Judges 1 Lawyers 1 Legal and related associate professionals 1 Legal professionals not elsewhere classified 1 Library clerks 1 Lifting truck operators 1 Livestock and dairy producers 1 Livestock farm labourers 1 Medical and pathology laboratory technicians 1 Medical secretaries 1 Metal production process controllers 1 Mining and quarrying labourers 1 Mining engineers metallurgists and related professionals 1 Mixed crop and animal producers 1 Mixed crop growers 1 Motorcycle drivers 1 Odd job persons 1 Other cleaning workers 1 Other music teachers 1
Paper products machine operators 1 Personnel and careers professionals 1 Personnel clerks 1 Pet groomers and animal care workers 1 Physicists and astronomers 1 Physiotherapy technicians and assistants 1 Potters and related workers 1 Power production plant operators 1 Prison guards 1 Product and garment designers 1 Psychologists 1 Pulp and papermaking plant operators 1 Railway brake signal and switch operators 1 Receptionists (general) 1 Refuse sorters 1 Riggers and cable splicers 1 Scribes and related workers 1 Secretaries (general) 1 Securities and finance dealers and brokers 1 Security guards 1 Senior government officials 1 Senior officials of special-interest organizations 1 Shelf fillers 1 Ships engineers 1 Shoemaking and related machine operators 1 Social work associate professionals 1 Stall and market salespersons 1 Stationary plant and machine operators not elsewhere classified 1 Stonemasons stone cutters splitters and carvers 1 Street and related service workers 1 Sweepers and related labourers 1 Teaching professionals not elsewhere classified 1 Telecommunications engineering technicians 1 Textile fur and leather products machine operators not elsewhere classified 1 Trade brokers 1 Travel attendants and travel stewards 1 Travel guides 1
Labour shortages and surpluses 2017
2017 41
Directorate-General for Employment Social Affairs and Inclusion European Network of Public Employment Services (PES)
Shortage occupation PES count
Tree and shrub crop growers 1 Underwater divers 1 University and higher education teachers 1 Vehicle cleaners 1 Veterinarians 1 Weaving and knitting machine operators 1 Web technicians 1 Wood processing plant operators 1 Woodworking-machine tool setters and operators 1
Labour shortages and surpluses 2017
2017 42
Directorate-General for Employment Social Affairs and Inclusion European Network of Public Employment Services (PES)
ANNEX 3 SURPLUS OCCUPATIONS
Surplus occupation PES count
General office clerks 8 Shop sales assistants 8 Advertising and marketing professionals 6 Bank tellers and related clerks 6 Sociologists anthropologists and related professionals 6 Child care workers 5 Hairdressers 5 Journalists 5 Cashiers and ticket clerks 4 Cleaners and helpers in offices hotels and other establishments 4 Hand packers 4 Mail carriers and sorting clerks 4 Photographers 4 Receptionists (general) 4 Tailors dressmakers furriers and hatters 4 Accounting and bookkeeping clerks 3 Administrative and executive secretaries 3 Beauticians and related workers 3 Biologists botanists zoologists and related professionals 3 Bricklayers and related workers 3 Broadcasting and audio-visual technicians 3 Civil engineering labourers 3 Economists 3 Gardeners horticultural and nursery growers 3 Interior designers and decorators 3 Kitchen helpers 3 Legal professionals not elsewhere classified 3 Manufacturing labourers not elsewhere classified 3 Motor vehicle mechanics and repairers 3
Musicians singers and composers 3 Other artistic and cultural associate professionals 3 Painters and related workers 3 Philosophers historians and political scientists 3 Security guards 3 Sweepers and related labourers 3 Travel consultants and clerks 3 Waiters 3 Actors 2 Archivists and curators 2 Bakers pastry-cooks and confectionery makers 2 Bartenders 2 Building construction labourers 2 Business services and administration managers not elsewhere classified 2 Cabinet-makers and related workers 2 Car taxi and van drivers 2 Chemists 2 Cleaning and housekeeping supervisors in offices hotels and other establishments 2 Credit and loans officers 2 Customs and border inspectors 2 Elementary workers not elsewhere classified 2 Film stage and related directors and producers 2 Financial analysts 2 Forestry and related workers 2 Freight handlers 2 Graphic and multimedia designers 2 Health care assistants 2 Hotel receptionists 2 Lawyers 2 Legal and related associate professionals 2 Library clerks 2 Livestock and dairy producers 2 Management and organization analysts 2 Messengers package deliverers and luggage porters 2 Odd job persons 2 Office supervisors 2 Plasterers 2
Labour shortages and surpluses 2017
2017 43
Directorate-General for Employment Social Affairs and Inclusion European Network of Public Employment Services (PES)
Surplus occupation PES count
Police officers 2 Pre-press technicians 2 Print finishing and binding workers 2 Printers 2 Prison guards 2 Product and garment designers 2 Psychologists 2 Public relations professionals 2 Religious professionals 2 Secondary education teachers 2 Secretaries (general) 2 Social work and counselling professionals 2 Stall and market salespersons 2 Stock clerks 2 Teachers aides 2 Telephone switchboard operators 2 Travel guides 2 Visual artists 2 Advertising and public relations managers 1 Agricultural technicians 1 Announcers on radio television and other media 1 Assemblers not elsewhere classified 1 Building and related electricians 1 Building architects 1 Building caretakers 1 Building frame and related trades workers not elsewhere classified 1 Business services agents not elsewhere classified 1 Buyers 1 Carpenters and joiners 1 Chemical engineers 1 Civil engineers 1 Clearing and forwarding agents 1 Clerical support workers not elsewhere classified 1
Commercial sales representatives 1 Conference and event planners 1 Contact centre information clerks 1 Contact centre salespersons 1 Cooks 1 Crane hoist and related plant operators 1 Creative and performing artists not elsewhere classified 1 Dancers and choreographers 1 Data entry clerks 1 Database designers and administrators 1 Domestic cleaners and helpers 1 Domestic housekeepers 1 Draughtspersons 1 Driving instructors 1 Early childhood educators 1 Electronics mechanics and servicers 1 Farming forestry and fisheries advisers 1 Fashion and other models 1 Fast food preparers 1 Field crop and vegetable growers 1 Filing and copying clerks 1 Finance managers 1 Financial and insurance services branch managers 1 Financial and investment advisers 1 Fire-fighters 1 Fitness and recreation instructors and program leaders 1 Floor layers and tile setters 1 Food service counter attendants 1 Fruit vegetable and related preservers 1 Gallery museum and library technicians 1 Garbage and recycling collectors 1 Garment and related pattern-makers and cutters 1 Glass and ceramics plant operators 1 Government tax and excise officials 1 Hand launderers and pressers 1
Labour shortages and surpluses 2017
2017 44
Directorate-General for Employment Social Affairs and Inclusion European Network of Public Employment Services (PES)
Surplus occupation PES count
Heavy truck and lorry drivers 1 House builders 1 Hunters and trappers 1 Information and communications technology installers and servicers 1 Information and communications technology user support technicians 1 Insurance representatives 1 Jewellery and precious-metal workers 1 Judges 1 Legal secretaries 1 Librarians and related information professionals 1 Life science technicians (excluding medical) 1 Lifting truck operators 1 Managing directors and chief executives 1 Manufacturing supervisors 1 Medical and dental prosthetic technicians 1 Metal moulders and coremakers 1 Mining and quarrying labourers 1 Mixed crop and animal producers 1 Mixed crop growers 1 Mobile farm and forestry plant operators 1 Musical instrument makers and tuners 1 Other language teachers 1 Pawnbrokers and money-lenders 1 Personnel and careers professionals 1 Pet groomers and animal care workers 1 Photographic products machine operators 1 Physical and engineering science technicians not elsewhere classified 1 Physicists and astronomers 1 Police inspectors and detectives 1 Precision-instrument makers and repairers 1 Primary school teachers 1 Process control technicians not elsewhere classified 1 Product graders and testers (excluding foods and beverages) 1
Production clerks 1 Professional services managers not elsewhere classified 1 Protective services workers not elsewhere classified 1 Research and development managers 1 Retail and wholesale trade managers 1 Roofers 1 Sales workers not elsewhere classified 1 Senior government officials 1 Service station attendants 1 Shelf fillers 1 Shop supervisors 1 Social work associate professionals 1 Special needs teachers 1 Spray painters and varnishers 1 Statistical mathematical and related associate professionals 1 Stonemasons stone cutters splitters and carvers 1 Street food salespersons 1 Supply distribution and related managers 1 Teaching professionals not elsewhere classified 1 Technical and medical sales professionals (excluding ICT) 1 Training and staff development professionals 1 Translators interpreters and other linguists 1 Transport conductors 1 Tree and shrub crop growers 1 Typists and word processing operators 1 Undertakers and embalmers 1 Vocational education teachers 1 Weaving and knitting machine operators 1 Woodworking-machine tool setters and operators 1
Labour shortages and surpluses 2017
2017 45
Directorate-General for Employment Social Affairs and Inclusion European Network of Public Employment Services (PES)
ANNEX 4 THE RATIO OF UNEMPLOYED TO NEW HIRES
ISCO-08 title
2015
UE
Recruited in the
last year (lt12
months)
Ratio of UE to new recruits
Street and related service workers 85 104 08 Agricultural forestry and fishery labourers 3913 5343 07 Mining and construction labourers 1937 3525 05 Creative and performing artists 610 1115 05 Refuse workers 1036 1923 05 Painters building structure cleaners and related trades workers 1116 2117 05 Street and market salespersons 195 389 05 Building frame and related trades workers 3632 7353 05 Mining manufacturing and construction supervisors 626 1315 05 Ships deck crews and related workers 53 114 05 Market gardeners and crop growers 1471 3207 05 Managing directors and chief executives 304 667 05 Travel attendants conductors and guides 229 538 04 Wood treaters cabinet-makers and related trades workers 491 1159 04 Manufacturing labourers 1640 3909 04 Domestic hotel and office cleaners and helpers 5679 13545 04 Other stationary plant and machine operators 822 1961 04 Mobile plant operators 1038 2497 04 Building finishers and related trades workers 1519 3680 04 Textile fur and leather products machine operators 431 1048 04 Garment and related trades workers 422 1047 04 Chemical and photographic products plant and machine operators 157 389 04 Food processing and related trades workers 930 2330 04 Vehicle window laundry and other hand cleaning workers 291 754 04 Sheet and structural metal workers moulders and welders and related workers
996 2603 04
Waiters and bartenders 4399 11595 04 Cooks 1529 4039 04 Metal processing and finishing plant operators 208 557 04 Printing trades workers 203 548 04 Forestry and related workers 130 351 04 Protective services workers 1347 3658 04 Transport and storage labourers 2532 6939 04 Fishery workers hunters and trappers 46 128 04 Material-recording and transport clerks 1671 4630 04 Process control technicians 179 517 03 Mining and mineral processing plant operators 94 274 03 Telecommunications and broadcasting technicians 177 519 03 Blacksmiths toolmakers and related trades workers 816 2409 03 Building and housekeeping supervisors 678 2045 03
Secretaries (general) 1072 3259 03 Assemblers 850 2586 03 Other craft and related workers 258 810 03 Shop salespersons 6600 21042 03 Electrical equipment installers and repairers 958 3060 03 Food and related products machine operators 437 1400 03 Other sales workers 1087 3510 03 Food preparation assistants 1646 5337 03 Mixed crop and animal producers 387 1260 03 Car van and motorcycle drivers 1155 3764 03 Client information workers 1993 6531 03 Sports and fitness workers 605 1984 03 Handicraft workers 194 638 03 Life science technicians and related associate professionals 82 271 03 Keyboard operators 283 940 03 Electronics and telecommunications installers and repairers 290 963 03 Other personal services workers 313 1047 03 Vocational education teachers 279 940 03 Other teaching professionals 744 2518 03 General office clerks 966 3272 03 Authors journalists and linguists 335 1135 03 Hairdressers beauticians and related workers 806 2796 03
Labour shortages and surpluses 2017
2017 46
Directorate-General for Employment Social Affairs and Inclusion European Network of Public Employment Services (PES)
ISCO-08 title
2015
UE
Recruited in the
last year (lt12
months)
Ratio of UE to new recruits
Animal producers 189 660 03 Other elementary workers 976 3401 03 Machinery mechanics and repairers 1134 3962 03 Ship and aircraft controllers and technicians 80 281 03 Hotel and restaurant managers 344 1220 03 Cashiers and ticket clerks 908 3220 03 Retail and wholesale trade managers 224 809 03 Sales marketing and development managers 311 1124 03 Physical and engineering science technicians 1204 4366 03 Administrative and specialised secretaries 1106 4040 03 Sales and purchasing agents and brokers 1294 4754 03 Rubber plastic and paper products machine operators 256 941 03 Artistic cultural and culinary associate professionals 511 1906 03 Numerical clerks 944 3532 03 Other services managers 184 691 03 Child care workers and teachers aides 1335 5005 03 Heavy truck and bus drivers 1426 5349 03 Business services and administration managers 383 1439 03 Information and communications technology service managers 67 257 03 Regulatory government associate professionals 209 807 03 Life science professionals 176 681 03 Wood processing and papermaking plant operators 97 379 03 Locomotive engine drivers and related workers 46 179 03 Legal professionals 315 1245 03 Personal care workers in health services 2195 8787 02 Physical and earth science professionals 85 345 02 Street vendors (excluding food) 50 204 02 Architects planners surveyors and designers 515 2092 02 Other clerical support workers 901 3657 02 Business services agents 510 2114 02 Manufacturing mining construction and distribution managers 361 1507 02 Tellers money collectors and related clerks 381 1612 02 Librarians archivists and curators 58 248 02 Medical and pharmaceutical technicians 255 1099 02 University and higher education teachers 301 1333 02 Information and communications technology operations and user support technicians
418 1888 02
Legal social and religious associate professionals 920 4348 02 Financial and mathematical associate professionals 601 2852 02 Sales marketing and public relations professionals 865 4172 02 Finance professionals 472 2281 02 Engineering professionals (excluding electrotechnology) 635 3118 02 Other health associate professionals 531 2657 02
Social and religious professionals 460 2317 02 Professional services managers 176 891 02 Nursing and midwifery associate professionals 556 2855 02 Legislators and senior officials 53 286 02 Database and network professionals 83 455 02 Administration professionals 641 3673 02 Primary school and early childhood teachers 575 3345 02 Electrotechnology engineers 142 827 02 Secondary education teachers 471 2812 02 Other health professionals 346 2083 02 Nursing and midwifery professionals 273 1760 02 Software and applications developers and analysts 631 4159 02 Medical doctors 293 1944 02 No occupation 152894 00
No answer 2531 578 44 Total 249561 294937 08
Labour shortages and surpluses 2017
2017 47
Directorate-General for Employment Social Affairs and Inclusion European Network of Public Employment Services (PES)
HOW TO OBTAIN EU PUBLICATIONS
Free publications
bull one copy
via EU Bookshop (httpbookshopeuropaeu)
bull more than one copy or postersmaps
from the European Unionrsquos representations (httpeceuropaeurepresent_enhtm)
from the delegations in non-EU countries
(httpeeaseuropaeudelegationsindex_enhtm)
by contacting the Europe Direct service (httpeuropaeueuropedirectindex_enhtm)
or calling 00 800 6 7 8 9 10 11 (free phone number from anywhere in the EU) () () The information given is free as are most calls (though some operators phone boxes or hotels may charge you)
Priced publications
bull via EU Bookshop (httpbookshopeuropaeu)
Priced subscriptions
bull via one of the sales agents of the Publications Office of the European Union
(httppublicationseuropaeuothersagentsindex_enhtm)
doi 10276731262
KE-0
1-1
8-2
63-E
N-N
[Ca
talo
gu
e n
um
be
r]
Labour shortages and surpluses 2017
2018 29
Directorate-General for Employment Social Affairs and Inclusion European Network of Public Employment Services (PES)
A total of 13 PES reported any data on gender composition of surpluses However the
quality of information submitted did not provide a sufficient basis for an accurate
estimation of the gender composition of surpluses in some of the cases
It is suggested that in order to address gender imbalances in relation to shortages and
surpluses data from PES on job seekers should be combined with the LSF data on
employment by occupation
45 Conclusions
The analysis in chapter four has produced a number of interesting findings The analysis
reveals that the PES in general has the capacity to distinguish between skill and labour
shortages and to identify shortage occupations which have some cross-border matching
possibilities
The relatively low number of surplus occupations reflects two factors firstly only
eighteen PES submitted a list of surplus occupations and secondly in many cases the
lists did not include the maximum number of twenty occupations which were requested
This response has to be viewed against the background of an EEA labour market where
employment is expanding and unemployment is contracting However while this is a
positive development the relatively low number of surplus occupations has placed a
significant limit on the extent to which there were cross-border possibilities of matching
shortage with surplus occupations
The data indicates that there is a limitation to the extent to which the PES can be used to
identify the gender imbalances (eg under-representation of females in some
occupations) and that other sources should be explored
Labour shortages and surpluses 2017
2018 30
Directorate-General for Employment Social Affairs and Inclusion European Network of Public Employment Services (PES)
Table 43 The potential for cross-border matching of shortage and surplus occupations
No PES
Occupation PES reporting shortage PES reporting surplus No PES
16 Cooks AT Art BG CY DK HR IE IS IT MT NL NO PT SE SI SK lsaquo―rsaquo HU 1
11 Truck drivers ART VDAB BG DK HR LT IT NL NO PT SE SI SK lsaquo―rsaquo DK 1
10 Cleaners helpers CY DK HR FI IS HU NL NO PT SI lsaquo―rsaquo DK LF NL IE 4
10 Commercial sales VDAB ART DK FI FR IT IE PT PL SI lsaquo―rsaquo DK 1
9 Sales assistants AT ART BG CY DK IT NO SI SK lsaquo―rsaquo DK LF SE NL BG CH FI IE 8
9 Bricklayers ART DE DK HR HU LT NL PT SI lsaquo―rsaquo CY HU IE 3
9 Motor mechanics AT VDAB ART LF DK IT NO PT SI lsaquo―rsaquo SK CH EE 3
9 Waiters ART BG CY IS IT MT NO PT SI lsaquo―rsaquo HU EE IE 3
9 Electricians ART VDAB DE DK IS IT NL NO SI lsaquo―rsaquo FR 1
8 Carpenters DK HR HU FI NL NO PT SI lsaquo―rsaquo HU 1
8 Civil engineers ART CH DE FI FR NO SE SI lsaquo―rsaquo CY 1
8 Primary teachers ART BG DK IS NO SE SI SK lsaquo―rsaquo CY 1
7 Healthcare assist CY DK EE NL NO SI SK lsaquo―rsaquo DK NL 2
7 Second teacher ART BG FR NL NO SI SK lsaquo―rsaquo CY FI 2
7 Man supervisors ART VDAB LF DE EE FR SK lsaquo―rsaquo BG 1
6 Plasterers HR HU FI LT NL SI lsaquo―rsaquo HU IE 2
6 Tele centre sales ART HU FI FR MT NO lsaquo―rsaquo EE 1
6 Childhood educ FI LT NO SE SI SK lsaquo―rsaquo CY 1
6 Floor layers HU HR FI FR LT LV lsaquo―rsaquo HU 1
6 Roofers HR FI FR LT LV SI lsaquo―rsaquo HU 1
Bottlenecks Occupations 2017
2017 31
Directorate-General for Employment Social Affairs and Inclusion European Network of Public Employment Services (PES)
5 CONCLUSIONS AND RECOMMENDATIONS
51 Conclusions
The terms of reference for this study emphasise the desirability of creating a process for
the systematic collection of data on surplus and shortage occupations in the EEA area
which could be effectively used by EURES for cross border matching of shortage
occupations in some EEA countries with surplus occupations in others
The authors have responded to this emphasis by using a process which ensures that the
data gathered on shortage and surplus occupations is comprehensive accurate and of
practical use to EURES and the providers of education and training programmes The
process is comprehensive because it gathers information both on the extent of shortages
and surpluses and on their relative severity It is accurate because the list of shortage
and surplus occupations are shown to be consistent with the estimated value of the ratio
of unemployed to new hires Finally the process provides information which is of
practical use to EURES and the national providers of VET because the data gathered is on
individual occupations rather than on lsquobundles of occupationsrsquo as in previous studies The
analyses in this report shows that while these bundles of occupations contain some
occupations which are identified by the PES as shortage and surplus occupations they
also contain occupations which are neither in shortage nor in surplus and it is impossible
to distinguish one from the other
The data gathering process used in this report however was not devoid of weaknesses
Fortunately these weaknesses reflect the modus operandi of the PES and may be
rectified by including other institutions and agencies in the process For example the PES
use the same sources for the identification of both shortage and surplus occupations
This may have advantages in terms of accuracy when those sources include employersrsquo
surveys immigration data and the results of forecasting exercises However these
sources are not suitable for gathering data on surplus occupations and they are the main
reason why the number of surplus occupations provided by the PES were almost half the
number requested In the future PES data could be augmented by data gathered by
other bodies as outlined in recent EU Regulation 2016589
In addition the response to the question on the capacity of the PES to deliver data on
shortage and surplus occupations at a regional level was also disappointing perhaps
reflecting a misalignment in some EEA countries between the geographic configuration of
the local PES network and the NUTs regions
The analysis highlighted that in order to assess gender imbalances of shortages and
surpluses PES data needs to be augmented by other sources
Finally despite the low number of surplus occupations submitted by the PES it was
nevertheless possible to identify twenty shortage occupations in the EEA labour market
which had at least one cross-border matching possibility and many more than one in the
case of some shortage occupations
52 Recommendations
Based on the findings from the three bottleneck studies undertaken to date a model for
the gathering of data on shortages and surpluses is proposed (Figure 51) The model
includes features of the methodology applied in this study which were successful It also
includes a number of features which should be introduced to the process in order to
address some of the weaknesses which were identified in this study (highlighted in red)
Labour shortages and surpluses 2017
2017 32
Directorate-General for Employment Social Affairs and Inclusion European Network of Public Employment Services (PES)
However before this methodology is implemented it would be prudent to discuss data
requirements with PES and invite a broader range of institutions and agencies to
participate in aspects of the data gathering process in addition to the PES EURES
Regulation (EU) 2016589 of the European Parliament and of the Council which obliges
the appropriate national authorities to furnish such data annually is fortuitous in this
regard and should facilitate the implementation of this recommendation
In addition the results of these and other relevant studies should be disseminated to
PES Eures coordination group and other relevant agencies and institutions in order to
emphasise the importance of data and analysis in informing policy at EU and national
level which aims to resolve labour market imbalances
Labour shortages and surpluses 2017
2017 33
Directorate-General for Employment Social Affairs and Inclusion European Network of Public Employment Services (PES)
Figure 51 Model for gathering data on shortage and surplus occupations
Sources of data on surpluses PES data from other relevant agencies
In those cases where the source used by the PES to identify shortage occupations cannot
be used to identify surplus occupations other institutions or other sources or both should be availed of to ensure that comprehensive data on surplus occupations are provided to the appropriate national authority
Dimensions of shortagessurpluses extent (number of reporting PES) and severity (high or low
magnitude)
Data should be systematically gathered on both the extent of shortage and surplus
occupations in the EEA and on their relative severity
Type of shortage skill vs labour shortages
The providers of the data on shortage occupations must also distinguish between skill and labour shortages because this distinction is necessary for the accurate identification of
shortage occupations and for the choice of the appropriate policy response to identified shortages
Classification of occupations used ISCO 08 4-digit codes (or translation into these codes)
All data should be either initially gathered in ISCO 08 4-digit codes or translated into these
codes This ensures that the data refers to specific individual occupations and is of practical use to EURES and the national providers of VET
Accuracy test cross-check with LSF data (ratio of unemployed to new hires)
The accuracy of the submitted lists of shortage and surplus occupations should be assessed
by comparing the most widely reported surplus and shortage occupations with the estimated values of the ratios of employed (by previous occupation) to new hires at the aggregated EU28 level These ratios should be based on an analysis of the most up-to date
Labour Force Survey (LFS) data
Gender balance assessment LFS data on employment at occupational level by gender PES job
seekers
The gender composition of shortage and surplus occupations should be based on the most
up to date analyses of LFS data on employment by gender and the PES job seeker data
Regional balance assessment LSF data data from relevant agencies
Where regional data is required other agencies and institutions should be requested to
provide the data in those cases where the data cannot be provided by the regional PES network because it is not geographically aligned to the NUTs regions
Labour shortages and surpluses 2017
2017 34
Directorate-General for Employment Social Affairs and Inclusion European Network of Public Employment Services (PES)
Number of occupations reporting should be extended beyond 20 occupations but with upper
limit (eg 50)
Consideration should be given to allowing the agencies responsible for identifying shortage
and surplus occupations a greater range of flexibility in terms of the numbers of occupations which should be identified A minimum to maximum range would be a more realistic approach as it would reflect the fact that the labour markets of the EEA vary significantly in size and performance
Timing of imbalance assessment September
It is proposed that the data gathering exercise should be brought forward to early September and that expert advice should be available on line throughout the data
gathering exercise
Labour shortages and surpluses 2017
2017 35
Directorate-General for Employment Social Affairs and Inclusion European Network of Public Employment Services (PES)
ANNEX 1 DATA COLLECTION TEMPLATE Information sought Explanation
Occupation title (text) Type in free text a list of occupations (one row one occupation) for which shortages and surpluses exist first list occupations for which there is a shortage the list should contain a maximum of 20 occupations if your list contains less than 20 occupations please provide a brief explanation in your email response for why the number is lower than 20 second list occupations for which there is a surplus the list should contain a maximum of 20 occupations if your list contains less than 20 occupations please provide a brief explanation in your email response for why the number is lower than 20
Shortagesurplus indicator For each occupation indicate if it refers to a shortage by typing in shortage or surplus by typing in surplus to identify surplus occupations you can examine for each occupation the ratio of the number of job seekers to the number of vacancies at the end of each year for example if there are 5000 shop assistants seeking employment and there are 200 vacancies at the end of the reference period the ratio is 251 you can rank the calculated ratios and report the occupations associated with the 20 highest ratios
Occupational classification used in your country
For each occupation indicate what occupational classification (if any) was used to identify this occupation for instance you can report a country specific classification ISCO ROME SOC etc If you donrsquot use occupational classifications type None
Occupation code to the lowest level of disaggregation (eg ISCO at 4 digits)
If you have indicated a classification used type the code for each occupation use the lowest level of disaggregation (eg 4 digit ISCO code) if you donrsquot use occupational classification leave black
ISCO-08 code at 4-digit level (or lower if 4-digit not available)
If you use occupational classification which is not ISCO-08 and if it is possible provide a translation of the national code to ISCO-08 code ISCO is the International Standard Classification of Occupations which is used to report to Eurostat code should be at 4 digits if this is not available than the lowest level of disaggregation that is available should be reported (3 digits if 4-digit code is not available 2 digits if neither 4-digit nor 3-digit code is available 1 digit if neither 4-digit 3-digit nor 2-digit code is available) if it is not possible to provide translation to ISCO-08 leave black if you have already reported ISCO-08 code in column 3 leave this column black
Estimate of shortagesurplus magnitude (high (gt3 of employment) medium (1-3 of employment) low (lt1 of employment))
For each occupation indicate a broad estimate of the magnitude of the shortagesurplus if you estimate that the shortagesurplus is less than 1 of the total employment in the occupation in question type low if between 1-3 type medium if greater than 3 type high if you cannot provide a rough estimate of magnitude type dont know
Current shortagesurplus (C) future short term (FST) future medium term (FMT) future long term (FLT) donrsquot know (indicate all that apply)
Against each occupation indicate if the identified shortagesurplus refers to present situation by typing C if the shortage is expected to occur in the short term future ie within 12 months by typing FST if it is expected to occur over the medium term (within 1-5 years) by typing FMT if it is expected to occur in the long term (in 5 or more years) by typing FLT if more than one time period applies indicate all relevant ones (eg for current shortagessurpluses that are expected to persist over the short term type C FST) if you dont know type dont know
Source of information on shortagessurpluses (eg PES administrative data (vacancies job seekers) PES survey third party survey Occupational forecasts other (specify) etc)
Indicate the source used to identify shortagesurplus for this occupation did you derive it from the PES administrative data on PES vacancies andor job seekers did you conduct a survey did you commission a third party to conduct a survey for you did you have occupational forecasts available did you use other research type in free text the full description of the source(s) eg National Employment Survey conducted by PES etc
Labour shortages and surpluses 2017
2017 36
Directorate-General for Employment Social Affairs and Inclusion European Network of Public Employment Services (PES)
Date for source of information Indicate the year that the information on shortagessurpluses (column 7) refers to eg type 2016 for a survey of difficult to fill vacancies conducted in 2016 even if the report was published in 2017
What indicator(s) suggested that there is a shortagesurplus
Indicate what criteria was used to conclude that this occupation is associated with a shortagesurplus for instance employers views sourcing from abroad to fill vacancies growth in employment faster than growth in educationtraining output time required to fill
vacancies higher than average etc
Share of females among job seekers in this occupation (surplus occupations only)
Indicate the percentage share of females among all job seekers in this occupation this is only applicable to surplus occupations
Skill or labour shortage Indicate if a shortage refers to a skill or labour shortage a skill shortage occurs where there is an insufficient supply of persons with the appropriate skills labour shortages occur where there is a sufficient number of skilled persons however an insufficient number of them is willing to take up employment in the occupation in question
Indicate the availability of data on shortagessurpluses at regional level (NUTS1 NUTS2 NUTS3 No data)
Indicate if data is available on the regional breakdown of shortagessurpluses by indicating the level of regional data available if multiple levels of regional disaggregation are available indicate the lowest level of disaggregation (eg NUTS3 rather than NUTS2) if there is no regional data available use no data
Labour shortages and surpluses 2017
2017 37
Directorate-General for Employment Social Affairs and Inclusion European Network of Public Employment Services (PES)
ANNEX 2 SHORTAGE OCCUPATIONS
Shortage occupation PES count
Cooks 16 Plumbers and pipe fitters 13 Generalist medical practitioners 12 Welders and flamecutters 12 Heavy truck and lorry drivers 11 Metal working machine tool setters and operators 11 Nursing professionals 11 Software developers 11 Agricultural and industrial machinery mechanics and repairers 10 Cleaners and helpers in offices hotels and other establishments 10 Commercial sales representatives 10 Specialist medical practitioners 10 Systems analysts 10 Bricklayers and related workers 9 Building and related electricians 9 Butchers fishmongers and related food preparers 9 Motor vehicle mechanics and repairers 9 Nursing associate professionals 9 Sheet-metal workers 9 Shop sales assistants 9 Waiters 9 Carpenters and joiners 8 Civil engineers 8 Concrete placers concrete finishers and related workers 8 Electrical engineering technicians 8 Electronics engineering technicians 8 Mechanical engineers 8 Primary school teachers 8 Structural-metal preparers and erectors 8 Electronics engineers 7
Health care assistants 7 Manufacturing supervisors 7 Mechanical engineering technicians 7 Secondary education teachers 7 Accountants 6 Applications programmers 6 Bus and tram drivers 6 Contact centre salespersons 6 Early childhood educators 6 Electrical mechanics and fitters 6 Floor layers and tile setters 6 Plasterers 6 Roofers 6 Sewing machine operators 6 Software and applications developers and analysts not elsewhere classified 6 Toolmakers and related workers 6 Web and multimedia developers 6 Air conditioning and refrigeration mechanics 5 Building frame and related trades workers not elsewhere classified 5 Chefs 5 Civil engineering labourers 5 Construction supervisors 5 Earthmoving and related plant operators 5 Electrical engineers 5 Electrical line installers and repairers 5 Engineering professionals not elsewhere classified 5 Hairdressers 5 Information and communications technology operations technicians 5 Manufacturing managers 5 Physiotherapists 5 Real estate agents and property managers 5 Research and development managers 5 Spray painters and varnishers 5 Accounting associate professionals 4 Bakers pastry-cooks and confectionery makers 4
Labour shortages and surpluses 2017
2017 38
Directorate-General for Employment Social Affairs and Inclusion European Network of Public Employment Services (PES)
Shortage occupation PES count
Blacksmiths hammersmiths and forging press workers 4 Civil engineering technicians 4 Crane hoist and related plant operators 4 Database designers and administrators 4 Industrial and production engineers 4 Painters and related workers 4 Physical and engineering science technicians not elsewhere classified 4 Plastic products machine operators 4 Social work and counselling professionals 4 Accounting and bookkeeping clerks 3 Administrative and executive secretaries 3 Ambulance workers 3 Building construction labourers 3 Car taxi and van drivers 3 Cartographers and surveyors 3 Cleaning and housekeeping supervisors in offices hotels and other establishments 3 Contact centre information clerks 3 Draughtspersons 3 Fast food preparers 3 Freight handlers 3 Gardeners horticultural and nursery growers 3 Home-based personal care workers 3 Hotel receptionists 3 Information and communications technology installers and servicers 3 Insulation workers 3 Kitchen helpers 3 Manufacturing labourers not elsewhere classified 3 Medical imaging and therapeutic equipment technicians 3 Metal moulders and coremakers 3 Metal polishers wheel grinders and tool sharpeners 3 Midwifery professionals 3 Other language teachers 3 Personal services workers not elsewhere classified 3
Pharmacists 3 Policy administration professionals 3 Printers 3 Process control technicians not elsewhere classified 3 Sales and marketing managers 3 Shop supervisors 3 Special needs teachers 3 Stock clerks 3 Supply distribution and related managers 3 Survey and market research interviewers 3 Systems administrators 3 Technical and medical sales professionals (excluding ICT) 3 Translators interpreters and other linguists 3 Transport clerks 3 Vocational education teachers 3 Advertising and marketing professionals 2 Audiologists and speech therapists 2 Bartenders 2 Beauticians and related workers 2 Cashiers and ticket clerks 2 Chemical engineers 2 Child care workers 2 Computer network and systems technicians 2 Computer network professionals 2 Construction managers 2 Craft and related workers not elsewhere classified 2 Credit and loans officers 2 Crop farm labourers 2 Database and network professionals not elsewhere classified 2 Dentists 2 Domestic cleaners and helpers 2 Door to door salespersons 2 Driving instructors 2 Electrical and electronic equipment assemblers 2 Electronics mechanics and servicers 2 Elementary workers not elsewhere classified 2 Employment agents and contractors 2
Labour shortages and surpluses 2017
2017 39
Directorate-General for Employment Social Affairs and Inclusion European Network of Public Employment Services (PES)
Shortage occupation PES count
Field crop and vegetable growers 2 Financial analysts 2 Financial and investment advisers 2 Forestry and related workers 2 Garbage and recycling collectors 2 General office clerks 2 Graphic and multimedia designers 2 Information and communications technology service managers 2 Insurance representatives 2 Locomotive engine drivers 2 Mail carriers and sorting clerks 2 Management and organization analysts 2 Mathematicians actuaries and statisticians 2 Mechanical machinery assemblers 2 Medical and dental prosthetic technicians 2 Medical assistants 2 Messengers package deliverers and luggage porters 2 Metal finishing plating and coating machine operators 2 Metal processing plant operators 2 Optometrists and ophthalmic opticians 2 Personal care workers in health services not elsewhere classified 2 Police officers 2 Policy and planning managers 2 Production clerks 2 Restaurant managers 2 Retail and wholesale trade managers 2 Sales workers not elsewhere classified 2 Sewing embroidery and related workers 2 Street food salespersons 2 Tailors dressmakers furriers and hatters 2 Telecommunications engineers 2 Advertising and public relations managers 1 Aged care services managers 1
Agricultural technicians 1 Aircraft engine mechanics and repairers 1 Aircraft pilots and related associate professionals 1 Assemblers not elsewhere classified 1 Authors and related writers 1 Bank tellers and related clerks 1 Bleaching dyeing and fabric cleaning machine operators 1 Bookmakers croupiers and related gaming workers 1 Business services agents not elsewhere classified 1 Buyers 1 Cabinet-makers and related workers 1 Cement stone and other mineral products machine operators 1 Chemical and physical science technicians 1 Chemical engineering technicians 1 Chemical processing plant controllers 1 Chemical products plant and machine operators 1 Chemists 1 Conference and event planners 1 Customs and border inspectors 1 Data entry clerks 1 Dental assistants and therapists 1 Dieticians and nutritionists 1 Dispensing opticians 1 Domestic housekeepers 1 Economists 1 Education methods specialists 1 Environmental and occupational health and hygiene professionals 1 Environmental and occupational health inspectors and associates 1 Fibre preparing spinning and winding machine operators 1 Finance managers 1 Financial and insurance services branch managers 1 Fire-fighters 1 Fitness and recreation instructors and program leaders 1 Food and beverage tasters and graders 1 Food and related products machine operators 1
Labour shortages and surpluses 2017
2017 40
Directorate-General for Employment Social Affairs and Inclusion European Network of Public Employment Services (PES)
Shortage occupation PES count
Food service counter attendants 1 Forestry labourers 1 Fruit vegetable and related preservers 1 Fur and leather preparing machine operators 1 Glass and ceramics plant operators 1 Hand launderers and pressers 1 Hand packers 1 Handicraft workers in textile leather and related materials 1 Health associate professionals not elsewhere classified 1 Health professionals not elsewhere classified 1 House builders 1 Human resource managers 1 Incinerator and water treatment plant operators 1 Information and communications technology user support technicians 1 Judges 1 Lawyers 1 Legal and related associate professionals 1 Legal professionals not elsewhere classified 1 Library clerks 1 Lifting truck operators 1 Livestock and dairy producers 1 Livestock farm labourers 1 Medical and pathology laboratory technicians 1 Medical secretaries 1 Metal production process controllers 1 Mining and quarrying labourers 1 Mining engineers metallurgists and related professionals 1 Mixed crop and animal producers 1 Mixed crop growers 1 Motorcycle drivers 1 Odd job persons 1 Other cleaning workers 1 Other music teachers 1
Paper products machine operators 1 Personnel and careers professionals 1 Personnel clerks 1 Pet groomers and animal care workers 1 Physicists and astronomers 1 Physiotherapy technicians and assistants 1 Potters and related workers 1 Power production plant operators 1 Prison guards 1 Product and garment designers 1 Psychologists 1 Pulp and papermaking plant operators 1 Railway brake signal and switch operators 1 Receptionists (general) 1 Refuse sorters 1 Riggers and cable splicers 1 Scribes and related workers 1 Secretaries (general) 1 Securities and finance dealers and brokers 1 Security guards 1 Senior government officials 1 Senior officials of special-interest organizations 1 Shelf fillers 1 Ships engineers 1 Shoemaking and related machine operators 1 Social work associate professionals 1 Stall and market salespersons 1 Stationary plant and machine operators not elsewhere classified 1 Stonemasons stone cutters splitters and carvers 1 Street and related service workers 1 Sweepers and related labourers 1 Teaching professionals not elsewhere classified 1 Telecommunications engineering technicians 1 Textile fur and leather products machine operators not elsewhere classified 1 Trade brokers 1 Travel attendants and travel stewards 1 Travel guides 1
Labour shortages and surpluses 2017
2017 41
Directorate-General for Employment Social Affairs and Inclusion European Network of Public Employment Services (PES)
Shortage occupation PES count
Tree and shrub crop growers 1 Underwater divers 1 University and higher education teachers 1 Vehicle cleaners 1 Veterinarians 1 Weaving and knitting machine operators 1 Web technicians 1 Wood processing plant operators 1 Woodworking-machine tool setters and operators 1
Labour shortages and surpluses 2017
2017 42
Directorate-General for Employment Social Affairs and Inclusion European Network of Public Employment Services (PES)
ANNEX 3 SURPLUS OCCUPATIONS
Surplus occupation PES count
General office clerks 8 Shop sales assistants 8 Advertising and marketing professionals 6 Bank tellers and related clerks 6 Sociologists anthropologists and related professionals 6 Child care workers 5 Hairdressers 5 Journalists 5 Cashiers and ticket clerks 4 Cleaners and helpers in offices hotels and other establishments 4 Hand packers 4 Mail carriers and sorting clerks 4 Photographers 4 Receptionists (general) 4 Tailors dressmakers furriers and hatters 4 Accounting and bookkeeping clerks 3 Administrative and executive secretaries 3 Beauticians and related workers 3 Biologists botanists zoologists and related professionals 3 Bricklayers and related workers 3 Broadcasting and audio-visual technicians 3 Civil engineering labourers 3 Economists 3 Gardeners horticultural and nursery growers 3 Interior designers and decorators 3 Kitchen helpers 3 Legal professionals not elsewhere classified 3 Manufacturing labourers not elsewhere classified 3 Motor vehicle mechanics and repairers 3
Musicians singers and composers 3 Other artistic and cultural associate professionals 3 Painters and related workers 3 Philosophers historians and political scientists 3 Security guards 3 Sweepers and related labourers 3 Travel consultants and clerks 3 Waiters 3 Actors 2 Archivists and curators 2 Bakers pastry-cooks and confectionery makers 2 Bartenders 2 Building construction labourers 2 Business services and administration managers not elsewhere classified 2 Cabinet-makers and related workers 2 Car taxi and van drivers 2 Chemists 2 Cleaning and housekeeping supervisors in offices hotels and other establishments 2 Credit and loans officers 2 Customs and border inspectors 2 Elementary workers not elsewhere classified 2 Film stage and related directors and producers 2 Financial analysts 2 Forestry and related workers 2 Freight handlers 2 Graphic and multimedia designers 2 Health care assistants 2 Hotel receptionists 2 Lawyers 2 Legal and related associate professionals 2 Library clerks 2 Livestock and dairy producers 2 Management and organization analysts 2 Messengers package deliverers and luggage porters 2 Odd job persons 2 Office supervisors 2 Plasterers 2
Labour shortages and surpluses 2017
2017 43
Directorate-General for Employment Social Affairs and Inclusion European Network of Public Employment Services (PES)
Surplus occupation PES count
Police officers 2 Pre-press technicians 2 Print finishing and binding workers 2 Printers 2 Prison guards 2 Product and garment designers 2 Psychologists 2 Public relations professionals 2 Religious professionals 2 Secondary education teachers 2 Secretaries (general) 2 Social work and counselling professionals 2 Stall and market salespersons 2 Stock clerks 2 Teachers aides 2 Telephone switchboard operators 2 Travel guides 2 Visual artists 2 Advertising and public relations managers 1 Agricultural technicians 1 Announcers on radio television and other media 1 Assemblers not elsewhere classified 1 Building and related electricians 1 Building architects 1 Building caretakers 1 Building frame and related trades workers not elsewhere classified 1 Business services agents not elsewhere classified 1 Buyers 1 Carpenters and joiners 1 Chemical engineers 1 Civil engineers 1 Clearing and forwarding agents 1 Clerical support workers not elsewhere classified 1
Commercial sales representatives 1 Conference and event planners 1 Contact centre information clerks 1 Contact centre salespersons 1 Cooks 1 Crane hoist and related plant operators 1 Creative and performing artists not elsewhere classified 1 Dancers and choreographers 1 Data entry clerks 1 Database designers and administrators 1 Domestic cleaners and helpers 1 Domestic housekeepers 1 Draughtspersons 1 Driving instructors 1 Early childhood educators 1 Electronics mechanics and servicers 1 Farming forestry and fisheries advisers 1 Fashion and other models 1 Fast food preparers 1 Field crop and vegetable growers 1 Filing and copying clerks 1 Finance managers 1 Financial and insurance services branch managers 1 Financial and investment advisers 1 Fire-fighters 1 Fitness and recreation instructors and program leaders 1 Floor layers and tile setters 1 Food service counter attendants 1 Fruit vegetable and related preservers 1 Gallery museum and library technicians 1 Garbage and recycling collectors 1 Garment and related pattern-makers and cutters 1 Glass and ceramics plant operators 1 Government tax and excise officials 1 Hand launderers and pressers 1
Labour shortages and surpluses 2017
2017 44
Directorate-General for Employment Social Affairs and Inclusion European Network of Public Employment Services (PES)
Surplus occupation PES count
Heavy truck and lorry drivers 1 House builders 1 Hunters and trappers 1 Information and communications technology installers and servicers 1 Information and communications technology user support technicians 1 Insurance representatives 1 Jewellery and precious-metal workers 1 Judges 1 Legal secretaries 1 Librarians and related information professionals 1 Life science technicians (excluding medical) 1 Lifting truck operators 1 Managing directors and chief executives 1 Manufacturing supervisors 1 Medical and dental prosthetic technicians 1 Metal moulders and coremakers 1 Mining and quarrying labourers 1 Mixed crop and animal producers 1 Mixed crop growers 1 Mobile farm and forestry plant operators 1 Musical instrument makers and tuners 1 Other language teachers 1 Pawnbrokers and money-lenders 1 Personnel and careers professionals 1 Pet groomers and animal care workers 1 Photographic products machine operators 1 Physical and engineering science technicians not elsewhere classified 1 Physicists and astronomers 1 Police inspectors and detectives 1 Precision-instrument makers and repairers 1 Primary school teachers 1 Process control technicians not elsewhere classified 1 Product graders and testers (excluding foods and beverages) 1
Production clerks 1 Professional services managers not elsewhere classified 1 Protective services workers not elsewhere classified 1 Research and development managers 1 Retail and wholesale trade managers 1 Roofers 1 Sales workers not elsewhere classified 1 Senior government officials 1 Service station attendants 1 Shelf fillers 1 Shop supervisors 1 Social work associate professionals 1 Special needs teachers 1 Spray painters and varnishers 1 Statistical mathematical and related associate professionals 1 Stonemasons stone cutters splitters and carvers 1 Street food salespersons 1 Supply distribution and related managers 1 Teaching professionals not elsewhere classified 1 Technical and medical sales professionals (excluding ICT) 1 Training and staff development professionals 1 Translators interpreters and other linguists 1 Transport conductors 1 Tree and shrub crop growers 1 Typists and word processing operators 1 Undertakers and embalmers 1 Vocational education teachers 1 Weaving and knitting machine operators 1 Woodworking-machine tool setters and operators 1
Labour shortages and surpluses 2017
2017 45
Directorate-General for Employment Social Affairs and Inclusion European Network of Public Employment Services (PES)
ANNEX 4 THE RATIO OF UNEMPLOYED TO NEW HIRES
ISCO-08 title
2015
UE
Recruited in the
last year (lt12
months)
Ratio of UE to new recruits
Street and related service workers 85 104 08 Agricultural forestry and fishery labourers 3913 5343 07 Mining and construction labourers 1937 3525 05 Creative and performing artists 610 1115 05 Refuse workers 1036 1923 05 Painters building structure cleaners and related trades workers 1116 2117 05 Street and market salespersons 195 389 05 Building frame and related trades workers 3632 7353 05 Mining manufacturing and construction supervisors 626 1315 05 Ships deck crews and related workers 53 114 05 Market gardeners and crop growers 1471 3207 05 Managing directors and chief executives 304 667 05 Travel attendants conductors and guides 229 538 04 Wood treaters cabinet-makers and related trades workers 491 1159 04 Manufacturing labourers 1640 3909 04 Domestic hotel and office cleaners and helpers 5679 13545 04 Other stationary plant and machine operators 822 1961 04 Mobile plant operators 1038 2497 04 Building finishers and related trades workers 1519 3680 04 Textile fur and leather products machine operators 431 1048 04 Garment and related trades workers 422 1047 04 Chemical and photographic products plant and machine operators 157 389 04 Food processing and related trades workers 930 2330 04 Vehicle window laundry and other hand cleaning workers 291 754 04 Sheet and structural metal workers moulders and welders and related workers
996 2603 04
Waiters and bartenders 4399 11595 04 Cooks 1529 4039 04 Metal processing and finishing plant operators 208 557 04 Printing trades workers 203 548 04 Forestry and related workers 130 351 04 Protective services workers 1347 3658 04 Transport and storage labourers 2532 6939 04 Fishery workers hunters and trappers 46 128 04 Material-recording and transport clerks 1671 4630 04 Process control technicians 179 517 03 Mining and mineral processing plant operators 94 274 03 Telecommunications and broadcasting technicians 177 519 03 Blacksmiths toolmakers and related trades workers 816 2409 03 Building and housekeeping supervisors 678 2045 03
Secretaries (general) 1072 3259 03 Assemblers 850 2586 03 Other craft and related workers 258 810 03 Shop salespersons 6600 21042 03 Electrical equipment installers and repairers 958 3060 03 Food and related products machine operators 437 1400 03 Other sales workers 1087 3510 03 Food preparation assistants 1646 5337 03 Mixed crop and animal producers 387 1260 03 Car van and motorcycle drivers 1155 3764 03 Client information workers 1993 6531 03 Sports and fitness workers 605 1984 03 Handicraft workers 194 638 03 Life science technicians and related associate professionals 82 271 03 Keyboard operators 283 940 03 Electronics and telecommunications installers and repairers 290 963 03 Other personal services workers 313 1047 03 Vocational education teachers 279 940 03 Other teaching professionals 744 2518 03 General office clerks 966 3272 03 Authors journalists and linguists 335 1135 03 Hairdressers beauticians and related workers 806 2796 03
Labour shortages and surpluses 2017
2017 46
Directorate-General for Employment Social Affairs and Inclusion European Network of Public Employment Services (PES)
ISCO-08 title
2015
UE
Recruited in the
last year (lt12
months)
Ratio of UE to new recruits
Animal producers 189 660 03 Other elementary workers 976 3401 03 Machinery mechanics and repairers 1134 3962 03 Ship and aircraft controllers and technicians 80 281 03 Hotel and restaurant managers 344 1220 03 Cashiers and ticket clerks 908 3220 03 Retail and wholesale trade managers 224 809 03 Sales marketing and development managers 311 1124 03 Physical and engineering science technicians 1204 4366 03 Administrative and specialised secretaries 1106 4040 03 Sales and purchasing agents and brokers 1294 4754 03 Rubber plastic and paper products machine operators 256 941 03 Artistic cultural and culinary associate professionals 511 1906 03 Numerical clerks 944 3532 03 Other services managers 184 691 03 Child care workers and teachers aides 1335 5005 03 Heavy truck and bus drivers 1426 5349 03 Business services and administration managers 383 1439 03 Information and communications technology service managers 67 257 03 Regulatory government associate professionals 209 807 03 Life science professionals 176 681 03 Wood processing and papermaking plant operators 97 379 03 Locomotive engine drivers and related workers 46 179 03 Legal professionals 315 1245 03 Personal care workers in health services 2195 8787 02 Physical and earth science professionals 85 345 02 Street vendors (excluding food) 50 204 02 Architects planners surveyors and designers 515 2092 02 Other clerical support workers 901 3657 02 Business services agents 510 2114 02 Manufacturing mining construction and distribution managers 361 1507 02 Tellers money collectors and related clerks 381 1612 02 Librarians archivists and curators 58 248 02 Medical and pharmaceutical technicians 255 1099 02 University and higher education teachers 301 1333 02 Information and communications technology operations and user support technicians
418 1888 02
Legal social and religious associate professionals 920 4348 02 Financial and mathematical associate professionals 601 2852 02 Sales marketing and public relations professionals 865 4172 02 Finance professionals 472 2281 02 Engineering professionals (excluding electrotechnology) 635 3118 02 Other health associate professionals 531 2657 02
Social and religious professionals 460 2317 02 Professional services managers 176 891 02 Nursing and midwifery associate professionals 556 2855 02 Legislators and senior officials 53 286 02 Database and network professionals 83 455 02 Administration professionals 641 3673 02 Primary school and early childhood teachers 575 3345 02 Electrotechnology engineers 142 827 02 Secondary education teachers 471 2812 02 Other health professionals 346 2083 02 Nursing and midwifery professionals 273 1760 02 Software and applications developers and analysts 631 4159 02 Medical doctors 293 1944 02 No occupation 152894 00
No answer 2531 578 44 Total 249561 294937 08
Labour shortages and surpluses 2017
2017 47
Directorate-General for Employment Social Affairs and Inclusion European Network of Public Employment Services (PES)
HOW TO OBTAIN EU PUBLICATIONS
Free publications
bull one copy
via EU Bookshop (httpbookshopeuropaeu)
bull more than one copy or postersmaps
from the European Unionrsquos representations (httpeceuropaeurepresent_enhtm)
from the delegations in non-EU countries
(httpeeaseuropaeudelegationsindex_enhtm)
by contacting the Europe Direct service (httpeuropaeueuropedirectindex_enhtm)
or calling 00 800 6 7 8 9 10 11 (free phone number from anywhere in the EU) () () The information given is free as are most calls (though some operators phone boxes or hotels may charge you)
Priced publications
bull via EU Bookshop (httpbookshopeuropaeu)
Priced subscriptions
bull via one of the sales agents of the Publications Office of the European Union
(httppublicationseuropaeuothersagentsindex_enhtm)
doi 10276731262
KE-0
1-1
8-2
63-E
N-N
[Ca
talo
gu
e n
um
be
r]
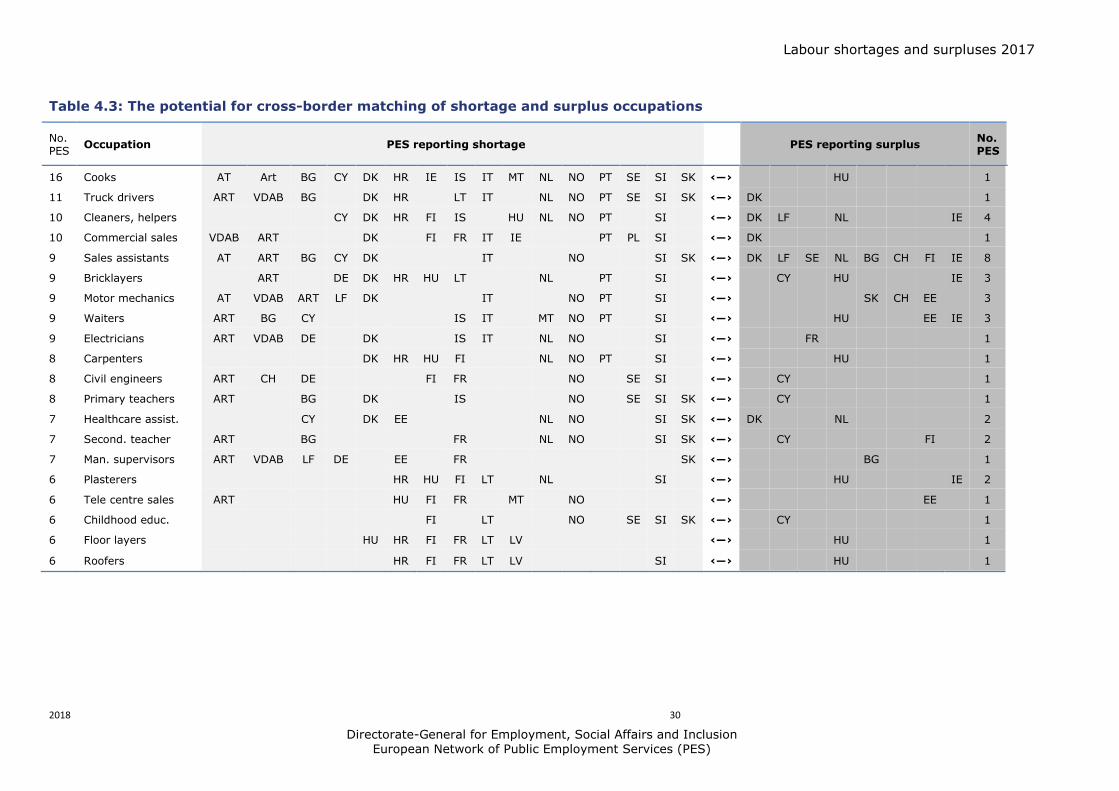
Labour shortages and surpluses 2017
2018 30
Directorate-General for Employment Social Affairs and Inclusion European Network of Public Employment Services (PES)
Table 43 The potential for cross-border matching of shortage and surplus occupations
No PES
Occupation PES reporting shortage PES reporting surplus No PES
16 Cooks AT Art BG CY DK HR IE IS IT MT NL NO PT SE SI SK lsaquo―rsaquo HU 1
11 Truck drivers ART VDAB BG DK HR LT IT NL NO PT SE SI SK lsaquo―rsaquo DK 1
10 Cleaners helpers CY DK HR FI IS HU NL NO PT SI lsaquo―rsaquo DK LF NL IE 4
10 Commercial sales VDAB ART DK FI FR IT IE PT PL SI lsaquo―rsaquo DK 1
9 Sales assistants AT ART BG CY DK IT NO SI SK lsaquo―rsaquo DK LF SE NL BG CH FI IE 8
9 Bricklayers ART DE DK HR HU LT NL PT SI lsaquo―rsaquo CY HU IE 3
9 Motor mechanics AT VDAB ART LF DK IT NO PT SI lsaquo―rsaquo SK CH EE 3
9 Waiters ART BG CY IS IT MT NO PT SI lsaquo―rsaquo HU EE IE 3
9 Electricians ART VDAB DE DK IS IT NL NO SI lsaquo―rsaquo FR 1
8 Carpenters DK HR HU FI NL NO PT SI lsaquo―rsaquo HU 1
8 Civil engineers ART CH DE FI FR NO SE SI lsaquo―rsaquo CY 1
8 Primary teachers ART BG DK IS NO SE SI SK lsaquo―rsaquo CY 1
7 Healthcare assist CY DK EE NL NO SI SK lsaquo―rsaquo DK NL 2
7 Second teacher ART BG FR NL NO SI SK lsaquo―rsaquo CY FI 2
7 Man supervisors ART VDAB LF DE EE FR SK lsaquo―rsaquo BG 1
6 Plasterers HR HU FI LT NL SI lsaquo―rsaquo HU IE 2
6 Tele centre sales ART HU FI FR MT NO lsaquo―rsaquo EE 1
6 Childhood educ FI LT NO SE SI SK lsaquo―rsaquo CY 1
6 Floor layers HU HR FI FR LT LV lsaquo―rsaquo HU 1
6 Roofers HR FI FR LT LV SI lsaquo―rsaquo HU 1
Bottlenecks Occupations 2017
2017 31
Directorate-General for Employment Social Affairs and Inclusion European Network of Public Employment Services (PES)
5 CONCLUSIONS AND RECOMMENDATIONS
51 Conclusions
The terms of reference for this study emphasise the desirability of creating a process for
the systematic collection of data on surplus and shortage occupations in the EEA area
which could be effectively used by EURES for cross border matching of shortage
occupations in some EEA countries with surplus occupations in others
The authors have responded to this emphasis by using a process which ensures that the
data gathered on shortage and surplus occupations is comprehensive accurate and of
practical use to EURES and the providers of education and training programmes The
process is comprehensive because it gathers information both on the extent of shortages
and surpluses and on their relative severity It is accurate because the list of shortage
and surplus occupations are shown to be consistent with the estimated value of the ratio
of unemployed to new hires Finally the process provides information which is of
practical use to EURES and the national providers of VET because the data gathered is on
individual occupations rather than on lsquobundles of occupationsrsquo as in previous studies The
analyses in this report shows that while these bundles of occupations contain some
occupations which are identified by the PES as shortage and surplus occupations they
also contain occupations which are neither in shortage nor in surplus and it is impossible
to distinguish one from the other
The data gathering process used in this report however was not devoid of weaknesses
Fortunately these weaknesses reflect the modus operandi of the PES and may be
rectified by including other institutions and agencies in the process For example the PES
use the same sources for the identification of both shortage and surplus occupations
This may have advantages in terms of accuracy when those sources include employersrsquo
surveys immigration data and the results of forecasting exercises However these
sources are not suitable for gathering data on surplus occupations and they are the main
reason why the number of surplus occupations provided by the PES were almost half the
number requested In the future PES data could be augmented by data gathered by
other bodies as outlined in recent EU Regulation 2016589
In addition the response to the question on the capacity of the PES to deliver data on
shortage and surplus occupations at a regional level was also disappointing perhaps
reflecting a misalignment in some EEA countries between the geographic configuration of
the local PES network and the NUTs regions
The analysis highlighted that in order to assess gender imbalances of shortages and
surpluses PES data needs to be augmented by other sources
Finally despite the low number of surplus occupations submitted by the PES it was
nevertheless possible to identify twenty shortage occupations in the EEA labour market
which had at least one cross-border matching possibility and many more than one in the
case of some shortage occupations
52 Recommendations
Based on the findings from the three bottleneck studies undertaken to date a model for
the gathering of data on shortages and surpluses is proposed (Figure 51) The model
includes features of the methodology applied in this study which were successful It also
includes a number of features which should be introduced to the process in order to
address some of the weaknesses which were identified in this study (highlighted in red)
Labour shortages and surpluses 2017
2017 32
Directorate-General for Employment Social Affairs and Inclusion European Network of Public Employment Services (PES)
However before this methodology is implemented it would be prudent to discuss data
requirements with PES and invite a broader range of institutions and agencies to
participate in aspects of the data gathering process in addition to the PES EURES
Regulation (EU) 2016589 of the European Parliament and of the Council which obliges
the appropriate national authorities to furnish such data annually is fortuitous in this
regard and should facilitate the implementation of this recommendation
In addition the results of these and other relevant studies should be disseminated to
PES Eures coordination group and other relevant agencies and institutions in order to
emphasise the importance of data and analysis in informing policy at EU and national
level which aims to resolve labour market imbalances
Labour shortages and surpluses 2017
2017 33
Directorate-General for Employment Social Affairs and Inclusion European Network of Public Employment Services (PES)
Figure 51 Model for gathering data on shortage and surplus occupations
Sources of data on surpluses PES data from other relevant agencies
In those cases where the source used by the PES to identify shortage occupations cannot
be used to identify surplus occupations other institutions or other sources or both should be availed of to ensure that comprehensive data on surplus occupations are provided to the appropriate national authority
Dimensions of shortagessurpluses extent (number of reporting PES) and severity (high or low
magnitude)
Data should be systematically gathered on both the extent of shortage and surplus
occupations in the EEA and on their relative severity
Type of shortage skill vs labour shortages
The providers of the data on shortage occupations must also distinguish between skill and labour shortages because this distinction is necessary for the accurate identification of
shortage occupations and for the choice of the appropriate policy response to identified shortages
Classification of occupations used ISCO 08 4-digit codes (or translation into these codes)
All data should be either initially gathered in ISCO 08 4-digit codes or translated into these
codes This ensures that the data refers to specific individual occupations and is of practical use to EURES and the national providers of VET
Accuracy test cross-check with LSF data (ratio of unemployed to new hires)
The accuracy of the submitted lists of shortage and surplus occupations should be assessed
by comparing the most widely reported surplus and shortage occupations with the estimated values of the ratios of employed (by previous occupation) to new hires at the aggregated EU28 level These ratios should be based on an analysis of the most up-to date
Labour Force Survey (LFS) data
Gender balance assessment LFS data on employment at occupational level by gender PES job
seekers
The gender composition of shortage and surplus occupations should be based on the most
up to date analyses of LFS data on employment by gender and the PES job seeker data
Regional balance assessment LSF data data from relevant agencies
Where regional data is required other agencies and institutions should be requested to
provide the data in those cases where the data cannot be provided by the regional PES network because it is not geographically aligned to the NUTs regions
Labour shortages and surpluses 2017
2017 34
Directorate-General for Employment Social Affairs and Inclusion European Network of Public Employment Services (PES)
Number of occupations reporting should be extended beyond 20 occupations but with upper
limit (eg 50)
Consideration should be given to allowing the agencies responsible for identifying shortage
and surplus occupations a greater range of flexibility in terms of the numbers of occupations which should be identified A minimum to maximum range would be a more realistic approach as it would reflect the fact that the labour markets of the EEA vary significantly in size and performance
Timing of imbalance assessment September
It is proposed that the data gathering exercise should be brought forward to early September and that expert advice should be available on line throughout the data
gathering exercise
Labour shortages and surpluses 2017
2017 35
Directorate-General for Employment Social Affairs and Inclusion European Network of Public Employment Services (PES)
ANNEX 1 DATA COLLECTION TEMPLATE Information sought Explanation
Occupation title (text) Type in free text a list of occupations (one row one occupation) for which shortages and surpluses exist first list occupations for which there is a shortage the list should contain a maximum of 20 occupations if your list contains less than 20 occupations please provide a brief explanation in your email response for why the number is lower than 20 second list occupations for which there is a surplus the list should contain a maximum of 20 occupations if your list contains less than 20 occupations please provide a brief explanation in your email response for why the number is lower than 20
Shortagesurplus indicator For each occupation indicate if it refers to a shortage by typing in shortage or surplus by typing in surplus to identify surplus occupations you can examine for each occupation the ratio of the number of job seekers to the number of vacancies at the end of each year for example if there are 5000 shop assistants seeking employment and there are 200 vacancies at the end of the reference period the ratio is 251 you can rank the calculated ratios and report the occupations associated with the 20 highest ratios
Occupational classification used in your country
For each occupation indicate what occupational classification (if any) was used to identify this occupation for instance you can report a country specific classification ISCO ROME SOC etc If you donrsquot use occupational classifications type None
Occupation code to the lowest level of disaggregation (eg ISCO at 4 digits)
If you have indicated a classification used type the code for each occupation use the lowest level of disaggregation (eg 4 digit ISCO code) if you donrsquot use occupational classification leave black
ISCO-08 code at 4-digit level (or lower if 4-digit not available)
If you use occupational classification which is not ISCO-08 and if it is possible provide a translation of the national code to ISCO-08 code ISCO is the International Standard Classification of Occupations which is used to report to Eurostat code should be at 4 digits if this is not available than the lowest level of disaggregation that is available should be reported (3 digits if 4-digit code is not available 2 digits if neither 4-digit nor 3-digit code is available 1 digit if neither 4-digit 3-digit nor 2-digit code is available) if it is not possible to provide translation to ISCO-08 leave black if you have already reported ISCO-08 code in column 3 leave this column black
Estimate of shortagesurplus magnitude (high (gt3 of employment) medium (1-3 of employment) low (lt1 of employment))
For each occupation indicate a broad estimate of the magnitude of the shortagesurplus if you estimate that the shortagesurplus is less than 1 of the total employment in the occupation in question type low if between 1-3 type medium if greater than 3 type high if you cannot provide a rough estimate of magnitude type dont know
Current shortagesurplus (C) future short term (FST) future medium term (FMT) future long term (FLT) donrsquot know (indicate all that apply)
Against each occupation indicate if the identified shortagesurplus refers to present situation by typing C if the shortage is expected to occur in the short term future ie within 12 months by typing FST if it is expected to occur over the medium term (within 1-5 years) by typing FMT if it is expected to occur in the long term (in 5 or more years) by typing FLT if more than one time period applies indicate all relevant ones (eg for current shortagessurpluses that are expected to persist over the short term type C FST) if you dont know type dont know
Source of information on shortagessurpluses (eg PES administrative data (vacancies job seekers) PES survey third party survey Occupational forecasts other (specify) etc)
Indicate the source used to identify shortagesurplus for this occupation did you derive it from the PES administrative data on PES vacancies andor job seekers did you conduct a survey did you commission a third party to conduct a survey for you did you have occupational forecasts available did you use other research type in free text the full description of the source(s) eg National Employment Survey conducted by PES etc
Labour shortages and surpluses 2017
2017 36
Directorate-General for Employment Social Affairs and Inclusion European Network of Public Employment Services (PES)
Date for source of information Indicate the year that the information on shortagessurpluses (column 7) refers to eg type 2016 for a survey of difficult to fill vacancies conducted in 2016 even if the report was published in 2017
What indicator(s) suggested that there is a shortagesurplus
Indicate what criteria was used to conclude that this occupation is associated with a shortagesurplus for instance employers views sourcing from abroad to fill vacancies growth in employment faster than growth in educationtraining output time required to fill
vacancies higher than average etc
Share of females among job seekers in this occupation (surplus occupations only)
Indicate the percentage share of females among all job seekers in this occupation this is only applicable to surplus occupations
Skill or labour shortage Indicate if a shortage refers to a skill or labour shortage a skill shortage occurs where there is an insufficient supply of persons with the appropriate skills labour shortages occur where there is a sufficient number of skilled persons however an insufficient number of them is willing to take up employment in the occupation in question
Indicate the availability of data on shortagessurpluses at regional level (NUTS1 NUTS2 NUTS3 No data)
Indicate if data is available on the regional breakdown of shortagessurpluses by indicating the level of regional data available if multiple levels of regional disaggregation are available indicate the lowest level of disaggregation (eg NUTS3 rather than NUTS2) if there is no regional data available use no data
Labour shortages and surpluses 2017
2017 37
Directorate-General for Employment Social Affairs and Inclusion European Network of Public Employment Services (PES)
ANNEX 2 SHORTAGE OCCUPATIONS
Shortage occupation PES count
Cooks 16 Plumbers and pipe fitters 13 Generalist medical practitioners 12 Welders and flamecutters 12 Heavy truck and lorry drivers 11 Metal working machine tool setters and operators 11 Nursing professionals 11 Software developers 11 Agricultural and industrial machinery mechanics and repairers 10 Cleaners and helpers in offices hotels and other establishments 10 Commercial sales representatives 10 Specialist medical practitioners 10 Systems analysts 10 Bricklayers and related workers 9 Building and related electricians 9 Butchers fishmongers and related food preparers 9 Motor vehicle mechanics and repairers 9 Nursing associate professionals 9 Sheet-metal workers 9 Shop sales assistants 9 Waiters 9 Carpenters and joiners 8 Civil engineers 8 Concrete placers concrete finishers and related workers 8 Electrical engineering technicians 8 Electronics engineering technicians 8 Mechanical engineers 8 Primary school teachers 8 Structural-metal preparers and erectors 8 Electronics engineers 7
Health care assistants 7 Manufacturing supervisors 7 Mechanical engineering technicians 7 Secondary education teachers 7 Accountants 6 Applications programmers 6 Bus and tram drivers 6 Contact centre salespersons 6 Early childhood educators 6 Electrical mechanics and fitters 6 Floor layers and tile setters 6 Plasterers 6 Roofers 6 Sewing machine operators 6 Software and applications developers and analysts not elsewhere classified 6 Toolmakers and related workers 6 Web and multimedia developers 6 Air conditioning and refrigeration mechanics 5 Building frame and related trades workers not elsewhere classified 5 Chefs 5 Civil engineering labourers 5 Construction supervisors 5 Earthmoving and related plant operators 5 Electrical engineers 5 Electrical line installers and repairers 5 Engineering professionals not elsewhere classified 5 Hairdressers 5 Information and communications technology operations technicians 5 Manufacturing managers 5 Physiotherapists 5 Real estate agents and property managers 5 Research and development managers 5 Spray painters and varnishers 5 Accounting associate professionals 4 Bakers pastry-cooks and confectionery makers 4
Labour shortages and surpluses 2017
2017 38
Directorate-General for Employment Social Affairs and Inclusion European Network of Public Employment Services (PES)
Shortage occupation PES count
Blacksmiths hammersmiths and forging press workers 4 Civil engineering technicians 4 Crane hoist and related plant operators 4 Database designers and administrators 4 Industrial and production engineers 4 Painters and related workers 4 Physical and engineering science technicians not elsewhere classified 4 Plastic products machine operators 4 Social work and counselling professionals 4 Accounting and bookkeeping clerks 3 Administrative and executive secretaries 3 Ambulance workers 3 Building construction labourers 3 Car taxi and van drivers 3 Cartographers and surveyors 3 Cleaning and housekeeping supervisors in offices hotels and other establishments 3 Contact centre information clerks 3 Draughtspersons 3 Fast food preparers 3 Freight handlers 3 Gardeners horticultural and nursery growers 3 Home-based personal care workers 3 Hotel receptionists 3 Information and communications technology installers and servicers 3 Insulation workers 3 Kitchen helpers 3 Manufacturing labourers not elsewhere classified 3 Medical imaging and therapeutic equipment technicians 3 Metal moulders and coremakers 3 Metal polishers wheel grinders and tool sharpeners 3 Midwifery professionals 3 Other language teachers 3 Personal services workers not elsewhere classified 3
Pharmacists 3 Policy administration professionals 3 Printers 3 Process control technicians not elsewhere classified 3 Sales and marketing managers 3 Shop supervisors 3 Special needs teachers 3 Stock clerks 3 Supply distribution and related managers 3 Survey and market research interviewers 3 Systems administrators 3 Technical and medical sales professionals (excluding ICT) 3 Translators interpreters and other linguists 3 Transport clerks 3 Vocational education teachers 3 Advertising and marketing professionals 2 Audiologists and speech therapists 2 Bartenders 2 Beauticians and related workers 2 Cashiers and ticket clerks 2 Chemical engineers 2 Child care workers 2 Computer network and systems technicians 2 Computer network professionals 2 Construction managers 2 Craft and related workers not elsewhere classified 2 Credit and loans officers 2 Crop farm labourers 2 Database and network professionals not elsewhere classified 2 Dentists 2 Domestic cleaners and helpers 2 Door to door salespersons 2 Driving instructors 2 Electrical and electronic equipment assemblers 2 Electronics mechanics and servicers 2 Elementary workers not elsewhere classified 2 Employment agents and contractors 2
Labour shortages and surpluses 2017
2017 39
Directorate-General for Employment Social Affairs and Inclusion European Network of Public Employment Services (PES)
Shortage occupation PES count
Field crop and vegetable growers 2 Financial analysts 2 Financial and investment advisers 2 Forestry and related workers 2 Garbage and recycling collectors 2 General office clerks 2 Graphic and multimedia designers 2 Information and communications technology service managers 2 Insurance representatives 2 Locomotive engine drivers 2 Mail carriers and sorting clerks 2 Management and organization analysts 2 Mathematicians actuaries and statisticians 2 Mechanical machinery assemblers 2 Medical and dental prosthetic technicians 2 Medical assistants 2 Messengers package deliverers and luggage porters 2 Metal finishing plating and coating machine operators 2 Metal processing plant operators 2 Optometrists and ophthalmic opticians 2 Personal care workers in health services not elsewhere classified 2 Police officers 2 Policy and planning managers 2 Production clerks 2 Restaurant managers 2 Retail and wholesale trade managers 2 Sales workers not elsewhere classified 2 Sewing embroidery and related workers 2 Street food salespersons 2 Tailors dressmakers furriers and hatters 2 Telecommunications engineers 2 Advertising and public relations managers 1 Aged care services managers 1
Agricultural technicians 1 Aircraft engine mechanics and repairers 1 Aircraft pilots and related associate professionals 1 Assemblers not elsewhere classified 1 Authors and related writers 1 Bank tellers and related clerks 1 Bleaching dyeing and fabric cleaning machine operators 1 Bookmakers croupiers and related gaming workers 1 Business services agents not elsewhere classified 1 Buyers 1 Cabinet-makers and related workers 1 Cement stone and other mineral products machine operators 1 Chemical and physical science technicians 1 Chemical engineering technicians 1 Chemical processing plant controllers 1 Chemical products plant and machine operators 1 Chemists 1 Conference and event planners 1 Customs and border inspectors 1 Data entry clerks 1 Dental assistants and therapists 1 Dieticians and nutritionists 1 Dispensing opticians 1 Domestic housekeepers 1 Economists 1 Education methods specialists 1 Environmental and occupational health and hygiene professionals 1 Environmental and occupational health inspectors and associates 1 Fibre preparing spinning and winding machine operators 1 Finance managers 1 Financial and insurance services branch managers 1 Fire-fighters 1 Fitness and recreation instructors and program leaders 1 Food and beverage tasters and graders 1 Food and related products machine operators 1
Labour shortages and surpluses 2017
2017 40
Directorate-General for Employment Social Affairs and Inclusion European Network of Public Employment Services (PES)
Shortage occupation PES count
Food service counter attendants 1 Forestry labourers 1 Fruit vegetable and related preservers 1 Fur and leather preparing machine operators 1 Glass and ceramics plant operators 1 Hand launderers and pressers 1 Hand packers 1 Handicraft workers in textile leather and related materials 1 Health associate professionals not elsewhere classified 1 Health professionals not elsewhere classified 1 House builders 1 Human resource managers 1 Incinerator and water treatment plant operators 1 Information and communications technology user support technicians 1 Judges 1 Lawyers 1 Legal and related associate professionals 1 Legal professionals not elsewhere classified 1 Library clerks 1 Lifting truck operators 1 Livestock and dairy producers 1 Livestock farm labourers 1 Medical and pathology laboratory technicians 1 Medical secretaries 1 Metal production process controllers 1 Mining and quarrying labourers 1 Mining engineers metallurgists and related professionals 1 Mixed crop and animal producers 1 Mixed crop growers 1 Motorcycle drivers 1 Odd job persons 1 Other cleaning workers 1 Other music teachers 1
Paper products machine operators 1 Personnel and careers professionals 1 Personnel clerks 1 Pet groomers and animal care workers 1 Physicists and astronomers 1 Physiotherapy technicians and assistants 1 Potters and related workers 1 Power production plant operators 1 Prison guards 1 Product and garment designers 1 Psychologists 1 Pulp and papermaking plant operators 1 Railway brake signal and switch operators 1 Receptionists (general) 1 Refuse sorters 1 Riggers and cable splicers 1 Scribes and related workers 1 Secretaries (general) 1 Securities and finance dealers and brokers 1 Security guards 1 Senior government officials 1 Senior officials of special-interest organizations 1 Shelf fillers 1 Ships engineers 1 Shoemaking and related machine operators 1 Social work associate professionals 1 Stall and market salespersons 1 Stationary plant and machine operators not elsewhere classified 1 Stonemasons stone cutters splitters and carvers 1 Street and related service workers 1 Sweepers and related labourers 1 Teaching professionals not elsewhere classified 1 Telecommunications engineering technicians 1 Textile fur and leather products machine operators not elsewhere classified 1 Trade brokers 1 Travel attendants and travel stewards 1 Travel guides 1
Labour shortages and surpluses 2017
2017 41
Directorate-General for Employment Social Affairs and Inclusion European Network of Public Employment Services (PES)
Shortage occupation PES count
Tree and shrub crop growers 1 Underwater divers 1 University and higher education teachers 1 Vehicle cleaners 1 Veterinarians 1 Weaving and knitting machine operators 1 Web technicians 1 Wood processing plant operators 1 Woodworking-machine tool setters and operators 1
Labour shortages and surpluses 2017
2017 42
Directorate-General for Employment Social Affairs and Inclusion European Network of Public Employment Services (PES)
ANNEX 3 SURPLUS OCCUPATIONS
Surplus occupation PES count
General office clerks 8 Shop sales assistants 8 Advertising and marketing professionals 6 Bank tellers and related clerks 6 Sociologists anthropologists and related professionals 6 Child care workers 5 Hairdressers 5 Journalists 5 Cashiers and ticket clerks 4 Cleaners and helpers in offices hotels and other establishments 4 Hand packers 4 Mail carriers and sorting clerks 4 Photographers 4 Receptionists (general) 4 Tailors dressmakers furriers and hatters 4 Accounting and bookkeeping clerks 3 Administrative and executive secretaries 3 Beauticians and related workers 3 Biologists botanists zoologists and related professionals 3 Bricklayers and related workers 3 Broadcasting and audio-visual technicians 3 Civil engineering labourers 3 Economists 3 Gardeners horticultural and nursery growers 3 Interior designers and decorators 3 Kitchen helpers 3 Legal professionals not elsewhere classified 3 Manufacturing labourers not elsewhere classified 3 Motor vehicle mechanics and repairers 3
Musicians singers and composers 3 Other artistic and cultural associate professionals 3 Painters and related workers 3 Philosophers historians and political scientists 3 Security guards 3 Sweepers and related labourers 3 Travel consultants and clerks 3 Waiters 3 Actors 2 Archivists and curators 2 Bakers pastry-cooks and confectionery makers 2 Bartenders 2 Building construction labourers 2 Business services and administration managers not elsewhere classified 2 Cabinet-makers and related workers 2 Car taxi and van drivers 2 Chemists 2 Cleaning and housekeeping supervisors in offices hotels and other establishments 2 Credit and loans officers 2 Customs and border inspectors 2 Elementary workers not elsewhere classified 2 Film stage and related directors and producers 2 Financial analysts 2 Forestry and related workers 2 Freight handlers 2 Graphic and multimedia designers 2 Health care assistants 2 Hotel receptionists 2 Lawyers 2 Legal and related associate professionals 2 Library clerks 2 Livestock and dairy producers 2 Management and organization analysts 2 Messengers package deliverers and luggage porters 2 Odd job persons 2 Office supervisors 2 Plasterers 2
Labour shortages and surpluses 2017
2017 43
Directorate-General for Employment Social Affairs and Inclusion European Network of Public Employment Services (PES)
Surplus occupation PES count
Police officers 2 Pre-press technicians 2 Print finishing and binding workers 2 Printers 2 Prison guards 2 Product and garment designers 2 Psychologists 2 Public relations professionals 2 Religious professionals 2 Secondary education teachers 2 Secretaries (general) 2 Social work and counselling professionals 2 Stall and market salespersons 2 Stock clerks 2 Teachers aides 2 Telephone switchboard operators 2 Travel guides 2 Visual artists 2 Advertising and public relations managers 1 Agricultural technicians 1 Announcers on radio television and other media 1 Assemblers not elsewhere classified 1 Building and related electricians 1 Building architects 1 Building caretakers 1 Building frame and related trades workers not elsewhere classified 1 Business services agents not elsewhere classified 1 Buyers 1 Carpenters and joiners 1 Chemical engineers 1 Civil engineers 1 Clearing and forwarding agents 1 Clerical support workers not elsewhere classified 1
Commercial sales representatives 1 Conference and event planners 1 Contact centre information clerks 1 Contact centre salespersons 1 Cooks 1 Crane hoist and related plant operators 1 Creative and performing artists not elsewhere classified 1 Dancers and choreographers 1 Data entry clerks 1 Database designers and administrators 1 Domestic cleaners and helpers 1 Domestic housekeepers 1 Draughtspersons 1 Driving instructors 1 Early childhood educators 1 Electronics mechanics and servicers 1 Farming forestry and fisheries advisers 1 Fashion and other models 1 Fast food preparers 1 Field crop and vegetable growers 1 Filing and copying clerks 1 Finance managers 1 Financial and insurance services branch managers 1 Financial and investment advisers 1 Fire-fighters 1 Fitness and recreation instructors and program leaders 1 Floor layers and tile setters 1 Food service counter attendants 1 Fruit vegetable and related preservers 1 Gallery museum and library technicians 1 Garbage and recycling collectors 1 Garment and related pattern-makers and cutters 1 Glass and ceramics plant operators 1 Government tax and excise officials 1 Hand launderers and pressers 1
Labour shortages and surpluses 2017
2017 44
Directorate-General for Employment Social Affairs and Inclusion European Network of Public Employment Services (PES)
Surplus occupation PES count
Heavy truck and lorry drivers 1 House builders 1 Hunters and trappers 1 Information and communications technology installers and servicers 1 Information and communications technology user support technicians 1 Insurance representatives 1 Jewellery and precious-metal workers 1 Judges 1 Legal secretaries 1 Librarians and related information professionals 1 Life science technicians (excluding medical) 1 Lifting truck operators 1 Managing directors and chief executives 1 Manufacturing supervisors 1 Medical and dental prosthetic technicians 1 Metal moulders and coremakers 1 Mining and quarrying labourers 1 Mixed crop and animal producers 1 Mixed crop growers 1 Mobile farm and forestry plant operators 1 Musical instrument makers and tuners 1 Other language teachers 1 Pawnbrokers and money-lenders 1 Personnel and careers professionals 1 Pet groomers and animal care workers 1 Photographic products machine operators 1 Physical and engineering science technicians not elsewhere classified 1 Physicists and astronomers 1 Police inspectors and detectives 1 Precision-instrument makers and repairers 1 Primary school teachers 1 Process control technicians not elsewhere classified 1 Product graders and testers (excluding foods and beverages) 1
Production clerks 1 Professional services managers not elsewhere classified 1 Protective services workers not elsewhere classified 1 Research and development managers 1 Retail and wholesale trade managers 1 Roofers 1 Sales workers not elsewhere classified 1 Senior government officials 1 Service station attendants 1 Shelf fillers 1 Shop supervisors 1 Social work associate professionals 1 Special needs teachers 1 Spray painters and varnishers 1 Statistical mathematical and related associate professionals 1 Stonemasons stone cutters splitters and carvers 1 Street food salespersons 1 Supply distribution and related managers 1 Teaching professionals not elsewhere classified 1 Technical and medical sales professionals (excluding ICT) 1 Training and staff development professionals 1 Translators interpreters and other linguists 1 Transport conductors 1 Tree and shrub crop growers 1 Typists and word processing operators 1 Undertakers and embalmers 1 Vocational education teachers 1 Weaving and knitting machine operators 1 Woodworking-machine tool setters and operators 1
Labour shortages and surpluses 2017
2017 45
Directorate-General for Employment Social Affairs and Inclusion European Network of Public Employment Services (PES)
ANNEX 4 THE RATIO OF UNEMPLOYED TO NEW HIRES
ISCO-08 title
2015
UE
Recruited in the
last year (lt12
months)
Ratio of UE to new recruits
Street and related service workers 85 104 08 Agricultural forestry and fishery labourers 3913 5343 07 Mining and construction labourers 1937 3525 05 Creative and performing artists 610 1115 05 Refuse workers 1036 1923 05 Painters building structure cleaners and related trades workers 1116 2117 05 Street and market salespersons 195 389 05 Building frame and related trades workers 3632 7353 05 Mining manufacturing and construction supervisors 626 1315 05 Ships deck crews and related workers 53 114 05 Market gardeners and crop growers 1471 3207 05 Managing directors and chief executives 304 667 05 Travel attendants conductors and guides 229 538 04 Wood treaters cabinet-makers and related trades workers 491 1159 04 Manufacturing labourers 1640 3909 04 Domestic hotel and office cleaners and helpers 5679 13545 04 Other stationary plant and machine operators 822 1961 04 Mobile plant operators 1038 2497 04 Building finishers and related trades workers 1519 3680 04 Textile fur and leather products machine operators 431 1048 04 Garment and related trades workers 422 1047 04 Chemical and photographic products plant and machine operators 157 389 04 Food processing and related trades workers 930 2330 04 Vehicle window laundry and other hand cleaning workers 291 754 04 Sheet and structural metal workers moulders and welders and related workers
996 2603 04
Waiters and bartenders 4399 11595 04 Cooks 1529 4039 04 Metal processing and finishing plant operators 208 557 04 Printing trades workers 203 548 04 Forestry and related workers 130 351 04 Protective services workers 1347 3658 04 Transport and storage labourers 2532 6939 04 Fishery workers hunters and trappers 46 128 04 Material-recording and transport clerks 1671 4630 04 Process control technicians 179 517 03 Mining and mineral processing plant operators 94 274 03 Telecommunications and broadcasting technicians 177 519 03 Blacksmiths toolmakers and related trades workers 816 2409 03 Building and housekeeping supervisors 678 2045 03
Secretaries (general) 1072 3259 03 Assemblers 850 2586 03 Other craft and related workers 258 810 03 Shop salespersons 6600 21042 03 Electrical equipment installers and repairers 958 3060 03 Food and related products machine operators 437 1400 03 Other sales workers 1087 3510 03 Food preparation assistants 1646 5337 03 Mixed crop and animal producers 387 1260 03 Car van and motorcycle drivers 1155 3764 03 Client information workers 1993 6531 03 Sports and fitness workers 605 1984 03 Handicraft workers 194 638 03 Life science technicians and related associate professionals 82 271 03 Keyboard operators 283 940 03 Electronics and telecommunications installers and repairers 290 963 03 Other personal services workers 313 1047 03 Vocational education teachers 279 940 03 Other teaching professionals 744 2518 03 General office clerks 966 3272 03 Authors journalists and linguists 335 1135 03 Hairdressers beauticians and related workers 806 2796 03
Labour shortages and surpluses 2017
2017 46
Directorate-General for Employment Social Affairs and Inclusion European Network of Public Employment Services (PES)
ISCO-08 title
2015
UE
Recruited in the
last year (lt12
months)
Ratio of UE to new recruits
Animal producers 189 660 03 Other elementary workers 976 3401 03 Machinery mechanics and repairers 1134 3962 03 Ship and aircraft controllers and technicians 80 281 03 Hotel and restaurant managers 344 1220 03 Cashiers and ticket clerks 908 3220 03 Retail and wholesale trade managers 224 809 03 Sales marketing and development managers 311 1124 03 Physical and engineering science technicians 1204 4366 03 Administrative and specialised secretaries 1106 4040 03 Sales and purchasing agents and brokers 1294 4754 03 Rubber plastic and paper products machine operators 256 941 03 Artistic cultural and culinary associate professionals 511 1906 03 Numerical clerks 944 3532 03 Other services managers 184 691 03 Child care workers and teachers aides 1335 5005 03 Heavy truck and bus drivers 1426 5349 03 Business services and administration managers 383 1439 03 Information and communications technology service managers 67 257 03 Regulatory government associate professionals 209 807 03 Life science professionals 176 681 03 Wood processing and papermaking plant operators 97 379 03 Locomotive engine drivers and related workers 46 179 03 Legal professionals 315 1245 03 Personal care workers in health services 2195 8787 02 Physical and earth science professionals 85 345 02 Street vendors (excluding food) 50 204 02 Architects planners surveyors and designers 515 2092 02 Other clerical support workers 901 3657 02 Business services agents 510 2114 02 Manufacturing mining construction and distribution managers 361 1507 02 Tellers money collectors and related clerks 381 1612 02 Librarians archivists and curators 58 248 02 Medical and pharmaceutical technicians 255 1099 02 University and higher education teachers 301 1333 02 Information and communications technology operations and user support technicians
418 1888 02
Legal social and religious associate professionals 920 4348 02 Financial and mathematical associate professionals 601 2852 02 Sales marketing and public relations professionals 865 4172 02 Finance professionals 472 2281 02 Engineering professionals (excluding electrotechnology) 635 3118 02 Other health associate professionals 531 2657 02
Social and religious professionals 460 2317 02 Professional services managers 176 891 02 Nursing and midwifery associate professionals 556 2855 02 Legislators and senior officials 53 286 02 Database and network professionals 83 455 02 Administration professionals 641 3673 02 Primary school and early childhood teachers 575 3345 02 Electrotechnology engineers 142 827 02 Secondary education teachers 471 2812 02 Other health professionals 346 2083 02 Nursing and midwifery professionals 273 1760 02 Software and applications developers and analysts 631 4159 02 Medical doctors 293 1944 02 No occupation 152894 00
No answer 2531 578 44 Total 249561 294937 08
Labour shortages and surpluses 2017
2017 47
Directorate-General for Employment Social Affairs and Inclusion European Network of Public Employment Services (PES)
HOW TO OBTAIN EU PUBLICATIONS
Free publications
bull one copy
via EU Bookshop (httpbookshopeuropaeu)
bull more than one copy or postersmaps
from the European Unionrsquos representations (httpeceuropaeurepresent_enhtm)
from the delegations in non-EU countries
(httpeeaseuropaeudelegationsindex_enhtm)
by contacting the Europe Direct service (httpeuropaeueuropedirectindex_enhtm)
or calling 00 800 6 7 8 9 10 11 (free phone number from anywhere in the EU) () () The information given is free as are most calls (though some operators phone boxes or hotels may charge you)
Priced publications
bull via EU Bookshop (httpbookshopeuropaeu)
Priced subscriptions
bull via one of the sales agents of the Publications Office of the European Union
(httppublicationseuropaeuothersagentsindex_enhtm)
doi 10276731262
KE-0
1-1
8-2
63-E
N-N
[Ca
talo
gu
e n
um
be
r]
Labour shortages and surpluses 2017
2017 32
Directorate-General for Employment Social Affairs and Inclusion European Network of Public Employment Services (PES)
However before this methodology is implemented it would be prudent to discuss data
requirements with PES and invite a broader range of institutions and agencies to
participate in aspects of the data gathering process in addition to the PES EURES
Regulation (EU) 2016589 of the European Parliament and of the Council which obliges
the appropriate national authorities to furnish such data annually is fortuitous in this
regard and should facilitate the implementation of this recommendation
In addition the results of these and other relevant studies should be disseminated to
PES Eures coordination group and other relevant agencies and institutions in order to
emphasise the importance of data and analysis in informing policy at EU and national
level which aims to resolve labour market imbalances
Labour shortages and surpluses 2017
2017 33
Directorate-General for Employment Social Affairs and Inclusion European Network of Public Employment Services (PES)
Figure 51 Model for gathering data on shortage and surplus occupations
Sources of data on surpluses PES data from other relevant agencies
In those cases where the source used by the PES to identify shortage occupations cannot
be used to identify surplus occupations other institutions or other sources or both should be availed of to ensure that comprehensive data on surplus occupations are provided to the appropriate national authority
Dimensions of shortagessurpluses extent (number of reporting PES) and severity (high or low
magnitude)
Data should be systematically gathered on both the extent of shortage and surplus
occupations in the EEA and on their relative severity
Type of shortage skill vs labour shortages
The providers of the data on shortage occupations must also distinguish between skill and labour shortages because this distinction is necessary for the accurate identification of
shortage occupations and for the choice of the appropriate policy response to identified shortages
Classification of occupations used ISCO 08 4-digit codes (or translation into these codes)
All data should be either initially gathered in ISCO 08 4-digit codes or translated into these
codes This ensures that the data refers to specific individual occupations and is of practical use to EURES and the national providers of VET
Accuracy test cross-check with LSF data (ratio of unemployed to new hires)
The accuracy of the submitted lists of shortage and surplus occupations should be assessed
by comparing the most widely reported surplus and shortage occupations with the estimated values of the ratios of employed (by previous occupation) to new hires at the aggregated EU28 level These ratios should be based on an analysis of the most up-to date
Labour Force Survey (LFS) data
Gender balance assessment LFS data on employment at occupational level by gender PES job
seekers
The gender composition of shortage and surplus occupations should be based on the most
up to date analyses of LFS data on employment by gender and the PES job seeker data
Regional balance assessment LSF data data from relevant agencies
Where regional data is required other agencies and institutions should be requested to
provide the data in those cases where the data cannot be provided by the regional PES network because it is not geographically aligned to the NUTs regions
Labour shortages and surpluses 2017
2017 34
Directorate-General for Employment Social Affairs and Inclusion European Network of Public Employment Services (PES)
Number of occupations reporting should be extended beyond 20 occupations but with upper
limit (eg 50)
Consideration should be given to allowing the agencies responsible for identifying shortage
and surplus occupations a greater range of flexibility in terms of the numbers of occupations which should be identified A minimum to maximum range would be a more realistic approach as it would reflect the fact that the labour markets of the EEA vary significantly in size and performance
Timing of imbalance assessment September
It is proposed that the data gathering exercise should be brought forward to early September and that expert advice should be available on line throughout the data
gathering exercise
Labour shortages and surpluses 2017
2017 35
Directorate-General for Employment Social Affairs and Inclusion European Network of Public Employment Services (PES)
ANNEX 1 DATA COLLECTION TEMPLATE Information sought Explanation
Occupation title (text) Type in free text a list of occupations (one row one occupation) for which shortages and surpluses exist first list occupations for which there is a shortage the list should contain a maximum of 20 occupations if your list contains less than 20 occupations please provide a brief explanation in your email response for why the number is lower than 20 second list occupations for which there is a surplus the list should contain a maximum of 20 occupations if your list contains less than 20 occupations please provide a brief explanation in your email response for why the number is lower than 20
Shortagesurplus indicator For each occupation indicate if it refers to a shortage by typing in shortage or surplus by typing in surplus to identify surplus occupations you can examine for each occupation the ratio of the number of job seekers to the number of vacancies at the end of each year for example if there are 5000 shop assistants seeking employment and there are 200 vacancies at the end of the reference period the ratio is 251 you can rank the calculated ratios and report the occupations associated with the 20 highest ratios
Occupational classification used in your country
For each occupation indicate what occupational classification (if any) was used to identify this occupation for instance you can report a country specific classification ISCO ROME SOC etc If you donrsquot use occupational classifications type None
Occupation code to the lowest level of disaggregation (eg ISCO at 4 digits)
If you have indicated a classification used type the code for each occupation use the lowest level of disaggregation (eg 4 digit ISCO code) if you donrsquot use occupational classification leave black
ISCO-08 code at 4-digit level (or lower if 4-digit not available)
If you use occupational classification which is not ISCO-08 and if it is possible provide a translation of the national code to ISCO-08 code ISCO is the International Standard Classification of Occupations which is used to report to Eurostat code should be at 4 digits if this is not available than the lowest level of disaggregation that is available should be reported (3 digits if 4-digit code is not available 2 digits if neither 4-digit nor 3-digit code is available 1 digit if neither 4-digit 3-digit nor 2-digit code is available) if it is not possible to provide translation to ISCO-08 leave black if you have already reported ISCO-08 code in column 3 leave this column black
Estimate of shortagesurplus magnitude (high (gt3 of employment) medium (1-3 of employment) low (lt1 of employment))
For each occupation indicate a broad estimate of the magnitude of the shortagesurplus if you estimate that the shortagesurplus is less than 1 of the total employment in the occupation in question type low if between 1-3 type medium if greater than 3 type high if you cannot provide a rough estimate of magnitude type dont know
Current shortagesurplus (C) future short term (FST) future medium term (FMT) future long term (FLT) donrsquot know (indicate all that apply)
Against each occupation indicate if the identified shortagesurplus refers to present situation by typing C if the shortage is expected to occur in the short term future ie within 12 months by typing FST if it is expected to occur over the medium term (within 1-5 years) by typing FMT if it is expected to occur in the long term (in 5 or more years) by typing FLT if more than one time period applies indicate all relevant ones (eg for current shortagessurpluses that are expected to persist over the short term type C FST) if you dont know type dont know
Source of information on shortagessurpluses (eg PES administrative data (vacancies job seekers) PES survey third party survey Occupational forecasts other (specify) etc)
Indicate the source used to identify shortagesurplus for this occupation did you derive it from the PES administrative data on PES vacancies andor job seekers did you conduct a survey did you commission a third party to conduct a survey for you did you have occupational forecasts available did you use other research type in free text the full description of the source(s) eg National Employment Survey conducted by PES etc
Labour shortages and surpluses 2017
2017 36
Directorate-General for Employment Social Affairs and Inclusion European Network of Public Employment Services (PES)
Date for source of information Indicate the year that the information on shortagessurpluses (column 7) refers to eg type 2016 for a survey of difficult to fill vacancies conducted in 2016 even if the report was published in 2017
What indicator(s) suggested that there is a shortagesurplus
Indicate what criteria was used to conclude that this occupation is associated with a shortagesurplus for instance employers views sourcing from abroad to fill vacancies growth in employment faster than growth in educationtraining output time required to fill
vacancies higher than average etc
Share of females among job seekers in this occupation (surplus occupations only)
Indicate the percentage share of females among all job seekers in this occupation this is only applicable to surplus occupations
Skill or labour shortage Indicate if a shortage refers to a skill or labour shortage a skill shortage occurs where there is an insufficient supply of persons with the appropriate skills labour shortages occur where there is a sufficient number of skilled persons however an insufficient number of them is willing to take up employment in the occupation in question
Indicate the availability of data on shortagessurpluses at regional level (NUTS1 NUTS2 NUTS3 No data)
Indicate if data is available on the regional breakdown of shortagessurpluses by indicating the level of regional data available if multiple levels of regional disaggregation are available indicate the lowest level of disaggregation (eg NUTS3 rather than NUTS2) if there is no regional data available use no data
Labour shortages and surpluses 2017
2017 37
Directorate-General for Employment Social Affairs and Inclusion European Network of Public Employment Services (PES)
ANNEX 2 SHORTAGE OCCUPATIONS
Shortage occupation PES count
Cooks 16 Plumbers and pipe fitters 13 Generalist medical practitioners 12 Welders and flamecutters 12 Heavy truck and lorry drivers 11 Metal working machine tool setters and operators 11 Nursing professionals 11 Software developers 11 Agricultural and industrial machinery mechanics and repairers 10 Cleaners and helpers in offices hotels and other establishments 10 Commercial sales representatives 10 Specialist medical practitioners 10 Systems analysts 10 Bricklayers and related workers 9 Building and related electricians 9 Butchers fishmongers and related food preparers 9 Motor vehicle mechanics and repairers 9 Nursing associate professionals 9 Sheet-metal workers 9 Shop sales assistants 9 Waiters 9 Carpenters and joiners 8 Civil engineers 8 Concrete placers concrete finishers and related workers 8 Electrical engineering technicians 8 Electronics engineering technicians 8 Mechanical engineers 8 Primary school teachers 8 Structural-metal preparers and erectors 8 Electronics engineers 7
Health care assistants 7 Manufacturing supervisors 7 Mechanical engineering technicians 7 Secondary education teachers 7 Accountants 6 Applications programmers 6 Bus and tram drivers 6 Contact centre salespersons 6 Early childhood educators 6 Electrical mechanics and fitters 6 Floor layers and tile setters 6 Plasterers 6 Roofers 6 Sewing machine operators 6 Software and applications developers and analysts not elsewhere classified 6 Toolmakers and related workers 6 Web and multimedia developers 6 Air conditioning and refrigeration mechanics 5 Building frame and related trades workers not elsewhere classified 5 Chefs 5 Civil engineering labourers 5 Construction supervisors 5 Earthmoving and related plant operators 5 Electrical engineers 5 Electrical line installers and repairers 5 Engineering professionals not elsewhere classified 5 Hairdressers 5 Information and communications technology operations technicians 5 Manufacturing managers 5 Physiotherapists 5 Real estate agents and property managers 5 Research and development managers 5 Spray painters and varnishers 5 Accounting associate professionals 4 Bakers pastry-cooks and confectionery makers 4
Labour shortages and surpluses 2017
2017 38
Directorate-General for Employment Social Affairs and Inclusion European Network of Public Employment Services (PES)
Shortage occupation PES count
Blacksmiths hammersmiths and forging press workers 4 Civil engineering technicians 4 Crane hoist and related plant operators 4 Database designers and administrators 4 Industrial and production engineers 4 Painters and related workers 4 Physical and engineering science technicians not elsewhere classified 4 Plastic products machine operators 4 Social work and counselling professionals 4 Accounting and bookkeeping clerks 3 Administrative and executive secretaries 3 Ambulance workers 3 Building construction labourers 3 Car taxi and van drivers 3 Cartographers and surveyors 3 Cleaning and housekeeping supervisors in offices hotels and other establishments 3 Contact centre information clerks 3 Draughtspersons 3 Fast food preparers 3 Freight handlers 3 Gardeners horticultural and nursery growers 3 Home-based personal care workers 3 Hotel receptionists 3 Information and communications technology installers and servicers 3 Insulation workers 3 Kitchen helpers 3 Manufacturing labourers not elsewhere classified 3 Medical imaging and therapeutic equipment technicians 3 Metal moulders and coremakers 3 Metal polishers wheel grinders and tool sharpeners 3 Midwifery professionals 3 Other language teachers 3 Personal services workers not elsewhere classified 3
Pharmacists 3 Policy administration professionals 3 Printers 3 Process control technicians not elsewhere classified 3 Sales and marketing managers 3 Shop supervisors 3 Special needs teachers 3 Stock clerks 3 Supply distribution and related managers 3 Survey and market research interviewers 3 Systems administrators 3 Technical and medical sales professionals (excluding ICT) 3 Translators interpreters and other linguists 3 Transport clerks 3 Vocational education teachers 3 Advertising and marketing professionals 2 Audiologists and speech therapists 2 Bartenders 2 Beauticians and related workers 2 Cashiers and ticket clerks 2 Chemical engineers 2 Child care workers 2 Computer network and systems technicians 2 Computer network professionals 2 Construction managers 2 Craft and related workers not elsewhere classified 2 Credit and loans officers 2 Crop farm labourers 2 Database and network professionals not elsewhere classified 2 Dentists 2 Domestic cleaners and helpers 2 Door to door salespersons 2 Driving instructors 2 Electrical and electronic equipment assemblers 2 Electronics mechanics and servicers 2 Elementary workers not elsewhere classified 2 Employment agents and contractors 2
Labour shortages and surpluses 2017
2017 39
Directorate-General for Employment Social Affairs and Inclusion European Network of Public Employment Services (PES)
Shortage occupation PES count
Field crop and vegetable growers 2 Financial analysts 2 Financial and investment advisers 2 Forestry and related workers 2 Garbage and recycling collectors 2 General office clerks 2 Graphic and multimedia designers 2 Information and communications technology service managers 2 Insurance representatives 2 Locomotive engine drivers 2 Mail carriers and sorting clerks 2 Management and organization analysts 2 Mathematicians actuaries and statisticians 2 Mechanical machinery assemblers 2 Medical and dental prosthetic technicians 2 Medical assistants 2 Messengers package deliverers and luggage porters 2 Metal finishing plating and coating machine operators 2 Metal processing plant operators 2 Optometrists and ophthalmic opticians 2 Personal care workers in health services not elsewhere classified 2 Police officers 2 Policy and planning managers 2 Production clerks 2 Restaurant managers 2 Retail and wholesale trade managers 2 Sales workers not elsewhere classified 2 Sewing embroidery and related workers 2 Street food salespersons 2 Tailors dressmakers furriers and hatters 2 Telecommunications engineers 2 Advertising and public relations managers 1 Aged care services managers 1
Agricultural technicians 1 Aircraft engine mechanics and repairers 1 Aircraft pilots and related associate professionals 1 Assemblers not elsewhere classified 1 Authors and related writers 1 Bank tellers and related clerks 1 Bleaching dyeing and fabric cleaning machine operators 1 Bookmakers croupiers and related gaming workers 1 Business services agents not elsewhere classified 1 Buyers 1 Cabinet-makers and related workers 1 Cement stone and other mineral products machine operators 1 Chemical and physical science technicians 1 Chemical engineering technicians 1 Chemical processing plant controllers 1 Chemical products plant and machine operators 1 Chemists 1 Conference and event planners 1 Customs and border inspectors 1 Data entry clerks 1 Dental assistants and therapists 1 Dieticians and nutritionists 1 Dispensing opticians 1 Domestic housekeepers 1 Economists 1 Education methods specialists 1 Environmental and occupational health and hygiene professionals 1 Environmental and occupational health inspectors and associates 1 Fibre preparing spinning and winding machine operators 1 Finance managers 1 Financial and insurance services branch managers 1 Fire-fighters 1 Fitness and recreation instructors and program leaders 1 Food and beverage tasters and graders 1 Food and related products machine operators 1
Labour shortages and surpluses 2017
2017 40
Directorate-General for Employment Social Affairs and Inclusion European Network of Public Employment Services (PES)
Shortage occupation PES count
Food service counter attendants 1 Forestry labourers 1 Fruit vegetable and related preservers 1 Fur and leather preparing machine operators 1 Glass and ceramics plant operators 1 Hand launderers and pressers 1 Hand packers 1 Handicraft workers in textile leather and related materials 1 Health associate professionals not elsewhere classified 1 Health professionals not elsewhere classified 1 House builders 1 Human resource managers 1 Incinerator and water treatment plant operators 1 Information and communications technology user support technicians 1 Judges 1 Lawyers 1 Legal and related associate professionals 1 Legal professionals not elsewhere classified 1 Library clerks 1 Lifting truck operators 1 Livestock and dairy producers 1 Livestock farm labourers 1 Medical and pathology laboratory technicians 1 Medical secretaries 1 Metal production process controllers 1 Mining and quarrying labourers 1 Mining engineers metallurgists and related professionals 1 Mixed crop and animal producers 1 Mixed crop growers 1 Motorcycle drivers 1 Odd job persons 1 Other cleaning workers 1 Other music teachers 1
Paper products machine operators 1 Personnel and careers professionals 1 Personnel clerks 1 Pet groomers and animal care workers 1 Physicists and astronomers 1 Physiotherapy technicians and assistants 1 Potters and related workers 1 Power production plant operators 1 Prison guards 1 Product and garment designers 1 Psychologists 1 Pulp and papermaking plant operators 1 Railway brake signal and switch operators 1 Receptionists (general) 1 Refuse sorters 1 Riggers and cable splicers 1 Scribes and related workers 1 Secretaries (general) 1 Securities and finance dealers and brokers 1 Security guards 1 Senior government officials 1 Senior officials of special-interest organizations 1 Shelf fillers 1 Ships engineers 1 Shoemaking and related machine operators 1 Social work associate professionals 1 Stall and market salespersons 1 Stationary plant and machine operators not elsewhere classified 1 Stonemasons stone cutters splitters and carvers 1 Street and related service workers 1 Sweepers and related labourers 1 Teaching professionals not elsewhere classified 1 Telecommunications engineering technicians 1 Textile fur and leather products machine operators not elsewhere classified 1 Trade brokers 1 Travel attendants and travel stewards 1 Travel guides 1
Labour shortages and surpluses 2017
2017 41
Directorate-General for Employment Social Affairs and Inclusion European Network of Public Employment Services (PES)
Shortage occupation PES count
Tree and shrub crop growers 1 Underwater divers 1 University and higher education teachers 1 Vehicle cleaners 1 Veterinarians 1 Weaving and knitting machine operators 1 Web technicians 1 Wood processing plant operators 1 Woodworking-machine tool setters and operators 1
Labour shortages and surpluses 2017
2017 42
Directorate-General for Employment Social Affairs and Inclusion European Network of Public Employment Services (PES)
ANNEX 3 SURPLUS OCCUPATIONS
Surplus occupation PES count
General office clerks 8 Shop sales assistants 8 Advertising and marketing professionals 6 Bank tellers and related clerks 6 Sociologists anthropologists and related professionals 6 Child care workers 5 Hairdressers 5 Journalists 5 Cashiers and ticket clerks 4 Cleaners and helpers in offices hotels and other establishments 4 Hand packers 4 Mail carriers and sorting clerks 4 Photographers 4 Receptionists (general) 4 Tailors dressmakers furriers and hatters 4 Accounting and bookkeeping clerks 3 Administrative and executive secretaries 3 Beauticians and related workers 3 Biologists botanists zoologists and related professionals 3 Bricklayers and related workers 3 Broadcasting and audio-visual technicians 3 Civil engineering labourers 3 Economists 3 Gardeners horticultural and nursery growers 3 Interior designers and decorators 3 Kitchen helpers 3 Legal professionals not elsewhere classified 3 Manufacturing labourers not elsewhere classified 3 Motor vehicle mechanics and repairers 3
Musicians singers and composers 3 Other artistic and cultural associate professionals 3 Painters and related workers 3 Philosophers historians and political scientists 3 Security guards 3 Sweepers and related labourers 3 Travel consultants and clerks 3 Waiters 3 Actors 2 Archivists and curators 2 Bakers pastry-cooks and confectionery makers 2 Bartenders 2 Building construction labourers 2 Business services and administration managers not elsewhere classified 2 Cabinet-makers and related workers 2 Car taxi and van drivers 2 Chemists 2 Cleaning and housekeeping supervisors in offices hotels and other establishments 2 Credit and loans officers 2 Customs and border inspectors 2 Elementary workers not elsewhere classified 2 Film stage and related directors and producers 2 Financial analysts 2 Forestry and related workers 2 Freight handlers 2 Graphic and multimedia designers 2 Health care assistants 2 Hotel receptionists 2 Lawyers 2 Legal and related associate professionals 2 Library clerks 2 Livestock and dairy producers 2 Management and organization analysts 2 Messengers package deliverers and luggage porters 2 Odd job persons 2 Office supervisors 2 Plasterers 2
Labour shortages and surpluses 2017
2017 43
Directorate-General for Employment Social Affairs and Inclusion European Network of Public Employment Services (PES)
Surplus occupation PES count
Police officers 2 Pre-press technicians 2 Print finishing and binding workers 2 Printers 2 Prison guards 2 Product and garment designers 2 Psychologists 2 Public relations professionals 2 Religious professionals 2 Secondary education teachers 2 Secretaries (general) 2 Social work and counselling professionals 2 Stall and market salespersons 2 Stock clerks 2 Teachers aides 2 Telephone switchboard operators 2 Travel guides 2 Visual artists 2 Advertising and public relations managers 1 Agricultural technicians 1 Announcers on radio television and other media 1 Assemblers not elsewhere classified 1 Building and related electricians 1 Building architects 1 Building caretakers 1 Building frame and related trades workers not elsewhere classified 1 Business services agents not elsewhere classified 1 Buyers 1 Carpenters and joiners 1 Chemical engineers 1 Civil engineers 1 Clearing and forwarding agents 1 Clerical support workers not elsewhere classified 1
Commercial sales representatives 1 Conference and event planners 1 Contact centre information clerks 1 Contact centre salespersons 1 Cooks 1 Crane hoist and related plant operators 1 Creative and performing artists not elsewhere classified 1 Dancers and choreographers 1 Data entry clerks 1 Database designers and administrators 1 Domestic cleaners and helpers 1 Domestic housekeepers 1 Draughtspersons 1 Driving instructors 1 Early childhood educators 1 Electronics mechanics and servicers 1 Farming forestry and fisheries advisers 1 Fashion and other models 1 Fast food preparers 1 Field crop and vegetable growers 1 Filing and copying clerks 1 Finance managers 1 Financial and insurance services branch managers 1 Financial and investment advisers 1 Fire-fighters 1 Fitness and recreation instructors and program leaders 1 Floor layers and tile setters 1 Food service counter attendants 1 Fruit vegetable and related preservers 1 Gallery museum and library technicians 1 Garbage and recycling collectors 1 Garment and related pattern-makers and cutters 1 Glass and ceramics plant operators 1 Government tax and excise officials 1 Hand launderers and pressers 1
Labour shortages and surpluses 2017
2017 44
Directorate-General for Employment Social Affairs and Inclusion European Network of Public Employment Services (PES)
Surplus occupation PES count
Heavy truck and lorry drivers 1 House builders 1 Hunters and trappers 1 Information and communications technology installers and servicers 1 Information and communications technology user support technicians 1 Insurance representatives 1 Jewellery and precious-metal workers 1 Judges 1 Legal secretaries 1 Librarians and related information professionals 1 Life science technicians (excluding medical) 1 Lifting truck operators 1 Managing directors and chief executives 1 Manufacturing supervisors 1 Medical and dental prosthetic technicians 1 Metal moulders and coremakers 1 Mining and quarrying labourers 1 Mixed crop and animal producers 1 Mixed crop growers 1 Mobile farm and forestry plant operators 1 Musical instrument makers and tuners 1 Other language teachers 1 Pawnbrokers and money-lenders 1 Personnel and careers professionals 1 Pet groomers and animal care workers 1 Photographic products machine operators 1 Physical and engineering science technicians not elsewhere classified 1 Physicists and astronomers 1 Police inspectors and detectives 1 Precision-instrument makers and repairers 1 Primary school teachers 1 Process control technicians not elsewhere classified 1 Product graders and testers (excluding foods and beverages) 1
Production clerks 1 Professional services managers not elsewhere classified 1 Protective services workers not elsewhere classified 1 Research and development managers 1 Retail and wholesale trade managers 1 Roofers 1 Sales workers not elsewhere classified 1 Senior government officials 1 Service station attendants 1 Shelf fillers 1 Shop supervisors 1 Social work associate professionals 1 Special needs teachers 1 Spray painters and varnishers 1 Statistical mathematical and related associate professionals 1 Stonemasons stone cutters splitters and carvers 1 Street food salespersons 1 Supply distribution and related managers 1 Teaching professionals not elsewhere classified 1 Technical and medical sales professionals (excluding ICT) 1 Training and staff development professionals 1 Translators interpreters and other linguists 1 Transport conductors 1 Tree and shrub crop growers 1 Typists and word processing operators 1 Undertakers and embalmers 1 Vocational education teachers 1 Weaving and knitting machine operators 1 Woodworking-machine tool setters and operators 1
Labour shortages and surpluses 2017
2017 45
Directorate-General for Employment Social Affairs and Inclusion European Network of Public Employment Services (PES)
ANNEX 4 THE RATIO OF UNEMPLOYED TO NEW HIRES
ISCO-08 title
2015
UE
Recruited in the
last year (lt12
months)
Ratio of UE to new recruits
Street and related service workers 85 104 08 Agricultural forestry and fishery labourers 3913 5343 07 Mining and construction labourers 1937 3525 05 Creative and performing artists 610 1115 05 Refuse workers 1036 1923 05 Painters building structure cleaners and related trades workers 1116 2117 05 Street and market salespersons 195 389 05 Building frame and related trades workers 3632 7353 05 Mining manufacturing and construction supervisors 626 1315 05 Ships deck crews and related workers 53 114 05 Market gardeners and crop growers 1471 3207 05 Managing directors and chief executives 304 667 05 Travel attendants conductors and guides 229 538 04 Wood treaters cabinet-makers and related trades workers 491 1159 04 Manufacturing labourers 1640 3909 04 Domestic hotel and office cleaners and helpers 5679 13545 04 Other stationary plant and machine operators 822 1961 04 Mobile plant operators 1038 2497 04 Building finishers and related trades workers 1519 3680 04 Textile fur and leather products machine operators 431 1048 04 Garment and related trades workers 422 1047 04 Chemical and photographic products plant and machine operators 157 389 04 Food processing and related trades workers 930 2330 04 Vehicle window laundry and other hand cleaning workers 291 754 04 Sheet and structural metal workers moulders and welders and related workers
996 2603 04
Waiters and bartenders 4399 11595 04 Cooks 1529 4039 04 Metal processing and finishing plant operators 208 557 04 Printing trades workers 203 548 04 Forestry and related workers 130 351 04 Protective services workers 1347 3658 04 Transport and storage labourers 2532 6939 04 Fishery workers hunters and trappers 46 128 04 Material-recording and transport clerks 1671 4630 04 Process control technicians 179 517 03 Mining and mineral processing plant operators 94 274 03 Telecommunications and broadcasting technicians 177 519 03 Blacksmiths toolmakers and related trades workers 816 2409 03 Building and housekeeping supervisors 678 2045 03
Secretaries (general) 1072 3259 03 Assemblers 850 2586 03 Other craft and related workers 258 810 03 Shop salespersons 6600 21042 03 Electrical equipment installers and repairers 958 3060 03 Food and related products machine operators 437 1400 03 Other sales workers 1087 3510 03 Food preparation assistants 1646 5337 03 Mixed crop and animal producers 387 1260 03 Car van and motorcycle drivers 1155 3764 03 Client information workers 1993 6531 03 Sports and fitness workers 605 1984 03 Handicraft workers 194 638 03 Life science technicians and related associate professionals 82 271 03 Keyboard operators 283 940 03 Electronics and telecommunications installers and repairers 290 963 03 Other personal services workers 313 1047 03 Vocational education teachers 279 940 03 Other teaching professionals 744 2518 03 General office clerks 966 3272 03 Authors journalists and linguists 335 1135 03 Hairdressers beauticians and related workers 806 2796 03
Labour shortages and surpluses 2017
2017 46
Directorate-General for Employment Social Affairs and Inclusion European Network of Public Employment Services (PES)
ISCO-08 title
2015
UE
Recruited in the
last year (lt12
months)
Ratio of UE to new recruits
Animal producers 189 660 03 Other elementary workers 976 3401 03 Machinery mechanics and repairers 1134 3962 03 Ship and aircraft controllers and technicians 80 281 03 Hotel and restaurant managers 344 1220 03 Cashiers and ticket clerks 908 3220 03 Retail and wholesale trade managers 224 809 03 Sales marketing and development managers 311 1124 03 Physical and engineering science technicians 1204 4366 03 Administrative and specialised secretaries 1106 4040 03 Sales and purchasing agents and brokers 1294 4754 03 Rubber plastic and paper products machine operators 256 941 03 Artistic cultural and culinary associate professionals 511 1906 03 Numerical clerks 944 3532 03 Other services managers 184 691 03 Child care workers and teachers aides 1335 5005 03 Heavy truck and bus drivers 1426 5349 03 Business services and administration managers 383 1439 03 Information and communications technology service managers 67 257 03 Regulatory government associate professionals 209 807 03 Life science professionals 176 681 03 Wood processing and papermaking plant operators 97 379 03 Locomotive engine drivers and related workers 46 179 03 Legal professionals 315 1245 03 Personal care workers in health services 2195 8787 02 Physical and earth science professionals 85 345 02 Street vendors (excluding food) 50 204 02 Architects planners surveyors and designers 515 2092 02 Other clerical support workers 901 3657 02 Business services agents 510 2114 02 Manufacturing mining construction and distribution managers 361 1507 02 Tellers money collectors and related clerks 381 1612 02 Librarians archivists and curators 58 248 02 Medical and pharmaceutical technicians 255 1099 02 University and higher education teachers 301 1333 02 Information and communications technology operations and user support technicians
418 1888 02
Legal social and religious associate professionals 920 4348 02 Financial and mathematical associate professionals 601 2852 02 Sales marketing and public relations professionals 865 4172 02 Finance professionals 472 2281 02 Engineering professionals (excluding electrotechnology) 635 3118 02 Other health associate professionals 531 2657 02
Social and religious professionals 460 2317 02 Professional services managers 176 891 02 Nursing and midwifery associate professionals 556 2855 02 Legislators and senior officials 53 286 02 Database and network professionals 83 455 02 Administration professionals 641 3673 02 Primary school and early childhood teachers 575 3345 02 Electrotechnology engineers 142 827 02 Secondary education teachers 471 2812 02 Other health professionals 346 2083 02 Nursing and midwifery professionals 273 1760 02 Software and applications developers and analysts 631 4159 02 Medical doctors 293 1944 02 No occupation 152894 00
No answer 2531 578 44 Total 249561 294937 08
Labour shortages and surpluses 2017
2017 47
Directorate-General for Employment Social Affairs and Inclusion European Network of Public Employment Services (PES)
HOW TO OBTAIN EU PUBLICATIONS
Free publications
bull one copy
via EU Bookshop (httpbookshopeuropaeu)
bull more than one copy or postersmaps
from the European Unionrsquos representations (httpeceuropaeurepresent_enhtm)
from the delegations in non-EU countries
(httpeeaseuropaeudelegationsindex_enhtm)
by contacting the Europe Direct service (httpeuropaeueuropedirectindex_enhtm)
or calling 00 800 6 7 8 9 10 11 (free phone number from anywhere in the EU) () () The information given is free as are most calls (though some operators phone boxes or hotels may charge you)
Priced publications
bull via EU Bookshop (httpbookshopeuropaeu)
Priced subscriptions
bull via one of the sales agents of the Publications Office of the European Union
(httppublicationseuropaeuothersagentsindex_enhtm)
doi 10276731262
KE-0
1-1
8-2
63-E
N-N
[Ca
talo
gu
e n
um
be
r]
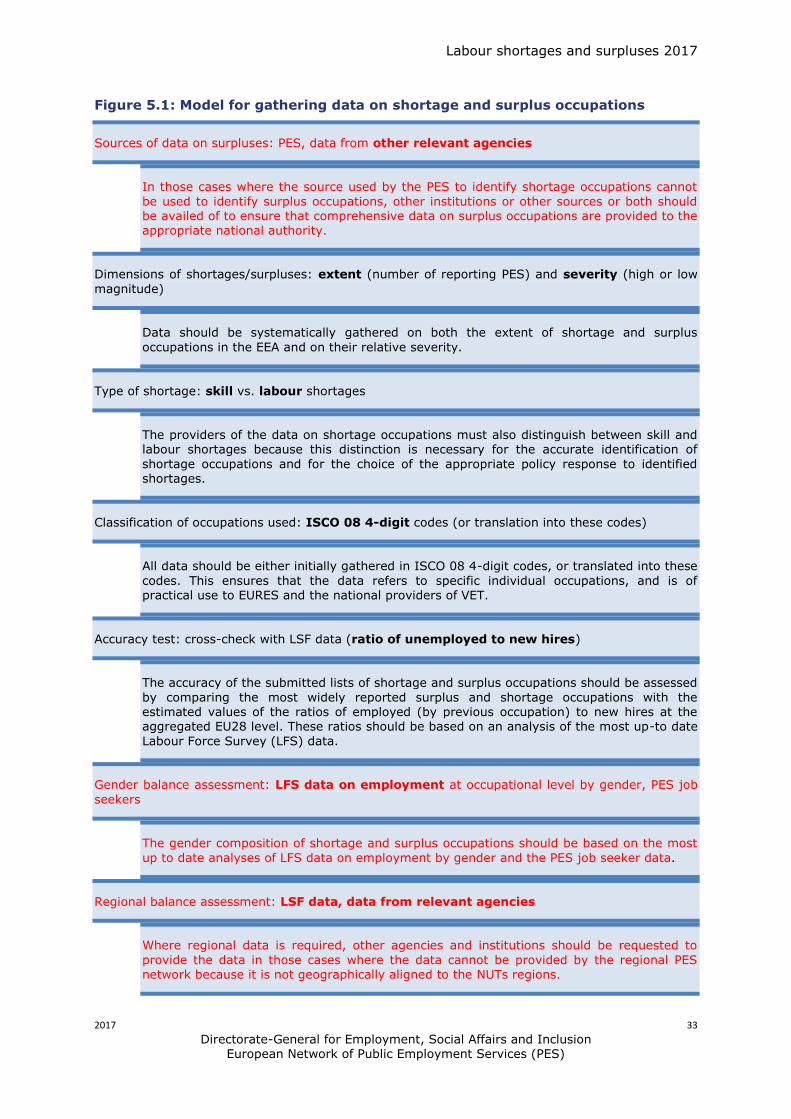
Labour shortages and surpluses 2017
2017 34
Directorate-General for Employment Social Affairs and Inclusion European Network of Public Employment Services (PES)
Number of occupations reporting should be extended beyond 20 occupations but with upper
limit (eg 50)
Consideration should be given to allowing the agencies responsible for identifying shortage
and surplus occupations a greater range of flexibility in terms of the numbers of occupations which should be identified A minimum to maximum range would be a more realistic approach as it would reflect the fact that the labour markets of the EEA vary significantly in size and performance
Timing of imbalance assessment September
It is proposed that the data gathering exercise should be brought forward to early September and that expert advice should be available on line throughout the data
gathering exercise
Labour shortages and surpluses 2017
2017 35
Directorate-General for Employment Social Affairs and Inclusion European Network of Public Employment Services (PES)
ANNEX 1 DATA COLLECTION TEMPLATE Information sought Explanation
Occupation title (text) Type in free text a list of occupations (one row one occupation) for which shortages and surpluses exist first list occupations for which there is a shortage the list should contain a maximum of 20 occupations if your list contains less than 20 occupations please provide a brief explanation in your email response for why the number is lower than 20 second list occupations for which there is a surplus the list should contain a maximum of 20 occupations if your list contains less than 20 occupations please provide a brief explanation in your email response for why the number is lower than 20
Shortagesurplus indicator For each occupation indicate if it refers to a shortage by typing in shortage or surplus by typing in surplus to identify surplus occupations you can examine for each occupation the ratio of the number of job seekers to the number of vacancies at the end of each year for example if there are 5000 shop assistants seeking employment and there are 200 vacancies at the end of the reference period the ratio is 251 you can rank the calculated ratios and report the occupations associated with the 20 highest ratios
Occupational classification used in your country
For each occupation indicate what occupational classification (if any) was used to identify this occupation for instance you can report a country specific classification ISCO ROME SOC etc If you donrsquot use occupational classifications type None
Occupation code to the lowest level of disaggregation (eg ISCO at 4 digits)
If you have indicated a classification used type the code for each occupation use the lowest level of disaggregation (eg 4 digit ISCO code) if you donrsquot use occupational classification leave black
ISCO-08 code at 4-digit level (or lower if 4-digit not available)
If you use occupational classification which is not ISCO-08 and if it is possible provide a translation of the national code to ISCO-08 code ISCO is the International Standard Classification of Occupations which is used to report to Eurostat code should be at 4 digits if this is not available than the lowest level of disaggregation that is available should be reported (3 digits if 4-digit code is not available 2 digits if neither 4-digit nor 3-digit code is available 1 digit if neither 4-digit 3-digit nor 2-digit code is available) if it is not possible to provide translation to ISCO-08 leave black if you have already reported ISCO-08 code in column 3 leave this column black
Estimate of shortagesurplus magnitude (high (gt3 of employment) medium (1-3 of employment) low (lt1 of employment))
For each occupation indicate a broad estimate of the magnitude of the shortagesurplus if you estimate that the shortagesurplus is less than 1 of the total employment in the occupation in question type low if between 1-3 type medium if greater than 3 type high if you cannot provide a rough estimate of magnitude type dont know
Current shortagesurplus (C) future short term (FST) future medium term (FMT) future long term (FLT) donrsquot know (indicate all that apply)
Against each occupation indicate if the identified shortagesurplus refers to present situation by typing C if the shortage is expected to occur in the short term future ie within 12 months by typing FST if it is expected to occur over the medium term (within 1-5 years) by typing FMT if it is expected to occur in the long term (in 5 or more years) by typing FLT if more than one time period applies indicate all relevant ones (eg for current shortagessurpluses that are expected to persist over the short term type C FST) if you dont know type dont know
Source of information on shortagessurpluses (eg PES administrative data (vacancies job seekers) PES survey third party survey Occupational forecasts other (specify) etc)
Indicate the source used to identify shortagesurplus for this occupation did you derive it from the PES administrative data on PES vacancies andor job seekers did you conduct a survey did you commission a third party to conduct a survey for you did you have occupational forecasts available did you use other research type in free text the full description of the source(s) eg National Employment Survey conducted by PES etc
Labour shortages and surpluses 2017
2017 36
Directorate-General for Employment Social Affairs and Inclusion European Network of Public Employment Services (PES)
Date for source of information Indicate the year that the information on shortagessurpluses (column 7) refers to eg type 2016 for a survey of difficult to fill vacancies conducted in 2016 even if the report was published in 2017
What indicator(s) suggested that there is a shortagesurplus
Indicate what criteria was used to conclude that this occupation is associated with a shortagesurplus for instance employers views sourcing from abroad to fill vacancies growth in employment faster than growth in educationtraining output time required to fill
vacancies higher than average etc
Share of females among job seekers in this occupation (surplus occupations only)
Indicate the percentage share of females among all job seekers in this occupation this is only applicable to surplus occupations
Skill or labour shortage Indicate if a shortage refers to a skill or labour shortage a skill shortage occurs where there is an insufficient supply of persons with the appropriate skills labour shortages occur where there is a sufficient number of skilled persons however an insufficient number of them is willing to take up employment in the occupation in question
Indicate the availability of data on shortagessurpluses at regional level (NUTS1 NUTS2 NUTS3 No data)
Indicate if data is available on the regional breakdown of shortagessurpluses by indicating the level of regional data available if multiple levels of regional disaggregation are available indicate the lowest level of disaggregation (eg NUTS3 rather than NUTS2) if there is no regional data available use no data
Labour shortages and surpluses 2017
2017 37
Directorate-General for Employment Social Affairs and Inclusion European Network of Public Employment Services (PES)
ANNEX 2 SHORTAGE OCCUPATIONS
Shortage occupation PES count
Cooks 16 Plumbers and pipe fitters 13 Generalist medical practitioners 12 Welders and flamecutters 12 Heavy truck and lorry drivers 11 Metal working machine tool setters and operators 11 Nursing professionals 11 Software developers 11 Agricultural and industrial machinery mechanics and repairers 10 Cleaners and helpers in offices hotels and other establishments 10 Commercial sales representatives 10 Specialist medical practitioners 10 Systems analysts 10 Bricklayers and related workers 9 Building and related electricians 9 Butchers fishmongers and related food preparers 9 Motor vehicle mechanics and repairers 9 Nursing associate professionals 9 Sheet-metal workers 9 Shop sales assistants 9 Waiters 9 Carpenters and joiners 8 Civil engineers 8 Concrete placers concrete finishers and related workers 8 Electrical engineering technicians 8 Electronics engineering technicians 8 Mechanical engineers 8 Primary school teachers 8 Structural-metal preparers and erectors 8 Electronics engineers 7
Health care assistants 7 Manufacturing supervisors 7 Mechanical engineering technicians 7 Secondary education teachers 7 Accountants 6 Applications programmers 6 Bus and tram drivers 6 Contact centre salespersons 6 Early childhood educators 6 Electrical mechanics and fitters 6 Floor layers and tile setters 6 Plasterers 6 Roofers 6 Sewing machine operators 6 Software and applications developers and analysts not elsewhere classified 6 Toolmakers and related workers 6 Web and multimedia developers 6 Air conditioning and refrigeration mechanics 5 Building frame and related trades workers not elsewhere classified 5 Chefs 5 Civil engineering labourers 5 Construction supervisors 5 Earthmoving and related plant operators 5 Electrical engineers 5 Electrical line installers and repairers 5 Engineering professionals not elsewhere classified 5 Hairdressers 5 Information and communications technology operations technicians 5 Manufacturing managers 5 Physiotherapists 5 Real estate agents and property managers 5 Research and development managers 5 Spray painters and varnishers 5 Accounting associate professionals 4 Bakers pastry-cooks and confectionery makers 4
Labour shortages and surpluses 2017
2017 38
Directorate-General for Employment Social Affairs and Inclusion European Network of Public Employment Services (PES)
Shortage occupation PES count
Blacksmiths hammersmiths and forging press workers 4 Civil engineering technicians 4 Crane hoist and related plant operators 4 Database designers and administrators 4 Industrial and production engineers 4 Painters and related workers 4 Physical and engineering science technicians not elsewhere classified 4 Plastic products machine operators 4 Social work and counselling professionals 4 Accounting and bookkeeping clerks 3 Administrative and executive secretaries 3 Ambulance workers 3 Building construction labourers 3 Car taxi and van drivers 3 Cartographers and surveyors 3 Cleaning and housekeeping supervisors in offices hotels and other establishments 3 Contact centre information clerks 3 Draughtspersons 3 Fast food preparers 3 Freight handlers 3 Gardeners horticultural and nursery growers 3 Home-based personal care workers 3 Hotel receptionists 3 Information and communications technology installers and servicers 3 Insulation workers 3 Kitchen helpers 3 Manufacturing labourers not elsewhere classified 3 Medical imaging and therapeutic equipment technicians 3 Metal moulders and coremakers 3 Metal polishers wheel grinders and tool sharpeners 3 Midwifery professionals 3 Other language teachers 3 Personal services workers not elsewhere classified 3
Pharmacists 3 Policy administration professionals 3 Printers 3 Process control technicians not elsewhere classified 3 Sales and marketing managers 3 Shop supervisors 3 Special needs teachers 3 Stock clerks 3 Supply distribution and related managers 3 Survey and market research interviewers 3 Systems administrators 3 Technical and medical sales professionals (excluding ICT) 3 Translators interpreters and other linguists 3 Transport clerks 3 Vocational education teachers 3 Advertising and marketing professionals 2 Audiologists and speech therapists 2 Bartenders 2 Beauticians and related workers 2 Cashiers and ticket clerks 2 Chemical engineers 2 Child care workers 2 Computer network and systems technicians 2 Computer network professionals 2 Construction managers 2 Craft and related workers not elsewhere classified 2 Credit and loans officers 2 Crop farm labourers 2 Database and network professionals not elsewhere classified 2 Dentists 2 Domestic cleaners and helpers 2 Door to door salespersons 2 Driving instructors 2 Electrical and electronic equipment assemblers 2 Electronics mechanics and servicers 2 Elementary workers not elsewhere classified 2 Employment agents and contractors 2
Labour shortages and surpluses 2017
2017 39
Directorate-General for Employment Social Affairs and Inclusion European Network of Public Employment Services (PES)
Shortage occupation PES count
Field crop and vegetable growers 2 Financial analysts 2 Financial and investment advisers 2 Forestry and related workers 2 Garbage and recycling collectors 2 General office clerks 2 Graphic and multimedia designers 2 Information and communications technology service managers 2 Insurance representatives 2 Locomotive engine drivers 2 Mail carriers and sorting clerks 2 Management and organization analysts 2 Mathematicians actuaries and statisticians 2 Mechanical machinery assemblers 2 Medical and dental prosthetic technicians 2 Medical assistants 2 Messengers package deliverers and luggage porters 2 Metal finishing plating and coating machine operators 2 Metal processing plant operators 2 Optometrists and ophthalmic opticians 2 Personal care workers in health services not elsewhere classified 2 Police officers 2 Policy and planning managers 2 Production clerks 2 Restaurant managers 2 Retail and wholesale trade managers 2 Sales workers not elsewhere classified 2 Sewing embroidery and related workers 2 Street food salespersons 2 Tailors dressmakers furriers and hatters 2 Telecommunications engineers 2 Advertising and public relations managers 1 Aged care services managers 1
Agricultural technicians 1 Aircraft engine mechanics and repairers 1 Aircraft pilots and related associate professionals 1 Assemblers not elsewhere classified 1 Authors and related writers 1 Bank tellers and related clerks 1 Bleaching dyeing and fabric cleaning machine operators 1 Bookmakers croupiers and related gaming workers 1 Business services agents not elsewhere classified 1 Buyers 1 Cabinet-makers and related workers 1 Cement stone and other mineral products machine operators 1 Chemical and physical science technicians 1 Chemical engineering technicians 1 Chemical processing plant controllers 1 Chemical products plant and machine operators 1 Chemists 1 Conference and event planners 1 Customs and border inspectors 1 Data entry clerks 1 Dental assistants and therapists 1 Dieticians and nutritionists 1 Dispensing opticians 1 Domestic housekeepers 1 Economists 1 Education methods specialists 1 Environmental and occupational health and hygiene professionals 1 Environmental and occupational health inspectors and associates 1 Fibre preparing spinning and winding machine operators 1 Finance managers 1 Financial and insurance services branch managers 1 Fire-fighters 1 Fitness and recreation instructors and program leaders 1 Food and beverage tasters and graders 1 Food and related products machine operators 1
Labour shortages and surpluses 2017
2017 40
Directorate-General for Employment Social Affairs and Inclusion European Network of Public Employment Services (PES)
Shortage occupation PES count
Food service counter attendants 1 Forestry labourers 1 Fruit vegetable and related preservers 1 Fur and leather preparing machine operators 1 Glass and ceramics plant operators 1 Hand launderers and pressers 1 Hand packers 1 Handicraft workers in textile leather and related materials 1 Health associate professionals not elsewhere classified 1 Health professionals not elsewhere classified 1 House builders 1 Human resource managers 1 Incinerator and water treatment plant operators 1 Information and communications technology user support technicians 1 Judges 1 Lawyers 1 Legal and related associate professionals 1 Legal professionals not elsewhere classified 1 Library clerks 1 Lifting truck operators 1 Livestock and dairy producers 1 Livestock farm labourers 1 Medical and pathology laboratory technicians 1 Medical secretaries 1 Metal production process controllers 1 Mining and quarrying labourers 1 Mining engineers metallurgists and related professionals 1 Mixed crop and animal producers 1 Mixed crop growers 1 Motorcycle drivers 1 Odd job persons 1 Other cleaning workers 1 Other music teachers 1
Paper products machine operators 1 Personnel and careers professionals 1 Personnel clerks 1 Pet groomers and animal care workers 1 Physicists and astronomers 1 Physiotherapy technicians and assistants 1 Potters and related workers 1 Power production plant operators 1 Prison guards 1 Product and garment designers 1 Psychologists 1 Pulp and papermaking plant operators 1 Railway brake signal and switch operators 1 Receptionists (general) 1 Refuse sorters 1 Riggers and cable splicers 1 Scribes and related workers 1 Secretaries (general) 1 Securities and finance dealers and brokers 1 Security guards 1 Senior government officials 1 Senior officials of special-interest organizations 1 Shelf fillers 1 Ships engineers 1 Shoemaking and related machine operators 1 Social work associate professionals 1 Stall and market salespersons 1 Stationary plant and machine operators not elsewhere classified 1 Stonemasons stone cutters splitters and carvers 1 Street and related service workers 1 Sweepers and related labourers 1 Teaching professionals not elsewhere classified 1 Telecommunications engineering technicians 1 Textile fur and leather products machine operators not elsewhere classified 1 Trade brokers 1 Travel attendants and travel stewards 1 Travel guides 1
Labour shortages and surpluses 2017
2017 41
Directorate-General for Employment Social Affairs and Inclusion European Network of Public Employment Services (PES)
Shortage occupation PES count
Tree and shrub crop growers 1 Underwater divers 1 University and higher education teachers 1 Vehicle cleaners 1 Veterinarians 1 Weaving and knitting machine operators 1 Web technicians 1 Wood processing plant operators 1 Woodworking-machine tool setters and operators 1
Labour shortages and surpluses 2017
2017 42
Directorate-General for Employment Social Affairs and Inclusion European Network of Public Employment Services (PES)
ANNEX 3 SURPLUS OCCUPATIONS
Surplus occupation PES count
General office clerks 8 Shop sales assistants 8 Advertising and marketing professionals 6 Bank tellers and related clerks 6 Sociologists anthropologists and related professionals 6 Child care workers 5 Hairdressers 5 Journalists 5 Cashiers and ticket clerks 4 Cleaners and helpers in offices hotels and other establishments 4 Hand packers 4 Mail carriers and sorting clerks 4 Photographers 4 Receptionists (general) 4 Tailors dressmakers furriers and hatters 4 Accounting and bookkeeping clerks 3 Administrative and executive secretaries 3 Beauticians and related workers 3 Biologists botanists zoologists and related professionals 3 Bricklayers and related workers 3 Broadcasting and audio-visual technicians 3 Civil engineering labourers 3 Economists 3 Gardeners horticultural and nursery growers 3 Interior designers and decorators 3 Kitchen helpers 3 Legal professionals not elsewhere classified 3 Manufacturing labourers not elsewhere classified 3 Motor vehicle mechanics and repairers 3
Musicians singers and composers 3 Other artistic and cultural associate professionals 3 Painters and related workers 3 Philosophers historians and political scientists 3 Security guards 3 Sweepers and related labourers 3 Travel consultants and clerks 3 Waiters 3 Actors 2 Archivists and curators 2 Bakers pastry-cooks and confectionery makers 2 Bartenders 2 Building construction labourers 2 Business services and administration managers not elsewhere classified 2 Cabinet-makers and related workers 2 Car taxi and van drivers 2 Chemists 2 Cleaning and housekeeping supervisors in offices hotels and other establishments 2 Credit and loans officers 2 Customs and border inspectors 2 Elementary workers not elsewhere classified 2 Film stage and related directors and producers 2 Financial analysts 2 Forestry and related workers 2 Freight handlers 2 Graphic and multimedia designers 2 Health care assistants 2 Hotel receptionists 2 Lawyers 2 Legal and related associate professionals 2 Library clerks 2 Livestock and dairy producers 2 Management and organization analysts 2 Messengers package deliverers and luggage porters 2 Odd job persons 2 Office supervisors 2 Plasterers 2
Labour shortages and surpluses 2017
2017 43
Directorate-General for Employment Social Affairs and Inclusion European Network of Public Employment Services (PES)
Surplus occupation PES count
Police officers 2 Pre-press technicians 2 Print finishing and binding workers 2 Printers 2 Prison guards 2 Product and garment designers 2 Psychologists 2 Public relations professionals 2 Religious professionals 2 Secondary education teachers 2 Secretaries (general) 2 Social work and counselling professionals 2 Stall and market salespersons 2 Stock clerks 2 Teachers aides 2 Telephone switchboard operators 2 Travel guides 2 Visual artists 2 Advertising and public relations managers 1 Agricultural technicians 1 Announcers on radio television and other media 1 Assemblers not elsewhere classified 1 Building and related electricians 1 Building architects 1 Building caretakers 1 Building frame and related trades workers not elsewhere classified 1 Business services agents not elsewhere classified 1 Buyers 1 Carpenters and joiners 1 Chemical engineers 1 Civil engineers 1 Clearing and forwarding agents 1 Clerical support workers not elsewhere classified 1
Commercial sales representatives 1 Conference and event planners 1 Contact centre information clerks 1 Contact centre salespersons 1 Cooks 1 Crane hoist and related plant operators 1 Creative and performing artists not elsewhere classified 1 Dancers and choreographers 1 Data entry clerks 1 Database designers and administrators 1 Domestic cleaners and helpers 1 Domestic housekeepers 1 Draughtspersons 1 Driving instructors 1 Early childhood educators 1 Electronics mechanics and servicers 1 Farming forestry and fisheries advisers 1 Fashion and other models 1 Fast food preparers 1 Field crop and vegetable growers 1 Filing and copying clerks 1 Finance managers 1 Financial and insurance services branch managers 1 Financial and investment advisers 1 Fire-fighters 1 Fitness and recreation instructors and program leaders 1 Floor layers and tile setters 1 Food service counter attendants 1 Fruit vegetable and related preservers 1 Gallery museum and library technicians 1 Garbage and recycling collectors 1 Garment and related pattern-makers and cutters 1 Glass and ceramics plant operators 1 Government tax and excise officials 1 Hand launderers and pressers 1
Labour shortages and surpluses 2017
2017 44
Directorate-General for Employment Social Affairs and Inclusion European Network of Public Employment Services (PES)
Surplus occupation PES count
Heavy truck and lorry drivers 1 House builders 1 Hunters and trappers 1 Information and communications technology installers and servicers 1 Information and communications technology user support technicians 1 Insurance representatives 1 Jewellery and precious-metal workers 1 Judges 1 Legal secretaries 1 Librarians and related information professionals 1 Life science technicians (excluding medical) 1 Lifting truck operators 1 Managing directors and chief executives 1 Manufacturing supervisors 1 Medical and dental prosthetic technicians 1 Metal moulders and coremakers 1 Mining and quarrying labourers 1 Mixed crop and animal producers 1 Mixed crop growers 1 Mobile farm and forestry plant operators 1 Musical instrument makers and tuners 1 Other language teachers 1 Pawnbrokers and money-lenders 1 Personnel and careers professionals 1 Pet groomers and animal care workers 1 Photographic products machine operators 1 Physical and engineering science technicians not elsewhere classified 1 Physicists and astronomers 1 Police inspectors and detectives 1 Precision-instrument makers and repairers 1 Primary school teachers 1 Process control technicians not elsewhere classified 1 Product graders and testers (excluding foods and beverages) 1
Production clerks 1 Professional services managers not elsewhere classified 1 Protective services workers not elsewhere classified 1 Research and development managers 1 Retail and wholesale trade managers 1 Roofers 1 Sales workers not elsewhere classified 1 Senior government officials 1 Service station attendants 1 Shelf fillers 1 Shop supervisors 1 Social work associate professionals 1 Special needs teachers 1 Spray painters and varnishers 1 Statistical mathematical and related associate professionals 1 Stonemasons stone cutters splitters and carvers 1 Street food salespersons 1 Supply distribution and related managers 1 Teaching professionals not elsewhere classified 1 Technical and medical sales professionals (excluding ICT) 1 Training and staff development professionals 1 Translators interpreters and other linguists 1 Transport conductors 1 Tree and shrub crop growers 1 Typists and word processing operators 1 Undertakers and embalmers 1 Vocational education teachers 1 Weaving and knitting machine operators 1 Woodworking-machine tool setters and operators 1
Labour shortages and surpluses 2017
2017 45
Directorate-General for Employment Social Affairs and Inclusion European Network of Public Employment Services (PES)
ANNEX 4 THE RATIO OF UNEMPLOYED TO NEW HIRES
ISCO-08 title
2015
UE
Recruited in the
last year (lt12
months)
Ratio of UE to new recruits
Street and related service workers 85 104 08 Agricultural forestry and fishery labourers 3913 5343 07 Mining and construction labourers 1937 3525 05 Creative and performing artists 610 1115 05 Refuse workers 1036 1923 05 Painters building structure cleaners and related trades workers 1116 2117 05 Street and market salespersons 195 389 05 Building frame and related trades workers 3632 7353 05 Mining manufacturing and construction supervisors 626 1315 05 Ships deck crews and related workers 53 114 05 Market gardeners and crop growers 1471 3207 05 Managing directors and chief executives 304 667 05 Travel attendants conductors and guides 229 538 04 Wood treaters cabinet-makers and related trades workers 491 1159 04 Manufacturing labourers 1640 3909 04 Domestic hotel and office cleaners and helpers 5679 13545 04 Other stationary plant and machine operators 822 1961 04 Mobile plant operators 1038 2497 04 Building finishers and related trades workers 1519 3680 04 Textile fur and leather products machine operators 431 1048 04 Garment and related trades workers 422 1047 04 Chemical and photographic products plant and machine operators 157 389 04 Food processing and related trades workers 930 2330 04 Vehicle window laundry and other hand cleaning workers 291 754 04 Sheet and structural metal workers moulders and welders and related workers
996 2603 04
Waiters and bartenders 4399 11595 04 Cooks 1529 4039 04 Metal processing and finishing plant operators 208 557 04 Printing trades workers 203 548 04 Forestry and related workers 130 351 04 Protective services workers 1347 3658 04 Transport and storage labourers 2532 6939 04 Fishery workers hunters and trappers 46 128 04 Material-recording and transport clerks 1671 4630 04 Process control technicians 179 517 03 Mining and mineral processing plant operators 94 274 03 Telecommunications and broadcasting technicians 177 519 03 Blacksmiths toolmakers and related trades workers 816 2409 03 Building and housekeeping supervisors 678 2045 03
Secretaries (general) 1072 3259 03 Assemblers 850 2586 03 Other craft and related workers 258 810 03 Shop salespersons 6600 21042 03 Electrical equipment installers and repairers 958 3060 03 Food and related products machine operators 437 1400 03 Other sales workers 1087 3510 03 Food preparation assistants 1646 5337 03 Mixed crop and animal producers 387 1260 03 Car van and motorcycle drivers 1155 3764 03 Client information workers 1993 6531 03 Sports and fitness workers 605 1984 03 Handicraft workers 194 638 03 Life science technicians and related associate professionals 82 271 03 Keyboard operators 283 940 03 Electronics and telecommunications installers and repairers 290 963 03 Other personal services workers 313 1047 03 Vocational education teachers 279 940 03 Other teaching professionals 744 2518 03 General office clerks 966 3272 03 Authors journalists and linguists 335 1135 03 Hairdressers beauticians and related workers 806 2796 03
Labour shortages and surpluses 2017
2017 46
Directorate-General for Employment Social Affairs and Inclusion European Network of Public Employment Services (PES)
ISCO-08 title
2015
UE
Recruited in the
last year (lt12
months)
Ratio of UE to new recruits
Animal producers 189 660 03 Other elementary workers 976 3401 03 Machinery mechanics and repairers 1134 3962 03 Ship and aircraft controllers and technicians 80 281 03 Hotel and restaurant managers 344 1220 03 Cashiers and ticket clerks 908 3220 03 Retail and wholesale trade managers 224 809 03 Sales marketing and development managers 311 1124 03 Physical and engineering science technicians 1204 4366 03 Administrative and specialised secretaries 1106 4040 03 Sales and purchasing agents and brokers 1294 4754 03 Rubber plastic and paper products machine operators 256 941 03 Artistic cultural and culinary associate professionals 511 1906 03 Numerical clerks 944 3532 03 Other services managers 184 691 03 Child care workers and teachers aides 1335 5005 03 Heavy truck and bus drivers 1426 5349 03 Business services and administration managers 383 1439 03 Information and communications technology service managers 67 257 03 Regulatory government associate professionals 209 807 03 Life science professionals 176 681 03 Wood processing and papermaking plant operators 97 379 03 Locomotive engine drivers and related workers 46 179 03 Legal professionals 315 1245 03 Personal care workers in health services 2195 8787 02 Physical and earth science professionals 85 345 02 Street vendors (excluding food) 50 204 02 Architects planners surveyors and designers 515 2092 02 Other clerical support workers 901 3657 02 Business services agents 510 2114 02 Manufacturing mining construction and distribution managers 361 1507 02 Tellers money collectors and related clerks 381 1612 02 Librarians archivists and curators 58 248 02 Medical and pharmaceutical technicians 255 1099 02 University and higher education teachers 301 1333 02 Information and communications technology operations and user support technicians
418 1888 02
Legal social and religious associate professionals 920 4348 02 Financial and mathematical associate professionals 601 2852 02 Sales marketing and public relations professionals 865 4172 02 Finance professionals 472 2281 02 Engineering professionals (excluding electrotechnology) 635 3118 02 Other health associate professionals 531 2657 02
Social and religious professionals 460 2317 02 Professional services managers 176 891 02 Nursing and midwifery associate professionals 556 2855 02 Legislators and senior officials 53 286 02 Database and network professionals 83 455 02 Administration professionals 641 3673 02 Primary school and early childhood teachers 575 3345 02 Electrotechnology engineers 142 827 02 Secondary education teachers 471 2812 02 Other health professionals 346 2083 02 Nursing and midwifery professionals 273 1760 02 Software and applications developers and analysts 631 4159 02 Medical doctors 293 1944 02 No occupation 152894 00
No answer 2531 578 44 Total 249561 294937 08
Labour shortages and surpluses 2017
2017 47
Directorate-General for Employment Social Affairs and Inclusion European Network of Public Employment Services (PES)
HOW TO OBTAIN EU PUBLICATIONS
Free publications
bull one copy
via EU Bookshop (httpbookshopeuropaeu)
bull more than one copy or postersmaps
from the European Unionrsquos representations (httpeceuropaeurepresent_enhtm)
from the delegations in non-EU countries
(httpeeaseuropaeudelegationsindex_enhtm)
by contacting the Europe Direct service (httpeuropaeueuropedirectindex_enhtm)
or calling 00 800 6 7 8 9 10 11 (free phone number from anywhere in the EU) () () The information given is free as are most calls (though some operators phone boxes or hotels may charge you)
Priced publications
bull via EU Bookshop (httpbookshopeuropaeu)
Priced subscriptions
bull via one of the sales agents of the Publications Office of the European Union
(httppublicationseuropaeuothersagentsindex_enhtm)
doi 10276731262
KE-0
1-1
8-2
63-E
N-N
[Ca
talo
gu
e n
um
be
r]
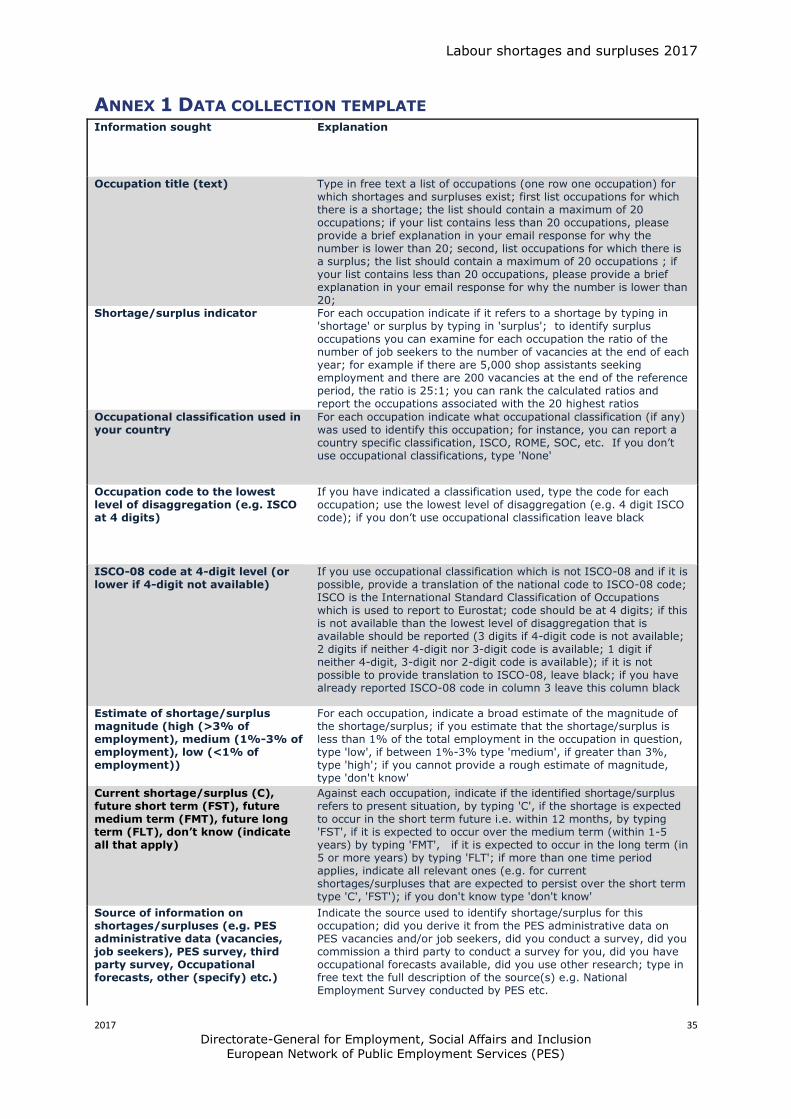
Labour shortages and surpluses 2017
2017 35
Directorate-General for Employment Social Affairs and Inclusion European Network of Public Employment Services (PES)
ANNEX 1 DATA COLLECTION TEMPLATE Information sought Explanation
Occupation title (text) Type in free text a list of occupations (one row one occupation) for which shortages and surpluses exist first list occupations for which there is a shortage the list should contain a maximum of 20 occupations if your list contains less than 20 occupations please provide a brief explanation in your email response for why the number is lower than 20 second list occupations for which there is a surplus the list should contain a maximum of 20 occupations if your list contains less than 20 occupations please provide a brief explanation in your email response for why the number is lower than 20
Shortagesurplus indicator For each occupation indicate if it refers to a shortage by typing in shortage or surplus by typing in surplus to identify surplus occupations you can examine for each occupation the ratio of the number of job seekers to the number of vacancies at the end of each year for example if there are 5000 shop assistants seeking employment and there are 200 vacancies at the end of the reference period the ratio is 251 you can rank the calculated ratios and report the occupations associated with the 20 highest ratios
Occupational classification used in your country
For each occupation indicate what occupational classification (if any) was used to identify this occupation for instance you can report a country specific classification ISCO ROME SOC etc If you donrsquot use occupational classifications type None
Occupation code to the lowest level of disaggregation (eg ISCO at 4 digits)
If you have indicated a classification used type the code for each occupation use the lowest level of disaggregation (eg 4 digit ISCO code) if you donrsquot use occupational classification leave black
ISCO-08 code at 4-digit level (or lower if 4-digit not available)
If you use occupational classification which is not ISCO-08 and if it is possible provide a translation of the national code to ISCO-08 code ISCO is the International Standard Classification of Occupations which is used to report to Eurostat code should be at 4 digits if this is not available than the lowest level of disaggregation that is available should be reported (3 digits if 4-digit code is not available 2 digits if neither 4-digit nor 3-digit code is available 1 digit if neither 4-digit 3-digit nor 2-digit code is available) if it is not possible to provide translation to ISCO-08 leave black if you have already reported ISCO-08 code in column 3 leave this column black
Estimate of shortagesurplus magnitude (high (gt3 of employment) medium (1-3 of employment) low (lt1 of employment))
For each occupation indicate a broad estimate of the magnitude of the shortagesurplus if you estimate that the shortagesurplus is less than 1 of the total employment in the occupation in question type low if between 1-3 type medium if greater than 3 type high if you cannot provide a rough estimate of magnitude type dont know
Current shortagesurplus (C) future short term (FST) future medium term (FMT) future long term (FLT) donrsquot know (indicate all that apply)
Against each occupation indicate if the identified shortagesurplus refers to present situation by typing C if the shortage is expected to occur in the short term future ie within 12 months by typing FST if it is expected to occur over the medium term (within 1-5 years) by typing FMT if it is expected to occur in the long term (in 5 or more years) by typing FLT if more than one time period applies indicate all relevant ones (eg for current shortagessurpluses that are expected to persist over the short term type C FST) if you dont know type dont know
Source of information on shortagessurpluses (eg PES administrative data (vacancies job seekers) PES survey third party survey Occupational forecasts other (specify) etc)
Indicate the source used to identify shortagesurplus for this occupation did you derive it from the PES administrative data on PES vacancies andor job seekers did you conduct a survey did you commission a third party to conduct a survey for you did you have occupational forecasts available did you use other research type in free text the full description of the source(s) eg National Employment Survey conducted by PES etc
Labour shortages and surpluses 2017
2017 36
Directorate-General for Employment Social Affairs and Inclusion European Network of Public Employment Services (PES)
Date for source of information Indicate the year that the information on shortagessurpluses (column 7) refers to eg type 2016 for a survey of difficult to fill vacancies conducted in 2016 even if the report was published in 2017
What indicator(s) suggested that there is a shortagesurplus
Indicate what criteria was used to conclude that this occupation is associated with a shortagesurplus for instance employers views sourcing from abroad to fill vacancies growth in employment faster than growth in educationtraining output time required to fill
vacancies higher than average etc
Share of females among job seekers in this occupation (surplus occupations only)
Indicate the percentage share of females among all job seekers in this occupation this is only applicable to surplus occupations
Skill or labour shortage Indicate if a shortage refers to a skill or labour shortage a skill shortage occurs where there is an insufficient supply of persons with the appropriate skills labour shortages occur where there is a sufficient number of skilled persons however an insufficient number of them is willing to take up employment in the occupation in question
Indicate the availability of data on shortagessurpluses at regional level (NUTS1 NUTS2 NUTS3 No data)
Indicate if data is available on the regional breakdown of shortagessurpluses by indicating the level of regional data available if multiple levels of regional disaggregation are available indicate the lowest level of disaggregation (eg NUTS3 rather than NUTS2) if there is no regional data available use no data
Labour shortages and surpluses 2017
2017 37
Directorate-General for Employment Social Affairs and Inclusion European Network of Public Employment Services (PES)
ANNEX 2 SHORTAGE OCCUPATIONS
Shortage occupation PES count
Cooks 16 Plumbers and pipe fitters 13 Generalist medical practitioners 12 Welders and flamecutters 12 Heavy truck and lorry drivers 11 Metal working machine tool setters and operators 11 Nursing professionals 11 Software developers 11 Agricultural and industrial machinery mechanics and repairers 10 Cleaners and helpers in offices hotels and other establishments 10 Commercial sales representatives 10 Specialist medical practitioners 10 Systems analysts 10 Bricklayers and related workers 9 Building and related electricians 9 Butchers fishmongers and related food preparers 9 Motor vehicle mechanics and repairers 9 Nursing associate professionals 9 Sheet-metal workers 9 Shop sales assistants 9 Waiters 9 Carpenters and joiners 8 Civil engineers 8 Concrete placers concrete finishers and related workers 8 Electrical engineering technicians 8 Electronics engineering technicians 8 Mechanical engineers 8 Primary school teachers 8 Structural-metal preparers and erectors 8 Electronics engineers 7
Health care assistants 7 Manufacturing supervisors 7 Mechanical engineering technicians 7 Secondary education teachers 7 Accountants 6 Applications programmers 6 Bus and tram drivers 6 Contact centre salespersons 6 Early childhood educators 6 Electrical mechanics and fitters 6 Floor layers and tile setters 6 Plasterers 6 Roofers 6 Sewing machine operators 6 Software and applications developers and analysts not elsewhere classified 6 Toolmakers and related workers 6 Web and multimedia developers 6 Air conditioning and refrigeration mechanics 5 Building frame and related trades workers not elsewhere classified 5 Chefs 5 Civil engineering labourers 5 Construction supervisors 5 Earthmoving and related plant operators 5 Electrical engineers 5 Electrical line installers and repairers 5 Engineering professionals not elsewhere classified 5 Hairdressers 5 Information and communications technology operations technicians 5 Manufacturing managers 5 Physiotherapists 5 Real estate agents and property managers 5 Research and development managers 5 Spray painters and varnishers 5 Accounting associate professionals 4 Bakers pastry-cooks and confectionery makers 4
Labour shortages and surpluses 2017
2017 38
Directorate-General for Employment Social Affairs and Inclusion European Network of Public Employment Services (PES)
Shortage occupation PES count
Blacksmiths hammersmiths and forging press workers 4 Civil engineering technicians 4 Crane hoist and related plant operators 4 Database designers and administrators 4 Industrial and production engineers 4 Painters and related workers 4 Physical and engineering science technicians not elsewhere classified 4 Plastic products machine operators 4 Social work and counselling professionals 4 Accounting and bookkeeping clerks 3 Administrative and executive secretaries 3 Ambulance workers 3 Building construction labourers 3 Car taxi and van drivers 3 Cartographers and surveyors 3 Cleaning and housekeeping supervisors in offices hotels and other establishments 3 Contact centre information clerks 3 Draughtspersons 3 Fast food preparers 3 Freight handlers 3 Gardeners horticultural and nursery growers 3 Home-based personal care workers 3 Hotel receptionists 3 Information and communications technology installers and servicers 3 Insulation workers 3 Kitchen helpers 3 Manufacturing labourers not elsewhere classified 3 Medical imaging and therapeutic equipment technicians 3 Metal moulders and coremakers 3 Metal polishers wheel grinders and tool sharpeners 3 Midwifery professionals 3 Other language teachers 3 Personal services workers not elsewhere classified 3
Pharmacists 3 Policy administration professionals 3 Printers 3 Process control technicians not elsewhere classified 3 Sales and marketing managers 3 Shop supervisors 3 Special needs teachers 3 Stock clerks 3 Supply distribution and related managers 3 Survey and market research interviewers 3 Systems administrators 3 Technical and medical sales professionals (excluding ICT) 3 Translators interpreters and other linguists 3 Transport clerks 3 Vocational education teachers 3 Advertising and marketing professionals 2 Audiologists and speech therapists 2 Bartenders 2 Beauticians and related workers 2 Cashiers and ticket clerks 2 Chemical engineers 2 Child care workers 2 Computer network and systems technicians 2 Computer network professionals 2 Construction managers 2 Craft and related workers not elsewhere classified 2 Credit and loans officers 2 Crop farm labourers 2 Database and network professionals not elsewhere classified 2 Dentists 2 Domestic cleaners and helpers 2 Door to door salespersons 2 Driving instructors 2 Electrical and electronic equipment assemblers 2 Electronics mechanics and servicers 2 Elementary workers not elsewhere classified 2 Employment agents and contractors 2
Labour shortages and surpluses 2017
2017 39
Directorate-General for Employment Social Affairs and Inclusion European Network of Public Employment Services (PES)
Shortage occupation PES count
Field crop and vegetable growers 2 Financial analysts 2 Financial and investment advisers 2 Forestry and related workers 2 Garbage and recycling collectors 2 General office clerks 2 Graphic and multimedia designers 2 Information and communications technology service managers 2 Insurance representatives 2 Locomotive engine drivers 2 Mail carriers and sorting clerks 2 Management and organization analysts 2 Mathematicians actuaries and statisticians 2 Mechanical machinery assemblers 2 Medical and dental prosthetic technicians 2 Medical assistants 2 Messengers package deliverers and luggage porters 2 Metal finishing plating and coating machine operators 2 Metal processing plant operators 2 Optometrists and ophthalmic opticians 2 Personal care workers in health services not elsewhere classified 2 Police officers 2 Policy and planning managers 2 Production clerks 2 Restaurant managers 2 Retail and wholesale trade managers 2 Sales workers not elsewhere classified 2 Sewing embroidery and related workers 2 Street food salespersons 2 Tailors dressmakers furriers and hatters 2 Telecommunications engineers 2 Advertising and public relations managers 1 Aged care services managers 1
Agricultural technicians 1 Aircraft engine mechanics and repairers 1 Aircraft pilots and related associate professionals 1 Assemblers not elsewhere classified 1 Authors and related writers 1 Bank tellers and related clerks 1 Bleaching dyeing and fabric cleaning machine operators 1 Bookmakers croupiers and related gaming workers 1 Business services agents not elsewhere classified 1 Buyers 1 Cabinet-makers and related workers 1 Cement stone and other mineral products machine operators 1 Chemical and physical science technicians 1 Chemical engineering technicians 1 Chemical processing plant controllers 1 Chemical products plant and machine operators 1 Chemists 1 Conference and event planners 1 Customs and border inspectors 1 Data entry clerks 1 Dental assistants and therapists 1 Dieticians and nutritionists 1 Dispensing opticians 1 Domestic housekeepers 1 Economists 1 Education methods specialists 1 Environmental and occupational health and hygiene professionals 1 Environmental and occupational health inspectors and associates 1 Fibre preparing spinning and winding machine operators 1 Finance managers 1 Financial and insurance services branch managers 1 Fire-fighters 1 Fitness and recreation instructors and program leaders 1 Food and beverage tasters and graders 1 Food and related products machine operators 1
Labour shortages and surpluses 2017
2017 40
Directorate-General for Employment Social Affairs and Inclusion European Network of Public Employment Services (PES)
Shortage occupation PES count
Food service counter attendants 1 Forestry labourers 1 Fruit vegetable and related preservers 1 Fur and leather preparing machine operators 1 Glass and ceramics plant operators 1 Hand launderers and pressers 1 Hand packers 1 Handicraft workers in textile leather and related materials 1 Health associate professionals not elsewhere classified 1 Health professionals not elsewhere classified 1 House builders 1 Human resource managers 1 Incinerator and water treatment plant operators 1 Information and communications technology user support technicians 1 Judges 1 Lawyers 1 Legal and related associate professionals 1 Legal professionals not elsewhere classified 1 Library clerks 1 Lifting truck operators 1 Livestock and dairy producers 1 Livestock farm labourers 1 Medical and pathology laboratory technicians 1 Medical secretaries 1 Metal production process controllers 1 Mining and quarrying labourers 1 Mining engineers metallurgists and related professionals 1 Mixed crop and animal producers 1 Mixed crop growers 1 Motorcycle drivers 1 Odd job persons 1 Other cleaning workers 1 Other music teachers 1
Paper products machine operators 1 Personnel and careers professionals 1 Personnel clerks 1 Pet groomers and animal care workers 1 Physicists and astronomers 1 Physiotherapy technicians and assistants 1 Potters and related workers 1 Power production plant operators 1 Prison guards 1 Product and garment designers 1 Psychologists 1 Pulp and papermaking plant operators 1 Railway brake signal and switch operators 1 Receptionists (general) 1 Refuse sorters 1 Riggers and cable splicers 1 Scribes and related workers 1 Secretaries (general) 1 Securities and finance dealers and brokers 1 Security guards 1 Senior government officials 1 Senior officials of special-interest organizations 1 Shelf fillers 1 Ships engineers 1 Shoemaking and related machine operators 1 Social work associate professionals 1 Stall and market salespersons 1 Stationary plant and machine operators not elsewhere classified 1 Stonemasons stone cutters splitters and carvers 1 Street and related service workers 1 Sweepers and related labourers 1 Teaching professionals not elsewhere classified 1 Telecommunications engineering technicians 1 Textile fur and leather products machine operators not elsewhere classified 1 Trade brokers 1 Travel attendants and travel stewards 1 Travel guides 1
Labour shortages and surpluses 2017
2017 41
Directorate-General for Employment Social Affairs and Inclusion European Network of Public Employment Services (PES)
Shortage occupation PES count
Tree and shrub crop growers 1 Underwater divers 1 University and higher education teachers 1 Vehicle cleaners 1 Veterinarians 1 Weaving and knitting machine operators 1 Web technicians 1 Wood processing plant operators 1 Woodworking-machine tool setters and operators 1
Labour shortages and surpluses 2017
2017 42
Directorate-General for Employment Social Affairs and Inclusion European Network of Public Employment Services (PES)
ANNEX 3 SURPLUS OCCUPATIONS
Surplus occupation PES count
General office clerks 8 Shop sales assistants 8 Advertising and marketing professionals 6 Bank tellers and related clerks 6 Sociologists anthropologists and related professionals 6 Child care workers 5 Hairdressers 5 Journalists 5 Cashiers and ticket clerks 4 Cleaners and helpers in offices hotels and other establishments 4 Hand packers 4 Mail carriers and sorting clerks 4 Photographers 4 Receptionists (general) 4 Tailors dressmakers furriers and hatters 4 Accounting and bookkeeping clerks 3 Administrative and executive secretaries 3 Beauticians and related workers 3 Biologists botanists zoologists and related professionals 3 Bricklayers and related workers 3 Broadcasting and audio-visual technicians 3 Civil engineering labourers 3 Economists 3 Gardeners horticultural and nursery growers 3 Interior designers and decorators 3 Kitchen helpers 3 Legal professionals not elsewhere classified 3 Manufacturing labourers not elsewhere classified 3 Motor vehicle mechanics and repairers 3
Musicians singers and composers 3 Other artistic and cultural associate professionals 3 Painters and related workers 3 Philosophers historians and political scientists 3 Security guards 3 Sweepers and related labourers 3 Travel consultants and clerks 3 Waiters 3 Actors 2 Archivists and curators 2 Bakers pastry-cooks and confectionery makers 2 Bartenders 2 Building construction labourers 2 Business services and administration managers not elsewhere classified 2 Cabinet-makers and related workers 2 Car taxi and van drivers 2 Chemists 2 Cleaning and housekeeping supervisors in offices hotels and other establishments 2 Credit and loans officers 2 Customs and border inspectors 2 Elementary workers not elsewhere classified 2 Film stage and related directors and producers 2 Financial analysts 2 Forestry and related workers 2 Freight handlers 2 Graphic and multimedia designers 2 Health care assistants 2 Hotel receptionists 2 Lawyers 2 Legal and related associate professionals 2 Library clerks 2 Livestock and dairy producers 2 Management and organization analysts 2 Messengers package deliverers and luggage porters 2 Odd job persons 2 Office supervisors 2 Plasterers 2
Labour shortages and surpluses 2017
2017 43
Directorate-General for Employment Social Affairs and Inclusion European Network of Public Employment Services (PES)
Surplus occupation PES count
Police officers 2 Pre-press technicians 2 Print finishing and binding workers 2 Printers 2 Prison guards 2 Product and garment designers 2 Psychologists 2 Public relations professionals 2 Religious professionals 2 Secondary education teachers 2 Secretaries (general) 2 Social work and counselling professionals 2 Stall and market salespersons 2 Stock clerks 2 Teachers aides 2 Telephone switchboard operators 2 Travel guides 2 Visual artists 2 Advertising and public relations managers 1 Agricultural technicians 1 Announcers on radio television and other media 1 Assemblers not elsewhere classified 1 Building and related electricians 1 Building architects 1 Building caretakers 1 Building frame and related trades workers not elsewhere classified 1 Business services agents not elsewhere classified 1 Buyers 1 Carpenters and joiners 1 Chemical engineers 1 Civil engineers 1 Clearing and forwarding agents 1 Clerical support workers not elsewhere classified 1
Commercial sales representatives 1 Conference and event planners 1 Contact centre information clerks 1 Contact centre salespersons 1 Cooks 1 Crane hoist and related plant operators 1 Creative and performing artists not elsewhere classified 1 Dancers and choreographers 1 Data entry clerks 1 Database designers and administrators 1 Domestic cleaners and helpers 1 Domestic housekeepers 1 Draughtspersons 1 Driving instructors 1 Early childhood educators 1 Electronics mechanics and servicers 1 Farming forestry and fisheries advisers 1 Fashion and other models 1 Fast food preparers 1 Field crop and vegetable growers 1 Filing and copying clerks 1 Finance managers 1 Financial and insurance services branch managers 1 Financial and investment advisers 1 Fire-fighters 1 Fitness and recreation instructors and program leaders 1 Floor layers and tile setters 1 Food service counter attendants 1 Fruit vegetable and related preservers 1 Gallery museum and library technicians 1 Garbage and recycling collectors 1 Garment and related pattern-makers and cutters 1 Glass and ceramics plant operators 1 Government tax and excise officials 1 Hand launderers and pressers 1
Labour shortages and surpluses 2017
2017 44
Directorate-General for Employment Social Affairs and Inclusion European Network of Public Employment Services (PES)
Surplus occupation PES count
Heavy truck and lorry drivers 1 House builders 1 Hunters and trappers 1 Information and communications technology installers and servicers 1 Information and communications technology user support technicians 1 Insurance representatives 1 Jewellery and precious-metal workers 1 Judges 1 Legal secretaries 1 Librarians and related information professionals 1 Life science technicians (excluding medical) 1 Lifting truck operators 1 Managing directors and chief executives 1 Manufacturing supervisors 1 Medical and dental prosthetic technicians 1 Metal moulders and coremakers 1 Mining and quarrying labourers 1 Mixed crop and animal producers 1 Mixed crop growers 1 Mobile farm and forestry plant operators 1 Musical instrument makers and tuners 1 Other language teachers 1 Pawnbrokers and money-lenders 1 Personnel and careers professionals 1 Pet groomers and animal care workers 1 Photographic products machine operators 1 Physical and engineering science technicians not elsewhere classified 1 Physicists and astronomers 1 Police inspectors and detectives 1 Precision-instrument makers and repairers 1 Primary school teachers 1 Process control technicians not elsewhere classified 1 Product graders and testers (excluding foods and beverages) 1
Production clerks 1 Professional services managers not elsewhere classified 1 Protective services workers not elsewhere classified 1 Research and development managers 1 Retail and wholesale trade managers 1 Roofers 1 Sales workers not elsewhere classified 1 Senior government officials 1 Service station attendants 1 Shelf fillers 1 Shop supervisors 1 Social work associate professionals 1 Special needs teachers 1 Spray painters and varnishers 1 Statistical mathematical and related associate professionals 1 Stonemasons stone cutters splitters and carvers 1 Street food salespersons 1 Supply distribution and related managers 1 Teaching professionals not elsewhere classified 1 Technical and medical sales professionals (excluding ICT) 1 Training and staff development professionals 1 Translators interpreters and other linguists 1 Transport conductors 1 Tree and shrub crop growers 1 Typists and word processing operators 1 Undertakers and embalmers 1 Vocational education teachers 1 Weaving and knitting machine operators 1 Woodworking-machine tool setters and operators 1
Labour shortages and surpluses 2017
2017 45
Directorate-General for Employment Social Affairs and Inclusion European Network of Public Employment Services (PES)
ANNEX 4 THE RATIO OF UNEMPLOYED TO NEW HIRES
ISCO-08 title
2015
UE
Recruited in the
last year (lt12
months)
Ratio of UE to new recruits
Street and related service workers 85 104 08 Agricultural forestry and fishery labourers 3913 5343 07 Mining and construction labourers 1937 3525 05 Creative and performing artists 610 1115 05 Refuse workers 1036 1923 05 Painters building structure cleaners and related trades workers 1116 2117 05 Street and market salespersons 195 389 05 Building frame and related trades workers 3632 7353 05 Mining manufacturing and construction supervisors 626 1315 05 Ships deck crews and related workers 53 114 05 Market gardeners and crop growers 1471 3207 05 Managing directors and chief executives 304 667 05 Travel attendants conductors and guides 229 538 04 Wood treaters cabinet-makers and related trades workers 491 1159 04 Manufacturing labourers 1640 3909 04 Domestic hotel and office cleaners and helpers 5679 13545 04 Other stationary plant and machine operators 822 1961 04 Mobile plant operators 1038 2497 04 Building finishers and related trades workers 1519 3680 04 Textile fur and leather products machine operators 431 1048 04 Garment and related trades workers 422 1047 04 Chemical and photographic products plant and machine operators 157 389 04 Food processing and related trades workers 930 2330 04 Vehicle window laundry and other hand cleaning workers 291 754 04 Sheet and structural metal workers moulders and welders and related workers
996 2603 04
Waiters and bartenders 4399 11595 04 Cooks 1529 4039 04 Metal processing and finishing plant operators 208 557 04 Printing trades workers 203 548 04 Forestry and related workers 130 351 04 Protective services workers 1347 3658 04 Transport and storage labourers 2532 6939 04 Fishery workers hunters and trappers 46 128 04 Material-recording and transport clerks 1671 4630 04 Process control technicians 179 517 03 Mining and mineral processing plant operators 94 274 03 Telecommunications and broadcasting technicians 177 519 03 Blacksmiths toolmakers and related trades workers 816 2409 03 Building and housekeeping supervisors 678 2045 03
Secretaries (general) 1072 3259 03 Assemblers 850 2586 03 Other craft and related workers 258 810 03 Shop salespersons 6600 21042 03 Electrical equipment installers and repairers 958 3060 03 Food and related products machine operators 437 1400 03 Other sales workers 1087 3510 03 Food preparation assistants 1646 5337 03 Mixed crop and animal producers 387 1260 03 Car van and motorcycle drivers 1155 3764 03 Client information workers 1993 6531 03 Sports and fitness workers 605 1984 03 Handicraft workers 194 638 03 Life science technicians and related associate professionals 82 271 03 Keyboard operators 283 940 03 Electronics and telecommunications installers and repairers 290 963 03 Other personal services workers 313 1047 03 Vocational education teachers 279 940 03 Other teaching professionals 744 2518 03 General office clerks 966 3272 03 Authors journalists and linguists 335 1135 03 Hairdressers beauticians and related workers 806 2796 03
Labour shortages and surpluses 2017
2017 46
Directorate-General for Employment Social Affairs and Inclusion European Network of Public Employment Services (PES)
ISCO-08 title
2015
UE
Recruited in the
last year (lt12
months)
Ratio of UE to new recruits
Animal producers 189 660 03 Other elementary workers 976 3401 03 Machinery mechanics and repairers 1134 3962 03 Ship and aircraft controllers and technicians 80 281 03 Hotel and restaurant managers 344 1220 03 Cashiers and ticket clerks 908 3220 03 Retail and wholesale trade managers 224 809 03 Sales marketing and development managers 311 1124 03 Physical and engineering science technicians 1204 4366 03 Administrative and specialised secretaries 1106 4040 03 Sales and purchasing agents and brokers 1294 4754 03 Rubber plastic and paper products machine operators 256 941 03 Artistic cultural and culinary associate professionals 511 1906 03 Numerical clerks 944 3532 03 Other services managers 184 691 03 Child care workers and teachers aides 1335 5005 03 Heavy truck and bus drivers 1426 5349 03 Business services and administration managers 383 1439 03 Information and communications technology service managers 67 257 03 Regulatory government associate professionals 209 807 03 Life science professionals 176 681 03 Wood processing and papermaking plant operators 97 379 03 Locomotive engine drivers and related workers 46 179 03 Legal professionals 315 1245 03 Personal care workers in health services 2195 8787 02 Physical and earth science professionals 85 345 02 Street vendors (excluding food) 50 204 02 Architects planners surveyors and designers 515 2092 02 Other clerical support workers 901 3657 02 Business services agents 510 2114 02 Manufacturing mining construction and distribution managers 361 1507 02 Tellers money collectors and related clerks 381 1612 02 Librarians archivists and curators 58 248 02 Medical and pharmaceutical technicians 255 1099 02 University and higher education teachers 301 1333 02 Information and communications technology operations and user support technicians
418 1888 02
Legal social and religious associate professionals 920 4348 02 Financial and mathematical associate professionals 601 2852 02 Sales marketing and public relations professionals 865 4172 02 Finance professionals 472 2281 02 Engineering professionals (excluding electrotechnology) 635 3118 02 Other health associate professionals 531 2657 02
Social and religious professionals 460 2317 02 Professional services managers 176 891 02 Nursing and midwifery associate professionals 556 2855 02 Legislators and senior officials 53 286 02 Database and network professionals 83 455 02 Administration professionals 641 3673 02 Primary school and early childhood teachers 575 3345 02 Electrotechnology engineers 142 827 02 Secondary education teachers 471 2812 02 Other health professionals 346 2083 02 Nursing and midwifery professionals 273 1760 02 Software and applications developers and analysts 631 4159 02 Medical doctors 293 1944 02 No occupation 152894 00
No answer 2531 578 44 Total 249561 294937 08
Labour shortages and surpluses 2017
2017 47
Directorate-General for Employment Social Affairs and Inclusion European Network of Public Employment Services (PES)
HOW TO OBTAIN EU PUBLICATIONS
Free publications
bull one copy
via EU Bookshop (httpbookshopeuropaeu)
bull more than one copy or postersmaps
from the European Unionrsquos representations (httpeceuropaeurepresent_enhtm)
from the delegations in non-EU countries
(httpeeaseuropaeudelegationsindex_enhtm)
by contacting the Europe Direct service (httpeuropaeueuropedirectindex_enhtm)
or calling 00 800 6 7 8 9 10 11 (free phone number from anywhere in the EU) () () The information given is free as are most calls (though some operators phone boxes or hotels may charge you)
Priced publications
bull via EU Bookshop (httpbookshopeuropaeu)
Priced subscriptions
bull via one of the sales agents of the Publications Office of the European Union
(httppublicationseuropaeuothersagentsindex_enhtm)
doi 10276731262
KE-0
1-1
8-2
63-E
N-N
[Ca
talo
gu
e n
um
be
r]
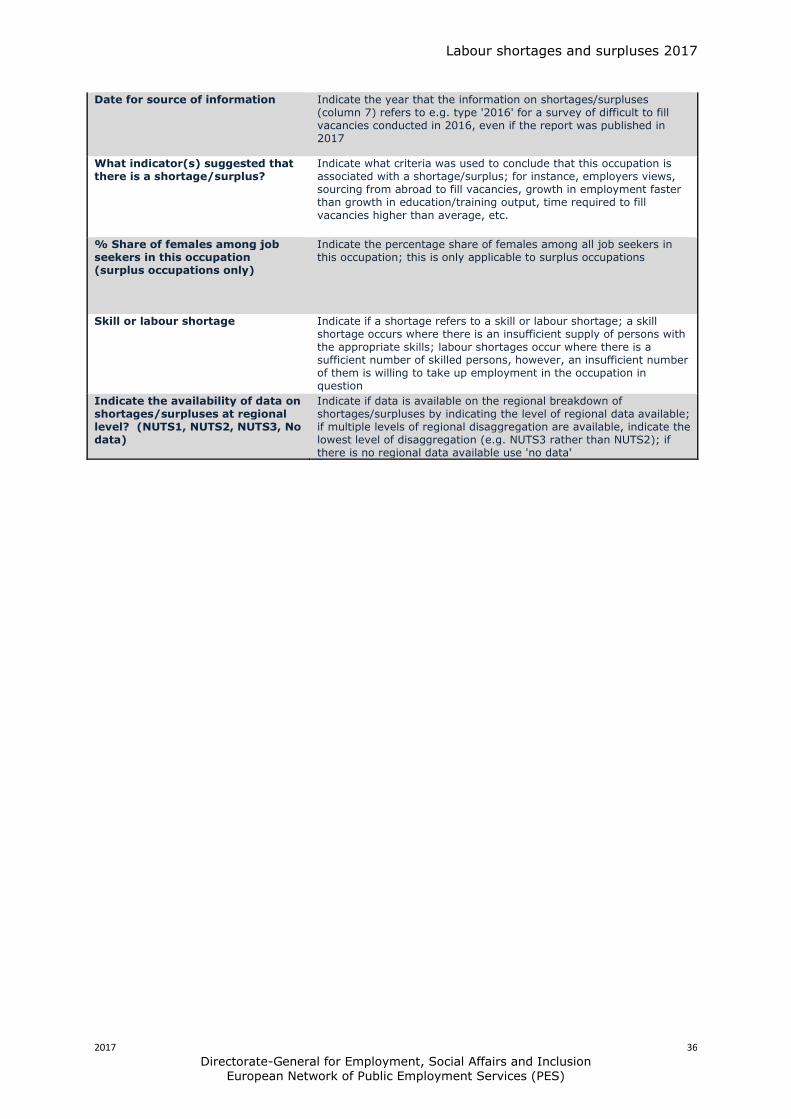
Labour shortages and surpluses 2017
2017 36
Directorate-General for Employment Social Affairs and Inclusion European Network of Public Employment Services (PES)
Date for source of information Indicate the year that the information on shortagessurpluses (column 7) refers to eg type 2016 for a survey of difficult to fill vacancies conducted in 2016 even if the report was published in 2017
What indicator(s) suggested that there is a shortagesurplus
Indicate what criteria was used to conclude that this occupation is associated with a shortagesurplus for instance employers views sourcing from abroad to fill vacancies growth in employment faster than growth in educationtraining output time required to fill
vacancies higher than average etc
Share of females among job seekers in this occupation (surplus occupations only)
Indicate the percentage share of females among all job seekers in this occupation this is only applicable to surplus occupations
Skill or labour shortage Indicate if a shortage refers to a skill or labour shortage a skill shortage occurs where there is an insufficient supply of persons with the appropriate skills labour shortages occur where there is a sufficient number of skilled persons however an insufficient number of them is willing to take up employment in the occupation in question
Indicate the availability of data on shortagessurpluses at regional level (NUTS1 NUTS2 NUTS3 No data)
Indicate if data is available on the regional breakdown of shortagessurpluses by indicating the level of regional data available if multiple levels of regional disaggregation are available indicate the lowest level of disaggregation (eg NUTS3 rather than NUTS2) if there is no regional data available use no data
Labour shortages and surpluses 2017
2017 37
Directorate-General for Employment Social Affairs and Inclusion European Network of Public Employment Services (PES)
ANNEX 2 SHORTAGE OCCUPATIONS
Shortage occupation PES count
Cooks 16 Plumbers and pipe fitters 13 Generalist medical practitioners 12 Welders and flamecutters 12 Heavy truck and lorry drivers 11 Metal working machine tool setters and operators 11 Nursing professionals 11 Software developers 11 Agricultural and industrial machinery mechanics and repairers 10 Cleaners and helpers in offices hotels and other establishments 10 Commercial sales representatives 10 Specialist medical practitioners 10 Systems analysts 10 Bricklayers and related workers 9 Building and related electricians 9 Butchers fishmongers and related food preparers 9 Motor vehicle mechanics and repairers 9 Nursing associate professionals 9 Sheet-metal workers 9 Shop sales assistants 9 Waiters 9 Carpenters and joiners 8 Civil engineers 8 Concrete placers concrete finishers and related workers 8 Electrical engineering technicians 8 Electronics engineering technicians 8 Mechanical engineers 8 Primary school teachers 8 Structural-metal preparers and erectors 8 Electronics engineers 7
Health care assistants 7 Manufacturing supervisors 7 Mechanical engineering technicians 7 Secondary education teachers 7 Accountants 6 Applications programmers 6 Bus and tram drivers 6 Contact centre salespersons 6 Early childhood educators 6 Electrical mechanics and fitters 6 Floor layers and tile setters 6 Plasterers 6 Roofers 6 Sewing machine operators 6 Software and applications developers and analysts not elsewhere classified 6 Toolmakers and related workers 6 Web and multimedia developers 6 Air conditioning and refrigeration mechanics 5 Building frame and related trades workers not elsewhere classified 5 Chefs 5 Civil engineering labourers 5 Construction supervisors 5 Earthmoving and related plant operators 5 Electrical engineers 5 Electrical line installers and repairers 5 Engineering professionals not elsewhere classified 5 Hairdressers 5 Information and communications technology operations technicians 5 Manufacturing managers 5 Physiotherapists 5 Real estate agents and property managers 5 Research and development managers 5 Spray painters and varnishers 5 Accounting associate professionals 4 Bakers pastry-cooks and confectionery makers 4
Labour shortages and surpluses 2017
2017 38
Directorate-General for Employment Social Affairs and Inclusion European Network of Public Employment Services (PES)
Shortage occupation PES count
Blacksmiths hammersmiths and forging press workers 4 Civil engineering technicians 4 Crane hoist and related plant operators 4 Database designers and administrators 4 Industrial and production engineers 4 Painters and related workers 4 Physical and engineering science technicians not elsewhere classified 4 Plastic products machine operators 4 Social work and counselling professionals 4 Accounting and bookkeeping clerks 3 Administrative and executive secretaries 3 Ambulance workers 3 Building construction labourers 3 Car taxi and van drivers 3 Cartographers and surveyors 3 Cleaning and housekeeping supervisors in offices hotels and other establishments 3 Contact centre information clerks 3 Draughtspersons 3 Fast food preparers 3 Freight handlers 3 Gardeners horticultural and nursery growers 3 Home-based personal care workers 3 Hotel receptionists 3 Information and communications technology installers and servicers 3 Insulation workers 3 Kitchen helpers 3 Manufacturing labourers not elsewhere classified 3 Medical imaging and therapeutic equipment technicians 3 Metal moulders and coremakers 3 Metal polishers wheel grinders and tool sharpeners 3 Midwifery professionals 3 Other language teachers 3 Personal services workers not elsewhere classified 3
Pharmacists 3 Policy administration professionals 3 Printers 3 Process control technicians not elsewhere classified 3 Sales and marketing managers 3 Shop supervisors 3 Special needs teachers 3 Stock clerks 3 Supply distribution and related managers 3 Survey and market research interviewers 3 Systems administrators 3 Technical and medical sales professionals (excluding ICT) 3 Translators interpreters and other linguists 3 Transport clerks 3 Vocational education teachers 3 Advertising and marketing professionals 2 Audiologists and speech therapists 2 Bartenders 2 Beauticians and related workers 2 Cashiers and ticket clerks 2 Chemical engineers 2 Child care workers 2 Computer network and systems technicians 2 Computer network professionals 2 Construction managers 2 Craft and related workers not elsewhere classified 2 Credit and loans officers 2 Crop farm labourers 2 Database and network professionals not elsewhere classified 2 Dentists 2 Domestic cleaners and helpers 2 Door to door salespersons 2 Driving instructors 2 Electrical and electronic equipment assemblers 2 Electronics mechanics and servicers 2 Elementary workers not elsewhere classified 2 Employment agents and contractors 2
Labour shortages and surpluses 2017
2017 39
Directorate-General for Employment Social Affairs and Inclusion European Network of Public Employment Services (PES)
Shortage occupation PES count
Field crop and vegetable growers 2 Financial analysts 2 Financial and investment advisers 2 Forestry and related workers 2 Garbage and recycling collectors 2 General office clerks 2 Graphic and multimedia designers 2 Information and communications technology service managers 2 Insurance representatives 2 Locomotive engine drivers 2 Mail carriers and sorting clerks 2 Management and organization analysts 2 Mathematicians actuaries and statisticians 2 Mechanical machinery assemblers 2 Medical and dental prosthetic technicians 2 Medical assistants 2 Messengers package deliverers and luggage porters 2 Metal finishing plating and coating machine operators 2 Metal processing plant operators 2 Optometrists and ophthalmic opticians 2 Personal care workers in health services not elsewhere classified 2 Police officers 2 Policy and planning managers 2 Production clerks 2 Restaurant managers 2 Retail and wholesale trade managers 2 Sales workers not elsewhere classified 2 Sewing embroidery and related workers 2 Street food salespersons 2 Tailors dressmakers furriers and hatters 2 Telecommunications engineers 2 Advertising and public relations managers 1 Aged care services managers 1
Agricultural technicians 1 Aircraft engine mechanics and repairers 1 Aircraft pilots and related associate professionals 1 Assemblers not elsewhere classified 1 Authors and related writers 1 Bank tellers and related clerks 1 Bleaching dyeing and fabric cleaning machine operators 1 Bookmakers croupiers and related gaming workers 1 Business services agents not elsewhere classified 1 Buyers 1 Cabinet-makers and related workers 1 Cement stone and other mineral products machine operators 1 Chemical and physical science technicians 1 Chemical engineering technicians 1 Chemical processing plant controllers 1 Chemical products plant and machine operators 1 Chemists 1 Conference and event planners 1 Customs and border inspectors 1 Data entry clerks 1 Dental assistants and therapists 1 Dieticians and nutritionists 1 Dispensing opticians 1 Domestic housekeepers 1 Economists 1 Education methods specialists 1 Environmental and occupational health and hygiene professionals 1 Environmental and occupational health inspectors and associates 1 Fibre preparing spinning and winding machine operators 1 Finance managers 1 Financial and insurance services branch managers 1 Fire-fighters 1 Fitness and recreation instructors and program leaders 1 Food and beverage tasters and graders 1 Food and related products machine operators 1
Labour shortages and surpluses 2017
2017 40
Directorate-General for Employment Social Affairs and Inclusion European Network of Public Employment Services (PES)
Shortage occupation PES count
Food service counter attendants 1 Forestry labourers 1 Fruit vegetable and related preservers 1 Fur and leather preparing machine operators 1 Glass and ceramics plant operators 1 Hand launderers and pressers 1 Hand packers 1 Handicraft workers in textile leather and related materials 1 Health associate professionals not elsewhere classified 1 Health professionals not elsewhere classified 1 House builders 1 Human resource managers 1 Incinerator and water treatment plant operators 1 Information and communications technology user support technicians 1 Judges 1 Lawyers 1 Legal and related associate professionals 1 Legal professionals not elsewhere classified 1 Library clerks 1 Lifting truck operators 1 Livestock and dairy producers 1 Livestock farm labourers 1 Medical and pathology laboratory technicians 1 Medical secretaries 1 Metal production process controllers 1 Mining and quarrying labourers 1 Mining engineers metallurgists and related professionals 1 Mixed crop and animal producers 1 Mixed crop growers 1 Motorcycle drivers 1 Odd job persons 1 Other cleaning workers 1 Other music teachers 1
Paper products machine operators 1 Personnel and careers professionals 1 Personnel clerks 1 Pet groomers and animal care workers 1 Physicists and astronomers 1 Physiotherapy technicians and assistants 1 Potters and related workers 1 Power production plant operators 1 Prison guards 1 Product and garment designers 1 Psychologists 1 Pulp and papermaking plant operators 1 Railway brake signal and switch operators 1 Receptionists (general) 1 Refuse sorters 1 Riggers and cable splicers 1 Scribes and related workers 1 Secretaries (general) 1 Securities and finance dealers and brokers 1 Security guards 1 Senior government officials 1 Senior officials of special-interest organizations 1 Shelf fillers 1 Ships engineers 1 Shoemaking and related machine operators 1 Social work associate professionals 1 Stall and market salespersons 1 Stationary plant and machine operators not elsewhere classified 1 Stonemasons stone cutters splitters and carvers 1 Street and related service workers 1 Sweepers and related labourers 1 Teaching professionals not elsewhere classified 1 Telecommunications engineering technicians 1 Textile fur and leather products machine operators not elsewhere classified 1 Trade brokers 1 Travel attendants and travel stewards 1 Travel guides 1
Labour shortages and surpluses 2017
2017 41
Directorate-General for Employment Social Affairs and Inclusion European Network of Public Employment Services (PES)
Shortage occupation PES count
Tree and shrub crop growers 1 Underwater divers 1 University and higher education teachers 1 Vehicle cleaners 1 Veterinarians 1 Weaving and knitting machine operators 1 Web technicians 1 Wood processing plant operators 1 Woodworking-machine tool setters and operators 1
Labour shortages and surpluses 2017
2017 42
Directorate-General for Employment Social Affairs and Inclusion European Network of Public Employment Services (PES)
ANNEX 3 SURPLUS OCCUPATIONS
Surplus occupation PES count
General office clerks 8 Shop sales assistants 8 Advertising and marketing professionals 6 Bank tellers and related clerks 6 Sociologists anthropologists and related professionals 6 Child care workers 5 Hairdressers 5 Journalists 5 Cashiers and ticket clerks 4 Cleaners and helpers in offices hotels and other establishments 4 Hand packers 4 Mail carriers and sorting clerks 4 Photographers 4 Receptionists (general) 4 Tailors dressmakers furriers and hatters 4 Accounting and bookkeeping clerks 3 Administrative and executive secretaries 3 Beauticians and related workers 3 Biologists botanists zoologists and related professionals 3 Bricklayers and related workers 3 Broadcasting and audio-visual technicians 3 Civil engineering labourers 3 Economists 3 Gardeners horticultural and nursery growers 3 Interior designers and decorators 3 Kitchen helpers 3 Legal professionals not elsewhere classified 3 Manufacturing labourers not elsewhere classified 3 Motor vehicle mechanics and repairers 3
Musicians singers and composers 3 Other artistic and cultural associate professionals 3 Painters and related workers 3 Philosophers historians and political scientists 3 Security guards 3 Sweepers and related labourers 3 Travel consultants and clerks 3 Waiters 3 Actors 2 Archivists and curators 2 Bakers pastry-cooks and confectionery makers 2 Bartenders 2 Building construction labourers 2 Business services and administration managers not elsewhere classified 2 Cabinet-makers and related workers 2 Car taxi and van drivers 2 Chemists 2 Cleaning and housekeeping supervisors in offices hotels and other establishments 2 Credit and loans officers 2 Customs and border inspectors 2 Elementary workers not elsewhere classified 2 Film stage and related directors and producers 2 Financial analysts 2 Forestry and related workers 2 Freight handlers 2 Graphic and multimedia designers 2 Health care assistants 2 Hotel receptionists 2 Lawyers 2 Legal and related associate professionals 2 Library clerks 2 Livestock and dairy producers 2 Management and organization analysts 2 Messengers package deliverers and luggage porters 2 Odd job persons 2 Office supervisors 2 Plasterers 2
Labour shortages and surpluses 2017
2017 43
Directorate-General for Employment Social Affairs and Inclusion European Network of Public Employment Services (PES)
Surplus occupation PES count
Police officers 2 Pre-press technicians 2 Print finishing and binding workers 2 Printers 2 Prison guards 2 Product and garment designers 2 Psychologists 2 Public relations professionals 2 Religious professionals 2 Secondary education teachers 2 Secretaries (general) 2 Social work and counselling professionals 2 Stall and market salespersons 2 Stock clerks 2 Teachers aides 2 Telephone switchboard operators 2 Travel guides 2 Visual artists 2 Advertising and public relations managers 1 Agricultural technicians 1 Announcers on radio television and other media 1 Assemblers not elsewhere classified 1 Building and related electricians 1 Building architects 1 Building caretakers 1 Building frame and related trades workers not elsewhere classified 1 Business services agents not elsewhere classified 1 Buyers 1 Carpenters and joiners 1 Chemical engineers 1 Civil engineers 1 Clearing and forwarding agents 1 Clerical support workers not elsewhere classified 1
Commercial sales representatives 1 Conference and event planners 1 Contact centre information clerks 1 Contact centre salespersons 1 Cooks 1 Crane hoist and related plant operators 1 Creative and performing artists not elsewhere classified 1 Dancers and choreographers 1 Data entry clerks 1 Database designers and administrators 1 Domestic cleaners and helpers 1 Domestic housekeepers 1 Draughtspersons 1 Driving instructors 1 Early childhood educators 1 Electronics mechanics and servicers 1 Farming forestry and fisheries advisers 1 Fashion and other models 1 Fast food preparers 1 Field crop and vegetable growers 1 Filing and copying clerks 1 Finance managers 1 Financial and insurance services branch managers 1 Financial and investment advisers 1 Fire-fighters 1 Fitness and recreation instructors and program leaders 1 Floor layers and tile setters 1 Food service counter attendants 1 Fruit vegetable and related preservers 1 Gallery museum and library technicians 1 Garbage and recycling collectors 1 Garment and related pattern-makers and cutters 1 Glass and ceramics plant operators 1 Government tax and excise officials 1 Hand launderers and pressers 1
Labour shortages and surpluses 2017
2017 44
Directorate-General for Employment Social Affairs and Inclusion European Network of Public Employment Services (PES)
Surplus occupation PES count
Heavy truck and lorry drivers 1 House builders 1 Hunters and trappers 1 Information and communications technology installers and servicers 1 Information and communications technology user support technicians 1 Insurance representatives 1 Jewellery and precious-metal workers 1 Judges 1 Legal secretaries 1 Librarians and related information professionals 1 Life science technicians (excluding medical) 1 Lifting truck operators 1 Managing directors and chief executives 1 Manufacturing supervisors 1 Medical and dental prosthetic technicians 1 Metal moulders and coremakers 1 Mining and quarrying labourers 1 Mixed crop and animal producers 1 Mixed crop growers 1 Mobile farm and forestry plant operators 1 Musical instrument makers and tuners 1 Other language teachers 1 Pawnbrokers and money-lenders 1 Personnel and careers professionals 1 Pet groomers and animal care workers 1 Photographic products machine operators 1 Physical and engineering science technicians not elsewhere classified 1 Physicists and astronomers 1 Police inspectors and detectives 1 Precision-instrument makers and repairers 1 Primary school teachers 1 Process control technicians not elsewhere classified 1 Product graders and testers (excluding foods and beverages) 1
Production clerks 1 Professional services managers not elsewhere classified 1 Protective services workers not elsewhere classified 1 Research and development managers 1 Retail and wholesale trade managers 1 Roofers 1 Sales workers not elsewhere classified 1 Senior government officials 1 Service station attendants 1 Shelf fillers 1 Shop supervisors 1 Social work associate professionals 1 Special needs teachers 1 Spray painters and varnishers 1 Statistical mathematical and related associate professionals 1 Stonemasons stone cutters splitters and carvers 1 Street food salespersons 1 Supply distribution and related managers 1 Teaching professionals not elsewhere classified 1 Technical and medical sales professionals (excluding ICT) 1 Training and staff development professionals 1 Translators interpreters and other linguists 1 Transport conductors 1 Tree and shrub crop growers 1 Typists and word processing operators 1 Undertakers and embalmers 1 Vocational education teachers 1 Weaving and knitting machine operators 1 Woodworking-machine tool setters and operators 1
Labour shortages and surpluses 2017
2017 45
Directorate-General for Employment Social Affairs and Inclusion European Network of Public Employment Services (PES)
ANNEX 4 THE RATIO OF UNEMPLOYED TO NEW HIRES
ISCO-08 title
2015
UE
Recruited in the
last year (lt12
months)
Ratio of UE to new recruits
Street and related service workers 85 104 08 Agricultural forestry and fishery labourers 3913 5343 07 Mining and construction labourers 1937 3525 05 Creative and performing artists 610 1115 05 Refuse workers 1036 1923 05 Painters building structure cleaners and related trades workers 1116 2117 05 Street and market salespersons 195 389 05 Building frame and related trades workers 3632 7353 05 Mining manufacturing and construction supervisors 626 1315 05 Ships deck crews and related workers 53 114 05 Market gardeners and crop growers 1471 3207 05 Managing directors and chief executives 304 667 05 Travel attendants conductors and guides 229 538 04 Wood treaters cabinet-makers and related trades workers 491 1159 04 Manufacturing labourers 1640 3909 04 Domestic hotel and office cleaners and helpers 5679 13545 04 Other stationary plant and machine operators 822 1961 04 Mobile plant operators 1038 2497 04 Building finishers and related trades workers 1519 3680 04 Textile fur and leather products machine operators 431 1048 04 Garment and related trades workers 422 1047 04 Chemical and photographic products plant and machine operators 157 389 04 Food processing and related trades workers 930 2330 04 Vehicle window laundry and other hand cleaning workers 291 754 04 Sheet and structural metal workers moulders and welders and related workers
996 2603 04
Waiters and bartenders 4399 11595 04 Cooks 1529 4039 04 Metal processing and finishing plant operators 208 557 04 Printing trades workers 203 548 04 Forestry and related workers 130 351 04 Protective services workers 1347 3658 04 Transport and storage labourers 2532 6939 04 Fishery workers hunters and trappers 46 128 04 Material-recording and transport clerks 1671 4630 04 Process control technicians 179 517 03 Mining and mineral processing plant operators 94 274 03 Telecommunications and broadcasting technicians 177 519 03 Blacksmiths toolmakers and related trades workers 816 2409 03 Building and housekeeping supervisors 678 2045 03
Secretaries (general) 1072 3259 03 Assemblers 850 2586 03 Other craft and related workers 258 810 03 Shop salespersons 6600 21042 03 Electrical equipment installers and repairers 958 3060 03 Food and related products machine operators 437 1400 03 Other sales workers 1087 3510 03 Food preparation assistants 1646 5337 03 Mixed crop and animal producers 387 1260 03 Car van and motorcycle drivers 1155 3764 03 Client information workers 1993 6531 03 Sports and fitness workers 605 1984 03 Handicraft workers 194 638 03 Life science technicians and related associate professionals 82 271 03 Keyboard operators 283 940 03 Electronics and telecommunications installers and repairers 290 963 03 Other personal services workers 313 1047 03 Vocational education teachers 279 940 03 Other teaching professionals 744 2518 03 General office clerks 966 3272 03 Authors journalists and linguists 335 1135 03 Hairdressers beauticians and related workers 806 2796 03
Labour shortages and surpluses 2017
2017 46
Directorate-General for Employment Social Affairs and Inclusion European Network of Public Employment Services (PES)
ISCO-08 title
2015
UE
Recruited in the
last year (lt12
months)
Ratio of UE to new recruits
Animal producers 189 660 03 Other elementary workers 976 3401 03 Machinery mechanics and repairers 1134 3962 03 Ship and aircraft controllers and technicians 80 281 03 Hotel and restaurant managers 344 1220 03 Cashiers and ticket clerks 908 3220 03 Retail and wholesale trade managers 224 809 03 Sales marketing and development managers 311 1124 03 Physical and engineering science technicians 1204 4366 03 Administrative and specialised secretaries 1106 4040 03 Sales and purchasing agents and brokers 1294 4754 03 Rubber plastic and paper products machine operators 256 941 03 Artistic cultural and culinary associate professionals 511 1906 03 Numerical clerks 944 3532 03 Other services managers 184 691 03 Child care workers and teachers aides 1335 5005 03 Heavy truck and bus drivers 1426 5349 03 Business services and administration managers 383 1439 03 Information and communications technology service managers 67 257 03 Regulatory government associate professionals 209 807 03 Life science professionals 176 681 03 Wood processing and papermaking plant operators 97 379 03 Locomotive engine drivers and related workers 46 179 03 Legal professionals 315 1245 03 Personal care workers in health services 2195 8787 02 Physical and earth science professionals 85 345 02 Street vendors (excluding food) 50 204 02 Architects planners surveyors and designers 515 2092 02 Other clerical support workers 901 3657 02 Business services agents 510 2114 02 Manufacturing mining construction and distribution managers 361 1507 02 Tellers money collectors and related clerks 381 1612 02 Librarians archivists and curators 58 248 02 Medical and pharmaceutical technicians 255 1099 02 University and higher education teachers 301 1333 02 Information and communications technology operations and user support technicians
418 1888 02
Legal social and religious associate professionals 920 4348 02 Financial and mathematical associate professionals 601 2852 02 Sales marketing and public relations professionals 865 4172 02 Finance professionals 472 2281 02 Engineering professionals (excluding electrotechnology) 635 3118 02 Other health associate professionals 531 2657 02
Social and religious professionals 460 2317 02 Professional services managers 176 891 02 Nursing and midwifery associate professionals 556 2855 02 Legislators and senior officials 53 286 02 Database and network professionals 83 455 02 Administration professionals 641 3673 02 Primary school and early childhood teachers 575 3345 02 Electrotechnology engineers 142 827 02 Secondary education teachers 471 2812 02 Other health professionals 346 2083 02 Nursing and midwifery professionals 273 1760 02 Software and applications developers and analysts 631 4159 02 Medical doctors 293 1944 02 No occupation 152894 00
No answer 2531 578 44 Total 249561 294937 08
Labour shortages and surpluses 2017
2017 47
Directorate-General for Employment Social Affairs and Inclusion European Network of Public Employment Services (PES)
HOW TO OBTAIN EU PUBLICATIONS
Free publications
bull one copy
via EU Bookshop (httpbookshopeuropaeu)
bull more than one copy or postersmaps
from the European Unionrsquos representations (httpeceuropaeurepresent_enhtm)
from the delegations in non-EU countries
(httpeeaseuropaeudelegationsindex_enhtm)
by contacting the Europe Direct service (httpeuropaeueuropedirectindex_enhtm)
or calling 00 800 6 7 8 9 10 11 (free phone number from anywhere in the EU) () () The information given is free as are most calls (though some operators phone boxes or hotels may charge you)
Priced publications
bull via EU Bookshop (httpbookshopeuropaeu)
Priced subscriptions
bull via one of the sales agents of the Publications Office of the European Union
(httppublicationseuropaeuothersagentsindex_enhtm)
doi 10276731262
KE-0
1-1
8-2
63-E
N-N
[Ca
talo
gu
e n
um
be
r]
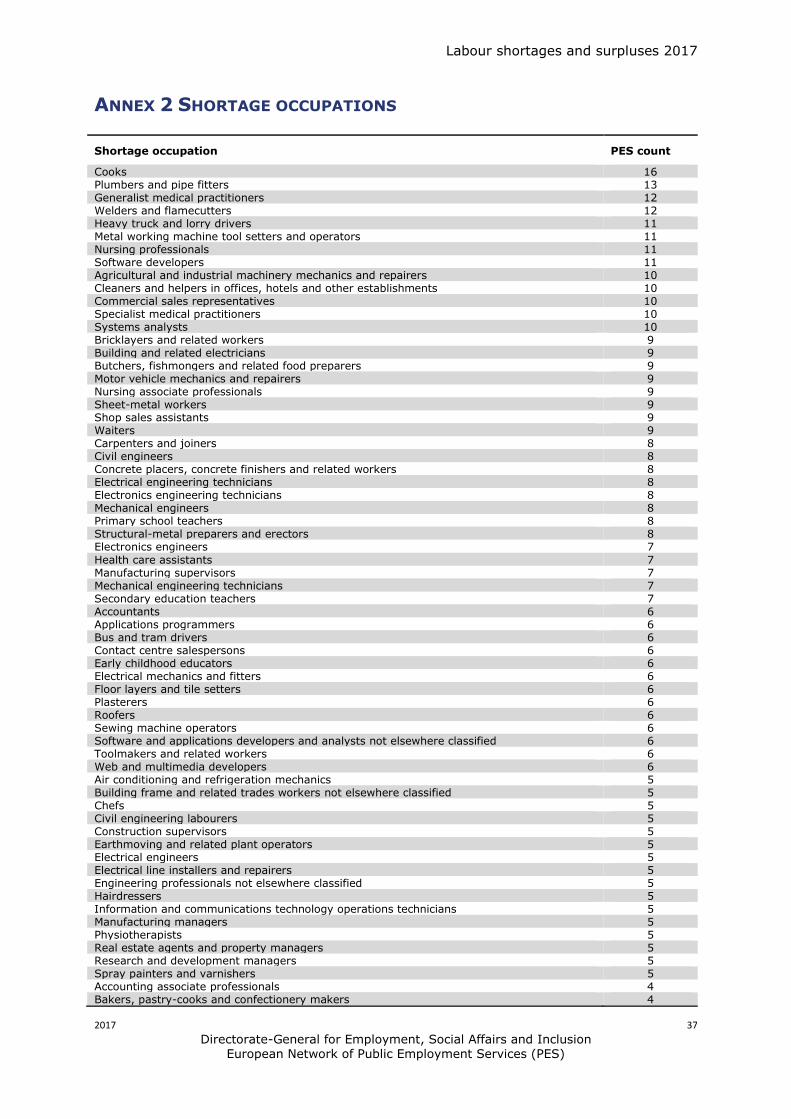
Labour shortages and surpluses 2017
2017 37
Directorate-General for Employment Social Affairs and Inclusion European Network of Public Employment Services (PES)
ANNEX 2 SHORTAGE OCCUPATIONS
Shortage occupation PES count
Cooks 16 Plumbers and pipe fitters 13 Generalist medical practitioners 12 Welders and flamecutters 12 Heavy truck and lorry drivers 11 Metal working machine tool setters and operators 11 Nursing professionals 11 Software developers 11 Agricultural and industrial machinery mechanics and repairers 10 Cleaners and helpers in offices hotels and other establishments 10 Commercial sales representatives 10 Specialist medical practitioners 10 Systems analysts 10 Bricklayers and related workers 9 Building and related electricians 9 Butchers fishmongers and related food preparers 9 Motor vehicle mechanics and repairers 9 Nursing associate professionals 9 Sheet-metal workers 9 Shop sales assistants 9 Waiters 9 Carpenters and joiners 8 Civil engineers 8 Concrete placers concrete finishers and related workers 8 Electrical engineering technicians 8 Electronics engineering technicians 8 Mechanical engineers 8 Primary school teachers 8 Structural-metal preparers and erectors 8 Electronics engineers 7
Health care assistants 7 Manufacturing supervisors 7 Mechanical engineering technicians 7 Secondary education teachers 7 Accountants 6 Applications programmers 6 Bus and tram drivers 6 Contact centre salespersons 6 Early childhood educators 6 Electrical mechanics and fitters 6 Floor layers and tile setters 6 Plasterers 6 Roofers 6 Sewing machine operators 6 Software and applications developers and analysts not elsewhere classified 6 Toolmakers and related workers 6 Web and multimedia developers 6 Air conditioning and refrigeration mechanics 5 Building frame and related trades workers not elsewhere classified 5 Chefs 5 Civil engineering labourers 5 Construction supervisors 5 Earthmoving and related plant operators 5 Electrical engineers 5 Electrical line installers and repairers 5 Engineering professionals not elsewhere classified 5 Hairdressers 5 Information and communications technology operations technicians 5 Manufacturing managers 5 Physiotherapists 5 Real estate agents and property managers 5 Research and development managers 5 Spray painters and varnishers 5 Accounting associate professionals 4 Bakers pastry-cooks and confectionery makers 4
Labour shortages and surpluses 2017
2017 38
Directorate-General for Employment Social Affairs and Inclusion European Network of Public Employment Services (PES)
Shortage occupation PES count
Blacksmiths hammersmiths and forging press workers 4 Civil engineering technicians 4 Crane hoist and related plant operators 4 Database designers and administrators 4 Industrial and production engineers 4 Painters and related workers 4 Physical and engineering science technicians not elsewhere classified 4 Plastic products machine operators 4 Social work and counselling professionals 4 Accounting and bookkeeping clerks 3 Administrative and executive secretaries 3 Ambulance workers 3 Building construction labourers 3 Car taxi and van drivers 3 Cartographers and surveyors 3 Cleaning and housekeeping supervisors in offices hotels and other establishments 3 Contact centre information clerks 3 Draughtspersons 3 Fast food preparers 3 Freight handlers 3 Gardeners horticultural and nursery growers 3 Home-based personal care workers 3 Hotel receptionists 3 Information and communications technology installers and servicers 3 Insulation workers 3 Kitchen helpers 3 Manufacturing labourers not elsewhere classified 3 Medical imaging and therapeutic equipment technicians 3 Metal moulders and coremakers 3 Metal polishers wheel grinders and tool sharpeners 3 Midwifery professionals 3 Other language teachers 3 Personal services workers not elsewhere classified 3
Pharmacists 3 Policy administration professionals 3 Printers 3 Process control technicians not elsewhere classified 3 Sales and marketing managers 3 Shop supervisors 3 Special needs teachers 3 Stock clerks 3 Supply distribution and related managers 3 Survey and market research interviewers 3 Systems administrators 3 Technical and medical sales professionals (excluding ICT) 3 Translators interpreters and other linguists 3 Transport clerks 3 Vocational education teachers 3 Advertising and marketing professionals 2 Audiologists and speech therapists 2 Bartenders 2 Beauticians and related workers 2 Cashiers and ticket clerks 2 Chemical engineers 2 Child care workers 2 Computer network and systems technicians 2 Computer network professionals 2 Construction managers 2 Craft and related workers not elsewhere classified 2 Credit and loans officers 2 Crop farm labourers 2 Database and network professionals not elsewhere classified 2 Dentists 2 Domestic cleaners and helpers 2 Door to door salespersons 2 Driving instructors 2 Electrical and electronic equipment assemblers 2 Electronics mechanics and servicers 2 Elementary workers not elsewhere classified 2 Employment agents and contractors 2
Labour shortages and surpluses 2017
2017 39
Directorate-General for Employment Social Affairs and Inclusion European Network of Public Employment Services (PES)
Shortage occupation PES count
Field crop and vegetable growers 2 Financial analysts 2 Financial and investment advisers 2 Forestry and related workers 2 Garbage and recycling collectors 2 General office clerks 2 Graphic and multimedia designers 2 Information and communications technology service managers 2 Insurance representatives 2 Locomotive engine drivers 2 Mail carriers and sorting clerks 2 Management and organization analysts 2 Mathematicians actuaries and statisticians 2 Mechanical machinery assemblers 2 Medical and dental prosthetic technicians 2 Medical assistants 2 Messengers package deliverers and luggage porters 2 Metal finishing plating and coating machine operators 2 Metal processing plant operators 2 Optometrists and ophthalmic opticians 2 Personal care workers in health services not elsewhere classified 2 Police officers 2 Policy and planning managers 2 Production clerks 2 Restaurant managers 2 Retail and wholesale trade managers 2 Sales workers not elsewhere classified 2 Sewing embroidery and related workers 2 Street food salespersons 2 Tailors dressmakers furriers and hatters 2 Telecommunications engineers 2 Advertising and public relations managers 1 Aged care services managers 1
Agricultural technicians 1 Aircraft engine mechanics and repairers 1 Aircraft pilots and related associate professionals 1 Assemblers not elsewhere classified 1 Authors and related writers 1 Bank tellers and related clerks 1 Bleaching dyeing and fabric cleaning machine operators 1 Bookmakers croupiers and related gaming workers 1 Business services agents not elsewhere classified 1 Buyers 1 Cabinet-makers and related workers 1 Cement stone and other mineral products machine operators 1 Chemical and physical science technicians 1 Chemical engineering technicians 1 Chemical processing plant controllers 1 Chemical products plant and machine operators 1 Chemists 1 Conference and event planners 1 Customs and border inspectors 1 Data entry clerks 1 Dental assistants and therapists 1 Dieticians and nutritionists 1 Dispensing opticians 1 Domestic housekeepers 1 Economists 1 Education methods specialists 1 Environmental and occupational health and hygiene professionals 1 Environmental and occupational health inspectors and associates 1 Fibre preparing spinning and winding machine operators 1 Finance managers 1 Financial and insurance services branch managers 1 Fire-fighters 1 Fitness and recreation instructors and program leaders 1 Food and beverage tasters and graders 1 Food and related products machine operators 1
Labour shortages and surpluses 2017
2017 40
Directorate-General for Employment Social Affairs and Inclusion European Network of Public Employment Services (PES)
Shortage occupation PES count
Food service counter attendants 1 Forestry labourers 1 Fruit vegetable and related preservers 1 Fur and leather preparing machine operators 1 Glass and ceramics plant operators 1 Hand launderers and pressers 1 Hand packers 1 Handicraft workers in textile leather and related materials 1 Health associate professionals not elsewhere classified 1 Health professionals not elsewhere classified 1 House builders 1 Human resource managers 1 Incinerator and water treatment plant operators 1 Information and communications technology user support technicians 1 Judges 1 Lawyers 1 Legal and related associate professionals 1 Legal professionals not elsewhere classified 1 Library clerks 1 Lifting truck operators 1 Livestock and dairy producers 1 Livestock farm labourers 1 Medical and pathology laboratory technicians 1 Medical secretaries 1 Metal production process controllers 1 Mining and quarrying labourers 1 Mining engineers metallurgists and related professionals 1 Mixed crop and animal producers 1 Mixed crop growers 1 Motorcycle drivers 1 Odd job persons 1 Other cleaning workers 1 Other music teachers 1
Paper products machine operators 1 Personnel and careers professionals 1 Personnel clerks 1 Pet groomers and animal care workers 1 Physicists and astronomers 1 Physiotherapy technicians and assistants 1 Potters and related workers 1 Power production plant operators 1 Prison guards 1 Product and garment designers 1 Psychologists 1 Pulp and papermaking plant operators 1 Railway brake signal and switch operators 1 Receptionists (general) 1 Refuse sorters 1 Riggers and cable splicers 1 Scribes and related workers 1 Secretaries (general) 1 Securities and finance dealers and brokers 1 Security guards 1 Senior government officials 1 Senior officials of special-interest organizations 1 Shelf fillers 1 Ships engineers 1 Shoemaking and related machine operators 1 Social work associate professionals 1 Stall and market salespersons 1 Stationary plant and machine operators not elsewhere classified 1 Stonemasons stone cutters splitters and carvers 1 Street and related service workers 1 Sweepers and related labourers 1 Teaching professionals not elsewhere classified 1 Telecommunications engineering technicians 1 Textile fur and leather products machine operators not elsewhere classified 1 Trade brokers 1 Travel attendants and travel stewards 1 Travel guides 1
Labour shortages and surpluses 2017
2017 41
Directorate-General for Employment Social Affairs and Inclusion European Network of Public Employment Services (PES)
Shortage occupation PES count
Tree and shrub crop growers 1 Underwater divers 1 University and higher education teachers 1 Vehicle cleaners 1 Veterinarians 1 Weaving and knitting machine operators 1 Web technicians 1 Wood processing plant operators 1 Woodworking-machine tool setters and operators 1
Labour shortages and surpluses 2017
2017 42
Directorate-General for Employment Social Affairs and Inclusion European Network of Public Employment Services (PES)
ANNEX 3 SURPLUS OCCUPATIONS
Surplus occupation PES count
General office clerks 8 Shop sales assistants 8 Advertising and marketing professionals 6 Bank tellers and related clerks 6 Sociologists anthropologists and related professionals 6 Child care workers 5 Hairdressers 5 Journalists 5 Cashiers and ticket clerks 4 Cleaners and helpers in offices hotels and other establishments 4 Hand packers 4 Mail carriers and sorting clerks 4 Photographers 4 Receptionists (general) 4 Tailors dressmakers furriers and hatters 4 Accounting and bookkeeping clerks 3 Administrative and executive secretaries 3 Beauticians and related workers 3 Biologists botanists zoologists and related professionals 3 Bricklayers and related workers 3 Broadcasting and audio-visual technicians 3 Civil engineering labourers 3 Economists 3 Gardeners horticultural and nursery growers 3 Interior designers and decorators 3 Kitchen helpers 3 Legal professionals not elsewhere classified 3 Manufacturing labourers not elsewhere classified 3 Motor vehicle mechanics and repairers 3
Musicians singers and composers 3 Other artistic and cultural associate professionals 3 Painters and related workers 3 Philosophers historians and political scientists 3 Security guards 3 Sweepers and related labourers 3 Travel consultants and clerks 3 Waiters 3 Actors 2 Archivists and curators 2 Bakers pastry-cooks and confectionery makers 2 Bartenders 2 Building construction labourers 2 Business services and administration managers not elsewhere classified 2 Cabinet-makers and related workers 2 Car taxi and van drivers 2 Chemists 2 Cleaning and housekeeping supervisors in offices hotels and other establishments 2 Credit and loans officers 2 Customs and border inspectors 2 Elementary workers not elsewhere classified 2 Film stage and related directors and producers 2 Financial analysts 2 Forestry and related workers 2 Freight handlers 2 Graphic and multimedia designers 2 Health care assistants 2 Hotel receptionists 2 Lawyers 2 Legal and related associate professionals 2 Library clerks 2 Livestock and dairy producers 2 Management and organization analysts 2 Messengers package deliverers and luggage porters 2 Odd job persons 2 Office supervisors 2 Plasterers 2
Labour shortages and surpluses 2017
2017 43
Directorate-General for Employment Social Affairs and Inclusion European Network of Public Employment Services (PES)
Surplus occupation PES count
Police officers 2 Pre-press technicians 2 Print finishing and binding workers 2 Printers 2 Prison guards 2 Product and garment designers 2 Psychologists 2 Public relations professionals 2 Religious professionals 2 Secondary education teachers 2 Secretaries (general) 2 Social work and counselling professionals 2 Stall and market salespersons 2 Stock clerks 2 Teachers aides 2 Telephone switchboard operators 2 Travel guides 2 Visual artists 2 Advertising and public relations managers 1 Agricultural technicians 1 Announcers on radio television and other media 1 Assemblers not elsewhere classified 1 Building and related electricians 1 Building architects 1 Building caretakers 1 Building frame and related trades workers not elsewhere classified 1 Business services agents not elsewhere classified 1 Buyers 1 Carpenters and joiners 1 Chemical engineers 1 Civil engineers 1 Clearing and forwarding agents 1 Clerical support workers not elsewhere classified 1
Commercial sales representatives 1 Conference and event planners 1 Contact centre information clerks 1 Contact centre salespersons 1 Cooks 1 Crane hoist and related plant operators 1 Creative and performing artists not elsewhere classified 1 Dancers and choreographers 1 Data entry clerks 1 Database designers and administrators 1 Domestic cleaners and helpers 1 Domestic housekeepers 1 Draughtspersons 1 Driving instructors 1 Early childhood educators 1 Electronics mechanics and servicers 1 Farming forestry and fisheries advisers 1 Fashion and other models 1 Fast food preparers 1 Field crop and vegetable growers 1 Filing and copying clerks 1 Finance managers 1 Financial and insurance services branch managers 1 Financial and investment advisers 1 Fire-fighters 1 Fitness and recreation instructors and program leaders 1 Floor layers and tile setters 1 Food service counter attendants 1 Fruit vegetable and related preservers 1 Gallery museum and library technicians 1 Garbage and recycling collectors 1 Garment and related pattern-makers and cutters 1 Glass and ceramics plant operators 1 Government tax and excise officials 1 Hand launderers and pressers 1
Labour shortages and surpluses 2017
2017 44
Directorate-General for Employment Social Affairs and Inclusion European Network of Public Employment Services (PES)
Surplus occupation PES count
Heavy truck and lorry drivers 1 House builders 1 Hunters and trappers 1 Information and communications technology installers and servicers 1 Information and communications technology user support technicians 1 Insurance representatives 1 Jewellery and precious-metal workers 1 Judges 1 Legal secretaries 1 Librarians and related information professionals 1 Life science technicians (excluding medical) 1 Lifting truck operators 1 Managing directors and chief executives 1 Manufacturing supervisors 1 Medical and dental prosthetic technicians 1 Metal moulders and coremakers 1 Mining and quarrying labourers 1 Mixed crop and animal producers 1 Mixed crop growers 1 Mobile farm and forestry plant operators 1 Musical instrument makers and tuners 1 Other language teachers 1 Pawnbrokers and money-lenders 1 Personnel and careers professionals 1 Pet groomers and animal care workers 1 Photographic products machine operators 1 Physical and engineering science technicians not elsewhere classified 1 Physicists and astronomers 1 Police inspectors and detectives 1 Precision-instrument makers and repairers 1 Primary school teachers 1 Process control technicians not elsewhere classified 1 Product graders and testers (excluding foods and beverages) 1
Production clerks 1 Professional services managers not elsewhere classified 1 Protective services workers not elsewhere classified 1 Research and development managers 1 Retail and wholesale trade managers 1 Roofers 1 Sales workers not elsewhere classified 1 Senior government officials 1 Service station attendants 1 Shelf fillers 1 Shop supervisors 1 Social work associate professionals 1 Special needs teachers 1 Spray painters and varnishers 1 Statistical mathematical and related associate professionals 1 Stonemasons stone cutters splitters and carvers 1 Street food salespersons 1 Supply distribution and related managers 1 Teaching professionals not elsewhere classified 1 Technical and medical sales professionals (excluding ICT) 1 Training and staff development professionals 1 Translators interpreters and other linguists 1 Transport conductors 1 Tree and shrub crop growers 1 Typists and word processing operators 1 Undertakers and embalmers 1 Vocational education teachers 1 Weaving and knitting machine operators 1 Woodworking-machine tool setters and operators 1
Labour shortages and surpluses 2017
2017 45
Directorate-General for Employment Social Affairs and Inclusion European Network of Public Employment Services (PES)
ANNEX 4 THE RATIO OF UNEMPLOYED TO NEW HIRES
ISCO-08 title
2015
UE
Recruited in the
last year (lt12
months)
Ratio of UE to new recruits
Street and related service workers 85 104 08 Agricultural forestry and fishery labourers 3913 5343 07 Mining and construction labourers 1937 3525 05 Creative and performing artists 610 1115 05 Refuse workers 1036 1923 05 Painters building structure cleaners and related trades workers 1116 2117 05 Street and market salespersons 195 389 05 Building frame and related trades workers 3632 7353 05 Mining manufacturing and construction supervisors 626 1315 05 Ships deck crews and related workers 53 114 05 Market gardeners and crop growers 1471 3207 05 Managing directors and chief executives 304 667 05 Travel attendants conductors and guides 229 538 04 Wood treaters cabinet-makers and related trades workers 491 1159 04 Manufacturing labourers 1640 3909 04 Domestic hotel and office cleaners and helpers 5679 13545 04 Other stationary plant and machine operators 822 1961 04 Mobile plant operators 1038 2497 04 Building finishers and related trades workers 1519 3680 04 Textile fur and leather products machine operators 431 1048 04 Garment and related trades workers 422 1047 04 Chemical and photographic products plant and machine operators 157 389 04 Food processing and related trades workers 930 2330 04 Vehicle window laundry and other hand cleaning workers 291 754 04 Sheet and structural metal workers moulders and welders and related workers
996 2603 04
Waiters and bartenders 4399 11595 04 Cooks 1529 4039 04 Metal processing and finishing plant operators 208 557 04 Printing trades workers 203 548 04 Forestry and related workers 130 351 04 Protective services workers 1347 3658 04 Transport and storage labourers 2532 6939 04 Fishery workers hunters and trappers 46 128 04 Material-recording and transport clerks 1671 4630 04 Process control technicians 179 517 03 Mining and mineral processing plant operators 94 274 03 Telecommunications and broadcasting technicians 177 519 03 Blacksmiths toolmakers and related trades workers 816 2409 03 Building and housekeeping supervisors 678 2045 03
Secretaries (general) 1072 3259 03 Assemblers 850 2586 03 Other craft and related workers 258 810 03 Shop salespersons 6600 21042 03 Electrical equipment installers and repairers 958 3060 03 Food and related products machine operators 437 1400 03 Other sales workers 1087 3510 03 Food preparation assistants 1646 5337 03 Mixed crop and animal producers 387 1260 03 Car van and motorcycle drivers 1155 3764 03 Client information workers 1993 6531 03 Sports and fitness workers 605 1984 03 Handicraft workers 194 638 03 Life science technicians and related associate professionals 82 271 03 Keyboard operators 283 940 03 Electronics and telecommunications installers and repairers 290 963 03 Other personal services workers 313 1047 03 Vocational education teachers 279 940 03 Other teaching professionals 744 2518 03 General office clerks 966 3272 03 Authors journalists and linguists 335 1135 03 Hairdressers beauticians and related workers 806 2796 03
Labour shortages and surpluses 2017
2017 46
Directorate-General for Employment Social Affairs and Inclusion European Network of Public Employment Services (PES)
ISCO-08 title
2015
UE
Recruited in the
last year (lt12
months)
Ratio of UE to new recruits
Animal producers 189 660 03 Other elementary workers 976 3401 03 Machinery mechanics and repairers 1134 3962 03 Ship and aircraft controllers and technicians 80 281 03 Hotel and restaurant managers 344 1220 03 Cashiers and ticket clerks 908 3220 03 Retail and wholesale trade managers 224 809 03 Sales marketing and development managers 311 1124 03 Physical and engineering science technicians 1204 4366 03 Administrative and specialised secretaries 1106 4040 03 Sales and purchasing agents and brokers 1294 4754 03 Rubber plastic and paper products machine operators 256 941 03 Artistic cultural and culinary associate professionals 511 1906 03 Numerical clerks 944 3532 03 Other services managers 184 691 03 Child care workers and teachers aides 1335 5005 03 Heavy truck and bus drivers 1426 5349 03 Business services and administration managers 383 1439 03 Information and communications technology service managers 67 257 03 Regulatory government associate professionals 209 807 03 Life science professionals 176 681 03 Wood processing and papermaking plant operators 97 379 03 Locomotive engine drivers and related workers 46 179 03 Legal professionals 315 1245 03 Personal care workers in health services 2195 8787 02 Physical and earth science professionals 85 345 02 Street vendors (excluding food) 50 204 02 Architects planners surveyors and designers 515 2092 02 Other clerical support workers 901 3657 02 Business services agents 510 2114 02 Manufacturing mining construction and distribution managers 361 1507 02 Tellers money collectors and related clerks 381 1612 02 Librarians archivists and curators 58 248 02 Medical and pharmaceutical technicians 255 1099 02 University and higher education teachers 301 1333 02 Information and communications technology operations and user support technicians
418 1888 02
Legal social and religious associate professionals 920 4348 02 Financial and mathematical associate professionals 601 2852 02 Sales marketing and public relations professionals 865 4172 02 Finance professionals 472 2281 02 Engineering professionals (excluding electrotechnology) 635 3118 02 Other health associate professionals 531 2657 02
Social and religious professionals 460 2317 02 Professional services managers 176 891 02 Nursing and midwifery associate professionals 556 2855 02 Legislators and senior officials 53 286 02 Database and network professionals 83 455 02 Administration professionals 641 3673 02 Primary school and early childhood teachers 575 3345 02 Electrotechnology engineers 142 827 02 Secondary education teachers 471 2812 02 Other health professionals 346 2083 02 Nursing and midwifery professionals 273 1760 02 Software and applications developers and analysts 631 4159 02 Medical doctors 293 1944 02 No occupation 152894 00
No answer 2531 578 44 Total 249561 294937 08
Labour shortages and surpluses 2017
2017 47
Directorate-General for Employment Social Affairs and Inclusion European Network of Public Employment Services (PES)
HOW TO OBTAIN EU PUBLICATIONS
Free publications
bull one copy
via EU Bookshop (httpbookshopeuropaeu)
bull more than one copy or postersmaps
from the European Unionrsquos representations (httpeceuropaeurepresent_enhtm)
from the delegations in non-EU countries
(httpeeaseuropaeudelegationsindex_enhtm)
by contacting the Europe Direct service (httpeuropaeueuropedirectindex_enhtm)
or calling 00 800 6 7 8 9 10 11 (free phone number from anywhere in the EU) () () The information given is free as are most calls (though some operators phone boxes or hotels may charge you)
Priced publications
bull via EU Bookshop (httpbookshopeuropaeu)
Priced subscriptions
bull via one of the sales agents of the Publications Office of the European Union
(httppublicationseuropaeuothersagentsindex_enhtm)
doi 10276731262
KE-0
1-1
8-2
63-E
N-N
[Ca
talo
gu
e n
um
be
r]
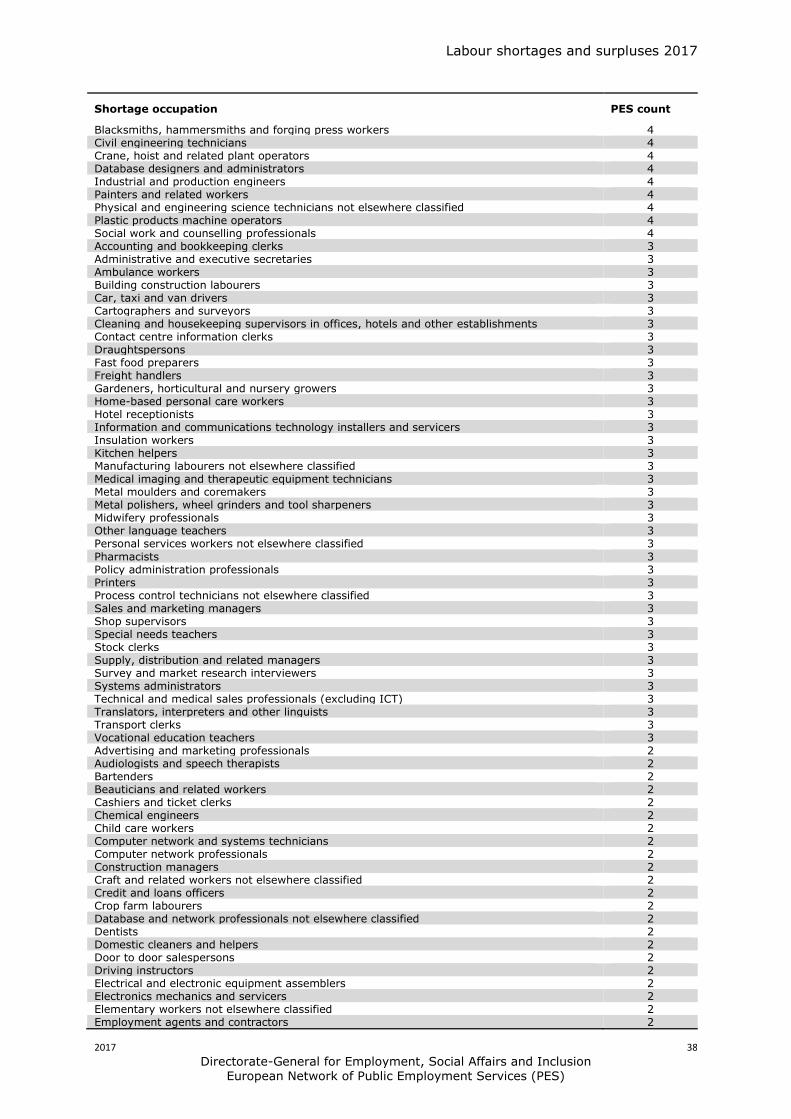
Labour shortages and surpluses 2017
2017 38
Directorate-General for Employment Social Affairs and Inclusion European Network of Public Employment Services (PES)
Shortage occupation PES count
Blacksmiths hammersmiths and forging press workers 4 Civil engineering technicians 4 Crane hoist and related plant operators 4 Database designers and administrators 4 Industrial and production engineers 4 Painters and related workers 4 Physical and engineering science technicians not elsewhere classified 4 Plastic products machine operators 4 Social work and counselling professionals 4 Accounting and bookkeeping clerks 3 Administrative and executive secretaries 3 Ambulance workers 3 Building construction labourers 3 Car taxi and van drivers 3 Cartographers and surveyors 3 Cleaning and housekeeping supervisors in offices hotels and other establishments 3 Contact centre information clerks 3 Draughtspersons 3 Fast food preparers 3 Freight handlers 3 Gardeners horticultural and nursery growers 3 Home-based personal care workers 3 Hotel receptionists 3 Information and communications technology installers and servicers 3 Insulation workers 3 Kitchen helpers 3 Manufacturing labourers not elsewhere classified 3 Medical imaging and therapeutic equipment technicians 3 Metal moulders and coremakers 3 Metal polishers wheel grinders and tool sharpeners 3 Midwifery professionals 3 Other language teachers 3 Personal services workers not elsewhere classified 3
Pharmacists 3 Policy administration professionals 3 Printers 3 Process control technicians not elsewhere classified 3 Sales and marketing managers 3 Shop supervisors 3 Special needs teachers 3 Stock clerks 3 Supply distribution and related managers 3 Survey and market research interviewers 3 Systems administrators 3 Technical and medical sales professionals (excluding ICT) 3 Translators interpreters and other linguists 3 Transport clerks 3 Vocational education teachers 3 Advertising and marketing professionals 2 Audiologists and speech therapists 2 Bartenders 2 Beauticians and related workers 2 Cashiers and ticket clerks 2 Chemical engineers 2 Child care workers 2 Computer network and systems technicians 2 Computer network professionals 2 Construction managers 2 Craft and related workers not elsewhere classified 2 Credit and loans officers 2 Crop farm labourers 2 Database and network professionals not elsewhere classified 2 Dentists 2 Domestic cleaners and helpers 2 Door to door salespersons 2 Driving instructors 2 Electrical and electronic equipment assemblers 2 Electronics mechanics and servicers 2 Elementary workers not elsewhere classified 2 Employment agents and contractors 2
Labour shortages and surpluses 2017
2017 39
Directorate-General for Employment Social Affairs and Inclusion European Network of Public Employment Services (PES)
Shortage occupation PES count
Field crop and vegetable growers 2 Financial analysts 2 Financial and investment advisers 2 Forestry and related workers 2 Garbage and recycling collectors 2 General office clerks 2 Graphic and multimedia designers 2 Information and communications technology service managers 2 Insurance representatives 2 Locomotive engine drivers 2 Mail carriers and sorting clerks 2 Management and organization analysts 2 Mathematicians actuaries and statisticians 2 Mechanical machinery assemblers 2 Medical and dental prosthetic technicians 2 Medical assistants 2 Messengers package deliverers and luggage porters 2 Metal finishing plating and coating machine operators 2 Metal processing plant operators 2 Optometrists and ophthalmic opticians 2 Personal care workers in health services not elsewhere classified 2 Police officers 2 Policy and planning managers 2 Production clerks 2 Restaurant managers 2 Retail and wholesale trade managers 2 Sales workers not elsewhere classified 2 Sewing embroidery and related workers 2 Street food salespersons 2 Tailors dressmakers furriers and hatters 2 Telecommunications engineers 2 Advertising and public relations managers 1 Aged care services managers 1
Agricultural technicians 1 Aircraft engine mechanics and repairers 1 Aircraft pilots and related associate professionals 1 Assemblers not elsewhere classified 1 Authors and related writers 1 Bank tellers and related clerks 1 Bleaching dyeing and fabric cleaning machine operators 1 Bookmakers croupiers and related gaming workers 1 Business services agents not elsewhere classified 1 Buyers 1 Cabinet-makers and related workers 1 Cement stone and other mineral products machine operators 1 Chemical and physical science technicians 1 Chemical engineering technicians 1 Chemical processing plant controllers 1 Chemical products plant and machine operators 1 Chemists 1 Conference and event planners 1 Customs and border inspectors 1 Data entry clerks 1 Dental assistants and therapists 1 Dieticians and nutritionists 1 Dispensing opticians 1 Domestic housekeepers 1 Economists 1 Education methods specialists 1 Environmental and occupational health and hygiene professionals 1 Environmental and occupational health inspectors and associates 1 Fibre preparing spinning and winding machine operators 1 Finance managers 1 Financial and insurance services branch managers 1 Fire-fighters 1 Fitness and recreation instructors and program leaders 1 Food and beverage tasters and graders 1 Food and related products machine operators 1
Labour shortages and surpluses 2017
2017 40
Directorate-General for Employment Social Affairs and Inclusion European Network of Public Employment Services (PES)
Shortage occupation PES count
Food service counter attendants 1 Forestry labourers 1 Fruit vegetable and related preservers 1 Fur and leather preparing machine operators 1 Glass and ceramics plant operators 1 Hand launderers and pressers 1 Hand packers 1 Handicraft workers in textile leather and related materials 1 Health associate professionals not elsewhere classified 1 Health professionals not elsewhere classified 1 House builders 1 Human resource managers 1 Incinerator and water treatment plant operators 1 Information and communications technology user support technicians 1 Judges 1 Lawyers 1 Legal and related associate professionals 1 Legal professionals not elsewhere classified 1 Library clerks 1 Lifting truck operators 1 Livestock and dairy producers 1 Livestock farm labourers 1 Medical and pathology laboratory technicians 1 Medical secretaries 1 Metal production process controllers 1 Mining and quarrying labourers 1 Mining engineers metallurgists and related professionals 1 Mixed crop and animal producers 1 Mixed crop growers 1 Motorcycle drivers 1 Odd job persons 1 Other cleaning workers 1 Other music teachers 1
Paper products machine operators 1 Personnel and careers professionals 1 Personnel clerks 1 Pet groomers and animal care workers 1 Physicists and astronomers 1 Physiotherapy technicians and assistants 1 Potters and related workers 1 Power production plant operators 1 Prison guards 1 Product and garment designers 1 Psychologists 1 Pulp and papermaking plant operators 1 Railway brake signal and switch operators 1 Receptionists (general) 1 Refuse sorters 1 Riggers and cable splicers 1 Scribes and related workers 1 Secretaries (general) 1 Securities and finance dealers and brokers 1 Security guards 1 Senior government officials 1 Senior officials of special-interest organizations 1 Shelf fillers 1 Ships engineers 1 Shoemaking and related machine operators 1 Social work associate professionals 1 Stall and market salespersons 1 Stationary plant and machine operators not elsewhere classified 1 Stonemasons stone cutters splitters and carvers 1 Street and related service workers 1 Sweepers and related labourers 1 Teaching professionals not elsewhere classified 1 Telecommunications engineering technicians 1 Textile fur and leather products machine operators not elsewhere classified 1 Trade brokers 1 Travel attendants and travel stewards 1 Travel guides 1
Labour shortages and surpluses 2017
2017 41
Directorate-General for Employment Social Affairs and Inclusion European Network of Public Employment Services (PES)
Shortage occupation PES count
Tree and shrub crop growers 1 Underwater divers 1 University and higher education teachers 1 Vehicle cleaners 1 Veterinarians 1 Weaving and knitting machine operators 1 Web technicians 1 Wood processing plant operators 1 Woodworking-machine tool setters and operators 1
Labour shortages and surpluses 2017
2017 42
Directorate-General for Employment Social Affairs and Inclusion European Network of Public Employment Services (PES)
ANNEX 3 SURPLUS OCCUPATIONS
Surplus occupation PES count
General office clerks 8 Shop sales assistants 8 Advertising and marketing professionals 6 Bank tellers and related clerks 6 Sociologists anthropologists and related professionals 6 Child care workers 5 Hairdressers 5 Journalists 5 Cashiers and ticket clerks 4 Cleaners and helpers in offices hotels and other establishments 4 Hand packers 4 Mail carriers and sorting clerks 4 Photographers 4 Receptionists (general) 4 Tailors dressmakers furriers and hatters 4 Accounting and bookkeeping clerks 3 Administrative and executive secretaries 3 Beauticians and related workers 3 Biologists botanists zoologists and related professionals 3 Bricklayers and related workers 3 Broadcasting and audio-visual technicians 3 Civil engineering labourers 3 Economists 3 Gardeners horticultural and nursery growers 3 Interior designers and decorators 3 Kitchen helpers 3 Legal professionals not elsewhere classified 3 Manufacturing labourers not elsewhere classified 3 Motor vehicle mechanics and repairers 3
Musicians singers and composers 3 Other artistic and cultural associate professionals 3 Painters and related workers 3 Philosophers historians and political scientists 3 Security guards 3 Sweepers and related labourers 3 Travel consultants and clerks 3 Waiters 3 Actors 2 Archivists and curators 2 Bakers pastry-cooks and confectionery makers 2 Bartenders 2 Building construction labourers 2 Business services and administration managers not elsewhere classified 2 Cabinet-makers and related workers 2 Car taxi and van drivers 2 Chemists 2 Cleaning and housekeeping supervisors in offices hotels and other establishments 2 Credit and loans officers 2 Customs and border inspectors 2 Elementary workers not elsewhere classified 2 Film stage and related directors and producers 2 Financial analysts 2 Forestry and related workers 2 Freight handlers 2 Graphic and multimedia designers 2 Health care assistants 2 Hotel receptionists 2 Lawyers 2 Legal and related associate professionals 2 Library clerks 2 Livestock and dairy producers 2 Management and organization analysts 2 Messengers package deliverers and luggage porters 2 Odd job persons 2 Office supervisors 2 Plasterers 2
Labour shortages and surpluses 2017
2017 43
Directorate-General for Employment Social Affairs and Inclusion European Network of Public Employment Services (PES)
Surplus occupation PES count
Police officers 2 Pre-press technicians 2 Print finishing and binding workers 2 Printers 2 Prison guards 2 Product and garment designers 2 Psychologists 2 Public relations professionals 2 Religious professionals 2 Secondary education teachers 2 Secretaries (general) 2 Social work and counselling professionals 2 Stall and market salespersons 2 Stock clerks 2 Teachers aides 2 Telephone switchboard operators 2 Travel guides 2 Visual artists 2 Advertising and public relations managers 1 Agricultural technicians 1 Announcers on radio television and other media 1 Assemblers not elsewhere classified 1 Building and related electricians 1 Building architects 1 Building caretakers 1 Building frame and related trades workers not elsewhere classified 1 Business services agents not elsewhere classified 1 Buyers 1 Carpenters and joiners 1 Chemical engineers 1 Civil engineers 1 Clearing and forwarding agents 1 Clerical support workers not elsewhere classified 1
Commercial sales representatives 1 Conference and event planners 1 Contact centre information clerks 1 Contact centre salespersons 1 Cooks 1 Crane hoist and related plant operators 1 Creative and performing artists not elsewhere classified 1 Dancers and choreographers 1 Data entry clerks 1 Database designers and administrators 1 Domestic cleaners and helpers 1 Domestic housekeepers 1 Draughtspersons 1 Driving instructors 1 Early childhood educators 1 Electronics mechanics and servicers 1 Farming forestry and fisheries advisers 1 Fashion and other models 1 Fast food preparers 1 Field crop and vegetable growers 1 Filing and copying clerks 1 Finance managers 1 Financial and insurance services branch managers 1 Financial and investment advisers 1 Fire-fighters 1 Fitness and recreation instructors and program leaders 1 Floor layers and tile setters 1 Food service counter attendants 1 Fruit vegetable and related preservers 1 Gallery museum and library technicians 1 Garbage and recycling collectors 1 Garment and related pattern-makers and cutters 1 Glass and ceramics plant operators 1 Government tax and excise officials 1 Hand launderers and pressers 1
Labour shortages and surpluses 2017
2017 44
Directorate-General for Employment Social Affairs and Inclusion European Network of Public Employment Services (PES)
Surplus occupation PES count
Heavy truck and lorry drivers 1 House builders 1 Hunters and trappers 1 Information and communications technology installers and servicers 1 Information and communications technology user support technicians 1 Insurance representatives 1 Jewellery and precious-metal workers 1 Judges 1 Legal secretaries 1 Librarians and related information professionals 1 Life science technicians (excluding medical) 1 Lifting truck operators 1 Managing directors and chief executives 1 Manufacturing supervisors 1 Medical and dental prosthetic technicians 1 Metal moulders and coremakers 1 Mining and quarrying labourers 1 Mixed crop and animal producers 1 Mixed crop growers 1 Mobile farm and forestry plant operators 1 Musical instrument makers and tuners 1 Other language teachers 1 Pawnbrokers and money-lenders 1 Personnel and careers professionals 1 Pet groomers and animal care workers 1 Photographic products machine operators 1 Physical and engineering science technicians not elsewhere classified 1 Physicists and astronomers 1 Police inspectors and detectives 1 Precision-instrument makers and repairers 1 Primary school teachers 1 Process control technicians not elsewhere classified 1 Product graders and testers (excluding foods and beverages) 1
Production clerks 1 Professional services managers not elsewhere classified 1 Protective services workers not elsewhere classified 1 Research and development managers 1 Retail and wholesale trade managers 1 Roofers 1 Sales workers not elsewhere classified 1 Senior government officials 1 Service station attendants 1 Shelf fillers 1 Shop supervisors 1 Social work associate professionals 1 Special needs teachers 1 Spray painters and varnishers 1 Statistical mathematical and related associate professionals 1 Stonemasons stone cutters splitters and carvers 1 Street food salespersons 1 Supply distribution and related managers 1 Teaching professionals not elsewhere classified 1 Technical and medical sales professionals (excluding ICT) 1 Training and staff development professionals 1 Translators interpreters and other linguists 1 Transport conductors 1 Tree and shrub crop growers 1 Typists and word processing operators 1 Undertakers and embalmers 1 Vocational education teachers 1 Weaving and knitting machine operators 1 Woodworking-machine tool setters and operators 1
Labour shortages and surpluses 2017
2017 45
Directorate-General for Employment Social Affairs and Inclusion European Network of Public Employment Services (PES)
ANNEX 4 THE RATIO OF UNEMPLOYED TO NEW HIRES
ISCO-08 title
2015
UE
Recruited in the
last year (lt12
months)
Ratio of UE to new recruits
Street and related service workers 85 104 08 Agricultural forestry and fishery labourers 3913 5343 07 Mining and construction labourers 1937 3525 05 Creative and performing artists 610 1115 05 Refuse workers 1036 1923 05 Painters building structure cleaners and related trades workers 1116 2117 05 Street and market salespersons 195 389 05 Building frame and related trades workers 3632 7353 05 Mining manufacturing and construction supervisors 626 1315 05 Ships deck crews and related workers 53 114 05 Market gardeners and crop growers 1471 3207 05 Managing directors and chief executives 304 667 05 Travel attendants conductors and guides 229 538 04 Wood treaters cabinet-makers and related trades workers 491 1159 04 Manufacturing labourers 1640 3909 04 Domestic hotel and office cleaners and helpers 5679 13545 04 Other stationary plant and machine operators 822 1961 04 Mobile plant operators 1038 2497 04 Building finishers and related trades workers 1519 3680 04 Textile fur and leather products machine operators 431 1048 04 Garment and related trades workers 422 1047 04 Chemical and photographic products plant and machine operators 157 389 04 Food processing and related trades workers 930 2330 04 Vehicle window laundry and other hand cleaning workers 291 754 04 Sheet and structural metal workers moulders and welders and related workers
996 2603 04
Waiters and bartenders 4399 11595 04 Cooks 1529 4039 04 Metal processing and finishing plant operators 208 557 04 Printing trades workers 203 548 04 Forestry and related workers 130 351 04 Protective services workers 1347 3658 04 Transport and storage labourers 2532 6939 04 Fishery workers hunters and trappers 46 128 04 Material-recording and transport clerks 1671 4630 04 Process control technicians 179 517 03 Mining and mineral processing plant operators 94 274 03 Telecommunications and broadcasting technicians 177 519 03 Blacksmiths toolmakers and related trades workers 816 2409 03 Building and housekeeping supervisors 678 2045 03
Secretaries (general) 1072 3259 03 Assemblers 850 2586 03 Other craft and related workers 258 810 03 Shop salespersons 6600 21042 03 Electrical equipment installers and repairers 958 3060 03 Food and related products machine operators 437 1400 03 Other sales workers 1087 3510 03 Food preparation assistants 1646 5337 03 Mixed crop and animal producers 387 1260 03 Car van and motorcycle drivers 1155 3764 03 Client information workers 1993 6531 03 Sports and fitness workers 605 1984 03 Handicraft workers 194 638 03 Life science technicians and related associate professionals 82 271 03 Keyboard operators 283 940 03 Electronics and telecommunications installers and repairers 290 963 03 Other personal services workers 313 1047 03 Vocational education teachers 279 940 03 Other teaching professionals 744 2518 03 General office clerks 966 3272 03 Authors journalists and linguists 335 1135 03 Hairdressers beauticians and related workers 806 2796 03
Labour shortages and surpluses 2017
2017 46
Directorate-General for Employment Social Affairs and Inclusion European Network of Public Employment Services (PES)
ISCO-08 title
2015
UE
Recruited in the
last year (lt12
months)
Ratio of UE to new recruits
Animal producers 189 660 03 Other elementary workers 976 3401 03 Machinery mechanics and repairers 1134 3962 03 Ship and aircraft controllers and technicians 80 281 03 Hotel and restaurant managers 344 1220 03 Cashiers and ticket clerks 908 3220 03 Retail and wholesale trade managers 224 809 03 Sales marketing and development managers 311 1124 03 Physical and engineering science technicians 1204 4366 03 Administrative and specialised secretaries 1106 4040 03 Sales and purchasing agents and brokers 1294 4754 03 Rubber plastic and paper products machine operators 256 941 03 Artistic cultural and culinary associate professionals 511 1906 03 Numerical clerks 944 3532 03 Other services managers 184 691 03 Child care workers and teachers aides 1335 5005 03 Heavy truck and bus drivers 1426 5349 03 Business services and administration managers 383 1439 03 Information and communications technology service managers 67 257 03 Regulatory government associate professionals 209 807 03 Life science professionals 176 681 03 Wood processing and papermaking plant operators 97 379 03 Locomotive engine drivers and related workers 46 179 03 Legal professionals 315 1245 03 Personal care workers in health services 2195 8787 02 Physical and earth science professionals 85 345 02 Street vendors (excluding food) 50 204 02 Architects planners surveyors and designers 515 2092 02 Other clerical support workers 901 3657 02 Business services agents 510 2114 02 Manufacturing mining construction and distribution managers 361 1507 02 Tellers money collectors and related clerks 381 1612 02 Librarians archivists and curators 58 248 02 Medical and pharmaceutical technicians 255 1099 02 University and higher education teachers 301 1333 02 Information and communications technology operations and user support technicians
418 1888 02
Legal social and religious associate professionals 920 4348 02 Financial and mathematical associate professionals 601 2852 02 Sales marketing and public relations professionals 865 4172 02 Finance professionals 472 2281 02 Engineering professionals (excluding electrotechnology) 635 3118 02 Other health associate professionals 531 2657 02
Social and religious professionals 460 2317 02 Professional services managers 176 891 02 Nursing and midwifery associate professionals 556 2855 02 Legislators and senior officials 53 286 02 Database and network professionals 83 455 02 Administration professionals 641 3673 02 Primary school and early childhood teachers 575 3345 02 Electrotechnology engineers 142 827 02 Secondary education teachers 471 2812 02 Other health professionals 346 2083 02 Nursing and midwifery professionals 273 1760 02 Software and applications developers and analysts 631 4159 02 Medical doctors 293 1944 02 No occupation 152894 00
No answer 2531 578 44 Total 249561 294937 08
Labour shortages and surpluses 2017
2017 47
Directorate-General for Employment Social Affairs and Inclusion European Network of Public Employment Services (PES)
HOW TO OBTAIN EU PUBLICATIONS
Free publications
bull one copy
via EU Bookshop (httpbookshopeuropaeu)
bull more than one copy or postersmaps
from the European Unionrsquos representations (httpeceuropaeurepresent_enhtm)
from the delegations in non-EU countries
(httpeeaseuropaeudelegationsindex_enhtm)
by contacting the Europe Direct service (httpeuropaeueuropedirectindex_enhtm)
or calling 00 800 6 7 8 9 10 11 (free phone number from anywhere in the EU) () () The information given is free as are most calls (though some operators phone boxes or hotels may charge you)
Priced publications
bull via EU Bookshop (httpbookshopeuropaeu)
Priced subscriptions
bull via one of the sales agents of the Publications Office of the European Union
(httppublicationseuropaeuothersagentsindex_enhtm)
doi 10276731262
KE-0
1-1
8-2
63-E
N-N
[Ca
talo
gu
e n
um
be
r]
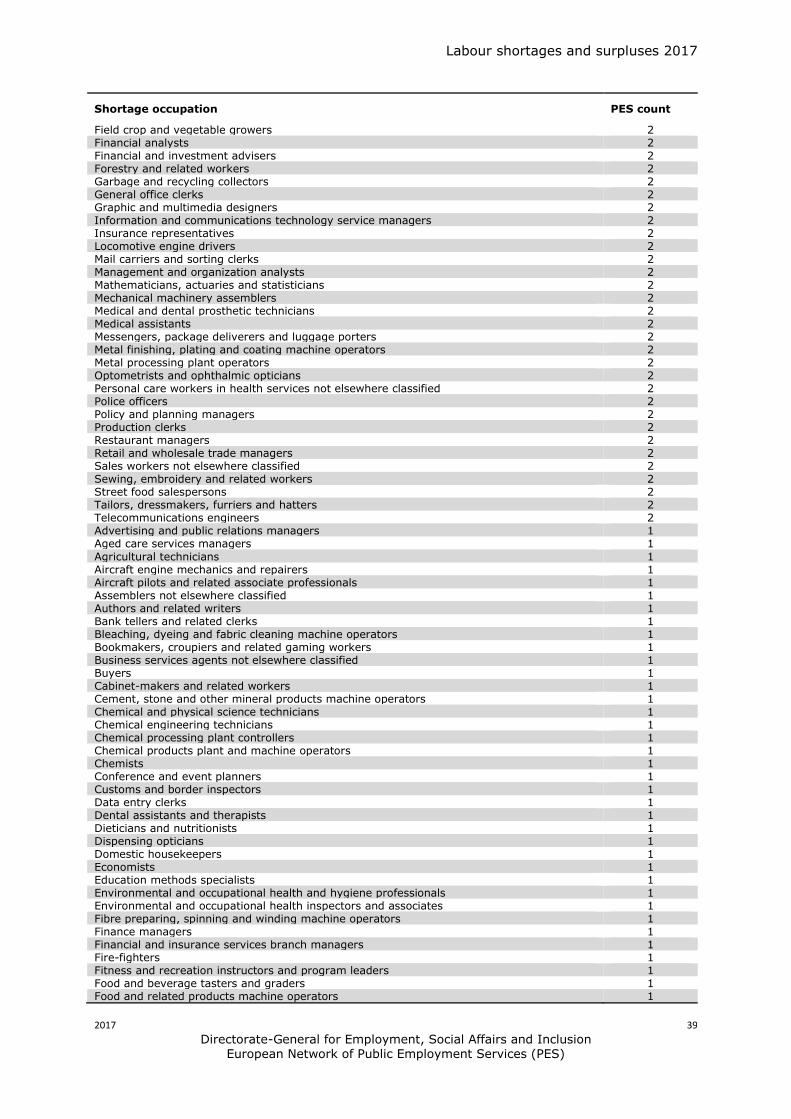
Labour shortages and surpluses 2017
2017 39
Directorate-General for Employment Social Affairs and Inclusion European Network of Public Employment Services (PES)
Shortage occupation PES count
Field crop and vegetable growers 2 Financial analysts 2 Financial and investment advisers 2 Forestry and related workers 2 Garbage and recycling collectors 2 General office clerks 2 Graphic and multimedia designers 2 Information and communications technology service managers 2 Insurance representatives 2 Locomotive engine drivers 2 Mail carriers and sorting clerks 2 Management and organization analysts 2 Mathematicians actuaries and statisticians 2 Mechanical machinery assemblers 2 Medical and dental prosthetic technicians 2 Medical assistants 2 Messengers package deliverers and luggage porters 2 Metal finishing plating and coating machine operators 2 Metal processing plant operators 2 Optometrists and ophthalmic opticians 2 Personal care workers in health services not elsewhere classified 2 Police officers 2 Policy and planning managers 2 Production clerks 2 Restaurant managers 2 Retail and wholesale trade managers 2 Sales workers not elsewhere classified 2 Sewing embroidery and related workers 2 Street food salespersons 2 Tailors dressmakers furriers and hatters 2 Telecommunications engineers 2 Advertising and public relations managers 1 Aged care services managers 1
Agricultural technicians 1 Aircraft engine mechanics and repairers 1 Aircraft pilots and related associate professionals 1 Assemblers not elsewhere classified 1 Authors and related writers 1 Bank tellers and related clerks 1 Bleaching dyeing and fabric cleaning machine operators 1 Bookmakers croupiers and related gaming workers 1 Business services agents not elsewhere classified 1 Buyers 1 Cabinet-makers and related workers 1 Cement stone and other mineral products machine operators 1 Chemical and physical science technicians 1 Chemical engineering technicians 1 Chemical processing plant controllers 1 Chemical products plant and machine operators 1 Chemists 1 Conference and event planners 1 Customs and border inspectors 1 Data entry clerks 1 Dental assistants and therapists 1 Dieticians and nutritionists 1 Dispensing opticians 1 Domestic housekeepers 1 Economists 1 Education methods specialists 1 Environmental and occupational health and hygiene professionals 1 Environmental and occupational health inspectors and associates 1 Fibre preparing spinning and winding machine operators 1 Finance managers 1 Financial and insurance services branch managers 1 Fire-fighters 1 Fitness and recreation instructors and program leaders 1 Food and beverage tasters and graders 1 Food and related products machine operators 1
Labour shortages and surpluses 2017
2017 40
Directorate-General for Employment Social Affairs and Inclusion European Network of Public Employment Services (PES)
Shortage occupation PES count
Food service counter attendants 1 Forestry labourers 1 Fruit vegetable and related preservers 1 Fur and leather preparing machine operators 1 Glass and ceramics plant operators 1 Hand launderers and pressers 1 Hand packers 1 Handicraft workers in textile leather and related materials 1 Health associate professionals not elsewhere classified 1 Health professionals not elsewhere classified 1 House builders 1 Human resource managers 1 Incinerator and water treatment plant operators 1 Information and communications technology user support technicians 1 Judges 1 Lawyers 1 Legal and related associate professionals 1 Legal professionals not elsewhere classified 1 Library clerks 1 Lifting truck operators 1 Livestock and dairy producers 1 Livestock farm labourers 1 Medical and pathology laboratory technicians 1 Medical secretaries 1 Metal production process controllers 1 Mining and quarrying labourers 1 Mining engineers metallurgists and related professionals 1 Mixed crop and animal producers 1 Mixed crop growers 1 Motorcycle drivers 1 Odd job persons 1 Other cleaning workers 1 Other music teachers 1
Paper products machine operators 1 Personnel and careers professionals 1 Personnel clerks 1 Pet groomers and animal care workers 1 Physicists and astronomers 1 Physiotherapy technicians and assistants 1 Potters and related workers 1 Power production plant operators 1 Prison guards 1 Product and garment designers 1 Psychologists 1 Pulp and papermaking plant operators 1 Railway brake signal and switch operators 1 Receptionists (general) 1 Refuse sorters 1 Riggers and cable splicers 1 Scribes and related workers 1 Secretaries (general) 1 Securities and finance dealers and brokers 1 Security guards 1 Senior government officials 1 Senior officials of special-interest organizations 1 Shelf fillers 1 Ships engineers 1 Shoemaking and related machine operators 1 Social work associate professionals 1 Stall and market salespersons 1 Stationary plant and machine operators not elsewhere classified 1 Stonemasons stone cutters splitters and carvers 1 Street and related service workers 1 Sweepers and related labourers 1 Teaching professionals not elsewhere classified 1 Telecommunications engineering technicians 1 Textile fur and leather products machine operators not elsewhere classified 1 Trade brokers 1 Travel attendants and travel stewards 1 Travel guides 1
Labour shortages and surpluses 2017
2017 41
Directorate-General for Employment Social Affairs and Inclusion European Network of Public Employment Services (PES)
Shortage occupation PES count
Tree and shrub crop growers 1 Underwater divers 1 University and higher education teachers 1 Vehicle cleaners 1 Veterinarians 1 Weaving and knitting machine operators 1 Web technicians 1 Wood processing plant operators 1 Woodworking-machine tool setters and operators 1
Labour shortages and surpluses 2017
2017 42
Directorate-General for Employment Social Affairs and Inclusion European Network of Public Employment Services (PES)
ANNEX 3 SURPLUS OCCUPATIONS
Surplus occupation PES count
General office clerks 8 Shop sales assistants 8 Advertising and marketing professionals 6 Bank tellers and related clerks 6 Sociologists anthropologists and related professionals 6 Child care workers 5 Hairdressers 5 Journalists 5 Cashiers and ticket clerks 4 Cleaners and helpers in offices hotels and other establishments 4 Hand packers 4 Mail carriers and sorting clerks 4 Photographers 4 Receptionists (general) 4 Tailors dressmakers furriers and hatters 4 Accounting and bookkeeping clerks 3 Administrative and executive secretaries 3 Beauticians and related workers 3 Biologists botanists zoologists and related professionals 3 Bricklayers and related workers 3 Broadcasting and audio-visual technicians 3 Civil engineering labourers 3 Economists 3 Gardeners horticultural and nursery growers 3 Interior designers and decorators 3 Kitchen helpers 3 Legal professionals not elsewhere classified 3 Manufacturing labourers not elsewhere classified 3 Motor vehicle mechanics and repairers 3
Musicians singers and composers 3 Other artistic and cultural associate professionals 3 Painters and related workers 3 Philosophers historians and political scientists 3 Security guards 3 Sweepers and related labourers 3 Travel consultants and clerks 3 Waiters 3 Actors 2 Archivists and curators 2 Bakers pastry-cooks and confectionery makers 2 Bartenders 2 Building construction labourers 2 Business services and administration managers not elsewhere classified 2 Cabinet-makers and related workers 2 Car taxi and van drivers 2 Chemists 2 Cleaning and housekeeping supervisors in offices hotels and other establishments 2 Credit and loans officers 2 Customs and border inspectors 2 Elementary workers not elsewhere classified 2 Film stage and related directors and producers 2 Financial analysts 2 Forestry and related workers 2 Freight handlers 2 Graphic and multimedia designers 2 Health care assistants 2 Hotel receptionists 2 Lawyers 2 Legal and related associate professionals 2 Library clerks 2 Livestock and dairy producers 2 Management and organization analysts 2 Messengers package deliverers and luggage porters 2 Odd job persons 2 Office supervisors 2 Plasterers 2
Labour shortages and surpluses 2017
2017 43
Directorate-General for Employment Social Affairs and Inclusion European Network of Public Employment Services (PES)
Surplus occupation PES count
Police officers 2 Pre-press technicians 2 Print finishing and binding workers 2 Printers 2 Prison guards 2 Product and garment designers 2 Psychologists 2 Public relations professionals 2 Religious professionals 2 Secondary education teachers 2 Secretaries (general) 2 Social work and counselling professionals 2 Stall and market salespersons 2 Stock clerks 2 Teachers aides 2 Telephone switchboard operators 2 Travel guides 2 Visual artists 2 Advertising and public relations managers 1 Agricultural technicians 1 Announcers on radio television and other media 1 Assemblers not elsewhere classified 1 Building and related electricians 1 Building architects 1 Building caretakers 1 Building frame and related trades workers not elsewhere classified 1 Business services agents not elsewhere classified 1 Buyers 1 Carpenters and joiners 1 Chemical engineers 1 Civil engineers 1 Clearing and forwarding agents 1 Clerical support workers not elsewhere classified 1
Commercial sales representatives 1 Conference and event planners 1 Contact centre information clerks 1 Contact centre salespersons 1 Cooks 1 Crane hoist and related plant operators 1 Creative and performing artists not elsewhere classified 1 Dancers and choreographers 1 Data entry clerks 1 Database designers and administrators 1 Domestic cleaners and helpers 1 Domestic housekeepers 1 Draughtspersons 1 Driving instructors 1 Early childhood educators 1 Electronics mechanics and servicers 1 Farming forestry and fisheries advisers 1 Fashion and other models 1 Fast food preparers 1 Field crop and vegetable growers 1 Filing and copying clerks 1 Finance managers 1 Financial and insurance services branch managers 1 Financial and investment advisers 1 Fire-fighters 1 Fitness and recreation instructors and program leaders 1 Floor layers and tile setters 1 Food service counter attendants 1 Fruit vegetable and related preservers 1 Gallery museum and library technicians 1 Garbage and recycling collectors 1 Garment and related pattern-makers and cutters 1 Glass and ceramics plant operators 1 Government tax and excise officials 1 Hand launderers and pressers 1
Labour shortages and surpluses 2017
2017 44
Directorate-General for Employment Social Affairs and Inclusion European Network of Public Employment Services (PES)
Surplus occupation PES count
Heavy truck and lorry drivers 1 House builders 1 Hunters and trappers 1 Information and communications technology installers and servicers 1 Information and communications technology user support technicians 1 Insurance representatives 1 Jewellery and precious-metal workers 1 Judges 1 Legal secretaries 1 Librarians and related information professionals 1 Life science technicians (excluding medical) 1 Lifting truck operators 1 Managing directors and chief executives 1 Manufacturing supervisors 1 Medical and dental prosthetic technicians 1 Metal moulders and coremakers 1 Mining and quarrying labourers 1 Mixed crop and animal producers 1 Mixed crop growers 1 Mobile farm and forestry plant operators 1 Musical instrument makers and tuners 1 Other language teachers 1 Pawnbrokers and money-lenders 1 Personnel and careers professionals 1 Pet groomers and animal care workers 1 Photographic products machine operators 1 Physical and engineering science technicians not elsewhere classified 1 Physicists and astronomers 1 Police inspectors and detectives 1 Precision-instrument makers and repairers 1 Primary school teachers 1 Process control technicians not elsewhere classified 1 Product graders and testers (excluding foods and beverages) 1
Production clerks 1 Professional services managers not elsewhere classified 1 Protective services workers not elsewhere classified 1 Research and development managers 1 Retail and wholesale trade managers 1 Roofers 1 Sales workers not elsewhere classified 1 Senior government officials 1 Service station attendants 1 Shelf fillers 1 Shop supervisors 1 Social work associate professionals 1 Special needs teachers 1 Spray painters and varnishers 1 Statistical mathematical and related associate professionals 1 Stonemasons stone cutters splitters and carvers 1 Street food salespersons 1 Supply distribution and related managers 1 Teaching professionals not elsewhere classified 1 Technical and medical sales professionals (excluding ICT) 1 Training and staff development professionals 1 Translators interpreters and other linguists 1 Transport conductors 1 Tree and shrub crop growers 1 Typists and word processing operators 1 Undertakers and embalmers 1 Vocational education teachers 1 Weaving and knitting machine operators 1 Woodworking-machine tool setters and operators 1
Labour shortages and surpluses 2017
2017 45
Directorate-General for Employment Social Affairs and Inclusion European Network of Public Employment Services (PES)
ANNEX 4 THE RATIO OF UNEMPLOYED TO NEW HIRES
ISCO-08 title
2015
UE
Recruited in the
last year (lt12
months)
Ratio of UE to new recruits
Street and related service workers 85 104 08 Agricultural forestry and fishery labourers 3913 5343 07 Mining and construction labourers 1937 3525 05 Creative and performing artists 610 1115 05 Refuse workers 1036 1923 05 Painters building structure cleaners and related trades workers 1116 2117 05 Street and market salespersons 195 389 05 Building frame and related trades workers 3632 7353 05 Mining manufacturing and construction supervisors 626 1315 05 Ships deck crews and related workers 53 114 05 Market gardeners and crop growers 1471 3207 05 Managing directors and chief executives 304 667 05 Travel attendants conductors and guides 229 538 04 Wood treaters cabinet-makers and related trades workers 491 1159 04 Manufacturing labourers 1640 3909 04 Domestic hotel and office cleaners and helpers 5679 13545 04 Other stationary plant and machine operators 822 1961 04 Mobile plant operators 1038 2497 04 Building finishers and related trades workers 1519 3680 04 Textile fur and leather products machine operators 431 1048 04 Garment and related trades workers 422 1047 04 Chemical and photographic products plant and machine operators 157 389 04 Food processing and related trades workers 930 2330 04 Vehicle window laundry and other hand cleaning workers 291 754 04 Sheet and structural metal workers moulders and welders and related workers
996 2603 04
Waiters and bartenders 4399 11595 04 Cooks 1529 4039 04 Metal processing and finishing plant operators 208 557 04 Printing trades workers 203 548 04 Forestry and related workers 130 351 04 Protective services workers 1347 3658 04 Transport and storage labourers 2532 6939 04 Fishery workers hunters and trappers 46 128 04 Material-recording and transport clerks 1671 4630 04 Process control technicians 179 517 03 Mining and mineral processing plant operators 94 274 03 Telecommunications and broadcasting technicians 177 519 03 Blacksmiths toolmakers and related trades workers 816 2409 03 Building and housekeeping supervisors 678 2045 03
Secretaries (general) 1072 3259 03 Assemblers 850 2586 03 Other craft and related workers 258 810 03 Shop salespersons 6600 21042 03 Electrical equipment installers and repairers 958 3060 03 Food and related products machine operators 437 1400 03 Other sales workers 1087 3510 03 Food preparation assistants 1646 5337 03 Mixed crop and animal producers 387 1260 03 Car van and motorcycle drivers 1155 3764 03 Client information workers 1993 6531 03 Sports and fitness workers 605 1984 03 Handicraft workers 194 638 03 Life science technicians and related associate professionals 82 271 03 Keyboard operators 283 940 03 Electronics and telecommunications installers and repairers 290 963 03 Other personal services workers 313 1047 03 Vocational education teachers 279 940 03 Other teaching professionals 744 2518 03 General office clerks 966 3272 03 Authors journalists and linguists 335 1135 03 Hairdressers beauticians and related workers 806 2796 03
Labour shortages and surpluses 2017
2017 46
Directorate-General for Employment Social Affairs and Inclusion European Network of Public Employment Services (PES)
ISCO-08 title
2015
UE
Recruited in the
last year (lt12
months)
Ratio of UE to new recruits
Animal producers 189 660 03 Other elementary workers 976 3401 03 Machinery mechanics and repairers 1134 3962 03 Ship and aircraft controllers and technicians 80 281 03 Hotel and restaurant managers 344 1220 03 Cashiers and ticket clerks 908 3220 03 Retail and wholesale trade managers 224 809 03 Sales marketing and development managers 311 1124 03 Physical and engineering science technicians 1204 4366 03 Administrative and specialised secretaries 1106 4040 03 Sales and purchasing agents and brokers 1294 4754 03 Rubber plastic and paper products machine operators 256 941 03 Artistic cultural and culinary associate professionals 511 1906 03 Numerical clerks 944 3532 03 Other services managers 184 691 03 Child care workers and teachers aides 1335 5005 03 Heavy truck and bus drivers 1426 5349 03 Business services and administration managers 383 1439 03 Information and communications technology service managers 67 257 03 Regulatory government associate professionals 209 807 03 Life science professionals 176 681 03 Wood processing and papermaking plant operators 97 379 03 Locomotive engine drivers and related workers 46 179 03 Legal professionals 315 1245 03 Personal care workers in health services 2195 8787 02 Physical and earth science professionals 85 345 02 Street vendors (excluding food) 50 204 02 Architects planners surveyors and designers 515 2092 02 Other clerical support workers 901 3657 02 Business services agents 510 2114 02 Manufacturing mining construction and distribution managers 361 1507 02 Tellers money collectors and related clerks 381 1612 02 Librarians archivists and curators 58 248 02 Medical and pharmaceutical technicians 255 1099 02 University and higher education teachers 301 1333 02 Information and communications technology operations and user support technicians
418 1888 02
Legal social and religious associate professionals 920 4348 02 Financial and mathematical associate professionals 601 2852 02 Sales marketing and public relations professionals 865 4172 02 Finance professionals 472 2281 02 Engineering professionals (excluding electrotechnology) 635 3118 02 Other health associate professionals 531 2657 02
Social and religious professionals 460 2317 02 Professional services managers 176 891 02 Nursing and midwifery associate professionals 556 2855 02 Legislators and senior officials 53 286 02 Database and network professionals 83 455 02 Administration professionals 641 3673 02 Primary school and early childhood teachers 575 3345 02 Electrotechnology engineers 142 827 02 Secondary education teachers 471 2812 02 Other health professionals 346 2083 02 Nursing and midwifery professionals 273 1760 02 Software and applications developers and analysts 631 4159 02 Medical doctors 293 1944 02 No occupation 152894 00
No answer 2531 578 44 Total 249561 294937 08
Labour shortages and surpluses 2017
2017 47
Directorate-General for Employment Social Affairs and Inclusion European Network of Public Employment Services (PES)
HOW TO OBTAIN EU PUBLICATIONS
Free publications
bull one copy
via EU Bookshop (httpbookshopeuropaeu)
bull more than one copy or postersmaps
from the European Unionrsquos representations (httpeceuropaeurepresent_enhtm)
from the delegations in non-EU countries
(httpeeaseuropaeudelegationsindex_enhtm)
by contacting the Europe Direct service (httpeuropaeueuropedirectindex_enhtm)
or calling 00 800 6 7 8 9 10 11 (free phone number from anywhere in the EU) () () The information given is free as are most calls (though some operators phone boxes or hotels may charge you)
Priced publications
bull via EU Bookshop (httpbookshopeuropaeu)
Priced subscriptions
bull via one of the sales agents of the Publications Office of the European Union
(httppublicationseuropaeuothersagentsindex_enhtm)
doi 10276731262
KE-0
1-1
8-2
63-E
N-N
[Ca
talo
gu
e n
um
be
r]
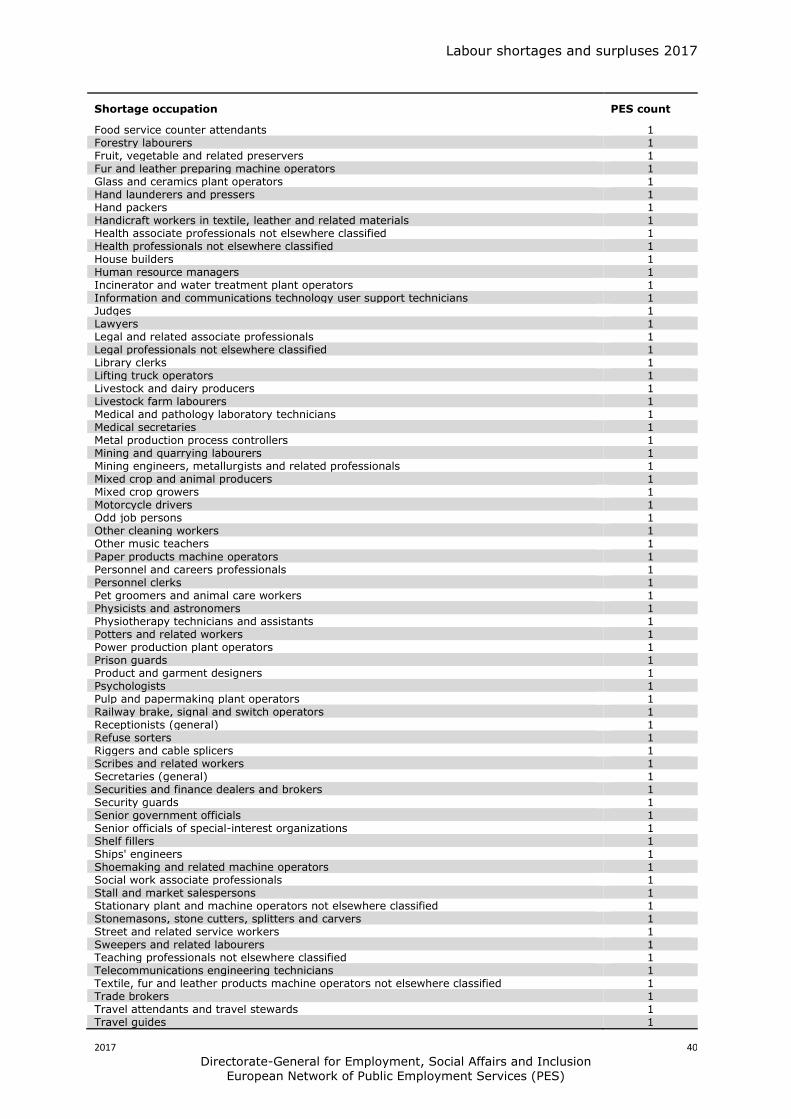
Labour shortages and surpluses 2017
2017 40
Directorate-General for Employment Social Affairs and Inclusion European Network of Public Employment Services (PES)
Shortage occupation PES count
Food service counter attendants 1 Forestry labourers 1 Fruit vegetable and related preservers 1 Fur and leather preparing machine operators 1 Glass and ceramics plant operators 1 Hand launderers and pressers 1 Hand packers 1 Handicraft workers in textile leather and related materials 1 Health associate professionals not elsewhere classified 1 Health professionals not elsewhere classified 1 House builders 1 Human resource managers 1 Incinerator and water treatment plant operators 1 Information and communications technology user support technicians 1 Judges 1 Lawyers 1 Legal and related associate professionals 1 Legal professionals not elsewhere classified 1 Library clerks 1 Lifting truck operators 1 Livestock and dairy producers 1 Livestock farm labourers 1 Medical and pathology laboratory technicians 1 Medical secretaries 1 Metal production process controllers 1 Mining and quarrying labourers 1 Mining engineers metallurgists and related professionals 1 Mixed crop and animal producers 1 Mixed crop growers 1 Motorcycle drivers 1 Odd job persons 1 Other cleaning workers 1 Other music teachers 1
Paper products machine operators 1 Personnel and careers professionals 1 Personnel clerks 1 Pet groomers and animal care workers 1 Physicists and astronomers 1 Physiotherapy technicians and assistants 1 Potters and related workers 1 Power production plant operators 1 Prison guards 1 Product and garment designers 1 Psychologists 1 Pulp and papermaking plant operators 1 Railway brake signal and switch operators 1 Receptionists (general) 1 Refuse sorters 1 Riggers and cable splicers 1 Scribes and related workers 1 Secretaries (general) 1 Securities and finance dealers and brokers 1 Security guards 1 Senior government officials 1 Senior officials of special-interest organizations 1 Shelf fillers 1 Ships engineers 1 Shoemaking and related machine operators 1 Social work associate professionals 1 Stall and market salespersons 1 Stationary plant and machine operators not elsewhere classified 1 Stonemasons stone cutters splitters and carvers 1 Street and related service workers 1 Sweepers and related labourers 1 Teaching professionals not elsewhere classified 1 Telecommunications engineering technicians 1 Textile fur and leather products machine operators not elsewhere classified 1 Trade brokers 1 Travel attendants and travel stewards 1 Travel guides 1
Labour shortages and surpluses 2017
2017 41
Directorate-General for Employment Social Affairs and Inclusion European Network of Public Employment Services (PES)
Shortage occupation PES count
Tree and shrub crop growers 1 Underwater divers 1 University and higher education teachers 1 Vehicle cleaners 1 Veterinarians 1 Weaving and knitting machine operators 1 Web technicians 1 Wood processing plant operators 1 Woodworking-machine tool setters and operators 1
Labour shortages and surpluses 2017
2017 42
Directorate-General for Employment Social Affairs and Inclusion European Network of Public Employment Services (PES)
ANNEX 3 SURPLUS OCCUPATIONS
Surplus occupation PES count
General office clerks 8 Shop sales assistants 8 Advertising and marketing professionals 6 Bank tellers and related clerks 6 Sociologists anthropologists and related professionals 6 Child care workers 5 Hairdressers 5 Journalists 5 Cashiers and ticket clerks 4 Cleaners and helpers in offices hotels and other establishments 4 Hand packers 4 Mail carriers and sorting clerks 4 Photographers 4 Receptionists (general) 4 Tailors dressmakers furriers and hatters 4 Accounting and bookkeeping clerks 3 Administrative and executive secretaries 3 Beauticians and related workers 3 Biologists botanists zoologists and related professionals 3 Bricklayers and related workers 3 Broadcasting and audio-visual technicians 3 Civil engineering labourers 3 Economists 3 Gardeners horticultural and nursery growers 3 Interior designers and decorators 3 Kitchen helpers 3 Legal professionals not elsewhere classified 3 Manufacturing labourers not elsewhere classified 3 Motor vehicle mechanics and repairers 3
Musicians singers and composers 3 Other artistic and cultural associate professionals 3 Painters and related workers 3 Philosophers historians and political scientists 3 Security guards 3 Sweepers and related labourers 3 Travel consultants and clerks 3 Waiters 3 Actors 2 Archivists and curators 2 Bakers pastry-cooks and confectionery makers 2 Bartenders 2 Building construction labourers 2 Business services and administration managers not elsewhere classified 2 Cabinet-makers and related workers 2 Car taxi and van drivers 2 Chemists 2 Cleaning and housekeeping supervisors in offices hotels and other establishments 2 Credit and loans officers 2 Customs and border inspectors 2 Elementary workers not elsewhere classified 2 Film stage and related directors and producers 2 Financial analysts 2 Forestry and related workers 2 Freight handlers 2 Graphic and multimedia designers 2 Health care assistants 2 Hotel receptionists 2 Lawyers 2 Legal and related associate professionals 2 Library clerks 2 Livestock and dairy producers 2 Management and organization analysts 2 Messengers package deliverers and luggage porters 2 Odd job persons 2 Office supervisors 2 Plasterers 2
Labour shortages and surpluses 2017
2017 43
Directorate-General for Employment Social Affairs and Inclusion European Network of Public Employment Services (PES)
Surplus occupation PES count
Police officers 2 Pre-press technicians 2 Print finishing and binding workers 2 Printers 2 Prison guards 2 Product and garment designers 2 Psychologists 2 Public relations professionals 2 Religious professionals 2 Secondary education teachers 2 Secretaries (general) 2 Social work and counselling professionals 2 Stall and market salespersons 2 Stock clerks 2 Teachers aides 2 Telephone switchboard operators 2 Travel guides 2 Visual artists 2 Advertising and public relations managers 1 Agricultural technicians 1 Announcers on radio television and other media 1 Assemblers not elsewhere classified 1 Building and related electricians 1 Building architects 1 Building caretakers 1 Building frame and related trades workers not elsewhere classified 1 Business services agents not elsewhere classified 1 Buyers 1 Carpenters and joiners 1 Chemical engineers 1 Civil engineers 1 Clearing and forwarding agents 1 Clerical support workers not elsewhere classified 1
Commercial sales representatives 1 Conference and event planners 1 Contact centre information clerks 1 Contact centre salespersons 1 Cooks 1 Crane hoist and related plant operators 1 Creative and performing artists not elsewhere classified 1 Dancers and choreographers 1 Data entry clerks 1 Database designers and administrators 1 Domestic cleaners and helpers 1 Domestic housekeepers 1 Draughtspersons 1 Driving instructors 1 Early childhood educators 1 Electronics mechanics and servicers 1 Farming forestry and fisheries advisers 1 Fashion and other models 1 Fast food preparers 1 Field crop and vegetable growers 1 Filing and copying clerks 1 Finance managers 1 Financial and insurance services branch managers 1 Financial and investment advisers 1 Fire-fighters 1 Fitness and recreation instructors and program leaders 1 Floor layers and tile setters 1 Food service counter attendants 1 Fruit vegetable and related preservers 1 Gallery museum and library technicians 1 Garbage and recycling collectors 1 Garment and related pattern-makers and cutters 1 Glass and ceramics plant operators 1 Government tax and excise officials 1 Hand launderers and pressers 1
Labour shortages and surpluses 2017
2017 44
Directorate-General for Employment Social Affairs and Inclusion European Network of Public Employment Services (PES)
Surplus occupation PES count
Heavy truck and lorry drivers 1 House builders 1 Hunters and trappers 1 Information and communications technology installers and servicers 1 Information and communications technology user support technicians 1 Insurance representatives 1 Jewellery and precious-metal workers 1 Judges 1 Legal secretaries 1 Librarians and related information professionals 1 Life science technicians (excluding medical) 1 Lifting truck operators 1 Managing directors and chief executives 1 Manufacturing supervisors 1 Medical and dental prosthetic technicians 1 Metal moulders and coremakers 1 Mining and quarrying labourers 1 Mixed crop and animal producers 1 Mixed crop growers 1 Mobile farm and forestry plant operators 1 Musical instrument makers and tuners 1 Other language teachers 1 Pawnbrokers and money-lenders 1 Personnel and careers professionals 1 Pet groomers and animal care workers 1 Photographic products machine operators 1 Physical and engineering science technicians not elsewhere classified 1 Physicists and astronomers 1 Police inspectors and detectives 1 Precision-instrument makers and repairers 1 Primary school teachers 1 Process control technicians not elsewhere classified 1 Product graders and testers (excluding foods and beverages) 1
Production clerks 1 Professional services managers not elsewhere classified 1 Protective services workers not elsewhere classified 1 Research and development managers 1 Retail and wholesale trade managers 1 Roofers 1 Sales workers not elsewhere classified 1 Senior government officials 1 Service station attendants 1 Shelf fillers 1 Shop supervisors 1 Social work associate professionals 1 Special needs teachers 1 Spray painters and varnishers 1 Statistical mathematical and related associate professionals 1 Stonemasons stone cutters splitters and carvers 1 Street food salespersons 1 Supply distribution and related managers 1 Teaching professionals not elsewhere classified 1 Technical and medical sales professionals (excluding ICT) 1 Training and staff development professionals 1 Translators interpreters and other linguists 1 Transport conductors 1 Tree and shrub crop growers 1 Typists and word processing operators 1 Undertakers and embalmers 1 Vocational education teachers 1 Weaving and knitting machine operators 1 Woodworking-machine tool setters and operators 1
Labour shortages and surpluses 2017
2017 45
Directorate-General for Employment Social Affairs and Inclusion European Network of Public Employment Services (PES)
ANNEX 4 THE RATIO OF UNEMPLOYED TO NEW HIRES
ISCO-08 title
2015
UE
Recruited in the
last year (lt12
months)
Ratio of UE to new recruits
Street and related service workers 85 104 08 Agricultural forestry and fishery labourers 3913 5343 07 Mining and construction labourers 1937 3525 05 Creative and performing artists 610 1115 05 Refuse workers 1036 1923 05 Painters building structure cleaners and related trades workers 1116 2117 05 Street and market salespersons 195 389 05 Building frame and related trades workers 3632 7353 05 Mining manufacturing and construction supervisors 626 1315 05 Ships deck crews and related workers 53 114 05 Market gardeners and crop growers 1471 3207 05 Managing directors and chief executives 304 667 05 Travel attendants conductors and guides 229 538 04 Wood treaters cabinet-makers and related trades workers 491 1159 04 Manufacturing labourers 1640 3909 04 Domestic hotel and office cleaners and helpers 5679 13545 04 Other stationary plant and machine operators 822 1961 04 Mobile plant operators 1038 2497 04 Building finishers and related trades workers 1519 3680 04 Textile fur and leather products machine operators 431 1048 04 Garment and related trades workers 422 1047 04 Chemical and photographic products plant and machine operators 157 389 04 Food processing and related trades workers 930 2330 04 Vehicle window laundry and other hand cleaning workers 291 754 04 Sheet and structural metal workers moulders and welders and related workers
996 2603 04
Waiters and bartenders 4399 11595 04 Cooks 1529 4039 04 Metal processing and finishing plant operators 208 557 04 Printing trades workers 203 548 04 Forestry and related workers 130 351 04 Protective services workers 1347 3658 04 Transport and storage labourers 2532 6939 04 Fishery workers hunters and trappers 46 128 04 Material-recording and transport clerks 1671 4630 04 Process control technicians 179 517 03 Mining and mineral processing plant operators 94 274 03 Telecommunications and broadcasting technicians 177 519 03 Blacksmiths toolmakers and related trades workers 816 2409 03 Building and housekeeping supervisors 678 2045 03
Secretaries (general) 1072 3259 03 Assemblers 850 2586 03 Other craft and related workers 258 810 03 Shop salespersons 6600 21042 03 Electrical equipment installers and repairers 958 3060 03 Food and related products machine operators 437 1400 03 Other sales workers 1087 3510 03 Food preparation assistants 1646 5337 03 Mixed crop and animal producers 387 1260 03 Car van and motorcycle drivers 1155 3764 03 Client information workers 1993 6531 03 Sports and fitness workers 605 1984 03 Handicraft workers 194 638 03 Life science technicians and related associate professionals 82 271 03 Keyboard operators 283 940 03 Electronics and telecommunications installers and repairers 290 963 03 Other personal services workers 313 1047 03 Vocational education teachers 279 940 03 Other teaching professionals 744 2518 03 General office clerks 966 3272 03 Authors journalists and linguists 335 1135 03 Hairdressers beauticians and related workers 806 2796 03
Labour shortages and surpluses 2017
2017 46
Directorate-General for Employment Social Affairs and Inclusion European Network of Public Employment Services (PES)
ISCO-08 title
2015
UE
Recruited in the
last year (lt12
months)
Ratio of UE to new recruits
Animal producers 189 660 03 Other elementary workers 976 3401 03 Machinery mechanics and repairers 1134 3962 03 Ship and aircraft controllers and technicians 80 281 03 Hotel and restaurant managers 344 1220 03 Cashiers and ticket clerks 908 3220 03 Retail and wholesale trade managers 224 809 03 Sales marketing and development managers 311 1124 03 Physical and engineering science technicians 1204 4366 03 Administrative and specialised secretaries 1106 4040 03 Sales and purchasing agents and brokers 1294 4754 03 Rubber plastic and paper products machine operators 256 941 03 Artistic cultural and culinary associate professionals 511 1906 03 Numerical clerks 944 3532 03 Other services managers 184 691 03 Child care workers and teachers aides 1335 5005 03 Heavy truck and bus drivers 1426 5349 03 Business services and administration managers 383 1439 03 Information and communications technology service managers 67 257 03 Regulatory government associate professionals 209 807 03 Life science professionals 176 681 03 Wood processing and papermaking plant operators 97 379 03 Locomotive engine drivers and related workers 46 179 03 Legal professionals 315 1245 03 Personal care workers in health services 2195 8787 02 Physical and earth science professionals 85 345 02 Street vendors (excluding food) 50 204 02 Architects planners surveyors and designers 515 2092 02 Other clerical support workers 901 3657 02 Business services agents 510 2114 02 Manufacturing mining construction and distribution managers 361 1507 02 Tellers money collectors and related clerks 381 1612 02 Librarians archivists and curators 58 248 02 Medical and pharmaceutical technicians 255 1099 02 University and higher education teachers 301 1333 02 Information and communications technology operations and user support technicians
418 1888 02
Legal social and religious associate professionals 920 4348 02 Financial and mathematical associate professionals 601 2852 02 Sales marketing and public relations professionals 865 4172 02 Finance professionals 472 2281 02 Engineering professionals (excluding electrotechnology) 635 3118 02 Other health associate professionals 531 2657 02
Social and religious professionals 460 2317 02 Professional services managers 176 891 02 Nursing and midwifery associate professionals 556 2855 02 Legislators and senior officials 53 286 02 Database and network professionals 83 455 02 Administration professionals 641 3673 02 Primary school and early childhood teachers 575 3345 02 Electrotechnology engineers 142 827 02 Secondary education teachers 471 2812 02 Other health professionals 346 2083 02 Nursing and midwifery professionals 273 1760 02 Software and applications developers and analysts 631 4159 02 Medical doctors 293 1944 02 No occupation 152894 00
No answer 2531 578 44 Total 249561 294937 08
Labour shortages and surpluses 2017
2017 47
Directorate-General for Employment Social Affairs and Inclusion European Network of Public Employment Services (PES)
HOW TO OBTAIN EU PUBLICATIONS
Free publications
bull one copy
via EU Bookshop (httpbookshopeuropaeu)
bull more than one copy or postersmaps
from the European Unionrsquos representations (httpeceuropaeurepresent_enhtm)
from the delegations in non-EU countries
(httpeeaseuropaeudelegationsindex_enhtm)
by contacting the Europe Direct service (httpeuropaeueuropedirectindex_enhtm)
or calling 00 800 6 7 8 9 10 11 (free phone number from anywhere in the EU) () () The information given is free as are most calls (though some operators phone boxes or hotels may charge you)
Priced publications
bull via EU Bookshop (httpbookshopeuropaeu)
Priced subscriptions
bull via one of the sales agents of the Publications Office of the European Union
(httppublicationseuropaeuothersagentsindex_enhtm)
doi 10276731262
KE-0
1-1
8-2
63-E
N-N
[Ca
talo
gu
e n
um
be
r]
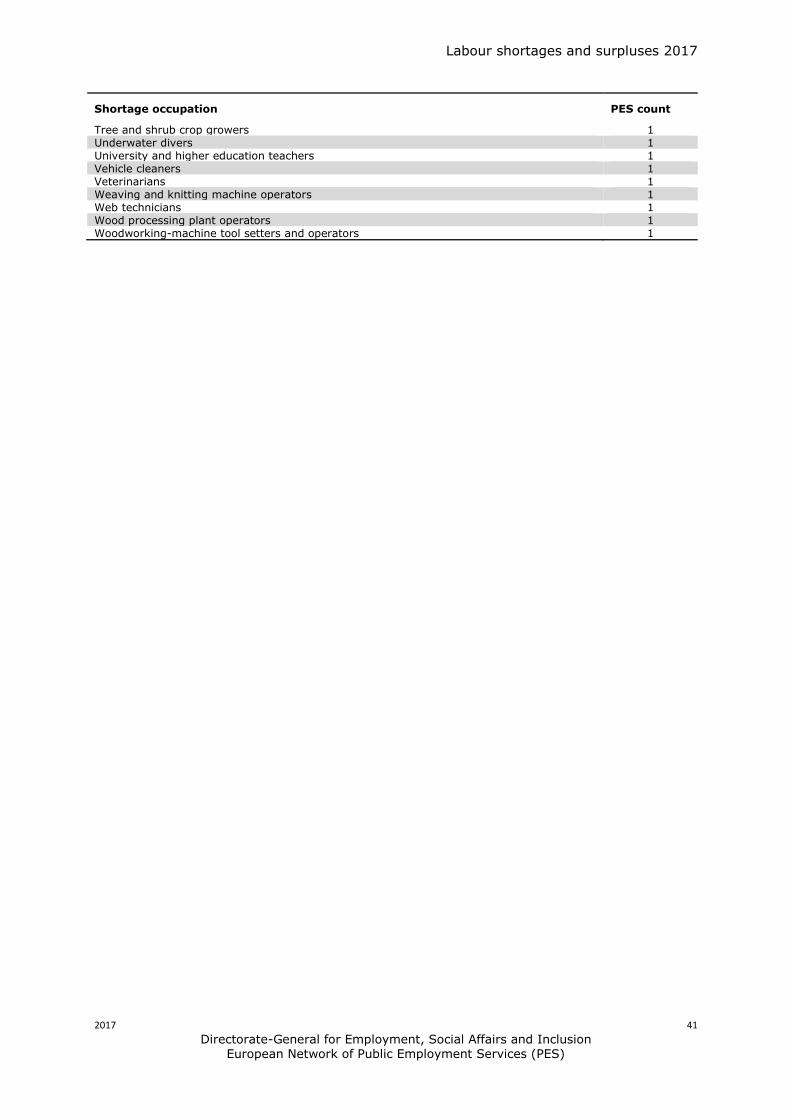
Labour shortages and surpluses 2017
2017 42
Directorate-General for Employment Social Affairs and Inclusion European Network of Public Employment Services (PES)
ANNEX 3 SURPLUS OCCUPATIONS
Surplus occupation PES count
General office clerks 8 Shop sales assistants 8 Advertising and marketing professionals 6 Bank tellers and related clerks 6 Sociologists anthropologists and related professionals 6 Child care workers 5 Hairdressers 5 Journalists 5 Cashiers and ticket clerks 4 Cleaners and helpers in offices hotels and other establishments 4 Hand packers 4 Mail carriers and sorting clerks 4 Photographers 4 Receptionists (general) 4 Tailors dressmakers furriers and hatters 4 Accounting and bookkeeping clerks 3 Administrative and executive secretaries 3 Beauticians and related workers 3 Biologists botanists zoologists and related professionals 3 Bricklayers and related workers 3 Broadcasting and audio-visual technicians 3 Civil engineering labourers 3 Economists 3 Gardeners horticultural and nursery growers 3 Interior designers and decorators 3 Kitchen helpers 3 Legal professionals not elsewhere classified 3 Manufacturing labourers not elsewhere classified 3 Motor vehicle mechanics and repairers 3
Musicians singers and composers 3 Other artistic and cultural associate professionals 3 Painters and related workers 3 Philosophers historians and political scientists 3 Security guards 3 Sweepers and related labourers 3 Travel consultants and clerks 3 Waiters 3 Actors 2 Archivists and curators 2 Bakers pastry-cooks and confectionery makers 2 Bartenders 2 Building construction labourers 2 Business services and administration managers not elsewhere classified 2 Cabinet-makers and related workers 2 Car taxi and van drivers 2 Chemists 2 Cleaning and housekeeping supervisors in offices hotels and other establishments 2 Credit and loans officers 2 Customs and border inspectors 2 Elementary workers not elsewhere classified 2 Film stage and related directors and producers 2 Financial analysts 2 Forestry and related workers 2 Freight handlers 2 Graphic and multimedia designers 2 Health care assistants 2 Hotel receptionists 2 Lawyers 2 Legal and related associate professionals 2 Library clerks 2 Livestock and dairy producers 2 Management and organization analysts 2 Messengers package deliverers and luggage porters 2 Odd job persons 2 Office supervisors 2 Plasterers 2
Labour shortages and surpluses 2017
2017 43
Directorate-General for Employment Social Affairs and Inclusion European Network of Public Employment Services (PES)
Surplus occupation PES count
Police officers 2 Pre-press technicians 2 Print finishing and binding workers 2 Printers 2 Prison guards 2 Product and garment designers 2 Psychologists 2 Public relations professionals 2 Religious professionals 2 Secondary education teachers 2 Secretaries (general) 2 Social work and counselling professionals 2 Stall and market salespersons 2 Stock clerks 2 Teachers aides 2 Telephone switchboard operators 2 Travel guides 2 Visual artists 2 Advertising and public relations managers 1 Agricultural technicians 1 Announcers on radio television and other media 1 Assemblers not elsewhere classified 1 Building and related electricians 1 Building architects 1 Building caretakers 1 Building frame and related trades workers not elsewhere classified 1 Business services agents not elsewhere classified 1 Buyers 1 Carpenters and joiners 1 Chemical engineers 1 Civil engineers 1 Clearing and forwarding agents 1 Clerical support workers not elsewhere classified 1
Commercial sales representatives 1 Conference and event planners 1 Contact centre information clerks 1 Contact centre salespersons 1 Cooks 1 Crane hoist and related plant operators 1 Creative and performing artists not elsewhere classified 1 Dancers and choreographers 1 Data entry clerks 1 Database designers and administrators 1 Domestic cleaners and helpers 1 Domestic housekeepers 1 Draughtspersons 1 Driving instructors 1 Early childhood educators 1 Electronics mechanics and servicers 1 Farming forestry and fisheries advisers 1 Fashion and other models 1 Fast food preparers 1 Field crop and vegetable growers 1 Filing and copying clerks 1 Finance managers 1 Financial and insurance services branch managers 1 Financial and investment advisers 1 Fire-fighters 1 Fitness and recreation instructors and program leaders 1 Floor layers and tile setters 1 Food service counter attendants 1 Fruit vegetable and related preservers 1 Gallery museum and library technicians 1 Garbage and recycling collectors 1 Garment and related pattern-makers and cutters 1 Glass and ceramics plant operators 1 Government tax and excise officials 1 Hand launderers and pressers 1
Labour shortages and surpluses 2017
2017 44
Directorate-General for Employment Social Affairs and Inclusion European Network of Public Employment Services (PES)
Surplus occupation PES count
Heavy truck and lorry drivers 1 House builders 1 Hunters and trappers 1 Information and communications technology installers and servicers 1 Information and communications technology user support technicians 1 Insurance representatives 1 Jewellery and precious-metal workers 1 Judges 1 Legal secretaries 1 Librarians and related information professionals 1 Life science technicians (excluding medical) 1 Lifting truck operators 1 Managing directors and chief executives 1 Manufacturing supervisors 1 Medical and dental prosthetic technicians 1 Metal moulders and coremakers 1 Mining and quarrying labourers 1 Mixed crop and animal producers 1 Mixed crop growers 1 Mobile farm and forestry plant operators 1 Musical instrument makers and tuners 1 Other language teachers 1 Pawnbrokers and money-lenders 1 Personnel and careers professionals 1 Pet groomers and animal care workers 1 Photographic products machine operators 1 Physical and engineering science technicians not elsewhere classified 1 Physicists and astronomers 1 Police inspectors and detectives 1 Precision-instrument makers and repairers 1 Primary school teachers 1 Process control technicians not elsewhere classified 1 Product graders and testers (excluding foods and beverages) 1
Production clerks 1 Professional services managers not elsewhere classified 1 Protective services workers not elsewhere classified 1 Research and development managers 1 Retail and wholesale trade managers 1 Roofers 1 Sales workers not elsewhere classified 1 Senior government officials 1 Service station attendants 1 Shelf fillers 1 Shop supervisors 1 Social work associate professionals 1 Special needs teachers 1 Spray painters and varnishers 1 Statistical mathematical and related associate professionals 1 Stonemasons stone cutters splitters and carvers 1 Street food salespersons 1 Supply distribution and related managers 1 Teaching professionals not elsewhere classified 1 Technical and medical sales professionals (excluding ICT) 1 Training and staff development professionals 1 Translators interpreters and other linguists 1 Transport conductors 1 Tree and shrub crop growers 1 Typists and word processing operators 1 Undertakers and embalmers 1 Vocational education teachers 1 Weaving and knitting machine operators 1 Woodworking-machine tool setters and operators 1
Labour shortages and surpluses 2017
2017 45
Directorate-General for Employment Social Affairs and Inclusion European Network of Public Employment Services (PES)
ANNEX 4 THE RATIO OF UNEMPLOYED TO NEW HIRES
ISCO-08 title
2015
UE
Recruited in the
last year (lt12
months)
Ratio of UE to new recruits
Street and related service workers 85 104 08 Agricultural forestry and fishery labourers 3913 5343 07 Mining and construction labourers 1937 3525 05 Creative and performing artists 610 1115 05 Refuse workers 1036 1923 05 Painters building structure cleaners and related trades workers 1116 2117 05 Street and market salespersons 195 389 05 Building frame and related trades workers 3632 7353 05 Mining manufacturing and construction supervisors 626 1315 05 Ships deck crews and related workers 53 114 05 Market gardeners and crop growers 1471 3207 05 Managing directors and chief executives 304 667 05 Travel attendants conductors and guides 229 538 04 Wood treaters cabinet-makers and related trades workers 491 1159 04 Manufacturing labourers 1640 3909 04 Domestic hotel and office cleaners and helpers 5679 13545 04 Other stationary plant and machine operators 822 1961 04 Mobile plant operators 1038 2497 04 Building finishers and related trades workers 1519 3680 04 Textile fur and leather products machine operators 431 1048 04 Garment and related trades workers 422 1047 04 Chemical and photographic products plant and machine operators 157 389 04 Food processing and related trades workers 930 2330 04 Vehicle window laundry and other hand cleaning workers 291 754 04 Sheet and structural metal workers moulders and welders and related workers
996 2603 04
Waiters and bartenders 4399 11595 04 Cooks 1529 4039 04 Metal processing and finishing plant operators 208 557 04 Printing trades workers 203 548 04 Forestry and related workers 130 351 04 Protective services workers 1347 3658 04 Transport and storage labourers 2532 6939 04 Fishery workers hunters and trappers 46 128 04 Material-recording and transport clerks 1671 4630 04 Process control technicians 179 517 03 Mining and mineral processing plant operators 94 274 03 Telecommunications and broadcasting technicians 177 519 03 Blacksmiths toolmakers and related trades workers 816 2409 03 Building and housekeeping supervisors 678 2045 03
Secretaries (general) 1072 3259 03 Assemblers 850 2586 03 Other craft and related workers 258 810 03 Shop salespersons 6600 21042 03 Electrical equipment installers and repairers 958 3060 03 Food and related products machine operators 437 1400 03 Other sales workers 1087 3510 03 Food preparation assistants 1646 5337 03 Mixed crop and animal producers 387 1260 03 Car van and motorcycle drivers 1155 3764 03 Client information workers 1993 6531 03 Sports and fitness workers 605 1984 03 Handicraft workers 194 638 03 Life science technicians and related associate professionals 82 271 03 Keyboard operators 283 940 03 Electronics and telecommunications installers and repairers 290 963 03 Other personal services workers 313 1047 03 Vocational education teachers 279 940 03 Other teaching professionals 744 2518 03 General office clerks 966 3272 03 Authors journalists and linguists 335 1135 03 Hairdressers beauticians and related workers 806 2796 03
Labour shortages and surpluses 2017
2017 46
Directorate-General for Employment Social Affairs and Inclusion European Network of Public Employment Services (PES)
ISCO-08 title
2015
UE
Recruited in the
last year (lt12
months)
Ratio of UE to new recruits
Animal producers 189 660 03 Other elementary workers 976 3401 03 Machinery mechanics and repairers 1134 3962 03 Ship and aircraft controllers and technicians 80 281 03 Hotel and restaurant managers 344 1220 03 Cashiers and ticket clerks 908 3220 03 Retail and wholesale trade managers 224 809 03 Sales marketing and development managers 311 1124 03 Physical and engineering science technicians 1204 4366 03 Administrative and specialised secretaries 1106 4040 03 Sales and purchasing agents and brokers 1294 4754 03 Rubber plastic and paper products machine operators 256 941 03 Artistic cultural and culinary associate professionals 511 1906 03 Numerical clerks 944 3532 03 Other services managers 184 691 03 Child care workers and teachers aides 1335 5005 03 Heavy truck and bus drivers 1426 5349 03 Business services and administration managers 383 1439 03 Information and communications technology service managers 67 257 03 Regulatory government associate professionals 209 807 03 Life science professionals 176 681 03 Wood processing and papermaking plant operators 97 379 03 Locomotive engine drivers and related workers 46 179 03 Legal professionals 315 1245 03 Personal care workers in health services 2195 8787 02 Physical and earth science professionals 85 345 02 Street vendors (excluding food) 50 204 02 Architects planners surveyors and designers 515 2092 02 Other clerical support workers 901 3657 02 Business services agents 510 2114 02 Manufacturing mining construction and distribution managers 361 1507 02 Tellers money collectors and related clerks 381 1612 02 Librarians archivists and curators 58 248 02 Medical and pharmaceutical technicians 255 1099 02 University and higher education teachers 301 1333 02 Information and communications technology operations and user support technicians
418 1888 02
Legal social and religious associate professionals 920 4348 02 Financial and mathematical associate professionals 601 2852 02 Sales marketing and public relations professionals 865 4172 02 Finance professionals 472 2281 02 Engineering professionals (excluding electrotechnology) 635 3118 02 Other health associate professionals 531 2657 02
Social and religious professionals 460 2317 02 Professional services managers 176 891 02 Nursing and midwifery associate professionals 556 2855 02 Legislators and senior officials 53 286 02 Database and network professionals 83 455 02 Administration professionals 641 3673 02 Primary school and early childhood teachers 575 3345 02 Electrotechnology engineers 142 827 02 Secondary education teachers 471 2812 02 Other health professionals 346 2083 02 Nursing and midwifery professionals 273 1760 02 Software and applications developers and analysts 631 4159 02 Medical doctors 293 1944 02 No occupation 152894 00
No answer 2531 578 44 Total 249561 294937 08
Labour shortages and surpluses 2017
2017 47
Directorate-General for Employment Social Affairs and Inclusion European Network of Public Employment Services (PES)
HOW TO OBTAIN EU PUBLICATIONS
Free publications
bull one copy
via EU Bookshop (httpbookshopeuropaeu)
bull more than one copy or postersmaps
from the European Unionrsquos representations (httpeceuropaeurepresent_enhtm)
from the delegations in non-EU countries
(httpeeaseuropaeudelegationsindex_enhtm)
by contacting the Europe Direct service (httpeuropaeueuropedirectindex_enhtm)
or calling 00 800 6 7 8 9 10 11 (free phone number from anywhere in the EU) () () The information given is free as are most calls (though some operators phone boxes or hotels may charge you)
Priced publications
bull via EU Bookshop (httpbookshopeuropaeu)
Priced subscriptions
bull via one of the sales agents of the Publications Office of the European Union
(httppublicationseuropaeuothersagentsindex_enhtm)
doi 10276731262
KE-0
1-1
8-2
63-E
N-N
[Ca
talo
gu
e n
um
be
r]
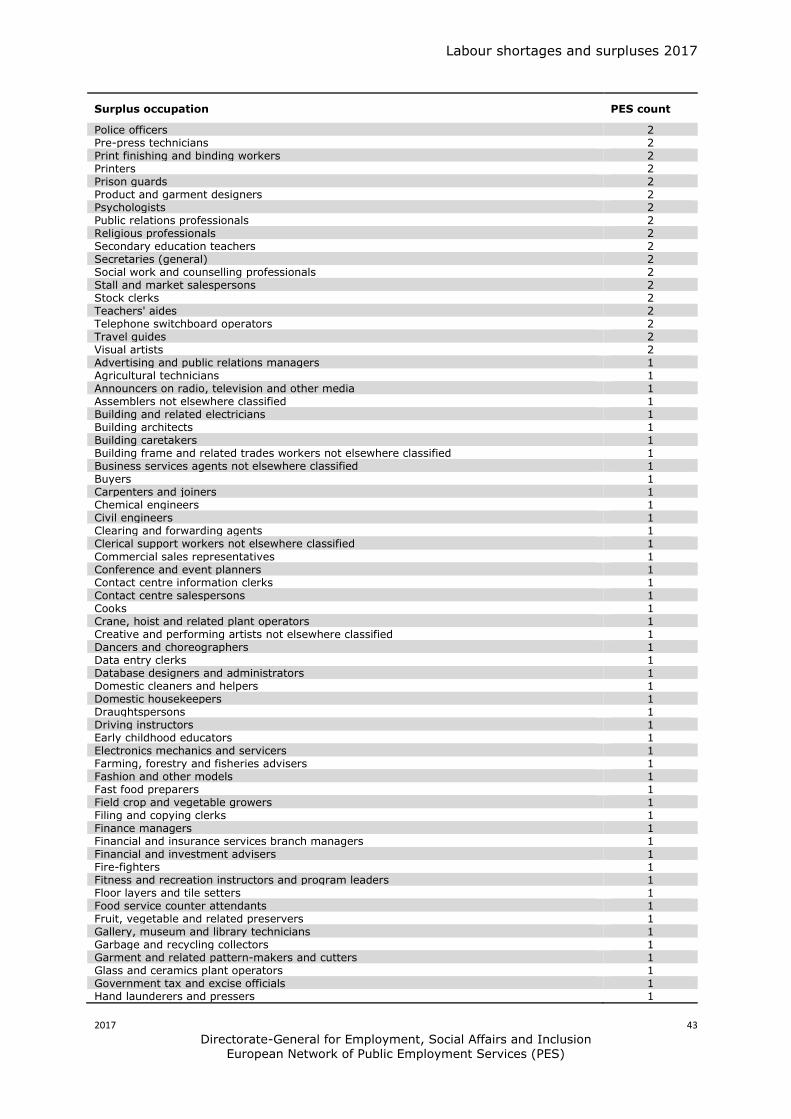
Labour shortages and surpluses 2017
2017 43
Directorate-General for Employment Social Affairs and Inclusion European Network of Public Employment Services (PES)
Surplus occupation PES count
Police officers 2 Pre-press technicians 2 Print finishing and binding workers 2 Printers 2 Prison guards 2 Product and garment designers 2 Psychologists 2 Public relations professionals 2 Religious professionals 2 Secondary education teachers 2 Secretaries (general) 2 Social work and counselling professionals 2 Stall and market salespersons 2 Stock clerks 2 Teachers aides 2 Telephone switchboard operators 2 Travel guides 2 Visual artists 2 Advertising and public relations managers 1 Agricultural technicians 1 Announcers on radio television and other media 1 Assemblers not elsewhere classified 1 Building and related electricians 1 Building architects 1 Building caretakers 1 Building frame and related trades workers not elsewhere classified 1 Business services agents not elsewhere classified 1 Buyers 1 Carpenters and joiners 1 Chemical engineers 1 Civil engineers 1 Clearing and forwarding agents 1 Clerical support workers not elsewhere classified 1
Commercial sales representatives 1 Conference and event planners 1 Contact centre information clerks 1 Contact centre salespersons 1 Cooks 1 Crane hoist and related plant operators 1 Creative and performing artists not elsewhere classified 1 Dancers and choreographers 1 Data entry clerks 1 Database designers and administrators 1 Domestic cleaners and helpers 1 Domestic housekeepers 1 Draughtspersons 1 Driving instructors 1 Early childhood educators 1 Electronics mechanics and servicers 1 Farming forestry and fisheries advisers 1 Fashion and other models 1 Fast food preparers 1 Field crop and vegetable growers 1 Filing and copying clerks 1 Finance managers 1 Financial and insurance services branch managers 1 Financial and investment advisers 1 Fire-fighters 1 Fitness and recreation instructors and program leaders 1 Floor layers and tile setters 1 Food service counter attendants 1 Fruit vegetable and related preservers 1 Gallery museum and library technicians 1 Garbage and recycling collectors 1 Garment and related pattern-makers and cutters 1 Glass and ceramics plant operators 1 Government tax and excise officials 1 Hand launderers and pressers 1
Labour shortages and surpluses 2017
2017 44
Directorate-General for Employment Social Affairs and Inclusion European Network of Public Employment Services (PES)
Surplus occupation PES count
Heavy truck and lorry drivers 1 House builders 1 Hunters and trappers 1 Information and communications technology installers and servicers 1 Information and communications technology user support technicians 1 Insurance representatives 1 Jewellery and precious-metal workers 1 Judges 1 Legal secretaries 1 Librarians and related information professionals 1 Life science technicians (excluding medical) 1 Lifting truck operators 1 Managing directors and chief executives 1 Manufacturing supervisors 1 Medical and dental prosthetic technicians 1 Metal moulders and coremakers 1 Mining and quarrying labourers 1 Mixed crop and animal producers 1 Mixed crop growers 1 Mobile farm and forestry plant operators 1 Musical instrument makers and tuners 1 Other language teachers 1 Pawnbrokers and money-lenders 1 Personnel and careers professionals 1 Pet groomers and animal care workers 1 Photographic products machine operators 1 Physical and engineering science technicians not elsewhere classified 1 Physicists and astronomers 1 Police inspectors and detectives 1 Precision-instrument makers and repairers 1 Primary school teachers 1 Process control technicians not elsewhere classified 1 Product graders and testers (excluding foods and beverages) 1
Production clerks 1 Professional services managers not elsewhere classified 1 Protective services workers not elsewhere classified 1 Research and development managers 1 Retail and wholesale trade managers 1 Roofers 1 Sales workers not elsewhere classified 1 Senior government officials 1 Service station attendants 1 Shelf fillers 1 Shop supervisors 1 Social work associate professionals 1 Special needs teachers 1 Spray painters and varnishers 1 Statistical mathematical and related associate professionals 1 Stonemasons stone cutters splitters and carvers 1 Street food salespersons 1 Supply distribution and related managers 1 Teaching professionals not elsewhere classified 1 Technical and medical sales professionals (excluding ICT) 1 Training and staff development professionals 1 Translators interpreters and other linguists 1 Transport conductors 1 Tree and shrub crop growers 1 Typists and word processing operators 1 Undertakers and embalmers 1 Vocational education teachers 1 Weaving and knitting machine operators 1 Woodworking-machine tool setters and operators 1
Labour shortages and surpluses 2017
2017 45
Directorate-General for Employment Social Affairs and Inclusion European Network of Public Employment Services (PES)
ANNEX 4 THE RATIO OF UNEMPLOYED TO NEW HIRES
ISCO-08 title
2015
UE
Recruited in the
last year (lt12
months)
Ratio of UE to new recruits
Street and related service workers 85 104 08 Agricultural forestry and fishery labourers 3913 5343 07 Mining and construction labourers 1937 3525 05 Creative and performing artists 610 1115 05 Refuse workers 1036 1923 05 Painters building structure cleaners and related trades workers 1116 2117 05 Street and market salespersons 195 389 05 Building frame and related trades workers 3632 7353 05 Mining manufacturing and construction supervisors 626 1315 05 Ships deck crews and related workers 53 114 05 Market gardeners and crop growers 1471 3207 05 Managing directors and chief executives 304 667 05 Travel attendants conductors and guides 229 538 04 Wood treaters cabinet-makers and related trades workers 491 1159 04 Manufacturing labourers 1640 3909 04 Domestic hotel and office cleaners and helpers 5679 13545 04 Other stationary plant and machine operators 822 1961 04 Mobile plant operators 1038 2497 04 Building finishers and related trades workers 1519 3680 04 Textile fur and leather products machine operators 431 1048 04 Garment and related trades workers 422 1047 04 Chemical and photographic products plant and machine operators 157 389 04 Food processing and related trades workers 930 2330 04 Vehicle window laundry and other hand cleaning workers 291 754 04 Sheet and structural metal workers moulders and welders and related workers
996 2603 04
Waiters and bartenders 4399 11595 04 Cooks 1529 4039 04 Metal processing and finishing plant operators 208 557 04 Printing trades workers 203 548 04 Forestry and related workers 130 351 04 Protective services workers 1347 3658 04 Transport and storage labourers 2532 6939 04 Fishery workers hunters and trappers 46 128 04 Material-recording and transport clerks 1671 4630 04 Process control technicians 179 517 03 Mining and mineral processing plant operators 94 274 03 Telecommunications and broadcasting technicians 177 519 03 Blacksmiths toolmakers and related trades workers 816 2409 03 Building and housekeeping supervisors 678 2045 03
Secretaries (general) 1072 3259 03 Assemblers 850 2586 03 Other craft and related workers 258 810 03 Shop salespersons 6600 21042 03 Electrical equipment installers and repairers 958 3060 03 Food and related products machine operators 437 1400 03 Other sales workers 1087 3510 03 Food preparation assistants 1646 5337 03 Mixed crop and animal producers 387 1260 03 Car van and motorcycle drivers 1155 3764 03 Client information workers 1993 6531 03 Sports and fitness workers 605 1984 03 Handicraft workers 194 638 03 Life science technicians and related associate professionals 82 271 03 Keyboard operators 283 940 03 Electronics and telecommunications installers and repairers 290 963 03 Other personal services workers 313 1047 03 Vocational education teachers 279 940 03 Other teaching professionals 744 2518 03 General office clerks 966 3272 03 Authors journalists and linguists 335 1135 03 Hairdressers beauticians and related workers 806 2796 03
Labour shortages and surpluses 2017
2017 46
Directorate-General for Employment Social Affairs and Inclusion European Network of Public Employment Services (PES)
ISCO-08 title
2015
UE
Recruited in the
last year (lt12
months)
Ratio of UE to new recruits
Animal producers 189 660 03 Other elementary workers 976 3401 03 Machinery mechanics and repairers 1134 3962 03 Ship and aircraft controllers and technicians 80 281 03 Hotel and restaurant managers 344 1220 03 Cashiers and ticket clerks 908 3220 03 Retail and wholesale trade managers 224 809 03 Sales marketing and development managers 311 1124 03 Physical and engineering science technicians 1204 4366 03 Administrative and specialised secretaries 1106 4040 03 Sales and purchasing agents and brokers 1294 4754 03 Rubber plastic and paper products machine operators 256 941 03 Artistic cultural and culinary associate professionals 511 1906 03 Numerical clerks 944 3532 03 Other services managers 184 691 03 Child care workers and teachers aides 1335 5005 03 Heavy truck and bus drivers 1426 5349 03 Business services and administration managers 383 1439 03 Information and communications technology service managers 67 257 03 Regulatory government associate professionals 209 807 03 Life science professionals 176 681 03 Wood processing and papermaking plant operators 97 379 03 Locomotive engine drivers and related workers 46 179 03 Legal professionals 315 1245 03 Personal care workers in health services 2195 8787 02 Physical and earth science professionals 85 345 02 Street vendors (excluding food) 50 204 02 Architects planners surveyors and designers 515 2092 02 Other clerical support workers 901 3657 02 Business services agents 510 2114 02 Manufacturing mining construction and distribution managers 361 1507 02 Tellers money collectors and related clerks 381 1612 02 Librarians archivists and curators 58 248 02 Medical and pharmaceutical technicians 255 1099 02 University and higher education teachers 301 1333 02 Information and communications technology operations and user support technicians
418 1888 02
Legal social and religious associate professionals 920 4348 02 Financial and mathematical associate professionals 601 2852 02 Sales marketing and public relations professionals 865 4172 02 Finance professionals 472 2281 02 Engineering professionals (excluding electrotechnology) 635 3118 02 Other health associate professionals 531 2657 02
Social and religious professionals 460 2317 02 Professional services managers 176 891 02 Nursing and midwifery associate professionals 556 2855 02 Legislators and senior officials 53 286 02 Database and network professionals 83 455 02 Administration professionals 641 3673 02 Primary school and early childhood teachers 575 3345 02 Electrotechnology engineers 142 827 02 Secondary education teachers 471 2812 02 Other health professionals 346 2083 02 Nursing and midwifery professionals 273 1760 02 Software and applications developers and analysts 631 4159 02 Medical doctors 293 1944 02 No occupation 152894 00
No answer 2531 578 44 Total 249561 294937 08
Labour shortages and surpluses 2017
2017 47
Directorate-General for Employment Social Affairs and Inclusion European Network of Public Employment Services (PES)
HOW TO OBTAIN EU PUBLICATIONS
Free publications
bull one copy
via EU Bookshop (httpbookshopeuropaeu)
bull more than one copy or postersmaps
from the European Unionrsquos representations (httpeceuropaeurepresent_enhtm)
from the delegations in non-EU countries
(httpeeaseuropaeudelegationsindex_enhtm)
by contacting the Europe Direct service (httpeuropaeueuropedirectindex_enhtm)
or calling 00 800 6 7 8 9 10 11 (free phone number from anywhere in the EU) () () The information given is free as are most calls (though some operators phone boxes or hotels may charge you)
Priced publications
bull via EU Bookshop (httpbookshopeuropaeu)
Priced subscriptions
bull via one of the sales agents of the Publications Office of the European Union
(httppublicationseuropaeuothersagentsindex_enhtm)
doi 10276731262
KE-0
1-1
8-2
63-E
N-N
[Ca
talo
gu
e n
um
be
r]
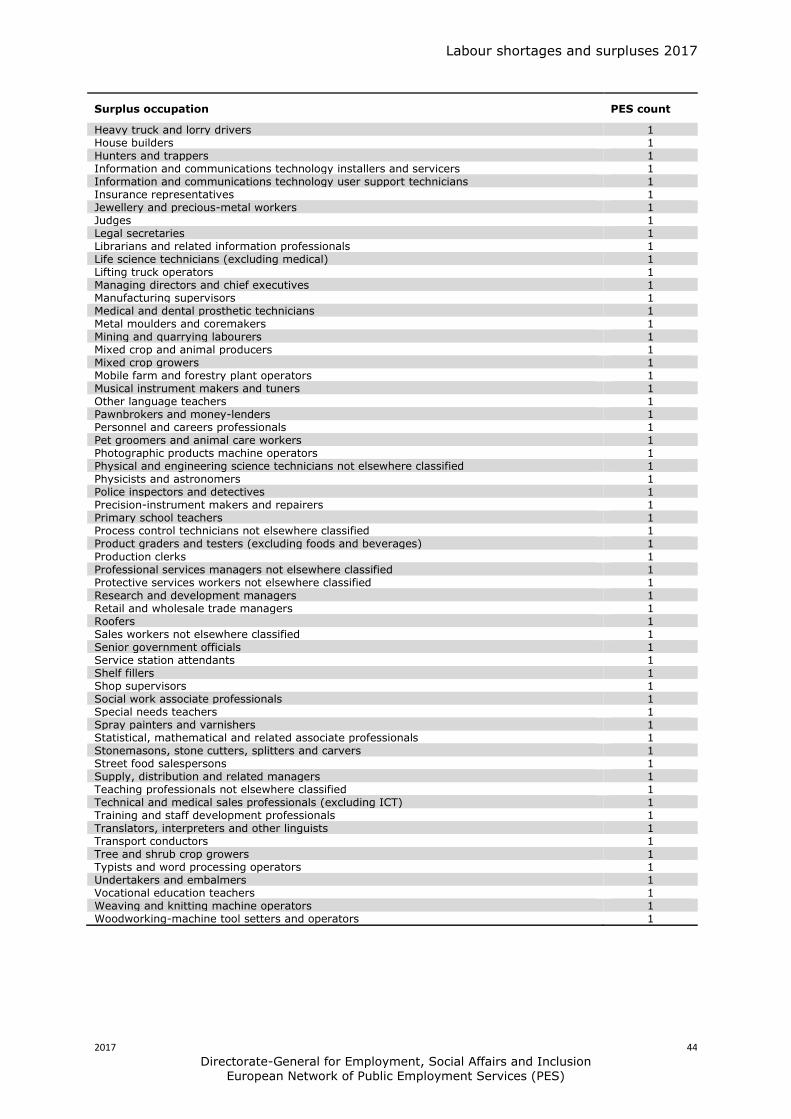
Labour shortages and surpluses 2017
2017 44
Directorate-General for Employment Social Affairs and Inclusion European Network of Public Employment Services (PES)
Surplus occupation PES count
Heavy truck and lorry drivers 1 House builders 1 Hunters and trappers 1 Information and communications technology installers and servicers 1 Information and communications technology user support technicians 1 Insurance representatives 1 Jewellery and precious-metal workers 1 Judges 1 Legal secretaries 1 Librarians and related information professionals 1 Life science technicians (excluding medical) 1 Lifting truck operators 1 Managing directors and chief executives 1 Manufacturing supervisors 1 Medical and dental prosthetic technicians 1 Metal moulders and coremakers 1 Mining and quarrying labourers 1 Mixed crop and animal producers 1 Mixed crop growers 1 Mobile farm and forestry plant operators 1 Musical instrument makers and tuners 1 Other language teachers 1 Pawnbrokers and money-lenders 1 Personnel and careers professionals 1 Pet groomers and animal care workers 1 Photographic products machine operators 1 Physical and engineering science technicians not elsewhere classified 1 Physicists and astronomers 1 Police inspectors and detectives 1 Precision-instrument makers and repairers 1 Primary school teachers 1 Process control technicians not elsewhere classified 1 Product graders and testers (excluding foods and beverages) 1
Production clerks 1 Professional services managers not elsewhere classified 1 Protective services workers not elsewhere classified 1 Research and development managers 1 Retail and wholesale trade managers 1 Roofers 1 Sales workers not elsewhere classified 1 Senior government officials 1 Service station attendants 1 Shelf fillers 1 Shop supervisors 1 Social work associate professionals 1 Special needs teachers 1 Spray painters and varnishers 1 Statistical mathematical and related associate professionals 1 Stonemasons stone cutters splitters and carvers 1 Street food salespersons 1 Supply distribution and related managers 1 Teaching professionals not elsewhere classified 1 Technical and medical sales professionals (excluding ICT) 1 Training and staff development professionals 1 Translators interpreters and other linguists 1 Transport conductors 1 Tree and shrub crop growers 1 Typists and word processing operators 1 Undertakers and embalmers 1 Vocational education teachers 1 Weaving and knitting machine operators 1 Woodworking-machine tool setters and operators 1
Labour shortages and surpluses 2017
2017 45
Directorate-General for Employment Social Affairs and Inclusion European Network of Public Employment Services (PES)
ANNEX 4 THE RATIO OF UNEMPLOYED TO NEW HIRES
ISCO-08 title
2015
UE
Recruited in the
last year (lt12
months)
Ratio of UE to new recruits
Street and related service workers 85 104 08 Agricultural forestry and fishery labourers 3913 5343 07 Mining and construction labourers 1937 3525 05 Creative and performing artists 610 1115 05 Refuse workers 1036 1923 05 Painters building structure cleaners and related trades workers 1116 2117 05 Street and market salespersons 195 389 05 Building frame and related trades workers 3632 7353 05 Mining manufacturing and construction supervisors 626 1315 05 Ships deck crews and related workers 53 114 05 Market gardeners and crop growers 1471 3207 05 Managing directors and chief executives 304 667 05 Travel attendants conductors and guides 229 538 04 Wood treaters cabinet-makers and related trades workers 491 1159 04 Manufacturing labourers 1640 3909 04 Domestic hotel and office cleaners and helpers 5679 13545 04 Other stationary plant and machine operators 822 1961 04 Mobile plant operators 1038 2497 04 Building finishers and related trades workers 1519 3680 04 Textile fur and leather products machine operators 431 1048 04 Garment and related trades workers 422 1047 04 Chemical and photographic products plant and machine operators 157 389 04 Food processing and related trades workers 930 2330 04 Vehicle window laundry and other hand cleaning workers 291 754 04 Sheet and structural metal workers moulders and welders and related workers
996 2603 04
Waiters and bartenders 4399 11595 04 Cooks 1529 4039 04 Metal processing and finishing plant operators 208 557 04 Printing trades workers 203 548 04 Forestry and related workers 130 351 04 Protective services workers 1347 3658 04 Transport and storage labourers 2532 6939 04 Fishery workers hunters and trappers 46 128 04 Material-recording and transport clerks 1671 4630 04 Process control technicians 179 517 03 Mining and mineral processing plant operators 94 274 03 Telecommunications and broadcasting technicians 177 519 03 Blacksmiths toolmakers and related trades workers 816 2409 03 Building and housekeeping supervisors 678 2045 03
Secretaries (general) 1072 3259 03 Assemblers 850 2586 03 Other craft and related workers 258 810 03 Shop salespersons 6600 21042 03 Electrical equipment installers and repairers 958 3060 03 Food and related products machine operators 437 1400 03 Other sales workers 1087 3510 03 Food preparation assistants 1646 5337 03 Mixed crop and animal producers 387 1260 03 Car van and motorcycle drivers 1155 3764 03 Client information workers 1993 6531 03 Sports and fitness workers 605 1984 03 Handicraft workers 194 638 03 Life science technicians and related associate professionals 82 271 03 Keyboard operators 283 940 03 Electronics and telecommunications installers and repairers 290 963 03 Other personal services workers 313 1047 03 Vocational education teachers 279 940 03 Other teaching professionals 744 2518 03 General office clerks 966 3272 03 Authors journalists and linguists 335 1135 03 Hairdressers beauticians and related workers 806 2796 03
Labour shortages and surpluses 2017
2017 46
Directorate-General for Employment Social Affairs and Inclusion European Network of Public Employment Services (PES)
ISCO-08 title
2015
UE
Recruited in the
last year (lt12
months)
Ratio of UE to new recruits
Animal producers 189 660 03 Other elementary workers 976 3401 03 Machinery mechanics and repairers 1134 3962 03 Ship and aircraft controllers and technicians 80 281 03 Hotel and restaurant managers 344 1220 03 Cashiers and ticket clerks 908 3220 03 Retail and wholesale trade managers 224 809 03 Sales marketing and development managers 311 1124 03 Physical and engineering science technicians 1204 4366 03 Administrative and specialised secretaries 1106 4040 03 Sales and purchasing agents and brokers 1294 4754 03 Rubber plastic and paper products machine operators 256 941 03 Artistic cultural and culinary associate professionals 511 1906 03 Numerical clerks 944 3532 03 Other services managers 184 691 03 Child care workers and teachers aides 1335 5005 03 Heavy truck and bus drivers 1426 5349 03 Business services and administration managers 383 1439 03 Information and communications technology service managers 67 257 03 Regulatory government associate professionals 209 807 03 Life science professionals 176 681 03 Wood processing and papermaking plant operators 97 379 03 Locomotive engine drivers and related workers 46 179 03 Legal professionals 315 1245 03 Personal care workers in health services 2195 8787 02 Physical and earth science professionals 85 345 02 Street vendors (excluding food) 50 204 02 Architects planners surveyors and designers 515 2092 02 Other clerical support workers 901 3657 02 Business services agents 510 2114 02 Manufacturing mining construction and distribution managers 361 1507 02 Tellers money collectors and related clerks 381 1612 02 Librarians archivists and curators 58 248 02 Medical and pharmaceutical technicians 255 1099 02 University and higher education teachers 301 1333 02 Information and communications technology operations and user support technicians
418 1888 02
Legal social and religious associate professionals 920 4348 02 Financial and mathematical associate professionals 601 2852 02 Sales marketing and public relations professionals 865 4172 02 Finance professionals 472 2281 02 Engineering professionals (excluding electrotechnology) 635 3118 02 Other health associate professionals 531 2657 02
Social and religious professionals 460 2317 02 Professional services managers 176 891 02 Nursing and midwifery associate professionals 556 2855 02 Legislators and senior officials 53 286 02 Database and network professionals 83 455 02 Administration professionals 641 3673 02 Primary school and early childhood teachers 575 3345 02 Electrotechnology engineers 142 827 02 Secondary education teachers 471 2812 02 Other health professionals 346 2083 02 Nursing and midwifery professionals 273 1760 02 Software and applications developers and analysts 631 4159 02 Medical doctors 293 1944 02 No occupation 152894 00
No answer 2531 578 44 Total 249561 294937 08
Labour shortages and surpluses 2017
2017 47
Directorate-General for Employment Social Affairs and Inclusion European Network of Public Employment Services (PES)
HOW TO OBTAIN EU PUBLICATIONS
Free publications
bull one copy
via EU Bookshop (httpbookshopeuropaeu)
bull more than one copy or postersmaps
from the European Unionrsquos representations (httpeceuropaeurepresent_enhtm)
from the delegations in non-EU countries
(httpeeaseuropaeudelegationsindex_enhtm)
by contacting the Europe Direct service (httpeuropaeueuropedirectindex_enhtm)
or calling 00 800 6 7 8 9 10 11 (free phone number from anywhere in the EU) () () The information given is free as are most calls (though some operators phone boxes or hotels may charge you)
Priced publications
bull via EU Bookshop (httpbookshopeuropaeu)
Priced subscriptions
bull via one of the sales agents of the Publications Office of the European Union
(httppublicationseuropaeuothersagentsindex_enhtm)
doi 10276731262
KE-0
1-1
8-2
63-E
N-N
[Ca
talo
gu
e n
um
be
r]
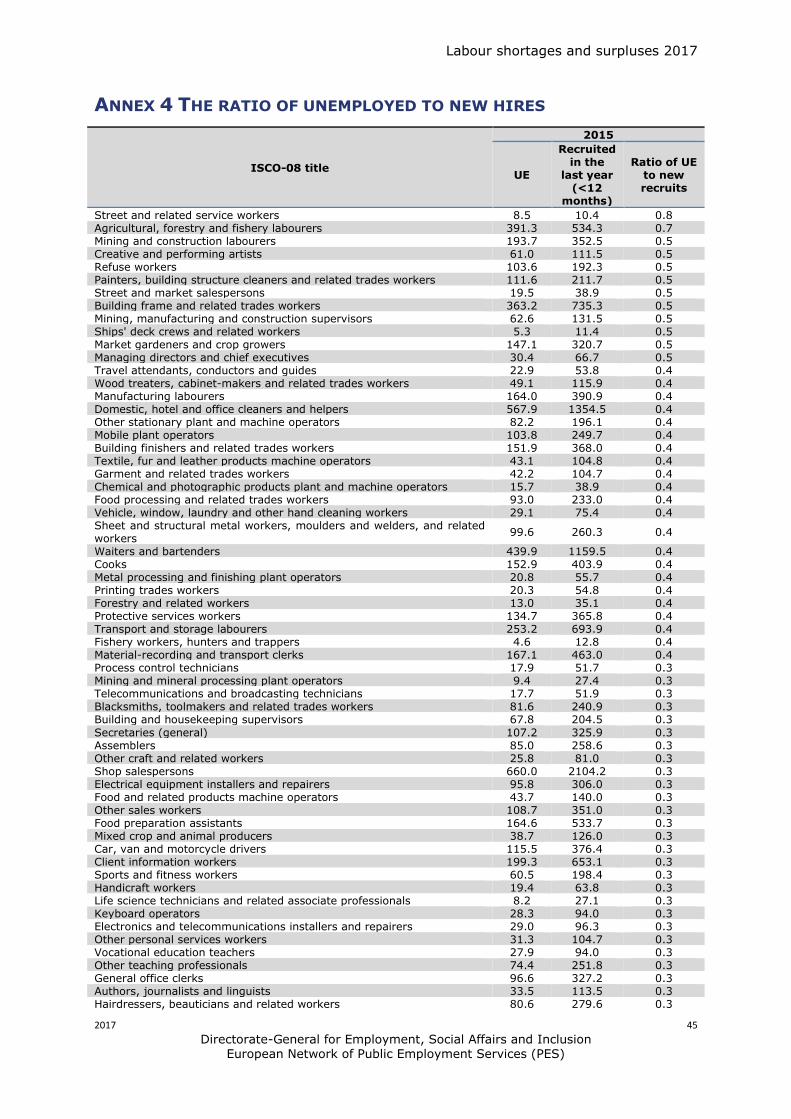
Labour shortages and surpluses 2017
2017 45
Directorate-General for Employment Social Affairs and Inclusion European Network of Public Employment Services (PES)
ANNEX 4 THE RATIO OF UNEMPLOYED TO NEW HIRES
ISCO-08 title
2015
UE
Recruited in the
last year (lt12
months)
Ratio of UE to new recruits
Street and related service workers 85 104 08 Agricultural forestry and fishery labourers 3913 5343 07 Mining and construction labourers 1937 3525 05 Creative and performing artists 610 1115 05 Refuse workers 1036 1923 05 Painters building structure cleaners and related trades workers 1116 2117 05 Street and market salespersons 195 389 05 Building frame and related trades workers 3632 7353 05 Mining manufacturing and construction supervisors 626 1315 05 Ships deck crews and related workers 53 114 05 Market gardeners and crop growers 1471 3207 05 Managing directors and chief executives 304 667 05 Travel attendants conductors and guides 229 538 04 Wood treaters cabinet-makers and related trades workers 491 1159 04 Manufacturing labourers 1640 3909 04 Domestic hotel and office cleaners and helpers 5679 13545 04 Other stationary plant and machine operators 822 1961 04 Mobile plant operators 1038 2497 04 Building finishers and related trades workers 1519 3680 04 Textile fur and leather products machine operators 431 1048 04 Garment and related trades workers 422 1047 04 Chemical and photographic products plant and machine operators 157 389 04 Food processing and related trades workers 930 2330 04 Vehicle window laundry and other hand cleaning workers 291 754 04 Sheet and structural metal workers moulders and welders and related workers
996 2603 04
Waiters and bartenders 4399 11595 04 Cooks 1529 4039 04 Metal processing and finishing plant operators 208 557 04 Printing trades workers 203 548 04 Forestry and related workers 130 351 04 Protective services workers 1347 3658 04 Transport and storage labourers 2532 6939 04 Fishery workers hunters and trappers 46 128 04 Material-recording and transport clerks 1671 4630 04 Process control technicians 179 517 03 Mining and mineral processing plant operators 94 274 03 Telecommunications and broadcasting technicians 177 519 03 Blacksmiths toolmakers and related trades workers 816 2409 03 Building and housekeeping supervisors 678 2045 03
Secretaries (general) 1072 3259 03 Assemblers 850 2586 03 Other craft and related workers 258 810 03 Shop salespersons 6600 21042 03 Electrical equipment installers and repairers 958 3060 03 Food and related products machine operators 437 1400 03 Other sales workers 1087 3510 03 Food preparation assistants 1646 5337 03 Mixed crop and animal producers 387 1260 03 Car van and motorcycle drivers 1155 3764 03 Client information workers 1993 6531 03 Sports and fitness workers 605 1984 03 Handicraft workers 194 638 03 Life science technicians and related associate professionals 82 271 03 Keyboard operators 283 940 03 Electronics and telecommunications installers and repairers 290 963 03 Other personal services workers 313 1047 03 Vocational education teachers 279 940 03 Other teaching professionals 744 2518 03 General office clerks 966 3272 03 Authors journalists and linguists 335 1135 03 Hairdressers beauticians and related workers 806 2796 03
Labour shortages and surpluses 2017
2017 46
Directorate-General for Employment Social Affairs and Inclusion European Network of Public Employment Services (PES)
ISCO-08 title
2015
UE
Recruited in the
last year (lt12
months)
Ratio of UE to new recruits
Animal producers 189 660 03 Other elementary workers 976 3401 03 Machinery mechanics and repairers 1134 3962 03 Ship and aircraft controllers and technicians 80 281 03 Hotel and restaurant managers 344 1220 03 Cashiers and ticket clerks 908 3220 03 Retail and wholesale trade managers 224 809 03 Sales marketing and development managers 311 1124 03 Physical and engineering science technicians 1204 4366 03 Administrative and specialised secretaries 1106 4040 03 Sales and purchasing agents and brokers 1294 4754 03 Rubber plastic and paper products machine operators 256 941 03 Artistic cultural and culinary associate professionals 511 1906 03 Numerical clerks 944 3532 03 Other services managers 184 691 03 Child care workers and teachers aides 1335 5005 03 Heavy truck and bus drivers 1426 5349 03 Business services and administration managers 383 1439 03 Information and communications technology service managers 67 257 03 Regulatory government associate professionals 209 807 03 Life science professionals 176 681 03 Wood processing and papermaking plant operators 97 379 03 Locomotive engine drivers and related workers 46 179 03 Legal professionals 315 1245 03 Personal care workers in health services 2195 8787 02 Physical and earth science professionals 85 345 02 Street vendors (excluding food) 50 204 02 Architects planners surveyors and designers 515 2092 02 Other clerical support workers 901 3657 02 Business services agents 510 2114 02 Manufacturing mining construction and distribution managers 361 1507 02 Tellers money collectors and related clerks 381 1612 02 Librarians archivists and curators 58 248 02 Medical and pharmaceutical technicians 255 1099 02 University and higher education teachers 301 1333 02 Information and communications technology operations and user support technicians
418 1888 02
Legal social and religious associate professionals 920 4348 02 Financial and mathematical associate professionals 601 2852 02 Sales marketing and public relations professionals 865 4172 02 Finance professionals 472 2281 02 Engineering professionals (excluding electrotechnology) 635 3118 02 Other health associate professionals 531 2657 02
Social and religious professionals 460 2317 02 Professional services managers 176 891 02 Nursing and midwifery associate professionals 556 2855 02 Legislators and senior officials 53 286 02 Database and network professionals 83 455 02 Administration professionals 641 3673 02 Primary school and early childhood teachers 575 3345 02 Electrotechnology engineers 142 827 02 Secondary education teachers 471 2812 02 Other health professionals 346 2083 02 Nursing and midwifery professionals 273 1760 02 Software and applications developers and analysts 631 4159 02 Medical doctors 293 1944 02 No occupation 152894 00
No answer 2531 578 44 Total 249561 294937 08
Labour shortages and surpluses 2017
2017 47
Directorate-General for Employment Social Affairs and Inclusion European Network of Public Employment Services (PES)
HOW TO OBTAIN EU PUBLICATIONS
Free publications
bull one copy
via EU Bookshop (httpbookshopeuropaeu)
bull more than one copy or postersmaps
from the European Unionrsquos representations (httpeceuropaeurepresent_enhtm)
from the delegations in non-EU countries
(httpeeaseuropaeudelegationsindex_enhtm)
by contacting the Europe Direct service (httpeuropaeueuropedirectindex_enhtm)
or calling 00 800 6 7 8 9 10 11 (free phone number from anywhere in the EU) () () The information given is free as are most calls (though some operators phone boxes or hotels may charge you)
Priced publications
bull via EU Bookshop (httpbookshopeuropaeu)
Priced subscriptions
bull via one of the sales agents of the Publications Office of the European Union
(httppublicationseuropaeuothersagentsindex_enhtm)
doi 10276731262
KE-0
1-1
8-2
63-E
N-N
[Ca
talo
gu
e n
um
be
r]
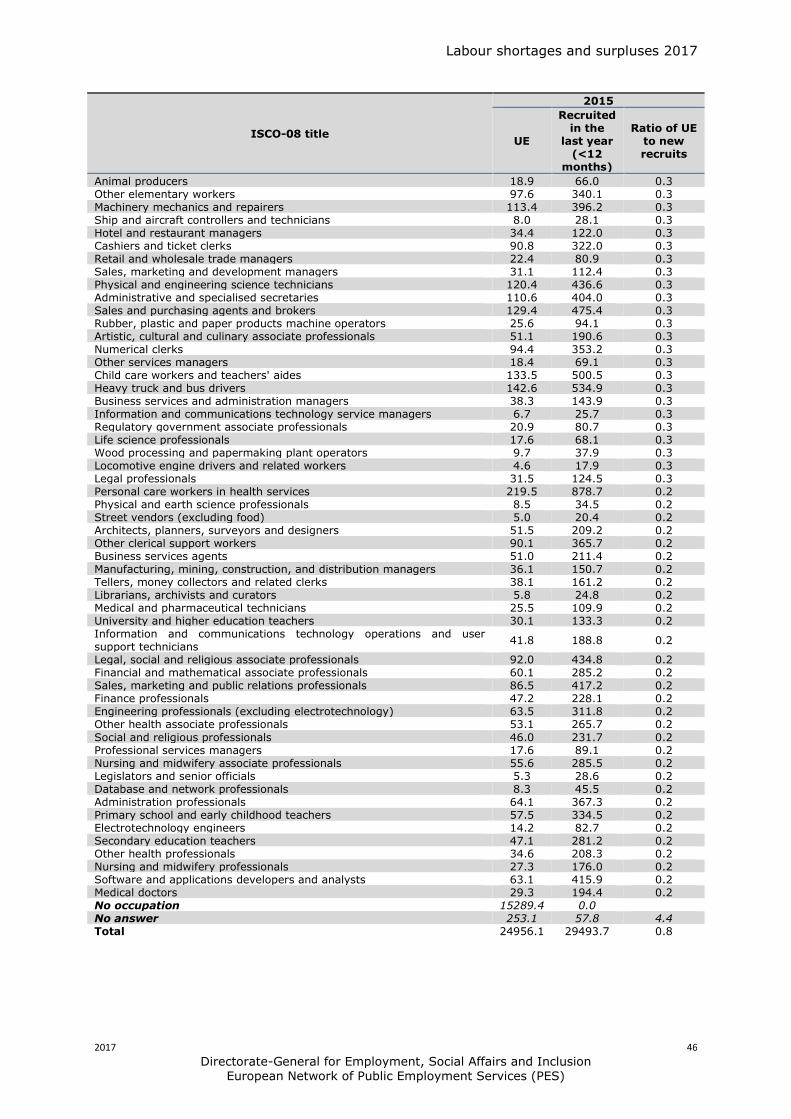
Labour shortages and surpluses 2017
2017 46
Directorate-General for Employment Social Affairs and Inclusion European Network of Public Employment Services (PES)
ISCO-08 title
2015
UE
Recruited in the
last year (lt12
months)
Ratio of UE to new recruits
Animal producers 189 660 03 Other elementary workers 976 3401 03 Machinery mechanics and repairers 1134 3962 03 Ship and aircraft controllers and technicians 80 281 03 Hotel and restaurant managers 344 1220 03 Cashiers and ticket clerks 908 3220 03 Retail and wholesale trade managers 224 809 03 Sales marketing and development managers 311 1124 03 Physical and engineering science technicians 1204 4366 03 Administrative and specialised secretaries 1106 4040 03 Sales and purchasing agents and brokers 1294 4754 03 Rubber plastic and paper products machine operators 256 941 03 Artistic cultural and culinary associate professionals 511 1906 03 Numerical clerks 944 3532 03 Other services managers 184 691 03 Child care workers and teachers aides 1335 5005 03 Heavy truck and bus drivers 1426 5349 03 Business services and administration managers 383 1439 03 Information and communications technology service managers 67 257 03 Regulatory government associate professionals 209 807 03 Life science professionals 176 681 03 Wood processing and papermaking plant operators 97 379 03 Locomotive engine drivers and related workers 46 179 03 Legal professionals 315 1245 03 Personal care workers in health services 2195 8787 02 Physical and earth science professionals 85 345 02 Street vendors (excluding food) 50 204 02 Architects planners surveyors and designers 515 2092 02 Other clerical support workers 901 3657 02 Business services agents 510 2114 02 Manufacturing mining construction and distribution managers 361 1507 02 Tellers money collectors and related clerks 381 1612 02 Librarians archivists and curators 58 248 02 Medical and pharmaceutical technicians 255 1099 02 University and higher education teachers 301 1333 02 Information and communications technology operations and user support technicians
418 1888 02
Legal social and religious associate professionals 920 4348 02 Financial and mathematical associate professionals 601 2852 02 Sales marketing and public relations professionals 865 4172 02 Finance professionals 472 2281 02 Engineering professionals (excluding electrotechnology) 635 3118 02 Other health associate professionals 531 2657 02
Social and religious professionals 460 2317 02 Professional services managers 176 891 02 Nursing and midwifery associate professionals 556 2855 02 Legislators and senior officials 53 286 02 Database and network professionals 83 455 02 Administration professionals 641 3673 02 Primary school and early childhood teachers 575 3345 02 Electrotechnology engineers 142 827 02 Secondary education teachers 471 2812 02 Other health professionals 346 2083 02 Nursing and midwifery professionals 273 1760 02 Software and applications developers and analysts 631 4159 02 Medical doctors 293 1944 02 No occupation 152894 00
No answer 2531 578 44 Total 249561 294937 08
Labour shortages and surpluses 2017
2017 47
Directorate-General for Employment Social Affairs and Inclusion European Network of Public Employment Services (PES)
HOW TO OBTAIN EU PUBLICATIONS
Free publications
bull one copy
via EU Bookshop (httpbookshopeuropaeu)
bull more than one copy or postersmaps
from the European Unionrsquos representations (httpeceuropaeurepresent_enhtm)
from the delegations in non-EU countries
(httpeeaseuropaeudelegationsindex_enhtm)
by contacting the Europe Direct service (httpeuropaeueuropedirectindex_enhtm)
or calling 00 800 6 7 8 9 10 11 (free phone number from anywhere in the EU) () () The information given is free as are most calls (though some operators phone boxes or hotels may charge you)
Priced publications
bull via EU Bookshop (httpbookshopeuropaeu)
Priced subscriptions
bull via one of the sales agents of the Publications Office of the European Union
(httppublicationseuropaeuothersagentsindex_enhtm)
doi 10276731262
KE-0
1-1
8-2
63-E
N-N
[Ca
talo
gu
e n
um
be
r]

doi 10276731262
KE-0
1-1
8-2
63-E
N-N
[Ca
talo
gu
e n
um
be
r]
Related Documents