1 Labour productivity of young and adult temporary workers and youth unemployment: a cross-country analysis Maria Laura Parisi University of Brescia, Italy Enrico Marelli University of Brescia, Italy Olga Demidova Higher School of Economics, Moscow 27 September 2014 Abstract The latest crisis has exacerbated two negative macroeconomic phenomena, particularly in Southern Europe. The size and persistence of youth unemployment has become unacceptable after 2010. Stagnation in labour productivity instead goes back to the ‘90s, but it has not improved since then and even worsen with the crisis. In this paper we analysed these two macroeconomic features, using aggregate data, in relation to labour market characteristics. Reforms of regulation, in many countries over the past twenty years, introduced a set of newly designed job contracts that allowed the use of temporary work. At the same time, Employment Protection Regulation encompassed temporary workers too. The availability of new contracts and EPLT changed the incentives of firms to vary their labour needs, and to invest in new technology. Eventually, this should have an impact on labour productivity and unemployment. We distinguished between temporary young and adult workers and, conditional to the level of employment protection, we estimate their labour productivity and the correlation with the rate of youth unemployment. We use macroeconomic data for groups based on economic development and groups based on welfare and educational systems. Preliminary evidence shows that the share of adult temporary workers clearly and negatively affects labour productivity, particularly in the Southern countries and New Member States, while young temporary work has mixed effects. Keywords: temporary work, labour productivity, youth unemployment JEL codes: J24, J64, J41 * We acknowledge the grant from EU FP7 “The Political Economy of Youth Unemployment”, Marie Curie Actions “People” – International Research Staff Exchange Scheme - Project IRSES GA-2010-269134. We thank the participants to the workshop “New challenges for the labour market: spatial and institutional perspectives” held in Naples on May 8-9, 2014; Tatiana Karabchuk, Joanna Tyrowicz and the EACES Biennial Conference participants, Budapest, 4-6 September 2014; Sergio Destefanis, Giovanna Vallanti at XXIX AIEL National Conference, Pisa, 11- 12 September 2014, for their helpful comments. The usual disclaimers apply.

Welcome message from author
This document is posted to help you gain knowledge. Please leave a comment to let me know what you think about it! Share it to your friends and learn new things together.
Transcript
1
Labour productivity of young and adult temporary workers and
youth unemployment: a cross-country analysis
Maria Laura Parisi
University of Brescia, Italy
Enrico Marelli
University of Brescia, Italy
Olga Demidova
Higher School of Economics, Moscow
27 September 2014
Abstract
The latest crisis has exacerbated two negative macroeconomic phenomena, particularly in
Southern Europe. The size and persistence of youth unemployment has become unacceptable
after 2010. Stagnation in labour productivity instead goes back to the ‘90s, but it has not
improved since then and even worsen with the crisis. In this paper we analysed these two
macroeconomic features, using aggregate data, in relation to labour market characteristics.
Reforms of regulation, in many countries over the past twenty years, introduced a set of newly
designed job contracts that allowed the use of temporary work. At the same time, Employment
Protection Regulation encompassed temporary workers too. The availability of new contracts
and EPLT changed the incentives of firms to vary their labour needs, and to invest in new
technology. Eventually, this should have an impact on labour productivity and unemployment.
We distinguished between temporary young and adult workers and, conditional to the level of
employment protection, we estimate their labour productivity and the correlation with the rate of
youth unemployment. We use macroeconomic data for groups based on economic development
and groups based on welfare and educational systems. Preliminary evidence shows that the share
of adult temporary workers clearly and negatively affects labour productivity, particularly in the
Southern countries and New Member States, while young temporary work has mixed effects.
Keywords: temporary work, labour productivity, youth unemployment
JEL codes: J24, J64, J41
* We acknowledge the grant from EU FP7 “The Political Economy of Youth Unemployment”, Marie Curie Actions
“People” – International Research Staff Exchange Scheme - Project IRSES GA-2010-269134. We thank the
participants to the workshop “New challenges for the labour market: spatial and institutional perspectives” held in
Naples on May 8-9, 2014; Tatiana Karabchuk, Joanna Tyrowicz and the EACES Biennial Conference participants,
Budapest, 4-6 September 2014; Sergio Destefanis, Giovanna Vallanti at XXIX AIEL National Conference, Pisa, 11-
12 September 2014, for their helpful comments. The usual disclaimers apply.
2
1. Introduction
The latest crisis has exacerbated two negative macroeconomic phenomena, particularly in
Southern Europe. The size and persistence of youth unemployment has become unacceptable
after 2010. Stagnation in labour productivity instead goes back to the ‘90s, but it has not
improved since then and even worsen with the crisis. In this paper we analysed these two
macroeconomic features, using aggregate data, in relation to labour market characteristics.
Different labour market reforms at the end of the 1990s tried to solve the problem of high
unemployment. European governments for instance introduced a set of newly designed job-
contracts that allowed the extensive use of temporary work. At the same time, Employment
Protection Legislation schemes encompassed temporary workers too, through further special
rules (here called EPLT).1
These rules might have affected both the youngsters’ ability to find a job and the productivity of
firms. The most common path today is that unemployed young people may re-enter the labour
market almost exclusively through signing a temporary contract. At the end of the period, if not
renovated or hired on a permanent position, they fall back into unemployment (see Di Giorgio
and Giannini, 2012, or De Graaf-Zijl, van den Berg and Heyma, 2011).
The entry of temporary workers (who are relatively inexperienced if young) likely lowered the
productivity of firms because it reduced their capital-labor ratio and, being cheap work, it mostly
substituted riskier ICT-enabled innovations (see for example Gordon and Dew-Becker (2008) or
Daveri and Parisi, 2014).2 Nonetheless, Cingano, Leonardi, Messina, Pica (2010) observed that
partial EPL reforms via the introduction of temporary contracts resulted in mixed impacts:
temporary contracts used as screening devices may lead to better matches and higher
productivity, but they may also lead to lower productivity if they provide weaker incentives for
specific investments and less on-the-job learning.
We think that their conclusion is particularly serious for young people, who are more
inexperienced and maybe have not accumulated enough skills and education yet. In this work,
we estimated the impact of temporary work, and labour protection, on labour productivity,
distinguishing the share of temporary young workers from adult workers.
1 EPLT include regulation of types of work allowed and duration of fixed-term contracts as well as regulation
governing the establishment and operations of temporary work agencies and agency workers’ pay (OECD, 2013). 2 Gordon and Dew-Becker (2008) made this point for Europe, showing that the labor market reforms that occurred
in many European countries in the second half of the 1990s has been eventually detrimental to productivity growth.
3
We initially set up a general model encompassing labour productivity and youth unemployment,
conditional on temporary work and other macroeconomic characteristics of each country.
Those characteristics are the presence of more or less strict regulations on employment
protection, either in general form (EPLG) or for temporary workers only (EPLT), the share of
employees with secondary or tertiary education, the size of R&D investments with respect to
GDP (both Business R&D and Publicly-funded R&D), the trade balance and country-time
effects.
The time interval of observed data is 1995-2011. We grouped countries within their known
economic-institutional frameworks: former Euro-zone (excluding Luxembourg), OECD, G7, G8,
current Euro-zone plus Russian Federation.3 We ended up with an unbalanced panel for each
group. We dealt with the most common caveats faced when analyzing the determinants of labour
productivity and unemployment at the macroeconomic level (endogeneity, reverse causality,
non-stationarity), by imposing different assumptions on the model and applying a set of
appropriate estimators.
The paper is organized as follows. Section 2 discusses the existing differences in welfare systems
and empirical evidence on the labour productivity-labour institutions relationship. Section 3
describes the data and the econometric framework to derive our model specification and
assumptions. Section 4 reports tables of estimation results. Finally, section 5 concludes.
2. Labour Market Institutions, Productivity and Unemployment
2.1 Institutions across different countries
As said in the Introduction, labour market institutions are critical – together with some other
institutional features, the structure of the economy and the more general economic policies – in
shaping the performance of the labour markets. Almost two-thirds of non-cyclical unemployment
changes over time are explained by changes in policies and institutions (OECD, 2006). Recent
3 Current Euro zone includes 28 countries, but we needed to exclude those adopting the euro after 2010, and those
with too few observations on the variables as described in subsection 3.1. The number of countries of this group is
therefore 16. In further research, we will apply our empirical analysis to countries grouped according to their welfare
systems, as described in section 2.
4
research has confirmed the importance of labour market institutions.4 Notice that, although in
some studies general employment protection legislation (EPL) has not been found significant in
explaining the behaviour of total unemployment rates, this legislation appears more significant
for young workers than older workers; in fact, EPL (especially lay-off regulations) affects the
distribution and duration of unemployment by affecting worker turnover more than the
unemployment level itself (OECD, 2006).5
Labour market institutions may interact with cyclical economic conditions raising the
unemployment rate of young people. During economic crises, not only are the young who are
already in the labour market generally among the first to lose their jobs, especially in countries
with the highest EPL on “permanent contracts”, but also school-leavers compete with more
jobseekers for fewer vacancies; this leads to a risk of a “lost generation” (Scarpetta, Sonnet,
Manfredi, 2010).
However, in addition to labour market flexibility, active and passive labour policies, the
educational and training systems, the school-to-work transition processes play a key role for the
youth labour market performance. As a matter of fact, the unsatisfactory experience of
implementation of two-tier reforms has made the emphasis of the theoretical and empirical
studies shift away in recent research from the labour market flexibility as the key, or even
unique, policy tool to fight youth unemployment (Pastore, 2014).
Labour market institutions widely differ across countries and over time. In general, they have
become more “flexible” in the last twenty years; also because of the research carried out within
international organisations (see e.g. OECD’s Job Study, 1994). The trend has been especially
clear in the Anglo-Saxon countries, while in the countries of Southern Europe the previous
model of full protection provided to permanent workers has generally been preserved. An
interesting approach has developed in the countries of Central-Northern Europe, such as
Denmark and the Netherlands, i.e. the “flexicurity” approach. There, workers are protected “in
the market” rather than “on the job”, thanks to an efficient (and expensive for the public budget)
integration between active and passive labour policies. Germany introduced greater flexibility in
its labour market about ten years ago, due to the so-called “Hartz” reforms of 2003-2005. These
4 For example, Choudhry et al. (2013) have found that – in addition to economic growth and to a general index of
“economic freedom” – labour market reforms, a high share of part time employment, and active labour market
policies tend to reduce the unemployment rate. 5 Also Bernal-Verdugo et al. (2012) found that hiring and firing regulations and hiring costs have the strongest effect
on unemployment outcomes of young people.
5
reforms deal with some different issues such as cost of labour, unemployment benefits,
deregulation, etc. According to the critics, these reforms were an overturn of the previous “neo-
corporatist” model of industrial relations, where trade unions played a crucial role, but their
supporters emphasize the definite labour market performance (Krebs and Scheffel, 2013).6
On the other hand, countries in Southern Europe have introduced some flexibility in their labour
markets as well, but essentially in the form of new type of contracts – mainly temporary – with
lower guarantees for new entrants. This, for example, happened in Spain and later in Italy,
following the 1997 Treu reform and later the 2003 “Biagi” reform. Such reforms have indeed led
to an increase in employment (about one million new jobs created in the new century until the
2008 crisis), but they were low-quality jobs, often held by unskilled workers and in many cases
by immigrants (the overall productivity per worker has been almost stagnant in Italy even before
the crisis). These partial reforms have led, according to Boeri (2011), to a new form of dualism
in the labour market (see also European Commission, 2010, chapt. 3).
If we want to group the European countries7 in some specific categories according to their
(labour) institutional framework, we can refer to the well-known classification of welfare
systems by Esping-Andersen (1990). Then, we can add to this classification the Southern
European countries and the new member states (NMS) of the EU; such modified classification
has been adopted by many authors.8,9 Thus we can identify the following five groups of
countries, with specific features concerning labour market institutions and also the economic
structure as a whole (including educational and welfare systems):
1. Continental countries: they are characterized by highly productive industries and by a
“dual educational system”10, that is probably the most effective setting in ensuring a
smooth transition from schools and universities to the labour market. Germany
introduced new flexible norms in the last decade (as specified above).
6 In fact, even during the Great Recession, Germany is the only country where unemployment has decreased, despite
a large fall in production in 2009, thanks to working-time adjustments and other labour hoarding practices. 7 Outside Europe, the US (and perhaps Australia) are the best examples of “flexible” labour markets, while Japan
has some peculiar institutions, that only recently have become more flexible. 8 See for example Vogel (2002), Caroleo and Pastore (2007), Pastore (2014), Bruno et al. (2013). In the latter study,
differently from Caroleo and Pastore, France is included in the Continental group (instead of the Southern one) and
Denmark in the Northern group (instead of the Continental one); furthermore, the NMS comprise all countries that
joined the EU in 2004 and 2007, but Cyprus and Malta (added to the Southern regional group). 9 A different grouping of EU countries, into four clusters of countries (not necessarily contiguous from a
geographical point of view) is that of Eurofound (2012). 10 It gives a key role to apprenticeship and implies that young people receive training while at school and not after
school, as in the “sequential” system.
6
2. Northern (Scandinavian) countries (extending to Denmark and the Netherlands) adopt the
“flexicurity” model. They make the best use of the welfare state, of the extensive Active
Labour Market Policies (ALMP) and of the efficient system of employment services.
3. Anglo-Saxon countries (i.e. the “liberal” regime): the educational system is high-level;
extreme labour market flexibility encourages job creation (but during great economic
crises unemployment increases rapidly, although with a low degree of persistence).
4. Southern countries (France for many features should be included in this group): here the
role of the family is significant (in many cases it is a substitute for the welfare state, thus
young adults still live with their parents). The overall labour markets are still considered
rigid, but there has been a significant diffusion of temporary work.
5. New Member States: they are mostly characterized by dynamic economic systems and
catching-up processes; they are trying to build a modern welfare system, while keeping
the previous tradition of high investment in human capital. Labour market flexibility
varies across countries but is generally high.
As a first step, in this paper, we perform our estimations first by grouping countries according to
their level of economic and monetary development. Therefore, we are able to enlarge the set of
economies to analyse OECD and Russia, which clearly encompass heterogeneous countries from
the point of view of labour market institutions. Second, we will perform the analysis
distinguishing the welfare categories above, therefore restricting the number of countries to the
EU countries and the US.
2.2 Empirical evidence on institutions and productivity
Most research on the relationship between regulations, institutions and productivity relies on
cross-industry analyses, mostly for circumventing econometric caveats. Bassanini, Nunziata,
Venn (2009) studied the impact of regulations combination on the performance of industries in
OECD countries in terms of Total Factor Productivity growth. Their main finding is that
mandatory dismissal regulations have a depressing impact on TFP growth in industries where
layoff restrictions are more likely to be binding. “[…] In countries with rigid dismissal
regulations but lax legislation on the use of temporary contracts, firms can circumvent the
constraints imposed by lay-off restrictions by opening fixed-term positions. Countries can
therefore ‘choose’ different combinations of the two types of regulations and achieve similar
7
degrees of ‘aggregate flexibility’ as regards job flows and employment levels” (cit. page 39).
Regulatory choices might have different even opposing effects on productivity.
In a very similar spirit, Lisi (2013) exploited a panel of industry data for EU countries to find
that the use of temporary contracts has a negative, even if small in magnitude, effect on labour
productivity. Furthermore, the analysis confirms that EPL for regular contracts reduce labour
productivity growth more in those industries requiring a greater employment reallocation.
Cingano, Leonardi, Messina and Pica (2010) estimated the effect of EPL on capital per worker,
investment per worker and labour productivity at the firm level, for financially constrained and
unconstrained firms across different European countries. EPL reduces all of them in high
reallocation sectors relative to low reallocation sectors, where EPL is more stringent and
increases labour costs. The magnitude of the effect is economically not negligible and lies
around 11.2%, 11.4% and 7% of the difference in, respectively, the capital-labour ratio, the
intensive margin of investment per worker and labour productivity, of high relative to low
reallocation industries. Moreover, firms with insufficient access to credit in high EPL
environments are unable to substitute the relative expensive factor, labour, for capital.
Consequently, the negative effect of EPL on productivity is reinforced among firms that are
financially constrained.
In Italy, temporary job contracts have been the main channel to hire young workers under 29
years old, especially after 2001 (see e.g. Daveri and Parisi, 2014). Daveri and Parisi find that a
higher share of temporary work has a detrimental effect on TFP long-run growth for both
innovative and non-innovative firms.
Cappellari, Dell’Aringa and Leonardi (2012) evaluate the effect of two reforms of temporary
contracts in the Italian labour market on capital-labour substitution and productivity, using micro
level data in the 2000s. They find that reforming the use of fixed-term contracts (more
flexibility) eventually reduced firm-level productivity because of the uncertainty in interpretation
of the norms, while reforming the use of apprenticeship increased the turnover of workers and
lowered employment adjustment costs for firms, inducing a higher growth in productivity.
With an eye on the supply side, and using individual workers data for Russian Federation,
Karabchuk (2012) examined wage differentials between permanent/non-permanent and full-
time/part-time employees. Her results show that non-permanent workers suffer a loss in wages,
while part-timers earn more per hour than full-timers, but the wage gap diminishes substantially
8
when controlling for observed and non-observed individual characteristics. It seems that the
theory of segmented labour markets is quite appropriate for explaining these differences in the
Russian labour market.
3. Data and econometric framework
3.1 Data description
Macro data on permanent and temporary work, employment protection, R&D expenditure,
Current Account, Youth Unemployment and Unemployment rates come from OECD databases.
Labour Productivity of each country is calculated as the ratio between GDP in millions of US$ -
at constant prices, constant PPP – over total employment.
The share of young permanent and temporary workers in age 15-24 over total dependent workers
(SHP1524 and SHT1524 respectively), the share of adult permanent and temporary workers over
total dependent workers in age 25-54 (SHP2554 and SHT2554, respectively) are found in
OECD.Stat “Employment by Permanency of the Job”.
The OECD indicators of employment protection (EPL) are synthetic indicators of the strictness
of regulation on dismissals and the use of temporary contracts (EPLT). For each year, indicators
refer to regulation in force on the 1st of January.11 The indicators are measured on a 0-6 scale.
Low values of the index are associated to low protection.
The variables related to human capital are the percentage of adult population at tertiary education
level (EDUTER); the percentage of population with secondary education (SECEDU) both from
OECD IPPStat database; R&D personnel per thousand total employment (RDL, OECD Skills for
innovation database).
General R&D expenditure (GERD), Business Expenditure on R&D (BERD), as a percentage of
GDP, and Gross Domestic R&D Expenditure (RDT, measured in millions 2005 dollars, constant
prices and PPP, total intramural, total funding), come from the “OECD main S&T indicators”
database. Trade balance (NX) comes from the OECD Shot-term Economic Indicators and from
IMF World Economic Indicators.
Unemployment rates and Youth Unemployment rates are those in IMF National Accounts.
11 For more information and full methodology, see www.oecd.org/employment/protection. For download,
OECD.Stat.
9
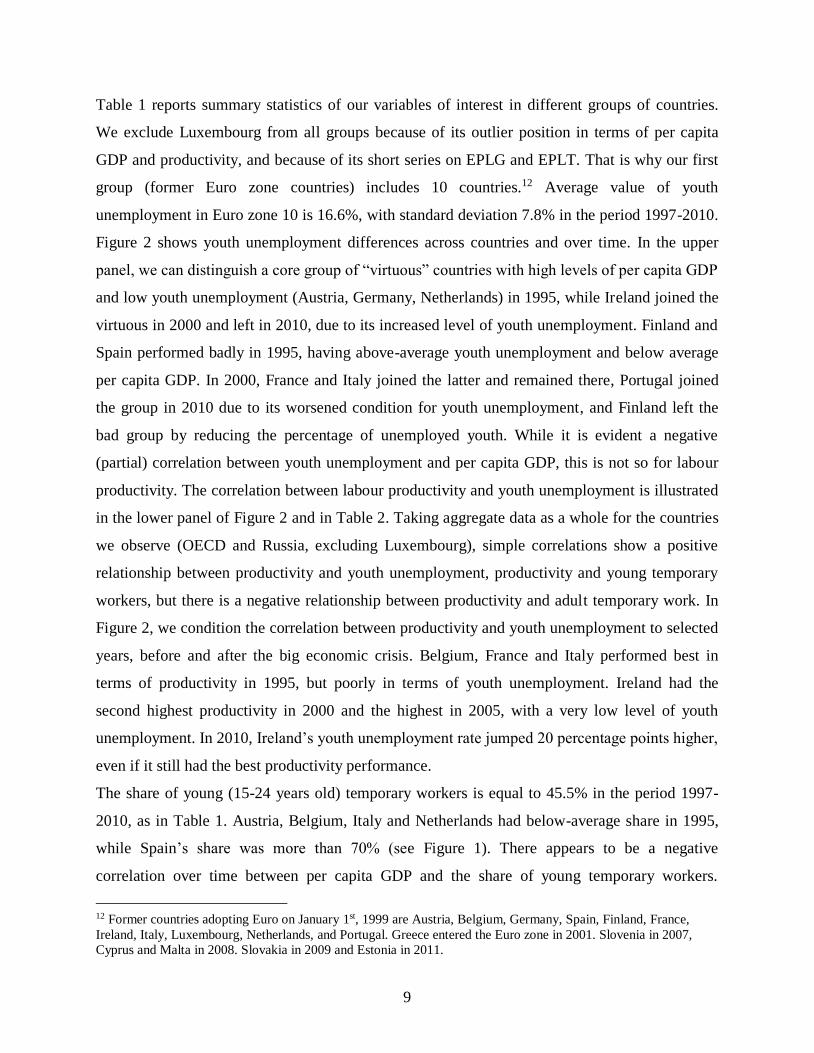
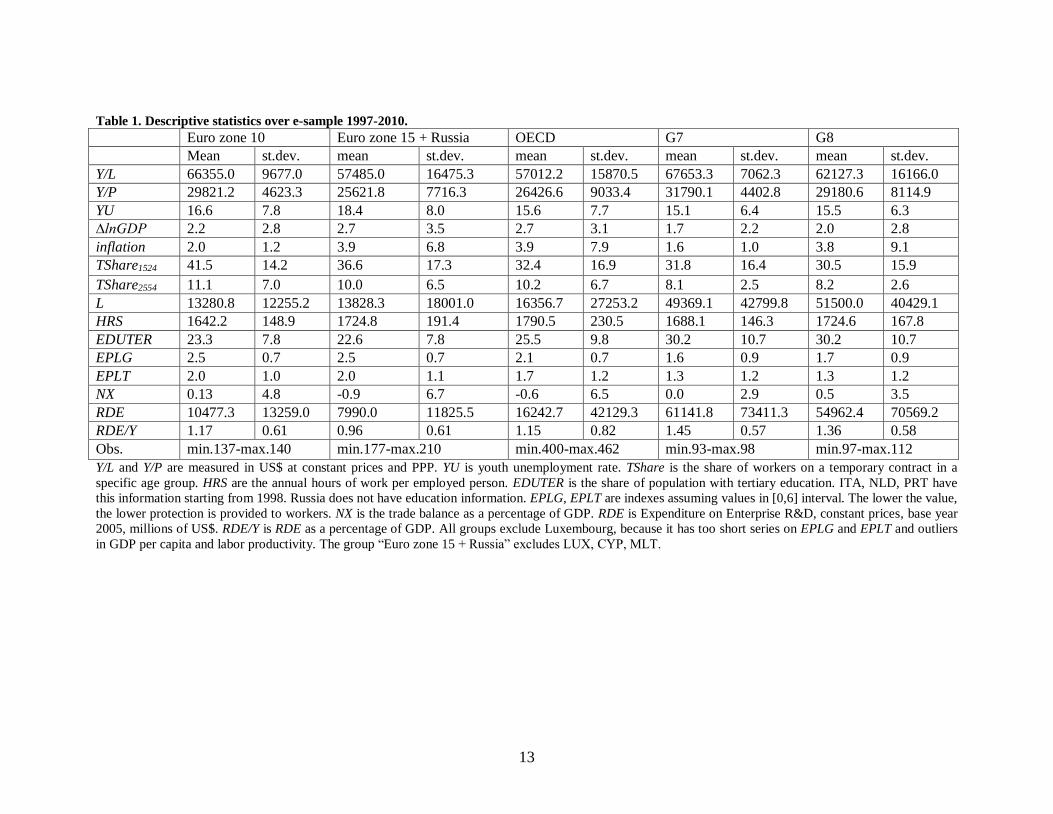
Table 1 reports summary statistics of our variables of interest in different groups of countries.
We exclude Luxembourg from all groups because of its outlier position in terms of per capita
GDP and productivity, and because of its short series on EPLG and EPLT. That is why our first
group (former Euro zone countries) includes 10 countries.12 Average value of youth
unemployment in Euro zone 10 is 16.6%, with standard deviation 7.8% in the period 1997-2010.
Figure 2 shows youth unemployment differences across countries and over time. In the upper
panel, we can distinguish a core group of “virtuous” countries with high levels of per capita GDP
and low youth unemployment (Austria, Germany, Netherlands) in 1995, while Ireland joined the
virtuous in 2000 and left in 2010, due to its increased level of youth unemployment. Finland and
Spain performed badly in 1995, having above-average youth unemployment and below average
per capita GDP. In 2000, France and Italy joined the latter and remained there, Portugal joined
the group in 2010 due to its worsened condition for youth unemployment, and Finland left the
bad group by reducing the percentage of unemployed youth. While it is evident a negative
(partial) correlation between youth unemployment and per capita GDP, this is not so for labour
productivity. The correlation between labour productivity and youth unemployment is illustrated
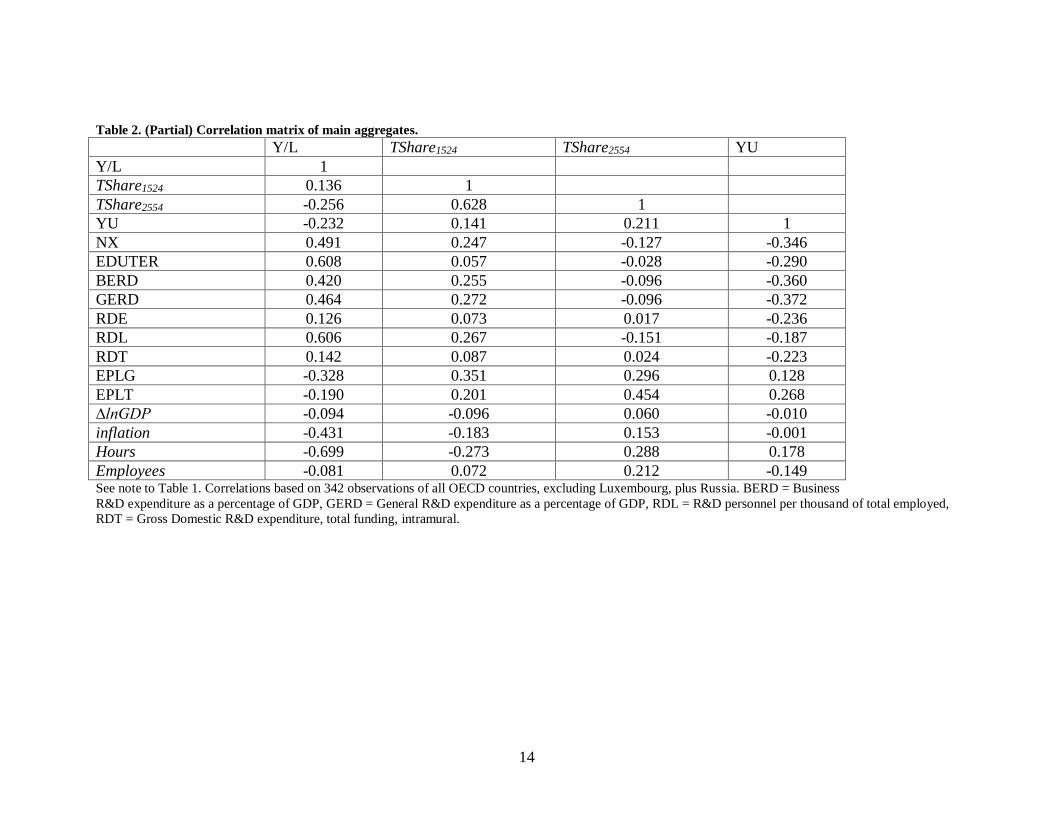
in the lower panel of Figure 2 and in Table 2. Taking aggregate data as a whole for the countries
we observe (OECD and Russia, excluding Luxembourg), simple correlations show a positive
relationship between productivity and youth unemployment, productivity and young temporary
workers, but there is a negative relationship between productivity and adult temporary work. In
Figure 2, we condition the correlation between productivity and youth unemployment to selected
years, before and after the big economic crisis. Belgium, France and Italy performed best in
terms of productivity in 1995, but poorly in terms of youth unemployment. Ireland had the
second highest productivity in 2000 and the highest in 2005, with a very low level of youth
unemployment. In 2010, Ireland’s youth unemployment rate jumped 20 percentage points higher,
even if it still had the best productivity performance.
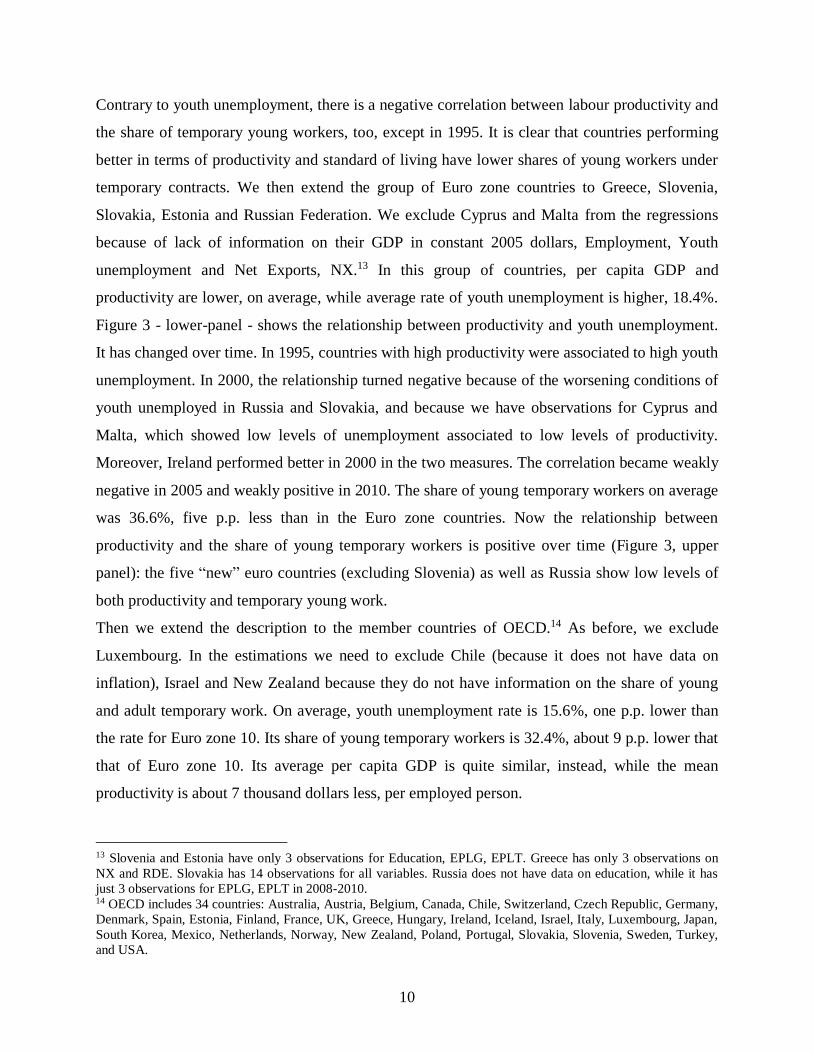
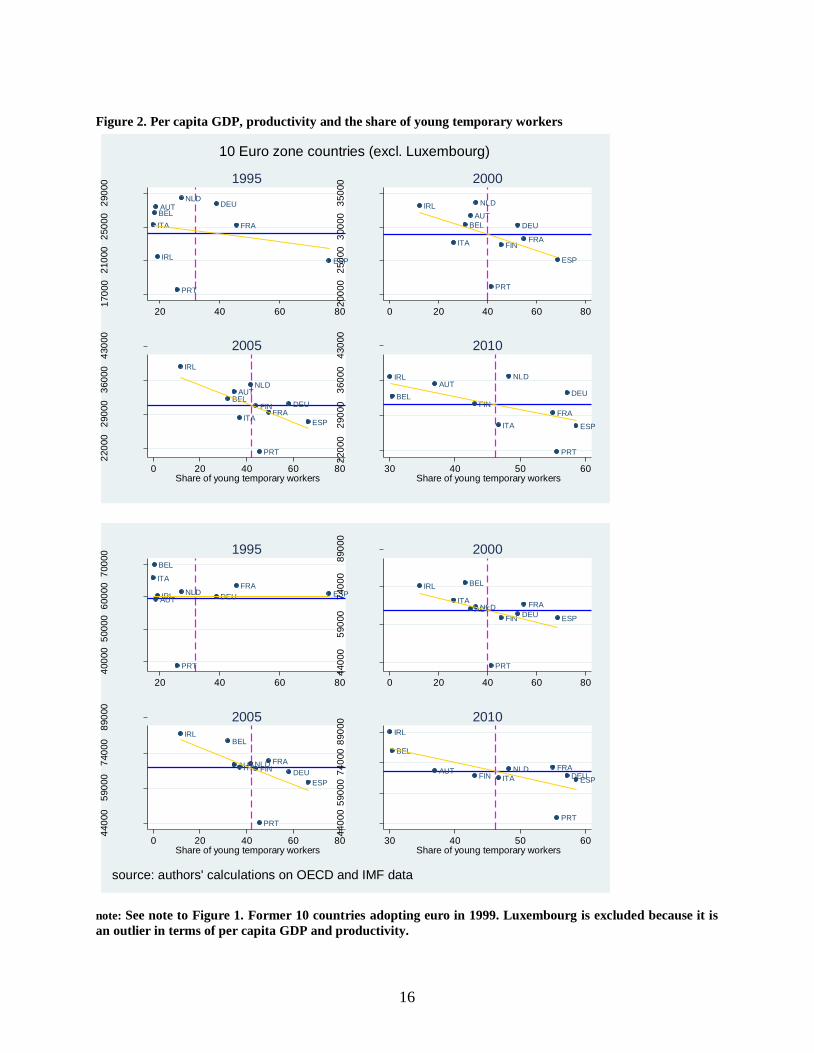
The share of young (15-24 years old) temporary workers is equal to 45.5% in the period 1997-
2010, as in Table 1. Austria, Belgium, Italy and Netherlands had below-average share in 1995,
while Spain’s share was more than 70% (see Figure 1). There appears to be a negative
correlation over time between per capita GDP and the share of young temporary workers.
12 Former countries adopting Euro on January 1st, 1999 are Austria, Belgium, Germany, Spain, Finland, France,
Ireland, Italy, Luxembourg, Netherlands, and Portugal. Greece entered the Euro zone in 2001. Slovenia in 2007,
Cyprus and Malta in 2008. Slovakia in 2009 and Estonia in 2011.
10
Contrary to youth unemployment, there is a negative correlation between labour productivity and
the share of temporary young workers, too, except in 1995. It is clear that countries performing
better in terms of productivity and standard of living have lower shares of young workers under
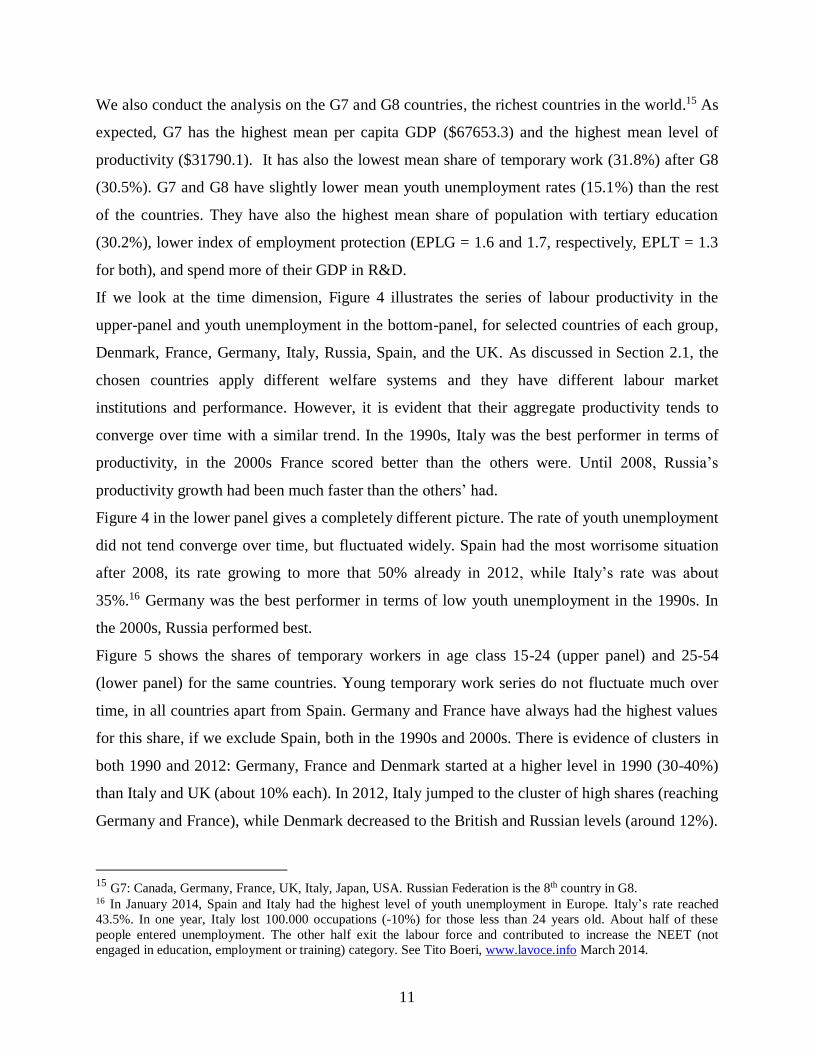
temporary contracts. We then extend the group of Euro zone countries to Greece, Slovenia,
Slovakia, Estonia and Russian Federation. We exclude Cyprus and Malta from the regressions
because of lack of information on their GDP in constant 2005 dollars, Employment, Youth
unemployment and Net Exports, NX.13 In this group of countries, per capita GDP and
productivity are lower, on average, while average rate of youth unemployment is higher, 18.4%.
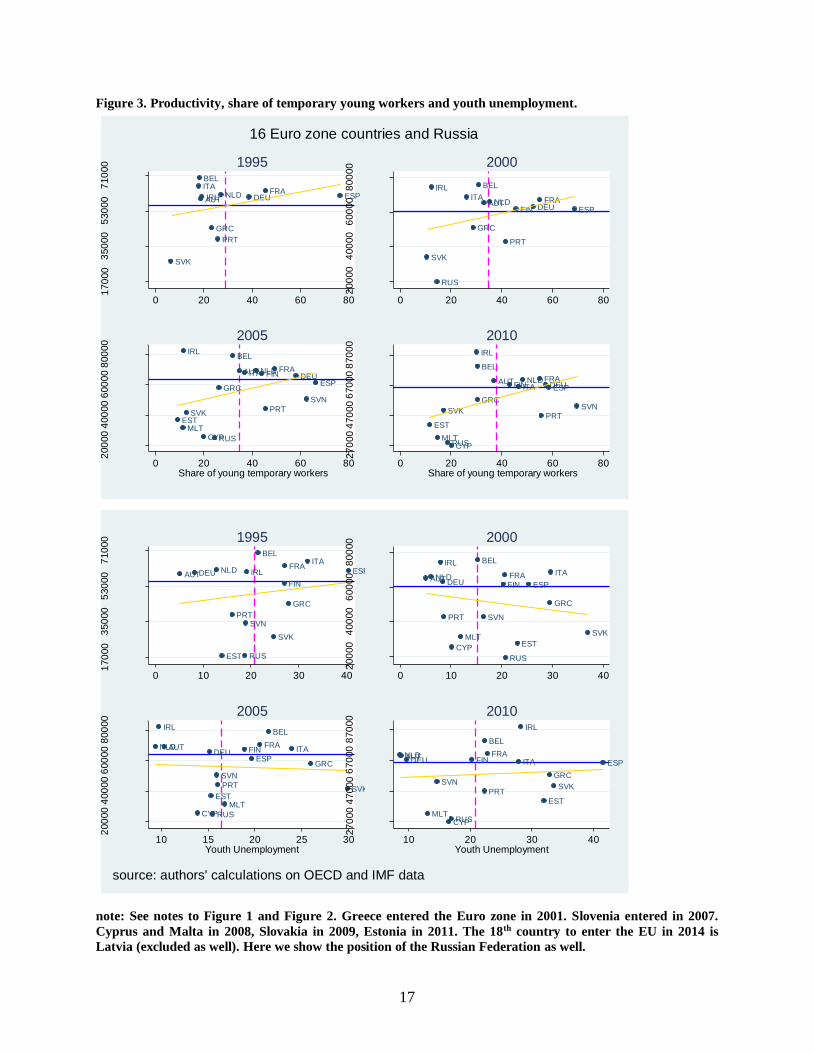
Figure 3 - lower-panel - shows the relationship between productivity and youth unemployment.
It has changed over time. In 1995, countries with high productivity were associated to high youth
unemployment. In 2000, the relationship turned negative because of the worsening conditions of
youth unemployed in Russia and Slovakia, and because we have observations for Cyprus and
Malta, which showed low levels of unemployment associated to low levels of productivity.
Moreover, Ireland performed better in 2000 in the two measures. The correlation became weakly
negative in 2005 and weakly positive in 2010. The share of young temporary workers on average
was 36.6%, five p.p. less than in the Euro zone countries. Now the relationship between
productivity and the share of young temporary workers is positive over time (Figure 3, upper
panel): the five “new” euro countries (excluding Slovenia) as well as Russia show low levels of
both productivity and temporary young work.
Then we extend the description to the member countries of OECD.14 As before, we exclude
Luxembourg. In the estimations we need to exclude Chile (because it does not have data on
inflation), Israel and New Zealand because they do not have information on the share of young
and adult temporary work. On average, youth unemployment rate is 15.6%, one p.p. lower than
the rate for Euro zone 10. Its share of young temporary workers is 32.4%, about 9 p.p. lower that
that of Euro zone 10. Its average per capita GDP is quite similar, instead, while the mean
productivity is about 7 thousand dollars less, per employed person.
13 Slovenia and Estonia have only 3 observations for Education, EPLG, EPLT. Greece has only 3 observations on
NX and RDE. Slovakia has 14 observations for all variables. Russia does not have data on education, while it has
just 3 observations for EPLG, EPLT in 2008-2010. 14 OECD includes 34 countries: Australia, Austria, Belgium, Canada, Chile, Switzerland, Czech Republic, Germany,
Denmark, Spain, Estonia, Finland, France, UK, Greece, Hungary, Ireland, Iceland, Israel, Italy, Luxembourg, Japan,
South Korea, Mexico, Netherlands, Norway, New Zealand, Poland, Portugal, Slovakia, Slovenia, Sweden, Turkey,
and USA.
11
We also conduct the analysis on the G7 and G8 countries, the richest countries in the world.15 As
expected, G7 has the highest mean per capita GDP ($67653.3) and the highest mean level of
productivity ($31790.1). It has also the lowest mean share of temporary work (31.8%) after G8
(30.5%). G7 and G8 have slightly lower mean youth unemployment rates (15.1%) than the rest
of the countries. They have also the highest mean share of population with tertiary education
(30.2%), lower index of employment protection (EPLG = 1.6 and 1.7, respectively, EPLT = 1.3
for both), and spend more of their GDP in R&D.
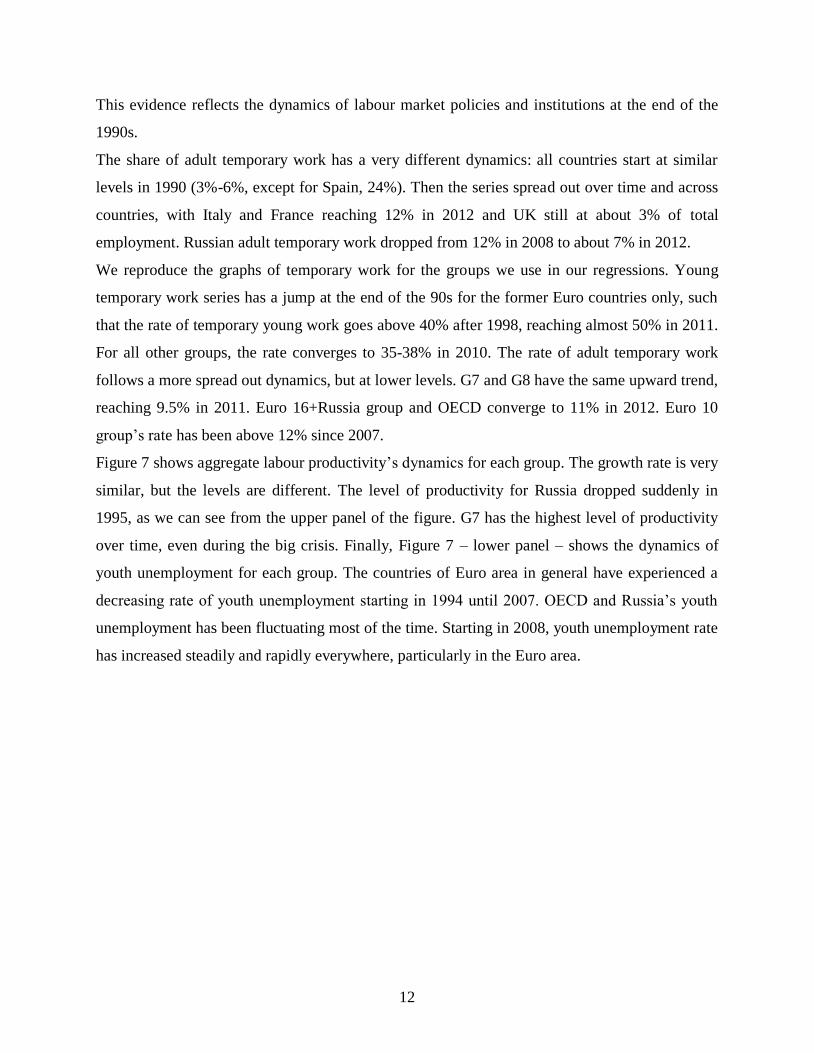
If we look at the time dimension, Figure 4 illustrates the series of labour productivity in the
upper-panel and youth unemployment in the bottom-panel, for selected countries of each group,
Denmark, France, Germany, Italy, Russia, Spain, and the UK. As discussed in Section 2.1, the
chosen countries apply different welfare systems and they have different labour market
institutions and performance. However, it is evident that their aggregate productivity tends to
converge over time with a similar trend. In the 1990s, Italy was the best performer in terms of
productivity, in the 2000s France scored better than the others were. Until 2008, Russia’s
productivity growth had been much faster than the others’ had.
Figure 4 in the lower panel gives a completely different picture. The rate of youth unemployment
did not tend converge over time, but fluctuated widely. Spain had the most worrisome situation
after 2008, its rate growing to more that 50% already in 2012, while Italy’s rate was about
35%.16 Germany was the best performer in terms of low youth unemployment in the 1990s. In
the 2000s, Russia performed best.
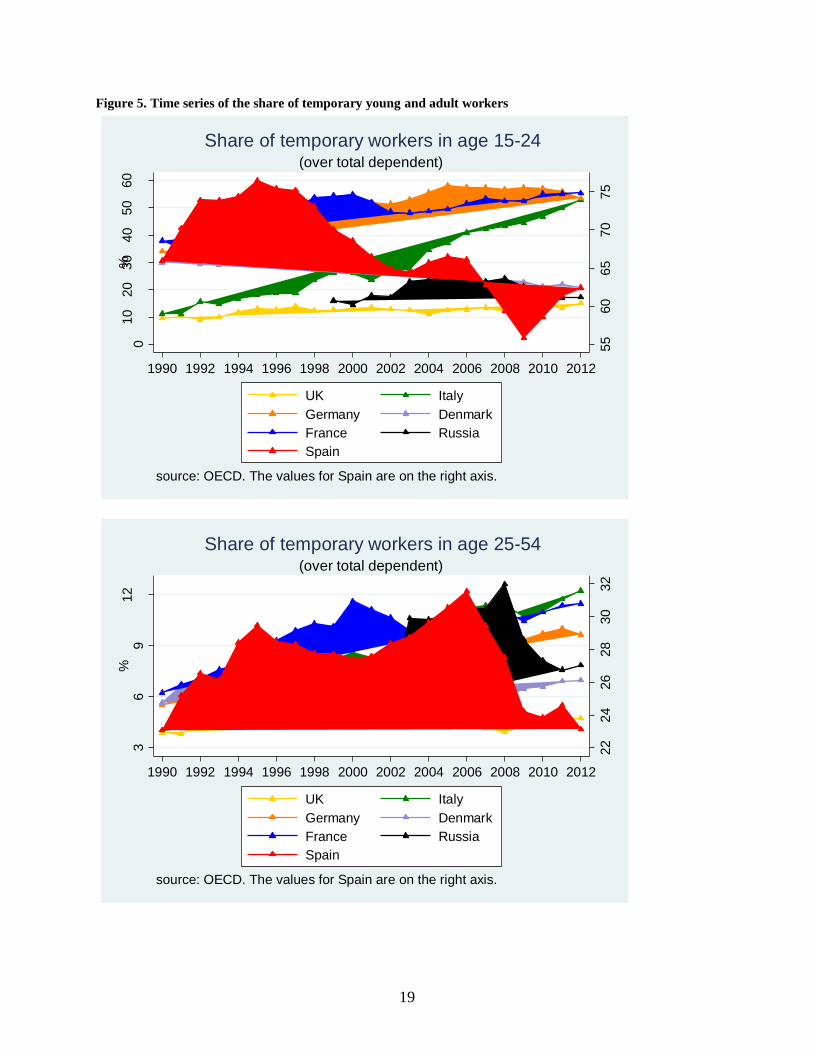
Figure 5 shows the shares of temporary workers in age class 15-24 (upper panel) and 25-54
(lower panel) for the same countries. Young temporary work series do not fluctuate much over
time, in all countries apart from Spain. Germany and France have always had the highest values
for this share, if we exclude Spain, both in the 1990s and 2000s. There is evidence of clusters in
both 1990 and 2012: Germany, France and Denmark started at a higher level in 1990 (30-40%)
than Italy and UK (about 10% each). In 2012, Italy jumped to the cluster of high shares (reaching
Germany and France), while Denmark decreased to the British and Russian levels (around 12%).
15 G7: Canada, Germany, France, UK, Italy, Japan, USA. Russian Federation is the 8th country in G8. 16 In January 2014, Spain and Italy had the highest level of youth unemployment in Europe. Italy’s rate reached
43.5%. In one year, Italy lost 100.000 occupations (-10%) for those less than 24 years old. About half of these
people entered unemployment. The other half exit the labour force and contributed to increase the NEET (not
engaged in education, employment or training) category. See Tito Boeri, www.lavoce.info March 2014.
12
This evidence reflects the dynamics of labour market policies and institutions at the end of the
1990s.
The share of adult temporary work has a very different dynamics: all countries start at similar
levels in 1990 (3%-6%, except for Spain, 24%). Then the series spread out over time and across
countries, with Italy and France reaching 12% in 2012 and UK still at about 3% of total
employment. Russian adult temporary work dropped from 12% in 2008 to about 7% in 2012.
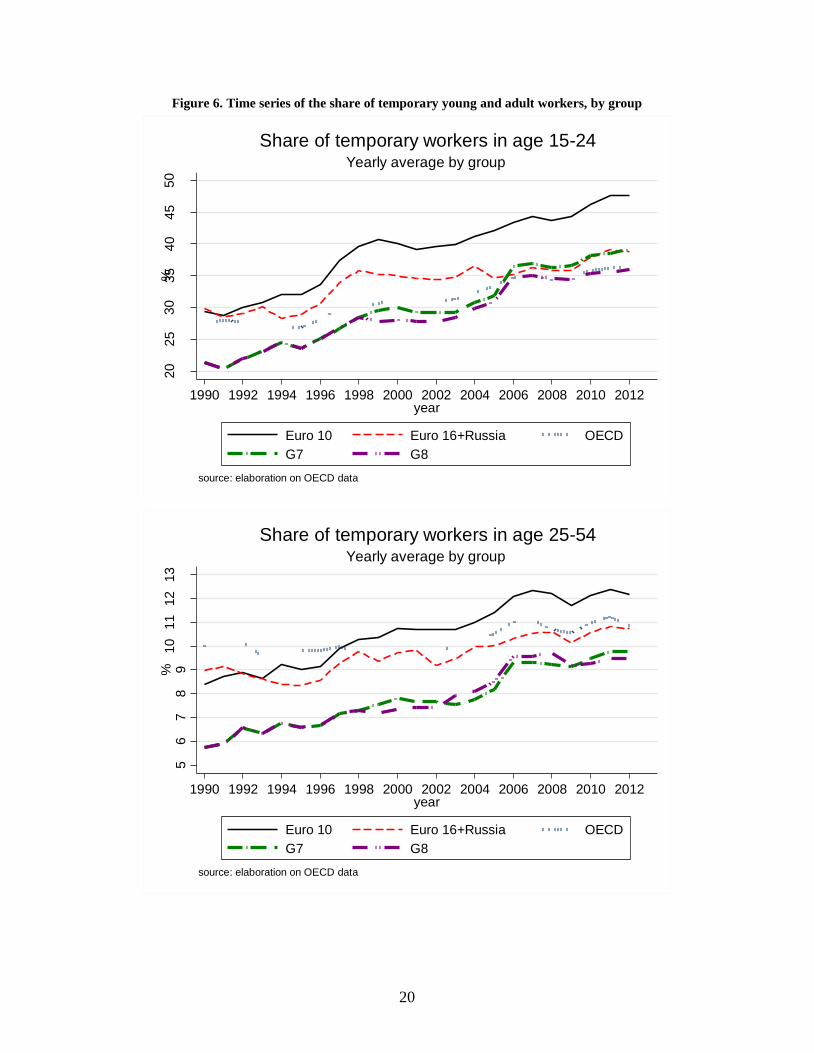
We reproduce the graphs of temporary work for the groups we use in our regressions. Young
temporary work series has a jump at the end of the 90s for the former Euro countries only, such
that the rate of temporary young work goes above 40% after 1998, reaching almost 50% in 2011.
For all other groups, the rate converges to 35-38% in 2010. The rate of adult temporary work
follows a more spread out dynamics, but at lower levels. G7 and G8 have the same upward trend,
reaching 9.5% in 2011. Euro 16+Russia group and OECD converge to 11% in 2012. Euro 10
group’s rate has been above 12% since 2007.
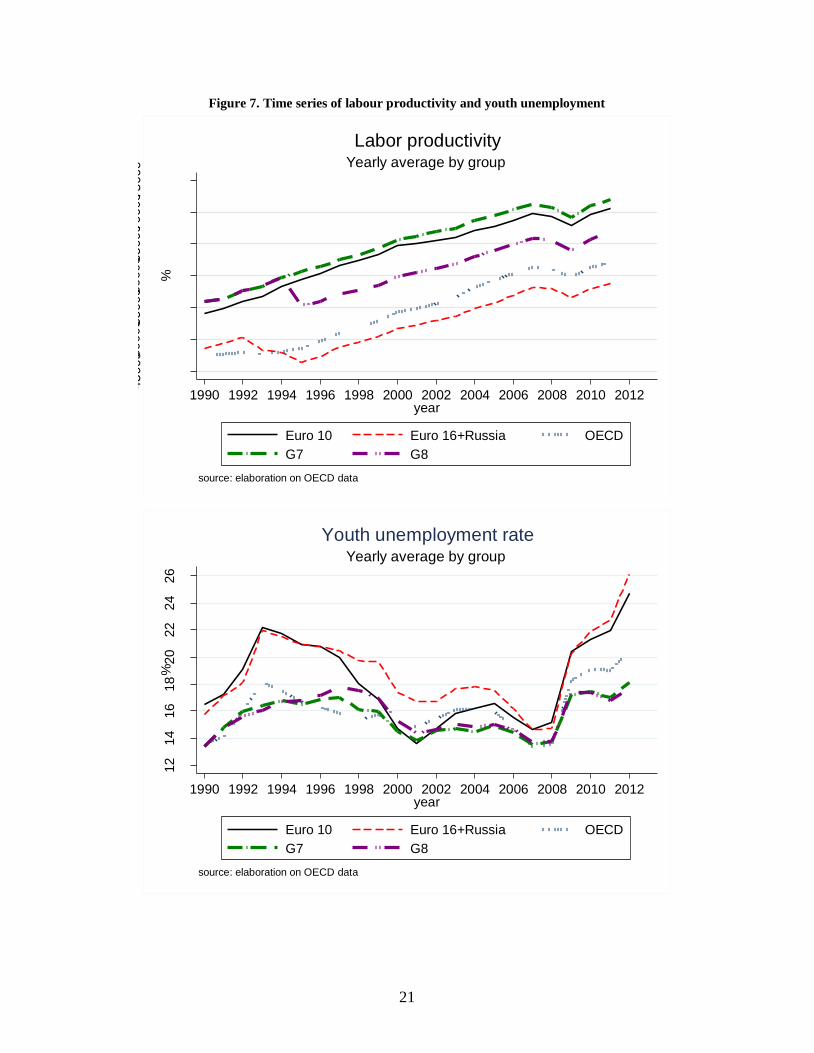
Figure 7 shows aggregate labour productivity’s dynamics for each group. The growth rate is very
similar, but the levels are different. The level of productivity for Russia dropped suddenly in
1995, as we can see from the upper panel of the figure. G7 has the highest level of productivity
over time, even during the big crisis. Finally, Figure 7 – lower panel – shows the dynamics of
youth unemployment for each group. The countries of Euro area in general have experienced a
decreasing rate of youth unemployment starting in 1994 until 2007. OECD and Russia’s youth
unemployment has been fluctuating most of the time. Starting in 2008, youth unemployment rate
has increased steadily and rapidly everywhere, particularly in the Euro area.
13
Table 1. Descriptive statistics over e-sample 1997-2010.
Euro zone 10 Euro zone 15 + Russia OECD G7 G8
Mean st.dev. mean st.dev. mean st.dev. mean st.dev. mean st.dev.
Y/L 66355.0 9677.0 57485.0 16475.3 57012.2 15870.5 67653.3 7062.3 62127.3 16166.0
Y/P 29821.2 4623.3 25621.8 7716.3 26426.6 9033.4 31790.1 4402.8 29180.6 8114.9
YU 16.6 7.8 18.4 8.0 15.6 7.7 15.1 6.4 15.5 6.3
∆lnGDP 2.2 2.8 2.7 3.5 2.7 3.1 1.7 2.2 2.0 2.8
inflation 2.0 1.2 3.9 6.8 3.9 7.9 1.6 1.0 3.8 9.1
TShare1524 41.5 14.2 36.6 17.3 32.4 16.9 31.8 16.4 30.5 15.9
TShare2554 11.1 7.0 10.0 6.5 10.2 6.7 8.1 2.5 8.2 2.6
L 13280.8 12255.2 13828.3 18001.0 16356.7 27253.2 49369.1 42799.8 51500.0 40429.1
HRS 1642.2 148.9 1724.8 191.4 1790.5 230.5 1688.1 146.3 1724.6 167.8
EDUTER 23.3 7.8 22.6 7.8 25.5 9.8 30.2 10.7 30.2 10.7
EPLG 2.5 0.7 2.5 0.7 2.1 0.7 1.6 0.9 1.7 0.9
EPLT 2.0 1.0 2.0 1.1 1.7 1.2 1.3 1.2 1.3 1.2
NX 0.13 4.8 -0.9 6.7 -0.6 6.5 0.0 2.9 0.5 3.5
RDE 10477.3 13259.0 7990.0 11825.5 16242.7 42129.3 61141.8 73411.3 54962.4 70569.2
RDE/Y 1.17 0.61 0.96 0.61 1.15 0.82 1.45 0.57 1.36 0.58
Obs. min.137-max.140 min.177-max.210 min.400-max.462 min.93-max.98 min.97-max.112
Y/L and Y/P are measured in US$ at constant prices and PPP. YU is youth unemployment rate. TShare is the share of workers on a temporary contract in a
specific age group. HRS are the annual hours of work per employed person. EDUTER is the share of population with tertiary education. ITA, NLD, PRT have
this information starting from 1998. Russia does not have education information. EPLG, EPLT are indexes assuming values in [0,6] interval. The lower the value,
the lower protection is provided to workers. NX is the trade balance as a percentage of GDP. RDE is Expenditure on Enterprise R&D, constant prices, base year
2005, millions of US$. RDE/Y is RDE as a percentage of GDP. All groups exclude Luxembourg, because it has too short series on EPLG and EPLT and outliers
in GDP per capita and labor productivity. The group “Euro zone 15 + Russia” excludes LUX, CYP, MLT.
14
Table 2. (Partial) Correlation matrix of main aggregates.
Y/L TShare1524 TShare2554 YU
Y/L 1
TShare1524 0.136 1
TShare2554 -0.256 0.628 1
YU -0.232 0.141 0.211 1
NX 0.491 0.247 -0.127 -0.346
EDUTER 0.608 0.057 -0.028 -0.290
BERD 0.420 0.255 -0.096 -0.360
GERD 0.464 0.272 -0.096 -0.372
RDE 0.126 0.073 0.017 -0.236
RDL 0.606 0.267 -0.151 -0.187
RDT 0.142 0.087 0.024 -0.223
EPLG -0.328 0.351 0.296 0.128
EPLT -0.190 0.201 0.454 0.268
∆lnGDP -0.094 -0.096 0.060 -0.010
inflation -0.431 -0.183 0.153 -0.001
Hours -0.699 -0.273 0.288 0.178
Employees -0.081 0.072 0.212 -0.149 See note to Table 1. Correlations based on 342 observations of all OECD countries, excluding Luxembourg, plus Russia. BERD = Business
R&D expenditure as a percentage of GDP, GERD = General R&D expenditure as a percentage of GDP, RDL = R&D personnel per thousand of total employed,
RDT = Gross Domestic R&D expenditure, total funding, intramural.
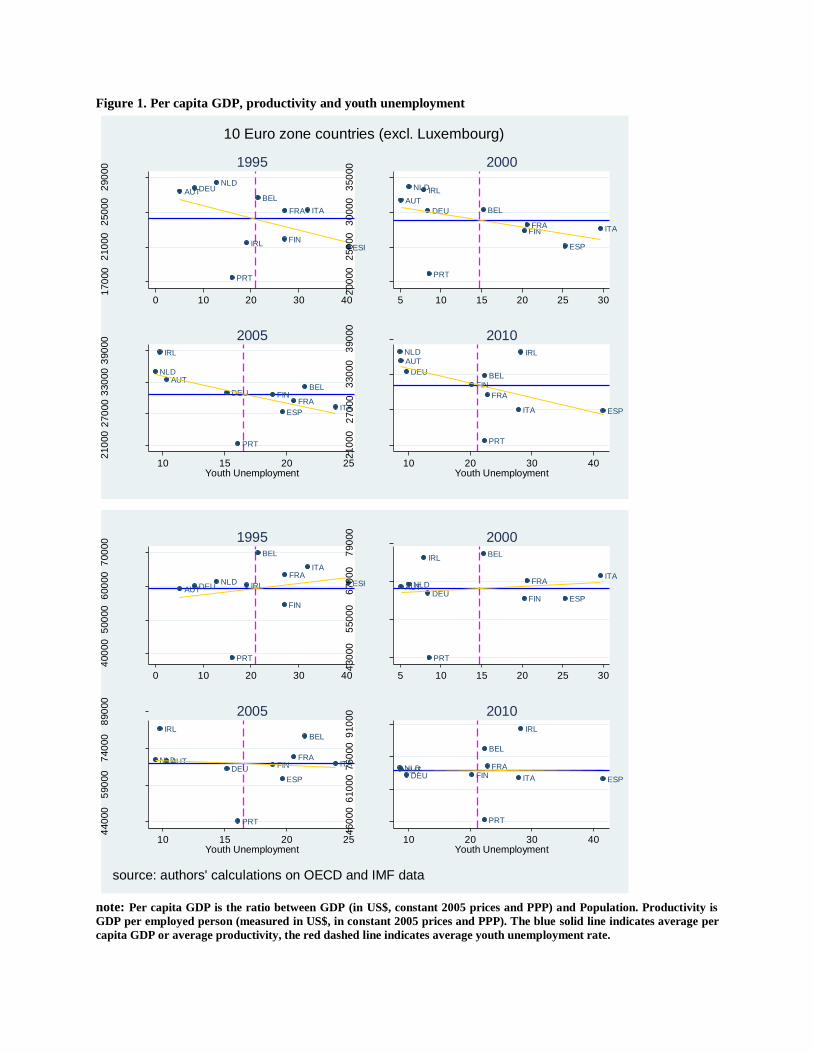
Figure 1. Per capita GDP, productivity and youth unemployment
AUTBEL
DEU
ESPFIN
FRA
IRL
ITA
NLD
PRT
170
00
210
00
250
00
290
00
Per
cap
ita G
DP
0 10 20 30 40
1995
AUT
BELDEU
ESP
FINFRA
IRL
ITA
NLD
PRT
200
00
250
00
300
00
350
00
5 10 15 20 25 30
2000
AUTBEL
DEU
ESP
FINFRA
IRL
ITA
NLD
PRT
210
00
270
00
330
00
390
00
Per
cap
ita G
DP
10 15 20 25Youth Unemployment
2005
AUT
BELDEU
ESP
FIN
FRA
IRL
ITA
NLD
PRT
210
00
270
00
330
00
390
00
10 20 30 40Youth Unemployment
2010
10 Euro zone countries (excl. Luxembourg)
AUT
BEL
DEU ESP
FIN
FRA
IRL
ITA
NLD
PRT
400
00
500
00
600
00
700
00
Lab
or
pro
ductivity
0 10 20 30 40
1995
AUT
BEL
DEUESPFIN
FRA
IRL
ITANLD
PRT
430
00
550
00
670
00
790
00
5 10 15 20 25 30
2000
AUT
BEL
DEU
ESP
FINFRA
IRL
ITANLD
PRT
440
00
590
00
740
00
890
00
Lab
or
pro
ductivity
10 15 20 25Youth Unemployment
2005
AUT
BEL
DEUESP
FINFRA
IRL
ITA
NLD
PRT
460
00
610
00
760
00
910
00
10 20 30 40Youth Unemployment
2010
source: authors' calculations on OECD and IMF data
note: Per capita GDP is the ratio between GDP (in US$, constant 2005 prices and PPP) and Population. Productivity is
GDP per employed person (measured in US$, in constant 2005 prices and PPP). The blue solid line indicates average per
capita GDP or average productivity, the red dashed line indicates average youth unemployment rate.
16
Figure 2. Per capita GDP, productivity and the share of young temporary workers
AUTBEL
DEU
ESP
FRA
IRL
ITA
NLD
PRT
170
00
210
00
250
00
290
00
Per
cap
ita G
DP
20 40 60 80
1995
AUT
BEL DEU
ESP
FINFRA
IRL
ITA
NLD
PRT
200
00
250
00
300
00
350
00
0 20 40 60 80
2000
AUTBEL
DEU
ESP
FINFRA
IRL
ITA
NLD
PRT
220
00
290
00
360
00
430
00
Per
cap
ita G
DP
0 20 40 60 80Share of young temporary workers
2005
AUT
BEL DEU
ESP
FINFRA
IRL
ITA
NLD
PRT
220
00
290
00
360
00
430
00
30 40 50 60Share of young temporary workers
2010
10 Euro zone countries (excl. Luxembourg)
AUT
BEL
DEU ESPFRA
IRL
ITA
NLD
PRT
400
00
500
00
600
00
700
00
Lab
or
pro
ductivity
20 40 60 80
1995
AUT
BEL
DEUESPFIN
FRA
IRL
ITANLD
PRT
440
00
590
00
740
00
890
00
0 20 40 60 80
2000
AUT
BEL
DEU
ESP
FINFRA
IRL
ITANLD
PRT
440
00
590
00
740
00
890
00
Lab
or
pro
ductivity
0 20 40 60 80Share of young temporary workers
2005
AUT
BEL
DEUESP
FINFRA
IRL
ITA
NLD
PRT
440
00
590
00
740
00
890
00
30 40 50 60Share of young temporary workers
2010
source: authors' calculations on OECD and IMF data
note: See note to Figure 1. Former 10 countries adopting euro in 1999. Luxembourg is excluded because it is
an outlier in terms of per capita GDP and productivity.
17
Figure 3. Productivity, share of temporary young workers and youth unemployment.
AUT
BEL
DEU ESPFRA
GRC
IRL
ITANLD
PRT
SVK
170
00
350
00
530
00
710
00
Lab
or
pro
ductivity
0 20 40 60 80
1995
AUT
BEL
DEU ESPFIN
FRA
GRC
IRL
ITANLD
PRT
RUS
SVK
200
00
400
00
600
00
800
00
0 20 40 60 80
2000
AUT
BEL
CYP
DEUESP
EST
FINFRA
GRC
IRL
ITA
MLT
NLD
PRT
RUS
SVK
SVN
200
00
400
00
600
00
800
00
Lab
or
pro
ductivity
0 20 40 60 80Share of young temporary workers
2005
AUT
BEL
CYP
DEUESP
EST
FINFRA
GRC
IRL
ITA
MLT
NLD
PRT
RUS
SVKSVN
270
00
470
00
670
00
870
00
0 20 40 60 80Share of young temporary workers
2010
16 Euro zone countries and Russia
AUT
BEL
DEU ESP
EST
FIN
FRA
GRC
IRL
ITANLD
PRT
RUS
SVK
SVN
170
00
350
00
530
00
710
00
Lab
or
pro
ductivity
0 10 20 30 40
1995
AUT
BEL
CYP
DEU ESP
EST
FINFRA
GRC
IRL
ITA
MLT
NLD
PRT
RUS
SVK
SVN
200
00
400
00
600
00
800
00
0 10 20 30 40
2000
AUT
BEL
CYP
DEUESP
EST
FINFRA
GRC
IRL
ITA
MLT
NLD
PRT
RUS
SVK
SVN
200
00
400
00
600
00
800
00
Lab
or
pro
ductivity
10 15 20 25 30Youth Unemployment
2005
AUT
BEL
CYP
DEU ESP
EST
FINFRA
GRC
IRL
ITA
MLT
NLD
PRT
RUS
SVKSVN
270
00
470
00
670
00
870
00
10 20 30 40Youth Unemployment
2010
source: authors' calculations on OECD and IMF data
note: See notes to Figure 1 and Figure 2. Greece entered the Euro zone in 2001. Slovenia entered in 2007.
Cyprus and Malta in 2008, Slovakia in 2009, Estonia in 2011. The 18th country to enter the EU in 2014 is
Latvia (excluded as well). Here we show the position of the Russian Federation as well.

18
Figure 4. Time series of labour productivity and youth unemployment
18
20
22
24
26
28
30
'000 U
S$
50
55
60
65
70
75
'000 U
S$
1990 1992 1994 1996 1998 2000 2002 2004 2006 2008 2010 2012
UK Italy
Germany Denmark
France Spain
Russia
Thousand US dollars per employed person (constant PPP prices).
Russia scale on the right axis.
Labor productivity across countries
20
30
40
50
60
Sp
ain
and I
taly
7.5
12
.51
7.5
22
.52
7.5
510
15
20
25
30
un
em
plo
ym
ent
rate
%
1990 1992 1994 1996 1998 2000 2002 2004 2006 2008 2010 2012
UK Italy
Germany Denmark
France Russia
Spain
Spain and Italy's unemployment on the right axis.
(15-24 years old)
Youth unemployment rate
19
Figure 5. Time series of the share of temporary young and adult workers
55
60
65
70
75
010
20
30
40
50
60
%
1990 1992 1994 1996 1998 2000 2002 2004 2006 2008 2010 2012
UK Italy
Germany Denmark
France Russia
Spain
source: OECD. The values for Spain are on the right axis.
(over total dependent)
Share of temporary workers in age 15-24
22
24
26
28
30
32
36
912
%
1990 1992 1994 1996 1998 2000 2002 2004 2006 2008 2010 2012
UK Italy
Germany Denmark
France Russia
Spain
source: OECD. The values for Spain are on the right axis.
(over total dependent)
Share of temporary workers in age 25-54
20
Figure 6. Time series of the share of temporary young and adult workers, by group
20
25
30
35
40
45
50
%
1990 1992 1994 1996 1998 2000 2002 2004 2006 2008 2010 2012year
Euro 10 Euro 16+Russia OECD
G7 G8
source: elaboration on OECD data
Yearly average by group
Share of temporary workers in age 15-24
56
78
910
11
12
13
%
1990 1992 1994 1996 1998 2000 2002 2004 2006 2008 2010 2012year
Euro 10 Euro 16+Russia OECD
G7 G8
source: elaboration on OECD data
Yearly average by group
Share of temporary workers in age 25-54
21
Figure 7. Time series of labour productivity and youth unemployment
45
0005
0000 5
50006
0000 6
50007
0000 7
5000
%
1990 1992 1994 1996 1998 2000 2002 2004 2006 2008 2010 2012year
Euro 10 Euro 16+Russia OECD
G7 G8
source: elaboration on OECD data
Yearly average by group
Labor productivity
12
14
16
18
20
22
24
26
%
1990 1992 1994 1996 1998 2000 2002 2004 2006 2008 2010 2012year
Euro 10 Euro 16+Russia OECD
G7 G8
source: elaboration on OECD data
Yearly average by group
Youth unemployment rate
22
3.2 Econometric framework
As said in the Introduction, the most common caveats on estimations of labour productivity
determinants on the one hand and its relationship with unemployment on the other, at the macro
level (i.e. using country level data), are reverse causality and endogeneity.
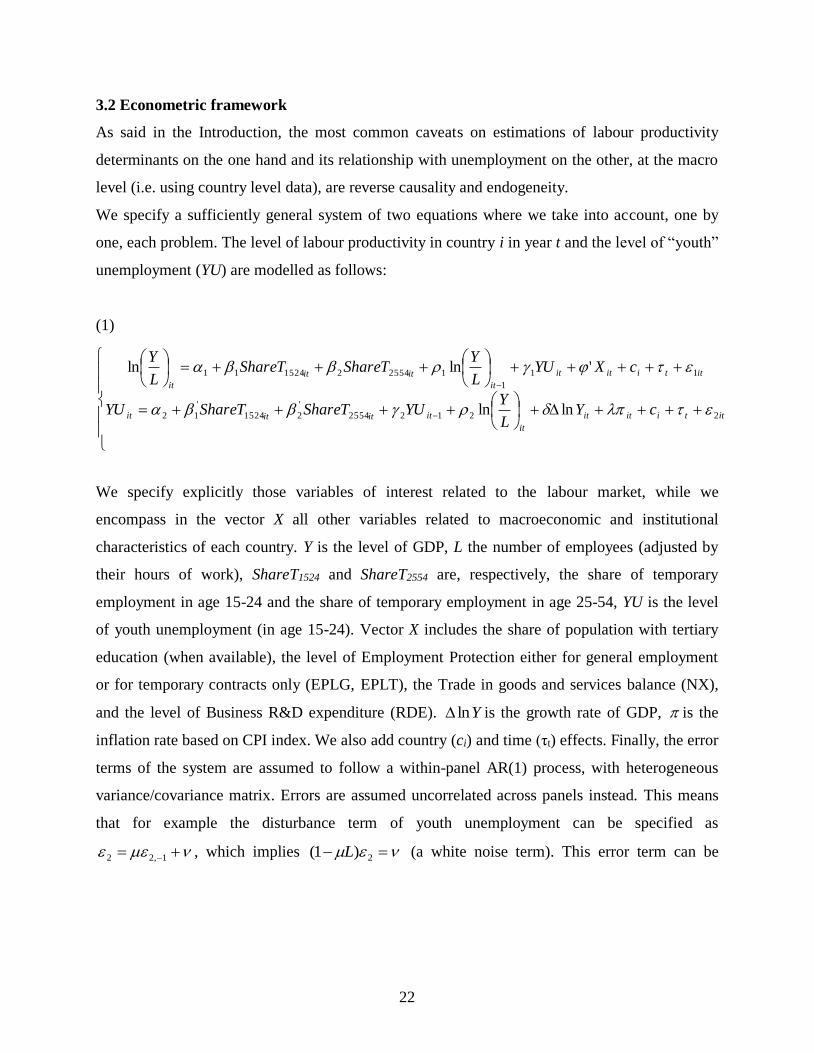
We specify a sufficiently general system of two equations where we take into account, one by
one, each problem. The level of labour productivity in country i in year t and the level of “youth”
unemployment (YU) are modelled as follows:
(1)
ittiitit
it
itititit
ittiitit
it
itit
it
cYL
YYUShareTShareTYU
cXYUL
YShareTShareT
L
Y
22122554
'
21524
'
12
11
1
125542152411
lnln
'lnln
We specify explicitly those variables of interest related to the labour market, while we
encompass in the vector X all other variables related to macroeconomic and institutional
characteristics of each country. Y is the level of GDP, L the number of employees (adjusted by
their hours of work), ShareT1524 and ShareT2554 are, respectively, the share of temporary
employment in age 15-24 and the share of temporary employment in age 25-54, YU is the level
of youth unemployment (in age 15-24). Vector X includes the share of population with tertiary
education (when available), the level of Employment Protection either for general employment
or for temporary contracts only (EPLG, EPLT), the Trade in goods and services balance (NX),
and the level of Business R&D expenditure (RDE). Yln is the growth rate of GDP, is the
inflation rate based on CPI index. We also add country (ci) and time (τt) effects. Finally, the error
terms of the system are assumed to follow a within-panel AR(1) process, with heterogeneous
variance/covariance matrix. Errors are assumed uncorrelated across panels instead. This means
that for example the disturbance term of youth unemployment can be specified as
1,22 , which implies 2)1( L (a white noise term). This error term can be
23
rewritten as an infinite sum of white noises j
j
j
0
2 , which has zero mean 02 E and
constant variance
0
222
22
j
i
jEV .17
The cross-equation correlation is a free parameter: '' jjtijijtE . We start estimating these
two equations for the panels of countries by imposing restrictions on the parameters, and then
relaxing them one by one, adding robustness to our results, as follows.
Case a): Static dependent variables with exogenous regressors and uncorrelated error terms (the
most constrained system). We assume 01 , no reverse causality ( 02 ), and the reduced-
form system covariance 0' jj (see Appendix 1). Therefore, we estimate the labour
productivity equation separately, with YU as an exogenous variable.
Case b): we relax the hypothesis of exogenous YU, but no-reverse causality assumption remains.
This means that we estimate the reduced-form system in Appendix 1 with 0' jj , but still
maintaining 02 .
Case c): we relax both hypotheses of exogenous YU and no reverse causality.
This means estimating the reduced form system with 0, 2 Cov and 02 .
Case d): dynamic equations. We introduce dynamics at this stage, with 01 , 02 . This
solves at least partially the problem of non stationarity (especially of the youth unemployment
variable). In fact, as discussed above, unemployment has been found in the empirical literature to
be non stationary (of fractional order [0.5-1]) and cointegrated with the growth rate of GDP and
the rate of inflation, at least for half European countries (see Caporale and Gil-Alana, 2014). We
test both dependent variables for unit root.
In the cases a) to c) we apply the fixed effects estimator for panel data and/or instrumental
variable or GMM, where indicated. In case d) we apply the Arellano-Bond estimator for dynamic
panels and fixed effects.
Case e): the whole system can be estimated also by the seemingly unrelated regression estimator
3SLS, with country dummies and time dummies on pooled data.
17 In Appendix 1, we show that the reduced form of the system implies cross-equation correlation of the error terms
and we show how to identify the parameters of the system.
24
Our parameters of interest are 121 ,, , i.e. the effect of temporary employment of young and
adult employees, and the impact of youth unemployment on labour productivity at the country
level. We are also interested in whether temporary work affects youth unemployment rate.
As seen in section 3.1, panels vary according to their economic development first (Euro-zone
countries, Euro-zone plus Russian Federation, OECD, G7 and G8 countries). Russian Federation
has fewer data on the control variables in general, and no information about tertiary education of
its population, so we need to drop the education variable when Russia is included in the
regressions. We apply the analysis to a restricted number of countries as well, distinguished by
their different educational and welfare systems.
4. Results
4.1 Country groups by different economic development
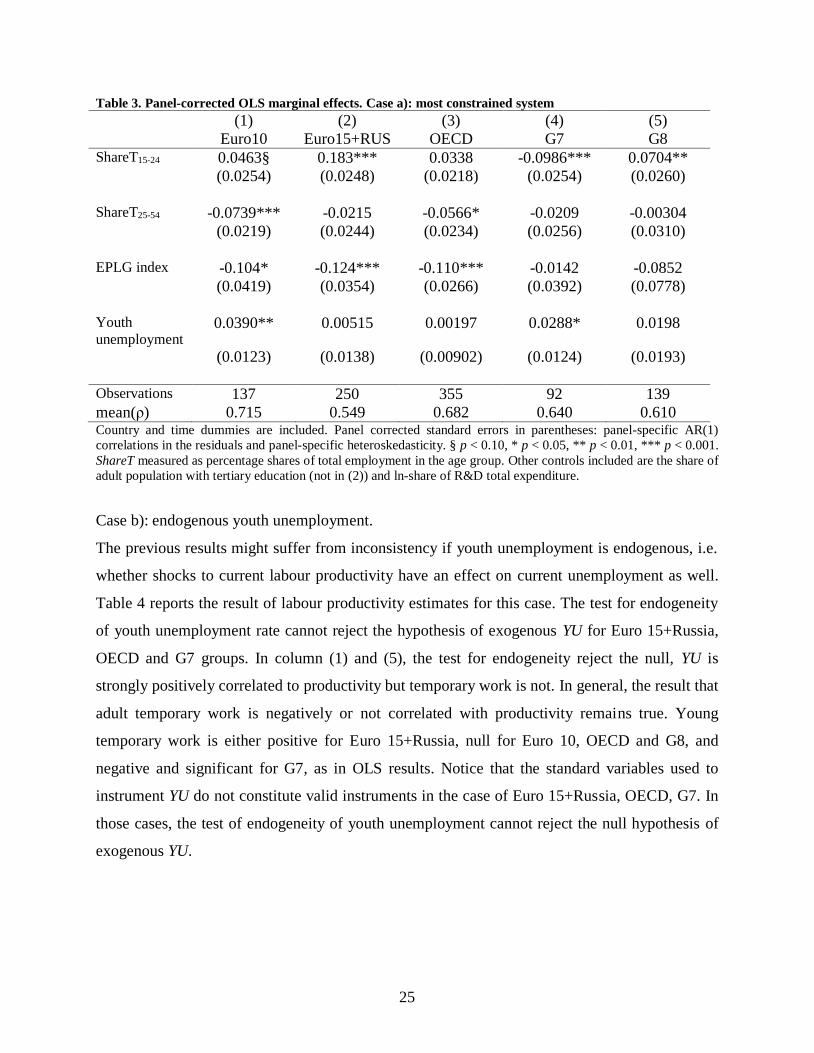
Case a): benchmark regressions, fully constrained parameters. We use an OLS estimate with
panel corrected standard errors. Residuals follow a panel-specific AR(1) process and their
specific covariance matrix is assumed heteroskedastic. We report the estimated elasticity of
labour productivity with respect to the main variables in Table 3. The share of temporary adult
workers has a negative impact in all groups, but statistically significant for the Euro 10 and
OECD groups. The elasticity with respect to young workers share is positive and statistically
significant for the Euro 15+Russia and G8 groups, it is positive and almost significant for Euro
10, not significant for OECD, and negative and significant only in the G7 countries. Youth
unemployment is positively correlated to labour productivity, in the Euro 10 and G7 groups,
while it is positive but not significant for the other groups. The percentage of population with
higher education has positive effect, but significant only for the G7 countries. The existence of
labour protection seems to have a dumping effect on productivity, but in G7 and G8 the effect is
not significantly different from zero. Finally, the percentage of GDP devoted to R&D has a
positive a significant effect only for the Euro 15+Russia group. Table 3 reports also the average
estimates for panel-specific autocorrelation coefficient, ρ.
25
Table 3. Panel-corrected OLS marginal effects. Case a): most constrained system
(1) (2) (3) (4) (5) Euro10 Euro15+RUS OECD G7 G8 ShareT15-24 0.0463§ 0.183*** 0.0338 -0.0986*** 0.0704** (0.0254) (0.0248) (0.0218) (0.0254) (0.0260) ShareT25-54 -0.0739*** -0.0215 -0.0566* -0.0209 -0.00304 (0.0219) (0.0244) (0.0234) (0.0256) (0.0310) EPLG index -0.104* -0.124*** -0.110*** -0.0142 -0.0852 (0.0419) (0.0354) (0.0266) (0.0392) (0.0778) Youth
unemployment 0.0390** 0.00515 0.00197 0.0288* 0.0198
(0.0123) (0.0138) (0.00902) (0.0124) (0.0193) Observations 137 250 355 92 139
mean(ρ) 0.715 0.549 0.682 0.640 0.610 Country and time dummies are included. Panel corrected standard errors in parentheses: panel-specific AR(1)
correlations in the residuals and panel-specific heteroskedasticity. § p < 0.10, * p < 0.05, ** p < 0.01, *** p < 0.001.
ShareT measured as percentage shares of total employment in the age group. Other controls included are the share of
adult population with tertiary education (not in (2)) and ln-share of R&D total expenditure.
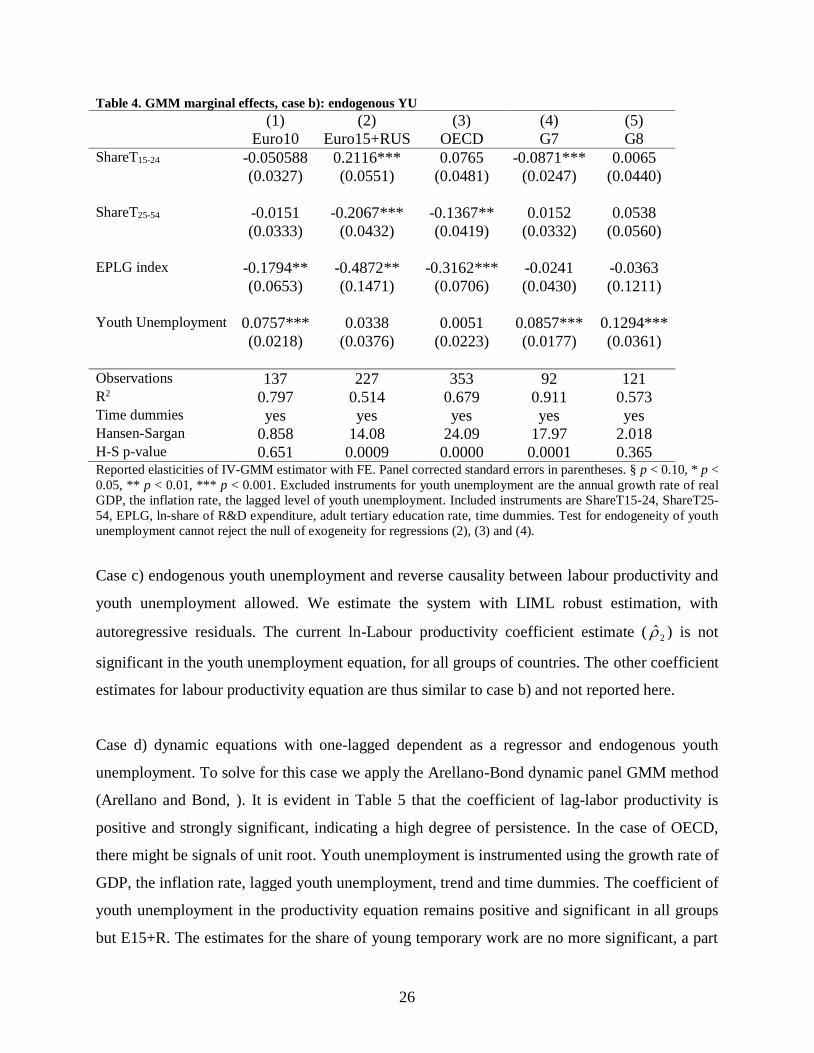
Case b): endogenous youth unemployment.
The previous results might suffer from inconsistency if youth unemployment is endogenous, i.e.
whether shocks to current labour productivity have an effect on current unemployment as well.
Table 4 reports the result of labour productivity estimates for this case. The test for endogeneity
of youth unemployment rate cannot reject the hypothesis of exogenous YU for Euro 15+Russia,
OECD and G7 groups. In column (1) and (5), the test for endogeneity reject the null, YU is
strongly positively correlated to productivity but temporary work is not. In general, the result that
adult temporary work is negatively or not correlated with productivity remains true. Young
temporary work is either positive for Euro 15+Russia, null for Euro 10, OECD and G8, and
negative and significant for G7, as in OLS results. Notice that the standard variables used to
instrument YU do not constitute valid instruments in the case of Euro 15+Russia, OECD, G7. In
those cases, the test of endogeneity of youth unemployment cannot reject the null hypothesis of
exogenous YU.
26
Table 4. GMM marginal effects, case b): endogenous YU
(1) (2) (3) (4) (5) Euro10 Euro15+RUS OECD G7 G8 ShareT15-24 -0.050588 0.2116*** 0.0765 -0.0871*** 0.0065 (0.0327) (0.0551) (0.0481) (0.0247) (0.0440) ShareT25-54 -0.0151 -0.2067*** -0.1367** 0.0152 0.0538 (0.0333) (0.0432) (0.0419) (0.0332) (0.0560) EPLG index -0.1794** -0.4872** -0.3162*** -0.0241 -0.0363 (0.0653) (0.1471) (0.0706) (0.0430) (0.1211) Youth Unemployment 0.0757*** 0.0338 0.0051 0.0857*** 0.1294*** (0.0218) (0.0376) (0.0223) (0.0177) (0.0361) Observations 137 227 353 92 121 R2 0.797 0.514 0.679 0.911 0.573 Time dummies yes yes yes yes yes Hansen-Sargan 0.858 14.08 24.09 17.97 2.018 H-S p-value 0.651 0.0009 0.0000 0.0001 0.365 Reported elasticities of IV-GMM estimator with FE. Panel corrected standard errors in parentheses. § p < 0.10, * p <
0.05, ** p < 0.01, *** p < 0.001. Excluded instruments for youth unemployment are the annual growth rate of real
GDP, the inflation rate, the lagged level of youth unemployment. Included instruments are ShareT15-24, ShareT25-
54, EPLG, ln-share of R&D expenditure, adult tertiary education rate, time dummies. Test for endogeneity of youth
unemployment cannot reject the null of exogeneity for regressions (2), (3) and (4).
Case c) endogenous youth unemployment and reverse causality between labour productivity and
youth unemployment allowed. We estimate the system with LIML robust estimation, with
autoregressive residuals. The current ln-Labour productivity coefficient estimate ( 2̂ ) is not
significant in the youth unemployment equation, for all groups of countries. The other coefficient
estimates for labour productivity equation are thus similar to case b) and not reported here.
Case d) dynamic equations with one-lagged dependent as a regressor and endogenous youth
unemployment. To solve for this case we apply the Arellano-Bond dynamic panel GMM method
(Arellano and Bond, ). It is evident in Table 5 that the coefficient of lag-labor productivity is
positive and strongly significant, indicating a high degree of persistence. In the case of OECD,
there might be signals of unit root. Youth unemployment is instrumented using the growth rate of
GDP, the inflation rate, lagged youth unemployment, trend and time dummies. The coefficient of
youth unemployment in the productivity equation remains positive and significant in all groups
but E15+R. The estimates for the share of young temporary work are no more significant, a part
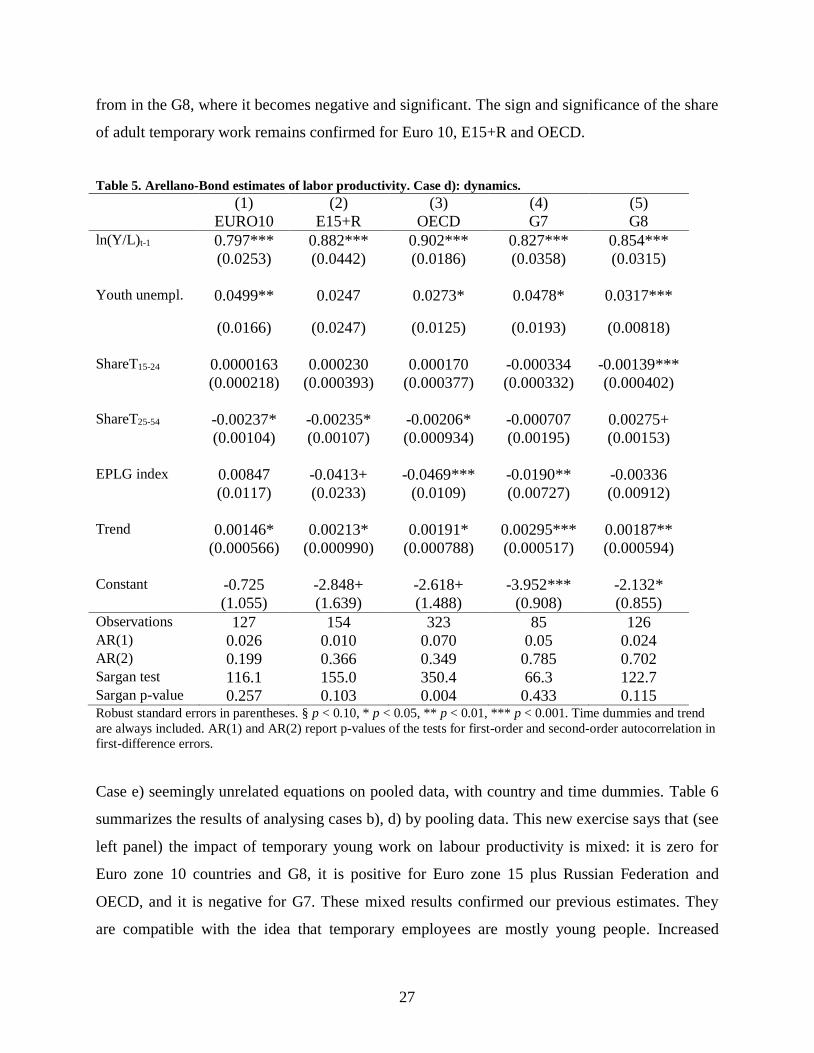
27
from in the G8, where it becomes negative and significant. The sign and significance of the share
of adult temporary work remains confirmed for Euro 10, E15+R and OECD.
Table 5. Arellano-Bond estimates of labor productivity. Case d): dynamics.
(1) (2) (3) (4) (5) EURO10 E15+R OECD G7 G8 ln(Y/L)t-1 0.797*** 0.882*** 0.902*** 0.827*** 0.854*** (0.0253) (0.0442) (0.0186) (0.0358) (0.0315) Youth unempl. 0.0499** 0.0247 0.0273* 0.0478* 0.0317***
(0.0166) (0.0247) (0.0125) (0.0193) (0.00818) ShareT15-24 0.0000163 0.000230 0.000170 -0.000334 -0.00139*** (0.000218) (0.000393) (0.000377) (0.000332) (0.000402) ShareT25-54 -0.00237* -0.00235* -0.00206* -0.000707 0.00275+ (0.00104) (0.00107) (0.000934) (0.00195) (0.00153) EPLG index 0.00847 -0.0413+ -0.0469*** -0.0190** -0.00336 (0.0117) (0.0233) (0.0109) (0.00727) (0.00912) Trend 0.00146* 0.00213* 0.00191* 0.00295*** 0.00187** (0.000566) (0.000990) (0.000788) (0.000517) (0.000594) Constant -0.725 -2.848+ -2.618+ -3.952*** -2.132* (1.055) (1.639) (1.488) (0.908) (0.855) Observations 127 154 323 85 126 AR(1) 0.026 0.010 0.070 0.05 0.024 AR(2) 0.199 0.366 0.349 0.785 0.702 Sargan test 116.1 155.0 350.4 66.3 122.7 Sargan p-value 0.257 0.103 0.004 0.433 0.115 Robust standard errors in parentheses. § p < 0.10, * p < 0.05, ** p < 0.01, *** p < 0.001. Time dummies and trend
are always included. AR(1) and AR(2) report p-values of the tests for first-order and second-order autocorrelation in
first-difference errors.
Case e) seemingly unrelated equations on pooled data, with country and time dummies. Table 6
summarizes the results of analysing cases b), d) by pooling data. This new exercise says that (see
left panel) the impact of temporary young work on labour productivity is mixed: it is zero for
Euro zone 10 countries and G8, it is positive for Euro zone 15 plus Russian Federation and
OECD, and it is negative for G7. These mixed results confirmed our previous estimates. They
are compatible with the idea that temporary employees are mostly young people. Increased
28
labour market flexibility, as the one observed especially in Europe in the past decade, created job
opportunities for the youngsters, leading firms to face lower adjustment costs in the size of their
workforce (avoiding firing costs and lower wage bills), better monitoring, substitutions of
permanent employees on leave, etc. Thus, it increased firms’ productivity and competitiveness.
However, flexibility means less protection on the job, higher unemployment risks, lower job
tenure, sometimes poor working conditions, like access to social benefits or training. This
reduces workers’ incentives to invest in firm-specific human capital, lowering their productivity
(Jahn, Riphahn, Schnabel, 2012). Therefore, the net effect is not clear as in our evidence,
depending to the group of countries we rely on. The share of prime-age (25-54) employed under
temporary contracts, instead, is negatively related to aggregate labour productivity (or unrelated
like in the G8 group). The negative impact of flexibility is dominant in the case of adult
employees, throughout different labour markets structures.
As far as youth unemployment, our results indicate that there is no direct relationship between
labour productivity and youth unemployment in the groups Euro 15+Russia and OECD, while
there is a positive link for Euro 10 (as in Figure 2), G7 and G8 groups. Figure 2 shows that
countries experiencing high youth unemployment (Italy, France, Belgium) were also surprisingly
experiencing the highest levels of productivity, at least in the period 1995-2005. Most plausibly,
the link between youth unemployment and productivity is mostly mediated by a mechanism
through which young unemployed people (re-)entering the labour market become temporary
workers. In fact, it is evident from Table 6 (right panel) that temporary work is strongly
correlated with youth unemployment. Young temporary work is positively correlated and
significant for G7 and G8, and positive but non significant in the other groups. This means that
the marginal effect of a change in the share of temporary workers aged 15-24 is a combination of
an indirect positive effect through youth unemployment and a (zero or) negative direct effect on
productivity. The result is mixed, as in our evidence. Adult temporary work is negatively
correlated to youth unemployment and strongly significant in all groups, but E15+R. The indirect
effect through youth unemployment and the direct effect on labour productivity reinforce each
other.
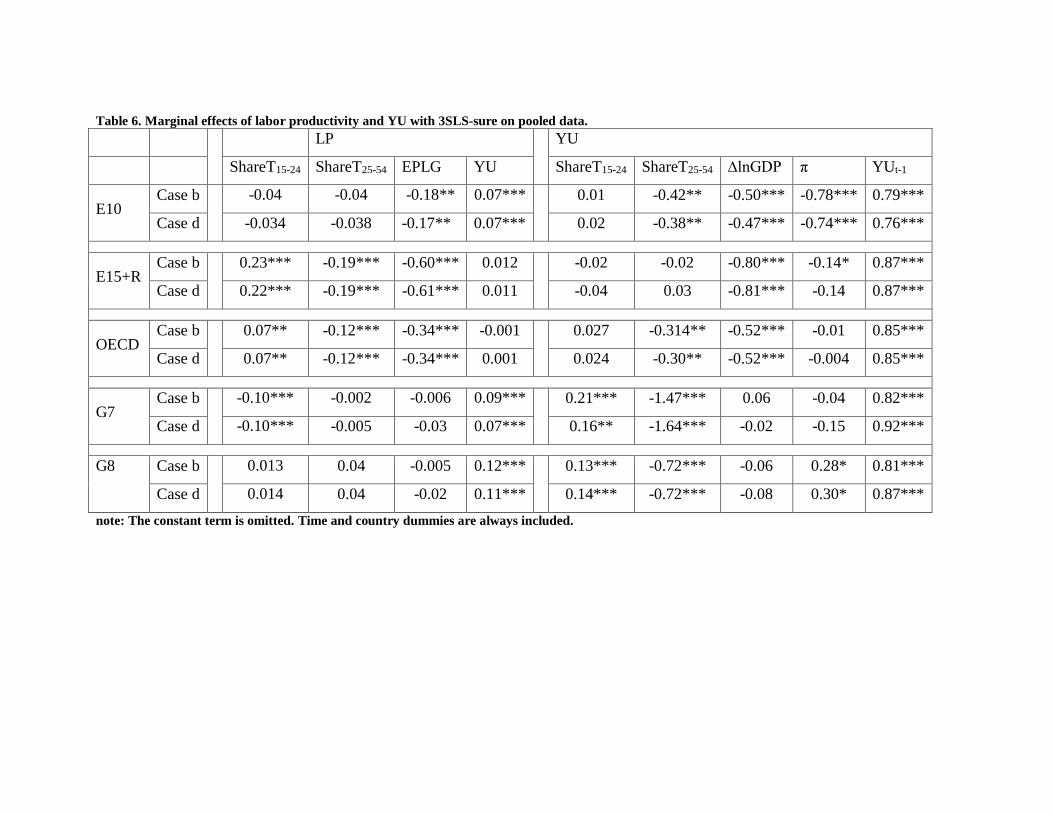
Table 6. Marginal effects of labor productivity and YU with 3SLS-sure on pooled data.
LP YU
ShareT15-24 ShareT25-54 EPLG YU ShareT15-24 ShareT25-54 ∆lnGDP π YUt-1
E10 Case b -0.04 -0.04 -0.18** 0.07*** 0.01 -0.42** -0.50*** -0.78*** 0.79***
Case d -0.034 -0.038 -0.17** 0.07*** 0.02 -0.38** -0.47*** -0.74*** 0.76***
E15+R Case b 0.23*** -0.19*** -0.60*** 0.012 -0.02 -0.02 -0.80*** -0.14* 0.87***
Case d 0.22*** -0.19*** -0.61*** 0.011 -0.04 0.03 -0.81*** -0.14 0.87***
OECD Case b 0.07** -0.12*** -0.34*** -0.001 0.027 -0.314** -0.52*** -0.01 0.85***
Case d 0.07** -0.12*** -0.34*** 0.001 0.024 -0.30** -0.52*** -0.004 0.85***
G7 Case b -0.10*** -0.002 -0.006 0.09*** 0.21*** -1.47*** 0.06 -0.04 0.82***
Case d -0.10*** -0.005 -0.03 0.07*** 0.16** -1.64*** -0.02 -0.15 0.92***
G8 Case b 0.013 0.04 -0.005 0.12*** 0.13*** -0.72*** -0.06 0.28* 0.81***
Case d 0.014 0.04 -0.02 0.11*** 0.14*** -0.72*** -0.08 0.30* 0.87***
note: The constant term is omitted. Time and country dummies are always included.
4.2 Country groups by different welfare systems
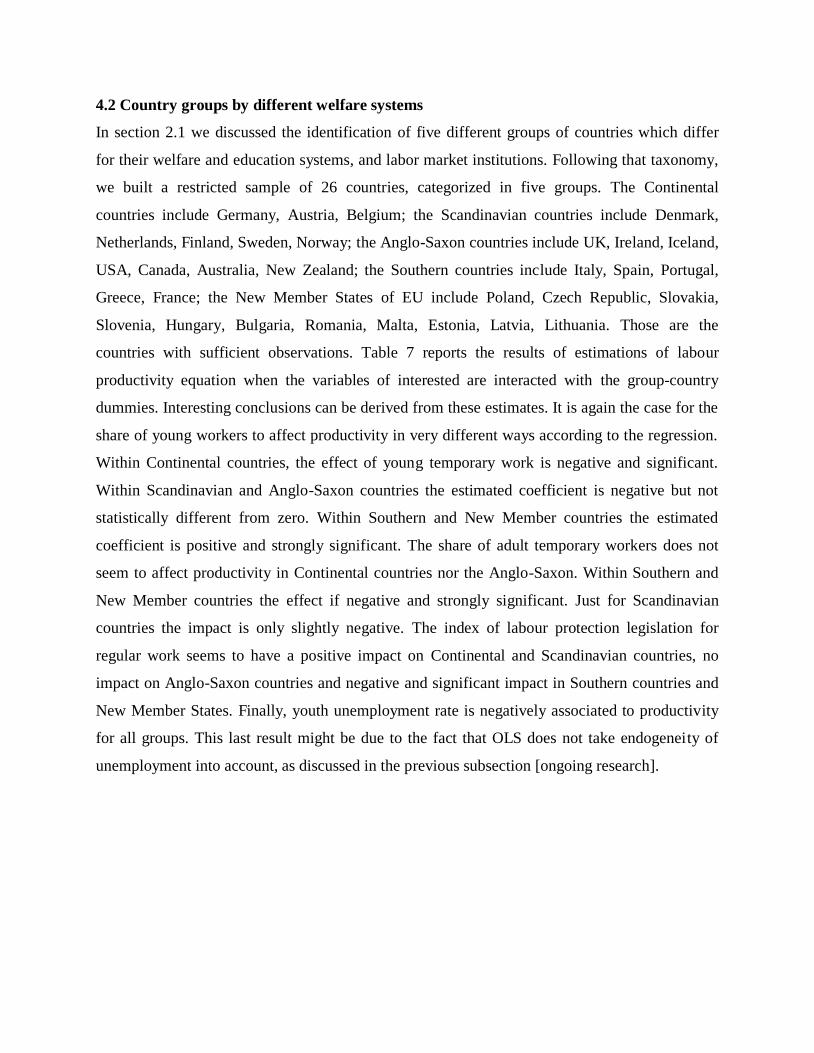
In section 2.1 we discussed the identification of five different groups of countries which differ
for their welfare and education systems, and labor market institutions. Following that taxonomy,
we built a restricted sample of 26 countries, categorized in five groups. The Continental
countries include Germany, Austria, Belgium; the Scandinavian countries include Denmark,
Netherlands, Finland, Sweden, Norway; the Anglo-Saxon countries include UK, Ireland, Iceland,
USA, Canada, Australia, New Zealand; the Southern countries include Italy, Spain, Portugal,
Greece, France; the New Member States of EU include Poland, Czech Republic, Slovakia,
Slovenia, Hungary, Bulgaria, Romania, Malta, Estonia, Latvia, Lithuania. Those are the
countries with sufficient observations. Table 7 reports the results of estimations of labour
productivity equation when the variables of interested are interacted with the group-country
dummies. Interesting conclusions can be derived from these estimates. It is again the case for the
share of young workers to affect productivity in very different ways according to the regression.
Within Continental countries, the effect of young temporary work is negative and significant.
Within Scandinavian and Anglo-Saxon countries the estimated coefficient is negative but not
statistically different from zero. Within Southern and New Member countries the estimated
coefficient is positive and strongly significant. The share of adult temporary workers does not
seem to affect productivity in Continental countries nor the Anglo-Saxon. Within Southern and
New Member countries the effect if negative and strongly significant. Just for Scandinavian
countries the impact is only slightly negative. The index of labour protection legislation for
regular work seems to have a positive impact on Continental and Scandinavian countries, no
impact on Anglo-Saxon countries and negative and significant impact in Southern countries and
New Member States. Finally, youth unemployment rate is negatively associated to productivity
for all groups. This last result might be due to the fact that OLS does not take endogeneity of
unemployment into account, as discussed in the previous subsection [ongoing research].
31
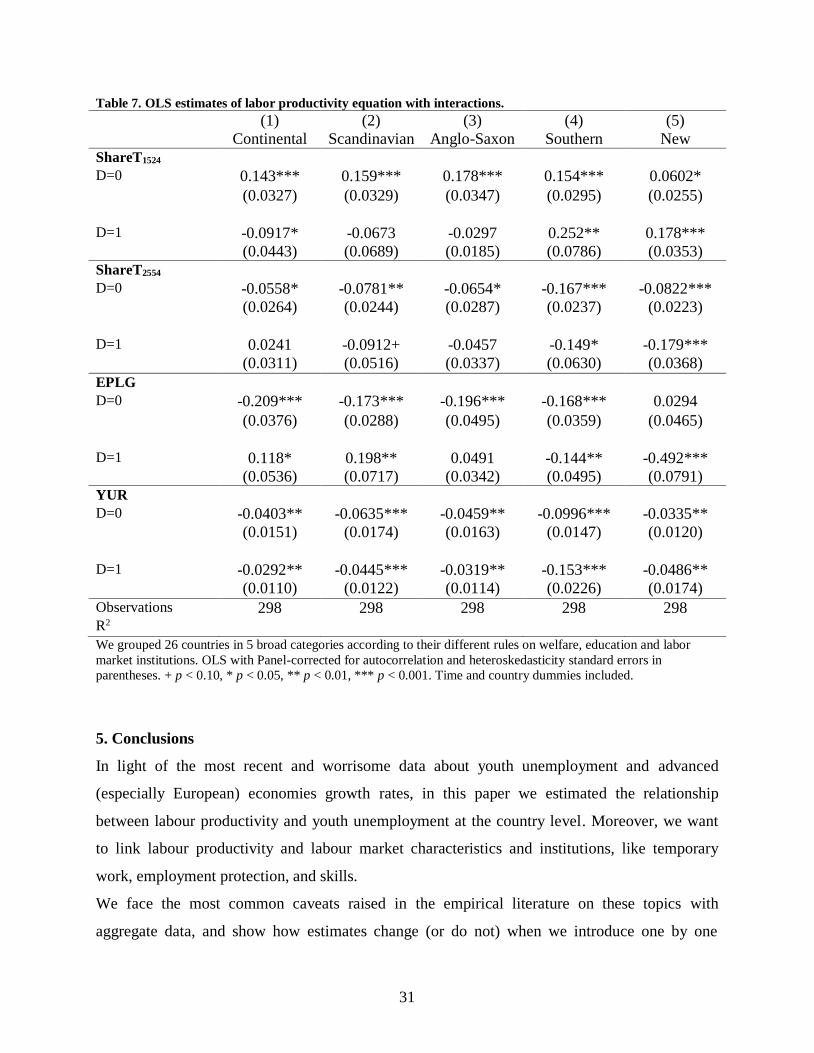
Table 7. OLS estimates of labor productivity equation with interactions.
(1) (2) (3) (4) (5) Continental Scandinavian Anglo-Saxon Southern New ShareT1524 D=0 0.143*** 0.159*** 0.178*** 0.154*** 0.0602*
(0.0327) (0.0329) (0.0347) (0.0295) (0.0255) D=1 -0.0917* -0.0673 -0.0297 0.252** 0.178*** (0.0443) (0.0689) (0.0185) (0.0786) (0.0353) ShareT2554 D=0 -0.0558* -0.0781** -0.0654* -0.167*** -0.0822*** (0.0264) (0.0244) (0.0287) (0.0237) (0.0223)
D=1 0.0241 -0.0912+ -0.0457 -0.149* -0.179*** (0.0311) (0.0516) (0.0337) (0.0630) (0.0368)
EPLG D=0 -0.209*** -0.173*** -0.196*** -0.168*** 0.0294
(0.0376) (0.0288) (0.0495) (0.0359) (0.0465) D=1 0.118* 0.198** 0.0491 -0.144** -0.492*** (0.0536) (0.0717) (0.0342) (0.0495) (0.0791) YUR D=0 -0.0403** -0.0635*** -0.0459** -0.0996*** -0.0335** (0.0151) (0.0174) (0.0163) (0.0147) (0.0120)
D=1 -0.0292** -0.0445*** -0.0319** -0.153*** -0.0486** (0.0110) (0.0122) (0.0114) (0.0226) (0.0174)
Observations 298 298 298 298 298 R2 We grouped 26 countries in 5 broad categories according to their different rules on welfare, education and labor
market institutions. OLS with Panel-corrected for autocorrelation and heteroskedasticity standard errors in
parentheses. + p < 0.10, * p < 0.05, ** p < 0.01, *** p < 0.001. Time and country dummies included.
5. Conclusions
In light of the most recent and worrisome data about youth unemployment and advanced
(especially European) economies growth rates, in this paper we estimated the relationship
between labour productivity and youth unemployment at the country level. Moreover, we want
to link labour productivity and labour market characteristics and institutions, like temporary
work, employment protection, and skills.
We face the most common caveats raised in the empirical literature on these topics with
aggregate data, and show how estimates change (or do not) when we introduce one by one
32
assumptions on endogeneity, reverse causality and dynamics of productivity and youth
unemployment.
We applied our econometric framework to different group of countries according to their
economic development or their welfare and educational systems.
It turns out that the correlation between youth unemployment and labour productivity is different
according to what group of countries we refer. In the first place, it is positive and significant for
Euro zone 10 countries, G7 and G8 countries. It appears to be not significant across Euro zone
15 + Russia and OECD countries. Most plausibly, the link between youth unemployment and
productivity is mediated by a mechanism through which young unemployed people (re-)entering
the labour market become temporary workers.
Second, our preliminary results on a smaller sample of countries show that youth unemployment
negatively affects labour productivity independently on the welfare system a country adopt. This
might be due to the inconsistency of OLS estimates if youth unemployment is endogenous.
The most robust result we obtain is that temporary work share over total employment does have
an effect on labour productivity for most countries. The effect is particularly strong when “adult”
workers are on a temporary contract. The effect of young labour on a temporary contract have
mixed effects: either null, like in the case of Euro zone 10 and G8 countries, or positive, like in
the Euro zone 15 + Russia and in the OECD countries taken as a whole. It is negative for the G7
countries. If we look at our preliminary estimates on welfare, young temporary work positively
affects Southern countries and New Member States, while it affects negatively productivity in
Continental countries.
References
Bassanini, A., Nunziata, L. and D. Venn (2009): “Job protection legislation and productivity
growth in OECD countries”, Economic Policy, pp.349-402.
Boeri, T. (2011): “Institutional Reforms and Dualism in European Labour Markets”, in: O.
Ashenfelter & D. Card (ed.), Handbook of Labour Economics, Elsevier, v.4, n.5.
Bruno, G.S.F., Marelli, E. and M. Signorelli (2013): “Young People in Crisis: NEETs and
Unemployed in EU Regions”, ERSA Congress Palermo, October 27-31; a slightly modified
version presented at 54th Riunione Scientifica annuale SIE, Bologna, October 24-26.
33
Caporale, G.M. and L. Gil-Alana (2014): “Youth Unemployment in Europe: Persistence and
Macroeconomic Determinants”, CESifo Working Paper n.4696.
Cappellari, L., Dell’Aringa, C. and M. Leonardi (2012): “Temporary Employment, Job Flows
and Productivity: A Tale of Two Reforms”, The Economic Journal, v.122, pp.F188-F225,
August, DOI 10.1111/j.1468-0297.2012.02535.x.
Caroleo, F.E. and F. Pastore (2007): “The Youth experience gap: explaining differences across
countries”, Quaderni del Dipartimento di Economia, Finanza e Statistica, n. 41, Università di
Perugia.
Choudhry, M.T., Marelli, E. and M. Signorelli (2013): “Youth and the total unemployment rate:
The impact of policies and institutions”, Rivista internazionale di Scienze Sociali, v.121, n.1,
pp.63-86.
Cingano, F., Leonardi, M., Messina, J. and G. Pica (2010): “Employment Protection and
Investment”, Economic Policy, pp.117-163.
Daveri, F. and M.L. Parisi (2010): “Experience, Innovation and Productivity. Empirical evidence
from Italy’s slowdown”, CESifo Working Paper n.3123.
De Graaf-Zijl, M., van den Berg, G.J. and A. Heyma (2011): “Stepping Stones fort he
Unemployed: The Effect of Temporary Jobs on the Duration until (Regular) Work”, Journal of
Population Economics, v.24, n.1, pp.107-139.
Di Giorgio, C. and M. Giannini (2012): “A Comparison of the Beveridge Curve Dynamics in
Italy and USA”, Empirical Economics, v.43, n.3, pp.945-983.
Esping-Andersen, G. (1990): The Three Worlds of Welfare Capitalism, Cambridge: Polity Press.
Eurofound (2012): NEETs – Young people not in employment, education or training:
Characteristics, costs and policy responses in Europe, Publications Office of the European
Union, Luxembourg.
European Commission (2010): Employment in Europe 2010, Brussels.
Jahn, E.J., Riphahn, R.T. and C. Schnabel (2012): “Feature: Flexible Forms of Employment:
Boon and Bane”, The Economic Journal, v.122, pp.F115-F124, August, DOI 10.1111/j.1468-
0297.2012.02535.x.
Karabchuk, T. (2012): “Part-time and Temporary Workers in Russia: Winners or Losers?” ZAF
(The Journal of Labour Market Research), v.45, pp.23-39.
Krebs, T. and M. Scheffel (2013): “Macroeconomic Evaluation of Labor Market Reform in
Germany”, IMF Working Paper, n.13/42.
34
Lisi, D. (2013): “The Impact of Temporary Employment and Employment Protection on Labour
Productivity: Evidence from an Industry-level Panel of EU countries”, the Journal of Labour
Market Research, DOI: 10.1007/s12651-013-0127-0.
OECD (1994): The OECD Jobs Study, OECD Publishing, Paris.
OECD (2006): Employment Outlook, OECD Publishing, ISBN: 92-64-02384-4.
OECD (2013): OECD Employment Outlook 2013, Chapter 2, OECD Publishing,
http://dx.doi.org/10.1787/empl_outlook-2013-en.
Pastore, F. (2014): “The Youth Experience Gap. A classification of school-to-work transition
regimes”, mimeo, Seconda Università di Napoli and IZA Bonn.
Scarpetta, S., Sonnet, A. and T. Manfredi (2010): “Rising Youth Unemployment During the
Crisis: How to Prevent Negative Long-term Consequences on a Generation?”, OECD Social,
Employment and Migration Working Papers, n.6.
Vogel, J. (2002): “European Welfare Regimes and the Transition to Adulthood: A Comparative
and Longitudinal Perspective”, Social Indicators Research, v.59, n.3, pp.275-299.
Related Documents