1 Labour Migration and its Effects on the Demography and Labour Market of Serbia Conducted within the "Mainstreaming Migration into National Development Strategies" Project Dragana Marjanovic July 3, 2015

Welcome message from author
This document is posted to help you gain knowledge. Please leave a comment to let me know what you think about it! Share it to your friends and learn new things together.
Transcript
1
Labour Migration and its Effects on the Demography and Labour Market of
Serbia Conducted within the "Mainstreaming Migration into National
Development Strategies" Project
Dragana Marjanovic
July 3, 2015

2
Disclaimer
‘This publication has been produced with the assistance of the Swiss Agency for
Development and Cooperation, IOM and UNDP through the global Joint Project on
“Mainstreaming Migration into National Development Strategies”. The contents of
this publication can in no way be taken to reflect the views of SDC, IOM or UNDP, and
those of their member states’.
3
Table of Contents
1. Context and Methodology .................................................................................................................................................... 4
1.1. Research Context......................................................................................................................................................... 4
1.2. Methodological Approach ........................................................................................................................................... 6
2. Labour Migration in Serbia .................................................................................................................................................. 8
2.1. External Labour Migration ......................................................................................................................................... 8
2.1.1. State of Affairs.................................................................................................................................................... 8
2.1.2. The Brain Drain Phenomenon ........................................................................................................................11
2.1.3. International Labour Migration Outlook .......................................................................................................12
2.2. Internal Labour Migration ........................................................................................................................................13
2.2.1. A Regional Perspective on Demographic Changes ........................................................................................13
2.2.2. The Demographic and Socio-Economic Rural - Urban Divide and Labour Migration ................................16
3. Labour Migration Data .......................................................................................................................................................21
3.1. Labour Force Survey Data Analysis .........................................................................................................................21
3.1.1. International Migration ...................................................................................................................................21
3.1.2. Internal Migration ...........................................................................................................................................23
3.1.3. Internal mobility of the Labour Force and Regional Disparities ..................................................................28
3.2. National Employment Service Registry Data ..........................................................................................................30
4. Synthesis of Findings and Key Issues for Policy Concern ................................................................................................33
5. Policy Recommendations and Measures for the Management of Internal Labour Mobility.....................................35
5.1. Policy Responses .......................................................................................................................................................35
5.2. Inventory of Best International Practices................................................................................................................37
5.2.1. Passive Labour Market Policies ......................................................................................................................38
5.2.2. Policies for Local Development ......................................................................................................................43
5.2.3. Active Labour Market Programmes ...............................................................................................................47
5.2.4. Transportation and Relocation Support ........................................................................................................54
5.2.5. Housing Support ..............................................................................................................................................58
5.2.6. Education Policies ...........................................................................................................................................62
5.2.7. Concluding Remarks .......................................................................................................................................65
Bibliography .................................................................................................................................................................................67
4
1. Context and Methodology
The International Organization for Migration in Serbia is currently implementing the “Mainstreaming Migration into National Development Strategies” project. This project aims to enable countries to integrate migration into their national development planning documents and processes and to continually monitor and adjust their approaches to migration and development in consultation with all relevant stakeholders. Specifically, in Serbia, the project supports governments to mainstream migration into national development plans and sector policies, including thorough situation assessments, the formulation of policy objectives and integrated migration and development strategies, and by strengthening mechanisms for coordination within the government and with other stakeholders on migration-related issues. The Ministry of Labour, Employment, Veteran and Social Policy (MoLEVSP) is planning a revision of the National Employment Strategy 2011-2020 this year (2015). With the aim at supporting the Ministry increase focus on labour mobility and more effectively manage internal labour mobility, the IOM has commissioned this research on Labour Migration and its Effects on the Demography and Labour Market of Serbia within the above mentioned project.
1.1. Research Context The current strategic policy documents do not provide sufficient guidance, nor have specific measures defined to support the management of internal labour migration in Serbia. The overarching Migration Management Strategy („Official Bulletin of the Republic of Serbia”, No. 59/2009) makes hardly any mention of internal labour migration at all. The National Employment Strategy for the period 2011-2020 („Official Bulletin of the Republic of Serbia”, No. 37/11) recognizes the lack of internal labour migration management as a problem and provides an overview of the situation in this respect, but as already mentioned, lacks clear guidance and tools in addressing these problems. With the 2015 revision of the National Employment Strategy the policy maker intends to set firm grounds for the introduction of evidence based policy making and designing targeted policy measures for the management of internal labour migration.
The current National Employment Strategy highlights the problem of the decrease in the population size mainly caused by declining birth rates and continuing migration driven by economic transition and lack of employment opportunities, alongside the ever more prominent polarisation into zones of concentration and zones of emigration and depopulation.
5
The effect these demographic changes will have on a shrinking labour force is anticipated and the risk of increasing emigration flows of new highly educated experts and qualified workers, mainly to EU countries renders the situation even more alarming.
Speaking of internal labour migration it has been explained that the low economic activity and scarcity of jobs has resulted in the migration of the workforce towards the regions offering better opportunities. This has been observed in the southern relative to the northern regions of the country and in rural relative to urban areas. Due to migration, the demographic structure of urban areas is changing with some towns losing considerable numbers of their residents. In 2009, a negative or zero population growth was recorded in 157 out of 165 towns and municipalities. Positive population growth was registered in four municipalities of the city of Belgrade (Zemun, Palilula, Surcin and Cukarica), in the town of Novi Sad, in the municipality of Sjenica, in the town of Novi Pazar and in the municipality of Tutin.1 In 2009, the level of district development, measured by per capita income, ranged within the 4:1 ratio, with the highest income recorded in the City of Belgrade and the South Backa district (74% and 41% above the national average, respectively,) and the lowest in the Toplica and Jablanica districts (60% below the national average).2
Attempts to address these regional disparities was made with the adoption of Serbia’s Regional Development Strategy (2007-2012) and its action plan, while the 2009 Law on
regional development („Official Bulletin of the Republic of Serbia”, No 51/2009 and 30/10) set the principles of decentralisation and the establishment of institutions at regional and local level.
Furthermore, it has been recognized that the demographic decline of the working age population, will require a more efficient education system and increased knowledge and skills, particularly among new labour market entrants. Employment, education, scientific and technological development strategies must be carefully aligned. Besides this, the current National Employment Strategy (drawing on the Migration Management Strategy) recognizes that in order to counteract the worsening of the demographic situation and the reduction of the labour force, migration management must be a strategic goal, in line with the long-term economic development and labour market needs of Serbia. These challenges require new solutions that may include promoting the immigration of younger and better educated workers, primarily from neighbouring countries, and a system of incentives to attract young and educated workers to underdeveloped regions.
The improvement of the existing infrastructure and increase of employment opportunities through decentralisation and the development of local and regional
1First National Report on Social Inclusion and Poverty Reduction in the Republic of Serbia - “Social Exclusion and
Poverty Report for the Period 2008 – mid-2010”, Social Inclusion and Poverty Reduction Unit. 2 Statistical Office of the Republic Serbia, (2010) Report on Serbia’s Development 2009
6
employment policies are seen as preconditions for the permanence and return of the labour force to poor and underdeveloped regions.
Although specific measures addressing internal labour mobility are not provided in the National Employment Strategy 2011-2020, specific measures aimed at decreasing labour market disparities in Serbia are and include: the allocation of more funding to employment subsidies in the less developed and poor regions, financing enterprises through long- and short-term loans, issuing bank guarantees, and supporting investors with grants for each new job created. Additional regional and local employment policies were to be further developed and special programmes designed to stimulate employment in the less developed regions - local employment councils were to play a crucial role, not only in the design, but also in the implementation of regional and local employment policies. The already established financial support provided from the central level to local self-governments in the form of co-funding programmes and measures established by the regional and local employment policy were to play a central role, as the funding allocation was to be carried out in a manner that promotes the development of regions lagging behind.
1.2. Methodological Approach
This research has been conceptualized in order to respond to the needs of the Employment sector of the MoLEVSP, in its revision of the National Employment Strategy 2011-2020, with a particular aim to provide an updated account of the internal labour migration situation in Serbia and support the policy maker in recognizing specific objectives and designing measures to best address them.
The research will comprise of three main sections.
Firstly, a secondary data analysis will be performed on the basis of identified existing research and previous analyses. This section will cover all key issues related to this problem. Both international migration, including the 'brain drain' and internal migration including the creation of urban agglomerations will be tackled. The issues of the aging of the Serbian population and depopulation of certain rural areas will be separately addressed with a particular focus on how these changes affect the Serbian labour force. Finally, also, an examination of the Serbian labour market, with view of these processes will be performed. An overview of the existing literature testifies to the lack of attention devoted to internal labour migration and provides further justification for conducting the commissioned research.
Secondly, the Labour Force Survey (LFS) data, regularly collected by the Republic's Statistical Office (RSO) will be re-examined with a view of extracting labour migration relevant indicators which have neither been computed nor analyzed up to date. These include information on foreign nationals in Serbia, as well as on Serbian nationals

7
abroad. However, most attention will be devoted to information on the translocations of Serbian nationals, with particular focus on the reasons for move, their labour market status, the most common movement 'paths', the labour market situation in the districts of origin and the receiving cities, etc. In addition to this, the National Employment Service (NES) administrative record data will also be examined for information on cross-district mediation, as well as the readiness of the registered unemployed to work in a municipality other than the one they live in.
On the basis of both the primary and secondary data analysis, conclusions regarding the state of labour migrations in Serbia (primarily those that occur within the Serbian border) will be drawn and key issues that require attention from the side of the policy maker will be highlighted.
The final section will bring forward recommendations and the best international practices in managing labour mobility which could serve as inspiration for designing policy measures to effectively manage internal labour mobility in Serbia.
8
2. Labour Migration in Serbia
The issues of labour migration and demography on the one side, and the labour market and regional disparities on the other, are tightly interrelated. Many processes are simultaneously at play and they often reinforce one another. This section will provide an account of the key issues and explain the relation between labour mobility, the population's demographic aging, rural depopulation, unequal regional development and the labour force and labour market. Although the focus of this research will lay on internal labour mobility, an account of external labour migration will also be provided.
2.1. External Labour Migration
Although the focus of this study is to reveal the internal labour mobility trends and processes and to consequently provide policy recommendations and measures for their management a brief account of emigration and immigration will also be provided. Particular attention will be devoted to the brain drain phenomenon, characteristic of the previous couple of decades and raising concern among the policy makers.
2.1.1. State of Affairs
Although data collection and reporting on immigration has significantly improved since 2010 with the launching of the Migration Profile of the Republic of Serbia (Government of Serbia, 2012), official data on emigration unfortunately do not exist for the Republic of Serbia. Estimations based on the data provided by the key receiving countries and information on the total population and natural growth in the period between the 2002 and 2011 census suggests the net migration loss is estimated at approximately 15,000 individuals annually (Government of the Republic of Serbia, 2014).
Emigration
Traditionally, the Republic of Serbia has been a country of economic emigration. Germany, Austria, Switzerland, France, Italy, USA, Sweden, Canada, Australia, Netherlands, Russia and the UK are the countries which have experienced the largest migration inflows from Serbia thus far. If we look at the period from the late 1960s onwards, the first four countries on this list represent the older destinations for Serbian emigrants, while most of the others represent either new destinations or those from earlier periods which have since experience a revival.
9
Among the traditional emigration countries for Serbian nationals, Germany, Austria, Switzerland and Sweden still are very attractive. Owing to the existing, well-developed social networks from the earlier periods, these countries are chiefly of interest to people with a secondary education or lower, which is the general characteristic of Serbian emigrants in Europe, unlike those to the overseas states during the last two decades. The process of emigration to the EU countries has been facilitated since the beginning of 2010, when Serbia entered the White Schengen List, a list of the countries whose nationals do not require visas to travel to the Schengen Area. Among the new Member States of the EU, the most important destination countries for Serbian citizens have been Slovenia and Hungary (IOM, 2012). According to the Eurostat data3 in 2013, 853 and 329 first time work related first time residence permits have been issued to Serbian nationals in these countries respectively. While Italy is by far attracting the highest number of labour migrants from Serbia, having issued 1,113 first time residence permits for remuneration related activities. The Census results confirm the well-known regularity on economic migrant selectivity by gender and age. In the case of international migration, men are more numerous, in almost all five-year age groups. According to 2002 Census data, for which the sex ratio of Serbian citizens working or residing abroad is available, this ratio amounted to 114.1 and was considerably higher than for the population in the country (94.6). The numerical dominance of men in the emigrant population is primarily the result of migrant selectivity by gender, conditioned by a pattern of international migration that is characterized by a larger spatial mobility of men as well as specific demands of the labour market in countries of destination (e.g. Russia).
In all countries of destination the share of men was greater than of the women. Differences are considerable. The share of women is the greatest in Austria and Switzerland where they represent 48.6 percent, namely 48.2 percent of total Serbian citizens in these countries, while it is by far the lowest in Russia where only every fifth person (21.0 percent) is female (there were 376 males to 100 females).
Generally, the change in the age structure of emigrants from Serbia follows the general trends of demographic ageing of Serbia’s total population. Still, the emigrant population is by far younger than the population in the country, which is the result of the still present, although less pronounced, selectivity of emigrants by age, an increasing share of family members in total Serbian emigrant stock and, consequently, the relatively high birth rate of emigrant population (Lukic, 2013). Not all regions are equally affected by emigration. There are three zones of high level emigration in Serbia, determined by the share of persons residing or working abroad out of total population during the 1991 and 2002 Censuses4. Zone 1 includes 14
3 http://ec.europa.eu/eurostat/data/database 4Such analysis has unfortunately not yet been performed on the basis of the latest Census data.
10
municipalities in Central-Eastern Serbia, Zone 2 refers to the municipalities of Bujanovac and Preševo in the south of Serbia, while Zone 3 includes five Sandzak municipalities. Zone 1, which includes Braničevo, Bor and part of Pomoravlje districts, represents the traditionally emigration region with at least twice as high share of population abroad than the average in Serbia which amounts to 4 per cent. This zone includes municipalities with record high share of persons residing or working abroad (Zabari with 22.6 percent in 1991 and 29.1 percent in 2002, and Malo Crnice with 31.6 percent in 2011). The municipality of Presevo in Zone 2 (Pcinja District), has the highest share, which in 1991 amounted to 7.3 percent, in 2002 – 27.3 percent and in 2011 – 5.4 percent. The share of persons working or staying abroad in Zone 3 (Raska District) was the highest in Novi Pazar (3.4 percent) in 1991, in Sjenica (17.6 percent) and Tutin (17.6 percent) in 2002 and in Tutin (11.9 percent) in 2011. When observing unemployment in the above stated municipalities in Serbia which form pronounced zones of emigration, a rising trend of unemployment is marked. Namely, Zone 1 consists of a population well under way in the demographic ageing and low levels of unemployment are noted. On the other hand, a younger population is found in Zone 2, of Albanian ethnic affiliation. Zone 3 also consists mainly of the younger age groups, of population of Bosniak/Muslim ethnic affiliation. High unemployment is present in this zone which exceeds the unemployment rate in Serbia. In this case, the departure of persons to reside or work abroad relieves the pressure on the labour market (Lukic, 2013).
Immigration
The past months have brought upon increased focus on the issue of irregular migration, as the influx of migrants from conflict zones, mainly intending to transit through Serbia on their path to EU states, has dramatically increased. The Minister of Interior reported on approximately 34,000 people intending to request asylum in Serbia in mid-20155, while the total number of irregular migrants on the territory of Serbia is not reported. Efforts to manage such migration through coordinated actions with the police forces of other transit and destination countries are increasing. Apart from this, immigration to Serbia in recent years mainly consists of Serbian nationals who, once their working careers abroad came to an end, returned either to enjoy their pension, in the case of the first large emigration waves of the late 1960s and early 1970s, or to find a new job in Serbia. These flows originate in the old destination countries for Serbs, such as Germany, Austria, Switzerland and France. In Serbia, there is no official estimate of the number of people who have returned annually in the recent period apart from the Republic Pension Fund estimate of the total number receiving a pension from abroad, which is around 114 thousand. 5 http://www.tanjug.rs/full-view.aspx?izb=186397
11
Foreigners constitute the minority of recent immigrants to Serbia. Most of them are not from the EU countries. The Serbian Ministry of Interior data give some indication of the size and origins of foreign immigrants. This data is also reported on in the Migration Profile of the Republic of Serbia. If those who received first-time residence permits for up to twelve months are considered as the category closest to the definition of an immigrant, in accordance with the EU regulation on migration, then, on average, 3.4 thousand foreigners immigrated to Serbia from 2009 to 2010. In those two years, the biggest inflows were from China, Russia and the former Yugoslav Republics, namely, Bosnia and Herzegovina, Croatia and Macedonia, as well as from Libya. The main reasons for immigration are family reunification (47 percent) and work (40 percent). The sex structure is rather unbalanced; those who came for work are predominantly men (81.5 percent), while the women came mostly for reasons of family reunification (64.3 percent) (IOM, 2012). The latest data collected by the IOM, covering the period up to 2013 shows no changes in the described pattern has occurred. In 2013, the number of Russian immigrants has increased as has the number of those with Libyan citizenship. Family reunification remained the prime reason for immigration (42 percent), while work remained second (38 percent) (IOM, 2014, see also Government of the Republic of Serbia, 2012).
2.1.2. The Brain Drain Phenomenon
A reoccurring concern for policy makers in Serbia is the more recent brain drain phenomenon, consisting of highly educated and technically skilled workers emigrating from Serbia.
In Serbia, emigration of tertiary educated persons rose in the first years of the 1990s, and it is estimated that 30,000 university graduates left Serbia and Montenegro during the last decade of the 20th century. The Serbian country report indicates considerable losses of tertiary educated persons, in particular in the industry sector, where the number of researchers and engineers fell by 45 percent in the period between 1990 and 2003. Besides considerable wage differentials, the sharp decline in research and development and lacking opportunities for professional development push highly educated persons out of their country (Pejin-Stokic, 2012). Also an analysis of issued immigrant visas to highly qualified persons which have been emigrating from Serbia leads to the conclusion that the brain drain was intensified in the last two decades of the 20th century. It is estimated that 10 to 12 percent of persons who emigrated to overseas countries had tertiary education. The USA and Canada were the two most important destinations for experts emigrating from Serbia, while the EU countries were recognized as ‘destination for future migration of scientists’. Among highly qualified persons who were granted immigration visas at the end of the last decade of the 20thcentury for the USA and Canada, the persons with professional and technical specialties i.e. scientists, engineers and mathematicians participated with the
12
greatest share. The phenomenon of brain drain takes on a greater dimension when data on the number of highly educated young experts and students from Serbia who were granted temporary visas as well as the data on the number of scientists from Serbia who live and work worldwide are taken in consideration. The greatest number is in the USA, followed by the United Kingdom, Germany, Canada, Sweden, and Switzerland (Lukic, 2013).
Such migratory movements characterized by the emigration of the highly educated younger population causes structural changes in the labour force, resulting in negative consequences in terms of labour productivity, economic growth and development (Manic, 2012). What causes additional concern are the results of the World Economic Forum Report the
2010-2011 period according to which Serbia is still highly ranked in view of the extent of circumstances which encourage the brain drain phenomenon (Pejin-Stokic, 2012).
2.1.3. International Labour Migration Outlook
Migration is a potent driver of population change. Migrants are mostly young adults and their persistent, long-term emigration may therefore modify the population age structure at source. In the countries where migration is feminized, it may also distort the sex structure. Migration has a direct impact on the number of births, as it decreases the population of potential mothers. Couples often emigrate with the children born to them prior to emigration. These factors contribute to the undercutting of the age pyramid. Besides these direct demographic consequences, there are indirect economic and social ones. The demographic processes affect the labour force supply, which can be particularly damaging when emigrants are well educated and do not return. Depending on the educational and occupational structure, the migrants’ productivity and the innovativeness of the economy may be affected. Over time, large dents in the young adult age groups may lead to a decrease in the in-family care of the elderly (IOM, 2013).
Analysis has been performed (Lukic, 2013) to anticipate the effect Serbia's expected EU accession will have on external labour migration of the citizens of Serbia. It has been projected that already in the near future, the net migration losses might reduce slightly, owing to the financial crisis in Europe. The reduction in emigration flows from Serbia, particularly to the new destinations such as Italy and Slovenia has, in fact, already been observed. Simultaneously, the slow economic recovery should reduce unemployment, which could also lead to a decrease in emigration. Immigration, consisted primarily of nationals who finished their working careers abroad, will probably remain more or less stable over time. Overall, we would thus assume a reduction in the net migration loss of some 10 percent every five years until the EU accession date. In addition, the perspective of Serbia’s joining the EU may generate a deferred demand for emigration, to be realized after Serbia’s accession.
13
Serbia’s accession to the EU could have an important effect, manifested in large-scale emigration of an explosive but relatively short-lived nature, as it happened with the emigration flows of Poles, Lithuanians, Latvians and Slovaks after the 2004 EU enlargement. This is supported by the results of the representative survey from 2010 aimed at estimating the potential for emigration from Serbia. There are also strong pull factors ahead: in the late 2010s and early 2020s, the working life of the post-war baby boom population in Western Europe will come to an end, creating a huge gap on the labour market. However, from a demographic point of view, the number of potential emigrants from Serbia could also be significantly depleted before the EU accession date, mainly due to the same cause, that is, the retiring of the vast majority of the post-war baby boom generations. Therefore, the post-accession net emigration from Serbia should can be thought to be relatively lower. After the short period of high volume emigration induced by the EU accession, it is reasonable to expect a rapid reduction of net migration loss and, finally, a turn towards positive net migration some 10-15 years later. This assumption is justified by the experience of Central European countries such as, for example, the Czech Republic, which turned from a negative migration balance in the 1980s to a positive one in the 1990s and 2000s. In that sense, the significance of immigration from third countries will most likely rise over time. Such a trend could be anticipated from the recent flow data, also having in mind the inflows from the South East Europe region. This scenario is reinforced, when the population and labour force decline and ageing (see below), which are clearly identified characteristics of contemporary Serbia, are considered (Lukic, 2013).
2.2. Internal Labour Migration Labour mobility in Serbia cannot be examined in isolation - at least two other key issues and their multifaceted interplay must be taken into serious consideration: the demographic aging of the Serbian population and the large regional disparities which are intensified when the rural/urban divide is also included into the equation. This section will provide an account of the information accumulated up to date on these issues through previous research and analysis. In drawing final conclusions and identifying key points of interest for policy makers, these findings will be triangulated with the results of the primary labour mobility data analysis collected through the Labour Force Survey by the Republic's Statistic Office.
2.2.1. A Regional Perspective on Demographic Changes Unlike Europe as a whole, Serbia has been losing population in the last decade, mainly through natural change. In order to provide an image of the population change, the intercensal population change 2002-2011 should be adjusted in order to counteract the
14
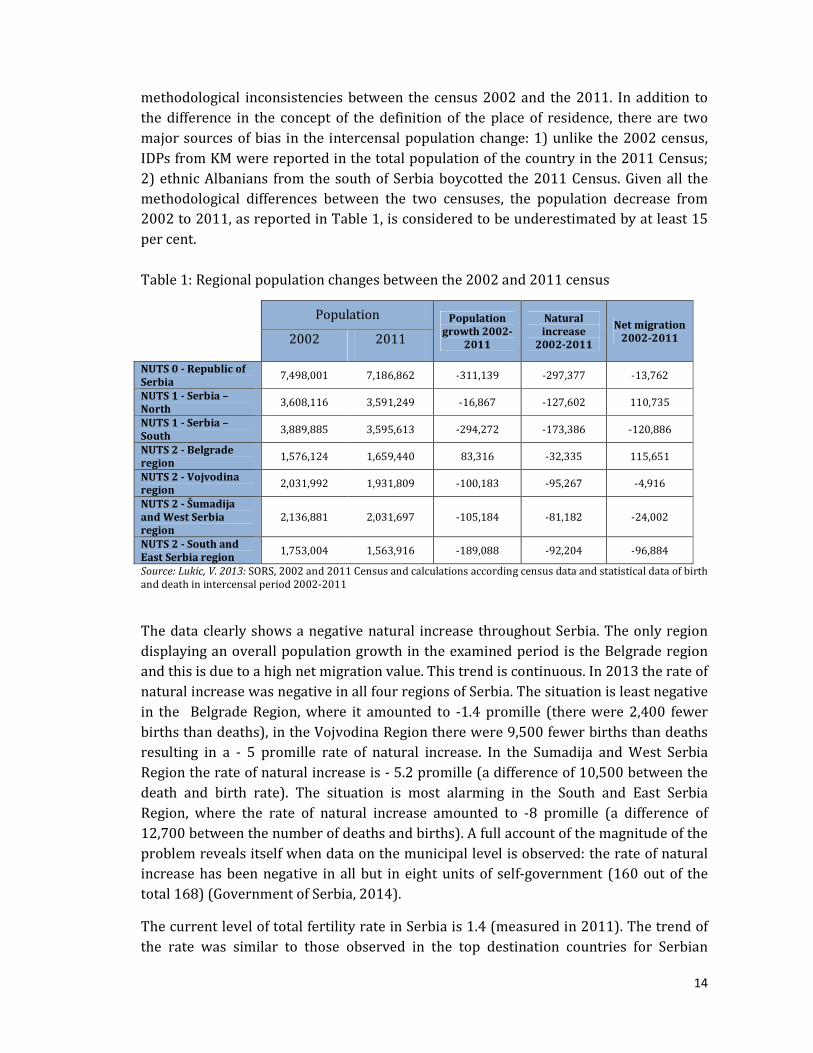
methodological inconsistencies between the census 2002 and the 2011. In addition to the difference in the concept of the definition of the place of residence, there are two major sources of bias in the intercensal population change: 1) unlike the 2002 census, IDPs from KM were reported in the total population of the country in the 2011 Census; 2) ethnic Albanians from the south of Serbia boycotted the 2011 Census. Given all the methodological differences between the two censuses, the population decrease from 2002 to 2011, as reported in Table 1, is considered to be underestimated by at least 15 per cent. Table 1: Regional population changes between the 2002 and 2011 census
Population Population
growth 2002-2011
Natural increase
2002-2011
Net migration 2002-2011 2002 2011
NUTS 0 - Republic of Serbia
7,498,001 7,186,862 -311,139 -297,377 -13,762
NUTS 1 - Serbia – North
3,608,116 3,591,249 -16,867 -127,602 110,735
NUTS 1 - Serbia – South
3,889,885 3,595,613 -294,272 -173,386 -120,886
NUTS 2 - Belgrade region
1,576,124 1,659,440 83,316 -32,335 115,651
NUTS 2 - Vojvodina region
2,031,992 1,931,809 -100,183 -95,267 -4,916
NUTS 2 - Šumadija and West Serbia region
2,136,881 2,031,697 -105,184 -81,182 -24,002
NUTS 2 - South and East Serbia region
1,753,004 1,563,916 -189,088 -92,204 -96,884
Source: Lukic, V. 2013: SORS, 2002 and 2011 Census and calculations according census data and statistical data of birth and death in intercensal period 2002-2011
The data clearly shows a negative natural increase throughout Serbia. The only region displaying an overall population growth in the examined period is the Belgrade region and this is due to a high net migration value. This trend is continuous. In 2013 the rate of natural increase was negative in all four regions of Serbia. The situation is least negative in the Belgrade Region, where it amounted to -1.4 promille (there were 2,400 fewer births than deaths), in the Vojvodina Region there were 9,500 fewer births than deaths resulting in a - 5 promille rate of natural increase. In the Sumadija and West Serbia Region the rate of natural increase is - 5.2 promille (a difference of 10,500 between the death and birth rate). The situation is most alarming in the South and East Serbia Region, where the rate of natural increase amounted to -8 promille (a difference of 12,700 between the number of deaths and births). A full account of the magnitude of the problem reveals itself when data on the municipal level is observed: the rate of natural increase has been negative in all but in eight units of self-government (160 out of the total 168) (Government of Serbia, 2014).
The current level of total fertility rate in Serbia is 1.4 (measured in 2011). The trend of the rate was similar to those observed in the top destination countries for Serbian
15
emigrants. The average age of women at first birth increased from 25.3 years in 2002 to 27.5 years in 2011, while the crude death rate (14.2 per thousand in 2011) is among the highest in Europe due to the very old age structure and relatively high age-specific mortality rates of the middle-aged and elderly population. If compared to the top countries of destination for Serbian emigrants, life expectancy at birth (2011) in Serbia is lower by 5-7 years for males and 6-8 years for females (71.5 and 76.7 years, respectively) (Lukic, 2013). The presented data point out to an increasing problem of Serbia's society - that of its population aging.
Population Aging and the Related Socio-economic Effects
Population ageing (observed from the middle of the 20th century) is a process which has been lasting in Serbia for over 40 years, beginning from the end of the 1960s when population was demographically younger. According to the 2011 Census, Serbia is one of the demographically oldest countries in the world with an average age of 42.2 years, ageing index of 1.22 and the share of people aged 65 and over of 17.4 per cent in total population. The region of South and East Serbia is affected the most with average age of 43.3 years. On NUTS-3 level, the highest average age is 46.7 years in Zajecar area.
According to the Census 2011, the share of the population below 15 years of age is 14.3 percent, while the share of the population aged 65 and over is 17.4 percent in 2011. The NUTS-3 regions with the highest share of young population also have the lowest share of elderly population and vice versa. On the one side is Raska area with 19.1 percent and 14.3 percent, and on the other side is Zajecar area with 11.5 percent and 24.2 percent, respectively. The female population is demographically older than the male by 2.7 years in 2011. Females are more numerous than males, consisting 51.3 per cent of the total population of Serbia. The males outnumber the females only in three NUTS-3 level areas - Pirot, Toplica and Pcinja.
The age-dependency ratio (population aged 0-14 and 65 years and over to population aged 15-64 years) in Serbia amounts to 46.3, the young-age-dependency ratio (population aged 0-14 years to population 15-64 years) amounts to 20.9 and the old-age-dependency ratio (population aged 65 years and over to population 15-64 years) amounts to 25.5 (Lukic, 2013). These age dependency ratios are important indicators in understanding and analyzing the socio-economic prospects. The more people in the retirement age group and those still in education will have to be supported by the same number of those in the economically active age category.
The total dependency ratio is increasing and it is expected that the aging effects will particularly manifest themselves in this decade. This is the case, since the cohort born during the economic transition, reaching working age is small. The problem is additionally intensified as their labour market participation is postponed due to prolonged education and few employment opportunities. It is therefore no surprise that the ratio of potential support (number of persons aged 15 to 64 per every person aged 65 or older) which was 4.87 at the end of the last century (above the EU average) as started decreasing rapidly in the first decade of this century and is expected to reach
16
only 2.43 by mid-21st century. Unlike the highly developed countries of Western and Northern Europe which shall maintain a relatively stable proportion of the 30-49 age cohort among the total working age population, in Serbia this cohort is decreasing. If also the 1995-2005 migration data, which indicates approximately half a million of Serbian citizens emigrated in this period is observed, the situation appears to be even more worrisome.
Such migratory movements caused not only a momentary decrease in the size of the population but also created long-term demographic effects in terms of the future generation losses as well as structural changes (as the majority of emigrants at the end of last century and beginning of this century were highly educated and young - see section 2.1.2).
Such a changed population structure is no longer only a demographic problem as the economic transition period worsened what were already negative trends in terms of the demographic transition trends. Therefore more than demographic means must be applied to remedy the situation. These refer to human capital investment that is to increase the labour productivity and partially compensate for the decreasing number of working age population through higher education and achievements of the working age population (Manic, 2012).
2.2.2. The Demographic and Socio-Economic Rural - Urban Divide and Labour Migration The Rural-Urban Divide
A recent regional Human Development Report (UNDP, 2011) conducted in Serbia shows levels of social exclusion up to four times as high in rural compared to urban areas. In sum, it concludes that in Serbia, people living in rural areas face less access to networks, employment opportunities, goods, and services, including transport services. Migration to urban areas is often considered the only option left for young people. The report also looks at the existence of inequalities between rural and urban areas in terms of access to pre-school education, water and sewage systems, and energy, suggesting that the multiplier effect of all these exclusions is significant (Pejin-Stosic, 2012).
The data collected by the RSO corroborates these conclusions. The demographic indicators of rural areas are much less favorable than those in urban areas. The population density (50 inhabitants per km2) is 10 times lower than in urban areas, while it is almost two times lower than the average population density in Serbia. The inhabitants of rural areas currently comprise 40.6 percent of the overall populations which 3 percent less in comparison to the previous census, while the average age of the rural population (43.6 years) is two years higher than that of urban areas. In 2010 the aging index was 130 compared to 94 in urban areas, while 82.5 percent of rural
17
dwellings had a negative natural increase and not a single child was born in 31 percent of these dwellings.
This is coupled with the problems of poverty, regional and developmental inequalities, migration, depopulation, poorer education, poor local initiatives and competitiveness, loss of natural and cultural heritage and overall increased vulnerability of the rural population. In the period 2011-2013 the percentage of poor was twice as high in rural areas as compared to urban areas. In 2013 12 percent of the rural population suffered from absolute poverty, while this was the case for 6.3 percent of the urban population. It has been shown that households that poses between one a five hectors of land responded most severely to the economic crisis. At the same time, according to the agricultural census, 76 percent of households belong to this category (accounting for only 30 percent of the total agricultural land).
In the 2011-2013 period the basic labour market indicators suggest better performance of the inhabitants (15-64 years of age) of rural areas compared to those from urban areas. The participation and employment rates are higher, while the unemployment rate is lower. In 2011 the unemployment rate was 21.9 percent and has since decreased, amounting to 19.9 percent in 2013. The employment rate increased by 2.8 percentage points in the same period (from 47.4 to 50.2 percent). However, the proportion of those in vulnerable employment (self-employed and contributing family members, mainly employed in agriculture of low productivity) as well as the age and educational structure are much less favorable. The percentage of self-employed has increased by 3.5 percentage points between 2011 and 2013 and self-employment is twice as common in rural as compared to urban areas, while the percentage of contributing family members in rural areas is approximately 16. It should be added that in rural areas, the risk of poverty is most pronounced among the self-employed, most of which are farmers (Government of Serbia, 2014).
Having all of the above in mind, it is clear that one of the main migratory processes occurring in Serbia is the move from rural to urban environments. Data clearly demonstrates this process. According to the 2012 Migration Profile of the Republic of Serbia, 121,891 people have moved during 2012. Out of these, 68 percent moved to urban areas, most of which (56.8 percent) were women (Government of the Republic of Serbia, 2012).
The second half of the 20th century has been characterized by a very pronounced process of primary urbanization that is intense migratory movements from villages to cities leading to significant spatial-demographic changes. This process of demographic polarization leads to formation of zones of demographic expansion and zones of constant depopulation. This migratory movement is continuous, and its intensity has waned only after the traditional demographic 'reservoirs', extremely rural areas' have emptied.
18
Zones of demographic expansion are typically spatially restricted with a high level of population and activity agglomeration and are characterized by a relatively positive demographic outlook. Contrary to these, zones of depopulation are territorially large and relatively poorly inhabited areas, they are dominantly rural and are accompanied by all of the negative effects steaming from a shrinking population. Demographic expansion is concentrated around fast growing urban centers which are placed alongside the main developmental axes, out of which the (Sava) Danube-Morava axes is most significant due its positioning along a key international multi-modular corridor (Corridor X). Out of the five Serbian cities which are inhabited by over 100,000 people, four lay in this zone (Subotica, Novi Sad, Belgrade and Nis), while the fifth, Kragujevac, is placed just beside it (Stojanovic, 2005).
Data shows that 60.7 percent, that is 72 percent of the employed in the Republic of Serbia live on 24.3 percent of the territory of the Republic of Serbia (in 23 cities) (Government of Serbia, 2014).
Regional Disparities
Besides the large differences in key socio-economic indicators between rural and urban areas of Serbia, large disparities exist also among Serbian regions.
When the poverty risk is examined, these disparities are highlighted: the Belgrade Region (11.6 percent) is the only with a poverty risk rate lower than average (24.6 percent)- in fact, the poverty risk rate is two times lower in the Belgrade Region compared to the Serbian average. The regions where the poverty risk is most pronounced are the East and South Serbia Region (31 percent), followed by the Sumadija and West Serbia Region (28.2 percent). The Vojvodina Region is doing slightly better in respect to this indicator, as 26.8 percent of its inhabitants are at risk of poverty. These data are consistent with the educational attainment data and unemployment rates, according to which similar disparities are noted among the four Serbian regions (Government of Serbia, 2014).
Regional labour market differences tend to deepen and persist during the process of economic transition, with typically the capital city and a few privileged regions experiencing fast growth and a tight labour market, while the rest of the country sinks into prolonged recession, becoming a zone of high unemployment and low wages6.
6 For more municipality relevant data see the DevInfo data base at http://devinfo.stat.gov.rs/DI6Web/home.aspx,
while information on available measures aiming at regional development see the Registy of such measures at http://www.apr.gov.rs.
19
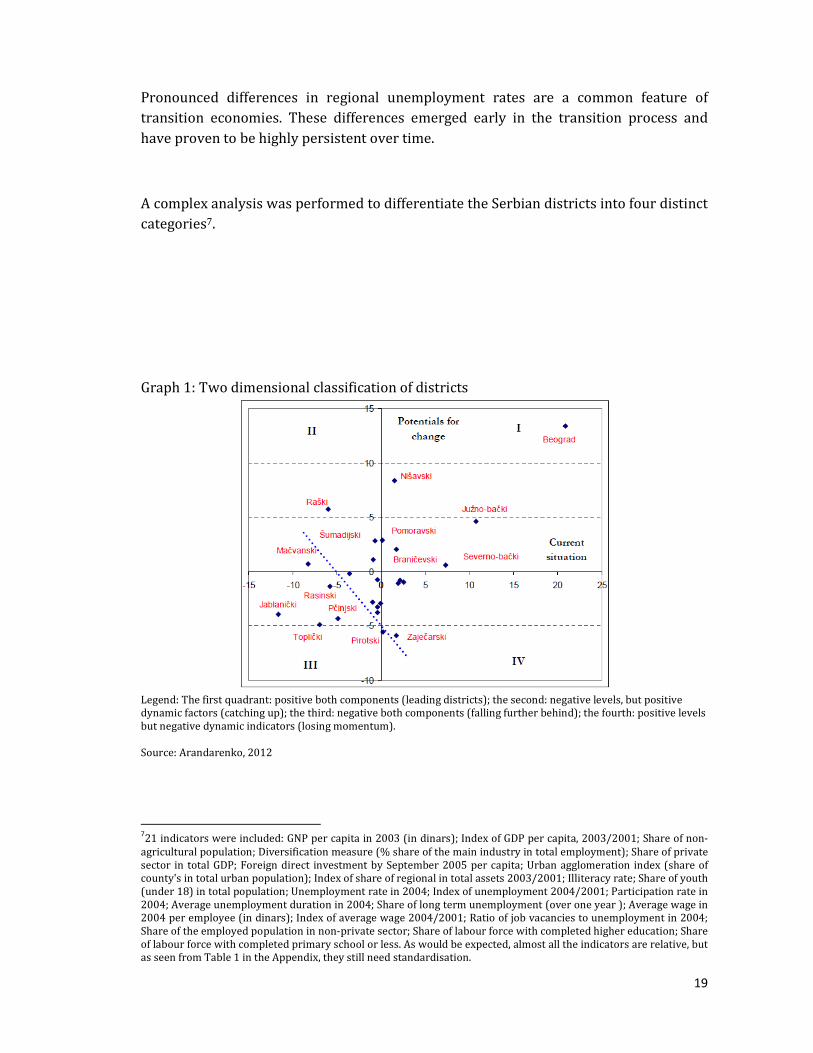
Pronounced differences in regional unemployment rates are a common feature of transition economies. These differences emerged early in the transition process and have proven to be highly persistent over time.
A complex analysis was performed to differentiate the Serbian districts into four distinct categories7.
Graph 1: Two dimensional classification of districts
Legend: The first quadrant: positive both components (leading districts); the second: negative levels, but positive dynamic factors (catching up); the third: negative both components (falling further behind); the fourth: positive levels but negative dynamic indicators (losing momentum). Source: Arandarenko, 2012
721 indicators were included: GNP per capita in 2003 (in dinars); Index of GDP per capita, 2003/2001; Share of non-agricultural population; Diversification measure (% share of the main industry in total employment); Share of private sector in total GDP; Foreign direct investment by September 2005 per capita; Urban agglomeration index (share of county's in total urban population); Index of share of regional in total assets 2003/2001; Illiteracy rate; Share of youth (under 18) in total population; Unemployment rate in 2004; Index of unemployment 2004/2001; Participation rate in 2004; Average unemployment duration in 2004; Share of long term unemployment (over one year ); Average wage in 2004 per employee (in dinars); Index of average wage 2004/2001; Ratio of job vacancies to unemployment in 2004; Share of the employed population in non-private sector; Share of labour force with completed higher education; Share of labour force with completed primary school or less. As would be expected, almost all the indicators are relative, but as seen from Table 1 in the Appendix, they still need standardisation.

20
As we see there are clear distinctions in respect the current level of development and potential for change when the districts of Serbia are examined in light of a broad set of economic and social indicators. The Belgrade district clearly stands out both with regards the current level of development and potential for further change. The South Backi and North Backi are considered to be second in terms of current development, but the Nisavski district is considered to have the most potential for further development among the group of 'second-runners'. Conversely the Rasinski, Jablanicki, Toplicki and Pirotski have been estimated to be lagging the most in terms of development and it is considered they will in fact lag back further in the future.
In Serbia, as in other transition countries, catching up tends to be driven by a small number of growth poles, while other regions lag behind, thus leading, almost inevitably, to an increase in regional disparities. This effect appears to be stronger where levels of national GDP per capita are well below the EU-15 average. At the early stages of reconstruction and development, the largest share of public investment is usually deliberately focused on the most efficient projects, many of which tend to be located in the national growth poles. On the other hand, lack of investment capital in the depressed regions and fast restructuring of the economy, which produces additional unemployment, are adding to the problem of regional differences in transition economies. Such regions display persistent differences in both earnings and unemployment rates, so that in general regions which have high unemployment also tend to have low wages.
Further, it has been established that cross-regional labour mobility has also remained low and has played a minimal role in equilibrating regional disparities. Workers in depressed regions appear often to be caught in a 'poverty-cum-liquidity trap', and their incomplete information about job opportunities elsewhere makes moving yet more difficult (Arandarenko, 2012). Workers are quite immobile in Serbia due to low wages, shortage of affordable housing and reliance on kinship and social networks. Since these features are quite persistent and even intensifying in the times of crisis, the more promising way to capture regional unemployment differences is to create more jobs in the regions which need them most (Arandarenko, 2007).
Despite this, as already explained in the section on the rural/urban divide, internal migration has been a noted phenomenon in Serbia with certain regularities and trends.
In Serbia, high migration loss regions are those districts in the Eastern part of the country bordering Romania and Bulgaria which suffered a considerable decrease in mining and processing industries. Poverty and social exclusion is highly concentrated in the South and the East of Serbia, although the degree of inequality in access to services is, to an extent, limited by national policies favoring disadvantaged areas. At the same time, receipt of social assistance is higher in those areas which have better organized local social plans, such as Vojvodina, even though poverty risk is less. The economies of
21
the high migration loss regions are characterized by a decline in industrial production and high employment shares in agriculture (Pejin-Stosic, 2012).
3. Labour Migration Data This chapter will bring forward the analysis of two sets of primary data: the Labour Force Survey data and the data steaming from the National Employment Service Unified Information System.
3.1. Labour Force Survey Data Analysis The Labour Force Survey (LFS) is a survey which is regularly conducted by the Republic's Statistical Office (RSO) with the aim of collecting data about the labour force in Serbia. Since this year the data is collected continuously, whereas in the past it has been collected on a semi-annual and quartile basis. The LFS instrument and data collection methodology are entirely in-line with international standards and recommendations - those of the International Labour Office and the European Statistical Office. Mainly, the focus is on harvesting information about the principle three categories on the labour market: the employed, unemployed and inactive8. Yet, through the LFS, also other significant data may be extracted and analyzed. This includes important information on labour migration - both international and internal. Upon request, for the purpose of this research, selected indicators have been computed by the RSO. This chapter will report on and analyze the identified indicators describing labour mobility steaming from LFS data.
3.1.1. International Migration
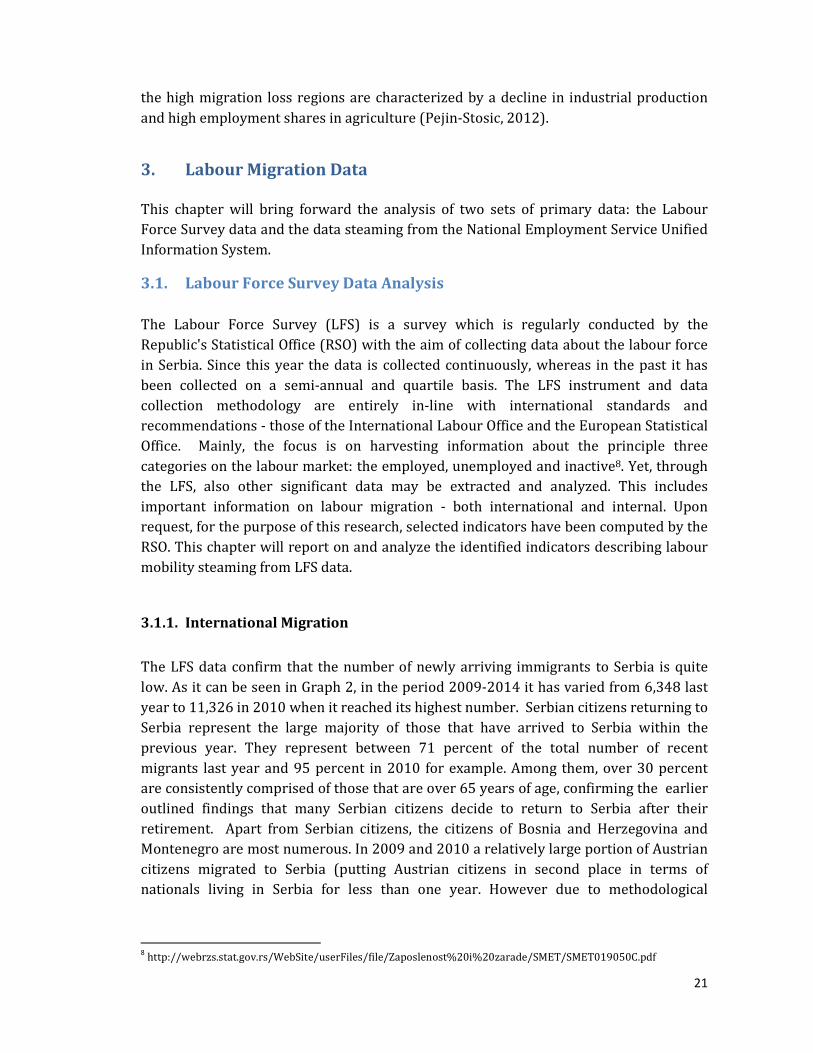
The LFS data confirm that the number of newly arriving immigrants to Serbia is quite low. As it can be seen in Graph 2, in the period 2009-2014 it has varied from 6,348 last year to 11,326 in 2010 when it reached its highest number. Serbian citizens returning to Serbia represent the large majority of those that have arrived to Serbia within the previous year. They represent between 71 percent of the total number of recent migrants last year and 95 percent in 2010 for example. Among them, over 30 percent are consistently comprised of those that are over 65 years of age, confirming the earlier outlined findings that many Serbian citizens decide to return to Serbia after their retirement. Apart from Serbian citizens, the citizens of Bosnia and Herzegovina and Montenegro are most numerous. In 2009 and 2010 a relatively large portion of Austrian citizens migrated to Serbia (putting Austrian citizens in second place in terms of nationals living in Serbia for less than one year. However due to methodological
8 http://webrzs.stat.gov.rs/WebSite/userFiles/file/Zaposlenost%20i%20zarade/SMET/SMET019050C.pdf
22
differences introduced to improve the data collection in the recent years, and the low number of observed cases, these findings should be interpreted with caution. Graph 2: Recent migrants to Serbia
Source: LFS Data 2008-2014; RSO, 2015
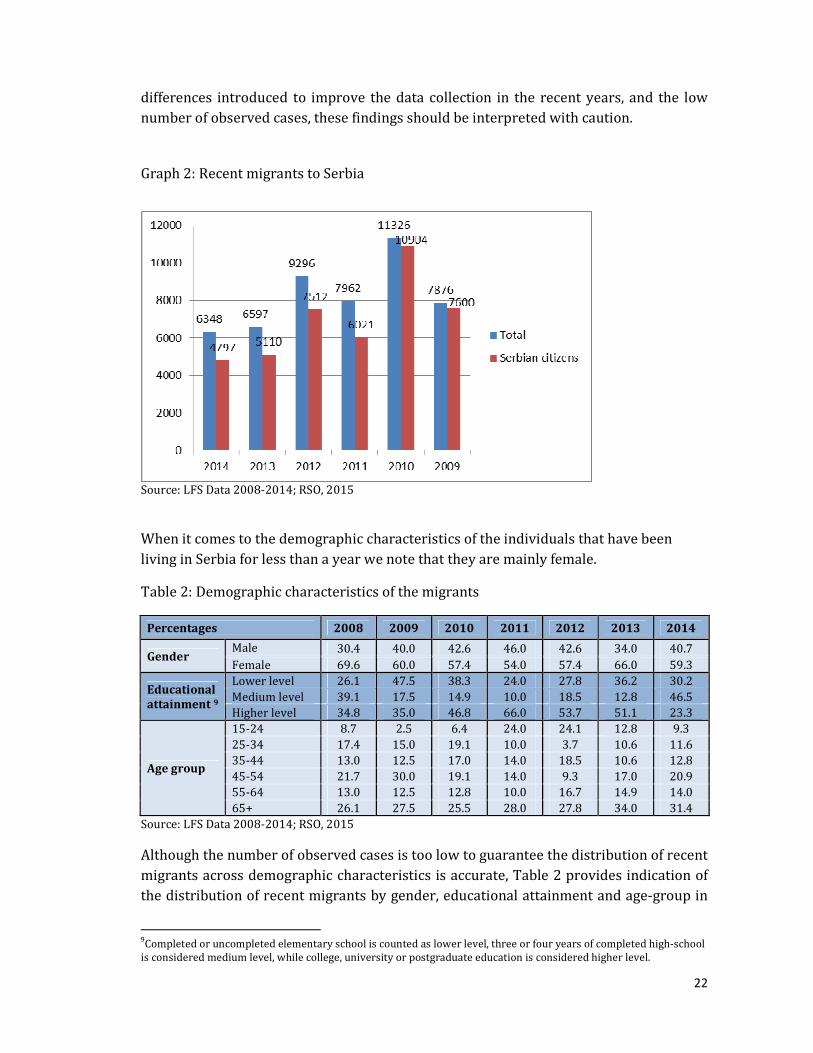
When it comes to the demographic characteristics of the individuals that have been living in Serbia for less than a year we note that they are mainly female.
Table 2: Demographic characteristics of the migrants
Percentages 2008 2009 2010 2011 2012 2013 2014
Gender Male 30.4 40.0 42.6 46.0 42.6 34.0 40.7 Female 69.6 60.0 57.4 54.0 57.4 66.0 59.3
Educational attainment 9
Lower level 26.1 47.5 38.3 24.0 27.8 36.2 30.2 Medium level 39.1 17.5 14.9 10.0 18.5 12.8 46.5 Higher level 34.8 35.0 46.8 66.0 53.7 51.1 23.3
Age group
15-24 8.7 2.5 6.4 24.0 24.1 12.8 9.3 25-34 17.4 15.0 19.1 10.0 3.7 10.6 11.6 35-44 13.0 12.5 17.0 14.0 18.5 10.6 12.8 45-54 21.7 30.0 19.1 14.0 9.3 17.0 20.9 55-64 13.0 12.5 12.8 10.0 16.7 14.9 14.0 65+ 26.1 27.5 25.5 28.0 27.8 34.0 31.4
Source: LFS Data 2008-2014; RSO, 2015
Although the number of observed cases is too low to guarantee the distribution of recent migrants across demographic characteristics is accurate, Table 2 provides indication of the distribution of recent migrants by gender, educational attainment and age-group in
9Completed or uncompleted elementary school is counted as lower level, three or four years of completed high-school is considered medium level, while college, university or postgraduate education is considered higher level.
23
the 2008-2009 period. Apart from the already mentioned prevalence of women and of the eldest age category not much regularity can be found, that is the structure varies from year to year.
3.1.2. Internal Migration
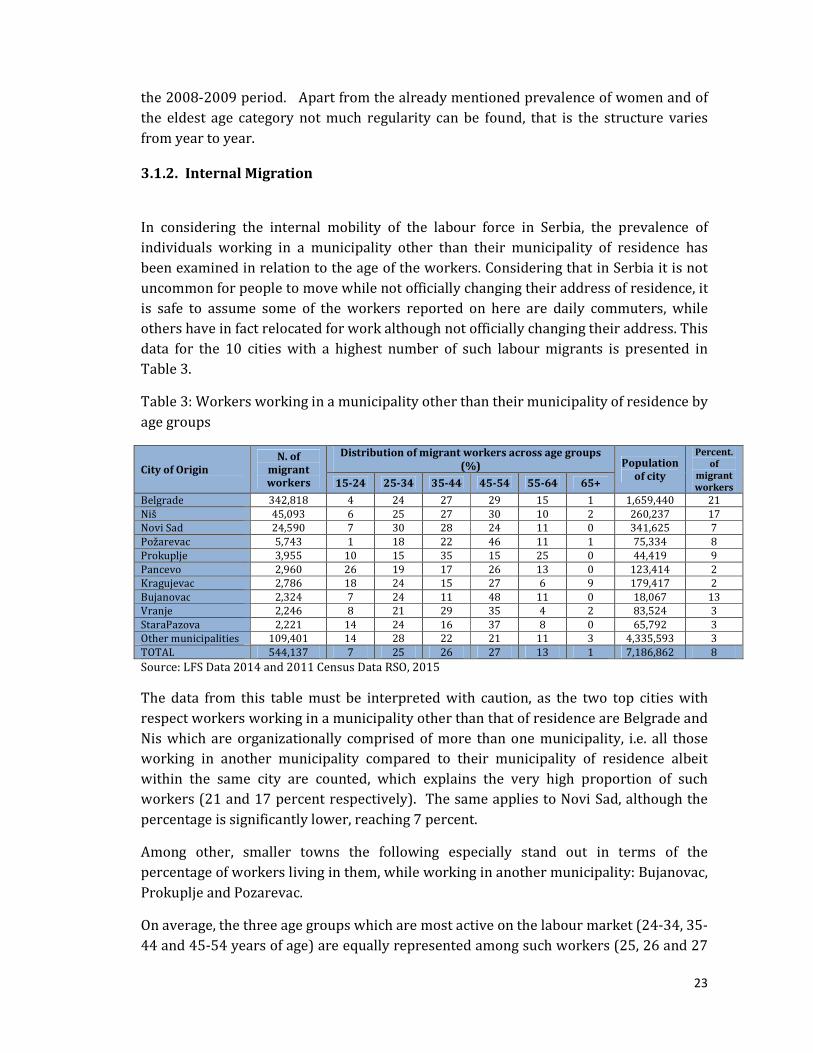
In considering the internal mobility of the labour force in Serbia, the prevalence of individuals working in a municipality other than their municipality of residence has been examined in relation to the age of the workers. Considering that in Serbia it is not uncommon for people to move while not officially changing their address of residence, it is safe to assume some of the workers reported on here are daily commuters, while others have in fact relocated for work although not officially changing their address. This data for the 10 cities with a highest number of such labour migrants is presented in Table 3.
Table 3: Workers working in a municipality other than their municipality of residence by age groups
City of Origin N. of
migrant workers
Distribution of migrant workers across age groups (%) Population
of city
Percent. of
migrant workers 15-24 25-34 35-44 45-54 55-64 65+
Belgrade 342,818 4 24 27 29 15 1 1,659,440 21 Niš 45,093 6 25 27 30 10 2 260,237 17 Novi Sad 24,590 7 30 28 24 11 0 341,625 7 Požarevac 5,743 1 18 22 46 11 1 75,334 8 Prokuplje 3,955 10 15 35 15 25 0 44,419 9 Pancevo 2,960 26 19 17 26 13 0 123,414 2 Kragujevac 2,786 18 24 15 27 6 9 179,417 2 Bujanovac 2,324 7 24 11 48 11 0 18,067 13 Vranje 2,246 8 21 29 35 4 2 83,524 3 StaraPazova 2,221 14 24 16 37 8 0 65,792 3 Other municipalities 109,401 14 28 22 21 11 3 4,335,593 3 TOTAL 544,137 7 25 26 27 13 1 7,186,862 8 Source: LFS Data 2014 and 2011 Census Data RSO, 2015
The data from this table must be interpreted with caution, as the two top cities with respect workers working in a municipality other than that of residence are Belgrade and Nis which are organizationally comprised of more than one municipality, i.e. all those working in another municipality compared to their municipality of residence albeit within the same city are counted, which explains the very high proportion of such workers (21 and 17 percent respectively). The same applies to Novi Sad, although the percentage is significantly lower, reaching 7 percent.
Among other, smaller towns the following especially stand out in terms of the percentage of workers living in them, while working in another municipality: Bujanovac, Prokuplje and Pozarevac.
On average, the three age groups which are most active on the labour market (24-34, 35-44 and 45-54 years of age) are equally represented among such workers (25, 26 and 27
24
percent respectively). However in Bujanovac, Pozarevac, Stara Pazova and Vranje the eldest of these three cohorts has proven to be most mobile.
In the past four years an overall increasing trend in the number of such mobile workers has been noted as in 2011, 503,524 daily commuters were counted and slightly fewer, 495,519 in 2012. A large increase of such workers was recorded in 2013 and 2014, when 534,469 and 544,137 respectively have been registered.
Table 4: Workers working in a municipality other than their municipality of residence by educational attainment
City (%) Lower level
Medium level
Higher level
Belgrade 5 53 41
Niš 7 71 22
Novi Sad 8 66 26
Požarevac 9 70 22
Prokuplje 15 50 35
Pancevo 9 68 23
Kragujevac 0 88 12
Bujanovac 4 70 26
Vranje 10 63 27
StaraPazova 14 57 29
Other municipalities
12 60 28
TOTAL 7 58 35
Source: LFS Data 2014, RSO, 2015
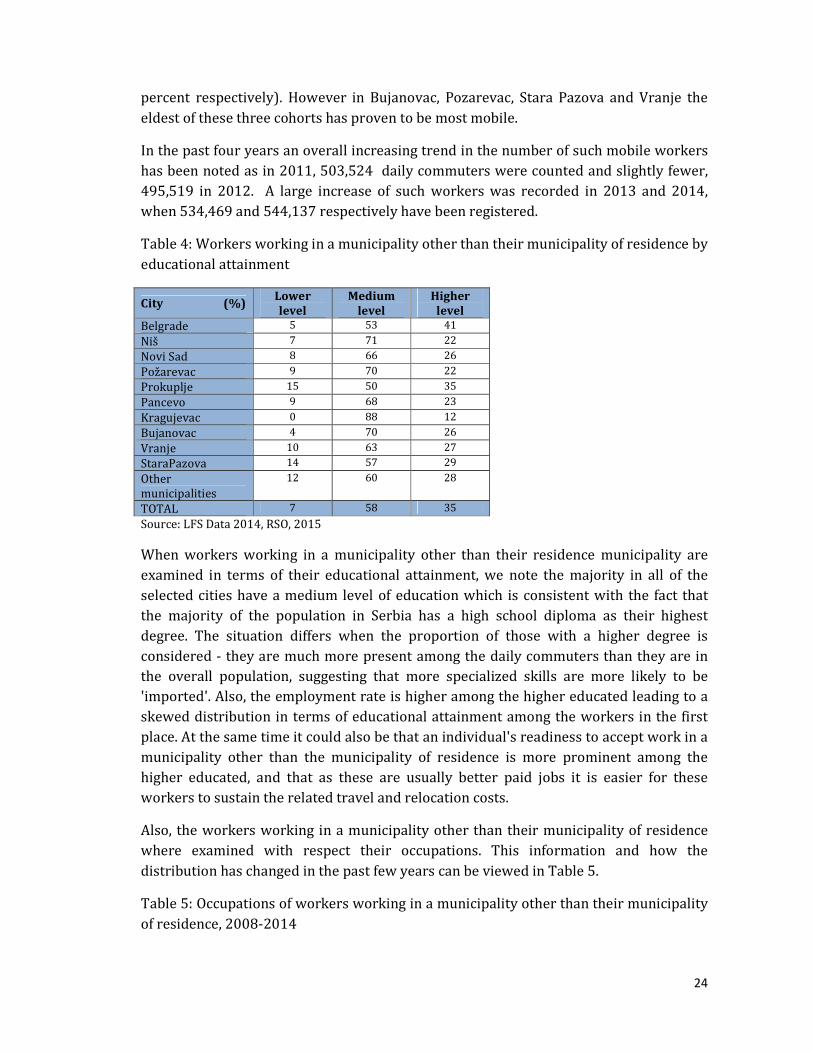
When workers working in a municipality other than their residence municipality are examined in terms of their educational attainment, we note the majority in all of the selected cities have a medium level of education which is consistent with the fact that the majority of the population in Serbia has a high school diploma as their highest degree. The situation differs when the proportion of those with a higher degree is considered - they are much more present among the daily commuters than they are in the overall population, suggesting that more specialized skills are more likely to be 'imported'. Also, the employment rate is higher among the higher educated leading to a skewed distribution in terms of educational attainment among the workers in the first place. At the same time it could also be that an individual's readiness to accept work in a municipality other than the municipality of residence is more prominent among the higher educated, and that as these are usually better paid jobs it is easier for these workers to sustain the related travel and relocation costs.
Also, the workers working in a municipality other than their municipality of residence where examined with respect their occupations. This information and how the distribution has changed in the past few years can be viewed in Table 5.
Table 5: Occupations of workers working in a municipality other than their municipality of residence, 2008-2014
25
Occupation (%) 2008 2009 2010 2011 2012 2013 2014
Distribution among all
employees, 2014
Managers, functionaries, policy makers
5.5 5.2 4.5 4.0 4.4 3.3 3.4 3.5
Experts and artists 20.5 19.2 20.2 18.9 17.4 19.5 20.9 12.9 Engineers and technicians 22.0 21.3 21.7 20.8 20.8 19.9 20.1 12.1 Administrative clerks 7.9 7.4 7.9 8.3 9.7 10.6 10.7 6.7 Services and sale 14.4 14.3 14.5 14.8 15.7 16.4 15.3 14.5 Farmers, foresters, fishermen and related
1.1 2.9 1.5 1.27 2.0 1.9 1.6 21.0
Craftsmen 13.1 13.3 12.1 12.1 11.3 10.8 11.4 12.1 Machine operators, assemblers, drivers
6.8 7.8 9.1 10.2 11.1 8.3 7.7 7.3
Elementary occupations 7.8 8.0 7.4 8.13 6.0 7.6 7.5 9.4 Military occupations .8 .6 1.1 1.57 1.5 1.6 1.4 0.6 Total 100 100 100 100 100 100 100 100 Source: LFS Data 2008-2014, RSO, 2015
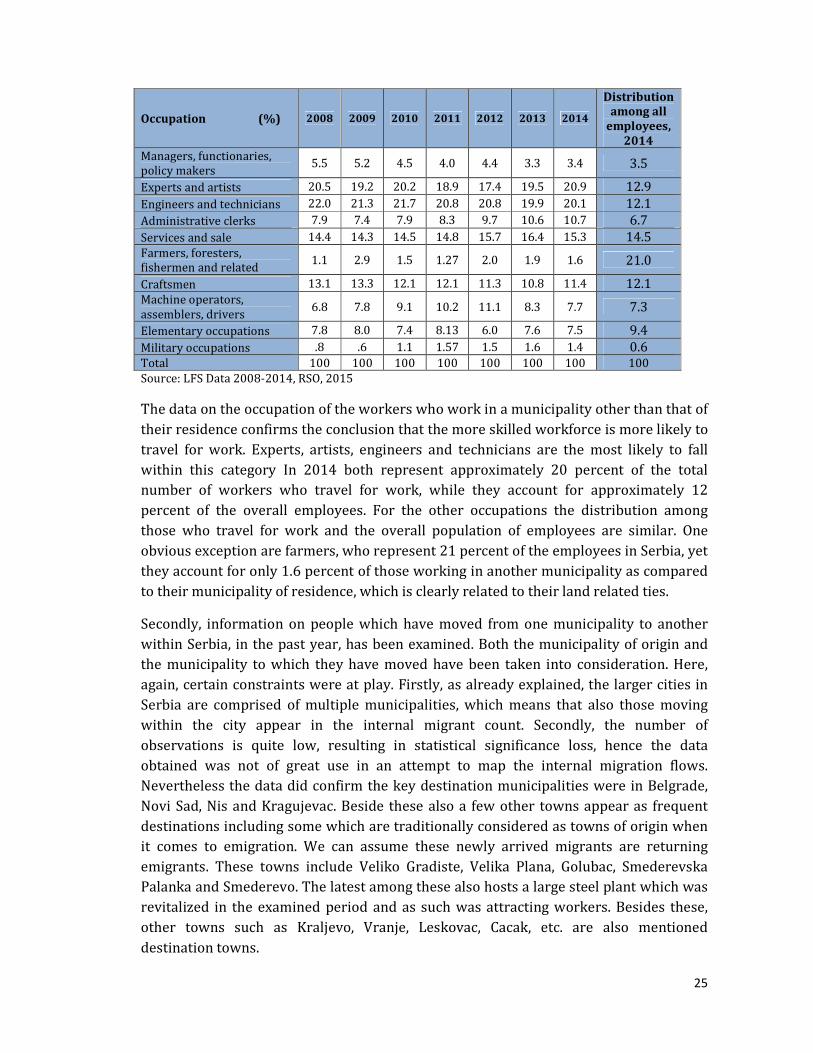
The data on the occupation of the workers who work in a municipality other than that of their residence confirms the conclusion that the more skilled workforce is more likely to travel for work. Experts, artists, engineers and technicians are the most likely to fall within this category In 2014 both represent approximately 20 percent of the total number of workers who travel for work, while they account for approximately 12 percent of the overall employees. For the other occupations the distribution among those who travel for work and the overall population of employees are similar. One obvious exception are farmers, who represent 21 percent of the employees in Serbia, yet they account for only 1.6 percent of those working in another municipality as compared to their municipality of residence, which is clearly related to their land related ties.
Secondly, information on people which have moved from one municipality to another within Serbia, in the past year, has been examined. Both the municipality of origin and the municipality to which they have moved have been taken into consideration. Here, again, certain constraints were at play. Firstly, as already explained, the larger cities in Serbia are comprised of multiple municipalities, which means that also those moving within the city appear in the internal migrant count. Secondly, the number of observations is quite low, resulting in statistical significance loss, hence the data obtained was not of great use in an attempt to map the internal migration flows. Nevertheless the data did confirm the key destination municipalities were in Belgrade, Novi Sad, Nis and Kragujevac. Beside these also a few other towns appear as frequent destinations including some which are traditionally considered as towns of origin when it comes to emigration. We can assume these newly arrived migrants are returning emigrants. These towns include Veliko Gradiste, Velika Plana, Golubac, Smederevska Palanka and Smederevo. The latest among these also hosts a large steel plant which was revitalized in the examined period and as such was attracting workers. Besides these, other towns such as Kraljevo, Vranje, Leskovac, Cacak, etc. are also mentioned destination towns.
26
Table 6: Employment rates of the populations that have not moved to another municipality as compared to those that have by gender, 2008-2014
Employment rate 2008 2009 2010 2011 2012 2013 2014
Living in the same municipality
Male 53.3 49.2 45.4 43.2 42.9 45.2 46.9
Female 36.5 34.0 31.2 29.0 28.8 30.9 33.1
Total 44.5 41.3 38.0 35.8 35.6 37.8 39.7
Living in another municipality
Male 39.2 38.0 37.2 34.9 28.5 46.0 45.9
Female 29.6 23.8 22.4 21.2 27.5 18.5 28.1
Total 34.7 30.0 28.7 27.8 27.9 28.9 35.4
Source: LFS Data 2008-2014, RSO, 2015
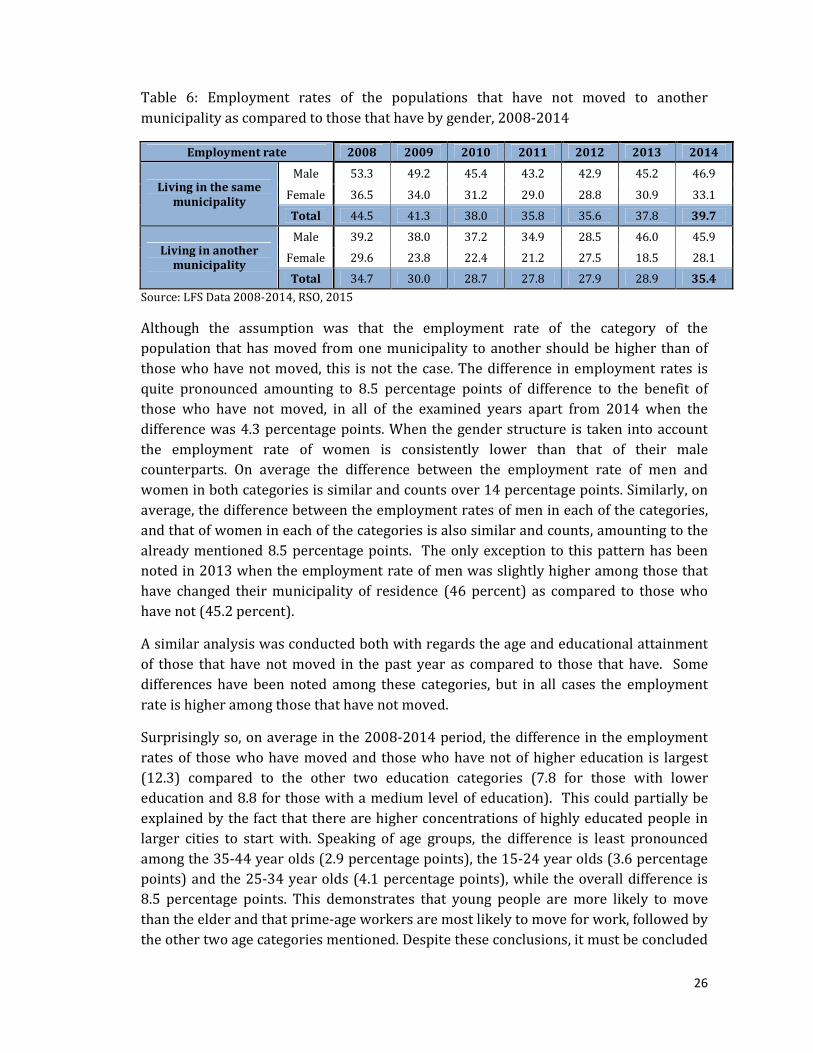
Although the assumption was that the employment rate of the category of the population that has moved from one municipality to another should be higher than of those who have not moved, this is not the case. The difference in employment rates is quite pronounced amounting to 8.5 percentage points of difference to the benefit of those who have not moved, in all of the examined years apart from 2014 when the difference was 4.3 percentage points. When the gender structure is taken into account the employment rate of women is consistently lower than that of their male counterparts. On average the difference between the employment rate of men and women in both categories is similar and counts over 14 percentage points. Similarly, on average, the difference between the employment rates of men in each of the categories, and that of women in each of the categories is also similar and counts, amounting to the already mentioned 8.5 percentage points. The only exception to this pattern has been noted in 2013 when the employment rate of men was slightly higher among those that have changed their municipality of residence (46 percent) as compared to those who have not (45.2 percent).
A similar analysis was conducted both with regards the age and educational attainment of those that have not moved in the past year as compared to those that have. Some differences have been noted among these categories, but in all cases the employment rate is higher among those that have not moved.
Surprisingly so, on average in the 2008-2014 period, the difference in the employment rates of those who have moved and those who have not of higher education is largest (12.3) compared to the other two education categories (7.8 for those with lower education and 8.8 for those with a medium level of education). This could partially be explained by the fact that there are higher concentrations of highly educated people in larger cities to start with. Speaking of age groups, the difference is least pronounced among the 35-44 year olds (2.9 percentage points), the 15-24 year olds (3.6 percentage points) and the 25-34 year olds (4.1 percentage points), while the overall difference is 8.5 percentage points. This demonstrates that young people are more likely to move than the elder and that prime-age workers are most likely to move for work, followed by the other two age categories mentioned. Despite these conclusions, it must be concluded

27
that the majority of the migration that occurs across municipalities in Serbia is not related to job opportunities, even when speaking of the labour market most active.
Finally the LFS data was harvested also for information on the reason for absence in case a family member was absent from the household at the time of the surveying. Unfortunately this data has not been consistently collected throughout the examined time period, and again the number of observed cases has been too low to allow for statistically significant conclusions. Nevertheless, the available information is presented in Table 7.
Table 7: Absent household members, reason, 2008-2014
2008 2009 2010 2011 2012 2013 2014
Reason for absence
(%)
Work related travel 1.5 0.9 0.7
NA
0.9 1.2 NA Works in a different municipality in Serbia
18.6 14.1 6.8 7.0 4.5 NA
Works abroad 4.9 4.6 2.1 2.2 2.5 NA Residence abroad as a family member of somebody who works abroad
0.5 0.1 0.4 0.9 1.7 2.7
Education in another municipality in Serbia
24.0 NA 52.9 45.5 NA NA
Education abroad 1.6 NA NA NA NA NA Personal reasons (illness, living in another household)
15.2 12.5 6.2 9.6 19.4 18.5
Vacation 0.5 0.5 NA 0.1 0.6 6.0 Military service 5.0 6.7 1.7 0.4 0.2
71.4 Other (ex. prison) 28 60.5 29.1 32.8 68.1 Institutional care NA NA NA 0.5 1.8 1.3
Length of absence (%)
Less than a year 96.6 95.0 95.3 94.1 91.3 91.2 92.1 A year or longer 3.4 5.0 4.7 5.9 8.7 8.8 7.9
Source: LFS Data 2008-2014, RSO, 2015
As it is evident from the table above, it appears not all choices were available each year of the surveying which makes comparison difficult. Considering the distribution of reasons for absence from household in the years the option: 'education in another municipality' was available, we can conclude this is the most frequent cause of a household member's absence from the household. In the years this option was not available the option 'other' was much more prevalent. One of the main concerns of policy makers in Serbia is in motivating such students to return to their towns of origin once their degrees have been obtained.
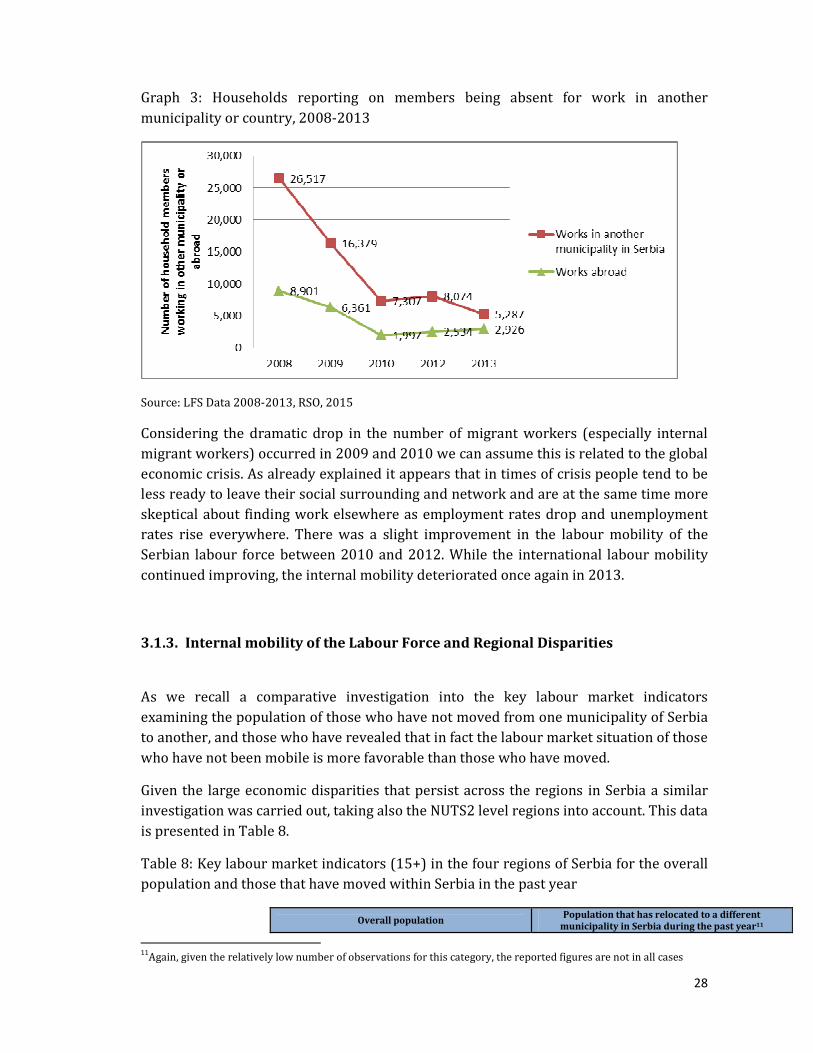
According to the answers to this question, there is a declining trend in family member absence due both to work in another municipality in Serbia and abroad compared to the other potential reasons. An overall declining trend of labour migration is confirmed when the number of households10 reporting on a family member being absent due to work in another municipality in Serbia or abroad are compared across time. Graph 3 illustrates this quite clearly through the data obtained.
10Weighed values on the basis of the LFS sample.
28
Graph 3: Households reporting on members being absent for work in another municipality or country, 2008-2013
Source: LFS Data 2008-2013, RSO, 2015
Considering the dramatic drop in the number of migrant workers (especially internal migrant workers) occurred in 2009 and 2010 we can assume this is related to the global economic crisis. As already explained it appears that in times of crisis people tend to be less ready to leave their social surrounding and network and are at the same time more skeptical about finding work elsewhere as employment rates drop and unemployment rates rise everywhere. There was a slight improvement in the labour mobility of the Serbian labour force between 2010 and 2012. While the international labour mobility continued improving, the internal mobility deteriorated once again in 2013.
3.1.3. Internal mobility of the Labour Force and Regional Disparities
As we recall a comparative investigation into the key labour market indicators examining the population of those who have not moved from one municipality of Serbia to another, and those who have revealed that in fact the labour market situation of those who have not been mobile is more favorable than those who have moved.
Given the large economic disparities that persist across the regions in Serbia a similar investigation was carried out, taking also the NUTS2 level regions into account. This data is presented in Table 8.
Table 8: Key labour market indicators (15+) in the four regions of Serbia for the overall population and those that have moved within Serbia in the past year
Overall population Population that has relocated to a different
municipality in Serbia during the past year11
11Again, given the relatively low number of observations for this category, the reported figures are not in all cases
29
2008 2009 2010 2011 2012 2013 2014 2008 2009 2010 2011 2012 2013 2014
NUTS2 Participation rate
Belgrade region 48.2 47.7 46.1 44.0 44.5 47.4 46.8 62.3 61.8 49.6 59.1 34.4 57.6 71.8
South and East Serbia Region 49.4 47.0 46.7 46.7 46.1 49.6 47.8 48.1 39.1 22.3 30.4 32.7 25.0 36.6
Sumadija and West Serbia Region 55.6 52.8 50.0 48.8 49.2 50.8 51.4 41.3 41.1 34.1 26.8 32.6 34.2 42.6
Vojvodina Region 51.8 48.5 44.5 45.9 46.3 47.6 49.1 30.1 39.3 42.0 25.4 47.5 41.2 40.5
TOTAL 51.4 49.1 46.9 46.4 46.7 49.1 48.9 43.3 44.9 37.6 36.7 35.3 38.1 48.5
NUTS2 Employment rate
Belgrade region 41.5 41.3 39.2 35.3 35.0 38.7 38.7 50.3 59.1 46.3 49.9 24.3 42.3 60.7
South and East Serbia Region 42.6 39.0 36.4 34.7 34.4 37.9 37.6 37.7 18.7 19.9 24.2 28.6 16.3 25.4
Sumadija and West Serbia Region 48.9 44.9 40.5 37.8 38.1 39.6 42.5 32.8 24.6 20.5 18.3 27.0 28.3 33.8
Vojvodina Region 43.9 39.2 35.5 35.1 34.1 36.0 39.3 24.9 21.1 26.3 13.3 34.6 32.2 23.5
TOTAL 44.4 41.2 37.9 35.8 35.5 38.1 39.7 34.7 30.0 28.7 27.8 27.9 28.9 35.4
NUTS2 Unemployment rate
Belgrade region 13.8 13.5 14.9 19.8 21.4 18.3 17.4 12.0 4.3 6.7 15.6 29.3 26.6 15.4
South and East Serbia Region 13.8 16.9 22.0 25.7 25.3 23.6 21.3 10.4 52.1 10.5 20.4 12.5 34.9 40.2
Sumadija and West Serbia Region 12.1 15.0 19.1 22.6 22.5 22.2 17.3 8.5 40.1 39.8 31.7 17.1 17.4 20.5
Vojvodina Region 15.3 19.3 20.4 23.5 26.4 24.4 19.9 5.3 46.4 37.5 47.6 27.1 21.8 41.9
TOTAL 13.6 16.1 19.2 23.0 23.9 22.4 18.9 8.6 33.1 23.7 24.2 21.0 24.3 27.0
Source: LFS Data 2008-2014, RSO, 2015
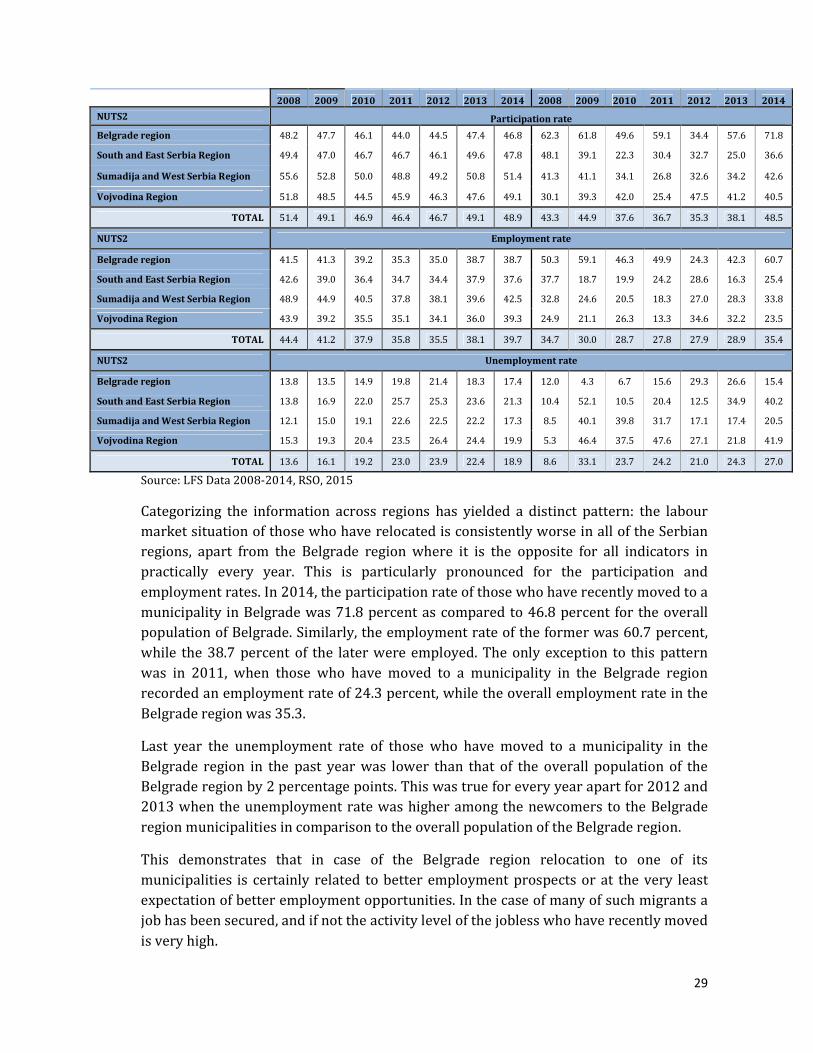
Categorizing the information across regions has yielded a distinct pattern: the labour market situation of those who have relocated is consistently worse in all of the Serbian regions, apart from the Belgrade region where it is the opposite for all indicators in practically every year. This is particularly pronounced for the participation and employment rates. In 2014, the participation rate of those who have recently moved to a municipality in Belgrade was 71.8 percent as compared to 46.8 percent for the overall population of Belgrade. Similarly, the employment rate of the former was 60.7 percent, while the 38.7 percent of the later were employed. The only exception to this pattern was in 2011, when those who have moved to a municipality in the Belgrade region recorded an employment rate of 24.3 percent, while the overall employment rate in the Belgrade region was 35.3.
Last year the unemployment rate of those who have moved to a municipality in the Belgrade region in the past year was lower than that of the overall population of the Belgrade region by 2 percentage points. This was true for every year apart for 2012 and 2013 when the unemployment rate was higher among the newcomers to the Belgrade region municipalities in comparison to the overall population of the Belgrade region.
This demonstrates that in case of the Belgrade region relocation to one of its municipalities is certainly related to better employment prospects or at the very least expectation of better employment opportunities. In the case of many of such migrants a job has been secured, and if not the activity level of the jobless who have recently moved is very high.
30
For the other regions in Serbia: the South and East Serbia region, Sumadija and West Serbia region and the Vojvodina region, moving to other municipalities does not appear to be motivated by employment prospects.
3.2. National Employment Service Registry Data
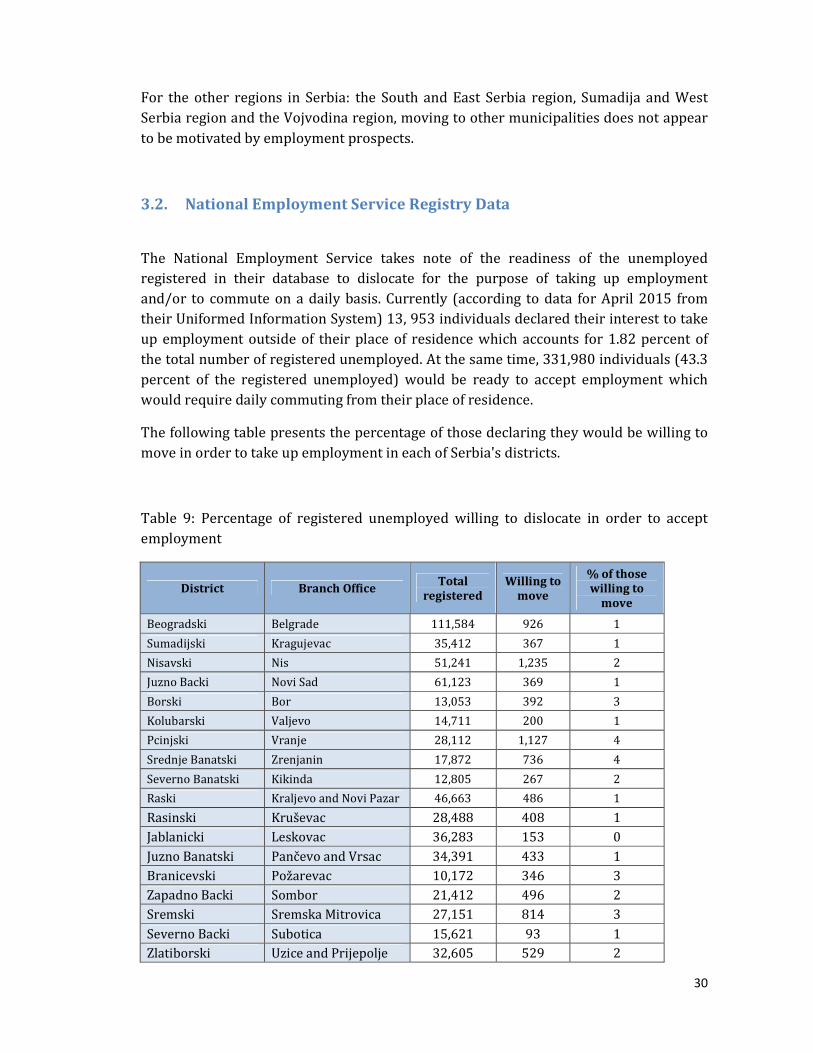
The National Employment Service takes note of the readiness of the unemployed registered in their database to dislocate for the purpose of taking up employment and/or to commute on a daily basis. Currently (according to data for April 2015 from their Uniformed Information System) 13, 953 individuals declared their interest to take up employment outside of their place of residence which accounts for 1.82 percent of the total number of registered unemployed. At the same time, 331,980 individuals (43.3 percent of the registered unemployed) would be ready to accept employment which would require daily commuting from their place of residence.
The following table presents the percentage of those declaring they would be willing to move in order to take up employment in each of Serbia's districts.
Table 9: Percentage of registered unemployed willing to dislocate in order to accept employment
District Branch Office Total
registered Willing to
move
% of those willing to
move
Beogradski Belgrade 111,584 926 1
Sumadijski Kragujevac 35,412 367 1
Nisavski Nis 51,241 1,235 2
Juzno Backi Novi Sad 61,123 369 1
Borski Bor 13,053 392 3
Kolubarski Valjevo 14,711 200 1
Pcinjski Vranje 28,112 1,127 4
Srednje Banatski Zrenjanin 17,872 736 4
Severno Banatski Kikinda 12,805 267 2
Raski Kraljevo and Novi Pazar 46,663 486 1
Rasinski Kruševac 28,488 408 1
Jablanicki Leskovac 36,283 153 0
Juzno Banatski Pančevo and Vrsac 34,391 433 1
Branicevski Požarevac 10,172 346 3
Zapadno Backi Sombor 21,412 496 2
Sremski Sremska Mitrovica 27,151 814 3
Severno Backi Subotica 15,621 93 1
Zlatiborski Uzice and Prijepolje 32,605 529 2
31
Moravicki Cacak 21,185 471 2
Macvanski Sabac and Loznica 38,481 1,526 4
Pirotski Pirot 12,074 1,265 10
Toplicki Prokuplje 15,931 165 1
Zajecarski Zaječar 14,526 251 2
Podunavski Smederevo 17,509 612 3
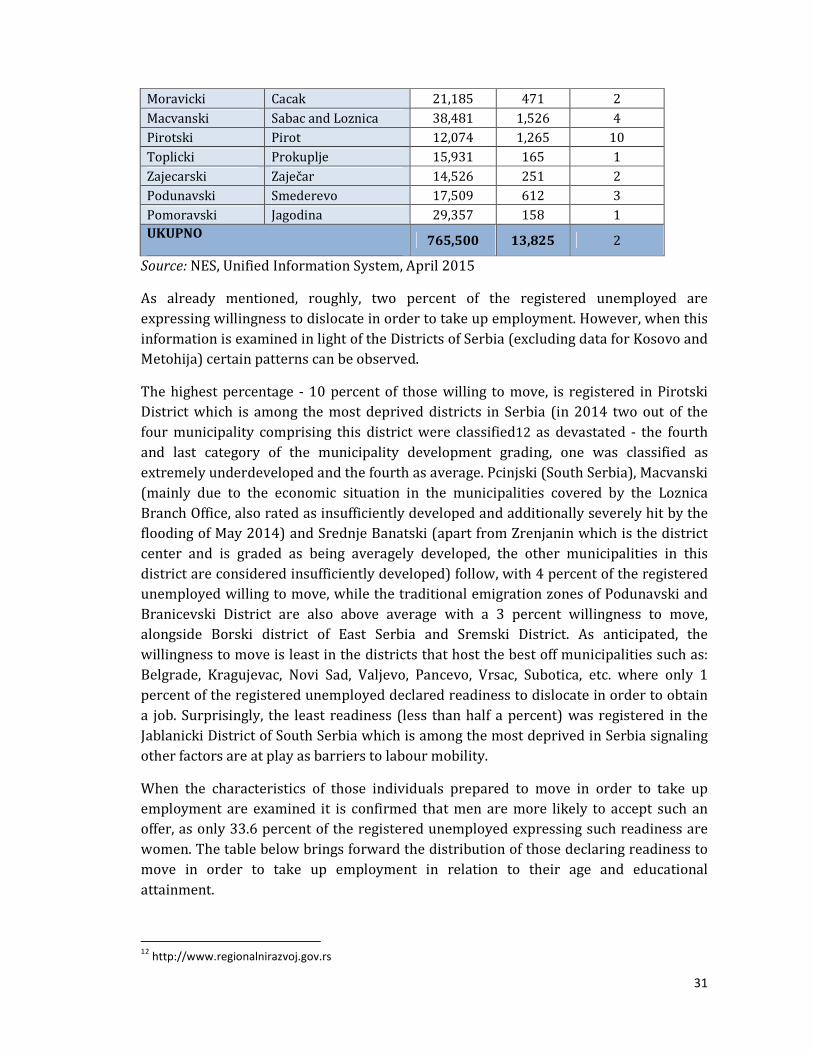
Pomoravski Jagodina 29,357 158 1 UKUPNO 765,500 13,825 2
Source: NES, Unified Information System, April 2015
As already mentioned, roughly, two percent of the registered unemployed are expressing willingness to dislocate in order to take up employment. However, when this information is examined in light of the Districts of Serbia (excluding data for Kosovo and Metohija) certain patterns can be observed.
The highest percentage - 10 percent of those willing to move, is registered in Pirotski District which is among the most deprived districts in Serbia (in 2014 two out of the four municipality comprising this district were classified12 as devastated - the fourth and last category of the municipality development grading, one was classified as extremely underdeveloped and the fourth as average. Pcinjski (South Serbia), Macvanski (mainly due to the economic situation in the municipalities covered by the Loznica Branch Office, also rated as insufficiently developed and additionally severely hit by the flooding of May 2014) and Srednje Banatski (apart from Zrenjanin which is the district center and is graded as being averagely developed, the other municipalities in this district are considered insufficiently developed) follow, with 4 percent of the registered unemployed willing to move, while the traditional emigration zones of Podunavski and Branicevski District are also above average with a 3 percent willingness to move, alongside Borski district of East Serbia and Sremski District. As anticipated, the willingness to move is least in the districts that host the best off municipalities such as: Belgrade, Kragujevac, Novi Sad, Valjevo, Pancevo, Vrsac, Subotica, etc. where only 1 percent of the registered unemployed declared readiness to dislocate in order to obtain a job. Surprisingly, the least readiness (less than half a percent) was registered in the Jablanicki District of South Serbia which is among the most deprived in Serbia signaling other factors are at play as barriers to labour mobility.
When the characteristics of those individuals prepared to move in order to take up employment are examined it is confirmed that men are more likely to accept such an offer, as only 33.6 percent of the registered unemployed expressing such readiness are women. The table below brings forward the distribution of those declaring readiness to move in order to take up employment in relation to their age and educational attainment.
12
http://www.regionalnirazvoj.gov.rs
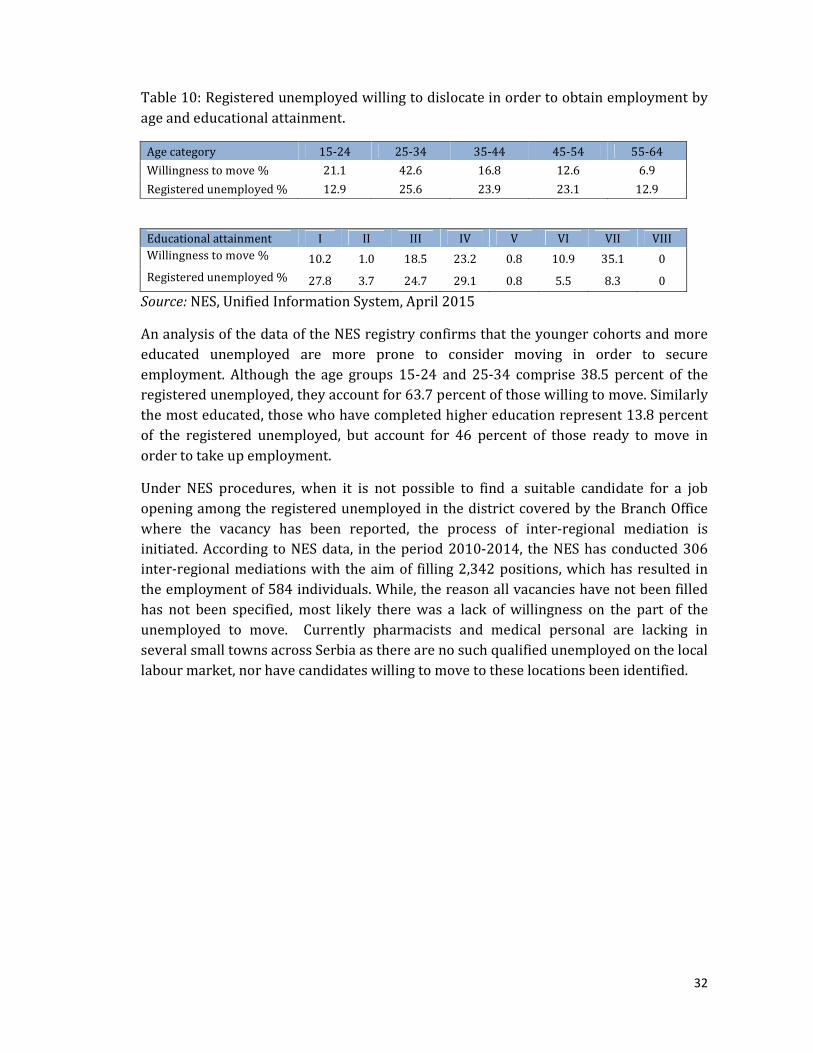
32
Table 10: Registered unemployed willing to dislocate in order to obtain employment by age and educational attainment.
Age category 15-24 25-34 35-44 45-54 55-64
Willingness to move % 21.1 42.6 16.8 12.6 6.9
Registered unemployed % 12.9 25.6 23.9 23.1 12.9
Educational attainment I II III IV V VI VII VIII Willingness to move % 10.2 1.0 18.5 23.2 0.8 10.9 35.1 0
Registered unemployed % 27.8 3.7 24.7 29.1 0.8 5.5 8.3 0
Source: NES, Unified Information System, April 2015
An analysis of the data of the NES registry confirms that the younger cohorts and more educated unemployed are more prone to consider moving in order to secure employment. Although the age groups 15-24 and 25-34 comprise 38.5 percent of the registered unemployed, they account for 63.7 percent of those willing to move. Similarly the most educated, those who have completed higher education represent 13.8 percent of the registered unemployed, but account for 46 percent of those ready to move in order to take up employment.
Under NES procedures, when it is not possible to find a suitable candidate for a job opening among the registered unemployed in the district covered by the Branch Office where the vacancy has been reported, the process of inter-regional mediation is initiated. According to NES data, in the period 2010-2014, the NES has conducted 306 inter-regional mediations with the aim of filling 2,342 positions, which has resulted in the employment of 584 individuals. While, the reason all vacancies have not been filled has not been specified, most likely there was a lack of willingness on the part of the unemployed to move. Currently pharmacists and medical personal are lacking in several small towns across Serbia as there are no such qualified unemployed on the local labour market, nor have candidates willing to move to these locations been identified.

33
4. Synthesis of Findings and Key Issues for Policy Concern
After careful consideration and triangulation of all available information including previously conducted research and analysis, as well as data steaming from the Labour Force Survey and National Employment Service registry an overall conclusion regarding the Serbian labour force is that it is not characterized by a high degree of mobility.
Serbia is not yet attracting large numbers of economic immigrants, and as such this issue is not on the forefront of the policy makers’ agenda. However considering the demographic aging of the Serbian population which will in the medium run lead to labour force shortages, the need for enhanced attention to the immigration policy and immigration management will present itself.
Emigration appears to be on the rise again. Concern is raised with respect the brain-drain phenomenon and most policy efforts revolve around the issue of attracting young skilled workers to return to Serbia. Emigration of highly skilled young people is considered particularly harmful as it causes structural changes in the labour force, leading to lessened competiveness and labour productivity.
When this is coupled with the sever issue of demographic aging Serbia is facing, the prospect for Serbia's labour force in the decades to come is bleak, which is, as already mentioned, reason to approach migration policy making more attentively.
Of course emigration does not affect all areas of Serbia equally. The economically most deprived areas are most prone to this phenomenon.
The issue of quite sever economic regional disparities, in fact, lay at the heart of many issues which are at play when discussing the phenomenon of labour mobility and demographics. In fact a sort of vicious circle is at play as the poor regions, especially rural areas are abandoned by its youth, leading to even more pronounced demographic aging and decreasing the potential for economic recovery, which in turn renders the region even poorer and less attractive for living.
This is why it is of crucial importance that policies aiming at regional development, promoting child birth and the management of labour mobility are synchronized and coordinated.
The internal migration that therefore takes place occurs only in the direction of larger economic centers in Serbia. Surprisingly the data analyzed does not demonstrate these moves are directly related to existing job opportunities in most cases. The three key labour market indicators: labour force participation, employment rate and unemployment rate, consistently show the labour market status of those who have
34
moved across Serbia is worse than that of those who have not moved. The only region in Serbia for which this is not true is the Belgrade region which suggests that the bulk of what little labour mobility is registered in Serbia takes place towards Belgrade alone.
Although, this is the case, at the very least a few other regional centers have potential to lead the overall regional development of their surroundings and spark more leveled economic development across Serbia which would provide basis for job creation and labour mobility that would have more than just one direction. Regional development strategies and measures to attract workers to less 'obvious' cities are clearly necessary as currently existing vacancies in some towns in Serbia remain vacant, despite the sky rocketing unemployment rates.
The analyzed data also shows that there has been a decline in labour mobility as result of the latest economic crisis, which is surely related to the fact that jobs are scarcer to start with, but it should also be considered that relocation itself is costly. In fact it has been demonstrated that more qualified workers which hold better paying jobs are also more likely to move or commute for work. This signals financial support measures must be envisaged in order to promote labour mobility in Serbia.
Also, it has been demonstrated that younger cohorts are more likely to relocate for work than the older (see the next chapter for a discussion on this) and this could also be harvested in promoting labour mobility. Although the available data does not allow for conclusive evidence, no such relation was documented in relation to gender while in examining educational attainment it has been suggested that people with a lower or medium level of educational attainment are more likely to move for work.
The following chapter will bring forward a brief discussion of the key barriers to labour mobility, most of which have already been touched upon here, and present an array of potential policy measures to counteract them. The key concerns being the overall promotion of internal labour mobility and ensuring it flows in more directions than only towards Belgrade.
35
5. Policy Recommendations and Measures for the Management of Internal Labour Mobility13
5.1. Policy Responses
In order to lay down how geographic labour immobility can be counteracted, it is necessary to first map out its causes, i.e. the barriers to mobility. This section will focus firstly on generic barriers to mobility; barriers which prevail in most contexts and in most areas of the world. Thereafter, main barriers to mobility in Serbia will be explored in brief. Together, this will provide a foundation for the upcoming policy examples, so that practices can be examined both from their general capacity to reduce barriers to mobility, and from their potential to be adapted to the Serbian context.
In general terms, barriers to geographic labour mobility, be it cross-country or inter-regional, can be divided into two main categories: personal barriers (sometimes also referred to as natural barriers) and institutional/systemic barriers (sometimes also referred to as artificial barriers)14.
The first category includes impediments stemming from characteristics of the individual, the worker. Such barriers typically include:
- Geographical location of the individual and distance to the possible new location; - Language skills of the individual in the case of multi-ethnic countries; - Culture and values, for example religious beliefs or political views, of the
individual; - Physical and mental ability of the individual; - Family situation of the individual.
In the second category, we find impediments stemming from institutions, for example laws and regulations. These include:
- Professional occupational licensing; - Government occupational licensing of trades; - Hiring regulations and practices; - Active and passive labour market measures; - Education policies; - Infrastructure.
In many cases, personal barriers can be affected by institutional barriers and vice versa. For example, language skills are influenced by education policies, and the need for
13This chapter has foundation in an ILO research (ILO, 2013b) conducted by the Moscow, sub-regional office. 14 See for example ILO (2009) and Cardus (2013) for such categorization discussions.
36
specific language skills are influenced by workplace regulations; the distance which a person is willing to move is affected by infrastructure, and so on.
Nonetheless, all of the above factors are expected to have an impact on the final choice of whether or not to relocate made by the individual worker. To which degree each factor affects the decision varies from case to case, as the individual weighs the economic and social benefit of relocating against the economic and social cost that the relocation would entail.
Generally, the result of such investment decisions is that younger workers are more mobile than older workers (Molloy et al, 2011, and Herrera and Sahn, 2013). Young people have lower costs and higher expected returns of moving: they have more employment years ahead of them than do older workers, but also lower opportunity costs in leaving the place of origin due to, for example, overall high youth unemployment rates and high regional disparities in youth unemployment rates. Furthermore, young people tend to be less attached to their place of residence for family reasons, as they more seldom are married and have children. They are also typically in a stage of life where they are both encouraged and physically and emotionally capable to travel and to relocate.
In other words, many of the personal barriers to mobility are less pertinent for the younger groups, which in turn means that young people are expected to be more responsive to mobility policies targeting institutional barriers, since they are simply less restrained by other obstacles. Substantiating this, studies from the European Union also show that younger age groups find mobility services and information provided by government agencies more useful and decisive when considering relocation than older age groups (Eurobarometer Report, 2010).
In an international comparison, the labour force in Serbia is considered relatively immobile. Moreover, those labour movements that do take place are highly uneven across regions. As already detailed, during the last couple of decades, some regions in Serbia have lost large portions of their populations, while a few other urban conglomerates have been increasing in terms of population due to inward migration. Labour movements are taking place, but they are not followed by a corresponding level of regional convergence. By reducing the identified barriers to labour mobility, a more sustainable mobility structure would be rendered possible.
Five main factors hindering a more dynamic mobility in the country could be mentioned.
- Poverty traps, meaning that many individuals who are prepared to move simply cannot afford to do so, even though relocation would make them economically better off;
- Large disparities in living standards and development between different regions; - Limited performance in cross-regional cooperation of employment services;
37
- Migration distances, leading to transport and relocation costs. Just as with limited access to social services, poverty traps increase this barrier to mobility.
- Poor development of the housing market and high housing prices in attractive areas;
5.2. Inventory of Best International Practices
A mobile labour force is key in achieving a smoothly functioning labour market, both at local, national and global levels. Movements of workers not only ease labour market rigidities and address skills mismatches, but can also contribute to the reduction of disparities between regions or countries.
For these reasons, most governments worldwide take action to promote increased labour mobility. However, what policies should be pursued is far from straightforward, as the risks of brain-drain and depopulation in some regions need to be balanced with the benefits of movement to job-rich and productive regions.
Labour market mobility can be divided into geographic mobility, i.e. changes in location of workers, and occupational mobility, i.e. movement within or across sectors. Although the two are often linked, meaning that mobility policies in some cases can target both, the aim of this review is to focus on policies and practices that primarily address geographic mobility.
More specifically, the review will explore practices which address the main barriers to mobility in the Republic of Serbia, as described above. Thus, the coming six sections will deal with the following:
1. Passive labour market policies, addressing limitations to welfare benefits; 2. Policies for local development, addressing regional disparities in living
standards and development; 3. Active labour market programs and coordination of employment services,
addressing lack of efficiency and cross-regional cooperation of employment services, as well as difficulties of skills under-development and skills mismatch;
4. Transportation and relocation support, addressing difficulties of financing of internal migration;
5. Housing support, addressing disparities in housing prices between regions and subsequent barriers to relocation;
6. Educational policies, addressing difficulties in attracting skilled workers to some areas of the country.
To the greatest possible extent, practices which have been identified as having a clear impact will be outlined. This means policies or programs that are effective in achieving set objectives, are relevant in addressing the needs or obstacles in
38
question, and are expected to have sustainable results. It is important to keep in mind, though that as country practices are designed under different circumstances and in idiosyncratic environments, what has proven successful in one country is not necessarily applicable elsewhere. In other words, practices should always be considered in view of the larger context in which they are being implemented.
Further, as not all practices have undergone proper evaluation, but may nonetheless appear fruitful for the time being, the review will include a number of policies that are considered promising, even if their compliance with the above criteria cannot be fully assessed. In some cases, practices which seem to have less impact will also be described, so as to further substantiate policy discussions.
5.2.1. Passive Labour Market Policies
Passive labour market policies and welfare benefits are wide concepts, but generally refer to all types of policies which provide income replacement. In the context of this study, passive labour market and welfare policies that are expected to influence geographic mobility typically include unemployment insurance and other income raising
benefits.
A quite common notion among policy makers is that generous unemployment insurance and other welfare benefits create obstacles to mobility, by lowering the incentives for relocating to find employment. However, several studies indicate that the opposite seems to hold; high income replacements during unemployment tend to increase, rather
than decrease, labour mobility. One reason for this is that the costs of searching for new jobs are higher at the national (or international) level than at the local level. Through sufficient unemployment benefits, liquidity constraints are relaxed, which increases the propensity to search for a job outside the local community (Bertola et al, 2006). In other words, unemployment benefits provide the financial means needed to undertake the relocation, thus mitigating the risks of an individual ending up in a poverty trap.
Similarly, generous unemployment insurance reduces the risk of undertaking a move. With income security guaranteed, an individual can pay less attention to the risk of future layoff at a new workplace - a risk which is generally higher when starting a new job due to the last-in-first-out principle. This reduction in risk is comparable to a reduction in mobility costs, thus increasing the propensity to move (Bonin et al, 2008).
Generous unemployment insurance can also create incentives enhancing geographic mobility on the employers’ level. Where income replacement is high, workers tend to search for higher-waged jobs, and employers respond by creating high-quality, high-wage jobs. This, in turn, corrects distortions arising from uninsured risk-taking, consequently creating a more sustainable labour market (Acemoglu and Shimer, 1999).

39
Looking at empirical evidence, we see that a positive connection between high mobility at a national level and more generous unemployment benefit systems indeed seems to exist. This is illustrated in example 1.
Practice example 1:
Unemployment benefits and effects on mobility in France, Germany, Spain, and the UK
Aim of
policy/programme
The aim of each unemployment benefit system is naturally to provide income replacement to unemployed persons. As a good practice, however, the policies serve to illustrate the effect of different benefit systems on geographic mobility.
Description The reason for selecting a particular system of income replacements during unemployment of course depends on a number of issues. Each individual country tries to find what it believes to be the optimum balance between tax levels, budgetary constraints, employment stimulation and security for the unemployed person. Though labour market flexibility is an important component in this equation, geographic mobility is generally not a core focus when determining unemployment benefit levels and regulations.
Nonetheless, unemployment benefits are expected to affect geographic mobility within a country. An econometric study undertaken in 2004 therefore compared the unemployment assistance systems and mobility rates in France, Germany, Spain and the UK.
The countries were chosen due to their similarity in terms of population and size, but difference in unemployment benefit systems.
At the time of the study, the UK had by far the lowest replacement rate, whereas the replacement rates were more than twice as high in France Germany and Spain. More specifically, the unemployment benefit system in each country, again at the time of the study, can be summarized as follows.
o In France, the unemployment insurance replacement rate was 75 percent, which was the highest among the four countries. It was disbursed provided that the unemployed person had worked for at least four months during the last eight months. Unemployment insurance could be paid for maximum 27 months at full rate, and another 33 months at declining rate. After this, unemployment assistance applied. This was means-tested and indefinite in duration. The country had an unemployment level of 6.13 percent and an employment protection index of 14 (on a country ranking of 20, with 20 being the most regulated).
o In Germany, the replacement rate was 60 percent for a maximum of 32 months, and was paid under the precondition that the person had been working for at least 360 days during the last three years. Thereafter, indefinite and means-tested unemployment assistance

40
applied. Germany had an unemployment level of 10.95 percent and an employment protection index of 15 of 20.
o Spain had an unemployment insurance replacement rate of 70 per cent, contingent upon at least twelve months employment during the last six years. The insurance was paid for a maximum of 24 months, and was reduced every six months. After exhaustion of unemployment insurance, means-tested unemployment assistance is provided for six months. Upon exhaustion of this, social assistance was provided. Spain’s unemployment level was 14.0 percent. The country was the most regulated, with an employment protection index of 19 of 20.
o In the UK, unemployment insurance was paid at a flat rate covering 30 percent of the average wage in the country. Duration of unemployment insurance was 12 months. After this period, means-tested unemployment assistance was provided for an indefinite duration. The country had the lowest level of unemployment among the four countries, 5.87 percent, as well as the lowest level of employment protection, 7 of 20.
Results When holding other factors which are expected to affect labour mobility constant, such as age, housing situation, family situation and education, the results of the study show a positive correlation between mobility and unemployment benefits.
Unemployment benefit recipients had the lowest propensity to move in the UK, whereas recipients in France were the most mobile. This indicates that generous unemployment benefits in fact seem to enhance rather than reduce geographic mobility of the labour force.
It also illustrates, once again, that low employment protection is not necessarily coupled with high mobility.
Source: Tatsiramos, 2004
Though the above evidence suggests that there are mobility gains from generous welfare and unemployment benefits, there is also a risk that too high and long-lasting benefits may reduce job reallocation and mobility incentives. For this reason, most countries, including those with the most generous welfare systems, apply time- and replacement level limitations of benefits, thus avoiding disincentive effects being larger than incentive effects. As an example, the Swedish model of unemployment insurance sets the following limitations (Swedish Public Employment Service, 2013):
- An unemployed person receives 80 per cent of his/her previous income during the first 200 days of unemployment, with a ceiling of 680 Swedish kronor per day (approximately 100 US dollars), provided that the person was working full time
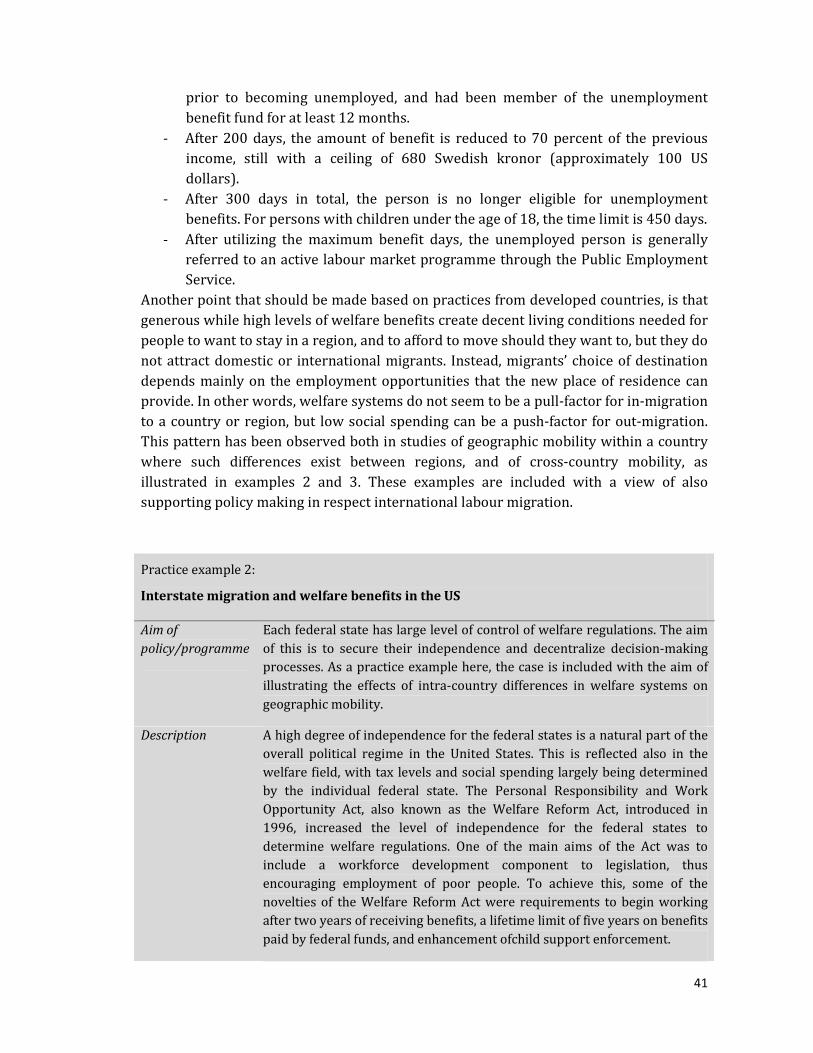
41
prior to becoming unemployed, and had been member of the unemployment benefit fund for at least 12 months.
- After 200 days, the amount of benefit is reduced to 70 percent of the previous income, still with a ceiling of 680 Swedish kronor (approximately 100 US dollars).
- After 300 days in total, the person is no longer eligible for unemployment benefits. For persons with children under the age of 18, the time limit is 450 days.
- After utilizing the maximum benefit days, the unemployed person is generally referred to an active labour market programme through the Public Employment Service.
Another point that should be made based on practices from developed countries, is that generous while high levels of welfare benefits create decent living conditions needed for people to want to stay in a region, and to afford to move should they want to, but they do not attract domestic or international migrants. Instead, migrants’ choice of destination depends mainly on the employment opportunities that the new place of residence can provide. In other words, welfare systems do not seem to be a pull-factor for in-migration to a country or region, but low social spending can be a push-factor for out-migration. This pattern has been observed both in studies of geographic mobility within a country where such differences exist between regions, and of cross-country mobility, as illustrated in examples 2 and 3. These examples are included with a view of also supporting policy making in respect international labour migration.
Practice example 2:
Interstate migration and welfare benefits in the US
Aim of
policy/programme
Each federal state has large level of control of welfare regulations. The aim of this is to secure their independence and decentralize decision-making processes. As a practice example here, the case is included with the aim of illustrating the effects of intra-country differences in welfare systems on geographic mobility.
Description A high degree of independence for the federal states is a natural part of the overall political regime in the United States. This is reflected also in the welfare field, with tax levels and social spending largely being determined by the individual federal state. The Personal Responsibility and Work Opportunity Act, also known as the Welfare Reform Act, introduced in 1996, increased the level of independence for the federal states to determine welfare regulations. One of the main aims of the Act was to include a workforce development component to legislation, thus encouraging employment of poor people. To achieve this, some of the novelties of the Welfare Reform Act were requirements to begin working after two years of receiving benefits, a lifetime limit of five years on benefits paid by federal funds, and enhancement ofchild support enforcement.
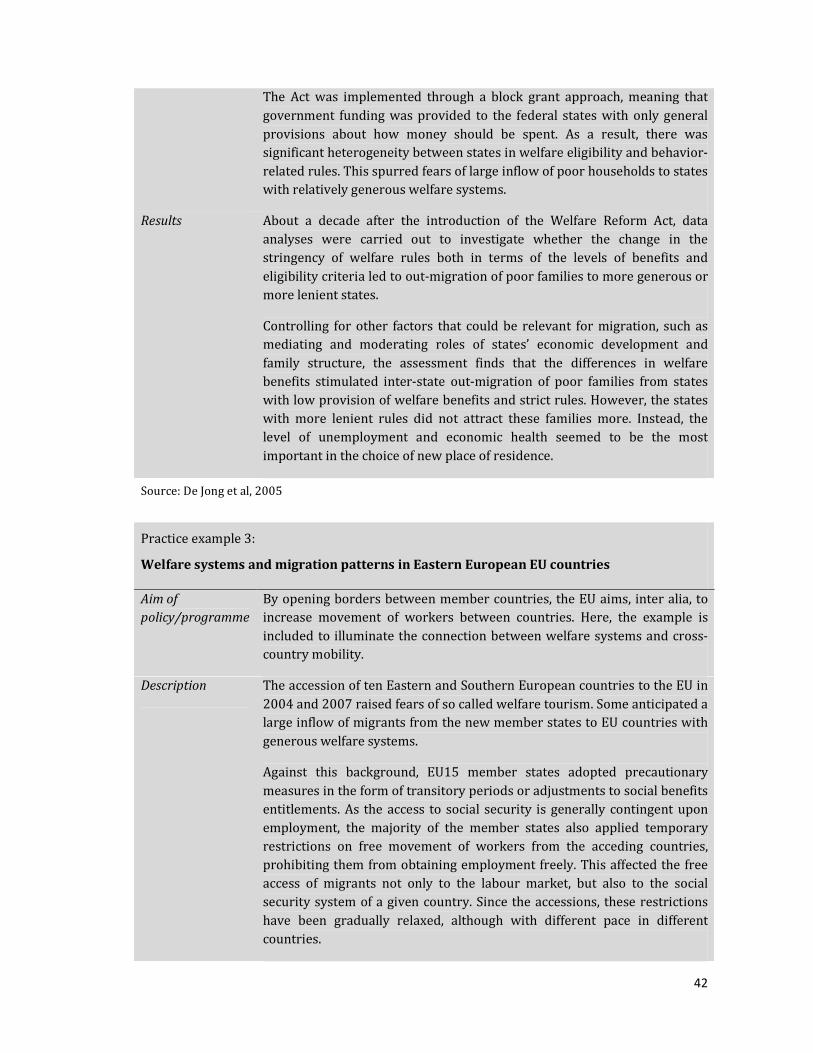
42
The Act was implemented through a block grant approach, meaning that government funding was provided to the federal states with only general provisions about how money should be spent. As a result, there was significant heterogeneity between states in welfare eligibility and behavior-related rules. This spurred fears of large inflow of poor households to states with relatively generous welfare systems.
Results About a decade after the introduction of the Welfare Reform Act, data analyses were carried out to investigate whether the change in the stringency of welfare rules both in terms of the levels of benefits and eligibility criteria led to out-migration of poor families to more generous or more lenient states.
Controlling for other factors that could be relevant for migration, such as mediating and moderating roles of states’ economic development and family structure, the assessment finds that the differences in welfare benefits stimulated inter-state out-migration of poor families from states with low provision of welfare benefits and strict rules. However, the states with more lenient rules did not attract these families more. Instead, the level of unemployment and economic health seemed to be the most important in the choice of new place of residence.
Source: De Jong et al, 2005
Practice example 3:
Welfare systems and migration patterns in Eastern European EU countries
Aim of
policy/programme
By opening borders between member countries, the EU aims, inter alia, to increase movement of workers between countries. Here, the example is included to illuminate the connection between welfare systems and cross-country mobility.
Description The accession of ten Eastern and Southern European countries to the EU in 2004 and 2007 raised fears of so called welfare tourism. Some anticipated a large inflow of migrants from the new member states to EU countries with generous welfare systems.
Against this background, EU15 member states adopted precautionary measures in the form of transitory periods or adjustments to social benefits entitlements. As the access to social security is generally contingent upon employment, the majority of the member states also applied temporary restrictions on free movement of workers from the acceding countries, prohibiting them from obtaining employment freely. This affected the free access of migrants not only to the labour market, but also to the social security system of a given country. Since the accessions, these restrictions have been gradually relaxed, although with different pace in different countries.
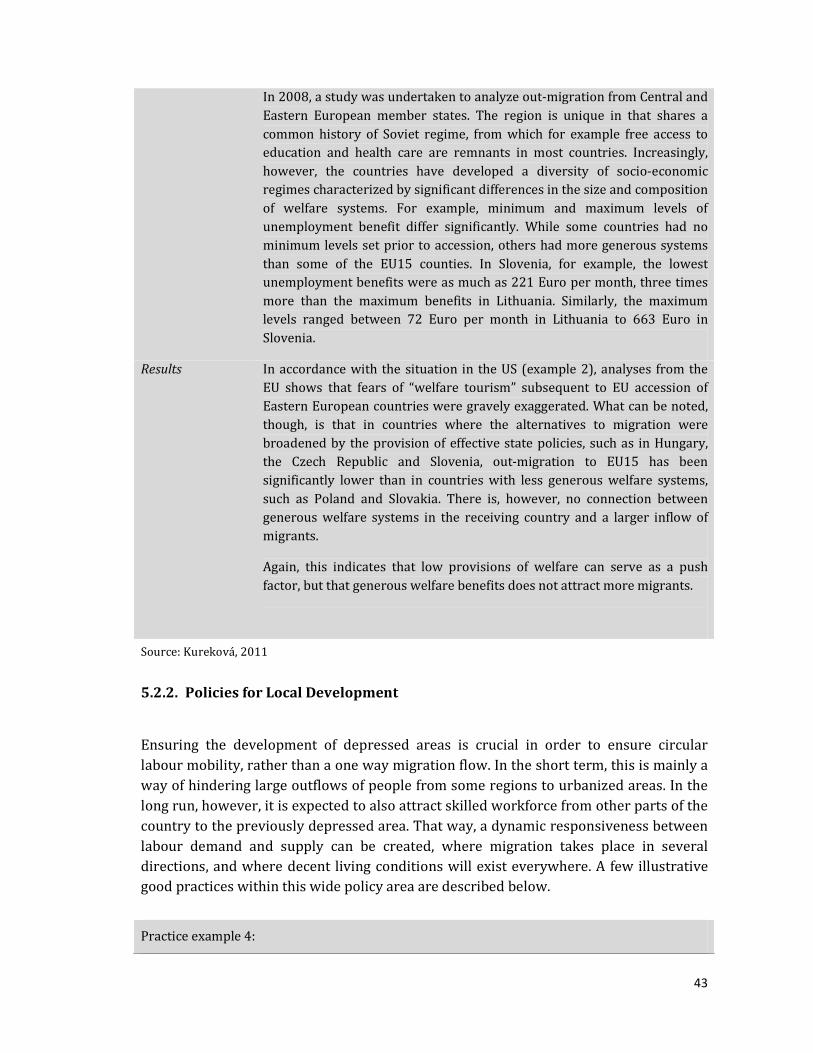
43
In 2008, a study was undertaken to analyze out-migration from Central and Eastern European member states. The region is unique in that shares a common history of Soviet regime, from which for example free access to education and health care are remnants in most countries. Increasingly, however, the countries have developed a diversity of socio-economic regimes characterized by significant differences in the size and composition of welfare systems. For example, minimum and maximum levels of unemployment benefit differ significantly. While some countries had no minimum levels set prior to accession, others had more generous systems than some of the EU15 counties. In Slovenia, for example, the lowest unemployment benefits were as much as 221 Euro per month, three times more than the maximum benefits in Lithuania. Similarly, the maximum levels ranged between 72 Euro per month in Lithuania to 663 Euro in Slovenia.
Results In accordance with the situation in the US (example 2), analyses from the EU shows that fears of “welfare tourism” subsequent to EU accession of Eastern European countries were gravely exaggerated. What can be noted, though, is that in countries where the alternatives to migration were broadened by the provision of effective state policies, such as in Hungary, the Czech Republic and Slovenia, out-migration to EU15 has been significantly lower than in countries with less generous welfare systems, such as Poland and Slovakia. There is, however, no connection between generous welfare systems in the receiving country and a larger inflow of migrants.
Again, this indicates that low provisions of welfare can serve as a push factor, but that generous welfare benefits does not attract more migrants.
Source: Kureková, 2011
5.2.2. Policies for Local Development
Ensuring the development of depressed areas is crucial in order to ensure circular labour mobility, rather than a one way migration flow. In the short term, this is mainly a way of hindering large outflows of people from some regions to urbanized areas. In the long run, however, it is expected to also attract skilled workforce from other parts of the country to the previously depressed area. That way, a dynamic responsiveness between labour demand and supply can be created, where migration takes place in several directions, and where decent living conditions will exist everywhere. A few illustrative good practices within this wide policy area are described below.
Practice example 4:
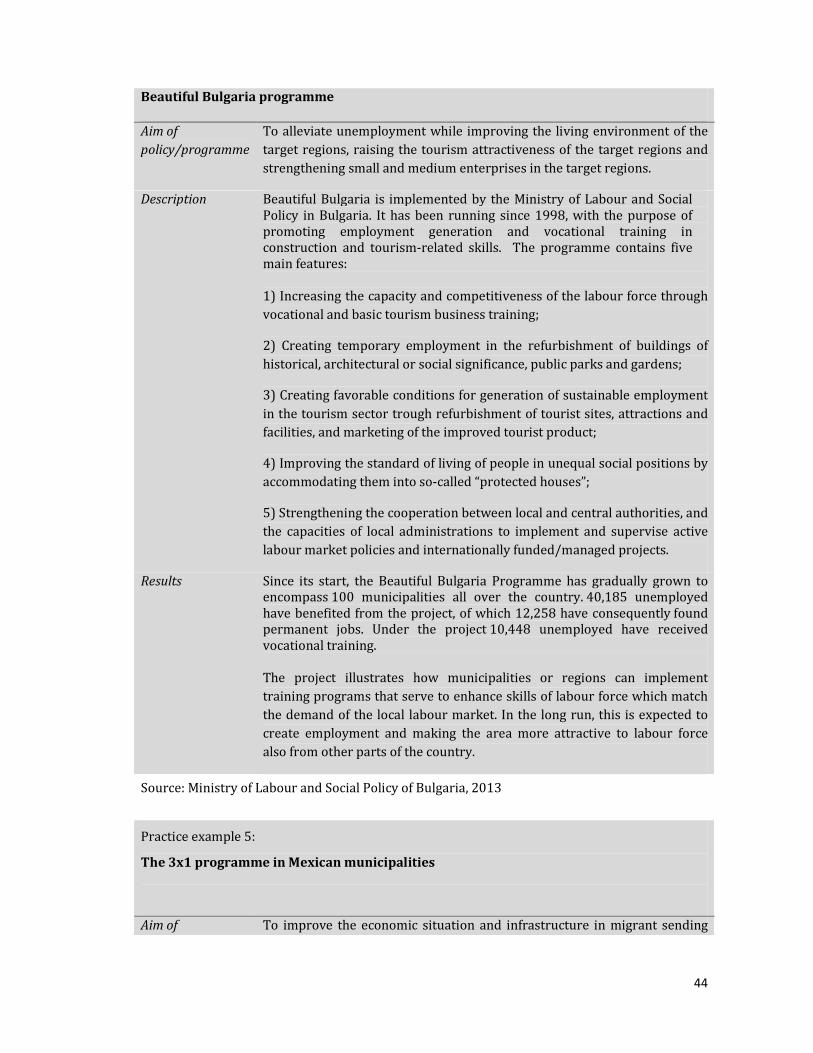
44
Beautiful Bulgaria programme
Aim of
policy/programme
To alleviate unemployment while improving the living environment of the target regions, raising the tourism attractiveness of the target regions and strengthening small and medium enterprises in the target regions.
Description Beautiful Bulgaria is implemented by the Ministry of Labour and Social Policy in Bulgaria. It has been running since 1998, with the purpose of promoting employment generation and vocational training in construction and tourism-related skills. The programme contains five main features: 1) Increasing the capacity and competitiveness of the labour force through vocational and basic tourism business training;
2) Creating temporary employment in the refurbishment of buildings of historical, architectural or social significance, public parks and gardens;
3) Creating favorable conditions for generation of sustainable employment in the tourism sector trough refurbishment of tourist sites, attractions and facilities, and marketing of the improved tourist product;
4) Improving the standard of living of people in unequal social positions by accommodating them into so-called “protected houses”;
5) Strengthening the cooperation between local and central authorities, and the capacities of local administrations to implement and supervise active labour market policies and internationally funded/managed projects.
Results Since its start, the Beautiful Bulgaria Programme has gradually grown to encompass 100 municipalities all over the country. 40,185 unemployed have benefited from the project, of which 12,258 have consequently found permanent jobs. Under the project 10,448 unemployed have received vocational training. The project illustrates how municipalities or regions can implement training programs that serve to enhance skills of labour force which match the demand of the local labour market. In the long run, this is expected to create employment and making the area more attractive to labour force also from other parts of the country.
Source: Ministry of Labour and Social Policy of Bulgaria, 2013
Practice example 5:
The 3x1 programme in Mexican municipalities
Aim of To improve the economic situation and infrastructure in migrant sending
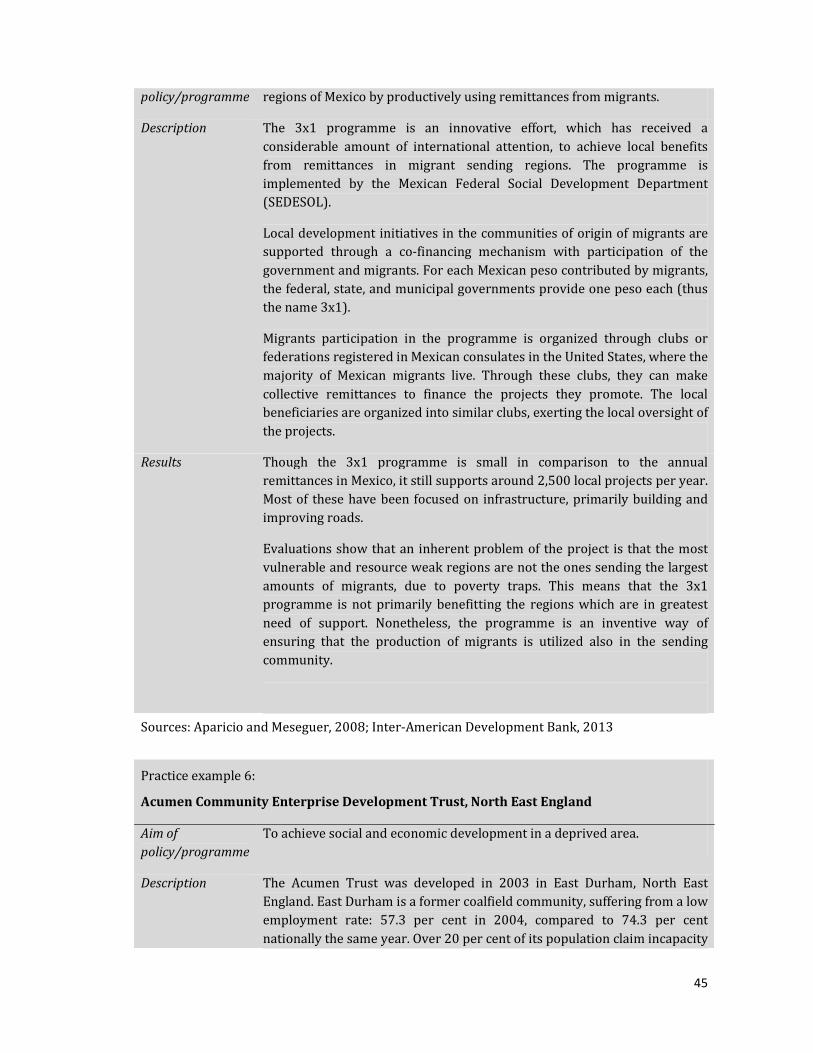
45
policy/programme regions of Mexico by productively using remittances from migrants.
Description The 3x1 programme is an innovative effort, which has received a considerable amount of international attention, to achieve local benefits from remittances in migrant sending regions. The programme is implemented by the Mexican Federal Social Development Department (SEDESOL).
Local development initiatives in the communities of origin of migrants are supported through a co-financing mechanism with participation of the government and migrants. For each Mexican peso contributed by migrants, the federal, state, and municipal governments provide one peso each (thus the name 3x1).
Migrants participation in the programme is organized through clubs or federations registered in Mexican consulates in the United States, where the majority of Mexican migrants live. Through these clubs, they can make collective remittances to finance the projects they promote. The local beneficiaries are organized into similar clubs, exerting the local oversight of the projects.
Results Though the 3x1 programme is small in comparison to the annual remittances in Mexico, it still supports around 2,500 local projects per year. Most of these have been focused on infrastructure, primarily building and improving roads.
Evaluations show that an inherent problem of the project is that the most vulnerable and resource weak regions are not the ones sending the largest amounts of migrants, due to poverty traps. This means that the 3x1 programme is not primarily benefitting the regions which are in greatest need of support. Nonetheless, the programme is an inventive way of ensuring that the production of migrants is utilized also in the sending community.
Sources: Aparicio and Meseguer, 2008; Inter-American Development Bank, 2013
Practice example 6:
Acumen Community Enterprise Development Trust, North East England
Aim of
policy/programme
To achieve social and economic development in a deprived area.
Description The Acumen Trust was developed in 2003 in East Durham, North East England. East Durham is a former coalfield community, suffering from a low employment rate: 57.3 per cent in 2004, compared to 74.3 per cent nationally the same year. Over 20 per cent of its population claim incapacity
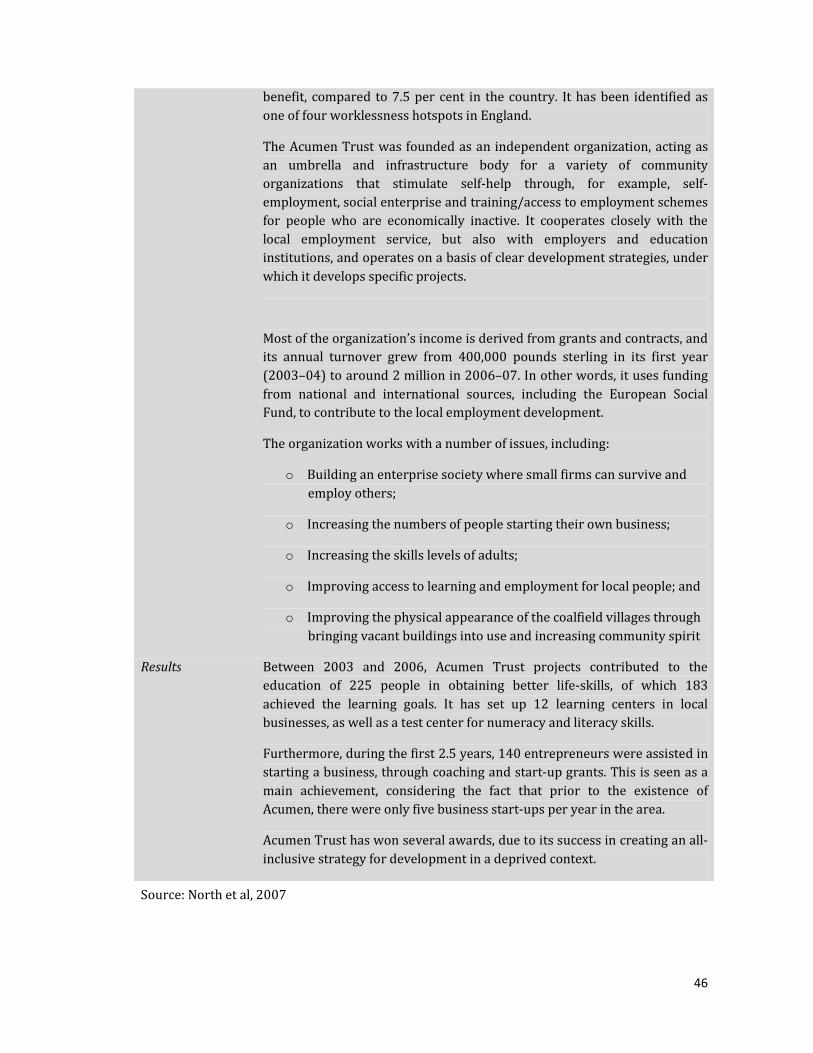
46
benefit, compared to 7.5 per cent in the country. It has been identified as one of four worklessness hotspots in England.
The Acumen Trust was founded as an independent organization, acting as an umbrella and infrastructure body for a variety of community organizations that stimulate self-help through, for example, self-employment, social enterprise and training/access to employment schemes for people who are economically inactive. It cooperates closely with the local employment service, but also with employers and education institutions, and operates on a basis of clear development strategies, under which it develops specific projects.
Most of the organization’s income is derived from grants and contracts, and its annual turnover grew from 400,000 pounds sterling in its first year (2003–04) to around 2 million in 2006–07. In other words, it uses funding from national and international sources, including the European Social Fund, to contribute to the local employment development.
The organization works with a number of issues, including:
o Building an enterprise society where small firms can survive and employ others;
o Increasing the numbers of people starting their own business;
o Increasing the skills levels of adults;
o Improving access to learning and employment for local people; and
o Improving the physical appearance of the coalfield villages through bringing vacant buildings into use and increasing community spirit
Results Between 2003 and 2006, Acumen Trust projects contributed to the education of 225 people in obtaining better life-skills, of which 183 achieved the learning goals. It has set up 12 learning centers in local businesses, as well as a test center for numeracy and literacy skills.
Furthermore, during the first 2.5 years, 140 entrepreneurs were assisted in starting a business, through coaching and start-up grants. This is seen as a main achievement, considering the fact that prior to the existence of Acumen, there were only five business start-ups per year in the area.
Acumen Trust has won several awards, due to its success in creating an all-inclusive strategy for development in a deprived context.
Source: North et al, 2007

47
5.2.3. Active Labour Market Programmes
Governments can use active labour market policies to address geographical immobility in two principal ways: either to create incentives for workers to move to depressed areas or to encourage workers to move to job-rich areas. In the vast majority of advanced economies, governments pursue a mix of both policy options. Though these two methods may seem conflicting, their parallel implementation is considered necessary to achieve both short-term and long-term employment effects. While regional convergence incentives are aimed at spurring job creation in under-developed areas, meaning that there should eventually be a voluntary inflow of workers to these regions, this is a long process requiring many years. Therefore, policies which encourage workers to move to prospering regions might be needed to deal with short-term, cyclical unemployment peaks.
Typical mobility-supporting active labour market measures include transport and
relocation subsidies and housing support. As these areas are at the core of pro-mobility policy measures, they will be dealt with separately in sections 5.2.4. and 5.2.5. In this section, focus will instead be placed on more traditional types of active labour market programs, which generally do not emphasize mobility, but rather improving the employment prospective for unemployed persons in large.
Most such programs fall under four broad categories: (1) Labour market training, aiming at enhancing the human capital of participants through for example vocational training or adult education; (2) job search support, including career counseling, vacancy matching, monitoring of job search efforts, and job clubs; (3) subsidized employment,
generally meaning wage subsidies to employers to hire unemployed persons and self-employment grants; and (4) direct job creation, which is generally targeted at specific groups such as long-term unemployed or youth.
Though mobility has not traditionally been an aspect considered in the design of active labour market programs, governments are now increasingly turning attention towards programs which serve to promote mobility. In some countries, carrot and stick approaches are pursued, meaning that participation in any active labour market programme, and access to unemployment benefits, are coupled with requirements to move to another part of the country if employment opportunities appear. The effects of such approaches are not clear-cut. In Sweden, for example, an unemployed person is required to extend the geographic job search area after 100 days of unemployment in order to continue receiving unemployment benefits. If there are special reasons not to move, including family or health reasons, this requirement is not valid. In practice, case workers have found it both problematic to determine whether or not this rule should apply, and to put pressure on an unemployed who is reluctant to move. Many argue that it is crucial that mobility is voluntary, and that forcing a person to move to find

48
employment is an unsustainable, short-sighted and an inhuman measure (Official Reports of the Swedish Government, 2003).
Looking at programs which can be clearly established as good practices, these can be divided in three main categories: coordination and cooperation between employment
services, coordination of vocational training and accreditation, and encouraging
relocation of youth to employment-rich areas. Good practices within each of these categories are presented in the sections below.
Coordination and cooperation of employment services
A central precondition to enhance mobility is ensuring that job vacancies in other areas are made available to job-seekers in the first place. This requires coordination between employment services. When employment services are well-coordinated in their measures of action and information provided, the job search area to which unemployed persons have access is enlarged. This is illustrated in cases 7 and 8.
Practice example 7:
EURES15
Aim of
policy/programme
To increase cross-country mobility through coordination of employment services
Description The European Job Mobility Portal, EURES, is the main web platform promoting labour mobility in Europe. It is a cooperation between the European Commission and the Public Employment Services in the EU countries as well as Iceland, Liechtenstein, Norway and Switzerland.
The EURES network offers possibility for employers to register their vacancies online, and job seekers can upload their CVs. To further smoothen the job-seeking process, the portal is linked to the Europass initiative, which facilitates the transfer of skills, qualifications and education to a common and easily comparable system.
Results Preliminary evaluations show that EURES has managed to improve the transparency and exchange of information on labour demand and supply on the European labour market. In July 2013, around 1.5 million vacancies were posted at the EURES portal and more than 30,000 employers were registered.
Though EURES was designed with the aim of promoting cross-country mobility, its main features could naturally be applied also in a national context with the aim of increasing mobility between regions.
15As already mentioned the NES is in the process of joining the EURES network.
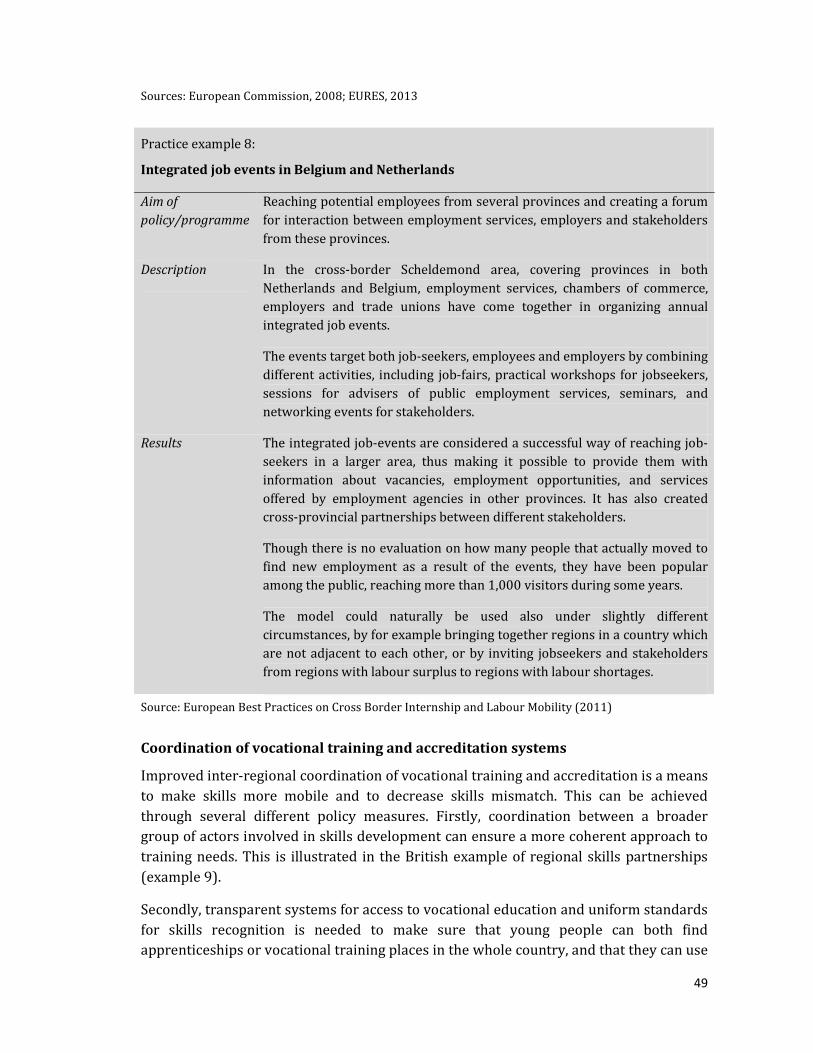
49
Sources: European Commission, 2008; EURES, 2013
Practice example 8:
Integrated job events in Belgium and Netherlands
Aim of
policy/programme
Reaching potential employees from several provinces and creating a forum for interaction between employment services, employers and stakeholders from these provinces.
Description In the cross-border Scheldemond area, covering provinces in both Netherlands and Belgium, employment services, chambers of commerce, employers and trade unions have come together in organizing annual integrated job events.
The events target both job-seekers, employees and employers by combining different activities, including job-fairs, practical workshops for jobseekers, sessions for advisers of public employment services, seminars, and networking events for stakeholders.
Results The integrated job-events are considered a successful way of reaching job-seekers in a larger area, thus making it possible to provide them with information about vacancies, employment opportunities, and services offered by employment agencies in other provinces. It has also created cross-provincial partnerships between different stakeholders.
Though there is no evaluation on how many people that actually moved to find new employment as a result of the events, they have been popular among the public, reaching more than 1,000 visitors during some years.
The model could naturally be used also under slightly different circumstances, by for example bringing together regions in a country which are not adjacent to each other, or by inviting jobseekers and stakeholders from regions with labour surplus to regions with labour shortages.
Source: European Best Practices on Cross Border Internship and Labour Mobility (2011)
Coordination of vocational training and accreditation systems
Improved inter-regional coordination of vocational training and accreditation is a means to make skills more mobile and to decrease skills mismatch. This can be achieved through several different policy measures. Firstly, coordination between a broader group of actors involved in skills development can ensure a more coherent approach to training needs. This is illustrated in the British example of regional skills partnerships (example 9).
Secondly, transparent systems for access to vocational education and uniform standards for skills recognition is needed to make sure that young people can both find apprenticeships or vocational training places in the whole country, and that they can use
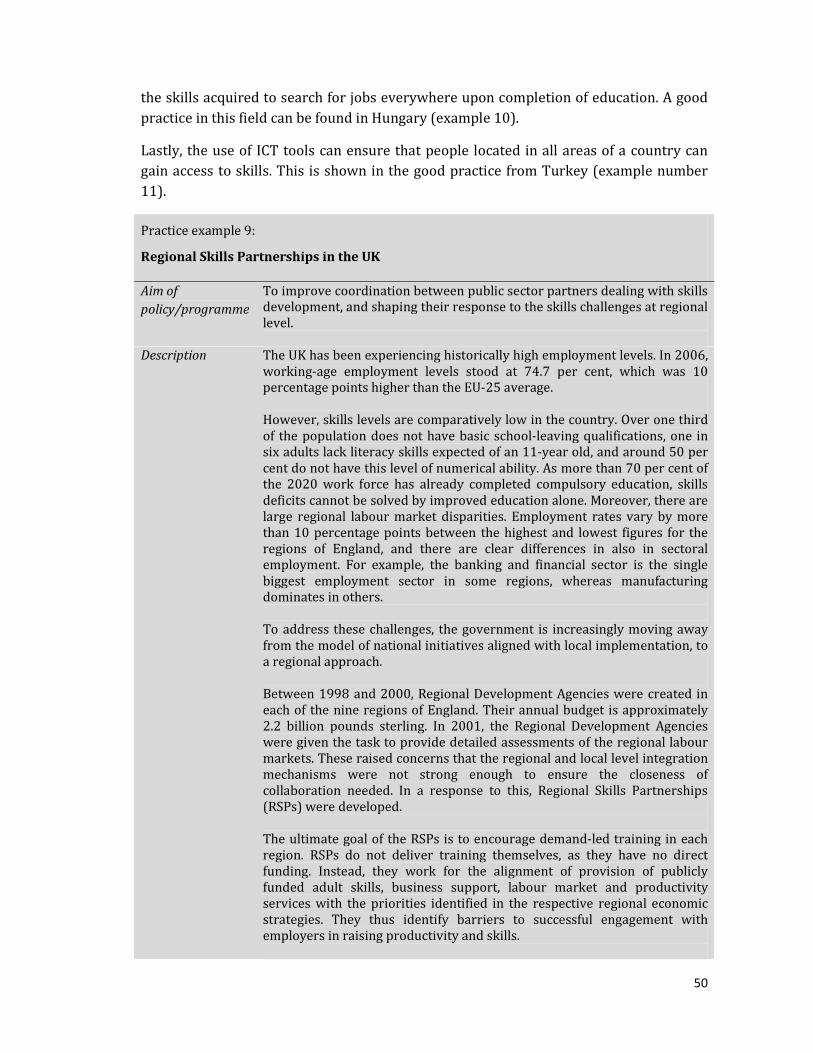
50
the skills acquired to search for jobs everywhere upon completion of education. A good practice in this field can be found in Hungary (example 10).
Lastly, the use of ICT tools can ensure that people located in all areas of a country can gain access to skills. This is shown in the good practice from Turkey (example number 11).
Practice example 9:
Regional Skills Partnerships in the UK
Aim of
policy/programme
To improve coordination between public sector partners dealing with skills development, and shaping their response to the skills challenges at regional level.
Description The UK has been experiencing historically high employment levels. In 2006, working-age employment levels stood at 74.7 per cent, which was 10 percentage points higher than the EU-25 average. However, skills levels are comparatively low in the country. Over one third of the population does not have basic school-leaving qualifications, one in six adults lack literacy skills expected of an 11-year old, and around 50 per cent do not have this level of numerical ability. As more than 70 per cent of the 2020 work force has already completed compulsory education, skills deficits cannot be solved by improved education alone. Moreover, there are large regional labour market disparities. Employment rates vary by more than 10 percentage points between the highest and lowest figures for the regions of England, and there are clear differences in also in sectoral employment. For example, the banking and financial sector is the single biggest employment sector in some regions, whereas manufacturing dominates in others. To address these challenges, the government is increasingly moving away from the model of national initiatives aligned with local implementation, to a regional approach. Between 1998 and 2000, Regional Development Agencies were created in each of the nine regions of England. Their annual budget is approximately 2.2 billion pounds sterling. In 2001, the Regional Development Agencies were given the task to provide detailed assessments of the regional labour markets. These raised concerns that the regional and local level integration mechanisms were not strong enough to ensure the closeness of collaboration needed. In a response to this, Regional Skills Partnerships (RSPs) were developed. The ultimate goal of the RSPs is to encourage demand-led training in each region. RSPs do not deliver training themselves, as they have no direct funding. Instead, they work for the alignment of provision of publicly funded adult skills, business support, labour market and productivity services with the priorities identified in the respective regional economic strategies. They thus identify barriers to successful engagement with employers in raising productivity and skills.
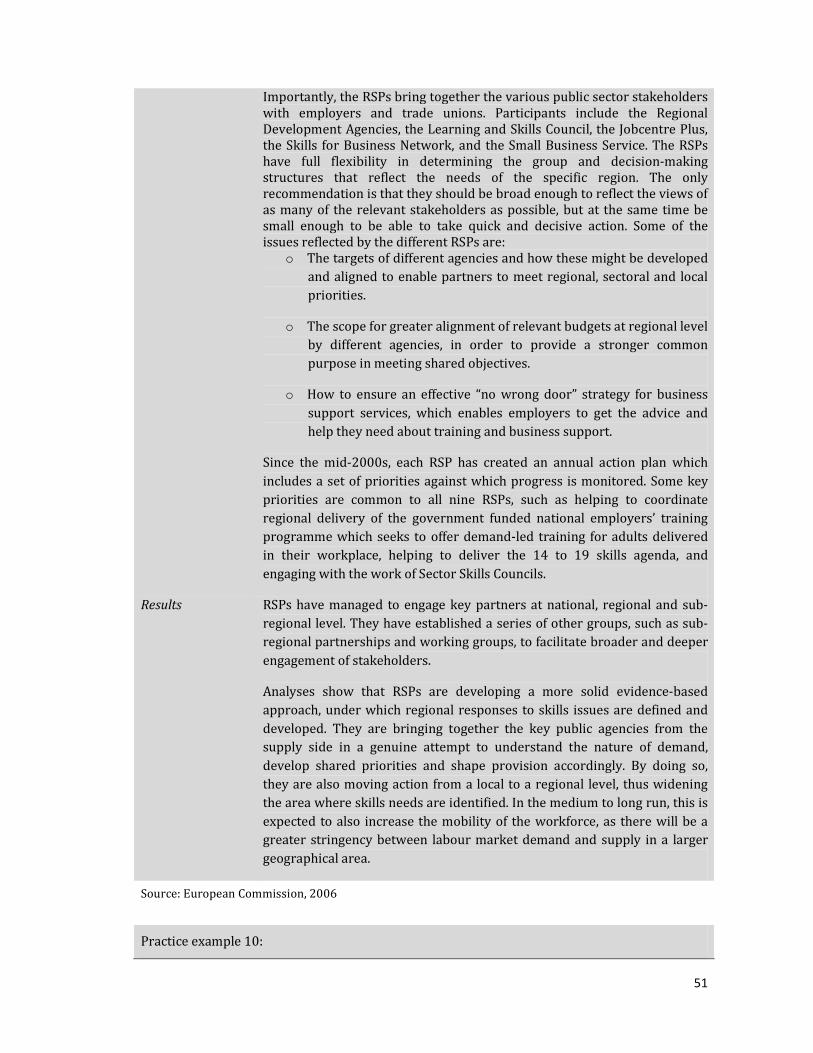
51
Importantly, the RSPs bring together the various public sector stakeholders with employers and trade unions. Participants include the Regional Development Agencies, the Learning and Skills Council, the Jobcentre Plus, the Skills for Business Network, and the Small Business Service. The RSPs have full flexibility in determining the group and decision-making structures that reflect the needs of the specific region. The only recommendation is that they should be broad enough to reflect the views of as many of the relevant stakeholders as possible, but at the same time be small enough to be able to take quick and decisive action. Some of the issues reflected by the different RSPs are:
o The targets of different agencies and how these might be developed and aligned to enable partners to meet regional, sectoral and local priorities.
o The scope for greater alignment of relevant budgets at regional level by different agencies, in order to provide a stronger common purpose in meeting shared objectives.
o How to ensure an effective “no wrong door” strategy for business support services, which enables employers to get the advice and help they need about training and business support.
Since the mid-2000s, each RSP has created an annual action plan which includes a set of priorities against which progress is monitored. Some key priorities are common to all nine RSPs, such as helping to coordinate regional delivery of the government funded national employers’ training programme which seeks to offer demand-led training for adults delivered in their workplace, helping to deliver the 14 to 19 skills agenda, and engaging with the work of Sector Skills Councils.
Results RSPs have managed to engage key partners at national, regional and sub-regional level. They have established a series of other groups, such as sub-regional partnerships and working groups, to facilitate broader and deeper engagement of stakeholders.
Analyses show that RSPs are developing a more solid evidence-based approach, under which regional responses to skills issues are defined and developed. They are bringing together the key public agencies from the supply side in a genuine attempt to understand the nature of demand, develop shared priorities and shape provision accordingly. By doing so, they are also moving action from a local to a regional level, thus widening the area where skills needs are identified. In the medium to long run, this is expected to also increase the mobility of the workforce, as there will be a greater stringency between labour market demand and supply in a larger geographical area.
Source: European Commission, 2006
Practice example 10:
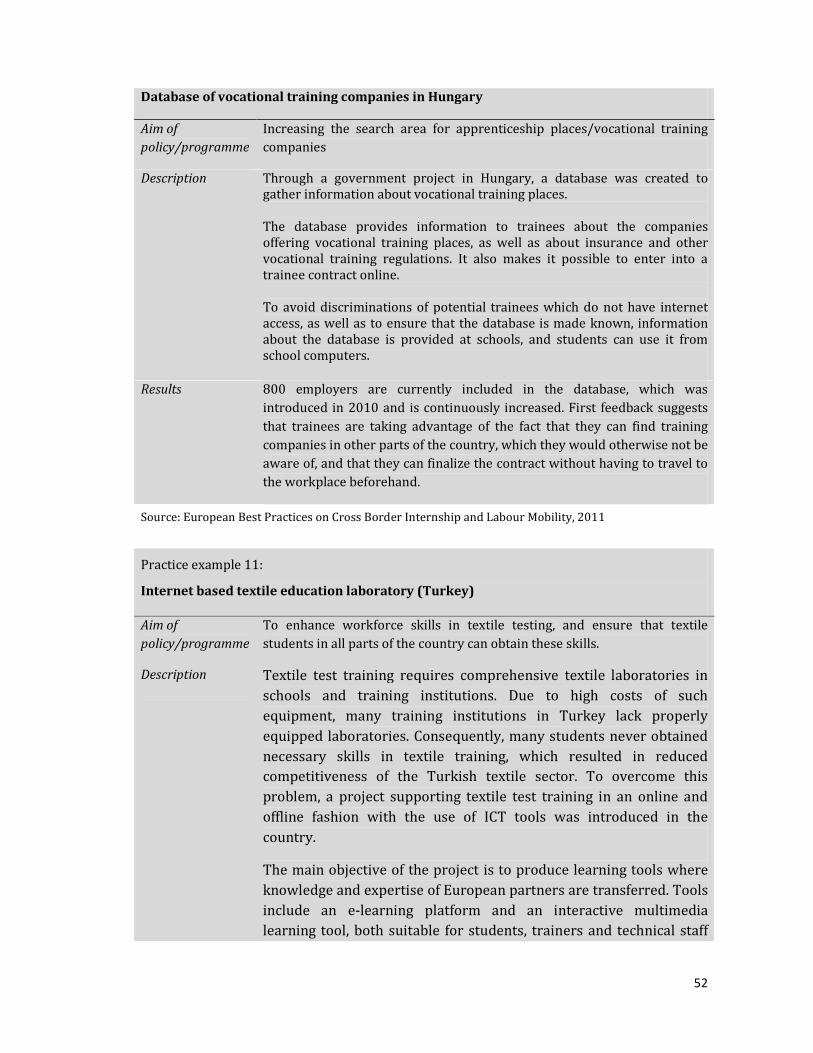
52
Database of vocational training companies in Hungary
Aim of
policy/programme
Increasing the search area for apprenticeship places/vocational training companies
Description Through a government project in Hungary, a database was created to gather information about vocational training places. The database provides information to trainees about the companies offering vocational training places, as well as about insurance and other vocational training regulations. It also makes it possible to enter into a trainee contract online. To avoid discriminations of potential trainees which do not have internet access, as well as to ensure that the database is made known, information about the database is provided at schools, and students can use it from school computers.
Results 800 employers are currently included in the database, which was introduced in 2010 and is continuously increased. First feedback suggests that trainees are taking advantage of the fact that they can find training companies in other parts of the country, which they would otherwise not be aware of, and that they can finalize the contract without having to travel to the workplace beforehand.
Source: European Best Practices on Cross Border Internship and Labour Mobility, 2011
Practice example 11:
Internet based textile education laboratory (Turkey)
Aim of
policy/programme
To enhance workforce skills in textile testing, and ensure that textile students in all parts of the country can obtain these skills.
Description Textile test training requires comprehensive textile laboratories in schools and training institutions. Due to high costs of such equipment, many training institutions in Turkey lack properly equipped laboratories. Consequently, many students never obtained necessary skills in textile training, which resulted in reduced competitiveness of the Turkish textile sector. To overcome this problem, a project supporting textile test training in an online and offline fashion with the use of ICT tools was introduced in the country.
The main objective of the project is to produce learning tools where knowledge and expertise of European partners are transferred. Tools include an e-learning platform and an interactive multimedia learning tool, both suitable for students, trainers and technical staff
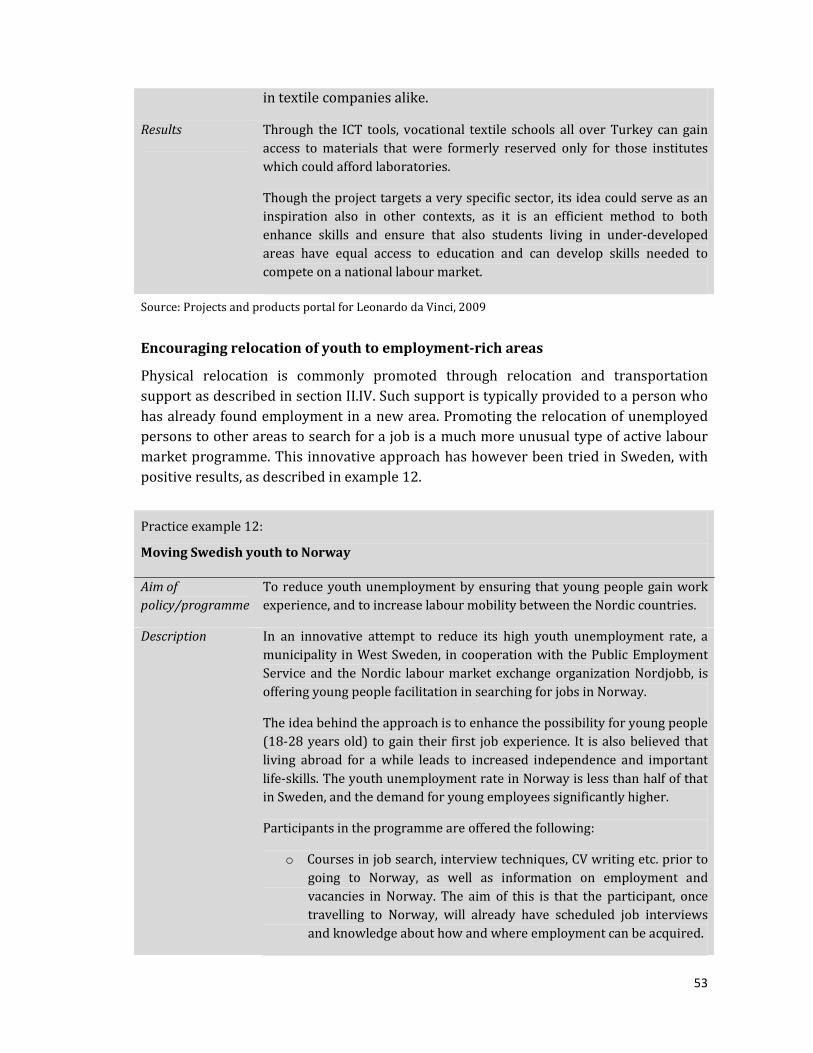
53
in textile companies alike.
Results Through the ICT tools, vocational textile schools all over Turkey can gain access to materials that were formerly reserved only for those institutes which could afford laboratories.
Though the project targets a very specific sector, its idea could serve as an inspiration also in other contexts, as it is an efficient method to both enhance skills and ensure that also students living in under-developed areas have equal access to education and can develop skills needed to compete on a national labour market.
Source: Projects and products portal for Leonardo da Vinci, 2009
Encouraging relocation of youth to employment-rich areas
Physical relocation is commonly promoted through relocation and transportation support as described in section II.IV. Such support is typically provided to a person who has already found employment in a new area. Promoting the relocation of unemployed persons to other areas to search for a job is a much more unusual type of active labour market programme. This innovative approach has however been tried in Sweden, with positive results, as described in example 12.
Practice example 12:
Moving Swedish youth to Norway
Aim of
policy/programme
To reduce youth unemployment by ensuring that young people gain work experience, and to increase labour mobility between the Nordic countries.
Description In an innovative attempt to reduce its high youth unemployment rate, a municipality in West Sweden, in cooperation with the Public Employment Service and the Nordic labour market exchange organization Nordjobb, is offering young people facilitation in searching for jobs in Norway.
The idea behind the approach is to enhance the possibility for young people (18-28 years old) to gain their first job experience. It is also believed that living abroad for a while leads to increased independence and important life-skills. The youth unemployment rate in Norway is less than half of that in Sweden, and the demand for young employees significantly higher.
Participants in the programme are offered the following:
o Courses in job search, interview techniques, CV writing etc. prior to going to Norway, as well as information on employment and vacancies in Norway. The aim of this is that the participant, once travelling to Norway, will already have scheduled job interviews and knowledge about how and where employment can be acquired.
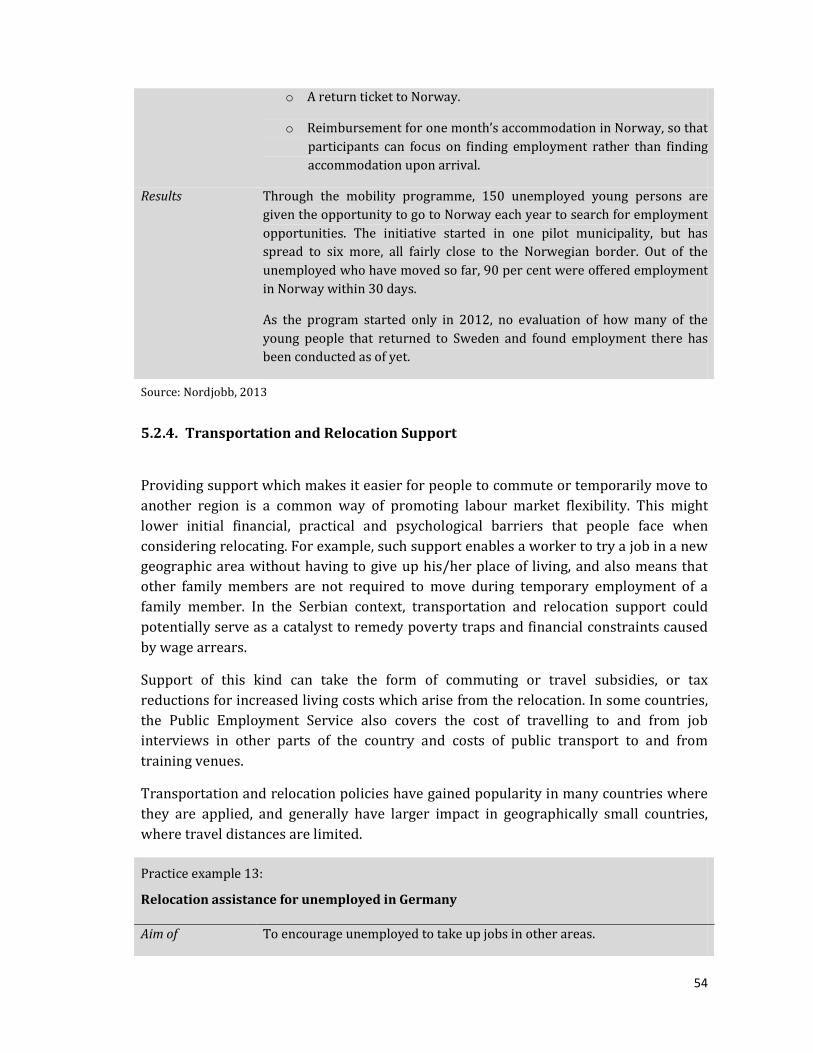
54
o A return ticket to Norway.
o Reimbursement for one month’s accommodation in Norway, so that participants can focus on finding employment rather than finding accommodation upon arrival.
Results Through the mobility programme, 150 unemployed young persons are given the opportunity to go to Norway each year to search for employment opportunities. The initiative started in one pilot municipality, but has spread to six more, all fairly close to the Norwegian border. Out of the unemployed who have moved so far, 90 per cent were offered employment in Norway within 30 days.
As the program started only in 2012, no evaluation of how many of the young people that returned to Sweden and found employment there has been conducted as of yet.
Source: Nordjobb, 2013
5.2.4. Transportation and Relocation Support
Providing support which makes it easier for people to commute or temporarily move to another region is a common way of promoting labour market flexibility. This might lower initial financial, practical and psychological barriers that people face when considering relocating. For example, such support enables a worker to try a job in a new geographic area without having to give up his/her place of living, and also means that other family members are not required to move during temporary employment of a family member. In the Serbian context, transportation and relocation support could potentially serve as a catalyst to remedy poverty traps and financial constraints caused by wage arrears.
Support of this kind can take the form of commuting or travel subsidies, or tax reductions for increased living costs which arise from the relocation. In some countries, the Public Employment Service also covers the cost of travelling to and from job interviews in other parts of the country and costs of public transport to and from training venues.
Transportation and relocation policies have gained popularity in many countries where they are applied, and generally have larger impact in geographically small countries, where travel distances are limited.
Practice example 13:
Relocation assistance for unemployed in Germany
Aim of To encourage unemployed to take up jobs in other areas.

55
policy/programme
Description Even though Germany is experiencing high demand for mobile workers and has a well-developed infrastructure, the willingness to change place of residence is relatively low: 45 per cent of people between 20 and 59 years of age have lived in the same regions as their parents since birth. People are much more prone to change professions, commute long distances, or take on a job below the level of skills or education than to move for employment reasons.
To improve inter-regional labour mobility, relocation assistance was introduced in Germany in 1998. Local employment agencies in the country decide autonomously about their individual mix of Active Labour Market Programmes, given a fixed budget and a set of measures. The relocation assistance belongs to this set of programs, and the responsibility for an individual applicant falls under the local employment agency in the initial place of residence of the person.
The assistance can be assigned to unemployed or to job-seekers who are threatened by unemployment and it is contingent to social insurance contributions. It consists of two parts; support to temporary housekeeping with a monthly payment of 260 Euro for up to six months, and a subsidy for permanent moving covering the one-time transportation costs. For the latter, the applicant has to submit three cost-estimates to find the most cost-efficient offer, and the subsidy is then paid directly to the removal company. Both parts of the assistance are only available if the commuting distance to the new place exceeds 2.5 hours per day.
To be eligible to assistance, the applicant has to start a new employment and show his/her legal employment contract.
Results An evaluation of the German relocation assistance was carried out in 2013, covering the period 2006-2010. It looks at a random sample of individuals who were registered as unemployed in 2006, comparing 433 persons who received relocation assistance to a control group, consisting of 35,524 persons who did not utilize this ALMP, with the aim of measuring the causal effect of the relocation assistance on unemployment duration and job match quality.
The evaluation shows no effect on relocation assistance on unemployment duration. However, recipients of the assistance receive higher wages: 77.92 Euro on average as first daily income after transition, compared to 60.92 Euro for non-participants. They also tend to end up in more stable jobs, with 1.26 job quits within 24 months after transition, compared to 1.97 within the control group. Logically, participants are also much more likely to work in distant regions. 46 per cent work in a region not bordering their previous region of residence, whereas this is true for only 4 per cent of non-participants. Relocations generally take place to regions which are characterized by better economic conditions and lower unemployment
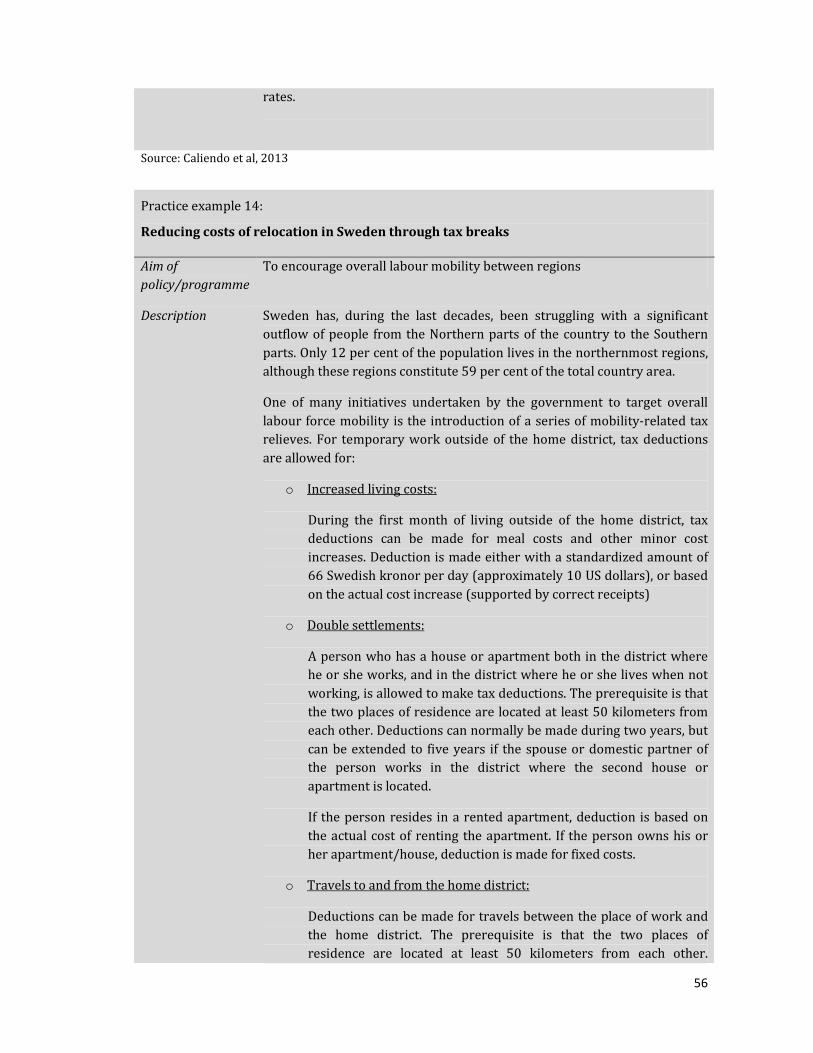
56
rates.
Source: Caliendo et al, 2013
Practice example 14:
Reducing costs of relocation in Sweden through tax breaks
Aim of
policy/programme
To encourage overall labour mobility between regions
Description Sweden has, during the last decades, been struggling with a significant outflow of people from the Northern parts of the country to the Southern parts. Only 12 per cent of the population lives in the northernmost regions, although these regions constitute 59 per cent of the total country area.
One of many initiatives undertaken by the government to target overall labour force mobility is the introduction of a series of mobility-related tax relieves. For temporary work outside of the home district, tax deductions are allowed for:
o Increased living costs:
During the first month of living outside of the home district, tax deductions can be made for meal costs and other minor cost increases. Deduction is made either with a standardized amount of 66 Swedish kronor per day (approximately 10 US dollars), or based on the actual cost increase (supported by correct receipts)
o Double settlements:
A person who has a house or apartment both in the district where he or she works, and in the district where he or she lives when not working, is allowed to make tax deductions. The prerequisite is that the two places of residence are located at least 50 kilometers from each other. Deductions can normally be made during two years, but can be extended to five years if the spouse or domestic partner of the person works in the district where the second house or apartment is located.
If the person resides in a rented apartment, deduction is based on the actual cost of renting the apartment. If the person owns his or her apartment/house, deduction is made for fixed costs.
o Travels to and from the home district:
Deductions can be made for travels between the place of work and the home district. The prerequisite is that the two places of residence are located at least 50 kilometers from each other.

57
Deductions can be made for one return trip per week, and should be based on the actual costs of travelling (the cheapest alternative must be chosen).
Results Although there is no evaluation of the exact impacts of the tax breaks on mobility, preliminary studies suggest that they are successful in increasing the willingness to try employment in another area in the short term, and to permanently relocate in to the new area in the long run.
An assessment from Official Reports of the Swedish Government (SOU) argues that the tax breaks have a positive impact on regions with high unemployment levels, based on the arguments that they A) can maintain high tax bases if residents keep living in the region, while being employed elsewhere; B) can maintain workers by not forcing family members to move if one person in the household finds a job elsewhere; and C) can more easily recruit new people to the region, as it is not necessary to move to the depressed region.
Source: Swedish Tax Agency, 2013; Reports of the Swedish Government, 2005
The German example shows that relocation support there stimulated movements from regions with higher unemployment to job-rich areas. This pattern is confirmed also by other studies16, which indicate that such support tends to result in a redistribution of the working population from smaller and less densely populated areas to urban areas characterized by good economic conditions. In contrast to this, commuting subsidies have the advantage of offering possibilities for people to be able to live outside large urban areas or remain in their place of residence, while enjoying employment opportunities elsewhere. This is illustrated in the Slovakian example.
Practice example 15:
Commuting allowance in Slovakia
Aim of
policy/programme
To reduce unemployment and encourage unemployed to take up jobs in other areas
Description Since 2006, jobseekers in Slovakia are entitled to a commuting allowance if they take up employment in another municipality, under the only prerequisite that they have been registered as unemployed for at least three months.
The reimbursement is kilometer-based, with a ceiling of 135 Euro per month. It can be utilized for maximum six months in a two-year period. The reimbursement ceiling is used to avoid excessively long commuting, as well as to meet government budget constraints. The time limit is used because the allowance should serve as a catalyst for job-searchers, encouraging
16 See Official Reports of the Swedish Governments, 2003 for a discussion on this.
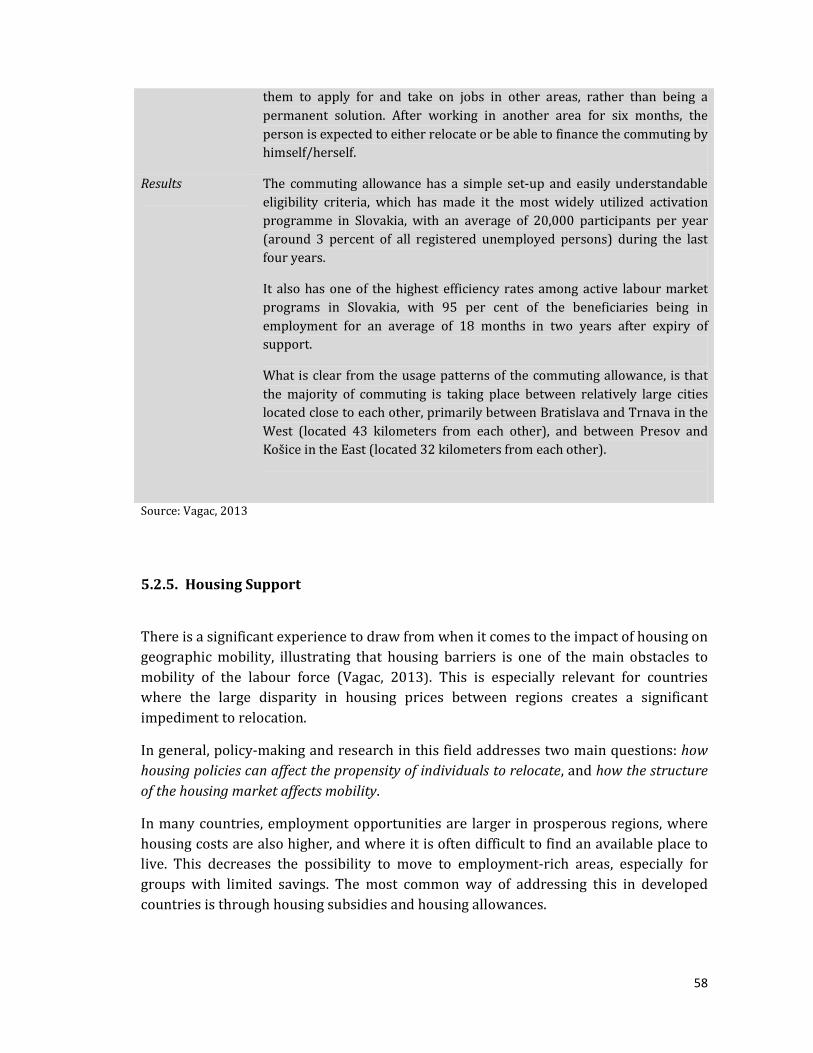
58
them to apply for and take on jobs in other areas, rather than being a permanent solution. After working in another area for six months, the person is expected to either relocate or be able to finance the commuting by himself/herself.
Results The commuting allowance has a simple set-up and easily understandable eligibility criteria, which has made it the most widely utilized activation programme in Slovakia, with an average of 20,000 participants per year (around 3 percent of all registered unemployed persons) during the last four years.
It also has one of the highest efficiency rates among active labour market programs in Slovakia, with 95 per cent of the beneficiaries being in employment for an average of 18 months in two years after expiry of support.
What is clear from the usage patterns of the commuting allowance, is that the majority of commuting is taking place between relatively large cities located close to each other, primarily between Bratislava and Trnava in the West (located 43 kilometers from each other), and between Presov and Košice in the East (located 32 kilometers from each other).
Source: Vagac, 2013
5.2.5. Housing Support
There is a significant experience to draw from when it comes to the impact of housing on geographic mobility, illustrating that housing barriers is one of the main obstacles to mobility of the labour force (Vagac, 2013). This is especially relevant for countries where the large disparity in housing prices between regions creates a significant impediment to relocation.
In general, policy-making and research in this field addresses two main questions: how
housing policies can affect the propensity of individuals to relocate, and how the structure
of the housing market affects mobility.
In many countries, employment opportunities are larger in prosperous regions, where housing costs are also higher, and where it is often difficult to find an available place to live. This decreases the possibility to move to employment-rich areas, especially for groups with limited savings. The most common way of addressing this in developed countries is through housing subsidies and housing allowances.
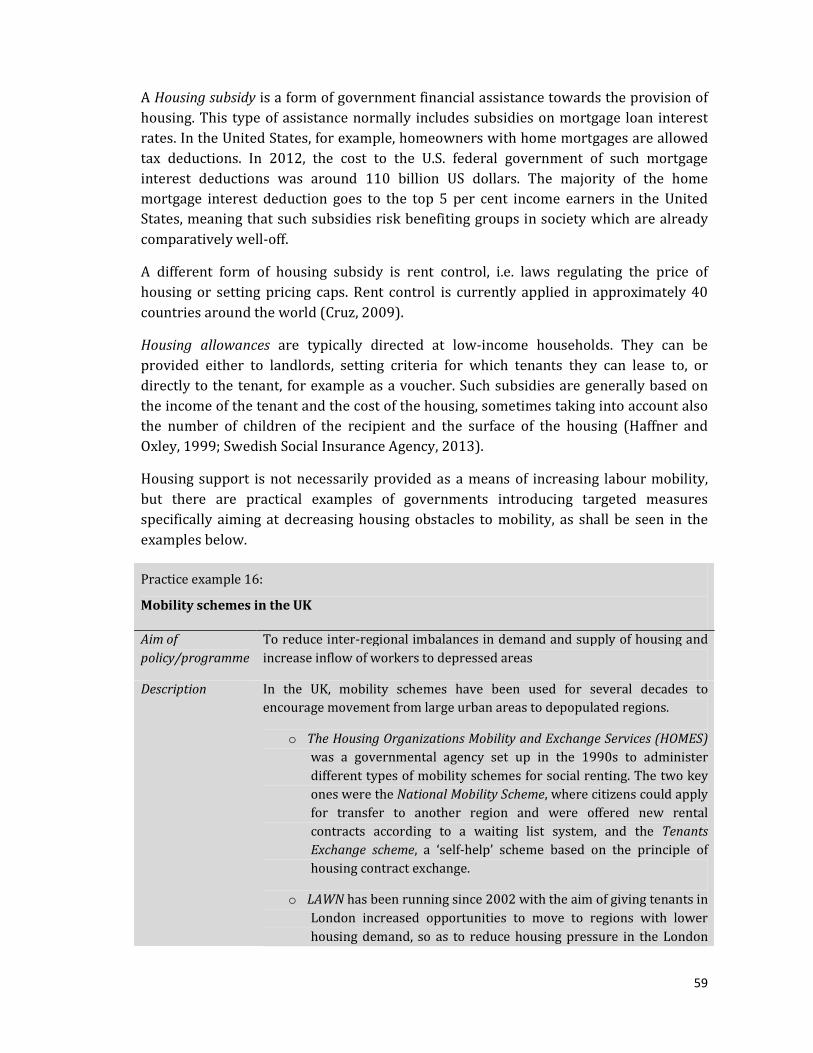
59
A Housing subsidy is a form of government financial assistance towards the provision of housing. This type of assistance normally includes subsidies on mortgage loan interest rates. In the United States, for example, homeowners with home mortgages are allowed tax deductions. In 2012, the cost to the U.S. federal government of such mortgage interest deductions was around 110 billion US dollars. The majority of the home mortgage interest deduction goes to the top 5 per cent income earners in the United States, meaning that such subsidies risk benefiting groups in society which are already comparatively well-off.
A different form of housing subsidy is rent control, i.e. laws regulating the price of housing or setting pricing caps. Rent control is currently applied in approximately 40 countries around the world (Cruz, 2009).
Housing allowances are typically directed at low-income households. They can be provided either to landlords, setting criteria for which tenants they can lease to, or directly to the tenant, for example as a voucher. Such subsidies are generally based on the income of the tenant and the cost of the housing, sometimes taking into account also the number of children of the recipient and the surface of the housing (Haffner and Oxley, 1999; Swedish Social Insurance Agency, 2013).
Housing support is not necessarily provided as a means of increasing labour mobility, but there are practical examples of governments introducing targeted measures specifically aiming at decreasing housing obstacles to mobility, as shall be seen in the examples below.
Practice example 16:
Mobility schemes in the UK
Aim of
policy/programme
To reduce inter-regional imbalances in demand and supply of housing and increase inflow of workers to depressed areas
Description In the UK, mobility schemes have been used for several decades to encourage movement from large urban areas to depopulated regions.
o The Housing Organizations Mobility and Exchange Services (HOMES) was a governmental agency set up in the 1990s to administer different types of mobility schemes for social renting. The two key ones were the National Mobility Scheme, where citizens could apply for transfer to another region and were offered new rental contracts according to a waiting list system, and the Tenants
Exchange scheme, a ‘self-help’ scheme based on the principle of housing contract exchange.
o LAWN has been running since 2002 with the aim of giving tenants in London increased opportunities to move to regions with lower housing demand, so as to reduce housing pressure in the London
60
area. Participants are entitled to financial assistance to view properties in another region and to pay removal costs, as well as relocation grants.
Since 2005, a series of measures to improve previous mobility schemes have been undertaken, incorporating some of the schemes, such as LAWN, but also creating new features:
o Several user-friendly web sites and forums have been introduced to inform people about existing mobility schemes and to facilitate housing exchange. These include the London authorities’ housing
moves website and the nationwide exchange databases House swap,
House exchange and Under One Roof. Job vacancy databases are also linked with housing database, to facilitate relocation for people considering moving for employment reasons.
o On the legislation side, the Localism Act of 2011 ensures, inter alia, that transfer applicants do not have to compete alongside new applicants for local authority housing.
Results Through the HOMES programs, more than 100,000 households moved to another region in the 1990s. The new mobility schemes have not yet been evaluated, but preliminary reviews show that they are frequently utilized.
Source: Wilson, 2013
Concerning the structure of the housing market and its effects on geographic mobility, studies of OECD countries quite unambiguously show that a high degree of home
ownership and a small rental sector is counteractive to mobility. In countries where there is a large share of home owners, such as many Eastern and Southern European countries, housing constitutes a larger barrier to mobility than elsewhere. In these countries, the responsiveness of housing supply is also lower than in countries with a relatively larger rental sector, such as the Nordic countries. Estimates by Andrews et al, (2011), show that households move twice as often in English-speaking and Nordic countries compared to Southern and Eastern European countries. It is argued that the comparatively larger rental sector in the English-speaking and Nordic countries is a key factor explaining this. More than 80 per cent of the households in Estonia, Slovakia, Slovenia and Hungary own their homes, whereas this figure is below 55 per cent in Sweden, Denmark and Germany (Andrews et al, 2011).
A study on the connection between housing tenure, mobility and unemployment in Sweden between 1970 and 2005 also shows that unemployed persons renting their house or apartment are much more inclined to move, compared to unemployed persons who own their home. In fact, an unemployed homeowner is even less likely to move than an employed person with a rental contract. Around 80 percent of those unemployed people that do move, also move to a rented house or apartment (Brandén, 2008).
61
The share of rental supply is primarily determined by government spending on housing construction for rental purposes, but can it also be increased through enhancing incentives for private renting. This can be done, for example, through simplification of procedures for receiving building permits, tax relieves for house owners which rent out apartments or rooms, or subsidies to increase the profitability of construction for rent or to offset high development costs.
Practice example 17:
Housing policy in Slovakia
Aim of
policy/programme
To increase the share of the rental housing sector, thereby increasing labour mobility.
Description The share of home ownership is very high in Slovakia, with owner occupancy exceeding 90 per cent. This is primarily a result of privatization of municipal and cooperative dwellings in the early 90s, according to the ‘right-to-buy’ policy. Prior to 1991, the share of home-ownership was 49 percent.
The housing stock is generally small, and the overcrowding rate is one of the highest in the EU, with 326 dwellings per 1,000 inhabitants. At the same time, a relatively large part of the housing stock is vacant (about 11 percent), further substantiating the mismatch between housing supply and demand. Residential construction is increasing, but is largely focusing on more owner-occupied houses.
In 2010, the government adopted the Concept of the State Housing Policy
until 2015. One of its explicit aims is to facilitate labour mobility. To achieve this, the policy focuses on support to the development of the public rental sector (social housing) through direct subsidies from the state budget as well as soft loans from the State Housing Development Fund. Economic incentives should also be introduced to stimulate investments in the private rental sector. This is mainly to be achieved through tax incentives, which are considered more motivating for the population and business entities than the provision of subsidies. The State Housing Development Fund also offers favorable loans to legal entities.
Results No evaluation of the Housing Policy is available. However, initial surveys among housing developers point to high VAT and absence of sufficient economic stimuli to build houses for rental purposes. They are generally more positive towards tax incentives than loans from the State Housing Development Fund.
Though the success of the policy cannot be established at this stage, it provides an example of how countries with high shares of home-ownership are trying to steer developers towards creating more rental housing.
62
Soruce: Vagac, 2013
5.2.6. Education Policies
Empirical studies clearly demonstrate that skills and education is a key driver in geographic mobility. Firstly, highly educated people have a higher propensity to move than other groups in society. Secondly, education can be an important pull factor, since young people, who are also in general more mobile than other age groups, often move for educational reasons.
Furthermore, educational advancement raises the gains of moving, as individuals with specialized skills are expected to have higher returns of searching for jobs on a wider market. The more highly educated and specialized a worker is, the more likely it is that he or she will find a better job match when searching on a larger geographic job market, in turn resulting also in a higher salary. Skills of highly educated people are in general also more portable, since they are based primarily on technical or academic knowledge, rather than on abilities developed in response to the needs of a local employer, which is more often the case for low-skilled workers (European Commission, 2008). In a time where many highly educated youth are referred to jobs below their level of skills, and where unemployment rates among highly educated youth have reached new heights, mobility can be a solution to find employment matching the level of education and avoiding loss of skills.
Against this background, all policies which are effective in promoting skills and education are expected to also impact mobility in the long run. More specifically, the more specialized and educated a worker is, the more likely it is that his or her relocation has a positive labour market effect, as highly skilled workers are more difficult to replace. Thus, a wider geographic employment scope of skilled workers is a key factor in matching labour market demand with adequate supply.
When focusing on education policies that directly target geographic mobility, two types of interventions can be identified: policies promoting education exchanges, and policies
attracting and recruiting students to remote or depressed areas.
Promoting education exchanges
In most OECD countries, attempts to attract foreign students or students from other areas of the country are numerous, especially so, within tertiary education. Such efforts include exchange programs between schools, education fairs, and different kinds of Public Relations activities. They are generally organized by local governments or by the education institutions themselves.
However, student mobility can also be addressed through government policies, since factors such as the availability of affordable housing and transportation possibilities to

63
and from the hometown, which all typically fall under the responsibility of governments, also affect the willingness of students to move.
If effectively implemented, policies which promote student mobility are expected to have a very high yield in the long run, as young people who move from their home towns are significantly more likely to be mobile also later in life (Parey and Waldinger, 2007). This is a result both of reduced psychological barriers to mobility of the individual, and of concrete gains in skills, such as greater language abilities, adaptability and interpersonal competences, which are all valued by employers.
Practice example 18:
EU Lifelong Learning Program
Aim of
policy/programme
To reduce personal barriers to cross-country mobility
Description The EU Lifelong Learning Program supports activities which foster exchange, cooperation and mobility within and between education systems in member states. It builds on four main programs:
o The Comenius program (pre-school);
o The Leonardo da Vinci program (vocational education and training);
o The Erasmus program (tertiary education);
o The Grundtvig program (adult education).
Among these, the Erasmus programme has received most attention and is considered a major success. Since its adoption in 1987, more than 3 million students from 33 countries have taken part in the programme. Eligibility criteria for participation are that the student is studying at a tertiary level institution and has completed his/her first year of studies. The period spent abroad is guaranteed to be recognized by the home university when the student returns from the exchange semester, and students do not pay any extra tuition fees to the university which they visit. It is also possible to apply for a grant to cover extra expenses of living abroad.
To facilitate Erasmus participation and mobility, the European Commission has also supported an accommodation network – Erasmate – where students can rent, sublet and swap accommodation.
Results Evaluation shows that conducting some parts of university studies abroad, which in Europe is most often done under the Erasmus program, increases the likelihood of working abroad later in life by 15-20 percent.
Sources:European Commission Education and Training; Parey and Waldinger, 2007
64
Attracting and recruiting students to remote areas
In unfortunate contexts, labour mobility can increase rather than reduce regional disparities, with relocation taking place mainly in one direction; from rural or depressed areas to urban or economically flourishing areas. Therefore, attracting people to remote regions is crucial in ensuring sufficient human resources in basic services of such regions.
Evaluations of policies encouraging young people to move to remote areas have shown that professionals who themselves stem from rural areas are also more likely to work in rural areas at a later stage in life. For this reason, it is important that universities can attract students from such areas. Similarly, placing education and training institutions in remote areas can attract young people both from the local area and from other areas to stay in or move to remote parts of the country.
On a related note, where curricula include rural or regional issues, this generally increases the willingness of students to work in remote areas. The examples below illustrate how this knowledge can be reflected in practice.
Practice example 19:
Rural Physician Associate Program of Minnesota
Aim of
policy/programme
To increase the number of primary care physicians in rural Minnesota, , i.e. to boost inflow of certain professionals to depressed areas
Description The state funded Rural Physician Associate Program has been implemented since 1971. It was developed to ensure a sufficient amount of skilled health care workers in the low-populated rural Minnesota, US.
Third-year medical students are assigned to primary care centers in rural communities for 9 months, where they experience rural practice with hands-on participation, mentoring, and one-to-one teaching.
In 2008, 1,175 students had graduated from the programme, i.e. on average around 30 students per year.
Results An evaluation of the program was conducted in 2008, showing that conducting the 9-month rural practice increased the number of students which later choose to practice in a rural setting, compared with the control group. 44 per cent of participants who were still practicing at the time of the evaluation had been working in a rural setting since graduation.
Source: Halaas et al, 2008
Practice example 20:
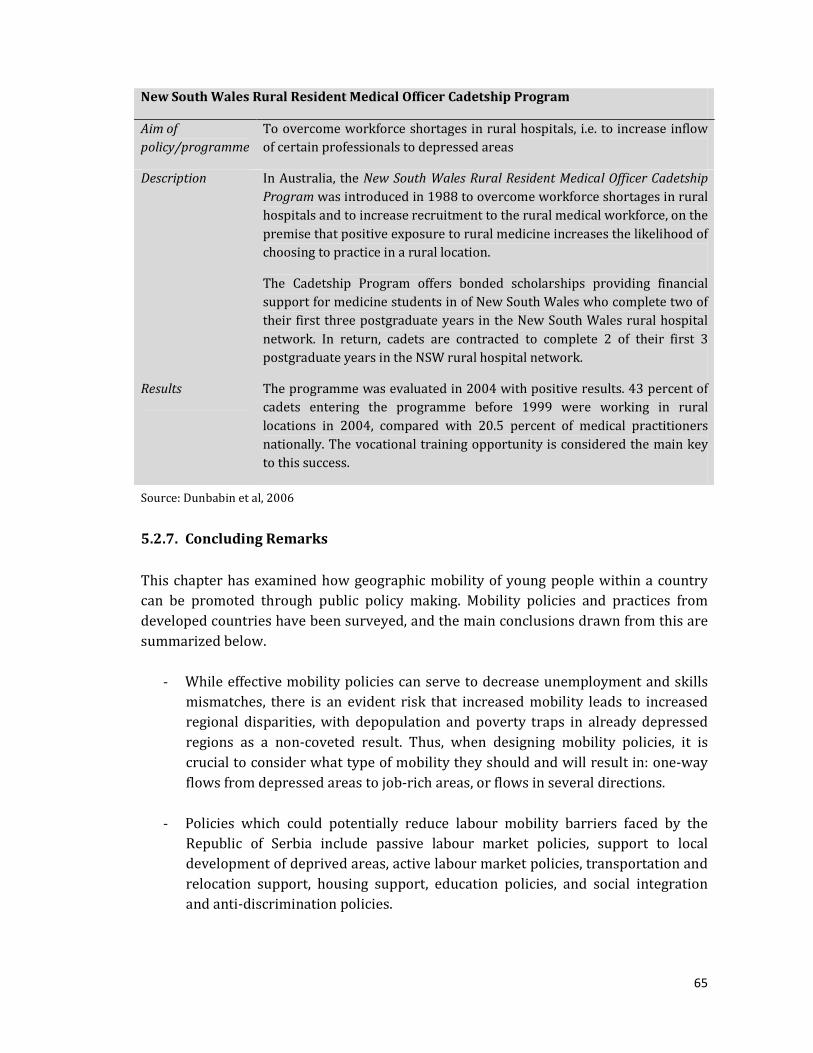
65
New South Wales Rural Resident Medical Officer Cadetship Program
Aim of
policy/programme
To overcome workforce shortages in rural hospitals, i.e. to increase inflow of certain professionals to depressed areas
Description In Australia, the New South Wales Rural Resident Medical Officer Cadetship
Program was introduced in 1988 to overcome workforce shortages in rural hospitals and to increase recruitment to the rural medical workforce, on the premise that positive exposure to rural medicine increases the likelihood of choosing to practice in a rural location.
The Cadetship Program offers bonded scholarships providing financial support for medicine students in of New South Wales who complete two of their first three postgraduate years in the New South Wales rural hospital network. In return, cadets are contracted to complete 2 of their first 3 postgraduate years in the NSW rural hospital network.
Results The programme was evaluated in 2004 with positive results. 43 percent of cadets entering the programme before 1999 were working in rural locations in 2004, compared with 20.5 percent of medical practitioners nationally. The vocational training opportunity is considered the main key to this success.
Source: Dunbabin et al, 2006
5.2.7. Concluding Remarks
This chapter has examined how geographic mobility of young people within a country can be promoted through public policy making. Mobility policies and practices from developed countries have been surveyed, and the main conclusions drawn from this are summarized below.
- While effective mobility policies can serve to decrease unemployment and skills mismatches, there is an evident risk that increased mobility leads to increased regional disparities, with depopulation and poverty traps in already depressed regions as a non-coveted result. Thus, when designing mobility policies, it is crucial to consider what type of mobility they should and will result in: one-way flows from depressed areas to job-rich areas, or flows in several directions.
- Policies which could potentially reduce labour mobility barriers faced by the Republic of Serbia include passive labour market policies, support to local development of deprived areas, active labour market policies, transportation and relocation support, housing support, education policies, and social integration and anti-discrimination policies.
66
- Recent country cases show that relatively high unemployment and welfare benefits have a positive effect on mobility, by relaxing liquidity constraints and reducing risks of relocating. High levels of welfare benefits create decent living conditions needed for people to want to stay in a region, but they do not attract domestic or international migrants. Instead, migrants’ choice of destination depends mainly on the employment opportunities that the new place of residence can provide.
- To ensure that mobility is taking place not only from depressed areas to urbanized areas, policies to promote local development are needed. In the short term, such policies can prevent a large outflow of people from some areas. In the long term, they can also attract skilled workers to previously depressed areas.
- Active labour market programs focusing on increased labour mobility are not very common, but where they exist they have been quite effective. These primarily revolve around improved coordination and cooperation between employment services, and improved coordination of vocational training and accreditation systems. Innovative approaches that encourage the relocation of unemployed youth to employment rich areas also exist.
- Transportation and relocation support is generally provided through relatively
small active labour market programs. Successful policies include commuting allowances in countries or regions where geographic distances are moderate, and mobility-related tax relieves.
- Housing support policies are complex to develop, but important, as housing
constraints tend to be a major barrier to mobility in most countries, not least in Eastern Europe. Evidence shows that a large rental sector is beneficial to mobility, not least of young workers.
- Education policies have high potential to affect labour mobility positively. Young people undertaking education outside the home district are significantly more likely to be mobile also later in life. Thus, exchange programs can be utilized to break down initial psychological barriers to moving from the home district. Education policies can also be used to attract students and workers to depressed areas, for example by placing universities in these areas, or by supporting apprenticeships in workplaces located in depressed regions.
- Evidence suggests that young people in general have higher propensity to move.
They are also more responsive to and interested in services provided by government agencies to promote mobility. This indicates that there is a large scope for effectively addressing youth mobility through public policies.
67
Bibliography
Acemoglu, D. and R. Shimer (1999): Efficient Unemployment Insurance. Journal of Political Economy 107.
Andrews, D., A. Caldera Sánchez and Å. Johansson (2011): Housing Markets and
Structural Policies in OECD Countries. OECD Economics Department WorkingPapers, No. 836.
Aparicio, F.J., and C. Meseguer (2008): Collective Remittances and the State: The 3x1
program in Mexican Municipalities. LLILAS, the University of Texas at Austin.
Arandarenko, M. and M. Jovičić (2007):"Regional Labour Market Differences in Serbia: Assessment and Policy Recommendations", The European Journal of Comparative
Economics , Vol. 4, n. 2, pp. 299-317, 2007
Arntz, M. (2005): The geographical mobility of unemployed persons. Evidence from West
Germany. Centre for European Economic Research, Working Paper 05-34.
Auer, P. (2005): Protected mobility for employment and decent work: Labour market
security in a globalised world. International Labour Office, Employment Analysis and Research Unit.
Bertola G., R. Foellmi and J. Zweimüller (2006), Income Distribution in Macroeconomic
Models. Princeton University Press.
Bonin, H., W. Eichhorst, C. Florman, M. Okkels Hansen, L. Skiöld, J. Stuhler, K. Tatsiramos, H. Thomasen, and K.F. Zimmerman (2008): Geographic Mobility in the European
Union: Optimising its Economic and Social Benefits. IZA Research Report no 19.
Caliendo, M., S. Künn, and R. Mahlstedt (2013): The Return to Labour Market Mobility: An
Evaluation of Relocation Assistance for the Unemployed. Preliminary version, May 14. http://www.iza.org/conference_files/PolicyEval_2013/mahlstedt_r7298.pdf
Cardus: http://www.cardus.ca/research/workandeconomics/labourmobility/
Cruz, P.C. (2009): The pros and cons of rent control, Global Property Guide. http://www.globalpropertyguide.com/investment-analysis/The-pros-and-cons-of- rent-control
De Jong, G.F., D. RoemkeGraeffe, and T. St Pierre (2005): Welfare reform and interstate
migration of poor families. Department of Sociology and Population Research Institute, Pennsylvania State University
Dunbabin JS., K. McEwin and I. Cameron (2006): Postgraduate medical placements in
rural areas: their impact on the rural medical workforce. Rural Remote Health 2006;6.
EURES: https://ec.europa.eu/eures/
68
Eurobarometer Report (2010): Geographical and Labour Market Mobility, Directorate- General for Employment and Social Affairs, Special Eurobarometer 337.
European Best Practices on Cross Border Internship and Labour Mobility (2011): EBCIL
Catalogue. 14 European Best Practices on Cross Border Internship and Labour
Mobility.http://www.ebcil.eu/index.php?option=com_content&view=article&id=79 &Itemid=54
European Commission Education and Training: http://ec.europa.eu/education/lifelong- learning-programme/doc78_en.htm
European Commission, DG Employment, Social Affairs and Equal Opportunities (2006): European Employment Observatory Review: Spring 2006).
European Commission, DG Employment, Social Affairs and Equal Opportunities (2008): Geographic Mobility in the European Union: Optimising its Social and Economic
Benefits. Institute for the Study of Labour, NIRAS Consultants A/S, and the Swedish National Labour Market Board.
European Industrial Relations Observatory On-line (2006): Measures to encourage
geographic labour mobility. http://www.eurofound.europa.eu/eiro/2006/03/articles/es0603049i.htm
European Social Fund (2011): Giving Young People a Better Start in Life.
European Web Site on Integration (2013): MIGOVITA Young People with an Immigrant
Background: Diversity and Participation in the Transition from School to the
Labour Market.
http://ec.europa.eu/ewsi/en/practice/details.cfm?ID_ITEMS=33837
Eurostat: http://epp.eurostat.ec.europa.eu/portal/page/portal/eurostat/home/
Finnish National Board of Education (2013): Qualifications frameworks
http://www.oph.fi/mobility/qualifications_frameworks
Fredriksson, P., and P. Johansson (2003): Employment, mobility and active labor market
programs. Institute for labor market policy evaluation, Working paper 2003:3.
Fredriksson, P., and P. Johansson (2003): Employment, mobility, and active labour market
programmes. Institute for Labour Market Policy Evaluation, Working Paper 2003:3.
Government of Serbia (2009): Migration Management Strategy (Official Bulletin of the Republic of Serbia”, RS No. 59/2009)
Government of Serbia (2011):The National Employment Strategy for the period 2011-
2020 („Official Bulletin of the Republic of Serbia”, No. 55/05, 71/05 − correction, 101/07, 65/08 and 16/11)
Government of Serbia (2012): Migration Profile of the Republic of Serbia, 2012
Government of Serbia (2014): Drugi nacionalni izveštaj o socijalnom uključivanju i
smanjenju siromaštva u Republici Srbiji: Pregledi stanje socijalne isključenosti i
siromaštva za period 2011 – 2014. godine sa prioritetima za naredni period, 2014

69
Government of the United Kingdom: https://www.gov.uk
Haffner, M., and M. Oxley (1999): Housing Subsidies: Definitions and Comparisons, Housing Studies, Volume 14, Number 2
Halaas GW., T. Zink, D. Finstad, K. Bolin and B. Center (2008): Recruitment and retention
of rural physicians: outcomes from the rural physician associate program of
Minnesota. J Rural Health 2008 24 (4).
Hämäläinen, K. (2002): Unemployment, selective employment measures and inter-regional
mobility of labour. Papers in regional science 81.
Hendeliowitz, J. (2008): Danish Employment Policy. National Target Setting, Regional
Performance Management and Local Delivery. Employment Region Copenhagen & Zealand, The Danish National Labour Market Authority.
Herrera, C., and D. Sahn (2013): Determinants of Internal Migration Among Senegalese
Youth. http://www.cfnpp.cornell.edu/images/wp245.pdf
ILO (2003); Active Labour Market Policies. GB.288/ESP/2, 288th Session of the Governing Body. Geneva.
ILO (2009a): Opportunities and challenges for labour mobility in times of crisis and
beyond. International Labour Office. Geneva.
ILO (2009b): Labour Market Policies in times of crisis. Employment Working Paper no. 35. International Labour Office. Geneva.
ILO (2012): Promoting Decent Work in Eastern Europe and Central Asia. ILO Decent Work Technical Support Team and Country Office for Eastern Europe and Central Asia. Moscow.
ILO (2012b): Overview of apprenticeship systems and issues. ILO contribution to the G20
Task Force on Employment.
ILO (2013): Global Employment Trends: Recovering from a second jobs dip. International Labour Office. Geneva.
ILO (2013b): Practice Review: How can national polices address internal labour mobility
conducted within the "Partnerships for Youth Employment in the Commonwealth of Independent States" Project, Moscow
ILO Employment protection legislation database. http://www.ilo.org/dyn/eplex/termmain.home?p_lang=en
ILOSTAT Database http://www.ilo.org/ilostat
Ilsøe, A. (2007): The Danish Flexicurity Model – a Lesson for the US? Working Paper, Center for Transatlantic Relations, The Johns Hopkins University.
Inter-American Development Bank: Management and Investment Strengthening Project
3x1 for Migrants.http://www.iadb.org/en/projects/project-description- title,1303.html?id=ME-L1115#.Ul0ijlN2hog

70
Interprovincial Standards Red Seal Program (2013).http://www.red-seal.ca/w.2lc.4m.2@- eng.jsp
IOM (2012): The Impact of Demographic and Migration Flows on Serbia, “Capacity Building of Institutions Involved in Migration Management and Reintegration of Returnees in the Republic of Serbia“(CBMM) Project, Belgrade
IOM (2014): Mapping Major Migration Flows Over the Territory of Western Balkan
Countries: Transit, Origin and Destination, 2009-2013, Belgrade
Kupiszewski, M. (ed.) (2009): Labour Migration Patterns, Policies and Migration
Propensity in the Western Balkans, The Central European Forum for Migration and Population Research (CEFMR), IOM, Budapest, 2009
Kureková, L. (2011): The role of welfare systems in affecting out-migration. The case of
Central and Easter Europe. International Migration Institute, University of Oxford. DEMIG project paper no. 9.
Lindgren, U., and O. Westerlund (2003): Labour market programmes and geographical
mobility: migration and commuting among programme participants and openly
unemployed. Institute for labor market policy evaluation, Working paper 2003:6.
Lukic, V et all. (2013): Dynamic Historical Analysis of Longer Term Migratory, Labour
Market and Human Capital Processes in Serbia, Country report developed within the project ‘SEEMIG Managing Migration and Its Effects – Transnational Actions Towards Evidence Based Strategies’. Institute for Social Sciences, Belgrade,
Manić, S. and D. Azdejković (2012): Potencijalni efekti demografske tranzicije na održivu
konkurentnost, Ekonomskihorizonti, Maj - Avgust 2012, Godište XIV, Sveska 2, 111 - 120, Beograd
Ministry of Labour and Social Policy of Bulgaria (2013): Beautiful Bulgaria
http://www.beautifulbulgaria.com/bg/
Molloy, R., C.L. Smith, and A.K. Wozniak (2011): Internal Migration in the United States, NBER Working Paper No. 17307
Nakosteen, R.A., M. Zimmer, and O. Westerlund (2012): Active Labor Market Programs
and Regional Mobility of Labor: Evidence from the Swedish Recessio, 1994-1995.
Contemporary Economic Policy, Volume 30, Number 2, April 2012.
Nekby, L. (2008): Active labor market programs for the integration of youths and
immigrants into the labour market. United Nations Publication, Santiago de Chile.
Nordjobb (2013). http://www.nordjobb.org/sv/
North, D., S. Syrett, and D. Etherington (2007): Interventions to tackle the needs of
deprived areas. Analysis of six policy case studies.
O’Higgins, N. (2010): The impact of the economic and financial crisis on youth
employment: Measures for labour market recovery in the European Union, Canada and
the United States. International Labour Office, Employment Working Paper No. 70, Geneva.
71
OECD (2005): Employment Outlook 2005. Paris: OECD
OECD (2006): Employment Outlook 2006. Paris: OECD
OECD (2010): Off to a Good Start? Jobs for Youth.
OECD (2012), Free Movement of Workers and Labour Market Adjustment: Recent
Experiences from OECD Countries and the European Union. OECD Publishing. http://dx.doi.org/10.1787/9789264177185-en
OECD Statistics. http://www.oecd.org/statistics/
Parey, M. and F. Waldinger (2007): Studying Abroad and the Effect on International Labor
Market Mobility.
Pejin-Stokić. Lj. - Grečić, V. (2012): Social Impact of Emigration and Rural-Urban
Migration in Central and Eastern Europe. Final Country Report, Serbia, VT/2010/001.
Brussels: European Commission / DG Employment, Social Affairs and Inclusion – GVG.
Projects and products portal for Leonardo da Vinci (2009): Internet based textile
education laboratory.http://www.adam-europe.eu/adam/project/view.htm?prj=7592
Sharpe, A., and J. Gibson (2005): The Apprenticeship System in Canada. Trends and Issues.
Centre for the Study of Living Standards, CSLS Research Report 2005-04.
SOVA Center for Information and Analysis. http://www.sova-center.ru/en/
Stojanović B. and G.Vojković(2005): Urbane aglomeracije na glavnim razvojnim
osovinama kao polovi demografske revitalizacije Srbije, Stanovnistvo 1-4, Beograd
Swedish Public Employment Service (2013b): Establishment reform
http://www.government.se/sb/d/17645/a/220849
Swedish Social Insurance Agency: http://www.forsakringskassan.se
Swedish Tax Agency: http://www.skatteverket.se/
Tatsiramos, K. (2004): Geographic Labour Mobility and Unemployment insurance in
Europe. IZA Discussion paper series, No. 1253.
US Department of Housing and Urban Development (2011): Moving to Opportunity for
Fair Housing Demonstration Programme. Final Impacts Evaluation. http://www.huduser.org/publications/pdf/MTOFHD_fullreport_v2.pdf
US Department of Housing and Urban Development (2013): LIHTC
http://portal.hud.gov/hudportal/HUD?src=/program_offices/fair_housing_equal_op p/lihtcmou
Vagac, L. (2013): Internal Labour Mobility in Slovakia. Centre for Economic Development, Slovakia.

72
Van den Berg, G.J. and B. Van der Klaauw (2006): Counseling and Monitoring of
Unemployed Workers: Theory and Evidence from a Controlled Social Experiment. International Economic Review, 47: 3.
Wilson, W. (2013): Housing Mobility Schemes. House of Commons Library, Social Policy Section.
Wölfl, A. and J. S. Mora-Sanguinetti (2011): Reforming the Labour Market in Spain. OECD Economics Department Working Papers, No. 845, OECD Publishing. http://dx.doi.org/10.1787/5kghtchh277h-en
Related Documents