Valentina Barcucci and Nader Mryyan June 2014 Labour market transitions of young women and men in Jordan No. 14 Publication Series Youth Employment Programme Employment Policy Department LABOUR MARKET TRANSITIONS OF YOUNG WOMEN AND MEN IN JORDAN ILO

Welcome message from author
This document is posted to help you gain knowledge. Please leave a comment to let me know what you think about it! Share it to your friends and learn new things together.
Transcript

Valentina Barcucci and Nader Mryyan
June 2014
Labour market transitions of young women and men in Jordan
This report presents the highlights of the 2012 School-to-work Transition Survey (SWTS) run together with the Jordanian Department of Statistics within the framework of the ILO Work4Youth Project. This Project is a five-year partnership between the ILO and The MasterCard Foundation that aims to promote decent work opportunities for young men and women through knowledge and action. The W4Y Publication Series is designed to disseminate data and analyses from the SWTS administered by the ILO in 28 countries covering five regions of the world. The SWTS is a unique survey instrument that generates relevant labour market information on young people aged 15 to 29 years. The survey captures longitudinal information on transitions within the labour market, thus providing evidence of the increasingly tentative and indirect paths to decent and productive employment that today’s young men and women face.
The W4Y Publications Series covers national reports, with main survey findings and details on current national policy interventions in the area of youth employment, and regional synthesis reports that highlight regional patterns in youth labour market transitions and distinctions in national policy frameworks.
No. 14
For more information, visit our website: www.ilo.org/w4yYouth Employment Programme4 route des MorillonsCH-1211 Genève 22Switzerland [email protected]
Publication Series
Youth Employment ProgrammeEmployment Policy Department
LAB
OU
R MA
RKET TRA
NSITIO
NS O
F YOU
NG W
OM
EN A
ND M
EN IN
JORDA
NILO
ISSN 2309-6780

Work4Youth Publication Series No. 14
Labour market transitions of young women and men in
Jordan
Valentina Barcucci and Nader Mryyan
International Labour Office ● Geneva
June 2014
Copyright © International Labour Organization 2014
First published 2014
Publications of the International Labour Office enjoy copyright under Protocol 2 of the Universal Copyright Convention. Nevertheless, short
excerpts from them may be reproduced without authorization, on condition that the source is indicated. For rights of reproduction or translation, application should be made to the Publications Bureau (Rights and Permissions), International Labour Office, CH-1211 Geneva
22, Switzerland, or by email: [email protected]. The International Labour Office welcomes such applications
Libraries, institutions and other users registered with reproduction rights organizations may make copies in accordance with the licences issued to them for this purpose. Visit www.ifrro.org to find the reproduction rights organization in your country.
ILO Cataloguing in Publication Data
Barcucci, Valentina; Mryyan, Nader
Labour market transitions of young women and men in Jordan / Valentina Barcucci and Nader Mryyan; International Labour Office, Youth Employment Programme, Employment Policy Department. Geneva: ILO, 2014
Work4Youth publication series, No. 14; ISSN 2309-6780; 2309-6799 (web pdf)
International Labour Office; Employment Policy Dept
youth employment / youth unemployment / youth / transition from school to work / data collecting / methodology / Jordan
13.01.3
Cover design by: Creative Cow
The designations employed in ILO publications, which are in conformity with United Nations practice, and the presentation of material
therein do not imply the expression of any opinion whatsoever on the part of the International Labour Office concerning the legal status of
any country, area or territory or of its authorities, or concerning the delimitation of its frontiers.
The responsibility for opinions expressed in signed articles, studies and other contributions rests solely with their authors, and publication
does not constitute an endorsement by the International Labour Office of the opinions expressed in them.
Reference to names of firms and commercial products and processes does not imply their endorsement by the International Labour Office, and any failure to mention a particular firm, commercial product or process is not a sign of disapproval.
ILO publications can be obtained through major booksellers or ILO local offices in many countries, or direct from ILO Publications, International Labour Office, CH-1211 Geneva 22, Switzerland. Catalogues or lists of new publications are available free of charge from the
above address, or by email: [email protected]
Visit our website: www.ilo.org/publns
Printed by the International Labour Office, Geneva, Switzerland

iii
Preface
Youth is a crucial time of life when young people start realizing their aspirations,
assuming their economic independence and finding their place in society. The global jobs
crisis has exacerbated the vulnerability of young people in terms of: i) higher
unemployment, ii) lower quality jobs for those who find work, iii) greater labour market
inequalities among different groups of young people, iv) longer and more insecure school-
to-work transitions, and v) increased detachment from the labour market.
In June 2012, the International Labour Conference of the ILO resolved to take urgent
action to tackle the unprecedented youth employment crisis through a multi-pronged
approach geared towards pro-employment growth and decent job creation. The resolution
“The youth employment crisis: A call for action” contains a set of conclusions that
constitute a blueprint for shaping national strategies for youth employment.1 It calls for
increased coherence of policies and action on youth employment across the multilateral
system. In parallel, the UN Secretary-General highlighted youth as one of the five
generational imperatives to be addressed through the mobilization of all the human,
financial and political resources available to the United Nations (UN). As part of this
agenda, the UN has developed a System-wide Action Plan on Youth, with youth
employment as one of the main priorities, to strengthen youth programmes across the UN
system.
The ILO supports governments and social partners in designing and implementing
integrated employment policy responses. As part of this work, the ILO seeks to enhance
the capacity of national and local level institutions to undertake evidence-based analysis
that feeds social dialogue and the policy-making process. To assist member States in
building a knowledge base on youth employment, the ILO has designed the “school-to-
work transition survey” (SWTS). The current report, which presents the results of the
survey in Jordan, is a product of a partnership between the ILO and The MasterCard
Foundation. The “Work4Youth” Project entails collaboration with statistical partners and
policy-makers of 28 low- and middle-income countries to undertake the SWTS and assist
governments and the social partners in the use of the data for effective policy design and
implementation.
It is not an easy time to be a young person in the labour market today. The hope is
that with leadership from the UN system, with the commitment of governments, trade
unions and employers’ organizations and through the active participation of donors such as
The MasterCard Foundation, the international community can provide the effective
assistance needed to help young women and men make a good start in the world of work.
If we can get this right, it will positively affect young people’s professional and personal
success in all future stages of life.
Azita Berar Awad
Director
Employment Policy Department
Nada al-Nashif
Regional Director
Regional Office for Arab States
1 The full text of the 2012 resolution “The youth employment crisis: A call for action” can be found
on the ILO website at: http://www.ilo.org/ilc/ILCSessions/101stSession/texts-
adopted/WCMS_185950/lang--en/index.htm.


v
Contents
Page
Preface ............................................................................................................................ iii
Contents ............................................................................................................................ v
Acknowledgements ........................................................................................................................... ix
1. Introduction and main findings .................................................................................................. 1
1.1 Overview........................................................................................................................ 1
1.2 Main findings ................................................................................................................. 1
1.3 Structure of the report .................................................................................................... 5
2. Overview of the labour market and survey methodology .......................................................... 5
2.1 The socio-economic context .......................................................................................... 5
2.2 The labour market in Jordan .......................................................................................... 7
2.3 Survey objectives and methodology .............................................................................. 10
2.3.1 Questionnaire development ................................................................................ 10
2.3.2 Sample design and fieldwork ............................................................................. 10
3. Characteristics of youth in the SWTS sample............................................................................ 11
3.1 Individual characteristics of youth in Jordan ................................................................. 11
3.2 Educational attainment .................................................................................................. 14
3.3 Current activity status of youth ...................................................................................... 18
3.4 Aspirations and life goals .............................................................................................. 22
3.5 Characteristics of employed youth ................................................................................ 22
3.5.1 General characteristics ........................................................................................ 22
3.5.2 Status in employment ......................................................................................... 23
3.5.3 Employment by sector and occupation ............................................................... 26
3.5.4 Hours of work ..................................................................................................... 28
3.5.5 Other job-quality indicators ................................................................................ 28
3.5.6 Security and satisfaction ..................................................................................... 31
3.6 Characteristics of unemployed youth ............................................................................ 32
3.7 Characteristics of youth outside the labour market (inactive youth) ............................. 37
4. Stages of transition ..................................................................................................................... 38
4.1 Concepts and definitions ................................................................................................ 39
4.2 Stages of transition by sex, age group and area of residence ......................................... 40
4.2.1 Youth who have not yet started the transition .................................................... 41
4.2.2 Youth in transition .............................................................................................. 41
4.3 Characteristics of a completed transition ....................................................................... 42
4.4 Transition paths and lengths .......................................................................................... 45
5. Relevant policy frameworks and policy implications ................................................................ 47
vi
5.1 Policy frameworks ......................................................................................................... 47
5.2 Policy implications ........................................................................................................ 50
References ......................................................................................................................................... 53
Annex I. Definitions of labour market statistics .......................................................................... 55
Annex II. Additional statistical tables ........................................................................................... 57
Tables
2.1 Labour force participation and unemployment rates by sex, age and area of residence, 2013 7
2.2 Working-age population (aged 15+) by level of educational attainment and sex, 2013 (%) .. 8
2.3 Employed population (aged 15+) by employment status and sex, 2013 (%) .......................... 9
2.4 Employed population (aged 15 and older) by economic activity and sex, 2013 (%) .............. 9
3.1 Characteristics of youth in Jordan (%) .................................................................................... 11
3.2 Youth by educational attainment and sex (%) ........................................................................ 14
3.3 Level of completed education of youth and their parents (%) ................................................ 15
3.4 Youth by reason for leaving school and sex (%) .................................................................... 17
3.5 Youth by level of completed education and main economic activity status (%) .................... 17
3.6 Key youth labour market indicators – traditional distribution by sex and area of residence
(%) ........................................................................................................................................... 19
3.7 Youth unemployment (relaxed definition), labour underutilization and NEET rates by sex
(%) ........................................................................................................................................... 21
3.8 Youth employment-to-population ratio by age group, area of residence and household
income level ............................................................................................................................ 22
3.9 Employed youth by status in employment and sex (%) .......................................................... 23
3.10 Wage and salaried workers and the self-employed by level of completed educational
attainment (%) ......................................................................................................................... 23
3.11 Young wage and salaried workers by type of contract and duration (%) ............................... 24
3.12 Young wage and salaried workers by access to employment benefits/entitlements and sex
(%) ........................................................................................................................................... 25
3.13 Average monthly wages of young wage and salaried workers by sex and level of
completed education................................................................................................................ 25
3.14 ISCO major groups and education levels ................................................................................ 30
3.15 Overeducated and undereducated young workers by major occupational category (ISCO-
08, %) ...................................................................................................................................... 31
3.16 Employed youth by reasons for not joining a trade union and sex (%) .................................. 32
3.17 Unemployed youth by duration of unemployment and sex (%) ............................................. 33
3.18 Employed and unemployed youth by job search methods used (%) ....................................... 34
3.19 Discouraged youth by sex and reasons for not looking for a job opportunity (%) ................. 34
3.20 Unemployed youth who rejected a job offer by reason and sex (%) ...................................... 35
3.21 Monthly reservation wages of unemployed youth (Jordanian dinars) by sex and area of
residence (in JOD)................................................................................................................... 36
3.22 Unemployed youth by preferred occupation and sex (%) ....................................................... 36
3.23 Unemployed youth by main obstacles to finding work ........................................................... 37

vii
3.24 Economically inactive youth by reasons for remaining out of the workforce and sex (%) .... 37
3.25 Current students by preferred field of study and sex (%) ....................................................... 38
4.1 Youth population by stage of transition and selected characteristics (%) ............................... 41
4.2 Transited youth by employment sector according to 1-digit ISCO categorization ................. 44
4.3 Indicators on the transition paths of transited youth by sex .................................................... 46
A.1 Number of primary and secondary sampling units by governorate ........................................ 57
A.2 Migrating youth by original area of residence, reason for migration and sex (%) .................. 57
A.3 Financial inclusion of youth .................................................................................................... 58
A.4 Young students combining work and study by sex (%) .......................................................... 58
A.5 Young workers who want to change their job by reason and sex (%) .................................... 58
A.6 Self-employed youth by reason for choosing self-employment .............................................. 58
A.7 Discouraged youth by how they spend their time ................................................................... 59
A.8 Young wage and salaried workers by type of contract, contract duration and 1-digit ISCO
categorization (%) ................................................................................................................... 59
Figures
3.1 Household income levels ........................................................................................................ 14
3.2 Comparison of the level of completed education of youth and their parents .......................... 16
3.3 Youth by household income level and level of completed education ..................................... 18
3.4 Youth according to SWTS framework by sex ........................................................................ 20
3.5 Youth by primary life goal and main economic activity status ............................................... 21
3.6 Youth employment by sector according to 1-digit ISCO categorization and sex ................... 27
3.7 Youth employment by ISCO categorization and sex .............................................................. 27
3.8 Employed youth by actual hours worked per week and sex ................................................... 28
3.9 Employed youth by indicators measuring quality of employment ......................................... 29
3.10 Youth unemployment rate by completed education level and sex .......................................... 33
3.11 Unemployed youth by number of jobs applied for and job interviews attended .................... 34
4.1 Youth population by stages of transition and sex ................................................................... 40
4.2 Youth in transition by sub-category and area of residence, household income level and sex 42
4.3 Transited youth by sub-category and sex ................................................................................ 43
4.4 Transited youth by sub-category and level of completed education, area of residence,
household income level and sex .............................................................................................. 43
4.5 Youth flows from transited category to stable and/or satisfactory employment by sex ......... 45
4.6 Transited youth by length of transition and sex ...................................................................... 47
Boxes
1 Definition of youth .................................................................................................................. 10
2 Work4Youth: an ILO project in partnership with The MasterCard Foundation ..................... 11


ix
Acknowledgements
The 2012 school-to-work transition survey in Jordan was implemented by the
Department of Statistics (DOS) with funding from the ILO “Work4Youth” partnership
with The MasterCard Foundation. Mohammad Al Jundi coordinated the survey
implementation process at the DOS.
The authors take this opportunity to thank Nicolas Grisewood, ILO Amman, for his
help in organizing the survey process on the ground. Thanks also to members of the
Work4Youth team including Sara Elder for coordinating the process and contributing to
the text, Yonca Gurbuzer and Yves Perardel from the same team for technical support and
valuable inputs during all stages of the survey, and Susan Divald for research assistance.
Sincere thanks also to ILO colleagues from the Regional Office for Arab States – Mary
Kawar, Senior Employment Policy Specialist and Patrick Daru, Senior Skills and
Employability Specialist – and to Yasser Ali, ILO Amman, for useful comments on the
draft.
We wish also to acknowledge the officials from the Ministry of Labour for their
active interest in the survey and its findings. The preliminary results of the survey were
presented at a national workshop in Amman on 8 May 2014. The authors wish to thank the
participants of the workshop for their validation of the results. Mary Kawar and Yasser Ali
offered invaluable assistance in the organization of the event and promotion of the
Work4Youth project on the ground.
Finally, the ILO would like to acknowledge the support given by The MasterCard
Foundation in allowing the research to move forward, under the scope of the Work4Youth
partnership.

1
1. Introduction and main findings
1.1 Overview
The population of Jordan is one of the youngest among countries in its income
category. The median age was 23.4 years in 2010 (UNDESA, 2012), when young people
aged 15–24 constituted 19.8 per cent of the total. The growth rate of the population
between 1981 and 2011 was an average of 5.6 per cent per year (ILO, 2013b), much higher
than the region’s average rate, and well above the world’s.
Youth unemployment represents a major issue for Jordan’s economy, politics and
society as a whole. Unemployment rates in the early stages of life affect the job prospects
across the working life span of young people (ILO, 2013a). Moreover, the high level of
unemployment among youth presents a source of social and psychological instability.
Hence, much political attention has been given to the employment of young people in
Jordan. The Government has been active in developing policies to promote youth
employment. As the challenges are many and cut across several policy dimensions,
measures should focus on both supply and demand, and be curative as well as preventative.
Emphasis is placed on education and training, job creation and entrepreneurship, inclusion
of youth in the labour market and institutional reform. The World Bank reckons that more
than 10 per cent of GDP has been spent in strengthening the country’s human resources
over the last three decades (World Bank, 2013).
Despite recognition by various employment-related policies of the importance of
improving school-to-work transitions, existing labour market information in Jordan cannot
adequately answer the questions of whether school-to-work transitions of young people are
a long and difficult process and if so, why. Answering these questions would go a long
way to improving the existing employment strategies and to better deal with problems
youth face as they transition from school to work. Recognizing this information gap, the
ILO undertook the school-to-work transition survey (SWTS) in Jordan. The SWTS covers
young people aged 15–29 and aims to generate information on the current labour market
situation, the history of economic activities and the perceptions and aspirations of youth. In
Jordan, the SWTS was commissioned in October 2012 to the Department of Statistics
(DOS). Data collection took place in January and February 2013 and targeted 5,405 youth.
This report presents the findings from the survey.
1.2 Main findings
Young people in Jordan enjoy good access to education, including higher
education.
More than 40 per cent of young people enrolled in school at the time of the survey
were in tertiary education. Among those who had already completed their education,
almost one-half completed school at the secondary level or higher. The share of youth in
Jordan who dropped out of school before completing primary education was very low (3.1
per cent). This percentage is likely to shrink even further in the future.
Most Jordan’s young people today are achieving a higher educational attainment than
their parents. At the same time, household income levels seem to pose less of a barrier to
gaining an education. Young people with no education come from a diversity of household
income backgrounds. Tertiary education is no longer an exclusive privilege of high-income
families, and is within reach of middle-income households; in the survey, 42.2 per cent of
youth with tertiary degrees classified their household income level as average. While these

2
are remarkable achievements, progress in expanding access to higher education has yet to
achieve equitable inclusion of the lowest-income families. According to the survey, youth
from poor households still represented a minority of secondary graduates and only a
fraction of tertiary graduates.
The rate of participation in the labour force among youth in Jordan is very low.
This is partially expected, given that 42.9 per cent of the youth population is in
education. However, education alone is not sufficient to explain high inactivity rates.
The survey showed that 60.6 per cent of Jordan’s youth were inactive. High levels of
youth inactivity in a country with wide access to education are not, per se, surprising.
Almost one-half (42.9 per cent) of young people in Jordan at the time of the survey were in
school, and their propensity to combine work and study was minimal, given that their
financial needs were provided by their families, and part-time work opportunities were
limited. However, the enrolment rates can explain only part of the low participation in the
labour force, especially as the tendency to inactivity is not an age-specific feature, but
rather a gender-specific one. Young women showed a slightly higher tendency to be
economically active than the total female working-age population (aged 15 and older), at
19.3 and 13.1 per cent, respectively. Yet, the vast majority of young women (80.7 per cent)
remained inactive, and more than one-third were inactive and not in school.
At 24.1 per cent, the youth unemployment rate in Jordan at the time of the survey
was almost double the global average.
Youth unemployment in Jordan is pervasive, and often protracted (see Annex I for
definitions of labour market statistics). The country’s youth unemployment rate was almost
twice the global average of 12.4 per cent in 2012 (ILO, 2013a). Yet, it was lower than the
regional average youth unemployment rate for the Middle East (28.3 per cent in 2012), and
lower compared to other countries of the region where the SWTS was also implemented
(Tunisia, 31.8 per cent, and the Occupied Palestinian Territory, 37.0 per cent).2
The duration of youth unemployment in the country is a serious concern. The survey
showed that long-term unemployment (1 year or more) affected 55.8 per cent of those
unemployed at the time. The percentage of unemployed youth who had been looking for
work for at least 6 months was 72.4 per cent.
For young men in Jordan, investing in education brings a return in terms of finding
employment; male unemployment rates decrease as the level of education of the young
person increases. Unfortunately, the same cannot be said for young women, where the
unemployment rate remains stubbornly above 40 per cent regardless of the level of
education attained.
The survey indicated that the young unemployed in Jordan felt the main barrier to
finding employment was the lack of available jobs. This perception was confirmed by the
fact that jobseeker’s proactive attitude in searching for opportunities through many
channels translated into very few actual interview opportunities.
Rural youth do not face greater employment challenges than urban youth during
their transitions.
Contrary to what is often expected, rural Jordan’s youth do not face any striking
disadvantage during their transitions to work. The survey showed the rate of participation
2 National reports for the two countries will be available on www.ilo.org/w4y from the second
quarter of 2014.
3
in the labour force to be remarkably homogeneous in urban and rural areas, as was the
probability to be employed.
Rather, the survey found that urban youth were often relatively worse off than rural
youth. The largest number of households living below the national poverty line was
actually in urban areas, although rural areas are more often targeted by interventions to
reduce poverty. Young people in urban areas were also more likely to be unemployed. At
20.6 per cent, the youth unemployment rate in urban areas was almost 4 percentage points
higher than in rural areas. In terms of quality of employment, many more youth in stable
employment were based in urban settings than rural ones, but this simply reflected the
population distribution across the country’s territory. Rural youth enjoyed a relatively
higher probability to have a written contract than their counterparts in urban areas, and
monthly reservation wages were also higher among rural youth. And, while there was more
frequent use of limited-duration contracts in rural than in urban areas, the duration of time-
bound contracts tended to be longer in rural areas.
Young women in Jordan are, on average, highly educated, but the majority of them
remain inactive after leaving school. Those who do enter the labour market face very
high unemployment rates.
The vast majority of young women in Jordan are not employed. The survey showed
only 11.2 per cent of the young women were working, compared to 47.2 per cent of young
men. The share of unemployed young women in the female population was 8.1 per cent
(compared to 10.8 per cent of young men). This mostly reflected young women's low rate
of participation in the country's labour force. Eight in ten (80.7 per cent) young women in
Jordan are inactive according to the survey, and among the inactive young females, slightly
more than four in ten is not in school. Only one-quarter of inactive non-student females
maintain an attachment to the labour market, stating their intention to work in the future.
Equality in access to education in the country has improved impressively over the last
few generations, and nowadays girls are more likely than boys to reach the highest levels
of education. However, improved access to education has not translated into equal
opportunities for employment. With a female unemployment rate as high as 41.8 per cent
(more than twice the male rate of 18.7 per cent), it is clear that the few young women who
do opt to join the labour market do not have an easy time finding work.
Gender-specific preferences are apparent already in the fields of study chosen by
students, hinting that young people will end up channelled through different career paths
depending on their sex. The survey showed that young women tended to favour fields of
study such as health and welfare, and education/teaching (while men’s preferences
extended to a broader range of specialities). One could suppose that the fields of study
reflect the rather limited range of employment options in which young women feel
comfortable to apply. Young working women are mainly restricted to education and health
and social work. However, another 12.5 per cent of young women are engaged in
manufacturing. Young working men are found primarily in public administration and
wholesale and retail trade.
Employed youth in Jordan often have stable jobs, based on a written contract and
with some benefits.
At the time of the survey, wage and salaried workers (employees) made up most of
the employed youth in Jordan (92.8 per cent of employed young men and 98.7 per cent of
employed young women). In part, this is because the largest employer in the country is the
public sector, which offers contracts of unlimited duration or durations of longer than 1
year. According to the survey, in 85.0 per cent of cases, young employees held contracts of
unlimited duration. Employees often had access to social security contributions (in 66.2
per cent of cases), paid annual leave (62.7 per cent), medical insurance coverage (60.3 per

4
cent) and more. Only 2.1 per cent of employed youth were in involuntary part-time
employment and would have liked to extend their working hours.
Although most youth declared being satisfied with their job situation, many remain
in the informal economy or have to accept jobs characterized by excessive working hours
or qualification mismatches.
The elements discussed so far point to rather positive employment conditions for a
large share of employed youth in Jordan. In fact, 84.5 per cent of those surveyed declared
themselves satisfied with their current job situation. However, other job-quality indicators
showed a more negative picture. Informal employment still involved 53.2 per cent of
employed youth. Most of them are engaged as paid employees holding informal jobs in the
formal sector. They therefore hold contracts, including contracts of long duration, but such
contracts do not give them access to fundamental benefits such as paid sick leave, paid
annual leave and pension contributions.
In addition, the majority of working youth received a below-average wage. An
analysis of working hours shows that the largest share of employed youth, in relative
terms, worked 40–49 hours per week, and 21.9 per cent of young men and 10.8 per cent of
young women worked an excessive number of hours – more than 60 hours per week. Also
worrisome is the issue of qualifications mismatch. More than 5 in ten young workers (52.4
per cent) were affected by qualifications mismatch, whereby they worked in a job for
which they were either overeducated or undereducated. Undereducated youth accounted
for 43.0 per cent of the employed, while 9.4 per cent of those working were overeducated
for their job held at the time of the survey.
Most transited youth in Jordan are in stable employment, yet the transitions can be
long for those who do not move directly from education to stable and/or satisfactory
employment.
An analysis of transition stages from the survey shows that youth in Jordan were
divided almost evenly between two groups. Slightly over one-half (52.2 per cent) of the
total youth population had not yet started their transition; this group consisted of students
and female family carers. The remainder (47.8 per cent), mostly male, were youth who had
completed their transition to stable and/or satisfactory employment (28.8 per cent), or were
still in transition (19.0 per cent).
Given that Jordan’s labour demand is dominated by the public sector, transited youth
were mainly found in stable employment. According to the survey, the availability of other
options – employment in the private sector or self-employment – was limited; therefore, it
is not surprising that the majority of those still in transition were unemployed, while only a
fraction were in a temporary and non-satisfactory job, or in non-satisfactory self-
employment. The distribution of employed youth by occupation was closely aligned with
the occupational distribution of youth who had completed their transition. This suggests
that, among the occupations of employed youth, none seems to be relatively more likely to
lead to stable and/or satisfactory employment than another. The same applies to sectors of
employment.
Labour market transitions in Jordan can be extremely long.
The survey showed that those who did not move directly from education to stable
and/or satisfactory employment (bearing in mind that the greatest proportion – 33.5 per
cent – transited directly) faced, on average, a very long transition of 32.8 months or nearly
3 years. The average length of unemployment and inactivity spells that young people faced
during their transitions range from 22.1 months (average unemployment spell among
transited males) to 40.5 months (average inactivity spell among transited females).

5
These findings are in line with the elements discussed above, pointing at a labour
market that can offer good jobs, but to an insufficient number of youth. Survey results
show that low-skilled males struggled particularly to find employment, along with highly-
educated females. The unemployed felt that a lack of jobs available is the major reason for
their jobless status. Further limitations, as mentioned above, are imposed by gender issues
that channel women towards a very restricted set of suitable employment sectors. The
quality of available employment outside the public sector is also a concern, as low pay and
inappropriate workplace conditions have emerged as the two most frequent reasons to
refuse a job offer among youth in Jordan. The survey therefore found that a combination of
supply and demand-side factors is behind the long transitions to the labour market of youth
in Jordan. Economic growth is an important prerequisite for job creation, but it is by no
means sufficient without a clear policy orientation towards employment creation, and the
support of responsive education and labour market policies. Availability of data on the
specific challenges that need to be addressed is an essential first step to any policy
response.
1.3 Structure of the report
The rest of this report is organized as follows: Section 2 sets out the socio-economic
and labour market contexts in Jordan and introduces the objectives and the methodology of
the survey process. Section 3 presents the main results of the SWTS with details on the
characteristics of youth and their labour market outcomes. Section 4 introduces the
classification of stages of labour market transition and investigates the youth
characteristics that lead to more successful labour market outcomes. Finally, section 5
outlines the main national policies addressing youth employment.
2. Overview of the labour market and survey methodology
2.1 The socio-economic context
Jordan is an upper-middle-income country with a population of 6.4 million that
mostly resides in urban areas (DOS, 2013a). Its official language is Arabic, and more than
99 per cent of Jordanians belong to the Arab ethnic group. The country’s territory,
covering an area of 89,342 km2, is almost fully landlocked, with a 26-km access to the Red
Sea as the only exception. Arable land is scarce, and the country lacks a rich natural
resource base. Jordan’s economy relies heavily on services, representing more than 70 per
cent of gross domestic product (GDP) and 75 per cent of jobs. Services are also the main
contributor to GDP growth.
The country’s economy is characterized by significant openness and a high level of
regional and global integration. This has strengthened trade flows, boosted foreign direct
investment and improved the competitiveness of Jordan's most successful sectors, such as
information and communications technology. However, its open economy and high degree
of regional integration render the country more vulnerable to being affected by external
shocks. The global financial crisis affected Jordan significantly in 2009–10, when the
country’s GDP growth shrunk from an average 6.7 per cent in the previous decade to 2 to 3
per cent. Nevertheless, a rather resilient domestic demand has been supporting the
country’s growth recovery. Since the onset of the Syrian crisis in 2011, Jordan’s real GDP
growth has remained stable at 2.5 per cent in 2011 and 2012 (ILO, 2013b).
Poverty in Jordan has remained relatively stable between 2002 and 2010. During that
period, poverty rates decreased from 14.2 per cent in 2002 to 13.0 per cent in 2006, but

6
increased to 13.3 per cent in 2008. The latest poverty estimates from the DOS found that
the national poverty rate in 2010 was 14.4 per cent (UNDP, 2013), but this figure has been
produced through a new calculation methodology and therefore cannot be directly
compared to the previous rates.
Inequality has increased overall since the economic crisis, and little substantial
improvement has been achieved in closing gender gaps. Women still benefit from a
fraction of the available economic opportunities, as gender issues continue to limit their
participation in the country’s economic life. While women's educational attainment has
improved over the last three decades, and literacy rates for young females rose from 55 to
99 per cent between 1980 and 2010, the share of working-age women who have completed
primary education is still relatively lower than that of men (DOS, 2013b). More
importantly, improvements in human development have not translated into proportionally
higher economic participation of women. The rate of participation in the labour market of
Jordan’s women was 15.3 per cent in 2010, almost 3 percentage points lower than the
average in the Middle East (ILO, 2011). Due to the very low activity rate of Jordan’s
women, the country is among the ten in the world with the lowest employment-to-
population ratios (among countries with available data).
Jordan’s population is one of the youngest among countries in the same income
category. The median age of the population in 2010 was 23.4 years (UNDESA, 2012).
Young people aged 15–25 constituted 19.8 per cent of the total, an increase of more than 2
percentage points compared to 1950. The population growth rate averaged 5.6 per cent
annually between 1981 and 2011 (ILO, 2013b), much higher than the region’s average rate
and well above the global average. After a slowdown in population growth in the late
1990s, the rate has accelerated again since the early 2000s. Nevertheless, estimates from
the United Nations’ population division indicate that these trends can be expected to
progressively reverse after 2010. The country will likely then enter the third stage of the
demographic transition, characterized by shrinking growth rates to an estimated 0.5 per
cent in 2050.
The Government of Jordan has been making significant investments to ensure that the
potential economic benefits of its young population are fully harnessed. The World Bank
(2013) reckons that more than 10 per cent of GDP has been spent to strengthen the
country’s human resources over the last three decades. Among other initiatives, the
Government has implemented structural reform in skills development and education to
provide young people with the skills necessary to build a competitive economy. An
elaborate apprenticeship programme has been developed, and the state has set up the
Centre for Accreditation and Quality Assurance to monitor apprenticeships in both the
private and public sectors, under the Employment, Technical and Vocational Education
and Training Council secretariat at the Ministry of Labour.
The challenge for the country’s economy is now to keep up the transition towards
higher levels in the value chain. This will be necessary to ensure adequate returns on
investment in education for the large and growing number of young graduates entering the
Jordanian labour market each year. Today, job creation in the private sector is still in
predominantly low-skilled jobs, which do not match the expectations of Jordan’s youth,
who mostly strive for government jobs. In 2011/2012, 47,613 youth in Jordan obtained a
bachelor's degree, while the Government created around 18,000 net jobs over the same
year (DOS, 2012). As a result, over 600,000 Jordanians, a figure one-half the size of the
domestic Jordan’s labour force, work abroad and mostly in skill-intensive jobs, as the local
supply of skills continues to exceed local demand (ILO, 2012).
7
2.2 The labour market in Jordan
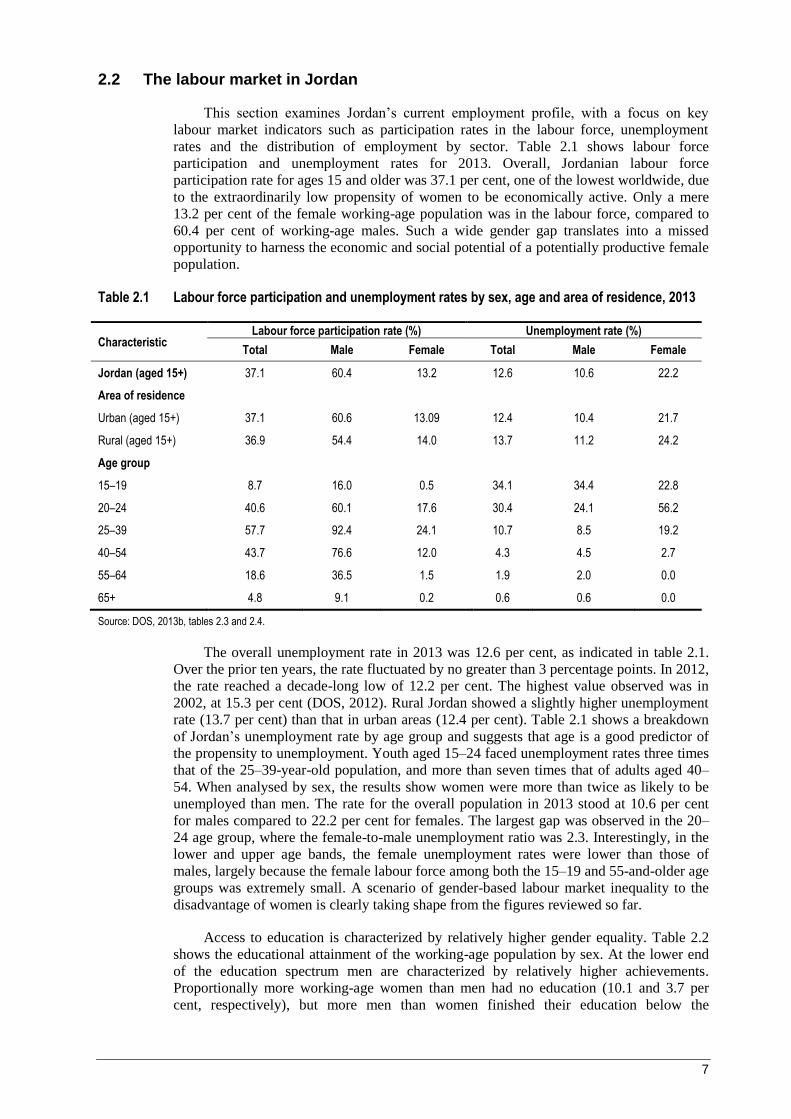
This section examines Jordan’s current employment profile, with a focus on key
labour market indicators such as participation rates in the labour force, unemployment
rates and the distribution of employment by sector. Table 2.1 shows labour force
participation and unemployment rates for 2013. Overall, Jordanian labour force
participation rate for ages 15 and older was 37.1 per cent, one of the lowest worldwide, due
to the extraordinarily low propensity of women to be economically active. Only a mere
13.2 per cent of the female working-age population was in the labour force, compared to
60.4 per cent of working-age males. Such a wide gender gap translates into a missed
opportunity to harness the economic and social potential of a potentially productive female
population.
Table 2.1 Labour force participation and unemployment rates by sex, age and area of residence, 2013
Characteristic Labour force participation rate (%) Unemployment rate (%)
Total Male Female Total Male Female
Jordan (aged 15+) 37.1 60.4 13.2 12.6 10.6 22.2
Area of residence
Urban (aged 15+) 37.1 60.6 13.09 12.4 10.4 21.7
Rural (aged 15+) 36.9 54.4 14.0 13.7 11.2 24.2
Age group
15–19 8.7 16.0 0.5 34.1 34.4 22.8
20–24 40.6 60.1 17.6 30.4 24.1 56.2
25–39 57.7 92.4 24.1 10.7 8.5 19.2
40–54 43.7 76.6 12.0 4.3 4.5 2.7
55–64 18.6 36.5 1.5 1.9 2.0 0.0
65+ 4.8 9.1 0.2 0.6 0.6 0.0
Source: DOS, 2013b, tables 2.3 and 2.4.
The overall unemployment rate in 2013 was 12.6 per cent, as indicated in table 2.1.
Over the prior ten years, the rate fluctuated by no greater than 3 percentage points. In 2012,
the rate reached a decade-long low of 12.2 per cent. The highest value observed was in
2002, at 15.3 per cent (DOS, 2012). Rural Jordan showed a slightly higher unemployment
rate (13.7 per cent) than that in urban areas (12.4 per cent). Table 2.1 shows a breakdown
of Jordan’s unemployment rate by age group and suggests that age is a good predictor of
the propensity to unemployment. Youth aged 15–24 faced unemployment rates three times
that of the 25–39-year-old population, and more than seven times that of adults aged 40–
54. When analysed by sex, the results show women were more than twice as likely to be
unemployed than men. The rate for the overall population in 2013 stood at 10.6 per cent
for males compared to 22.2 per cent for females. The largest gap was observed in the 20–
24 age group, where the female-to-male unemployment ratio was 2.3. Interestingly, in the
lower and upper age bands, the female unemployment rates were lower than those of
males, largely because the female labour force among both the 15–19 and 55-and-older age
groups was extremely small. A scenario of gender-based labour market inequality to the
disadvantage of women is clearly taking shape from the figures reviewed so far.
Access to education is characterized by relatively higher gender equality. Table 2.2
shows the educational attainment of the working-age population by sex. At the lower end
of the education spectrum men are characterized by relatively higher achievements.
Proportionally more working-age women than men had no education (10.1 and 3.7 per
cent, respectively), but more men than women finished their education below the

8
secondary level (56.3 and 48.6 per cent, respectively). Shares of those who finished
secondary school were almost equal between the sexes, but slightly more women than men
achieved their intermediate diploma, and men edged out women in the share that attained
bachelor's-degree level or higher.
Table 2.2 Working-age population (aged 15+) by level of educational attainment and sex, 2013 (%)
Education level Total Male Female
None 6.8 3.7 10.1
Less than secondary 52.5 56.3 48.6
Secondary 17.9 17.9 17.8
Intermediate diploma 7.8 6.3 9.4
Bachelor's & above 15.0 15.8 14.2
Total 100.0 100.0 100.0
Source: DOS (2013b), table 2.5.
If indicators of educational achievement are disaggregated by age group, they reveal
how gender imbalances in education, at least from a quantitative viewpoint, have been
narrowing over time. The illiteracy rate for women remains significantly higher compared
to men among people aged 65 and over – 19.0 per cent of women aged 65 and older
remain illiterate compared to only 4.1 per cent of men (DOS, 2013b, table 2.1). Clearly,
progress has been made in increasing access to education for young girls and boys. These
findings indicate a step in the right direction towards a more gender-balanced society in
Jordan. However, it is important to stress that rebalancing quantitative gaps in education
does not imply that women and men enjoy the same quality of teaching and curricula.
Most importantly, more equality in access to schooling does not automatically translate
into equal opportunities for women and men on the labour market.
Recent figures from the DOS (2013b) show that, for equal levels of educational
attainment, the earnings of employed Jordan’s females tend to be lower than those of
employed males. For instance, only 13.9 per cent of employed women with secondary
education are found in the highest-earning category (corresponding to more than 300
Jordanian dinars [JOD] per month). The percentage of employed men with secondary
education in that category is more than three times as high, namely 47.3 per cent. Even
highly skilled women who have reached a bachelor's level of education or above are less
likely than men to be in the highest-earning category (75.3 per cent of women versus 88.4
per cent of men). A comparison between male and female earnings in the private versus
public sector (ILO, 2010) has found that differences are correlated to educational
attainment. The private sector offers higher earnings to male tertiary-level graduates, while
no significant difference exists between public and private employment in terms of
earnings for female graduates. On the other hand, for individuals with secondary education
or less, and regardless of sex, public employment pays on average more than private-sector
employment, despite offering better job security and shorter working hours.
Jordan’s labour market is characterized by a high incidence of wage and salaried
employment, mostly because of the large share of public-sector employment (including the
army), accounting for nearly 85 per cent of the employed population. As illustrated in table
2.3, only 9.0 per cent of employed people are own-account workers and 5.6 per cent are
reported as self-employed with employees (employers). Contributing family workers
account for 0.3 per cent of the employed. These figures mirror a tendency among Jordan’s
population to favour job security over the risks of self-employment. Yet, 16.6 per cent of
working men are in self-employment, either with or without employees, compared to only
3.6 per cent of women. The rest of working women, an overwhelming 95.8 per cent, is
found in wage employment.

9
Table 2.3 Employed population (aged 15+) by employment status and sex, 2013 (%)
Employment status Total Male Female
Wage & salaried workers (employees) 84.9 82.8 95.8
Self-employed with employees (employers) 5.6 6.3 1.6
Self-employed without employees (own-account workers) 9.0 10.3 2.0
Contributing family worker 0.3 0.4 0.2
Other 0.2 0.2 0.3
Total 100.0 100.0 100.0
Source: DOS (2013b), table 5.7.
The Government is a significant employer in the country. The largest share of male
workers in 2013 was in the sector of public administration, defence and compulsory social
security (28.4 per cent), followed by 17.5 per cent in wholesale and retail trade and repair
of motor vehicles and motorcycles, and 10.6 per cent in manufacturing (table 2.4). Female
workers were heavily concentrated in three public sectors: education (41.7 per cent),
human health and social work activities (14.6 per cent) and public administration and
defence and compulsory social security (14.1 per cent). Traditionally, these sectors
guarantee job stability, are characterized by shorter working hours and leave room for
child care and other family responsibilities. Moreover, jobs such as teaching and nursing
are considered more “appropriate” for women because they are an extension of women's
perceived caregiving role.
Table 2.4 Employed population (aged 15 and older) by economic activity and sex, 2013 (%)
Sector Total Male Female
Agriculture, forestry & fishing 2.0 2.3 0.6
Manufacturing 9.9 10.6 6.2
Construction 6.4 7.4 0.8
Wholesale & retail trade; repair of motor vehicles & motorcycles 15.7 17.5 5.6
Transportation & storage 7.6 8.7 1.1
Accommodation & food service activities 2.5 2.8 0.9
Financial & insurance activities 1.9 1.7 3.1
Professional, scientific & technical activities 2.3 2.1 3.2
Public administration & defence, compulsory social security 26.2 28.4 14.1
Education 12.1 6.6 41.7
Human health & social work activities 5.0 3.2 14.6
Other service activities 2.2 2.2 2.4
Note: Sectors employing less than 2 per cent of the total are not reported in this table. Source: DOS (2013b), table 5.4.
Waves of migration have represented a source of semi- and low-skilled labour.
According to the ILO, migrant workers account on average for 20.0 per cent of the labour
force in Jordan (ILO, 2013b). Refugees from neighbouring conflicts in Lebanon, Iraq and,
recently, Syria, have contributed a significant share to immigration flows. According to the
UNHCR, 440,491 registered Syrian refugees were in Jordan as of July 2013, and the
number of total refugees, both registered and not registered, is believed to be higher.
Jordan’s migration policy is relatively open to semi-skilled and low-skilled economic
immigration, and complements measures encouraging skilled emigration (EUI, 2013).
Such policies aim to relieve unemployment and fill supply gaps caused by low levels or
low participation in the labour force, particularly of semi- and low-skilled women.
10
However, the coexistence of high levels of unemployment among nationals and large
shares of foreign workers has raised contentions. Besides the potential risk of crowding out
low-skilled Jordanians from the labour market, the availability of many low-pay migrant
workers may put downward pressure on wages, and increase the incidence of decent work
deficits on Jordan’s labour market. The precise impact of immigration on the labour
market has not yet been fully determined, but it is likely to be important, as economic
growth has been mostly concentrated in sectors where migrant workers are dominant, such
as construction and manufacturing (ILO, 2013b). These considerations add to a growing
concern of Jordan experiencing the phenomenon of brain drain, as its skilled professionals
leave the country in search of better opportunities abroad.
2.3 Survey objectives and methodology
The question of why the school-to-work transition of young people in Jordan today is
a long and difficult process has yet to be satisfactorily answered, owing to limitations in
labour market information. At the same time, the goal of improving the transitions of youth
is among the top policy priorities of most countries in the world. In response to this
information gap, the ILO has developed the SWTS, a detailed household survey covering
15–29-year-olds (see box 1). It is applied at the national level to generate information on
the current labour market situation, the history of economic activities and the perceptions
and aspirations of youth. This report discusses the results of the SWTS implemented in
Jordan in 2012–13.
Jordan undertook the SWTS to collect and analyse information on the various
challenges that impact young men and women as they make the transition to working life.
The survey was implemented by the DOS, with fieldwork completed in December 2012
and January 2013. Funding for the survey came from the Work4Youth partnership between
the ILO Youth Employment Programme and The MasterCard Foundation (see box 2). The
partnership supports the SWTS in 28 target countries, and data from the first round were
made available throughout 2013. A second round of the SWTS will take place in each of
the 28 countries in 2014–15, including in Jordan.
2.3.1 Questionnaire development
The standard ILO SWTS questionnaire was adapted to the national context based on a
consultative process between the ILO and the DOS. The questionnaire was translated and
administered in Arabic.
2.3.2 Sample design and fieldwork
The SWTS 2012–13 in Jordan was run as a stand-alone survey. The sample was
designed based on the 2004 General Census of Population and Housing survey. The
sample’s framework was divided into categories according to the governorate, main cities,
urban and rural areas. The sample was drawn over two steps. Initially, the primary
sampling units (blocks) were selected in a systematic manner, with a proportional
probability to the size of the primary sample. This process led to the selection of 296
primary sampling units. Subsequently, a fixed number of households (30) were chosen as
final sampling units from each block.
Box 1. Definition of youth
While in other contexts, a youth is defined as a person aged between 15 and 24 (United Nations), for the purpose of the SWTS and related reports, the upper age limit is 29 years of age. This recognizes the fact that some young people remain in education beyond the age of 24, and allows the opportunity to capture more information on the post-graduation employment experiences of young people.

11
After a pilot test and training sessions for supervisors and enumerators, field data
collection was carried out between December 2012 and January 2013. Enumerators
reached 2,440 households. All people aged 15–29 within each household were
interviewed. Table A.1 (Annex II) shows the sample distribution by governorate. The
overall sample size amounted to 5,405 young people.
Box 2. Work4Youth: An ILO project in partnership with The MasterCard Foundation
The Work4Youth (W4Y) Project is a partnership between the ILO Youth Employment Programme and The MasterCard Foundation. The project has a budget of US$14.6 million and will run for 5 years to mid-2016. Its aim is to “promot[e] decent work opportunities for young men and women through knowledge and action”. The immediate objective of the partnership is to produce more and better labour market information specific to youth in developing countries, focusing in particular on transition paths to the labour market. The assumption is that governments and social partners in the project’s 28 target countries will be better prepared to design effective policy and programme initiatives once armed with detailed information on:
• what young people expect in terms of transition paths and quality of work; • what employers expect in terms of young applicants; • what issues prevent the two sides – supply and demand – from matching; and • what policies and programmes can have a real impact.
Work4Youth target areas and countries:
Asia and the Pacific: Bangladesh, Cambodia, Nepal, Samoa, Viet Nam Eastern Europe and Central Asia: Armenia, Kyrgyzstan, the former Yugoslav Republic of Macedonia, the Republic of Moldova, the Russian Federation, Ukraine Latin America and the Caribbean: Brazil, Colombia, El Salvador, Jamaica, Peru Middle East and North Africa: Egypt, Jordan, Occupied Palestinian Territory, Tunisia Sub-Saharan Africa: Benin, Liberia, Madagascar, Malawi, the United Republic of Tanzania, Togo, Uganda, Zambia
3. Characteristics of youth in the SWTS sample
This section presents survey findings on the individual characteristics of Jordan’s
youth, their educational attainment, current activity status, and aspirations and life goals, as
well as the characteristics of unemployed youth, those of youth outside the labour market
(inactive youth) and the characteristics of employed youth.
3.1 Individual characteristics of youth in Jordan
Age groups
Table 3.1 shows the age categories of the surveyed youth. The largest proportion
(43.3 per cent) of sampled youth was adolescents aged 15–19. Women and men were
rather evenly represented in all of the age sub-categories illustrated in the table.
Area of residence
Most youth resided in urban areas. This is not surprising and is in line with the pattern
of geographic distribution of Jordan's overall population as discussed earlier. Virtually no
difference was observed between the sexes.

12
Table 3.1 Characteristics of youth in Jordan (%)
Primary characteristic Total Male Female
Age group
15–19 43.0 42.2 43.9
20–24 33.5 34.9 32.0
25–29 23.5 22.9 24.1
Area of residence
Urban 81.9 81.6 82.1
Rural 18.1 18.4 17.9
Head of household status
Not head of household 96.9 94.1 99.8
Head of household 3.1 5.9 0.2
Size of household
1 0.2 0.4 0.0
2–3 7.6 6.7 8.7
4–6 42.8 42.6 43.0
> 6 49.4 50.3 48.4
Marital status
Married 15.4 7.0 24.4
Single 84.6 93.0 75.6
Main economic activity status
Employed 29.9 47.2 11.2
Unemployed 9.5 10.8 8.1
Inactive 60.6 42.0 80.7
Source: SWTS-Jordan, 2012–13.
Status of head of household, household size and marital status
Table 3.1 also illustrates that only a small minority of youth (3.1 per cent) were heads
of household, and virtually no young women were among them. The vast majority of
surveyed males (94.1 per cent) and females (99.8 per cent) were not yet classified as heads
of household, as expected from the findings on educational attainment that show
significant percentages of young people in Jordan staying in education well into their
twenties.
Surveyed youth mostly belonged to a household of more than six members (49.4 per
cent) and four to six members (42.8 per cent). Small households of one to three members
represented less than 8 per cent of the sample. Households tended to be relatively larger in
rural areas (table 3.1), in line with national patterns that show higher fertility rates in rural
areas (DOS and ICF International, 2013).
The majority of youth in the sample were single; this does not change when
disaggregated by sex. However, while 93.0 per cent of young men were single, the
percentage for women was 75.6 per cent. Almost one-quarter of young women were
married (24.4 per cent), versus only 7.0 per cent of men, suggesting a difference between
sexes in the average age of marriage. The average age at marriage within the survey
sample was 19.6 years for females and 23.2 years for males. A woman’s age at her first
marriage is an important determinant of fertility. If a woman starts bearing children at a
13
very young age as a consequence of marrying early, she is more likely to have a high
number of births by the end of her reproductive years. An expected consequence of this
disparity is that women have children at a younger age than men: 87.7 per cent of young
married women surveyed already had at least one child, while the percentage for young
men was 75.5 per cent.
Mobility
In order to determine the extent of youth’s internal and external migration, the SWTS
asked respondents whether they had always lived in their current locality. Results reflect
that youth in Jordan are not especially mobile. The share of youth who had moved from
their original place of residence was 21.6 per cent. Young women were relatively more
mobile than men, as 26.6 per cent had moved from their original residence compared to
17.0 per cent of males. This may be explained by the higher tendency of women to move
to their husband's or father's work location. This argument is supported by the finding that
the majority of youth migrated to accompany their families (table A.2). The percentage
was higher for women (94.1 per cent) than for men (87.2 per cent).
A significant share of youth who moved from their original residence migrated from
another country (29.5 per cent of young men and 18.1 per cent of young women).
Immigration from Asian countries, mostly the Philippines and Sri Lanka, is common
among young women who find employment as domestic workers, and young men who
work mainly in the export-processing zones (Deshingkar, Sward and Estruch-Puertas,
2012).
Interestingly, the biggest proportion of youth migration originated from large cities
and urban areas (49.8 per cent) (table A.2). This was most likely urban-to-urban migration,
as only 8.0 per cent of youth had migrated from a rural area.
Financial inclusion
The SWTS collected information on the financial services used by young people in
Jordan. The findings show that financial inclusion was very limited among youth (table
A.3). More than 90 per cent (91.1 per cent of males and 95.3 per cent of females) did not
use any financial service, including savings accounts; one reason for this seems to be the
lack of a compelling need to cover unexpected expenses. Over one-half of youth (56.7 per
cent) said they had no such need, and a likely explanation is a tendency of young people to
live in the family home, where parents provide for their children.
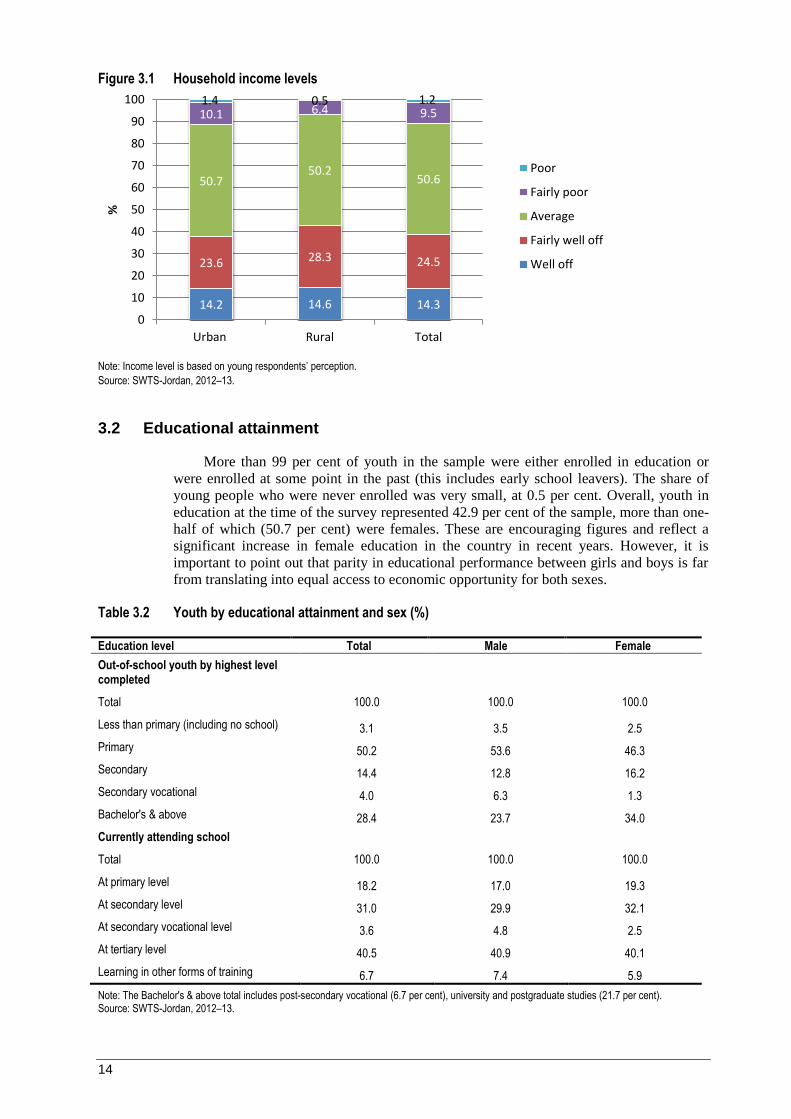
Household income level
Figure 3.1 illustrates the youth population by category of declared household income
(self-reported) and area of residence. Only a small portion (10.7 per cent) of youth
classified their households as either poor or fairly poor (1.2 and 9.5 per cent, respectively).
This figure is comparable with Jordan’s latest poverty estimates produced by the DOS in
2012, which found that the national poverty rate in 2010 was 14.4 per cent (UNDP, 2013).
Although rural areas are more often targeted by poverty-reduction interventions, the largest
number of households living below the absolute poverty line (JOD 813.7 per person, per
year) was in urban areas (ibid.). The SWTS also showed a relatively higher share of those
young people residing in rural areas that considered their household to be fairly well off
compared to urban youth (28.3 and 23.6 per cent, respectively). Over six (6.4) per cent of
rural youth described their household as fairly poor, compared to 10.1 per cent of young
people in urban areas.
14
Figure 3.1 Household income levels
Note: Income level is based on young respondents’ perception.
Source: SWTS-Jordan, 2012–13.
3.2 Educational attainment
More than 99 per cent of youth in the sample were either enrolled in education or
were enrolled at some point in the past (this includes early school leavers). The share of
young people who were never enrolled was very small, at 0.5 per cent. Overall, youth in
education at the time of the survey represented 42.9 per cent of the sample, more than one-
half of which (50.7 per cent) were females. These are encouraging figures and reflect a
significant increase in female education in the country in recent years. However, it is
important to point out that parity in educational performance between girls and boys is far
from translating into equal access to economic opportunity for both sexes.
Table 3.2 Youth by educational attainment and sex (%)
Education level Total Male Female
Out-of-school youth by highest level completed
Total 100.0 100.0 100.0
Less than primary (including no school) 3.1 3.5 2.5
Primary 50.2 53.6 46.3
Secondary 14.4 12.8 16.2
Secondary vocational 4.0 6.3 1.3
Bachelor's & above 28.4 23.7 34.0
Currently attending school
Total 100.0 100.0 100.0
At primary level 18.2 17.0 19.3
At secondary level 31.0 29.9 32.1
At secondary vocational level 3.6 4.8 2.5
At tertiary level 40.5 40.9 40.1
Learning in other forms of training 6.7 7.4 5.9
Note: The Bachelor's & above total includes post-secondary vocational (6.7 per cent), university and postgraduate studies (21.7 per cent). Source: SWTS-Jordan, 2012–13.
14.2 14.6 14.3
23.6 28.3 24.5
50.7 50.2
50.6
10.1 6.4 9.5 1.4 0.5 1.2
0
10
20
30
40
50
60
70
80
90
100
Urban Rural Total
%
Poor
Fairly poor
Average
Fairly well off
Well off
15
Among youth who completed their education, more than one-half (53.3 per cent)
finished their schooling below the secondary level (table 3.2). Young men showed a higher
propensity than females to finish below this level (57.1 per cent of young men and 48.8 per
cent of young women). Young women were more likely than young men to gain a tertiary-
level education (bachelor's degree and above) in Jordan; 34.0 per cent of young women
completed tertiary level compared to 23.7 per cent of young men. Young men, on the other
hand, were more likely to follow vocational training.
Regarding current students surveyed, the distribution was heavier towards the higher
education levels. Fewer than 20 per cent of those who were still enrolled were at the
primary level. The largest share of current students aged 15–29 was in tertiary education
(40.5 per cent), followed by secondary education (31.0 per cent).
Vocational education attracted 4.0 per cent of the surveyed population with
completed education, while 3.6 per cent were enrolled in a vocational institution and 6.7
per cent were learning in an apprenticeship or internship arrangement (proportionally more
men than women in both cases). Participation in vocational training shows a weakness in
Jordan’s technical and vocational education system, as the level is below the average for
the Middle East, already low at 8.1 per cent (UNESCO, 2013), and less than one-half of
the aggregate for upper-middle-income countries (15.9 per cent, based on the same
source). The nearly 7.0 per cent share of Jordan’s youth engaged in apprenticeships and
internships, however, is encouraging, and is the highest share among the 28 countries that
ran the SWTS in 2012–13.3
Education of youth and their parents
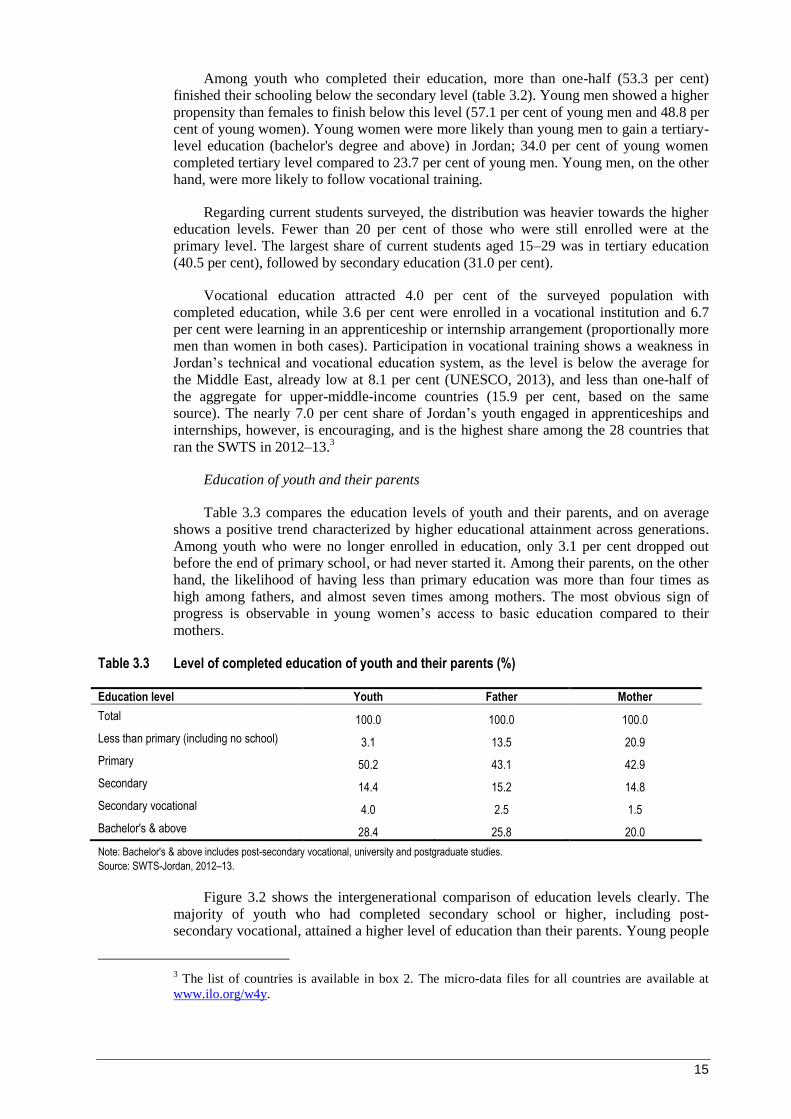
Table 3.3 compares the education levels of youth and their parents, and on average
shows a positive trend characterized by higher educational attainment across generations.
Among youth who were no longer enrolled in education, only 3.1 per cent dropped out
before the end of primary school, or had never started it. Among their parents, on the other
hand, the likelihood of having less than primary education was more than four times as
high among fathers, and almost seven times among mothers. The most obvious sign of
progress is observable in young women’s access to basic education compared to their
mothers.
Table 3.3 Level of completed education of youth and their parents (%)
Education level Youth Father Mother
Total 100.0 100.0 100.0
Less than primary (including no school) 3.1 13.5 20.9
Primary 50.2 43.1 42.9
Secondary 14.4 15.2 14.8
Secondary vocational 4.0 2.5 1.5
Bachelor's & above 28.4 25.8 20.0
Note: Bachelor's & above includes post-secondary vocational, university and postgraduate studies.
Source: SWTS-Jordan, 2012–13.
Figure 3.2 shows the intergenerational comparison of education levels clearly. The
majority of youth who had completed secondary school or higher, including post-
secondary vocational, attained a higher level of education than their parents. Young people
3 The list of countries is available in box 2. The micro-data files for all countries are available at
www.ilo.org/w4y.

16
with less than primary education, by and large, were nearly equally likely to have parents
with the same level of education (less than primary) as they were to have parents with
higher levels of education. Youth with a primary-level education, however, had a much
higher tendency to have a mother and father with the same or lower level of education than
a parent with a higher than primary-education level.
Figure 3.2 Comparison of the level of completed education of youth and their parents
Source: SWTS-Jordan, 2012–13.
Early school leaving
Table 3.4 shows the reasons why youth stopped attending school before completion.
The two most frequently given explanation for dropping out were lack of interest in further
education (35.8 per cent) and a failed examination (33.0 per cent). The latter likely refers
to the secondary school exam in Jordan that determines whether students can continue on
to university. The data show that young men, as opposed to young women, were more
prone to lose their interest in schooling. While a desire to start working was the third most
frequently mentioned reason by young males, it accounted for a minor share of female
drop-outs. Conversely, while almost one-fifth (19.4 per cent) of young women dropped out
because they wanted to get married, the percentage for this reason was nil among young
men. This is probably due to a combination of factors, one of which is the tendency for
women to marry earlier than men. Economic reasons were referred to by only 6.7 per cent
of respondents, and by a relatively larger share of males than females (8.3 per cent versus
4.6 per cent). This is not surprising, given that the immediate opportunity cost of the
education of young men (who could otherwise contribute to the household’s income) is
likely to be perceived as relatively higher than that of young women.
0
10
20
30
40
50
60
70
80
90
100
Sam
e le
vel a
sfa
the
r
Fath
er h
as lo
we
red
uca
tio
n le
vel
Fath
er h
as h
igh
er
edu
cati
on
leve
l
Sam
e le
vel a
sm
oth
er
Mo
ther
has
low
er
edu
cati
on
leve
l
Mo
ther
has
hig
her
ed
uca
tio
nle
vel
Father Mother
%
Less than primary
Primary
Secondary
Secondary vocational
Bachelor's and post-secondary vocational
Doctorate
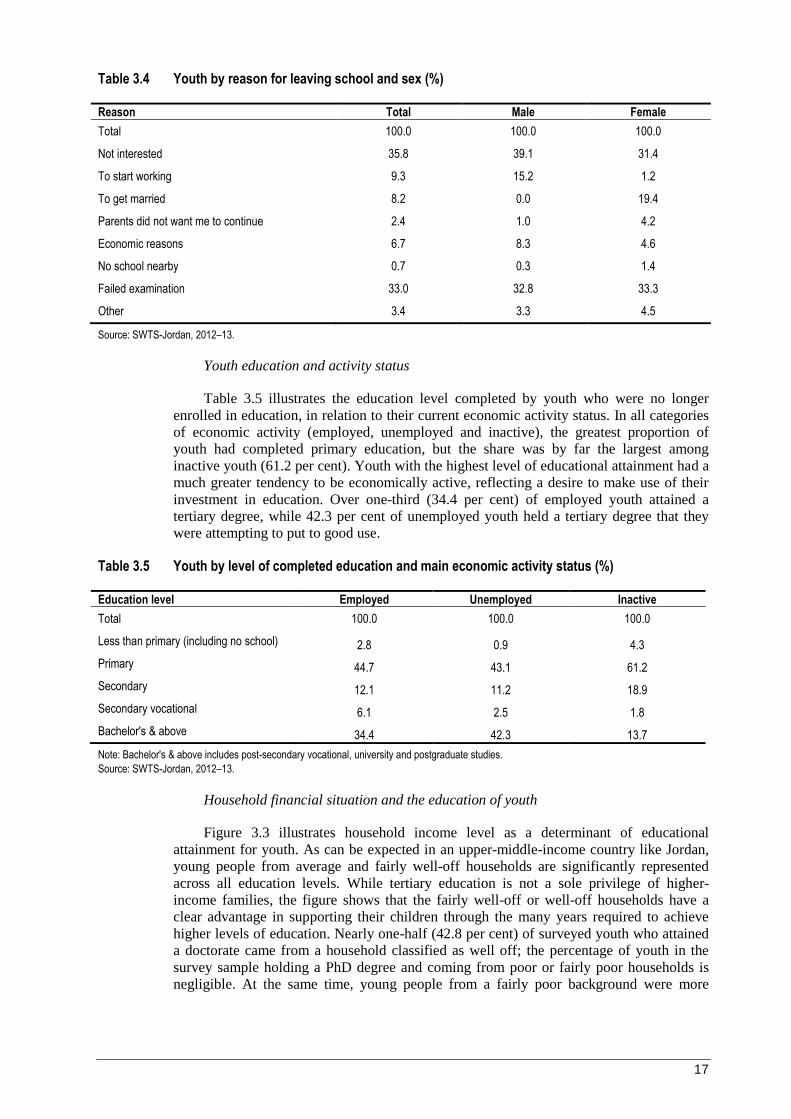
17
Table 3.4 Youth by reason for leaving school and sex (%)
Reason Total Male Female
Total 100.0 100.0 100.0
Not interested 35.8 39.1 31.4
To start working 9.3 15.2 1.2
To get married 8.2 0.0 19.4
Parents did not want me to continue 2.4 1.0 4.2
Economic reasons 6.7 8.3 4.6
No school nearby 0.7 0.3 1.4
Failed examination 33.0 32.8 33.3
Other 3.4 3.3 4.5
Source: SWTS-Jordan, 2012–13.
Youth education and activity status
Table 3.5 illustrates the education level completed by youth who were no longer
enrolled in education, in relation to their current economic activity status. In all categories
of economic activity (employed, unemployed and inactive), the greatest proportion of
youth had completed primary education, but the share was by far the largest among
inactive youth (61.2 per cent). Youth with the highest level of educational attainment had a
much greater tendency to be economically active, reflecting a desire to make use of their
investment in education. Over one-third (34.4 per cent) of employed youth attained a
tertiary degree, while 42.3 per cent of unemployed youth held a tertiary degree that they
were attempting to put to good use.
Table 3.5 Youth by level of completed education and main economic activity status (%)
Education level Employed Unemployed Inactive
Total 100.0 100.0 100.0
Less than primary (including no school) 2.8 0.9 4.3
Primary 44.7 43.1 61.2
Secondary 12.1 11.2 18.9
Secondary vocational 6.1 2.5 1.8
Bachelor's & above 34.4 42.3 13.7
Note: Bachelor's & above includes post-secondary vocational, university and postgraduate studies.
Source: SWTS-Jordan, 2012–13.
Household financial situation and the education of youth
Figure 3.3 illustrates household income level as a determinant of educational
attainment for youth. As can be expected in an upper-middle-income country like Jordan,
young people from average and fairly well-off households are significantly represented
across all education levels. While tertiary education is not a sole privilege of higher-
income families, the figure shows that the fairly well-off or well-off households have a
clear advantage in supporting their children through the many years required to achieve
higher levels of education. Nearly one-half (42.8 per cent) of surveyed youth who attained
a doctorate came from a household classified as well off; the percentage of youth in the
survey sample holding a PhD degree and coming from poor or fairly poor households is
negligible. At the same time, young people from a fairly poor background were more

18
likely to have no education. Once disaggregated by sex, the data on household income and
youth educational attainment show similar findings for males and females.
Figure 3.3 Youth by household income level and level of completed education
Source: SWTS-Jordan, 2012–13.
Work-study combination
Combining work and study is not a common practice among Jordan’s youth. Among
those no longer in education, 94.0 per cent said they never combined work with their
studies (table A.4). The remainder (virtually all men) mostly worked outside the school
term, during the summer or weekends. Asked for their motivations, respondents most
frequently said they combined work and study to earn money (69.0 per cent), help their
family (28.8 per cent) and gain professional experience (17.6 per cent).
3.3 Current activity status of youth
The traditional classification of current activity status has three categories: employed,
unemployed or inactive. The employed and unemployed are added together to form the
total labour force. The key labour market indicators of youth, based on the traditional
distribution and abiding by international standard concepts, are presented for Jordan in
table 3.6. The survey results show that 29.9 per cent of youth were employed, and 9.5 per
cent were unemployed for a total youth labour force participation rate of 39.4 per cent. The
percentage of young females employed and unemployed was 11.2 per cent and 8.1 per
cent, respectively. The female rate of participation in the labour force was therefore very
low at 19.3 per cent. The percentage of males employed and unemployed was 47.2 per cent
and 10.8 per cent, respectively. While very little difference existed in the labour force
participation rates of youth in rural and urban areas, the youth unemployment rate in urban
areas was higher at 20.6 per cent compared to 16.3 per cent in rural areas.
3.0 7.7 10.8 5.0 20.7
42.8 23.5 18.3
27.1 20.3
31.5
31.7 48.2
57.5 52.4
58.4
42.2
25.6 24.4 14.5 8.1 16.2
4.9 0.9 2.0 1.6 0.0 0.7 0.0
0
10
20
30
40
50
60
70
80
90
100
Less thanprimary
Primary Secondary Secondaryvocational
Bachelor's andpost-secondary
vocational
Doctorate
%
Well off Fairly well off Average Fairly poor Poor

19
Table 3.6 Key youth labour market indicators – traditional distribution by sex and area of residence (%)
Sex & area of residence
Distribution of youth population Labour force participation rate
Youth unemployment rate Employed Unemployed Inactive
Total 29.9 9.5 60.6 39.4 24.1
Male 47.2 10.8 42.0 58.0 18.7
Female 11.2 8.1 80.7 19.3 41.8
Rural 30.4 7.9 61.8 38.2 16.3
Urban 29.8 9.9 60.3 39.7 20.6
Source: SWTS-Jordan, 2012–13.
Within the framework of the SWTS analyses, the ILO proposes a more detailed
classification of youth employment to reflect areas of underutilization and the quality of
employment.4 In figure 3.4, the youth population of Jordan is classified into four main
categories (with a further subdivision of inactive youth) as follows:
a. regularly employed, defined as wage and salaried workers (employees) holding a
contract of greater than 12 months’ duration, plus self-employed youth with employees
(employers); this category can be considered as the ideal employment arrangement,
although having a “regular” job is not a guarantee of good quality employment;
b. irregularly employed, defined as wage and salaried workers (employees) holding a
contract of limited duration, i.e. set to terminate prior to 12 months, self-employed
youth with no employees (own-account workers) and contributing family workers;
young people in this category almost certainly fall outside of the framework of
standard employment relationships;
c. unemployed (relaxed definition), defined as persons currently without work and
available to take up work in the week prior to the reference period;
d. inactive youth, which is further divided into two sub-categories: those who are inactive
and in school (“inactive students”) and those who are inactive and not in school
(“inactive non-students”). The inactive students are considered to be investing in their
education to emerge better equipped for their future labour market experience. Hence,
this can tentatively be judged as a “positive” category (notwithstanding issues of skills
mismatch). The inactive non-students have chosen to be outside of the labour market
for reasons other than schooling (to engage in household duties or care for children, for
example) and they may or may not have the intention to (re)enter the labour market in
the future (although further SWTS data analyses show that a majority of inactive non-
students do state an intention to join the labour market in the future in most countries).
Those who say they intend to work in the future have some degree of labour market
attachment and should thus be considered in the classification of labour
(under)utilization.
4 The SWTS analytical framework was designed with an eye on the current efforts to adapt the
international framework of statistics on the economically active population. The International
Conference of Labour Statisticians (ICLS), held in Geneva in October 2013, adopted the
“Resolution concerning statistics of work, employment and labour underutilization”. The Resolution
provides guidelines on a wider set of measures than previously defined internationally, aiming
specifically to enable better statistical measurement of participation of all persons in all forms of
work and in all sectors of the economy while also enabling measurement of areas of labour
underutilization. See ICLS (2013).
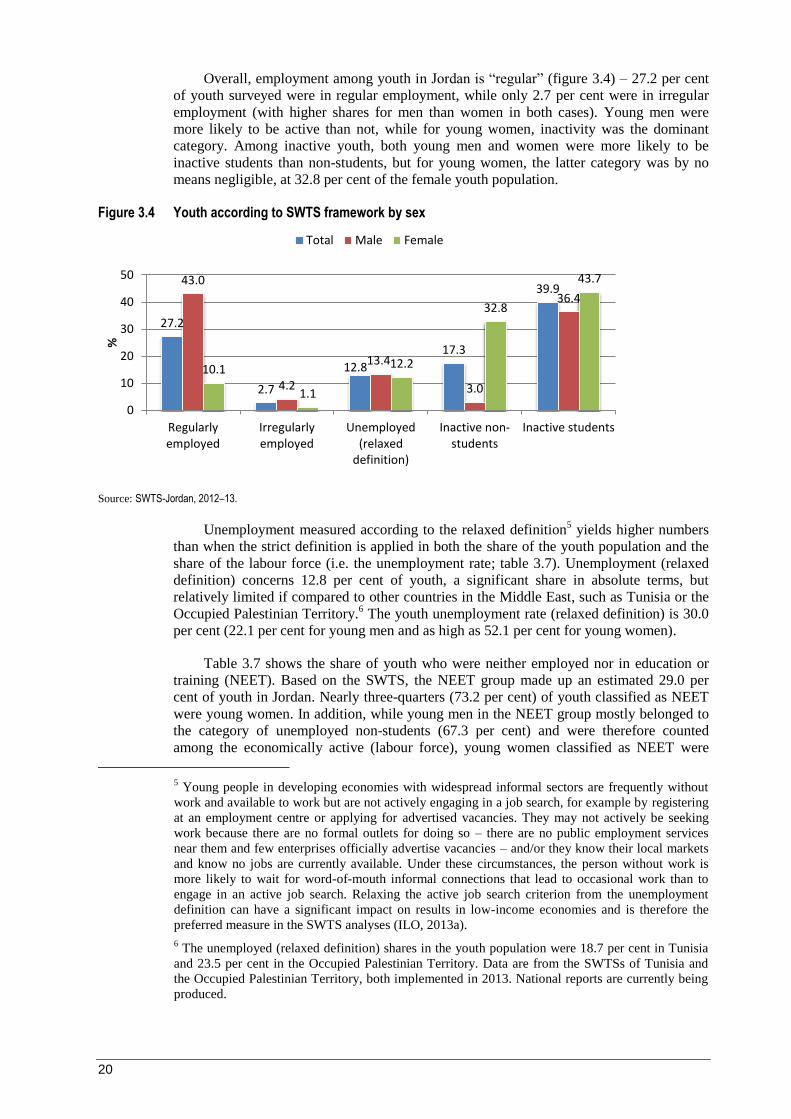
20
Overall, employment among youth in Jordan is “regular” (figure 3.4) – 27.2 per cent
of youth surveyed were in regular employment, while only 2.7 per cent were in irregular
employment (with higher shares for men than women in both cases). Young men were
more likely to be active than not, while for young women, inactivity was the dominant
category. Among inactive youth, both young men and women were more likely to be
inactive students than non-students, but for young women, the latter category was by no
means negligible, at 32.8 per cent of the female youth population.
Figure 3.4 Youth according to SWTS framework by sex
Source: SWTS-Jordan, 2012–13.
Unemployment measured according to the relaxed definition5 yields higher numbers
than when the strict definition is applied in both the share of the youth population and the
share of the labour force (i.e. the unemployment rate; table 3.7). Unemployment (relaxed
definition) concerns 12.8 per cent of youth, a significant share in absolute terms, but
relatively limited if compared to other countries in the Middle East, such as Tunisia or the
Occupied Palestinian Territory.6 The youth unemployment rate (relaxed definition) is 30.0
per cent (22.1 per cent for young men and as high as 52.1 per cent for young women).
Table 3.7 shows the share of youth who were neither employed nor in education or
training (NEET). Based on the SWTS, the NEET group made up an estimated 29.0 per
cent of youth in Jordan. Nearly three-quarters (73.2 per cent) of youth classified as NEET
were young women. In addition, while young men in the NEET group mostly belonged to
the category of unemployed non-students (67.3 per cent) and were therefore counted
among the economically active (labour force), young women classified as NEET were
5 Young people in developing economies with widespread informal sectors are frequently without
work and available to work but are not actively engaging in a job search, for example by registering
at an employment centre or applying for advertised vacancies. They may not actively be seeking
work because there are no formal outlets for doing so – there are no public employment services
near them and few enterprises officially advertise vacancies – and/or they know their local markets
and know no jobs are currently available. Under these circumstances, the person without work is
more likely to wait for word-of-mouth informal connections that lead to occasional work than to
engage in an active job search. Relaxing the active job search criterion from the unemployment
definition can have a significant impact on results in low-income economies and is therefore the
preferred measure in the SWTS analyses (ILO, 2013a).
6 The unemployed (relaxed definition) shares in the youth population were 18.7 per cent in Tunisia
and 23.5 per cent in the Occupied Palestinian Territory. Data are from the SWTSs of Tunisia and
the Occupied Palestinian Territory, both implemented in 2013. National reports are currently being
produced.
27.2
2.7
12.8
17.3
39.9 43.0
4.2
13.4
3.0
36.4
10.1
1.1
12.2
32.8
43.7
0
10
20
30
40
50
Regularlyemployed
Irregularlyemployed
Unemployed(relaxed
definition)
Inactive non-students
Inactive students
%
Total Male Female

21
predominantly inactive non-students (82.5 per cent). By way of comparison, ILO reporting
on youth NEET rates (ILO, 2013a) in countries of the Organisation for Economic Co-
operation and Development showed the lowest share of 7.1 per cent in Luxembourg and
36.6 per cent in Turkey in 2010.
Table 3.7 Youth unemployment (relaxed definition), labour underutilization and NEET rates by sex (%)
Rate/share Total Male Female
Unemployment rate (relaxed definition) 30.0 22.1 52.1
Labour underutilization rate 32.9 20.6 46.2
NEET rate 29.0 14.9 44.2
NEET by sub-category
Total 100.0 100.0 100.0
Unemployed non-students 30.8 67.3 17.5
Inactive non-students 69.2 32.7 82.5
Source: SWTS-Jordan, 2012–13.
The youth labour underutilization rate is a measure that aims to capture all elements
of the youth population whose economic potential is not being fully realized, either
because they work in non-standard employment arrangements or are classified as neither in
the labour force nor in school. Combining the shares of youth irregularly employed and
unemployed (relaxed definition) with inactive non-students, as a percentage of the youth
population, the youth labour underutilization rate in Jordan stands at 32.9 per cent (table
3.7). The disadvantages experienced by young women show up strongly in the labour
underutilization rate, with the female–male gap among Jordan’s youth exceeding 20
percentage points.
Figure 3.5 Youth by primary life goal and main economic activity status
Source: SWTS-Jordan, 2012–13.
18.8
19.0
7.3
25.8
25.8
37.0
47.0
29.1
29.9
2.5
3.2
4.2
6.0
22.9
21.6
0 20 40 60 80 100
Employed
Unemployed
Inactive
%
Having lots of money Having a good family life
Being successful at work Making a contribution to society
Other reasons
22
3.4 Aspirations and life goals
Figure 3.5 indicates the primary life goal of young respondents. The data reveal that
the employed and unemployed had fairly similar views about being successful at work and
having a good family life. Having lots of money ranked third for the employed and fourth
for the unemployed. Not surprisingly, inactive youth were more likely to place a high
value on having a good family life, although being successful at work still represented the
second most frequent answer. This may suggest that a portion of inactive young people
intend to engage in the labour market in the future. It could also mean that for a significant
part of the inactive youth population, inactivity is not a choice but an involuntary condition
in which they find themselves, when they would rather be following their life aspirations in
the labour market.
3.5 Characteristics of employed youth
3.5.1 General characteristics
This section looks at the characteristics of the 29.9 per cent of surveyed youth who
were employed at the time of the survey. The results in table 3.8 reveal that the likelihood
of being employed increased with age. More than one-half, or 52.8 per cent, of those aged
25–29 were employed, versus 39.5 per cent of the 20–24 age cohort. Only 10.0 per cent of
youth aged 15–19 were employed. These results are in line with the educational attainment
of surveyed youth, based on which it is expected that most teenagers in Jordan were in
school. The probability of being employed was remarkably similar in urban and rural
areas, as was the distribution of employment across household income levels.
Table 3.8 Youth employment-to-population ratio by age group, area of residence and household income level
Characteristic %
Age group
15–19 10.0
20–24 39.5
25–29 52.8
Area of residence
Rural 29.8
Urban 30.4
Household income level
Well off 29.4
Fairly well off 28.7
Average 31.2
Fairly poor 27.2
Poor 29.1
Source: SWTS-Jordan, 2012–13.
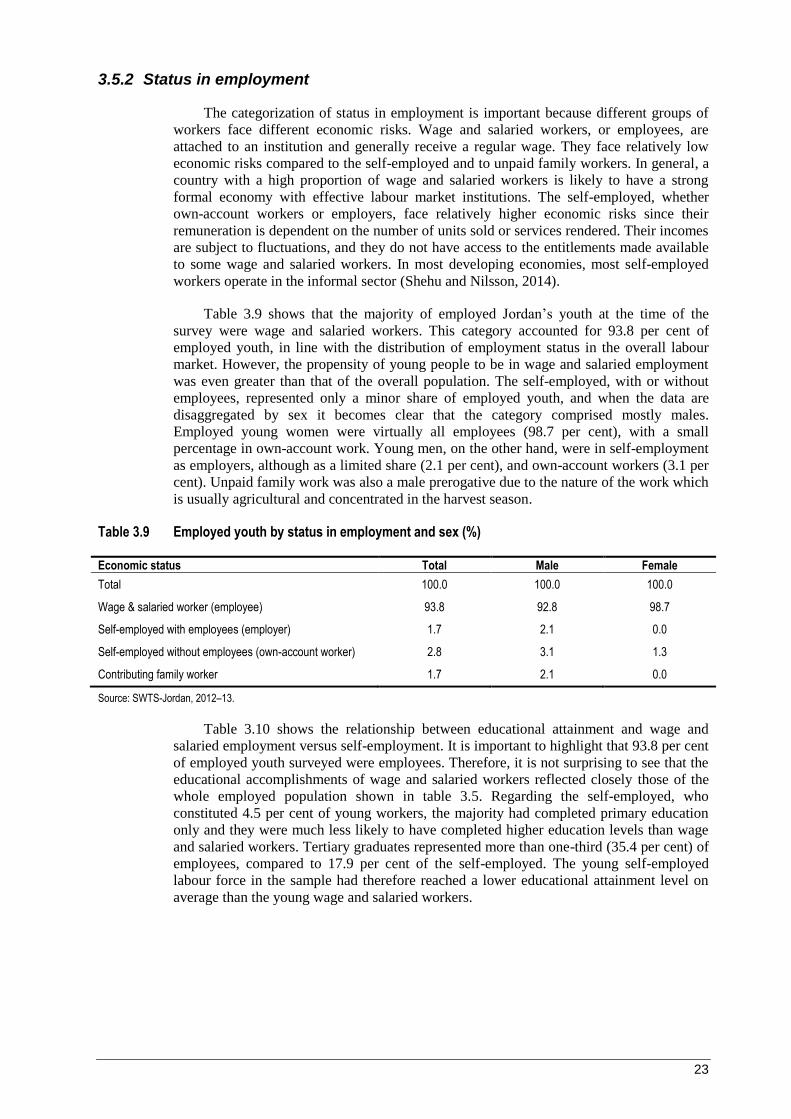
23
3.5.2 Status in employment
The categorization of status in employment is important because different groups of
workers face different economic risks. Wage and salaried workers, or employees, are
attached to an institution and generally receive a regular wage. They face relatively low
economic risks compared to the self-employed and to unpaid family workers. In general, a
country with a high proportion of wage and salaried workers is likely to have a strong
formal economy with effective labour market institutions. The self-employed, whether
own-account workers or employers, face relatively higher economic risks since their
remuneration is dependent on the number of units sold or services rendered. Their incomes
are subject to fluctuations, and they do not have access to the entitlements made available
to some wage and salaried workers. In most developing economies, most self-employed
workers operate in the informal sector (Shehu and Nilsson, 2014).
Table 3.9 shows that the majority of employed Jordan’s youth at the time of the
survey were wage and salaried workers. This category accounted for 93.8 per cent of
employed youth, in line with the distribution of employment status in the overall labour
market. However, the propensity of young people to be in wage and salaried employment
was even greater than that of the overall population. The self-employed, with or without
employees, represented only a minor share of employed youth, and when the data are
disaggregated by sex it becomes clear that the category comprised mostly males.
Employed young women were virtually all employees (98.7 per cent), with a small
percentage in own-account work. Young men, on the other hand, were in self-employment
as employers, although as a limited share (2.1 per cent), and own-account workers (3.1 per
cent). Unpaid family work was also a male prerogative due to the nature of the work which
is usually agricultural and concentrated in the harvest season.
Table 3.9 Employed youth by status in employment and sex (%)
Economic status Total Male Female
Total 100.0 100.0 100.0
Wage & salaried worker (employee) 93.8 92.8 98.7
Self-employed with employees (employer) 1.7 2.1 0.0
Self-employed without employees (own-account worker) 2.8 3.1 1.3
Contributing family worker 1.7 2.1 0.0
Source: SWTS-Jordan, 2012–13.
Table 3.10 shows the relationship between educational attainment and wage and
salaried employment versus self-employment. It is important to highlight that 93.8 per cent
of employed youth surveyed were employees. Therefore, it is not surprising to see that the
educational accomplishments of wage and salaried workers reflected closely those of the
whole employed population shown in table 3.5. Regarding the self-employed, who
constituted 4.5 per cent of young workers, the majority had completed primary education
only and they were much less likely to have completed higher education levels than wage
and salaried workers. Tertiary graduates represented more than one-third (35.4 per cent) of
employees, compared to 17.9 per cent of the self-employed. The young self-employed
labour force in the sample had therefore reached a lower educational attainment level on
average than the young wage and salaried workers.
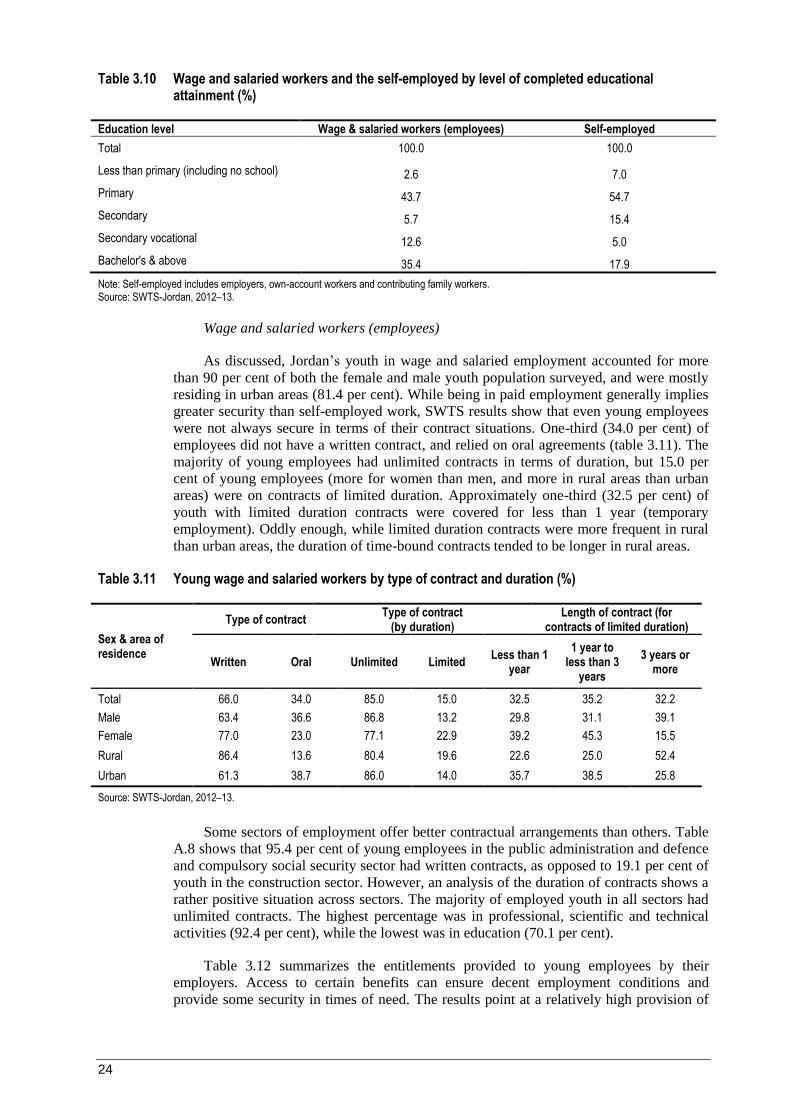
24
Table 3.10 Wage and salaried workers and the self-employed by level of completed educational attainment (%)
Education level Wage & salaried workers (employees) Self-employed
Total 100.0 100.0
Less than primary (including no school) 2.6 7.0
Primary 43.7 54.7
Secondary 5.7 15.4
Secondary vocational 12.6 5.0
Bachelor's & above 35.4 17.9
Note: Self-employed includes employers, own-account workers and contributing family workers. Source: SWTS-Jordan, 2012–13.
Wage and salaried workers (employees)
As discussed, Jordan’s youth in wage and salaried employment accounted for more
than 90 per cent of both the female and male youth population surveyed, and were mostly
residing in urban areas (81.4 per cent). While being in paid employment generally implies
greater security than self-employed work, SWTS results show that even young employees
were not always secure in terms of their contract situations. One-third (34.0 per cent) of
employees did not have a written contract, and relied on oral agreements (table 3.11). The
majority of young employees had unlimited contracts in terms of duration, but 15.0 per
cent of young employees (more for women than men, and more in rural areas than urban
areas) were on contracts of limited duration. Approximately one-third (32.5 per cent) of
youth with limited duration contracts were covered for less than 1 year (temporary
employment). Oddly enough, while limited duration contracts were more frequent in rural
than urban areas, the duration of time-bound contracts tended to be longer in rural areas.
Table 3.11 Young wage and salaried workers by type of contract and duration (%)
Sex & area of residence
Type of contract Type of contract
(by duration) Length of contract (for
contracts of limited duration)
Written Oral Unlimited Limited Less than 1
year
1 year to less than 3
years
3 years or more
Total 66.0 34.0 85.0 15.0 32.5 35.2 32.2
Male 63.4 36.6 86.8 13.2 29.8 31.1 39.1
Female 77.0 23.0 77.1 22.9 39.2 45.3 15.5
Rural 86.4 13.6 80.4 19.6 22.6 25.0 52.4
Urban 61.3 38.7 86.0 14.0 35.7 38.5 25.8
Source: SWTS-Jordan, 2012–13.
Some sectors of employment offer better contractual arrangements than others. Table
A.8 shows that 95.4 per cent of young employees in the public administration and defence
and compulsory social security sector had written contracts, as opposed to 19.1 per cent of
youth in the construction sector. However, an analysis of the duration of contracts shows a
rather positive situation across sectors. The majority of employed youth in all sectors had
unlimited contracts. The highest percentage was in professional, scientific and technical
activities (92.4 per cent), while the lowest was in education (70.1 per cent).
Table 3.12 summarizes the entitlements provided to young employees by their
employers. Access to certain benefits can ensure decent employment conditions and
provide some security in times of need. The results point at a relatively high provision of

25
benefits. The survey showed the majority of young employees were entitled to social
security contributions (66.2 per cent), paid sick leave (64.8 per cent), paid annual leave
(62.7 per cent) and medical insurance (60.3 per cent). Training was also a quite frequent
benefit, mentioned by 44.6 per cent of employees; male and female employees benefited
almost evenly from training opportunities made available by their employers, with men
showing only a limited advantage. The provision of other entitlements, however, appears
to have skewed towards one of the two sexes, depending on the specific benefit.
Table 3.12 Young wage and salaried workers by access to employment benefits/entitlements and sex (%)
Benefit/entitlement Total Male Female
Transport or transport allowance 35.9 37.1 30.8
Meal allowance 41.9 46.7 21.2
Paid annual leave 62.7 60.7 71.4
Paid sick leave 64.8 62.3 75.6
Pension 16.0 14.9 20.8
Severance/end-of-service payment 38.9 40.5 32.1
Overtime pay 23.2 22.1 27.8
Medical insurance coverage 60.3 60.2 61.0
Bonus 40.2 41.2 35.9
Social security contributions 66.2 63.3 78.7
Training 44.6 45.1 42.8
Occupational safety 39.0 43.1 21.6
Childcare facilities 10.5 5.6 31.4
Maternity/paternity leave 16.6 7.9 53.5
Source: SWTS-Jordan, 2012–13.
Women were more likely to receive paid annual leave, sick leave, social security
contributions, pension contributions and overtime pay. More than one-half (53.5 per cent)
of young female employees could benefit from maternity leave, and nearly one-third (31.4
per cent) had access to childcare facilities, while the share of men with such benefits was
minor. Men, on the other hand, were more often entitled to severance payments and
bonuses. Occupational safety equipment and meal allowance were also benefits going
primarily to men. This is mostly because of gender-based differences in type of occupation
and sectors of employment, with women usually employed in sectors characterized by
lower health and safety risks, and limited working hours.
Table 3.13 indicates the average wages of young people in Jordan by sex and
education level. Only findings on wage and salaried workers are shown, as data on own-
account workers and employers were not reliable due to a limited number of observations.
Overall, the mean monthly wages of men and women were quite homogeneous. Young
men earned on average JOD 266.54 per month, with young women very close at JOD
260.52. Another important finding was the wage premium that comes with increased
education.7 For example, the average wage of a young employee with a university
7 The UN operational exchange rate on 1 November 2012 (immediately prior to the start of the
survey fieldwork) was 0.708 Jordanian dinars to the US dollar. The average wage of a young
employee in Jordan was therefore the equivalent of US$ 374.87 per month. The university graduate
working in paid employment earned the equivalent of US$ 445.68 per month.
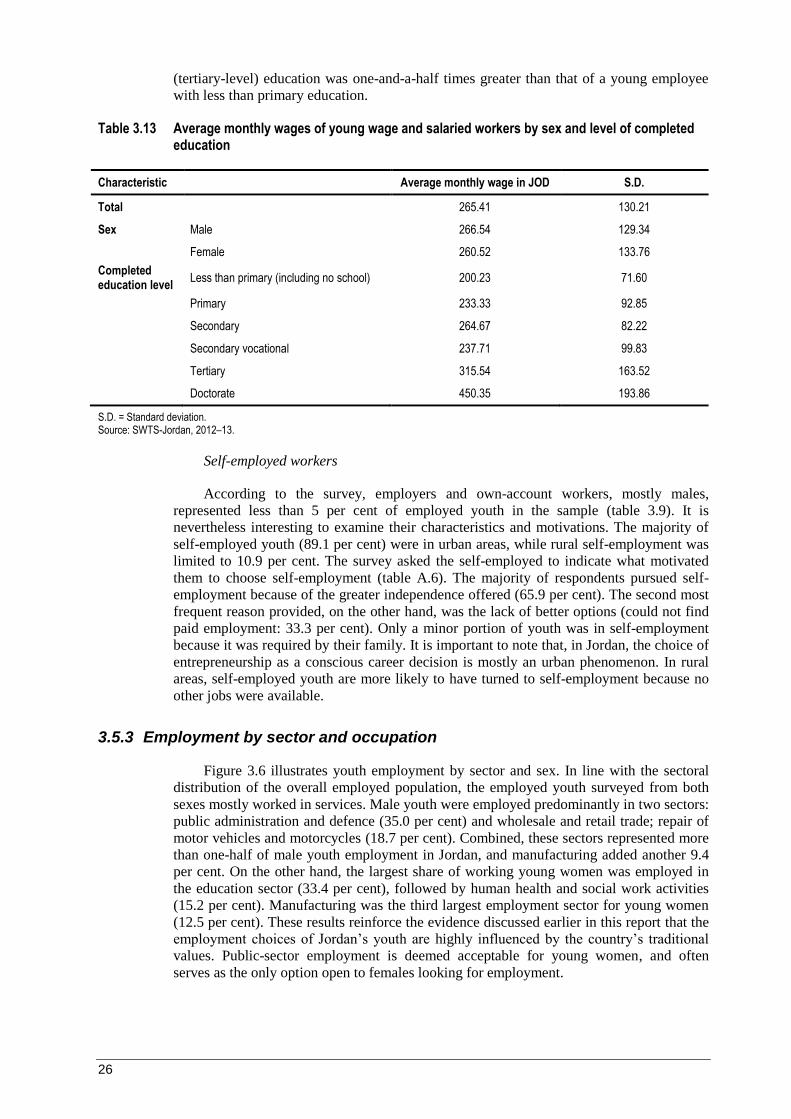
26
(tertiary-level) education was one-and-a-half times greater than that of a young employee
with less than primary education.
Table 3.13 Average monthly wages of young wage and salaried workers by sex and level of completed education
Characteristic Average monthly wage in JOD S.D.
Total 265.41 130.21
Sex Male 266.54 129.34
Female 260.52 133.76
Completed education level
Less than primary (including no school) 200.23 71.60
Primary 233.33 92.85
Secondary 264.67 82.22
Secondary vocational 237.71 99.83
Tertiary 315.54 163.52
Doctorate 450.35 193.86
S.D. = Standard deviation. Source: SWTS-Jordan, 2012–13.
Self-employed workers
According to the survey, employers and own-account workers, mostly males,
represented less than 5 per cent of employed youth in the sample (table 3.9). It is
nevertheless interesting to examine their characteristics and motivations. The majority of
self-employed youth (89.1 per cent) were in urban areas, while rural self-employment was
limited to 10.9 per cent. The survey asked the self-employed to indicate what motivated
them to choose self-employment (table A.6). The majority of respondents pursued self-
employment because of the greater independence offered (65.9 per cent). The second most
frequent reason provided, on the other hand, was the lack of better options (could not find
paid employment: 33.3 per cent). Only a minor portion of youth was in self-employment
because it was required by their family. It is important to note that, in Jordan, the choice of
entrepreneurship as a conscious career decision is mostly an urban phenomenon. In rural
areas, self-employed youth are more likely to have turned to self-employment because no
other jobs were available.
3.5.3 Employment by sector and occupation
Figure 3.6 illustrates youth employment by sector and sex. In line with the sectoral
distribution of the overall employed population, the employed youth surveyed from both
sexes mostly worked in services. Male youth were employed predominantly in two sectors:
public administration and defence (35.0 per cent) and wholesale and retail trade; repair of
motor vehicles and motorcycles (18.7 per cent). Combined, these sectors represented more
than one-half of male youth employment in Jordan, and manufacturing added another 9.4
per cent. On the other hand, the largest share of working young women was employed in
the education sector (33.4 per cent), followed by human health and social work activities
(15.2 per cent). Manufacturing was the third largest employment sector for young women
(12.5 per cent). These results reinforce the evidence discussed earlier in this report that the
employment choices of Jordan’s youth are highly influenced by the country’s traditional
values. Public-sector employment is deemed acceptable for young women, and often
serves as the only option open to females looking for employment.

27
Youth employment in Jordan can also be categorized by type of occupation,
according to the International Standard Classification of Occupations (ISCO) (figure 3.7).
Most young workers surveyed were in the service and professionals groups, which together
amounted to 55.5 per cent of employed youth. Young men were more often service
workers, shop and market sales workers (37.0 per cent), and craft and related trades
workers (18.7 per cent), whereas the greatest proportion of young women was in the
professionals group (54.5 per cent). The first three major occupational groups (legislators,
senior officials and managers; professionals; and technicians and associate professionals),
typically the higher-skilled occupations, accounted for 63.5 per cent of working women,
but only 22.0 per cent of working men.
Figure 3.6 Youth employment by sector according to 1-digit ISCO categorization and sex
Note: Only sectors with shares of total youth employment equal to or greater than 2 per cent are shown. Source: SWTS-Jordan, 2012–13.
Figure 3.7 Youth employment by ISCO categorization and sex
Source: SWTS-Jordan, 2012–13.
0 10 20 30 40
Public administration and defence,…
Wholesale and retail trade; repair
Education
Manufacturing
Human health and social work activities
Construction
Transportation and storage
Accommodation and food service…
Other service activities
Professional, scientific and technical…
%
Female
Male
Total
0 20 40 60
Elementary occupations
Plant & machine operators & assemblers
Craft & related trades workers
Skilled agricultural & fishery workers
Service workers, shop & market sales…
Clerks
Technicians and associate professionals
Professionals
Legislators, senior officials & managers
%
Female
Male
Total
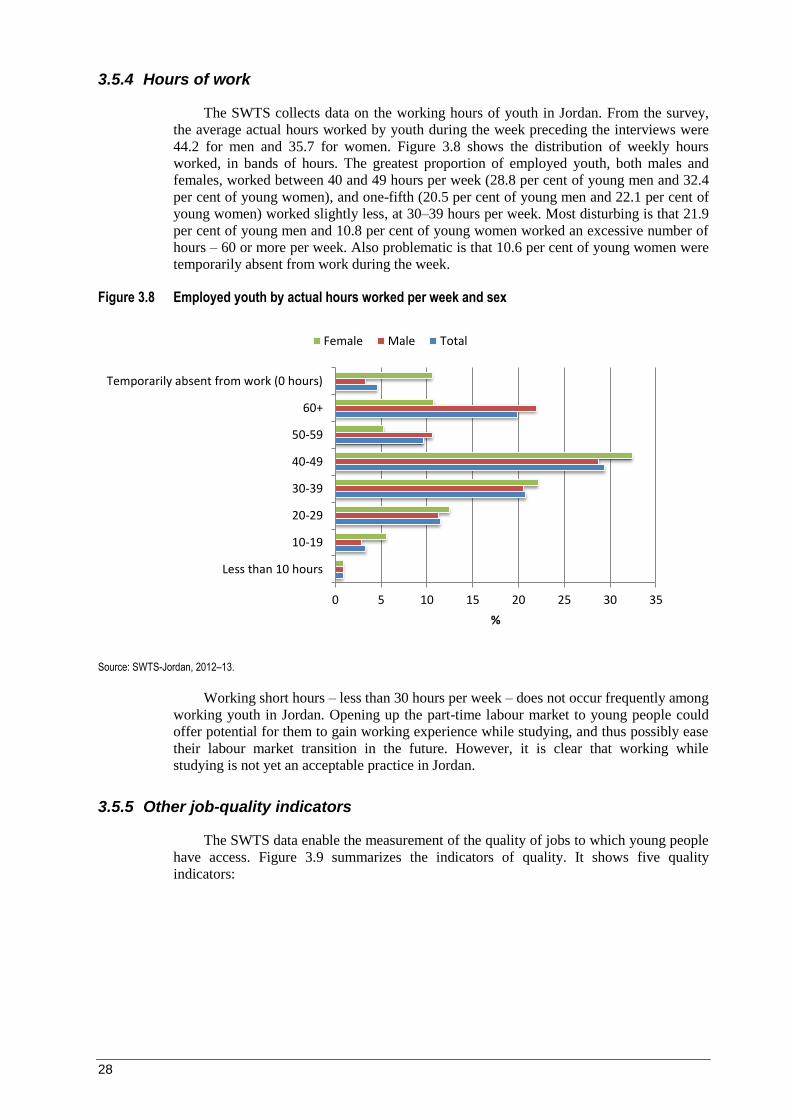
28
3.5.4 Hours of work
The SWTS collects data on the working hours of youth in Jordan. From the survey,
the average actual hours worked by youth during the week preceding the interviews were
44.2 for men and 35.7 for women. Figure 3.8 shows the distribution of weekly hours
worked, in bands of hours. The greatest proportion of employed youth, both males and
females, worked between 40 and 49 hours per week (28.8 per cent of young men and 32.4
per cent of young women), and one-fifth (20.5 per cent of young men and 22.1 per cent of
young women) worked slightly less, at 30–39 hours per week. Most disturbing is that 21.9
per cent of young men and 10.8 per cent of young women worked an excessive number of
hours – 60 or more per week. Also problematic is that 10.6 per cent of young women were
temporarily absent from work during the week.
Figure 3.8 Employed youth by actual hours worked per week and sex
Source: SWTS-Jordan, 2012–13.
Working short hours – less than 30 hours per week – does not occur frequently among
working youth in Jordan. Opening up the part-time labour market to young people could
offer potential for them to gain working experience while studying, and thus possibly ease
their labour market transition in the future. However, it is clear that working while
studying is not yet an acceptable practice in Jordan.
3.5.5 Other job-quality indicators
The SWTS data enable the measurement of the quality of jobs to which young people
have access. Figure 3.9 summarizes the indicators of quality. It shows five quality
indicators:
0 5 10 15 20 25 30 35
Less than 10 hours
10-19
20-29
30-39
40-49
50-59
60+
Temporarily absent from work (0 hours)
%
Female Male Total
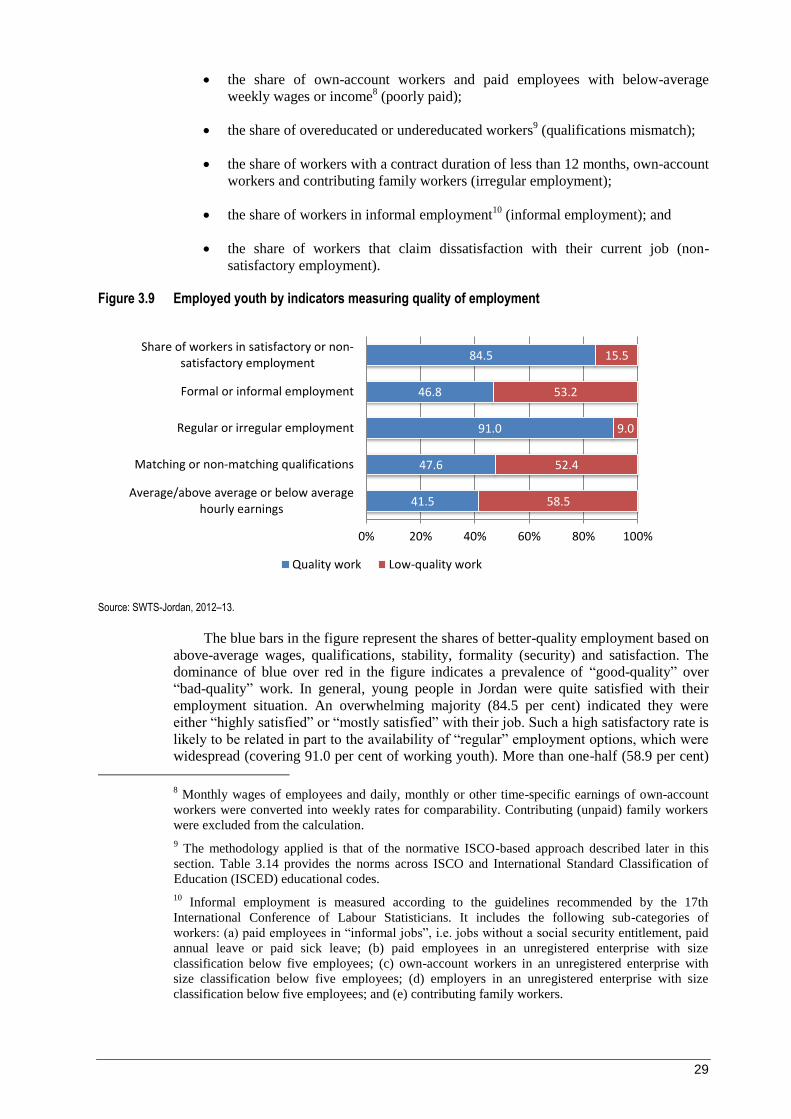
29
the share of own-account workers and paid employees with below-average
weekly wages or income8 (poorly paid);
the share of overeducated or undereducated workers9 (qualifications mismatch);
the share of workers with a contract duration of less than 12 months, own-account
workers and contributing family workers (irregular employment);
the share of workers in informal employment10
(informal employment); and
the share of workers that claim dissatisfaction with their current job (non-
satisfactory employment).
Figure 3.9 Employed youth by indicators measuring quality of employment
Source: SWTS-Jordan, 2012–13.
The blue bars in the figure represent the shares of better-quality employment based on
above-average wages, qualifications, stability, formality (security) and satisfaction. The
dominance of blue over red in the figure indicates a prevalence of “good-quality” over
“bad-quality” work. In general, young people in Jordan were quite satisfied with their
employment situation. An overwhelming majority (84.5 per cent) indicated they were
either “highly satisfied” or “mostly satisfied” with their job. Such a high satisfactory rate is
likely to be related in part to the availability of “regular” employment options, which were
widespread (covering 91.0 per cent of working youth). More than one-half (58.9 per cent)
8 Monthly wages of employees and daily, monthly or other time-specific earnings of own-account
workers were converted into weekly rates for comparability. Contributing (unpaid) family workers
were excluded from the calculation.
9 The methodology applied is that of the normative ISCO-based approach described later in this
section. Table 3.14 provides the norms across ISCO and International Standard Classification of
Education (ISCED) educational codes.
10 Informal employment is measured according to the guidelines recommended by the 17th
International Conference of Labour Statisticians. It includes the following sub-categories of
workers: (a) paid employees in “informal jobs”, i.e. jobs without a social security entitlement, paid
annual leave or paid sick leave; (b) paid employees in an unregistered enterprise with size
classification below five employees; (c) own-account workers in an unregistered enterprise with
size classification below five employees; (d) employers in an unregistered enterprise with size
classification below five employees; and (e) contributing family workers.
41.5
47.6
91.0
46.8
84.5
58.5
52.4
9.0
53.2
15.5
0% 20% 40% 60% 80% 100%
Average/above average or below averagehourly earnings
Matching or non-matching qualifications
Regular or irregular employment
Formal or informal employment
Share of workers in satisfactory or non-satisfactory employment
Quality work Low-quality work

30
of employed youth earned a weekly wage below the average of all working youth; the
indicator was 60.4 per cent for males and 52.7 per cent for females, with the lagging
female result possibly due to wages for women being lower in absolute terms.
Informal employment, which impacted more than one-half (53.2 per cent) of young
workers, is made up of two sub-categories: workers in the informal (unregistered) sector
and paid employees holding informal jobs in the formal sector. In Jordan, the latter
category prevails. While employees in this category earn a salary, they do not receive
certain benefits, such as social security contributions, or paid annual or sick leave, that
would normally be associated with a formal job. While 53.2 per cent of young people in
Jordan were categorized in informal employment, it could be noted that the rate falls well
below that of the other countries running the SWTS in the Middle East and North Africa
region.11
Another job-quality measure is qualification matching. Notably, 52.4 per cent of
surveyed youth felt that their qualifications did not match their employment – that they
were either over- or underqualified for their job (figure 3.10). At the subjective level, this
result implies that a skills mismatch problem exists in Jordan. Objectively, the skills
mismatch between the job that a person does and their level of educational qualification is
measured by applying the normative measure of occupational skills categories from the
ISCO (ILO, 2013a, p. 44). ISCO-08 includes the categorization of major occupational
groups (1-digit ISCO levels) by level of education in accordance with the International
Standard Classification of Education (ISCED). Table 3.14 summarizes the ISCO-based
educational classification.
Table 3.14 ISCO major groups and education levels
ISCO major group Broad occupation group Education level
Managers
High-skilled non-manual Tertiary (ISCED 5–6) Professionals
Technicians & associate professionals
Clerical support workers Low-skilled non-manual
Service & sales workers
Skilled agricultural & fishery workers
Skilled manual
Secondary (ISCED 3–4)
Craft & related trades workers
Plant & machine operators & assemblers
Elementary occupations Unskilled Primary (ISCED 1–2)
Source: ILO, 2013a, table 3.
Workers in a particular group who have the assigned level of education are
considered well-matched. Those who have a higher (lower) level of education are
considered over- (under-) educated. For example, a university graduate working as a clerk
(a low-skilled non-manual occupation) is overeducated, while someone whose highest
education level is secondary school but who is working as an engineer (a high-skilled non-
manual occupation) is undereducated. Both types of mismatch can have a negative impact
on workers' productivity and satisfaction. Undereducated workers are likely to be less
productive and, in that sense, bring lower added value to their employers and, more
personally, they are more prone to suffering from a sense of insecurity and inadequacy. In
the same job, overeducated workers earn more than those with a lower (i.e. appropriate)
11
Informal employment rates among youth (calculated from the SWTSs) come to 91.1 per cent in
Egypt, 94.1 per cent in the Occupied Palestinian Territory and 86.1 per cent in Tunisia.

31
level of qualifications, but less than workers at their same education level and in a job that
matches it well. Using the ISCO-based method and looking at those with completed
education, 52.4 per cent of youth were employed in a job that did not match their
qualifications well; 9.4 per cent were overeducated and 43.0 per cent were undereducated.
Table 3.15 provides details on the extent of the qualifications mismatch among youth
in Jordan. As is expected in a country with the educational profile of Jordan, the tendency
towards undereducation in the higher-skilled occupational categories is small. Enough
university graduates are produced every year with the right amount of qualifications to fill
professional and managerial vacancies. Youth working as service workers, shop and
market sales workers, or craft and related trades workers, are those most likely to be
undereducated for their jobs (47.5 and 26.7 per cent, respectively).
Regarding overqualification, more than one-fifth of youth in elementary occupations
(22.5 per cent) or working as clerks (27.8 per cent) are overeducated for their job, and an
even greater share of young service workers, shop and market sales workers (35.9 per cent)
hold a higher degree than required to do their work. These numbers suggest that some
educated youth must settle for jobs for which they are overqualified. One consequence of
overeducation is that those affected will likely earn less than they could otherwise, thus not
making the most of their productive potential. Another consequence is the crowding out of
youth at the bottom of the educational pyramid. The less-educated youth find themselves at
the back of the queue even for those jobs for which they are best qualified.
Table 3.15 Overeducated and undereducated young workers by major occupational category (ISCO-08, %)
Major occupational category (ISCO-08) Overeducated Undereducated
1. Legislators, senior officials & managers 0.0 0.1
2. Professionals 0.0 0.6
3. Technicians & associate professionals 0.0 4.6
4. Clerks 27.8 7.1
5. Service workers, shop & market sales workers 35.9 47.5
6. Skilled agricultural & fishery workers 0.0 2.3
7. Craft & related trades workers 11.4 26.7
8. Plant & machine operators & assemblers 2.5 10.5
9. Elementary occupations 22.5 0.6
Total 9.4 43.0
Source: SWTS-Jordan, 2012–13.
3.5.6 Security and satisfaction
Figure 3.10 shows that 84.5 per cent of employed youth were satisfied with their jobs.
The SWTS results show that job satisfaction does not necessarily depend on the nature of
employment. Of Jordan’s youth claiming satisfaction with their job, 40.1 per cent were in
informal employment and 51.7 per cent were paid less than the average wage. Relative job
satisfaction among youth in the country was somewhat contradicted by the more than one-
quarter (28.8 per cent) of young workers expressing a desire to change their jobs (table
A.5). Among satisfied youth, the most cited reason for wanting to change jobs was to
improve working conditions (26.8 per cent), followed closely by the desire to have a
higher pay per hour (26.2 per cent) and to move out of temporary employment (23.7 per
cent). Nine (9.0) per cent of young workers wanted to change their job to make better use
of their qualifications.
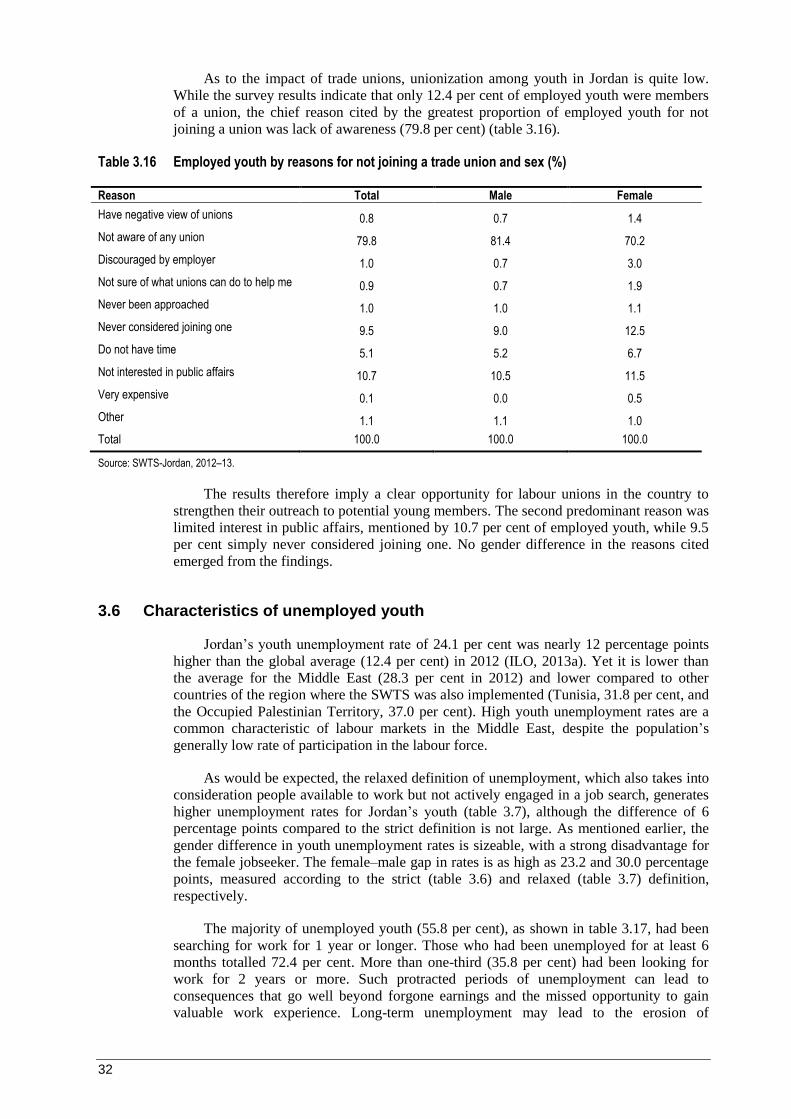
32
As to the impact of trade unions, unionization among youth in Jordan is quite low.
While the survey results indicate that only 12.4 per cent of employed youth were members
of a union, the chief reason cited by the greatest proportion of employed youth for not
joining a union was lack of awareness (79.8 per cent) (table 3.16).
Table 3.16 Employed youth by reasons for not joining a trade union and sex (%)
Reason Total Male Female
Have negative view of unions 0.8 0.7 1.4
Not aware of any union 79.8 81.4 70.2
Discouraged by employer 1.0 0.7 3.0
Not sure of what unions can do to help me 0.9 0.7 1.9
Never been approached 1.0 1.0 1.1
Never considered joining one 9.5 9.0 12.5
Do not have time 5.1 5.2 6.7
Not interested in public affairs 10.7 10.5 11.5
Very expensive 0.1 0.0 0.5
Other 1.1 1.1 1.0
Total 100.0 100.0 100.0
Source: SWTS-Jordan, 2012–13.
The results therefore imply a clear opportunity for labour unions in the country to
strengthen their outreach to potential young members. The second predominant reason was
limited interest in public affairs, mentioned by 10.7 per cent of employed youth, while 9.5
per cent simply never considered joining one. No gender difference in the reasons cited
emerged from the findings.
3.6 Characteristics of unemployed youth
Jordan’s youth unemployment rate of 24.1 per cent was nearly 12 percentage points
higher than the global average (12.4 per cent) in 2012 (ILO, 2013a). Yet it is lower than
the average for the Middle East (28.3 per cent in 2012) and lower compared to other
countries of the region where the SWTS was also implemented (Tunisia, 31.8 per cent, and
the Occupied Palestinian Territory, 37.0 per cent). High youth unemployment rates are a
common characteristic of labour markets in the Middle East, despite the population’s
generally low rate of participation in the labour force.
As would be expected, the relaxed definition of unemployment, which also takes into
consideration people available to work but not actively engaged in a job search, generates
higher unemployment rates for Jordan’s youth (table 3.7), although the difference of 6
percentage points compared to the strict definition is not large. As mentioned earlier, the
gender difference in youth unemployment rates is sizeable, with a strong disadvantage for
the female jobseeker. The female–male gap in rates is as high as 23.2 and 30.0 percentage
points, measured according to the strict (table 3.6) and relaxed (table 3.7) definition,
respectively.
The majority of unemployed youth (55.8 per cent), as shown in table 3.17, had been
searching for work for 1 year or longer. Those who had been unemployed for at least 6
months totalled 72.4 per cent. More than one-third (35.8 per cent) had been looking for
work for 2 years or more. Such protracted periods of unemployment can lead to
consequences that go well beyond forgone earnings and the missed opportunity to gain
valuable work experience. Long-term unemployment may lead to the erosion of
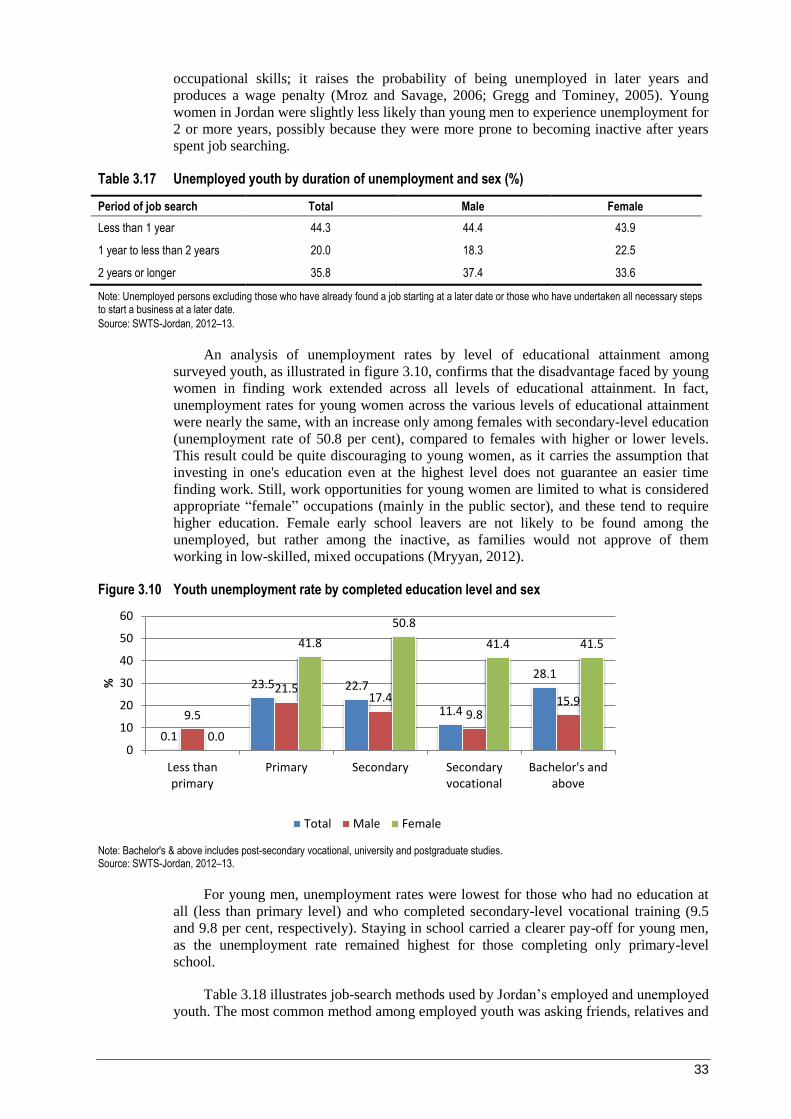
33
occupational skills; it raises the probability of being unemployed in later years and
produces a wage penalty (Mroz and Savage, 2006; Gregg and Tominey, 2005). Young
women in Jordan were slightly less likely than young men to experience unemployment for
2 or more years, possibly because they were more prone to becoming inactive after years
spent job searching.
Table 3.17 Unemployed youth by duration of unemployment and sex (%)
Period of job search Total Male Female
Less than 1 year 44.3 44.4 43.9
1 year to less than 2 years 20.0 18.3 22.5
2 years or longer 35.8 37.4 33.6
Note: Unemployed persons excluding those who have already found a job starting at a later date or those who have undertaken all necessary steps to start a business at a later date.
Source: SWTS-Jordan, 2012–13.
An analysis of unemployment rates by level of educational attainment among
surveyed youth, as illustrated in figure 3.10, confirms that the disadvantage faced by young
women in finding work extended across all levels of educational attainment. In fact,
unemployment rates for young women across the various levels of educational attainment
were nearly the same, with an increase only among females with secondary-level education
(unemployment rate of 50.8 per cent), compared to females with higher or lower levels.
This result could be quite discouraging to young women, as it carries the assumption that
investing in one's education even at the highest level does not guarantee an easier time
finding work. Still, work opportunities for young women are limited to what is considered
appropriate “female” occupations (mainly in the public sector), and these tend to require
higher education. Female early school leavers are not likely to be found among the
unemployed, but rather among the inactive, as families would not approve of them
working in low-skilled, mixed occupations (Mryyan, 2012).
Figure 3.10 Youth unemployment rate by completed education level and sex
Note: Bachelor's & above includes post-secondary vocational, university and postgraduate studies. Source: SWTS-Jordan, 2012–13.
For young men, unemployment rates were lowest for those who had no education at
all (less than primary level) and who completed secondary-level vocational training (9.5
and 9.8 per cent, respectively). Staying in school carried a clearer pay-off for young men,
as the unemployment rate remained highest for those completing only primary-level
school.
Table 3.18 illustrates job-search methods used by Jordan’s employed and unemployed
youth. The most common method among employed youth was asking friends, relatives and
0.1
23.5 22.7
11.4
28.1
9.5
21.5 17.4
9.8 15.9
0.0
41.8
50.8
41.4 41.5
0
10
20
30
40
50
60
Less thanprimary
Primary Secondary Secondaryvocational
Bachelor's andabove
%
Total Male Female

34
acquaintances; 45.3 per cent of employed youth used this approach to find their current
job. Among unemployed youth, a large share (42.2 per cent) sought work through their
network of family and friends, but an even more common method was to inquire directly
with potential employers (72.2 per cent). The fact that half as many (37.8 per cent) youth
in employment reportedly attained their job using this method implies it often proves
ineffective. Further, over one-third of unemployed youth responded to job advertisements
(35.0 per cent) or registered at an employment centre (34.1 per cent).
Table 3.18 Employed and unemployed youth by job search methods used (%)
Method Employed Unemployed
Registered at employment centre 13.8 34.1
Placed or answered job advertisements 15.6 35.0
Inquired directly at factories, farms, markets, shops or other workplaces 37.8 72.2
Took a test or interview 11.1 5.2
Asked friends, relatives, acquaintances 45.3 42.2
Waited on the street to be recruited for casual work 1.8 4.9
Sought financial assistance to look for work or start a business 1.3 0.6
Looked for land, building, equipment, machinery to start own business or farm 0.1 0.0
Applied for permit or licence to start a business 0.9 0.4
Other 4.6 0.0
Note: Multiple responses were allowed. Source: SWTS-Jordan, 2012–13.
Among unemployed youth in the survey sample who submitted applications in
response to job advertisements, more than 90 per cent said they had completed at least one
job application over the previous 12 months, and 43.5 per cent had submitted more than
three applications (figure 3.11). Despite this effort, 53.9 per cent did not obtain any
interview requests in the year prior to the survey and only 9.2 per cent were interviewed
more than three times.
Figure 3.11 Unemployed youth by number of jobs applied for and job interviews attended
Source: SWTS-Jordan, 2012–13.
Discouraged workers are those not working but available to work; they do not seek
employment because they feel that undertaking a job search would be futile. The survey
showed that only 1.8 per cent of the overall Jordan’s youth population belonged to this
category (1.5 per cent of males and 2.0 per cent of females). Table 3.19 presents the
reasons given by young discouraged workers for not seeking work. The lack of job
9.1
53.9 47.4
36.9 43.5
9.2
0
20
40
60
80
100
Applications Interviews
% More than 3
3 or less
None
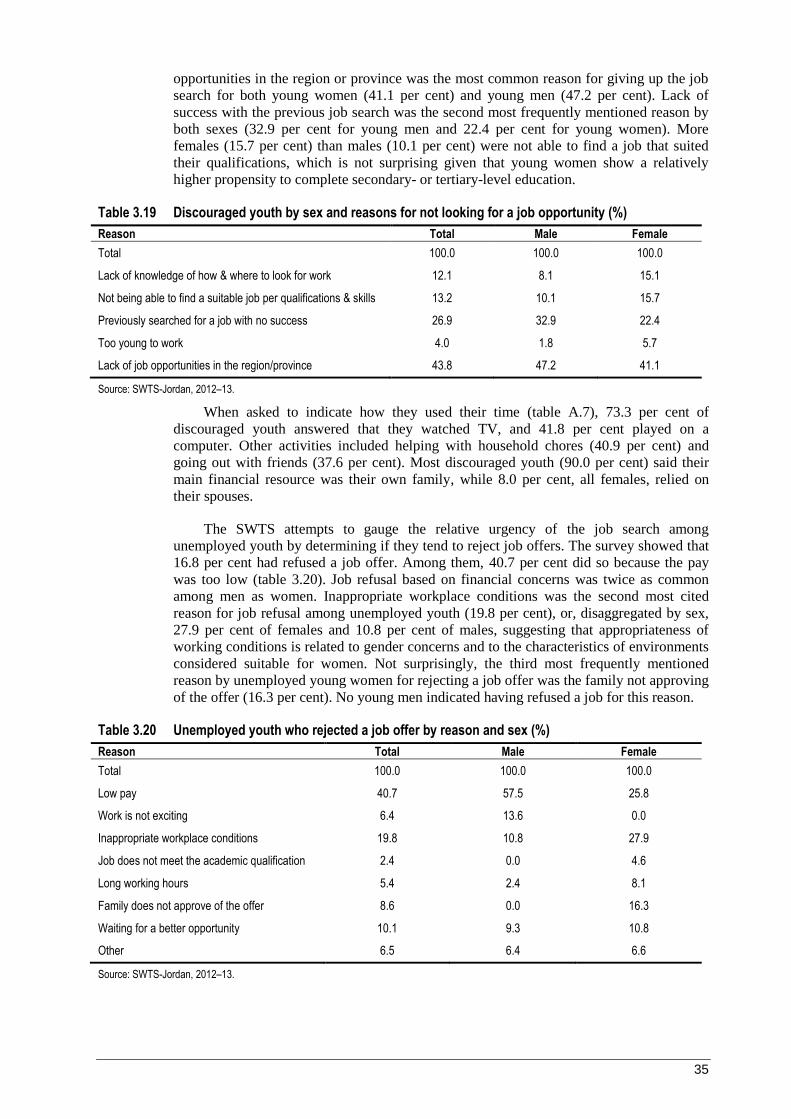
35
opportunities in the region or province was the most common reason for giving up the job
search for both young women (41.1 per cent) and young men (47.2 per cent). Lack of
success with the previous job search was the second most frequently mentioned reason by
both sexes (32.9 per cent for young men and 22.4 per cent for young women). More
females (15.7 per cent) than males (10.1 per cent) were not able to find a job that suited
their qualifications, which is not surprising given that young women show a relatively
higher propensity to complete secondary- or tertiary-level education.
Table 3.19 Discouraged youth by sex and reasons for not looking for a job opportunity (%)
Reason Total Male Female
Total 100.0 100.0 100.0
Lack of knowledge of how & where to look for work 12.1 8.1 15.1
Not being able to find a suitable job per qualifications & skills 13.2 10.1 15.7
Previously searched for a job with no success 26.9 32.9 22.4
Too young to work 4.0 1.8 5.7
Lack of job opportunities in the region/province 43.8 47.2 41.1
Source: SWTS-Jordan, 2012–13.
When asked to indicate how they used their time (table A.7), 73.3 per cent of
discouraged youth answered that they watched TV, and 41.8 per cent played on a
computer. Other activities included helping with household chores (40.9 per cent) and
going out with friends (37.6 per cent). Most discouraged youth (90.0 per cent) said their
main financial resource was their own family, while 8.0 per cent, all females, relied on
their spouses.
The SWTS attempts to gauge the relative urgency of the job search among
unemployed youth by determining if they tend to reject job offers. The survey showed that
16.8 per cent had refused a job offer. Among them, 40.7 per cent did so because the pay
was too low (table 3.20). Job refusal based on financial concerns was twice as common
among men as women. Inappropriate workplace conditions was the second most cited
reason for job refusal among unemployed youth (19.8 per cent), or, disaggregated by sex,
27.9 per cent of females and 10.8 per cent of males, suggesting that appropriateness of
working conditions is related to gender concerns and to the characteristics of environments
considered suitable for women. Not surprisingly, the third most frequently mentioned
reason by unemployed young women for rejecting a job offer was the family not approving
of the offer (16.3 per cent). No young men indicated having refused a job for this reason.
Table 3.20 Unemployed youth who rejected a job offer by reason and sex (%)
Reason Total Male Female
Total 100.0 100.0 100.0
Low pay 40.7 57.5 25.8
Work is not exciting 6.4 13.6 0.0
Inappropriate workplace conditions 19.8 10.8 27.9
Job does not meet the academic qualification 2.4 0.0 4.6
Long working hours 5.4 2.4 8.1
Family does not approve of the offer 8.6 0.0 16.3
Waiting for a better opportunity 10.1 9.3 10.8
Other 6.5 6.4 6.6
Source: SWTS-Jordan, 2012–13.
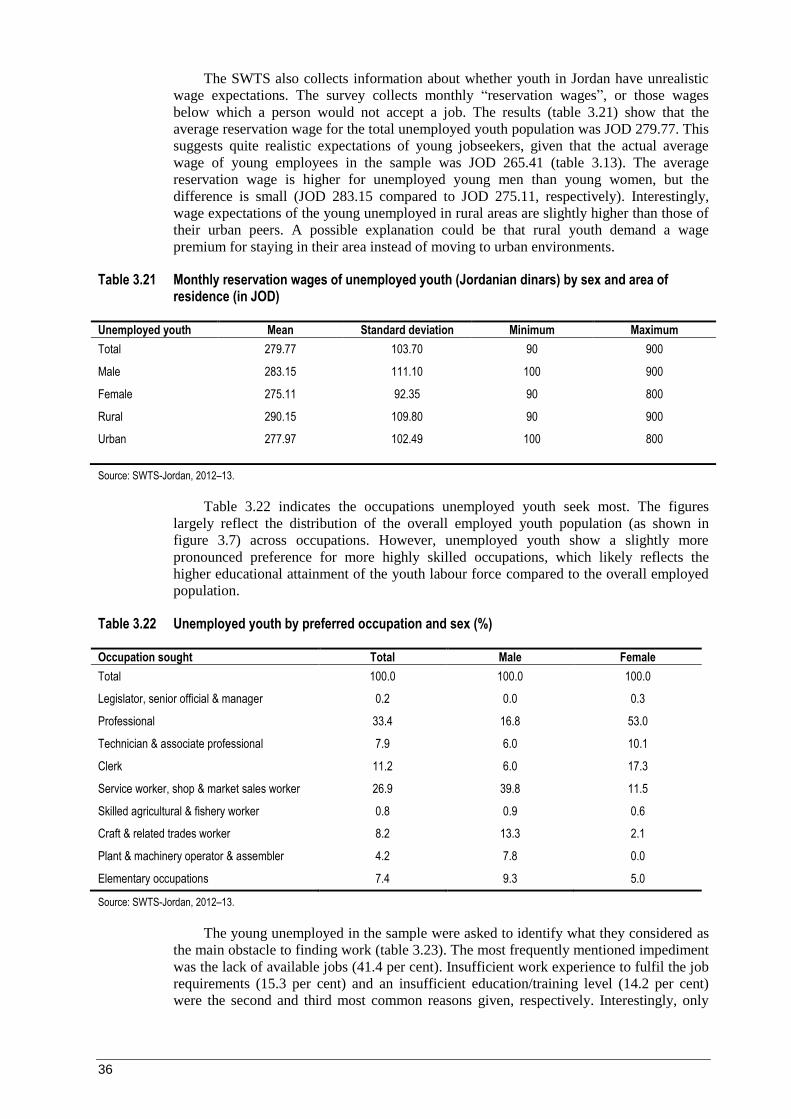
36
The SWTS also collects information about whether youth in Jordan have unrealistic
wage expectations. The survey collects monthly “reservation wages”, or those wages
below which a person would not accept a job. The results (table 3.21) show that the
average reservation wage for the total unemployed youth population was JOD 279.77. This
suggests quite realistic expectations of young jobseekers, given that the actual average
wage of young employees in the sample was JOD 265.41 (table 3.13). The average
reservation wage is higher for unemployed young men than young women, but the
difference is small (JOD 283.15 compared to JOD 275.11, respectively). Interestingly,
wage expectations of the young unemployed in rural areas are slightly higher than those of
their urban peers. A possible explanation could be that rural youth demand a wage
premium for staying in their area instead of moving to urban environments.
Table 3.21 Monthly reservation wages of unemployed youth (Jordanian dinars) by sex and area of residence (in JOD)
Unemployed youth Mean Standard deviation Minimum Maximum
Total 279.77 103.70 90 900
Male 283.15 111.10 100 900
Female 275.11 92.35 90 800
Rural 290.15 109.80 90 900
Urban 277.97 102.49 100 800
Source: SWTS-Jordan, 2012–13.
Table 3.22 indicates the occupations unemployed youth seek most. The figures
largely reflect the distribution of the overall employed youth population (as shown in
figure 3.7) across occupations. However, unemployed youth show a slightly more
pronounced preference for more highly skilled occupations, which likely reflects the
higher educational attainment of the youth labour force compared to the overall employed
population.
Table 3.22 Unemployed youth by preferred occupation and sex (%)
Occupation sought Total Male Female
Total 100.0 100.0 100.0
Legislator, senior official & manager 0.2 0.0 0.3
Professional 33.4 16.8 53.0
Technician & associate professional 7.9 6.0 10.1
Clerk 11.2 6.0 17.3
Service worker, shop & market sales worker 26.9 39.8 11.5
Skilled agricultural & fishery worker 0.8 0.9 0.6
Craft & related trades worker 8.2 13.3 2.1
Plant & machinery operator & assembler 4.2 7.8 0.0
Elementary occupations 7.4 9.3 5.0
Source: SWTS-Jordan, 2012–13.
The young unemployed in the sample were asked to identify what they considered as
the main obstacle to finding work (table 3.23). The most frequently mentioned impediment
was the lack of available jobs (41.4 per cent). Insufficient work experience to fulfil the job
requirements (15.3 per cent) and an insufficient education/training level (14.2 per cent)
were the second and third most common reasons given, respectively. Interestingly, only

37
0.5 per cent of respondents indicated that being male or female represented an obstacle.
Given the high labour market segregation based on gender, jobseekers do not venture out
of the traditional occupational boundaries and pre-select suitable job opportunities before
trying to pursue them.
Table 3.23 Unemployed youth by main obstacles to finding work
Obstacle %
Total 100.0
Requirements for job were higher than education/training received 14.2
Not enough work experience 15.3
Not enough jobs available 41.4
Considered too young 2.9
Being male/female 0.5
Discriminatory prejudices 5.0
Low wages in available jobs 8.6
Poor working conditions in available jobs 6.2
Did not know how or where to seek work 0.4
Other 5.6
Source: SWTS-Jordan, 2012–13.
3.7 Characteristics of youth outside the labour market (inactive youth)
As indicated in table 3.6, 60.6 per cent of the surveyed youth in Jordan were inactive.
This percentage becomes more meaningful when disaggregated by sex, revealing that 64.0
per cent of youth outside the labour market were female and 36.0 per cent were male.
According to the results shown in table 3.24, the dominant reason for inactivity was
participation in education and training (69.6 per cent), accounting for almost the totality
(92.1 per cent) of young men and more than one-half (57.0 per cent) of young women
outside the labour force. The second most frequently mentioned reason was family and
household responsibilities although, unlike education, this was an almost exclusively
female reason. It was responsible for inactivity among women in nearly one-third of cases
(32.1 per cent), but was negligible as a reason among men (0.3 per cent).
Table 3.24 Economically inactive youth by reasons for remaining out of the workforce and sex (%)
Reason Total Male Female
Total 100.0 100.0 100.0
Education & training 69.6 92.1 57.0
Family & household responsibilities 20.7 0.3 32.1
Pregnancy 0.2 0.0 0.3
Illness, injury or handicap 1.3 2.2 0.8
Below working age 0.1 0.1 0.1
Lack of desire to work 4.3 1.0 6.1
Other 3.9 4.2 3.6
Source: SWTS-Jordan, 2012–13.

38
Current students and preferred fields of study
At the time of the survey, students constituted 42.9 per cent of Jordan’s youth
population. Among students, 92.5 per cent were determined to complete higher education
(67.7 per cent tertiary and 24.8 per cent other tertiary), and 4.0 per cent expected to
complete secondary education.
Table 3.25 Current students by preferred field of study and sex (%)
Field of study Total Male Female
Total 100.0 100.0 100.0
General programmes 5.7 7.4 3.9
Education & teaching 12.2 6.0 18.2
Humanities & arts 7.7 4.5 10.9
Social science 24.1 25.8 22.6
Science 12.0 13.0 11.2
Engineering, manufacturing 20.7 28.7 12.8
Agriculture 0.9 1.1 0.8
Health & welfare 11.9 7.0 16.7
Services 3.5 5.0 2.0
Other 1.2 1.5 0.9
Source: SWTS-Jordan, 2012–13.
The survey asked current students to identify their preferred field of study. The most
frequently mentioned field (by 24.1 per cent) was social science (table 3.25). Results for
males and females for this field were rather close, and likely reflected similar aspirations of
finding a government job. For all other educational fields, preferences tended to differ
between the sexes. Engineering and manufacturing was the most preferred field of male
respondents (28.7 per cent). Interestingly, it is the field of choice for 12.8 per cent of
young women, a positive sign for overcoming traditional, gender-based stereotypes on
“appropriate” sectors of Jordanian employment. Young women tended to prefer
engineering and manufacturing more than science, humanities and arts, general
programmes, services and agriculture. Not surprisingly, education and teaching ranked
high among female preferences as the second most mentioned (accounting for 18.2 per
cent of respondents), followed by health and welfare at 16.7 per cent. In contrast, only 6.0
per cent of young men considered education and teaching as their preferred field of study,
and only 7.0 per cent of them mentioned health and welfare.
4. Stages of transition
In the preceding sections, the situation of Jordan’s youth, whether employed,
unemployed or inactive, was analysed, and their characteristics in each of these categories
were examined. This section looks at another means of classifying youth, based on where
they stand in their transition to the labour market. The labour market transition of young
people concerns not only the length of time between their exit from education (either upon
graduation or early exit without completion) and their first job, but also qualitative
elements, such as whether the job is stable (measured by contract type). Specifically, this
section covers the concepts and definitions of labour market transition; the stages of
transition by sex, education level, age group and area of residence; youth who have not yet
started the transition or are in transition and the characteristics of a completed transition;
and transition paths and lengths.
39
4.1 Concepts and definitions12
Labour market transition is defined as the passage of a young person from the end of
schooling (or entry to first economic activity) to the first stable or satisfactory job. Stable
employment is defined in terms of the employment contract (written or oral) and the
contract duration (greater than 12 months). Introducing the issue of a contract
automatically excludes the employment status of self-employed, where the employment
relationship is not defined by a contract. The opposite of stable employment is temporary
employment, or wage and salaried employment of limited duration. Satisfactory
employment is a subjective concept, based on the self-assessment of the jobholder. It
implies that the respondent considers the job to be a good “fit” with their desired
employment path at that moment in time. The contrary is termed non-satisfactory
employment, implying a sense of dissatisfaction with the job. Based on this definition of
labour market transition, the stages of transition are classified as follows:
Transited – A young person who has “transited” is one who is currently employed in:
- a stable job, whether satisfactory or non-satisfactory; or
- a satisfactory but temporary job; or
- satisfactory self-employment.
In transition – A young person still “in transition” is one who is currently:
- unemployed (relaxed definition); or
- employed in a temporary and non-satisfactory job; or
- in non-satisfactory self-employment; or
- inactive and not in school, with an aim to look for work later.
Transition not yet started – A young person whose “transition has not yet started” is one
who is currently:
- still in school and inactive (inactive student); or
- inactive and not in school (inactive non-student), with no intention of looking for
work.
Two elements of this classification are noteworthy. First, the stages of transition span
across the boundaries of economic activity as defined in the standard labour force
framework.13
The “transited” category includes a sub-set of youth classified as employed;
the remaining employed fall within the category of “in transition”, which includes those
who fall under the strict definition of unemployed and portions of the inactive (namely,
those without work, available for work but not actively seeking work14
and inactive non-
students who have stated an intention to join the labour force at a later stage). The
“transition not yet started” category is the residual of the inactive population.
Second, the stages of transition are not intended to be a normative framework.
Because of the inclusion of youth in satisfactory self-employment and satisfactory
12
This section is adapted from ILO (2013a), Chapter 5.
13 The international guidelines for measuring statistics on the economically active population, set
out by the 13th International Conference of Labour Statisticians (ICLS) in 1982, provide the
framework for measuring who is counted as employed and as unemployed according to the
economic production boundaries set out by the System of National Accounts.
14 This is the portion added to the “strictly” unemployed category to make up the unemployed
(relaxed definition).
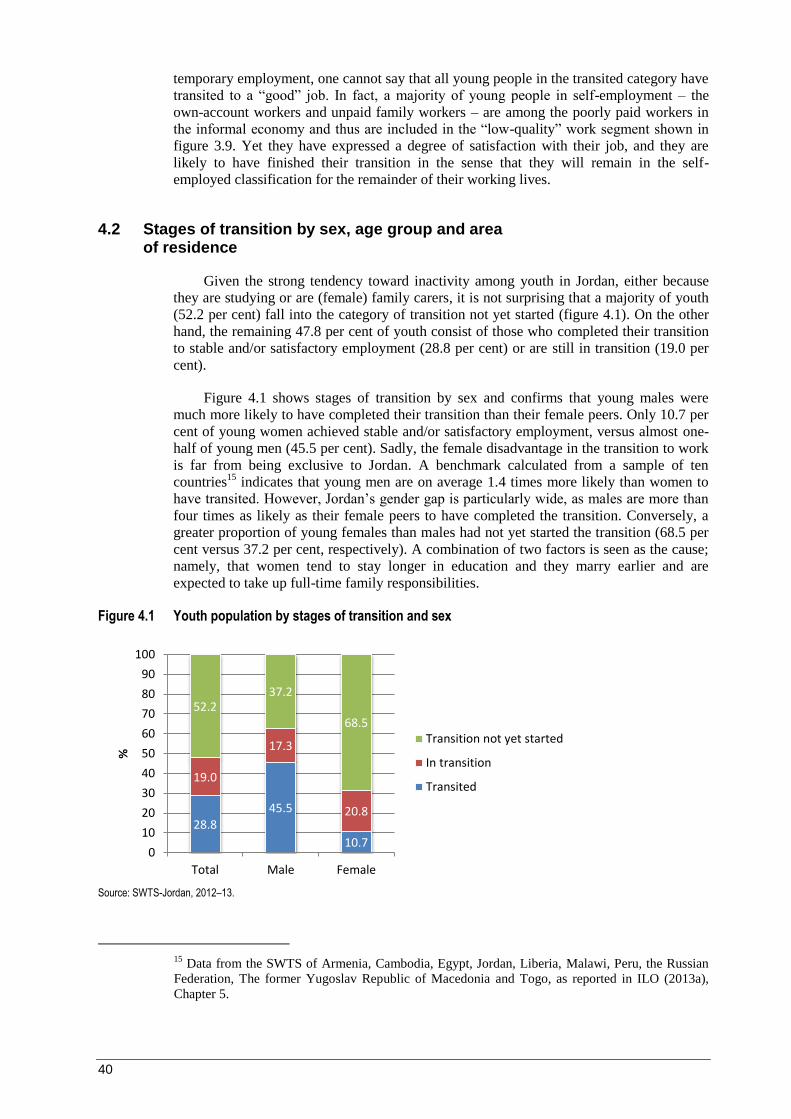
40
temporary employment, one cannot say that all young people in the transited category have
transited to a “good” job. In fact, a majority of young people in self-employment – the
own-account workers and unpaid family workers – are among the poorly paid workers in
the informal economy and thus are included in the “low-quality” work segment shown in
figure 3.9. Yet they have expressed a degree of satisfaction with their job, and they are
likely to have finished their transition in the sense that they will remain in the self-
employed classification for the remainder of their working lives.
4.2 Stages of transition by sex, age group and area of residence
Given the strong tendency toward inactivity among youth in Jordan, either because
they are studying or are (female) family carers, it is not surprising that a majority of youth
(52.2 per cent) fall into the category of transition not yet started (figure 4.1). On the other
hand, the remaining 47.8 per cent of youth consist of those who completed their transition
to stable and/or satisfactory employment (28.8 per cent) or are still in transition (19.0 per
cent).
Figure 4.1 shows stages of transition by sex and confirms that young males were
much more likely to have completed their transition than their female peers. Only 10.7 per
cent of young women achieved stable and/or satisfactory employment, versus almost one-
half of young men (45.5 per cent). Sadly, the female disadvantage in the transition to work
is far from being exclusive to Jordan. A benchmark calculated from a sample of ten
countries15
indicates that young men are on average 1.4 times more likely than women to
have transited. However, Jordan’s gender gap is particularly wide, as males are more than
four times as likely as their female peers to have completed the transition. Conversely, a
greater proportion of young females than males had not yet started the transition (68.5 per
cent versus 37.2 per cent, respectively). A combination of two factors is seen as the cause;
namely, that women tend to stay longer in education and they marry earlier and are
expected to take up full-time family responsibilities.
Figure 4.1 Youth population by stages of transition and sex
Source: SWTS-Jordan, 2012–13.
15
Data from the SWTS of Armenia, Cambodia, Egypt, Jordan, Liberia, Malawi, Peru, the Russian
Federation, The former Yugoslav Republic of Macedonia and Togo, as reported in ILO (2013a),
Chapter 5.
28.8
45.5
10.7
19.0
17.3
20.8
52.2 37.2
68.5
0
10
20
30
40
50
60
70
80
90
100
Total Male Female
% Transition not yet started
In transition
Transited

41
Not surprisingly, of the transited youth surveyed, 86.2 per cent belonged to the upper-
age groups (table 4.1). On the other hand, the majority (63.9 per cent) of youth who had
not yet started the transition were aged 15–19, the typical school age for those who attain
secondary education. This age group was also significantly represented among youth in
transition (29.9 per cent) and accounted for a minor share of those transited (13.8 per cent).
Transited youth were predominantly male (82.1 per cent), while young women accounted
for a large share (63.0 per cent) of youth whose transition had not yet started. Those in
transition were quite evenly divided between the sexes. With regard to urban or rural area
of residence, the distribution of youth was consistent across the three transition categories
and matched the distribution of the country's overall population.
Table 4.1 Youth population by stage of transition and selected characteristics (%)
Characteristic Stage of transition
Transited In transition Transition not yet started
Age group 100.0 100.0 100.0
15–19 13.8 29.9 63.9
20–24 44.4 42.4 24.3
25–29 41.8 27.7 11.8
Sex 100.0 100.0 100.0
Male 82.1 47.5 37.0
Female 17.9 52.5 63.0
Area of residence 100.0 100.0 100.0
Urban 81.8 81.0 82.2
Rural 18.2 19.0 17.8
Source: SWTS-Jordan, 2012–13.
4.2.1 Youth who have not yet started the transition
The results of the SWTS show that most of the youth population (76.2 per cent) that
had not yet started the transition was in education (inactive students), while the remaining
youth (23.8 per cent) were inactive non-students with no intention of looking for work.
The students were quite evenly split between males and females (47.4 per cent and 52.6
per cent, respectively). Conversely, the inactive non-students with no intention to work
were virtually all female (96.4 per cent). This is because of the traditional roles of Jordan’s
women, who are expected to give priority to their family responsibilities despite the fact
that they may have completed their education and been potentially ready for the labour
market.
4.2.2 Youth in transition
A young person is classified as in transition if they are either unemployed (relaxed
definition), engaged in self-employment or in a paid temporary job that they have
expressed dissatisfaction with, or are an inactive non-student with an attachment to the
labour market, indicated by their desire to work in the future. Interestingly, figure 4.2
shows that the largest share (67.5 per cent) of surveyed youth in transition was classified as
such because they were unemployed. A further 26.3 per cent were inactive non-students
with an attachment to the labour market, and only a limited proportion (6.2 per cent) was
in non-satisfactory temporary employment or in self-employment. These results point at
the low tendency of young people in Jordan to quickly accept sub-optimal work
opportunities. The data reviewed so far suggest that youth are likely to place a high value

42
on stable employment and, until the possibility to achieve it presents itself, they would
rather keep searching or wait for future opportunities to arise.
Young men were relatively more likely to be in transition due to unemployment (77.2
per cent of those in transition) than young women (58.8 per cent). It is not surprising to
find that a much larger share of women than men (38.6 per cent versus 12.8 per cent,
respectively) were in the category of inactive non-students with an aim to look for work in
the future. It can be argued that women in this group had recently taken up family caring
duties and had taken a break from their economic activity, hoping to enter the labour
market later on. Interestingly, 10.1 per cent of young males in transition were in the sub-
category of non-satisfactory self-employment or temporary employment. This is quite a
low result and confirms the findings discussed earlier in this report about the high rates of
regular employment and low self-employment among Jordan’s youth. The percentage of
women in this category was only 2.6 per cent.
Figure 4.2 also provides a disaggregation of survey results by area of residence and
level of household income. No discernible difference was seen in the distribution of youth
across transition stages in urban versus rural areas. The disaggregation of results by
income level reveals that youth from poor households had a much lower propensity to be
inactive non-students and a much higher tendency to accept non-satisfactory employment
than well-off youth. The proportion of inactive youth among those transitioning in higher-
income (“well-off”) households was more than three times greater than the proportion in
poor households. However, youth in transition in well-off households were only half as
likely to have accepted a non-satisfactory job as their poorer peers. The results for all
income levels, except for the fairly well-off category, seem to confirm that the tendency
towards inactivity increases with income, while readiness to accept sub-optimal
employment diminishes as household income grows.
Figure 4.2 Youth in transition by sub-category and area of residence, household income level and sex
Source: SWTS-Jordan, 2012–13.
4.3 Characteristics of a completed transition
Figure 4.3 shows, as would be expected, that by far the largest share of transited
youth surveyed consisted of males. While young men accounted for 82.2 per cent, young
women represented only 17.8 per cent of those transited. Women were underrepresented in
each sub-category of transited youth, and particularly among those that included the
67.5
77.2
58.8
60.9
76.2
64.3
69.6
77.4
68.0
65.7
6.2
10.1
2.6
5.4
5.9
6.2
6.3
12.8
5.8
7.7
26.3
12.8
38.6
33.7
17.9
29.5
24.1
9.7
26.2
26.7
0 20 40 60 80 100
Total
Male
Female
Well off
Fairly well off
Average
Fairly poor
Poor
Urban
Rural
%
Relaxed unemployed
Non-satisfactory self-employment or temporaryemployment
Inactive non-studentswith plans to work infuture

43
achievement of a stable job. These results reflect the overall underrepresentation of women
in the economically active population.
Figure 4.3 Transited youth by sub-category and sex
Source: SWTS-Jordan, 2012–13.
Figure 4.4 shows that, overall, the transited youth surveyed were mostly in stable and
satisfactory employment (92.9 per cent). The disaggregation by sex reveals that a transited
young woman in Jordan was slightly more likely to be in satisfied and stable employment
than a transited young man. However, it is important to point out that the proportion of
transited young women was limited to 10.7 per cent of all young women surveyed (figure
4.1). The educational attainment of the transited women was mostly tertiary-level (72.3 per
cent). These elements suggest that young women who complete their transitions to
satisfactory and/or stable employment belong to a highly educated elite that has access to
the few best-quality jobs available.
Figure 4.4 Transited youth by sub-category and level of completed education, area of residence, household income level and sex
Note: Statistics on level of completed education exclude current students. Source: SWTS-Jordan, 2012–13.
98.7
63.3
87.0
81.1
82.2
1.3
36.7
13.0
18.9
17.8
0 20 40 60 80 100
Satisfactory self-employment
Satisfactory but temporaryemployment
Stable and non-satisfactoryemployment
Stable and satisfactoryemployment
Total transited
%
Male
Female
92.9
92.6
94.4
92.4
93.8
91.7
98.1
100.0
92.3
95.4
86.4
92.9
87.1
94.5
95.3
91.5
7.1
7.5
5.6
7.6
6.2
8.3
1.9
0.0
7.7
4.7
13.6
7.1
12.9
5.5
4.7
8.5
75 80 85 90 95 100
Total
Male
Female
Well off
Fairly well off
Average
Fairly poor
Poor
Urban
Rural
Less than primary
Primary
Vocational (secondary)
Secondary
Bachelor's and post-secondary vocational
Postgraduate studies
Sex
Ho
use
ho
ld in
com
ele
vel
Are
a o
fre
sid
ence
Edu
cati
on
alat
tain
me
nt
% In stable employment In satisfactory self-employment or temporary employment

44
Transited young men, on the other hand, made up 45.5 per cent of the surveyed young
males (figure 4.1). Over one-half of young men who had transited (53.2 per cent) achieved
primary-education level or less. This suggests that lower-skilled occupations, suitable for
men but not for women in Jordan’s society, may offer a larger scope of employment
opportunities than those which are open to young women.
The proportion of transited rural youth in stable employment was slightly higher than
that of their counterparts in urban areas. This is likely explained by the fact that, in rural
settings, there are few alternatives to public employment, which offers stable contracts. In
cities, on the other hand, there may be a relatively higher availability of short-term jobs
with private employers or in self-employment.
A breakdown of transited youth by educational attainment shows mixed results. The
survey findings suggest that higher educational achievement is frequently associated with
an increased likelihood of attaining stable employment. Besides those with less than
primary education, young people with secondary-level vocational education made up the
highest share of those in self- or temporary employment (12.9 per cent). The
disaggregation of findings by household income shows that, interestingly, young people
from poor and fairly poor families had the largest proportion in stable employment (100.0
per cent and 98.1 per cent, respectively) compared to other income levels. In fact, the
lowest income group had no youth in self- or temporary employment, and only 1.9 per cent
of the second-lowest income level were in this sub-category. The likelihood was higher
among the other income groups, ranging from 6.2 per cent among the fairly well-off youth
and 8.3 per cent among the youth from average income households.
Table 4.2 shows the distribution of the transited youth surveyed across sectors of
employment. As expected, transited youth were primarily in the public administration and
defence and compulsory social security sector, where almost one-third (31.9 per cent) were
employed. The second largest share of transited youth was employed in the wholesale and
retail sector (16.4 per cent), and the third largest in manufacturing (10.2 per cent).
Table 4.2 Transited youth by employment sector according to 1-digit ISCO categorization
Sector of employment %
Agriculture, forestry & fishing 1.0
Manufacturing 10.2
Construction 5.8
Wholesale & retail trade; repair of motor vehicles & motorcycles 16.4
Transportation & storage 4.1
Accommodation & food service activities 3.6
Professional, scientific & technical activities 2.1
Public administration & defence, compulsory social security 31.9
Education 9.8
Human health & social work activities 6.5
Other service activities 2.3
Note: Sectors employing less than 2 per cent of the total are not reported in this table. Source: SWTS-Jordan, 2012–13.
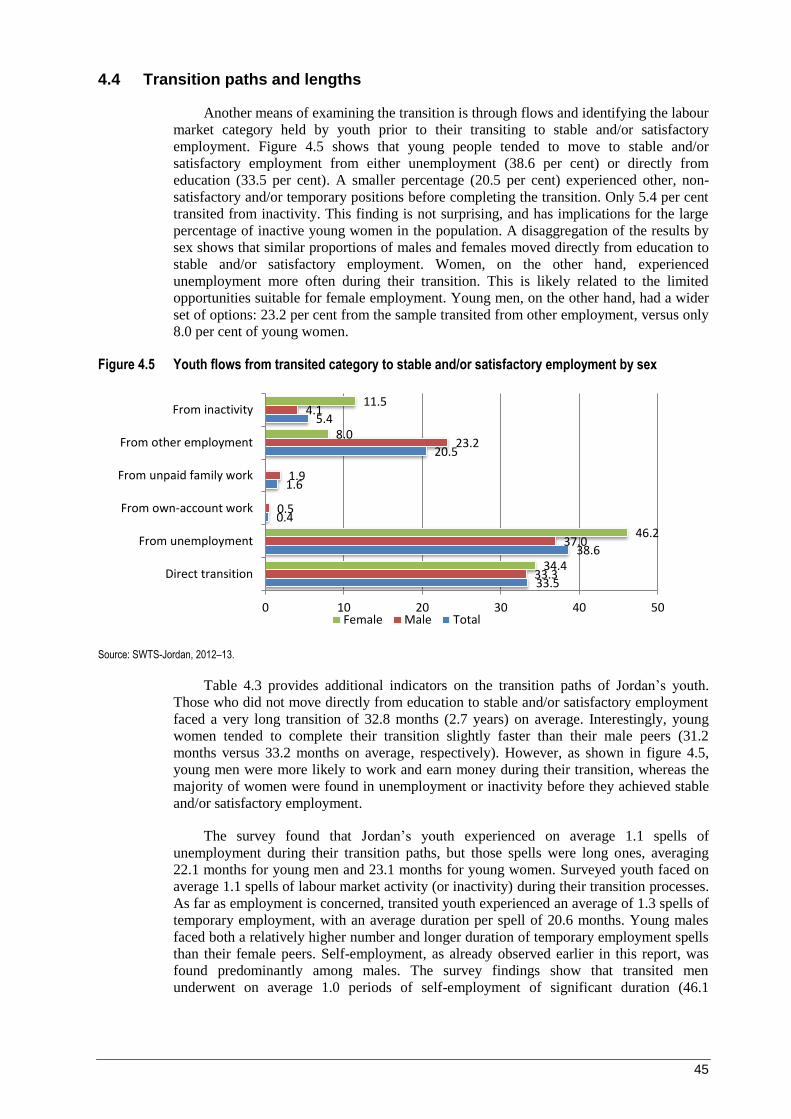
45
4.4 Transition paths and lengths
Another means of examining the transition is through flows and identifying the labour
market category held by youth prior to their transiting to stable and/or satisfactory
employment. Figure 4.5 shows that young people tended to move to stable and/or
satisfactory employment from either unemployment (38.6 per cent) or directly from
education (33.5 per cent). A smaller percentage (20.5 per cent) experienced other, non-
satisfactory and/or temporary positions before completing the transition. Only 5.4 per cent
transited from inactivity. This finding is not surprising, and has implications for the large
percentage of inactive young women in the population. A disaggregation of the results by
sex shows that similar proportions of males and females moved directly from education to
stable and/or satisfactory employment. Women, on the other hand, experienced
unemployment more often during their transition. This is likely related to the limited
opportunities suitable for female employment. Young men, on the other hand, had a wider
set of options: 23.2 per cent from the sample transited from other employment, versus only
8.0 per cent of young women.
Figure 4.5 Youth flows from transited category to stable and/or satisfactory employment by sex
Source: SWTS-Jordan, 2012–13.
Table 4.3 provides additional indicators on the transition paths of Jordan’s youth.
Those who did not move directly from education to stable and/or satisfactory employment
faced a very long transition of 32.8 months (2.7 years) on average. Interestingly, young
women tended to complete their transition slightly faster than their male peers (31.2
months versus 33.2 months on average, respectively). However, as shown in figure 4.5,
young men were more likely to work and earn money during their transition, whereas the
majority of women were found in unemployment or inactivity before they achieved stable
and/or satisfactory employment.
The survey found that Jordan’s youth experienced on average 1.1 spells of
unemployment during their transition paths, but those spells were long ones, averaging
22.1 months for young men and 23.1 months for young women. Surveyed youth faced on
average 1.1 spells of labour market activity (or inactivity) during their transition processes.
As far as employment is concerned, transited youth experienced an average of 1.3 spells of
temporary employment, with an average duration per spell of 20.6 months. Young males
faced both a relatively higher number and longer duration of temporary employment spells
than their female peers. Self-employment, as already observed earlier in this report, was
found predominantly among males. The survey findings show that transited men
underwent on average 1.0 periods of self-employment of significant duration (46.1
33.5
38.6
0.4
1.6
20.5
5.4
33.3
37.0
0.5
1.9
23.2
4.1
34.4
46.2
8.0
11.5
0 10 20 30 40 50
Direct transition
From unemployment
From own-account work
From unpaid family work
From other employment
From inactivity
Female Male Total
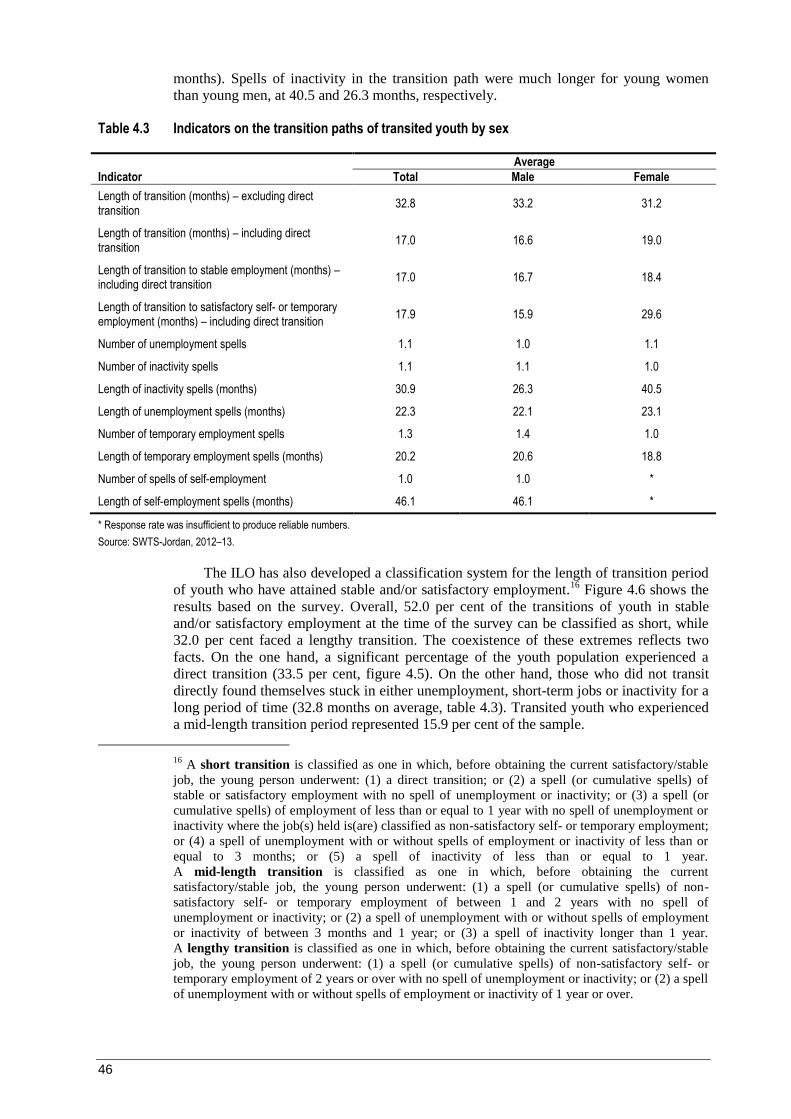
46
months). Spells of inactivity in the transition path were much longer for young women
than young men, at 40.5 and 26.3 months, respectively.
Table 4.3 Indicators on the transition paths of transited youth by sex
Average
Indicator Total Male Female
Length of transition (months) – excluding direct transition
32.8 33.2 31.2
Length of transition (months) – including direct transition
17.0 16.6 19.0
Length of transition to stable employment (months) – including direct transition
17.0 16.7 18.4
Length of transition to satisfactory self- or temporary employment (months) – including direct transition
17.9 15.9 29.6
Number of unemployment spells 1.1 1.0 1.1
Number of inactivity spells 1.1 1.1 1.0
Length of inactivity spells (months) 30.9 26.3 40.5
Length of unemployment spells (months) 22.3 22.1 23.1
Number of temporary employment spells 1.3 1.4 1.0
Length of temporary employment spells (months) 20.2 20.6 18.8
Number of spells of self-employment 1.0 1.0 *
Length of self-employment spells (months) 46.1 46.1 *
* Response rate was insufficient to produce reliable numbers.
Source: SWTS-Jordan, 2012–13.
The ILO has also developed a classification system for the length of transition period
of youth who have attained stable and/or satisfactory employment.16
Figure 4.6 shows the
results based on the survey. Overall, 52.0 per cent of the transitions of youth in stable
and/or satisfactory employment at the time of the survey can be classified as short, while
32.0 per cent faced a lengthy transition. The coexistence of these extremes reflects two
facts. On the one hand, a significant percentage of the youth population experienced a
direct transition (33.5 per cent, figure 4.5). On the other hand, those who did not transit
directly found themselves stuck in either unemployment, short-term jobs or inactivity for a
long period of time (32.8 months on average, table 4.3). Transited youth who experienced
a mid-length transition period represented 15.9 per cent of the sample.
16
A short transition is classified as one in which, before obtaining the current satisfactory/stable
job, the young person underwent: (1) a direct transition; or (2) a spell (or cumulative spells) of
stable or satisfactory employment with no spell of unemployment or inactivity; or (3) a spell (or
cumulative spells) of employment of less than or equal to 1 year with no spell of unemployment or
inactivity where the job(s) held is(are) classified as non-satisfactory self- or temporary employment;
or (4) a spell of unemployment with or without spells of employment or inactivity of less than or
equal to 3 months; or (5) a spell of inactivity of less than or equal to 1 year.
A mid-length transition is classified as one in which, before obtaining the current
satisfactory/stable job, the young person underwent: (1) a spell (or cumulative spells) of non-
satisfactory self- or temporary employment of between 1 and 2 years with no spell of
unemployment or inactivity; or (2) a spell of unemployment with or without spells of employment
or inactivity of between 3 months and 1 year; or (3) a spell of inactivity longer than 1 year.
A lengthy transition is classified as one in which, before obtaining the current satisfactory/stable
job, the young person underwent: (1) a spell (or cumulative spells) of non-satisfactory self- or
temporary employment of 2 years or over with no spell of unemployment or inactivity; or (2) a spell
of unemployment with or without spells of employment or inactivity of 1 year or over.
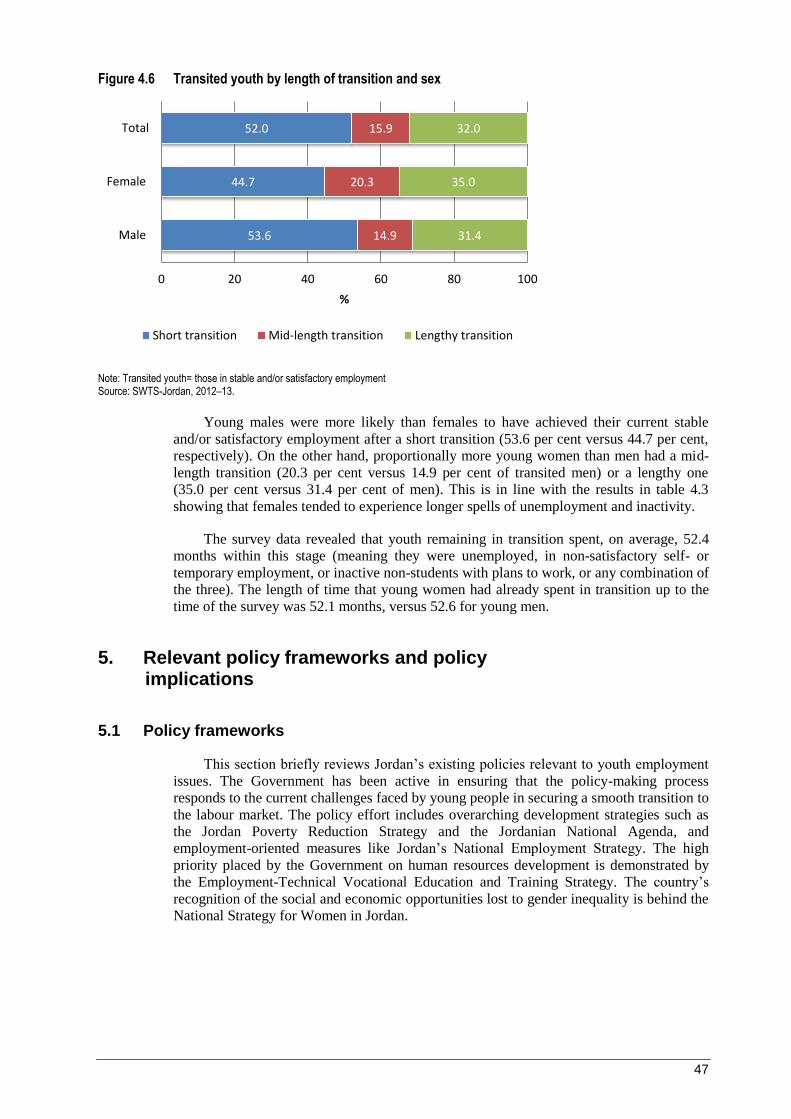
47
Figure 4.6 Transited youth by length of transition and sex
Note: Transited youth= those in stable and/or satisfactory employment Source: SWTS-Jordan, 2012–13.
Young males were more likely than females to have achieved their current stable
and/or satisfactory employment after a short transition (53.6 per cent versus 44.7 per cent,
respectively). On the other hand, proportionally more young women than men had a mid-
length transition (20.3 per cent versus 14.9 per cent of transited men) or a lengthy one
(35.0 per cent versus 31.4 per cent of men). This is in line with the results in table 4.3
showing that females tended to experience longer spells of unemployment and inactivity.
The survey data revealed that youth remaining in transition spent, on average, 52.4
months within this stage (meaning they were unemployed, in non-satisfactory self- or
temporary employment, or inactive non-students with plans to work, or any combination of
the three). The length of time that young women had already spent in transition up to the
time of the survey was 52.1 months, versus 52.6 for young men.
5. Relevant policy frameworks and policy implications
5.1 Policy frameworks
This section briefly reviews Jordan’s existing policies relevant to youth employment
issues. The Government has been active in ensuring that the policy-making process
responds to the current challenges faced by young people in securing a smooth transition to
the labour market. The policy effort includes overarching development strategies such as
the Jordan Poverty Reduction Strategy and the Jordanian National Agenda, and
employment-oriented measures like Jordan’s National Employment Strategy. The high
priority placed by the Government on human resources development is demonstrated by
the Employment-Technical Vocational Education and Training Strategy. The country’s
recognition of the social and economic opportunities lost to gender inequality is behind the
National Strategy for Women in Jordan.
53.6
44.7
52.0
14.9
20.3
15.9
31.4
35.0
32.0
0 20 40 60 80 100
Male
Female
Total
%
Short transition Mid-length transition Lengthy transition
48
Jordan Poverty Reduction Strategy 2013 and action plan
The new Poverty Reduction Strategy (PRS) was approved in 2013 to contain and
reduce poverty, vulnerability and inequality in Jordan’s socio-economic environment
through 2013 by adopting a holistic and results-oriented approach, which targets poor and
below-middle-class households.
The specific goals that the Government of Jordan aims to achieve through the strategy
are to:
1. better harmonize all public, private and civil society poverty-reduction
programming;
2. deliver expanded, increasingly aligned and better-targeted social protection
measures to members of poor and vulnerable households;
3. provide more gainful employment to Jordanians, especially youth, women
and people with disabilities;
4. work towards the elimination of child labour;
5. provide micro- and small-business incentives and more effective
microfinance to male and female members of poor and vulnerable
households;
6. supply more accessible and affordable basic health services to male and
female members of poor and vulnerable households, the elderly and people
with disabilities;
7. supply more accessible basic education services and more effective
vocational training to male and female members of poor and vulnerable
households, the elderly and people with disabilities;
8. alleviate the impacts of climate change and environmental degradation upon
the members of poor and vulnerable households; and
9. provide improved transport, housing and utilities to members of poor and
vulnerable households.
The strategy requires resource mobilization for its implementation across a range of
ministries and public agencies, as well as the establishment of new institutional
arrangements. For instance, the strategy establishes a “PRS Unit”, with the responsibility
to work closely with the DOS to ensure that the necessary data and technical supports are
in place to enable development, monitoring and evaluation of the strategy. The Unit also
has the role of coordinating with public agencies to ensure availability of necessary data,
facilitating improved measurement of policy outcomes, and developing synergies. Within
the strategy, the Ministry of Planning and International Cooperation is responsible for
providing the Unit with detailed training on monitoring and evaluation, and will generally
support the Ministry of Social Development in implementing the PRS. Given the cross-
cutting nature of both poverty and the necessary policy responses, the strategy envisages
the creation of a PRS implementation group consisting of senior public servants from the
key public agencies involved in the strategy's implementation. The group is chaired by the
Prime Minister, and includes representatives from several ministries.
Following the official approval of the PRS, a detailed action plan will be developed.
The plan is expected to set out, in detail, the specific actions to be taken, to identify the
agency (or agencies) responsible for implementation of different actions, and to identify
resource requirements. The action plan should also include a detailed monitoring and
evaluation framework, identifying key performance indicators against which
implementation will be assessed, as well as poverty reduction indicators monitoring the
achievement of the PRS outcomes and relevant Millennium Development Goals.
49
Jordanian National Agenda (2006–2015)
Under King Abdullah II, Jordan has embarked upon an extensive socio-economic
reform strategy, the National Agenda, to address key economic and social development
issues over a decade. The Agenda’s aim is to achieve consistent policies and ensure they
will not be subject to Government changes, while taking into account the need to regularly
develop and update the policies. To monitor and report on its implementation by means of
key performance indicators, the Agenda established a Ministry of Government
Performance within the Prime Ministry.
The National Agenda foresees three phases of socio-economic development for
Jordan. The first phase spans a period of 5 years, and focuses on creating employment
opportunities by promoting export-oriented, labour-intensive industries, education,
infrastructure and legislation regulating political life. The second phase focuses on
gradually upgrading and strengthening the industrial base, and the third phase prepares the
ground for the development of high-value-added sectors in the knowledge economy.
The National Agenda introduced, for the first time in Jordan, a clear mechanism to
measure implementation of the initiatives and evaluate the impact of reforms. It also set
clear targets for each initiative, which have to be met over a period of 10 years, with
priorities reflected in the budget, supported by performance indicators to measure and
assess the degree of success of implementation.
Specifically regarding employment issues, the National Agenda includes reducing the
high rate of unemployment and addressing the mismatch between labour supply and
demand. It also advocates for the reinforcement of links between employment and training
to facilitate Jordanians’ inclusion in the labour market. In addition, the policy sets
quantitative overall targets, such as the number of new jobs to be created for both men and
women. Youth are a specific concern of the National Agenda, particularly in the sections
addressing issues of quality and relevance of education and training.
Jordan’s National Employment Strategy 2011–2020 and action plan
The National Employment Strategy (NES) is based on a comprehensive document
including analytical considerations on the main issues and priorities in the labour market,
and suggested ways forward under different scenarios.
The NES was prepared by a technical team that selected 69 different actions for
implementation. The criteria for selecting the actions, which were chosen from a total of
more than 160 considered, included a demonstration of a clear link of the action to either
reaching an outcome or reducing/eliminating a challenge; a significant impact on
employment; realism and feasibility; and complexity of implementation. Activities
requiring substantial coordination across sectors and ministries, as well as input from
stakeholders, were also included.
The strategy document is complemented by an action plan, which was approved by
the Council of Ministers in May 2011. The final action plan was then further elaborated
into an implementation plan, which outlined for each action the main public agency
responsible for oversight and delivery of the action, the other implementation partners, the
resources required and a timetable.
The strategy sets specific objectives for the demand and supply sides of the labour
market. On the demand side, the strategic goals are to enable the private sector to move up
the value chain and increase value added, to improve its productivity and to expand its
ability to export products and services. On the supply side, the goal is to graduate a skilled
and motivated labour force armed with employable skills and technical know-how as
demanded by the labour market. In addition, the strategy has institutional framework goals;
50
they address the ability of the Government to carry out strategic planning for policy
implementation, monitoring and evaluation, and to establish a social protection floor and
access to health insurance, independent of whether workers are in the public or private
sector, and regardless of the size of the enterprise.
Regarding youth, the strategy targets the main employment challenges faced by
young Jordanians. They include the transition from school to work, ensuring reliable and
updated labour market information, the relevance and quality of technical and/or
vocational skills and of general education, and the matching of labour demand and supply.
Employment-Technical Vocational Education and Training Strategy
The Employment-Technical Vocational Education and Training (E-TVET) Strategy
was introduced in 2006. While its main focus is human resources development (HRD), and
technical and vocational education and training in particular, the strategy also includes
employment objectives such as reducing the unemployment rate, especially among young
people. The strategy complements the more comprehensive HRD strategy approved by the
Cabinet in 1998.
A major feature of the strategy is its establishment of an E-TVET Council, which has
responsibility over planning, policy-making and coordination for employment and TVET
at the national level. In addition, the strategy aims to develop the role and involvement of
the current Employment and Training Fund in financing the various E-TVET systems,
programmes and services.
National Strategy for Women in Jordan 2012–2015
Over the last generation, Jordan has achieved significant progress in addressing
some gender challenges within Jordanian society. Mostly, such progress is noticeable in
education. Young women in the country show higher enrolment rates than young men, and
their performance tends to be higher. These results are a critical step in addressing the
gender gaps that characterize so many aspects of the social and economic life in Jordan.
However, the way towards equality of opportunity for both sexes is still long.
The National Strategy for Women in Jordan 2012–2015 aims to build on the
progress made and to further advance women's empowerment both economically and
politically. It includes several “strategy axes”, or areas for intervention, such as women
and education, women and health, and violence against women. The strategy sets targets
on women’s inclusion, including quantitative targets (e.g. unemployment rates of females
versus males, the number of self-employed women, the share of women in policy-making
positions).
The Jordanian National Commission for Women is responsible for studying
challenges in the execution of the strategy and finding solutions through cooperation with
concerned institutions. The commission is also responsible for activating coordination with
institutions and organizations concerned with women's affairs, including governmental
institutions, civil community organizations, the private sector and international donor
organizations.
5.2 Policy implications
While the policy efforts reviewed in the section above are impressive, the findings of
this report show that more needs to be done in addressing unemployment, issues of skills
mismatch and decent work deficits in the country. The survey results point to a labour
market that can offer good jobs, but to an insufficient number of youth. For those who do
not transit directly from higher education to a stable job, transitions are long and difficult.

51
The survey found that a combination of supply and demand-side factors is behind the
difficulties young people in Jordan face in entering the labour market. In formulating
policy responses, policy-makers need to take into account the multi-faceted nature of the
challenge. Areas of possible action include:
Job creation needs to be boosted. Most unemployed youth attribute their
difficulty finding work to the insufficient number of jobs available. The number of
new jobs produced by the public sector every year amounts to a fraction of the
labour market entrants. This means that the private sector needs to contribute more
prominently to the job creation capacity of the economy of Jordan. To this end, the
country should improve its capability to support the expansion of the private
sector. More needs to be done to offer an enabling environment for businesses to
establish themselves and thrive, including facilitating access to credit and to basic
services (such as access to electricity).
Access to education can be further expanded. Young people in Jordan enjoy
good access to education, including higher education. However, youth from poor
households still represent a minority of secondary graduates and only a minor
percentage of tertiary graduates. Ensuring that youth from lower-income families
can choose to access higher education will enable the country to take better
advantage of its talent pool, and will raise productivity. Most importantly, the
wage premium that comes with higher education will have a positive impact in
tackling Jordan’s poverty rate. The survey found that the average wage of young
employees increases consistently with educational attainment. The potential of
education should therefore be exploited fully, to break poverty traps and set
virtuous cycles of increased educational attainment and better quality employment.
Gender-based disparities in the labour market must be reduced. The survey
found that the vast majority of young women (80.7 per cent) were inactive, and
more than one-third of them were inactive and not in school. Young women were
also more likely to attain higher education than young men. These facts show that
forgoing women’s potential contribution to the Jordanian labour force represents
not only a social, but also an economic loss, since the investment made in female
education will not reap its economic fruit. Addressing gender gaps in the labour
market should start with a detailed collection of data on the multiplicity of
obstacles facing young women in their attempts to enter the labour market, or in
their daily work life. The nature of such barriers changes widely from urban to
rural areas and from city to city. More clarity is required on this subject in order
for policy-makers to design a pragmatic response. The National Strategy for
Women in Jordan is a step in the right direction to promote women’s inclusion and
monitor it against quantitative targets. However implementation has been patchy,
whereas it would require to be sustained by action and advocacy at all levels of
society and government institutions.
The potential of vocational education needs to be harnessed. Skills mismatch at
the time of the survey affected more than one-half of employed youth. Most of
these youth were found to be undereducated for the job they were performing. This
seems to confirm that the educational system in Jordan is not prepared to equip
young people with the skills required by medium-skilled occupations. Mostly,
education caters for the requirements of public sector employment, which absorbs
highly-educated jobseekers. The very small share of youth attending or completing
vocational education is an additional sign of missing skills within the youth labour
force. Attracting more young people to vocational education should remain a
priority for the Government of Jordan. A high-quality vocational education, which
leads to good jobs, will gain popularity among young people and their families, as
they see that graduates move smoothly into employment. In order to ensure female

52
participation, vocational education must be equally organized in sectors of interest
to young women.
Youth need to be introduced to business concepts. Only 2.8 per cent of young
workers in the survey were classified as own-account workers and another 1.7 per
cent as employers. More than half of the self-employed youth have completed only
primary education. While low numbers of enterprises run by youth is not
surprising in a middle-income country where paid job opportunities are frequently
available, age alone cannot explain such low figures. Entrepreneurship is not
significantly higher among adults in the country. In order to succeed in expanding
its private sector, the country should make efforts to nurture the entrepreneurial
culture among youth in school. The “business acumen” required to become an
entrepreneur can be instilled in students so that they might consider starting up a
business as a viable option later in life. In addition, an adequate range of highly
professional business support services can be set up, including incubators that
combine mentorship, access to finance, and even provision of office space.
Furthermore, in a context like Jordan, raising the attractiveness of entrepreneurship
among young people themselves as well as their families must play a critical role.
Experience in other countries has shown that promotional campaigns around
stories of successful entrepreneurs can inspire youth toward this career option.
Needless to say, these efforts can only be successful if accompanied by reform to
improve the business enabling environment, as discussed earlier.
Access to basic rights at work needs to be extended to all youth. More than
one-half of youth is in informal employment according to the survey results. Most
of the informally employed worked for a formally registered employer, but did not
have access to a basic set of benefits. The response to this problem is two-fold.
First, policy-makers need to strengthen the provision of rights at work through
legislation and set up an adequate system of incentives for employers to hire young
people in decent jobs. Second, the enforcement of legislation needs to be
monitored effectively through mechanisms of labour inspection.

53
References
Deshingkar, P.; Sward, J.; Estruch-Puertas, E. 2012. “Decent work country programmes
and human mobility”, Migrating out of Poverty Research Programme Consortium Working
Paper No. 5, Mar. (Brighton, University of Sussex).
European University Institute (EUI). 2013. “Migration Profile: Jordan”, June.
Gregg, P.; Tominey, E. 2005. “The wage scar from male youth unemployment”, Labour
Economics, Issue 12, pp. 487–509.
International Conference of Labour Statisticians (ICLS). 2013. Resolution concerning
statistics of work, employment and labour underutilization, adopted by the ICLS, 19th
Conference, Geneva, 2013 (Geneva).
International Labour Organization (ILO). 2010. A comparison of public and private sector
earnings in Jordan. Conditions of Work and Employment Series No. 24 (Geneva).
―. 2011. Key Indicators of the Labour Market (KILM), 7th Edition (Geneva).
―. 2012. Decent Work Country Programme 2012–2015 – Jordan, Mar. (Amman).
―. 2013a. Global Employment Trends for Youth 2013: A generation at risk (Geneva).
―. 2013b. Decent Work Country Profile – Jordan, Jan. (Geneva).
Jordan Department of Statistics (DOS). 2012. Jordan Statistical Yearbook 2012 (Amman).
―. 2013a. Jordan in Figures 2012, Issue 15, June, Table: “Population by Sex (000) and
Population Density (P/Km2) for Selected Years”. Available at:
www.dos.gov.jo/dos_home_a/jorfig/2012/3.pdf [5 May 2014].
―. 2013b. Employment And Unemployment Survey/Third round, 2013. Available at:
http://www.dos.gov.jo/dos_home_e/main/.
―; ICF International. 2013. Jordan Population and Family Health Survey, 2012, Mar.
Mroz, T.; Savage, T. 2006. “The Long-Term Effects of Youth Unemployment”, The
Journal of Human Resources, Vol. XLI, no. 2.
Mryyan, N. 2012. “Demographics, labor force participation and unemployment in Jordan”,
Working Paper No. 670, May (Dokki, The Economic Research Forum).
Shehu, E.; Nilsson, B. 2014. “Informal employment among youth: Evidence from 20
school-to-work transition surveys”, Work4Youth Publication Series No. 8, Feb. (Geneva,
ILO).
United Nations Development Programme (UNDP). 2013. Jordan Poverty Reduction
Strategy (Amman).
United Nations Division for Economic and Social Affairs (UNDESA). 2012. World
Population Prospects: The 2012 Revision (New York).
United Nations Educational, Scientific and Cultural Organization (UNESCO). 2013.
Education for All Global Monitoring Report 2013/14 (Paris).
The World Bank. 2013. Jordan Country Gender Assessment, Report No. ACS5158,
Poverty Reduction and Economic Management Unit, Middle East and North Africa
Region, July.

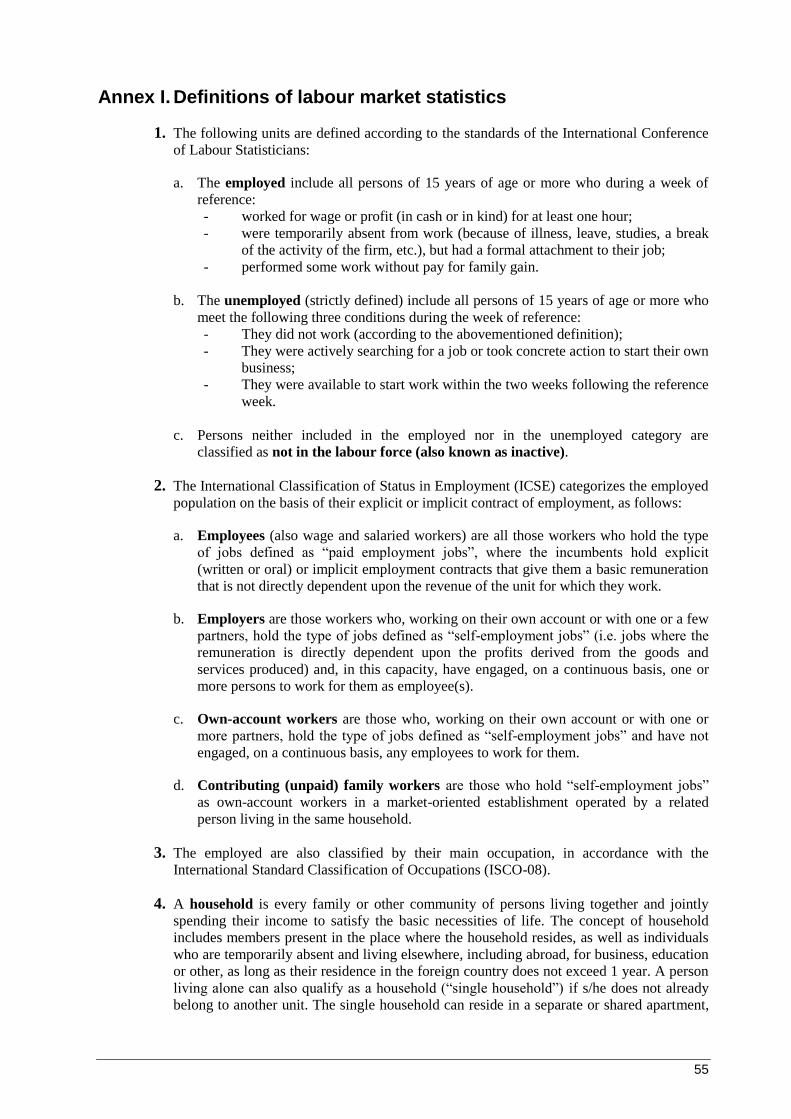
55
Annex I. Definitions of labour market statistics
1. The following units are defined according to the standards of the International Conference
of Labour Statisticians:
a. The employed include all persons of 15 years of age or more who during a week of
reference:
- worked for wage or profit (in cash or in kind) for at least one hour;
- were temporarily absent from work (because of illness, leave, studies, a break
of the activity of the firm, etc.), but had a formal attachment to their job;
- performed some work without pay for family gain.
b. The unemployed (strictly defined) include all persons of 15 years of age or more who
meet the following three conditions during the week of reference:
- They did not work (according to the abovementioned definition);
- They were actively searching for a job or took concrete action to start their own
business;
- They were available to start work within the two weeks following the reference
week.
c. Persons neither included in the employed nor in the unemployed category are
classified as not in the labour force (also known as inactive).
2. The International Classification of Status in Employment (ICSE) categorizes the employed
population on the basis of their explicit or implicit contract of employment, as follows:
a. Employees (also wage and salaried workers) are all those workers who hold the type
of jobs defined as “paid employment jobs”, where the incumbents hold explicit
(written or oral) or implicit employment contracts that give them a basic remuneration
that is not directly dependent upon the revenue of the unit for which they work.
b. Employers are those workers who, working on their own account or with one or a few
partners, hold the type of jobs defined as “self-employment jobs” (i.e. jobs where the
remuneration is directly dependent upon the profits derived from the goods and
services produced) and, in this capacity, have engaged, on a continuous basis, one or
more persons to work for them as employee(s).
c. Own-account workers are those who, working on their own account or with one or
more partners, hold the type of jobs defined as “self-employment jobs” and have not
engaged, on a continuous basis, any employees to work for them.
d. Contributing (unpaid) family workers are those who hold “self-employment jobs”
as own-account workers in a market-oriented establishment operated by a related
person living in the same household.
3. The employed are also classified by their main occupation, in accordance with the
International Standard Classification of Occupations (ISCO-08).
4. A household is every family or other community of persons living together and jointly
spending their income to satisfy the basic necessities of life. The concept of household
includes members present in the place where the household resides, as well as individuals
who are temporarily absent and living elsewhere, including abroad, for business, education
or other, as long as their residence in the foreign country does not exceed 1 year. A person
living alone can also qualify as a household (“single household”) if s/he does not already
belong to another unit. The single household can reside in a separate or shared apartment,

56
considered as an independent unit as long as the household’s income is not shared with
other residents. Collective households, such as prisons and institutions, and their members,
are not observed in a traditional Labour Force Survey.
5. The reporting period, to which the questions for the economic activity are related, is the
week before the week of interview (52 reporting weeks throughout the year).
6. The following units are also defined within the SWTS analysis but are outside the scope of
those defined within the international framework of labour market statistics mentioned in
item I1 above:
a. Relaxed unemployment – a person without work and available to work (relaxing the
jobseeking criteria of item I1b above).
b. Labour underutilization rate – the sum of shares of youth in irregular employment,
unemployed (relaxed definition) and youth neither in the labour force nor in
education/training (inactive non-students) as a percentage of the youth population.
c. Regular employment – the sum of employees with a contract (oral or written) of 12
months or more in duration and employers; the indicators are therefore a mix of
information on status in employment and contract situations.
d. Satisfactory employment – based on self-assessment of the jobholder; implies a job
that the respondent considers to “fit” to their desired employment path at that moment
in time.
e. Stable employment – employees with a contract (oral or written) of 12 months or
more in duration.
f. Temporary employment – employees with a contract (oral or written) of less than 12
months in duration.

57
Annex II. Additional statistical tables
The source for all tables is the school-to-work transition survey in Jordan, 2012–13.
Table A.1 Number of primary and secondary sampling units by governorate
Governorate Primary
sampling units (blocks)
Secondary sampling units
(families)
Families (completed)
Youth (aged 15–29)
Youth (aged 15–29) (completed)
Amman 118 3 540 2 740 2 132 1 785
Balqa 20 600 437 456 377
Zarqa 46 1380 1067 995 878
Madaba 6 180 153 161 141
Irbid 53 1 590 1 224 1 206 1 044
Mafraq 12 360 263 357 340
Jerash 8 240 204 217 190
Ajloun 7 210 169 161 144
Karak 11 330 269 235 224
Tafila 4 120 102 92 86
Ma’an 5 150 100 106 102
Aqaba 6 180 120 111 94
Total 296 8 880 6 848 6 229 5 405
Table A.2 Migrating youth by original area of residence, reason for migration and sex (%)
Original area of residence & reason for migration
Total Male Female
Total 100.0 100.0 100.0
Large city 15.5 12.2 17.7
Urban area 34.3 34.3 34.3
Rural area 8.0 6.8 8.9
Refugee camp 1.6 1.7 1.6
Within the area 17.8 15.5 19.4
Another country 22.7 29.5 18.1
Reason for migration
Total 100.0 100.0 100.0
Studying/training 1.9 3.6 0.8
Employment 4.2 7.5 2.0
Accompanying family 91.3 87.2 94.1
Other 2.6 1.7 3.1

58
Table A.3 Financial inclusion of youth
Financial service used %
None 93.5
Business loans 1.6
Emergency loans 1.7
Consumptions loans 2.1
Other services 1.4
Table A.4 Young students combining work and study by sex (%)
Total Male Female
Working during the school term 1.8 2.6 1.0
Working outside the school term 3.1 5.6 0.4
Working during and outside the school term 1.1 1.8 0.4
Did not work 94.0 90.1 98.2
Total 100.0 100.0 100.0
Table A.5 Young workers who want to change their job by reason and sex (%)
Reason Total Male Female
Working youth stating a desire to change job 28.8 27.9 32.5
Reason
Present job is temporary 23.7 21.7 31.6
Fear of losing present job 7.2 6.3 10.4
To work more hours paid at the current rate 1.3 1.3 1.6
To have a higher pay per hour 26.2 27.4 21.3
To work less hours with a reduction in pay 1.7 1.5 2.2
To better use qualifications/skills 9.0 8.6 10.7
More convenient working time, shorter commuting time 3.1 3.6 1.2
To improve working conditions 26.8 28.6 19.8
Other 1.1 1.0 1.2
Table A.6 Self-employed youth by reason for choosing self-employment
Reason %
Could not find a wage or salaried job 33.3
Greater independence 65.9
More flexible working hours 16.6
Higher income level 15.5
Required by the family 6.7
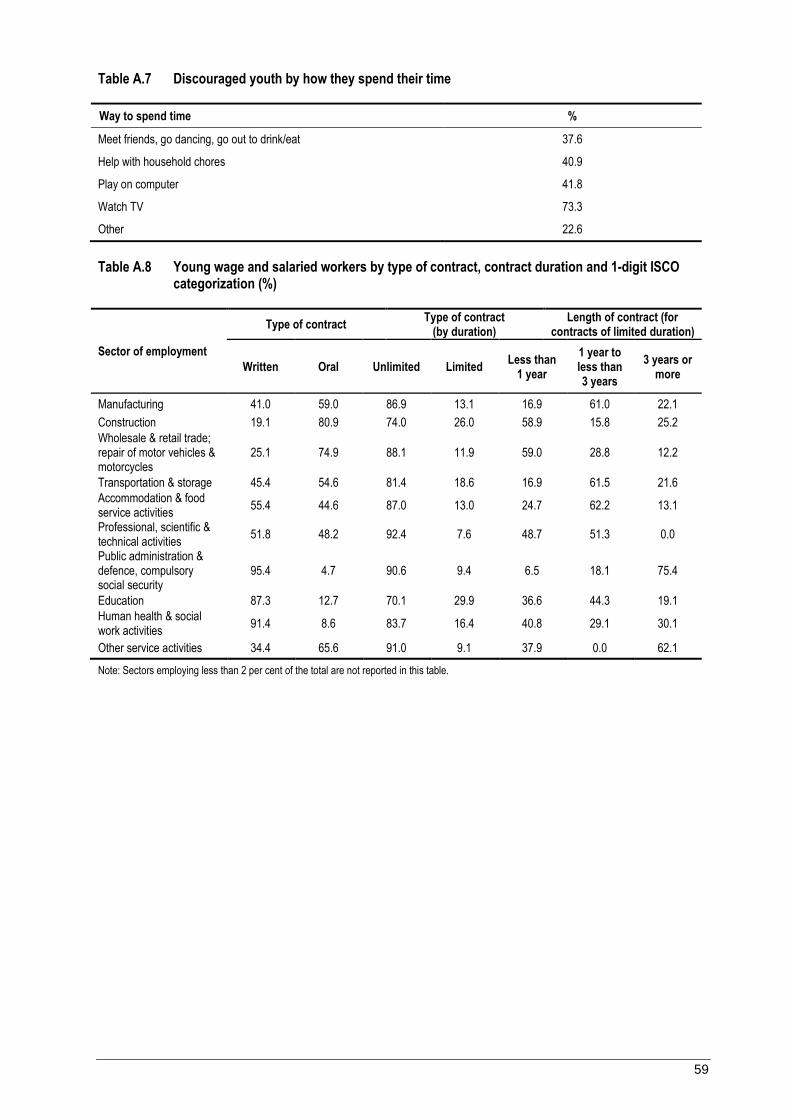
59
Table A.7 Discouraged youth by how they spend their time
Way to spend time %
Meet friends, go dancing, go out to drink/eat 37.6
Help with household chores 40.9
Play on computer 41.8
Watch TV 73.3
Other 22.6
Table A.8 Young wage and salaried workers by type of contract, contract duration and 1-digit ISCO categorization (%)
Sector of employment
Type of contract Type of contract
(by duration) Length of contract (for
contracts of limited duration)
Written Oral Unlimited Limited Less than
1 year
1 year to less than 3 years
3 years or more
Manufacturing 41.0 59.0 86.9 13.1 16.9 61.0 22.1
Construction 19.1 80.9 74.0 26.0 58.9 15.8 25.2
Wholesale & retail trade; repair of motor vehicles & motorcycles
25.1 74.9 88.1 11.9 59.0 28.8 12.2
Transportation & storage 45.4 54.6 81.4 18.6 16.9 61.5 21.6
Accommodation & food service activities
55.4 44.6 87.0 13.0 24.7 62.2 13.1
Professional, scientific & technical activities
51.8 48.2 92.4 7.6 48.7 51.3 0.0
Public administration & defence, compulsory social security
95.4 4.7 90.6 9.4 6.5 18.1 75.4
Education 87.3 12.7 70.1 29.9 36.6 44.3 19.1
Human health & social work activities
91.4 8.6 83.7 16.4 40.8 29.1 30.1
Other service activities 34.4 65.6 91.0 9.1 37.9 0.0 62.1
Note: Sectors employing less than 2 per cent of the total are not reported in this table.

Valentina Barcucci and Nader Mryyan
June 2014
Labour market transitions of young women and men in Jordan
This report presents the highlights of the 2012 School-to-work Transition Survey (SWTS) run together with the Jordanian Department of Statistics within the framework of the ILO Work4Youth Project. This Project is a five-year partnership between the ILO and The MasterCard Foundation that aims to promote decent work opportunities for young men and women through knowledge and action. The W4Y Publication Series is designed to disseminate data and analyses from the SWTS administered by the ILO in 28 countries covering five regions of the world. The SWTS is a unique survey instrument that generates relevant labour market information on young people aged 15 to 29 years. The survey captures longitudinal information on transitions within the labour market, thus providing evidence of the increasingly tentative and indirect paths to decent and productive employment that today’s young men and women face.
The W4Y Publications Series covers national reports, with main survey findings and details on current national policy interventions in the area of youth employment, and regional synthesis reports that highlight regional patterns in youth labour market transitions and distinctions in national policy frameworks.
No. 14
For more information, visit our website: www.ilo.org/w4yYouth Employment Programme4 route des MorillonsCH-1211 Genève 22Switzerland [email protected]
Publication Series
Youth Employment ProgrammeEmployment Policy Department
LAB
OU
R MA
RKET TRA
NSITIO
NS O
F YOU
NG W
OM
EN A
ND M
EN IN
JORDA
NILO
ISSN 2309-6780
Related Documents