Labour Market Transitions of Young Women and Men in Cambodia 2014 June 2015

Welcome message from author
This document is posted to help you gain knowledge. Please leave a comment to let me know what you think about it! Share it to your friends and learn new things together.
Transcript

Labour Market Transitions
of Young Women and Men
in Cambodia 2014
June 2015

Labour Market Transitions
of Young Women and Men
in Cambodia 2014
National Institute of Statistics,
Ministry of Planning
in collaboration with
International Labour Organization
June 2015


i
Preface
The National Institute of Statistics (NIS), Ministry of Planning carried out the
Cambodian School-to-Work Transition Survey (SWTS) 2014 by collecting and analysing
information on various challenges that impact young women and men as they transition from
school to working life. The SWTS, implemented in Cambodia in 2012 and 2014, can serve as
a principle tool for monitoring the impact of youth-related policies and programmes outlined
in national instruments. This report is intended for the policymakers and social partners that
concern themselves with the implementation, monitoring and evaluation of the youth-related
policies and programmes.
This report was produced by the National Institute of Statistics (NIS), Ministry of
Planning, with assistance from the International Labour Organization (ILO). The report
outlines issue of quality of youth employment, the path and duration for young people’s
transition from school to work. It draws conclusions on the characteristics or experiences that
make for a smoother transition. I am certain that the results of this report can be used as a basis
of research and policy making aiming to reflect a clear picture of the labour market
developments in Cambodia.
I would like to thank H.E. Chhay Than, Senior Minister, Ministry of Planning, and H.E.
Ms Pen Sopakphea, Secretary of State of the Ministry of Planning, for their continuous support
to the survey activities and preparation of this report.
I extend deep appreciation for the financial support and technical assistance from the
ILO Work4Youth project. I extend special thanks to Ms Sara Elder, Chief Technical Advisor,
Youth Employment Programme, for her help in organizing the survey process. Thanks also to
Mr Yves Parardel and Ms Yonca Gurbuzer, members of the Work4Youth team for their
technical support and valuable inputs during all stages of the survey and drafting process.
Finally, I gratefully acknowledge all the NIS staff who were involved in the survey for
their great efforts, support and good work in making the survey a success. I also extend
appreciation to the core technical team of the National Institute of Statistics, Ministry of
Planning, for their high level of execution and supervision of the survey activities. In particular,
Mr Heang Kanol, Deputy Director General and Survey Operation Manager as well as his core
technical team at the National Institute of Statistics, for their hard work in the survey activities
and the preparation of this report.
Phnom Penh
June 2015
HANG LINA
Director General, NIS

ii
iii
Contents Page
Preface…………………………………………………………………………………….. i
1. Introduction and key findings…………………………………..……………………. 1
1.1 Overview………………………………………………………………………. 1
1.2 Structure of the report………………………….………………………………. 2
1.3 Main findings……………………………….…………………………………. 2
2. Overview of the labour market and survey methodology…………...………………. 5
2.1 The socio-economic context ………………………………….………….……. 5
2.2 The labour market in Cambodia……………….………………………………. 7
2.3 The school-to-work transition survey in Cambodia: Objectives
and methodology………………………………………………………………. 9
3. Characteristics of youth in the sample survey……………………….………………. 11
3.1 Individual characteristics of youth…………………….………………………. 11
3.2 Educational attainment………………………...………………………………. 13
3.3 Current activity status of youth……………..…………………………………. 16
3.4 Aspirations and life goals………………………...……………………………. 18
3.5 Characteristics of unemployed youth……………………………….…………. 19
3.6 Characteristics of youth outside of the labour force (inactive youth)…………. 26
3.7 Characteristics of employed youth…………………………….………………. 28
3.7.1 General characteristics of the employment….………….…..…………. 28
3.7.2 Status in employment……………………………….….………...……. 29
3.7.3 Sector and occupations of the employment……………………………. 29
3.7.4 Wage employment…………………………..…………………………. 31
3.7.5 Self-employment………………...…….………………………………. 32
3.7.6 Hours of work and involuntary part-time work……………..…………. 33
3.7.7 Other job quality indicators…………………....………………………. 34
3.7.8 Security and satisfaction………………….……………………………. 38
3.7.9 The job search………………………....………………………………. 39
4. Stages of transition……………………………….….………………………………. 40
4.1 Concepts and definitions…………….………………….……..………………. 40
4.2 Stages of transition ……………………………….………………...…………. 42
4.2.1 Youth who have not started transition…………………………………. 43
4.2.2 Youth in transition………………………..……………………………. 44

iv
4.2.3 Characteristics of a completed transition………………………...……. 46
4.3 Transition paths and lengths of transition.………………….…………………. 48
Reference…………………………….………………………………………….………... 51
Annex I. Definitions of labour market statistics………………………………...……. 53
Annex II. Methodology for the Cambodia SWTS 2014………………...………….…. 55
Annex III. Additional statistical tables…………………………………………………. 59
Annex IV. Survey personnel……………………………….…………………………… 67
Tables
1. Key economic indicators…………………………………….……………………… 5
2. Working-age population (15+) by educational attainment and sex………………… 6
3. 2 Key labour market indicators for working-age population (15+)
by area of residence and sex………………………………..………………………
7
4. Employed population (15+) by main branches of economic activity and sex……… 8
5. 2 Employed population (15+) by occupation and sex…………………………...…… 8
6. Employed population (15+) by status in employment and sex…………...………… 9
7. 2 Youth population by selected characteristics and sex………………………….....… 12
8. Key labour market indicators for youth by sex (%)………………………………… 12
9. 2 Educational attainment of youth by current activity status…………………….…… 13
10. Youth with uncompleted education by reason for leaving school………………..… 14
11. 2 Distribution of out-of-school youth by current activity status and sex………...…… 14
12. Educational attainment of youth's mothers and youth's fathers……………..……… 15
13. 2 Educational attainment of respondent in comparison to their parents'………...…… 15
14. Youth population by main economic activity and sex……………………………… 17
15. 2 Distribution of NEET youth by area of residence and sex…………….…………… 18
16. Primary life goals of young respondents by current activity status………………… 18
17. Unemployed youth by level of completed educational attainment and sex………… 19
18. Unemployed youth by duration of job search and sex……………………………… 20
19. Unemployed youth by main obstacle to finding work……………………………… 22
20. Unemployed youth by type of occupation sought and sex……………….………… 23
21. Unemployed youth by household’s overall financial situation and area of residence 24
22. Youth unemployment, strict and relaxed definition, and discouragement…….…… 24
v
23. Non-working youth, available to work but not seeking work (relaxed unemployed)
by reason for not looking for work and sex…………………………………………
25
24. Unemployed youth who had refused a job by reason for refusal and sex……..…… 26
25. Inactive youth by reasons for inactivity and sex……………………….…………… 27
26. Employed youth by age group, marital status, area of residence and sex……..…… 28
27. Employed youth by status in employment and sex……………………….………… 29
28. Employed youth by main branches of economic activity and sex………..………… 29
29. Employed youth by occupation and sex…………………………………….……… 30
30. Young wage and salaried workers by access to benefits/entitlements and sex…..… 31
31. Young wage and salaried workers by type of contract, area of residence and sex.… 32
32. Young own-account worker by reason for self-employment and area of residence... 33
33. Involuntary part-time young workers by sex………………………………..……… 34
34. Average monthly wages (in Riels) of employees and own-account workers
by occupation and sex……………………….………………………………………
36
35. Share of employed youth in informal employment by sex…………………….…… 36
36. ISCO Major groups and education levels……………………...…………………… 37
37. Shares of overeducated and undereducated young workers by major occupational
category (ISCO-08, %)……………………...……..……………..…………………
38
38. Employed and unemployed youth by job search method……………...…………… 40
39. Distribution of youth population by stage of transition and sex……………….…… 42
40. Distribution of youth population across stage of transition and selected key
indicators: age group, sex, area of residence and household’s overall financial
situation……….………………………………………………………..……………
43
41. Youth who have not yet started their transition by sub-category and sex………..… 44
42. Youth “in transition” and “transited” by level of household income, area of
residence, level of completed educational attainment and sub-category…………… 45
43. Distribution of transited youth by sub-category and occupation…………………… 48
44. Distribution of transited youth by previous activity…………………………...…… 49
45. Indicators on the path of transition (for “transited” youth) by sex…….…………… 49
A1. Youth population by selected characteristics and sex, SWTS 2012
and SWTS 2014…………………………………………………………………….. 59
A2. Distribution of youth population by use of financial instruments……..…………… 60
A3. Distribution of youth by source of financial services………………………….…… 61
A4. Share of employed youth by union membership…………………………………… 61
A5. Distribution of employed youth by company size……………………..…………… 62
A6. Distribution of employed youth by satisfaction with current job………...………… 62
vi
A7. Distribution of employed youth by receipt of job-oriented training………...……… 63
A8. Distribution of self-employed youth (own-account workers and employers)
by problems in running the business………….…………..………………………… 64
A9. Distribution of self-employed workers (own-account workers and employers)
by source of funding for starting their current activity……………...……………… 65
A10. Distribution of in-school youth by highest educational attainment expected………. 66
A11. Share of young students combining work and study……………………………….. 66
Figures
1. 1 Distribution of youth by completed level of educational attainment (%)……….… 13
2. 1 Cross-tabulation of youth educational attainment by parental educational
attainment (%)……………………………...……………………………………… 16
3. 1 Youth population by category of economic activity and sex……………………… 17
4. 1 Youth unemployment rates by level of educational attainment (%)………….…… 20
5. 1 Distribution of occupations sought by unemployed youth and occupational
distribution of employed youth (%)……………………..………………………… 23
6. 1 Current young students by preferred field of study (%)…………………………… 28
7. 1 Distribution of youth employment by sector at the 1-digit level and sex (%)…..… 30
8. Distribution of youth employment by actual hours worked per week by sex (%)… 33
9. Indicators measuring quality of youth employment (%)…………………...……… 35
10. Employed youth who would like to change their work by reason (%)……….…… 39
11. Youth population by stages of transition (%)……………………………………… 42
12. “In transition” youth by level of household income, level of completed
educational attainment and sub-category (%)…………...………………………… 44
13. Distribution of transition groups (transited and in-transition youth) by sex,
urban/rural geography, household income level and level of educational
attainment (%)……………………………………………...……………………… 46
14. “Transited” youth by sub-category and by sex, urban/rural geography,
household income level and level of educational attainment (%)……………….… 47
15. Classification of duration of transition of youth who have completed
the transition by sex (%)…………………………………………………………… 50
1
1. Introduction and key findings
1.1 Overview1
The work ethic is strong in Cambodia and job opportunities for youth are
abundant, at least for the lesser skilled. Nearly three-fourths of Cambodian young
people aged 15 to 29 years are already working. Unemployment is very low, although
the rate increases slightly among more educated youth reflecting the current structure
of demand in the country.
Much political attention has been given to the employment of young people in
the country. In recent years, the government has been active in developing policies to
promote youth employment, most recently in the forthcoming National Employment
Policy with a focus on young women and men, and also within the framework of the
National Strategic Development Plan (NSDP). As the challenges are many and cut
across several policy dimensions, measures focus on both supply and demand, and are
curative as well as preventative. Emphasis will necessarily be placed on education and
training, job creation and entrepreneurship, inclusion of youth in the labour market, and
institutional reform. Section 5 of this report will present in greater detail the policy
response to youth employment challenges in the country.
To characterize the specific youth employment challenges and to support
policymakers in designing adequate instruments to support the transition of young
people into employment, the ILO has developed its school-to-work transition survey
(SWTS), a household survey of young people aged 15-29. The National Institute of
Statistics (NIS) undertook in the third quarter of 2014 a SWTS survey to collect and
analyse information on the various challenges that influence young men and women
while they are making the transition to working life. This was the second SWTS
implemented in the country while the first one had run in 2012. The SWTS,
implemented in Cambodia in 2012 and 2014, can serve as a principle tool for
monitoring the impact of policies and programmes outlined in national instruments.
This report is intended for the policymakers and social partners that concern themselves
with the implementation, monitoring and evaluation of the youth-related policies and
programmes.
The indicators generated from the survey and analysed in this report aim to
present a much more detailed picture of youth in the labour market than what can
usually be derived through standard surveys, including the labour force survey.
Unemployment among youth is not a major national concern in the country, although
graduate unemployment is proving to be increasingly worrisome. What is of significant
concern, however, is the quality of work made available to the young population and
the impact that low-productive employment among the large youth population has on
the growth prospects of the country. The report therefore focuses heavily on the quality
of youth employment. It also draws attention to the path and duration that young
people’s transition from school to work takes and draws conclusions on characteristics
or experiences that make for a smoother transition.
1 This report builds on the analysis of the 2012 SWTS presented in the September 2013 report. See Kanol,
Khemarin and Elder, 2013.

2
1.2 Structure of the report
This report is divided into four sections. Following this introduction, section 2
presents an overview of the socio-economic context and labour market in Cambodia
and introduces the objectives and methodology of the SWTS. Section 3 presents the
main results of the SWTS with details on the characteristics of youth and their labour
market outcomes. It includes an overall description of individual characteristics of
youth, educational achievement, current activity status of youth, aspirations and life
goals of young people, characteristics of unemployed youth, youth who are outside of
the labour market and their reasons other than studying, and characteristics of employed
youth. Finally, section 4 introduces the classification of stages of labour market
transition and investigates the characteristics that lead to more advantageous labour
market outcomes, specifically in the attainment of stable employment. The section also
discusses the length of time that young men and women spend in transition and traces
the various labour market experiences they have along the way.
1.3 Main findings
Too many young people are not benefiting fully from the education system,
but still there has been clear progress in the area of education when this generation
of youth is compared to previous generations.
The largest share of youth in the country has completed education at the primary
level (40.3 per cent of total youth), but there is still 5.5 per cent of youth who finished
school below the primary level. Nearly one-half (46.8) per cent of Cambodian youth
have completed their education at the secondary level and only 4.3 per cent at the
tertiary level. It is important to bear in mind, however, that one-fourth (27.8 per cent)
of young Cambodians are still in school, 15.8 per cent of which are currently engaged
in studies at the tertiary level.
Among the youth who left school before completion, 62.0 stated they left school
due to economic reasons, i.e. their family could not afford for them to continue in
school.
There has been remarkable progress in the area of educational enrolment in
Cambodia in recent years. Both young men and women today are much more likely to
have school facilities readily accessible and to also have the permission to attend them.
In total, 54.0 per cent of youth finished their education at a level higher than their father
and 69.7 per cent finished higher than their mother.
Education has a significant influence on the young person’s labour market
transition.
Education matters in the results on a young person’s labour market transition:
The higher the educational attainment of the youth, the more likely s/he is to attain
stable employment over satisfactory self- or temporary employment. Nearly one-half
(54.6 per cent) of transited youth with a tertiary degree are in stable employment
compared to 45.4 per cent in satisfactory self-employment or temporary employment.

3
Young people who have higher educational levels also experience shorter
transition periods than those with lower levels of completed education. The difference
can be quite grim, with those with education below the primary level spending an
average of 130.9 months, or nearly eleven years, in transition compared to 103.7 months
(nearly nine years) for those with university degrees.
Unemployment is low among youth in Cambodia, but higher unemployment rates
among the most educated youth implies a mismatch between education and skills
demand in the labour market.
Overall, the youth unemployment rate is Cambodia is very low at 2.4 per cent,
a slight increase from the 2.1 per cent rate in 2012. The likelihood of being unemployed
is highest among young Cambodians with university education (7.3 per cent youth
unemployment rate). The most significant challenges cited by unemployed youth were
their lack of work experience (40.6 per cent) and the requirements of the job were higher
than the education/training received (18.9 per cent). These findings suggest that there
is an urgent need to improve labour market relevance of educational outcomes and to
strengthen career guidance services. The education system often falls short of students’
expectations to provide them with the skills and means needed to enter the labour
market.
The vast majority of young Cambodians are working, but the quality of employment
is often low, which does not allow the youth (and the country) to make the most of
their economic potential.
Eight in ten (83.1 per cent) youth in Cambodia is employed, and among the
employed, self-employment represents 67.5 per cent, summing 16.3 per cent young
own-account workers, 50.8 per cent young contributing (unpaid) family workers and
0.4 per cent young employers.
Many youth took the self-employment route involuntarily, either because it was
required by the family (23.5 per cent) or because they had been unable to find a wage
or salaried job (11.9 per cent). The young self-employed claim their most significant
business challenges as insufficient financial resources (43.9 per cent) and competition
in the market (23.0 per cent).
Regarding the few youth who do obtain wage and salaried employment (32.5
per cent of young workers), two-fifth has access to the benefits of paid annual leave
(40.0 per cent) and 15.5 per cent claim to have employers who pay into a social security
system. About one-half (52.7 per cent) of young employees were engaged without a
written contract. The share of employees receiving core benefits and a written contract
represent a significant improvement from the 2012 results, although there is still much
room for improvement.
Poor quality employment impacts more than half of young workers: seven in
ten young workers receive a wage that is below the average of all workers (paid workers
and own-account workers), five in ten are in informal employment, seven in ten are in
irregular employment, and five in ten are undereducated for the job that they hold. A
significant share of young workers (53.0 per cent) said they would like to change their
job.

4
A large share (45.0 per cent) of young working Cambodians are undereducated
for the work that they do. Managers, professionals, technicians and associate
professionals, services and sales workers, skilled agricultural workers, crafts workers,
and plant and machine operators in the country have a one in two chance of being
undereducated than the job calls for. Undereducation can have a negative impact on the
productivity of the worker and thus the output of the enterprise, but also more
personally, on the sense of security of the young worker.
Agriculture remains the most important employer in the country.
Employment in agriculture continues to dominate the youth labour market
absorbing 45.1 per cent of young workers, with employment in service and sales a
distant second at 20.2 per cent of youth employment and craft and related trade workers
a distant third at 18.1 per cent (with both of the latter sectors showing a higher share for
young women than men). The construction and transport sectors are fairly well
represented among male employment (8.1 and 4.8 per cent, respectively).
Most youth in Cambodia have already completed their labour market transitions and
the transitions were relatively short, reflecting low turnover in the Cambodian labour
market.
The largest share of the youth population in Cambodia has already completed
the transition to stable and/or satisfactory employment (79.9 per cent), and most to
satisfactory self-employment or temporary employment (57.1 per cent). Among the
youth who have already completed their labour market transition, 29.6 per cent – moved
directly to their current stable and/or satisfactory job while slightly more moved from
unpaid family work or from another job (31.3 per cent).
The percentage of youth who have not yet started the transition is 8.2 per cent
and the share of youth still in the process of transition is 11.9 per cent. Urban youth are
more likely to remain in education and start the transition later (20.9 per cent compared
to 5.0 per cent of rural youth) while rural youth are more likely to fall in the
economically active categories of transition completed or in transition. Regarding the
influence of household income, it becomes clear that household wealth determines the
ability of youth to stay in school and thus be more likely to fall in the category of
transition not yet started (16.8 per cent of youth in well-off households are in the
category compared to 2.4 per cent of youth in poor households).
Regarding the youth who completed the transition but had not moved directly
to their status in stable and/or satisfactory employment, the path to transition proved to
be extremely long at 89.0 months, or more than seven years. The time spent in transition
averaged more than five months longer for young men compared to young women (92.0
and 86.7 months, respectively).
Urban residence, household income and level of education are good determinants of
who does better in the labour market transition.
Regarding who is doing better at obtaining the few “good” jobs and completing
their labour market transition, young men have a slight advantage over young women
(91.3 per cent of young men have completed the transition compared to 83.7 per cent

5
of young women). Second, living in a rural area slightly increases the youth’s chances
of completing the transition (87.6 per cent of urban youth have completed the transition
compared to 84.7 per cent of youth in urban areas).
Youth from wealthier households have a higher likelihood to complete the
transition as opposed to remaining in transition, although the difference in shares across
the two categories is not large (90.0 per cent of youth in above average wealth
households completed the transition compared to 82.8 per cent of youth in below
average income households). Finally, one of the strongest conclusions is that education
matters to the transition, as was noted in the previous second main finding above.
2. Overview of the labour market and survey methodology
2.1 The socio-economic context
Economic growth is strong in recent years in Cambodia. The growth rate in
2013 was 7.6 per cent, according to preliminary estimates (Table 1).2 Real GDP per
capita was US$ 1,036, an increase of 6.5 per cent from 2012.
Table 1. Key economic indicators
2009 2010 2011 2012p 2013p
Real GDP growth rate (%) 0.1 6.0 7.1 7.3 7.6
GDP per capita (US$) 753 830 911 973 1,036
Gross capital formation growth rate (%) 4.0 -9.8 10.8 17.4 15.3
Exports growth rate (%) -9.9 20.6 18.9 14.4 14.0
Imports growth rate (%) -10.2 16.8 16.3 16.9 15.1
External balance (% Real GDP) -13.8 -12.7 -11.8 -15.0 -17.0
Consumer Price Index (CPI)* 131.1 136.4 143.8 148.0 152.4
Inflation rate (%) - 4.0 5.5 2.9 3.0
Official exchange rate (Riels/US$) 4,140 4,044 4,016 4,034 4,050
Notes: Real GDP (at constant 2000 prices)
* CPI-Phnom Penh (October-December 2006=100) started from 2009
p = Preliminary
Source: National Accounts of Cambodia, NIS.
Gross fixed capital formation slightly decreased by 15.3 per cent in 2013,
compared to increases of 17.4 per cent in 2012 and 10.8 per cent in 2011 (Table 1).
These increases were due to increase in construction. In constant 2000 prices, exports
of goods and services grew by 14.0 per cent in 2013, preceded by an increase of 14.4
per cent in 2012 and 18.9 per cent in 2011. The increasing demand for raw materials
2 These estimates are according to the production approach. In this approach, GDP equals the sum of gross value
added (GVA) of all industries or economic activities. The GVA can be measured by taking the value of the goods
and services produced by an industry (gross output) and subtracting the cost of goods and services used by the
industry in the production process (intermediate input).
6
for export-oriented industries and asset accumulation has generally been met through
imports. However, in recent years there has been much stronger growth in the import
of consumption goods than intermediary goods. Imports of goods and services grew by
15.1 per cent in 2013, compared to 16.9 per cent in 2012 and 16.3 per cent in 2011. As
a result of the stronger growth in exports compared to imports, the external goods and
services deficit decreased from 17.0 per cent of GDP in 2013 compared to 15.0 per cent
in 2012. The annual average increase for the Phnom Penh Consumer Price Index (CPI)
was 2.9 per cent in 2012 and 3.0 per cent in 2013, mainly due to rising food prices.
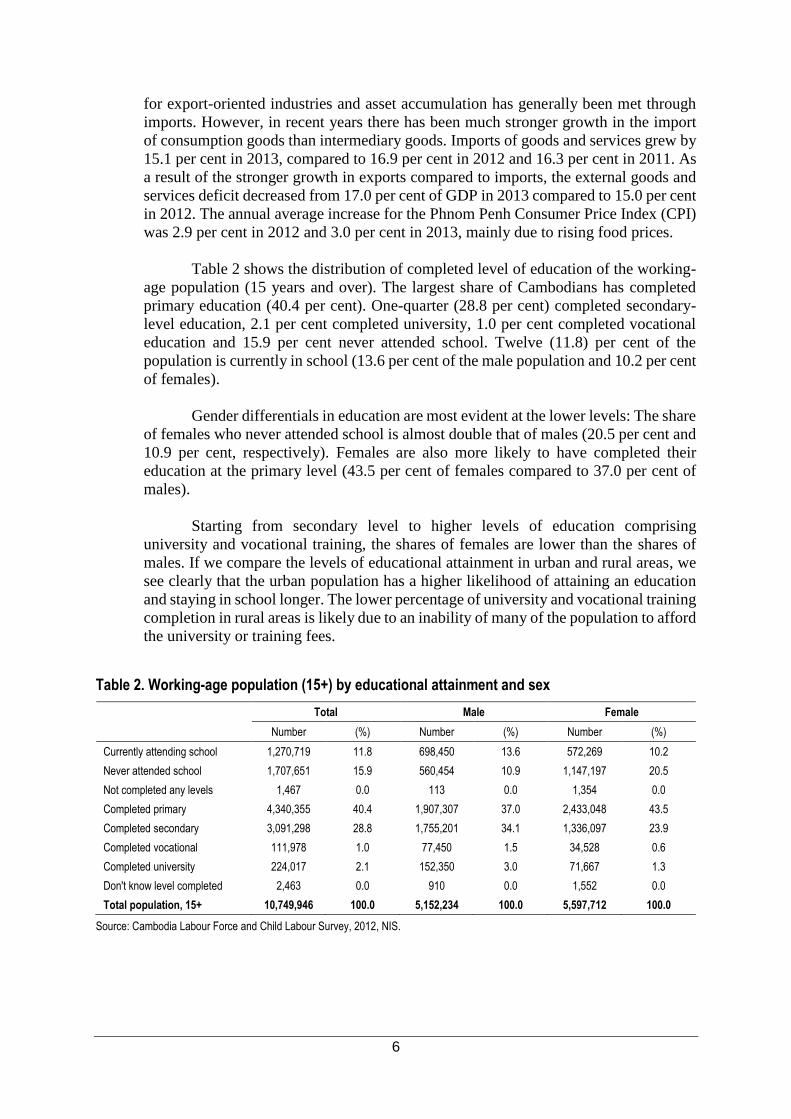
Table 2 shows the distribution of completed level of education of the working-
age population (15 years and over). The largest share of Cambodians has completed
primary education (40.4 per cent). One-quarter (28.8 per cent) completed secondary-
level education, 2.1 per cent completed university, 1.0 per cent completed vocational
education and 15.9 per cent never attended school. Twelve (11.8) per cent of the
population is currently in school (13.6 per cent of the male population and 10.2 per cent
of females).
Gender differentials in education are most evident at the lower levels: The share
of females who never attended school is almost double that of males (20.5 per cent and
10.9 per cent, respectively). Females are also more likely to have completed their
education at the primary level (43.5 per cent of females compared to 37.0 per cent of
males).
Starting from secondary level to higher levels of education comprising
university and vocational training, the shares of females are lower than the shares of
males. If we compare the levels of educational attainment in urban and rural areas, we
see clearly that the urban population has a higher likelihood of attaining an education
and staying in school longer. The lower percentage of university and vocational training
completion in rural areas is likely due to an inability of many of the population to afford
the university or training fees.
Table 2. Working-age population (15+) by educational attainment and sex
Total Male Female
Number (%) Number (%) Number (%)
Currently attending school 1,270,719 11.8 698,450 13.6 572,269 10.2
Never attended school 1,707,651 15.9 560,454 10.9 1,147,197 20.5
Not completed any levels 1,467 0.0 113 0.0 1,354 0.0
Completed primary 4,340,355 40.4 1,907,307 37.0 2,433,048 43.5
Completed secondary 3,091,298 28.8 1,755,201 34.1 1,336,097 23.9
Completed vocational 111,978 1.0 77,450 1.5 34,528 0.6
Completed university 224,017 2.1 152,350 3.0 71,667 1.3
Don't know level completed 2,463 0.0 910 0.0 1,552 0.0
Total population, 15+ 10,749,946 100.0 5,152,234 100.0 5,597,712 100.0
Source: Cambodia Labour Force and Child Labour Survey, 2012, NIS.
7
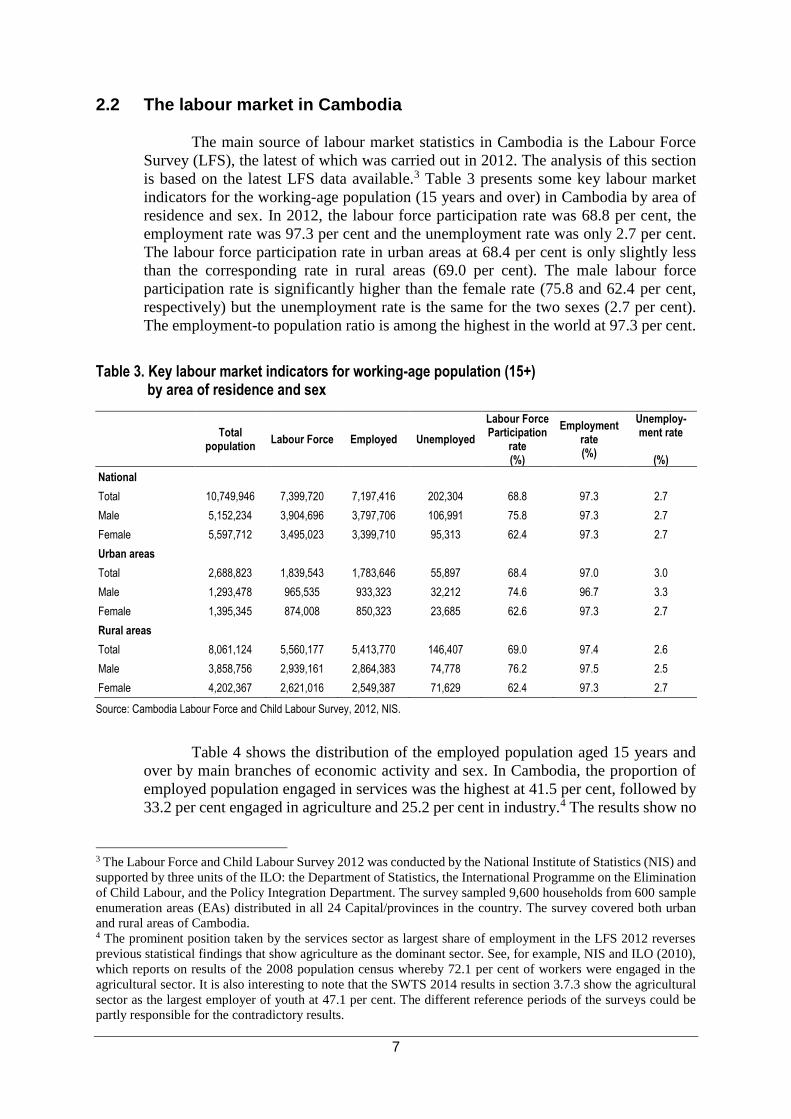
2.2 The labour market in Cambodia
The main source of labour market statistics in Cambodia is the Labour Force
Survey (LFS), the latest of which was carried out in 2012. The analysis of this section
is based on the latest LFS data available.3 Table 3 presents some key labour market
indicators for the working-age population (15 years and over) in Cambodia by area of
residence and sex. In 2012, the labour force participation rate was 68.8 per cent, the
employment rate was 97.3 per cent and the unemployment rate was only 2.7 per cent.
The labour force participation rate in urban areas at 68.4 per cent is only slightly less
than the corresponding rate in rural areas (69.0 per cent). The male labour force
participation rate is significantly higher than the female rate (75.8 and 62.4 per cent,
respectively) but the unemployment rate is the same for the two sexes (2.7 per cent).
The employment-to population ratio is among the highest in the world at 97.3 per cent.
Table 3. Key labour market indicators for working-age population (15+)
by area of residence and sex
Total
population Labour Force Employed Unemployed
Labour Force Participation
rate (%)
Employment rate (%)
Unemploy-ment rate
(%)
National
Total 10,749,946 7,399,720 7,197,416 202,304 68.8 97.3 2.7
Male 5,152,234 3,904,696 3,797,706 106,991 75.8 97.3 2.7
Female 5,597,712 3,495,023 3,399,710 95,313 62.4 97.3 2.7
Urban areas
Total 2,688,823 1,839,543 1,783,646 55,897 68.4 97.0 3.0
Male 1,293,478 965,535 933,323 32,212 74.6 96.7 3.3
Female 1,395,345 874,008 850,323 23,685 62.6 97.3 2.7
Rural areas
Total 8,061,124 5,560,177 5,413,770 146,407 69.0 97.4 2.6
Male 3,858,756 2,939,161 2,864,383 74,778 76.2 97.5 2.5
Female 4,202,367 2,621,016 2,549,387 71,629 62.4 97.3 2.7
Source: Cambodia Labour Force and Child Labour Survey, 2012, NIS.
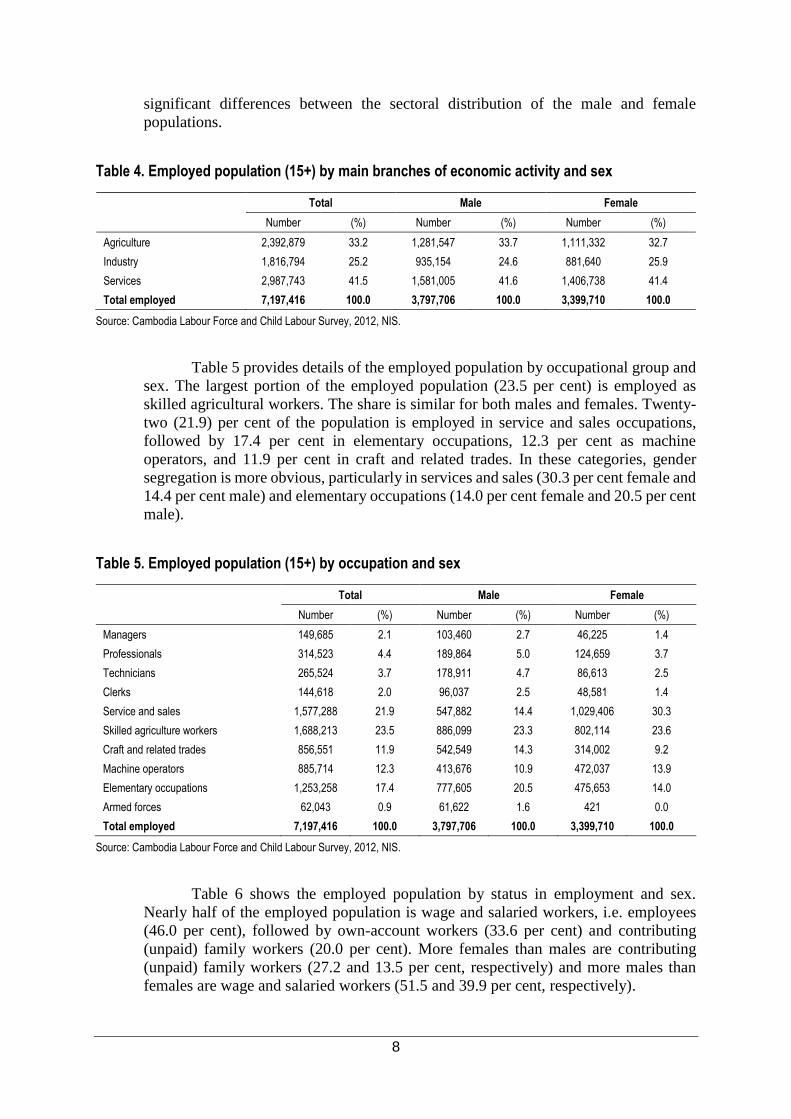
Table 4 shows the distribution of the employed population aged 15 years and
over by main branches of economic activity and sex. In Cambodia, the proportion of
employed population engaged in services was the highest at 41.5 per cent, followed by
33.2 per cent engaged in agriculture and 25.2 per cent in industry.4 The results show no
3 The Labour Force and Child Labour Survey 2012 was conducted by the National Institute of Statistics (NIS) and
supported by three units of the ILO: the Department of Statistics, the International Programme on the Elimination
of Child Labour, and the Policy Integration Department. The survey sampled 9,600 households from 600 sample
enumeration areas (EAs) distributed in all 24 Capital/provinces in the country. The survey covered both urban
and rural areas of Cambodia. 4 The prominent position taken by the services sector as largest share of employment in the LFS 2012 reverses
previous statistical findings that show agriculture as the dominant sector. See, for example, NIS and ILO (2010),
which reports on results of the 2008 population census whereby 72.1 per cent of workers were engaged in the
agricultural sector. It is also interesting to note that the SWTS 2014 results in section 3.7.3 show the agricultural
sector as the largest employer of youth at 47.1 per cent. The different reference periods of the surveys could be
partly responsible for the contradictory results.
8
significant differences between the sectoral distribution of the male and female
populations.
Table 4. Employed population (15+) by main branches of economic activity and sex
Total Male Female
Number (%) Number (%) Number (%)
Agriculture 2,392,879 33.2 1,281,547 33.7 1,111,332 32.7
Industry 1,816,794 25.2 935,154 24.6 881,640 25.9
Services 2,987,743 41.5 1,581,005 41.6 1,406,738 41.4
Total employed 7,197,416 100.0 3,797,706 100.0 3,399,710 100.0
Source: Cambodia Labour Force and Child Labour Survey, 2012, NIS.
Table 5 provides details of the employed population by occupational group and
sex. The largest portion of the employed population (23.5 per cent) is employed as
skilled agricultural workers. The share is similar for both males and females. Twenty-
two (21.9) per cent of the population is employed in service and sales occupations,
followed by 17.4 per cent in elementary occupations, 12.3 per cent as machine
operators, and 11.9 per cent in craft and related trades. In these categories, gender
segregation is more obvious, particularly in services and sales (30.3 per cent female and
14.4 per cent male) and elementary occupations (14.0 per cent female and 20.5 per cent
male).
Table 5. Employed population (15+) by occupation and sex
Total Male Female
Number (%) Number (%) Number (%)
Managers 149,685 2.1 103,460 2.7 46,225 1.4
Professionals 314,523 4.4 189,864 5.0 124,659 3.7
Technicians 265,524 3.7 178,911 4.7 86,613 2.5
Clerks 144,618 2.0 96,037 2.5 48,581 1.4
Service and sales 1,577,288 21.9 547,882 14.4 1,029,406 30.3
Skilled agriculture workers 1,688,213 23.5 886,099 23.3 802,114 23.6
Craft and related trades 856,551 11.9 542,549 14.3 314,002 9.2
Machine operators 885,714 12.3 413,676 10.9 472,037 13.9
Elementary occupations 1,253,258 17.4 777,605 20.5 475,653 14.0
Armed forces 62,043 0.9 61,622 1.6 421 0.0
Total employed 7,197,416 100.0 3,797,706 100.0 3,399,710 100.0
Source: Cambodia Labour Force and Child Labour Survey, 2012, NIS.
Table 6 shows the employed population by status in employment and sex.
Nearly half of the employed population is wage and salaried workers, i.e. employees
(46.0 per cent), followed by own-account workers (33.6 per cent) and contributing
(unpaid) family workers (20.0 per cent). More females than males are contributing
(unpaid) family workers (27.2 and 13.5 per cent, respectively) and more males than
females are wage and salaried workers (51.5 and 39.9 per cent, respectively).

9
Table 6. Employed population (15+) by status in employment and sex
Total Male Female
Number (%) Number (%) Number (%)
Wage and salaried workers 3,312,644 46.0 1,956,686 51.5 1,355,958 39.9
Employers 28,455 0.4 17,931 0.5 10,524 0.3
Own-account/self-employed workers 2,415,194 33.6 1,307,900 34.4 1,107,293 32.6
Contributing (unpaid) family workers 1,439,847 20.0 514,398 13.5 925,449 27.2
Other 1,275 0.0 790 0.0 485 0.0
Total employed 7,197,416 100.0 3,797,706 100.0 3,399,710 100.0
Source: Cambodia Labour Force and Child Labour Survey, 2012, NIS.
2.3 The school-to-work transition survey in Cambodia: Objectives and methodology
The National Institute of Statistics (NIS) ran a Labour Force and Child Labour
Survey (LFCLS) in 2012. Statistics on youth aged 15 to 24 years are made available
from the LFCLS, but tabulations are typically made for only standard indicators such
as labour force participation rates, employment-to-population ratios and unemployment
rates. If looking at standard LFS results only, one will usually have difficulty creating
a detailed picture of the youth labour market and will certainly not be able to trace the
path of transition that young people take into and within the labour market. The SWTS
helps to fill this information gap, providing a rare opportunity to analyse the specific
challenges of young people in the labour market. By collecting information on the
labour market situation of young people and including also questions on the history of
economic activity of young respondents aged 15 to 29 years (see Box 1), the survey can
serve as a principle tool for monitoring the impact of youth employment policies and
programmes currently underway in Cambodia, including those being planned in recent
tripartite discussions on the formulation of a National Employment Policy, led by the
Ministry of Labour and Vocational Training.
The main objectives of the SWTS are to collect detailed information on the
various challenges, attitudes and situations of young persons aged 15-29 years entrance
to the labour market. The survey is designed to capture these factors and the specific
experiences of young men and women from the period of time between their exit from
school (or first entry to the labour market if never attended school) to the time of entry
in a stable job or satisfactory job.
Box 1. Definition of youth
While in most other contexts, a young person is defined as a person aged 15 to 24 years, for the purpose of the SWTS and related reports the upper age bound is extended to 29 years. This is done in recognition of the fact that some young people remain in education beyond the age of 24 years, and in the hopes of capturing more information on the post-graduation employment experiences of young people.
The SWTS can also be used to detect the individual characteristics of young
people that determine labour market disadvantages. This, in turn, is instrumental to the
development of policy responses to prevent the emergence of risk factors, as well as
10
measures to remedy those factors that negatively affect the transition to decent work.
Other specific objectives of the survey are to:
1. Obtain data on personal, family and household information including financial
situation, health problems, highest educational level of parents, occupation of
parents and financial inclusion;
2. Collect data on formal education/training (current and former students) and
aspirations of youth, including area of study, aspirations of future occupations and
industry, combination of work and study, and main goal in life;
3. Collect data on young workers including details of place of work, employment
status, access to benefits/entitlements, challenges of the self-employed, access to
finances, hours of work, job satisfaction and perception of security, future
prospects, training in current activity, and the job search experience;
4. Collect data on unemployed youth including method and length of the job search,
occupation sought, and wage and job reservations;
5. Capture the history of economic activities of the active youth based on personal
perception of the respondent, from the first time of entry, including spells of
employment (by status, satisfaction and reason for leaving), unemployment and
inactivity by length of each spell.
The SWTS 20125 and 2014 in Cambodia were conducted by the National
Institute of Statistics (NIS) with the financial and technical support of the International
Labour Organization (ILO). The two surveys were highlighted on issues such as labour
market inefficiencies shown in job search/recruitment methods and mismatches
between the skills base of young labour market entrants and the realities of the labour
market itself. Moreover, the surveys aim to strengthen the production of labour market
information specific to youth and to work with policy-makers on the interpretation of
data, including on transitions to the labour market, for the design or monitoring of youth
employment policies and programmes. Funding for the surveys came from the
Work4Youth partnership between the ILO Youth Employment Programme and The
MasterCard Foundation (see box 2).
Box 2. Work4Youth: An ILO project in partnership with The MasterCard Foundation
The Work4Youth (W4Y) project is a partnership between the ILO Youth Employment Programme and The MasterCard Foundation. The project has a budget of US$14.6 million and will run for five years to mid-2016. Its aim is to “promote decent work opportunities for young men and women through knowledge and action”. The immediate objective of the partnership is to produce more and better labour market information specific to youth in developing countries, focusing in particular on transition paths to the labour market. The assumption is that governments and social partners in the project’s 28 target countries will be better prepared to design effective policy and programme initiatives once armed with detailed information on:
• what young people expect in terms of transition paths and quality of work;
• what employers expect in terms of young applicants;
• what issues prevent the two sides – supply and demand – from matching; and
• what policies and programmes can have a real impact.
5 The previous report on the main findings of SWTS 2012 (Kanol, Khemarin and Elder, 2013) can be found
on the W4Y project website at: www.ilo.org/w4y.

11
Work4Youth target countries:
Asia and the Pacific: Bangladesh, Cambodia, Nepal, Samoa, Viet Nam Eastern Europe and Central Asia: Armenia, Former Yugoslav Republic of Macedonia, Kyrgyzstan, Montenegro, Republic of Moldova, Russian Federation, Serbia, Ukraine Latin America and the Caribbean: Brazil, Colombia, Dominican Republic, El Salvador, Jamaica, Peru Middle East and North Africa: Egypt, Jordan, Lebanon, Occupied Palestinian Territories, Tunisia Sub-Saharan Africa: Benin, Liberia, Madagascar, Malawi, Republic of Congo, Sierra Leone, South Africa, Togo, Uganda, United Republic of Tanzania, Zambia
Following a pilot test of the survey and training sessions for supervisors and
enumerators, field data collection was carried out for 28 days from 21 July to 17 August
2014. Interviews were conducted by eight teams, consisting of five people.6 Youth aged
15-29 were surveyed in twenty four provinces, including the capital. The overall sample
size was 3,396 young people. The details of the sample design are presented in Annex
II.
3. Characteristics of youth in the sample survey
3.1 Individual characteristics of youth
This section provides information on the characteristics of the youth population
aged 15-29 by selected characteristics such as age group, area of residence, marital
status, educational attainment, and main current activity.
As shown in Table 7, most of the young respondents are in the age group of 15-
19 (40.9 per cent) and living in rural areas (79.8 per cent). Most youth are single (63.0
per cent) and three-tenth (29.6 per cent) of youth has children. Young women show a
greater likelihood of being married than young men (45.8 per cent married young
women compared to 25.8 per cent of married young men). Young women are also more
than twice as likely to already have children (37.8 per cent young mothers compared to
19.1 per cent young fathers). The average age of marriage was 21 years (22 years for
males and 20 years for females).
6 Annex IV provides the names of the survey personnel.
12
Table 7. Youth population by selected characteristics and sex7
Total Male Female
Number (%) Number (%) Number (%)
Age group
15-19 years 1,919,751 40.9 882,355 42.7 1,037,396 39.4
20-24 years 1,531,382 32.6 658,885 31.9 872,497 33.2
25-29 years 1,245,373 26.5 524,024 25.4 721,349 27.4
Area of residence
Urban 950,879 20.2 409,900 19.8 540,979 20.6
Rural 3,745,627 79.8 1,655,363 80.2 2,090,263 79.4
Marital status
Married (including divorced and widowed) 1,737,823 37.0 533,251 25.8 1,204,571 45.8
Single 2,958,683 63.0 1,532,012 74.2 1,426,671 54.2
With children 1,391,160 29.6 395,366 19.1 995,795 37.8
Average age of marriage 21 22 20
Main current activity
Employed 3,902,316 83.1 1,794,102 86.9 2,108,215 80.1
Unemployed 96,615 2.1 43,210 2.1 53,405 2.0
Inactive student 397,076 8.5 180,789 8.8 216,288 8.2
Inactive non-student 300,498 6.4 47,163 2.3 253335 9.6
Total youth population 4,696,506 100.0 2,065,263 100.0 2,631,242 100.0
Source: SWTS-Cambodia, 2014.
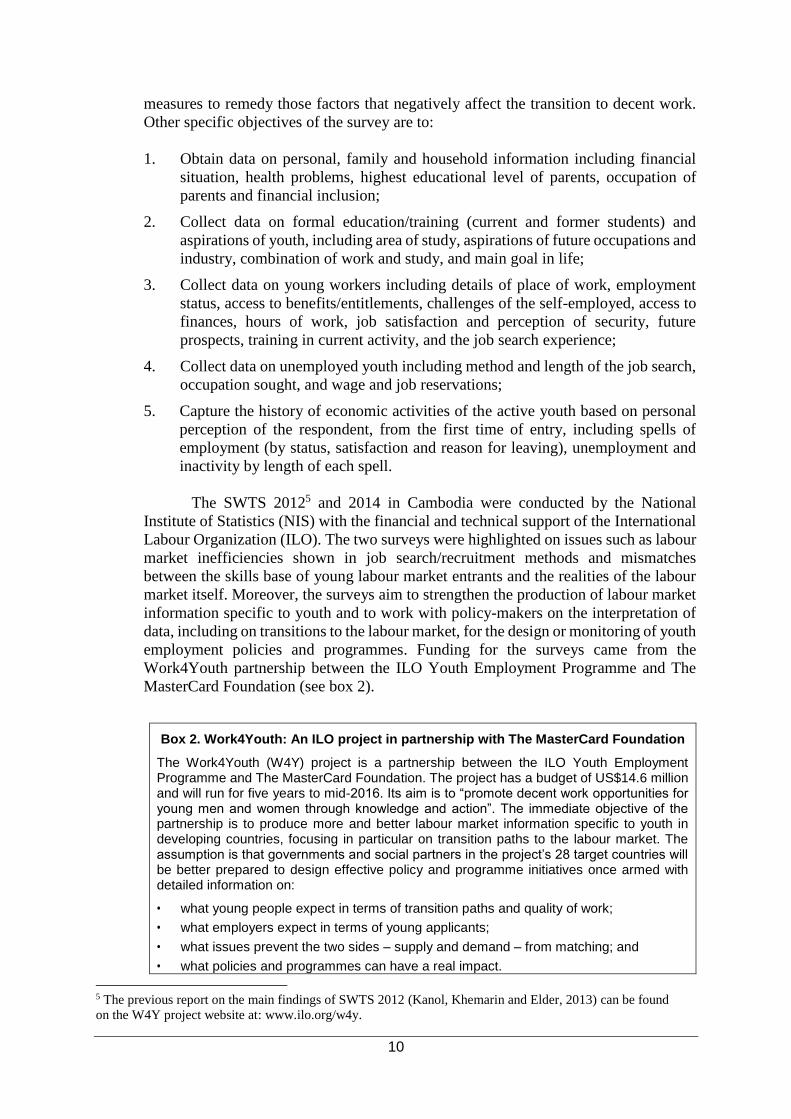
Table 8 shows a labour force participation rate of youth of 85.1 per cent and an
employment-to-population ratio that is high at 83.1 per cent (for definitions of labour
market terms, see Annex I). The high capacity of the economy to create jobs is also
reflected in the low unemployment share in the youth population (2.1 per cent). The
inactive youth population is 14.9 per cent with 8.5 per cent of the inactive youth still in
school and 6.4 per cent as inactive non-students. Young men have a higher likelihood
of being employed, unemployed and inactive students than young women. The female
share is higher than the male only in the percentage of youth who are inactive non-
students (9.6 and 2.3 per cent, respectively), which reflects a stronger female tendency
to remain inactive to care for the household.
Table 8. Key labour market indicators for youth by sex (%)
Total Male Female
Employment-to-population ratio 83.1 86.9 80.1
Unemployment-to-population ratio 2.1 2.1 2.0
Unemployment rate 2.4 2.4 2.5
Labour force participation rate 85.1 89.0 82.2
Inactivity rate 14.9 11.0 17.8
Share of inactive and out-of-school (neither in labour force nor in education/training)
6.4 2.3 9.6
Source: SWTS-Cambodia, 2014.
7 For comparison to 2012 results see Annex table A1.

13
3.2 Educational attainment
Education is the starting point for the labour market transition and there are
many determinants which affect the transition path of each individual. One of the
strongest influential factors is the level of educational attainment of the young person.
It influences the age at which young people enter the labour force, the extent to which
they are prepared for work, the job they obtain and their future career path.
Nearly three-fourths (72.2 per cent) of Cambodian youth aged 15-29 years have
finished their schooling and 27.8 per cent are still in school (Table 9). Among youth
still in school, a large share engages in some form of employment while studying (67.5
per cent) and most are studying at the secondary level (76.6 per cent).
Table 9. Educational attainment of youth by current activity status
Employed Unemployed Inactive Total
Number (%) Number (%) Number (%) Number (%)
Currently attending school
At primary level 45,446 5.2 0 0.0 15,751 4.0 61,197 4.7
At secondary level 689,685 78.3 11,905 43.9 298,397 75.1 999,986 76.6
At vocational school 15,612 1.8 603 2.2 13,113 3.3 29,329 2.2
At university and post graduate 125,761 14.3 14,417 53.1 65,405 16.5 205,583 15.8
Learning in a formal apprenticeship/internship 4,508 0.5 206 0.8 4,410 1.1 9,124 0.7
Total studying youth 881,011 100.0 27,131 100.0 397,076 100.0 1,305,219 100.0
Finished school by level of completed education
No schooling 112,709 3.7 3,008 4.3 17,623 5.9 133,340 3.9
Uncompleted primary level 52,742 1.7 0 0.0 1,521 0.5 54,263 1.6
Completed primary level 1,233,793 40.8 20,011 28.8 114,254 38.0 1,368,059 40.3
Completed secondary level 1,399,858 46.3 35,065 50.5 153,687 51.1 1,588,610 46.8
Completed vocational school 94,414 3.1 1,399 2.0 5,611 1.9 101,424 3.0
Completed university and post graduate 127,789 4.2 10,000 14.4 7,802 2.6 145,591 4.3
Total non-student youth 3,021,305 100.0 69,484 100.0 300,498 100.0 3,391,287 100.0
Source: SWTS-Cambodia, 2014.
Figure 1. Distribution of youth by completed level of educational attainment (%)
Source: SWTS-Cambodia, 2014.
3.9
1.6
40.346.8
3.0
4.3
No schooling
Uncompleted primary level
Completed primary level
Completed secondary level
Completed vocational school
Completed university and post graduate
14
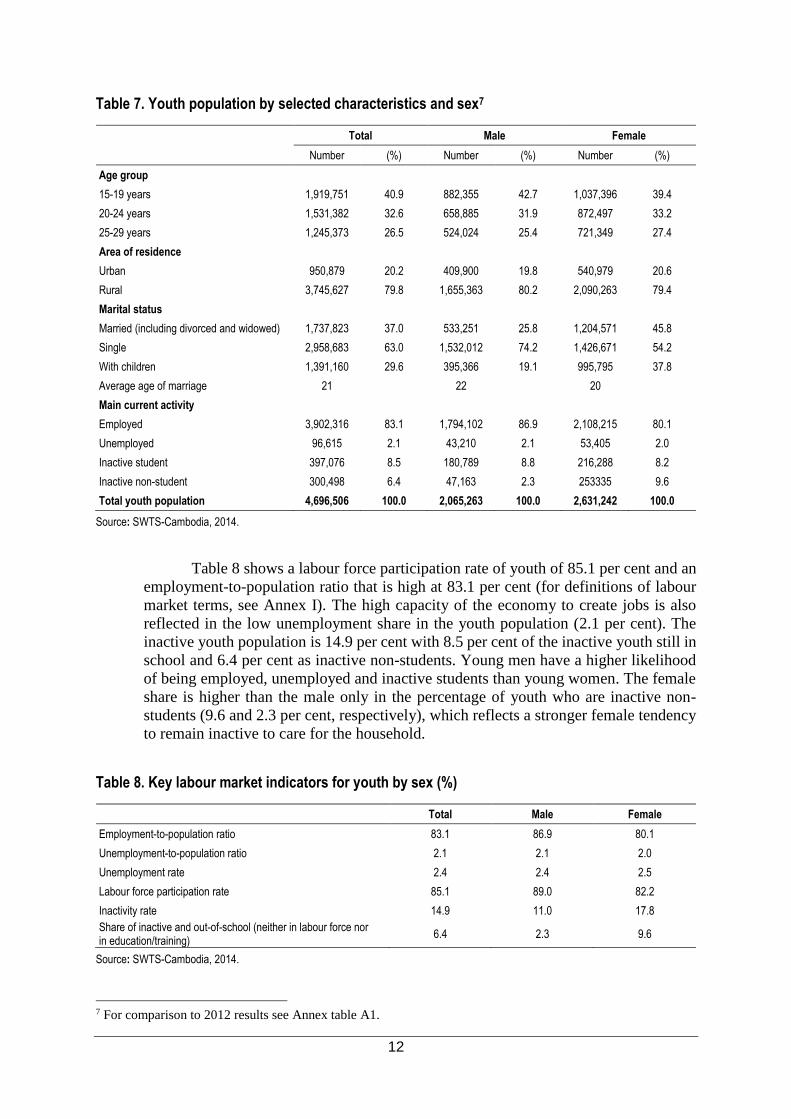
Among the youth who left school before completion, 62.0 per cent stated they
left school due to economic reasons, i.e. their family could not afford for them to
continue in school (Table 10). The second most important reason indicated by youth
early school leavers was because they wanted to start working (11.7 per cent for men
and 13.4 per cent for women). Another 9.8 per cent of young men left school because
of failed examination compare to 5.1 per cent of young women. Young women more
than men stated marriage as a reason for leaving school early (4.4 per cent and 2.3 per
cent, respectively).
Table 10. Youth with uncompleted education by reason for leaving school
Total Male Female
Number (%) Number (%) Number (%)
Failed examination 174,134 7.0 99,190 9.8 74,944 5.1
Not interested in education/training 88,117 3.5 39,079 3.9 49,037 3.3
Wanted to start working 317,044 12.7 119,150 11.7 197,894 13.4
To get married 88,152 3.5 23,171 2.3 64,981 4.4
Parents did not want me to continue 73,707 3.0 20,790 2.0 52,918 3.6
Economic reasons (could not afford, too poor, needed to earn money to support family)
1,543,431 62.0 628,132 61.9 915,299 62.0
No school nearby 104,728 4.2 30,292 3.0 74,436 5.0
Other 102,046 4.1 54,645 5.4 47,401 3.2
Total pre-primary school leavers 2,491,358 100.0 1,014,449 100.0 1,476,909 100.0
Source: SWTS-Cambodia, 2014.
There are gender differences in the area of educational attainment of youth.
First, there are more young women than men in both categories – youth who never
attended school and youth with completed education (Table 11). Second, young women
are more likely to be inactive than young men regardless of education level (no
schooling or with education). Other interesting results are that the share of
unemployment is highest among young men with no education (2.9 per cent) and that
female youth with completed education, is more likely to be employed than female
youth with no education.
Table 11. Distribution of out-of-school youth by current activity status and sex
Total Employed Unemployed Inactive
Number (%) Number (%) Number (%) Number (%)
Total out-of-school youth 3,391,287 100.0 3,021,305 89.1 69,484 2.0 300,498 8.9
Male 1,392,646 100.0 1,320,921 94.8 24,561 1.8 47,164 3.4
Female 1,998,641 100.0 1,700,384 85.1 44,923 2.2 253,334 12.7
Total youth never attended school 133,341 100.0 112,709 84.5 3,009 2.3 17,623 13.2
Male 43,699 100.0 42,429 97.1 1,270 2.9 0 0.0
Female 89,642 100.0 70,280 78.4 1,739 1.9 17,623 19.7
Total youth with completed education 3,257,946 100.0 2,908,596 89.3 66,475 2.0 282,875 8.7
Male 1,348,947 100.0 1,278,492 94.8 23,291 1.7 47,164 3.5
Female 1,908,999 100.0 1,630,104 85.4 43,184 2.3 235,711 12.3
Source: SWTS-Cambodia, 2014.

15
There has been remarkable progress in the area of educational enrolment in
Cambodia in recent years. Both young men and women today are much more likely to
have school facilities readily accessible and to also have the permission to attend them.
The situation was quite different for their parents. As shown in Table 12, 26.9 per cent
of youth indicated that their mother had never attended school and 15.5 per cent stated
their father had never attended school. Men of the previous generation were more likely
to be educated than women, with youth’s fathers showing higher levels of completed
education at all levels compared to youth’s mothers. Youth’s mothers were much more
likely to have finished at the primary level than youth’s father (49.2 per cent compared
to 43.6 per cent). About 21.8 per cent of youth’s fathers compared to 10.3 per cent of
youth’s mothers had completed secondary school. Only a small proportion of the youth
population reported that their parents completed vocational education or university or
higher education degrees.
Table 12. Educational attainment of youth's mothers and youth's fathers
Highest educational level completed
Youth's parents
Youth's mothers Youth's fathers
Number (%) Number (%)
None 1,262,276 26.9 726,150 15.5
Primary school 2,309,436 49.2 2,048,099 43.6
Secondary school 483,690 10.3 1,025,419 21.8
Vocational 75,092 1.6 122,281 2.6
University or higher 12,472 0.3 90,715 1.9
Do not know 553,539 11.8 683,841 14.6
Total youth population 4,696,506 100.0 4,696,506 100.0
Source: SWTS-Cambodia, 2014.
Table 13 shows the distribution of the highest education level of youth’s parents
by youth’s highest education level. Results are further summarized in Figure 2.
Comparing the educational attainment of parents in this table and that of the young
respondents, it is clear that the provision of education is more comprehensive in
Cambodia today. In total 54.0 per cent of youth finished their education at a level higher
than their father and 69.7 per cent finished higher than their mother. Only 6.0 per cent
of youth stated their father finished his education at a higher level than themselves and
2.0 per cent claimed to less educated than their mother.
Table 13. Educational attainment of respondent in comparison to their parents'
Highest educational level of parents
Highest educational level of youth
Uncompleted primary
Primary school
Secondary school
Vocational University or higher
Number (%) Number (%) Number (%) Number (%) Number (%)
Father
Uncompleted primary 11,517 21.2 341,599 25.0 209,940 13.2 17,135 16.9 4,037 2.8
Primary school 14,079 25.9 673,182 49.2 710,052 44.7 38,348 37.8 45,812 31.5
Secondary school 2,802 5.2 101,410 7.4 391,304 24.6 28,021 27.6 69,879 48.0
Vocational 0 0.0 10,402 0.8 30,937 1.9 7,680 7.6 6,322 4.3
University or higher 0 0.0 525 0.0 1,918 0.1 1,389 1.4 5,941 4.1
Do not know 25,864 47.7 240,941 17.6 244,459 15.4 8,852 8.7 13,601 9.3
Total 54,263 100.0 1,368,059 100.0 1,588,610 100.0 101,423 100.0 145,591 100.0

16
Mother
Uncompleted primary 19,677 36.3 530,258 38.8 414,198 26.1 18,054 17.8 17,998 12.4
Primary school 7,000 12.9 630,695 46.1 818,850 51.5 63,766 62.9 77,022 52.9
Secondary school 2,859 5.3 34,323 2.5 149,272 9.4 6,705 6.6 34,505 23.7
Vocational 0 0.0 3,838 0.3 9,917 0.6 4,871 4.8 1,389 1.0
University or higher 0 0.0 0 0.0 0 0.0 0 0.0 0 0.0
Do not know 24,727 45.6 168,945 12.3 196,373 12.4 8,028 7.9 14,676 10.1
Total 54,263 100.0 1,368,059 100.0 1,588,610 100.0 101,423 100.0 145,591 100.0
Source: SWTS-Cambodia, 2014.
Figure 2. Cross-tabulation of youth educational attainment by parental educational attainment (%)
Source: SWTS-Cambodia, 2014.
3.3 Current activity status of youth
The international standards concerning employment and unemployment
statistics are based on the labour force framework. According to this framework, the
working-age population is divided into three categories (employed, unemployed and
not economically active), depending on their labour market activities during a specified
short reference period, either a day or a week (ILO, 2008).
Table 14 presents the proportion of youth population by main economic activity.
The share of employed young men was more than that of women, at 86.9 per cent and
80.1 per cent, respectively. Thus, young women were much more likely to be inactive
compared to young men, and young men were more likely to be employed compared
to young women. About 2.1 per cent of youth were unemployed, with little difference
in the shares by sex. The remaining proportion was inactive (14.9 per cent), and the
share was higher among inactive young women (17.8 per cent compared to 11.0 per
cent of young men). The inactive group is not engaged in the labour market and includes
people who are in education, looking after family, retired or sick/disabled.
1.1 0
10.3
2.40
17.0
61.8
23.2
68.7
78.4
26.7
65.9
35.9
62.5
0.2
18.6
62.2
0.20.7 0.1 0.8 0.6 0 00.5
8.6
0 0
6.6
0
40.0
54.0
6.0
28.3
69.7
2.0
0
10
20
30
40
50
60
70
80
90
Same level asfather
Father has lowerlevel education
Father has higherlevel education
Same level asmother
Mother has lowerlevel education
Mother has higherlevel education
No schooling
Primary
Secondary
Vocational
University or higher
Total

17
Table 14. Youth population by main economic activity and sex
Total Male Female
Number (%) Number (%) Number (%)
Employed 3,902,316 83.1 1,794,102 86.9 2,108,214 80.1
Unemployed 96,615 2.1 43,210 2.1 53,405 2.0
Inactive 697,574 14.9 227,951 11.0 469,623 17.8
Total 4,696,506 100.0 2,065,263 100.0 2,631,242 100.0
Source: SWTS-Cambodia, 2014.
In the ILO Global Employment Trends for Youth 2013, the argument is made
that comparing traditional labour market indicators with a more detailed disaggregation
of indicators made available through the SWTS offers a fuller picture of the challenges
that youth face in developing economies (ILO, 2013, chapter 4). Figure 3 shows the
results for Cambodia from the survey. The SWTS framework proposes a distribution
of the youth population in the following five categories: (a) regular employment,
defined as wage and salaried workers holding a contract of duration greater than 12
months, plus self-employed youth with employees (employers); (b) irregular
employment, defined as wage and salaried workers holding a contract of limited
duration, i.e. set to terminate prior to 12 months, self-employed youth with no
employees (own-account workers) and contributing family workers; (c) unemployed
(relaxed definition), defined as persons currently without work and available to take up
work in the week prior to the reference period; (d) inactive non-students; and (e)
inactive students.
Figure 3. Youth population by category of economic activity and sex
Source: SWTS-Cambodia, 2014.
Figure 3 shows the categories of economic activity by sex. The observation is
that the greatest proportion was in irregular employment with a small difference by sex
(60.0 per cent of the total youth population). The percentage of regular employment
among young men was higher than young women (26.3 per cent and 20.5per cent
respectively). There is a higher share of young women categorized as inactive non-
students (8.7 per cent) compared to men (1.8 per cent). Overall, the small share of
8.0 8.4 7.6
5.7 1.88.7
3.3 2.93.6
60.060.6
59.6
23.1 26.320.5
0%
10%
20%
30%
40%
50%
60%
70%
80%
90%
100%
Total Male Female
Regular employment
Irregular employment
Relaxed unemployment
Inactive non-student
Inactive student
18
inactive non-students that stands at less than 6 per cent of the total population is a good
sign for the productive potential of the country.
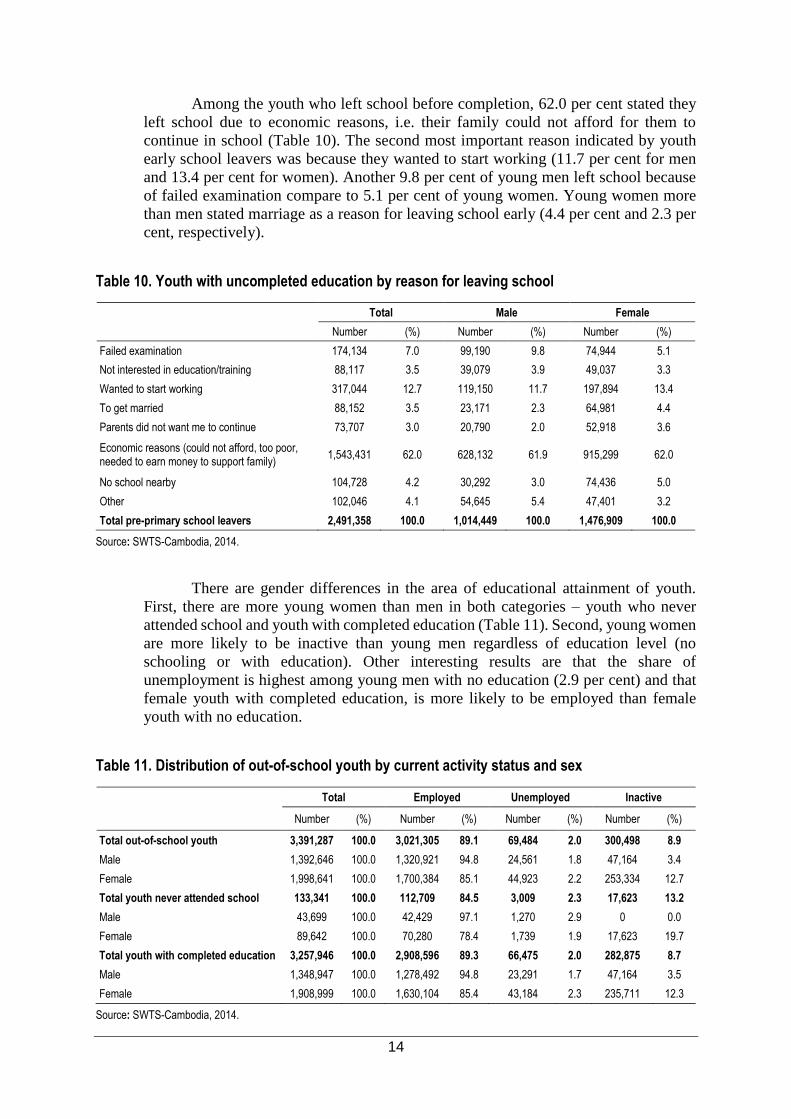
Table 15 presents data on young people neither in education nor in employment
or training (also called the NEET population). Of the total youth population in
Cambodia, 7.9 per cent fall under the NEET category, with 1.5 per cent as unemployed
non-students and 6.4 per cent as inactive non-students. The comparison shows that
young women are much more likely to fall under the NEET category than young men
(11.3 per cent compared to 3.5 per cent) and that most young female NEETs are inactive
non-students (9.6 per cent compared to 1.7 per cent young female unemployed non-
students). In addition, the distribution of NEET youth is slightly higher in urban areas
(8.1 per cent) than in rural areas (7.8 per cent).
Table 15. Distribution of NEET youth by area of residence and sex
Total youth population
Total NEET youth as a % of total
youth population
NEET status
Unemployed non-students
Inactive non-students
Number (%) Number (%)
Total youth population 4,696,506 7.9 69,484 1.5 300,498 6.4
Male 2,065,263 3.5 24,561 1.2 47,163 2.3
Female 2,631,242 11.3 44,923 1.7 253,335 9.6
Area of residence
Urban 950,879 8.1 23,352 2.5 53,358 5.6
Rural 3,745,627 7.8 46,132 1.2 247,140 6.6
Source: SWTS-Cambodia, 2014.
3.4 Aspirations and life goals
As shown in Table 16, the majority of young people (52.2 per cent for
employed, 38.2 per cent for unemployed, and 42.4 per cent for inactive) gave their
primary life goal as having a good family life. Of employed youth, 27.7 per cent said
that their goal was having lots of money, followed by 14.6 per cent who chose being
successful in work and 5.5 per cent for whom the most important life goal was making
a contribution to society. Being successful at work was cited more often as primary goal
among youth who do not have a job (35.2 per cent for unemployed) and having lots of
money was chosen by 26.9 per cent among youth who were inactive.
Table 16. Primary life goals of young respondents by current activity status
Employed Unemployed Inactive
Number (%) Number (%) Number (%)
Being successful in work 569,318 14.6 33,980 35.2 129,150 18.5
Making a contribution to society 215,256 5.5 8,022 8.3 85,436 12.2
Having lots of money 1,080,691 27.7 17,678 18.3 187,305 26.9
Having a good family life 2,037,051 52.2 36,936 38.2 295,683 42.4
Total 3,902,316 100.0 96,615 100.0 697,574 100.0
Source: SWTS-Cambodia, 2014.

19
3.5 Characteristics of unemployed youth
The ILO international standard definition of unemployment is based on the
following three criteria which should be satisfied simultaneously: “without work”,
“currently available for work” and “seeking work”. The youth unemployment rate (the
percentage of young unemployed persons in the youth labour force) was only 2.4 per
cent. This is extremely low when compared to most other countries in the world and
even within the region. According to ILO (2013), the global youth unemployment rate
in 2012 (bearing in mind that the report defines youth as 15-24 rather than 15-29 as
used in the SWTS) was 12.4 per cent and the regional youth unemployment rate in
South-East Asia and the Pacific was 9.3 per cent.
Table 17 gives the educational attainment of the young unemployed. Sixty-nine
(68.8) per cent of unemployed youth have attended school, 28.1 per cent were currently
attending school and 3.1 per cent had no schooling. Among non-student unemployed
youth, 28.8 per cent had completed primary education, following by 50.5 per cent with
completed secondary and 14.4 per cent with completed university education or higher.
Table 17. Unemployed youth by level of completed educational attainment and sex
Total Male Female
Number (%) Number (%) Number (%)
Currently attending school 27,131 28.1 18,649 43.2 8,482 15.9
Never attended school 3,008 3.1 1,270 2.9 1,739 3.3
Have attended school 66,476 68.8 23,291 53.9 43,184 80.9
Total unemployed youth 96,615 100.0 43,210 100.0 53,405 100.0
Never attended school 3,008 4.3 1,270 5.2 1,739 3.9
Uncompleted primary level 0 0.0 0 0.0 0 0.0
Primary school 20,011 28.8 8,472 34.5 11,539 25.7
Secondary school 35,065 50.5 9,532 38.8 25,533 56.8
Vocational 1,399 2.0 0 0.0 1,399 3.1
University or higher 9,999 14.4 5,286 21.5 4,713 10.5
Total non-student unemployed youth 69,482 100.0 24,560 100.0 44,923 100.0
Source: SWTS-Cambodia, 2014.
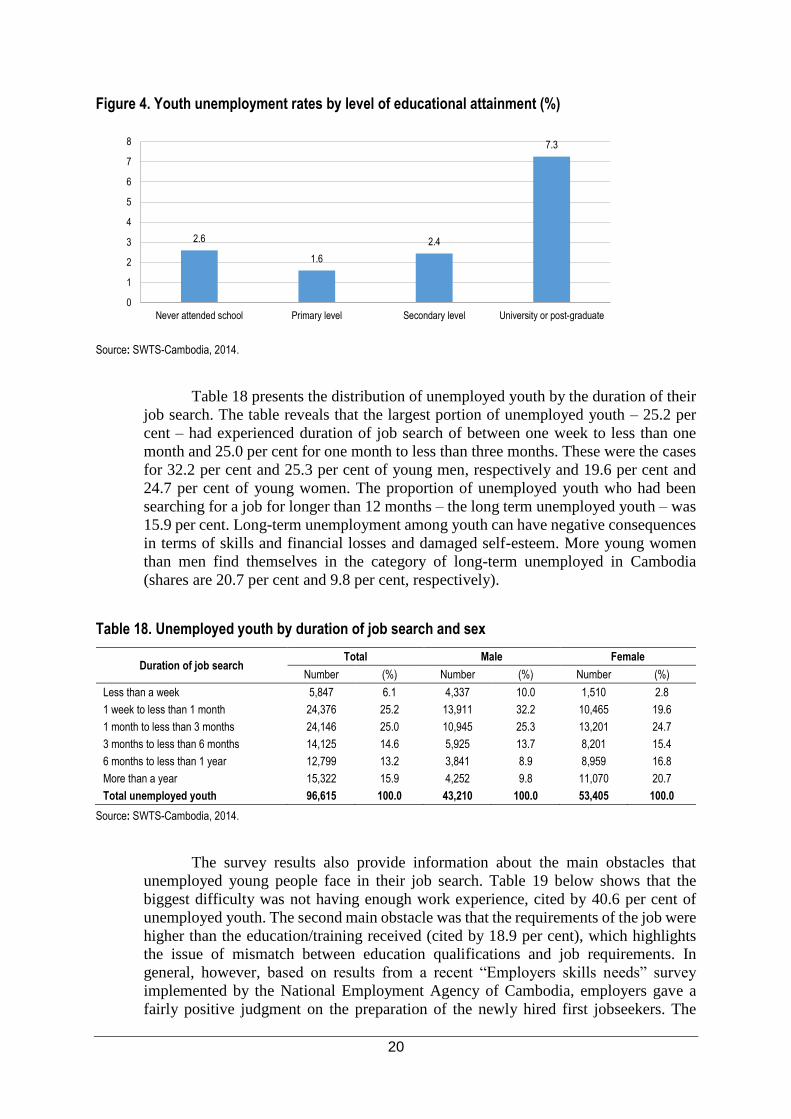
Figure 4 shows the youth unemployment rates by level of completed education.
Interestingly, the highest rate was among youth with university education (7.3 per cent
youth unemployment rate). Unemployment among youth with primary or secondary
level education – which includes most young Cambodians according to Figure 4 – are
lower, with unemployment rates of 1.6 and 2.4 per cent, respectively.
20
Figure 4. Youth unemployment rates by level of educational attainment (%)
Source: SWTS-Cambodia, 2014.
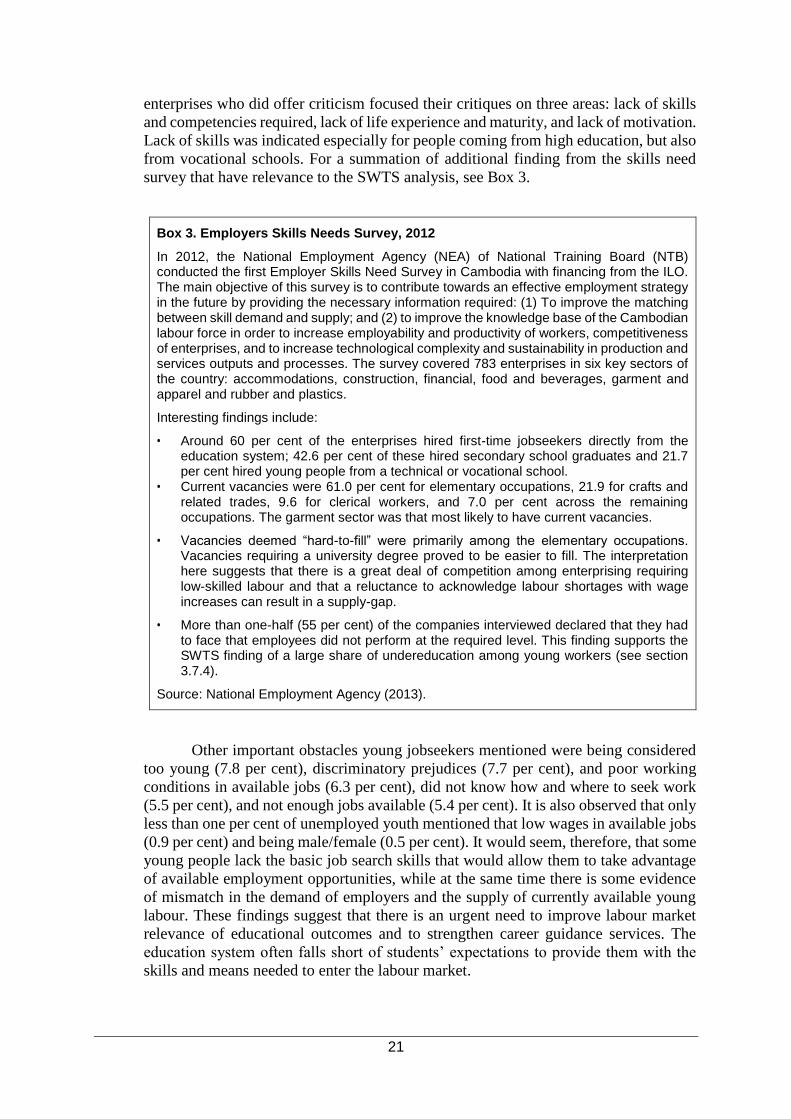
Table 18 presents the distribution of unemployed youth by the duration of their
job search. The table reveals that the largest portion of unemployed youth – 25.2 per
cent – had experienced duration of job search of between one week to less than one
month and 25.0 per cent for one month to less than three months. These were the cases
for 32.2 per cent and 25.3 per cent of young men, respectively and 19.6 per cent and
24.7 per cent of young women. The proportion of unemployed youth who had been
searching for a job for longer than 12 months – the long term unemployed youth – was
15.9 per cent. Long-term unemployment among youth can have negative consequences
in terms of skills and financial losses and damaged self-esteem. More young women
than men find themselves in the category of long-term unemployed in Cambodia
(shares are 20.7 per cent and 9.8 per cent, respectively).
Table 18. Unemployed youth by duration of job search and sex
Duration of job search Total Male Female
Number (%) Number (%) Number (%)
Less than a week 5,847 6.1 4,337 10.0 1,510 2.8
1 week to less than 1 month 24,376 25.2 13,911 32.2 10,465 19.6
1 month to less than 3 months 24,146 25.0 10,945 25.3 13,201 24.7
3 months to less than 6 months 14,125 14.6 5,925 13.7 8,201 15.4
6 months to less than 1 year 12,799 13.2 3,841 8.9 8,959 16.8
More than a year 15,322 15.9 4,252 9.8 11,070 20.7
Total unemployed youth 96,615 100.0 43,210 100.0 53,405 100.0
Source: SWTS-Cambodia, 2014.
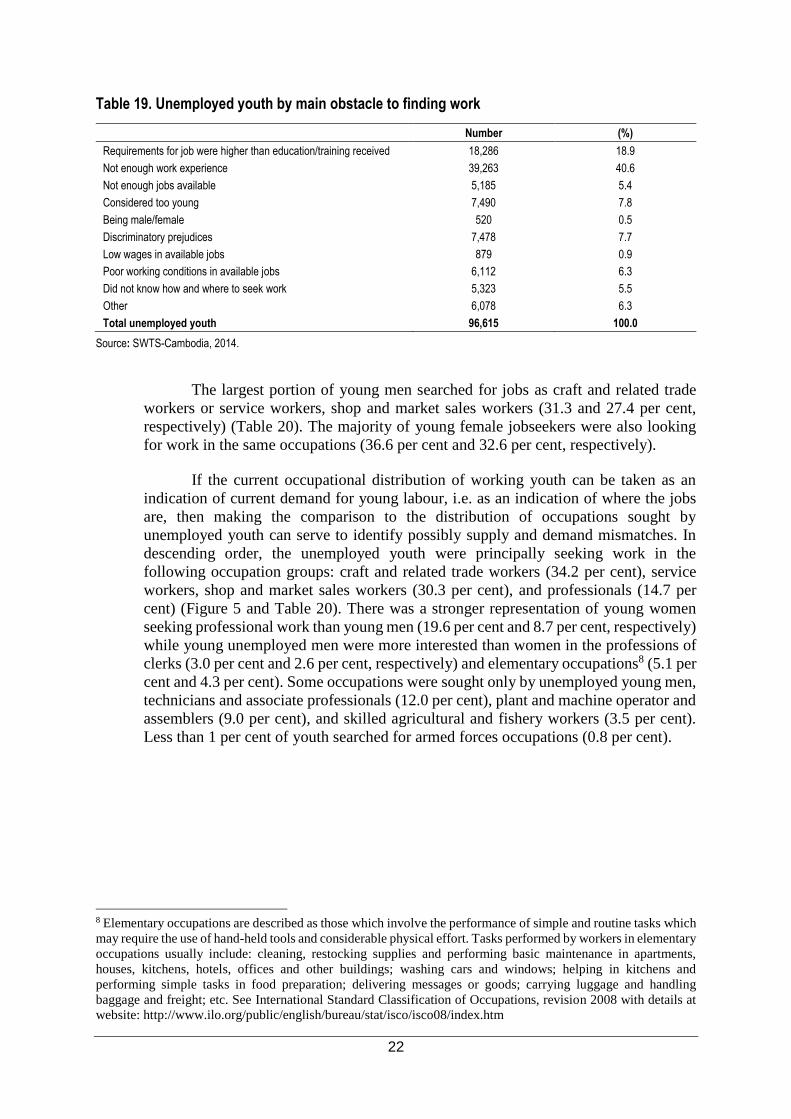
The survey results also provide information about the main obstacles that
unemployed young people face in their job search. Table 19 below shows that the
biggest difficulty was not having enough work experience, cited by 40.6 per cent of
unemployed youth. The second main obstacle was that the requirements of the job were
higher than the education/training received (cited by 18.9 per cent), which highlights
the issue of mismatch between education qualifications and job requirements. In
general, however, based on results from a recent “Employers skills needs” survey
implemented by the National Employment Agency of Cambodia, employers gave a
fairly positive judgment on the preparation of the newly hired first jobseekers. The
2.6
1.6
2.4
7.3
0
1
2
3
4
5
6
7
8
Never attended school Primary level Secondary level University or post-graduate
21
enterprises who did offer criticism focused their critiques on three areas: lack of skills
and competencies required, lack of life experience and maturity, and lack of motivation.
Lack of skills was indicated especially for people coming from high education, but also
from vocational schools. For a summation of additional finding from the skills need
survey that have relevance to the SWTS analysis, see Box 3.
Box 3. Employers Skills Needs Survey, 2012
In 2012, the National Employment Agency (NEA) of National Training Board (NTB) conducted the first Employer Skills Need Survey in Cambodia with financing from the ILO. The main objective of this survey is to contribute towards an effective employment strategy in the future by providing the necessary information required: (1) To improve the matching between skill demand and supply; and (2) to improve the knowledge base of the Cambodian labour force in order to increase employability and productivity of workers, competitiveness of enterprises, and to increase technological complexity and sustainability in production and services outputs and processes. The survey covered 783 enterprises in six key sectors of the country: accommodations, construction, financial, food and beverages, garment and apparel and rubber and plastics.
Interesting findings include:
• Around 60 per cent of the enterprises hired first-time jobseekers directly from the education system; 42.6 per cent of these hired secondary school graduates and 21.7 per cent hired young people from a technical or vocational school.
• Current vacancies were 61.0 per cent for elementary occupations, 21.9 for crafts and related trades, 9.6 for clerical workers, and 7.0 per cent across the remaining occupations. The garment sector was that most likely to have current vacancies.
• Vacancies deemed “hard-to-fill” were primarily among the elementary occupations. Vacancies requiring a university degree proved to be easier to fill. The interpretation here suggests that there is a great deal of competition among enterprising requiring low-skilled labour and that a reluctance to acknowledge labour shortages with wage increases can result in a supply-gap.
• More than one-half (55 per cent) of the companies interviewed declared that they had to face that employees did not perform at the required level. This finding supports the SWTS finding of a large share of undereducation among young workers (see section 3.7.4).
Source: National Employment Agency (2013).
Other important obstacles young jobseekers mentioned were being considered
too young (7.8 per cent), discriminatory prejudices (7.7 per cent), and poor working
conditions in available jobs (6.3 per cent), did not know how and where to seek work
(5.5 per cent), and not enough jobs available (5.4 per cent). It is also observed that only
less than one per cent of unemployed youth mentioned that low wages in available jobs
(0.9 per cent) and being male/female (0.5 per cent). It would seem, therefore, that some
young people lack the basic job search skills that would allow them to take advantage
of available employment opportunities, while at the same time there is some evidence
of mismatch in the demand of employers and the supply of currently available young
labour. These findings suggest that there is an urgent need to improve labour market
relevance of educational outcomes and to strengthen career guidance services. The
education system often falls short of students’ expectations to provide them with the
skills and means needed to enter the labour market.
22
Table 19. Unemployed youth by main obstacle to finding work
Number (%)
Requirements for job were higher than education/training received 18,286 18.9
Not enough work experience 39,263 40.6
Not enough jobs available 5,185 5.4
Considered too young 7,490 7.8
Being male/female 520 0.5
Discriminatory prejudices 7,478 7.7
Low wages in available jobs 879 0.9
Poor working conditions in available jobs 6,112 6.3
Did not know how and where to seek work 5,323 5.5
Other 6,078 6.3
Total unemployed youth 96,615 100.0
Source: SWTS-Cambodia, 2014.
The largest portion of young men searched for jobs as craft and related trade
workers or service workers, shop and market sales workers (31.3 and 27.4 per cent,
respectively) (Table 20). The majority of young female jobseekers were also looking
for work in the same occupations (36.6 per cent and 32.6 per cent, respectively).
If the current occupational distribution of working youth can be taken as an
indication of current demand for young labour, i.e. as an indication of where the jobs
are, then making the comparison to the distribution of occupations sought by
unemployed youth can serve to identify possibly supply and demand mismatches. In
descending order, the unemployed youth were principally seeking work in the
following occupation groups: craft and related trade workers (34.2 per cent), service
workers, shop and market sales workers (30.3 per cent), and professionals (14.7 per
cent) (Figure 5 and Table 20). There was a stronger representation of young women
seeking professional work than young men (19.6 per cent and 8.7 per cent, respectively)
while young unemployed men were more interested than women in the professions of
clerks (3.0 per cent and 2.6 per cent, respectively) and elementary occupations8 (5.1 per
cent and 4.3 per cent). Some occupations were sought only by unemployed young men,
technicians and associate professionals (12.0 per cent), plant and machine operator and
assemblers (9.0 per cent), and skilled agricultural and fishery workers (3.5 per cent).
Less than 1 per cent of youth searched for armed forces occupations (0.8 per cent).
8 Elementary occupations are described as those which involve the performance of simple and routine tasks which
may require the use of hand-held tools and considerable physical effort. Tasks performed by workers in elementary
occupations usually include: cleaning, restocking supplies and performing basic maintenance in apartments,
houses, kitchens, hotels, offices and other buildings; washing cars and windows; helping in kitchens and
performing simple tasks in food preparation; delivering messages or goods; carrying luggage and handling
baggage and freight; etc. See International Standard Classification of Occupations, revision 2008 with details at
website: http://www.ilo.org/public/english/bureau/stat/isco/isco08/index.htm

23
Table 20. Unemployed youth by type of occupation sought and sex
Total Male Female
Number (%) Number (%) Number (%)
Legislators, senior officials and managers 2,317 2.4 0 0.0 2,317 4.3
Professionals 14,224 14.7 3,766 8.7 10,457 19.6
Technicians and associate professionals 5,171 5.4 5,171 12.0 0 0.0
Clerks 2,696 2.8 1,317 3.0 1,379 2.6
Service workers, shop and market sales workers 29,256 30.3 11,826 27.4 17,430 32.6
Skilled agricultural and fishery workers 1,510 1.6 1,510 3.5 0 0.0
Craft and related trade workers 33,058 34.2 13,536 31.3 19,524 36.6
Plant and machine operator and assemblers 3,894 4.0 3,894 9.0 0 0.0
Elementary occupations 3,689 3.8 1,790 4.1 1,899 3.6
Armed forces 800 0.8 400 0.9 400 0.7
Total unemployed youth 96,615 100.0 43,210 100.0 53,405 100.0
Source: SWTS-Cambodia, 2014.
Figure 5. Distribution of occupations sought by unemployed youth and occupational distribution
of employed youth (%)
Source: SWTS-Cambodia, 2014.
While the occupation group “professionals” is the third most sought after by the
unemployed youth in the country, the group takes a low ranking among the distribution
of occupations of currently employed youth (fifth lowest among nine occupations).
Similarly, there is also a substantial gap between the share of youth seeking work as
craft and related trades workers and the share of youth currently working in this
occupation. What this means is that young people seeking work in these two higher
skilled occupations are likely to have to wait a very long time in the queue for the
limited number of jobs in the occupations. The young person seeking work in
elementary occupations or in skilled agriculture, on the other hand, is likely to find it
less difficult to find work. Given the large gap in the supply and demand for young
labour in the higher-skilled occupations, some of the youth with tertiary education will
end up “settling” for lesser skilled occupations such as shop work for which they are
2.4
14.7
5.42.8
30.3
1.6
34.2
4.03.8
0.43.2
1.5 1.6
20.2
45.1
18.1
2.3
7.3
0
5
10
15
20
25
30
35
40
45
50
Managers Professionals Techniciansand associateprofessionals
Clericalsupportworkers
Service andsales workers
Skilledagricultural,forestry and
fishery workers
Craft andrelated trades
workers
Plant andmachine
operators, andassemblers
Elementaryoccupations
Unemployed (occupation sought) Employed (current occupation)
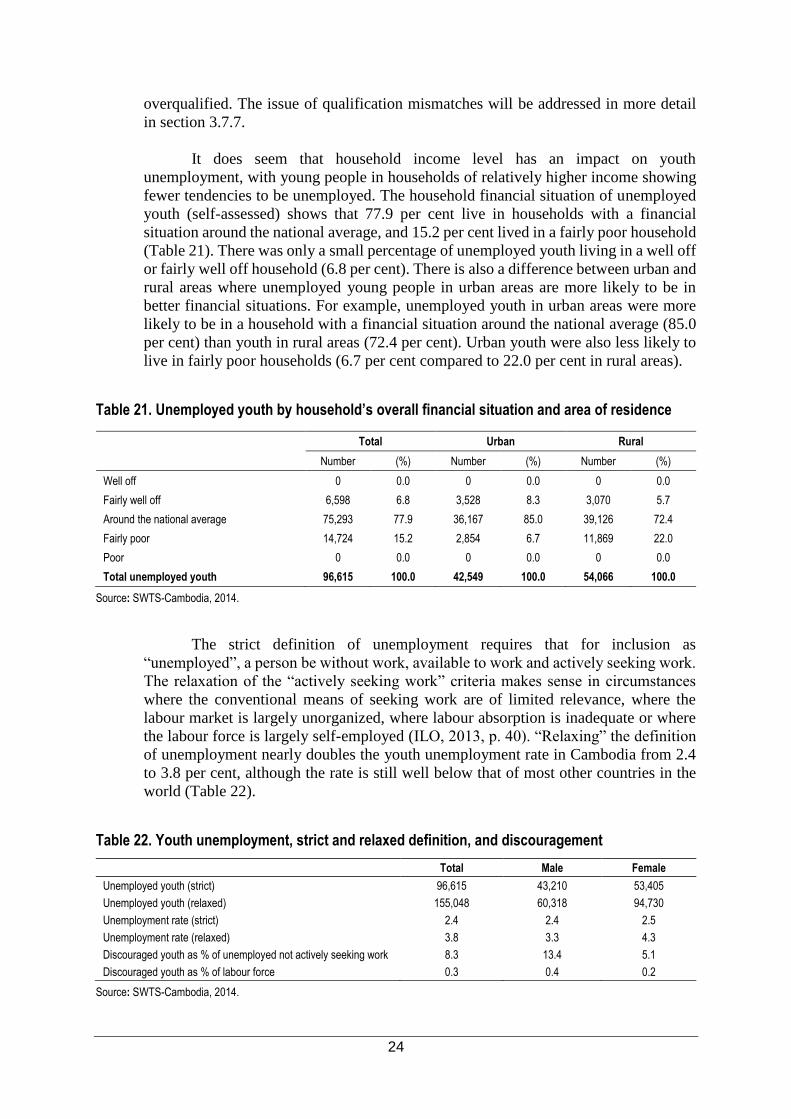
24
overqualified. The issue of qualification mismatches will be addressed in more detail
in section 3.7.7.
It does seem that household income level has an impact on youth
unemployment, with young people in households of relatively higher income showing
fewer tendencies to be unemployed. The household financial situation of unemployed
youth (self-assessed) shows that 77.9 per cent live in households with a financial
situation around the national average, and 15.2 per cent lived in a fairly poor household
(Table 21). There was only a small percentage of unemployed youth living in a well off
or fairly well off household (6.8 per cent). There is also a difference between urban and
rural areas where unemployed young people in urban areas are more likely to be in
better financial situations. For example, unemployed youth in urban areas were more
likely to be in a household with a financial situation around the national average (85.0
per cent) than youth in rural areas (72.4 per cent). Urban youth were also less likely to
live in fairly poor households (6.7 per cent compared to 22.0 per cent in rural areas).
Table 21. Unemployed youth by household’s overall financial situation and area of residence
Total Urban Rural
Number (%) Number (%) Number (%)
Well off 0 0.0 0 0.0 0 0.0
Fairly well off 6,598 6.8 3,528 8.3 3,070 5.7
Around the national average 75,293 77.9 36,167 85.0 39,126 72.4
Fairly poor 14,724 15.2 2,854 6.7 11,869 22.0
Poor 0 0.0 0 0.0 0 0.0
Total unemployed youth 96,615 100.0 42,549 100.0 54,066 100.0
Source: SWTS-Cambodia, 2014.
The strict definition of unemployment requires that for inclusion as
“unemployed”, a person be without work, available to work and actively seeking work.
The relaxation of the “actively seeking work” criteria makes sense in circumstances
where the conventional means of seeking work are of limited relevance, where the
labour market is largely unorganized, where labour absorption is inadequate or where
the labour force is largely self-employed (ILO, 2013, p. 40). “Relaxing” the definition
of unemployment nearly doubles the youth unemployment rate in Cambodia from 2.4
to 3.8 per cent, although the rate is still well below that of most other countries in the
world (Table 22).
Table 22. Youth unemployment, strict and relaxed definition, and discouragement
Total Male Female
Unemployed youth (strict) 96,615 43,210 53,405
Unemployed youth (relaxed) 155,048 60,318 94,730
Unemployment rate (strict) 2.4 2.4 2.5
Unemployment rate (relaxed) 3.8 3.3 4.3
Discouraged youth as % of unemployed not actively seeking work 8.3 13.4 5.1
Discouraged youth as % of labour force 0.3 0.4 0.2
Source: SWTS-Cambodia, 2014.
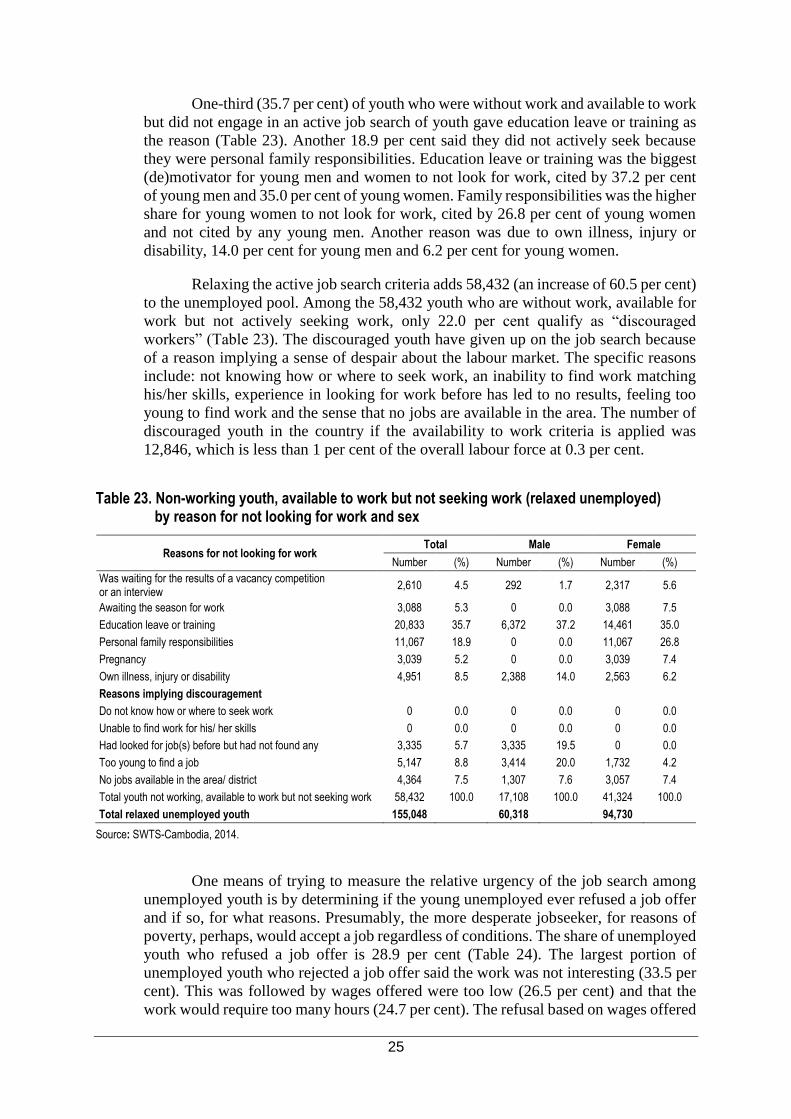
25
One-third (35.7 per cent) of youth who were without work and available to work
but did not engage in an active job search of youth gave education leave or training as
the reason (Table 23). Another 18.9 per cent said they did not actively seek because
they were personal family responsibilities. Education leave or training was the biggest
(de)motivator for young men and women to not look for work, cited by 37.2 per cent
of young men and 35.0 per cent of young women. Family responsibilities was the higher
share for young women to not look for work, cited by 26.8 per cent of young women
and not cited by any young men. Another reason was due to own illness, injury or
disability, 14.0 per cent for young men and 6.2 per cent for young women.
Relaxing the active job search criteria adds 58,432 (an increase of 60.5 per cent)
to the unemployed pool. Among the 58,432 youth who are without work, available for
work but not actively seeking work, only 22.0 per cent qualify as “discouraged
workers” (Table 23). The discouraged youth have given up on the job search because
of a reason implying a sense of despair about the labour market. The specific reasons
include: not knowing how or where to seek work, an inability to find work matching
his/her skills, experience in looking for work before has led to no results, feeling too
young to find work and the sense that no jobs are available in the area. The number of
discouraged youth in the country if the availability to work criteria is applied was
12,846, which is less than 1 per cent of the overall labour force at 0.3 per cent.
Table 23. Non-working youth, available to work but not seeking work (relaxed unemployed)
by reason for not looking for work and sex
Reasons for not looking for work Total Male Female
Number (%) Number (%) Number (%)
Was waiting for the results of a vacancy competition or an interview
2,610 4.5 292 1.7 2,317 5.6
Awaiting the season for work 3,088 5.3 0 0.0 3,088 7.5
Education leave or training 20,833 35.7 6,372 37.2 14,461 35.0
Personal family responsibilities 11,067 18.9 0 0.0 11,067 26.8
Pregnancy 3,039 5.2 0 0.0 3,039 7.4
Own illness, injury or disability 4,951 8.5 2,388 14.0 2,563 6.2
Reasons implying discouragement
Do not know how or where to seek work 0 0.0 0 0.0 0 0.0
Unable to find work for his/ her skills 0 0.0 0 0.0 0 0.0
Had looked for job(s) before but had not found any 3,335 5.7 3,335 19.5 0 0.0
Too young to find a job 5,147 8.8 3,414 20.0 1,732 4.2
No jobs available in the area/ district 4,364 7.5 1,307 7.6 3,057 7.4
Total youth not working, available to work but not seeking work 58,432 100.0 17,108 100.0 41,324 100.0
Total relaxed unemployed youth 155,048 60,318 94,730
Source: SWTS-Cambodia, 2014.
One means of trying to measure the relative urgency of the job search among
unemployed youth is by determining if the young unemployed ever refused a job offer
and if so, for what reasons. Presumably, the more desperate jobseeker, for reasons of
poverty, perhaps, would accept a job regardless of conditions. The share of unemployed
youth who refused a job offer is 28.9 per cent (Table 24). The largest portion of
unemployed youth who rejected a job offer said the work was not interesting (33.5 per
cent). This was followed by wages offered were too low (26.5 per cent) and that the
work would require too many hours (24.7 per cent). The refusal based on wages offered
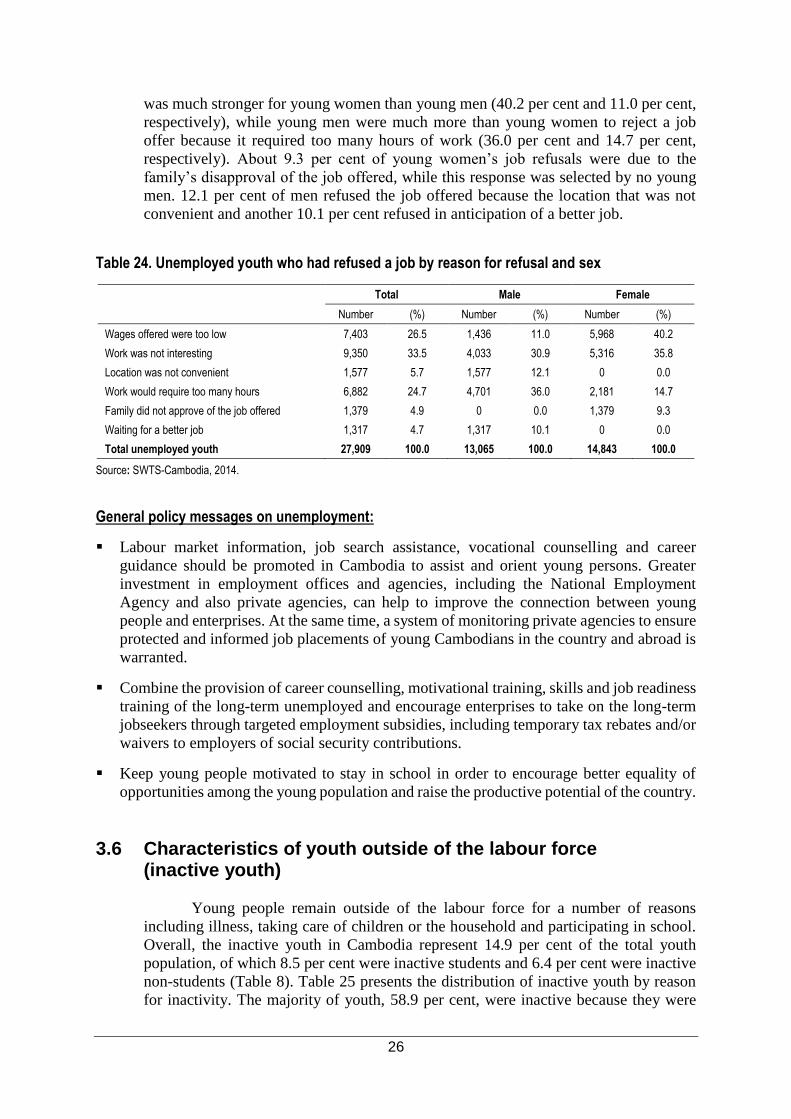
26
was much stronger for young women than young men (40.2 per cent and 11.0 per cent,
respectively), while young men were much more than young women to reject a job
offer because it required too many hours of work (36.0 per cent and 14.7 per cent,
respectively). About 9.3 per cent of young women’s job refusals were due to the
family’s disapproval of the job offered, while this response was selected by no young
men. 12.1 per cent of men refused the job offered because the location that was not
convenient and another 10.1 per cent refused in anticipation of a better job.
Table 24. Unemployed youth who had refused a job by reason for refusal and sex
Total Male Female
Number (%) Number (%) Number (%)
Wages offered were too low 7,403 26.5 1,436 11.0 5,968 40.2
Work was not interesting 9,350 33.5 4,033 30.9 5,316 35.8
Location was not convenient 1,577 5.7 1,577 12.1 0 0.0
Work would require too many hours 6,882 24.7 4,701 36.0 2,181 14.7
Family did not approve of the job offered 1,379 4.9 0 0.0 1,379 9.3
Waiting for a better job 1,317 4.7 1,317 10.1 0 0.0
Total unemployed youth 27,909 100.0 13,065 100.0 14,843 100.0
Source: SWTS-Cambodia, 2014.
General policy messages on unemployment:
Labour market information, job search assistance, vocational counselling and career
guidance should be promoted in Cambodia to assist and orient young persons. Greater
investment in employment offices and agencies, including the National Employment
Agency and also private agencies, can help to improve the connection between young
people and enterprises. At the same time, a system of monitoring private agencies to ensure
protected and informed job placements of young Cambodians in the country and abroad is
warranted.
Combine the provision of career counselling, motivational training, skills and job readiness
training of the long-term unemployed and encourage enterprises to take on the long-term
jobseekers through targeted employment subsidies, including temporary tax rebates and/or
waivers to employers of social security contributions.
Keep young people motivated to stay in school in order to encourage better equality of
opportunities among the young population and raise the productive potential of the country.
3.6 Characteristics of youth outside of the labour force (inactive youth)
Young people remain outside of the labour force for a number of reasons
including illness, taking care of children or the household and participating in school.
Overall, the inactive youth in Cambodia represent 14.9 per cent of the total youth
population, of which 8.5 per cent were inactive students and 6.4 per cent were inactive
non-students (Table 8). Table 25 presents the distribution of inactive youth by reason
for inactivity. The majority of youth, 58.9 per cent, were inactive because they were

27
attending education or training. The second most common reason was family
responsibilities or housework, mentioned by 20.4 per cent of young people, following
by pregnancy by 11.7 per cent. An important gender gap emerges here, with 29.2 per
cent of inactive young women citing family responsibilities as the main reason for
inactivity compared to only 2.4 per cent of young men. In contrast, 83 per cent of
inactive young men were attending education or training compared to 47 per cent of
inactive young women. Other reasons of inactivity for men were illness, injury or
disability (8.3 per cent), too young to work (3.2 per cent) and being the off-season for
work (2.3 per cent). For young women other reasons included pregnancy (17.5 per
cent), illness, injury or disability (3.3 per cent), and too young to work (1.5 per cent).
Table 25. Inactive youth by reasons for inactivity and sex
Total Male Female
Number (%) Number (%) Number (%)
Attending education/training 376,248 58.9 175,028 83.0 201,220 47.0
Family responsibilities or housework 130,111 20.4 5,049 2.4 125,063 29.2
Pregnancy 74,776 11.7 0 0.0 74,776 17.5
Illness, injury or disability 31,638 4.9 17,494 8.3 14,144 3.3
Too young to work 13,322 2.1 6,815 3.2 6,507 1.5
No desire to work 2,008 0.3 276 0.1 1,732 0.4
Off-season 8,280 1.3 4,901 2.3 3,379 0.8
Other 2,759 0.4 1,282 0.6 1,477 0.3
Total inactive youth (relaxed) 639,142 100.0 210,844 100.0 428,298 100.0
Source: SWTS-Cambodia, 2014.
Among the current young students, most (95.2 per cent) stated they would like
to work in the future. Most young students (78.2 per cent) aim to follow a programme
of general studies, followed by social sciences, business or law (10.6 per cent), science,
mathematics and computing (4.1 per cent), health and welfare (2.3 per cent), other
services (1.6 per cent), engineering, manufacturing and construction (1.3 per cent), and
education (1.0 per cent) (Figure 6). A large share (58.4 per cent) of young students
stated their expectation to finish their education at the university level (Table A10).
Whether household finances allow them to fulfil their expectations remains to be seen,
but young students in Cambodia should study more skilled labour market for the
development in the future.

28
Figure 6. Current young students by preferred field of study (%)
Source: SWTS-Cambodia, 2014.
3.7 Characteristics of employed youth 3.7.1 General characteristics of the employment
The employment-to-population ratio of youth in Cambodia in 2014 was 83.1
per cent (see Annex I for definition). Table 26 provides characteristics of the employed
youth population surveyed in Cambodia in terms of their age, marital status, area of
residence and sex. Most employed youth fell in the 15-19 years group (38.3 per cent)
and 20-24 years (33.3 per cent). More single than married youth were among those
employed (62.1 per cent). Nearly half (45.3 per cent) of young working females while
the share among young males was 29.2 per cent. The employed youth population was
mainly located in rural areas (83.3 per cent).
Table 26. Employed youth by age group, marital status, area of residence and sex
Total Male Female
Number (%) Number (%) Number (%)
Age group
15-19 years 1,495,591 38.3 701,212 39.1 794,379 37.7
20-24 years 1,301,158 33.3 593,594 33.1 707,564 33.6
25-29 years 1,105,567 28.3 499,295 27.8 606,272 28.8
Marital status
Married (including divorced and widowed) 1,479,065 37.9 523,004 29.2 956,062 45.3
Single 2,423,251 62.1 1,271,098 70.8 1,152,153 54.7
Area of residence
Urban 653,298 16.7 271,424 15.1 381,874 18.1
Rural 3,249,018 83.3 1,522,678 84.9 1,726,340 81.9
Total youth population 3,902,316 100.0 1,794,102 100.0 2,108,214 100.0
Source: SWTS-Cambodia, 2014.
78.2
1.0
0.6
10.6
4.1
1.3
0.4
2.3
1.6
76.7
0.8
0.5
10.8
5.6
2.1
0.2
1.4
1.9
79.7
1.1
0.8
10.4
2.6
0.4
0.5
3.2
1.3
0 10 20 30 40 50 60 70 80 90
General programmes
Education
Humanities and arts
Social sciences, business and law
Science, mathematics and computing
Engineering, manufacturing and construction
Agriculture and veterinary
Health and welfare
Other services
Female Male Total

29
3.7.2 Status in employment
Table 27 shows that of the employed respondents, the largest share were
contributing (unpaid) family workers (50.8 per cent) then wage and salaried workers
(employees) (32.5 per cent) and 16.3 per cent were own-account workers (see Annex I
for definitions). Only 0.4 per cent was self-employed with employees (“employers”).
The share of female employed youth was higher than males for the categories of
contributing (unpaid) family workers and own-account workers. On the other hand,
there was a higher percentage of male employed youth as wage and salaried workers
(34.3 and 31.1 per cent, respectively) and also as employers (0.6 per cent and 01 per
cent).
Table 27. Employed youth by status in employment and sex
Total Male Female
Number (%) Number (%) Number (%)
Wage and salaried workers (employees) 1,269,989 32.5 614,861 34.3 655,128 31.1
Contributing (unpaid) family workers 1,982,921 50.8 904,452 50.4 1,078,470 51.2
Own-account workers 635,362 16.3 263,151 14.7 372,211 17.7
Employers 14,044 0.4 11,638 0.6 2,406 0.1
Total employed youth 3,902,316 100.0 1,794,102 100.0 2,108,215 100.0
Source: SWTS-Cambodia, 2014. 3.7.3 Sector and occupations of the employment
The main economic activity of employed youth is presented in Table 28. Nearly
one-half of young workers were engaged in the agriculture sector (47.1 per cent), with
slightly more young men than women (50.8 per cent and 44.1 per cent). The services
sector absorbed 30.8 per cent of employed youth, with a higher share of females (33.3
per cent) than males (27.8 per cent). The industrial sector employs 22.1 per cent of
youth (22.7 per cent for young women and 21.4 per cent for young men). Figure 7
shows the more detailed breakdown of sectoral distribution. Clearly, employment in
agriculture dominates with employment in wholesale and retail trade a distant second
at 17.6 per cent of youth employment and manufacturing a distant third at 17.1 per cent
(with both of the latter sectors showing a higher share for young women than men). The
construction and transport sectors are fairly well represented among male employment
(8.1 and 4.8 per cent, respectively).
Table 28. Employed youth by main branches of economic activity and sex
Total Male Female
Number (%) Number (%) Number (%)
Agriculture 1,839,383 47.1 910,494 50.8 928,889 44.1
Industry 862,333 22.1 384,168 21.4 478,166 22.7
Services 1,200,600 30.8 499,440 27.8 701,160 33.3
Total employed youth 3,902,316 100.0 1,794,102 100.0 2,108,215 100.0
Source: SWTS-Cambodia, 2014.

30
Figure 7. Distribution of youth employment by sector at the 1-digit level and sex (%)
Note: Only sectors showing greater than 1 per cent of total employment are displayed.
Source: SWTS-Cambodia, 2014.
Table 29 presents the distribution of the employed youth by occupation. It
shows that 45.1 per cent were skilled agricultural and fishery workers, 20.2 per cent
were service and sales workers, 18.1 per cent were in craft and related trade workers,
while 7.3 per cent were in elementary occupations. A comparison by sex reveals that
the largest difference in occupational categories was in services and sales, which
employed 25.8 per cent of young women and 13.6 per cent of young men, followed by
elementary occupations which employed 10.4 per cent of young men and 4.7 per cent
of young women. Noticeably, the armed forces occupations had less than one per cent
of total employed youth.
Table 29. Employed youth by occupation and sex
Total Male Female
Number (%) Number (%) Number (%)
Managers 17,003 0.4 7,425 0.4 9,577 0.5
Professionals 123,629 3.2 52,424 2.9 71,205 3.4
Technicians and associate professionals 60,447 1.5 26,277 1.5 34,170 1.6
Clerical support workers 62,991 1.6 17,994 1.0 44,997 2.1
Service and sales workers 788,778 20.2 244,157 13.6 544,621 25.8
Skilled agricultural and fishery workers 1,759,731 45.1 857,999 47.8 901,732 42.8
Craft and related trade workers 705,597 18.1 311,200 17.3 394,397 18.7
Plant and machine operator and assemblers 88,925 2.3 80,801 4.5 8,123 0.4
Elementary occupations 285,092 7.3 185,701 10.4 99,391 4.7
Armed forces 10,124 0.3 10,124 0.6 0 0.0
Total employed youth 3,902,316 100.0 1,794,102 100.0 2,108,215 100.0
Source: SWTS-Cambodia, 2014.
50.7
13.6
12.1
8.1
4.8
1.7
1.6
1.2
0.9
0.9
44.1
21.1
21.3
1.0
0.3
2.2
2.5
0.8
1.1
2.2
47.1
17.6
17.1
4.3
2.4
2.0
2.1
1.0
1.0
1.6
0 10 20 30 40 50 60
Agriculture
Wholesale and retail trade
Manufacturing
Construction
Transport
Education
Accommodation
Administrative and support activities
Information and communication
Other services
Total Female Male

31
3.7.4 Wage employment
Slightly more than one-third (32.5 per cent) of young workers in Cambodia
qualify as wage and salaried workers. Table 30 presents the number of young
employees who received benefits from their jobs. The highest share received benefits
in terms of meals or meal allowance (46.1 per cent), followed by overtime pay (44.2
per cent), annual paid leave (40.0 per cent), bonus/reward for good performance (36.2
per cent), and maternity/paternity leave (32.0 per cent). It can also be observed that a
very small percentage of young employees received pension/old age insurance (9.8 per
cent) and childcare facilities (1.5 per cent).
Table 30. Young wage and salaried workers by access to benefits/entitlements and sex
Total Male Female
Number (%) Number (%) Number (%)
Transport or transport allowance 430,382 33.9 145,091 23.6 285,291 43.5
Meals or meal allowance 584,926 46.1 236,845 38.5 348,081 53.1
Annual paid leave (holiday time) 508,513 40.0 172,086 28.0 336,426 51.4
Paid sick leave 369,688 29.1 145,730 23.7 223,958 34.2
Pension/ old age insurance 124,291 9.8 60,965 9.9 63,326 9.7
Severance/ end of service payment 293,545 23.1 100,368 16.3 193,177 29.5
Overtime pay 561,774 44.2 187,216 30.4 374,558 57.2
Medical insurance coverage 297,637 23.4 89,560 14.6 208,077 31.8
Bonus/reward for good performance 460,370 36.2 156,592 25.5 303,778 46.4
Social security contribution 196,577 15.5 78,324 12.7 118,253 18.1
Educational or training courses 281,770 22.2 103,493 16.8 178,278 27.2
Occupational safety/protective equipment or clothing
290,631 22.9 111,569 18.1 179,062 27.3
Childcare facilities 19,360 1.5 7,905 1.3 11,455 1.7
Maternity/paternity leave 406,961 32.0 103,506 16.8 303,455 46.3
Total wage/salaried workers 1,269,989 614,861 655,128
Source: SWTS-Cambodia, 2014.
Regarding the type of contract held by employed youth, the SWTS found that
about one-half (52.7 per cent) of young employees were engaged on an oral agreement,
while 47.3 per cent had a written agreement (Table 31). In addition, 73.1 per cent of
youth with an employment contract had a contract of unlimited duration (without time
limit). Among those with a contract of limited duration, 15.8 per cent held a contract of
12 months or less.

32
Table 31. Young wage and salaried workers by type of contract, area of residence and sex
Total Male Female
Number (%) Number (%) Number (%)
Total (Urban + Rural)
Written agreement 600,734 47.3 214,762 34.9 385,972 58.9
Oral agreement 669,255 52.7 400,099 65.1 269,156 41.1
Unlimited duration 928,977 73.1 467,068 76.0 461,908 70.5
Limited duration 341,012 26.9 147,793 24.0 193,220 29.5
Less than 12 months 200,748 15.8 83,721 13.6 117,027 17.9
12 months to less than 36 months 58,082 4.6 23,913 3.9 34,168 5.2
36 months or more 82,182 6.5 40,158 6.5 42,024 6.4
Total young wage and salaried workers 1,269,989 100.0 614,861 100.0 655,128 100.0
Urban areas
Written agreement 160,323 47.0 73,730 48.1 86,593 46.1
Oral agreement 181,134 53.0 79,707 51.9 101,428 53.9
Unlimited duration 249,227 73.0 112,627 73.4 136,600 72.7
Limited duration 92,230 27.0 40,809 26.6 51,421 27.3
Less than 12 months 25,749 7.5 11,602 7.6 14,148 7.5
12 months to less than 36 months 17,480 5.1 4,576 3.0 12,903 6.9
36 months or more 49,001 14.4 24,631 16.1 24,370 13.0
Total young wage and salaried workers 341,457 100.0 153,437 100.0 188,021 100.0
Rural areas
Written agreement 440,411 47.4 141,032 30.6 299,379 64.1
Oral agreement 488,121 52.6 320,392 69.4 167,728 35.9
Unlimited duration 679,749 73.2 354,441 76.8 325,308 69.6
Limited duration 248,783 26.8 106,983 23.2 141,799 30.4
Less than 12 months 174,999 18.8 72,120 15.6 102,879 22.0
12 months to less than 36 months 40,602 4.4 19,337 4.2 21,265 4.6
36 months or more 33,181 3.6 15,527 3.4 17,655 3.8
Total young wage and salaried workers 928,532 100.0 461,424 100.0 467,107 100.0
Source: SWTS-Cambodia, 2014.
3.7.5 Self-employment
Self-employed youth represent 67.5 per cent of total young workers in
Cambodia, summing 16.3 per cent young own-account workers, 50.8 per cent young
contributing (unpaid) family workers and 0.4 per cent young employers. Table 32
presents the reasons why young own-account workers have taken up such work. The
largest share, 40.6 per cent, chose to be self-employed because it allowed them greater
independence for their own business. The second and third most common reasons imply
that the young person turned to self-employment for involuntary reasons; 23.5 per cent
stated they followed the family requirement and 21.6 per cent said they were able to
find higher income level, following by 11.9 per cent said they had been unable to find
a waged or salaried job. These four reasons are found in both urban and rural areas.
However, the reason of greater independence was cited more often by urban than rural
youth (45.5 per cent and 39.9 per cent, respectively), and higher income level were
more common for urban than rural youth (27.9 per cent and 20.7 per cent, respectively),
while family requirements were more common for rural than urban youth (24.3 per cent
and 18.1 per cent, respectively).

33
Table 32. Young own-account worker by reason for self-employment and area of residence
Total Urban Rural
Number (%) Number (%) Number (%)
Could not find a wage or salary job 77,334 11.9 6,029 7.5 71,304 12.5
Greater independence 263,630 40.6 36,648 45.5 226,981 39.9
More flexible hours of work 14,940 2.3 786 1.0 14,155 2.5
Higher income level 140,009 21.6 22,501 27.9 117,508 20.7
Required by the family 152,542 23.5 14,586 18.1 137,957 24.3
Other 951 0.1 0 0.0 951 0.2
Total self-employed workers 649,406 100.0 80,551 100.0 568,855 100.0
Source: SWTS-Cambodia, 2014.
The young self-employed claim their most significant business challenge as
insufficient financial resources (43.9 per cent) (Table A8). Competition in the market
and labour shortage are the second and third position (23.0 and 10.9 per cent,
respectively). Table A9 confirms that very few of the self-employed are accessing
formal financial services. Only 3.0 per cent of young self-employed youth took a bank
loan to start their business. About 7.8 per cent received a loan from a microfinance
institution, 3.0 per cent of young self-employed youth took a bank loan to start their
business, and 2.1 per cent took a loan from an informal loan operator, but by far the
largest shares used their own funds (51.2 per cent) or received the funds from their
family or friends (31.1 per cent).
3.7.6 Hours of work and involuntary part-time work
Figure 8 shows the distribution of youth employment by actual hours worked
per week. Most young people work full time: 54.9 per cent of working youth work at
least 40 hours per week. Nearly one-thirds (32.6) per cent of working youth can be said
to work an excessive number of hours (50 or more hours per week). About 34.9 per
cent of youth work part-time (less than 30 hours per week) with only a small portion
(8.6 per cent) stating they would like to work more hours (Table 33). There is little
difference in hours of work between the sexes; slightly more young women work long
hours (greater than 50 hours per week) than young men (33.0 per cent and 32.1 per cent,
respectively). Also, the tendency towards long hours is slightly greater in urban areas
compared to rural areas (39.9 per cent and 31.1 per cent, respectively).
Figure 8. Distribution of youth employment by actual hours worked per week by sex (%)
Source: SWTS-Cambodia, 2014.
6.1
11.1
16.3
11.6
21.7
13.9
19.4
6.0
10.7
17.9
11.5
21.7
14.5
17.8
6.2
11.4
15.0
11.7
21.7
13.3
20.7
0
5
10
15
20
25
Less than 10 hours 10 to 19 hours 20 to 29 hours 30 to 39 hours 40 to 49 hours 50 to 59 hours More than 60 hours
Total Male Female
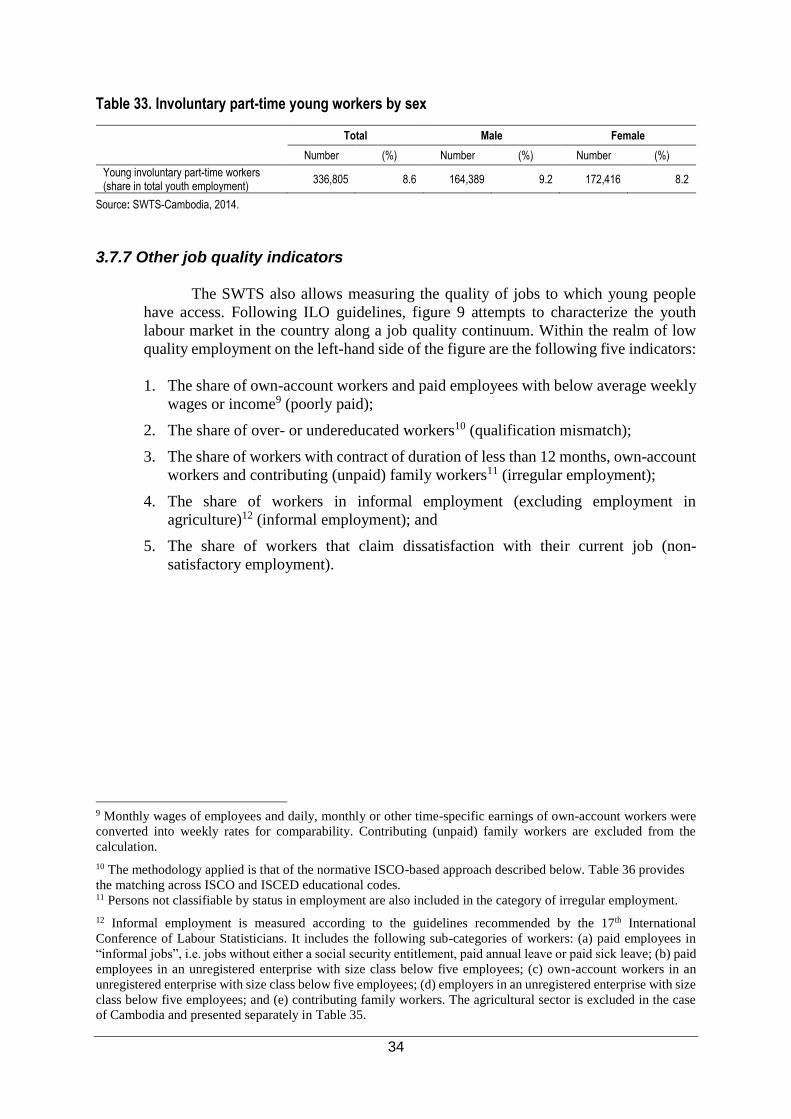
34
Table 33. Involuntary part-time young workers by sex
Total Male Female
Number (%) Number (%) Number (%)
Young involuntary part-time workers (share in total youth employment)
336,805 8.6 164,389 9.2 172,416 8.2
Source: SWTS-Cambodia, 2014. 3.7.7 Other job quality indicators
The SWTS also allows measuring the quality of jobs to which young people
have access. Following ILO guidelines, figure 9 attempts to characterize the youth
labour market in the country along a job quality continuum. Within the realm of low
quality employment on the left-hand side of the figure are the following five indicators:
1. The share of own-account workers and paid employees with below average weekly
wages or income9 (poorly paid);
2. The share of over- or undereducated workers10 (qualification mismatch);
3. The share of workers with contract of duration of less than 12 months, own-account
workers and contributing (unpaid) family workers11 (irregular employment);
4. The share of workers in informal employment (excluding employment in
agriculture)12 (informal employment); and
5. The share of workers that claim dissatisfaction with their current job (non-
satisfactory employment).
9 Monthly wages of employees and daily, monthly or other time-specific earnings of own-account workers were
converted into weekly rates for comparability. Contributing (unpaid) family workers are excluded from the
calculation.
10 The methodology applied is that of the normative ISCO-based approach described below. Table 36 provides
the matching across ISCO and ISCED educational codes. 11 Persons not classifiable by status in employment are also included in the category of irregular employment.
12 Informal employment is measured according to the guidelines recommended by the 17th International
Conference of Labour Statisticians. It includes the following sub-categories of workers: (a) paid employees in
“informal jobs”, i.e. jobs without either a social security entitlement, paid annual leave or paid sick leave; (b) paid
employees in an unregistered enterprise with size class below five employees; (c) own-account workers in an
unregistered enterprise with size class below five employees; (d) employers in an unregistered enterprise with size
class below five employees; and (e) contributing family workers. The agricultural sector is excluded in the case
of Cambodia and presented separately in Table 35.

35
Figure 9. Indicators measuring quality of youth employment (%)
Note: The indicators are shares in total youth employment (aged 15-29), except for (a) the shares of workers earning below and average and above-average wages, which are percentages of young employees and own-account workers only, and (b) overeducated and undereducated workers, which are percentages of employed youth with completed education (i.e. excluding currently working students).
Source: SWTS-Cambodia, 2014.
The blue bars of the figure represents the shares of better quality employment
based on above average wages, qualifications, stability, formality (security), and
satisfaction. Unfortunately, there is a greater presence of red, representing “low quality”
work, in the chart, which indicates numerous issues of concerns regarding the quality
of available work in the country. First, low pay is an issue. Slightly more than three-
quarters (75.4 per cent) of employees and own-account workers are taking home less
than the average weekly wages. At the same time nearly three-quarters (72.2 per cent)
of young workers are in what we classify as irregular work (self-employment plus
employees with temporary contracts). The temporary nature of the contract and
sporadic nature of self-employment are likely to impact on the sense of security and
well-being of the youth. Improve conditions of work by ensuring equal treatment for
and rights of young workers.
Adding more detail to the issue of low wages, Table 34 presents the average
monthly wages of young employees and own-account workers by occupation. The table
shows little wage advantage to being a paid employee as opposed to working as an own-
account worker. The average wage of the young paid employee (657,962 Riels per
month) is only slightly higher than the own-account worker (654,698 Riels per month).
Among employees and own-account workers, the average pay of young males is higher
than young females, but the gender wage gaps varies by occupation. Regarding the
occupational distribution, wages are highest among managers followed by
professionals within the employees group. The most lucrative profession among young
own-account workers also appears to be professionals, followed by technicians and
associate professionals and plant and machine operators.
94.4
51.2
27.8
49.4
24.6
5.6
48.8
72.2
50.6
75.4
0% 10% 20% 30% 40% 50% 60% 70% 80% 90% 100%
Satisfactory/Non-satisfactory
Formal/Informal (excluding Agriculture)
Regular/Irregular (contract/status)
Qualifications match/Qualfications mismatch (over- orundereducated)
Well paid/Poorly paid
Quality work Low quality work

36
Table 34. Average monthly wages (in Riels)13 of employees and own-account workers by occupation and sex
Average monthly wage in Riels Employees Own-account workers
Total Male Female Total Male Female
Managers 922,473 1,197,827 794,548 800,000 800,000 0
Professionals 800,700 698,824 868,648 1,615,931 1,550,378 2,000,000
Technicians and associate professionals 610,184 690,848 561,313 1,185,136 471,335 3,000,000
Clerks 666,657 544,237 731,575 600,000 0 600,000
Service workers shop and market sales workers 482,881 536,090 457,631 878,486 942,578 861,183
Skilled agricultural and fishery workers 666,036 829,975 422,270 483,440 591,544 363,242
Craft and related trade workers 671,674 763,614 602,719 443,130 552,771 370,393
Plant and machine operator and assemblers 874,957 913,859 553,629 1,111,552 1,114,294 1,080,000
Elementary occupations 612,188 616,559 604,031 681,175 686,023 650,000
Armed forces 524,111 524,111 0 0 0 0
Total 657,962 706,071 612,818 654,698 696,502 625,143
Source: SWTS-Cambodia, 2014.
Informal employment is a significant concern in Cambodia. Table 35 shows that
48.8 per cent of young workers in Cambodia fall into the category of informal
employment. This share is likely to be severely underestimated due to the exclusion of
the agricultural sector, where half of young workers are engaged. Informal employment
in the agricultural sector is likely to exist in large numbers. Within the category of
informal employment, 51.9 per cent are in employment in the informal sector (meaning
they are working in unregistered enterprises) and 48.1 per cent are in an informal job
in the formal sector (without social security benefits and/or paid annual or sick leave).
Young female workers have a slightly higher change of engaging in informal
employment (51.7 per cent compared to 45.4 per cent for young men), and within the
category are more likely than young men to be engaged in the informal sector as
opposed to working under an informal arrangement in the formal sector.
Table 35. Share of employed youth in informal employment by sex
Total Male Female
Number (%) Number (%) Number (%)
Total youth employment 3,902,316 100.0 1,794,102 100.0 2,108,215 100.0
Youth informal employment (excluding agriculture)
1,904,187 48.8 814,823 45.4 1,089,363 51.7
Employment in the informal sector (share in informal employment)
988,169 51.9 391,672 48.1 596,496 54.8
Informal employment outside the informal sector (share in informal employment)
916,018 48.1 423,151 51.9 492,867 45.2
Youth formal employment (excluding agriculture)
158,747 4.1 68,785 3.8 89,962 4.3
Youth employment in agriculture 1,839,383 47.1 910,494 50.7 928,889 44.1
Source: SWTS-Cambodia, 2014.
13 As of 30 June 2014, the National Bank of Cambodia, Official exchange rate was 4,040 Cambodian Riels to
the US dollar.

37
Qualification mismatch
One means of measuring the mismatch between the job that a person does and
their level of educational qualifications is to apply the normative measure of
occupational skills categories from the International Standard Classification of
Occupations (ISCO). ISCO-08 includes a categorization of major occupational groups
(first-digit ISCO levels) by level of education in accordance with the International
Standard Classification of Education (ISCED)14 that is reproduced in Table 36.
Table 36. ISCO Major groups and education levels
ISCO major group Broad occupation group Education level
Managers
High-skilled non-manual Tertiary (ISCED 5-6) Professionals
Technicians and associate professionals
Clerical support workers Low-skilled non-manual
Secondary (ISCED 3-4)
Service and sales workers
Skilled agricultural and fishery workers
Skilled manual Craft and related trades workers
Plant and machine operators and assemblers
Elementary occupations Unskilled Primary (ISCED 1-2)
Source: ILO, 2013, table 3.
Workers in a particular group who have the assigned level of education are
considered well-matched. Those who have a higher level of education are considered
over-overeducated and those with a lower level of education are considered
undereducated. For instance, a university graduate working as a clerk (a low-skilled
non-manual occupation) is overeducated, while a secondary school graduate working
as an engineer (a high-skilled non-manual occupation) is undereducated.
The result for Cambodian youth is that a slight majority of young workers are
in occupations that match their level of education (49.4 per cent) compared to workers
whose occupations they are overeducated or undereducated for (50.6 per cent) (Figure
9). Table 37 provides the breakdown: 5.6 per cent of young working Cambodians is
overeducated and 45.0 per cent is undereducated. The results are, in part, a reflection
of the levels of education attained by youth in the country. With a substantial share of
employed youth completing education at the secondary or primary level, it is not overly
surprising to find more youth classified as undereducated than overeducated.
The phenomenon of overeducation tends to take place when there is an
insufficient number of jobs that match a certain level of education. The mismatch in
supply and demand forces some of the degree holders to take up available work that
they are subsequently overqualified for. The consequence is the overeducated youth is
likely to earn less than s/he otherwise could have and is also not making the most of
his/her productive potential. Another consequence is the crowding out of youth at the
14 For more information on this ISCO-based along with other methods of measuring skills mismatches, see
Quintini (2011).

38
bottom of the educational pyramid. The less-educated youth find themselves at the back
of the queue even for those jobs for which they are best qualified.
Table 37 supports the premise that some highly educated young people in the
country are having to “settle” for jobs that they are overqualified for – for example, as
clerical support workers or general labourers (within the elementary occupations). On
the other hand, there are many more young people holding positions that do not match
perfectly to their education degree. Technicians and associate professionals,
professionals, managers, and skilled agricultural workers in the country have at least a
one in two chance of being undereducated than the job calls for. The undereducation of
workers can have a severe impact on labour productivity and can be a significant
hindrance to economic growth.
Table 37. Shares of overeducated and undereducated young workers by major occupational
category (ISCO-08, %)
Major occupational categories (ISCO-08) Overeducated Undereducated
Managers 0.0 63.2
Professionals 0.0 72.3
Technicians and associate professionals 0.0 81.3
Clerical support workers 35.1 7.7
Service and sales workers 7.1 35.8
Skilled agricultural and fishery workers 1.1 56.9
Craft and related trade workers 2.1 38.3
Plant and machine operator and assemblers 0.0 36.0
Elementary occupations 34.1 11.5
Share in total non-student youth employment 5.6 45.0
Source: SWTS-Cambodia, 2014. 3.7.8 Security and satisfaction
One surprising element that came in the examination of job quality indicators
in Figure 10 is that despite some indications of poor quality employment, the vast
majority of young people have expressed satisfaction with their work (including both
paid and self-employment) (94.4 per cent) (Table A6). The seeming contradiction of a
young person working in a job that might bring little in terms of monetary reward and
stability claiming job satisfaction is a likely reflection of the ability of youth to adapt to
realities where not many “good” jobs exist. In the context of a fast-growth, full
employment market with very low unemployment rates, simply having a job seems to
outweigh issues of poor job quality.
One can dig further into issues of job satisfaction by the indication of whether
or not the working youth would like to change his/her job. A significant share of young
workers (53.0 per cent) said they would like to change their job. The most common
reasons for wanting to change work are to have a higher pay per hour (44.1 per cent),
the temporary nature of the work (26.6 per cent) and to improve working conditions
(12.7 per cent) (Figure 10).

39
Most of the working youth in the country believed they would be able to keep
their main job within the period of 12 months from the reference date (90.2 per cent of
working youth). Only 7.8 per cent felt they would not be able to work at the same job
over the coming period (the remaining 2.0 per cent of young workers was unable to
judge).
Figure 10. Employed youth who would like to change their work by reason (%)
Source: SWTS-Cambodia, 2014. 3.7.9 The job search
Young people were asked about their job search method, and the information
presented in Table 38 allows comparability across employed (in how they found their
job) and unemployed youth (in how they are looking for a job). With respect to
employed youth, most of them joined the family establishment (45.5 per cent), followed
at a large distance by 33.9 per cent who looked for their current job by using informal
networks of friends, relatives and acquaintances. However, the largest portion of
unemployed youth looked for work among their network of friends, relatives and family
(44.9 per cent). Curiously, the second and third most common job search methods used
by the unemployed – placing or answering job advertisements (25.7 per cent) and
inquiring directly at workplaces (12.0 per cent) – did not prove to be hugely successful
methods for the currently employed. Only 1.8 per cent of unemployed youth and 0.7
per cent of employment were registered at an employment center.
26.6
3.1
4.6
44.1
1.4
6.1
1.4
12.7
0 10 20 30 40 50
Present job is temporary
Fear of losing present job
To work more hours paid at current rate
To have a higher pay per hour
To work less hours with a reduction in pay
To use better your qualifications/skills
To have more convenient working time
To improve working conditions
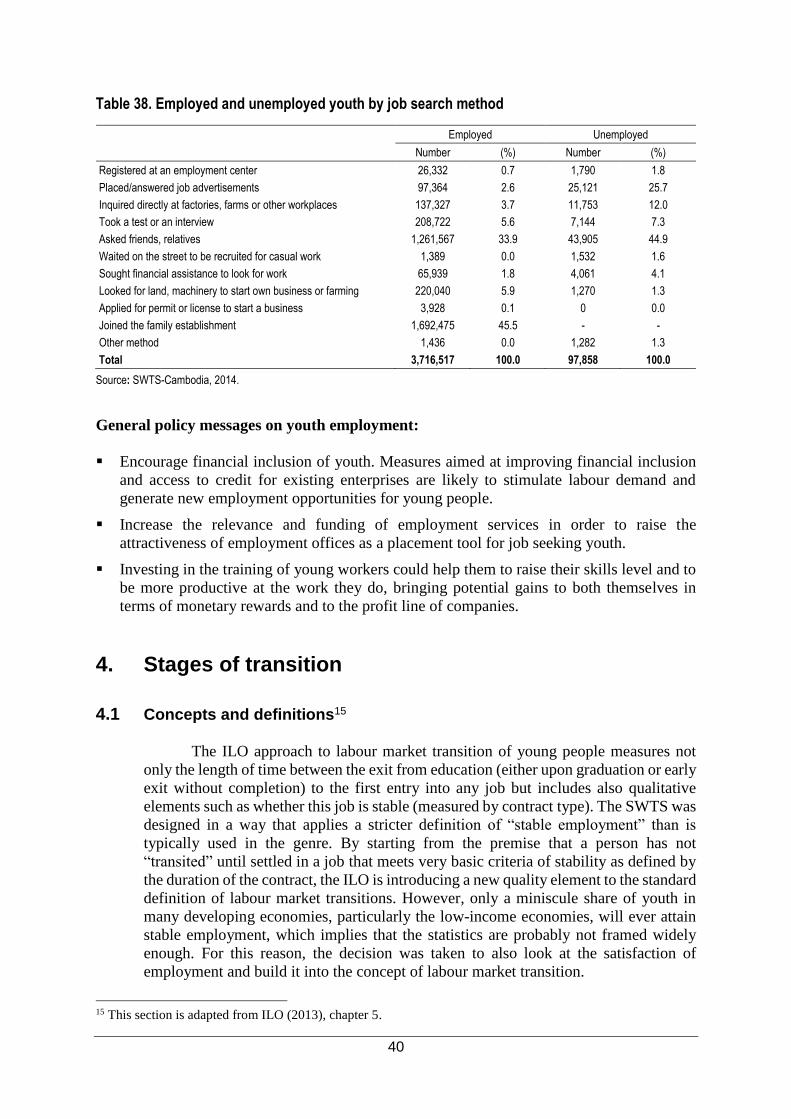
40
Table 38. Employed and unemployed youth by job search method
Employed Unemployed
Number (%) Number (%)
Registered at an employment center 26,332 0.7 1,790 1.8
Placed/answered job advertisements 97,364 2.6 25,121 25.7
Inquired directly at factories, farms or other workplaces 137,327 3.7 11,753 12.0
Took a test or an interview 208,722 5.6 7,144 7.3
Asked friends, relatives 1,261,567 33.9 43,905 44.9
Waited on the street to be recruited for casual work 1,389 0.0 1,532 1.6
Sought financial assistance to look for work 65,939 1.8 4,061 4.1
Looked for land, machinery to start own business or farming 220,040 5.9 1,270 1.3
Applied for permit or license to start a business 3,928 0.1 0 0.0
Joined the family establishment 1,692,475 45.5 - -
Other method 1,436 0.0 1,282 1.3
Total 3,716,517 100.0 97,858 100.0
Source: SWTS-Cambodia, 2014.
General policy messages on youth employment:
Encourage financial inclusion of youth. Measures aimed at improving financial inclusion
and access to credit for existing enterprises are likely to stimulate labour demand and
generate new employment opportunities for young people.
Increase the relevance and funding of employment services in order to raise the
attractiveness of employment offices as a placement tool for job seeking youth.
Investing in the training of young workers could help them to raise their skills level and to
be more productive at the work they do, bringing potential gains to both themselves in
terms of monetary rewards and to the profit line of companies.
4. Stages of transition
4.1 Concepts and definitions15
The ILO approach to labour market transition of young people measures not
only the length of time between the exit from education (either upon graduation or early
exit without completion) to the first entry into any job but includes also qualitative
elements such as whether this job is stable (measured by contract type). The SWTS was
designed in a way that applies a stricter definition of “stable employment” than is
typically used in the genre. By starting from the premise that a person has not
“transited” until settled in a job that meets very basic criteria of stability as defined by
the duration of the contract, the ILO is introducing a new quality element to the standard
definition of labour market transitions. However, only a miniscule share of youth in
many developing economies, particularly the low-income economies, will ever attain
stable employment, which implies that the statistics are probably not framed widely
enough. For this reason, the decision was taken to also look at the satisfaction of
employment and build it into the concept of labour market transition.
15 This section is adapted from ILO (2013), chapter 5.
41
More specifically, the labour market transition is defined as the passage of a
young person (aged 15 to 29 years) from the end of schooling (or entry to first economic
activity) to the first stable or satisfactory job. Stable employment is defined in terms of
the contract of employment (written or oral) and the duration of the contract (greater
than 12 months). Bringing in the issue of contract automatically excludes the
employment status of the self-employed, where the employment relationship is not
defined by a written contract. The contrary is temporary employment, or wage and
salaried employment of limited duration. Satisfactory employment is a subjective
concept, based on the self-assessment of the job-holder. It implies a job that the
respondent considers to “fit” to his desired employment path at that moment in time.
The contrary is termed non-satisfactory employment, implying a sense of
dissatisfaction about the job.
Based on the definition of labour market transition, the stages of transition are
classified as follows:
Transited – A young person who has “transited” is one who is currently employed in:
- a stable job, whether satisfactory or non-satisfactory; or
- a satisfactory but temporary job; or
- satisfactory self-employment.
In transition – A young person is still “in transition” if s/he has one of the following
statuses:
- currently unemployed (relaxed definition); or
- currently employed in a temporary and non-satisfactory job; or
- currently in non-satisfactory self-employment; or
- currently inactive and not in school, with an aim to look for work later.
Transition not yet started – A young person whose “transition has not yet started” is
one who is either of the following:
- still in school and inactive (inactive students); or
- currently inactive and not in school (inactive non-students), with no
intention of looking for work.
Two elements are noteworthy with this classification. First, the stages of
transition span across the boundaries of economic activity as defined in the traditional
labour force framework. The “transited” category includes a sub-set of youth classified
as employed; the remaining employed fall within the category of “in transition”, which
includes also the strict unemployed and portions of the inactive (namely, those without
work, available for work but not actively seeking work and the inactive non-students
who have stated an intention to join the labour force at a later stage); and finally, the
“transition not yet started” category is the residual of the inactive population.
Second, the stages of transition are not intended to be a normative framework.
Because of the inclusion of persons in satisfactory self-employment and satisfactory
temporary employment, one cannot say that all youth in the “transited” category have
transited to a good quality job. In fact, the majority of persons in self-employment – the
own-account workers and contributing (unpaid) family workers – will be among the
poorly paid workers in the informal economy showing up on the poor quality job side

42
of Figure 9 above. And by definition, they make up the bulk of the country’s share of
irregularly employed. Yet still they have professed a degree of satisfaction with their
job and they are likely to have finished their transition in the sense of remaining in the
self-employed classification for the remainder of their working lives. To summarize,
rather than a normative concept, the stages of transition classification is intended to
offer a flow concept. A person is “in transition” until they reach a resting point in the
labour market; good or bad quality job, it is one that they are likely to maintain.
4.2 Stages of transition
Using the classification of stages of transition, the largest share of the youth
population in Cambodia has already completed the transition to stable and/or
satisfactory employment (79.9 per cent), and most to satisfactory self-employment
(57.1 per cent) (Table 39 and Figure 11). The percentage of youth still in the process of
transition is 11.9 per cent and the share of youth who have not yet started the transition
is 8.2 per cent. There are more males than females in the “transited” category, as well
as among those who have not yet started their transition. However, more young women
are “in transition” than young men.
Table 39. Distribution of youth population by stage of transition and sex
Total Male Female
Number (%) Number (%) Number (%)
Transited 3,752,245 79.9 1,725,809 83.6 2,026,435 77.0
In transition 557,826 11.9 163,753 7.9 394,073 15.0
Transition not yet started 386,435 8.2 175,701 8.5 210,734 8.0
Total youth population 4,696,506 100.0 2,065,263 100.0 2,631,242 100.0
Source: SWTS-Cambodia, 2014.
Figure 11. Youth population by stages of transition (%)
Source: SWTS-Cambodia, 2014.
79.9
22.8
57.1
11.93.3 3.2 5.4 8.2
0102030405060708090
Tot
al
Sta
ble
empl
oyed
Sat
isfa
ctor
y se
lf-em
ploy
men
t or
tem
pora
ry e
mpl
oym
ent Tot
al
Rel
axed
une
mpl
oyed
Non
-sat
isfa
ctor
y se
lf-em
ploy
men
t or
tem
pora
ry e
mpl
oym
ent
Inac
tive
non-
stud
ents
with
futu
repl
ans
to w
ork
Tot
al
Total transited Total in transition Transition notyet started

43
Table 40 presents the stage of transition distributed across characteristics such
as age group, sex, area of residence and household’s overall financial situation. The
likelihood of completing the transition increases with age; 87.0 per cent of youth in the
upper age band of 25-29 years have completed the transition, compared to 73.8 per cent
of the “younger” youth aged 15-19 years. The younger age group, on the other hand, is
that which is most likely to remain the category of transition not yet started (16.8 per
cent), which is logical given the likelihood they are still in school. Urban youth are
more likely to remain in education and start the transition later (20.9 per cent compared
to 5.0 per cent of rural youth) while rural youth are more likely to fall in the
economically active categories of transition completed. Regarding the influence of
household income,16 it becomes clear that household wealth determines the ability of
youth to stay in school and thus be more likely to fall in the category of transition not
yet started (16.8 per cent of youth in well-off households are in the category compared
to 2.4 per cent of youth in poor households).
Table 40. Distribution of youth population across stage of transition and selected key indicators:
age group, sex, area of residence and household’s overall financial situation
Transited In transition
Transition not yet started
Total
Number (%) Number (%) Number (%) Number (%)
Age group
15-19 1,416,270 73.8 181,255 9.4 322,226 16.8 1,919,751 100.0
20-24 1,252,161 81.8 230,274 15.0 48,947 3.2 1,531,382 100.0
25-29 1,083,814 87.0 146,296 11.7 15,263 1.2 1,245,373 100.0
Sex
Male 1,725,809 83.6 163,753 7.9 175,701 8.5 2,065,263 100.0
Female 2,026,435 77.0 394,073 15.0 210,734 8.0 2,631,242 100.0
Place of residence
Urban 637,365 67.0 115,123 12.1 198,390 20.9 950,879 100.0
Rural 3,114,879 83.2 442,702 11.8 188,045 5.0 3,745,627 100.0
Household’s overall financial situation
Well off 24,894 76.0 2,336 7.1 5,508 16.8 32,737 100.0
Fairly well off 278,754 70.6 31,342 7.9 84,986 21.5 395,083 100.0
Around the national average
2,688,281 81.3 365,870 11.1 250,770 7.6 3,304,920 100.0
Fairly poor 666,383 78.4 140,809 16.6 42,453 5.0 849,645 100.0
Poor 93,933 82.3 17,469 15.3 2,719 2.4 114,120 100.0
Total 3,752,245 557,825 386,436 4,696,506
Source: SWTS-Cambodia, 2014.
4.2.1 Youth who have not yet started transition
As shown in Table 41, most of the young people who have not yet started the
transition were still in school (96.7 per cent) and only 3.3 per cent were inactive and
not intending to look for work. For young men, 99.1 per cent were in school compared
to 94.7 per cent of young women. The remaining 5.3 per cent of young women were
inactive and not intending to look for work compared to 0.9 per cent of young men.
16 The rating of household income level is based on the perception of the young respondent.

44
Table 41. Youth who have not yet started their transition by sub-category and sex
Sub-category Total Male Female
Number (%) Number (%) Number (%)
In-school 373,634 96.7 174,124 99.1 199,510 94.7
Currently inactive no school with no intention of looking for work
12,801 3.3 1,577 0.9 11,224 5.3
Total youth transition not started 386,435 100.0 175,701 100.0 210,734 100.0
Source: SWTS-Cambodia, 2014.
4.2.2 Youth in transition
A young person is classified as “in transition” if s/he is either unemployed
(relaxed definition), engaged in self-employment or in a paid temporary job that they
have expressed dissatisfaction with, or is an inactive non-student with an attachment to
the labour market, indicated by their expressed desire to work in the future. Figure 12
presents the category of youth “in transition” in greater detail, with disaggregation by
sub-category, sex, urban/rural geography and level of completed educational attainment
(excluding current students).
Regarding the reason for the classification as “in transition”, there is a biggest
share of youth who are temporary inactive non-student with plans to work in future
(45.3 per cent) while nearly equal shares of youth who are unemployment (27.8 per
cent) and youth who are currently working in non-satisfactory temporary or self-
employment (26.9 per cent). About 52.4 per cent of youth “in transition” have
completed education at secondary level and another 37.7 per cent have completed
education at the lower (primary) level. Those with tertiary education represent the
lowest share at 3.9 per cent, which offers hints that having a higher level degree helps
to get the youth out of the transition phase. The level of household income also seems
to have an influence on the transition stage: 28.4 per cent of youth remaining in
transition come from households having below average income levels.
Figure 12. “In transition” youth by level of household income, level of completed educational
attainment and sub-category (%)
* Excluding current students since their highest level is not yet determinable.
Source: SWTS-Cambodia, 2014.
6.0
65.6
28.4
4.5
37.7
52.4
1.5
3.9
27.8
26.9
45.3
0 10 20 30 40 50 60 70
Above average
Average
Below average
None or less than primary
Primary
Secondary
Vocational
Tertiary
In relaxed unemployment
In non-satisfactory self- or temporary employment
Inactive non-students with plans to work in future
Hou
seho
ldin
com
e le
vel
Com
plet
ed e
duca
tion*
Sub
-cat
egor
y

45
Table 42 shows the cross-tabulations of the sub-categories of in transition youth
by the same variables shown in Figure 12. One interesting inference that can be drawn
from the table is that the youth from wealthier households have a slight advantage in
avoiding non-satisfactory self-employment or temporary employment since the family
would seem better able to support them through the unemployment process or to stay
in school. Higher education affects positively the chance of having a stable
employment. It is also interesting to note that the lesser educated youth are more likely
to fall in the category of non-satisfactory self-employment or temporary employment
than youth with vocational or tertiary education. The interpretation here being that those
who have invested more time in education could be more reluctant to take any job which
does not satisfy them. The higher educated youth, then, are more likely to spend the
transition from education to work in unemployment or inactive with plans to work in
the future.
Table 42. Youth “in transition” and “transited” by level of household income, area of residence, level of completed educational attainment and sub-category
Transited In transition
Stable
employment
Satisfactory Self-
employment
Satisfactory temporary
employment
Total “transited”
(%)
Unemployed (relaxed
definition)
Non-satisfactory
self-employment
or temporary
employment
Inactive nonstudent
with plan to work in future
Total “in transition”
(%)
Total 1,069,241 2,493,718 189,286 100.0 155,048 150,071 252,706 100.0
Male 531,140 1,115,777 78,893 46.0 60,318 68,292 35,142 29.4
Female 538,101 1,377,941 110,393 54.0 94,730 81,779 217,564 70.6
Urban 315,708 298,498 23,159 17.0 52,312 15,933 46,878 20.6
Rural 753,533 2,195,220 166,127 83.0 102,735 134,138 205,828 79.4
Household income level
Well off 7,016 16,441 1,436 0.7 603 0 1,732 0.4
Fairly well off 36,878 228,914 12,962 7.4 8,176 9,825 13,342 5.6
Around the national average
729,160 1,805,866 153,255 71.6 112,178 87,286 166,405 65.6
Fairly poor 251,488 394,995 19,900 17.8 31,070 45,241 64,498 25.2
Poor 44,699 47,502 1,732 2.5 3,020 7,719 6,730 3.1
Completed education (excluding current students)
None or less than primary
51,969 105,692 5,594 4.4 6,022 2,197 12,080 3.6
Primary 351,134 785,854 56,129 31.8 32,463 40,676 98,247 30.7
Secondary 453,507 802,130 89,616 35.9 54,590 54,604 128,966 42.7
Vocational 60,542 32,862 1,010 2.5 1,399 0 5,611 1.3
Tertiary 69,801 47,784 10,204 3.4 9,999 0 7,802 3.2
Source: SWTS-Cambodia, 2014.

46
4.2.3 Characteristics of a completed transition
Figure 13 compares the stages of “completed transition” and “in transition”
youth according to a breakdown by the variables of sex, area of residence, household
income and level of educational attainment with the intention of identifying if there are
any obvious advantages brought to the outcome of the transition. Looking at the youth
either in transition or with completed transition only, one can draw the following
conclusions: First, young men have a slight advantage in completing the transition than
young women (91.3 per cent of young men (in the two groups) have completed the
transition compared to 83.7 per cent of young women). Second, living in a rural area
slightly increases the youth’s chances of completing the transition (87.6 per cent of
rural youth have completed the transition compared to 84.7 per cent of youth in urban
areas).
Youth from wealthier households have a higher likelihood to complete the
transition as opposed to remaining in transition, although the difference in shares across
the two categories is not large (90.0 per cent of youth in above average wealth
households completed the transition compared to 82.8 per cent of youth in below
average income households). About 41.8 per cent of youth who completed their
transition to stable and/or satisfactory employment had completed education at the
secondary level or higher compared to 47.2 per cent of youth remaining in transition
(Table 42). About 4.4 per cent of the transited youth had low levels of education
(primary or less), compared to 3.6 per cent of the youth remaining in transition.
Figure 13. Distribution of transition groups (transited and in-transition youth) by sex, urban/rural geography, household income level and level of educational attainment (%)
* Excluding current students since their highest level is not yet determinable
Source: SWTS-Cambodia, 2014.
91.383.7 84.7 87.6 90.0 88.0 82.8
88.9 87.4 85.093.1 87.8
8.716.3 15.3 12.4 10.0 12.0 17.2
11.1 12.6 15.06.9 12.2
0%
10%
20%
30%
40%
50%
60%
70%
80%
90%
100%
Mal
e
Fem
ale
Urb
an
Rur
al
Abo
ve a
vera
ge
Ave
rage
Bel
ow a
vera
ge
Non
e or
less
than
prim
ary
Prim
ary
Sec
onda
ry
Voc
atio
nal
Ter
tiary
Sex Geography Household income level Completed education*
Transition completed In transition

47
Most of the transited young people have attained a satisfactory self-employment
job (66.5 per cent), 28.5 per cent are in stable employment and the remaining 5.0 per
cent are in a job that is satisfactory but temporary (calculated from Table 42). Certainly
there are job quality implications for the youth in the various sub-categories of
completed transition. The young person may have stopped moving around between
labour market categories, but s/he has not necessarily attained quality employment.
Figure 14 allows us to determine which characteristics are more likely to result in a
transition to the most advantageous category of transited to stable employment
compared to the second-best category of transited to satisfactory self-employment or
temporary employment.
Young men who have completed their transition to the labour market have a
slightly higher likelihood to attain stable employment than young women (30.8 and
26.6 per cent, respectively). The share of transited youth in stable employment is lesser
than youth in satisfactory self-employment in rural areas, and urban youth have a higher
chance to attain stable employment (49.5 per cent compared to 24.2 per cent of rural
“transited” youth). Similarly, transited youth have a greater tendency to be in
satisfactory self-employment regardless of household income level, but the likelihood
to end up in satisfactory temporary employment shows an inverse relationship to the
level of household wealth with poorer household having a greater tendency to have
youth working in satisfactory temporary work (most likely seasonal agricultural work).
The more dramatic results come with the education level: The higher the educational
attainment of the youth, the more likely s/he is to attain stable employment over
satisfactory self- or temporary employment. Nearly one-half (54.6 per cent) of transited
youth with a tertiary degree are in stable employment compared to 45.4 per cent in
satisfactory self-employment or temporary employment.
Figure 14. “Transited” youth by sub-category and by sex, urban/rural geography, household income level and level of educational attainment (%)
* Excluding current students since their highest level is not yet determinable
Source: SWTS-Cambodia, 2014.
30.8
26.6
49.5
24.2
14.5
27.1
39.0
31.8
29.4
33.7
64.1
54.6
64.7
68.0
46.8
70.5
80.8
67.2
58.2
64.7
65.9
59.6
34.8
37.4
4.6
5.4
3.6
5.3
4.7
5.7
2.8
3.4
4.7
6.7
1.1
8.0
0% 10% 20% 30% 40% 50% 60% 70% 80% 90% 100%
Male
Female
Urban
Rural
Above average
Average
Below average
None or less than primary
Primary
Secondary
Vocational
Tertiary
Sex
Geo
grap
hyH
ouse
hold
inco
me
leve
lC
ompl
eted
edu
catio
n*
Stable employment Satisfactory self-employment Satisfactory temporary employment
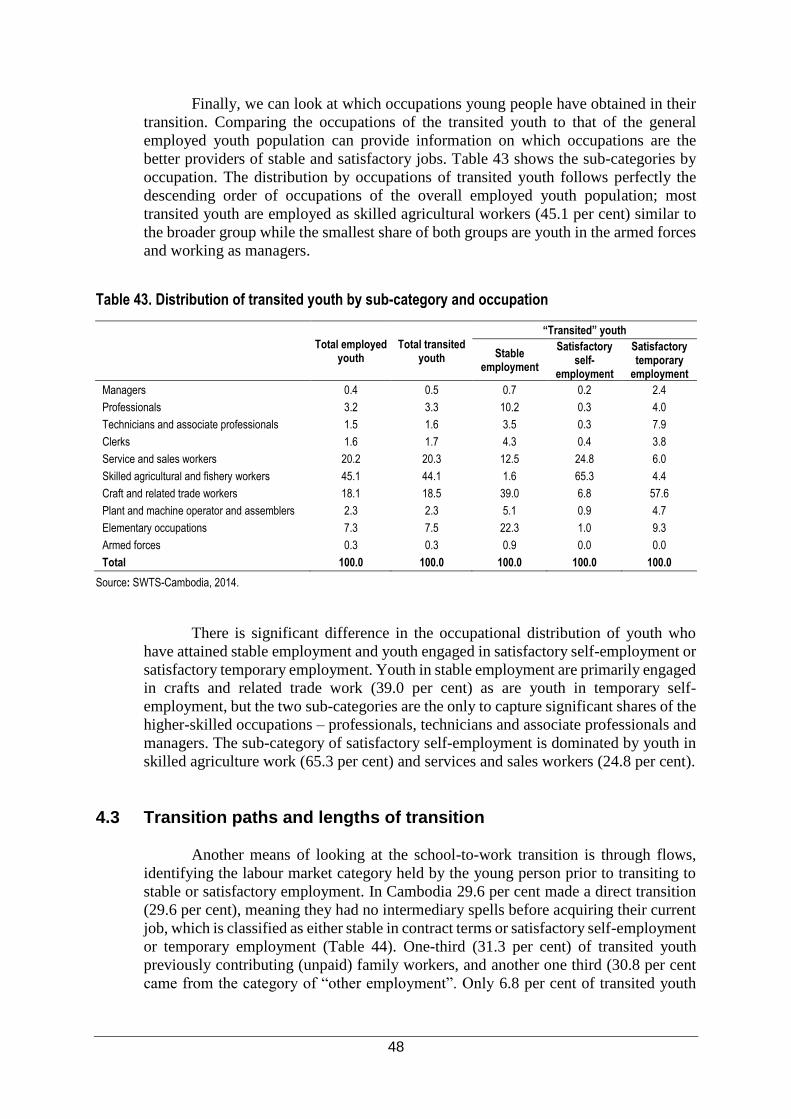
48
Finally, we can look at which occupations young people have obtained in their
transition. Comparing the occupations of the transited youth to that of the general
employed youth population can provide information on which occupations are the
better providers of stable and satisfactory jobs. Table 43 shows the sub-categories by
occupation. The distribution by occupations of transited youth follows perfectly the
descending order of occupations of the overall employed youth population; most
transited youth are employed as skilled agricultural workers (45.1 per cent) similar to
the broader group while the smallest share of both groups are youth in the armed forces
and working as managers.
Table 43. Distribution of transited youth by sub-category and occupation
Total employed youth
Total transited youth
“Transited” youth
Stable
employment
Satisfactory self-
employment
Satisfactory temporary
employment
Managers 0.4 0.5 0.7 0.2 2.4
Professionals 3.2 3.3 10.2 0.3 4.0
Technicians and associate professionals 1.5 1.6 3.5 0.3 7.9
Clerks 1.6 1.7 4.3 0.4 3.8
Service and sales workers 20.2 20.3 12.5 24.8 6.0
Skilled agricultural and fishery workers 45.1 44.1 1.6 65.3 4.4
Craft and related trade workers 18.1 18.5 39.0 6.8 57.6
Plant and machine operator and assemblers 2.3 2.3 5.1 0.9 4.7
Elementary occupations 7.3 7.5 22.3 1.0 9.3
Armed forces 0.3 0.3 0.9 0.0 0.0
Total 100.0 100.0 100.0 100.0 100.0
Source: SWTS-Cambodia, 2014.
There is significant difference in the occupational distribution of youth who
have attained stable employment and youth engaged in satisfactory self-employment or
satisfactory temporary employment. Youth in stable employment are primarily engaged
in crafts and related trade work (39.0 per cent) as are youth in temporary self-
employment, but the two sub-categories are the only to capture significant shares of the
higher-skilled occupations – professionals, technicians and associate professionals and
managers. The sub-category of satisfactory self-employment is dominated by youth in
skilled agriculture work (65.3 per cent) and services and sales workers (24.8 per cent).
4.3 Transition paths and lengths of transition
Another means of looking at the school-to-work transition is through flows,
identifying the labour market category held by the young person prior to transiting to
stable or satisfactory employment. In Cambodia 29.6 per cent made a direct transition
(29.6 per cent), meaning they had no intermediary spells before acquiring their current
job, which is classified as either stable in contract terms or satisfactory self-employment
or temporary employment (Table 44). One-third (31.3 per cent) of transited youth
previously contributing (unpaid) family workers, and another one third (30.8 per cent
came from the category of “other employment”. Only 6.8 per cent of transited youth

49
came from inactivity, 1.4 per cent from self-employment and 0.1 per cent from
unemployment.
Table 44. Distribution of transited youth by previous activity
Number (%)
Direct transition 864,960 29.6
Flowed from unemployment 3,804 0.1
Flowed from self-employment 39,783 1.4
Flowed from contributing (unpaid) family worker 913,440 31.3
Flowed from other employment** 897,804 30.8
Flowed from inactivity 199,731 6.8
Total transited, non-students 2,919,520 100.0
Notes: Excluding current students ** Other employment” includes wage workers and those who are engaged in apprenticeships Source: SWTS-Cambodia, 2014.
Table 45 presents some transition path indicators which provide a more detailed
picture of how youth arrived to the transition stage. Excluding the youth who transited
directly to stable or satisfactory employment, the path to transition involved, on
average, about 2 (1.78) intermediary labour market activities – whether unemployment,
employment or inactivity – prior to completing the labour market transition. The typical
young person in the country experienced “only” one spell of temporary employment in
their transition path and one spell of self-employment, but the spells of both were long,
averaging 9.7 months for temporary employment and much longer, 32.6 months or 2.7
years, for self-employment. The average young transited female spent longer in
temporary employment than the young male (10.1 months compared to 8.7 months),
while the average young transited male spent slightly longer in self-employment than
young females (34.4 months compared to 31.2 months).
Table 45. Indicators on the path of transition (for “transited” youth) by sex
Total Male Female
Average duration of transition, excluding direct transits (months) 89.0 months 92.0 months 86.7 months
Average duration of transition, including direct transits (months) 15.1 months 14.0 months 16.0 months
Average duration of transition to stable employment (months) 16.8 months 16.3 months 17.4 months
Average duration of transition to satisfactory self-employment or temporary employment (months)
14.2 months 12.7 months 15.3 months
Average number of intermediary activities 1.78 1.85 1.74
Average number of unemployment spells * * *
Average duration of unemployment spells (months) * * *
Average number of temporary employment spells 1.19 1.1 1.23
Average duration of temporary employment spells (months) 9.7 months 8.7 months 10.1 months
Average number of spells of self-employment 1.08 1.1 1.06
Average duration of spells of self-employment (months) 32.6 months 34.4 months 31.2 months
Notes: Excluding current students
* Insignificant number of observations Note: Excluding youth who made a direct transition except where indicated Source: SWTS-Cambodia, 2014.

50
When one includes the young people who transited directly to stable and/or
satisfactory employment to generate an average duration of transition, the results show
the duration of the transition period to be slightly more than 1 year (16.8 months).
Removing the number of youth who transited directly from the calculation, however,
reveals a very different picture. The path to transition was not especially circuitous for
those who did not move directly to stable and/or satisfactory work (with 1.78 spells of
intermediary activities), but it was extremely long at 89 months, or more than seven
years. The time spent in transition averaged more than five months longer for young
men compared to young women (92 and 86.7 months, respectively).
The ILO has also developed a classification system for the duration of the
transition period of youth who have completed the transition.17 Given the prevalence of
direct transitions (42.1 per cent), the large share of transited youth who undertook a
short transition (85.2 per cent) is not too surprising (Figure 15). Only 4.4 per cent of
transited youth spent a long time to reach the current status in stable or satisfactory
employment. The difference between the sexes is negligible.
Figure 15. Classification of duration of transition of youth who have completed the transition
by sex (%)
Note: Duration of transition is calculated for non-students only.
Source: SWTS-Cambodia, 2014.
17 A short transition is classified as one in which, before obtaining the current satisfactory/stable job, the young
person underwent either: (1) a direct transition; or (2) a spell (or cumulative spells) of stable or satisfactory
employment with no spell of unemployment or inactivity; or (3) a spell (or cumulative spells) of employment of
less than or equal to one year with no spell of unemployment or inactivity where the job(s) held is classified as
non-satisfactory self-employment or temporary employment; or (4) a spell of unemployment with or without
spells of employment or inactivity of less than or equal to three months; or (5) a spell of inactivity of less than or
equal to one year.
A mid-length transition is classified as one in which, before obtaining the current satisfactory
/stable job, the young person underwent either: (1) a spell (or cumulative spells) of non-satisfactory self-
employment or temporary employment of between one and two years with no spell of unemployment or inactivity;
or (2) a spell of unemployment with or without spells of employment or inactivity of between three months and
one year; or (3) a spell of inactivity longer than one year.
A lengthy transition is classified as one in which, before obtaining the current satisfactory/stable job, the young
person underwent either: (1) a spell (or cumulative spells) of non-satisfactory self-employmentor temporary
employment of two years or over with no spell of unemployment or inactivity; or (2) a spell of unemployment
with or without spells of employment or inactivity of one year or over.
85.2 86.4 84.3
10.4 8.611.8
4.4 5.0 3.9
0
10
20
30
40
50
60
70
80
90
100
Total Male Female
Short transiton Mid-length transition Lengthy transition
51
References
International Labour Organization (ILO). “Labour market transitions of young women and men
in Cambodia, 2012”. September 2013.
─. 2013. “Global Employment Trends for Youth 2013: A generation at risk”. (Geneva).
─. 2008. Beyond Unemployment: Measurement of Other Forms of Labour Underutilization,
Room Document 13, Working group on Labour underutilization, 18th International
Conference of Labour Statisticians, 24 Nov.–5 Dec., Geneva, 2008 (Geneva).
Kanol, H.; Khemarin, K.; Elder, S. 2013. Labour market transitions of young women and men
in Cambodia, Work4Youth Publication Series No. 2, Sep. (Geneva, ILO).
National Employment Agency. 2013. “Skill shortages and skill gaps in Cambodian labour
market: Evidence from Employer Skills Needs Survey”, February 2013, draft.
Matsumoto, M.; Hengge, M.; Islam, I. 2012. “Tacking the youth employment crisis: A
macroeconomic perspective”, Employment Working Paper, No. 124 (Geneva, ILO).
Quintini, G. 2011. “Over-qualified or under-skilled: A review of existing literature”, OECD
Employment and Migration Working Papers, No. 121 (Paris).
Cambodian Federation of Employers and Business Associations (CAMFEBA) and
International Labour Organization (ILO). 2008. “Youth and employment: Bridging the gap”,
Youth Employment and Social Dialogue Project, July.

52
53
Annex I. Definitions of labour market statistics
1. The following units are defined according to the standards of the International
Conference of Labour Statisticians:
a. The employed include all persons of 15 years of age or more who during
a week of reference:
- Worked for wage or profit (in cash or in kind) for at least one hour;
- Were temporary absent from work (because of illness, leave, studies, a
break of the activity of the firm, etc.), but had a formal attachment to
their job;
- Performed some work without pay for family gain.
b. The unemployed include all persons age 15 years and over who meet
the following three conditions during the week of reference:
- They did not work (according to the above mentioned definition);
- Were actively searching for a job or took concrete action to start their
own business;
- Were available to start work within the next two weeks following the
reference week.
c. The persons neither included in the employed nor in the unemployed are
classified as not in the labour force (also known as inactive).
2. The International Classification of Status in Employment (ICSE) categorises the
employed population on the basis of their explicit or implicit contract of
employment, as follows:
a. Employees (also wage and salaried workers) are all those workers who
hold the type of jobs defined as "paid employment jobs", where the incumbents hold
explicit (written or oral) or implicit employment contracts that give them a basic
remuneration that is not directly dependent upon the revenue of the unit for which
they work.
b. Employers are those workers who, working on their own account or
with one or a few partners, hold the type of jobs defined as a "self-employment
jobs" (i.e. jobs where the remuneration is directly dependent upon the profits
derived from the goods and services produced), and, in this capacity, have engaged,
on a continuous basis, one or more persons to work for them as employee(s).
c. Own-account workers are those workers who, working on their own
account or with one or more partners, hold the type of jobs defined as a "self-
employment jobs", and have not engaged on a continuous basis any employees to
work for them.
d. Contributing (unpaid) family workers are those workers who hold
"self-employment jobs" as own-account workers in a market-oriented establishment
operated by a related person living in the same household.
3. The employed are also classified by their main occupation, in accordance with the
International Standard Classification of Occupations (ISCO-08).
4. Household is every family or other community of persons declaring to live together
and jointly spend their income to satisfy the basic necessities of life. The concept
54
of household includes members present in the place where the household resides,
as well as individuals who are temporary absent and living elsewhere, including
abroad, for business, education or other, as long as their residence in the foreign
country does not exceed one year. A person living alone can also qualify as a
household (“single household”) if she does not already belong to another unit. The
single household can reside in a separate or shared apartment, and it will be
considered as an independent unit as long as the household’s income is not shared
with other residents. Collective households such as prisons and institutions and their
members are not observed in the LFS.
5. The reporting period, to which the questions for the economic activity are related,
is the week before the week of interview (52 reporting weeks throughout the year).
6. The following units are also defined within the SWTS analysis but are outside of
the scope of those defined within the international framework of labour market
statistics seen in item 1 above:
a. Relaxed unemployment – a person without work and available to work
(relaxing the job seeking criteria of item 1b above).
b. Labour underutilization rate – the sum of shares of youth in irregular
employment, unemployed (relaxed definition) and youth neither in the labour force
nor in education/training (inactive non-students) as a percentage of the youth
population.
c. Regular employment – the sum of employees with a contract (oral or
written) of 12 months or more in duration and employers; the indicators is therefore
a mixes information on status in employment and contract situations.
d. Satisfactory employment – based on self-assessment of the job-holder;
implies a job that the respondent considers to “fit” to his desired employment path
at that moment in time.
e. Stable employment – employees with a contract (oral or written) of 12
months or more in duration.
f. Temporary employment – employees with a contract (oral or written)
of less than 12 months in duration.
55
Annex II. Methodology for the Cambodia SWTS 2014
Questionnaire development
The questionnaire for the Cambodia School-to-Work Transition Survey 2014
(SWTS) was developed based on the guidelines of the ILO Youth Employment
Programme and the “Work for Youth” Project modelled SWTS questionnaires. The
questionnaire asked youth aged 15-29 questions according to seven main sections.
These sections included general information about their personal, family and
households, information about their formal education/training and their aspirations, and
their activity history. It also included detailed information about the experiences of
young people in each of the five target groups: in-school youth, jobseekers, young
workers, young self-employed and own-account workers, and youth who are neither in
school nor in the labour market.
Sample design and selection
Sampling frame
The SWTS 2014 in Cambodia will be run as a stand-alone survey and will be
based on latest available sampling frame. The latest updated frame from 2008
Population Census is used as sampling frame. The sample design proposed by ILO
consultant had envisaged a total sample of 160 Enumeration Areas (EAs), of which 123
EAs in rural area and 37 EAs in urban area (Table 1). With 16 households will be
selected in each EA, the sample size will be equivalent to 2,560 households.
Sampling design
The survey used a stratified two-stage probability sample where the first stage
units are enumeration areas (EAs) designated as the Primary Sampling Units (PSUs)
and the second stage units as the Second Sampling Units (SSUs) are households.
Stage 1: Selecting enumeration areas (EAs)
The sample size of 160 EAs are selected with probability proportional to the EA
size according to the sample allocation given in table 1. The enumeration areas (EAs)
will be arranged by geographical code and the number of regular households cumulated.
The sample EAs will then be selected using the Probability Proportional to Size with
Linear Systematic Sampling and Random start method.
1. Compute the lower and upper cumulative of the number of regular households of
every EAs in each province-urban or rural.
2. Calculate the sampling interval by dividing the total number of regular households
in every province with urban or rural by the number of EAs selected in province-
urban or rural.
3. Pick up a random start between 1 and the sampling interval for province-urban or
rural.
4. Continue adding the fix sampling interval according to the number of EAs selected
in province-urban or rural.
5. Identify sample province-urban or rural with EA number.

56
Stage 2: Selecting households (hhs)
This stage a fixed sample size of 16 households will be selected within each
sample EA. Firstly, all household having youth aged 15-29 years old in each selected
EA will be listed prior household selection. Then, the sample households will be
selected from the household listing by equal probability circular systematic sampling
(CSS).
The procedure of selecting households by Systematic Random Sampling with
equal probability in brief is given below:
Let H be the number of households in the household listing sheet in an EA and
allocated number of households to be h.
Calculate sampling interval, I = H/h up to two places of decimal.
Take a random number between 1 and I. Call it R (Random start).
Then the set of selected households are:
R, R+1*I, R+2*I, …………., R+i*I, …., R+(h-1)*I
Note: (i) If any (R+i*I) > H then take [(R+i*I) – H]
(ii) If (R+i*I) has a decimal part, round off it to the nearest integer.
Table 1. Number of sample EAs for SWTS in Cambodia 2014
Code Provinces Urban Rural Total
1 Banteay Meanchey 2 5 7
2 Battambang 2 7 9
3 Kampong Cham 1 15 16
4 Kampong Chhnang 1 5 6
5 Kampong Speu 1 7 8
6 Kanpong Thom 1 6 7
7 Kampot 1 6 7
8 Kandal 1 10 11
9 Koh Kong 1 2 3
10 Kratie 1 3 4
11 Mondul Kiri 1 2 3
12 Phnom Penh 11 2 13
13 Preah Vihear 1 2 3
14 Prey Veng 1 12 13
15 Pursat 1 4 5
16 Rattanak Kiri 1 2 3
17 Siem Reap 2 7 9
18 Preah Sihanouk 1 2 3
19 Stung Treng 1 2 3
20 Svay Rieng 1 6 7
21 Takeo 1 10 11
22 Otdar Meanchey 1 2 3
23 Kep 1 2 3
24 Pailin 1 2 3
Cambodia 37 123 160
57
Data collection
Pilot test of SWTS questionnaires
Before going to the field for the pilot test, 8 staff received a three-day training
on how to carry out data collection from 01 to 03 July 2014 at the National Institute of
Statistics (NIS). The training consisted of 2 days of training, and 1 day for field-testing
of the draft questionnaire and for reviewing the field test. Observed difficulties and
problems during the field test served as additional inputs for further revisions and
improvements of the questionnaire, and better understanding of the data collection
process.
The data collection of the pilot test was conducted from 04 to 08 July 2014. The
EA map from the population census of 2008, the household listing form and the draft
questionnaire were used in the pilot test.
First, an EA was selected where a leader of village lived, and an updated listing
of all the households in the selected EA was made. Depending on the completed
household listing sheet in the selected EA, a probability systematic random sampling
of 8 households was used. Eight sample households were randomly selected from all
households having members aged 15-29 years old.
Survey of SWTS
Training programmes were arranged for survey supervisors and enumerators for
the Cambodia SWTS 2014. Before carrying out the field work of the main survey, 40
staff members received a four-day training on how to carry out data collection from 14
to 17 July 2014 at the NIS. The training consisted of 2 days of training on the survey,
1 day for field-test, and 1 day for reviewing the field test. NIS survey coordinators also
participated in the training in order to provide their experience and offer advice
regarding complicated and difficult questions, or unclear definitions. Observed
difficulties and problems during the field test served as additional inputs for further
revisions and improvement understanding of the data collection process.
The field data collection operation was conducted by eight teams and each team
consisted of one supervisor and four enumerators. The fieldwork was carried out for 28
days, from 21 July to 17 August 2014. One team covered 20 EAs for data collection.
Using the selected sample village provided, the enumerators first visited the
sample villages, and selected one sample Enumeration Area (EA) where the village
leader lived. They contacted the local authorities (village leader) to inform them about
the survey and to ask for necessary assistance. Sixteen households having youth
members aged 15-29 years were randomly selected by systematic random sampling
method. The field supervisors ensured that the sixteen households were properly
selected. Then all youth members living in the selected households were interviewed
by enumerators. The field supervisors also

58
Data processing
Upon submission of the completed questionnaires to NIS, the questionnaires
were processed. The training of data processing staff (data coding and data entry) was
carried out for four days from 13-16 August 2014. After training, the editing of the
completed questionnaires was done manually starting from 17 August 2014. Before
entering the data, all completed questionnaires were thoroughly checked. Data entry
was done directly from the questionnaires after finishing data editing. The data entry
was done by trained personnel. The data was initially entered in CSPro format, which
was converted to SPSS for analysis.

59
Annex III. Additional statistical tables Table A1. Youth population by selected characteristics and sex, SWTS 2012 and SWTS 2014
SWTS 2012 SWTS 2014
Geographic coverage Ten capital/provinces.* 37 urban areas and 123 rural areas.
All 24 capital/provinces.** 37 urban areas and 123 rural areas.
Total sample 3,552 3,396
Sex
Male 45.2 44.0
Female 54.8 56.0
Age group
15-19 years 41.5 40.9
20-24 years 33.4 32.6
25-29 years 25.2 26.5
Geographic location
Urban 24.8 20.2
Rural 75.2 79.8
Marital status
Married (including divorced and widowed) 30.7 37.0
Single 69.3 63.0
with children 25.0 29.6
Average age of 21.0 21.2
marriage (standard deviation) (4.0) (4.3)
Education level
None 9.8 4.0
Primary 36.6 30.4
Secondary 42.4 55.1
Vocational 3.0 3.0
Tertiary 8.2 7.5
Main current activity
Employed 74.1 83.1
Unemployed 1.6 2.1
In school 16.7 8.5
Inactive 7.6 6.4
* Ten capital/provinces: Phnom Penh, Banteay Meanchey, Batambang, Kampong Cham, Kampot, Koh Kong, Prey Veng, Preah Sihanouk, Siem Reap, and Takeo. ** Tbong Khmum province was included in Kampong Cham province based on the Cambodia Population Census 2008.

60
Table A2. Distribution of youth population by use of financial instruments
Financial instruments Total Male Female
Number (%) Number (%) Number (%)
Total (Urban + Rural)
None 4,032,375 85.5 1,832,685 88.5 2,199,690 83.3
Business loans 183,932 3.9 63,802 3.1 120,130 4.5
Emergency loans 117,831 2.5 50,765 2.5 67,067 2.5
Consumption loans 171,636 3.6 64,712 3.1 106,924 4.0
Savings 153,555 3.3 41,872 2.0 111,683 4.2
Insurance 2,317 0.0 0 0.0 2,317 0.1
Remittances/money transfer services 52,031 1.1 17,715 0.9 34,316 1.3
Total youth population 4,713,677 100.0 2,071,551 100.0 2,642,127 100.0
Urban area
None 768,626 79.9 355,331 86.0 413,295 75.2
Business loans 22,814 2.4 4,202 1.0 18,612 3.4
Emergency loans 59,535 6.2 22,523 5.5 37,012 6.7
Consumption loans 26,759 2.8 8,780 2.1 17,978 3.3
Savings 75,816 7.9 19,932 4.8 55,884 10.2
Insurance 2,317 0.2 0 0.0 2,317 0.4
Remittances/money transfer services 6,589 0.7 2,317 0.6 4,272 0.8
Total youth population 962,456 100.0 413,085 100.0 549,370 100.0
Rural area
None 3,263,750 87.0 1,477,355 89.1 1,786,395 85.4
Business loans 161,118 4.3 59,600 3.6 101,518 4.9
Emergency loans 58,296 1.6 28,242 1.7 30,054 1.4
Consumption loans 144,877 3.9 55,931 3.4 88,946 4.3
Savings 77,738 2.1 21,940 1.3 55,799 2.7
Insurance 0 0.0 0 0.0 0 0.0
Remittances/money transfer services 45,442 1.2 15,398 0.9 30,044 1.4
Total youth population 3,751,221 100.0 1,658,466 100.0 2,092,756 100.0
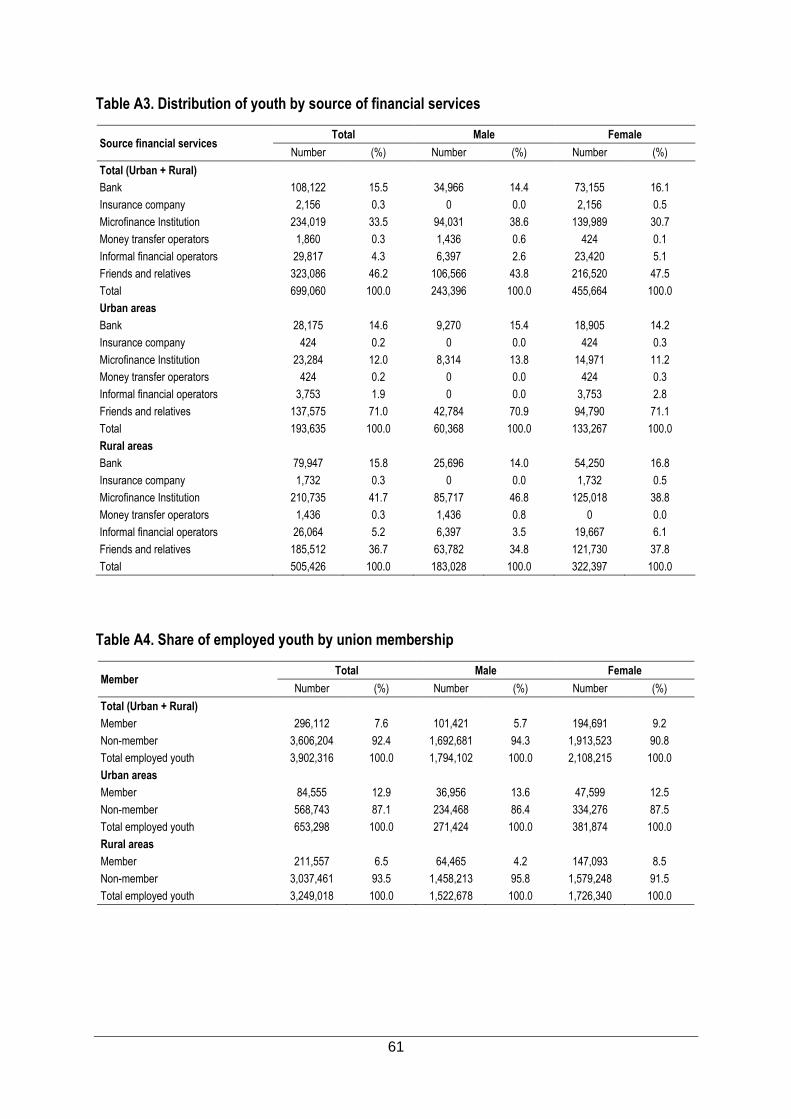
61
Table A3. Distribution of youth by source of financial services
Source financial services Total Male Female
Number (%) Number (%) Number (%)
Total (Urban + Rural)
Bank 108,122 15.5 34,966 14.4 73,155 16.1
Insurance company 2,156 0.3 0 0.0 2,156 0.5
Microfinance Institution 234,019 33.5 94,031 38.6 139,989 30.7
Money transfer operators 1,860 0.3 1,436 0.6 424 0.1
Informal financial operators 29,817 4.3 6,397 2.6 23,420 5.1
Friends and relatives 323,086 46.2 106,566 43.8 216,520 47.5
Total 699,060 100.0 243,396 100.0 455,664 100.0
Urban areas
Bank 28,175 14.6 9,270 15.4 18,905 14.2
Insurance company 424 0.2 0 0.0 424 0.3
Microfinance Institution 23,284 12.0 8,314 13.8 14,971 11.2
Money transfer operators 424 0.2 0 0.0 424 0.3
Informal financial operators 3,753 1.9 0 0.0 3,753 2.8
Friends and relatives 137,575 71.0 42,784 70.9 94,790 71.1
Total 193,635 100.0 60,368 100.0 133,267 100.0
Rural areas
Bank 79,947 15.8 25,696 14.0 54,250 16.8
Insurance company 1,732 0.3 0 0.0 1,732 0.5
Microfinance Institution 210,735 41.7 85,717 46.8 125,018 38.8
Money transfer operators 1,436 0.3 1,436 0.8 0 0.0
Informal financial operators 26,064 5.2 6,397 3.5 19,667 6.1
Friends and relatives 185,512 36.7 63,782 34.8 121,730 37.8
Total 505,426 100.0 183,028 100.0 322,397 100.0
Table A4. Share of employed youth by union membership
Member Total Male Female
Number (%) Number (%) Number (%)
Total (Urban + Rural)
Member 296,112 7.6 101,421 5.7 194,691 9.2
Non-member 3,606,204 92.4 1,692,681 94.3 1,913,523 90.8
Total employed youth 3,902,316 100.0 1,794,102 100.0 2,108,215 100.0
Urban areas
Member 84,555 12.9 36,956 13.6 47,599 12.5
Non-member 568,743 87.1 234,468 86.4 334,276 87.5
Total employed youth 653,298 100.0 271,424 100.0 381,874 100.0
Rural areas
Member 211,557 6.5 64,465 4.2 147,093 8.5
Non-member 3,037,461 93.5 1,458,213 95.8 1,579,248 91.5
Total employed youth 3,249,018 100.0 1,522,678 100.0 1,726,340 100.0

62
Table A5. Distribution of employed youth by company size
Number of workers Total Male Female
Number (%) Number (%) Number (%)
Total (Urban + Rural)
Less than 5 workers 2,716,097 69.6 1,241,561 69.2 1,474,535 69.9
Between 5 and 9 workers 359,217 9.2 206,537 11.5 152,680 7.2
Between 10 and 19 workers 191,529 4.9 124,801 7.0 66,728 3.2
Between 20 and 49 workers 133,795 3.4 70,020 3.9 63,776 3.0
Between 50 and 499 workers 155,866 4.0 62,511 3.5 93,355 4.4
Above 500 workers 345,812 8.9 88,672 4.9 257,140 12.2
Total 3,902,316 100.0 1,794,102 100.0 2,108,215 100.0
Urban areas
Less than 5 workers 336,148 51.5 122,114 45.0 214,034 56.0
Between 5 and 9 workers 76,807 11.8 35,472 13.1 41,335 10.8
Between 10 and 19 workers 56,199 8.6 32,866 12.1 23,333 6.1
Between 20 and 49 workers 54,125 8.3 30,090 11.1 24,035 6.3
Between 50 and 499 workers 56,076 8.6 19,347 7.1 36,729 9.6
Above 500 workers 73,943 11.3 31,534 11.6 42,409 11.1
Total 653,298 100.0 271,424 100.0 381,874 100.0
Rural areas
Less than 5 workers 2,379,948 73.3 1,119,447 73.5 1,260,501 73.0
Between 5 and 9 workers 282,410 8.7 171,065 11.2 111,345 6.4
Between 10 and 19 workers 135,330 4.2 91,935 6.0 43,395 2.5
Between 20 and 49 workers 79,670 2.5 39,930 2.6 39,740 2.3
Between 50 and 499 workers 99,791 3.1 43,164 2.8 56,627 3.3
Above 500 workers 271,869 8.4 57,137 3.8 214,731 12.4
Total 3,249,018 100.0 1,522,678 100.0 1,726,340 100.0
Table A6. Distribution of employed youth by satisfaction with current job
Satisfaction Total Male Female
Number (%) Number (%) Number (%)
Total (Urban + Rural)
Very satisfied 1,905,793 48.8 824,267 45.9 1,081,526 51.3
Somewhat satisfied 1,779,027 45.6 855,950 47.7 923,078 43.8
Somewhat unsatisfied 188,678 4.8 95,362 5.3 93,316 4.4
Very unsatisfied 28,818 0.7 18,524 1.0 10,294 0.5
Total employed youth 3,902,316 100.0 1,794,102 100.0 2,108,215 100.0
Urban areas
Very satisfied 316,215 48.4 118,401 43.6 197,813 51.8
Somewhat satisfied 302,098 46.2 131,694 48.5 170,404 44.6
Somewhat unsatisfied 27,782 4.3 15,578 5.7 12,204 3.2
Very unsatisfied 7,203 1.1 5,750 2.1 1,454 0.4
Total employed youth 653,298 100.0 271,424 100.0 381,874 100.0
Rural areas
Very satisfied 1,589,578 48.9 705,865 46.4 883,713 51.2
Somewhat satisfied 1,476,930 45.5 724,255 47.6 752,674 43.6
Somewhat unsatisfied 160,896 5.0 79,783 5.2 81,112 4.7
Very unsatisfied 21,615 0.7 12,774 0.8 8,840 0.5
Total employed youth 3,249,018 100.0 1,522,678 100.0 1,726,340 100.0
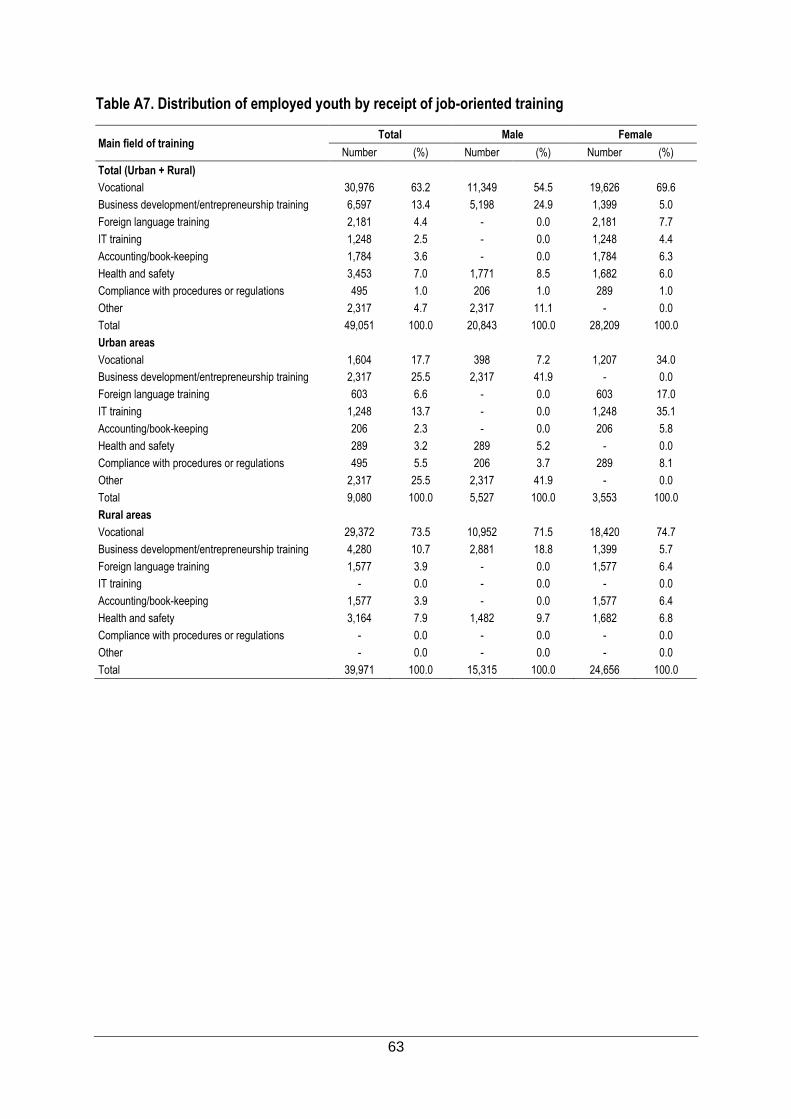
63
Table A7. Distribution of employed youth by receipt of job-oriented training
Main field of training Total Male Female
Number (%) Number (%) Number (%)
Total (Urban + Rural)
Vocational 30,976 63.2 11,349 54.5 19,626 69.6
Business development/entrepreneurship training 6,597 13.4 5,198 24.9 1,399 5.0
Foreign language training 2,181 4.4 - 0.0 2,181 7.7
IT training 1,248 2.5 - 0.0 1,248 4.4
Accounting/book-keeping 1,784 3.6 - 0.0 1,784 6.3
Health and safety 3,453 7.0 1,771 8.5 1,682 6.0
Compliance with procedures or regulations 495 1.0 206 1.0 289 1.0
Other 2,317 4.7 2,317 11.1 - 0.0
Total 49,051 100.0 20,843 100.0 28,209 100.0
Urban areas
Vocational 1,604 17.7 398 7.2 1,207 34.0
Business development/entrepreneurship training 2,317 25.5 2,317 41.9 - 0.0
Foreign language training 603 6.6 - 0.0 603 17.0
IT training 1,248 13.7 - 0.0 1,248 35.1
Accounting/book-keeping 206 2.3 - 0.0 206 5.8
Health and safety 289 3.2 289 5.2 - 0.0
Compliance with procedures or regulations 495 5.5 206 3.7 289 8.1
Other 2,317 25.5 2,317 41.9 - 0.0
Total 9,080 100.0 5,527 100.0 3,553 100.0
Rural areas
Vocational 29,372 73.5 10,952 71.5 18,420 74.7
Business development/entrepreneurship training 4,280 10.7 2,881 18.8 1,399 5.7
Foreign language training 1,577 3.9 - 0.0 1,577 6.4
IT training - 0.0 - 0.0 - 0.0
Accounting/book-keeping 1,577 3.9 - 0.0 1,577 6.4
Health and safety 3,164 7.9 1,482 9.7 1,682 6.8
Compliance with procedures or regulations - 0.0 - 0.0 - 0.0
Other - 0.0 - 0.0 - 0.0
Total 39,971 100.0 15,315 100.0 24,656 100.0

64
Table A8. Distribution of self-employed youth (own-account workers and employers) by problems in running the business
Most important problem Total Male Female
Number (%) Number (%) Number (%)
Total (Urban + Rural)
Insufficient financial resources 284,909 43.9 130,817 47.6 154,093 41.1
Insufficient quality of staff 6,770 1.0 400 0.1 6,370 1.7
Insufficient (personal) business expertise 35,003 5.4 16,961 6.2 18,042 4.8
Legal regulations 6,882 1.1 3,088 1.1 3,794 1.0
Shortages in raw materials 31,594 4.9 11,190 4.1 20,404 5.4
Labour shortage 70,744 10.9 36,276 13.2 34,468 9.2
Political uncertainties 1,807 0.3 75 0.0 1,732 0.5
Access to technology 16,340 2.5 6,219 2.3 10,121 2.7
Product development 5,503 0.8 4,552 1.7 951 0.3
Competition in the market 149,072 23.0 53,239 19.4 95,833 25.6
Other 40,781 6.3 11,972 4.4 28,809 7.7
Total self-employed youth 649,406 100.0 274,789 100.0 374,617 100.0
Urban areas
Insufficient financial resources 30,907 38.4 13,490 47.9 17,417 33.2
Insufficient quality of staff 1,779 2.2 400 1.4 1,379 2.6
Insufficient (personal) business expertise 3,019 3.7 967 3.4 2,053 3.9
Legal regulations 506 0.6 - 0.0 506 1.0
Shortages in raw materials 3,647 4.5 726 2.6 2,920 5.6
Labour shortage 3,839 4.8 - 0.0 3,839 7.3
Political uncertainties 75 0.1 75 0.3 - 0.0
Access to technology 879 1.1 587 2.1 292 0.6
Product development - 0.0 - 0.0 - 0.0
Competition in the market 33,070 41.1 10,883 38.6 22,188 42.4
Other 2,829 3.5 1,041 3.7 1,789 3.4
Total self-employed youth 80,551 100.0 28,169 100.0 52,382 100.0
Rural areas
Insufficient financial resources 254,002 44.7 117,326 47.6 136,676 42.4
Insufficient quality of staff 4,992 0.9 - 0.0 4,992 1.5
Insufficient (personal) business expertise 31,984 5.6 15,994 6.5 15,990 5.0
Legal regulations 6,376 1.1 3,088 1.3 3,288 1.0
Shortages in raw materials 27,947 4.9 10,464 4.2 17,484 5.4
Labour shortage 66,905 11.8 36,276 14.7 30,629 9.5
Political uncertainties 1,732 0.3 - 0.0 1,732 0.5
Access to technology 15,460 2.7 5,632 2.3 9,829 3.1
Product development 5,503 1.0 4,552 1.8 951 0.3
Competition in the market 116,002 20.4 42,357 17.2 73,645 22.9
Other 37,952 6.7 10,931 4.4 27,020 8.4
Total self-employed youth 568,855 100.0 246,620 100.0 322,235 100.0

65
Table A9. Distribution of self-employed workers (own-account workers and employers) by source of funding for starting their current activity
Main source of funding Total Male Female
Number (%) Number (%) Number (%)
Total (Urban + Rural)
No money needed 31,999 4.9 13,523 4.9 18,477 4.9
Own savings 332,619 51.2 131,185 47.7 201,434 53.8
Money from family or friends 201,823 31.1 94,328 34.3 107,495 28.7
Loan from microfinance institutions 50,341 7.8 23,744 8.6 26,596 7.1
Loan from bank 19,284 3.0 7,152 2.6 12,132 3.2
Loan from an informal financial operator 13,340 2.1 4,857 1.8 8,483 2.3
loan/assistance from government institution - 0.0 - 0.0 - 0.0
Loan/assistance from NGO, donor project - 0.0 - 0.0 - 0.0
Remittances from abroad - 0.0 - 0.0 - 0.0
Total self-employed youth 649,406 100.0 274,789 100.0 374,617 100.0
Urban areas
No money needed 5,200 6.5 3,878 13.8 1,323 2.5
Own savings 32,503 40.4 7,520 26.7 24,984 47.7
Money from family or friends 35,068 43.5 14,668 52.1 20,400 38.9
Loan from microfinance institutions 2,681 3.3 1,597 5.7 1,084 2.1
Loan from bank 4,494 5.6 506 1.8 3,988 7.6
Loan from an informal financial operator 603 0.7 - 0.0 603 1.2
loan/assistance from government institution - 0.0 - 0.0 - 0.0
Loan/assistance from NGO, donor project - 0.0 - 0.0 - 0.0
Remittances from abroad - 0.0 - 0.0 - 0.0
Total self-employed youth 80,551 100.0 28,169 100.0 52,382 100.0
Rural areas
No money needed 26,799 4.7 9,645 3.9 17,154 5.3
Own savings 300,116 52.8 123,666 50.1 176,450 54.8
Money from family or friends 166,755 29.3 79,660 32.3 87,095 27.0
Loan from microfinance institutions 47,660 8.4 22,147 9.0 25,512 7.9
Loan from bank 14,790 2.6 6,646 2.7 8,144 2.5
Loan from an informal financial operator 12,737 2.2 4,857 2.0 7,879 2.4
loan/assistance from government institution - 0.0 - 0.0 - 0.0
Loan/assistance from NGO, donor project - 0.0 - 0.0 - 0.0
Remittances from abroad - 0.0 - 0.0 - 0.0
Total self-employed youth 568,855 100.0 246,620 100.0 322,235 100.0

66
Table A10. Distribution of in-school youth by highest educational attainment expected
Highest educational attainment expected Total Male Female
Number (%) Number (%) Number (%)
Total (Urban + Rural)
Elementary education 18,186 1.4 9,688 1.4 8,498 1.3
Vocational education (secondary) 11,342 0.9 8,070 1.2 3,272 0.5
Secondary education 338,226 25.9 172,590 25.7 165,637 26.2
Vocational education (post-secondary) 42,178 3.2 23,654 3.5 18,524 2.9
University 761,652 58.4 389,626 57.9 372,025 58.8
Post-graduate studies 133,635 10.2 68,990 10.3 64,644 10.2
Total in-school youth 1,305,219 100.0 672,618 100.0 632,601 100.0
Urban areas
Elementary education 587 0.1 587 0.3 0 0.0
Vocational education (secondary) 1,739 0.4 199 0.1 1,540 0.8
Secondary education 51,185 12.5 25,814 12.4 25,371 12.5
Vocational education (post-secondary) 4,113 1.0 3,011 1.4 1,102 0.5
University 281,560 68.6 139,941 67.3 141,619 70.0
Post-graduate studies 71,128 17.3 38,407 18.5 32,720 16.2
Total in-school youth 410,311 100.0 207,959 100.0 202,352 100.0
Rural areas
Elementary education 17,599 2.0 9,101 2.0 8,498 2.0
Vocational education (secondary) 9,603 1.1 7,871 1.7 1,732 0.4
Secondary education 287,042 32.1 146,776 31.6 140,266 32.6
Vocational education (post-secondary) 38,066 4.3 20,643 4.4 17,422 4.0
University 480,092 53.6 249,685 53.7 230,406 53.6
Post-graduate studies 62,507 7.0 30,583 6.6 31,924 7.4
Total in-school youth 894,908 100.0 464,659 100.0 430,249 100.0
Table A11. Share of young students combining work and study
Work and study Total Male Female
Number (%) Number (%) Number (%)
Total (Urban + Rural)
Working during the school season 290,227 8.1 121,020 7.6 169,207 8.5
Working outside the school season 402,896 11.2 169,414 10.6 233,482 11.7
Working during and outside the school season 2,896,960 80.7 1,311,443 81.9 1,585,517 79.7
Total 3,590,082 100.0 1,601,877 100.0 1,988,205 100.0
Urban area
Working during the school season 33,027 5.9 11,220 5.0 21,807 6.5
Working outside the school season 76,476 13.6 34,783 15.5 41,692 12.4
Working during and outside the school season 451,891 80.5 178,265 79.5 273,627 81.2
Total 561,394 100.0 224,268 100.0 337,126 100.0
Rural area
Working during the school season 257,200 8.5 109,800 8.0 147,400 8.9
Working outside the school season 326,420 10.8 134,631 9.8 191,789 11.6
Working during and outside the school season 2,445,068 80.7 1,133,178 82.3 1,311,890 79.5
Total 3,028,689 100.0 1,377,609 100.0 1,651,079 100.0
67
Annex IV. Survey personnel
Survey Management
H.E. Ms. Hang Lina Director General, NIS
Project Director
Mr. HEANG Kanol Deputy Director General, NIS
Operational Management and Coordination
Technical Personnel
Mr. Sok Kosal Deputy Director General, NIS
Sampling Design
Mr. Yip Thavrin Deputy Director of Sub-National Statistics, NIS
Programmer and Tabulation
Mr. Khieu Khemarin Deputy Director of Social Statistics, NIS
Data Processing and Coordination
Technical Support of ILO/YEP
Ms. Sara Elder Research Specialist and Work4Youth Coordinator, ILO-Geneva
Mr. Yves Perardel
Statistician, W4Y Project
Youth Employment Programme, ILO-Geneva
Data Collection Personnel
1. Supervisor (NIS)
Mr. Chhom Pisith Mr. Moeung Rado
Mr. Pha Engsry Mr. Lmot Samkol
Mr. Sam Saroeurn Mr. Heang Sovithyea
Mr. Seang Rith Mr. Som Bony
2. Enumerator (NIS)
Mr. Nen Chourn Nath Mr. Chek Pheakdey
Mr. Heng Dara Mr. Keo Channareth
Mr. Seng Sovanang Mr. Pen Sophorn
Mr. Moeung Marady Mr. Uy Savan
Mr. Khuon Sithana Mr. Lenh Heang
Mr. So Sokhim Ms. Hang Phally
Mr. Bun Narith Ms. Vuth Sokun
Mr. Leng Vansak Mr. Hok Narin
Mr. Samut Sotha Mr. Chhun Saovy
Mr. Mak Huch Mr. Nguon Nor
Mr. Un Chamroeun Mr. Im Nhen
Mr. Mom Sathya Mr. Sim Seth
Ms. Heng Mala Mr. Bou Noch
Ms. Sin Somala Mr. Roeun Kimsreng
Mr. Nget Ketya Ms. Nhoung Kunthea
Mr. Pok Piseth Mr. Mak Sovichea
68
Data Processing Personnel
1. Data coding personnel (NIS)
Mr. Kith Thona (Supervisor)
Ms. Khon Neary Ms. Hang Chariya
Ms. Heng Vichet Mr. Nou Phirun
Ms. Chhin Phearum Mr. Sim Socheat
Ms. Chim Sayuth Mr. Un Savin
2. Data entry personnel (NIS)
Mr. Nop Rithy Ms. Yim Chanrany
Ms. Choun Sokunthea Ms. Mey Sokmarady
Ms. Suy Sotheara Ms. Lim Rathphomealea
Ms. So Sovannchakriya Ms. Nong Sokuntheavy
Ms. San Sopha Ms. Hun Phany
Report Writer
Mr. HEANG Kanol Report on Labour Market Transitions of Young Women and Men
in Cambodia, 2014
Report editor


Published by: National Institute of Statistics Ministry of Planning
#386, Preah Monivong Boulevard, Phnom Penh, Kingdom of Cambodia
Telephone: (855) 23 213 650 Facsimile: (855) 23 213 650 Website: www.nis.gov.kh
Related Documents