Labour Market Segmentation, Occupational Choice and Non-farm Rural Employment: Multinomial Logit Estimation in India Panchanan Das Professor Department of Economics University of Calcutta Email: [email protected] & Anindita Sengupta Associate Professor Hooghly Women’s College Email: [email protected] This study is an attempt to look into the causal effect of education on occupational choice in the presence of labour market segmentation with micro level survey data on employment and unemployment in India. In this study, the dependent variable is a categorical variable, type of employment based on principal activity status and occupational status. Rural employment has been categorised into 8 groups: self-employed in agriculture and non-agriculture, unpaid family workers in agriculture and non-agriculture, regular wage earners in agriculture and non-agriculture, casual labour in agriculture and non-agriculture. As employment category is likely to be endogenously rather than exogenously determined, the dependent variable is a stochastic event describing the outcome of this stochastic event with a density function. Thus a multinomial logit model may be appropriate for predicting the occupational choice of individuals. Casual worker in agriculture is taken as the reference group in the multinomial logit model used in this study to look at the transformation of workers towards nonfarm employment. Rural people who have education the middle school or secondary level were mostly engaged in self-employment group either in the farm or non-farm sector. The persons with higher level of education were mostly absorbed as wage or salaried workers on permanent basis as expected. The coefficients for different education dummies are the multinomial logit estimate comparing the effects of education on occupational choice for different categories of employment relative to those in casual employment in agriculture given the other variables in the model are constant. Key words: participation, occupational choices, labour market, multinomial logit JEL Classification: I 21, I38, J21, J24, J64

Welcome message from author
This document is posted to help you gain knowledge. Please leave a comment to let me know what you think about it! Share it to your friends and learn new things together.
Transcript

Labour Market Segmentation, Occupational Choice and Non-farm Rural Employment: Multinomial Logit Estimation in India
Panchanan DasProfessorDepartment of EconomicsUniversity of CalcuttaEmail: [email protected]
&
Anindita SenguptaAssociate ProfessorHooghly Women’s CollegeEmail: [email protected]
This study is an attempt to look into the causal effect of education on occupational choice in the presence of labour market segmentation with micro level survey data on employment and unemployment in India. In this study, the dependent variable is a categorical variable, type of employment based on principal activity status and occupational status. Rural employment has been categorised into 8 groups: self-employed in agriculture and non-agriculture, unpaid family workers in agriculture and non-agriculture, regular wage earners in agriculture and non-agriculture, casual labour in agriculture and non-agriculture. As employment category is likely to be endogenously rather than exogenously determined, the dependent variable is a stochastic event describing the outcome of this stochastic event with a density function. Thus a multinomial logit model may be appropriate for predicting the occupational choice of individuals. Casual worker in agriculture is taken as the reference group in the multinomial logit model used in this study to look at the transformation of workers towards nonfarm employment. Rural people who have education the middle school or secondary level were mostly engaged in self-employment group either in the farm or non-farm sector. The persons with higher level of education were mostly absorbed as wage or salaried workers on permanent basis as expected. The coefficients for different education dummies are the multinomial logit estimate comparing the effects of education on occupational choice for different categories of employment relative to those in casual employment in agriculture given the other variables in the model are constant.
Key words: participation, occupational choices, labour market, multinomial logit
JEL Classification: I 21, I38, J21, J24, J64

1. Introduction
Economic growth normally makes gradual transference of labour out of low paid land
based activities into the high paid non-farm activities (Lewis 1954, Kaldor 1966) and labour
market has been segmented with this labour transference. Labour market segmentation is
closely related to labour market discrimination. As the labour markets are more segmented
the most vulnerable groups of workers would likely to be affected more badly. Resource
poor, uneducated, semi-skilled persons trapped in perpetual poverty. Socially disadvantaged
tribal Dalits and other economically less endowed people are in chronic poverty. Women,
particularly within this disadvantaged class, tend to be more vulnerable than men when
labour markets are segmented more, reflected in lower participation rates with less earnings.
Labour market dynamism has been rising with the expansion of non-farm
employment, but the expansion of employment opportunities is restricted for a very few well-
endowed groups of workers keeping a large proportion remained in low productive informal
employment. It results in widening wage gap between farm and non-farm sectors, and even
between different segments within the non-farm sector in the rural economy. While higher
level of education enables people to increase their chances of having access to employment
by enhancing the quality of their job search, there are many socio-economic and other
restrictions for the lower strata of the people to enter into higher hierarchy employment.
Non–farm employment in the rural economy assumes significance in creating new
jobs as well as diversification of jobs away from agriculture in a transitional economy like
India. Non-farm activities in rural India have been segmented into several heterogeneous
types and in most of them, the dominant forces are informal and casual workers. While
regular non-farm wage employment and, in some cases, self-employment are largely the
outcome of the dynamic process of sectoral transformation out of agriculture into
manufacturing and services, non-farm wage employment on casual basis is a part of residual
activities into which poor people are forced to participate.
Human capital, particularly education, is very much crucial in explaining occupational
choice, both in developed as well as less developed countries1. It is well documented that
better-educated individuals earn higher wages, experience less unemployment, and work in
1 The issue relating to human capital and growth was started to stimulate in the late 1950s by the belief that increasing human capital could explain much of the productivity growth, leaving little contribution for technological change (Becker, 1964; Griliches, 1977).

more high-status occupations than their less-educated counterparts (Cohn and Addison 1997).
However, the accumulation of human capital through education is no longer a guarantee of
getting a better quality job. There are many socio-economic and cultural factors that actually
restrict the vulnerable people to enter into higher hierarchy employment. In many cases,
certain groups of workers are segregated from better jobs because they are less acceptable
socially rather than because they lack ability.
In recent years the nature of labour market in India, as in other transitional economies,
has changed dramatically because of pro-business market openness and deregulation of
labour market which have motivated to examine further the nature of labour market
segmentation in a transitional economy like India. Firms are allowed to be more flexible in
determining the conditions under which they employ workers. Some firms have taken the
opportunity to reduce their labour costs either by displacing labour or by increasing working
hours per worker. Labour market flexibility enhances the peripheral segment of the labour
market by reducing the core segment of it.
Against this background the present study looks into some interrelated issues on
occupational choice particularly in non-farm employment in the presence of labour market
segmentation with micro level survey data on employment and unemployment in India. The
objective is to examine empirically how the labour market participation of a person is
affected by the level of education along with other observable household characteristics. We
hypothesise that occupational choice of a person is determined by the social and demographic
characteristics of individuals, such as social status, family background, gender, along with the
level of schooling. We have examined how household specific factors are associated with
non-farm employment at the individual level by applying multinomial logit model. This study
in estimating the effect of education on employment may be helpful to reconcile the various
findings in the literature, and provides a useful framework for generating new hypotheses and
insights about the connection between education and earnings.
The study begins with a brief overview of the theoretical analyses on occupational
choice and labour market segmentation that are helpful in interpreting the empirical findings
of this study in section 2. The data used in this study are described shortly in section 3.
Section 4 deals with the econometric models used in this study. Section 5 interprets the
empirical findings. Section 6 summarises and concludes.

2. Theoretical views
In the neoclassical framework, occupational decisions are based mainly on initial
wealth distribution and level of human capital. Persons at higher deciles in the wealth
distribution have access to adequate fund to become entrepreneurs, while the persons located
in the middle of the initial wealth distribution enter into self-employment group with a low
scale production process. The persons at the lower end of the wealth distribution have no
option other than joining wage-employment group (Lucas 1978, Kihlstrom and Laffont 1979,
Banerjee and Newman 1993). In developing countries, however, a large proportion of people
are forced to choose self-employment or wage employment on casual basis to maintain
merely a subsistence level of living. Thus, self-employment, along with wage employment on
casual basis, can be found mostly in the lower end of the income distribution. The
neoclassical general equilibrium analysis of occupational choice, perhaps, fails to
accommodate the stylised facts on employment structure in a less developed economy, where
a significant part of the labour force are self-employed or wage workers in the informal
sector. A disequilibrium model with labour market inflexibilities, instead of general
equilibrium in a neoclassical set up, may be appropriate to study the labour market dynamics
in developing countries.
The human capital theory of the 1960s suggests that education and training would
improve workers’ skills, enabling them to work in the nonfarm sector for higher wage
(Schultz 1961, Becker 1964). In Becker (1964), each individual faces a market opportunity
locus that gives the level of earnings associated with alternative choice of schooling. There is
a fundamental duality even within the informal sector, where some people are forced to work
in a lower tier, while others work in an upper tier into which entry is restricted because of the
lack of human capital and financial capital (Fields, 2007).
Labour market segmentation theory challenges both the neoclassical and human
capital theory on the grounds that workers and jobs are not matched perfectly by a
competitive market mechanism. Segmentation in the labour market is based both on job
characteristics and differences in workers’ attributes like education and training. While
segmentation theory focusses more on demand side and institutional factors, segmentation of
labour is intertwined with supply-side processes of social stratification with class, gender and
ethnic groups (Valentine et al., 1998).

In this approach labour market is segmented between the core (formal) and the
periphery (informal) sectors consisting of permanent employment with high wage and
contractual employment with low wage respectively. Working conditions in the core segment
are better in terms of wages and social security benefits than those in peripheral employment.
In the core sectors, firms have monopoly power in large scale production with extensive use
of capital. Trade union activities are normally strong in these sectors. In contrast, in small
firms in the periphery sectors employ labour-intensive methods of production under roughly
competitive conditions with low levels of unionisation. The advantages enjoyed by core firms
do not, however, automatically result in favourable employment conditions for workers.
Segmentation theory views that the high pay of workers in the core sector may not be
simply because of superior quality of the workers’ attributes, although the labour quality is
better in this sector as compared to labour quality in the peripheral sectors. Labour
productivity in the core sectors is higher than the productivity in the periphery sectors mainly
because of the infrastructural facilities in the workplace. More importantly, the wage
differences between these sectors cannot be explained meaningfully in terms of the
differences in labour characteristics. The labour market segmentation is thus seen as a key
ingredient in the generation of economic inequality. Wage structures are differentiated largely
by employer characteristics rather than worker attributes.
3. Data
We have used unit level data from 68th round survey on employment and
unemployment situation in India (Schedule 10) for the period 2011-12 provided by the
National Sample Survey Office (NSSO). The cross-sectional survey is roughly representative
of the national, state, and the so-called “NSS region” level. It gathers information about
demographic characteristics of household members, weekly time disposition, and their main
and secondary job activities. The principal job activities are defined for all household
members as self-employed, regular salaried worker, casual wage labourer and so on. The
usual principal activity status is used to examine employment status of a person.
The major aims of this household level survey have been to measure the magnitude of
employment and unemployment in quantitative terms disaggregated by various household
and population characteristics at the national and state levels. In order to capture the multi-
dimensional aspects of employment and unemployment, data on several correlates were also

gathered. Each quinquennial round is further segregated into four sub-rounds2 and covers the
whole of the Indian Union except few regions3. A stratified multi-stage sampling design was
adopted for the survey both in rural and urban areas4. In this paper we have taken usual
principal status of employment5 of the age group 15-65 years in rural areas for our analysis.
Total number of working age persons in the sample is 186485.
In schedule 10 of 68th round survey rural households have been categorised into six
groups: self-employed in agriculture, self-employed in non-agriculture, regular wage or
salary earning, casual labour in agriculture, casual labour in non-agriculture, and others.
Occupation type has been categorised into nine groups in single digit NCO classification.
Activity types have been classified by usual status of employment. By combining activity
status and occupational status we have constructed employment type in rural labour market.
4. Methodology
In this study, the dependent variable is a categorical variable, type of employment,
constructed by combining the principal activity status and occupational status of the working
people. As employment category is likely to be endogenously rather than exogenously
determined, the dependent variable is a stochastic event describing the outcome of this
stochastic event with a density function. Thus a multinomial logit model may be appropriate
for predicting the occupational choice of individuals. The logit assumes the log distribution to
restrict the probability values within the range between zero and unity. Multinomial logit
regression is a multi-equation model, similar to multiple linear regression, or to the
multivariate discriminant analysis. For a limited dependent variable with k categories the
multinomial regression model estimates k-1 logit equations.
The multinomial logit model is specified as
2 The sub-rounds are from July-September, October to December, January to March, and April to June. The number of sample villages and blocks are allotted for these surveys in each of these four sub-rounds are equal.3 i) Leh(Ladakh) and Kargil districts of Jammu & Kashmir ii)interior villages of Nagaland situated beyond five kilometres of the bus route and iii) villages in Andaman and NicobarIslands which remain inaccessible throughout the year
4 The first stage units (FSUs) are villages for rural areas and NSS urban frame survey (UFS) blocks for urban areas. The ultimate stage units (USU) are households.5 Wage information for the regular salaried workers and casual workers are only available from surveys but as for the self-employed category it is not easy to separate out the wage component.

ijjiij uXU (1)
Here, Uij is the utility of individual i in choosing employment of category j, Xi is a vector of
observed individual characteristics determining the choice of occupation by individual i, βj is
the coefficient vector attached in employment category j, uij is random error. The utility
function is stochastic and a linear function of the observed individual characteristics. Now,
the utility, Uij, is a latent variable which we do not observe. What we observe is a
polychotomous variable, y, with values 1 to 8 corresponding to eight types of employment
category as we have constructed from the data. An individual i participates in employment
category j for which y = j when Uij > Uik.
The probability that the response to the jth outcome is
1
1
)exp(
expk
jj
jj
x
xpjyP
(2)
The model described in equation (2), however, is unidentified in the sense that there is more
than one solution to βj that leads to the same probabilities for y=1, y=2, y=3 etc. To identify
the model, we have to set arbitrarily βj =0 for any value of j. If we arbitrarily set β1 =0, the
remaining coefficients β2, β3,…., β8 will measure the change relative to the y = 1 group. In
the multinomial logit model, we estimate a set of coefficients, βj, j = 1,2,3…8, corresponding
to each outcome with respect to the base outcome. Let the base outcome be 1, i.e. β1 =0.
Thus,
8
2
1
)exp(1
11
jjx
pyP
(3)
1,
)exp(1
exp8
2
jforx
xpjyP
jj
jj
(4)
The relative probability of y = j, j >1, to the base outcome is
pjpkjkjjjj xxxxx
p
p ..............exp)exp( 2211
1
(5)

This ratio is called the relative risk. The relative risk for a one-unit change in xk is exp(βjk).
Thus the exponentiated value of a coefficient is the relative-risk for a one-unit change in the
corresponding variable (risk is measured as the risk of the outcome relative to the base
outcome).
pjpkjkjjjj xxxxx
p
p ..............ln 2211
1
(6)
Using the multinomial logistic distribution, the utility of an individual by offering labour in
sector j is nothing but the log of the relative risk, or the log odd ratio:
uxxxyp
ypyit pp
......
)1(1
)1(log1log 22110
uxxxyp
ypyit pp
......
)2(1
)2(log2log 22110 , and so on.
The multinomial logit is estimated by using the maximum likelihood method. The slope
coefficient represents the change in the log odds of being in the j-category of employment
versus the reference category with an increase in one unit of independent variable. The
significance of the parameter estimates can be determined through usual t-test.
5. Empirical results
The 68th round survey on employment and unemployment in India during 2011-12
highlights some features of labour market segmentation in rural India. The worker population
ratio for men was more than doubled the ratio for women in rural areas and nearly four times
higher in urban areas. In usual status employment in the rural labour market the major part of
the workers, both men and women, were in self-employment. About 10 per cent of rural male
workers and only 6 per cent of rural female workers were in wage employment on regular
basis. The proportion of casual labour among workers was about 36 per cent for rural males
and 35 per cent for rural females. The share of casual workers was significantly higher in the
rural economy than in the urban economy, while the situation was reversed for wage
employment on regular basis. Gender gap has been highly prominent both in employment
status and in wages both in rural and urban economy.

The labour force participation rate in usual status decreased by 1 percentage point for
rural men and by 8 percentage points for rural women during the period 1993 – 2012, while
the rate increased by 2 percentage points for urban men and decreased by 1 percentage point
for urban women during the same period. The worker population ratio remained at the same
level for rural men, but for rural women the ratio decreased by about 7 percentage points
during 1972-2012. The proportion of workers engaged in the agriculture declined, but very
slowly, to 59 percent men and to 75 percent for women in rural India in 2011-12. The main
absorber in the non-farm sector has been construction in which the proportion workers
increased by 11 percentage points and 6 percentage points respectively for men and women
workers in rural areas, but mostly in the form of casual employment during the period
between 1977-78 and 2011-12.
In this study rural employment has been categorised into 8 groups: self-employed in
agriculture and non-agriculture, unpaid family workers in agriculture and non-agriculture,
regular wage earners in agriculture and non-agriculture, and casual labour in agriculture and
non-agriculture. The labour market segmentation in rural India is analysed by taking these
categories of employment. Casual worker in agriculture is taken as the reference group in the
multinomial logit model used in this study to look at the transformation of workers towards
nonfarm employment. Self-employment in non-agriculture has been highly heterogeneous
ranging from high risk bearing entrepreneur to petty shop keepers, or street vendors.
This study uses the working age (15–65 years old) population. Level of education,
gender, social and religious status, along with other demographic characters are taken as
possible responsible factors in explaining occupational choice in a segmented labour market.
In many studies, education is measured in terms of years of schooling. But, the relationship
between job selection and education, or the relation between earning and education is not
linear. To account for the nonlinear relationship between occupational choice and the level of
education, we have used different dummies for different levels of education: illiterate, literate
less than primary level, primary level, high school, and graduate and above. The relationship
between education and type of employment is affected highly by gender and other social
factors. Gender dummy is used to capture the differential impact of gender on participation in
the job market. The life-cycle effects are captured by age and the age-squared of the worker.
We have segmented the rural labour market on the basis of type of employment. All
activities in the rural economy have been segmented into farm and non-farm activities. By

combining the principal activity status and the status of occupation as revealed in schedule 10
of the 68th round survey on employment and unemployment in India we have constructed
four categories of employment both in the farm and non-farm sectors: self-employment,
employed as unpaid family worker, wage worker on permanent basis and wage worker on
casual or temporary basis. From the last column of Table 1 it is revealed that over 60 percent
of the rural workers were absorbed in the non-farm sector in which the highest share of
employment was in the form of casual labour followed by self-employed worker and regular
wage worker. In the farm sector, on the other hand, the majority of the working people were
concentrated either as self-employed farmers or as unpaid family workers.
Table 1 also presents the distribution of working age people with different levels of
education by types of employment in rural India during 2011-12. Majority of the rural
working people with no education or schooling up to primary education were absorbed as
casual workers in non-farm activities followed by self-employment in farming. A significant
part of the persons with schooling up to primary level, however, were engaged in self-
employment in the non-farm sector. Rural people who have education the middle school or
secondary level were mostly engaged in self-employment group either in the farm or non-
farm sector. The persons with higher level of education (higher secondary, diploma, graduate,
post-graduate and above) were mostly absorbed as wage or salaried workers on permanent
basis as expected.
Table 1 Distribution of educated working age people by types of employment in rural India: 2011-12
Not literate
Below primary
Primary Middle SecondaryHigher
secondaryDiploma course
GraduatePostgraduate
and aboveAll
Farm sector 39.1Self employed 27.2 51.4 23.6 22.9 22.1 18.4 8.4 12.4 8.5 22.7Family worker 17.8 25.0 15.2 15.6 16.6 17.1 7.3 10.3 5.7 15.4Regular wage worker 0.1 0.4 0.2 0.3 0.3 0.5 0.6 0.4 0.1 0.2Casual wage worker 1.0 1.9 1.0 0.9 0.4 0.2 0.2 0.2 0.0 0.7Non-farm sector 60.9self employed 14.7 41.7 21.7 22.1 22.8 19.3 17.4 17.4 12.7 19.4Family worker 4.2 7.7 4.9 5.8 5.5 5.9 2.9 4.2 2.0 4.8Regular wage worker 4.4 14.7 9.0 12.8 19.8 31.5 58.0 52.9 69.9 16.6Casual wage worker 30.6 54.7 24.5 19.7 12.7 7.0 5.2 2.3 1.1 20.1
Source: Authors’ calculation with 68th round unit level NSS data

The human capital theory, as discussed above, highlights that earnings are positively
related to the level of education. According to this theory as the level of education rises, the
level of earnings will rise by following the necessary condition for optimal choice of
schooling. This kind of theoretical behaviour may not be observed in the labour market in a
developing country like India. Table 2 displays the variation of weekly wages earned by
different types of wage workers by the level of education. We do not find a monotonic and
linear relation between wage and education level in either type of employment in the Indian
rural labour market. In agriculture, the average weekly wage was significantly lower for
workers with primary level of education as compared to them with schooling level below
primary. Permanent workers in farming with education level diploma got lower wages than
those with higher secondary level of education. In the non-farm sector, however, we have
observed a systematic rise of wages with education for workers employed on regular or
permanent basis.
Table 2 Average weekly wages (in Rs.) of rural workers by levels of education: 2011-12
Employment type
Level of education
Regular wage
worker in agriculture
Casual wage
worker in agriculture
Regular wage
worker in non-
agriculture
Casual wage
worker in non-
agriculture
Not literate 904.55 600.87 1252.65 862.40
Literate below primary 2211.50 723.45 1483.87 950.02
Primary 1627.22 693.04 1536.67 961.17
Middle 2414.44 894.06 1759.12 1025.07
Secondary 2806.19 800.82 2526.77 1056.76
Higher secondary 3228.41 530.56 3022.67 1025.62
Diploma course 2232.57 695.00 3582.64 1319.96
Graduate 4653.95 687.14 4005.89 1315.45
Post-graduate and above 3600.00 - 4693.88 961.45
Source: As for Table 1
Against the background of the stylised facts as displayed in Tables 1 and 2 we have
examined the nature of occupational choice explained by education along with some
household specific factors as controlled variables by estimating multinomial logit model. The
estimated results are shown in Table 3. Total number of observations used in estimating the
model, 91778, is less than the number of observations in the dataset because there are missing
values for some variables in the equation. Multinomial logistic regression uses maximum
likelihood estimation, which is an iterative procedure. The first iteration (called iteration 0) is

the log likelihood of the "null" or "empty" model; that is, a model with no predictors. At the
next iteration, the predictor(s) are included in the model. At each iteration, the log likelihood
decreases because the goal is to minimise the log likelihood.
The estimated statistics as shown in the lower panel of Table 3 indicate how the
model is fitted good. The log likelihood shown in Table 3 is the estimated value for the fitted
model. It is used in the Likelihood Ratio χ 2 test of whether all predictors' regression
coefficients in the model are simultaneously zero and in tests of nested models. The
Likelihood Ratio (LR) χ2 (77) test that for all equations relating to different types of
employment relative to the base employment type (casual worker in agriculture, the most
disadvantaged type of workers) at least one of the predictors' regression coefficient is not
equal to zero. The number in the parentheses indicates the degrees of freedom of the χ2
distribution used to test the LR χ2 statistic and is defined by the number of models estimated
(7) times the number of predictors in the model (11). The LR χ2 statistic is calculated by -2*(
L(null model) - L(fitted model)) = -2*(( -161514.06) - (-143809.57)) =35408.97, where
L(null model) is from the log likelihood with just the response variable in the model
(Iteration 0) and L(fitted model) is the log likelihood from the final iteration (assuming the
model converged) with all the parameters.
The probability of getting a LR test statistic as extreme as, or more so, than the
observed under the null hypothesis, (<0.00001), would lead us to conclude that at least one of
the regression coefficients in the model is not equal to zero. Here, the null hypothesis is that
all of the regression coefficients across the models are simultaneously equal to zero. The
parameter of the χ2 distribution used to test the null hypothesis is defined by the degrees of
freedom in the prior line, χ2 (77). Logistic regression does not have R2 that is found in OLS
regression. The pseudo-R2 statistics does not mean the proportion of variance for the response
variable explained by the predictors.
An important feature of the multinomial logit model is that it estimates k-1 models,
where k is the number of levels of the dependent variable. The type of employment is the
response variable in the multinomial logistic regression. We have constructed 8 types of
employment in the rural labour market: 4 in the farm sector and 4 of similar kind in the non-
farm sector. The referent employment in our econometric model is casual workers in
agriculture, the most disadvantaged group of workers in the rural economy. In our case, we
have set casual employment in agriculture as the referent group and therefore estimated a
model for the remaining 7 employment groups relative to casual employment in agriculture.
The estimated coefficients in each model under multinomial logistic regression framework
corresponding to different types of employment are displayed in 7 columns in Table 3. Since
the parameter estimates are relative to the referent group, the standard interpretation of the
multinomial logit is that for a unit change in the predictor variable, the logit of an
outcome relative to the referent group is expected to change by its respective parameter
estimate given the variables in the model are held constant.
The coefficients for different education dummies (D_primary, D_middle_edu, D_HS,
D_graduate, D_post_graduate), representing lower to higher level of schooling, are the
multinomial logit estimate comparing the effects of education on occupational choice for
family workers in agriculture and other categories of employment relative to those in casual
employment in agriculture given the other variables in the model are held constant. For
example, the multinomial logit for higher secondary level of education (D_HS) relative to
other levels of education is 1.07 units higher for being in self-employment in agriculture, 1.53
units higher for family workers in agriculture, 2.65 units higher for regular wage workers in
agriculture, and so on relative to casual workers in agriculture given all other predictor
variables in the model are held constant. Similarly, the coefficients for D_female compare the
position of females to males for different types of employment relative to casual employment
in agriculture given the other variables in the model are held constant. Most of the estimated
coefficients have desired sign and are statistically significant at 1 percent level.
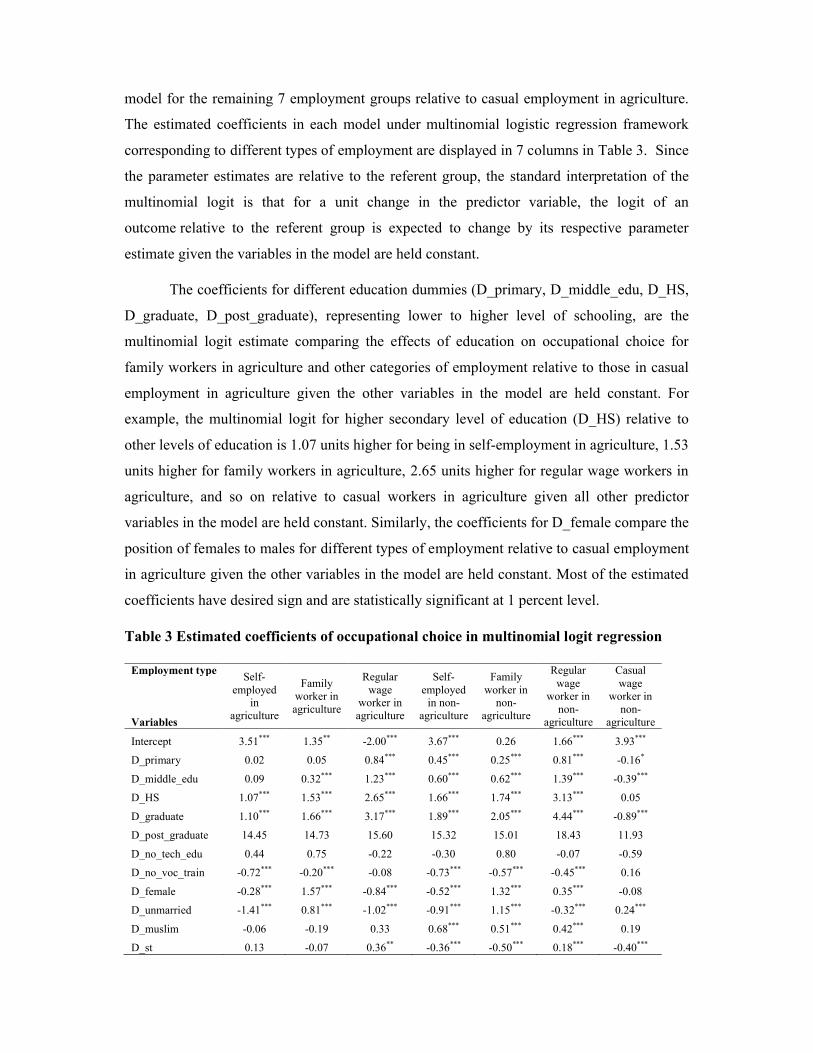
Table 3 Estimated coefficients of occupational choice in multinomial logit regression
Employment type
Variables
Self-employed
in agriculture
Family worker in agriculture
Regular wage
worker in agriculture
Self-employed
in non-agriculture
Family worker in
non-agriculture
Regular wage
worker in non-
agriculture
Casual wage
worker in non-
agriculture
Intercept 3.51*** 1.35** -2.00*** 3.67*** 0.26 1.66*** 3.93***
D_primary 0.02 0.05 0.84*** 0.45*** 0.25*** 0.81*** -0.16*
D_middle_edu 0.09 0.32*** 1.23*** 0.60*** 0.62*** 1.39*** -0.39***
D_HS 1.07*** 1.53*** 2.65*** 1.66*** 1.74*** 3.13*** 0.05
D_graduate 1.10*** 1.66*** 3.17*** 1.89*** 2.05*** 4.44*** -0.89***
D_post_graduate 14.45 14.73 15.60 15.32 15.01 18.43 11.93
D_no_tech_edu 0.44 0.75 -0.22 -0.30 0.80 -0.07 -0.59
D_no_voc_train -0.72*** -0.20*** -0.08 -0.73*** -0.57*** -0.45*** 0.16
D_female -0.28*** 1.57*** -0.84*** -0.52*** 1.32*** 0.35*** -0.08
D_unmarried -1.41*** 0.81*** -1.02*** -0.91*** 1.15*** -0.32*** 0.24***
D_muslim -0.06 -0.19 0.33 0.68*** 0.51*** 0.42*** 0.19
D_st 0.13 -0.07 0.36** -0.36*** -0.50*** 0.18*** -0.40***

Log likelihood -143810 LR χ2(77) 35408.97Number of observation 91778 Prob > χ 2 0.00
Pseudo R2 0.1096
Notes: *** indicates significant at 1 percent level, ** indicates significant at 5 percent level, * indicates significant at 10 percent level, the rest are statistically insignificant.
Source: Authors’ estimation with unit level data from 68th round NSS survey.
6. Conclusions
This paper looks into the issues relating to occupational choice and human capital in a
segmented labour market in rural India with household level data from NSSO survey rounds
on employment and unemployment in India. We have examined how household specific
factors are associated with non-farm employment at the individual level by applying
multinomial logit model by taking casual workers in farm employment as a reference group.
We have failed to observe a systematic relationship between employment and level of
education supporting fully the human capital theory. Our empirical results suggest that the
household specific and demographic factors have significant role in occupational choice of an
individual. Women are less likely to be involved in self-employment both in farm and non-
farm activities.
As agriculture has limited scope to absorb increased demographic pressure, non-farm
employment in the rural economy assumes significance. Rural non–farm employment has
emerged as an important driver of both of net new job creation as well as diversification away
from agriculture. Non-farm activities has been rising since the past two decades particularly
in the shape of informal and casual employment in rural India as in other developing
countries. There has been a substantial change in sectoral composition of employment,
although not by keeping the pace of the changes in production structure. The employment
share of agriculture declined along with an increase in the shares of rural non-farm
employment. The main drivers of the change in employment structure have been
construction, trade, hotels, transport, storage and manufacturing.
Labour market dynamism has been rising with the expansion of non-farm
employment, increase in rural-urban migration, implementation of employment guarantee act
and the rising share of educated workforce. But the expansion of employment opportunities is
restricted for a very few well-endowed workers with large proportion remained in low

productive informal employment resulting in widening wage gap between farm and non-farm
sectors, and even between different segments within the non-farm sector in the rural
economy. There are many socio-economic and other restrictions for the lower strata of the
people to enter into higher hierarchy employment.
References
Banerjee, Abhijit V. and Andrew F. Newman (1993). “Occupational Choice and the Process of Development”, Journal of Political Economy, 101 (2): 274-298.
Becker, Gary S. (1964), Human capital: a theoretical and empirical analysis, with special reference to education (Columbia University Press, New York).
Cohn, Elchanan and John T. Addison (1997), "The economic returns to lifelong learning", Working paper B-97-04 (Division of Research, University of South Carolina College of Business Administration).
Fields, Gary S. (2007). "Employment in Low-Income Countries: Beyond Labor Market Segmentation?" In Pierella Paci and Pieter Serneels, eds., Employment and Shared Growth. Washington: World Bank).
Griliches, Zvi (1977), "Estimating the returns to schooling: some econometric problems", Econometrica, 45:1-22.
Kihlstrom, R., and J. Laffont (1979): “A General Equilibrium Entrepreneurial Theory of the Firm Based on Risk Aversion,” Journal of Political Economy, 87.
Lewis, W. Arthur (1954). “Economic Development with Unlimited Supplies of Labour,” Manchester School, 22: 139-191.
Lucas, R. (1978): “On the Size Distribution of Business Firms,” Bell Journal of Economics, 9.
Schultz, T.W. (1961). “Investment in Human Capital,” American Economic Review, LI: 1-17.
Valentine, G., Skelton, T. and Chambers, D. (1998). Cool places: an introduction to youth and youth cultures. In Skelton, T. and Valentine, G., eds., Cool places: geographies of youth cultures. London, Routledge, 1–32.
Related Documents