ECLAC / ILO Employment Situation in Latin America and the Caribbean May 2017 Number 16 Labour immigration in Latin America

Welcome message from author
This document is posted to help you gain knowledge. Please leave a comment to let me know what you think about it! Share it to your friends and learn new things together.
Transcript

ECLAC / ILO
Employment Situation in Latin America and the Caribbean
May 2017Number 16
Labour immigration in Latin America
ECLAC / ILO
Employment Situation in Latin America and the Caribbean
May 2017Number 16
Labour immigration in Latin America

United Nations publicationLC/TS.2017/30
Distribution: LimitedCopyright © United Nations / © ILO, May 2017All rights reservedPrinted at United Nations, SantiagoS.17-00341
Employment situation in Latin America and the Caribbean is a twice-yearly report prepared jointly by the Economic Development Division of the Economic Commission for Latin America and the Caribbean (ECLAC) and the Office for the Southern Cone of Latin America of the International Labour Organization (ILO), headed by Daniel Titelman and Fabio Bertranou, respectively. Work on the document was coordinated by Gerhard Reinecke, Senior Expert on Employment Policies of ILO, and Jürgen Weller, Chief of the Employment Studies Unit of the Economic Development Division of ECLAC.
The first section of this report was prepared by Juan Jacobo Velasco, and the second by Sonia Gontero and Jürgen Weller. Statistical information for the first part was provided by the Labour Analysis and Information System in Latin America and the Caribbean, under the coordination of Bolívar Pino. Andrés Aranzaes, Sebastián Carrasco, José Luis Germán and Roberto Marín processed census and household survey data and systematized information from these sources for the second part of the report. Thanks are owed to Jorge Martínez for guidance on the availability of census data in Latin American and Caribbean Demographic Centre (CELADE)-Population Division of ECLAC. Guillermo Dema provided valuable comments on a preliminary version of the second part of the report.

Employment Situation in Latin America and the Caribbean 3
Contents
Foreword ................................................................................................................................................................5
I. Labour market performance in Latin America and the Caribbean in 2016 .......................................................7
Introduction ............................................................................................................................................................7A. The regional urban unemployment rate posted its largest year-on-year increase in two decades, amid falling employment and growing labour market participation................................................................... 7B. The rise in unemployment affected both men and women ..........................................................................9C. Employment quality is deteriorating in the region, but with differences between countries and subregions ............................................................................................................................................9D. Conclusions and outlook ............................................................................................................................12
Bibliography .........................................................................................................................................................12
II. Labour immigration in Latin America: an evidence-based analysis ...............................................................13
Introduction ..........................................................................................................................................................13A. Demography and education of migrants to Latin American countries .......................................................14B. Aspects of the workforce integration of immigrants ...................................................................................17C. Policies and agreements to promote full and productive employment and decent work for immigrants .......24D. Summary and conclusions .........................................................................................................................28
Bibliography .........................................................................................................................................................29
Annex A1 .............................................................................................................................................................31

Employment Situation in Latin America and the Caribbean 5
Foreword
In 2016, Latin America and the Caribbean endured its largest jump in urban unemployment for two decades. Although the rise, from 7.3% in 2015 to 8.9% in 2016, can largely be attributed to the weak performance of the Brazilian labour market, most of the other countries in the region also showed signs of labour market deterioration.
In the context of a second successive year of contraction of regional output, the urban employment rate fell sharply, by 0.7 percentage points, owing chiefly to weak wage-job creation, which declined by 0.5% in the weighted average. Continued weak job creation also pushed up the participation rate, which had been in decline over the previous two years, as more members of households affected by the labour market deterioration chose to seek paid work. This greater pressure on households also produced a rise in own-account work, which offers low and unstable income in periods of weak job creation. Accordingly, the average quality of employment deteriorated, which is also reflected in weaker wage gains and in the low growth rates —or outright contractions— in registered employment.
The heavy deterioration of the domestic labour market in Brazil, where the urban unemployment rate climbed 3.7 percentage points, had a strong impact on the regional data. But amid widespread economic slowdown, above all in South America, labour markets deteriorated in other countries as well, albeit to a lesser degree. Excluding Brazil, the unemployment rate increased by 0.7 percentage points in the simple average in the Latin American countries, while it fell by 0.6 percentage points in the English- and Dutch-speaking Caribbean.
These labour trends give serious grounds for concern, given that employment is the key to reducing the poverty and severe inequality that dog this region. In fact, the region’s progress in combating both poverty and inequality has already slowed. Efforts must therefore be redoubled to “promote sustained, inclusive and sustainable economic growth, full and productive employment and decent work for all”, as called for in Sustainable Development Goal 8.
The downturn in labour conditions tends to hit the most vulnerable groups the hardest. This includes women and young people with low levels of education and immigrants, many of whom enter precarious occupations. Mass labour emigration is symptomatic of serious problems in the countries of origin of migrants and, for a number of decades, Latin America and the Caribbean has been a net out-migration region. However, for various reasons, extraregional emigration has slowed recently and intraregional migration has become more significant. As yet, little is known about the nature of immigration into countries of the region and the labour-market situation of these immigrants.
The second part of this report on the employment situation in Latin America and the Caribbean uses information from population censuses and household surveys to obtain a better understanding of immigrants’ labour-market participation in countries of the region. Among other findings, the report shows that immigrants are a very heterogeneous group, particularly in terms of age, education and labour-market participation. It finds significant differences between countries that have experienced relatively strong recent influxes of migrants and those where labour immigration is less significant or was more substantial in the past. Most immigrants entering countries with large migratory inflows are less educated than the native-born population and tend to enter lower-skilled occupations and segments that are less sought after by locals.
By contrast, migrants entering countries with less immigration relative to the total population tend to be quite highly educated and, on average, are able to secure better working conditions than the native-born workforce.
6 ECLAC / ILONumber 16
In countries with large migratory flows, the immigrant population has a lower average income than the native population, and endures higher levels of labour informality, with significantly lower levels of social security coverage, than native workers. The social security coverage of migrant women is of particular concern. These findings underline the importance of strengthening labour-market integration mechanisms, with a gender focus as an essential component. The report therefore examines the policies required to promote decent work and better access for migrant workers to productive employment, and the recent advances of the international development agenda in this regard.
The region’s economy is projected to grow by 1.1% in 2017, following two years of contraction of regional output. Although obviously an improvement, this growth will clearly not be enough to reverse the labour market deterioration of 2015 and 2016. In fact, the slight upturn projected in job creation will likely not be enough to reduce the unemployment rate. On the contrary, the urban unemployment rate is projected to continue rising, albeit more modestly, to an average of 9.2% in 2017.
José Manuel Salazar XirinachsAssistant Director-General
Regional DirectorRegional Office for Latin America and the Caribbean
of the International Labour Organization (ILO)
Alicia BárcenaUnder-Secretary General of the United Nations
Executive SecretaryEconomic Commission for Latin America
and the Caribbean (ECLAC)

Employment Situation in Latin America and the Caribbean 7
I. Labour market performance in Latin America and the Caribbean in 2016
Introduction
In 2016, Latin American and Caribbean labour markets were affected by the deepening of the economic crisis, reflected in a second year of contraction of regional output. The urban unemployment rate climbed from 7.3% in 2015 to 8.9% in 2016, the indicator’s biggest year-on-year increase in over two decades. Although the unemployment rate increased by two percentage points between 2014 and 2016, it remains lower than in the late 1990s and early 2000s. As this report will discuss, the ongoing economic
slowdown had a major impact in 2016, particularly on Brazil, whose figures weigh heaviest in regional GDP and employment variables. Calculated as a simple average, the overall impact at the regional level is alleviated by the stronger performances of other countries and subregions where unemployment rates rose only slightly, remained stable or declined, such as in the Caribbean. The region nonetheless witnessed an evident deterioration in general labour market conditions in 2016.
A. The regional urban unemployment rate posted its largest year-on-year increase in two decades, amid falling employment and growing labour market participation
Labour market performance in Latin America and the Caribbean in 2016 confirmed that the region remains in a very different phase of the economic cycle to that observed from the mid-2000s onwards. As noted in ECLAC/ILO (2016a), the contraction that began in 2015 and continued in 2016 represented a departure from the economic growth trend of the preceding years, which had given rise to strong job creation and brought down unemployment. Conversely, 2015 and 2016 brought a labour market downturn that was rooted in the progressive cooling of region’s economies since 2011, which resulted in the negative rates of regional GDP growth posted for the last two years.
In contrast to the situation during the global financial crisis of 2008 and 2009, when the region’s economy received a rapid boost from the upturn in commodity prices and the countercyclical policies deployed in many of the countries, raw material prices today are much lower than those seen in the upswing of the economic cycle. Although commodity prices in 2017 are edging above the average levels recorded in 2016, the dual impact of modest growth in China and increased uncertainty at the international level makes any marked improvement unlikely in the short and medium terms.
In this context of lower commodity prices, greater international uncertainty and particular trends in some economies, the region experienced its highest year-on-year rise in urban unemployment for two decades. The urban unemployment rate has risen in scenarios of slow growth (1996-1997, 2001-2003) and contraction (2009), but the 2016 increase exceeds any previously recorded (see figure I.1). In contrast to previous slowdowns, the current contraction episode has now run for two years straight, which
generated a cumulative 2-percentage-point rise in urban unemployment between 2015 and 2016. However, although the unemployment rate has risen, its levels remain lower than those recorded during the late 1990s and early 2000s.
Figure I.1LATIN AMERICA AND THE CARIBBEAN: GDP GROWTH
AND URBAN UNEMPLOYMENT RATES, 1995-2016a
(Percentages)
-3
-2
-1
0
1
2
3
4
5
6
7
6.9
7.4
7.9
8.4
8.9
9.4
9.9
10.4
10.9
11.4
11.9
1995
19
96
1997
19
98
1999
20
00
2001
20
02
2003
20
04
2005
20
06
2007
20
08
2009
20
10
2011
20
12
2013
20
14
2015
20
16 b
GD
P g
row
th ra
te
Urb
an u
nem
ploy
men
t rat
e
GDP growth rate Urban unemployment rate(new series)Urban unemployment rate
(old series)
Source: Economic Commission for Latin America and the Caribbean (ECLAC) and International Labour Organization (ILO), on the basis of official information from the countries.
a The 1995-2005 series corresponds to the original series, while the 2005-2016 series has been recalculated on the basis of new information from various countries. For more information on the change to the regional series based on the implementation of methodological innovations, see Economic Commission for Latin America and the Caribbean (ECLAC)/International Labour Organization (OIT), “Recent improvements and persistent gaps in rural employment”, Employment Situation in Latin America and the Caribbean, No. 14 (LC/L.4141), Santiago, May 2016.
b Preliminary data.

8 ECLAC / ILONumber 16
The labour market downturn was clearly reflected in the behaviour of employment rates. With the exception of 2009, between 2006 and 2014 regional employment rates grew more (or fell less) than participation rates, which pushed down the regional unemployment rate (see figure I.2). The drop in the urban employment rate in 2009 was in keeping with the brief phase of economic contraction. In contrast, including in 2009, urban participation rates continued to grow steadily, albeit moderately, until 2012. The impact of the economic slowdown was alleviated by the procyclical behaviour of the participation rate (ECLAC, ILO, 2016a), and in 2014, the employment rate fell less sharply than the participation rate. But this trend was reversed in 2015 and, above all, in 2016. While the employment rate continued to decline in 2015 (-0.4 percentage points) and fell even more sharply in 2016 (-0.7 percentage points), the regional participation rate posted a more moderate decrease (-0.2 percentage points) than the employment rate in 2015, before rebounding in 2016 (0.2 percentage points).
Figure I.2LATIN AMERICA AND THE CARIBBEAN: VARIATION IN URBAN
PARTICIPATION AND EMPLOYMENT RATES, 2006-2016(Percentage points)
-0.8
-0.6
-0.4
-0.2
0
0.2
0.4
0.6
0.8
2006 2007 2008 2009 2010 2011 2012 2013 2014 2015 2016
Participation rates Employment rates
Varia
tion
in p
artic
ipat
ion
and
empl
oym
ent r
ates
Source: Economic Commission for Latin America and the Caribbean (ECLAC) and International Labour Organization (ILO), on the basis of official information from the countries.
The behaviour of the employment and participation rates highlights the different dynamics generated in the region during different phases of economic cycles. During expansionary phases or moderate slowdowns, both indicators tend to behave procyclically, in particular the employment rate, which pushes down the unemployment rate. On the other hand, as seen in 2009 and between 2015 and 2016, during a period of negative regional GDP growth, the employment rate declines but the regional participation rate may fall or
rise, as was the case in 2016. This behaviour illustrates the effects of a sudden rise in unemployment: by affecting levels of household income, rising unemployment can push more people into the labour market. Consequently, in a context of declining urban employment generated by sharp economic slowdown, growing labour market participation creates the conditions for a significant increase in the unemployment rate, as occurred in 2016.
Although the evolution of regional GDP and unemployment is consistent with a sharper economic downturn, there are differences in the performances of economies and labour markets at the national and subregional levels. In 2015, of a total of 33 countries with GDP data, six countries —mainly in the Caribbean— posted a contraction: the Bahamas, the Bolivarian Republic of Venezuela, Brazil, Dominica, Suriname, and Trinidad and Tobago. In 2016, the number of countries posting contractions grew to eight, with the list now containing four South American countries: Argentina, Belize, the Bolivarian Republic of Venezuela, Brazil, Cuba, Ecuador, Suriname, and Trinidad and Tobago (ECLAC, 2016). The contraction in 2016 therefore affected those economies that carry more weight in the regional GDP, such as Brazil and Argentina. However, although economic performance across the region was uneven, the figures showed a general downtrend, which was also reflected in the evolution of the main labour variables.
As shown in annex table A1.1, urban unemployment rates went up in the majority of the countries, serving as evidence of the deterioration of domestic labour markets. In 2016, the urban unemployment rate rose in 13 countries, while it held steady or fell in 7. This performance contrasts with 2015, when the unemployment rate increased in 8 countries and remained stable or dropped in 15. Furthermore, most of the countries where unemployment rose (9) are in South America and carry greater weight both economically and in terms of the regional labour market.
On the other hand, in seven countries a rising unemployment rate was accompanied by an upturn in the participation rate. While the employment rate fell in five of those countries (Argentina, Brazil, Colombia, Panama and Paraguay), in Peru it held steady and in Honduras it rose less than the participation rate. In contrast, the unemployment rate climbed in five countries (Bolivarian Republic of Venezuela, Chile, Guatemala, Trinidad and Tobago, and Uruguay) owing to employment rates that fell more sharply than participation rates. Apart from Mexico, most (four) of the countries where the unemployment rate fell are in the Caribbean. For the second year in a row, the trend was different in the Caribbean: employment rates rose faster than participation rates, which pushed down unemployment.
Employment Situation in Latin America and the Caribbean 9
B. The rise in unemployment affected both men and women
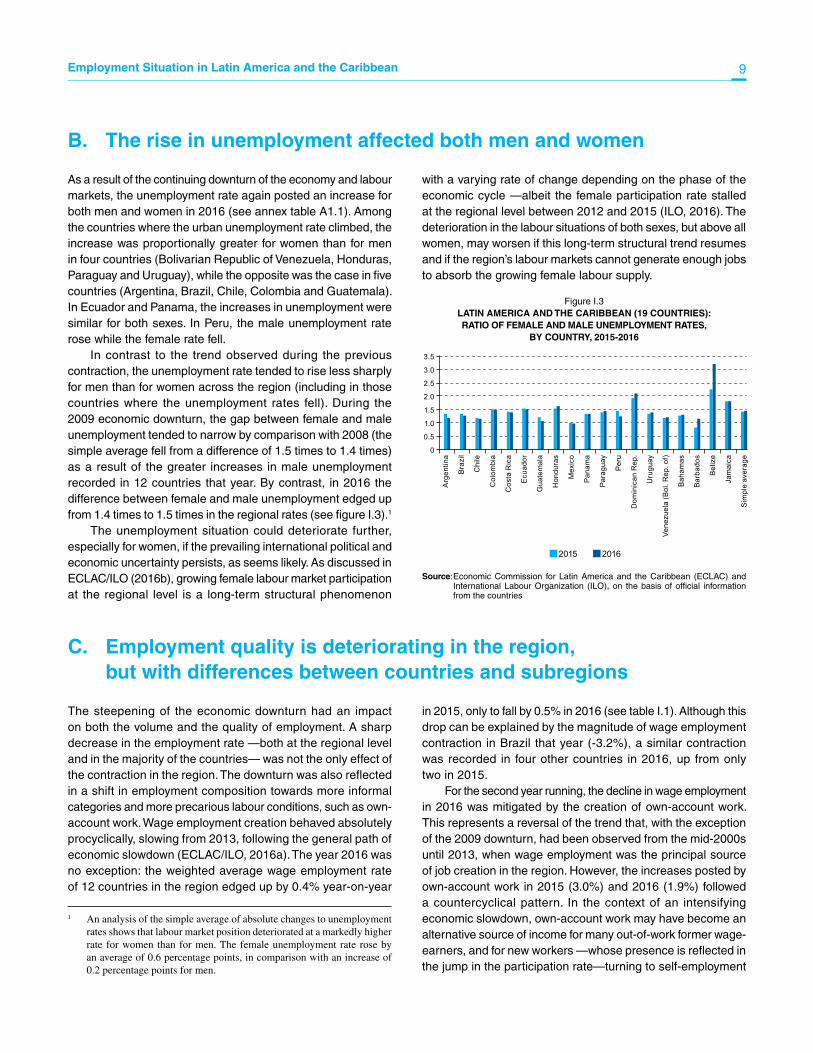
As a result of the continuing downturn of the economy and labour markets, the unemployment rate again posted an increase for both men and women in 2016 (see annex table A1.1). Among the countries where the urban unemployment rate climbed, the increase was proportionally greater for women than for men in four countries (Bolivarian Republic of Venezuela, Honduras, Paraguay and Uruguay), while the opposite was the case in five countries (Argentina, Brazil, Chile, Colombia and Guatemala). In Ecuador and Panama, the increases in unemployment were similar for both sexes. In Peru, the male unemployment rate rose while the female rate fell.
In contrast to the trend observed during the previous contraction, the unemployment rate tended to rise less sharply for men than for women across the region (including in those countries where the unemployment rates fell). During the 2009 economic downturn, the gap between female and male unemployment tended to narrow by comparison with 2008 (the simple average fell from a difference of 1.5 times to 1.4 times) as a result of the greater increases in male unemployment recorded in 12 countries that year. By contrast, in 2016 the difference between female and male unemployment edged up from 1.4 times to 1.5 times in the regional rates (see figure I.3).1
The unemployment situation could deteriorate further, especially for women, if the prevailing international political and economic uncertainty persists, as seems likely. As discussed in ECLAC/ILO (2016b), growing female labour market participation at the regional level is a long-term structural phenomenon
1 An analysis of the simple average of absolute changes to unemployment rates shows that labour market position deteriorated at a markedly higher rate for women than for men. The female unemployment rate rose by an average of 0.6 percentage points, in comparison with an increase of 0.2 percentage points for men.
with a varying rate of change depending on the phase of the economic cycle —albeit the female participation rate stalled at the regional level between 2012 and 2015 (ILO, 2016). The deterioration in the labour situations of both sexes, but above all women, may worsen if this long-term structural trend resumes and if the region’s labour markets cannot generate enough jobs to absorb the growing female labour supply.
Figure I.3LATIN AMERICA AND THE CARIBBEAN (19 COUNTRIES): RATIO OF FEMALE AND MALE UNEMPLOYMENT RATES,
BY COUNTRY, 2015-2016
Arg
entin
a
Bra
zil
Chi
le
Col
ombi
a
Cos
ta R
ica
Ecu
ador
Gua
tem
ala
Hon
dura
s
Mex
ico
Pan
ama
Par
agua
y
Per
u
Dom
inic
an R
ep.
Uru
guay
Vene
zuel
a (B
ol. R
ep. o
f)
Bah
amas
Bar
bado
s
Bel
ize
Jam
aica
Sim
ple
aver
age
0
0.5
1.0
1.5
2.0
2.5
3.0
3.5
2015 2016
Source: Economic Commission for Latin America and the Caribbean (ECLAC) and International Labour Organization (ILO), on the basis of official information from the countries
C. Employment quality is deteriorating in the region, but with differences between countries and subregions
The steepening of the economic downturn had an impact on both the volume and the quality of employment. A sharp decrease in the employment rate —both at the regional level and in the majority of the countries— was not the only effect of the contraction in the region. The downturn was also reflected in a shift in employment composition towards more informal categories and more precarious labour conditions, such as own-account work. Wage employment creation behaved absolutely procyclically, slowing from 2013, following the general path of economic slowdown (ECLAC/ILO, 2016a). The year 2016 was no exception: the weighted average wage employment rate of 12 countries in the region edged up by 0.4% year-on-year
in 2015, only to fall by 0.5% in 2016 (see table I.1). Although this drop can be explained by the magnitude of wage employment contraction in Brazil that year (-3.2%), a similar contraction was recorded in four other countries in 2016, up from only two in 2015.
For the second year running, the decline in wage employment in 2016 was mitigated by the creation of own-account work. This represents a reversal of the trend that, with the exception of the 2009 downturn, had been observed from the mid-2000s until 2013, when wage employment was the principal source of job creation in the region. However, the increases posted by own-account work in 2015 (3.0%) and 2016 (1.9%) followed a countercyclical pattern. In the context of an intensifying economic slowdown, own-account work may have become an alternative source of income for many out-of-work former wage-earners, and for new workers —whose presence is reflected in the jump in the participation rate—turning to self-employment

10 ECLAC / ILONumber 16
as a means to compensate for diminishing household income. The rise in own-account workers may suggest that the regional labour market is becoming more precarious, given the informal conditions that characterize self-employment during the slowdown
phase of the economic cycle. The increase in own-account work was nonetheless sharper in 2015 than in 2016, reflecting the weaker contribution made by own-account work to mitigate the effect of rising unemployment in 2016.
Table I.1LATIN AMERICA (12 COUNTRIES): YEAR-ON-YEAR VARIATION IN EMPLOYMENT RATE
BY OCCUPATIONAL CATEGORY, 2015-2016a
(Percentages)
CountryNational total Wage earners Own-account workers
2015 2016 2015 2016 2015 2016
Brazil 0.0 -1.9 -2.3 -3.2 3.8 1.3
Chile 1.6 1.1 2.3 0.1 1.4 5.5
Colombia 2.4 0.6 3.4 1.1 2.0 2.3
Costa Rica -0.3 -3.0 -0.7 -0.3 -0.9 -8.9
Dominican Republic 2.6 2.8 5.7 6.8 0.6 -3.2
Ecuadorb 5.4 4.6 2.5 -1.9 6.2 10.9
Honduras 5.4 0.2 2.9 8.9 4.3 -4.5
Mexico 2.4 1.9 2.6 2.6 2.3 1.6
Panama 2.3 2.1 1.0 -0.9 6.3 6.0
Paraguayc 4.2 1.1 5.6 2.4 4.4 2.7
Perud 1.1 1.8 1.4 1.7 1.1 4.4
Venezuela (Bolivarian Republic of)e 0.1 -0.7 0.0 -2.6 2.4 1.9
Simple average 2.3 0.9 2.0 1.2 2.8 1.7
Weighted average 1.3 0.0 0.4 -0.5 3.0 1.9
Source: Economic Commission for Latin America and the Caribbean (ECLAC) and International Labour Organization (ILO), on the basis of official information from the countries.a Where possible, domestic employees are excluded from the category of wage earners.b Employers are included under own-account workers.c Asunción and urban areas of the Central Department.d Lima metropolitan area. Employees and workers are included under wage earners. Employers are included under own-account workers.e The rates in the 2016 column refer to employment growth in January-April relative to the same period in 2015.
One of the indicators associated with the quality of employment measures registered employment and tracks the formalization of both new workers and informal workers in 10 countries in the region (see figure I.4). This indicator shows that registered employment either declined (Brazil and Uruguay) or slowed (Argentina, Chile, Mexico and Peru) in 2016. Costa Rica, El Salvador, Guatemala and Nicaragua are the only countries that enjoyed an improved year-on-year growth in registered employment. Registered employment performed quite unevenly in the different subregions in 2016; while edging up in Central America, it is either slowing or falling outright in South America.
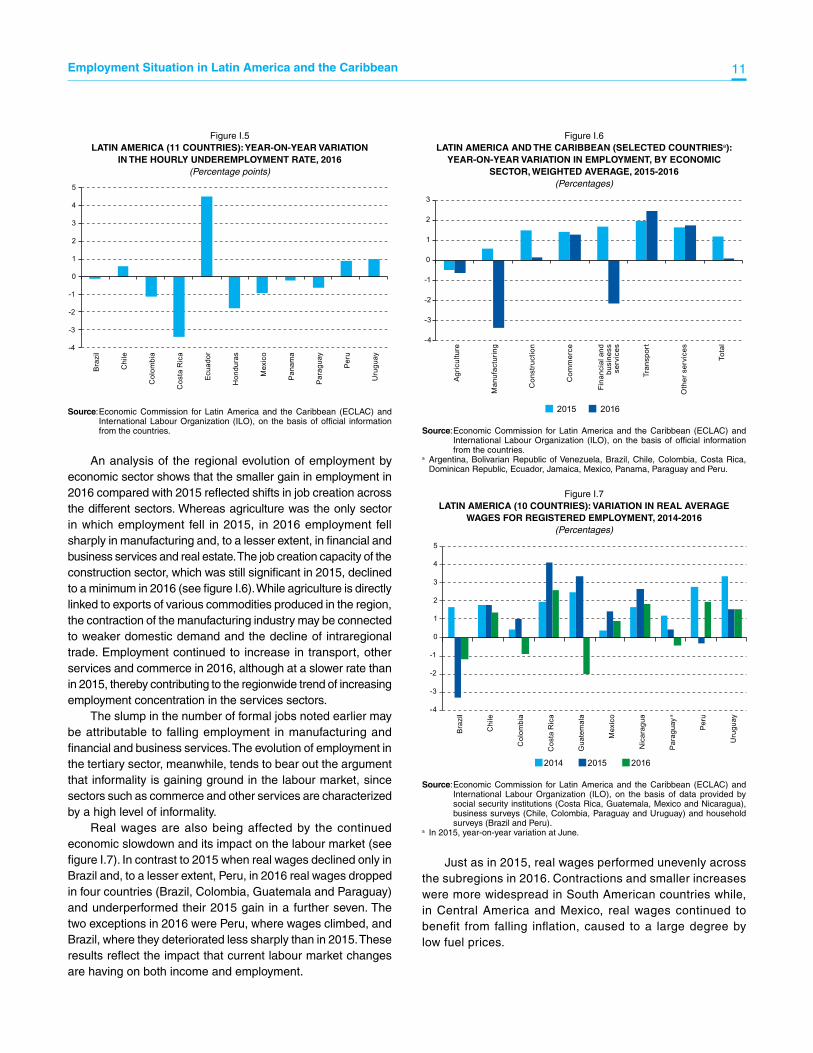
Another indicator of job quality measures underemployment in terms of working hours (see figure I.5). In 2016, this indicator improved in several of the region’s countries. The proportion of employed who work fewer than a national minimum threshold of working hours (which vary considerably among the countries) and who want to work more fell in 7 of the 11 countries for which information is available (Brazil, Colombia, Costa Rica, Honduras, Mexico, Panama and Paraguay). In contrast, the proportion of underemployed increased in Chile, Peru, Uruguay and, above all, Ecuador.
Figure I.4LATIN AMERICA (10 COUNTRIES): GROWTH IN REGISTERED EMPLOYMENT, 2013-2016
(Percentages)
2013 2014 2015 2016
-6
-4
-2
0
2
4
6
8
10
12
Arg
entin
a
Bra
zil
Chi
le
Cos
ta R
ica
El S
alva
dor
Gua
tem
ala
Mex
ico
Nic
arag
ua
Per
u
Uru
guay
Source: Economic Commission for Latin America and the Caribbean (ECLAC) and International Labour Organization (ILO), on the basis of official information from the countries.
Employment Situation in Latin America and the Caribbean 11
Figure I.5LATIN AMERICA (11 COUNTRIES): YEAR-ON-YEAR VARIATION
IN THE HOURLY UNDEREMPLOYMENT RATE, 2016(Percentage points)
-4
-3
-2
-1
0
1
2
3
4
5
Bra
zil
Chi
le
Col
ombi
a
Cos
ta R
ica
Ecu
ador
Hon
dura
s
Mex
ico
Pan
ama
Par
agua
y
Per
u
Uru
guay
Source: Economic Commission for Latin America and the Caribbean (ECLAC) and International Labour Organization (ILO), on the basis of official information from the countries.
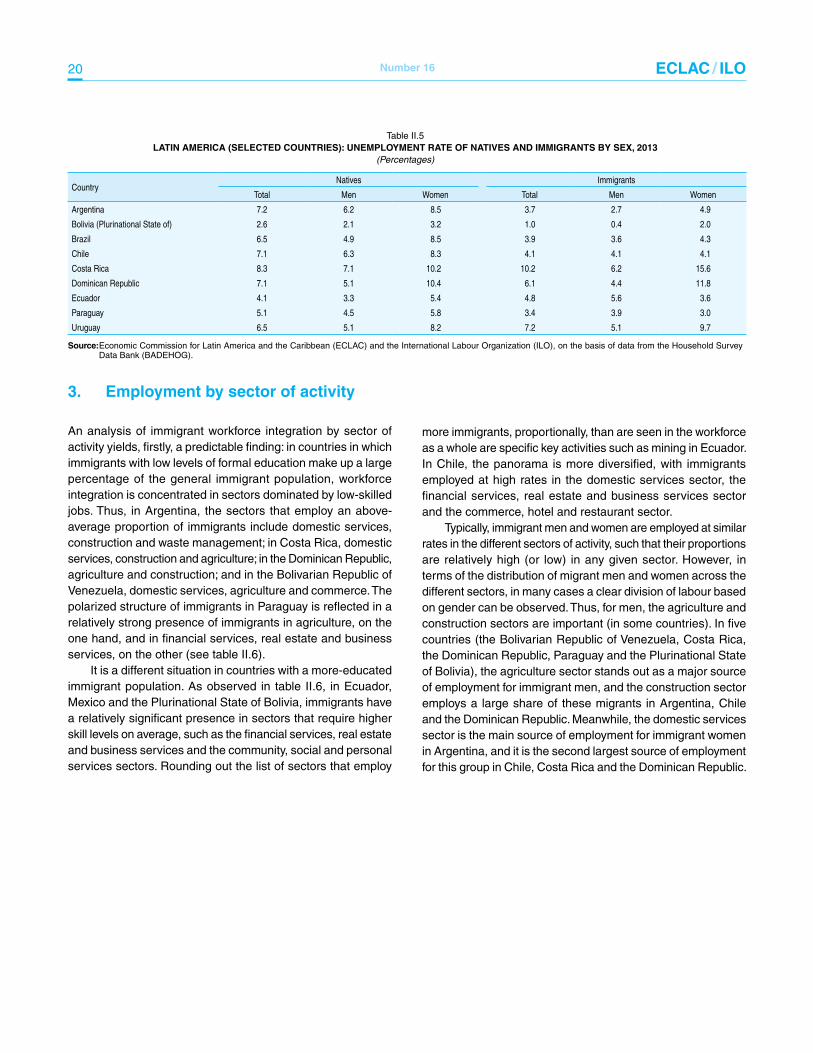
An analysis of the regional evolution of employment by economic sector shows that the smaller gain in employment in 2016 compared with 2015 reflected shifts in job creation across the different sectors. Whereas agriculture was the only sector in which employment fell in 2015, in 2016 employment fell sharply in manufacturing and, to a lesser extent, in financial and business services and real estate. The job creation capacity of the construction sector, which was still significant in 2015, declined to a minimum in 2016 (see figure I.6). While agriculture is directly linked to exports of various commodities produced in the region, the contraction of the manufacturing industry may be connected to weaker domestic demand and the decline of intraregional trade. Employment continued to increase in transport, other services and commerce in 2016, although at a slower rate than in 2015, thereby contributing to the regionwide trend of increasing employment concentration in the services sectors.
The slump in the number of formal jobs noted earlier may be attributable to falling employment in manufacturing and financial and business services. The evolution of employment in the tertiary sector, meanwhile, tends to bear out the argument that informality is gaining ground in the labour market, since sectors such as commerce and other services are characterized by a high level of informality.
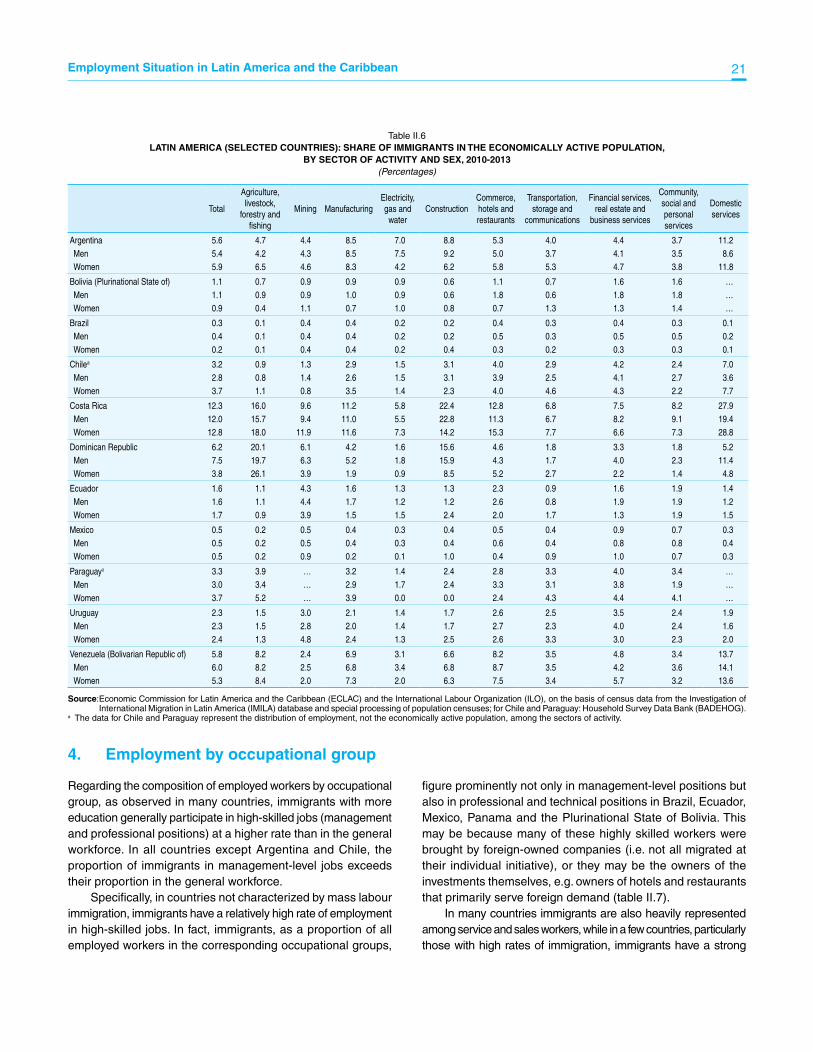
Real wages are also being affected by the continued economic slowdown and its impact on the labour market (see figure I.7). In contrast to 2015 when real wages declined only in Brazil and, to a lesser extent, Peru, in 2016 real wages dropped in four countries (Brazil, Colombia, Guatemala and Paraguay) and underperformed their 2015 gain in a further seven. The two exceptions in 2016 were Peru, where wages climbed, and Brazil, where they deteriorated less sharply than in 2015. These results reflect the impact that current labour market changes are having on both income and employment.
Figure I.6LATIN AMERICA AND THE CARIBBEAN (SELECTED COUNTRIESa):
YEAR-ON-YEAR VARIATION IN EMPLOYMENT, BY ECONOMIC SECTOR, WEIGHTED AVERAGE, 2015-2016
(Percentages)
-4
-3
-2
-1
0
1
2
3
Agr
icul
ture
Man
ufac
turin
g
Con
stru
ctio
n
Com
mer
ce
Fina
ncia
l and
busi
ness
serv
ices
Tran
spor
t
Oth
er s
ervi
ces
Tota
l
2015 2016
Source: Economic Commission for Latin America and the Caribbean (ECLAC) and International Labour Organization (ILO), on the basis of official information from the countries.
a Argentina, Bolivarian Republic of Venezuela, Brazil, Chile, Colombia, Costa Rica, Dominican Republic, Ecuador, Jamaica, Mexico, Panama, Paraguay and Peru.
Figure I.7LATIN AMERICA (10 COUNTRIES): VARIATION IN REAL AVERAGE
WAGES FOR REGISTERED EMPLOYMENT, 2014-2016 (Percentages)
20152014 2016
-4
-3
-2
-1
0
1
2
3
4
5
Bra
zil
Chi
le
Col
ombi
a
Cos
ta R
ica
Gua
tem
ala
Mex
ico
Nic
arag
ua
Par
agua
y a
Per
u
Uru
guay
Source: Economic Commission for Latin America and the Caribbean (ECLAC) and International Labour Organization (ILO), on the basis of data provided by social security institutions (Costa Rica, Guatemala, Mexico and Nicaragua), business surveys (Chile, Colombia, Paraguay and Uruguay) and household surveys (Brazil and Peru).
a In 2015, year-on-year variation at June.
Just as in 2015, real wages performed unevenly across the subregions in 2016. Contractions and smaller increases were more widespread in South American countries while, in Central America and Mexico, real wages continued to benefit from falling inflation, caused to a large degree by low fuel prices.

12 ECLAC / ILONumber 16
D. Conclusions and outlook
In 2016, the regional urban unemployment rate posted its largest year-on-year increase in several decades, in a context of low prices by comparison with the past decade, specific trends in some economies and greater international uncertainty. This context has resulted in a contracting economy, weak labour demand and a countercyclical participation rate. However, regionwide urban unemployment rates are still at lower levels than those registered during the late 1990s and early 2000s. Commodities-driven growth supported considerable gains in the regional unemployment rate; although these are being reversed in the current climate, they have not yet been reduced to the levels posted prior to the recent expansionary phase of the region’s economic cycle.
The deepening of the economic slowdown had various consequences. On the one hand, it generated more precarious labour conditions, with an increase in unemployment rates for men and, on average, an even sharper rise for women. On the other hand, the employment rate declined for the third year running, largely owing to a contraction in wage employment, the occupational category that had generated the bulk of the jobs during the recent economic upswing. This decline was offset by an increase in own-account work, an occupational category
characterized by more informal labour conditions during times of economic slowdown. This greater informality was also shown in the growth and greater concentration of employment in sectors of activity where labour conditions are more precarious.
The shifts in the quantity, composition and quality of regional employment in 2016 also resulted in more precarious income conditions. Real average wages either rose more weakly or fell outright in more countries than in 2015. The performance of real wages at the regional level, combined with jobs losses and increasingly precarious employment conditions, affected household poverty conditions in 2016.
Labour conditions continued to deteriorate in various countries in the region in 2016. As discussed, the international context has increased the uncertainty over the future course of political, economic and trade relations. Regional output is consequently not expected to rebound with the same vigour as post-2009 and labour market conditions will likely remain weak, particularly as regards job creation and the nature of existing and future jobs. In all probability, over the short term the regional labour market will continue to reflect a harsher economic environment that is estimated to deliver regional GDP growth of 1.1% in 2017, with an unemployment rate of around 9.2%.
Bibliography
ECLAC (Economic Commission for Latin America and the Caribbean) (2016), Preliminary Overview of the Economies of Latin America and the Caribbean (LC/G.2698-P), Santiago.
ECLAC/ILO (Economic Commission for Latin America and the Caribbean/International Labour Organization) (2016a), “Recent improvements and persistent gaps in rural employment”, Employment Situation in Latin America and the Caribbean, No. 14 (LC/L.4141), Santiago, May.
(2016b), “Global supply chains and decent work”, Employment Situation in Latin America and the Caribbean, No. 15 (LC/L.4242), Santiago, October.
ILO (International Labour Organization) (2016), 2016 Labour Overview of Latin America and the Caribbean, Lima, Regional Office for Latin America and the Caribbean.

Employment Situation in Latin America and the Caribbean 13
II. Labour immigration in Latin America: an evidence-based analysis
Introduction
Recent globalization processes have been characterized by a rapid dismantling of restrictions on the international movement both of capital and of goods and services but few institutional changes with respect to the international mobility of the labour force.1 This notwithstanding, there have been major international demographic movements, propelled mainly by economic considerations but also by personal safety and other reasons (education, family-related reasons).
Labour migrations have been a dominant force in Latin America too.2 Until the early 1990s, Latin American and Caribbean migrant workers flowed almost exclusively into the United States, with Argentina, the Bolivarian Republic of Venezuela, Costa Rica and the Dominican Republic absorbing most of the numerically small, intraregional slack. Around that time, these flows started to diversify, with the European Union becoming an important destination and intraregional flows and corridors taking on greater significance. In North America (excluding Mexico), the annual rate of growth of the number of migrants fell from 3.9% between 1990 and 2000 to 2.4% between 2000 and 2010, whereas the annual number of immigrants to southern Europe, especially, climbed from 5.6% to 8.0% over the same decades. In Latin America and the Caribbean, against a backdrop of economic volatility and rising unemployment, the number of immigrants contracted at a rate of 0.9% per year in the 1990s.3 In the 2000s, when many countries in the region saw dramatic improvements in their economic conditions and labour markets, the direction of these flows reversed, and the number of immigrants in Latin America and the Caribbean grew at an annual rate of 2.3% during that decade.4
When the 2008-2009 crisis hit, these flows came to a halt and even reversed direction in some cases, due, above all, to a dearth of labour options but also to more restrictive migratory control measures (Salas, Loría Díaz de Guzmán and Díaz, 2016). In effect, between 2010 and 2015, annual growth in the number of foreign-born people fell to 1.2% in North America and -0.5% in the southern European countries. In contrast, the previous decade’s momentum was sustained in Latin America
1 The main exceptions are measures taken in the framework of regional integration processes, such as in the European Union and MERCOSUR.
2 The internal conflict in Colombia represents the primary case of mass displacements for security-related reasons. While generating some cross-border migration, that conflict primarily fuelled internal displacements.
3 This could be the combined result of return migration and deaths of migrants from earlier flows that was not offset by new migratory flows.
4 The figures cited in this paragraph and the next are calculations prepared by the authors on the basis of UN-DESA data (2015).
and Caribbean, with migration to the countries in that region growing at annual rate of 2.3%.5
This landscape has given form to a complex system of labour migration corridors that is in constant flux in response to economic and labour-market fluctuations, migration mechanisms, demographics and environmental and other factors related to political and social instability, as well as changes in migration governance systems (ILO, 2016b). Changes in these factors are expressed in the constant redesign of routes, intermediation and recruitment methods, transport systems and even coyotaje, or people smuggling.6 Several of these corridors pass through countries in transit to the final migration destination.7
It should be noted that in addition to permanent labour migration, there is temporary migration (for a limited number of years, often involving individuals without family), seasonal migration (e.g. to harvest a crop) and return migration. However, the available information does not allow for distinctions between the various types. Lastly, although, strictly speaking, virtually all countries are both emigrant and immigrant countries, excluding countries of transit, only a few countries are both types for any sizeable number of people.
Despite the fact that immigration, particularly intraregional immigration, has become relatively more important for the countries of Latin America and the Caribbean compared with other destinations, few studies have looked at the integration of these immigrants into the labour force, which is the central topic of analysis in the second part of this report. It also presents some policies that are needed to promote the integration of migrant workers into productive jobs and decent work and reviews recent advances on the international development agenda. The purpose is to contribute to an analysis of the region’s labour markets and their heterogeneity, assess the degree of fulfilment of a specific aspect of target 8.8 of the Sustainable Development Goals (“Protect labour rights and promote safe and secure working environments for all workers, including
5 The countries in the region posting the largest increases in immigrant numbers between 2010 and 2015 included Chile (4.9% per year), Mexico (4.2%), Brazil (3.8%), Ecuador (3.6%), Suriname (3.4%) and Panama (3.3%) (calculations prepared by the authors on the basis of United Nations (2015)).
6 Coyotaje refers to the activity of illegally bringing into a country people who do not have legal documents that would authorize their entry and/or transporting them from one country to another.
7 Obviously, Mexico is the main country involved in this context, as many people from other Latin American countries try to enter the United States of America via Mexico. Costa Rica and Panama are more recent examples of countries that have become transit points for migrants from outside the region.

14 ECLAC / ILONumber 16
migrant workers, in particular women migrants, and those in precarious employment”) and enrich the policy areas that must take on the corresponding challenges, at both the national and international levels.
Sections A and B analyse the demographic and workforce integration characteristics of immigrants in the labour markets of several Latin American countries, distinguishing between those countries that have received a relatively large number of immigrants and those in which immigrants make up a smaller proportion of the working age population and the economically active population.8 The empirical data come from two sources: the 2010 population censuses and the latest available household surveys.9 By their nature, censuses tend to have complete coverage, so the data would be expected to capture a large
8 Drawing on census data, place of birth is used as a proxy variable for cross-border migratory movements. This section differentiates only occasionally between immigrants based on country of origin, and although most immigrants fall into the category of intraregional migration, immigrants from other countries are also included.
9 The census data come from the Investigation of International Migration in Latin America (IMILA) database at the Latin American and Caribbean Demographic Centre (CELADE) - Population Division of ECLAC, and from supplemental processing of the corresponding censuses. The household survey data come from the Household Survey Data Bank (BADEHOG).
percentage of immigrants but would not be as current and would not capture the most recent migratory movements.10 Household surveys provide information that is more up to date but offer weaker representation of relatively small subgroups. Moreover, not all surveys include questions that establish the migratory status of the respondents. Lastly, it may be the case in some countries that a considerable proportion of migrants live in conditions that are not captured by the sampling on which the surveys are based, which could bias the available information.11
The section C presents a brief review of the policies that are needed to promote the integration of migrant workers into productive jobs and decent work and the recent advances that have been made on the international development agenda. The section closes with a summary of the main findings.
10 In addition, not all variables are available for all countries covered.11 This analysis of the workforce integration of immigrants draws on census
data from 10 countries: Argentina (2010), the Bolivarian Republic of Venezuela (2011), Brazil (2010), Costa Rica (2011), the Dominican Republic (2010), Ecuador (2010), Mexico (2010), Panama (2010), the Plurinational State of Bolivia (2012) and Uruguay (2011). The tables with census data are supplemented with data on Chile from the 2013 National Socioeconomic Survey and data on Paraguay from the 2013 Permanent Household Survey, inasmuch as immigrants make up relatively large shares of the populations of these two countries. Lastly, in addition to Chile and Paraguay, household survey data is also used for Argentina, the Bolivarian Republic of Venezuela, Brazil, Costa Rica, the Dominican Republic, Ecuador and Uruguay, which are the countries whose surveys make it possible to identify immigrants in a way that is similar to the population censuses. For all these countries, the survey data is from 2013.
A. Demography and education of migrants to Latin American countries
International migration has played an essential role in the demographic history of Latin America and the Caribbean. Most of the region’s countries received significant flows of immigrants throughout the nineteenth and twentieth centuries, but the region now has net emigration. As observed in table II.1, around 2010, immigrants represented at least 1.3% of the total population of the region, whereas emigrants made up 4.8% of the population, for a total of 7.6 million and 28.5 million migrants, respectively.
In absolute terms, Mexico, Colombia, Cuba, the Dominican Republic, Ecuador, Haiti and Peru have the largest numbers of emigrants, whereas, in relative terms, English-speaking countries like Guyana, Jamaica, Trinidad and Tobago and Saint Lucia have significant emigration, as do El Salvador, Cuba, Paraguay, Nicaragua and Mexico in Latin America.
The countries that have received the largest numbers of immigrants are Argentina, the Bolivarian Republic of Venezuela, Mexico, Brazil, the Dominican Republic and Costa Rica. In relative terms, French Guyana, the former Netherlands Antilles, Guadalupe, Martinique and Belize, in the Caribbean, and Costa Rica, Argentina, the Dominican Republic, the Bolivarian Republic of Venezuela and Panama, in Latin America, stand out.
If, for a working definition of countries with significant migration, the minimum threshold of migrants as a percentage
of the total population is set at 2%, a number of countries are found to meet the definition, in terms of both immigration and emigration: Barbados, Saint Lucia and Trinidad and Tobago in the Caribbean, and Costa Rica, the Dominican Republic, Panama, Paraguay and Uruguay in Latin America. Among this group, only Barbados and Costa Rica have higher rates of immigration; the others are predominantly emigrant countries.
According to data from the United Nations (United Nations, 2015), women make up a slight majority of the immigrant population of Latin America and the Caribbean (50.4% in 2015), which reflects feminization processes identified, for example, by ILO (ILO 2016b).12 Indeed, in several of the countries studied for this report, there are more women than men in the immigrant population, above all in Argentina, Chile and Uruguay but also in the Bolivarian Republic of Venezuela, Costa Rica, Panama and Paraguay. In contrast, in Brazil and the Dominican Republic in particular, the immigrant populations skew heavily male (see table II.2).
12 By subregion, women make up 50.9% of immigrants in South America, 50.0% in Central America (including Mexico) and 48.7% in the Caribbean.

Employment Situation in Latin America and the Caribbean 15
Table II.1LATIN AMERICA AND THE CARIBBEAN: MINIMUM ESTIMATES OF IMMIGRANTS AND EMIGRANTS AS A SHARE OF TOTAL POPULATION,
BY COUNTRY OF RESIDENCE AND COUNTRY OF BIRTH, AROUND 2010(Thousands of persons and percentages)
Country or region Total populationImmigrants Emigrants
NumberPercentage of country
populationNumber
Percentage of country population
Total – Latin America and the Caribbean 599 057 7 564 1.3 28 467 4.8
South America 397 082 4 756 1.2 8 398 2.1
Argentina 41 223 1 806 4.4 710 1.7
Bolivia (Plurinational State of) 9 918 128 1.3 686 6.9
Brazil 198 614 592 0.3 874 0.4
Chile 17 015 320 1.9 429 2.5
Colombia 45 918 110 0.2 1 976 4.3
Ecuador 14 935 182 1.2 995 6.7
French Guyana 234 108 46.2 1 0.4
Guyana 753 12 1.6 374 49.7
Paraguay 6 210 161 2.6 688 11.1
Peru 29 734 64 0.2 981 3.3
Suriname 518 39 7.5 4 0.8
Uruguay 3 374 77 2.3 242 7.2
Venezuela (Bolivarian Republic of) 28 996 1 157 4.2 439 1.5
Central America 161 118 1 672 1.0 15 500 9.7
Belize 322 47 14.6 6 1.9
Costa Rica 4 545 386 8.5 111 2.4
El Salvador 6 038 37 0.6 1 316 21.8
Guatemala 14 732 59 0.4 919 6.2
Honduras 7 504 24 0.3 611 8.1
Mexico 118 618 968 0.8 11 863 10.0
Nicaragua 5 738 33 0.6 597 10.4
Panama 3 621 117 3.2 126 3.5
The Caribbeana 40 857 1 135 2.8 4 519 11.1
Bahamas 361 33 9.1 1 0.3
Barbados 280 28 10.0 18 6.4
Cuba 11 308 15 0.1 1 297 11.5
Dominican Republic 9 898 396 4.0 1 070 10.8
Former Netherlands Antillesb 202 53 26.2 2 1.0
Guadalupe 457 105 23.0 0 0.0
Haiti 10 000 35 0.4 994 9.9
Jamaica 2 741 30 1.1 803 29.3
Martinique 395 71 18.0 1 0.3
Puerto Rico 3 710 324 8.7 10 0.3
Saint Lucia 177 10 5.6 22 12.4
Trinidad and Tobago 1 328 34 2.6 301 22.7
Source: J. Martínez Pizarro y C. Orrego Rivera, “Nuevas tendencias y dinámicas migratorias en América Latina y el Caribe”, Población y Desarrollo series, No. 114 (LC/L.4164), Santiago, Econmic Commission for Latin America y and the Caribbean (ECLAC), p. 13, 2016.
Note: For Argentina, the Bolivarian Republic of Venezuela, Brazil, Colombia, Costa Rica, the Dominican Republic, Ecuador, El Salvador, Mexico, Nicaragua, Panama, Peru, the Plurinational State of Bolivia and Uruguay, 2010 census data were obtained from the Investigation of International Migration in Latin America (IMILA) database. In all other cases, the figures come from the United Nations Population Division. The figures on emigrants are minimum estimates inasmuch as they consider only a limited number of countries from Europe and Oceania.
a Excluding Anguilla, Antigua and Barbuda, Aruba, Bermuda, the British Virgin Islands, the Cayman Islands, Dominica, Grenada, Montserrat, Saint Kitts and Nevis, Saint Vincent and the Grenadines, Turks and Caicos Islands and the United States of America.
b “Former Netherlands Antilles” refers to the former autonomous part of the Kingdom of the Netherlands which comprised the territories of Bonaire, Curaçao, Saba, Sint Eustatius and Sint Maarten, and was dissolved on 10 October 2010

16 ECLAC / ILONumber 16
Table II.2LATIN AMERICA (SELECTED COUNTRIES): DISTRIBUTION OF IMMIGRANTS AGED 10 YEARS OR OLDER, BY SEX;
AND SHARE OF IMMIGRANTS IN TOTAL POPULATION OF THE CORRESPONDING AGE GROUP, 2010/2013(Percentages)
CountrySex Age group
Male Female Total 10-14 15-19 20-29 30-39 40-49 50-59 60 or older
Argentina 46.0 54.0 5.3 1.6 2.4 4.9 5.1 5.8 5.8 9.1Bolivia (Plurinational State of) 52.9 47.1 1.2 1.0 0.9 1.3 1.2 1.4 1.3 1.1Brazil 59.6 40.4 0.5 0.3 0.2 0.2 0.3 0.5 0.9 2.8Chile 45.4 54.6 2.2 1.8 1.5 3.1 4.1 2.4 1.3 1.0Costa Rica 48.1 51.9 10.1 5.0 7.9 11.3 15.0 11.4 8.5 7.8Dominican Republic 61.5 38.5 5.1 2.2 3.7 8.6 6.5 4.0 3.5 3.6Ecuador 50.9 49.1 1.4 0.8 0.9 1.5 1.7 1.7 1.6 1.4Mexico 50.2 49.8 0.6 1.1 0.8 0.5 0.5 0.4 0.5 0.6Panama 48.0 52.0 4.1 1.5 2.2 3.9 5.2 5.5 5.3 4.5Paraguay 49.1 50.9 3.0 1.8 1.1 1.9 3.6 4.6 4.8 3.9Uruguay 44.6 55.4 2.5 0.6 1.4 2.5 2.7 1.6 1.8 4.5Venezuela (Bolivarian Republic of) 49.5 50.5 5.1 1.6 1.7 2.8 4.4 6.3 8.8 11.2
Source: Economic Commission for Latin America and the Caribbean (ECLAC) and the International Labour Organization (ILO), on the basis of census data from the Investigation of International Migration in Latin America (IMILA) database and special processing of population censuses; for Chile and Paraguay: Household Survey Data Bank (BADEHOG).
In some countries, older people are overrepresented among immigrants, which would seem to indicate that either these countries were primary destinations for migrant flows in the past that have waned more recently or there is a significant influx of older immigrants, spurred in some cases by tax incentives. Argentina, the Bolivarian Republic of Venezuela, Brazil and Uruguay figure prominently in this group of countries, where the proportion of immigrants in the 60-or-older age group easily surpasses this proportion in the overall population (see table II.2). Thus, immigrants who are 60 years of age and older represent 25.6% of the total population of immigrants in the Bolivarian Republic of Venezuela, and 46.5% in Brazil. In contrast, in Costa Rica and the Dominican Republic, this age group represents just 9.7% and 6.7%, respectively, of the immigrant population.13
Whereas in other countries there are no major differences between the different age groups in terms of the proportion of immigrants, in Chile, Costa Rica, the Dominican Republic and Panama, the proportion of immigrants is relatively high among the core groups of the working-age population (20-49 years).14 This would seem to reflect the preponderance of recent and current labour migration flows.
In terms of years of education, a comparison of migrants and non-migrants reveals that, first, in Brazil, Chile, Ecuador, Mexico, Panama, Paraguay, the Plurinational State of Bolivia and Uruguay, immigrants are relatively overrepresented in the most educated group (see table II.3), making up a larger share of this group than in the total population. This indicates that the migration of highly educated individuals seeking job opportunities in occupations that require extensive training is quite widespread. Among these migrants are also individuals who have already
13 As indicated, due to the way in which immigrants are differentiated from natives, i.e. by place of birth, the process of comparing the age structures of the two groups is inherently biased inasmuch as children of immigrants who were born in the destination country are counted as natives.
14 In Panama, immigrants also account for a relatively high proportion of the 50-59 age group.
been hired when they arrive in their destination country or who move to another country for non-employment reasons (study, family-related reasons). The proportion of individuals with 10 or more years of education is particularly high in Chile (79.4%), Panama (65.4%), Ecuador (63.1%) and the Plurinational State of Bolivia (62.0%).
In contrast, in the Bolivarian Republic of Venezuela, Costa Rica and, especially, the Dominican Republic, there is a large proportion of individuals with low levels of education. In Argentina and Uruguay, too, the least skilled are overrepresented. Within the immigrant population, individuals with up to six years of education comprise 60.6% of the total in the Dominican Republic, 47.7% in Costa Rica, 44.5% in Paraguay, 42.6% in the Bolivarian Republic of Venezuela and 35.0% in Argentina. Immigrants are underrepresented among the most educated groups in these countries, with the exception of Paraguay, where a polarized education structure is observed among immigrants.
In summary, migration flows are heterogeneous in terms of education, with immigrants represented at all levels. However, where strong flows of immigration occurred, these tended to involve individuals with relatively low levels of education, as demonstrated by the fact that in the countries with the largest proportion of immigrants, the education levels of immigrants trail those of the native population. Another example is provided by the case of Colombian migrants, who, in the three neighbouring countries where they represent the largest group of migrants (the Bolivarian Republic of Venezuela, Ecuador and Panama), have an education distribution that is more heavily skewed towards the lower end than immigrants from other countries.
Among immigrants, the education structure is similar for men and women, with male immigrants having slightly more education in Argentina, Brazil, Ecuador, Mexico, Panama, Paraguay and the Plurinational State of Bolivia, and female immigrants having slightly more education in the Bolivarian Republic of Venezuela, Costa Rica and the Dominican Republic, and very similar levels in Chile.

Employment Situation in Latin America and the Caribbean 17
Table II.3LATIN AMERICA (SELECTED COUNTRIES): DISTRIBUTION OF IMMIGRANTS AGED 10 YEARS OR OLDER BY EDUCATION LEVEL
AND SHARE OF IMMIGRANTS IN THE TOTAL POPULATION OF THE CORRESPONDING EDUCATION GROUP, 2010/2013(Percentages)
CountryDistribution of immigrants by years of education
Proportion of immigrants by years of education compared with the total population in the corresponding education group
0-3 4-6 7-9 10 or more Total 0-3 4-6 7-9 10 or more
Argentina 12.6 22.4 21.1 41.4 5.3 7.4 7.1 4.2 4.7Bolivia (Plurinational State of) 5.9 12.8 15.5 62.0 1.2 0.4 0.9 1.0 1.6Brazil 11.4 15.8 14.0 45.7 0.4 0.2 0.3 0.3 0.6Chile 4.5 8.0 8.2 79.4 2.2 1.4 1.2 1.0 2.9Costa Rica 19.1 28.6 19.2 33.1 10.1 16.7 8.5 10.3 9.5Dominican Republic 46.9 13.6 12.4 27.0 5.1 13.7 3.8 2.8 3.3Ecuador 10.9 16.8 7.2 63.1 1.4 1.3 0.9 0.9 1.8Mexico 8.8 18.0 19.8 50.9 0.6 0.3 0.4 0.4 1.0Panama 7.3 13.0 14.3 65.4 4.1 2.7 1.9 3.2 6.2Paraguay 20.3 24.2 10.5 44.9 3.1 4.8 2.4 1.9 3.6Uruguay 9.3 25.1 16.0 49.6 2.4 3.9 2.0 1.6 2.8Venezuela (Bolivarian Republic of) 16.0 26.6 14.0 43.4 5.1 9.0 6.0 3.9 4.8
Source: Economic Commission for Latin America and the Caribbean (ECLAC) and the International Labour Organization (ILO), on the basis of census data from the Investigation of International Migration in Latin America (IMILA) database and special processing of population censuses; for Chile and Paraguay: Household Survey Data Bank (BADEHOG).
B. Aspects of the workforce integration of immigrants
1. Workforce participation
To differentiate between the countries based on type of immigration, those countries where the workforce participation rate among immigrants is higher than among natives can be identified as countries where immigration is recent and predominantly labour-driven, compared with other countries where the composition of the immigrant population has been shaped either by other types of migration or by an earlier pattern of labour immigration that has slowed over time, resulting in an immigrant population with an older age structure.
Among immigrants, the workforce participation rate is comparatively high, especially in countries in which immigrants make up a relatively robust share of the general population, which underscores the importance of recent labour migration as a determinant of the presence of immigrants in these countries. In fact, the collective participation rate of immigrants surpasses the rate of natives in the Bolivarian Republic of Venezuela, Chile, Costa Rica, the Dominican Republic, Ecuador, Panama and Paraguay. Immigrants and natives participate in the workforce at similar rates in Argentina. Meanwhile, the participation rate of natives is higher than that of immigrants in Brazil, Mexico, the Plurinational State of Bolivia and Uruguay, all countries in which immigrants comprise a relatively small share of the population, as previously mentioned (see table II.4).15
15 Population censuses tend to apply methods for identifying workforce participation that are different from the specialized methods used in household surveys to measure the labour market, so the data presented here may differ from the information presented in other ECLAC and ILO publications. Moreover, due to the methodological difference in the sources, a cautious approach must be taken to making comparisons between countries and the focus should be on comparisons between groups within the individual countries.
The differences in workforce participation rates should be analysed taking into account the composition of the entire immigrant population, by sex, age and education level, variables that in turn are related to country of origin and the history of these migration flows.
Labour migration —characterized by an economically active immigrant population— originates primarily in neighbouring countries. A case in point is Colombia, which is the origin country with the largest number of economically active immigrants for three of its neighbouring countries (the Bolivarian Republic of Venezuela, Ecuador and Panama).16 Mexico is another example, as the origin country with the largest number of migrants in a neighbouring country, the United States of America, although this is apparently the result of a return migration of individuals who were born in the United States of America to families originally from Mexico and have subsequently returned to their country of origin. Another special case is Brazil, which receives its largest group of immigrants not from a neighbouring country or even a country in Latin America and the Caribbean, possible due to the language barrier, but rather from Portugal.17
16 Colombia is also the second largest origin country for immigrants to Costa Rica and the fourth largest origin country for immigrants to the Dominican Republic.
17 Language also explains the fact that there are about 5,000 immigrants from Portuguese-speaking countries in Africa, accounting for approximately 2% of all immigrants in Brazil.

18 ECLAC / ILONumber 16
Table II.4LATIN AMERICA (SELECTED COUNTRIES): PARTICIPATION RATE OF NATIVES AND IMMIGRANTS
AGED 15 YEARS OR OLDER BY SEX, 2010-2013(Percentages of total population)
TotalNatives Immigrants
Total Men Women Total Men Women
Argentina 64.0 64.1 76.4 52.8 62.4 75.4 51.4
Bolivia (Plurinational State of) 66.7 66.8 78.6 55.3 56.0 67.9 42.6
Brazil 63.9 64.0 74.6 54.0 50.8 61.6 37.9
Chile 57.3 57.0 70.4 45.1 75.0 84.6 66.8
Costa Rica 53.5 52.6 71.1 35.2 61.0 80.8 42.7
Dominican Republic 53.4 52.8 68.5 37.6 64.1 80.0 37.9
Ecuador 60.5 60.4 78.0 43.6 67.2 82.0 51.8
Mexico 56.1 56.1 77.1 36.8 51.1 67.0 34.9
Panama 58.9 58.8 76.0 41.6 62.4 75.5 50.4
Paraguay 74.0 73.9 85.4 62.4 76.0 86.6 67.1
Uruguay 61.1 61.3 71.3 52.4 53.5 64.0 44.7
Venezuela (Bolivarian Republic of) 43.2 42.4 57.1 28.3 56.0 75.7 36.7
Source: Economic Commission for Latin America and the Caribbean (ECLAC) and the International Labour Organization (ILO), on the basis of census data from the Investigation of International Migration in Latin America (IMILA) database and special processing of population censuses; for Chile and Paraguay: Household Survey Data Bank (BADEHOG).
In several countries, a large share of economically active immigrants come from a single country, and this is especially so in the Dominican Republic (86% from Haiti), Costa Rica (76% from Nicaragua), the Bolivarian Republic of Venezuela and Ecuador (68% and 54%, respectively, from Colombia). In contrast, immigration is more diverse in Brazil (only 17% from the largest origin country, Portugal),18 the Plurinational State of Bolivia (21% from Argentina), Panama (32% from Colombia), Argentina (33% from Paraguay) and Chile (36% from Peru).
In nearly all the countries in the study, over 80% of the economically active immigrant population comes from countries in Latin America and the Caribbean, with the exceptions being the aforementioned cases of Brazil and Mexico, as well as Panama, owing in particular to the non-negligible presence of immigrants from Asia, especially China and India.
Among the countries in which immigrants have a relatively low workforce participation rate, there is a range of situations. In Uruguay, the low participation rate among immigrants is related to the presence of retirees and pensioners, who represent 62.2% of the non-economically active population of foreign-born individuals who are 15 years or age or older. This is primarily due to the aging of the immigrant population from European countries (for example, 87% of immigrants from Italy and 86% of immigrants from Spain are 60 years of age or older), but immigration by retirees, encouraged by the country through incentives, may also be a contributing factor.19
18 Immigrants from Portugal account for 24% of all immigrants who are 10 years of age or older.
19 In Uruguay, retirees pay a social security tax that has been in place since July 2008. However, retirement and pension proceeds distributed from contributions to foreign social security institution are exempt from this tax even when the income is paid by resident entities. http://www.dgi.gub.uy/wdgi/page?2,personas,dgi--personas--informacion-sobre-iass--informacion-general,O,es,0,
In Brazil, too, the low participation rate is related to the age structure of the immigrant population, given that Brazil is the country with the largest share of immigrants in the 60-or-older age group, most from Portugal. Meanwhile, the participation rate of immigrants between the ages of 30 and 59 surpasses the participation rate of the native population.
It is a similar story in Argentina, the country in Latin America with the largest number of immigrants. The participation rate among immigrants (similar to the native rate) is the result of two very different situations: a low participation rate (32.1%) among older immigrants from European countries and a much higher rate (68.6%) among Latin American immigrants (with even higher rates in the cases of Bolivia and Paraguay).
In the case of Mexico, the relatively low participation rate can be explained, in good part, by the large proportion of homemakers and students, who represent 41.2% and 33.7%, respectively, of the non-economically active immigrant population 15 years of age and older (and 32.2% and 47.7%, respectively, of the non-economically active immigrant population 10 years of age and older). This is due to the fact, mentioned earlier, that the principal country of origin of immigrants in this case is the United States of America. More than anything else, this likely has to do with individuals who were born in the United States of America to families of Mexican origin that subsequently returned to their country.20 Strikingly, Mexico is the only country in which immigrants in the youngest age group (10-14 years of age) make up a higher proportion of the total population in this age group than in the 10-or-older general population (see table II.2), a clear reflection of the predominance of family migration over individual migration, which is often labour migration. This is not to diminish the importance of the workforce integration of
20 Montoya Ortíz and González Becerrill (2015) review the characteristics of return migration to Mexico.

Employment Situation in Latin America and the Caribbean 19
immigrants, whose participation rate exceeds that of Mexican-born individuals in the 30-59 age groups.
In contrast, in the Dominican Republic, the country in which the participation rate of immigrants surpasses that of natives by the widest margin, the immigrant population does not include a large group of students (22.6% of non-economically active immigrants and 8.2% of the 10-or-older foreign-born population) or many retirees and pensioners (3.2% of non-active immigrants and 1.1% of 10-or-older immigrants). And in this country, as well as in other countries with a relatively very high participation rate among the immigrant population (the Bolivarian Republic of Venezuela, Costa Rica, Ecuador and Panama), immigrants participate in the workforce at a higher rate than natives across all age groups.21
Meanwhile, in some of the countries in which immigrants participate in the workforce at an equivalent or lower rate than natives, there are age groups that do not conform to the general pattern. For example, whereas in the Plurinational State of Bolivia and Uruguay the immigrant participation rate is lower than the native rate across all age groups, in Argentina the immigrant rate is higher than the native rate in the youngest age groups, and in Brazil and Mexico it is higher in the 30-or-older age groups (with the exception in Mexico of the oldest age group).
21 The exception is Panama, where immigrants in the youngest age groups participate at slightly lower rates than their native counterparts.
This indicates that there has also been recent labour migration in the two latter countries.
In all countries, the participation rate is higher among men than women in both the local and the foreign-born population. However, a comparison of gaps in the participation rates of immigrants and natives by sex reveals that male and female participation rates skew differently in the countries in which immigration is primarily characterized by recent labour migration (with relatively high participation rates). In the Bolivarian Republic of Venezuela and the Dominican Republic, labour immigration skews more heavily towards men (by a larger gap in their participation rate with respect to native men, compared with the gap in the rate between the two groups of women), whereas immigrant women are strongly integrated into the workforce (by a larger gap in their participation rate with respect to native women, compared with the gap in the rate between the two groups of men) in Chile, Costa Rica, Ecuador, Panama and Paraguay.
In the countries with relatively low workforce participation rates among the immigrant population, the (negative) gap is even larger for women in Brazil, the Plurinational State of Bolivia and Uruguay and more pronounced for men in Mexico, while the differences are negligible in Argentina.
2. Unemployment
A comparison of unemployment among natives and immigrants indicates significantly lower rates among immigrants in five of the nine countries studied (Argentina, Brazil, Chile, Paraguay and the Plurinational State of Bolivia). In contrast, the gap between the two groups is small in the Dominican Republic (though unemployment is still lower among immigrants), whereas in Costa Rica, Ecuador and Uruguay, the percentage of job seekers is higher among immigrants.
In nearly all the countries, the unemployment rate is higher among immigrant women than immigrant men. In Costa Rica and Uruguay, the large gap in the unemployment rate between immigrant men and women and the high rate of unemployment for immigrants generally is largely explained by female unemployment. In fact, in these countries, immigrant men are unemployed at an equivalent or lower rate than native men, while immigrant women are unemployed at a much higher rate than native women (see table II.5).
The fact that in many cases immigrants have a lower unemployment rate may be due to one or several of the following reasons:
• In Latin America and the Caribbean, less-educated groups tend to have lower open unemployment rates than more-educated groups because the former must find work quickly, often under nearly any condition, in order to support
themselves and the members of their households. In the case of mass labour immigration, especially involving low-skilled workers, the pattern is more pronounced, inasmuch as these migrants have few options for economic sustenance in the event of unemployment, forcing a quick return to paid work.
• In the case of migration by individuals who have a family in the country of origin that will depend on remittances sent by the migrant, there is added pressure to meet the expectations of the family members, especially in cases in which they helped finance the costs of migration.22
• Skilled-labour migration, overrepresented in several countries, frequently occurs in response to an explicit request, in which case an employment contract is guaranteed.
• A similar situation can be assumed in the case of employers (also overrepresented among migrants), many of whom would arrive with an investment project and capital.
22 In several countries (for example, Brazil, Chile, the Dominican Republic and Uruguay), single-person households comprise a larger share of households headed by a male or female immigrant than households headed by a male or female native. The proportion is similar in Argentina and smaller in the case of immigrants in Costa Rica. Likewise, the proportion of two-person households is larger among households headed by a male or female immigrant in four of these six countries (calculations prepared by the authors on the basis of data from BADEHOG). This suggests the importance of a partial migration in which just one or two members of a family migrate, while the others remain in the country of origin, usually with the expectation of receiving remittances.
20 ECLAC / ILONumber 16
Table II.5LATIN AMERICA (SELECTED COUNTRIES): UNEMPLOYMENT RATE OF NATIVES AND IMMIGRANTS BY SEX, 2013
(Percentages)
CountryNatives Immigrants
Total Men Women Total Men Women
Argentina 7.2 6.2 8.5 3.7 2.7 4.9
Bolivia (Plurinational State of) 2.6 2.1 3.2 1.0 0.4 2.0
Brazil 6.5 4.9 8.5 3.9 3.6 4.3
Chile 7.1 6.3 8.3 4.1 4.1 4.1
Costa Rica 8.3 7.1 10.2 10.2 6.2 15.6
Dominican Republic 7.1 5.1 10.4 6.1 4.4 11.8
Ecuador 4.1 3.3 5.4 4.8 5.6 3.6
Paraguay 5.1 4.5 5.8 3.4 3.9 3.0
Uruguay 6.5 5.1 8.2 7.2 5.1 9.7
Source: Economic Commission for Latin America and the Caribbean (ECLAC) and the International Labour Organization (ILO), on the basis of data from the Household Survey Data Bank (BADEHOG).
3. Employment by sector of activity
An analysis of immigrant workforce integration by sector of activity yields, firstly, a predictable finding: in countries in which immigrants with low levels of formal education make up a large percentage of the general immigrant population, workforce integration is concentrated in sectors dominated by low-skilled jobs. Thus, in Argentina, the sectors that employ an above-average proportion of immigrants include domestic services, construction and waste management; in Costa Rica, domestic services, construction and agriculture; in the Dominican Republic, agriculture and construction; and in the Bolivarian Republic of Venezuela, domestic services, agriculture and commerce. The polarized structure of immigrants in Paraguay is reflected in a relatively strong presence of immigrants in agriculture, on the one hand, and in financial services, real estate and business services, on the other (see table II.6).
It is a different situation in countries with a more-educated immigrant population. As observed in table II.6, in Ecuador, Mexico and the Plurinational State of Bolivia, immigrants have a relatively significant presence in sectors that require higher skill levels on average, such as the financial services, real estate and business services and the community, social and personal services sectors. Rounding out the list of sectors that employ
more immigrants, proportionally, than are seen in the workforce as a whole are specific key activities such as mining in Ecuador. In Chile, the panorama is more diversified, with immigrants employed at high rates in the domestic services sector, the financial services, real estate and business services sector and the commerce, hotel and restaurant sector.
Typically, immigrant men and women are employed at similar rates in the different sectors of activity, such that their proportions are relatively high (or low) in any given sector. However, in terms of the distribution of migrant men and women across the different sectors, in many cases a clear division of labour based on gender can be observed. Thus, for men, the agriculture and construction sectors are important (in some countries). In five countries (the Bolivarian Republic of Venezuela, Costa Rica, the Dominican Republic, Paraguay and the Plurinational State of Bolivia), the agriculture sector stands out as a major source of employment for immigrant men, and the construction sector employs a large share of these migrants in Argentina, Chile and the Dominican Republic. Meanwhile, the domestic services sector is the main source of employment for immigrant women in Argentina, and it is the second largest source of employment for this group in Chile, Costa Rica and the Dominican Republic.
Employment Situation in Latin America and the Caribbean 21
Table II.6LATIN AMERICA (SELECTED COUNTRIES): SHARE OF IMMIGRANTS IN THE ECONOMICALLY ACTIVE POPULATION,
BY SECTOR OF ACTIVITY AND SEX, 2010-2013(Percentages)
Total
Agriculture, livestock,
forestry and fishing
Mining ManufacturingElectricity, gas and
waterConstruction
Commerce, hotels and restaurants
Transportation, storage and
communications
Financial services, real estate and
business services
Community, social and personal services
Domestic services
ArgentinaMenWomen
5.65.45.9
4.74.26.5
4.44.34.6
8.58.58.3
7.07.54.2
8.89.26.2
5.35.05.8
4.03.75.3
4.44.14.7
3.73.53.8
11.28.6
11.8
Bolivia (Plurinational State of)MenWomen
1.11.10.9
0.70.90.4
0.90.91.1
0.91.00.7
0.90.91.0
0.60.60.8
1.11.80.7
0.70.61.3
1.61.81.3
1.61.81.4
………
BrazilMenWomen
0.30.40.2
0.10.10.1
0.40.40.4
0.40.40.4
0.20.20.2
0.20.20.4
0.40.50.3
0.30.30.2
0.40.50.3
0.30.50.3
0.10.20.1
Chilea
MenWomen
3.22.83.7
0.90.81.1
1.31.40.8
2.92.63.5
1.51.51.4
3.13.12.3
4.03.94.0
2.92.54.6
4.24.14.3
2.42.72.2
7.03.67.7
Costa RicaMenWomen
12.312.012.8
16.015.718.0
9.69.4
11.9
11.211.011.6
5.85.57.3
22.422.814.2
12.811.315.3
6.86.77.7
7.58.26.6
8.29.17.3
27.919.428.8
Dominican RepublicMenWomen
6.27.53.8
20.119.726.1
6.16.33.9
4.25.21.9
1.61.80.9
15.615.98.5
4.64.35.2
1.81.72.7
3.34.02.2
1.82.31.4
5.211.4
4.8
EcuadorMenWomen
1.61.61.7
1.11.10.9
4.34.43.9
1.61.71.5
1.31.21.5
1.31.22.4
2.32.62.0
0.90.81.7
1.61.91.3
1.91.91.9
1.41.21.5
MexicoMenWomen
0.50.50.5
0.20.20.2
0.50.50.9
0.40.40.2
0.30.30.1
0.40.41.0
0.50.60.4
0.40.40.9
0.90.81.0
0.70.80.7
0.30.40.3
Paraguaya
MenWomen
3.33.03.7
3.93.45.2
………
3.22.93.9
1.41.70.0
2.42.40.0
2.83.32.4
3.33.14.3
4.03.84.4
3.41.94.1
………
UruguayMenWomen
2.32.32.4
1.51.51.3
3.02.84.8
2.12.02.4
1.41.41.3
1.71.72.5
2.62.72.6
2.52.33.3
3.54.03.0
2.42.42.3
1.91.62.0
Venezuela (Bolivarian Republic of)MenWomen
5.86.05.3
8.28.28.4
2.42.52.0
6.96.87.3
3.13.42.0
6.66.86.3
8.28.77.5
3.53.53.4
4.84.25.7
3.43.63.2
13.714.113.6
Source: Economic Commission for Latin America and the Caribbean (ECLAC) and the International Labour Organization (ILO), on the basis of census data from the Investigation of International Migration in Latin America (IMILA) database and special processing of population censuses; for Chile and Paraguay: Household Survey Data Bank (BADEHOG).
a The data for Chile and Paraguay represent the distribution of employment, not the economically active population, among the sectors of activity.
4. Employment by occupational group
Regarding the composition of employed workers by occupational group, as observed in many countries, immigrants with more education generally participate in high-skilled jobs (management and professional positions) at a higher rate than in the general workforce. In all countries except Argentina and Chile, the proportion of immigrants in management-level jobs exceeds their proportion in the general workforce.
Specifically, in countries not characterized by mass labour immigration, immigrants have a relatively high rate of employment in high-skilled jobs. In fact, immigrants, as a proportion of all employed workers in the corresponding occupational groups,
figure prominently not only in management-level positions but also in professional and technical positions in Brazil, Ecuador, Mexico, Panama and the Plurinational State of Bolivia. This may be because many of these highly skilled workers were brought by foreign-owned companies (i.e. not all migrated at their individual initiative), or they may be the owners of the investments themselves, e.g. owners of hotels and restaurants that primarily serve foreign demand (table II.7).
In many countries immigrants are also heavily represented among service and sales workers, while in a few countries, particularly those with high rates of immigration, immigrants have a strong
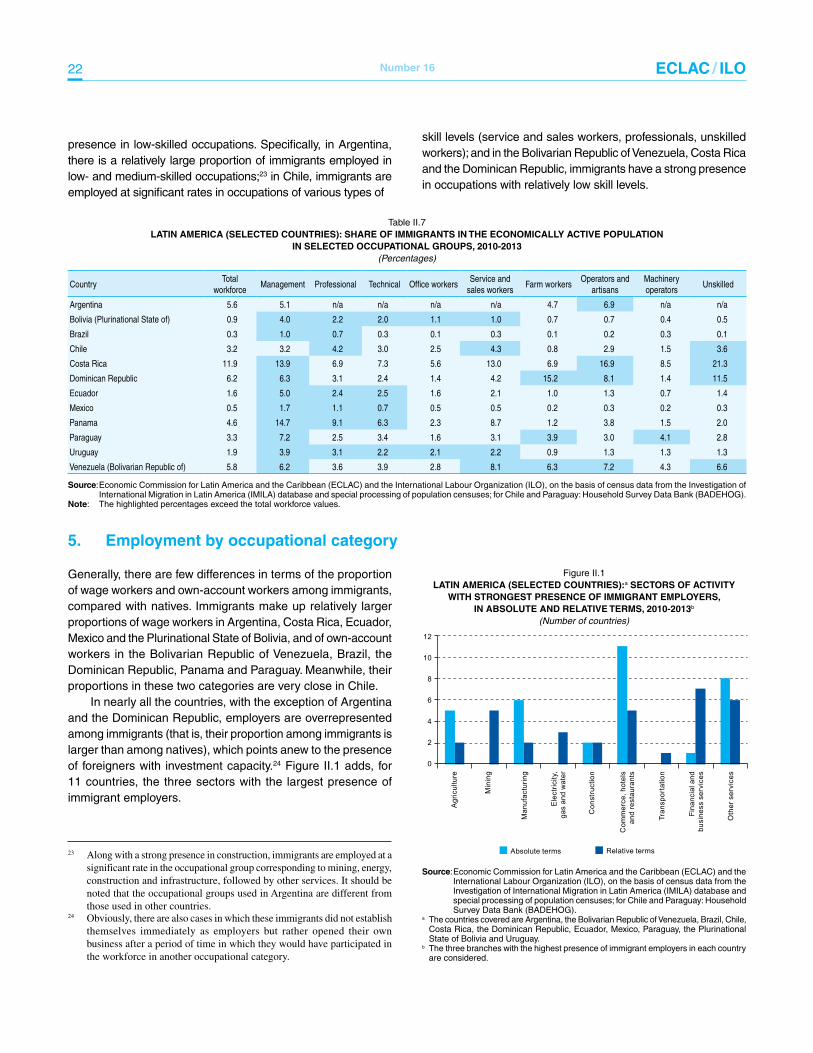
22 ECLAC / ILONumber 16
presence in low-skilled occupations. Specifically, in Argentina, there is a relatively large proportion of immigrants employed in low- and medium-skilled occupations;23 in Chile, immigrants are employed at significant rates in occupations of various types of
23 Along with a strong presence in construction, immigrants are employed at a significant rate in the occupational group corresponding to mining, energy, construction and infrastructure, followed by other services. It should be noted that the occupational groups used in Argentina are different from those used in other countries.
skill levels (service and sales workers, professionals, unskilled workers); and in the Bolivarian Republic of Venezuela, Costa Rica and the Dominican Republic, immigrants have a strong presence in occupations with relatively low skill levels.
Table II.7LATIN AMERICA (SELECTED COUNTRIES): SHARE OF IMMIGRANTS IN THE ECONOMICALLY ACTIVE POPULATION
IN SELECTED OCCUPATIONAL GROUPS, 2010-2013(Percentages)
CountryTotal
workforceManagement Professional Technical Office workers
Service and sales workers
Farm workersOperators and
artisansMachinery operators
Unskilled
Argentina 5.6 5.1 n/a n/a n/a n/a 4.7 6.9 n/a n/a
Bolivia (Plurinational State of) 0.9 4.0 2.2 2.0 1.1 1.0 0.7 0.7 0.4 0.5
Brazil 0.3 1.0 0.7 0.3 0.1 0.3 0.1 0.2 0.3 0.1
Chile 3.2 3.2 4.2 3.0 2.5 4.3 0.8 2.9 1.5 3.6
Costa Rica 11.9 13.9 6.9 7.3 5.6 13.0 6.9 16.9 8.5 21.3
Dominican Republic 6.2 6.3 3.1 2.4 1.4 4.2 15.2 8.1 1.4 11.5
Ecuador 1.6 5.0 2.4 2.5 1.6 2.1 1.0 1.3 0.7 1.4
Mexico 0.5 1.7 1.1 0.7 0.5 0.5 0.2 0.3 0.2 0.3
Panama 4.6 14.7 9.1 6.3 2.3 8.7 1.2 3.8 1.5 2.0
Paraguay 3.3 7.2 2.5 3.4 1.6 3.1 3.9 3.0 4.1 2.8
Uruguay 1.9 3.9 3.1 2.2 2.1 2.2 0.9 1.3 1.3 1.3
Venezuela (Bolivarian Republic of) 5.8 6.2 3.6 3.9 2.8 8.1 6.3 7.2 4.3 6.6
Source: Economic Commission for Latin America and the Caribbean (ECLAC) and the International Labour Organization (ILO), on the basis of census data from the Investigation of International Migration in Latin America (IMILA) database and special processing of population censuses; for Chile and Paraguay: Household Survey Data Bank (BADEHOG).
Note: The highlighted percentages exceed the total workforce values.
5. Employment by occupational category
Generally, there are few differences in terms of the proportion of wage workers and own-account workers among immigrants, compared with natives. Immigrants make up relatively larger proportions of wage workers in Argentina, Costa Rica, Ecuador, Mexico and the Plurinational State of Bolivia, and of own-account workers in the Bolivarian Republic of Venezuela, Brazil, the Dominican Republic, Panama and Paraguay. Meanwhile, their proportions in these two categories are very close in Chile.
In nearly all the countries, with the exception of Argentina and the Dominican Republic, employers are overrepresented among immigrants (that is, their proportion among immigrants is larger than among natives), which points anew to the presence of foreigners with investment capacity.24 Figure II.1 adds, for 11 countries, the three sectors with the largest presence of immigrant employers.
24 Obviously, there are also cases in which these immigrants did not establish themselves immediately as employers but rather opened their own business after a period of time in which they would have participated in the workforce in another occupational category.
Figure II.1LATIN AMERICA (SELECTED COUNTRIES):a SECTORS OF ACTIVITY
WITH STRONGEST PRESENCE OF IMMIGRANT EMPLOYERS, IN ABSOLUTE AND RELATIVE TERMS, 2010-2013b
(Number of countries)
0
2
4
6
8
10
12
Agr
icul
ture
Min
ing
Man
ufac
turin
g
Ele
ctric
ity,
gas
and
wat
er
Con
stru
ctio
n
Com
mer
ce, h
otel
san
d re
stau
rant
s
Tran
spor
tatio
n
Fina
ncia
l and
busi
ness
ser
vice
s
Oth
er s
ervi
ces
Absolute terms Relative terms
Source: Economic Commission for Latin America and the Caribbean (ECLAC) and the International Labour Organization (ILO), on the basis of census data from the Investigation of International Migration in Latin America (IMILA) database and special processing of population censuses; for Chile and Paraguay: Household Survey Data Bank (BADEHOG).
a The countries covered are Argentina, the Bolivarian Republic of Venezuela, Brazil, Chile, Costa Rica, the Dominican Republic, Ecuador, Mexico, Paraguay, the Plurinational State of Bolivia and Uruguay.
b The three branches with the highest presence of immigrant employers in each country are considered.
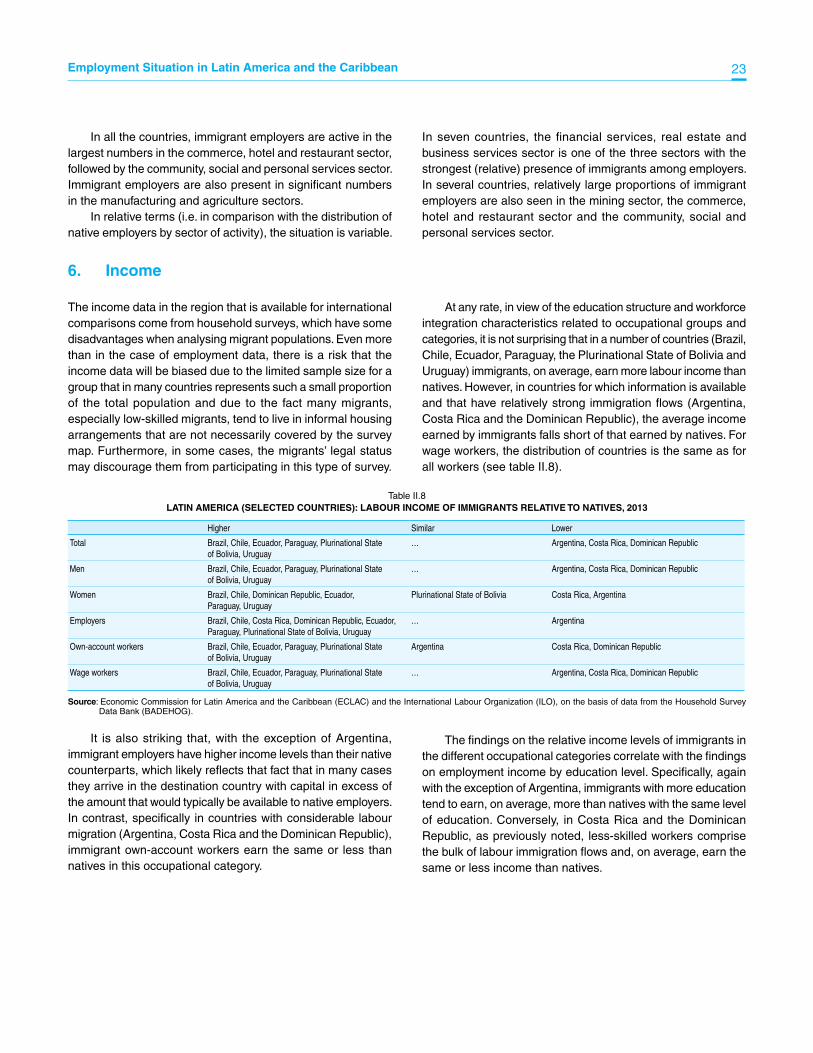
Employment Situation in Latin America and the Caribbean 23
In all the countries, immigrant employers are active in the largest numbers in the commerce, hotel and restaurant sector, followed by the community, social and personal services sector. Immigrant employers are also present in significant numbers in the manufacturing and agriculture sectors.
In relative terms (i.e. in comparison with the distribution of native employers by sector of activity), the situation is variable.
In seven countries, the financial services, real estate and business services sector is one of the three sectors with the strongest (relative) presence of immigrants among employers. In several countries, relatively large proportions of immigrant employers are also seen in the mining sector, the commerce, hotel and restaurant sector and the community, social and personal services sector.
6. Income
The income data in the region that is available for international comparisons come from household surveys, which have some disadvantages when analysing migrant populations. Even more than in the case of employment data, there is a risk that the income data will be biased due to the limited sample size for a group that in many countries represents such a small proportion of the total population and due to the fact many migrants, especially low-skilled migrants, tend to live in informal housing arrangements that are not necessarily covered by the survey map. Furthermore, in some cases, the migrants’ legal status may discourage them from participating in this type of survey.
At any rate, in view of the education structure and workforce integration characteristics related to occupational groups and categories, it is not surprising that in a number of countries (Brazil, Chile, Ecuador, Paraguay, the Plurinational State of Bolivia and Uruguay) immigrants, on average, earn more labour income than natives. However, in countries for which information is available and that have relatively strong immigration flows (Argentina, Costa Rica and the Dominican Republic), the average income earned by immigrants falls short of that earned by natives. For wage workers, the distribution of countries is the same as for all workers (see table II.8).
Table II.8LATIN AMERICA (SELECTED COUNTRIES): LABOUR INCOME OF IMMIGRANTS RELATIVE TO NATIVES, 2013
Higher Similar Lower
Total Brazil, Chile, Ecuador, Paraguay, Plurinational State of Bolivia, Uruguay
… Argentina, Costa Rica, Dominican Republic
Men Brazil, Chile, Ecuador, Paraguay, Plurinational State of Bolivia, Uruguay
… Argentina, Costa Rica, Dominican Republic
Women Brazil, Chile, Dominican Republic, Ecuador, Paraguay, Uruguay
Plurinational State of Bolivia Costa Rica, Argentina
Employers Brazil, Chile, Costa Rica, Dominican Republic, Ecuador, Paraguay, Plurinational State of Bolivia, Uruguay
… Argentina
Own-account workers Brazil, Chile, Ecuador, Paraguay, Plurinational State of Bolivia, Uruguay
Argentina Costa Rica, Dominican Republic
Wage workers Brazil, Chile, Ecuador, Paraguay, Plurinational State of Bolivia, Uruguay
… Argentina, Costa Rica, Dominican Republic
Source: Economic Commission for Latin America and the Caribbean (ECLAC) and the International Labour Organization (ILO), on the basis of data from the Household Survey Data Bank (BADEHOG).
It is also striking that, with the exception of Argentina, immigrant employers have higher income levels than their native counterparts, which likely reflects that fact that in many cases they arrive in the destination country with capital in excess of the amount that would typically be available to native employers. In contrast, specifically in countries with considerable labour migration (Argentina, Costa Rica and the Dominican Republic), immigrant own-account workers earn the same or less than natives in this occupational category.
The findings on the relative income levels of immigrants in the different occupational categories correlate with the findings on employment income by education level. Specifically, again with the exception of Argentina, immigrants with more education tend to earn, on average, more than natives with the same level of education. Conversely, in Costa Rica and the Dominican Republic, as previously noted, less-skilled workers comprise the bulk of labour immigration flows and, on average, earn the same or less income than natives.

24 ECLAC / ILONumber 16
7. Informality and social protection
Although the census data is insufficient, several studies point to high rates of informality among immigrant workers. For example, in Argentina, it has been estimated that 67.4% of immigrants of South American origin were working in the informal sector in 2011, compared with 41.7% of non-migrant workers and 41.8% of internal migrant workers (ILO, 2015b). In Costa Rica, it is estimated that 29% of all migrant workers and 32% of female migrant workers are in the informal economy (ILO, 2013). In the Dominican Republic, in 2012, 83.6% of Haitian migrant workers in the agricultural sector were estimated to be working informally, and the rate was 91% in the construction sector (Ministry of Labour/OMLAD, 2011).
If enrolment in contributory social security programmes is used as an indicator of labour (in)formality, in the specific case of three countries with large proportions of immigrants for which information is available (Argentina, Costa Rica and the Dominican Republic), there are large gaps between immigrants and natives, with significantly less coverage for the former compared with the latter. In contrast, in Brazil, Paraguay, the Plurinational State of Bolivia and Uruguay, as well as for wage workers in Chile, coverage rates are similar for both groups (see table II.9).25
In terms of the coverage gap between immigrants and natives, with few exceptions, women fare worse than men, and in some cases, there are major coverage discrepancies between immigrant women and native women.
25 Among all employed workers and employed men in Chile and among wage workers in Ecuador, there is even moderately more coverage for immigrants.
Table II.9LATIN AMERICA (SELECTED COUNTRIES): IMMIGRANTS ENROLMENT IN SOCIAL PROTECTION SYSTEMS COMPARED WITH NATIVES, 2013a
(Percentages)
Higher Similar Lower
Employed workers
Chile (88-83) Brazil (61-63), Paraguay (29-30), Plurinational State of Bolivia (24-27), Uruguay (76-76)
Argentina (49-73), Costa Rica (71-87), Dominican Republic (19-64)
Employed men
Chile (92-83) Brazil (64-62), Paraguay (26-28), Uruguay (79-76)
Argentina (46-70), Costa Rica (70-84), Dominican Republic (20-59), Plurinational State of Bolivia (19-25)
Employed women
- Chile (84-82), Paraguay (31-31), Plurinational State of Bolivia (32-29), Uruguay (73-76)
Argentina (53-77), Brazil (56-64), Costa Rica (73-91), Dominican Republic (19-72)
Wage workers
Ecuador (60-55) Brazil (73-77), Chile (94-90), Uruguay (88-88)
Argentina (56-78), Costa Rica (73-90), Dominican Republic (51-71), Paraguay (39-46), Plurinational State of Bolivia (38-44)
Wage-earning men
Ecuador (61-50) Brazil (75-78), Chile (95-91), Uruguay (91-88)
Argentina (55-77), Costa Rica (73-87), Dominican Republic (51-69), Paraguay (39-45), Plurinational State of Bolivia (19-40)
Wage-earning women
Plurinational State of Bolivia (64-53)
Chile (93-89), Ecuador (60-64),Uruguay (84-87)
Argentina (57-79), Brazil (69-77), Costa Rica (73-93), Dominican Republic (48-75), Paraguay (38-49)
Source: Economic Commission for Latin America and the Caribbean (ECLAC) and the International Labour Organization (ILO), on the basis of data from the Household Survey Data Bank (BADEHOG).
a The first number in the parentheses represents the coverage rate for immigrants, and the second number corresponds to natives. The variables considered were pension contributions in Brazil, Chile and Uruguay, health contributions in Argentina, the Dominican Republic, Paraguay and the Plurinational State of Bolivia and social security contributions in Costa Rica and Ecuador.
C. Policies and agreements to promote full and productive employment and decent work for immigrants
1. Challenges and policies
To promote full and productive employment and decent work for immigrants and generate the best possible impact on the labour markets in the destination countries, it is important to shape migration through the multiple policies that have a bearing on it (see diagram II.1).26
Societies should tackle the complex issue of migration from various areas of public policy, involving and coordinating not only migration and labour policies but also social, education,
26 Programmes may also be needed to support segments of the native population whose employment prospects are affected by immigration.
health, security, social protection, development, trade and other policies geared towards social inclusion and protection of rights. At the same time, because this issue cuts across geographic boundaries, countries must agree on coordination mechanisms in order to successfully handle various aspects related to the migration of people.
These policies are interrelated, and many have both direct and indirect effects on the labour market. For example, migration policies

Employment Situation in Latin America and the Caribbean 25
that control the number and characteristics of immigrants accepted into a country directly affect its labour market by influencing the labour supply. However, they also have an impact on how these individuals integrate into the workforce, which depends on their skills, migration status, migration rationale, origin country, labour regulations and other variables, many of which are shaped by migration policies. Table II.10 summarizes some labour policies that are related to immigration. Origin countries may be interested in retaining their human resources, so any labour policy that tends
to improve conditions in the local labour market will have a positive effect in this regard. For their part, countries with net immigration may implement labour policy tools to make the most efficient use of an expanded supply of workers. This may be achieved through any number of policies to promote workforce integration. Lastly, countries can take coordinated action together to improve labour conditions for migrant workers, which basically consists in agreements that recognize skills, competencies and experience acquired abroad as well as contributions made to social security.
Diagram II.1IMPACT OF INTERNATIONAL MIGRATION AND RELATED POLICIES
Health policies
Security policies
Social protectionpolicies
Countryof origin
Country of transit
Country of destination
Economic impact
Demographic impactCultural impact Social impact
Education policies
Labour policies
Economic policies
Trade policies
Development policies
Social policies
Migration policies
Source: Economic Commission for Latin American (ECLAC) and the International Labour Organization (ILO).
A useful tool containing policy guidelines is the ILO Multilateral Framework on Labour Migration: Non-binding principles and guidelines for a rights-based approach to labour migration (ILO, 2007). This document offers practical guidelines and measures to enable all parties to maximize the contribution of labour migrations by addressing the main issues faced by those who make policy on
migration at the national, regional and international levels. Based on migration experiences around the world, the framework presents a wide range of principles, guidelines and best practices on policy related to migrant workers, such as decent work, management of migration, protection of migrant workers and promotion of linkages between migration and development.
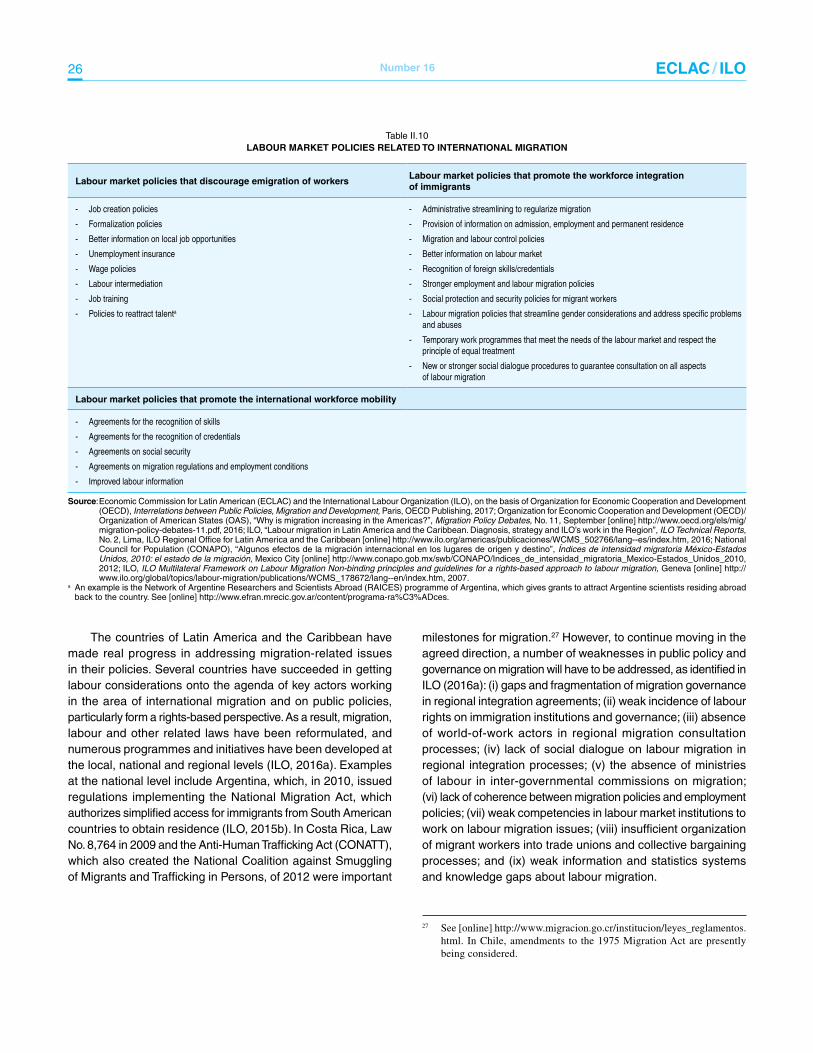
26 ECLAC / ILONumber 16
Table II.10LABOUR MARKET POLICIES RELATED TO INTERNATIONAL MIGRATION
Labour market policies that discourage emigration of workersLabour market policies that promote the workforce integration of immigrants
- Job creation policies
- Formalization policies
- Better information on local job opportunities
- Unemployment insurance
- Wage policies
- Labour intermediation
- Job training
- Policies to reattract talenta
- Administrative streamlining to regularize migration
- Provision of information on admission, employment and permanent residence
- Migration and labour control policies
- Better information on labour market
- Recognition of foreign skills/credentials
- Stronger employment and labour migration policies
- Social protection and security policies for migrant workers
- Labour migration policies that streamline gender considerations and address specific problems and abuses
- Temporary work programmes that meet the needs of the labour market and respect the principle of equal treatment
- New or stronger social dialogue procedures to guarantee consultation on all aspects of labour migration
Labour market policies that promote the international workforce mobility
- Agreements for the recognition of skills
- Agreements for the recognition of credentials
- Agreements on social security
- Agreements on migration regulations and employment conditions
- Improved labour information
Source: Economic Commission for Latin American (ECLAC) and the International Labour Organization (ILO), on the basis of Organization for Economic Cooperation and Development (OECD), Interrelations between Public Policies, Migration and Development, Paris, OECD Publishing, 2017; Organization for Economic Cooperation and Development (OECD)/Organization of American States (OAS), “Why is migration increasing in the Americas?”, Migration Policy Debates, No. 11, September [online] http://www.oecd.org/els/mig/migration-policy-debates-11.pdf, 2016; ILO, “Labour migration in Latin America and the Caribbean. Diagnosis, strategy and ILO’s work in the Region”, ILO Technical Reports, No. 2, Lima, ILO Regional Office for Latin America and the Caribbean [online] http://www.ilo.org/americas/publicaciones/WCMS_502766/lang--es/index.htm, 2016; National Council for Population (CONAPO), “Algunos efectos de la migración internacional en los lugares de origen y destino”, Índices de intensidad migratoria México-Estados Unidos, 2010: el estado de la migración, Mexico City [online] http://www.conapo.gob.mx/swb/CONAPO/Indices_de_intensidad_migratoria_Mexico-Estados_Unidos_2010, 2012; ILO, ILO Multilateral Framework on Labour Migration Non-binding principles and guidelines for a rights-based approach to labour migration, Geneva [online] http://www.ilo.org/global/topics/labour-migration/publications/WCMS_178672/lang--en/index.htm, 2007.
a An example is the Network of Argentine Researchers and Scientists Abroad (RAICES) programme of Argentina, which gives grants to attract Argentine scientists residing abroad back to the country. See [online] http://www.efran.mrecic.gov.ar/content/programa-ra%C3%ADces.
The countries of Latin America and the Caribbean have made real progress in addressing migration-related issues in their policies. Several countries have succeeded in getting labour considerations onto the agenda of key actors working in the area of international migration and on public policies, particularly form a rights-based perspective. As a result, migration, labour and other related laws have been reformulated, and numerous programmes and initiatives have been developed at the local, national and regional levels (ILO, 2016a). Examples at the national level include Argentina, which, in 2010, issued regulations implementing the National Migration Act, which authorizes simplified access for immigrants from South American countries to obtain residence (ILO, 2015b). In Costa Rica, Law No. 8,764 in 2009 and the Anti-Human Trafficking Act (CONATT), which also created the National Coalition against Smuggling of Migrants and Trafficking in Persons, of 2012 were important
milestones for migration.27 However, to continue moving in the agreed direction, a number of weaknesses in public policy and governance on migration will have to be addressed, as identified in ILO (2016a): (i) gaps and fragmentation of migration governance in regional integration agreements; (ii) weak incidence of labour rights on immigration institutions and governance; (iii) absence of world-of-work actors in regional migration consultation processes; (iv) lack of social dialogue on labour migration in regional integration processes; (v) the absence of ministries of labour in inter-governmental commissions on migration; (vi) lack of coherence between migration policies and employment policies; (vii) weak competencies in labour market institutions to work on labour migration issues; (viii) insufficient organization of migrant workers into trade unions and collective bargaining processes; and (ix) weak information and statistics systems and knowledge gaps about labour migration.
27 See [online] http://www.migracion.go.cr/institucion/leyes_reglamentos.html. In Chile, amendments to the 1975 Migration Act are presently being considered.
Employment Situation in Latin America and the Caribbean 27
In recent decades, cross-border migration has been a topic of international debate. In order to protect the human rights of migrant workers and promote equal treatment and opportunities for them, the ILO has two Conventions that specifically address issues related to migrant workers: the Migration for Employment Convention (No. 97 of 1949) and the Migrant Workers (Supplementary Provisions) Convention (No. 143 of 1975, in force since 1978), along with the corresponding Recommendations Nos. 86 and 151. Conventions Nos. 97 and 143 establish respect for the fundamental rights of migrant workers and rights to equal treatment as part of employment rights, even for workers in situations of irregular migration. The instruments also call for protection of a migrant worker’s regular status in the event of loss of employment. The Conventions do not interfere with the right of each member State to determine whether and how migrant workers may enter and stay in the country (ILO, 2016b). To date, 14 member States in the region have ratified Convention No. 97, but only one has ratified Convention No. 143.28 However, many countries in the region have ratified the fundamental conventions of the ILO, which contain provisions that also apply to migrant workers29 (ILO, 2016a).
In addition, many countries have ratified one of the principal international agreements on migration, the United Nations International Convention on the Protection of the Rights of All Migrant Workers and Members of Their Families,30 which was approved in 1990 but did not enter into force until July 2003. That Convention provides an international framework for governments to establish national policies on migration and employment. It also proposes a wide range of protections for migrant workers and their family members in various realms of work and life (ILO, 2016b).
In September 2013, official representatives from 38 Latin American and Caribbean member and associate member States of the Economic Commission for Latin America and the Caribbean (ECLAC) approved the Montevideo Consensus on Population and Development, which includes a series of agreements on international migration and protection of the rights of all migrants. The signatories agreed to guarantee the full inclusion of matters related to this phenomenon in global, regional and national post-2015 development agendas and
28 In the region, Convention No. 97 has been ratified by the Bahamas, Barbados, Belize, the Bolivarian Republic of Venezuela, Brazil, Cuba, Dominica, Ecuador, Grenada, Guatemala, Guyana, Jamaica, Trinidad and Tobago and Uruguay. Convention No. 143 has been ratified only by the Bolivarian Republic of Venezuela (ILO, 2016a).
29 See the list of ILO Conventions ratified by the countries of the Americas: www.ilo.org/dyn/normlex/en/f?p=1000:11001:2500961296771443::::P11001_COUNTRY_SORT:2#Americas.
30 See United Nations Office of the High Commissioner on Human Rights [online] http://www.ohchr.org/SP/ProfessionalInterest/Pages/CMW.aspx.
strategies, to provide assistance and protection to migrants, with full respect for their rights, and to promote the establishment of multilateral and bilateral agreements on social security that include migrant workers (ECLAC, 2013).31
Globally, the issue of immigration was taken up during the sixty-eighth session of the United Nations General Assembly at the High-level Dialogue on International Migration and Development, held in October 2013. On that occasion, the Member States reached consensus on matters related to migration and development, such as the establishment of international standards for recruiting and contracting migrants and the development of protection and assistance mechanisms for migrants that are victims of natural disasters or armed conflicts.32 The joint declaration called for more systematic and responsible action in origin, destination and transit countries for the purpose of creating a safer, more transparent framework for migration and mobility that protects the human rights of migrants. The following are some areas of action that elicited interest in terms of practical collaboration on migration:
• The portability of benefits acquired by migrants during their working life abroad.
• The elimination of abusive employment practices.• Stronger protections for migrant domestic workers.• Greater participation by diaspora communities in development
activities in countries of origin.• The agreement to create a protection and assistance
framework for migrants in crisis situations.• The incorporation of international migration in the post-2015
development agenda.• Lower remittances costs and better strategies to combat
human trafficking.These agreements served as inputs for putting the issue
of migration on the development agenda that was agreed on by the international community in September 2015. The international mobility of people was addressed by Sustainable Development Goal 8, as mentioned earlier, as well as by two targets of Sustainable Development Goal 10, one to “facilitate orderly, safe, regular and responsible migration and mobility of people, including through the implementation of planned and well-managed migration policies” and another to “by 2030, reduce to less than 3% the transaction costs of migrant remittances
31 In Latin America and the Caribbean, the topic of migration has been analysed and policy guidelines have been agreed on in forums such as the Community of Latin American and Caribbean States (CELAC) and the Inter-American Conference of Ministers of Labor, as well as in several regional economic integration agreements such as the Southern Common Market (MERCOSUR), the Andean Community (CAN), the Caribbean Community (CARICOM) and the Central American Integration System (SICA) (ILO, 2016a).
32 See [online] http://www.un.org/es/ga/68/meetings/migration/.
2. Labour migration on the international development agenda
28 ECLAC / ILONumber 16
and eliminate remittance corridors with costs higher than 5%”. In September 2016, the Member States of the United Nations issued the New York Declaration for Refugees and Migrants, which sets out commitments and specifies concrete actions to improve conditions associated with involuntary displacement (refugees) and for other immigrants in situations of vulnerability.33 It also outlines steps towards the achievement of a global compact for safe, orderly and regular migration in 2018.34 Meanwhile, in the framework of the ILO Fair Recruitment Initiative, in September 2016
33 More information available [online] https://refugeesmigrants.un.org/declaration. 34 The International Dialogue on Migration has planned two workshops
for 2017 to contribute to the process for the preparation of the global compact. The first one was held in New York in April and the second one will take place in Geneva in July (see [online] https://www.iom.int/idm-2017-global-compact-migration)
a tripartite meeting of experts adopted the “General principles and operational guidelines for fair recruitment”. The purpose of these (non-binding) principles and guidelines is to identify good practices for reducing the exploitation, forced labour and vulnerability of workers around the world, especially migrants, vis-à-vis traffickers and unscrupulous employers and labour contractors.35 These international coordination efforts reinforce the countries’ commitments to include migrant communities in their development plans.
35 See the complete document [online] http://www.ilo.org/wcmsp5/groups/public/---ed_protect/---protrav/---migrant/documents/meetingdocument/wcms_508966.pdf. The issue of labour migration is on the agenda of the 106th session of the International Labour Conference, to be held in mid-2017 (ILO, 2017).
D. Summary and conclusions
Labour migration between countries is a permanent phenomenon driven primarily by scarcity of options for productive work in countries of origin, by employment opportunities in countries of destination and expectations of access to those opportunities and a substantially higher income than what is available in countries of origin. This type of migration holds the potential to gradually improve the well-being of migrants, but for a number of reasons, including discrimination, their integration into the workforce is often precarious.
Emigration from Latin America and the Caribbean to countries outside the region has slowed in recent times, and in relative terms intraregional migration is on the rise. This section of the report reviews the available information on the workforce integration of immigrants to a number of Latin American countries. The available empirical information corresponds to the period between 2010 and 2013, so the report does not capture some of the more recent trends in intraregional migration, particularly the strong immigration flows to Chile. However, a number of key aspects of the immigrant experience with integration have been identified, contributing to a greater understanding of this increasingly important issue. Immigrants to Latin American countries represent a very diverse group of people in terms of age, education, workforce participation and other characteristics. Specifically, the way in which migrants participate in the workforce in the different countries of Latin America is related to the nature of the immigration itself, which can be delineated as recent labour migration, past labour migration and non-labour migration.
Intraregional labour migration occurs primarily between neighbouring countries. In cases in which there is a relatively larger presence of immigrants (Argentina, the Bolivarian Republic of Venezuela, Costa Rica and the Dominican Republic), migrants tend to be less educated than the native population, and they generally work in occupations and sectors that are less attractive to the local population and require fewer skills.
In contrast, other countries (Brazil, Chile, Ecuador, Mexico, Panama, the Plurinational State of Bolivia and Uruguay) receive migrants with relatively high levels of education. This is related to a relatively larger presence of immigrants in skilled occupations (managers, professionals, technical experts) in fields requiring higher qualifications, as well as employers.
In nearly all the countries with relatively strong immigration (with the exception of the Dominican Republic), women immigrants comprise the majority, which corroborates the feminization of intraregional migration.
The participation rate among immigrants tends to be higher than among natives, especially in countries that have received a relatively large influx of immigrants but also in some of the other countries and among people in the core age groups (30 years or older) of the working-age population. In some of these countries, lower rates of activity among the general immigrant population are primarily determined by age structure, specifically a large share of immigrants in the 60-or-older age group, or, as in the case of Mexico, of a preponderance of school-age adolescents.
Given the aforementioned participation characteristics of the immigrant population, it is unsurprising that this group often experiences unemployment at lower rates than the native population. This is related to factors including their subsistence needs, strong family commitments (remittances), pre-established employment contracts and the incidence of employers with investment capital. In countries with relatively high unemployment among immigrants, gender-based estimates demonstrate the disproportionate impact of the workforce integration problems of immigrant women, who are unemployed in these cases at higher rates than native women, who already have a higher unemployment rate than men.
In countries with strong migration flows, immigrants have lower average incomes than the native population, high levels of labour informality and significantly lower levels of social security

Employment Situation in Latin America and the Caribbean 29
coverage than native workers. Coverage is particularly low for migrant women. These conditions underscore the importance of strengthening workforce integration mechanisms, for which a gender perspective is essential.
Against this backdrop, the region’s countries have recognized the importance of ensuring the effective regulation of cross-border migration within the frameworks of national migration policies. This means approaching migration from different public policy areas to address major challenges. Specifically, labour market policies should tackle a number of weaknesses identified in policies designed to address the challenges related to migration processes.
Given that cross-border migration, by its nature, affects populations in different countries, the challenges associated with it are being addressed in a growing number of international forums, both in the framework of the ILO and in other global and regional settings. Cross-border migration will continue to exist and generate challenges for origin and destination countries alike, as well as transit countries as applicable. Coordinating effective regulatory instruments will be an ongoing task in the effort to improve the wellbeing of the individuals involved and to promote the development of the countries and the fulfilment of Sustainable Development Goal 8.
Bibliography
CONAPO (National Council for Population) (2012), “Algunos efectos de la migración internacional en los lugares de origen y destino”, Índices de intensidad migratoria México-Estados Unidos, 2010: el estado de la migración, Mexico City [online] http://www.conapo.gob.mx/swb/CONAPO/Indices_de_intensidad_migratoria_Mexico-Estados_Unidos_2010.
ECLAC (Economic Commission for Latin America and the Caribbean) (2013b), Montevideo Consensus on Population and Development (LC/L.3697), Santiago [online] http://repositorio.cepal.org/bitstream/handle/11362/21860/S20131039_en.pdf?sequence=4&isAllowed=y.
ILO (International Labour Organization) (2017), “Addressing governance challenges in a changing labour migration landscape”, Report IV, International Labour Conference, 106th Session, Geneva.
(2016a), “Labour migration in Latin America and the Caribbean. Diagnosis, strategy and ILO’s work in the Region”, ILO Technical Reports, No. 2, Lima, ILO Regional Office for Latin America and the Caribbean [online].
(2016b), “Migración laboral en Chile: oportunidades y desafíos para el trabajo decente” [online] http://www.ilo.org/santiago/sala-de-prensa/WCMS_495285/lang--es/index.htm.
(2015a), ILO Global Estimates on Migrant Workers: Results and Methodology. Special Focus on Migrant Domestic Workers [online] http://www.ilo.org/global/topics/labour-migration/publications/WCMS_436343/lang--en/index.htm.
(2015b), Migraciones laborales en Argentina: protección social, informalidad y heterogeneidades sectoriales, Buenos Aires, ILO Country Office for Argentina.
(2013), Nicaragüenses en el norte: condiciones laborales y práctica de contratación de hombres y mujeres migrantes en la Región Huetar Norte, San José.
(2007), ILO Multilateral Framework on Labour Migration Non-binding principles and guidelines for a rights-based approach to labour migration, Geneva [online] http://www.ilo.org/global/topics/labour-migration/publications/WCMS_178672/lang--en/index.htm.
Martínez Pizarro, J. and C. Orrego Rivera (2016), “Nuevas tendencias y dinámicas migratorias en América Latina y el Caribe”, Población y Desarrollo series, No. 114 (LC/L.4164), Santiago, Economic Commission for Latin America and the Caribbean (ECLAC).
Martínez Pizarro, J., V. Cano Christiny and M. Soffia Contrucci (2014), “Tendencias y patrones de la migración latinoamericana y caribeña hacia 2010 y desafíos para una agenda regional”, Población y Desarrollo series, No. 109 (LC/L.3914), Santiago, Economic Commission for Latin America and the Caribbean (ECLAC).
Ministry of Labour/OMLAD (Dominican Labor Observatory) (2011), Inmigrantes haitianos y mercado laboral: estudio sobre los trabajadores de la construcción y de la producción del guineo en República Dominicana, Santo Domingo.
Montoya Ortiz, M. S. and J.G. González Becerril (2015), “Evolución de la migración de retorno en México: migrantes procedentes de Estados Unidos en 1995 y de 1999 a 2014”, Papeles de Población, vol. 21, No. 85, Center for Research and Advanced Population Studies (CIEAP), Autonomous University of the State of Mexico (UAEMEX), July-September.
OECD (Organization for Economic Cooperation and Development) (2017), Interrelations between Public Policies, Migration and Development, Paris, OECD Publishing.
OECD/OAS (Organization for Economic Cooperation and Development/Organization of American States) (2016), “Why is migration increasing in the Americas?”, Migration Policy Debates, No. 11, September [online] http://www.oecd.org/els/mig/migration-policy-debates-11.pdf.
Salas, E. G., E. G. Loría-Díaz de Guzmán and E. Díaz (2016), “The paradox of Mexican migration to the US 2007-2012”, Papeles de Población, vol. 22, No. 87, January-March.
United Nations (2015), Trends in International Migrant Stock: The 2015 Revision (POP/DB/MIG/Stock/Rev.2015), New York, Department of Economic and Social Affairs (DESA).


Employment Situation in Latin America and the Caribbean 31
Annex A1
Table A1.1LATIN AMERICA AND THE CARIBBEAN: ANNUAL AVERAGE URBAN UNEMPLOYMENT RATE BY SEX, 2005-2016
(Percentages)
Country 2005 2006 2007 2008 2009 2010 2011 2012 2013 2014 2015 2016
a
Latin America
Argentinab 11.6 10.2 8.5 7.9 8.7 7.7 7.2 7.2 7.1 7.3 6.5 8.5
Men 10.0 8.4 6.7 6.6 7.8 6.7 6.3 6.1 6.1 6.5 5.7 7.8
Women 13.6 12.5 10.8 9.7 9.9 9.2 8.5 8.8 8.5 8.4 7.6 9.4
Bolivia (Plurinational State of) 8.1 8.0 7.7 6.7 6.8 … 3.8 3.2 4.0 3.5 4.4 …
Men 6.8 7.1 6.3 … … … 3.1 2.2 3.2 2.5 3.5 …
Women 9.9 9.1 9.4 … … … 4.7 4.4 5.1 4.9 5.6 …
Brazilc 9.8 10.0 9.3 7.9 8.1 6.7 6.0 8.2 8.0 7.8 9.3 13.0
Men 7.8 8.2 7.4 6.1 6.5 5.2 4.7 6.8 6.6 6.7 8.1 11.6
Women 12.4 12.2 11.6 10.0 9.9 8.5 7.5 9.9 9.7 9.1 10.7 14.7
Chiled 8.6 8.2 7.6 8.2 10.2 8.5 7.4 6.7 6.2 6.7 6.4 6.8
Men 7.6 7.2 6.8 7.3 9.7 7.6 6.5 5.7 5.5 6.4 6.1 6.5
Women 10.1 9.7 8.8 9.7 10.9 9.8 8.7 8.0 7.0 7.0 6.9 7.1
Colombiae 13.2 13.2 12.2 12.1 13.2 12.7 11.8 11.4 10.7 10.0 9.8 10.3
Men 10.9 10.7 10.2 10.2 11.1 10.6 9.6 9.2 8.7 8.1 7.9 8.4
Women 16.2 16.2 14.7 14.5 15.7 15.3 14.4 14.0 12.9 12.2 11.9 12.4
Costa Ricaf 6.9 6.0 4.8 4.8 8.5 7.1 7.7 9.8 9.1 9.5 9.7 9.6
Men 5.6 4.5 3.4 4.3 6.5 6.0 6.3 8.9 8.3 8.3 8.3 8.3
Women 8.8 8.2 6.8 5.6 9.2 8.8 9.7 11.5 10.5 11.3 11.7 11.5
Cubag 1.9 1.9 1.8 1.6 1.7 2.5 3.2 3.5 3.3 2.7 2.4 …
Men 1.8 1.7 1.7 1.3 1.5 2.4 3.0 3.4 3.1 2.4 2.3 …
Women 2.2 2.2 1.9 2.0 2.0 2.7 3.5 3.6 3.5 3.1 2.6 …
Dominican Republich 7.3 6.2 5.4 5.3 5.8 5.7 6.7 7.2 7.9 7.2 6.9 6.3
Men 5.5 4.4 4.0 3.8 4.5 4.8 5.4 5.8 5.9 5.4 5.0 4.3
Women 10.0 9.0 7.8 7.6 7.8 7.1 8.5 9.3 10.7 9.8 9.6 9.0
Ecuadori 8.5 8.1 6.9 6.9 8.5 7.6 6.0 4.9 4.7 5.1 5.4 6.8
Men 6.7 6.2 6.0 5.5 7.1 6.3 5.1 4.5 4.2 4.5 4.4 5.6
Women 10.9 10.6 9.3 8.8 10.5 9.4 7.2 5.5 5.4 6.0 6.7 8.5
El Salvadorj 7.3 5.7 5.8 5.5 7.1 6.8 6.6 6.2 5.6 6.7 6.5 …
Men 9.4 7.6 7.9 7.2 9.0 8.3 8.7 8.0 6.8 8.5 8.1 …
Women 4.8 3.6 3.4 3.5 4.9 5.1 4.1 4.2 4.2 4.6 4.6 …
Guatemalak … … … … … 4.8 3.1 4.0 3.8 4.0 3.2 3.6
Men … … … … … 4.4 2.8 3.7 3.9 3.9 2.9 3.6
Women … … … … … 5.2 3.7 4.5 3.7 4.2 3.6 3.8
Honduras 6.1 4.6 3.9 4.2 4.9 6.4 6.8 5.6 6.0 7.5 8.8 9.0
Men 6.7 5.2 3.8 4.2 4.6 5.9 6.2 5.3 5.7 6.9 7.0 7.0
Women 7.2 5.3 4.4 4.2 5.2 7.1 7.6 6.1 6.3 8.3 10.9 11.3
Mexico 4.0 4.0 4.0 4.3 5.9 5.9 5.6 5.4 5.4 5.3 4.7 4.3
Men 3.8 3.8 3.9 4.3 6.0 6.1 5.8 5.5 5.4 5.4 4.7 4.3
Women 4.2 4.1 4.3 4.3 5.7 5.5 5.5 5.3 5.3 5.2 4.7 4.2
Nicaragual 7.9 7.6 7.3 8.0 10.5 10.1 6.5 7.6 … … … …
Men 8.8 8.8 8.0 8.4 … 10.4 6.7 7.7 … … … …
Women 6.8 6.1 6.3 7.6 … 9.6 6.3 7.5 … … … …
Panamam 12.1 10.4 7.8 6.5 7.9 7.7 5.4 4.8 4.7 5.4 5.8 6.4
Men 10.0 8.6 6.5 5.4 6.3 6.5 5.3 4.2 3.9 4.7 5.1 5.7
Women 15.0 12.9 9.6 7.9 9.9 9.3 5.4 5.5 5.7 6.4 6.7 7.5
Paraguayn 7.6 8.9 7.2 7.4 8.2 7.4 6.9 7.9 7.7 7.8 6.5 7.7
Men 7.1 7.7 6.2 6.6 7.9 6.7 6.1 6.5 6.1 6.3 5.5 6.3
Women 8.3 10.4 8.4 8.5 8.7 8.2 7.8 9.6 9.4 9.6 7.6 9.3
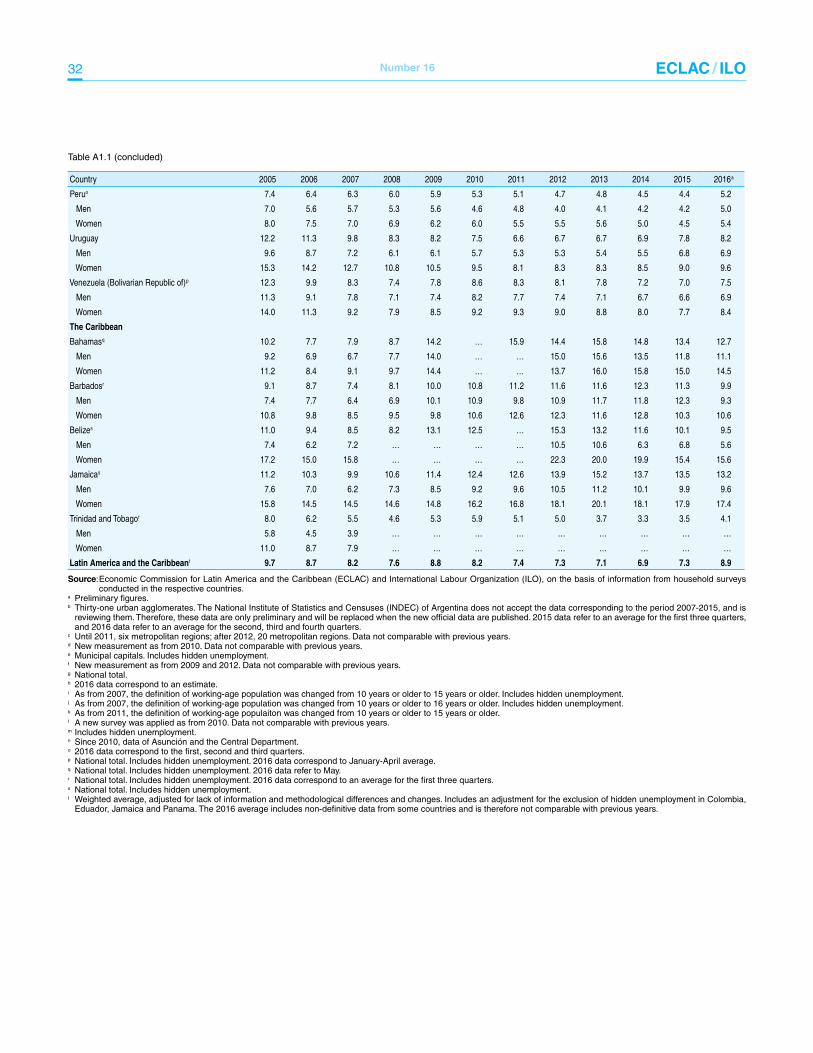
32 ECLAC / ILONumber 16
Country 2005 2006 2007 2008 2009 2010 2011 2012 2013 2014 2015 2016
a
Peruo 7.4 6.4 6.3 6.0 5.9 5.3 5.1 4.7 4.8 4.5 4.4 5.2
Men 7.0 5.6 5.7 5.3 5.6 4.6 4.8 4.0 4.1 4.2 4.2 5.0
Women 8.0 7.5 7.0 6.9 6.2 6.0 5.5 5.5 5.6 5.0 4.5 5.4
Uruguay 12.2 11.3 9.8 8.3 8.2 7.5 6.6 6.7 6.7 6.9 7.8 8.2
Men 9.6 8.7 7.2 6.1 6.1 5.7 5.3 5.3 5.4 5.5 6.8 6.9
Women 15.3 14.2 12.7 10.8 10.5 9.5 8.1 8.3 8.3 8.5 9.0 9.6
Venezuela (Bolivarian Republic of)p 12.3 9.9 8.3 7.4 7.8 8.6 8.3 8.1 7.8 7.2 7.0 7.5
Men 11.3 9.1 7.8 7.1 7.4 8.2 7.7 7.4 7.1 6.7 6.6 6.9
Women 14.0 11.3 9.2 7.9 8.5 9.2 9.3 9.0 8.8 8.0 7.7 8.4
The Caribbean
Bahamasq 10.2 7.7 7.9 8.7 14.2 … 15.9 14.4 15.8 14.8 13.4 12.7
Men 9.2 6.9 6.7 7.7 14.0 … … 15.0 15.6 13.5 11.8 11.1
Women 11.2 8.4 9.1 9.7 14.4 … … 13.7 16.0 15.8 15.0 14.5
Barbadosr 9.1 8.7 7.4 8.1 10.0 10.8 11.2 11.6 11.6 12.3 11.3 9.9
Men 7.4 7.7 6.4 6.9 10.1 10.9 9.8 10.9 11.7 11.8 12.3 9.3
Women 10.8 9.8 8.5 9.5 9.8 10.6 12.6 12.3 11.6 12.8 10.3 10.6
Belizes 11.0 9.4 8.5 8.2 13.1 12.5 … 15.3 13.2 11.6 10.1 9.5
Men 7.4 6.2 7.2 … … … … 10.5 10.6 6.3 6.8 5.6
Women 17.2 15.0 15.8 … … … … 22.3 20.0 19.9 15.4 15.6
Jamaicas 11.2 10.3 9.9 10.6 11.4 12.4 12.6 13.9 15.2 13.7 13.5 13.2
Men 7.6 7.0 6.2 7.3 8.5 9.2 9.6 10.5 11.2 10.1 9.9 9.6
Women 15.8 14.5 14.5 14.6 14.8 16.2 16.8 18.1 20.1 18.1 17.9 17.4
Trinidad and Tobagor 8.0 6.2 5.5 4.6 5.3 5.9 5.1 5.0 3.7 3.3 3.5 4.1
Men 5.8 4.5 3.9 … … … … … … … … …
Women 11.0 8.7 7.9 … … … … … … … … …
Latin America and the Caribbeant 9.7 8.7 8.2 7.6 8.8 8.2 7.4 7.3 7.1 6.9 7.3 8.9
Source: Economic Commission for Latin America and the Caribbean (ECLAC) and International Labour Organization (ILO), on the basis of information from household surveys conducted in the respective countries.
a Preliminary figures.b Thirty-one urban agglomerates. The National Institute of Statistics and Censuses (INDEC) of Argentina does not accept the data corresponding to the period 2007-2015, and is
reviewing them. Therefore, these data are only preliminary and will be replaced when the new official data are published. 2015 data refer to an average for the first three quarters, and 2016 data refer to an average for the second, third and fourth quarters.
c Until 2011, six metropolitan regions; after 2012, 20 metropolitan regions. Data not comparable with previous years.d New measurement as from 2010. Data not comparable with previous years.e Municipal capitals. Includes hidden unemployment.f New measurement as from 2009 and 2012. Data not comparable with previous years.g National total.h 2016 data correspond to an estimate.i As from 2007, the definition of working-age population was changed from 10 years or older to 15 years or older. Includes hidden unemployment.j As from 2007, the definition of working-age population was changed from 10 years or older to 16 years or older. Includes hidden unemployment.k As from 2011, the definition of working-age populaiton was changed from 10 years or older to 15 years or older.l A new survey was applied as from 2010. Data not comparable with previous years.m Includes hidden unemployment.n Since 2010, data of Asunción and the Central Department.o 2016 data correspond to the first, second and third quarters.p National total. Includes hidden unemployment. 2016 data correspond to January-April average.q National total. Includes hidden unemployment. 2016 data refer to May.r National total. Includes hidden unemployment. 2016 data correspond to an average for the first three quarters.s National total. Includes hidden unemployment.t Weighted average, adjusted for lack of information and methodological differences and changes. Includes an adjustment for the exclusion of hidden unemployment in Colombia,
Eduador, Jamaica and Panama. The 2016 average includes non-definitive data from some countries and is therefore not comparable with previous years.
Table A1.1 (concluded)

Employment Situation in Latin America and the Caribbean 33
Table A1.2LATIN AMERICA AND THE CARIBBEAN: ANNUAL AVERAGE URBAN PARTICIPATION RATE, 2005-2016
(Percentages)
Country 2005 2006 2007 2008 2009 2010 2011 2012 2013 2014 2015 2016a
Latin America
Argentinab 59.9 60.3 59.5 58.8 59.3 58.9 59.5 59.3 58.9 58.3 57.7 57.5
Bolivia (Plurinational State of) 55.7 58.7 57.1 58.8 60.5 … 59.7 57.0 58.4 59.4 56.2 …
Brazilc 56.6 56.9 56.9 57.0 56.7 57.1 57.1 63.1 63.4 62.8 62.8 63.7
Chiled 53.8 55.0 55.4 56.6 56.5 59.1 60.3 59.9 59.7 60.0 60.0 59.7
Colombiae 61.7 60.6 60.2 60.6 62.9 64.1 65.2 66.0 65.8 66.0 66.3 65.9
Costa Ricaf 58.2 58.2 58.5 58.6 62.3 60.7 62.6 64.5 63.3 64.0 62.7 59.3
Cubag 72.1 72.1 73.7 74.7 75.4 74.9 76.1 74.2 72.9 71.9 69.1 …
Dominican Republich 62.8 62.7 62.1 62.3 60.0 61.1 62.5 63.6 63.7 63.5 64.0 64.3
Ecuadori 59.5 59.1 69.1 67.7 66.3 64.2 62.2 62.8 61.8 62.2 64.1 65.7
El Salvadorj 54.3 53.9 63.6 64.1 64.3 64.4 63.7 64.6 65.1 64.6 63.5 …
Guatemala … … … … … 65.2 61.0 65.5 61.9 62.7 62.9 62.7
Honduras 50.3 52.1 51.7 52.7 53.1 53.7 52.5 51.2 54.3 55.7 56.9 57.4
Mexico 60.4 61.5 61.4 61.3 61.1 60.8 61.0 61.6 61.6 60.9 60.8 60.8
Nicaraguak 52.1 53.1 50.7 53.8 52.1 71.6 74.2 75.2 … … … …
Panamal 63.7 62.8 62.6 64.4 64.4 64.0 63.2 63.6 64.1 64.3 64.5 64.6
Paraguay m 60.4 57.9 59.6 61.5 62.3 63.9 64.7 64.7 66.6 65.5 66.0 66.3
Perun 67.3 68.5 71.0 71.1 71.2 71.6 71.6 71.5 71.2 70.0 69.4 69.4
Uruguay 58.5 60.8 62.9 62.8 63.6 63.5 65.0 64.0 63.6 64.8 64.0 63.8
Venezuela (Bolivarian Republic of)o 66.3 65.4 64.8 64.8 65.0 64.6 64.4 64.0 64.3 65.1 63.7 62.9
The Caribbean
Bahamas p 76.3 75.1 76.2 76.3 73.4 … 72.1 72.5 73.2 73.7 74.3 76.9
Barbadosq 69.6 67.9 67.8 67.6 67.0 66.6 67.6 66.2 66.7 63.9 65.1 66.6
Belizer 59.4 57.6 61.2 59.2 … … … 65.8 64.0 63.6 63.2 64.0
Jamaicar 64.2 64.7 64.9 65.4 63.5 62.4 61.7 61.9 63.0 62.8 63.1 64.8
Trinidad and Tobagoq 63.7 63.9 63.5 63.5 62.7 62.1 61.3 61.8 61.3 61.9 60.6 60.1
Latin American and the Caribbeans 62.7 62.9 63.1 63.3 63.5 63.3 63.1 63.2 63.2 62.8 62.7 62.9
Source: Economic Commission for Latin America and the Caribbean (ECLAC) and International Labour Organization (ILO), on the basis of information from household surveys conducted in the respective countries.
a Preliminary figures.b Thirty-one urban agglomerates. The National Institute of Statistics and Censuses (INDEC) of Argentina does not accept the data corresponding to the period 2007-2015, and is
reviewing them. Therefore, these data are only preliminary and will be replaced when the new official data are published. 2015 data refer to an average for the first three quarters, and 2016 data refer to an average for the second, third and fourth quarters.
c Until 2011, six metropolitan regions; after 2012, 20 metropolitan regions. Data not comparable with previous years.d New measurement as from 2010. Data not comparable with previous years.e Municipal capitals. Includes hidden unemployment.f New measurement as from 2009 and 2012. Data not comparable with previous years.g National total.h 2016 data correspond to an estimate.i As from 2007, the definition of working-age population was changed from 10 years or older to 15 years or older. Includes hidden unemployment.j As from 2007, the definition of working-age population was changed from 10 years or older to 16 years or older. Includes hidden unemployment.k A new survey was applied as from 2010. Data not comparable with previous years.l Includes hidden unemployment.m Since 2010, data of Asunción and the Central Department.n 2016 data correspond to the first, second and third quarters.o National total. Includes hidden unemployment. 2016 data correspond to January-April average.p National total. Includes hidden unemployment. 2016 data refer to May.q National total. Includes hidden unemployment. 2016 data correspond to an average for the first three quarters.r National total. Includes hidden unemployment. s Weighted average, adjusted for lack of information and methodological differences and changes. Includes an adjustment for the exclusion of hidden unemployment in Colombia,
Eduador, Jamaica and Panama. The 2016 average includes non-definitive data from some countries and is therefore not comparable with previous years.
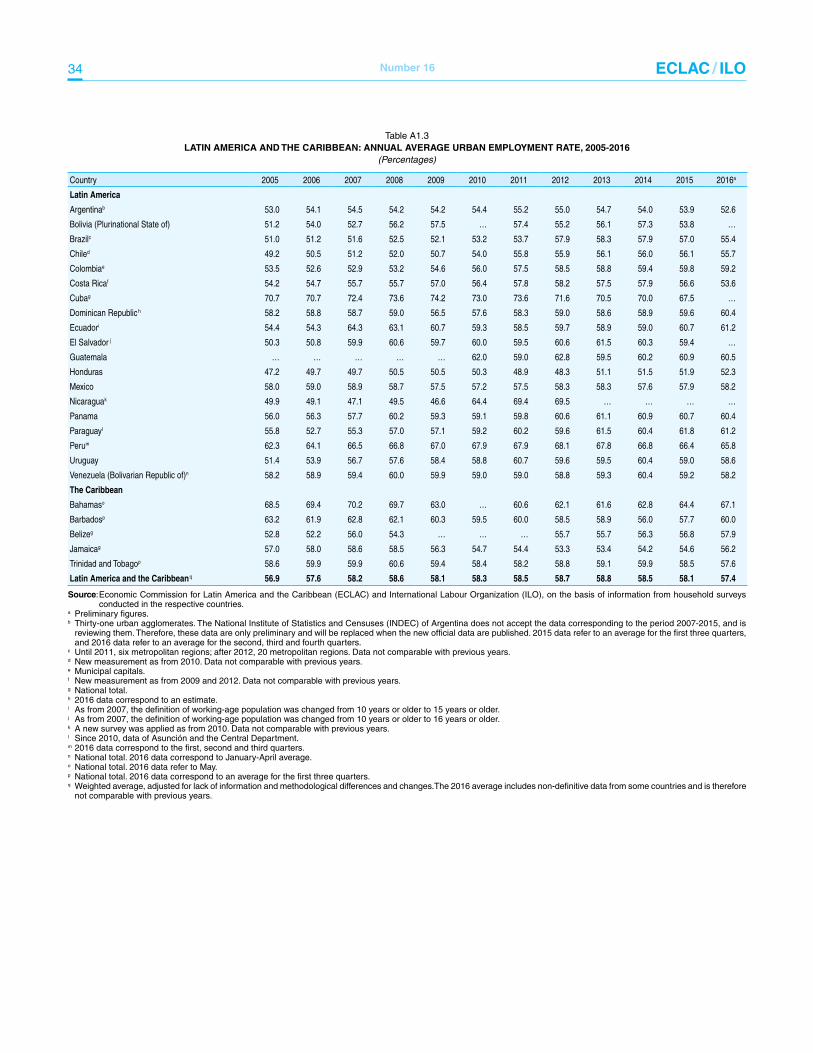
34 ECLAC / ILONumber 16
Table A1.3LATIN AMERICA AND THE CARIBBEAN: ANNUAL AVERAGE URBAN EMPLOYMENT RATE, 2005-2016
(Percentages)
Country 2005 2006 2007 2008 2009 2010 2011 2012 2013 2014 2015 2016a
Latin America
Argentinab 53.0 54.1 54.5 54.2 54.2 54.4 55.2 55.0 54.7 54.0 53.9 52.6
Bolivia (Plurinational State of) 51.2 54.0 52.7 56.2 57.5 … 57.4 55.2 56.1 57.3 53.8 …
Brazilc 51.0 51.2 51.6 52.5 52.1 53.2 53.7 57.9 58.3 57.9 57.0 55.4
Chiled 49.2 50.5 51.2 52.0 50.7 54.0 55.8 55.9 56.1 56.0 56.1 55.7
Colombiae 53.5 52.6 52.9 53.2 54.6 56.0 57.5 58.5 58.8 59.4 59.8 59.2
Costa Ricaf 54.2 54.7 55.7 55.7 57.0 56.4 57.8 58.2 57.5 57.9 56.6 53.6
Cubag 70.7 70.7 72.4 73.6 74.2 73.0 73.6 71.6 70.5 70.0 67.5 …
Dominican Republic h 58.2 58.8 58.7 59.0 56.5 57.6 58.3 59.0 58.6 58.9 59.6 60.4
Ecuadori 54.4 54.3 64.3 63.1 60.7 59.3 58.5 59.7 58.9 59.0 60.7 61.2
El Salvador j 50.3 50.8 59.9 60.6 59.7 60.0 59.5 60.6 61.5 60.3 59.4 …
Guatemala … … … … … 62.0 59.0 62.8 59.5 60.2 60.9 60.5
Honduras 47.2 49.7 49.7 50.5 50.5 50.3 48.9 48.3 51.1 51.5 51.9 52.3
Mexico 58.0 59.0 58.9 58.7 57.5 57.2 57.5 58.3 58.3 57.6 57.9 58.2
Nicaraguak 49.9 49.1 47.1 49.5 46.6 64.4 69.4 69.5 … … … …
Panama 56.0 56.3 57.7 60.2 59.3 59.1 59.8 60.6 61.1 60.9 60.7 60.4
Paraguayl 55.8 52.7 55.3 57.0 57.1 59.2 60.2 59.6 61.5 60.4 61.8 61.2
Perum 62.3 64.1 66.5 66.8 67.0 67.9 67.9 68.1 67.8 66.8 66.4 65.8
Uruguay 51.4 53.9 56.7 57.6 58.4 58.8 60.7 59.6 59.5 60.4 59.0 58.6
Venezuela (Bolivarian Republic of)n 58.2 58.9 59.4 60.0 59.9 59.0 59.0 58.8 59.3 60.4 59.2 58.2
The Caribbean
Bahamaso 68.5 69.4 70.2 69.7 63.0 … 60.6 62.1 61.6 62.8 64.4 67.1
Barbadosp 63.2 61.9 62.8 62.1 60.3 59.5 60.0 58.5 58.9 56.0 57.7 60.0
Belizeg 52.8 52.2 56.0 54.3 … … … 55.7 55.7 56.3 56.8 57.9
Jamaicag 57.0 58.0 58.6 58.5 56.3 54.7 54.4 53.3 53.4 54.2 54.6 56.2
Trinidad and Tobagop 58.6 59.9 59.9 60.6 59.4 58.4 58.2 58.8 59.1 59.9 58.5 57.6
Latin America and the Caribbean q 56.9 57.6 58.2 58.6 58.1 58.3 58.5 58.7 58.8 58.5 58.1 57.4
Source: Economic Commission for Latin America and the Caribbean (ECLAC) and International Labour Organization (ILO), on the basis of information from household surveys conducted in the respective countries.
a Preliminary figures.b Thirty-one urban agglomerates. The National Institute of Statistics and Censuses (INDEC) of Argentina does not accept the data corresponding to the period 2007-2015, and is
reviewing them. Therefore, these data are only preliminary and will be replaced when the new official data are published. 2015 data refer to an average for the first three quarters, and 2016 data refer to an average for the second, third and fourth quarters.
c Until 2011, six metropolitan regions; after 2012, 20 metropolitan regions. Data not comparable with previous years.d New measurement as from 2010. Data not comparable with previous years.e Municipal capitals. f New measurement as from 2009 and 2012. Data not comparable with previous years.g National total.h 2016 data correspond to an estimate.i As from 2007, the definition of working-age population was changed from 10 years or older to 15 years or older.j As from 2007, the definition of working-age population was changed from 10 years or older to 16 years or older.k A new survey was applied as from 2010. Data not comparable with previous years.l Since 2010, data of Asunción and the Central Department.m 2016 data correspond to the first, second and third quarters.n National total. 2016 data correspond to January-April average.o National total. 2016 data refer to May.p National total. 2016 data correspond to an average for the first three quarters.q Weighted average, adjusted for lack of information and methodological differences and changes.The 2016 average includes non-definitive data from some countries and is therefore
not comparable with previous years.

In 2016, Latin America and the Caribbean saw the largest rise in urban unemployment in the last two decades. Although much of the increase, from 7.3% in 2015 to 8.9% in 2016, reflected the performance of the Brazilian labour market, labour indicators deteriorated in most of the other countries as well. The quality of employment, too, has deteriorated, with new jobs concentrated in lower-wage occupations in which labour conditions tend to be more precarious. These labour trends give serious grounds for concern, given that employment is the key to reducing the poverty and severe inequality that dog this region. In fact, the region’s progress in combating both poverty and inequality has already slowed. Efforts must therefore be redoubled to promote sustained, inclusive and sustainable economic growth, full and productive employment and decent work for all, as called for in Sustainable Development Goal 8.
The downturn in labour conditions tends to hit the most vulnerable groups the hardest. This includes women and young people with low levels of education and immigrants, many of whom work in precarious occupations. The second part of this report analyses the labour situation of immigrants in Latin American countries. It finds significant differences between countries that have experienced relatively recent influxes of migrants and those where labour immigration is less significant or was more substantial in the past. Most immigrants entering countries with large migratory inflows are less educated than the native-born population and tend to enter lower-skilled occupations and segments that are less sought after by locals. In those cases, immigrants earn lower incomes than the employed native-born population and work in highly informal conditions, with much lower levels of social security coverage.
Related Documents