Laboratory Studies of Atmospherically Important Gas- Phase Peroxy Radical Reactions Thesis by Lance E. Christensen In partial fulfillment of the requirements for the Degree of Doctor of Philosophy California Institute of Technology 2002

Welcome message from author
This document is posted to help you gain knowledge. Please leave a comment to let me know what you think about it! Share it to your friends and learn new things together.
Transcript
Laboratory Studies of Atmospherically Important Gas-
Phase Peroxy Radical Reactions
Thesis by
Lance E. Christensen
In partial fulfillment of the requirements
for the Degree of Doctor of Philosophy
California Institute of Technology
2002

© 2002
Lance Christensen
All Rights Reserved
i
Abstract
Peroxy radicals (HO2, RO2) are important intermediates in Earths atmosphere.
They are intermediates in the oxidation of alkanes and CO in combustion and
atmospheric chemical processes. In earths atmosphere, the rates of their self and cross
reactions are often the dominant loss processes when NOx concentrations fall below tens
of pptv. These reactions have proven difficult to study in laboratory experiments, due to
complex secondary chemistry and ambiguities in radical detection.
This thesis describes a new laser-photolysis apparatus to measure the rates of
peroxy radical reactions under atmospheric conditions that employs simultaneous UV
direct absorption and IR wavelength-modulation spectroscopy to detect the peroxy
radicals. Prior kinetic measurements of gas-phase peroxy radical reactions have typically
employed flash-photolysis methods coupled with detection of the radicals only by UV
absorption spectroscopy. However, uncertainties can arise because several different
species often contribute to the absorption signal. The IR channel provides an
independent means of monitoring HO2 radicals by detection of specific rovibrational
transitions.
With this apparatus, the rates of the reactions HO2 + NO2, HO2 + CH3O2, CH3O2
+ CH3O2, and HO2 + HO2 were studied at temperatures from 219 K to 300 K. Our
measurements have, in some cases, led to significant revision of previously accepted rate
constants, mechanisms, or product yields, especially at conditions relevant to the upper
atmosphere. The new rate coefficients for the HO2 + HO2 reaction are shown to account

ii
for a long-standing discrepancy in modeled vs. observed hydrogen peroxide in the
stratosphere.
A key finding has been the observation that many previous measurements of HO2
reactions at low temperatures have suffered from problems due to complexation between
HO2 and methanol, a precursor used to generate HO2. Direct kinetic evidence is
presented for the formation of the HO2·CH3OH complex; the rate coefficients,
equilibrium constant, and enthalpy of reaction for HO2 + CH3OH, ↔ HO2·CH3OH were
measured. These results are the first direct study of the chaperone effect proposed to
explain the enhancement of the observed rates of the HO2 self-reaction by hydrogen-
bonding species.
The effects of methanol enhancement on the HO2 + NO2, HO2 + CH3O2, CH3O2 +
CH3O2, and HO2 + HO2 reaction rates were measured. For the HO2 + NO2 reaction,
overlapping, time-dependent signals in the UV due to the equilibrium between NO2 and
N2O4 were observed that may not have been properly accounted for in previous
measurements. Other studies of NO2 reactions conducted at temperatures below 250 K
may be subject to similar errors. In the CH3O2 + CH3O2 reaction, detection of HO2
products has raised questions concerning the product yields and reaction mechanisms.
iii
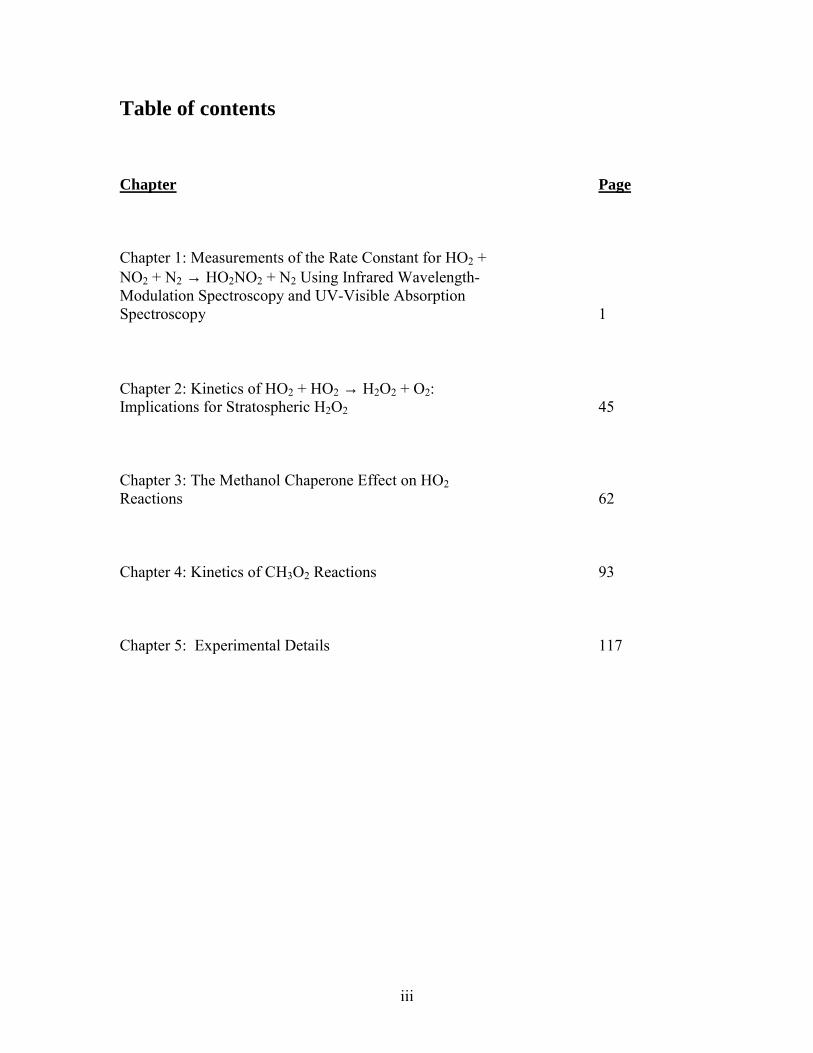
Table of contents Chapter Page Chapter 1: Measurements of the Rate Constant for HO2 + NO2 + N2 → HO2NO2 + N2 Using Infrared Wavelength-Modulation Spectroscopy and UV-Visible Absorption Spectroscopy 1 Chapter 2: Kinetics of HO2 + HO2 → H2O2 + O2: Implications for Stratospheric H2O2 45 Chapter 3: The Methanol Chaperone Effect on HO2 Reactions 62 Chapter 4: Kinetics of CH3O2 Reactions 93 Chapter 5: Experimental Details 117

iv
List of Tables Chapter 1. Measurements of the Rate Constant for HO2 + NO2 + N2 → HO2NO2 Using Infrared Wavelength-Modulation Spectroscopy and UV- Visible Absorption Spectroscopy. 1.1 Cross sections for various species.......................................................... 28 1.2 Relevant reactions................................................................................... 29 1.3 Fitted values at different temperatures.................................................... 30 1.4 Fitted values for Troe equation............................................................... 31 Chapter 2. Kinetics of HO2 + HO2 → H2O2 + O2: Implications for Stratospheric H2O2. 2.1 Experimental conditions......................................................................... 57 Chapter 3. The Methanol Chaperone Effect of HO2 Reactions. 3.1 Relevant reactions................................................................................... 82 3.2 Experimental conditions......................................................................... 83 3.3 Values of Keq, k7, and k-7......................................................................... 84 Chapter 4. Kinetics of CH3O2 Reactions. 4.1 Experimental conditions......................................................................... 104 4.2 Reaction mechanism............................................................................... 105 4.3 Values of k2 and α................................................................................... 106 4.4 Measurements of k1................................................................................. 107

v
List of Figures Chapter 1. Measurements of the Rate Constant for HO2 + NO2 + N2 → HO2NO2 Using Infrared Wavelength-Modulation Spectroscopy and UV- Visible Absorption Spectroscopy. 1.1 Experimental apparatus........................................................................... 32 1.2 Simulated UV absorbances at 369.50 nm using FACSIMILE............... 33 1.3 Decay of [HO2] due to the HO2 + NO2 reaction at different [CH3OH] at 231 K............................................................................. 34 1.4 k′ versus [CH3OH] for various [NO2] at 231 K, 100 Torr...................... 35 1.5 k′o versus [NO2].......................................................................................36 1.6 k1 versus T compared with the NASA recommendation and expected rate if the HO2 + NO2 reaction were studied using [CH3OH] = 3 × 10¹⁵ molecules cm-3..................................................................... 37 1.7 k″ versus [NO2]....................................................................................... 38 1.8 k″o and k versus T-1................................................................................ 39 1.9.1 Comparison of UV and IR signals at 298 K........................................ 40 1.9.2 Comparison of UV and IR signals at 231 K........................................ 41 1.10 k′ versus [NO2]...................................................................................... 42 1.11 Measured rates of k1 from the present work using [CH3OH] = 4 × 10¹⁴ molecules cm-3 compared with the NASA recommended values.......................................................................... 43 1.12 Comparison of NASA recommended k1 versus k1 from new
parameterization employing the kinetic data from this work with previous studies in which only measurements in which the influence of methanol was insignificant were used........................... 44
Chapter 2. Kinetics of HO2 + HO2 → H2O2 + O2: Implications for Stratospheric H2O2. 2.1 Plot of kobs as a function of [CH3OH] at 231 K and 295 K..................... 58 2.2 Plot of the rate constant of reaction (1) as a function of inverse
temperature at 100 Torr..................................................................... 59 2.3 Plot of k″ as a function of inverse temperature from the present
study at 100 Torr and from the Andersson et al. study at 760 Torr............................................................................................. 60
2.4 Measured and modeled profiles of H2O2 VMR for two seasons near Ft. Sumner, NM (34.5°N).......................................................... 61

vi
Chapter 3. The Methanol Chaperone Effect of HO2 Reactions. 3.1 Time dependence of HO2 signal at different methanol
concentrations at 251 K, 100 Torr..................................................... 85 3.2 The Dependence of [HO2]o/[HO2]eq on Methanol Concentration
at 231 K and 261 K............................................................................ 86 3.3 Comparisons of experimentally measured and theoretically
calculated Kc...................................................................................... 87 3.4 Decay of [HO2] from the reaction HO2 + CH3OH M →
HO2·CH3OH at 240 K, 100 Torr........................................................ 88 3.5 Comparisons of the observed rate coefficient for the HO2
self-reaction between the IR and UV detection channels at two different temperatures................................................................. 89
3.6.1 Typical example of the IR signal at 231 K, 100 Torr.......................... 90 3.6.2 Typical example of the UV signal at 231 K, 100 Torr........................ 91 3.7 kobs,ir and kobs,uv versus methanol concentration at 231 K, 100 Torr....... 92 Chapter 4. Kinetics of CH3O2 Reactions. 4.1.1 Time dependence of the [HO2] at different [H2]/[CH4] at 231 K,
100 Torr............................................................................................. 108 4.1.2 Time dependence of [CH3O2] at different [H2]/[CH4] at 231 K,
100 Torr............................................................................................. 109 4.2 Natural log plots of data acquired at 252 K, 100 Torr in which
the time dependence at [H2]/[CH4]=0 have been subtracted............. 110 4.3 Arrhenius Plot of k2 Versus T-1............................................................... 111 4.4.1 Fits using FACSIMILE to the time dependences of [HO2]
and [CH3O2] at 296 K........................................................................ 112 4.4.2 Fits using FACSIMILE to the time dependences of [HO2]
and [CH3O2] at 231 K........................................................................ 113 4.4.3 Comparisons of [HO2] from the CH3O2 self-reaction at 296 K
and 231 K........................................................................................... 114 4.5 Possible reaction pathways..................................................................... 115 4.6 Possible reaction pathway for formation of HO2................................... 116
vii
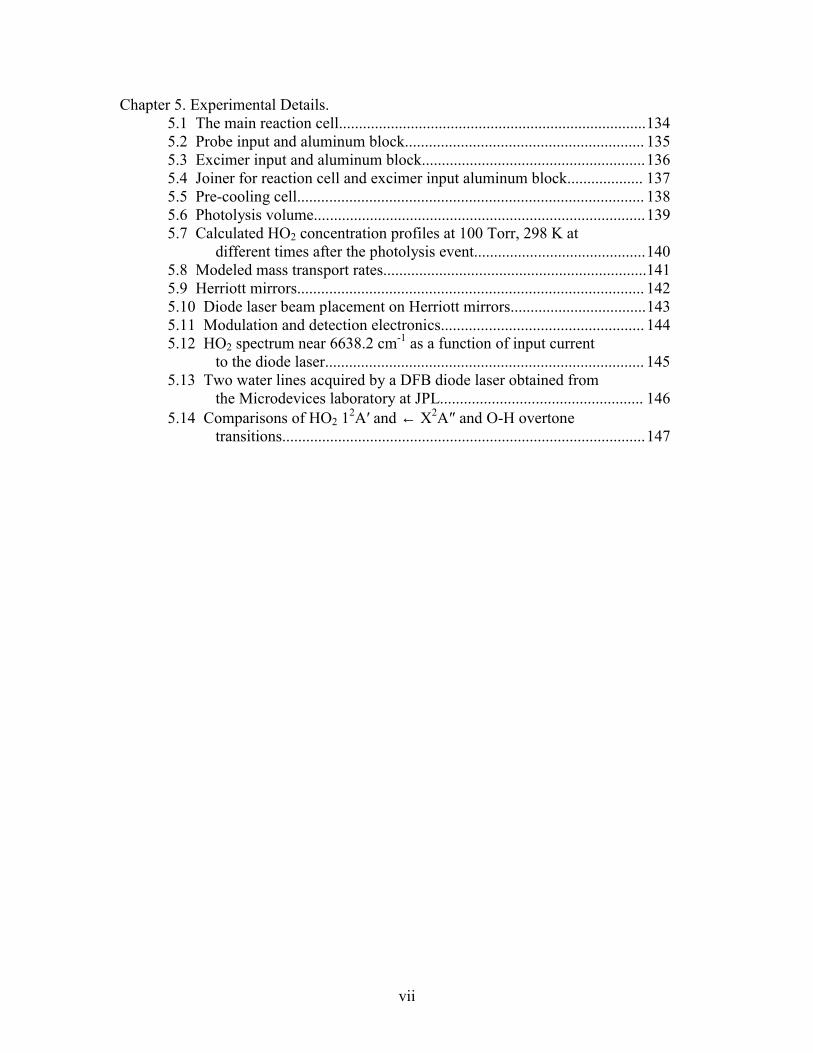
Chapter 5. Experimental Details. 5.1 The main reaction cell............................................................................. 134 5.2 Probe input and aluminum block............................................................ 135 5.3 Excimer input and aluminum block........................................................ 136 5.4 Joiner for reaction cell and excimer input aluminum block................... 137 5.5 Pre-cooling cell....................................................................................... 138 5.6 Photolysis volume................................................................................... 139 5.7 Calculated HO2 concentration profiles at 100 Torr, 298 K at different times after the photolysis event........................................... 140 5.8 Modeled mass transport rates..................................................................141 5.9 Herriott mirrors....................................................................................... 142 5.10 Diode laser beam placement on Herriott mirrors.................................. 143 5.11 Modulation and detection electronics................................................... 144 5.12 HO2 spectrum near 6638.2 cm-1 as a function of input current to the diode laser................................................................................ 145 5.13 Two water lines acquired by a DFB diode laser obtained from the Microdevices laboratory at JPL................................................... 146 5.14 Comparisons of HO2 12A′ and ← X2A″ and O-H overtone transitions........................................................................................... 147
1
Chapter 1: Measurements of the Rate Constant for HO2
+ NO2 + N2 →→→→ HO2NO2 + N2 Using Infrared
Wavelength-Modulation Spectroscopy and UV-Visible
Absorption Spectroscopy
1.1 Introduction
The reaction between HO2 and NO2 has been the subject of numerous laboratory
studies1-10 and proceeds as
M2 2 2 2HO + NO HO NO → (1)
From the upper troposphere through the middle stratosphere, the thermal lifetime of
HO2NO2 is sufficiently long that reaction with OH is a significant loss process for
HO2NO2. This establishes a NO2 driven catalytic cycle that is an important sink for
HOx.11
M2 2 2 2HO + NO HO NO → (1)
2 2 2 2 2OH + HO NO H O + NO + O → (2)
2 2 2OH + HO H O + O → (3)
2
Measurements of HO2NO2 from space12 and balloon-borne13 platforms have enabled
researchers to test our understanding of atmospheric processes involving HO2NO2.
Accurate measurements of k1 are thus necessary to correctly describe the chemistry of
this region of the atmosphere.
The most comprehensive studies of reaction (1) measured the time dependence of
[HO2] with UV spectroscopy and utilized CH3OH as a precursor for HO2.8-10 These
studies have had the greatest influence on current recommendations.14,15 In these previous
studies, the rate of reaction (1) was measured under conditions where an appreciable
fraction of HO2 would be hydrogen-bonded to CH3OH, namely low temperatures (<
273 K) and/or high [CH3OH]. It has been shown16,17 that CH3OH can significantly
enhance the observed rate of the reaction
bi-molecular2 2 2 2 2ter-molecularHO + HO H O + O → (4)
under these conditions. A similar enhancement for reaction (1) might also be expected.
This would suggest that the NASA recommended rates are too high at low temperatures.
This paper details kinetic studies of reaction (1) using simultaneous UV and IR
detection. The effect of CH3OH on reaction (1) was measured. Detection of HO2 in the
IR provided a method of measuring k1 that avoided overlapping absorptions from several
species, a problem associated with measurements in the UV. In addition, the use of
heterodyne detection for the IR channel resulted in considerably improved signal-to-noise
compared with the UV channel.

3
1.2 Experimental
1.2.1 Apparatus
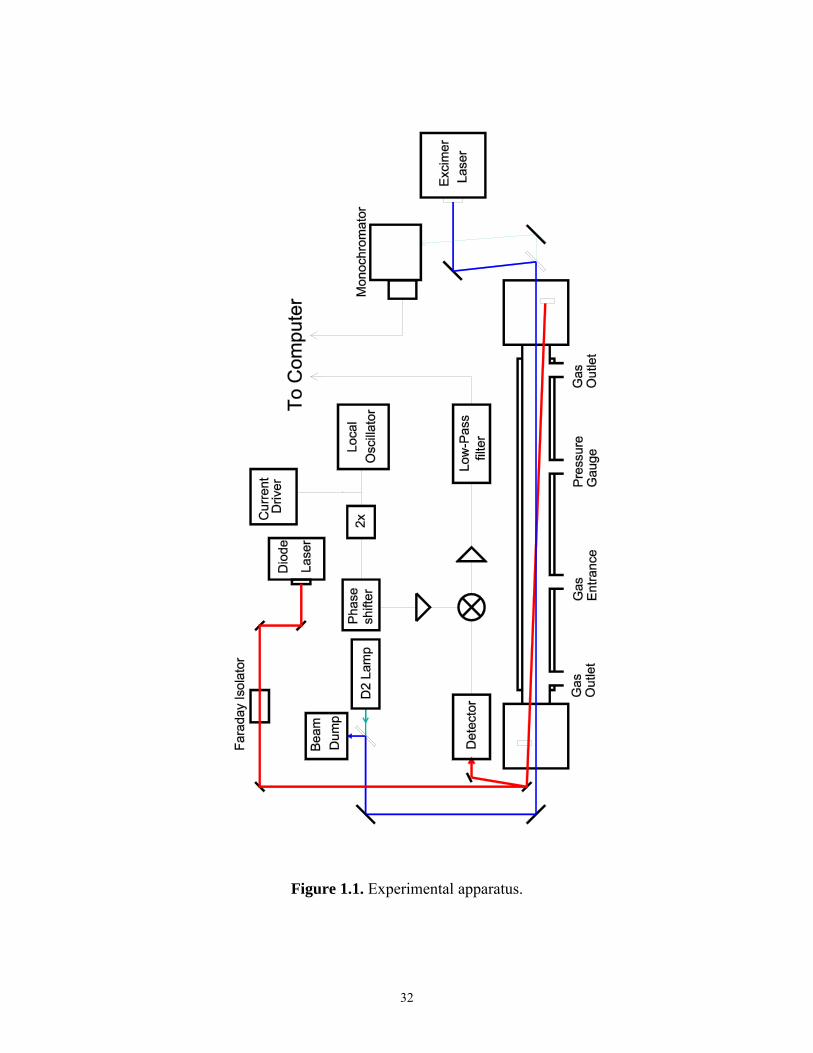
Figure 1.1 is a schematic diagram of the experimental apparatus. A XeCl pulsed
excimer laser (308 nm) was used to photolyze either F2 or Cl2, which reacted with other
reagents to form the species of interest. The concentrations of the species of interest were
monitored with simultaneous IR heterodyne and UV-visible direct absorption
spectroscopy.
The reaction cell was a 175 cm long, 5 cm diameter Pyrex cylinder supported at
each end by aluminum chambers. An insulated jacket surrounded the reaction cell
through which flowed methanol chilled by a liquid-nitrogen cooled heat exchanger.
Thermocouples located inside the reaction cell allowed the temperature to be measured to
within ± 1 K. Reagent gases were cooled in a meter-long mixing tube prior to entering
the main reaction cell. They entered from the middle of the main reaction cell and flowed
towards the outlet ports. N2 confinement gas flowing from both aluminum chambers
restricted the reactants to a region 135 ± 1 cm long between the outlet ports. Tests were
performed to ensure the extent of confinement by flowing gas mixtures containing known
amounts of Cl2 and NO2 through the reagent entrance port. In these tests, the Cl2
absorbance at 330 nm and NO2 absorbance at 369.50 nm was measured. The effective
path length was calculated using a Beers Law analysis and tabulated absorption cross
sections.18 These tests were conducted over the range of pressures and flow rates utilized
in the experiment. They confirmed that the reagent gases were contained between the two
4
exit ports with an effective path length matching the separation between the middle of the
two ports to within 1 cm.
The excimer photolysis pulse entered the cell through a CaF2 window on one of
the aluminum chambers. The 20 ns pulses had a 2 cm by 1 cm rectangular cross section.
The pulse energy ranged from 60 mJ to 150 mJ. The pulses passed through the middle of
the cell, creating a 2 cm by 1 cm by 138 cm photolysis region. An unstable optical
resonator configuration was used in the excimer laser to ensure good collimation of the
photolysis beam.
Light from a deuterium (D2) lamp and an IR diode laser entered the apparatus
through a 30′ wedged CaF2 window on the other aluminum chamber. Light from the D2
lamp made one pass through the photolysis volume and was focused onto the entrance slit
of a monochromater (Acton SpectraPro 300i). A PMT was mounted at the exit slit.
Baffles in both aluminum chambers ensured that only UV light that had sampled the
photolysis volume entered the monochromater.
For the present experiment, several species were formed which absorb in the UV.
The detectable species were HO2, NO2, N2O4, H2O2, HO2NO2, ClNO2, and ClONO. Their
cross sections at various wavelengths are given in Table 1.1. The monochromater was set
to 369.50 nm for experiments conducted at temperatures of 230 K and higher and
381.875 nm for experiments at 219 K. The 369.50 nm NO2 cross section at 298 K was
5.23 × 10⁻¹⁹ cm2 with a temperature dependence of -1.1 × 10⁻²² cm2 K-1.19,20 The
381.875 nm NO2 cross section at 298 K was taken to be 5.62 × 10⁻¹⁹ cm2 with a
temperature dependence of -8.7 × 10⁻²³ cm2 K-1.19,20 The reason for the change in UV
wavelengths was to minimize absorbance by N2O4 at low temperature.

5
The IR source was a 3 mW distributed-feedback (DFB), continuous wave tunable
diode laser manufactured by the JPL Microdevices Laboratory. The laser current was
modulated at 6.80 MHz through an external bias tee. The beam passed through a small
opening in a gold-coated mirror with a 2032 mm radius of curvature located in one
aluminum chamber and impinged on a similar mirror in the other chamber positioned
1820 mm from the input mirror. These two mirrors formed a Herriott cell21,22 that folded
the IR beam, resulting in 30 passes through the photolysis volume. The beam was inside
the photolysis volume for approximately 1/2 the length of a single pass between mirrors.
The effective path length of the IR beam was approximately 2000 cm as determined by
visual inspection of where overlap occurred. This was maximized by placing the Herriott
mirrors as close to the path of the excimer beam as possible. The signal from the InGaAs
photodiode detector was demodulated at 13.6 MHz (2f detection) and low-pass filtered.
The filter frequency was determined by the timescale of the reaction. Typically,
bandwidths greater than a factor of 5 over the pseudo-first-order HO2 loss rate were
employed. Minor adjustments of the amplitude of modulation were required to optimize
the signal when the pressure and temperature of the cell was varied.
The diode laser emitted light in the region between 6620 cm-1 and 6645 cm-1,
depending on the injection current and temperature of the diode laser. The lower
frequency limit was determined by the maximum temperature the diode laser chip could
be held at. For emission at 6620 cm-1, the temperature had to be set at around 60 ºC. At
these temperatures, the lifetime of the laser is drastically reduced. Further,
d(Power)/d(Current) becomes appreciably non-linear, introducing a significant amount of
noise into the IR detection channel. The upper limit of the laser emission frequency was
6
to prevent condensation of ambient water when the diode laser was cooled below 5 ºC.
The linewidth of the laser was approximately 20 MHz.23 This was verified by
deconvolving H2O transitions at low pressure (< 200 mTorr). For the present study, an
HO2 transition at 6638.2 cm-1 was probed. This line is assigned to the qQ2 transition (a
band head) of the first overtone of the O-H stretch.24 Another diode laser that emitted
near 7000 cm-1 (JPL Microdevices Laboratory) was also employed in the experiment but
only for a limited number of experiments at room temperature. This diode laser probed
transitions to the low-lying electronic state of HO2 (2A′ ← 2A″). No differences in the
measured kinetic parameters were observed between the two lasers. For HO2, direct
absorption measurements have suggested that the integrated band strength of the overtone
transitions absorb are stronger than the electronic transitions.25 The cross-section of the
qQ2 line at 100 Torr, 298 K was estimated to be (5 ± 3) × 10-20 cm2. This was determined
by observing that its signal was similar in strength to several of the strongest lines near
6627 cm-1, which have been assigned to the P-branch of the K″ = 0 stack.24 These lines
have been observed to have cross sections between (1 10) × 10-20 cm-2 near 60 Torr.26
The highest concentrations of HO2 employed in the present experiment were around 1 ×
1014 molecules cm-3. The absorbance for a pathlength of 2000 cm is approximately 0.01.
The difference between Beers law analysis and simply correlating the IR signal with
[HO2] is less than 1% at the maximum [HO2].
The IR and UV beams have different geometric paths, and consequently probe
different regions of the photolysis volume. The IR beam probes the central half of the
photolysis volume. The UV beam probes the whole length of the photolysis volume. A
method of testing the agreement between the two probes was devised based on
7
simultaneous measurements of the HO2 + HO2 reaction under conditions where the
concentrations of species that can hydrogen-bond with HO2 is negligible. The formula
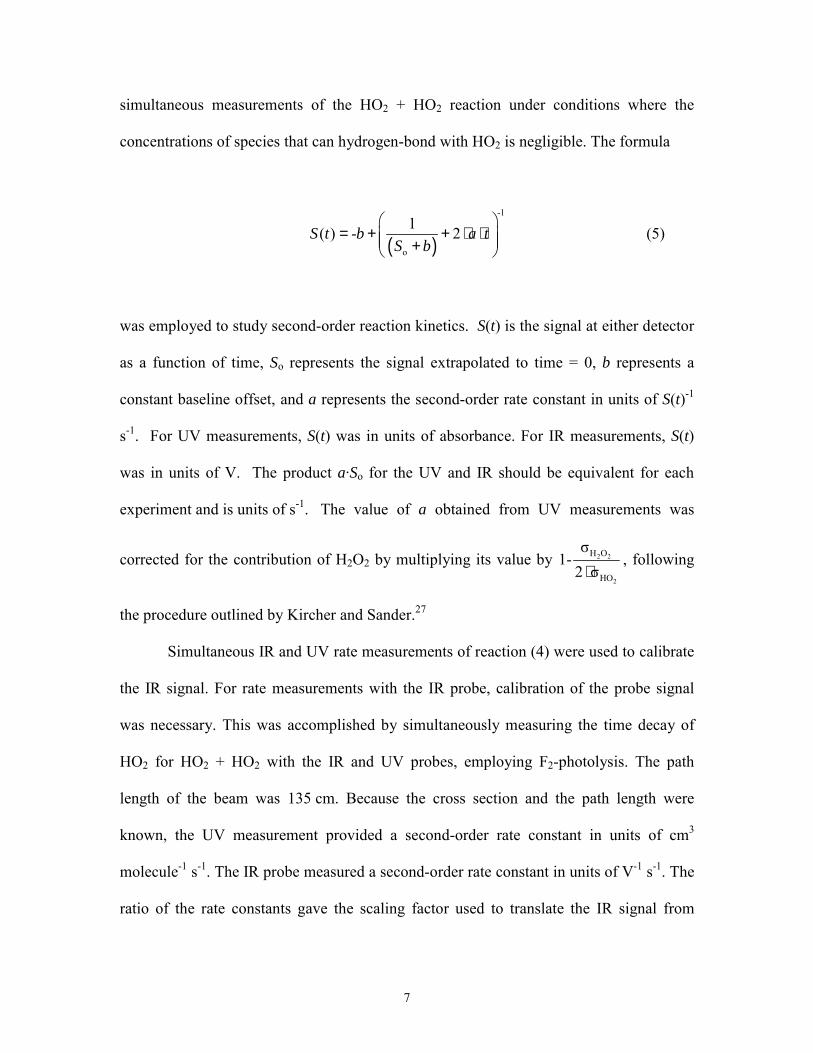
( )
-1
o
1( ) - 2S t b a tS b
= + + ⋅ ⋅ +
(5)
was employed to study second-order reaction kinetics. S(t) is the signal at either detector
as a function of time, So represents the signal extrapolated to time = 0, b represents a
constant baseline offset, and a represents the second-order rate constant in units of S(t)-1
s-1. For UV measurements, S(t) was in units of absorbance. For IR measurements, S(t)
was in units of V. The product a·So for the UV and IR should be equivalent for each
experiment and is units of s-1. The value of a obtained from UV measurements was
corrected for the contribution of H2O2 by multiplying its value by 2 2
2
H O
HO
σ1-
2 σ⋅, following
the procedure outlined by Kircher and Sander.27
Simultaneous IR and UV rate measurements of reaction (4) were used to calibrate
the IR signal. For rate measurements with the IR probe, calibration of the probe signal
was necessary. This was accomplished by simultaneously measuring the time decay of
HO2 for HO2 + HO2 with the IR and UV probes, employing F2-photolysis. The path
length of the beam was 135 cm. Because the cross section and the path length were
known, the UV measurement provided a second-order rate constant in units of cm3
molecule-1 s-1. The IR probe measured a second-order rate constant in units of V-1 s-1. The
ratio of the rate constants gave the scaling factor used to translate the IR signal from
8
Volts to units of molecules cm-3. This value ranged between (1 - 6) × 1017 molecules V-1
at the RF port of the demodulation mixer.
The photolysis volume was centrally located and wall reactions were not a
concern. However, transport of reactive species from the photolysis volume into the
surrounding gas by turbulent mixing was an important consideration. The reactions
C2H5O2 + C2H5O2 (kEtO2), and HO2 + HO2 were studied at [C2H5O2] < 1×10¹³ molecules
cm-3 and [HO2] < 5 × 10¹¹ molecules cm-3, respectively. At these concentrations,
2·kEtO2·[C2H5O2] and 2·k4·[HO2] < 2 s-1, and other loss processes, such as turbulent
mixing, can compete with loss due to chemical reaction. The measured rates for these
reactions were dependent on the residence time of the precursor gases, indicating that
turbulent mixing affected measured kinetics. As the residence time was increased, the
measured rates approached the predicted rates asymptotically. The measured first-order
loss due to turbulent mixing was between (2 - 5) s-1 for a residence time of 15 s at 298 K.
Turbulent mixing affects decreased with decreasing temperature. The residence time was
adjusted so turbulent mixing had less than a 5% effect on measured rates. The effect of
diffusion was found to be negligible compared to turbulent mixing.
Calibrated flows of reagent gases were mixed prior to entering the cell. Flow
conditions were adjusted so that the cell residence time was 3-10 s, approximately equal
to the interval between photolysis laser pulses. HO2 was formed from the reaction
sequence
2Cl 2 Clhv → (6)
3 2Cl + CH OH HCl + CH OH → (7)
9
2 2 2 2CH OH + O HO + CH O → (8)
The concentrations (molecules cm-3) of the reagents were Cl2: (2 - 6) × 1015; He: (2 - 5) ×
1016; CH3OH: (1 - 3) × 1014; O2: (2 - 7) × 1017; NO2: (6 - 50) × 1014. The buffer gas was
N2 for all experiments. The Cl2 and He came from a mixed cylinder of 10.0% Cl2 (99.5%
purity) in He (99.999%). N2 (99.9993%) was bubbled through CH3OH (A. C. S. Reagent
Grade) in a temperature-controlled saturator to obtain the desired [CH3OH]. NO2 was
prepared by mixing NO (99% purity) with a large excess of O2 (99.996%) and allowing
the mixture to stand for a day. All gases were acquired from Air Products and Chemicals,
Inc. except NO, which was acquired from Matheson Tri-Gas, Inc. The maximum [HO2]
formed in an individual experiment, denoted [HO2]max, was (5 - 8) × 1013 molecules cm-3.
The reaction between HO2 and NO2 was studied under pseudo-first-order
conditions with the value of 2 o
2 max
[NO ][HO ]
between 60 and 500. The reaction was studied
between 40 Torr and 200 Torr and 219 K to 295 K. Contributions to measured NO2
absorbance at 369.50 nm and 381.875 nm from HO2, H2O2, HO2NO2, and Cl2 were less
than 2% at all temperatures. At temperatures below 240 K for the concentrations of NO2
employed in the present experiment, a significant fraction of NO2 dimerized to N2O4. At
219 K, 2 4
2
[N O ][NO ]
reached values as high as 0.8. In order to maintain 2 4 2 4
2 2
σN O [N O ]σNO [NO ]
⋅⋅
<
0.05, NO2 was monitored at 381.875 nm for experiments at 219 K.
The excimer laser photolyzed a fraction of NO2 to produce NO + O. The fraction
was determined to be 0.0028 ± 0.0002. This was measured by photolyzing NO2 in the
presence of O2 and observing O3 formation. Davidson et al.20 has shown that at 219 K,
10
the NO2 cross-section at 308 nm is only 2% higher than at room temperature, indicating
that the fraction of NO2 dissociated by photolysis was approximately the same at all
temperatures. Knowledge of [NO] produced by photolysis of NO2 was important because
the reaction
2 2HO + NO OH + NO → (9)
can affect the measured rate of decay of HO2. The effect of reaction (9) was ascertained
by employing the kinetics modeling program FACSIMILE28 and the NASA
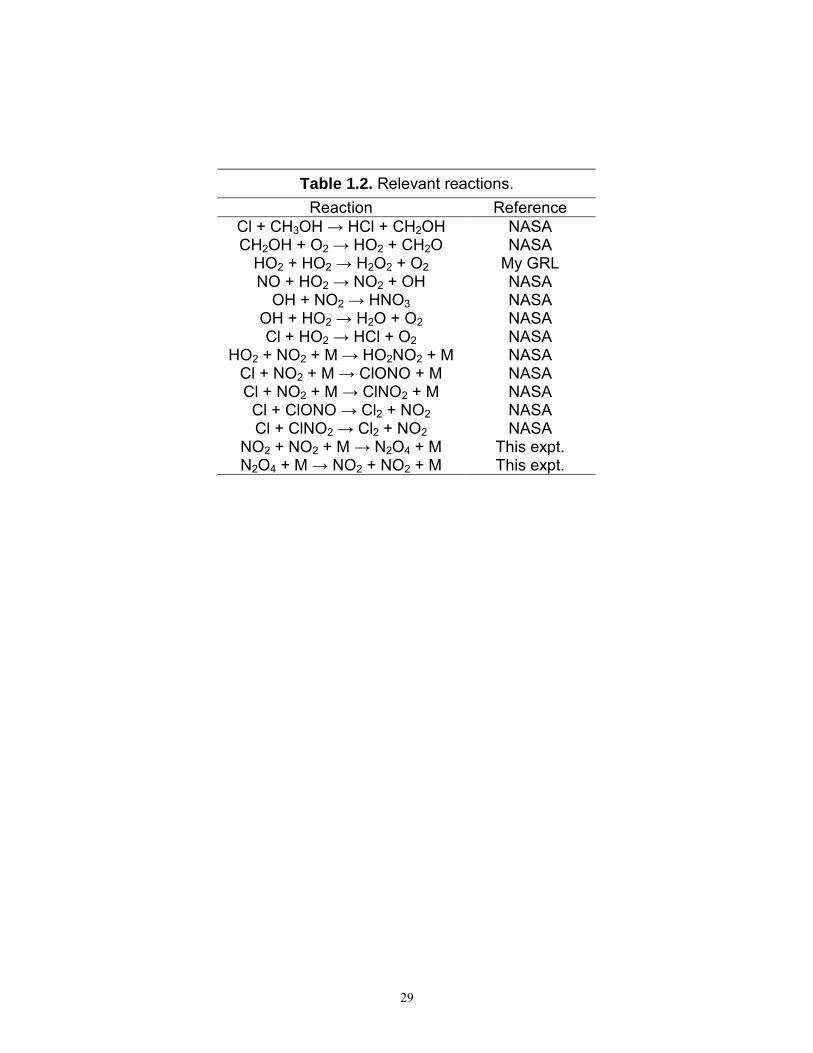
recommended18 values for the rate constants of reactions listed Table 1.2. At 50 Torr and
295 K, the ratio of the observed rate constant to the actual rate constant was calculated to
be 1.06. As pressure increases and temperature decreases, the effect of reaction (9)
diminishes, influencing the observed rate less than 1% at pressures greater than 100 Torr
at 298 K. The observed rate was influenced by less than 3% at all other temperatures and
pressures examined in the present experiment. All reported k1 values have taken this
correction into account.
1.2.2 Effect of reaction (4) on IR and UV signals
Because 2 o
2 max
[NO ][HO ]
> 60, the loss of HO2 via reaction (1) was treated as first-
order. To analyze the decay of IR and UV signals, the equation
os( ) exp(- )t A k t b= ⋅ ′ ⋅ + (10)
11
was used to fit the data, where s(t) was the absorbance signal (unitless) for the UV
channel, and demodulated voltage signal (in V) for the IR channel. Reactions (1) and (4)
are the major loss processes for HO2. Since the loss by reaction (4) was second-order, fits
to the data using equation 10 resulted in values of k′ that were dependent on 2 o
2 max
[NO ][HO ]
,
the time span in which the fitting procedure was employed, and k1([M],T). The effect of
reaction (4) on measured k1 was ascertained three different ways. First, as has been done
in prior examinations9 of k1, kinetic modeling using FACSIMILE was used to determine
the effect reaction (4) on the overall rate measurement of k1. The largest correction to k1
was a 5% decrease in the value observed at 50 Torr and 298 K. At 100 Torr, the
correction was less than 3% for all temperatures. Second, measured k1 values did not
differ by more than 5% when 2 o
2 max
[NO ][HO ]
was changed by an order of magnitude. Third, no
significant difference in the value k1 was observed when fits were conducted over
differing time intervals. This procedure was adopted because as time proceeds, the
influence of reaction (4) decreases.
A positive residual baseline signal was observed in many experiments. The
magnitude of this residual was typically less than 2% of the maximum HO2 signal. This
residual showed negligible temporal dependence and was thus assumed to be constant for
fitting purposes. The source of this residual was uncertain.
12
1.2.3 Effect of overlapping absorptions on UV signal
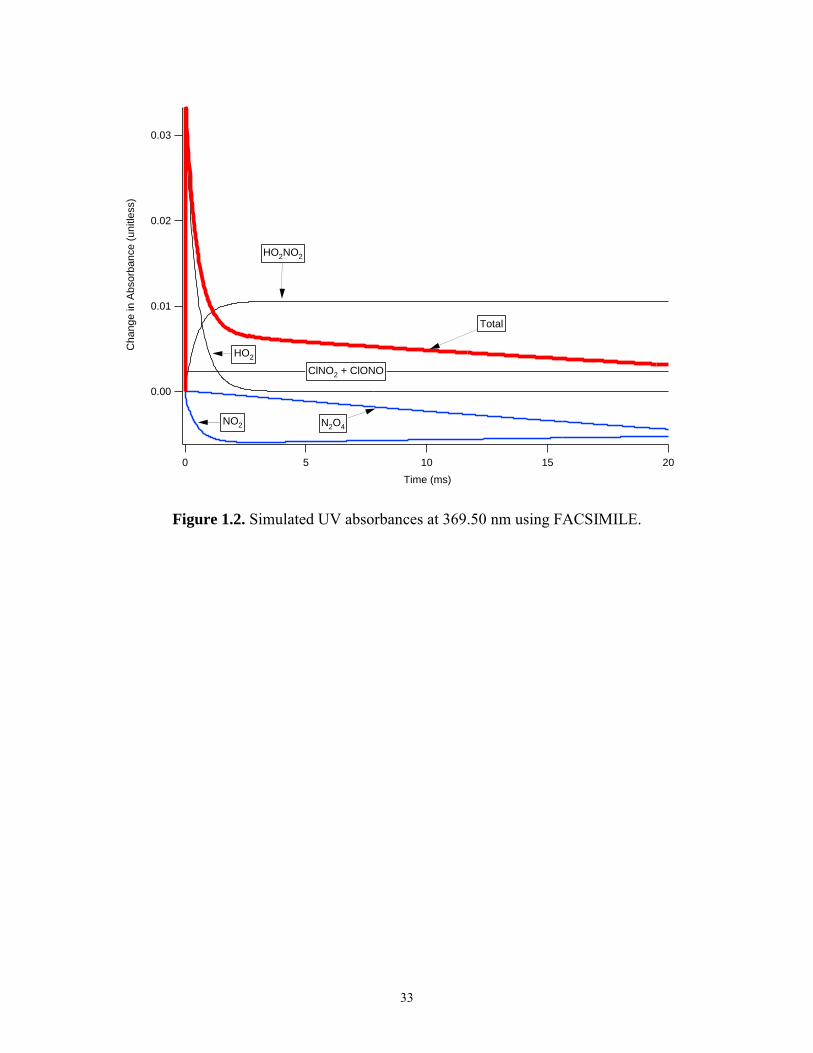
Table 1.1 lists several species and their cross sections at various UV wavelengths.
Figure 1.2 shows the contribution of these species to the UV signal at 220 nm using the
FACSIMILE kinetic modeling program and the kinetic model described in Table 1.2. The
model was computed at 231 K, 100 Torr total pressure of N2, [NO2] = 2 × 10¹⁵ molecules
cm-3, [CH3OH] = 3 × 10¹⁵ molecules cm-3. H2O2 absorbance was negligible. Combined
absorbances for ClONO and ClNO2 are shown. The cross section of ClONO at 220 nm is
not known and was assigned the value of 2.15 × 10⁻¹⁸ cm2, a value measured by Molina
and Molina29 at 235 nm. This value was chosen because the cross section of ClONO
appears to increase as wavelength decreases near 235 nm and thus would appear to be a
lower limit to the actual value at 220 nm. These figures demonstrate that the acquired UV
signal contains significant contributions from several species.
Despite overlapping absorptions, the HO2 rate of decay is equivalent to the first-
order rate of decay of the total UV signal if equation 10 is used to fit the data and if the
concentration of all species that contribute to the signal are solely dependent on reaction
(1) or are constant during the time of analysis.30
1.2.4 Secondary chemistry involving Cl + NO2 recombination
Possible complications arising from the formation of ClONO and ClNO2 were
considered as part of the data analysis. In the present experiments, these species are
formed by the reactions
M2Cl + NO ClONO → (11)
13
M2 2Cl + NO ClNO → (12)
Buildup of these species can be significant depending on the relative concentrations of
CH3OH and NO2. For example, with [CH3OH] = 2 × 10¹⁵ molecules cm-3 and [NO2] = 4
× 1015 molecules cm-3, the fraction of Cl that reacts with NO2 is 0.23 at 231 K and 100
Torr total pressure of N2. At 298 K, the corresponding fraction is 0.13. These calculations
are based on the rate constant recommendations of DeMore et al.18 and assume that
reactions (10), (11) and (12) are the only loss processes for Cl.
ClONO and ClNO2 can affect the measured rate of k1 by reacting with other
species or by undergoing unimolecular processes such as decay or isomerization. Both
species absorb strongly in the UV. In the present experiment, k1 was measured in the IR
for [Cl]max 20% of typical values. Poor signal-to-noise prevented similar measurements in
the UV. No noticeable difference between these low [Cl]max and normal [Cl]max
experiments was observed at 231 K and 298 K, indicating that the influence of Cl + NO2
on measured kinetics was negligible.
1.2.5 Sources of uncertainty
The statistical uncertainty (1σ) in the measurement of k′ due to noise in the IR
signal was approximately 2%. For the UV signal, it was approximately 5%. Error in the
photometric measurement of [NO2] due to changes in the flux of the NO2 gas mixture
from the NO2 bulb, which was due to the chance in pressure of the bulb over the course
of an experiment, was approximately 3%. Uncertainty in [CH3OH], which in turn was
due to the fluctuations in measured gas flows and temperature of the bath surrounding the
14
methanol, was 3%. The uncertainty in the measured pressure was approximately 1% and
in measured temperature was ± 1 K. The total uncertainty in the precision of the
measurements of k1(T) ranged from approximately 5% to 10%. The observed fluctuations
in measured k1(T) at 230 K and 219 K were observed to be somewhat higher, 8% to 15%,
most likely due to the errors caused by imprecision in determining [CH3OH]. The
systematic uncertainty in the cross section of NO2 at room temperature is approximately
10% at room temperature. The uncertainty in the accuracy of the vapor pressure of
methanol was 5%. These systematic uncertainties are not reported in the uncertainties
given for the measurements of any rate coefficients in the present work.
1.3 Results
It is demonstrated in Chapter 2 the Cl2-CH3OH-O2 source of HO2 can result in
kinetic complications arising from reactions of the HO2·CH3OH complex. Studies of
reaction (1) were therefore carried out to determine both the pressure and temperature
dependences of k1 and to examine the possibility that complex formation enhances the
observed reaction rate.
1.3.1 Effect of CH3OH on reaction (1)
The effect of CH3OH on the rate of reaction (1) was studied at 100 Torr for six
different temperatures ranging from 231 K to 298 K. In addition, at 231 K, the reaction
was studied at 50 Torr and 200 Torr. The observed first-order rate constant, k′, for the
decay of HO2 was measured at each temperature at 16 to 25 different combinations of

15
[NO2] and [CH3OH]. Plots of [HO2] versus time at 100 Torr, 231 K, and [NO2] = 2.80 ×
1015 molecules cm-3 are shown in Figure 1.3 for different [CH3OH].
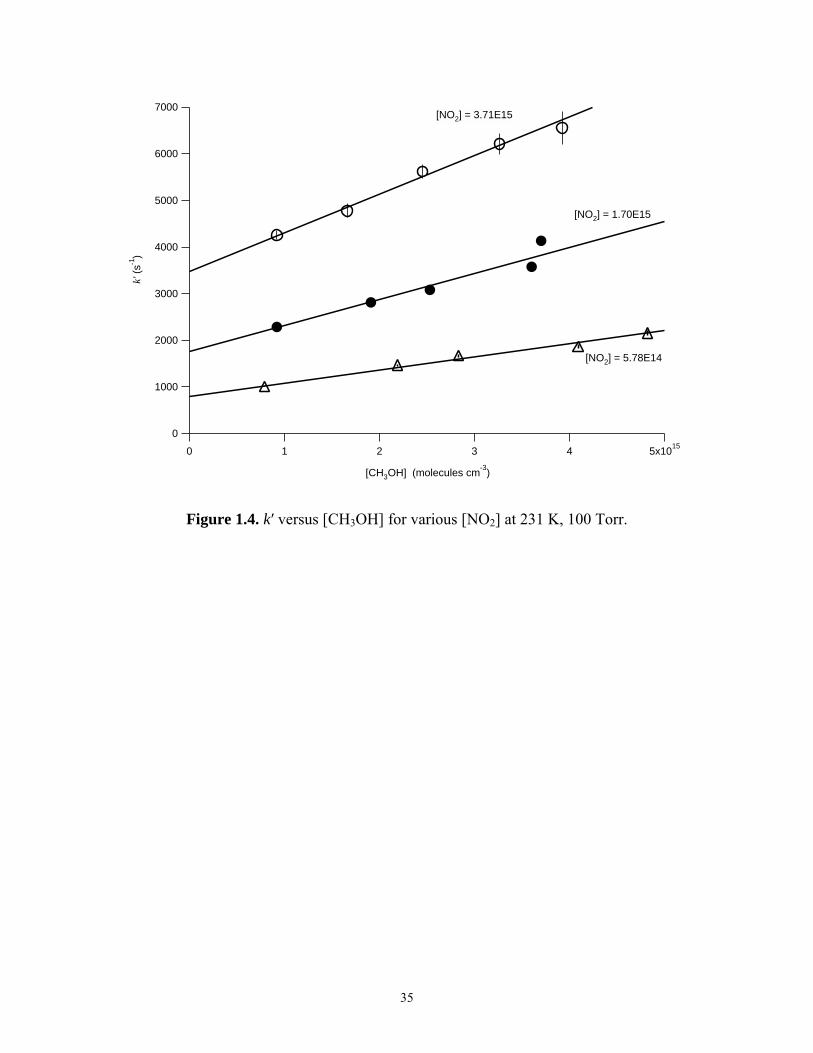
These experiments showed that there is a significant dependence on the apparent
rate of reaction (1) with [CH3OH]. The dependence of k′ on [CH3OH] for various [NO2]
is shown in Figure 1.4 at 100 Torr and 231 K. The dependence of k′ on [CH3OH] was
well described by the equation
o 3[CH OH]k k k ′′′ = ′ + ⋅ (13)
Both ko′ and k″ were both observed to be dependent on [NO2]. The value of ko′
represented the first-order rate constant at zero [CH3OH]. The value of k″ represented the
dependence of the measured first-order rate constant on [CH3OH].
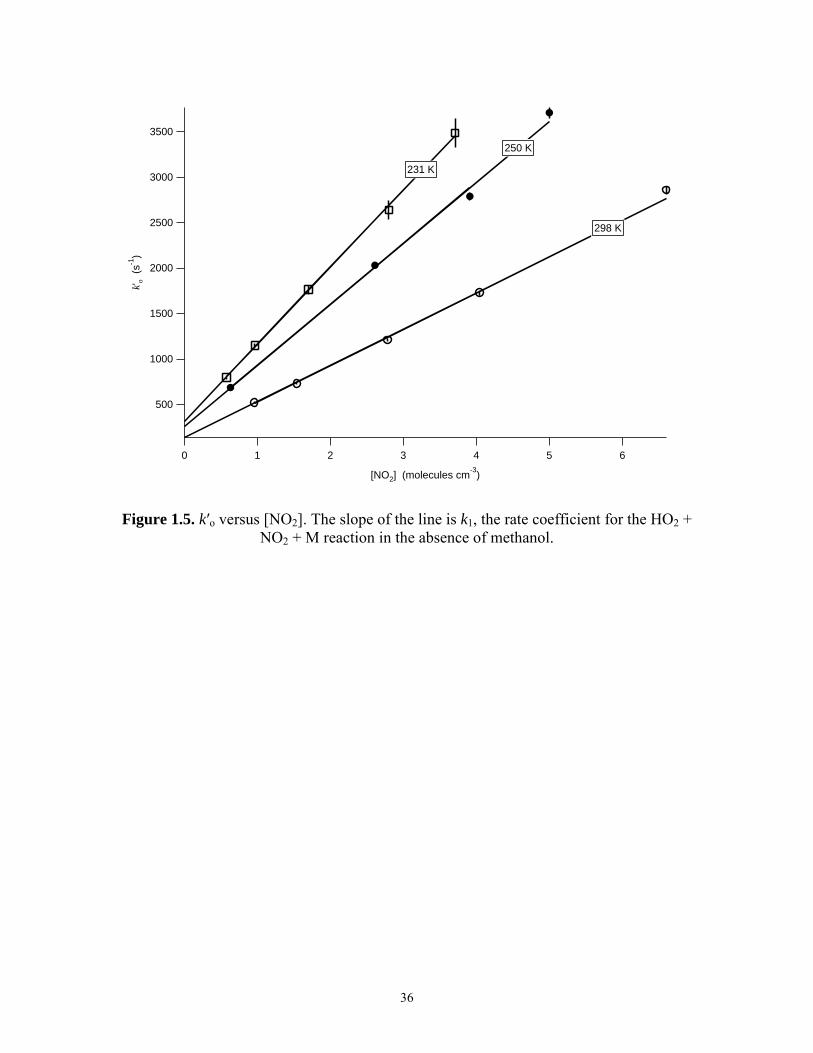
The trend of ko′ versus [NO2] was observed to be linear at all temperatures and
was analyzed with the equation
2 2o HO +HO 1 2[NO ]k k k′ = + ⋅ (14)
where kHO2+HO2 represents the contribution of the HO2 + HO2 reaction to the measurement
of k′o. The slope, k1, is the rate constant for HO2 + NO2 in the limit of zero methanol.
Figure 1.5 is a plot of k′o versus [NO2] at 100 Torr for 231 K, 250 K, and 298 K. The
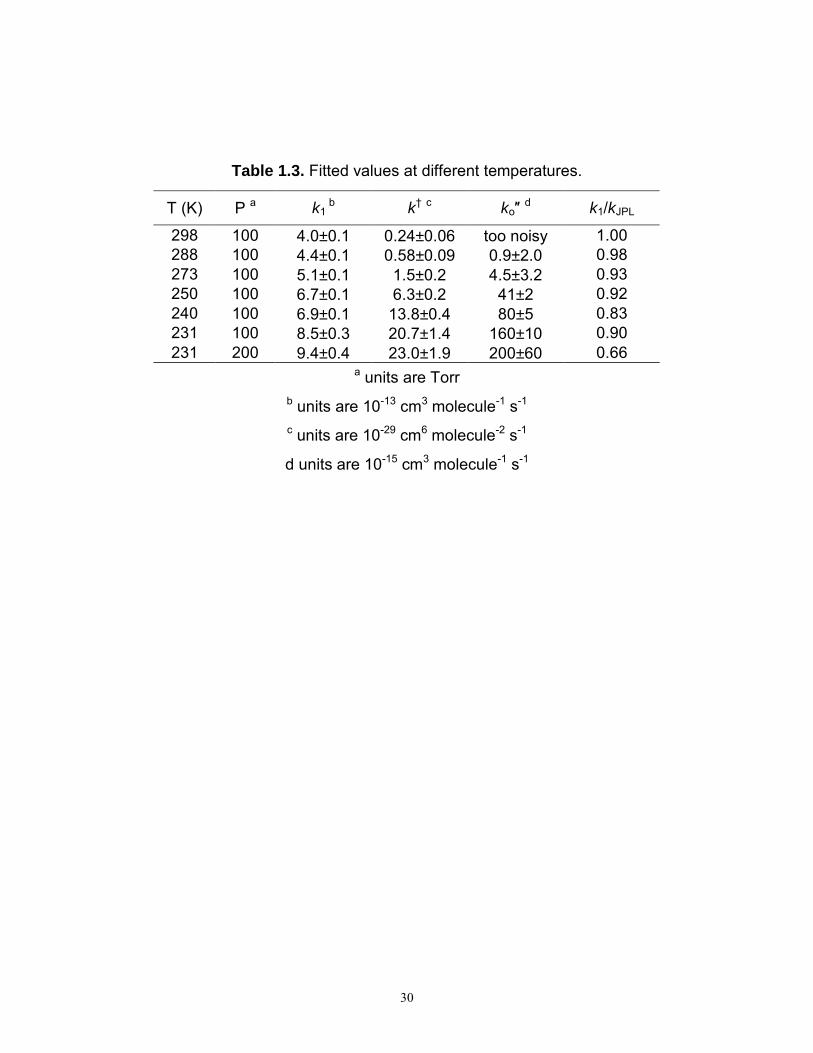
temperature dependence of k1 at 100 Torr is shown in Figure 1.6. The values of k1 are
tabulated in Table 1.3. The measured values of k1 in the present study were within 3% of
16
the NASA values at 298 K and 288 K and were approximately 14% lower than the
NASA values at 231 K, as indicated by the last column of Table 1.3.
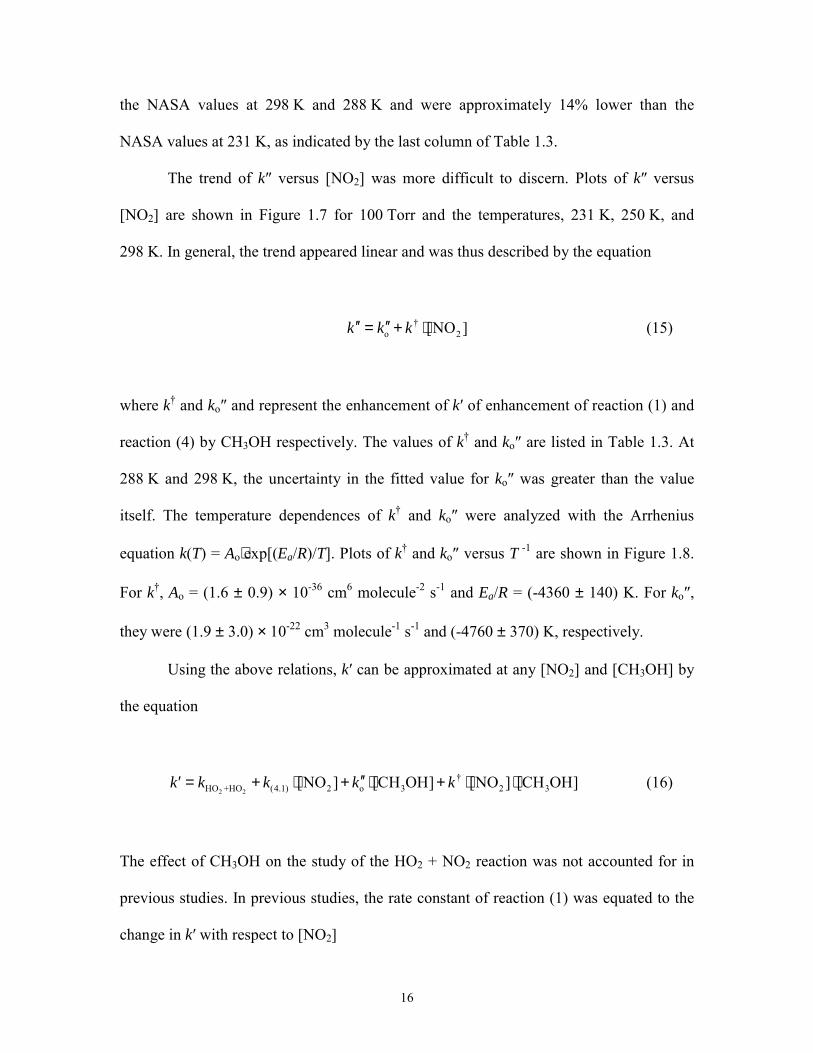
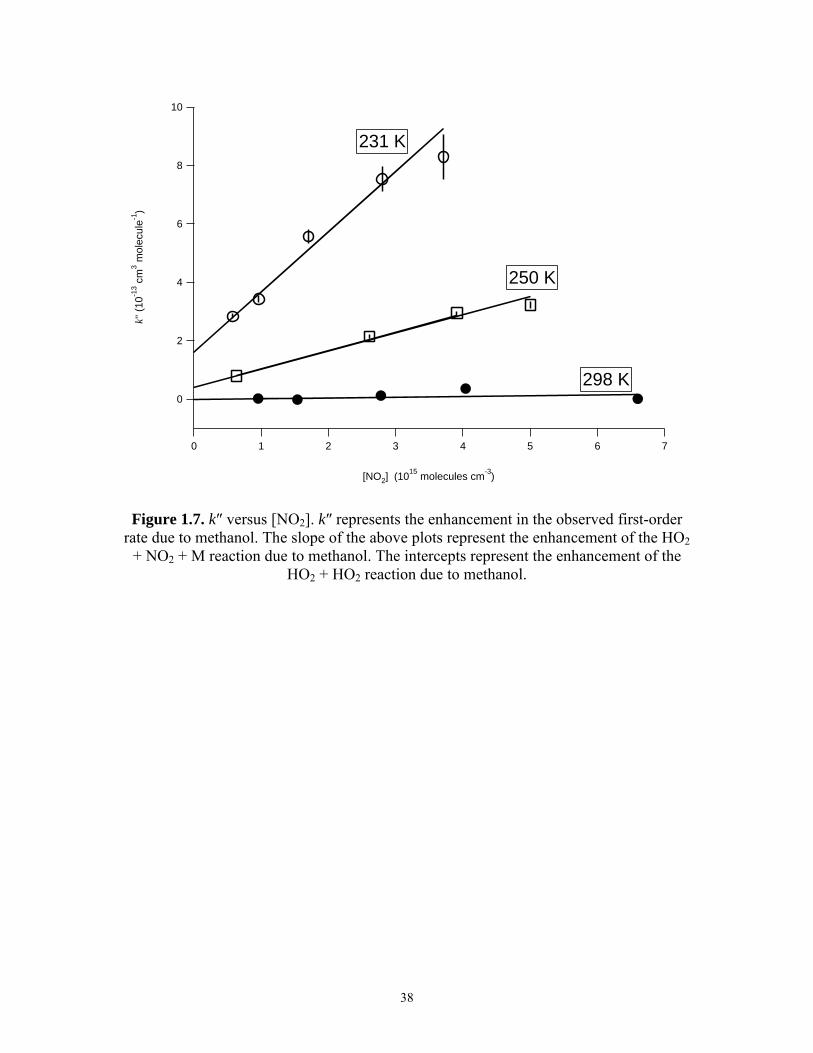
The trend of k″ versus [NO2] was more difficult to discern. Plots of k″ versus
[NO2] are shown in Figure 1.7 for 100 Torr and the temperatures, 231 K, 250 K, and
298 K. In general, the trend appeared linear and was thus described by the equation
o 2[NO ]k k k′′ ′′= + ⋅ (15)
where k and ko″ and represent the enhancement of k′ of enhancement of reaction (1) and
reaction (4) by CH3OH respectively. The values of k and ko″ are listed in Table 1.3. At
288 K and 298 K, the uncertainty in the fitted value for ko″ was greater than the value
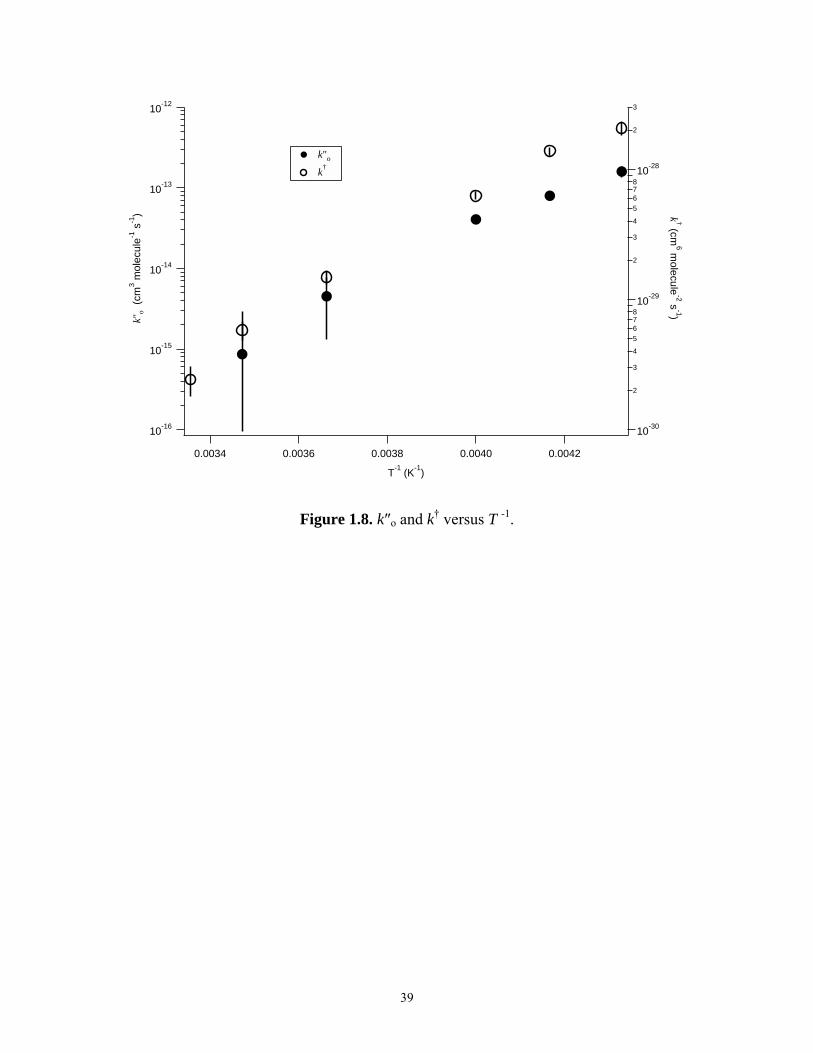
itself. The temperature dependences of k and ko″ were analyzed with the Arrhenius
equation k(T) = Ao⋅exp[(Ea/R)/T]. Plots of k and ko″ versus T -1 are shown in Figure 1.8.
For k, Ao = (1.6 ± 0.9) × 10-36 cm6 molecule-2 s-1 and Ea/R = (-4360 ± 140) K. For ko″,
they were (1.9 ± 3.0) × 10-22 cm3 molecule-1 s-1 and (-4760 ± 370) K, respectively.
Using the above relations, k′ can be approximated at any [NO2] and [CH3OH] by
the equation
2 2
HO +HO (4.1) 2 o 3 2 3[NO ] [CH OH] [NO ] [CH OH]k k k k k′′′ = + ⋅ + ⋅ + ⋅ ⋅ (16)
The effect of CH3OH on the study of the HO2 + NO2 reaction was not accounted for in
previous studies. In previous studies, the rate constant of reaction (1) was equated to the
change in k′ with respect to [NO2]
17
1 3
2
[CH OH][NO ]dk k k
d′ = + ⋅ (17)
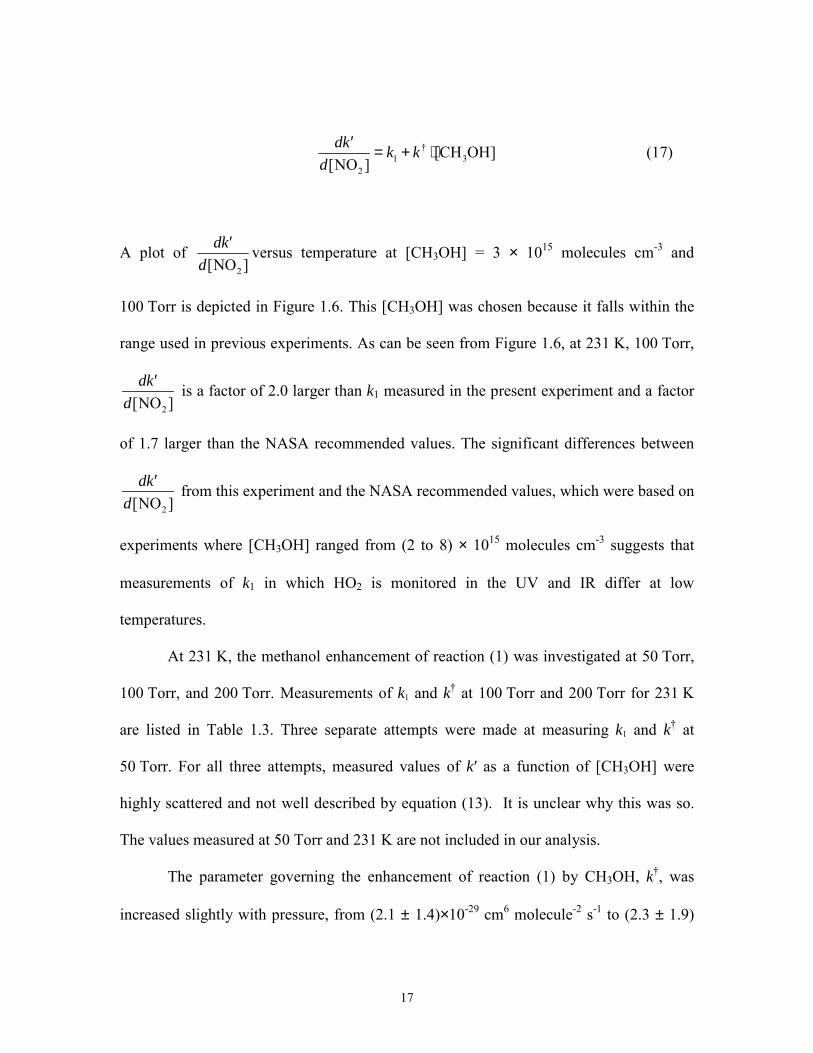
A plot of 2[NO ]
dkd
′ versus temperature at [CH3OH] = 3 × 10¹⁵ molecules cm-3 and
100 Torr is depicted in Figure 1.6. This [CH3OH] was chosen because it falls within the
range used in previous experiments. As can be seen from Figure 1.6, at 231 K, 100 Torr,
2[NO ]dk
d′ is a factor of 2.0 larger than k1 measured in the present experiment and a factor
of 1.7 larger than the NASA recommended values. The significant differences between
2[NO ]dk
d′ from this experiment and the NASA recommended values, which were based on
experiments where [CH3OH] ranged from (2 to 8) × 1015 molecules cm-3 suggests that
measurements of k1 in which HO2 is monitored in the UV and IR differ at low
temperatures.
At 231 K, the methanol enhancement of reaction (1) was investigated at 50 Torr,
100 Torr, and 200 Torr. Measurements of k1 and k at 100 Torr and 200 Torr for 231 K
are listed in Table 1.3. Three separate attempts were made at measuring k1 and k at
50 Torr. For all three attempts, measured values of k′ as a function of [CH3OH] were
highly scattered and not well described by equation (13). It is unclear why this was so.
The values measured at 50 Torr and 231 K are not included in our analysis.
The parameter governing the enhancement of reaction (1) by CH3OH, k, was
increased slightly with pressure, from (2.1 ± 1.4)×10-29 cm6 molecule-2 s-1 to (2.3 ± 1.9)
18
×10-29 cm6 molecule-2 s-1 but the difference was well within the error estimates. However,
the uncertainties of the measurements make it unclear whether or not there is a pressure
effect on k. More studies over a larger range of pressures are needed. The increase in the
value of k1/kJPL with pressure, noted in the last column of Table 1.4, suggests that k may
be pressure dependent.
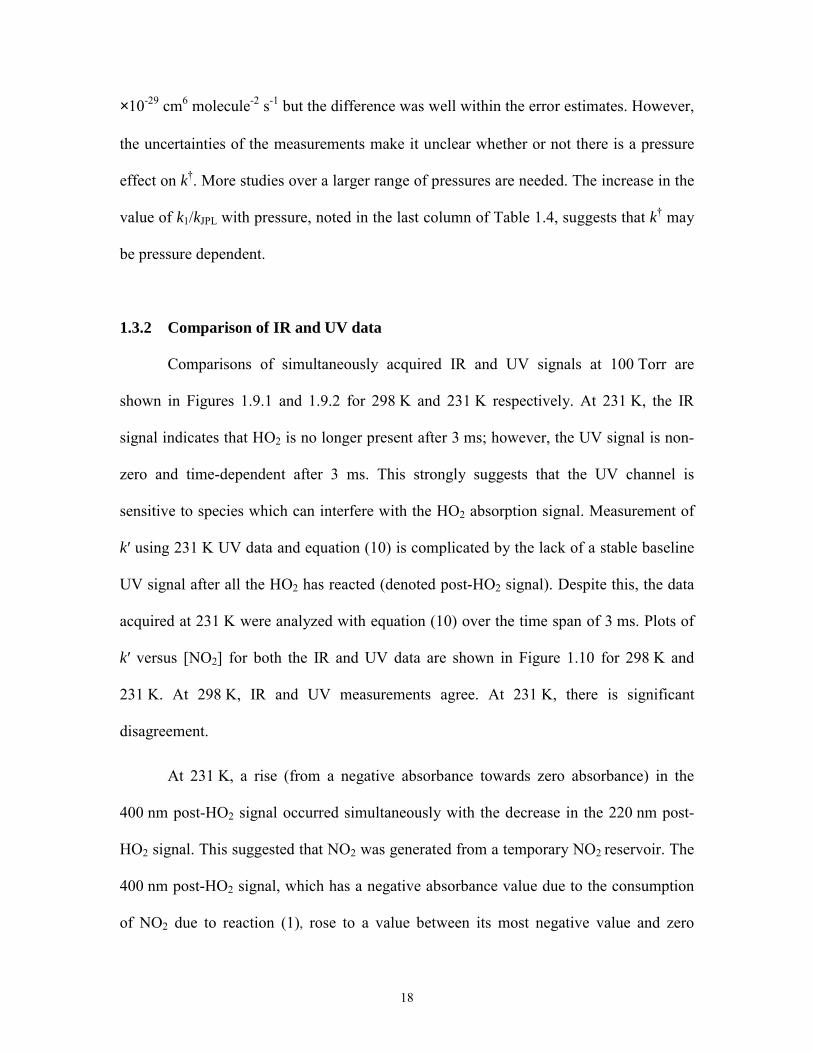
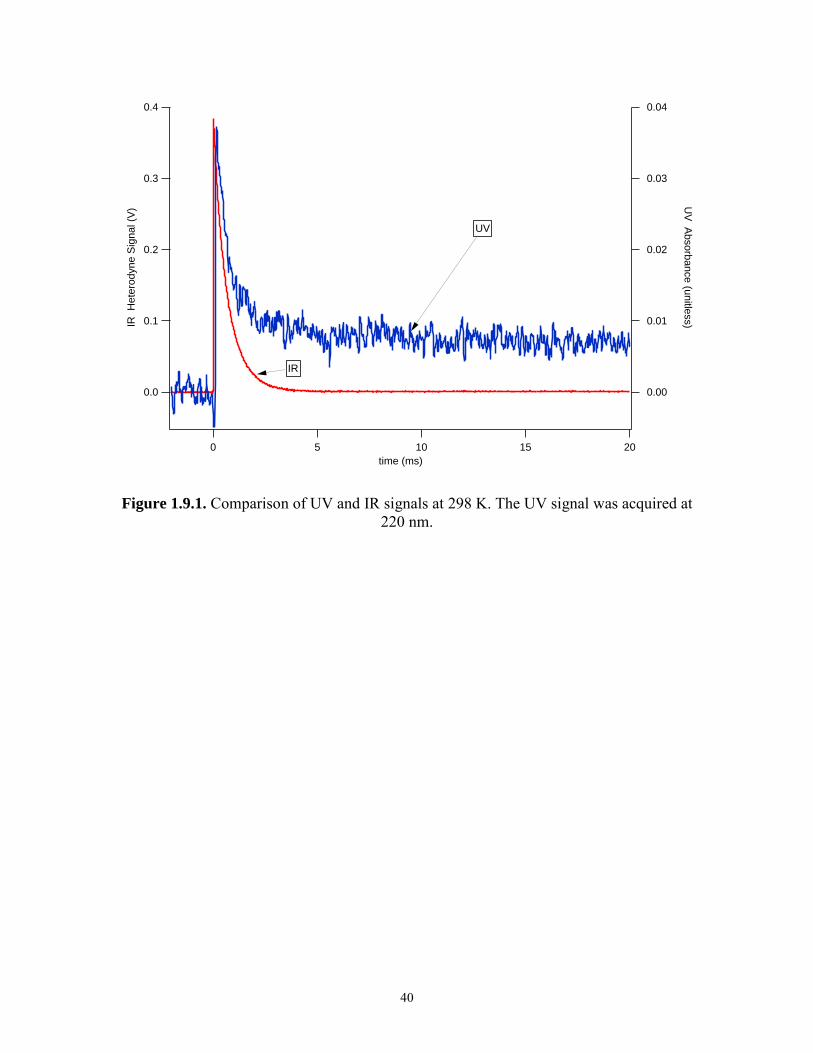
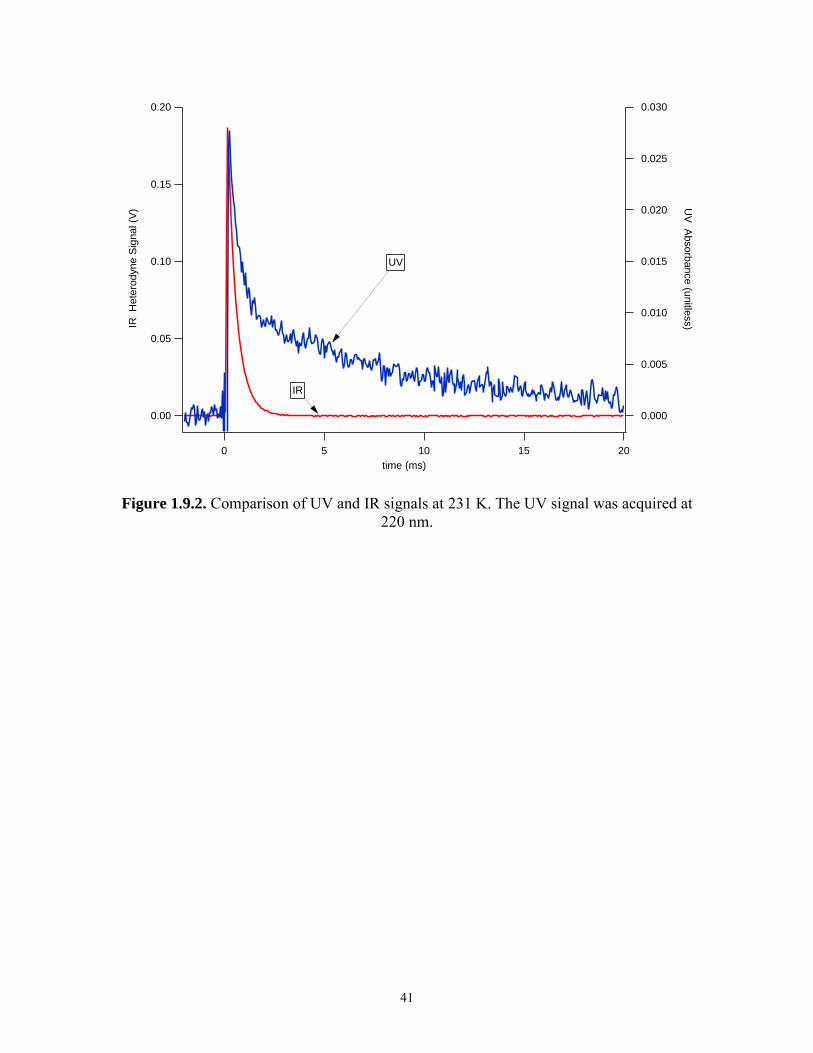
1.3.2 Comparison of IR and UV data
Comparisons of simultaneously acquired IR and UV signals at 100 Torr are
shown in Figures 1.9.1 and 1.9.2 for 298 K and 231 K respectively. At 231 K, the IR
signal indicates that HO2 is no longer present after 3 ms; however, the UV signal is non-
zero and time-dependent after 3 ms. This strongly suggests that the UV channel is
sensitive to species which can interfere with the HO2 absorption signal. Measurement of
k′ using 231 K UV data and equation (10) is complicated by the lack of a stable baseline
UV signal after all the HO2 has reacted (denoted post-HO2 signal). Despite this, the data
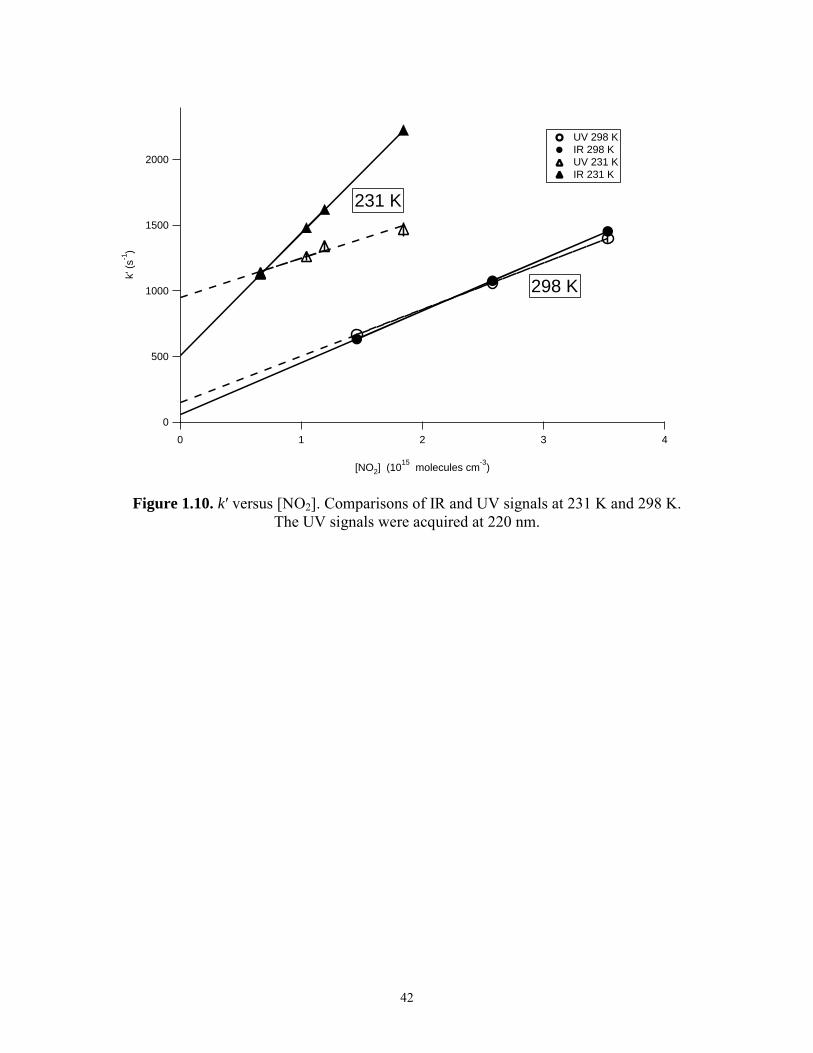
acquired at 231 K were analyzed with equation (10) over the time span of 3 ms. Plots of
k′ versus [NO2] for both the IR and UV data are shown in Figure 1.10 for 298 K and
231 K. At 298 K, IR and UV measurements agree. At 231 K, there is significant
disagreement.
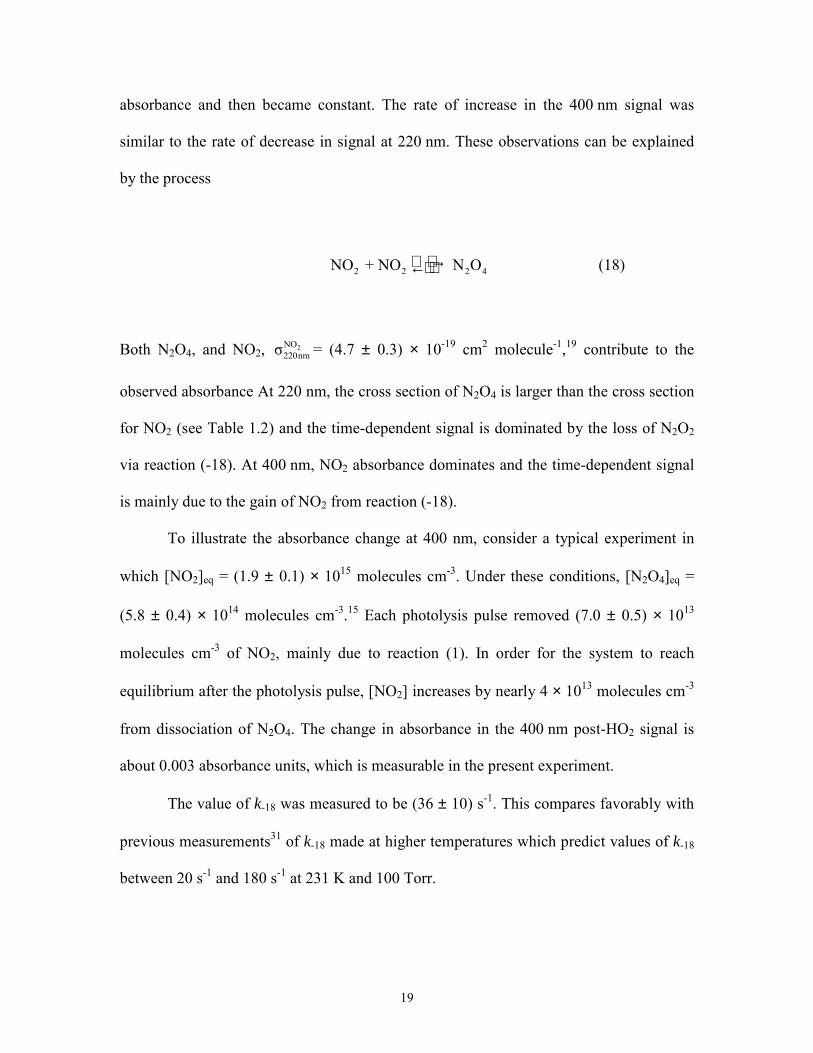
At 231 K, a rise (from a negative absorbance towards zero absorbance) in the
400 nm post-HO2 signal occurred simultaneously with the decrease in the 220 nm post-
HO2 signal. This suggested that NO2 was generated from a temporary NO2 reservoir. The
400 nm post-HO2 signal, which has a negative absorbance value due to the consumption
of NO2 due to reaction (1), rose to a value between its most negative value and zero
19
absorbance and then became constant. The rate of increase in the 400 nm signal was
similar to the rate of decrease in signal at 220 nm. These observations can be explained
by the process
2 2 2 4 NO + NO N O →← (18)
Both N2O4, and NO2, 2NO220nmσ = (4.7 ± 0.3) × 10-19 cm2 molecule-1,19 contribute to the
observed absorbance At 220 nm, the cross section of N2O4 is larger than the cross section
for NO2 (see Table 1.2) and the time-dependent signal is dominated by the loss of N2O2
via reaction (-18). At 400 nm, NO2 absorbance dominates and the time-dependent signal
is mainly due to the gain of NO2 from reaction (-18).
To illustrate the absorbance change at 400 nm, consider a typical experiment in
which [NO2]eq = (1.9 ± 0.1) × 1015 molecules cm-3. Under these conditions, [N2O4]eq =
(5.8 ± 0.4) × 1014 molecules cm-3.15 Each photolysis pulse removed (7.0 ± 0.5) × 1013
molecules cm-3 of NO2, mainly due to reaction (1). In order for the system to reach
equilibrium after the photolysis pulse, [NO2] increases by nearly 4 × 10¹³ molecules cm-3
from dissociation of N2O4. The change in absorbance in the 400 nm post-HO2 signal is
about 0.003 absorbance units, which is measurable in the present experiment.
The value of k-18 was measured to be (36 ± 10) s-1. This compares favorably with
previous measurements31 of k-18 made at higher temperatures which predict values of k-18
between 20 s-1 and 180 s-1 at 231 K and 100 Torr.
20
Attempts were made to study reaction (1) in the absence of hydrogen-bonding
species. A gas mixture of F2/H2/O2/N2 was flowed into the cell at concentrations
(molecules cm-3) of F2: 5 × 10¹⁶; H2: 5 × 10¹⁶; O2: 5 × 10¹⁷ and balance N2 at 100 Torr
and 231 K. When NO2 was added to the gas mixture, an unexpected explosion took place.
This may have occurred as a result of a thermal, wall-catalyzed, reaction or from
photolysis by ambient light. The reaction mixed was judged to be sufficiently unstable
that no further studies were conducted using the F2-H2 system.
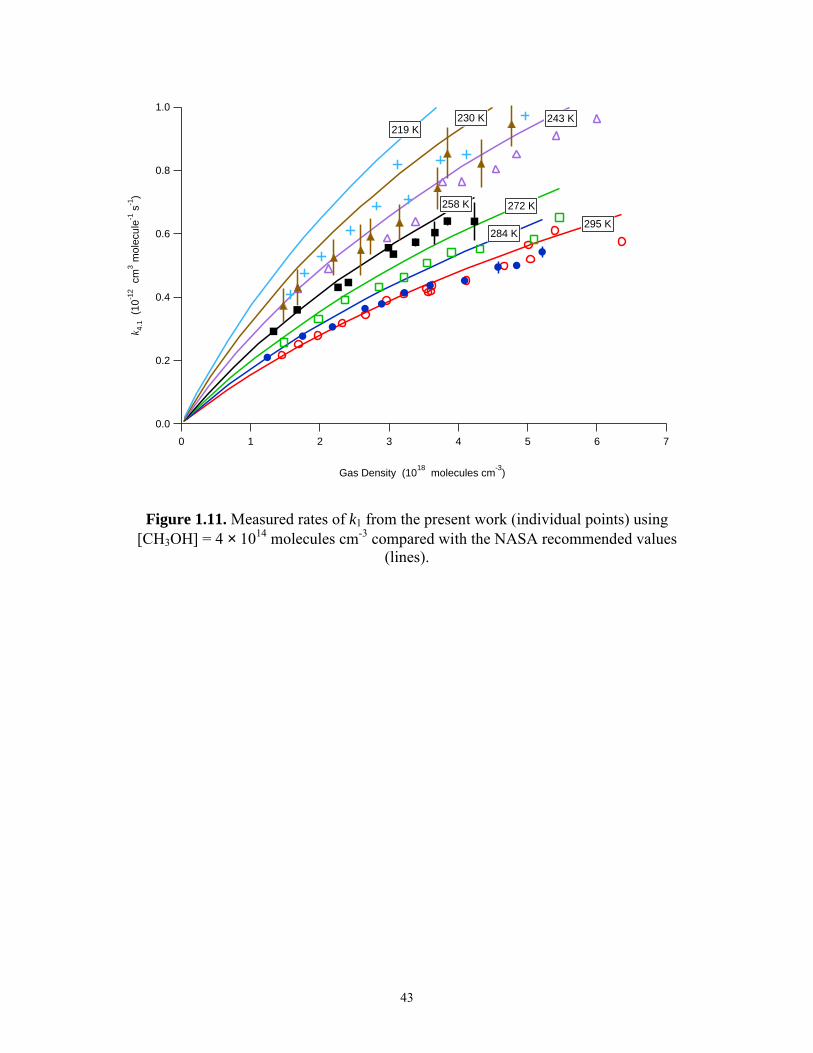
1.3.3 Measurements of k1 at low [CH3OH]
A second set of measurements of the rate of reaction (1) was obtained with
[CH3OH] = 2.0 × 10¹⁴ molecules cm-3. These measurements were done between 50 Torr
and 200 Torr, and between 219 K and 295 K. As stated above, complications from Cl +
NO2 were found to be insignificant. Results from the first set of experiments indicated
that at 231 K, 200 Torr, and [CH3OH] = 2.0 × 10¹⁴ molecules cm-3, the calculated value
of 2[NO ]
dkd
′ was approximately 5% greater than the measured value of k1. At 219 K, the
observed rates were calculated to be nearly 15% higher than k1. The observed values
from this second set of measurements, corrected for the presence of CH3OH, are shown
in Figure 1.11.
1.4 Discussion
1.4.1 Quantifying the results
To describe k1([M],T), a simplified version of a termolecular rate equation
developed by Troe (cite) was employed. This equation, defined below,
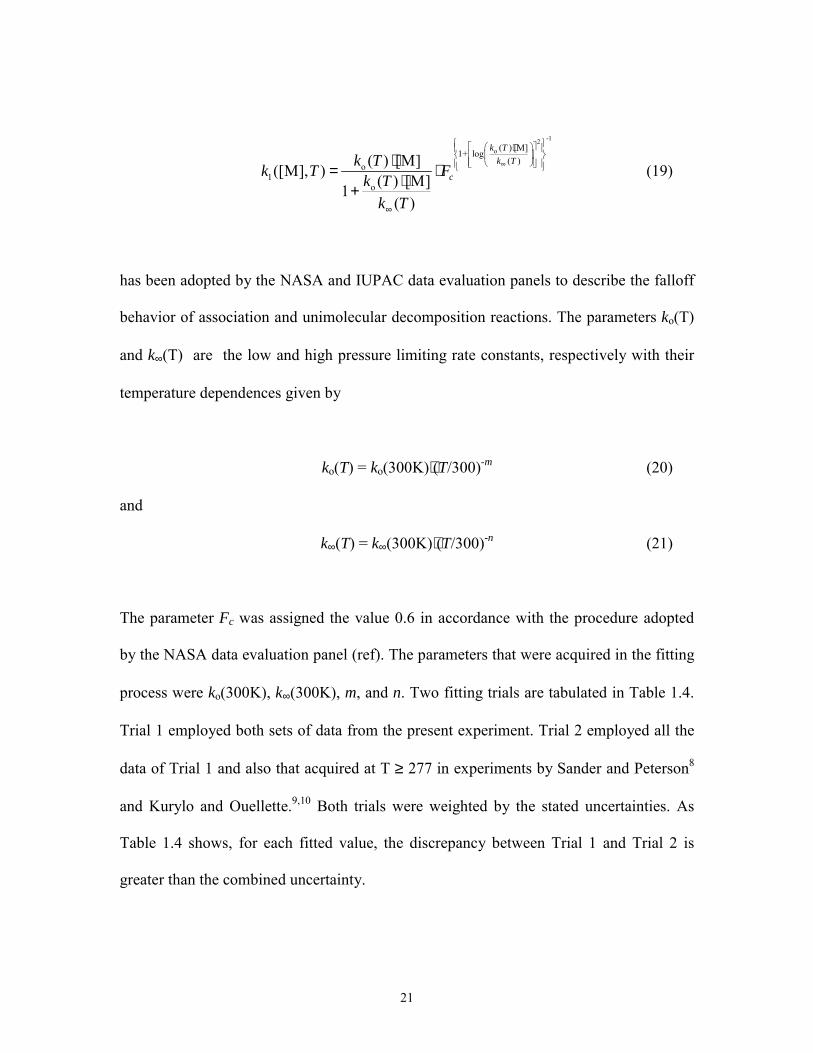
21
-12o ( ) [M]
1+ log( )o
1o
( ) [M]([M], ) ( ) [M]1( )
k Tk T
ck Tk T Fk T
k T
∞
⋅
∞
⋅= ⋅⋅+ (19)
has been adopted by the NASA and IUPAC data evaluation panels to describe the falloff
behavior of association and unimolecular decomposition reactions. The parameters ko(T)
and k∞(T) are the low and high pressure limiting rate constants, respectively with their
temperature dependences given by
ko(T) = ko(300K)⋅(T/300)-m (20)
and
k∞(T) = k∞(300K)⋅(T/300)-n (21)
The parameter Fc was assigned the value 0.6 in accordance with the procedure adopted
by the NASA data evaluation panel (ref). The parameters that were acquired in the fitting
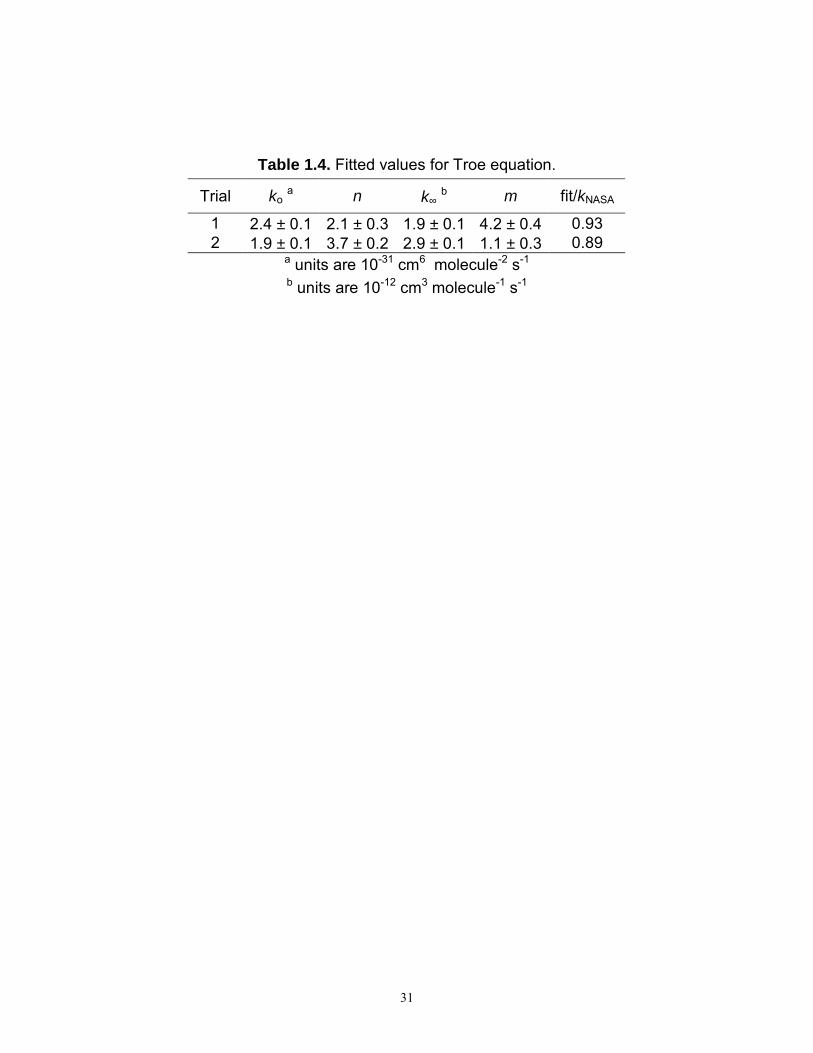
process were ko(300K), k∞(300K), m, and n. Two fitting trials are tabulated in Table 1.4.
Trial 1 employed both sets of data from the present experiment. Trial 2 employed all the
data of Trial 1 and also that acquired at T ≥ 277 in experiments by Sander and Peterson8
and Kurylo and Ouellette.9,10 Both trials were weighted by the stated uncertainties. As
Table 1.4 shows, for each fitted value, the discrepancy between Trial 1 and Trial 2 is
greater than the combined uncertainty.
22
The lack of agreement between the trials may result from insufficient
parameterization of equation (19). Since one of the principal aims of this paper is to
provide a description of reaction (1) that is useful for atmospheric modeling, and since
the adopted procedure by the NASA data evaluation panel has adopted the use of the
equation (19), further parameterization was not adopted.
As stated in the introduction, impact of reaction (1) on atmospheric chemistry is
greatest from the upper troposphere to the middle stratosphere. An assessment of how
each of the trials describes reaction (1) in this region of the atmosphere can be quantified
by comparing the calculated rate from each of the trials to the current NASA
recommended value at 231 K and 100 Torr. This has been done in Table 1.5. Both Trials
calculate rates that are about 10% lower than the current recommendation. The measured
value from data set 1 was 10% lower than currently recommended. Data set 1 is
highlighted because was a direct measurement of k1 at 231 K and 100 Torr.
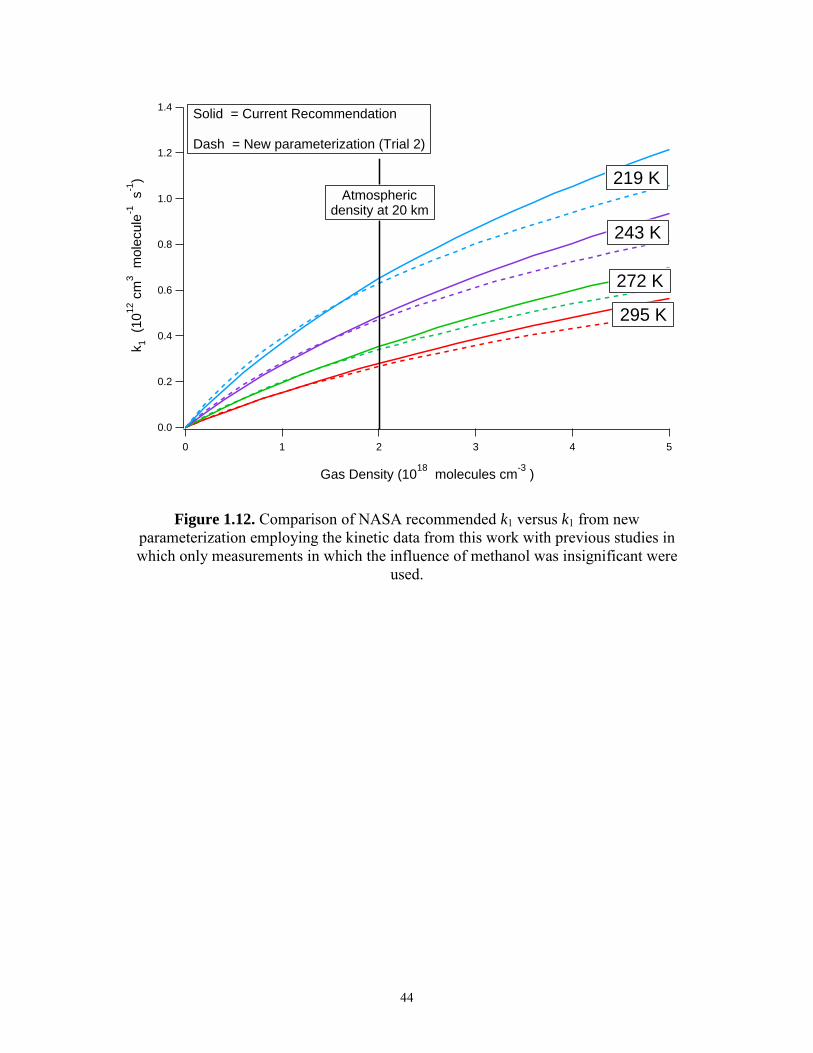
The above analysis indicates that for modeling the chemistry of the upper
troposphere to the middle stratosphere, there is little difference between Trial 1 and Trial
2 though the parameters acquired from Trial 2 best describe reaction (1) over the widest
range of pressures and temperatures. Figure 1.12 depicts the difference between Trial 2
and the current recommended values.
1.4.2 Enhancement by CH3OH
The observed enhancement of reaction (1) by CH3OH can be explained by the
reaction sequence

23
M2 2 2 2HO + NO HO NO → (1)
3 2 3 2CH OH + HO CH OH HO → ⋅← (22)
3 2 2CH OH HO + NO Products⋅ → (23)
If the steady-state approximation is used for [CH3OH⋅HO2],
2[NO ]
dkd
′ = k1 + 2⋅k23⋅K22⋅[CH3OH] (24)
where 2[NO ]
dkd
′ is the observed rate constant discussed above and K22 describes the
equilibrium between HO2, CH3OH, and CH3OH⋅HO2. From the present experiment, the
rate enhancement of reaction (1), k, was measured to be (1.6 ± 0.9) × 10-36 × exp((4360 ±
140)/T) cm6 molecule-2 s-1. In a prior study, the enhancement of reaction (1) by CH3OH
was described in a similar fashion and measured to be (2.5 ± 2.4) × 10-36 × exp(-4570 ±
120) cm6 molecule-2 s-1.17 If it is assumed that the rate of reaction (23) depends very little
on temperature, then the temperature dependence of the enhancement can be shown result
from the enthalpy change of Keq. In the present study, the enthalpy change for reaction (1)
was measured to be -(8.66 ± 0.28) kcal mol-1. For reaction (4), the enthalpy change was
measured to be -(9.1 ± 0.2) kcal mol-1. Both these values correspond to strong hydrogen
bonded complexes.

24
The similarity in enhancement between reactions (1) and (4) suggests that the
process HO2 + CH3OH⋅X → Products, where X = HO2 or NO2, may occur at near
collision frequency as has been suggested by prior researchers.16
1.4.5 Conclusion
The effect of methanol on the observed rate of HO2 + NO2 was measured. This
information was used to measure the rate constant of HO2 + NO2 in limit of zero
methanol k1. IR spectroscopy was employed, minimizing the influence of the equilibrium
between NO2 and N2O4 in determining the rate, a process not taken into account in prior
studies. The results indicated that at temperatures lower than 250 K, k1 was lower than
the current NASA recommended values. At 231 K, 100 Torr, k1 was nearly 10% lower.
Parameterizations of the rate of k1 using a simplified Troe termolecular equation was
done using the present data in addition to that taken by prior researchers. Only data that
in which the effect of CH3OH was minimal was included. It was found that the simplified
equation did not adequately describe all the data. However, it did describe the rate of
reaction (1) in the pressure and temperature regime of importance to atmospheric
chemistry.
The methanol effect was analyzed and found to be remarkable similar to that for
the enhancement of the HO2 + HO2 system. This suggests that current models discussed
in the literature approximate the process well.
25
Acknowledgements
This research was carried out by the Jet Propulsion Laboratory, California Institute of
Technology, under contract with the National Aeronautics and Space Administration.
Support is acknowledged from the NASA Upper Atmosphere Research and Tropospheric
Chemistry Programs. This research has also been supported in part by a grant from the
U.S. Environmental Protection Agency National Center for Environmental Researchs
Science to Achieve Results (STAR) program, through grant R826236-01-0. It has not
been subjected to any EPA review and therefore does not necessarily reflect the views of
the Agency, and no official endorsement should be inferred. We would like to
acknowledge the technical support of Dave Natzic, Jürgen Linke, Siamak Forouhar, Dave
Dougherty, and Sam Keo of JPL.
1.5 References
1. Simonaitis, R. and J. Heicklen J. Phys. Chem 78: 653 (1974).
2. Cox, R. A. and R. G. Derwent J. Photochem. 4: 139 (1975).
3. Simonaitis, R. and J. Heicklen J. Phys. Chem 80: 1 (1976).
4. Howard, C. J. "Kinetics of the reaction of HO2 with NO2." J. Chem. Phys. 67: 5258
(1977).
5. Niki, H., P. Maker, et al. "FTIR of PNA from HO2 + NO2." Chemical Physics Letters
45: 564 (1977).
6. Simonaitis, R. and J. Heicklen Int. J. Chem. Kinet. 10: 67-87 (1978).
7. Cox, R. A. and R. Patrick Int. J. Chem. Kinet. 11: 635 (1979).
8. Sander, S. P. and M. Peterson "HO2 + NO2." J. Phys. Chem. 88: 1566-1571 (1984).
26
9. Kurylo, M. J. and P. A. Ouellette "HO2 + NO2." J. Phys. Chem. 90: 441-444 (1986).
10. Kurylo, M. J. and P. A. Ouellette "Rate Constants for the Reaction HO2 + NO2 + N2 −
> HO2NO2 + N2: The Temperature Dependence of the Falloff Parameters." J.
Phys. Chem. 91: 3365-3368 (1987).
11. WMO (1983). The Statosphere: 1981, NASA.
12. Rinsland, C. P., R. Zander, et al. "Evidence for the Presence of the 802.7 cm-1 Band Q
Branch of HO2NO2 in High Resolution Solar Absorption Spectra of the
Stratosphere." Geophysical Research Letters 13: 761-764 (1986).
13. Sen, B., G. C. Toon, et al. "Measurements of Reactive Nitrogen in the Stratosphere."
Journal of Geophysical Research-Atmospheres 103: 3571-3585 (1998).
14. Atkinson, R., D. L. Baulch, et al. "Summary of Evaluated Kinetic and Photochemical
Data for Atmospheric Chemistry - Web Version December 2000." (2000).
15. Sander, S. P., R. R. Friedl, et al. (2000). Chemical Kinetics and Photochemical Data
for Use in Stratospheric Modeling, Evaluation Number 13. Pasadena, CA, Jet
Propulsion Laboratory, California Institute of Technology.
16. Andersson, B. Y., R. A. Cox, et al. "The Effect of Methanol on the Self Reaction of
HO2 Radicals." Int. J. Chem. Kinetics 20: 283-295 (1988).
17. Christensen, L. E., S. P. Sander, et al. "Kinetics of HO2 + HO2 → H2O2 + O2:
Implications for Stratospheric H2O2." Geophysical Research Letters (2002).
18. DeMore, W. B., S. P. Sander, et al. (1997). Chemical Kinetics and Photochemical
Data for Use in Stratospheric Modeling, Evaluation Number 12. Pasadena, CA,
Jet Propulsion Laboratory, California Institute of Technology.
19. Bass, A. M., A. E. Ledford, et al. J. Res. NBS 80A: 143-166 (1976).
27
20. Davidson, J. A., C. A. Cantrell, et al. J. Geophys. Res. 93: 7105-7112 (1988).
21. Herriott, D. and H. Schulte "Folded Optical Delay Lines." Appl. Optics 4: 883-889
(1965).
22. Trutna, W. and R. Byer "Multiple-pass Raman gain cell." Appl. Optics 19: 301-312
(1980).
23. Monsour, J. (2001). Private communication.
24. Tuckett, R. P., P. A. Freedman, et al. "The emission bands of HO2 between 1.43 and
1.51 microns." Molecular Physics 37: 379-401 (1979).
25. Hunziker, H. E. and H. R. Wendt J. Chem. Phys. 60: 4622 (1974).
26. Johnson, T. J., F. G. Wienhold, et al. J. Phys. Chem 95: 6499-6502 (1991).
27. Kircher, C. C. and S. P. Sander "Kinetics and Mechanism of HO2 and DO2
Disproportionations." J. Phys. Chem. 88: 2082-91 (1984).
28. Curtis, A. R. and W. P. Sweetenham (1987). FACSIMILE/CHEKMAT, H015 ed.
Harwell: Oxfordshire (UK).
29. Molina, L. T. and M. J. Molina Geophys. Res. Lett. 4: 83-86 (1977).
30. Sander, S. P. and R. T. Watson J. Phys. Chem. 84: 1664 (1980).
31. Markwalder, B., P. Gozel, et al. J. Chem. Phys. 97: 5472-5479 (1992).

28
Table 1.1. Cross sections for various species. species σ220nm a σ225nm a σ230nm a σ400nm a ref.
HO2 3.41 2.88 2.30 18 NO2 0.47 0.39 0.28 0.60 19 N2O4 6.68 4.11 2.55 19
HO2NO2 1.18 0.94 0.79 18 H2O2 0.26 0.22 0.18 18 Cl2 0.02 18
ClNO2 3.39 2.83 2.26 29 a units are 10-18 cm2
29
Table 1.2. Relevant reactions. Reaction Reference
Cl + CH3OH → HCl + CH2OH NASA CH2OH + O2 → HO2 + CH2O NASA
HO2 + HO2 → H2O2 + O2 My GRL NO + HO2 → NO2 + OH NASA
OH + NO2 → HNO3 NASA OH + HO2 → H2O + O2 NASA Cl + HO2 → HCl + O2 NASA
HO2 + NO2 + M → HO2NO2 + M NASA Cl + NO2 + M → ClONO + M NASA Cl + NO2 + M → ClNO2 + M NASA Cl + ClONO → Cl2 + NO2 NASA Cl + ClNO2 → Cl2 + NO2 NASA
NO2 + NO2 + M → N2O4 + M This expt. N2O4 + M → NO2 + NO2 + M This expt.
30
Table 1.3. Fitted values at different temperatures.
T (K) P a k1 b k c ko″ d k1/kJPL
298 100 4.0±0.1 0.24±0.06 too noisy 1.00 288 100 4.4±0.1 0.58±0.09 0.9±2.0 0.98 273 100 5.1±0.1 1.5±0.2 4.5±3.2 0.93 250 100 6.7±0.1 6.3±0.2 41±2 0.92 240 100 6.9±0.1 13.8±0.4 80±5 0.83 231 100 8.5±0.3 20.7±1.4 160±10 0.90 231 200 9.4±0.4 23.0±1.9 200±60 0.66
a units are Torr b units are 10-13 cm3 molecule-1 s-1 c units are 10-29 cm6 molecule-2 s-1
d units are 10-15 cm3 molecule-1 s-1
31
Table 1.4. Fitted values for Troe equation.
Trial ko a n k∞ b m fit/kNASA
1 2.4 ± 0.1 2.1 ± 0.3 1.9 ± 0.1 4.2 ± 0.4 0.93 2 1.9 ± 0.1 3.7 ± 0.2 2.9 ± 0.1 1.1 ± 0.3 0.89
a units are 10-31 cm6 molecule-2 s-1 b units are 10-12 cm3 molecule-1 s-1
32
Figure 1.1. Experimental apparatus.
33
0.03
0.02
0.01
0.00
Cha
nge
in A
bsor
banc
e (u
nitle
ss)
20151050
Time (ms)
HO2
HO2NO2
NO2 N2O4
Total
ClNO2 + ClONO
Figure 1.2. Simulated UV absorbances at 369.50 nm using FACSIMILE.

34
1.6
1.4
1.2
1.0
0.8
0.6
0.4
0.2
0.0
[HO
2] (
1013
mol
ecul
es c
m-3
)
43210-1time (ms)
[CH3OH]=3.84E15 [CH3OH]=7.25E14
Figure 1.3. Decay of [HO2] due to the HO2 + NO2 reaction at different [CH3OH] at 231 K, 100 Torr.
35
7000
6000
5000
4000
3000
2000
1000
0
k' (
s-1)
5x10¹⁵
43210
[CH3OH] (molecules cm-3
)
[NO2] = 3.71E15
[NO2] = 1.70E15
[NO2] = 5.78E14
Figure 1.4. k′ versus [CH3OH] for various [NO2] at 231 K, 100 Torr.
36
3500
3000
2500
2000
1500
1000
500
k'o
(s-1
)
6543210
[NO2] (molecules cm-3
)
231 K
250 K
298 K
Figure 1.5. k′o versus [NO2]. The slope of the line is k1, the rate coefficient for the HO2 + NO2 + M reaction in the absence of methanol.

37
1.5
1.0
0.5
0.0
k 1 (
10-1
2 cm
3 mol
ecul
e-1 s
-1)
300290280270260250240230
T (K)
Measured k1 - present work
NASA Recommendation
NASA Error limits
Observed rate coefficient calculated at
[CH3OH] = 3×10¹⁵
molecules cm-3
Figure 1.6. k1 versus T compared with the NASA recommendation and expected rate if the HO2 + NO2 reaction were studied using [CH3OH] = 3 × 10¹⁵ molecules cm-3.
38
10
8
6
4
2
0
k" (
10-1
3 cm
3 mol
ecul
e-1)
76543210
[NO2] (1015 molecules cm-3)
231 K
298 K
250 K
Figure 1.7. k″ versus [NO2]. k″ represents the enhancement in the observed first-order rate due to methanol. The slope of the above plots represent the enhancement of the HO2
+ NO2 + M reaction due to methanol. The intercepts represent the enhancement of the HO2 + HO2 reaction due to methanol.
39
10-16
10-15
10-14
10-13
10-12
k"o
(cm
3 mol
ecul
e-1 s
-1)
0.00420.00400.00380.00360.0034
T-1
(K-1
)
10-30
2
3
4
567810
-29
2
3
4
567810
-28
2
3
k† (cm
6 molecule
-2 s-1) k"o
k†
Figure 1.8. k″o and k versus T -1.
40
0.4
0.3
0.2
0.1
0.0
IR H
eter
odyn
e S
igna
l (V
)
20151050time (ms)
0.04
0.03
0.02
0.01
0.00
UV
Absorbance (unitless)
IR
UV
Figure 1.9.1. Comparison of UV and IR signals at 298 K. The UV signal was acquired at 220 nm.
41
0.20
0.15
0.10
0.05
0.00
IR H
eter
odyn
e S
igna
l (V
)
20151050time (ms)
0.030
0.025
0.020
0.015
0.010
0.005
0.000
UV
Absorbance (unitless)
IR
UV
Figure 1.9.2. Comparison of UV and IR signals at 231 K. The UV signal was acquired at 220 nm.
42
2000
1500
1000
500
0
k' (
s-1)
43210
[NO2] (1015
molecules cm-3
)
231 K
298 K
UV 298 K IR 298 K UV 231 K IR 231 K
Figure 1.10. k′ versus [NO2]. Comparisons of IR and UV signals at 231 K and 298 K. The UV signals were acquired at 220 nm.
43
1.0
0.8
0.6
0.4
0.2
0.0
k 4.1
(10
-12 c
m3 m
olec
ule-1
s-1
)
76543210
Gas Density (1018
molecules cm-3
)
295 K284 K
272 K258 K
243 K230 K219 K
Figure 1.11. Measured rates of k1 from the present work (individual points) using [CH3OH] = 4 × 10¹⁴ molecules cm-3 compared with the NASA recommended values
(lines).
44
1.4
1.2
1.0
0.8
0.6
0.4
0.2
0.0
k1
(10
12 c
m3 m
olec
ule-1
s-1
)
543210
Gas Density (1018
molecules cm-3
)
219 K
243 K
272 K
295 K
Solid = Current Recommendation Dash = New parameterization (Trial 2)
Atmospheric density at 20 km
Figure 1.12. Comparison of NASA recommended k1 versus k1 from new parameterization employing the kinetic data from this work with previous studies in which only measurements in which the influence of methanol was insignificant were
used.
45
Chapter 2: Kinetics of HO2 + HO2 →→→→ H2O2 + O2:
Implications for Stratospheric H2O2
2.1 Introduction
The principal source of upper tropospheric and stratospheric H2O2 is the reaction
2 2 2 2 2HO + HO H O + O → (1)
Reaction (1) is an important sink for HOx in the troposphere because H2O2 is scavenged
by aerosols and clouds. In the stratosphere, H2O2 serves as a temporary reservoir for HOx.
Remote measurements of stratospheric [H2O2] have indicated that our
understanding of the H2O2 budget is incomplete. Measurements, shown below, by the
balloon-borne MkIV and FIRS-2 spectrometers indicate that photochemical models
employing recommended rate constants significantly over-estimate [H2O2] in the lower to
middle stratosphere. This has prompted researchers to explore previously unrecognized
loss processes for H2O2 such as the H2O2 + O3 reaction.1 So far, laboratory studies have
been unable to explain the discrepancy.
Reaction (1) has been widely studied (see references in DeMore et al.2). However,
there are comparatively few studies below 273 K. The NASA2 and IUPAC3
recommendations at low temperatures have been influenced by studies that employed
46
CH3OH as a precursor for HO2. It has been demonstrated that the observed rate of
reaction (1) is enhanced in the presence of CH3OH, H2O, and NH3 and that this rate
enhancement is more pronounced at low temperatures4-6. The effect of methanol has been
the subject of only one study, at 278 K and 299 K.
In the present study, the effect of methanol on reaction (1) was examined over the
temperature range 222 K to 295 K. We defined k1 as the rate constant for reaction (1) in
the limit of zero added methanol and derived k1(T) at 100 Torr of combined O2 (40%) and
N2 (60%). The temperature dependence of the methanol enhancement effect was also
measured. The new value of k1(T) was used to compare measured volume mixing ratio
(VMR) profiles of stratospheric H2O2 with model calculations.
2.2 Experimental Details
The experiments were performed in a pulsed laser photolysis kinetic spectroscopy
apparatus described in detail in Chapters 1 and 5. Briefly, HO2 was generated in a 2-m
long temperature-controlled flow cell by laser photolysis at 308 nm of either Cl2 or F2 in
the gas mixtures CH3OH/O2/N2 and H2/O2/N2, respectively. The laser fluence was 120 mJ
pulse-1. HO2 decay curves were monitored simultaneously by UV and near-IR diode laser
spectroscopy. The measurements made in the UV are the subject of this paper. The near-
IR measurements of [HO2], which did not contain any spectral interference from other
species and supported the UV measurements, are discussed in Chapter 3. The
concentrations and specifications of the gases and methanol are listed in Table 2.1.
The photolysis beam traveled coaxially through the reaction cell (5-cm diameter)
resulting in a photolysis volume with a cross section of 1 cm by 2 cm. Reagent gases
were mixed and cooled prior to entering the middle of the reaction cell. N2 buffer gas was
47
flowed into both ends of the cell, constraining the reagent gases to an evenly mixed
134 cm long region. This was verified from measurements of gases with flow-meter
calibrated concentrations and known cross sections and further verified by examinations
of second-order reactions involving CH3O2 and CH3CH2O2 which yielded results
consistent with observations made by prior investigators. The residence time of the gas
was 3 seconds, and a photolysis flash occurred every 3.5 seconds. Methanol was added to
the cell by bubbling N2 through liquid methanol that was situated in a temperature-
controlled bath.
Light from a 150 W deuterium lamp was propagated collinearly with the
photolysis beam and made a single pass of path length 134 cm. HO2 was detected by UV
absorbance at 220.00 nm. The rate of decay was corrected to account for the time-
dependent absorbance by H2O2, a product of reaction (1) 5. The value used for the cross-
sections of HO2 and H2O2 at 220.00 nm were 3.41 ⋅ 10-18 cm2 and 2.58 ⋅ 10-19 cm2,
respectively.2,7 Both cross sections were assumed to be independent of temperature and
pressure.
We defined kobs as the second-order rate constant, measured in the presence of
methanol, and corrected for absorbance of H2O2. In each experiment, we measured the
HO2 decay over 38 milliseconds. At a given temperature and methanol concentration, kobs
was determined from the average of 3 individual experiments. At each temperature, kobs
was measured at 5 to 10 different methanol concentrations. As shown below, kobs was
linearly dependent on [CH3OH]. We expressed the enhancement due to methanol as
obs 1 3[CH OH]k k k= + ″⋅ (2)
48
where k1 is the rate constant of reaction (1) in the limit of zero methanol, k″ is the
enhancement factor due to the presence of methanol. Equation (2) was fit to kobs vs.
[CH3OH]. From the fit, k1 was determined from the y-intercept and k″ was determined
from the slope.
The uncertainty (2σ) in kobs due to the statistical noise in the UV signal was 2%
while the uncertainty in determining [CH3OH], which in turn was due to the fluctuations
in measured gas flows and temperature of the bath surrounding the methanol, was 5%.
The relationship between kobs and [CH3OH] was not well described by equation (2) at
222 K. This was correlated with slight deviations from second-order rate behavior at high
[CH3OH].
Seven different temperatures, from 222 K to 295 K, were investigated. The
temperature dependences of k1 and k″ were fit to the Arrhenius expression k(T) =
A ⋅ exp[-(Ea/R)/T] using weighted non-linear least-squares fitting. Weights were the
uncertainties derived from the linear fitting of k1 and k″ and the uncertainty in
temperature (±1 K).
The effects of secondary reactions were considered as a possible cause for the
observed rate enhancement. At all temperatures, the maximum [HO2] did not change for
[CH3OH] > 1 ⋅ 1015 molecules cm-3; at the lowest [CH3OH] employed, maximum [HO2]
decreased by 10%. Competing secondary reactions such as Cl + O2 and Cl + HO2 would
account for the decrease in maximum [HO2]. The kinetics modeling program
FACSIMILE8 was employed to ascertain the effects of these secondary reactions. It was
found that their effects were negligible. More than half of the experiments were done

49
with [CH3OH] > 1.0 ⋅ 1015 molecules cm-3. There was no discernable difference in the
slope of kobs versus [CH3OH] above and below this methanol concentration.
2.3 Laboratory Results and Discussion
The dramatic effect of methanol on the observed rate constant is demonstrated in
Figure 2.1. At 295 K, there was very little change in kobs when [CH3OH] was varied over
the range (1 to 5) ⋅ 1015 molecules cm-3. At 231 K, kobs more than doubled over the same
range of [CH3OH].
Figure 2.2 compares the temperature dependence of k1 with the JPL00-3
recommended values at 100 Torr. At 295 K, our results are within 7% of the current
recommended values, but at 231 K, we find that the rate constant is only 59% of the
current recommended value. Our measured values (2σ) of A and Ea/R for k1 were
(8.8 ± 0.9) ⋅ 10-13 cm3 molecule-1 s-1 and (-210 ± 26) K, respectively.
In order to validate the approach used in the derivation of k1, 308 nm photolysis of
F2/H2/O2/N2 mixtures was used to produce HO2. These experiments were conducted at
two temperatures, 231 K and 295 K. The results, plotted in Figure 2.2, show that k1
values obtained by extrapolating to zero methanol were statistically consistent with k1 in
the absence of methanol. Possible interferences from FO2 were determined to be
negligible.
Our measured temperature dependence leads to a negative Ea that is half that
reported by prior investigators. The study by Kircher and Sander5 (KS) is similar to the
JPL and IUPAC recommendations and has influenced the recommendations for
temperatures below 273 K. Their study was conducted between 240 K and 417 K and

50
employed [CH3OH] = (1 to 5) ⋅ 1015 molecules cm-3. The discrepancy between our results
and those of KS can be explained by taking into account the enhancement in kobs by
methanol. In Figure 2.2, we plot kobs(T), calculated for [CH3OH] = 3 ⋅ 1015 molecules
cm-3, using the values for k1 and k″ measured in the present experiment. The plot
demonstrates that we obtain the same observed reaction rate as KS under the same
experimental conditions. The plot also shows that at temperatures below 240 K, the
calculated rate constant begins to diverge from the recommended values. At 220 K, the
calculated values are 2 times larger.
To date, there are five published experimental studies of reaction (1) at
temperatures below 273 K. Studies conducted by KS, Lightfoot et al.9 and Takacs and
Howard10 employed methanol. A study by Dobis and Benson11 inferred k1 indirectly from
reactions initiated by Cl + C2H6 and has not influenced current recommendations. Maricq
and Szente12 studied reaction (1) in the absence of methanol. They utilized F2/H2/O2/N2
gas mixtures at 200 Torr and reported results similar to the current recommendations but
in disagreement with our results at low temperatures. At 222 K, their results agree with
the current recommendations, and are 40% higher than our value of k1 at zero-added
methanol after extrapolating to 100 Torr using the JPL recommended pressure-
dependence. They analyzed HO2 decays over a shorter time period, when competing
reactions are more important, and formed higher maximum [HO2] than in our experiment.
An Arrenhius plot for k″ is shown in Figure 2.3. The measured A and Ea/R values
(2σ) for k″ were (2.5 ± 5.9) ⋅ 10-36 cm6 molecule-2 s-1 and (-4570 ± 240) K, respectively.
Also plotted in Figure 2.3 are measurements of k″ by Andersson et al.6 which agree
favorably with our results at the two temperatures they investigated, 278 K and 299 K.
51
The rate enhancement due to methanol can be explained in terms of a hydrogen-
bonded complex. Prior investigators of the rate enhancement by CH3OH, H2O, and NH3
on reaction (1) have postulated that the effect is due to a hydrogen-bonded complex that
reacts with HO2 faster than HO2 reacts with itself.4-6 For methanol, the scheme can be
described as
M3 2 3 2CH OH + HO CH OH HO → ⋅← (3)
3 2 2 2 2 2 3CH OH HO + HO H O + O + CH OH⋅ → (4)
where k4 > k1. The temperature dependence of k″ can be shown to result from the
enthalpy change due to equilibrium (3).13 The measured Ea/R for k″ in our experiment
was equivalent to (-9.08 ± 0.48) kcal mol-1, which is consistent with the stabilization
energy of a strongly hydrogen-bonded complex. This is discussed in Chapter 3.
Reaction (1) proceeds via a complex potential energy surface and displays
pressure-dependent behavior. Both the NASA and IUPAC recommendations separate the
expression for the overall rate constant into two terms, i.e.,
1 o [M]k k k= + ′⋅ (0.5)
where ko and k′ are the bimolecular and termolecular components, respectively. For the
model calculations discussed below, we obtained ko from equation (0.5) using the JPL97-
4 recommended k′ = 1.7 ⋅ 10-33 ⋅ [M] ⋅ exp[1000/T], where the suggested uncertainty factor
is 1.3 and 2 at 298 K and 220 K, respectively (see DeMore et al.2 for an explanation of
52
the uncertainty factor). The following best-fit Arrenhius parameters (2σ) were obtained
for ko(T): A = (1.5 ± 0.2) ⋅ 10-12 cm3 molecule-1 s-1 and Ea/R = (-19 ± 31) K.
2.4 Atmospheric Implications
Measurements of H2O2 from space using infrared spectroscopy are potentially a
powerful way to ascertain [HOx] in the lower stratosphere and upper troposphere. In these
regions of the atmosphere, loss of H2O2 by photolysis
2 2H O 2 OHhv → (6)
is nearly an order of magnitude greater than other combined gas phase loss processes.
Assuming reaction (1) is the dominant source of H2O2, the relationship
2 6 2 22 24-hr ave
o
[H O ][HO ][M]
Jk k
⋅=+ ′ ⋅
(7)
can be established between [HO2] and [H2O2], where J6 is the photolysis rate of H2O2.
This relationship is sensitive to ko + k′ ⋅ [M], the rate coefficient of HO2 + HO2.
We tested our understanding of H2O2 HOx photochemistry by comparing
calculations using a constrained photochemical steady state model with observed profiles
of H2O2. Profiles of H2O2, shown in Figure 2.4, were obtained by two balloon-borne
Fourier transform spectrometers: the Harvard-Smithsonian FIRS-2 instrument that senses
H2O2 thermal emission from 80 cm-1 to 170 cm-1 14 and the JPL MkIV instrument that
uses mid-IR solar occultation.15

53
Three sets of model calculations are shown in Figure 2.4 to illustrate the
sensitivity of calculated H2O2 to certain kinetic parameters that govern HOx. The model
calculations were constrained by measurements of temperature, O3, H2O, CH4, NOy, and
Cly as well as profiles of sulfate aerosol surface area appropriate for the time of
measurement15 (K. W. Jucks et al., manuscript in preparation, 2002). One calculation,
denoted JPL00-3, used the current recommended rate constants.16 A second calculation,
denoted Model A, used JPL00-3 rate coefficients and the rate of HO2 + HO2 from this
study. A third calculation, denoted Model B, is identical to Model A except rate constants
from the JPL97-4 evaluation were used for O3 + OH (denoted reaction (8)) and O3 + HO2
(denoted reaction (9)). From the upper troposphere to the middle stratosphere, the
partitioning of HOx is mainly controlled by reactions (8) and (9). These reactions affect
calculated [HO2], and therefore [H2O2] via the HO2 + HO2 reaction. We include reactions
(8) and (9) in our sensitivity study because the recommended rates have recently
changed. We note that at low temperatures, JPL97-4 rates for these reactions lead to
lower calculated [HO2] and better agreement with measured [HO2]/[OH] in the lower
stratosphere.17
Use of the new rate for HO2 + HO2 (Models A and B) in the photochemical
simulation leads to significantly better agreement with measured H2O2 than is found
using JPL00-3 kinetics (Figure 2.4). Changes to the rates of reactions (8) and (9) have a
smaller effect on calculated H2O2 than the effect due to using the new rate of HO2 + HO2.
Nonetheless, use of JPL97-4 rates for reactions (8) and (9) together with the new rate for
HO2 + HO2 leads to slightly better overall agreement with measured H2O2 than is found
using JPL00-3 rates for reactions (8) and (9). Because our new rate for HO2 + HO2 differs

54
from the current recommendation mainly at low temperatures, the impact on model
calculations will be small for both the middle troposphere and the upper stratosphere. The
comparisons in Figure 2.4 suggest that, using the new rate coefficient for HO2 + HO2, the
kinetics governing the production and loss of H2O2 are well understood and that remote
measurements of [H2O2] can therefore be used to infer stratospheric [HOx] and place
strong constraints on upper tropospheric [HOx].
Acknowledgements. This work was supported by the NASA Upper Atmosphere
Research and Tropospheric Chemistry Programs and the NASA Graduate Student
Researchers Program (GRSP). We wish to thank The National Scientific Balloon Facility
(NSBF), Palestine, TX, for use of their facility and resources for the MkIV and FIRS-2
instruments. We also wish to thank D. J. Jacob and F. Ravetta for insight into the effect
of k1 on tropospheric chemistry, J. S. Francisco and J. C. Hansen for calculations
regarding hydrogen-bonding between methanol and HO2, and D. B. Natzic for his
invaluable experimental contributions. This research was carried out at the Jet Propulsion
Laboratory, California Institute of Technology, under contract with the National
Aeronautics and Space Administration.
2.5 References
1. Wallington, T. J., K. W. Jucks, et al. "Upper Limits for the Gas-Phase Reaction of
H2O2 with O3 and NO. Atmospheric Implications." Int. J. Chem. Kinet. 30: 707-
709 (1998).
55
2. DeMore, W. B., S. P. Sander, et al. (1997). Chemical Kinetics and Photochemical Data
for Use in Stratospheric Modeling, Evaluation Number 12. Pasadena, CA, Jet
Propulsion Laboratory, California Institute of Technology.
3. Atkinson, R., D. L. Baulch, et al. "Evaluated Kinetic and Photochemical Data for
Atmospheric Chemistry, Organic Species: Supplement VII." J. Phys. Chem. Ref.
Data 26: 1329-1499 (1997).
4. Lii, R.-R., R. A. Gorse, Jr. , et al. "Temperature Dependence of the Gas-Phase Self-
Reaction of HO2 in the Presence of NH3." J. Phys. Chem. 84: 813-817 (1980).
5. Kircher, C. C. and S. P. Sander "Kinetics and Mechanism of HO2 and DO2
Disproportionations." J. Phys. Chem. 88: 2082-91 (1984).
6. Andersson, B. Y., R. A. Cox, et al. "The Effect of Methanol on the Self Reaction of
HO2 Radicals." Int. J. Chem. Kinetics 20: 283-295 (1988).
7. Tyndall, G. S., R. A. Cox, et al. "Atmospheric Chemistry of Small Organic Peroxy
Radicals." J. Geophys. Res. 106: 12157-12182 (2001).
8. Curtis, A. R. and W. P. Sweetenham (1987). FACSIMILE/CHEKMAT, H015 ed.
Harwell: Oxfordshire (UK).
9. Lightfoot, P. D., B. Veyret, et al. "Flash Photolysis Study of the CH3O2 + HO2
Reaction between 248 and 573 K." J. Phys. Chem. 94: 708-714 (1990).
10. Takacs, G. A. and C. J. Howard "Temperature Dependence of the Reaction HO2 +
HO2 at Low Pressures." J. Phys. Chem. 90: 687-690 (1986).
11. Dobis, O. and S. W. Benson "Reaction of the Ethyl Radical with Oxygen at
Mmillitorr Pressures at 243-368 K and a Study of the Cl + HO2, Ethyl + HO2, and
HO2 + HO2 reactions." J. Am. Chem. Soc. 115: 8798-8809 (1993).
56
12. Maricq, M. M. and J. J. Szente "A Kinetics Study of the Reaction Between
Ethylperoxy Radicals and HO2." J. Phys. Chem. 98: 2078-2082 (1994).
13. Mozurkewich, M. and S. W. Benson "Self-Reaction of HO2 and DO2: Negative
Temperature Dependence and Pressure Effects." Int. J. Chem. Kinet. 17: 787-807
(1985).
14. Jucks, K. W., D. G. Johnson, et al. "Observations of OH, HO2, H2O, and O3 in the
Upper Stratosphere: Implications for HOx photochemistry." Geophysical
Research Letters 25: 3935-3938 (1998).
15. Sen, B., G. C. Toon, et al. "Measurements of Reactive Nitrogen in the Stratosphere."
Journal of Geophysical Research-Atmospheres 103: 3571-3585 (1998).
16. Sander, S. P., R. R. Friedl, et al. (2000). Chemical Kinetics and Photochemical Data
for Use in Stratospheric Modeling, Evaluation Number 13. Pasadena, CA, Jet
Propulsion Laboratory, California Institute of Technology.
17. Lanzendorf, E. J., T. F. Hanisco, et al. "Establishing the Dependence of [HO2]/[OH]
on Temperature, Halogen Loading, O3, and NOx Based on in Situ Measurements
from the NASA ER-2." J. Phys. Chem. A 105: 1535-1542 (2001).
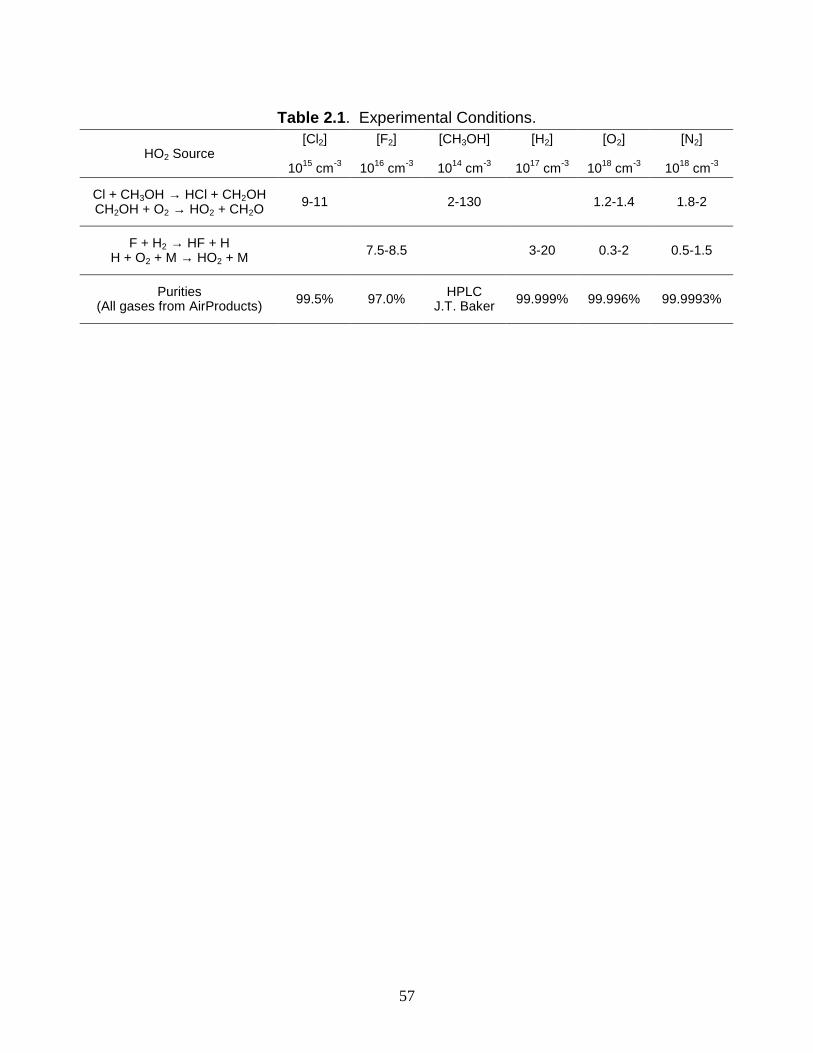
57
Table 2.1. Experimental Conditions.
HO2 Source [Cl2]
1015 cm-3
[F2]
1016 cm-3
[CH3OH]
1014 cm-3
[H2]
1017 cm-3
[O2]
1018 cm-3
[N2]
1018 cm-3
Cl + CH3OH → HCl + CH2OH CH2OH + O2 → HO2 + CH2O 9-11 2-130 1.2-1.4 1.8-2
F + H2 → HF + H H + O2 + M → HO2 + M 7.5-8.5 3-20 0.3-2 0.5-1.5
Purities (All gases from AirProducts) 99.5% 97.0% HPLC
J.T. Baker 99.999% 99.996% 99.9993%
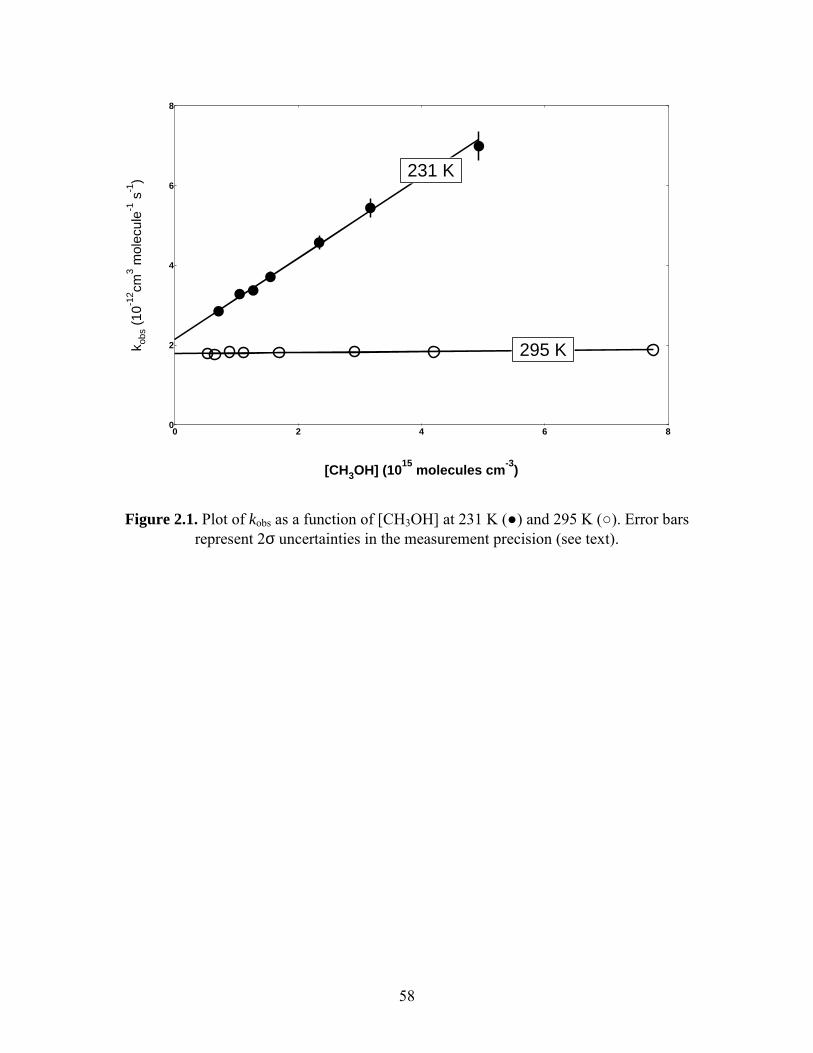
58
8
6
4
2
0
k obs
(10
-12 cm
3 mol
ecul
e-1 s
-1)
86420
[CH3OH] (1015
molecules cm-3
)
231 K
295 K
Figure 2.1. Plot of kobs as a function of [CH3OH] at 231 K () and 295 K (). Error bars represent 2σ uncertainties in the measurement precision (see text).
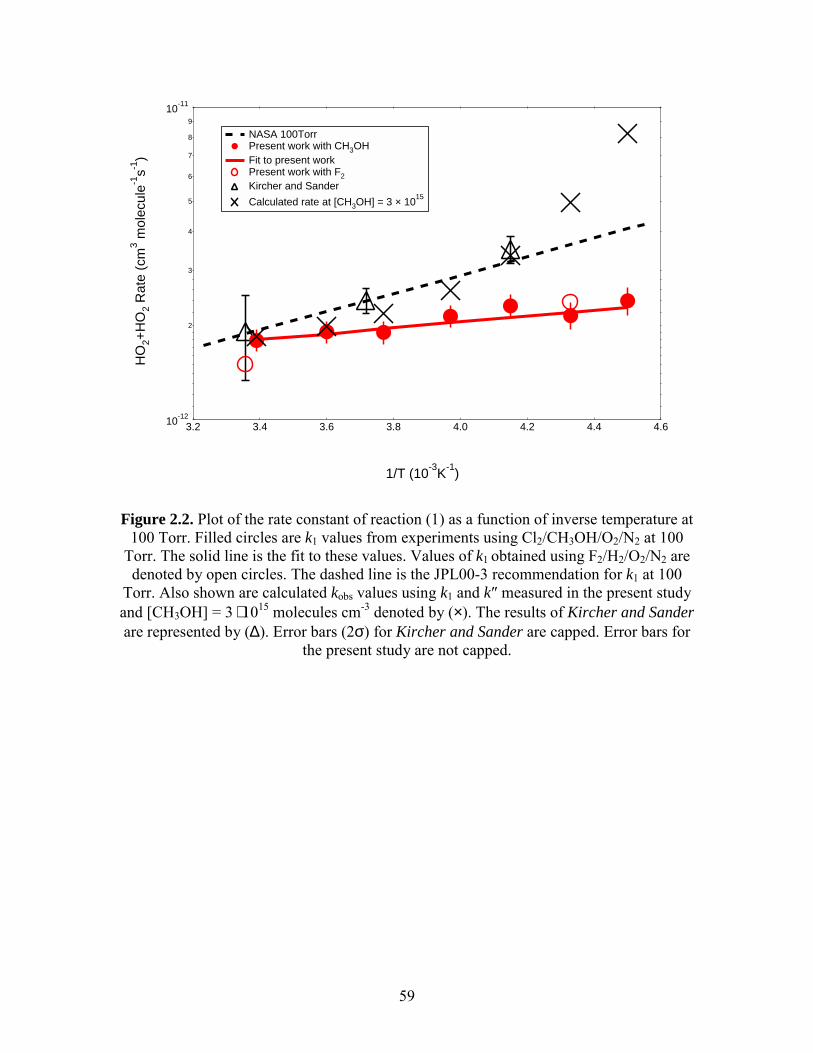
59
10-12
2
3
4
5
6
7
8
9
10-11
HO
2+H
O2
Rat
e (c
m3 m
olec
ule-1
s-1)
4.64.44.24.03.83.63.43.2
1/T (10-3
K-1
)
NASA 100Torr Present work with CH3OH Fit to present work Present work with F2
Kircher and Sander
Calculated rate at [CH3OH] = 3 × 10¹⁵
Figure 2.2. Plot of the rate constant of reaction (1) as a function of inverse temperature at 100 Torr. Filled circles are k1 values from experiments using Cl2/CH3OH/O2/N2 at 100
Torr. The solid line is the fit to these values. Values of k1 obtained using F2/H2/O2/N2 are denoted by open circles. The dashed line is the JPL00-3 recommendation for k1 at 100
Torr. Also shown are calculated kobs values using k1 and k″ measured in the present study and [CH3OH] = 3 ⋅ 1015 molecules cm-3 denoted by (×). The results of Kircher and Sander are represented by (∆). Error bars (2σ) for Kircher and Sander are capped. Error bars for
the present study are not capped.
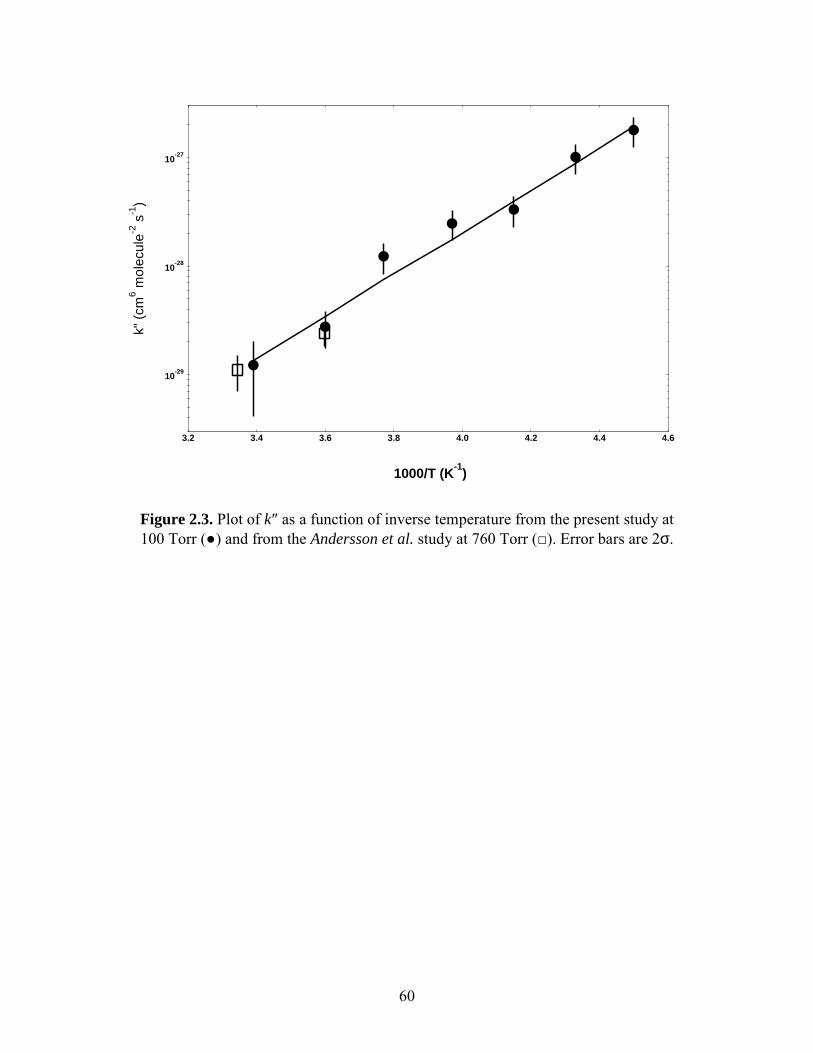
60
10-29
10-28
10-27
k" (
cm6 m
olec
ule-2
s-1
)
4.64.44.24.03.83.63.43.2
1000/T (K-1
)
Figure 2.3. Plot of k″ as a function of inverse temperature from the present study at 100 Torr () and from the Andersson et al. study at 760 Torr (). Error bars are 2σ.
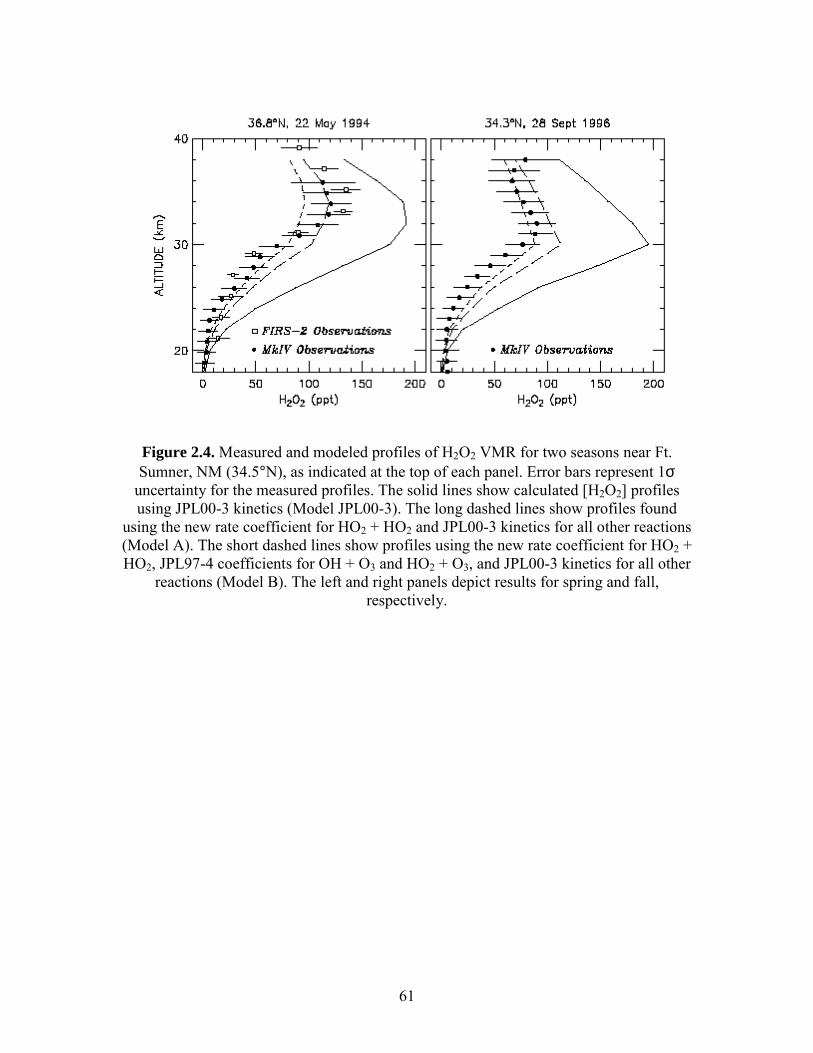
61
Figure 2.4. Measured and modeled profiles of H2O2 VMR for two seasons near Ft. Sumner, NM (34.5°N), as indicated at the top of each panel. Error bars represent 1σ
uncertainty for the measured profiles. The solid lines show calculated [H2O2] profiles using JPL00-3 kinetics (Model JPL00-3). The long dashed lines show profiles found
using the new rate coefficient for HO2 + HO2 and JPL00-3 kinetics for all other reactions (Model A). The short dashed lines show profiles using the new rate coefficient for HO2 + HO2, JPL97-4 coefficients for OH + O3 and HO2 + O3, and JPL00-3 kinetics for all other
reactions (Model B). The left and right panels depict results for spring and fall, respectively.
62
Chapter 3: The Methanol Chaperone Effect on HO2
Reactions
3.1 Introduction
The HO2 + HO2 reaction plays an important role in combustion and atmospheric
chemistry. HO2 is an intermediate in the oxidation of hydrocarbons, and its self-reaction
is the primary source of H2O2 in the stratosphere and upper troposphere.
Laboratory experiments have demonstrated that the observed rates of the HO2 +
HO2 and HO2 + NO2 + M reactions are enhanced in the presence of H2O, NH3, and
CH3OH.1-6 This enhancement has been attributed to the formation of the hydrogen-
bonded complex HO2·X, where X = H2O, NH3, or CH3OH. It is assumed that the HO2·X
complex is more reactive towards other species, such as HO2 and NO2, than uncomplexed
HO2. Under typical laboratory conditions, the formation and dissociation of the complex
is believed to be essentially instantaneous in comparison to the loss of HO2 due to
chemical reaction; therefore, equilibrium is established between HO2, X, and HO2·X. If
the equilibrium assumption is made, then the ratio of [HO2·X] to [HO2] increases linearly
with the concentration of X. In effect, by the formation of a hydrogen-bonded complex,
X chaperones HO2, making it more reactive towards other species. This is often termed
the chaperone effect.
This chapter presents experimental evidence for the formation of the HO2·CH3OH
complex. By measuring the time dependence of the HO2 signal in a laser-photolysis
63
experiment, we directly observed the establishment of equilibrium between CH3OH, HO2
and HO2·CH3OH and determined the equilibrium constant at temperatures between 231 K
and 261 K and at 50 and 100 Torr. We measured the rate coefficient for the HO2 +
CH3OH + M reaction and inferred the dissociation rate of the HO2·CH3OH complex. The
complex mechanism is further supported by comparisons of our experimental results with
ab initio calculations for the binding energy and geometry of HO2·CH3OH made at the
MP2 and CCSD(T) levels of theory. Furthermore, we measured the observed rate
coefficient for the HO2 self-reaction as a function of methanol concentration
simultaneously with UV an IR spectroscopy. From these measurements, we determined
rate coefficients for the HO2 + HO2·CH3OH and HO2·CH3OH self-reaction.
3.2 Experimental
The experimental apparatus is described in Chapters 1 and 5. Briefly, a 308 nm,
100 mJ/pulse excimer laser was used to photolyze either Cl2 or F2, initiating chemical
reactions in a temperature controlled reaction cell. IR and UV light sources probed the
temporal dependence of species within the reaction cell.
An IR beam emitted from a distributed feedback diode laser monitored the
temporal behavior of HO2 formed within the reaction cell. The diode laser probed a group
of blended ro-vibrational HO2 transitions near 6638.2 cm-1 associated with the OH
overtone stretch (2ν1) and nominally assigned to the qQ2 band head. The diode laser was
wavelength modulated, and 2f-Heterodyne detection was employed for the IR
measurements. The signal was calibrated by simultaneously measuring the second-order
rate coefficient of the HO2 self-reaction with IR and UV probes, as described in Chapter
64
1. Briefly, photolysis of F2-H2-O2-N2 gas mixtures was used to generate HO2. Using this
method of HO2 generation, problems from complex formation between HO2 and other
species present in the reaction cell were minimized. The measurement of the time-
dependent UV signal at 220 nm, corrected to give the HO2 concentration, provided a rate
coefficient in units of cm3 molecule-1 s-1 while the IR measurement determined a rate
coefficient in units of V-1 s-1. The ratio of the rate constants provided the scaling factor
that was used to convert the IR signal, in Volts, to molecules cm-3.
The IR signal was sensitive only to HO2. This was verified by studying the HO2
self-reaction using three distinct ro-vibrational HO2 transitions between 6625 cm-1 and
6638.2 cm-1. No significant discrepancies in the temporal dependence of the HO2 signal
were observed. Also, direct measurements of HCl, H2O2, and CH2O ruled out their
contributions in this spectral region. Methanol does absorb in this spectral region, but its
2f signal was insignificant at 6632.8 cm-1. We found no evidence for absorption by
HO2·CH3OH at 6638.2 cm-1, nor was it expected. Ab initio calculations of the
HO2·CH3OH complex, indicated that most of the hydrogen-bonding occurred between the
terminal H atom of HO2 and the O atom of CH3OH.7 The effect of hydrogen bonding on
overtone transitions is typically to decrease the intensity and shift the transition to lower
frequency.8 Ab initio calculations have indicated that for the HO2·H2O complex, a red
shift of around 300 cm-1 is expected for the O-H stretch.9 Thus, the overtone band of the
complex should be shifted completely out of the frequency range of the diode laser.
The UV beam from a D2 lamp measured the change in absorbance at 220 nm,
which was mainly due to HO2 and H2O2. However, it is possible that the HO2·CH3OH
complex would also absorb at this wavelength. The UV light excited the 2 2A″ ← X 2A″

65
transition of HO2. Ab initio calculations have indicated that the analogous transition in
the complex would be red-shifted by approximately 60 nm.10 To date, the UV spectrum
of the complex has not been experimentally observed. In previous studies of the methanol
enhancement of the HO2 self-reaction, it was noted that the dependence of the observed
rate coefficient on methanol concentration was consistent with the assumption that HO2
and the complex had similar UV cross sections at 220 nm. Similar arguments were made
for the UV absorption of the HO2·NH3 and HO2·H2O complexes as well. However, these
inferences are indirect, and no quantitative data yet exists on the relative magnitudes of
the UV cross sections of HO2 and any HO2·X complex.
All kinetic modeling discussed in this paper utilized the FACSIMILE modeling
program.11 The FACSIMILE program was used to evaluate the impact of possible
secondary reactions on the data analysis, rather than to determine any experimental
parameters. It was also used to verify the analytical expressions derived for the time
dependence of the HO2 signal as well as the analytical expressions derived for the
observed rate constant for the HO2 self reaction for the IR and UV channels. The
chemical reactions used in the kinetic modeling are listed in Table 3.1. The sources for
the values of the rate coefficients are also listed in the table. Most of the rate coefficient
values were taken from the 1997 NASA compendium.12
For this work, two different methods of HO2 generation were employed. The
methods differed in which halogen species was photolyzed and which reagents were
employed for HO2 formation.
66
In the first approach, photolysis of F2-H2-O2-N2 gas mixtures was used to
calibrate the IR signal and to confirm the trend of the observed rate of HO2 + HO2 with
methanol. The HO2 formation chemistry is as follows:
2F 2 Fhv → (1)
2F + H HF + H → (2)
M2 2H + O HO → (3)
Table 3.2 lists the gas concentrations employed. The effect of secondary formation of
FO2 via F + O2 + M on the UV signal was considered, because FO2 absorbs strongly in
the UV and the dissociation of FO2 into F + O2 is thought to be in the range of 40 s-1 to
80 s-1 at 300 K and 100 Torr.12 Thus, FO2 could contribute to a UV signal that decayed on
the timescale of the HO2 self-reaction in the present experiment. However, the effect of
FO2 could be neglected for three reasons. First, we found good agreement between the
measured IR and UV rate coefficients for the HO2 self-reaction. If there were spectral
interference in the UV channel, the IR and UV measurements would differ. Second, the
residual absorption in the UV was constant after the self-reaction had completed and
consistent with the formation of H2O2 product from the HO2 self-reaction. Finally, at the
highest ratio of [O2]/[H2] employed, [O2]/[H2] = 3, the maximum fraction of F atoms
predicted to react with O2 as opposed to H2 (based on the rate coefficients in the 1997
NASA compendium for F + O2 + M and F + H2) at [O2]/[H2] = 3, was approximately
0.2% at 300 K and 0.5% at 230 K. This amount of FO2 would not contribute significantly
67
to the UV absorption, nor would it affect the time dependence of [HO2] through
secondary chemistry.
F and H atom concentrations were high at early times. However, kinetic modeling
determined that under typical conditions used in the fluorine chemistry, reactions of these
atoms with HO2 could be neglected. The time constant for HO2 formation was in the µs
regime and the time constant for F disappearance was in the 100 ns regime. Because [H2]
>> [HO2], possible complications arising from F + HO2 were determined to be minimal.
During the first 20 µs, H atoms co-exist with HO2 due to the reaction F + H2 → HF + H.
The pseudo-first-order rate of H consumption by O2 was approximately 2 × 10⁵ s-1 at
100 Torr. Kinetic modeling determined that the H + HO2 reaction was unimportant.
For most of the experiments discussed in the present work, the second method for
HO2 generation, by photolysis of Cl2-CH3OH-O2-N2 gas mixtures, was employed. The
reaction sequence is as follows:
2Cl 2 Clhv → (4)
3 2Cl + CH OH HCl + CH OH → (5)
2 2 2 2CH OH + O HO + CH O → (6)
M3 2 3 2M
CH OH + HO CH OH HO → ⋅← (7,-7)
2 3 2HO + CH OH HO Products⋅ → (8)
2 3 2 3HO CH OH + HO CH OH Products⋅ ⋅ → (9)
bi-molecular2 2 2 2 2ter-molecularHO + HO H O + O → (10)
HO2 formation
Complex formation/ dissociation
HO2 and HO2·CH3OH chemical loss

68
Table 3.2 lists the gas concentrations employed. The values of the rate coefficients for the
reactions listed above are given in Table 3.2. The values for reactions (1) through (6)
were taken from the 1997 NASA compendium12 and the value for reaction (10) was taken
from Chapter 2. The rate coefficient values for reactions (7) through (9) were measured
in the present study. The concentrations of O2 and CH3OH were sufficiently high in
comparison to other reactive species so that bi-molecular reactions involving either O2 or
CH3OH could be considered as pseudo-first-order.
There are three main kinetic processes to consider in the above reaction scheme:
HO2 formation via reactions (5) and (6); complex formation and dissociation via
reactions (7) and (-7); and total HO2 and HO2·CH3OH loss via reactions (8), (9) and (10).
Complications from reactions not listed in the scheme above were considered
insignificant. The effect of the Cl + HO2 reaction was negligible because of three reasons:
first, most Cl atoms had reacted with CH3OH before HO2 concentrations became
appreciable; second, [CH3OH] >> [HO2], so virtually all Cl atoms reacted with CH3OH;
third, k5 is within an order of magnitude of the collision limit. Kinetic modeling
demonstrated that the Cl + HO2 reaction accounted for less than 0.1% of the loss of Cl at
[CH3OH] = 1 × 10¹⁶ molecules cm-3 at all temperatures when the NASA recommend
values12 for the Cl + HO2 reaction were used. Kinetic modeling also showed that the
reaction between HO2 + CH2OH was insignificant, because the O2 + CH2OH rate
coefficient is large and also [O2] >> [HO2].
For both photolysis schemes, secondary products are formed that can potentially
form a hydrogen-bond with HO2. For F2-photolysis, every F atom produced results in one

69
HF molecule formed. For Cl2-photolysis, every Cl atom results in one CH3OH lost, and
one HCl and CH2O gained. For both schemes, H2O2 is a product of the subsequent
reactions of HO2. If it is assumed that HF, HCl, CH2O, and H2O2 have the same rate
enhancing effect as CH3OH, then the calculated enhancement due to secondary product
formation, at 231 K, 100 Torr, and [Cl]o = [F]o = 8 × 10¹³ atoms cm-3, is less than 8%,
based on prior measurements of the rate enhancement due to methanol, explained in
Chapter 2. This calculation assumed the value of [H2O2] from the completed HO2 + HO2
reaction. No corrections were made to any measured parameters due to possible rate
enhancement from secondary products in the present work.
This paper discusses three distinct sets of direct measurements: measurements of
the equilibrium constant between HO2, CH3OH, and HO2·CH3OH, denoted Kc, where the
subscript c refers to the fact that it is expressed in terms of concentration as opposed to
pressure; measurements of k7; and measurements of the observed rate coefficient for the
HO2 self-reaction as a function of methanol concentration, denoted kobs. The term
observed refers to that fact that 2[HO ]ddt
and 2 2 3[HO ] [HO CH OH]ddt
+ ⋅, the loss
rates for the IR and UV probes, respectively, are the aggregate of reactions (7) through
(10).
Values for Kc were obtained by measuring the change in the equilibrium [HO2] as
a function of [CH3OH] using IR detection. These measurements were conducted within
the first 50 µs after photolysis. Measurements of k7 were conducted at different
temperatures and pressures using IR detection. These measurements were also conducted
within the first 50 µs after photolysis. The values of k7 and Kc where used to derive k-7.
The UV probe was not utilized for measurements of Kc and k7 due to scattered light from
70
the excimer pulse, which saturated the PMT. The PMT signal was adversely affected
until 200 µs to 400 µs after the photolysis event. Measurements of kobs as a function of
methanol concentration used simultaneous IR and UV spectroscopy. These measurements
were conducted between 200 µs and 38 ms after photolysis. From these measurements,
the rate coefficients k8 and k9 were indirectly obtained.
A SRS SR560 low-noise preamplifier with a low-pass filter was used to provide
gain to the demodulated signal. The low-pass filters had maximum bandwidths of 1 MHz
and were not utilized for measurements of Kc and k7. It was observed experimentally that
for a gain of 1000, which was the setting utilized for all experiments discussed in this
paper, the inherent low-pass bandwidth of the preamplifier circuitry was approximately
2 MHz (3dB point). Further, there was a phase-shift that imposed a measured delay of
approximately 500 ns upon the signal entering the preamplifier. For measurements of
kobs, the low-pass filters were set at the sampling rate of the data acquisition card housed
inside the computer. The trigger came from a voltage drop induced by the excimer light
impinging on a photodiode. The cable from the photodiode to the trigger input of the data
acquisition card was approximately 2 meters. It was assumed that the time between the
photolysis event and when the data acquisition card received the trigger signal was less
than 50 ns.
After passing through the preamplifier, the signal was digitized at 16 bits of
precision by a Gage Compuscope 1602 data acquisition card. The bandwidth of the
sample and hold amplifier on the card was 1.25 MHz. For measurements of Kc and k7,
data were sampled at the highest rate possible, 2.5 MS s-1, or a sampling interval of
400 ns. For measurements of kobs, data were sampled between 20 kHz and 100 kHz.

71
3.3 Measurements of Kc
Measurements of Kc employed the Cl2-CH3OH-O2-N2 system for HO2 generation.
A typical example of the influence of methanol on the HO2 signal is shown in Figure 3.1
for experiments conducted at 251 K at different CH3OH concentrations. The figure
demonstrates that the average signal between 20 µs and 50 µs, was greater at low
[CH3OH]. The decrease in the HO2 signal upon addition of CH3OH was due to a shift in
the equilibrium concentrations of HO2 and HO2·CH3OH. Addition of CH3OH promotes
the formation of HO2·CH3OH at the expense of HO2.
The change in [HO2] between 20 µs and 50 µs was observed to be less than 5%
under all conditions. This indicated that the loss of [HO2] due to reactions (8), (9), and
(10) was less than 5% during the first 50 µs after photolysis. Subsequent kinetic modeling
of the system using the measured values for reactions (8) and (9), given below, verified
that the loss of HO2 was less than 5% during this time period. By 20 µs, HO2 formation
was observed to be complete under all experimental conditions. This was verified by
calculating the time constant for HO2 formation at the lowest [CH3OH] employed. This
calculation yielded k5(3 × 10¹⁵ molecules cm-3)-1 = 6 µs. HO2 was observed to be in
equilibrium with CH3OH and HO2·CH3OH by 20 µs, based on the constant [HO2]
between 20 µs and 50 µs. The assumption that equilibrium was established by 20 µs was
verified by measuring the rate coefficient for HO2 + CH3OH + M. It will be shown below
that the first order rate constant for the establishment of equilibrium is approximately k7
·[CH3OH] + k-7. The rate constant can be re-written as k7[CH3OH] + Kc-1. From
measurements of Kc and k7, discussed below, [CH3OH] + Kc-1 > 2 × 10¹⁶ molecules

72
cm-3 and k7 ~ 4 × 10-12 cm3 molecule-1 s-1. Therefore k7[CH3OH] + Kc-1, the rate at
which equilibrium is established, was greater than 8 × 10⁴ s-1. This was equivaltent to a
time constant of approximately 13 µs.
A simplified kinetic scheme can be written for the establishment of equilibrium
during the first 50 µs after photolysis. Assuming the loss of [HO2] + [HO2·CH3OH] via
reactions (8), (9), and (10) is negligible, the kinetics of HO2 formation and subsequent
kinetics of the formation and dissociation of HO2·CH3OH can be simplified as follows:
ba2 2 3-b
Cl HO HO CH OH → → ⋅← (11)
where ka ≈ k5·[CH3OH] for [CH3OH] < 0.1 × [O2], which was true for all experiments, kb
= k7·[CH3OH], and k-b = k-7. In effect, Cl atoms are transformed into [HO2] +
[HO2·CH3OH] and the partitioning of [HO2] and [HO2·CH3OH] is determined by Kc.
The time dependence for [HO2] can be expressed as
a- t - t-b -b a a b2 o
a a
[HO ] [Cl]( )
kk k k k ke ek k
λ
λ λ λ λ −= + + − −
(12)
where λ = kb + k-b. The condition [HO2]/dt = 0 exists at t = ln[kb/(ka - k-b)]/(λ - ka). This
implies that in order for there to be an observable maximum HO2 signal, [CH3OH] > k-7
/k5, that is, the concentration of methanol has to be sufficiently high. As can be seen in
Figure 3.1, at sufficiently high [CH3OH], a non-equilibrium system was clearly
73
established within a few µs in which [HO2] > [HO2]eq. The system then relaxed
towards equilibrium on the timescale of several µs.
At a given temperature, [HO2]eq was measured as a function of [CH3OH]. Let
[HO2]eq,o represent [HO2]eq in the limit of zero added methanol. The following formula
can used to relate [HO2]eq,o to [CH3OH], enabling the determination of [HO2]o:
-1 -1 -1
2 eq eq 2 eq,o 3 2 eq,o[HO ] = [HO ] [CH OH]+ [HO ]K ⋅ ⋅ (13)
From a linear fit, the value of [HO2]eq,o is obtained. Equation (13) can be re-written as
2 eq,oeq 3
2 eq
[HO ]= 1 + [CH OH]
[HO ]K (14)
The slope of equation (14) gives Kc. Plots of [HO2]eq,o/[HO2]eq versus [CH3OH] are
shown in Figure 3.2 for experiments done at 231 K and 261 K. The value of Kc was
measured at 231 K, 240 K, 251 K, and 261 K. At each temperature, between 10 and 15
observations were used to infer Kc. The measured values for Kc (T) are listed in Table 3.3.
The vant Hoff equation was used to infer ∆H and ∆S from a weighted fit of Kp(T)
versus T using the equation Kp(T) = A·exp(∆H/RT). Kp(T) = Kc(T)·(6.022×10²⁰ molecules
L mol-1 cm-3)·(RT)-1, where R = 0.0821 L atm mol-1 K-1. From the fit, the obtained values
were A = (1.0 ± 1.0) × 10-5 L mol-1 and ∆H = (-36 ± 3) kJ mol-1. The value of A translates
to ∆S = (-96 ± 96) J mol-1 K-1.

74
The uncertainty (1σ) in determining [HO2]o ranged from 3% at 231 K to
approximately 20% at 261 K. Error due to inaccurate calibration of the IR signal was
insignificant because the calibration factor is ratioed out of equations (13) and (14). The
combined uncertainty in the knowledge of the vapor pressure of CH3OH, the flow of gas
through the bubbler, and the temperature of the liquid bath in which the bubbler was
placed was approximately 5% at all temperatures. The uncertainty in determining [HO2]eq
due to noise in the IR signal was approximately 3-5% of [HO2]eq,o. Uncertainty in the
accuracy of Kc due to temperature was 8% at 231 K, and 6% at 261 K. When added in
quadrature, the final uncertainty for Kc(T) was between 10% and 20%.
3.4 Measurements of k7 and k-7
The values of k7 and k-7 were derived from a subset of the experimental data used
to determine Kc. Only experiments in which the decrease in the HO2 signal due to
reaction (7) was more than five times greater than the standard deviation of [HO2]eq were
analyzed. Of the 57 individual observations, only 15 met this criterion.
As stated in the Experimental section, the preamplifier introduced a delay in
signal digitization relative to the photolysis event that resulted in uncertainty in the
knowledge of when the photolysis event occurred. Also, the resolution of the signal with
respect to time was 400 ns. The expected rise times of HO2 were on the order of 100 ns to
several µs, which meant that attempts to fit the HO2 time dependence with a kinetic
model were subject to an error due to a lack of time resolution. Further, the first 1.2 µs of
data after photolysis was heavily affected by noise associated with the excimer laser. To

75
address of these concerns, a simplified kinetic scheme was used to describe the time
dependence of [HO2] as follows:
7 3
-7
[CH OH]2 2 3[HO ] [HO CH OH]
k
k
⋅→ ⋅← (15)
For such a scheme, the time dependence for [HO2] can be expressed as
( )( )7 3 -7[CH OH]7 32 2 o
7 3 -7
[CH OH][HO ] [HO ] 1[CH OH]
k kk ek k
− + = − +
(16)
where [HO2]o represents [HO2] at time = 0. For equation (16) to be valid, loss of [HO2]
and [HO2·CH3OH] by reactions (8), (9), and (10) has to be insignificant and production
of HO2 via reactions (5) and (6) has to be complete before the signal was analyzed. The
former condition was met by limiting the analysis to within 20 µs after photolysis. As
discussed above for measurements of Kc, the decrease in the HO2 signal between 20 µs
and 50 µs was less than 5%. This indicated that loss of [HO2] and [HO2·CH3OH] by
reactions (8), (9), and (10) was insignificant. The time constant for HO2 formation was
calculated to be less than 1 µs for all individual experiments that qualified for analysis by
equation (16). Because the start of fitting was at (1.6 ± 0.2) µs, that latter condition for
analysis by equation (16) was met. The uncertainty in the time of fitting was due to the
resolution of the measurements.
The values of k7 and [HO2]o were allowed to vary. The measured values of
[CH3OH] and [HO2]eq were held constant. The fitted value of Kc(T) was used to replace

76
k-7 with k7/Kc. This ensured that the fitting process was sensitive to k7. Use of equation
(16) removed errors associated with the sampling intervals that were much longer than
the time for HO2 formation. The value of [HO2]o was not a meaningful quantity since it
was an extrapolation. Fits were done between 1.6 µs and 20 µs. An example of a fit is
shown in Figure 3.4 for 240 K, 100 Torr, and [CH3OH] = 9.1 × 10¹⁶ molecules cm-3.
Measured values for k7 at different pressures and temperatures are listed in Table 3.3.
Errors due to uncertainty in the calibration of the IR signal were negligible because the
calibration factor was ratioed out of equation (16).
3.5 Kinetic Measurements of kobs as a Function of Methanol Concentration
In contrast to the measurements of Kc and k7, conducted within the first 50 µs
after photolysis, measurements of kobs were done between 200 µs to 38 ms. In this time
regime, HO2, CH3OH, and HO2·CH3OH can be assumed to be in equilibrium because the
time constant for the establishment of equilibrium was on the order of µs, as discussed in
section 3.3, and the timescale of the observed HO2 loss was on the order of milliseconds.
Rate coefficients were obtained in both the UV and IR, and are denoted kobs,ir and kobs,uv
respectively. Results for kobs,uv at 100 Torr and between 222 K and 298 K have been
presented previously in Chapter 2. Comparisons between kobs,ir and kobs,ir are shown in
Figure 3.5 for the temperatures 295 K and 241 K. Overall, it was observed that for T ≥
241 and [CH3OH] < 6 × 10¹⁵ molecules cm-3, kobs,ir ≈ kobs,uv. It was observed that kobs,ir and
kobs,uv were second-order under these same conditions. The criteria for being second-order
was that the measured value of the rate coefficient not change by more than 10% between
fits that were conducted from 250 µs to 10 ms and fits that were conducted from 250 µs
77
to 20 ms. Typical examples of data collected at 231 K and 100 Torr for both the IR and
UV channels are shown in Figures 3.6.1 and 3.6.2. To aid in ascertaining the signal-to-
noise, the span of the residual plots on the figures are 20% of the maximum signal
acquired for each channel.
At 231 K, there were significant differences between the IR and UV
measurements. As depicted in Figure 3.7, for [CH3OH] > 5 × 10¹⁵ molecules cm-3, the
difference between kobs,uv and kobs,ir was greater than the scatter in the rate measurements,
and kobs,ir > kobs,uv. It was observed that for [CH3OH] < 2 × 10¹⁶ molecules cm-3, kobs,ir met
the criterion for second-order reactivity. However, at [CH3OH] ~ 5 × 10¹⁵ molecules
cm-3, measurements of kobs,uv done over 10 ms were about 10% larger than those
conducted over 20 ms. At [CH3OH] ~ 1 × 10¹⁶ molecules cm-3, measurements done over
10 ms were between 20% and 50% larger than those conducted over 20 ms. Figure 3.7
also indicates that 2
obs,ir2
3
0[CH OH]d k
d> and
2obs,uv
23
0[CH OH]d k
d< .
As discussed in the above in the Experimental section, IR signal was assumed to
measure only [HO2] while the UV measured [HO2] + [HO2·CH3OH]. Previous
investigators of the enhancement of the HO2 self-reaction by NH3 and H2O have derived
an expression for the dependence of kobs,uv on [NH3] and [H2O].13 Following their
example, kobs,ir and kobs,uv can be expressed as
( )2 2
10 8 c 3 9 c 3obs,ir
c 3
[CH OH] [CH OH]1 [CH OH]
k k K k KkK
+ ⋅ ⋅ + ⋅ ⋅=+ ⋅
(17)
( )
2 210 8 c 3 9 c 3
obs,uv 2c 3
[CH OH] [CH OH]1 [CH OH]
k k K k KkK
+ ⋅ ⋅ + ⋅ ⋅=+ ⋅
(18)
78
The only difference between equations (17) and (18) is the exponent on the denominator.
Equations (17) and (18) indicate that at low [CH3OH], kobs,ir ≈ kobs,uv ≈ k10 + k8·Kc
·[CH3OH]. From Chapter 2, k8·Kc at 231K was determined to be approximately 1 × 10-27
cm6 molecule-2 s-1.14 In that chapter, k8·Kc was equivalent to k′. Using the value Kc(231 K)
≈ 5 × 10-17 cm3 molecule-1, determined in the present study, k8 ≈ 2 × 10-11 cm3 molecule-1
s-1.
From equation (17), it can be shown that the observation 2
obs,ir2
3
0[CH OH]d k
d> , which
is evident in Figure 3.7, implies that k9 > (k8 k10) ≈ 1.8 × 10⁻¹¹ cm3 molecule-1 s-1. This
indicates that the self-reaction of the complex occurs at a significant rate.
The data shown in Figure 3.7 was fit using equations (17) and (18) to determine
values for k8 and k9. As stated above, the data was acquired at 231 K and 100 Torr. The
values used for k10 and Kc were 2.2 × 10⁻¹² cm3 molecule-1 s-1 and 4.8 × 10⁻¹⁷ cm3
molecule-1, respectively. The value of k10 was taken from Chapter 2 and the value of Kc
taken from this work. The values of k10 and Kc were held constant during the fitting
process. The fitted parameters for the IR data using equation (17) were: k8 = (2.3 ± 0.2) ×
10-11 cm3 molecule-1 s-1 and k9 = (7.1 ± 0.4) × 10-11 cm3 molecule-1 s-1. The fitted
parameters for the UV data using equation (18) were: k8 = (3.1 ± 0.5) × 10-11 cm3
molecule-1 s-1 and k9 = (3.3 ± 2.2) × 10-11 cm3 molecule-1 s-1.
The values acquired from fitting the IR data were considered more accurate than
the values acquired in the UV. This judgement was based on the high degree of
uncertainty in the individual UV measured rate coefficients due to poor signal-to-noise as

79
well as the fact that the UV signal departed significantly from second-order at high
concentrations of methanol. Further, the assumption that HO2 and HO2·CH3OH absorb
identically has not yet been experimentally verified.
3.6 Discussion
Aloisio et al.15 measured ∆H = (-36 ± 16) kJ mol-1 for HO2 + H2O M
M →←
HO2·H2O. In the present study, ∆H = (-36 ± 3) kJ mol-1 for HO2 + CH3OH M
M →←
HO2·CH3OH. However, Aloisio et al. measured ∆S to be (-85 ± 40) J mol-1 K-1 whereas
we determined ∆S = (-96 ± 96) J mol-1 K-1. The values of equilibrium constants they
measured for H2O M
M →← HO2·H2O were a factor of 3.5 larger than Kc measured in the
present study.
Our calculations indicated that ∆H = -37 kJ mol-1 which is very similar to what
we measured from experiment. However, the experimental values for Kc were a factor of
16 to 18 higher than what was calculated.
As stated above, k8 = (2.3 ± 0.2) × 10-11 cm3 molecule-1 s-1 and k9 = (7.1 ± 0.4) ×
10-11 cm3 molecule-1 s-1. The observation of a fast rate coefficient for reaction (8) is not
unexpected. However, the observation of a fast rate coefficient for reaction (9) is an
important finding. Hamilton and Lii13 argued, based on experimental evidence, that the
rate coefficient for reaction (9) was negligibly small. Bloss et al.16 measured k9 to be (3.2
± 0.5) × 10-11 cm3 molecule-1 s-1.

80
3.7 Conclusions
We measured the value of Kc for HO2 + CH3OH ↔ HO2·CH3OH and the rate
coefficient for the forward process. From these measurements, we inferred the
dissociation rate for HO2·CH3OH. We compared measured values of Kc to theoretical
calculations. We also measured the observed rate of the HO2 self-reaction in the presence
of methanol and determined, indirectly, the rate coefficients for HO2 + HO2·CH3OH and
the HO2·CH3OH self-reaction. Our results confirm that the mechanism responsible for the
observed rate enhancement is due to the formation of a hydrogen-bonded complex.
3.8 References
1. Chapter 1.
2. Hamilton, E. J., Jr. "Water Vapor Dependence of the Kinetics of the Self-reaction of
HO2 in the Gas Phase." J. Chem. Phys. 63: 3682-3683 (1975).
3. Lii, R.-R., R. A. Gorse, Jr. , et al. "Temperature Dependence of the Gas-Phase Self-
Reaction of HO2 in the Presence of NH3." J. Phys. Chem. 84: 813-817 (1980).
4. Lii, R.-R., M. C. Sauer, Jr., et al. J. Phys. Chem. 85: 2833-2834 (1981).
5. Kircher, C. C. and S. P. Sander "Kinetics and Mechanism of HO2 and DO2
Disproportionations." J. Phys. Chem. 88: 2082-91 (1984).
6. Andersson, B. Y., R. A. Cox, et al. "The Effect of Methanol on the Self Reaction of
HO2 Radicals." Int. J. Chem. Kinetics 20: 283-295 (1988).
7. Hansen, J. C. "Private communication."
8. Pimentel, G. C. and A. L. McClellan (1960). The Hydrogen Bond. San Francisco and
London, W. H. Freeman and Company.
81
9. Aloisio, S. and J. S. Francisco "Existence of a Hydroperoxy and Water (HO2·H2O)
Radical Complex." J. Phys. Chem. A 102: 1899-1902 (1998).
10. Aloisio, S., Y. Li, et al. "Complete Active Space Self-Consistent Field and
Multireference Configuration Interaction Studies of the Differences Between the
Low-Lying Excited States of HO2 and HO2 H2O." Journal of Chemical Physics
110: 9017-9019 (1999).
11. Curtis, A. R. and W. P. Sweetenham (1987). FACSIMILE/CHEKMAT, H015 ed.
Harwell: Oxfordshire (UK).
12. DeMore, W. B., S. P. Sander, et al. (1997). Chemical Kinetics and Photochemical
Data for Use in Stratospheric Modeling, Evaluation Number 12. Pasadena, CA,
Jet Propulsion Laboratory, California Institute of Technology.
13. Hamilton, E. J., Jr. and R.-R. Lii "The Dependence on H2O and on NH3 of the
Kinetics of the Self-Reaction of HO2 in the Gas-Phase Formation of HO2·H2O and
HO2·NH3 Complexes." Int. J. Chem. Kinet. 9: 875-885 (1977).
14. "Chapter 2."
15. Aloisio, S., J. S. Francisco, et al. "Experimental Evidence for the Existence of the
HO2-H2O Complex." J. Phys. Chem. 104: 6597-6601 (2000).
16. Bloss, W. J., D. M. Rowley, et al. "Rate Coefficient for BrO + HO2 Reaction at 298
K." Phys. Chem. Chem. Phys. 4: 3639-3647 (2002).
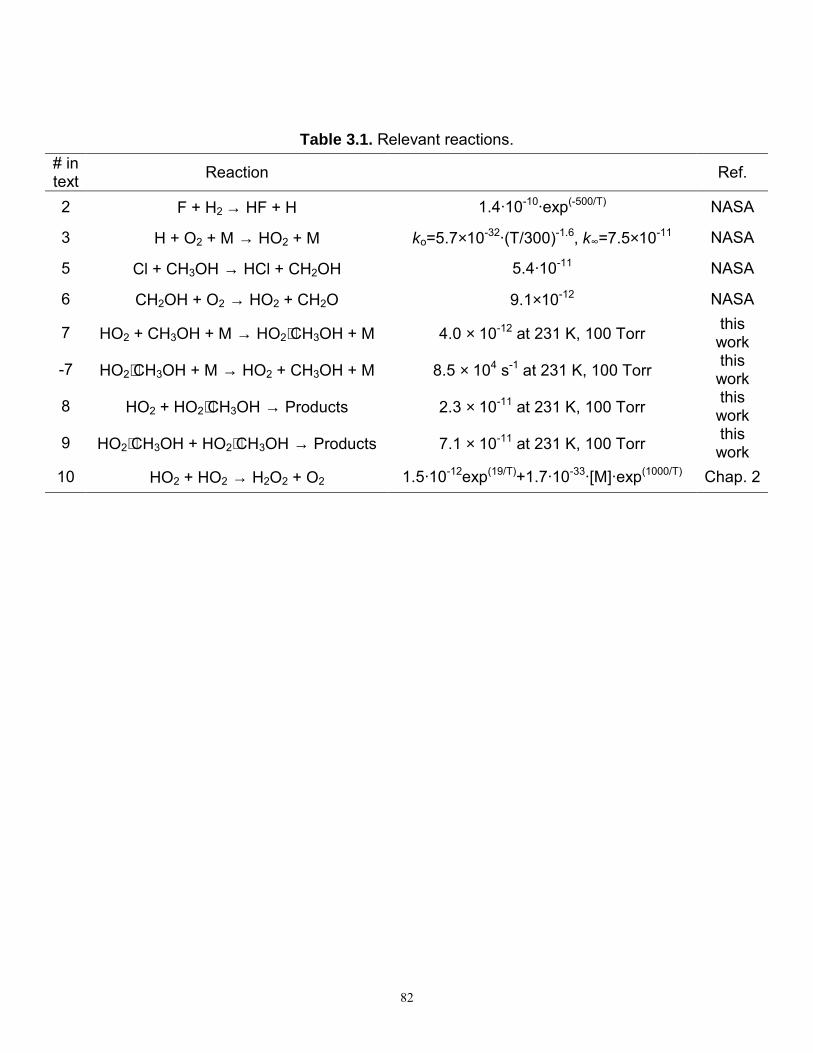
82
Table 3.1. Relevant reactions. # in text Reaction Ref.
2 F + H2 → HF + H 1.4·10-10·exp(-500/T) NASA
3 H + O2 + M → HO2 + M ko=5.7×10⁻³²·(T/300)-1.6, k∞=7.5×10⁻¹¹ NASA
5 Cl + CH3OH → HCl + CH2OH 5.4·10-11 NASA
6 CH2OH + O2 → HO2 + CH2O 9.1×10⁻¹² NASA
7 HO2 + CH3OH + M → HO2⋅CH3OH + M 4.0 × 10⁻¹² at 231 K, 100 Torr this work
-7 HO2⋅CH3OH + M → HO2 + CH3OH + M 8.5 × 10⁴ s-1 at 231 K, 100 Torr this work
8 HO2 + HO2⋅CH3OH → Products 2.3 × 10⁻¹¹ at 231 K, 100 Torr this work
9 HO2⋅CH3OH + HO2⋅CH3OH → Products 7.1 × 10⁻¹¹ at 231 K, 100 Torr this work
10 HO2 + HO2 → H2O2 + O2 1.5·10-12exp(19/T)+1.7·10-33·[M]·exp(1000/T) Chap. 2

83
Table 3.2. Experimental conditions. Measurements of Keq, k7 and k-7
Temp K
[M] Torr
[Cl2] 1014 cm-3
[O2] 1018 cm-3
[CH3OH] 1016 cm-3
[N2] 1018 cm-3
231 50 30 - 33 0.9 - 1.5 0.5-2.4 0.9 1 .5 231 100 5.4 - 7.1 1.6 0.3-2.2 1.6 240 100 4.3 - 9.1 2.7 - 3.5 1.4-9.1 0 0.8 251 100 6.1 - 9.6 2.2 - 3.4 5.1-28 0 1.2 261 100 4.3 - 14 2.2 - 3.3 4.5-33 0 - 1.1
Measurements of kobs at 100 Torr HO2
source [F2] 1016
[Cl2] 1015 cm-3
[O2] 1018 cm-3
[CH3OH] 1014 cm-3
[H2] 1017 cm-3
[N2] 1018 cm-3
Cl2 + hν 5-11 1-2 2-200 1.8-2 F2 + hν 2-8 0.3-1 3-10 0.5-1.5
gas purity 97% 99.5% 99.996% HPLC 99.999% 99.9993%
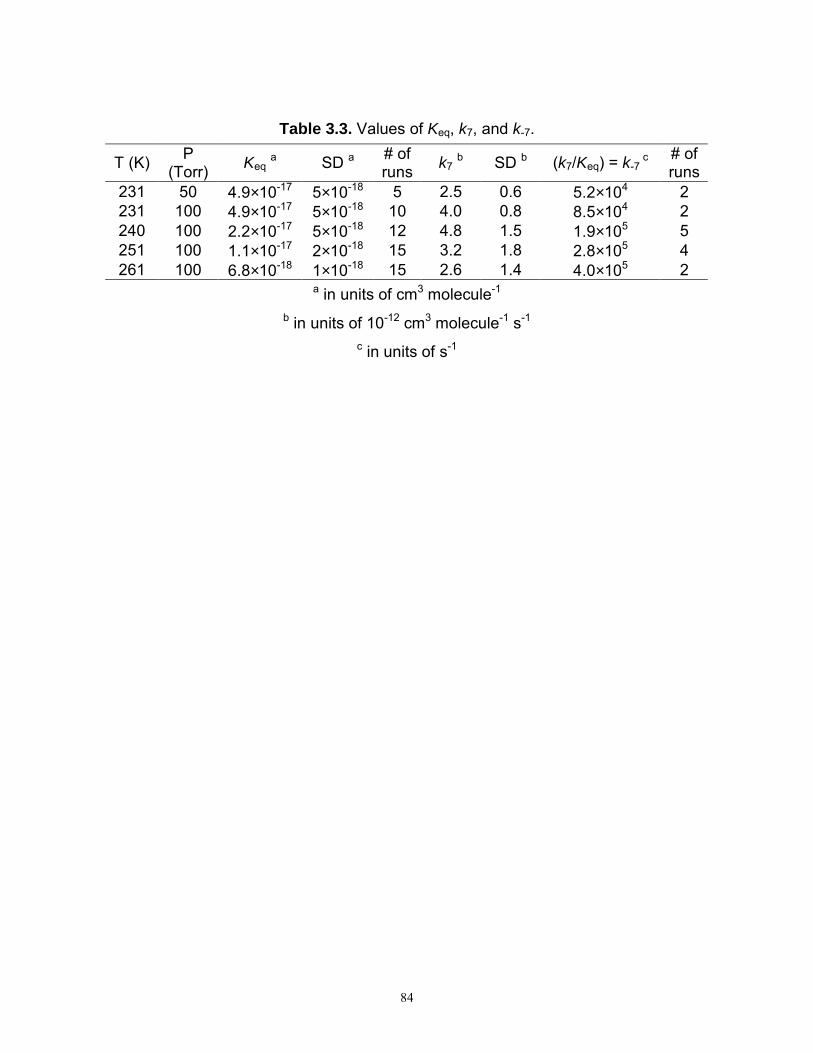
84
Table 3.3. Values of Keq, k7, and k-7.
T (K) P (Torr) Keq a SD a # of
runs k7 b SD b (k7/Keq) = k-7 c # of
runs 231 50 4.9×10⁻¹⁷ 5×10-18 5 2.5 0.6 5.2×10⁴ 2 231 100 4.9×10⁻¹⁷ 5×10-18 10 4.0 0.8 8.5×10⁴ 2 240 100 2.2×10⁻¹⁷ 5×10-18 12 4.8 1.5 1.9×10⁵ 5 251 100 1.1×10⁻¹⁷ 2×10-18 15 3.2 1.8 2.8×10⁵ 4 261 100 6.8×10⁻¹⁸ 1×10-18 15 2.6 1.4 4.0×10⁵ 2
a in units of cm3 molecule-1
b in units of 10-12 cm3 molecule-1 s-1
c in units of s-1
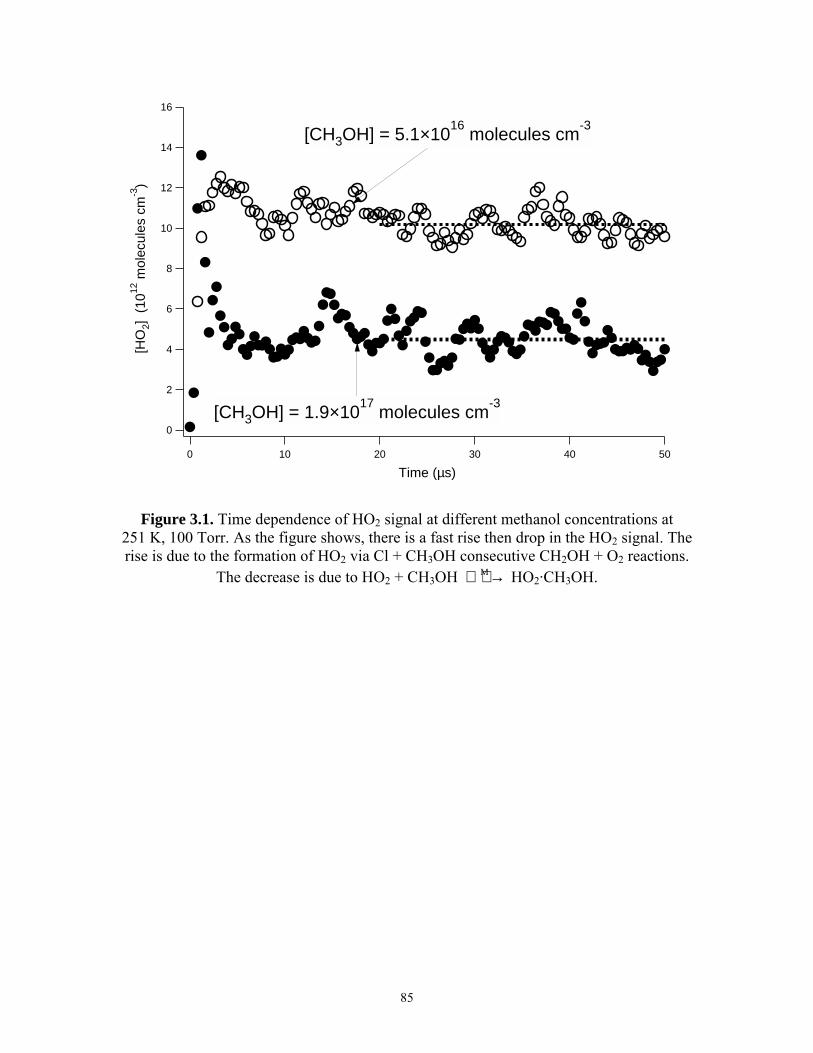
85
16
14
12
10
8
6
4
2
0
[HO
2] (
1012
mol
ecul
es c
m-3
)
50403020100
Time (µs)
[CH3OH] = 5.1×10¹⁶
molecules cm-3
[CH3OH] = 1.9×10¹⁷
molecules cm-3
Figure 3.1. Time dependence of HO2 signal at different methanol concentrations at 251 K, 100 Torr. As the figure shows, there is a fast rise then drop in the HO2 signal. The rise is due to the formation of HO2 via Cl + CH3OH consecutive CH2OH + O2 reactions.
The decrease is due to HO2 + CH3OH M → HO2·CH3OH.
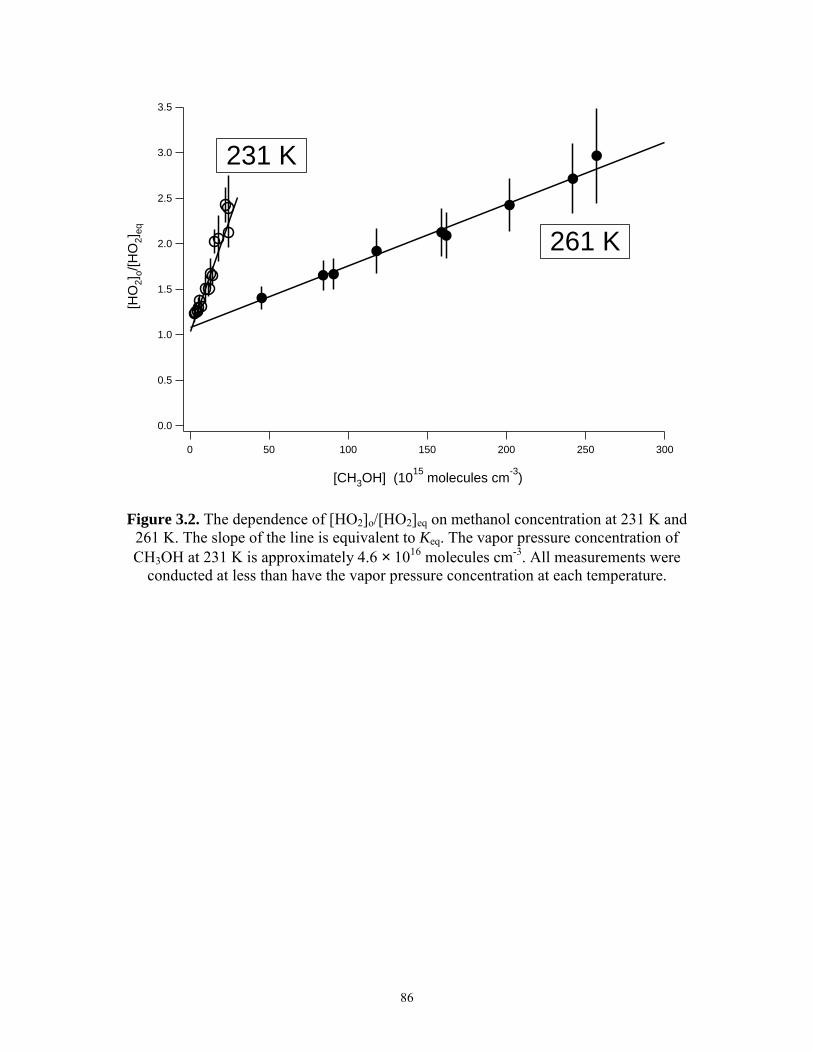
86
3.5
3.0
2.5
2.0
1.5
1.0
0.5
0.0
[HO
2]o/
[HO
2]eq
300250200150100500
[CH3OH] (1015
molecules cm-3
)
231 K
261 K
Figure 3.2. The dependence of [HO2]o/[HO2]eq on methanol concentration at 231 K and 261 K. The slope of the line is equivalent to Keq. The vapor pressure concentration of CH3OH at 231 K is approximately 4.6 × 10¹⁶ molecules cm-3. All measurements were
conducted at less than have the vapor pressure concentration at each temperature.

87
10-19
2
3
456
10-18
2
3
456
10-17
2
3
456
10-16
Keq
(cm
3 mol
ecul
e-1)
0.00430.00420.00410.00400.00390.0038
1/T (K-1
)
Experiment
Theory
Figure 3.3. Comparisons of experimentally measured and theoretically calculated Kc. Between 231 K and 261 K, the experimentally measured Kc was between a factor of 16
and 18 higher than the calculated values.

88
15
10
5
0
[HO
2] (
1012
mol
ecul
es c
m-3
)
20151050
Time (µs)
Figure 3.4. Decay of [HO2] from the reaction HO2 + CH3OH M → HO2·CH3OH at
240 K, 100 Torr.
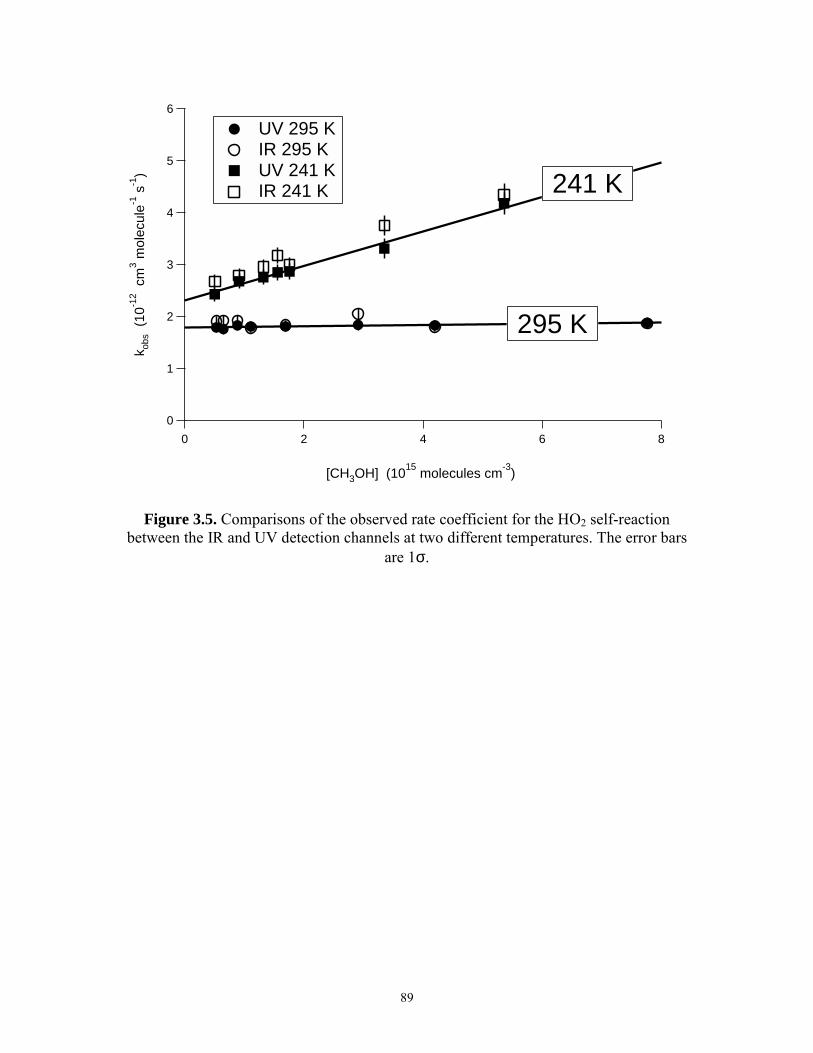
89
6
5
4
3
2
1
0
k obs
(10
-12 c
m3 m
olec
ule-1
s-1
)
86420
[CH3OH] (1015
molecules cm-3
)
241 K
295 K
UV 295 K IR 295 K UV 241 K IR 241 K
Figure 3.5. Comparisons of the observed rate coefficient for the HO2 self-reaction between the IR and UV detection channels at two different temperatures. The error bars
are 1σ.
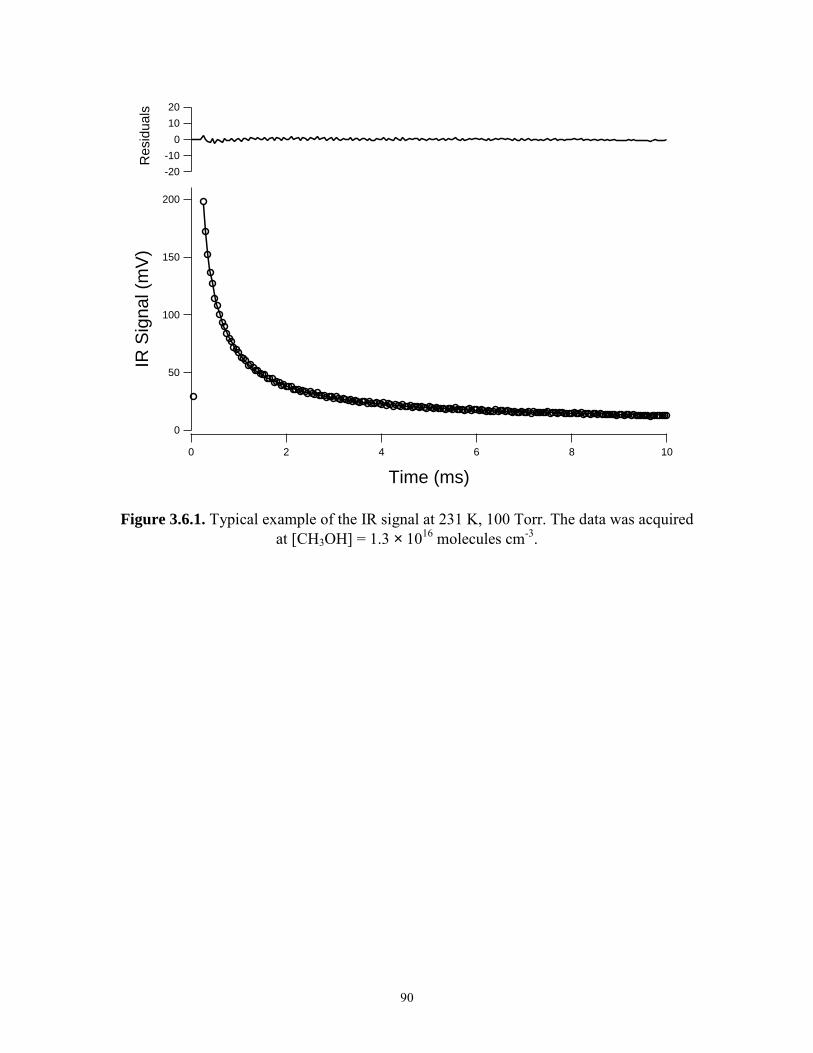
90
200
150
100
50
0
IR S
igna
l (m
V)
1086420
Time (ms)
-20
-10
0
10
20
Res
idua
ls
Figure 3.6.1. Typical example of the IR signal at 231 K, 100 Torr. The data was acquired at [CH3OH] = 1.3 × 10¹⁶ molecules cm-3.
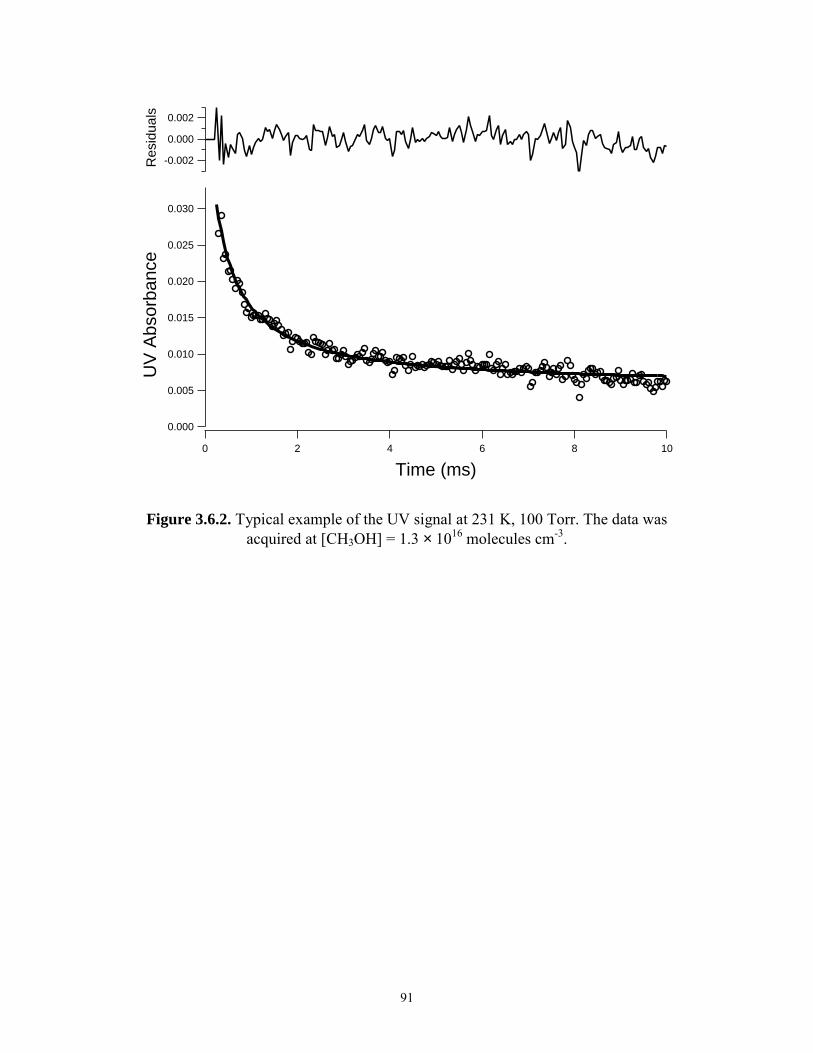
91
0.030
0.025
0.020
0.015
0.010
0.005
0.000
UV
Abs
orba
nce
1086420
Time (ms)
-0.002
0.000
0.002
Res
idua
ls
Figure 3.6.2. Typical example of the UV signal at 231 K, 100 Torr. The data was acquired at [CH3OH] = 1.3 × 10¹⁶ molecules cm-3.

92
5
4
3
2
1
0
k obs
(10
-11 c
m3 m
olec
ule-1
s-1
)
20151050
[CH3OH] (1015
molecules cm-3
)
IR Rate constants UV Rate constants
Figure 3.7. kobs,ir and kobs,uv versus methanol concentration at 231 K, 100 Torr. The solid lines are fits to each spectral channel independently. The dotted line is what is expected
for kobs,uv using the fitted parameters from the IR data.

93
Chapter 4: Kinetics of CH3O2 Reactions
4.1 Introduction
Reactions between peroxy radicals are an important class of reactions in
atmospheric and combustion chemistry. In the troposphere, peroxy radicals are
intermediates in the oxidation of alkane. Under conditions of low NOx (< 30 ppt), which
occur in the unpolluted troposphere, reactions between peroxy radicals are significant and
are an important consideration when determining local ozone production rates. Overall,
the reactions
CH3O2 + CH3O2 → CH3O + CH3O + O2 (1a)
→ CH3OH + CH2O + O2 (1b)
→ CH3OOCH3 + O2 (1c)
HO2 + CH3O2 → CH3OOH + O2 (2a)
→ CH2O + H2O + O2 (2b)
remove peroxy species that would otherwise react with NO to eventually form ozone.
Recently, field measurements of OH, HO2, H2O2, and CH3OOH in the upper
troposphere have led researchers to propose that the rate of reaction (2) might be
substantially faster than that suggested by the current NASA data evaluation at
temperatures applicable to the upper troposphere, below 273 K.1 Field measurements of
94
ozone production rates in polluted air masses in the lower troposphere have suggested
that near 298 K, the rate NASA recommended coefficient for reaction (2) may be nearly a
factor of 10 too large.2
There is significant disagreement between previous measurements of the rate
coefficients and product branching ratios for reactions (1) and (2). Separate studies of
reaction (1) have measured significantly different temperature dependences for product
branching ratios.3,4 Measured rate coefficients for reaction (2) differ substantially
between studies that examined the reaction below 273 K.5,6
This chapter describes measurements of the rate coefficient of reaction (2) and the
product branching ratio for reaction (1). Our measurements utilized IR heterodyne
spectroscopy to monitor the time-dependence of HO2 and UV spectroscopy to monitor
the time-dependence of CH3O2. The use of IR spectroscopy is a major experimental
difference between our measurements and previous studies. We conducted our studies
under conditions in which there were low levels of chemical species that could form
hydrogen-bonded complexes with HO2 such as methanol. This differs from previous low
temperature studies of reaction (2) that utilized CH3OH as a pre-cursor for HO2.5,6
4.2 Experimental
Much of the experimental technique has been described in Chapter 1. Briefly, an
excimer laser was used to photolyze F2 in gas-mixtures of H2-CH4-O2-N2. Subsequent
reactions produced HO2 and CH3O2 via the reaction sequence
2F 2 Fhv → (3)
95
2F + H HF + H → (4)
M2 2H + O HO → (5)
4 3F + CH HF + CH → (6)
M3 2 3 2CH + O CH O → (7)
Gas concentrations and purities are listed in Table 4.1. Kinetic modeling using the rates
listed in Table 4.2 indicated that CH3O2 and HO2 formation occurred between 5 µs and
30 µs for both species.
It was important to consider the reaction
3 2 2 2CH O + O HO + CH O → (8)
The rate coefficient at 298 K for reaction (8) is approximately 2 × 10-15 cm3 molecule-1
s-1, according to the 1997 NASA evaluation.7 Since typical O2 concentrations were
around 1 × 10¹⁸ molecules cm-3, the time constant for HO2 formation from the CH3O +
O2 reaction was approximately 500 µs at 298 K. Because no measurements of the rate
coefficient for reaction (8) have been done below 298 K, the recommended values are
extrapolated for temperatures below 298 K. Thus, there is some uncertainty in k8 below
298 K. The recommended value at 231 K is approximately 8 × 10-16 cm3 molecule-1 s-1
and the time constant for HO2 formation from reaction (8) is expected to be around
1.3 ms. Because this rate of HO2 formation is relatively slow in comparison to the
timescale of measurements, the time dependence of the HO2 concentration is dependent

96
on the concentration of O2. Also, there is a high degree of uncertainty in the values of the
rate coefficients of CH3O + HO2 and CH3O + CH3O2. In a literature review conducted by
Tsang and Hampson,8 they suggested that the rate coefficients for these reactions was
between (5 × 10-12 and 5 × 10-14) cm3 molecule-1 s-1. However, Pilling and Smith have
suggested that the rate of CH3O + CH3O2 was on the order of 1 × 10-11 cm3 molecule-1 s-1
at 298 K. If the rate coefficients for these reactions are greater than 5 × 10-12 cm3
molecule-1 s-1, then the CH3O + HO2 and CH3O + CH3O2 reactions would provide
another loss mechanism for CH3O other than reaction by O2. This would result in an
incorrect interpretation of CH3O production from reaction (1).9
Photolysis of F2 was chosen over photolysis of Cl2 in CH3OH-CH4-O2-N2 gas-
mixtures because of two reasons. First, the Cl + CH4 reaction is relatively slow, resulting
in a relatively long lifetime for Cl. The Cl + CH3O2 → HCl + CH3O reaction becomes a
significant experimental concern. Subsequent HO2 production from the CH3O + O2
reaction would complicate our kinetic analysis. Second, it has been shown in Chapters 1,
2, and 3 that CH3OH can hydrogen-bond with HO2 and that this can lead to significant
enhancements of the HO2 + HO2 and HO2 + NO2 + M reactions at low temperatures and
high methanol concentrations.1014 A similar enhancement of the HO2 + CH3O2 reaction
might also occur. The two previous low temperature studies of reaction (2) utilized
CH3OH at temperatures below 273 K,5,6 which may have resulted in higher measured rate
coefficients than applicable in the atmosphere.

97
4.3 Rate Coefficient for the CH3O2 + HO2 Reaction
Reaction (2) was studied between 296 K and 231 K at 100 Torr. Figures 4.1.1 and
4.1.2 show IR and UV data taken at 231 K at various [H2]/[CH4] ratios. The ratio
[HO2]o/[CH3O2]o is nearly equivalent to the ratio k4[H2]/k6[CH4]. The observed
[HO2]o/[CH3O2]o ratio was consistent with the expected ratio using the measured values
for [H2] and [CH4] and recommended values of k4 and k6.
We elected to determine k2 by subtracting out the [HO2] time dependence at
[H2]/[CH4] = 0 from the [HO2] time dependence recorded at [H2]/[CH4] < 0.5. For
examination of reaction (2), [HO2]o + [CH3O2]o was between (8 to 10) × 1013
molecules cm-3. At [H2]/[CH4] = 0.5, the decrease in [CH3O2]o in comparison to its value
at [H2]/[CH4] = 0 was between 10% and 15%. Despite this decrease in [CH3O2]o as
[H2]/[CH4] increased, measurements of k2 were not adversely affected, as demonstrated
below.
Fitting of the subtracted [HO2] time profiles utilized a first-order expression
-o( ) ktS t B S e= + (9)
where S(t) is the signal at time = t, So is the signal at time = 0, and B accounts for a
baseline offset. Fits to data were done over approximately 3 e-1 times, which was 10 ms at
296 K and 5 ms at 231 K.
The manner of measuring k2 outlined above was selected because it separates the
measurement of the branching ratio of the CH3O2 self-reaction from the measurement of
k2. For describing the time dependence of [HO2], these two kinetic parameters are

98
strongly correlated. Moreover, the uncertainty in the rate coefficient of the CH3O + O2
reaction at low temperatures, as well as complications from the possible CH3O + CH3O2
and CH3O + HO2 reactions, results in significant uncertainty in determining kinetic
parameters from the [HO2] time dependence. Further, it will be shown below that
currently suggested products and the branching ratio of reaction (1), and perhaps k8, were
not consistent with the present results at low temperatures. The abstraction of kinetic
information regarding k2 and the branching ratio is thus highly subject to error if each fit
was analyzed by fitting the time dependence of [HO2] by fitting k2, the branching ratio,
and k8 all at once.
There are several problems associated with the measurement of k2 in the manner
outlined above. First, the concentration of CH3O2 changes during the course of the fit.
This means that the time dependence of [HO2] is not truly first-order. Second, as
[H2]/[CH4] increases, the HO2 formed by the CH3O2 self-reaction decreases. This means
that the decays have been “overly” corrected for HO2 produced by the CH3O2 self-
reaction.
Kinetic modeling was done using the rate coefficients listed in Table 4.2 and the
FACSIMILE kinetic modeling program.15 The simulated signal at [H2]/[CH4] = 0 was
subtracted from simulated signals where [H2]/[CH4] was varied between 0.05 and 0.5.
First-order fits over 5 ms to 10 ms were performed after subtraction and rate coefficients
were obtained. These rate-coefficients were then divided by [CH3O2]o. At 296 K, at
[H2]/[CH4] = 0.5, the measured rate was 6% larger than the rate used in the model (ideal
rate) and at [H2]/[CH4] = 0.05, the measured rate was 1% larger than the ideal rate. At
231 K, at [H2]/[CH4] = 0.5, the measured rate was equal to the ideal rate and at
99
[H2]/[CH4] = 0.05, the measured rate was 4% lower than the ideal rate. Since the reported
rates were averaged from data acquired at [H2]/[CH4] between 0.05 and 0.5, the overall
systematic error was that the measured rate coefficient was 4% high at 296 K. Reported
values have not been corrected for these systematic errors. Figure 4.2 shows natural log
plots of data that had been adjusted in above manner. The linearity of the plots indicates
that the approximation of first-order type behavior is valid.
The measured values of k2 versus T were fit to the equation k2(T) =
A·exp(-Ea/(RT)). The fitted values were A = (7.6 ± 3.0) × 10-13 cm3 molecule-1 s-1 and
Ea/R = (-560 ± 70) K. The latter value translates into (-4.7 ± 0.6) kJ mol-1. Figure 4.3 is
an Arrhenius plot of the measured values of k2 versus T-1. The measured values from the
present study were very similar the NASA recommended values at 298 K but were
approximately 50% lower than the recommended values at 231 K. They are listed in
Table 4.3.
4.4 Product Branching Ratio for the CH3O2 + CH3O2 Reaction
The three reaction pathways that have been listed above for reaction (1) are based
on FTIR16,3,17 and kinetic studies.4
CH3O2 + CH3O2
→ CH3O + CH3O + O2 ∆H = (0 ± 13) kJ mol-1 (1a)
→ CH3OH + CH2O + O2 ∆H = (-344 ± 12) kJ mol-1 (1b)
→ CH3OOCH3 + O2 ∆H = (-159 ± 12) kJ mol-1 (1c)
100
The values for the change of enthalpy are from the 1997 NASA recommendation. Using
the values of k2 determined from the procedure outlined above, the measurements of
[HO2] and [CH3O2] time dependences at [H2]/[CH4] = 0, were used to fit the kinetic
model using the rates listed in Table 4.2. The value of the branching ratio was allowed to
vary and reaction (1c) was assumed not to occur. The fits were conducted over the first
10 ms of data.
Over the course of 10 ms, the kinetic model reproduced the experimental [HO2]
and [CH3O2] time dependences reasonably well at 296 K but poorly at 231 K. At
temperatures in between, the fits became progressively worse as the temperature
approached 231 K. Figures 4.4.1 and 4.4.2 are experimental data acquired at 296 K and
231 K, respectively, and the fits from using FACSIMILE. Figure 4.4.3 depicts the [HO2]
measurements at 296 K and 231 K. For the measurement at 296 K, [CH3O2]o was
approximately 7.9 × 10¹³ molecules cm-3 and at 231 K, it was 8.4 × 10¹³ molecules cm-3.
The values of k1a/(k1a+k1b), denoted α, are listed in Table 4.3. The value of k1c was
assumed to be 0.
The rate coefficient for the observed rate of the CH3O2 self-reaction was
measured as a function of temperature. The observed rate coefficient is assumed to be
larger than k1 because CH3O from branching channel (1a) either reacts quickly with O2 to
form HO2 which in turn reacts with CH3O2, or CH3O reacts directly with CH3O2. The
measured values of the observed rate coefficient for the CH3O2 self-reaction are tabulated
in Table 4.4. At 296 K, our measured values were approximately 25% lower than the
NASA recommendations if the branching ratio for channel (1a) was 30%. At 231 K, our
values were approximately 20% lower than the recommendations at a branching ratio of
101
10%, as suggested by FTIR studies of the CH3O2 self-reaction.3 The recommended error
in the rate constant given by the recommendation was 50% at 296 K and 80% at 231 K.
4.5 Results and Discussion
As Figure 4.4.3 indicates, the rise time in [HO2] is faster at 231 K than at 296 K.
This is despite the fact that the values of [CH3O2]o and k1 at the two temperature are
nearly equivalent. Moreover, there is no delay in HO2 formation as expected for the
CH3O + O2 reaction. To date, the CH3O + O2 (8) reaction has only been studied above
298 K. Work by Wantuck et al.18 revealed that the rate coefficient displayed non-
Arrhenius-type behavior above 500 K. The rate of reaction (8) would have to be greater
than 10-13 cm3 molecule-1 s-1 at 231 K to explain the rapid rise in HO2 signal. This is a
significant departure from expected temperature dependence and not likely to occur.
A more likely explanation is that another product is formed from reaction (1).
Figure 4.5 shows a possible reaction pathway that accounts for the formation of CH3O,
CH3OH, and CH2O products. One possible explanation for the quick formation of HO2 is
depicted in Figure 4.6.
Our measurements of the rate coefficient for reaction (2) are lower than previous
measurements. This can be partly explained by the use of methanol in previous
experiments.
4.5 Conclusions
The rate coefficient for HO2 + CH3O2 was measured at 100 Torr between 231 K
and 296 K and was found to be lower than the NASA recommended rate. Branching ratio

102
studies of the CH3O2 + CH3O2 reaction indicated the possibility of a change in reaction
products at low temperatures.
4.5 References
1. Ravetta, F., D. J. Jacob, et al. "Experimental Evidence for the Importance of
Convected Methylhydroperoxide as a source of Hydrogen Oxide (HOx) Radicals
in the Tropical Upper Troposphere." Journal of Geophysical Research-
Atmospheres 106: 32709-32716 (2001).
2. Thornton, J. A. Submitted to JGR.
3. Horie, O., J. N. Crowley, et al. J. Phys. Chem. 94: 8198-8203 (1990).
4. Lightfoot, P. D., R. Lesclaux, et al. "Flash Photolysis Study of the CH3O2 + CH3O2
Reaction: Rate Constants and Branching Ratios from 248 to 573 K." Journal of
Physical Chemistry 94: 700-707 (1990).
5. Dagaut, P., T. J. Wallington, et al. "Temperature Dependence of the Rate Constant for
the HO2 + CH3O2 Gas-Phase Reaction." J. Phys. Chem. 92: 3833-3836 (1988).
6. Lightfoot, P. D., B. Veyret, et al. "Flash Photolysis Study of the CH3O2 + HO2
Reaction between 248 and 573 K." J. Phys. Chem. 94: 708-714 (1990).
7. DeMore, W. B., S. P. Sander, et al. (1997). Chemical Kinetics and Photochemical Data
for Use in Stratospheric Modeling, Evaluation Number 12. Pasadena, CA, Jet
Propulsion Laboratory, California Institute of Technology.
8. Tsang, W. and R. F. Hampson "Chemical Kinetic Database For Combustion
Chemistry.1. Methane and Related-Compounds." Journal of Physical and
Chemical Reference Data 15: 1087-1279 (1986).

103
9. Pilling, M. J. and M. J. C. Smith "A Laser Flash Photolysis Study of the Reaction CH3
+ O2 => CH3O2 at 298 K." Journal of Physical Chemistry 89: 4713-4720 (1985).
10. Hamilton, E. J., Jr. "Water Vapor Dependence of the Kinetics of the Self-reaction of
HO2 in the Gas Phase." J. Chem. Phys. 63: 3682-3683 (1975).
11. Hamilton, E. J., Jr. and R.-R. Lii "The Dependence on H2O and on NH3 of the
Kinetics of the Self-Reaction of HO2 in the Gas-Phase Formation of HO2·H2O and
HO2·NH3 Complexes." Int. J. Chem. Kinet. 9: 875-885 (1977).
12. Lii, R.-R., R. A. Gorse, Jr. , et al. "Temperature Dependence of the Gas-Phase Self-
Reaction of HO2 in the Presence of NH3." J. Phys. Chem. 84: 813-817 (1980).
13. Andersson, B. Y., R. A. Cox, et al. "The Effect of Methanol on the Self-Reaction of
HO2 Radicals." Int. J. Chem. Kinetics 20: 283-295 (1988).
14. Chapter 3.
15. Curtis, A. R. and W. P. Sweetenham (1987). FACSIMILE/CHEKMAT, H015 ed.
Harwell: Oxfordshire (UK).
16. Kan, C. S., J. G. Calvert, et al. "Reactive Channels of the CH3O2-CH3O2 Reaction."
Journal of Physical Chemistry 84: 3411-3417 (1980).
17. Tyndall, G. S., T. J. Wallington, et al. "FTIR Product Study of the Reactions CH3O2 +
CH3O2 and CH3O2 + O3." Journal of Physical Chemistry A 102: 2547-2554
(1998).
18. Wantuck, P. J., R. C. Oldenborg, et al. "Removal Rate-Constant Measurements for
CH3O by O2 Over the 298-973-K Range." J. Phys. Chem 91: 4653-4655 (1987).

104
Table 4.1. Experimental conditions.
Gas: [N2]
1018 cm-3
[H2]
1018 cm-3
[CH4]
1017 cm-3
[F2]
1016 cm-3
[O2]
1018 cm-3 concentration:
(molecules cm-3) 0.8 - 2 0 - 1 4 - 7 3 - 4 0.9 – 1.2
Gas purity: (AirProducts) 99.9993% 99.999% 97% 99.996%
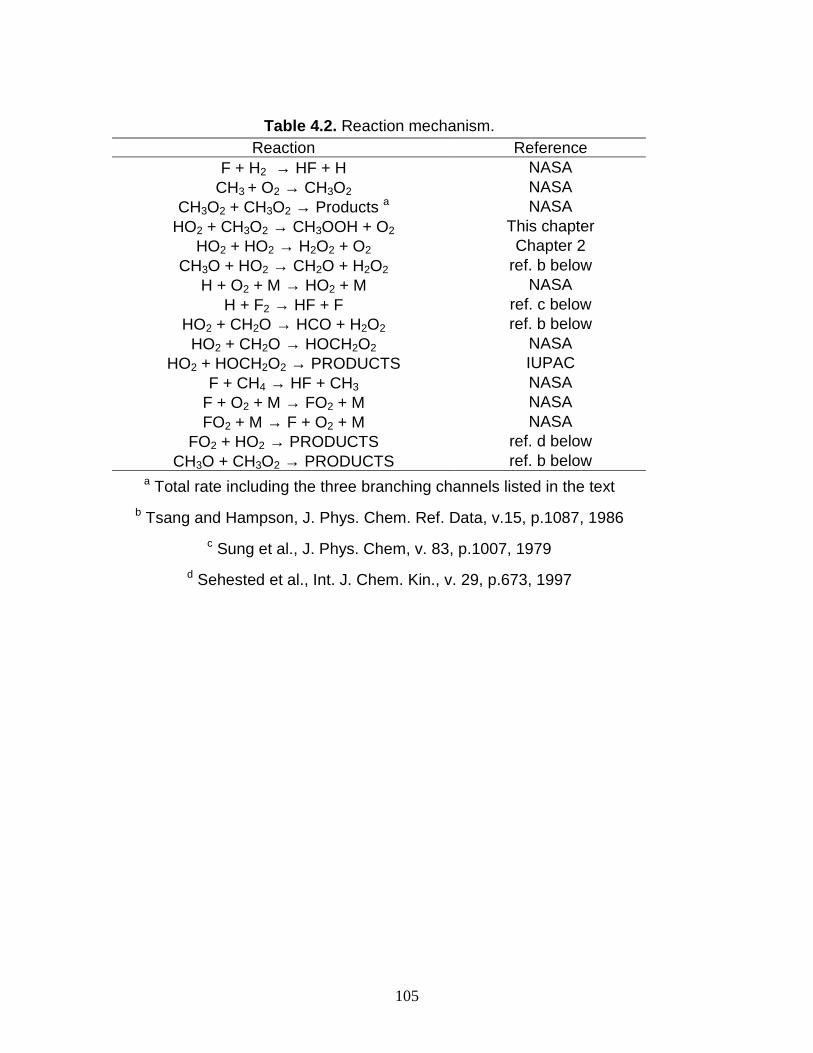
105
Table 4.2. Reaction mechanism.
Reaction Reference F + H2 → HF + H NASA
CH3 + O2 → CH3O2 NASA CH3O2 + CH3O2 → Products a NASA
HO2 + CH3O2 → CH3OOH + O2 This chapter HO2 + HO2 → H2O2 + O2 Chapter 2
CH3O + HO2 → CH2O + H2O2 ref. b below H + O2 + M → HO2 + M NASA
H + F2 → HF + F ref. c below HO2 + CH2O → HCO + H2O2 ref. b below
HO2 + CH2O → HOCH2O2 NASA HO2 + HOCH2O2 → PRODUCTS IUPAC
F + CH4 → HF + CH3 NASA F + O2 + M → FO2 + M NASA FO2 + M → F + O2 + M NASA
FO2 + HO2 → PRODUCTS ref. d below CH3O + CH3O2 → PRODUCTS ref. b below
a Total rate including the three branching channels listed in the text b Tsang and Hampson, J. Phys. Chem. Ref. Data, v.15, p.1087, 1986
c Sung et al., J. Phys. Chem, v. 83, p.1007, 1979 d Sehested et al., Int. J. Chem. Kin., v. 29, p.673, 1997

106
Table 4.3. Values of k2 and α. T (K) k2
a sd a α sd 296 5.0 0.5 0.16 0.03 282 5.5 0.6 0.17 0.03 267 5.6 0.6 0.16 0.03 252 7.5 0.8 0.15 0.03 239 7.7 0.8 0.13 0.03 231 8.3 0.8 0.15 0.03
a units in 10-12 cm3 molecule-1 s-1

107
Table 4.4. Measurements of k1. T (K) k1 a SD a 296 4.5 0.5 282 4.9 0.5 267 5.0 0.5 252 5.0 0.5 239 4.8 0.5 231 5.1 0.5
a units are 10-13 cm3 molecule s-1
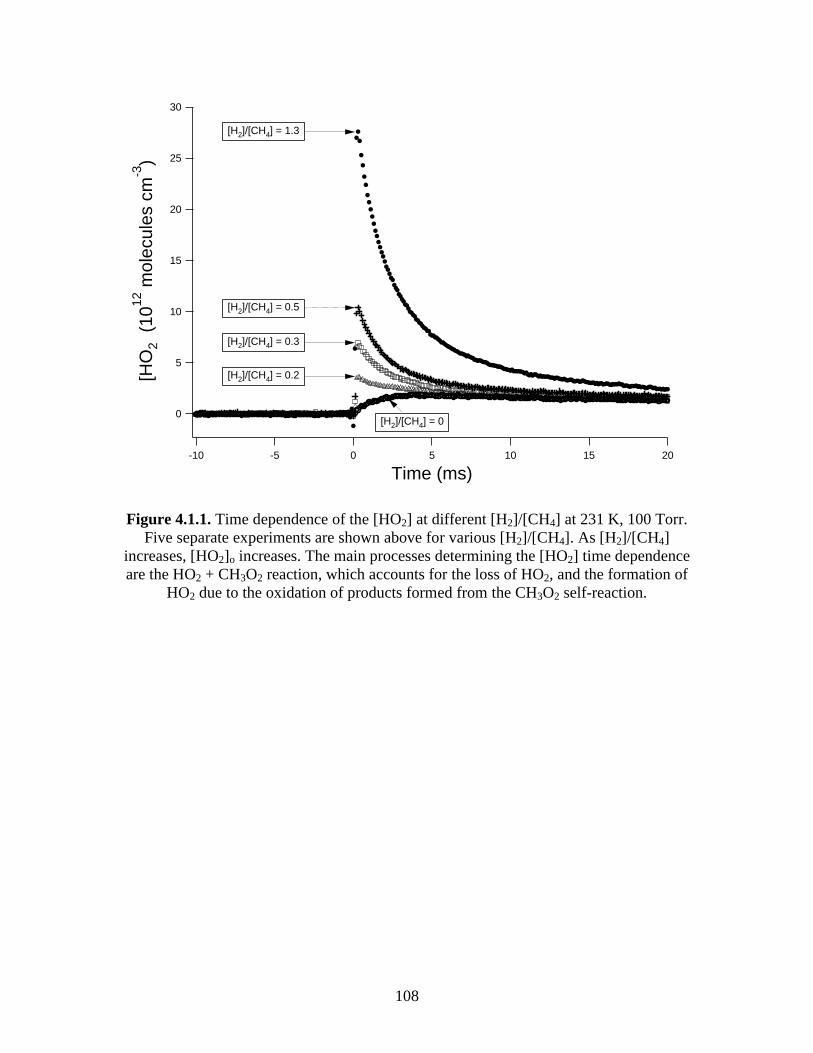
108
30
25
20
15
10
5
0
[HO
2 (
1012
mol
ecul
es c
m-3
)
20151050-5-10
Time (ms)
[H2]/[CH4] = 0.3
[H2]/[CH4] = 0.5
[H2]/[CH4] = 0.2
[H2]/[CH4] = 1.3
[H2]/[CH4] = 0
Figure 4.1.1. Time dependence of the [HO2] at different [H2]/[CH4] at 231 K, 100 Torr. Five separate experiments are shown above for various [H2]/[CH4]. As [H2]/[CH4]
increases, [HO2]o increases. The main processes determining the [HO2] time dependence are the HO2 + CH3O2 reaction, which accounts for the loss of HO2, and the formation of
HO2 due to the oxidation of products formed from the CH3O2 self-reaction.
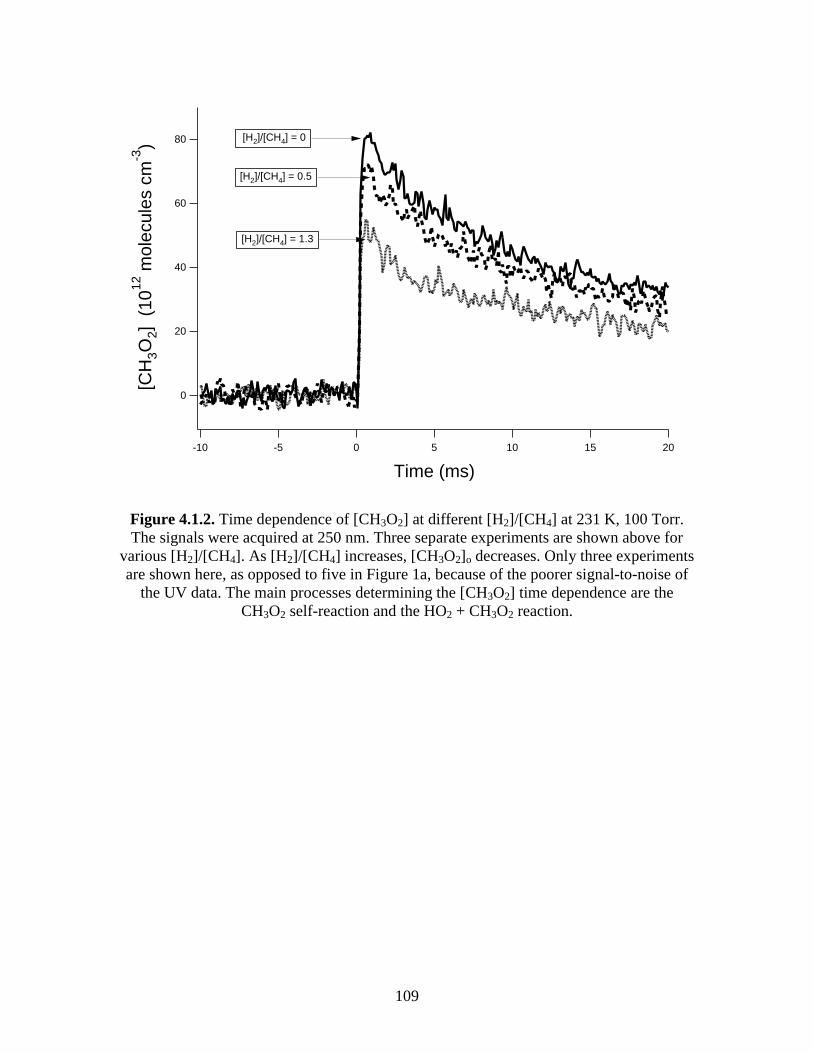
109
80
60
40
20
0
[CH
3O2]
(10
12 m
olec
ules
cm
-3)
20151050-5-10
Time (ms)
[H2]/[CH4] = 0
[H2]/[CH4] = 0.5
[H2]/[CH4] = 1.3
Figure 4.1.2. Time dependence of [CH3O2] at different [H2]/[CH4] at 231 K, 100 Torr. The signals were acquired at 250 nm. Three separate experiments are shown above for
various [H2]/[CH4]. As [H2]/[CH4] increases, [CH3O2]o decreases. Only three experiments are shown here, as opposed to five in Figure 1a, because of the poorer signal-to-noise of
the UV data. The main processes determining the [CH3O2] time dependence are the CH3O2 self-reaction and the HO2 + CH3O2 reaction.
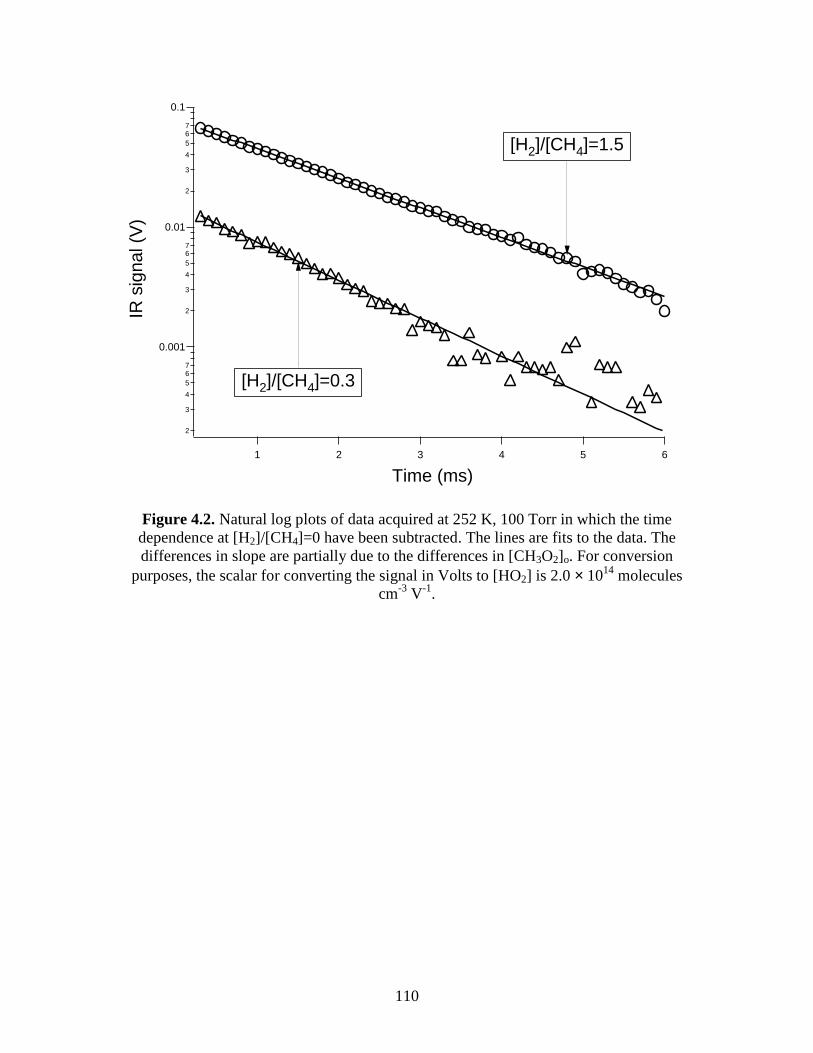
110
2
3
4
567
0.001
2
3
4
567
0.01
2
3
4
567
0.1
IR s
igna
l (V
)
654321
Time (ms)
[H2]/[CH4]=0.3
[H2]/[CH4]=1.5
Figure 4.2. Natural log plots of data acquired at 252 K, 100 Torr in which the time dependence at [H2]/[CH4]=0 have been subtracted. The lines are fits to the data. The differences in slope are partially due to the differences in [CH3O2]o. For conversion
purposes, the scalar for converting the signal in Volts to [HO2] is 2.0 × 10¹⁴ molecules cm-3 V-1.

111
3
4
5
6
7
8
910
-11
2
3
k 2 (
cm3 m
olec
ule-1
s-1
)
0.00440.00420.00400.00380.00360.0034
T-1
(K-1
)
Present work Fit to present work NASA recommendation Recommended error limits
Figure 4.3. Arrhenius Plot of k2 Versus T-1. The displayed uncertainties are 1σ.
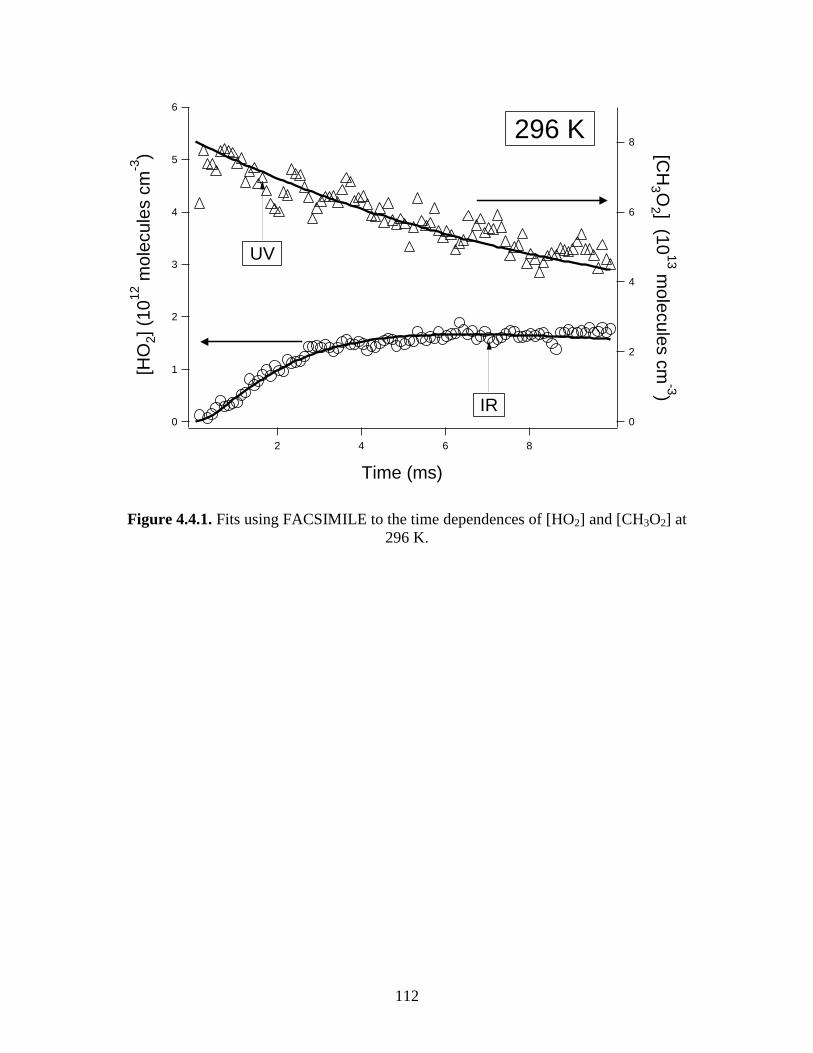
112
6
5
4
3
2
1
0
[HO
2] (
1012
mol
ecul
es c
m-3
)
8642
Time (ms)
8
6
4
2
0
[CH
3 O2 ] (10
13 molecules cm
-3)
UV
IR
296 K
Figure 4.4.1. Fits using FACSIMILE to the time dependences of [HO2] and [CH3O2] at 296 K.
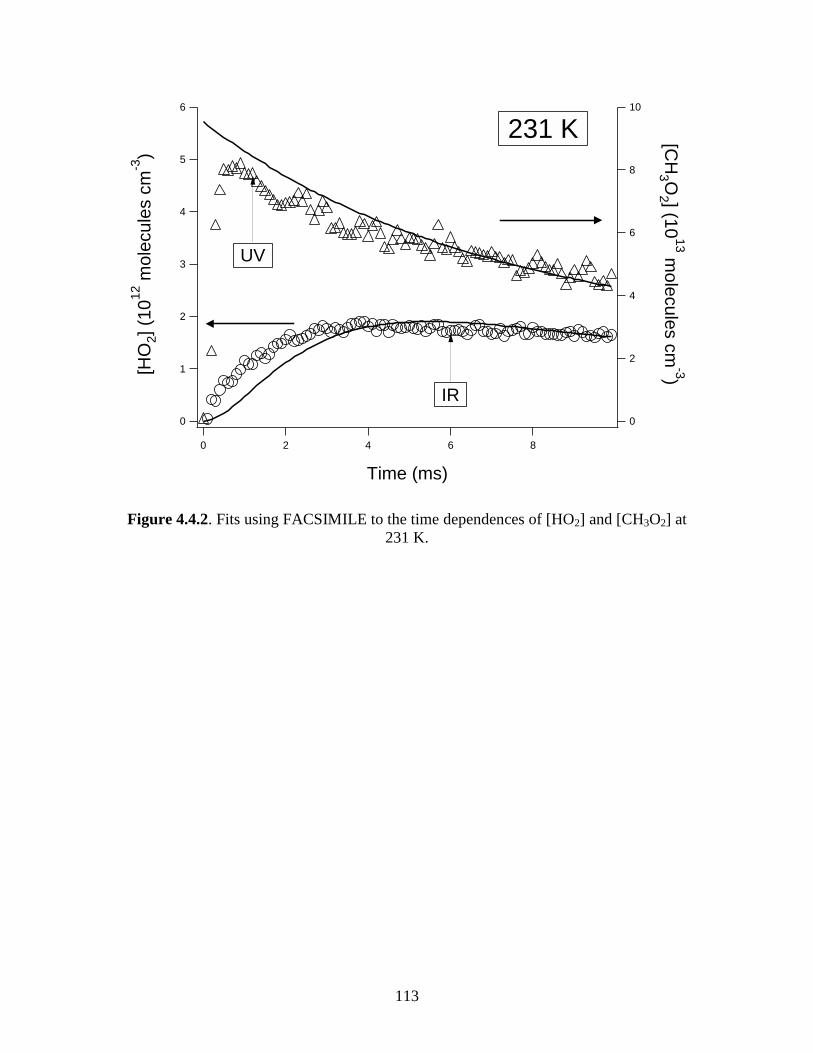
113
10
8
6
4
2
0
[CH
3 O2 ] (10
13 molecules cm
-3)
86420
Time (ms)
6
5
4
3
2
1
0
[HO
2] (
1012
mol
ecul
es c
m-3
)
UV
IR
231 K
Figure 4.4.2. Fits using FACSIMILE to the time dependences of [HO2] and [CH3O2] at 231 K.

114
2.5
2.0
1.5
1.0
0.5
0.0
[HO
2] (
1012
mol
ecul
es c
m-3
)
86420
Time (ms)
296 K
231 K
Figure 4.4.3. Comparisons of [HO2] from the CH3O2 self-reaction at 296 K and 231 K.
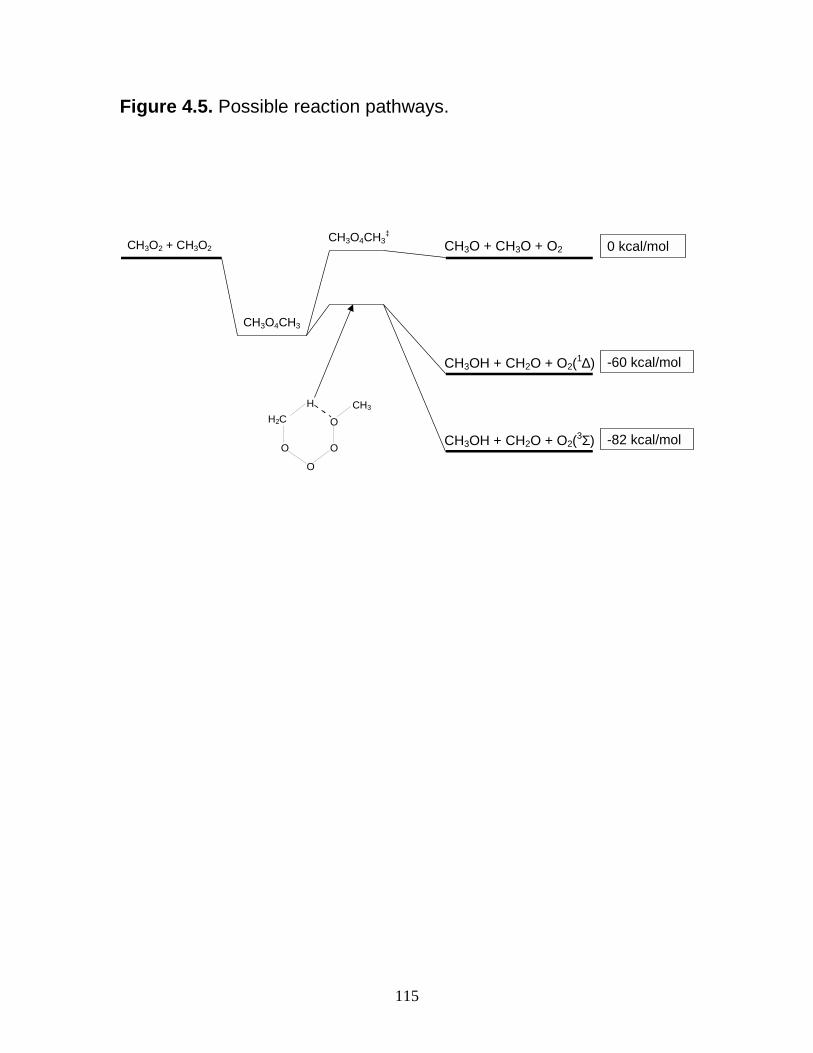
115
Figure 4.5. Possible reaction pathways.
CH3O2 + CH3O2 CH3O + CH3O + O2 0 kcal/mol
CH3OH + CH2O + O2(1∆) -60 kcal/mol
-82 kcal/molCH3OH + CH2O + O2(3Σ) H2C
O
O
O
O
H CH3
CH3O4CH3
CH3O4CH3‡
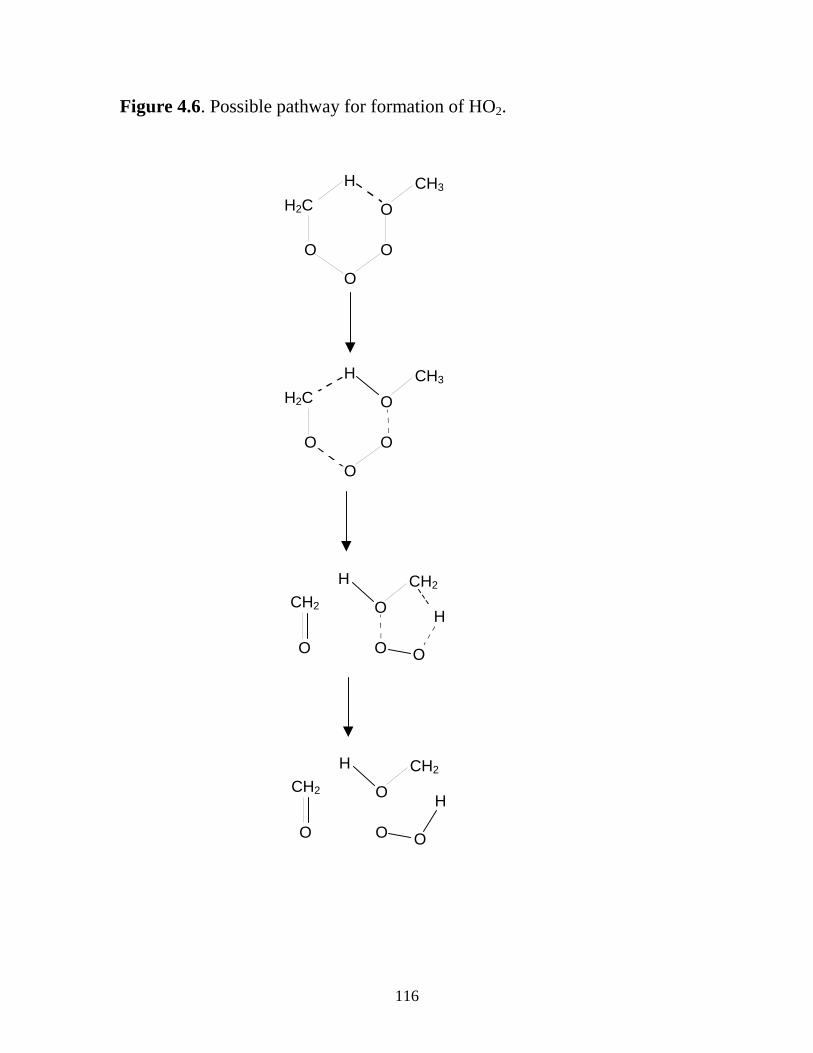
116
Figure 4.6. Possible pathway for formation of HO2.
H2C O
O
O
O
H CH3
H2C O
O
O
O
H CH3
CH2
O O O
O
H CH2 H
CH2 O O
O O
H CH2 H
117
Chapter 5: Experimental Details
5.1 Introduction
The infra-red kinetic spectroscopy apparatus (IRKS) consisted of a photolysis
laser, temperature controlled reaction cell connected to the gas manifold, the IR spectral
probe and the UV spectral probe. This chapter explains the experimental details of the
IRKS apparatus.
5.2 The Photolysis Laser
The photolysis laser was a XeCl Lambda Physik EMG-101 excimer laser that
emitted at 308 nm and utilized an unstable resonator in order to decrease beam
divergence. The pulse energy ranged between 50 mJ and 150 mJ. The specifications
given by Lambda Physik were the following: typical power of 120 mJ, nominal pulse
width of 20 ns, beam divergence of about 0.5 mrad for the unstable configuration. The
excimer pulse passed through a 10 mm × 20 mm (vertical × horizontal) aperture before
entering the reaction cell. At a distance of 200 cm away from the aperture, two
overlapping rectangular profiles of the excimer pulse observed, a bright profile and a
profile increased in size by approximately 2 mm in both directions as expected, given the
specified divergence. However, the weak profile was much more divergent in the
horizontal direction, approximately 2 mrad, and slightly more divergent in the vertical
direction, approximately 0.8 mrad. The excimer pulse power was measured at different
locations within the reaction cell. These measurements revealed that the effects of
118
divergence decreased the power by less than 5% the length of the reaction cell. This was
assumed to have a negligible affect on experimental measurements of reaction rates.
Bright regions were scattered throughout the excimer beam profile. This
phenomenon was attributed to whispering gallery modes formed within the resonator
cavity by reflections from the capacitors. These effects were considered insignificant for
kinetic studies because they were evenly scattered throughout the excimer beam profile
and because they made up less than 10% of the total cross-sectional area of the excimer
pulse.
The fan inside the laser cavity, which was intended to mix the gases, did not
work. After consulting with workers at JPSA (Hollis, NH, ph: 603-595-7048), it was
recommended that the fan not be fixed and the cooling water be removed from the pipes
inside the laser to prevent corrosion problems. At the typical repetition rates employed
for the kinetic experiments on the IRKS apparatus (0.3 Hz to 0.07 Hz), problems
associated with the lack of gas mixing within the laser cavity were minimal there was
little change in the average power and the shot-to-shot variance in power when
employing repetition rates slower than 0.3 Hz.
Typically, the voltage across the capacitors was between 20 kV and 22 kV. The
possibility of increasing the output power was discussed with workers at JPSA. They
suggested an upper limit of 24 kV for voltages employed. At this voltage, the pressure
inside the laser cavity would have to be raised to between 3000 mbarr and 3500 mbarr to
maintain proper impedance across the capacitors. However, at such voltages, the lifetime
of the capacitors decreases.

119
5.3 The Reaction Cell and Gas Flow Manifold
The reaction cell is shown in Figure 5.1. The reaction cell was made of pyrex. It
was 165 cm long and had an inner diameter of approximately 5 cm. It was held in place
by two aluminum blocks. The excimer pulse and the probe beams extended the length of
the reaction cell.
The two aluminum blocks that held it in place are shown in Figures 5.2 and 5.3.
One end of the main cell was inserted into the Probe input block. The other side of the
reaction cell was joined onto the Excimer input block by two aluminum parts depicted
in Figure 5.4.
The second 1-inch diameter port, denoted port 2 on Figure 5.1 was connected to
the pre-cooling side-arm. The pre-cooling side-arm is shown in Figure 5.5. A pressure
gauge was connected to port 3. The other two ports lead to a Welch pump, model 1396
(dual stage, 2000 L min-1 pumping speed). Gas from the pre-cooling side arm and the two
aluminum blocks flowed towards these exit ports.
Dry nitrogen gas was flown into the two aluminum blocks through openings in
conflat flanges on the side of the aluminum blocks. This purge gas was at room
temperature. The purge gas served to protect the mirrors from caustic gases. The purge
gas also confined the region in which there were reagent gases. The region where there
was overlap between the photolysis pulse and reagent gas is denoted the photolysis
volume. The photolysis volume and flow scheme are depicted in Figure 5.6.
To verify that the reagent gases were confined between the two exit ports, three
different tests were employed. First, gas mixtures in which the concentration of Cl2 was
determined by flow meters were flown into the reaction cell. The pathlength was
120
determined using the cross section for Cl2 given in the NASA 1997 data evaluation.1
Second, NO2 gas mixtures were flown into the cell and visual inspection determined
whether the reagent gases were confined between the two exit ports. Third, kinetic
experiments of HO2 + NO2 + M (1) were performed in which reagent gases were flown
through one of the purge ports and pumped away from the other purge port. The
pathlength in this case was known because the reagent gas was confined, homogeneously,
within the whole apparatus. In these studies, no purge gas was employed. Under
conditions where [HO2]o >> [NO2], pseudo-first-order conditions are established in which
k1 is proportional to [NO2]. NO2 absorbs in the UV and its cross section has been
measured previously.2,3 Measurements of k1 using this gas flow configuration were
compared to measurements of k1 using the gas flow configuration described above in
which purge gas confined the region of the reaction cell in which there was reagent gas.
The comparison indicated that the measurements of k1 were the same if the pathlength
was equivalent to the spacing between the center of the two ports, 137 cm, when the
purge flow was 15% of the main (reagent) flow. An estimated error of ± 1 cm was
determined from visual inspection of NO2 absorbance and Cl2 absorbance measurements
that correlated measured pathlength with the ratio of purge flow to main flow. It was
observed that a purge flow 10% of the main flow resulted in measured pathlengths of
140 cm. At a purge flow that was 20% of the main flow, the measured pathlength was
about 130 cm. At 50 Torr total pressure, the purge flow needed to be between 2% and 4%
of the main flow.

121
When not conducting experiments, it was useful to maintain a small purge flow (~
10 sccm) of N2 gas through both aluminum blocks to prevent caustic chemicals adsorbed
in the reaction cell from attacking the mirrors when they outgassed.
Thermocouples were inserted through all four 1-inch diameter ports on the main
cell. The inlets for these thermocouples were on the attachments to the main cell. The
thermocouples were placed so that they did not block light from the diode laser, UV
probe, or excimer laser. This forced the placement of the thermocouples towards the side
of the reaction cell rather than in the middle where the probes and photolysis volume
were located.
5.4 Mass Transport within the Reaction Cell
The photolysis region was centrally located within the reaction cell. While this
removed possibilities of wall reactions, transport of gas to and from the photolysis region
during the course of a measurement was a concern. The diffusion constant of O2 in air at
295 K, 100 Torr is approximately 1.3 cm2 s-1.4 Using this as an approximation for
diffusion of HO2, the effects of diffusion can be calculated using Ficks second law of
diffusion
2ii i
C D Ct
∂ = ∇∂
(2)
where C represents the concentration of HO2 within the reaction cell after a photolysis
event. The one-dimensional solution for the boundary conditions C(z,0) = Co for z < 0
and C(z,0) = 0 for z > 0 is
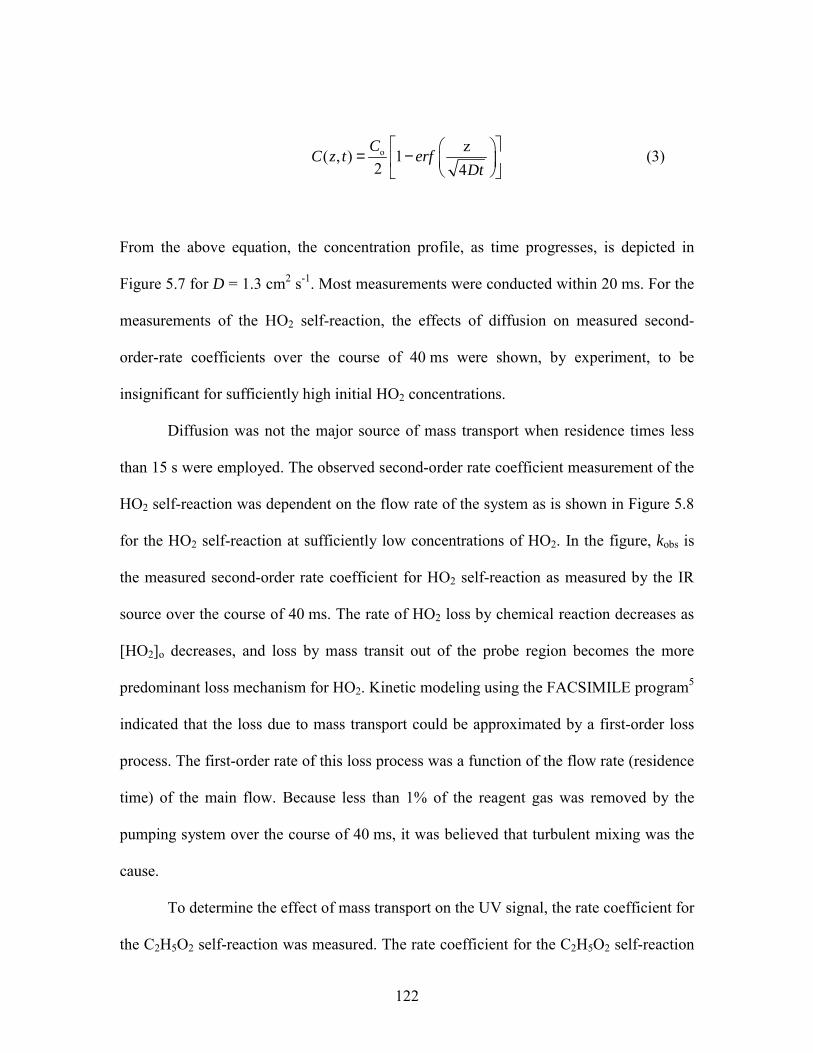
122
o z( , ) 12 4
CC z t erfDt
= −
(3)
From the above equation, the concentration profile, as time progresses, is depicted in
Figure 5.7 for D = 1.3 cm2 s-1. Most measurements were conducted within 20 ms. For the
measurements of the HO2 self-reaction, the effects of diffusion on measured second-
order-rate coefficients over the course of 40 ms were shown, by experiment, to be
insignificant for sufficiently high initial HO2 concentrations.
Diffusion was not the major source of mass transport when residence times less
than 15 s were employed. The observed second-order rate coefficient measurement of the
HO2 self-reaction was dependent on the flow rate of the system as is shown in Figure 5.8
for the HO2 self-reaction at sufficiently low concentrations of HO2. In the figure, kobs is
the measured second-order rate coefficient for HO2 self-reaction as measured by the IR
source over the course of 40 ms. The rate of HO2 loss by chemical reaction decreases as
[HO2]o decreases, and loss by mass transit out of the probe region becomes the more
predominant loss mechanism for HO2. Kinetic modeling using the FACSIMILE program5
indicated that the loss due to mass transport could be approximated by a first-order loss
process. The first-order rate of this loss process was a function of the flow rate (residence
time) of the main flow. Because less than 1% of the reagent gas was removed by the
pumping system over the course of 40 ms, it was believed that turbulent mixing was the
cause.
To determine the effect of mass transport on the UV signal, the rate coefficient for
the C2H5O2 self-reaction was measured. The rate coefficient for the C2H5O2 self-reaction

123
is relatively small at room temperature, approximately 1.1 × 10⁻¹³ cm3 molecule-1 s-1 for
the overall observed rate (which includes the contribution from the radical branching
channel). The results were similar to those obtained in the IR channel for the HO2 self-
reaction.
The flow characteristics of the reaction cell were analyzed. The Reynolds number
(Re) is an indicator of the flow characteristics of a flowing liquid or gas system. The
Reynolds equation is
Re = 4 QD
ρπ
(4)
where ρ is the gas density (g cm-3), Q is the flow rate (cm3 s-1), D is the diameter of pipe
(cm), and µ is the gas viscosity (g cm-1 s-1). µ = µo(T/298)0.5. For the present system, the
following values were used: µo = 1.8 g cm-1 s-1 (air), D = 5.66 cm. Table 1 lists Re versus
Q at 100 Torr for various flow rates and two temperatures, 298 K and 231 K. As an
approximation, the flow can be described as laminar when Re < 2000 and turbulent when
Re > 3000. In between, it is mixed.
Table 1. Calculated Reynolds number for kinetic experiments. flow (sccm) Q (cm3 s-1) residence time (s) a Re(298 K) Re(231 K)
2000 250 14 50 70 4000 510 6.8 100 150 8000 1000 3.4 200 290
a volume of reaction cell between the two exit ports is 3470 cm3
124
From the above calculations, it appeared that flow within the reaction cell was laminar.
However, the above calculation was done for the gas once it was inside the main reaction
cell and was flowing towards the exit ports. At the interfaces between the pre-cooling
side-arm and main cell and the exit ports and the main cell, local mixing may occur. This
was considered the most likely cause for the dependence of observed rate coefficients on
the flow rate.
5.5 IR Detection
5.5.1 Herriott resonator
Figure 5.9 shows the Herriott mirrors. There were two different mirrors used in
the cell, an input mirror and a back mirror. The input mirror had a 1/8-inch diameter input
hole for the diode laser beam. The typical substrate was Pyrex. There was a bonding coat
that allowed the gold coating to adhere adequately to the substrate that was applied onto
the Pyrex substrate. Typically, it was either a mixture of chromium and silver or inconel.
A protective layer was coated onto the gold.
Figure 5.10 shows the placement of the first three reflected spots from the diode
laser beam with respect to the Herriott mirrors. The mirrors had a radius of curvature (R)
of 2032 mm. The length (l) between the mirrors was approximately 1820 mm apart. This
resulted in 30 passes back and forth through the photolysis region. For reference, to
obtain 28 passes back and forth, the mirrors should be spaced 1786 mm apart. For 32
passes, the spacing is 1844 mm.
For the two identical mirrors, the resonator g parameter is defined as6,7

125
g = 1 lR
− (5)
The cavity was considered a stable resonator because 0 ≤ g2 = 0.01 ≤ 1.6,7 The dashed
lines on Figure 5.10 indicate where subsequent reflections were located on each mirror.
Much of the consideration of the design of the Herriott resonator had to do with the
distance between adjacent reflections. The beam diameter of the diode laser was
approximately 2 mm. To prevent overlap between the input hole and the adjacent
reflections on either side of the input hole, it was determined that a spacing larger than
6 mm was necessary between adjacent reflections. The ellipse formed by subsequent
reflections on each mirror had the following parameters: major axis radius a = 15 mm,
minor axis radius b = 7.5 mm. The placement of the input hole was along the minor axis
of the ellipse. In this configuration, the distance, d, between successive reflections was
2 2 2 2sin( ) (1 cos( ))d a bθ θ= + − (6)
where θ was the angle between successive reflections on an individual mirror defined as
θ = cos-1(2g2 1) (7).
The value of θ was calculated to be 24º and d was calculated to be ~ 6.1 mm using
equations (5), (6), (7) and the values for l, R, a, and b given above. To obtain a condition
in which reflection sizes remained constant for each reflection, the required beam
126
diameter on each of the mirrors needed to be approximately 1.5 mm, as calculated from
the following equation6,7
beam diameter = 1/ 41/ 2 12
1l
gλπ
−
(8)
where λ is the wavelength of light (1.51 µm). The actual beam diameter was
approximately 2 mm and slight periodic focusing and de-focusing was observed.
However, none of the laser light fell off either of the mirrors. For the final transit back
through the input hole, the beam diameter was nearly 2 mm.
5.5.2 The Modulation and Detection Electronics for IR channel
The modulation and detection electronics are shown in Figure 5.11. The system
was made up of discrete elements. The manufacturer of each element is listed in Figure
5.11. Essentially, the system was a high-frequency lock-in detector operated on second-
harmonic mode. The detection was phase-sensitive.
The system was designed to operate at a modulation frequency of 6.80 MHz
because of several reasons. First, this was a frequency region where commercial phase
shifters were available. Second, the de-modulated signal from the detector needed to be
fully averaged by the low-pass bandwidth of the detection elements after the mixer so
that the signal did not contain the initial modulation imposed on the diode laser. The SRS
pre-amplifier had an inherent bandwidth of approximately 1.5 MHz at a gain of 1000, the
value employed for most experiments. This was sufficient for full averaging of the de-
modulated signal. The third reason the system was operated at 6.80 MHz was because the
127
diode laser 1/f intensity noise was minimized by detecting signals at 13.6 MHz. Under
conditions where the diode laser beam went straight into a detector without passing
through the Herriott cell, the dominant noise at 13.6 MHz was the quadrature sum of the
detector (Johnson noise) and shot noise of the diode laser, as measured by a spectrum
analyzer. In an actual experiment, there were significant contributions to the total noise of
the signal from etalon effects within the Herriott resonator. The etalons were equivalent
to absorptions of approximately 10-4, approximately the same order of magnitude as the
absorptions due to HO2. The absorptions due to etalons were frequency dependent, and
because they were non-linear in nature, the etalons translated some of the 6.80 MHz
modulation into 13.6 MHz modulation. Further, the diode laser intensity output (L-I
characteristic) was highly non-linear with respect to input current. This non-linearity
translated diode laser intensity noise into noise at 13.6 MHz.
Pickup of electromagnetic field (EMF) noise was an issue for the diode laser
channel. The shielded cable from the ILX current driver to the bias tee was observed to
act as an antenna for EMF pickup. This was greatly reduced by properly grounding both
ends. It was observed that the warning light outside the laboratory caused significant
noise due to discharge of electricity from the brushes of the motor that turned the warning
light. This problem was solved by not using the motor. A further source of noise was the
charging up of the capacitor banks that provided charge to the capacitors in the excimer
laser. After the excimer fired, the thyratron circuit immediately (within a tens of µs)
began to re-charge the capacitor banks. This emitted an EMF with a frequency of around
60 kHz that persisted for several milliseconds. The time it persisted was dependent on the
128
voltage setting of the thyratron. This problem was mitigated by using the inhibit circuit of
the thyratron after the trigger pulse was sent to fire the laser.
5.5.3 The HO2 signal at 6638.2 cm-1
A scan of the HO2 signal as a function of current was obtained for the HO2
transition that was employed for most of the experiments. The diode laser temperature
was held at about 297.5 K (11.0 kΩ thermistor resistance on the plate holding the diode
laser inside the diode laser housing). The current was ramped from 43 mA to 63 mA
using a sawtooth voltage function on the input to the current controller. The spectrum in
Figure 5.12 was obtained. The negative slope of signal versus current was to the non-
linearity of the diode laser L-I characteristic as well as etalons in the diode laser beam
path. The concentration of HO2 for the scan was approximately 3 × 10¹³ molecules cm-3.
To calibrate the spectral position of the HO2 signal near 6638.2 cm-1, spectral
scans of water were conducted. Water was flown into the reaction cell at 295 K and
10 Torr total pressure. The concentration of water in the cell was approximately 3 × 10¹⁶
molecules cm-3. The pathlength of the IR beam through the region with water was
approximately 137 cm × 30 passes = 4100 cm. As depicted in Figure 5.13, two water
transitions were observed. Using the HITRAN database,8 the two water lines were
positions were established. Line A was at 6636.85 cm-1 and Line B was at 6636.60 cm-1.
The spectral distance between the peaks was 0.25 cm-1, and the current distance was
11 mA. The current tuning was thus approximately -0.023 cm-1/mA. At 8.2 kΩ, the
frequency of emission at 49.60 mA was estimated to be 6634.2 cm-1 (from measurements
made the same day). The temperature tuning was approximately 1 cm-1/kΩ. Line A was

129
approximately at 49.60 mA. The line used for HO2 studies was at 33.80 mA, 11.7 kΩ.
The combined temperature and current tuning places the HO2 line at ~ 6638.0 ± 0.5 cm-1.
The uncertainty is based on the observation that diode laser current tuning was non-
linear. It was more efficient at lower currents (i.e., the frequency response was greater per
unit current at). Also, the temperature tuning has been observed to be slightly non-linear,
becoming more efficient at lower temperatures (higher values of thermistor resistance).
Through private conversation, I obtained an emission spectrum of HO2 between
6570.0 cm-1 and 6700.0 cm-1. The work was done by E. Fink and D. Ramsay. To date, it
has not been published. It was done at the same time work was done on the emission
spectrum of the A2A′ → X2A″ band of HO2 which was published in 1997 by these same
workers.9 I have not been authorized to publish this work so I will only document my
observation based on their work. There is a strong emission line at 6638.20 ± 0.05 cm-1
given an arbitrary strength of approximately 1.9. There are also an emission lines at
6638.10 ± 0.05 cm-1 and 6638.35 ± 0.05 cm-1 with strengths of approximately 1. None of
the lines are labeled and could be due to O2 emission. Tuckett et al.10 also studied the
emission spectrum of HO2 in this spectral region and assigned many of the transitions.
Based on the above considerations, the maximum HO2 signal has been associated with a
frequency of 6638.2 cm-1 and the assignment qQ2. A supporting piece of evidence is that
the observed HO2 transition strengths diminished as the frequency of the diode laser was
increased from the HO2 transition at 6625.80 cm-1, a transition given the nominal
assignment qP0(10).10 It was assumed that this was due to the decrease in the degeneracy
as J → 0. Despite this trend, the line at 6638.2 cm-1 was observed to be stronger than all
130
the previous lines. These observations support the theory that the transition is a Q-branch
band-head.
5.5.4 Comparisons of linestrengths between Q1,2(12)0-1 A2A′ ←←←← X2A″ and qP0(10)
2νννν1 transitions
For kinetic studies of the HO2 + NO2 + M reaction, described in Chapter 1, two
lasers were used, one that emitted at 1.43 microns and one that emitted at 1.51 microns.
The former investigated A2A′ ← X2A″ electronic transitions, the latter investigated ro-
vibrational transitions associated with the O-H overtone. The Q1,2(12)0-1 A2A′ ← X2A″
transition occurs9 at 6998.403 cm-1 and the qP0(10) O-H stretch overtone transition (2ν1)
occurs10 at 6625.80 cm-1. Both assignments were made using emission measurements.9
Linestrengths for A2A′ ← X2A″ transitions have not been published to date. Linestrength
measurements for only one transition of 2ν1 has been published. This was for the qP0(10)
line and its value was reported to be 2.4 × 10⁻²¹ cm2 molecule-1 cm-1.11
Daniel B. Oh and I conducted measurements in 1999 to compare linestrengths
between the overtone and electronic transition. At that time, Dr. Oh was a researcher at
Southwest Sciences Inc. in Santa Fe, NM. The apparatus used was a discharge flow
apparatus. A microwave discharge dissociated O2 into O atoms that then reacted with
allyl alcohol.
2 2 2 2 2CH =CH-CH OH + O HO + CH =CH-CH → (9)
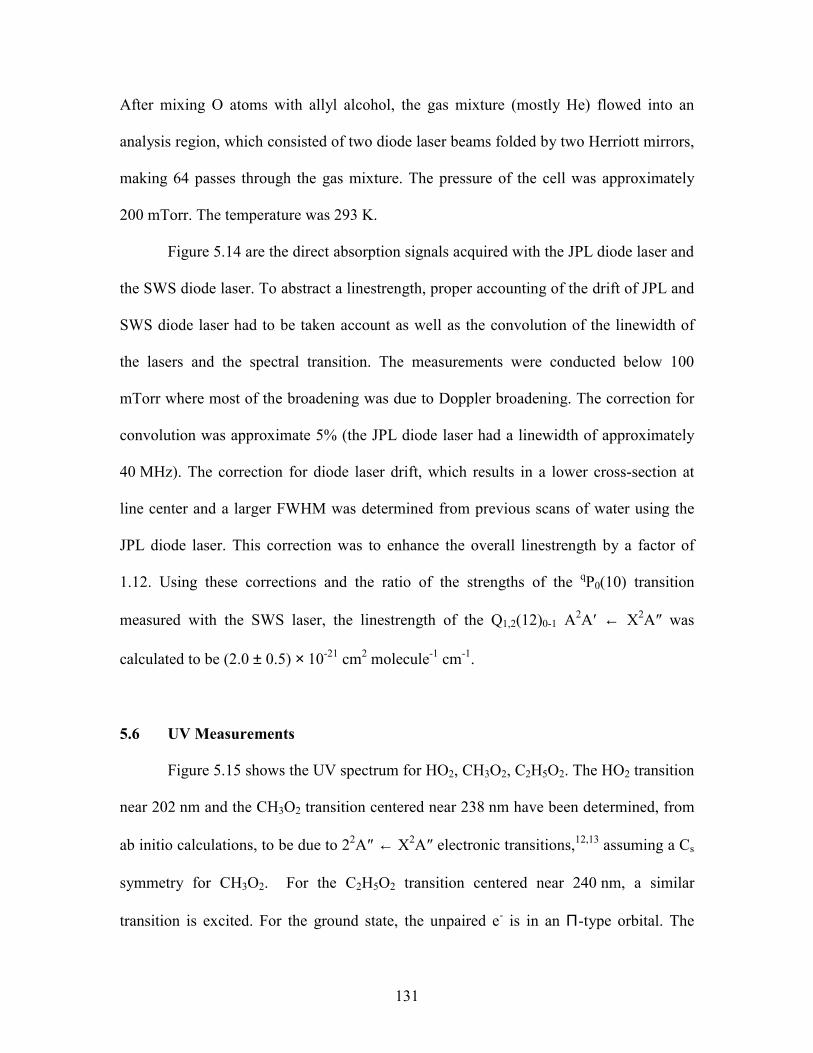
131
After mixing O atoms with allyl alcohol, the gas mixture (mostly He) flowed into an
analysis region, which consisted of two diode laser beams folded by two Herriott mirrors,
making 64 passes through the gas mixture. The pressure of the cell was approximately
200 mTorr. The temperature was 293 K.
Figure 5.14 are the direct absorption signals acquired with the JPL diode laser and
the SWS diode laser. To abstract a linestrength, proper accounting of the drift of JPL and
SWS diode laser had to be taken account as well as the convolution of the linewidth of
the lasers and the spectral transition. The measurements were conducted below 100
mTorr where most of the broadening was due to Doppler broadening. The correction for
convolution was approximate 5% (the JPL diode laser had a linewidth of approximately
40 MHz). The correction for diode laser drift, which results in a lower cross-section at
line center and a larger FWHM was determined from previous scans of water using the
JPL diode laser. This correction was to enhance the overall linestrength by a factor of
1.12. Using these corrections and the ratio of the strengths of the qP0(10) transition
measured with the SWS laser, the linestrength of the Q1,2(12)0-1 A2A′ ← X2A″ was
calculated to be (2.0 ± 0.5) × 10-21 cm2 molecule-1 cm-1.
5.6 UV Measurements
Figure 5.15 shows the UV spectrum for HO2, CH3O2, C2H5O2. The HO2 transition
near 202 nm and the CH3O2 transition centered near 238 nm have been determined, from
ab initio calculations, to be due to 22A″ ← X2A″ electronic transitions,12,13 assuming a Cs
symmetry for CH3O2. For the C2H5O2 transition centered near 240 nm, a similar
transition is excited. For the ground state, the unpaired e- is in an Π-type orbital. The

132
calculated dipole moment functions of X2A″ and 22A″ are a factor of 2 different, thus
there should be a strong transition due to the accompanying charge transfer.12,13
5.7 References
1. DeMore, W. B., S. P. Sander, et al. (1997). Chemical Kinetics and Photochemical Data
for Use in Stratospheric Modeling, Evaluation Number 12. Pasadena, CA, Jet
Propulsion Laboratory, California Institute of Technology.
2. Bass, A. M., A. E. Ledford, et al. J. Res. NBS 80A: 143-166 (1976).
3. Davidson, J. A., C. A. Cantrell, et al. J. Geophys. Res. 93: 7105-7112 (1988).
4. C., R. R. and T. K. Sherwood (1958). The Properties of Gases and Liquids, Chap. 8.
New York, McGraw-Hill Book Company.
5. Curtis, A. R. and W. P. Sweetenham (1987). FACSIMILE/CHEKMAT, H015 ed.
Harwell: Oxfordshire (UK).
6. Siegman, A. E. (1971). An Introduction to Lasers and Masers. New York, McGraw-
Hill.
7. Trutna, W. and R. Byer "Multiple-pass Raman gain cell." Appl. Optics 19: 301-312
(1980).
8. Rothman, L. S., C. P. Rinsland, et al. "The HITRAN Molecular Spectroscopic
Database and HAWKS (HITRAN Atmospheric Workstation): 1996 Edition."
Journal of Quantitative Spectroscopy & Radiative Transfer 60: 665-710 (1998).
9. Fink, E. H. and D. A. Ramsay J. Mol. Spectrosc. 185: 304-324 (1997).

133
10. Tuckett, R. P., P. A. Freedman, et al. "The Emission Bands of HO2 between 1.43 and
1.51 Microns." Molecular Physics 37: 379-401 (1979).
11. Taatjes, C. A. and D. B. Oh Appl. Optics 36: 5817-5821 (1997).
12. Shih, S.-K., S. D. Peyerimhoff, et al. "MRD-CI Calculations for the Vertical
Electronic Spectrum of the Hydroperoxyl Radical." Chemical Physics 28: 299-
304 (1978).
13. Jafri, J. A. and D. H. Phillips "Ground and Lower Excited States of Methyl Peroxy,
CH3O2, Radical: A Computational Investigation." J. Am. Chem. Soc. 112: 2586-
2590 (1990).
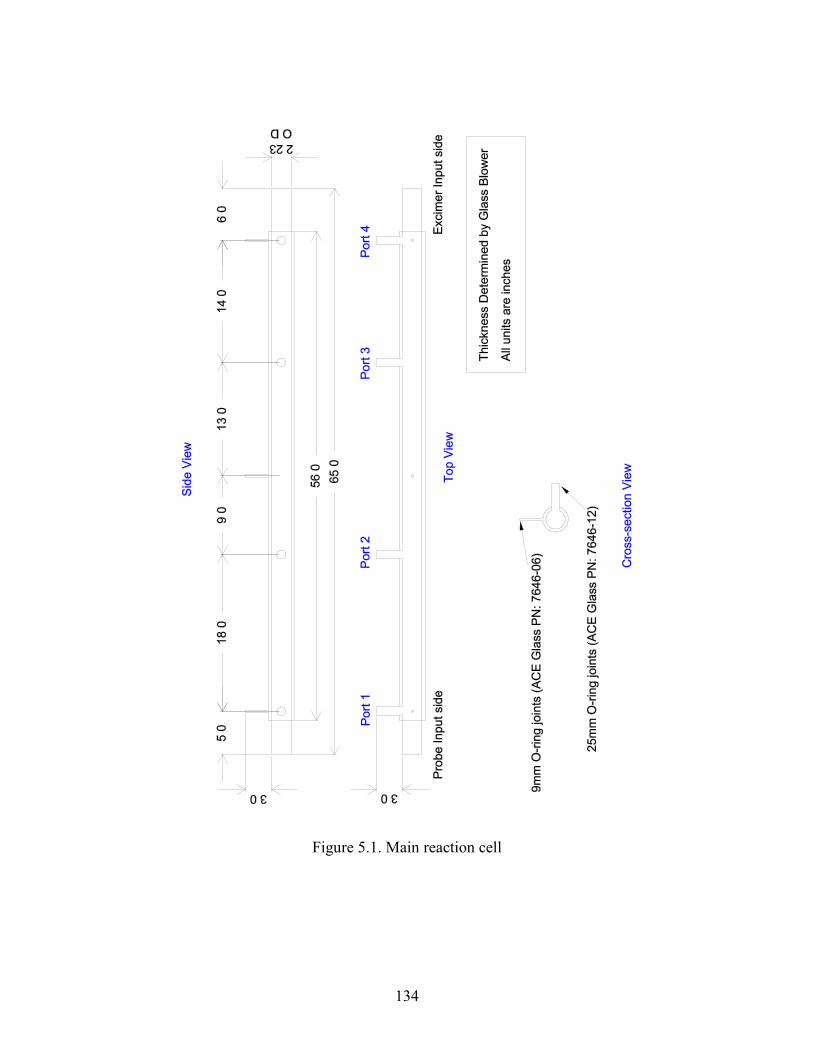
134
Figure 5.1. Main reaction cell
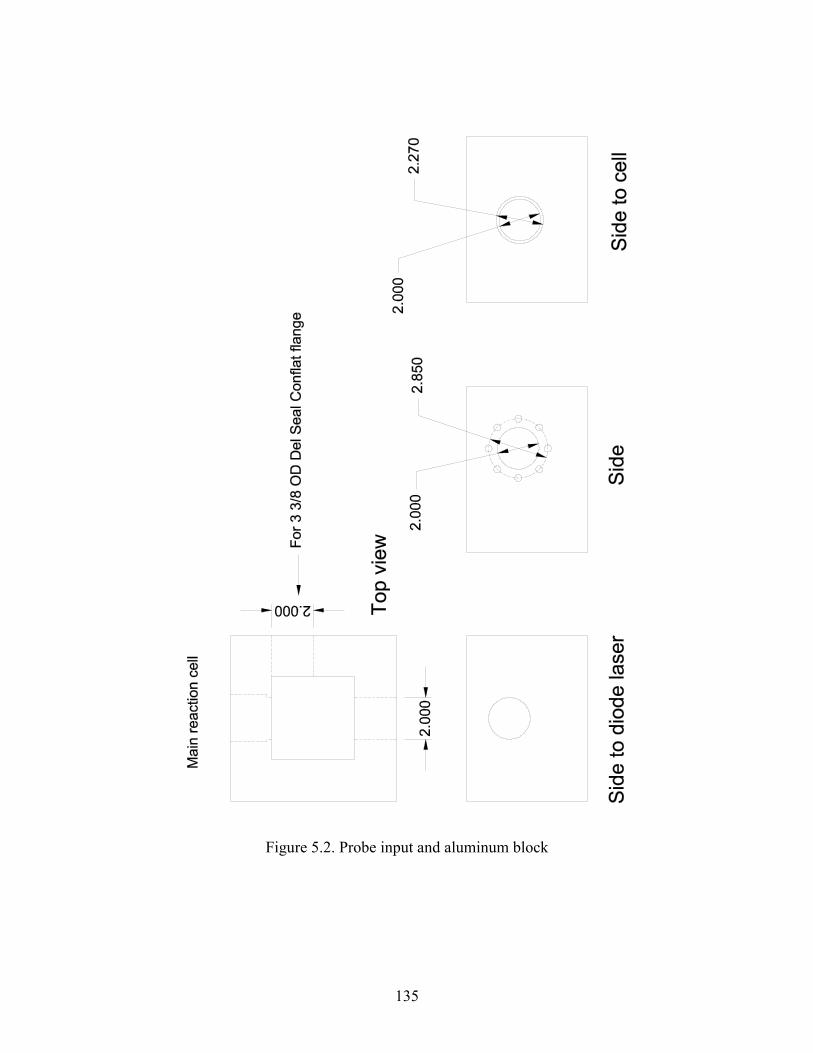
135
Figure 5.2. Probe input and aluminum block
136
Side facing cell
Top View
Figure 5.3. Excimer input and aluminum block.
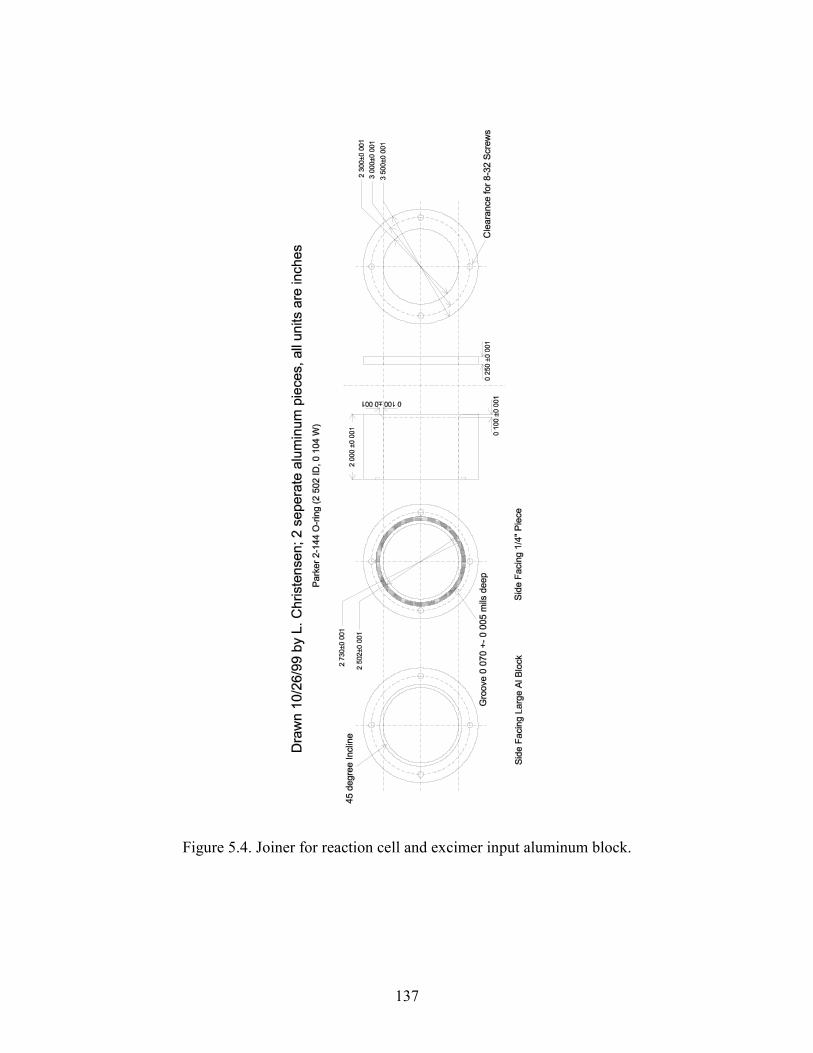
137
Figure 5.4. Joiner for reaction cell and excimer input aluminum block.

138
All units in inchesunless otherwisenotedItem made fromPyrex
Figure 5.5. Pre-cooling cell.
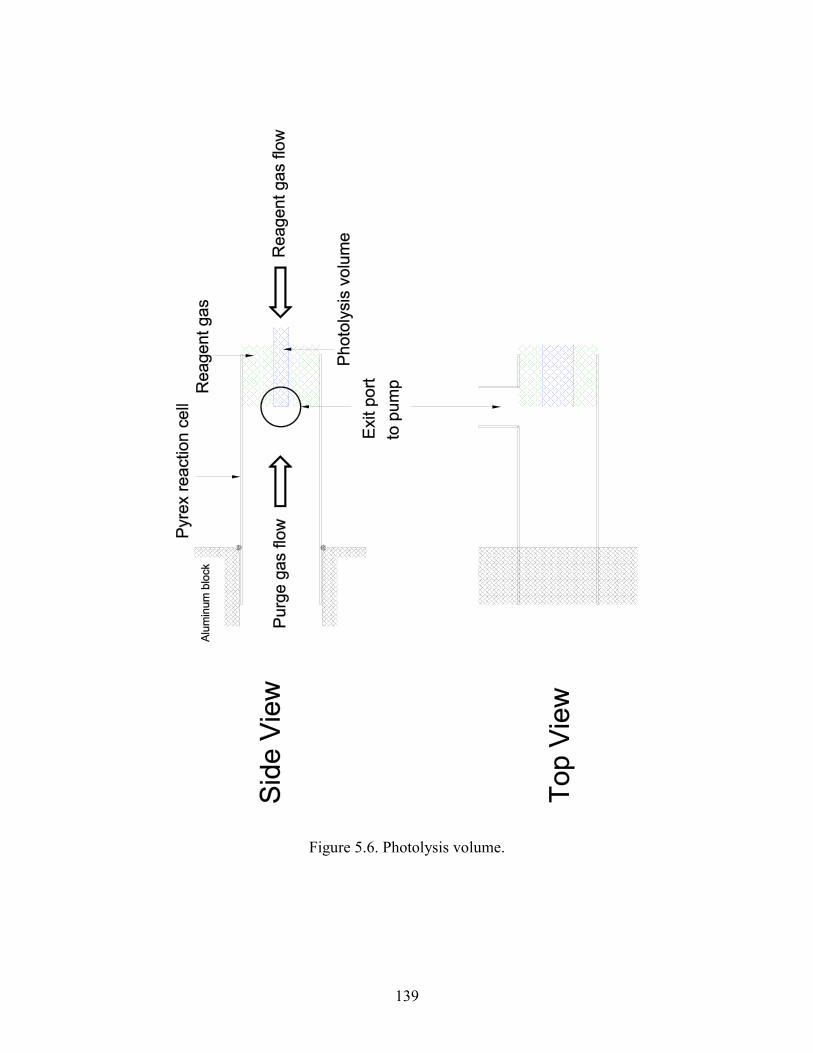
139
Figure 5.6. Photolysis volume.

140
1.0
0.8
0.6
0.4
0.2
0.0
Fra
ctio
n of
initi
al c
once
ntra
tion
-1.0 -0.5 0.0 0.5 1.0
Distance relative to edge (cm)
Photolysis volume Outside photolysis volume
40 ms
300 µs
20 ms
Figure 5.7. Calculated HO2 concentration profiles at 100 Torr, 298 K at different times after the photolysis event.
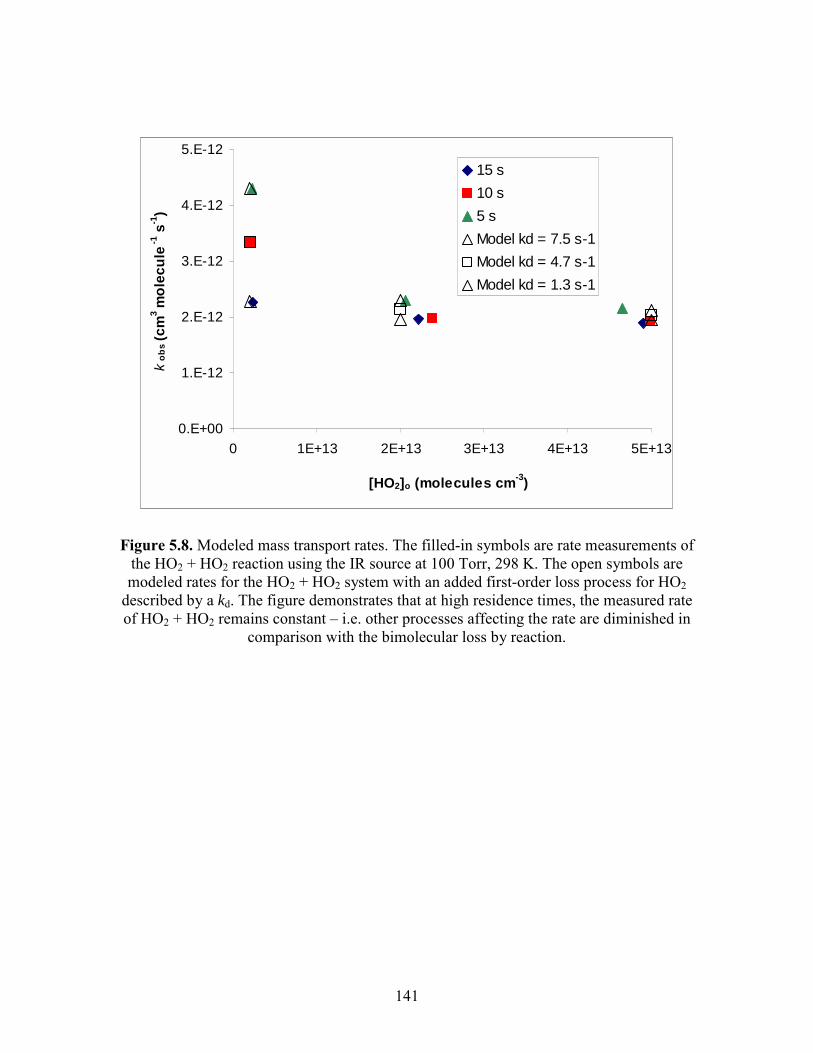
141
Figure 5.8. Modeled mass transport rates. The filled-in symbols are rate measurements of the HO2 + HO2 reaction using the IR source at 100 Torr, 298 K. The open symbols are modeled rates for the HO2 + HO2 system with an added first-order loss process for HO2
described by a kd. The figure demonstrates that at high residence times, the measured rate of HO2 + HO2 remains constant i.e. other processes affecting the rate are diminished in
comparison with the bimolecular loss by reaction.
0.E+00
1.E-12
2.E-12
3.E-12
4.E-12
5.E-12
0 1E+13 2E+13 3E+13 4E+13 5E+13
[HO2]o (molecules cm-3)
kob
s (c
m3
mol
ecul
e-1
s-1
) 15 s10 s5 sModel kd = 7.5 s-1Model kd = 4.7 s-1Model kd = 1.3 s-1
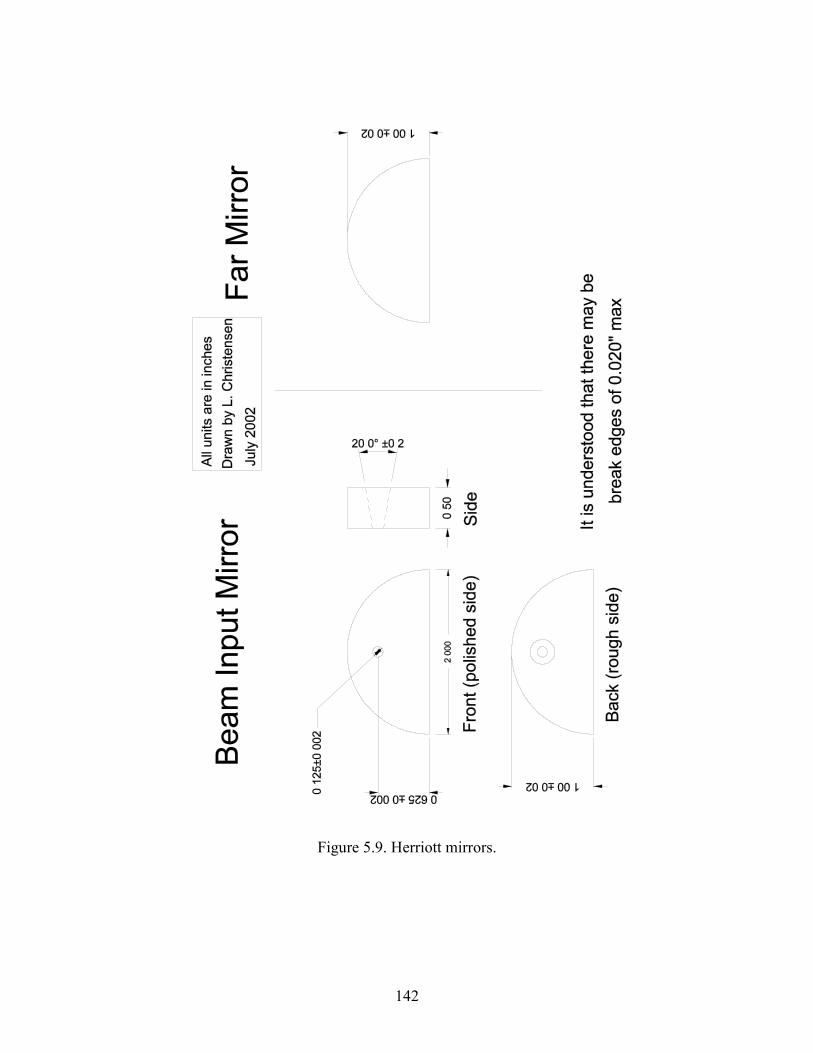
142
Figure 5.9. Herriott mirrors.

143
Figure 5.10. Diode laser beam placement on Herriott mirrors.
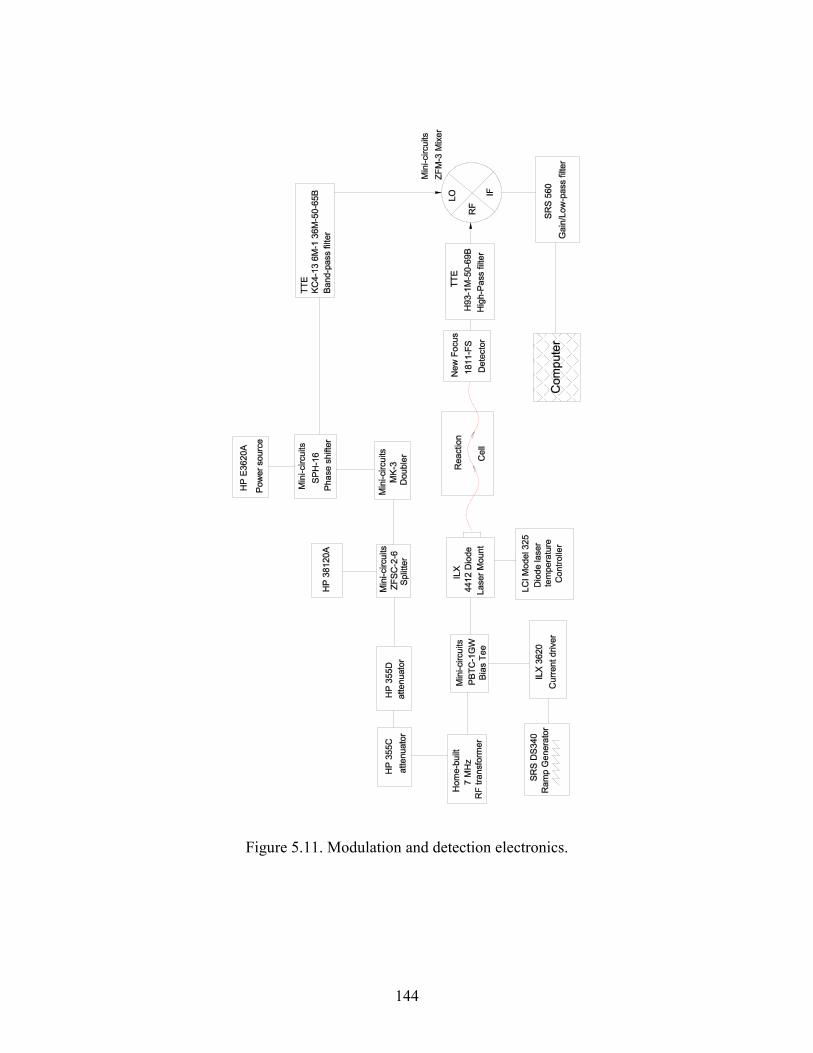
144
Figure 5.11. Modulation and detection electronics.
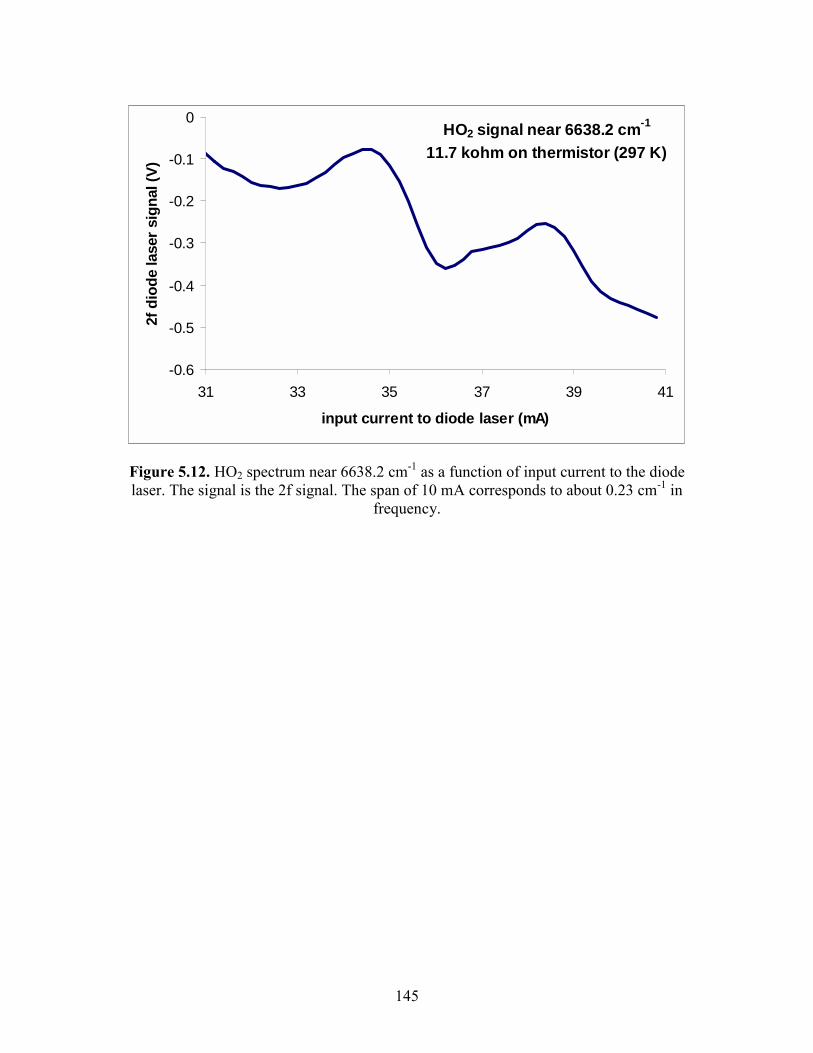
145
Figure 5.12. HO2 spectrum near 6638.2 cm-1 as a function of input current to the diode laser. The signal is the 2f signal. The span of 10 mA corresponds to about 0.23 cm-1 in
frequency.
HO2 signal near 6638.2 cm-1
11.7 kohm on thermistor (297 K)
-0.6
-0.5
-0.4
-0.3
-0.2
-0.1
0
31 33 35 37 39 41
input current to diode laser (mA)
2f d
iode
lase
r sig
nal (
V)
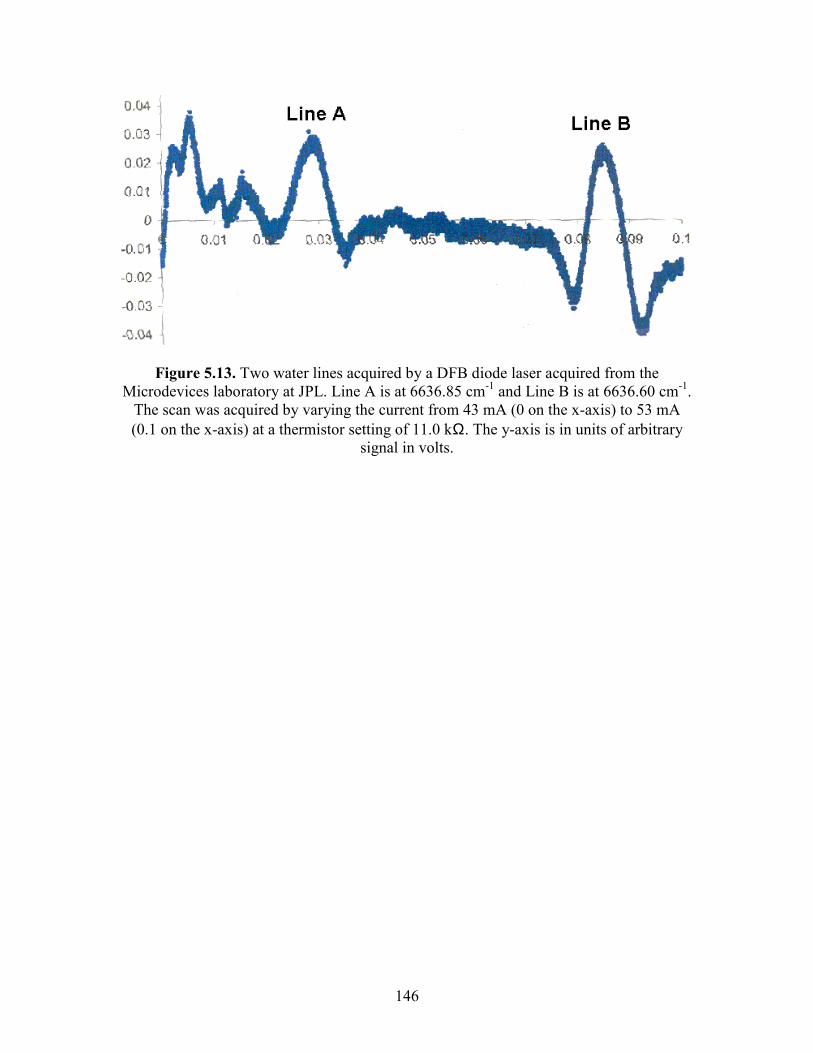
146
Figure 5.13. Two water lines acquired by a DFB diode laser acquired from the Microdevices laboratory at JPL. Line A is at 6636.85 cm-1 and Line B is at 6636.60 cm-1.
The scan was acquired by varying the current from 43 mA (0 on the x-axis) to 53 mA (0.1 on the x-axis) at a thermistor setting of 11.0 kΩ. The y-axis is in units of arbitrary
signal in volts.
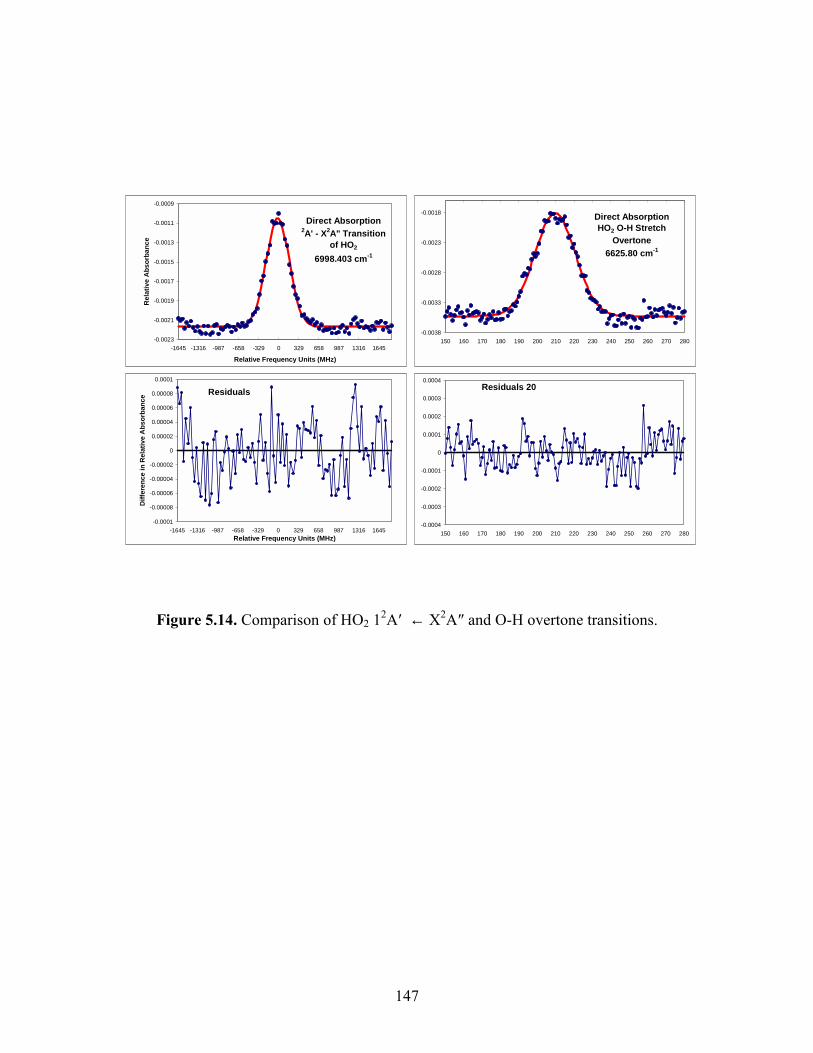
147
Figure 5.14. Comparison of HO2 12A′ ← X2A″ and O-H overtone transitions.
Direct Absorption2A' - X2A" Transition
of HO2
6998.403 cm-1
-0.0023
-0.0021
-0.0019
-0.0017
-0.0015
-0.0013
-0.0011
-0.0009
-1645 -1316 -987 -658 -329 0 329 658 987 1316 1645
Relative Frequency Units (MHz)
Rel
ativ
e A
bsor
banc
e
Residuals
-0.0001
-0.00008
-0.00006
-0.00004
-0.00002
0
0.00002
0.00004
0.00006
0.00008
0.0001
-1645 -1316 -987 -658 -329 0 329 658 987 1316 1645Relative Frequency Units (MHz)
Diff
eren
ce in
Rel
ativ
e A
bsor
banc
e
Direct AbsorptionHO2 O-H Stretch
Overtone6625.80 cm-1
-0.0038
-0.0033
-0.0028
-0.0023
-0.0018
150 160 170 180 190 200 210 220 230 240 250 260 270 280
Residuals 20
-0.0004
-0.0003
-0.0002
-0.0001
0
0.0001
0.0002
0.0003
0.0004
150 160 170 180 190 200 210 220 230 240 250 260 270 280
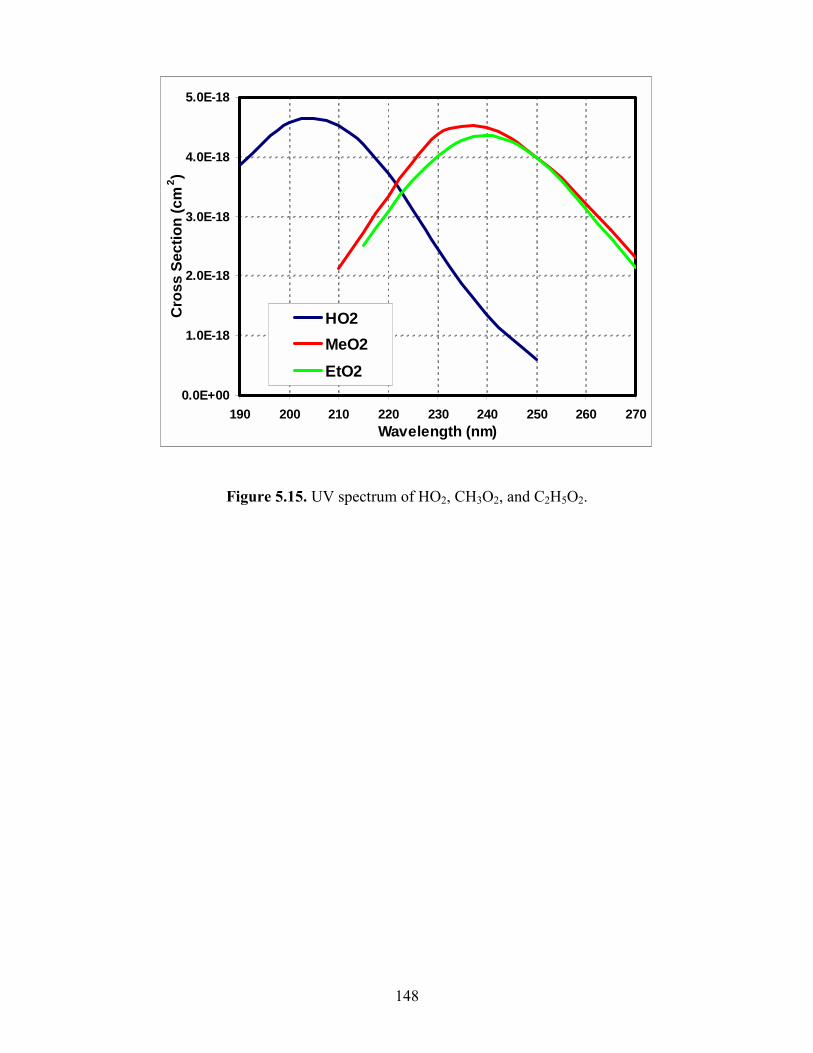
148
Figure 5.15. UV spectrum of HO2, CH3O2, and C2H5O2.
0.0E+00
1.0E-18
2.0E-18
3.0E-18
4.0E-18
5.0E-18
190 200 210 220 230 240 250 260 270Wavelength (nm)
Cro
ss S
ectio
n (c
m 2 )
HO2MeO2EtO2
Related Documents