LABORATORY PROFICIENCY TESTING RESEARCH PROGRAM U.S. Department of Justice National Institute of Justice 143163 This document I,as been reproduced exactly as received from the person or organization originating it. Points of view or opinions stated in this document are those of the authors and do not necessarily represent the official position or policies of the National Institute of Justice, Permission to reproduce this ! , _tocl material has been granted by- • , Pub1J.c Dornal.n u.s. Deparbna"1t of Justice to the National Criminal Justice Reference Service (NCJRS), Further reproduction outside of the NCJRS system requires permission of the owner. NATIONAL INSTITUTE OF LAW ENFORCEMENT AND CRIMINAL JUSTICE LAW ENFORCEMEN'T ASSISTANCE ADMINISTRATION U.S. DEPARTMENT OF JUSTICE· If you have issues viewing or accessing this file contact us at NCJRS.gov.

Welcome message from author
This document is posted to help you gain knowledge. Please leave a comment to let me know what you think about it! Share it to your friends and learn new things together.
Transcript
LABORATORY PROFICIENCY TESTING RESEARCH PROGRAM
U.S. Department of Justice National Institute of Justice
143163
This document I,as been reproduced exactly as received from the person or organization originating it. Points of view or opinions stated in this document are those of the authors and do not necessarily represent the official position or policies of the National Institute of Justice,
Permission to reproduce this ! , _tocl material has been granted by- • ,
Pub1J.c Dornal.n u.s. Deparbna"1t of Justice
to the National Criminal Justice Reference Service (NCJRS),
Further reproduction outside of the NCJRS system requires permission of the ~ owner.
NATIONAL INSTITUTE OF LAW ENFORCEMENT AND CRIMINAL JUSTICE LAW ENFORCEMEN'T ASSISTANCE ADMINISTRATION U.S. DEPARTMENT OF JUSTICE·
~---------------------------------------------
If you have issues viewing or accessing this file contact us at NCJRS.gov.

LABORATORY 'PROFICIENCY TESTIN·G RESEARCH :PROGRAM'
By
Joseph L. Peterson, D. Crjm.
Ellen'L. Fabricant, M.S.
Kenneth, S. Field, M.B.A.'
1'/31 fo3
with' the assistance of J;I. ThOrnton, D. Crim.
Prepared under Grcint Numbers 74NI.99.0048 and 76NI.99.0091 awarded to the Forensic Sciences Foundation, Inc. by the National Institute of Law Enforcement and Criminal Justice, LciwEnforcement Assistance Administration, u..S. Department of Justice. Points of view or opinions express,ed in this document are those of the authors and do not
. necessarily represent the official position OT policies of the u..S,. Department of Justice.
JULY 1978
NATIONAL INSTITUTE OF LAW ENFORCEMENT AND CRIMINAL JUSTICE LAW ENFORCEMENT ASSISTANCE ADMINISTRATION
U.S. DEPARTMENT OF JUSTICE

PROJECT ADVISORY COMMITTEE
John F. Anderson -Spokane, Washington
J. D. Chastain Austin, Texas
Richard H. Fox Ventura, California
Anthony Longhetti San Bernardino, California
Charles A. McInernE1Y, Jr. ( Pittsburgh, Pehnsylvania Deceased)
Andrew H-. Principe _ Highland Park, Illinois
John -I. Thornton Berkeley~ California
Edward Whittaker Mi ami, Flori da
Statistical Presentations Prepared by:
COLLABORATIVE TESTING SERVICES, INC. - Vienna, Virginia
iii
. .;.----------------

',-",
First and foremost, appreciation is expressed to the members of the Project Advisory Committee (PAC) and the participating laboratories. The proficiency testing program could never have been successful without the support of both groups. The PAC's encouragement, sensitivity, expertise and constructive criticism were instrumental in the success of the research endeavor. However, all their work wo~ld have been for naught if the proficiency testing program had not had the support and cooperation of the entire criminalistics profession~
We would like to thank the many professionals who aided in the design and preparation of test samples. Specifically we w1.sh to cite. the encouragement and support offered by the Ameri can Soci ety of Questioned Document Examiners, the Association of Firearms arid Toolmark Examiners and the American Society of Crime Laboratory Di rectors.
We are also indebted to Pittsburgh Plate Glass, the Cook Paint Company; the Davi s Pai nt Company, Abbott Laboratori es and the U. S. Drug Enforcement Admini strati on for preparing for us and provi d- ' ing us with' test samples.
The expert ana lyses of the test samp,l es provi ded ~y the 1 aboratori es who served in a referee capaci ty ,were most val uabl e to the 'project staff and to the participating laboratories.
Charles Leete and Jeffrey Stevenson of Collaborative Testing Services, Inc. performed a yeoman service in the compilation, abstraction and statistical analyses of project data. Their
-insight and advice cannot go unmentioned.
Lastly, we express our-gratitude to past and p~esent members of the Foundation Staff who sperit many of their hours working to make this a successfuJ project ... James C. Coleman, Deborah A. Heath, Regina Kwan, Beth Ann Lipskih, Mark A. Reich and Mary G. Wilson. .
v

~.
\."t.
. FOREWORD
Periodically, it is, necessary to place proficiency testing programs in the proper perspective with all other laboratory activities that attempt t~maintain or enhance the quality of serVices provided. Pro'ficiency testing is not a panacea for all possible laboratory problems; it cannot solve problems directly traceable to inadequate facilities, nor to those associated with budgetary shortcomings. In fact, proficiency testing is not the only so called; quality assurance program available. Any special effort to develop or maintain quality in laboratory performance is properly called a quality assurance program. Education and in-service training programs fit the description, as do a myriad of quality control measures such as peri odi c cali brat; ons of instruments and programed checks made on reagents. No individual quality assurance program can be said to be'more important than another. All are needed and serve a special purpose.
Thus, proficiency testing fulfiils a particular need, that of providing ~n external (independent) evaluation of laboratory performance. Most internal quality control programs use a structured set of reference mate~ials of publicly known specifications to openly check particular types of examination in a laboratory. Proficiency testing, on the other hand, uses a battery of varied test sample:;. of knowri but unpublicized sp~cifications td test l'boratories as entities, specific tea~s within the laborato~ies~ or iridi~iduals within the laboratories. '
This proficiency testing program w~s not conceived primarily as a means to assess the state-of-the-art, nor was it necessarily viewed asan ongoing program. Rather, the principal purpos~ of this endeavor was to determine the feasibility of proficiency testing as a tool to uncover potential problem areas in laboratory performance. It was a research project concerned with how to design a testing program that. could be implemented by the profession as a continuing, self-sustaining program. However, as 'a result of the research performed, it was anticlpated that knowledge could be gained relati·ve to the general strengths and weaknesses of the laboratories wi~h a view toward supporting 10nge~ rClnge efforts of research and acti on programs.
vii

1-
TABLE OF CONTENTS
v ACKNOWLEDGEMENTS
FOREWORD ....
EXECUTIVE 'SUMMARY
. .. . . . . . . . vi i
. . . .. . . . . .. . . . . . . . . 1
CHAPTER I. PROJECT BACKGROUND
II. METHODS • . . . . . . .. ,. . III. TEST SAMPLE DISCUSSION
- IV. FINDINGS .•. .
• • • • • • • • •• Ii
5
13
51
257
V.
VI.
RECOMMENDATIONS
EPILOGUE
APPENDIX A. ROSTER OF PARTICIPATING LAB.ORATORIES ..
APPENDIX B. GEOGRAPHIC REPRESENTATION OF PARTICIPATING
.. . • • • • • 259
. . . . 261
265
LABORATORIES . . . . 281
SELECTED BiBLIOGRAPHY. . . . . . . . . . . . . . . 285
ix
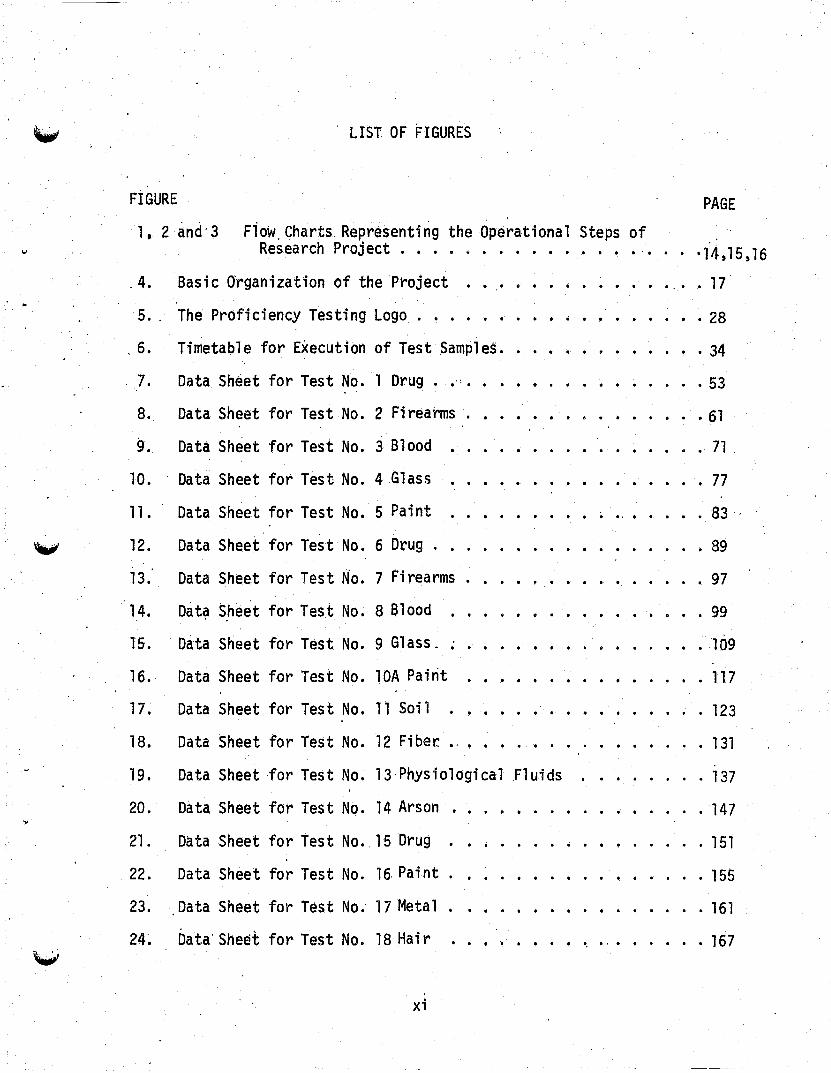
LIST OF FIGURES
FIGURE PAGE
1 • 2 and'3 Fiow. Charts Representing the Operational Steps of Research Project . . . · · .. · · -14,15,16
. 4. Basic Organization of the Pr-oject · · . · · · .. · 17
5 .. The PrOficiency Testing Logo . . · · · · · · · 28
. 6. Timetable for Execution of Test Samples • · · · · · · · • 34
7. Data Sh<:!et for Test No. 1 Dr.ug . · '~ . · · · · · · 53
8. Data Sheet for Test No. 2 Firearms . · · · • 61
9. Data Sheet for Test No. 3 Blood · · · · · · · 71
10. Data Sheet for Test No. 4 Glass · · · · · · · · · 77
1l. Data Sheet for Test No. 5 Paint · .. . · 83
~ 12. Data Sheet for Test No. 6 Drug . · · · · · 89
13. Data Sheet for Test No. 7 Firearms · · . · · 97
14. Dat~ Sheet for Test No. 8 Blood · · · · · · · · · · 99
15. Data Sheet for Test No. 9 Glass. · · · · • · l()9
16. Data Sheet for Test No. lOA Paint 117
17 ~ Data Sheet for Test No. 11 Soil · · · · · · · 123
18. Data Sheet for Test No. 12 Fiber o' • · · · · · 131
19. Data Sheet for Test No. l3,Physio1ogica1 Fluids · · · · · 137
20. Data Sheet for Test No. 14 Arson . · · · . · · · · · · · 147
21. Data Sheet for Test No .. 15 Drug · · · · · . . · . · • · · 151
xi
FIGURE
25.
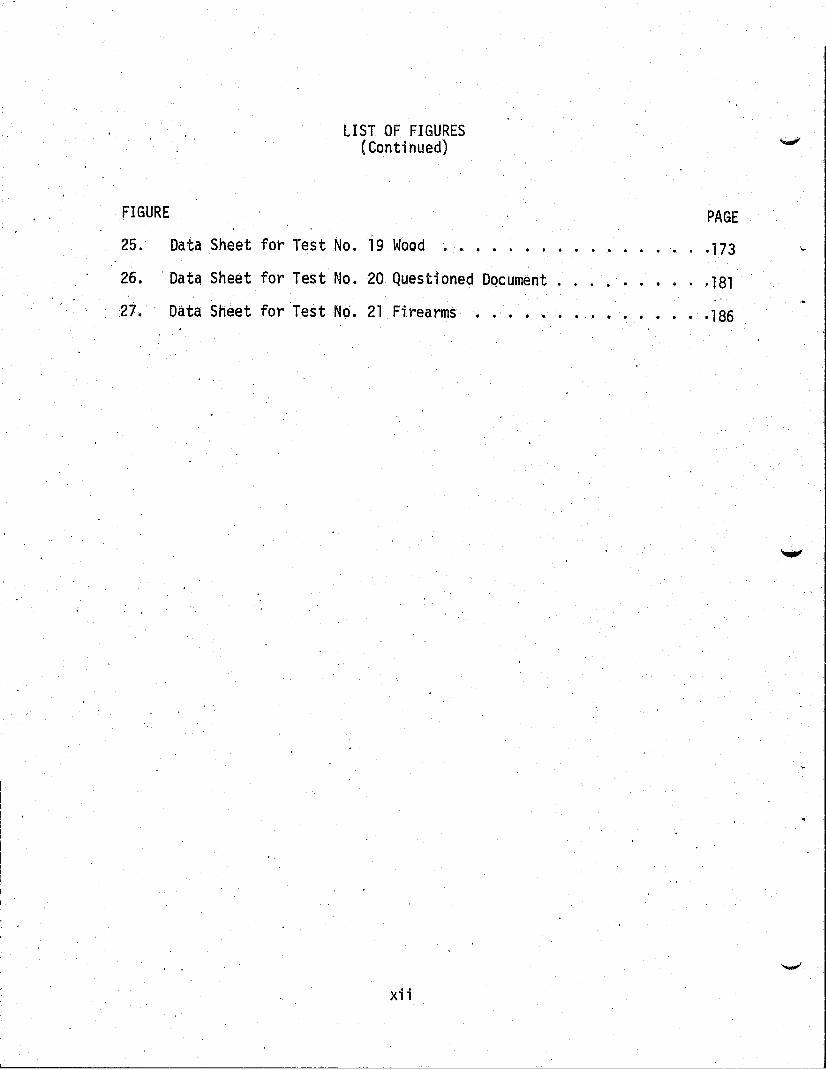
LIST OF FIGURES (Continued)
Data Sheet for Test No. 19 Wood . . . . . . . . . . . 26. 'Data Sheet for Test No. 20 Questioned Dqcument
27. ' Data Sheet for 'Test No. 21 Fi rearms . . . . . . .
xii
PAGE
. .173
. . . ·181
·186

~
~
LIST OF TABLES
TABLE PAGE·
. •. 43 .1.
2.
3.
4.
5.
6.
7.
8.
9.
10.
11. .
12.
13.
14.
15.
16.
17.
18.
19.
20.
21.
22.
Numerica.l Tabulation of Responses
Controlled (Narcotic or Dangerous Drug) Substance Found. .. 55
Relationship Among the Drug Names Used· 56 . .
Methods Used jn Determining Substance . 57
Instruments and Methods ..• . . .: • . . • 58
Characteristics Derived, From Laboratory Responses and the Number of Labs Repo.rting Each Characteristic '. • . • . .• 63
Revolvers Named for Projectile (Item 1) •.•
Revolvers Named for Cartridge Case (Item 2)
Automati cs Named forProjecti 1 e (Item 3)
. . .
Automatics Named for Cartridge Case (Item 4)
Diameter of .38 Special Projectile ..
Land' Widths of .38 Special. Projectile
Groove Widths of .38 Special Projecti)e
. . . .
64
· • . . 65
66
67
68
· . . . 68
69
Diameter of .380 Automatic Projectile. . . •.. 69
Land Wi dths of .380 Automati c Projecti le. • . . 70
Groove Wi dth of .380 Automati c Projecti 1 e . . . '. 70
Methods for Determining That Sample 1s Blood, 73
Methods for Determining That Sample Is Human Blood 74
Methods for Determining ABO Factor of Human Blood . • . . 75
Methods for Determining Additional Blood Subgroups • . .. . . 76
Refract ive Index and Dens i ty Di frerences: B mi nus A • • • 80
Relative F.requencies of the Reported Methods • • • • 81
xiii
'tABLE
23.
,24.
25.
26.
27.
28.
29.
30.
31.
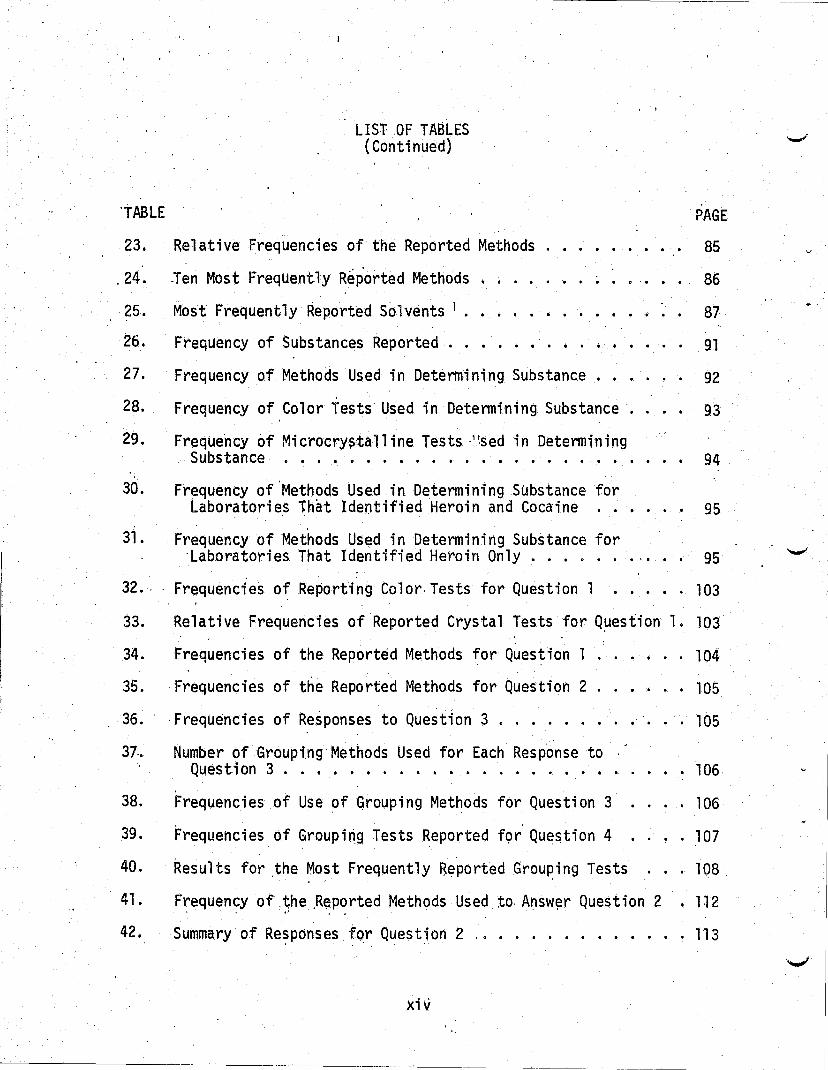
LIST .OF TABLES (Continued)
Relative Frequencies of the Reported Methods
.Ten Most Frequently Reported Methods
Most Frequently Reported Sol vents I •
'. . .
Frequency of Substances Reported . . . . . . . .
, I
. '.
Frequency of Methods Used in Determining Substance
Frequency of Color Tests Used in Determining Substance ..
Frequency of Microcry~talline Tests ·'\sed in Determining - Substance . . . . . . . . . . . . " . . . . . .
Frequenty of 'Methods Used in Determining Substance for Laboratories that Identified Heroin and Cocaine
Frequency of Methods Used in Determining Substance for 'Laboratories That Identified Heroin Only ..... .
32., Frequencies of Reporting Color, Tests for Question 1
PAGE
85
86
87
91
92
93
94
95
95
103
33. Relative Frequencies of Reported Crystal Tests for Q~estion 1. 103
34.
35.
36.
Frequencies of the Reported Methods for Question 1 .
Frequencies of the Reported Methods for Question 2 .
·Frequencies of Responses to Question 3 .
104
. . 105
. 105
37.. Number of Grouping Methods Used for Each Response to Ques t ion 3 . . • .' . . . . • . . . • . . . . . • . 106
38. Frequencies of Use of Grouping Methods for Question 3 .... 106
39. Frequencies of Groupipg Tests Reported f9r Que$tion 4 .. 107
40. Results for ,the Most Frequently Reported Grouping Tests ... 108
41. Frequency of'.the,R~ported Methods Used to.Answ~r Question 2 .112 ~ , .'
42. Summary of Re~ponses. for Question 2 , ........•.... 113
xiv
TABLE
'" 43.
, 44.'
45.
46.
47.
48.
" 49.
~ 50.
51-
52.
53.
54.
55.
56.
57.
.58.
59.
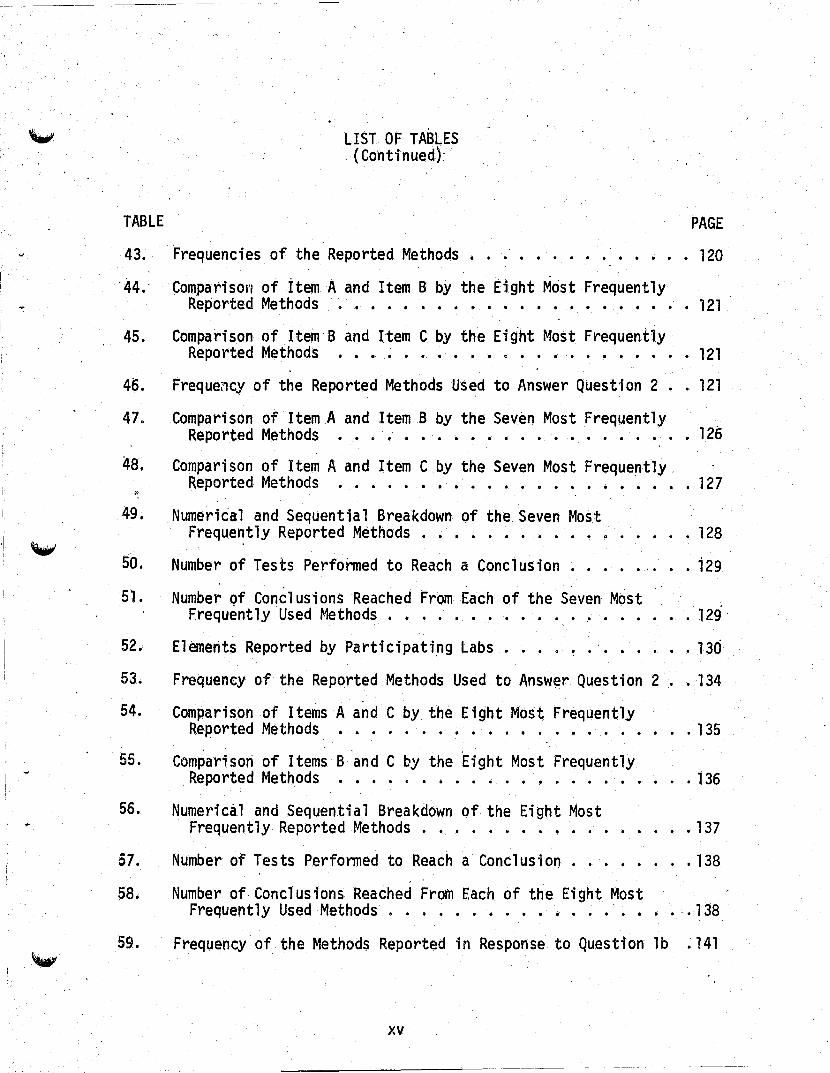
LIST OF TABLES ( Continued)'
Frequencies of the Reported Methods . . . . . . . . . . PAGE
120
Comparisofl of Item. A and Item B by the Eight Most Frequently Reported Methods • 0 0 • • 0 • 0 • 0 • 0 0 ••• 0 • 0 •• 0 121
Comparison of Item' B and Item C by the Eig'ht Most Frequently Reported Methods 0.. 0 • 00 • • • • • 0 0 0 0 0 • • • • 0 121
Freque~cy of the Reported Methods Used to Answer Question 2 0 • 121
Comparison of Item A and Item B by the Seven Most Frequently Reported Methods ••. 0 0 ••• 0 • 0 0 • 0 0 • 0 0 •••• 125
Comparison of Item A and Item C by the Seven Most Frequently Reported Methods .•. 0 • • • 0 0 • 0 ••••• 0 • 0 0 •• 127
NumeriCal and Sequential Breakdown of the Seven Most Frequently Reported Methods . • 0 • 0 0 0 • •
Number of Tests Perfonmed to Reach a Conclusion 0 ••
. .' .
Number of Conclusions Reached From Each of the Seven Most
. 128
. . i 29
Frequently Used Methods 0 0 0 • • 0 0 • • • • • 129
E1 emerits Reported by Parti cipati.ng Labs . . . . ~ .'. 0 • • • • 130
Frequency of the Reported Methods Used to Answ~r Question 2 .. 134
Comparison of Items A and C by the Eight Most Frequently Reported Methods 0 • 0 •••• ~ ••• 0 •••••• 0 • 135
, ,
Comparison of Items Band C hy the Eight Most Frequently Reported Methods . . . . . . . . . . . . 0 • • • • • 136
Numerical and Sequential Breakdown of the Eight Most Frequently Reported Methods . . . . . . . . • . 137
Number of Tests Performed to Reach a Conclusion . .. . .. 138
Number of, Conclusions Reached From Each of the Eight Most Frequently Used Methods •.•... 0 •• 0 0 •••• 0 .138
Frequency of the Methods Reported in Response to Question lb ~ 141
xv

TABLE
LIST OF.TABLES (Continued)
PAGE
60. Frequency of the Methods Reported in Response to Question 2b .,141
61. Summa'ry .of Responses to Questi on 1 a of Those Labs Report; n9 Use 'of Starch Amylase Determination in Question lb ...... 142
62. Summary of Responses to QUestion la of Those .Labs Not Reporting Use of Starch Amylase Determinatiort in Question lb. '. . .. 142
63. Stains Used by Those Laboratories' Reporting Bright Field as a Response to Question lb or 2b •............... 143
64. Substrates and Dyes .Used by Those Laborator-i es Reporting Aci d Phosphatase Determination as a Response to Question lb or 2b. 144
65. Type of Microcrystall ine Tests Performed by Those Laboratories Reporting Microcrystalline Tests as a Response to Question 1 b or 2b. . . . . . . . . . . . . . .. . . . . . . . . . 145
66. Frequency of the Methods Reported in Response to Question 2 .. 150
67.
68.
Summary of Responses to Question 1
Frequency of Reported· Methods · . ".
153
· 154
69. Frequency of Reported Methods Used to Answer Question 2 .... 158
70. Comparison of Item A and. Item B by the Eight Most Frequently ~eported Methods .......... '0 •••••. ' •••• 159
71. Conipari son of Item B and Item C by the Ei ght Most Frequently . Reported Methods .. . . . . . . . 159
72. Frequency of Reported Meth.ods . . .
73. Frequency of Reported Elements
74.
75.
Summary of Responses Sample A
Summary of Responses Sample B
76. Summary of Responses Sample C .
77. Summary of Responses Sample D
xvi
.
. . . . . . .
. . · . . · 165
. . · 166
170
170
· 170
· 171 . ......",.
..
~
'Y.
'fA.BLE
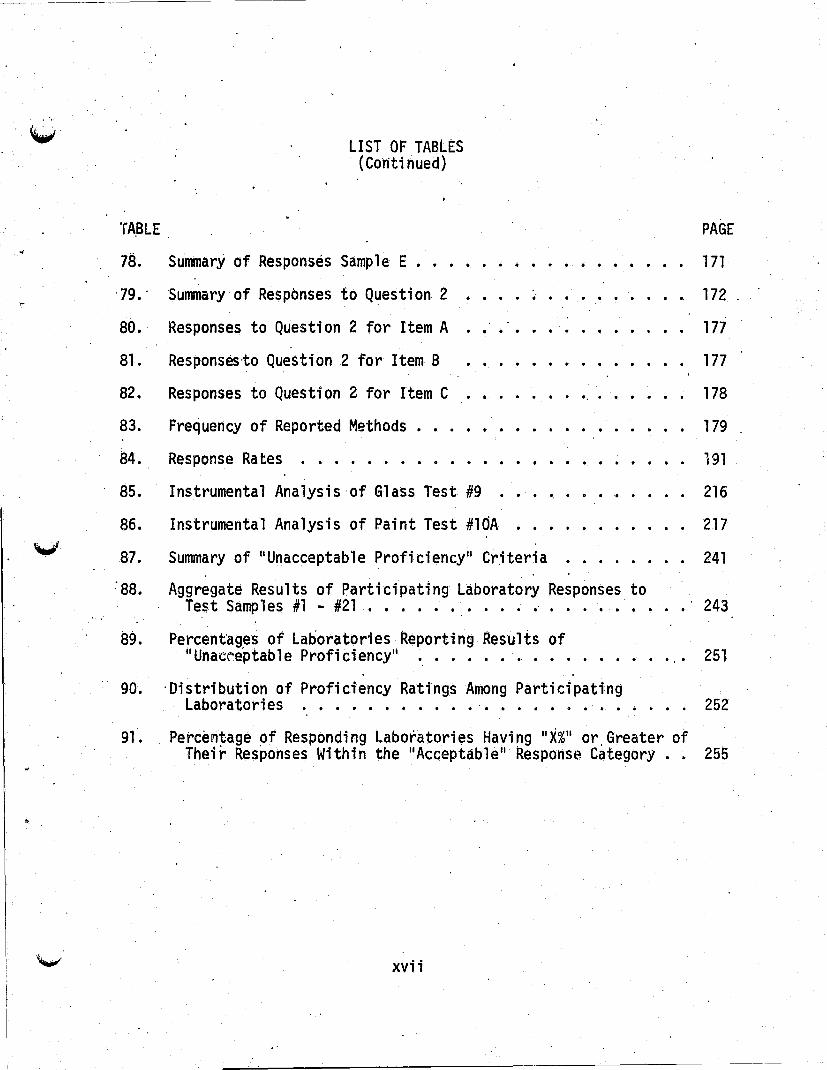
LIST OF TABLES (Continued)
78. Summary of Responses Sample E . • . . . . . . . . . PAGE
171
172
177
177
178
179
·79. '
80.
8l.
82.
83.
84.
85.
86.
87.
'88.
89.
90.
91.
Summary·of Responses to Question 2 · . . . . Responses to Question 2 for Item A ••
Responsesto Question 2 for Item B · . . .
· . . . . . . . . Responses to Question 2 for Item C
Frequency of Reported Methods
Response Rates . . . . • . • · . . . . . . . 191
Instrumental Analysis of Glass Test #9
Instrumental Analysis of Paint Test #ldA
Summary of "Unacceptable Proficiency" Criteria
Aggregate Results of Participating Laboratory Responses to Test Samples #1 - #21 • • . . . . • . . .• . . . • .
Percentages of Laboratories Reporting Results of il Unatre·ptab 1 e Profi ci ency" ..•.....••
'Distribution of Proficiency Ratings Among Participating Laboratories .•........•..........
216
217
241
243
. ,. 251
252
Percen~age of Responding Laboratories Having.IX%" or, Greater of Their Responses Within the "Acceptable" Response Category. . 255
xvii
EXECUTivE SUMMARX
This final report is the cUlmination of a three-year r~search effort to design a crime laboratory proficiency testing program encompassing tha entire United States. Because the profession
. acknowledged, the existence of wide variations in criminalistics lahoratoryperformance throughout ,the nation, and,because no national program to test the analytical accuracies and proficiencies of crime laboratories existed prior to 1974, the primary objectives of this research project centered on determining'how to prepare and distribute speC; fi c sampl es, how to analyze laboratory resul ts and' how to report those results in arneaningful manner. The purpose of tlie project was to see if such a proficiency testing system was even feasible, to try to a:chieve maximum participati'on o'f all crime laboratories in the
'country and to gradually undertake a nationwide state-of-the:-art ~s-sessment of. crime laboratories. The stated objectives of the research addressed the foll owi ng topi cs:
• Determine the feasibili"ty of preparation and distribution of different classes of' physlcal evidence for nationwide distribution;
• Assess the accuracy of criminalistic~ laboratories in the processing of selected samples of phy~ical evidence;
• Conduct statistical studies of the tests administered; • Establish the basis for the design of education and self
imp~ov~ment programs which will assist the crimina1i~tics, profession in the attainment of higher levels, of proficiency.
Because this constituted a pilot study utilizing untried manufacturing and sample distribution techniques, untested questionnaires and completely new methods for analyzing responses from the crime laboratories, the. Law Enforcement Assistance Administration and the Forensic Sci~nces Foundation assured all partiCipating laboratories that they would remain,anonymous and that,all research and statistical.data' would be considered confidential. Most crime laboratories in the country elected to participate in the program since. the pri.mary thrust of the project was to benefit the laboratories by giving them insight into their ownproficiencies and shortcomings, allowing them to compare and contrast their procedures and capabilities with other laboratories around the country. Indeed, the prQgram waS, launched with ali unpreceden.ted participation rate. Parti,cipation for the initial three test samples, for example, was 90%, 78% and 81% respectively.
Unlike other clinical and commercial testing laboratories, crime laboratories are frequently required to examine micro-quantiti~s of phYSical materials which are contaminated. These materials, which are gathered from the victims and scenes of crimes, constitute serious problems for such a proficiency testing prog'ram, since virtually' identical samples had to be manufactured and mailed to more than 200' laboratories around the country. With guidance from a Project Advisory Committee composed of eight nationally recognized crime . laboratory directors and academicians, the following types of samples were manufactured, packaged and distributed: controlled substances, blood, paint, glass, hair, fibers, firearms; physiological fluids {semen, saliva}, questioned documents, wood, a~son accelerahts, soils
1

and metals. Each physical evidence category presented a new set of problems to the staff and a'dvisory committee, for never before had efforts been made to construct so many homogeneous samples.
, A 1 though numerous p'rolJ 1 ems were encountered in the course of th~ project, valuable lessons were learned and documented in the areas of sample selection, packaging and ~ailing. Various data gathering i nstr.uments were t~sted and eval uated for the purpo~e of receiving and analyzing the response~ of the laboratories. Also, the individual sample types posed unique problems, necessitating constant monitoring and revision of data collecti6n instrument~. One of the primary adjustments made to suit the characteristics of each physical evidence type was the use of open-ended questions on the data sheets. As a result, the approach used in the analysis of the d~ta was more akin to the grading of an essay:where the grader can assign full, partial or no credit to the essay depending upon how thoroughly the writer treated,his subject. As a result~ the data could not be . subjected to classical forms of statistical analysis.
Many of, the tests also. called for laboratories to attempt to "individualize" the .physical materi.als, that is, to conclude if two or more items (glass fragments, for example) shared a common origin or source. The criteria by which an examiner may offer an opinion of common origin or individuality is a continually evolving concept which take~ ondiffe~ent meanings to different labo~atories acros~
. the cO!-,ritry,' depending upon their level of expertise and availability of sophisticated instrumentation.
The findings of this study range from the specific Ce.g., paint testing) to the general, where the same type of error surfaced in more than one evidence category. In addition to classifying the responses for ~ach test sample o'n a correct/incorrect basis as the project proceeded, an e'ffort was made to develop criteria which could be applied to all categories at the close of the project. The "unacceptable proriciencies ll and .criteria utilized to place responses in such a category are summarized in Chapter IV," Findir'lgs. The reader is cautioned to view such data with care, for the research design of the project did not concentrate on assuring precision or accuracy of the data collection. The most obvious clue to this is that some of the evidence ty~es were only submitted to the laboratories for one evaluation, and no type was sul"mitted for more than three. Thedetermination of precision and accuracy, by their very definitions in a scientific sense, requires multiple testings--reproducibi.lity and the ~bility to derive an average are requisite, and none of the sample tests was similar enough that such criteria could be judged.
A number of general findings were formed at the conclusion of the project, among them:
• Voluntary, anonymous proficiency testing is bbthfeasible and necessary as i.ndi.cated by the consistently high participation rates throughout the ~ourse of the p~oject and the ability of such testing to identify areas in 'needof improvement.
2
----~~~-

• There is a need for continuous, ongoing proficiency testing to pr.ovide a means to monitor efforts to upgrade and 'maintain high quality criminalistics services;
• A wide range of proficiency levels among the nation's l~boratoriesexists; with seVeral evidence types posing serious diffi.culties for the laboratories;
• The majority of laboratories queried lack the financial resource$ to participate in the~. proficiency testing program on a subscription (fee) basis.
In response to these findings', the Forensic Sciences Foundation and the Project Advisory Committee have formulated several recommendations, including:
• A nationwide program of continuous proficiency , testing of crime laboratories should be established and administered by a peer group;
• Future proficiency testing programs should contain provisions to render technical assistance to the laboratories which desire and request such help;
• A series of regional workshops to address education andt~aining needs corresponding to deficient are~s
. as, ident·ified in this proJect should be developed· . immediately;
• Law enforcement agencies at. all levels of government ~ust recognize that the problems identified in th~ research findings are symptomatic of inaqequate budgets, and both,physical and human resources· and should allocate the necessary funds to correct such deficiencies.
Although more intangible than the previously stated findings, this proficiency testing project has been an "eye opener" to many laboratories, causing some di,rectors to re-examine their tests and procedures in selected physical evidence examination areas. Many laboratory directors have stated flatly that proficiency testing h~s been the most successful program ever funded on a national basis for it allowed them to compare themselves with other crime laboratori es and was the stimul us to initiate programs for impro'vement which ,now are yielding very tangible benefits to the justice ~ystem.
3
'Many of the findings of this report are neither new nor unexpected to anyo,ne who has kept abreast of the 1 iterature emanating from the evaluations and task force reports addressing crime laboratories. Some of the difficulties experienced by the, laboratories could only be expected as all of the previous reports which have addressed this issue have inferred the likelihood of such findings. Many laboratories are hot demonstra~ing optimal proficiencfes because it is circumstantially impossible for them to do so. The causal relationships between budgetary and operational problems and the degree of laboratory
, proficiencY,a~e co~plex, yet limited budgets, poor or nonexistent education' and training programs', high backlog of cases, insufficient numbers of scientific personnel and overcrowded facilities with outdated ~quipment may adve,rsely affect the proficiency of a laboratory. This , r'eport documents that crime laboratories have been and are still in need of help.
The proficiency testing program has bee'n controversial in that many laboratory directors wondered whether the research findings wou'ld constructjvely or destructively affect the laboratories. To deliberately document the shortcomings of the crime laboratory operations and then walk away from them would be completely destructive and senseless. However, based on previous experiences where needed aid has been refused, many of the directors feared this. In the best interest ot both the crime laboratory as well as equitable criminal ju?tice~ the proficiency testing program was ultimately supported by the laboratory directors' with the optimistic hope that the results would compel a change for the bet1;er. Indeed" the findings of the proficiency testfng project should be the .last straw in bringing whatever aid is necessary to the crime laboratories. The laboratories acknowledge that they are helpless without the, support of the federa,l" state and municipal governments, and it is to them that the, crime laboratories must turn for aid;n taking remedial measures and securing adequate resources for'improved laboratory 'operations.
Aside from greater resource a11ocations to the laboratories at the local level, the most pressing needs of the crime laboratories fi;lll into the areas of qualifications and possible certification of personnel, accreditation of crime laboratorieS, accreditation of forensic science degree programs, regional workshops to upgrade the training of current laboratory personnel, research for improved techniques in the analysis of the various physical evidence types, and, of course, a means for continued proficiency testing. The criminalistics community has 'already addressed many of these needs and has developed several others into concept papers or grant proposals for federal support.
, ,
As a final note, the proficiency testing research project has shown that crime laboratories can be extremely proficient. Many of the laboratbries around the countrY-displayed excellence in the examination and analysis of virtually all the categories of phYsical evidence submitted by the project staff. This is, without a doubt, a great tribute to those laboratories, as well as to their supporting agencies' and local government.
4

~ ...
INTRODUCTION
CHAPTER I
PROJECT BACKGROUND
It c;:an be sa; d of the Laboratory Profi ci ency Testing Research Pr.ogram that it is. 1I**an idea whose time has come.lI~ The history of profici~ncy testing in the field of criminalistics when coupled with the results of this specific program bear out the validity of that
. statement.
This report covers the t~sks performed under two LEAA gr~nts given to the Forensic Sciences Foundation, Inc.: IILaboratory Proficiency Testingll~ Nr. 74-NI-99-0048 (c9vering the period July 1974 to April 1976) and the -continuation gr~nt,. "Laboratory Profi ciencYTesti ng Research Projett ll
, Nr. 76-NI-99-009l (for the period April 1976 to May 1977).
OTHER PROFICIENCY TESTING PROGRAMS
Prior to the initiation of this program no broad spectrum, nationwide . proficiehcy testing program for cri.minalistics laboratories. had'been
attempted. In the late 1950 l s and continuing thfough the late 1~60's the Criminalistics Section of the Amerlcan 'Academy' of Forensic Sciences conducted a proficiency test that was national in coverage but sporadic and limited in scope. They could best be described as exploratory or feasibility .studies of the need for such a program. The conclusion reached ~as that there ~as ari urgent need for. ' develbping a program such as the one implemented in this LEAA project.
In the past, and in many cases today, a number of individual laboratories have been and are conducting self-testing systems. In addition, some states have established limited monitoring activities in this field. Some regional efforts have been made, and some specific . testing has been or is being conducted by various government and private
w agehcies. Examples of the latter include: U.S. Department of Transportation - Blood/Alcohol Testing; Drug Enforcement Administration -Internal Proficiency Testing; National Bureau of Standards; Clinical La~oratory Pr:-oficiency Testing for the Center for. Disease ~ontrol in selected areas of Clinical Chemistry, Hematology and Microbiology;
~ IIiGreater than the tread. of mighty armies is an idea whose time has come. II Victor Hugo, Historie dlun Crime, 1852.
5

· College of American Pathol ogyi n Hospitals and Cl i ni ca 1 Pathology Laboratories.
All of these efforts have made significant contributions to the study of laboratory problems and their solution. However, none of these programs has provided a mechanism by which comparisons in the variati,ons of laboratory performances' can be made ... to the end that all labtitatories can,b~ assisted in the upgrading bf thei r serviq~.
CATALYST FOR THIS PROjECT
In .1974 the prop'er catalyst for a national, continuing proficiency testing'programwas found. In early 1974, LEAA indicated an interest' in funding a meaningful research program in the field of criminalistics and, almost concurrently, at the 1974 Annual Meeting of the American Academy of Forensic Sciences, the Criminalistics Section 'held,discus~ions to find a means for'assessi~g the perform~nc~ and quality of 'services of the crime laboratories throughout the
, Uni ted States.
At that meeting it was acknowledged that, because the nationts laboratories had developed independently,a wide variety of techniques and instrumentation. had also been developed ... resulting i~ a wide variation· in the quantity and quality of services provided. What was not kn"own was: speci fi ca lly, how we 11 the nati on l s 1 aboratori es were performing. in particular types of examinations, what their. true capabilities were, which methods were being employed for the examination of physical ~vidence, and ~ multitude of other related matter~. Iri short, the profession acknowledged that the state-ofthe-art of criminalistics laboratories was unknown. That common con~ern ,was shared by LEAA' s Natlonal Ir)stitute of Law, Enforcement and.Criminal,Justice, thus giving rise to th~ r~search which" is the 's ubj ect of th i s repo rt .
PROFESSION Ml~GIVINGS
It w6uld be less than candid to imply that ~11 laboratories or criminalists ,in. the field endorsed the concept of a nationwide proficiency testing program. Skepticism centered on four points.
The first was the traditional contern that independence of operation (a characteristic of autonomy) would be seriously ~roded by allow';ng
6
I
I
i -
...
outsi.de access to individual laboratory operations. This question was re'sol ved by showing the laboratories that the testing mechanics precluded any direct involvement in the operations of any specific laboratory. Rather, because the project was a research effort in "how to run proficiency testing ll
, its. impa,ct would be on . the profession as a whole:, .• a generic approach to the problems of the profession.
The second area was the issue of s'tandardization. Some individuals fe l't that profi ci ency testi ng coul d 1 ~ad to requi rements that certa'i n instruments and methods be used to analyze the materi al s submitted to the crime laboratory.
The third area of concern related to the profession's direct involvement in the design and admiriistrationof the tests. It was agreed by the leaders in the field that few, if any, laboratories would participate in even a pilot proficiency program unless convinced that the prof~ssion itself would have a strong hand,in d~signing and guiding the project. The creation of a Project Advisory Committee (comprised of eight prominent criminalists in the field) and their ass;'gnmeht to specific project planning, design and operational responsibilities proved to be a satisfactory solution to this problem.
The last major area of concern ... confidentiality of data and total anonymity of laboratories ... proved to be the most difficult to resolve.'The equation,i'n need of solution was: .
Guaranteed Confidentiality of Data Voluhtary participati'on = Plus
Anonymity of Laboratories
The official documents and files on this project attest to the continued, intense concern over this matter, to include: the Initial Concept Paper; the Grant Proposal; the Official Grant Award; Cdrrespondence with,individu~l labor~tories~ Speeches; Project Reports; and Project Advisory Committee Meeting Minutes .
Two safeguards were utilized to guarantee confidentiality and anonymity. The Foundation established temporary, internal administrative procedures to severely limit access to selected files. In effect, only one individual had the means to link a laboratory name with a test result ... and that linkage was only established to ensure that the specific, reports were credited to the, right laboratories. The second safeguard was generated by LEAA. The Grant Award contained the following statements:
1

~ -'r , , . '. ~ ... ~ , . i
"SPECIAL CONDITIONS"2
• liThe Forensi c Sciences Foundati on shall advi se respondents th~tinfor~ation is being collected for res~arch and statistical purpo$es only. Such information will not be revealed or used for any other purpose. Information furnished by any ·person or agency and identifiable to any. specific person or laboratOrY will not be revealed or used for any purp.ose other than the research and statistical
. purposes for which it was obtained.
• Any questionnaires prepared for completion by study subjects shall include the following notation:
'Information on this questionnaire is being collected by the Forensic Sciences Foundation in connection with a grant from LEAA. The information has not been requested by. and is' not intended for the use of LEAA.III
The first grant was approved by LEAA in July 1974 under the title, "Laboratory Proficiency testing", #74-NI-99-0048. It was' renewed for 9ne year in April 1976 as the "Laboratory Profi ciency Testing Research Project", #76-NI-99-0091.
SPECIFIC OBJECTIVES ~ INITIAL GRANT
Three factors exercised considerable influence on the decision as to what would be the objectives for the initial grant:
• the wide variety of samples that would be required
• the voluntary nature of the participation
2Paragraphs 8 & .10, "Statementof Special Conditions", 74NI-99-0048 4/15/74 and Paragraphs 1 & 2, "Statement of Special Conditi'ms", 76NI-99-0091,3/30/76.
8
• the absence of any sped fi c base of knowledge for a project of this magnitude.
Experts in the field of clinical laboratory proficiency testing cautioned that the samples should be limited to a very narrow subclass of one generic type of evidence ... such· as blood. They . reas~ned that it had taken them a rtumber of jears to. develop their manu~acturing and testing techniques. We could exp~ct no less a problem. .
These same experts also felt that the unqualified voluntary nature of the program would create many problems. It was felt that large numbers of laboratories might not participate if it Were not required that they do so.
Finally, it was acknowledged that .progress would be slow·and . sometimes .painful because the concept was new and without any true
base of past experience or data.
Accordingly, the following specific objectives were established for the .initial grant.
: . •
•
OBJECTIVES--FIRST GRANT
Through the use of voluntary, anohymous proficiency testing, assess the analytical accu~acy of criminalistic laboratories jn the processing of selected physical evidence.
Make statisti cal studi es of 1 aboratory profi ciency in the '. processing of open proficiency test samples and of :the
accuracy and precision of the various analytical methods . used.
Establish the basis for the design of Educational Programs, in the area of analytic methods, which will assist the criminalistics profession in the attainment of higher levels of proficiency.
SPECIFIC OBJECTIVES - SECOND GRANT (EXTENSION)
Based on the experience gained in the first two years of operation of the proficiency program, it was evident that the grant language shoul d emphas ize the researc·h nature of the project. I n a sense, the earlier warning of experts in proficiency testing were right.
9
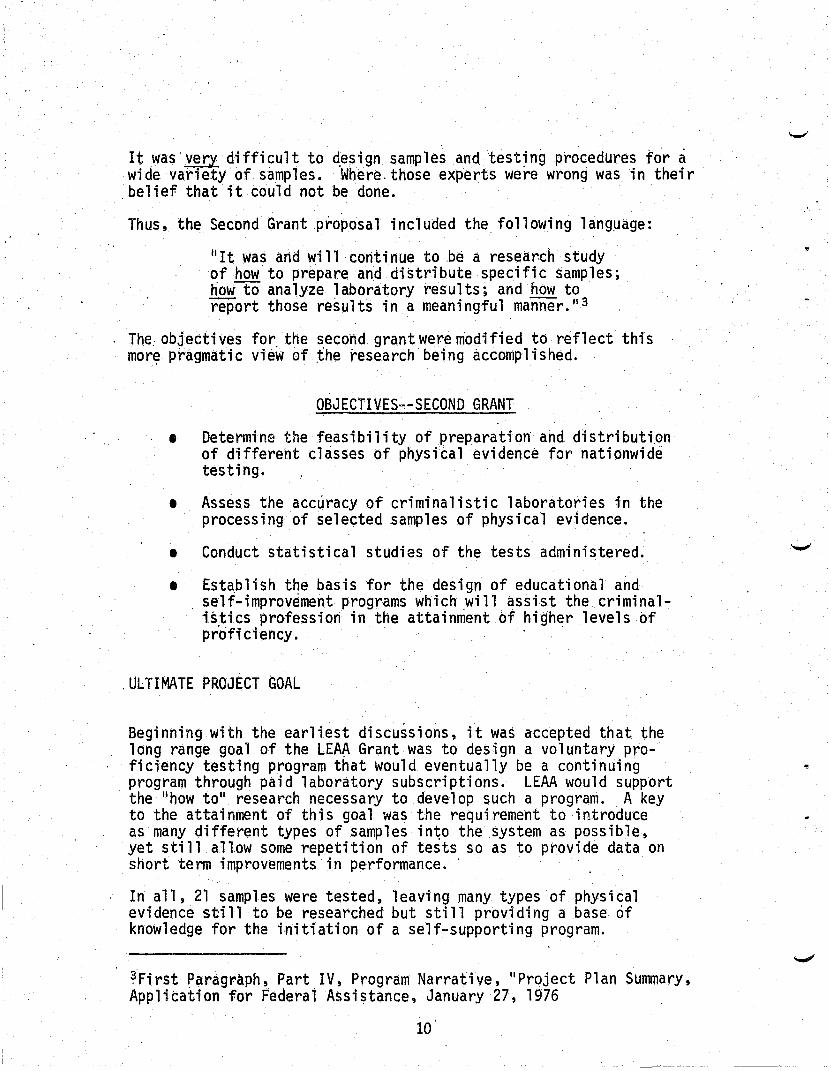
It was' very di ffi cul t to d.es i gn samples andtest1 ng procedures for a wide variety of samples. Where. those experts were wrong was in their belief that it could not be done.
Thus, the Second Grant proposal included the following lang~age:
lilt was and will continue to .be a resear,ch study of how to prepare and distribute specific samples; how to analyze laboratory results; and how to report those results in a meaningful manner." 3
The, objectives for, the s,econd grant were modified to reflect this mor~ pragmatic view of the research being accomplished.
OBJECTIVES--SECOND GRANT
.• Determine the feasibility of preparation and distribution of different classes of physical evidence for nationwide testing.
• Assess the accuracy of criminalistic laboratories in the processing of selected samples of physical evidence.
• Conduct statistical studies of the tests administered .
•. Establish the basis for the design of educational and , self-improvement programs which ,will assist the criminal
iS,tics profession in the attainment of higher levels of proficiency.
,ULTIMATE PROJECT GOAL
Beginning with the earliest discu~sions, it wa~ accepted that the long range goal of the LEAA Grant was to design a voluntary proficiencytesting program that would eventually be a continuing program through paid laboratory subscriptions. LEAA would support the "how to" research necessary to develop such a program. A key to the attainment of this goal was the requireme'nt to introduce as many different types of samples in~o the system as possible, yet still allow some repetition of tests so as to provide data on snort term improvements in performance. '
In all, 21 samples were tested, leaving many types of physical evi dence sti 11 to be researched but sti 11 prov; di ng a base of knowledge for the initiation of a self-supporting program.
~First Paragraph, Part IV, Program Narrative, "Project Plan Summary, Application for Federal Assistance, January 27, 1976
10
..
..
'.
PARTICIPATING LABORATORIES
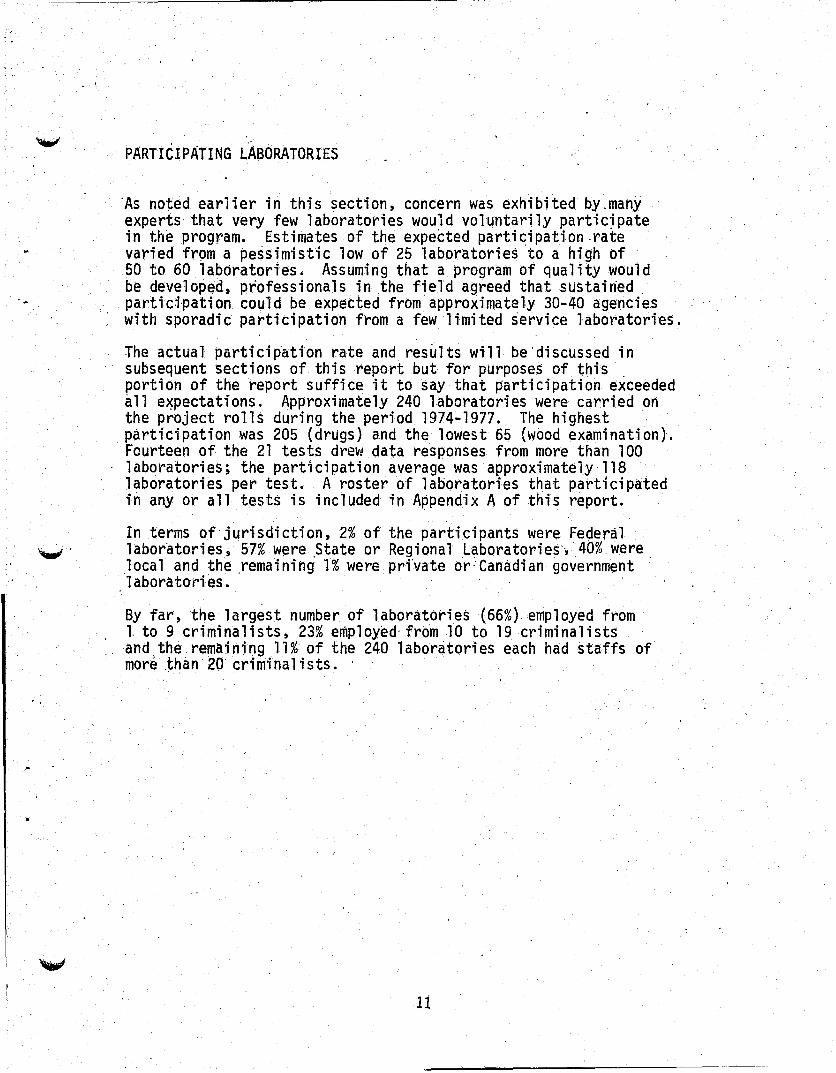
'As noted earlier in this section, concern was exhibited by,many experts,that very few laboratories would volLmtarily partlcjpate in the program. Estimates of the expected participation.rate varied from a pe~simistic low of 25 laboratories 'to a hi~h bf 50 to 60 laboratories. Assuming that a program of quality would be developed, professionals in the field agreed that sustairied partictpation could be expected from approximately 30-40 age'ncies with sporadic participation from a few limited service laboratories.
The actual participation rate and res~lts will be'discussed in subsequent sections of this report but for purposes of this , portion of the report suffice it to say that participation exceeded ~ll expectations. Approximately 240 laboratories were carried on the project rollS during the period 1974-1977. The highest participation was 205 (drugs) and the lowest 65 (wood examination). Fourteen of the 21 tests drew data responses from more than 100 laboratories; the participation average was approximately 118 laboratories per test. A roster of laboratories that pa~ticipated in any or all tests is included in Appendix A of this report.
In terms of jurisdiction, 2,% of the participants were Federal laboratories; 57% were ,State or Regional Laboratories", 40% were local and the .remainitlg 1% 'were prfvateor'Canadian government laboratories.
By far, the largest number of laboratories (66%), employed from 1. to 9 criminalists, 23% employed' from 10 to 19criminalists and the remaining 11% of the 240 laboratories each had staffs of mor~ th~n 20 criminalists.
11
INTRODUCTION
CHAPTER II
METHOOS
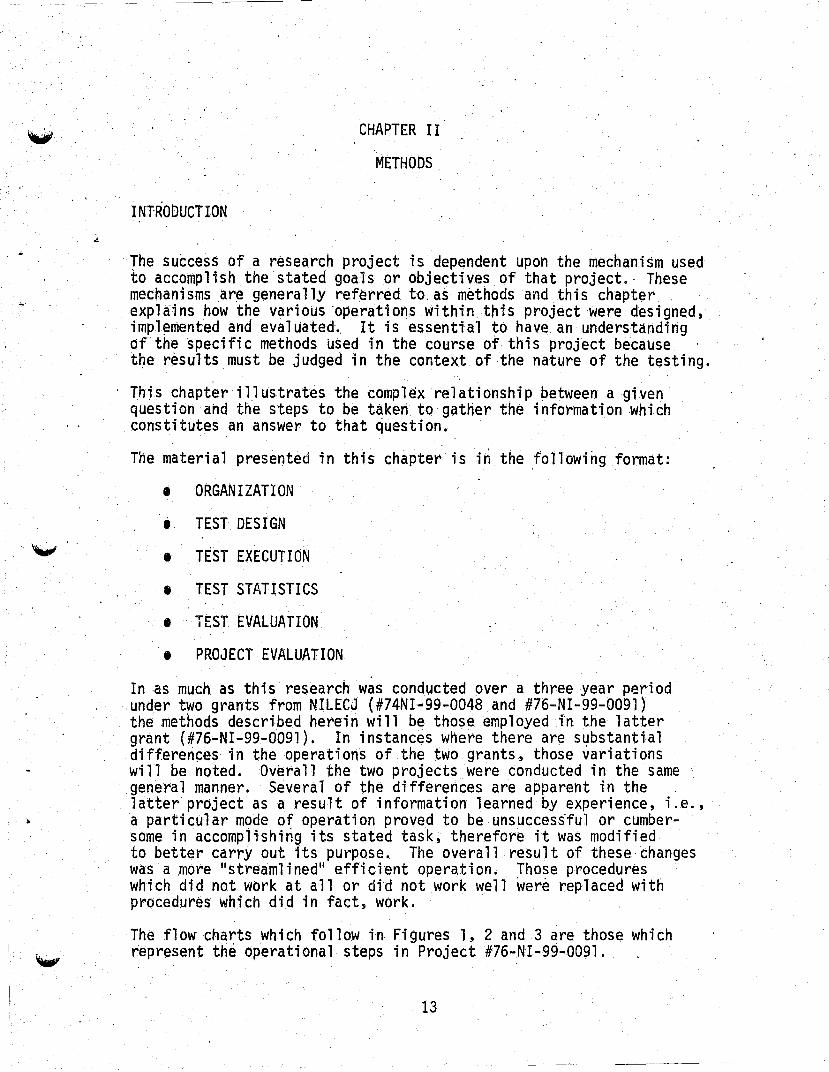
The success of a research project is dependent upon the mechanism used to accomplish the stated goals or objectives of that project.- These mechanisms are generally referred to. as methods and this chapter expl~ins how the various 'operations within this project were designed, impl~mented and evaluated .. It is essential to have. an understahding of the specific methods used in the course of· this project because t~e results must be judged in the context of the nature of the testing.
This chapter i1.1ustrates the complex relationship between a given question and the steps to be taken to gather the information which
, . constitutes an answer to that ~uestion.
The material presented in this chapter is in the following format:
• ORGANIZATION
i TEST DESIGN
• TEST EXECUTION
• TEST STATISTICS
• TEST EVALUATION
• PROJECT EVALUATION
In as much as this research was conducted over a three year period . under two grants from NILECJ {#74NI-99-0048 and #76-NI-99-0091} . the methods described herein will be those employed .in the latter
grant (#76-NI-99-0091). In instances where there are s~bstantial differences in the operations of the two grants~ those variations will be noted. Overall the two projects were conducted in the same general manner. Several of the differences are apparent in the latter'project as a result of information learned by experience, i.e., a particular mode of operation proved to be unsucces~ful or cumbersome in accompiishing its stated task, therefore it was modified to better carry out its purpose. The overall result of these changes was a .more "streamlined" efficient operation. Those procedures which did not work at all or di~ not work well ~er~ replaced with procedures which did in fact, work.
The flow charts which follow in Figures 1, 2 and 3 are those which represent the operational steps in Project #76-NI-99-0091.
13

~ ~
~
~
~ (
.. Technical and Administrative
SIJPPOl"t to PAC
Commence Selection of .,...., Physical Evidence 'categories
to be teste.d
.Organiie~PAC Meetings
• Place • Agenda • Transportation • Accoll1llOdat1on
PAC Meeting
Participate in
PAC Heeting
(-
Candidate Test Sample Catego~ies
Test Parameters • ·Test Objectives • . Reali sti c Laboratory Capabi 1 it; es • Plausible' Scenarios • Number of Samples per Scenario
CandidateOuestions
Sample Parameters' . . • Replf~ation Capabilities • Physical Properties • Package/Mail Requirew~nts • Manufacture Availabil tty • CostlTiine Factors
{
" ...... lO C -s ([)

(
~
[3> I-' tTl
~
~
'(
Draft Su~portin~ Coordinate Manufacture
of Sample with :Jocuments • Cover Letter • Instruction Sheet
Specific Test DeSign~ Parameters
PAC • Data Sheet
~~ Design Test
Questions 'I--i _---..I
Test Run
~
Sample ,
Prepare Sample
L Assign l .l Member Select ' ~ ","ufactu," , L... Ref ... , . :
Responsibility! Labs I
As Needed i I 'Appoint "Local ", _ _ __ ___ __ _ _ _ _ ___ _ ___ J
: f1anufacture I
lR~r.e~e!!.t.e. tj y"e"';
Technical Support I---
, I-
Sample to
Referee --_._--
labs
Preparation Packaging
and, Mailing
,."",.., - Provide Written Sample Manufacture
Specifications
Actual Sample Ha 1,1 ing
(
--1110. •
" ...... to c' .)
CD
N

-. . r..l .E?> -. Draft
Re o'rt ,Disseminate ..lIiIIo....Partic pa 1ng Report .. Compne ~ ... v~sion. . "port r- . Labs· J Preparation 1--,
Conments . . . , Send
.-4
'Quick ~~ Report
j
• "
-lfna lys i s for,
Return: .- SUPP'ementary ~ to " . - Findings
Start & Trends [3> PAC
4 J Report f--Evaluation
Consultants to
PAC t-o 0)
-
" -\1 -0.
Draft to c-Revision ~
Statistical
rt>
Data ': ..... Stat. f--~ Section
Analysis w
Reduction Report Preparation E?
( ( ( ~t,

I I .
ORGANIZATION
Fi gure 4
Project Advisory Committee
I Technical SUEeort Project Staff Participating Coll aborati ve ~ Forensic Sciences Laboratories Testing.Services, Inc.' Foundation "
Figure 4 illustrates the basic organiz~tion of the Project.
From its inception, the concepi of conducting a nationwide program in the criminalistics profession required the active participation of members of that profession. Since the areas being investigated did not lend themselves to the more traditional, clinically oriented proficiency testing, it was neceS$ary to gain the cooperation of individuals who were thoroughly familiar with the function and operation of the crime laboratory. Based on the need for this c~liber of expertise~ the Project Advisory Committee was formed. The heed ,for supporting technical services was recognized and the capabilities of the Law Enforcement Standards Laboratory of the National Bureau of Standards (NBS), U.S. Department of Commerce were.tapped. During the co~rse of the project, the technical sarvices requirements were reassessed and, with the· concurrence of NBS, the operation transferred to 'Collaborative Testing Serv,;ces, Inc. of Vienna, Virginia.
Project Advisory Committee (PAC)
The Project Advisory Committee held the responsibility for the overall project guidance and evaluation. It was composed of eight prominent members of the criminalistics profession~ each having extensive criminalistic laboratory management and academic experience.
17
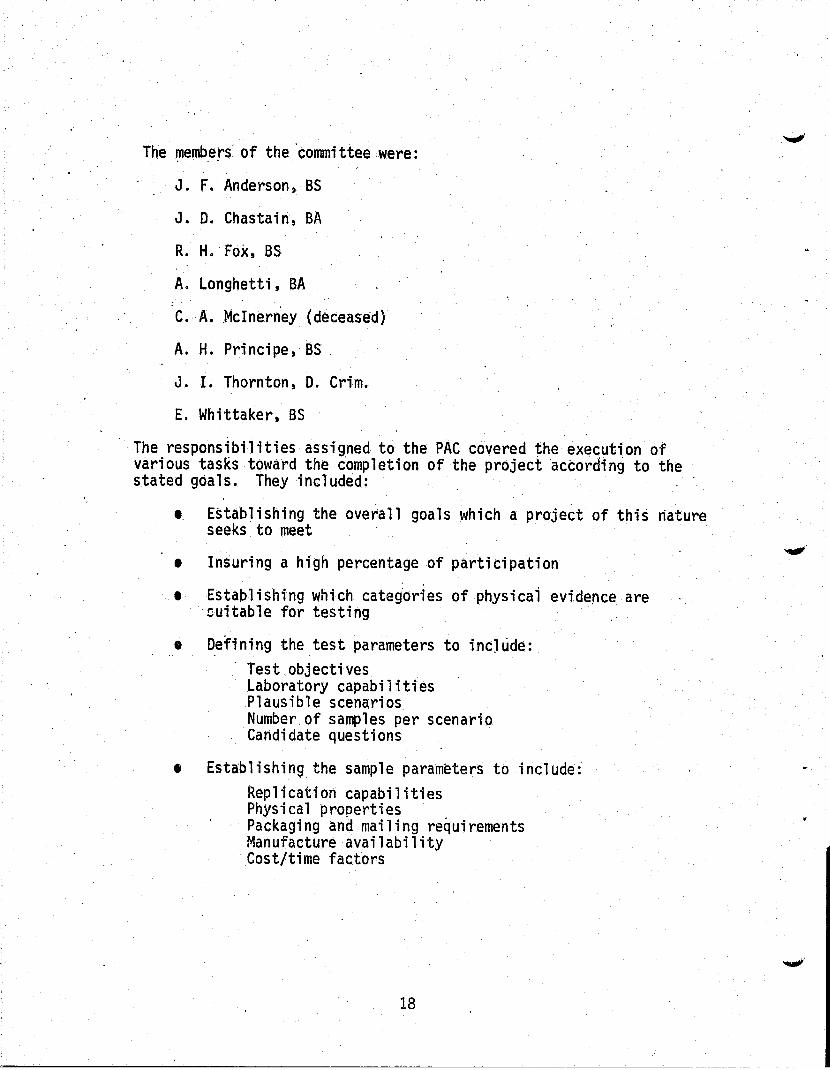
The memb,ers' of the 'commi tteewere:
J. F. Anderson, BS
J. D. Chastain, BA
R. H. Fox,BS
A. Longhetti, BA
C. A. ,McInern'ey (deceased)
A. H. Principe, BS .
J. I. Thornton, D. Crim.
E. Whittaker, BS
The responsibilities assigned to the PAC covered the execution of v~rioUs tasRs toward the riompletion of the project ~ctording to the stated goals. They included:
• Establishing the overall goals which a project of this nature seeks to meet
• Insuring a high percentage of participation
• Establishing which categories of physicai evide,nce are cuitable for testing
• Defining the test parameters to include: Test objectives Laboratory capabilities Plausible scenarios Number of samples per scenario Candidate questions
• Establishing the sample parameters to include:' Replication capabilities Physical properties Packaging and mailing requirements Manufacture availability Cost/time factors
18
\tj;'. I
I
I.
I
• • I
I
Assigning of manufactur~ responsibility
Design of test q~estions
Refe.ree laboratory selection
Sample manufacture and preparation
Written for each sample specification
Evalyation of test sample reports
Analysis of collected data for supplementary findings
Provide peer group liaison with the professional community
Technical Support
, Technical support to this project was provided by Collaborative Testing 'Services, Inc. (CTS) of Vienna, Virginia. The services provided included:
I Participation 'in planning meetings.
• Lending t~chnical expertise to the PAC to'assist in the design of specific t~5tquestions.
I Data reduction of returned results.
I Preparation of statistical presentation of returned results. , .
Additional services, such as maintenance Of mailing lists and generation of computer-labels were also provided by CTS. '
As briefly noted, earlier, at the outset of this project in July 1974, the activities ,cited above were performed by the National Bureau of Staf'!dards under an agreement with LEAA., Staff.support was suppHed to them by personnel of the Collaborative Testing Services, Inc., (CTS) . under contract to NBS.
By mutual agreement with LEAA, NBS and the Foundation, the National Bureau of Standards discontinued involvement in the program after December 31, 1975. From that time to the conclusion of the second grant, technical support was accomplished by direct subcontract of CTS to the Foundation.
19

Forensic Sciences Foundation, Inc.
The Forensic Sciences Foundation, Inc. acting in the capacity of Project Staff'was responsible for the execution and administration of the p~oject to include the activities of the PAC, th9 P~rticipating Laboratories and the technical suppor.t provided by Collaborative Testing Services, Inc. under subcontract to the Foundation.
Participating Laboratories
In the fall of 1974, invitations were extended to all criminalistics laboratories in the U.S. to participate in this, Proficiency Testing Project. The names and locations of these laboratories were.compiled from existing sources and listings. Those sources included .the ' National Institute of Law Enforcment and Criminal Justice (NILECJ), Federal Bureau of Identification (FBI), Crime Laboratory Information System (CLlS), Drug Enforcement Admini,stration (DEA), and American Society of Crime Laboratory Directors (ASCLD). Once compiled, letters and telephone calls to verify information having been completed, the list became the working "roster" for the project.
Participation wa~ encouraged by assuring potential participants that all testing would be anonymous and confidential. Presentations were made by the Forensic Sciences Foundation by invitation at the National Symposium on Crime Laboratory Development in September 1974 at the FBI AcademY, Quantico, Virginia and before the Criminalistics Section of the ,American AcademY of Forensic Sciences Annual Meeting in February 1975. The Project Advisory Committee also addressed the International Association for Identification, the Association of Firearms and Toolmark Examiners and various regional professional associations. These presentations explained the nature of the project and answered questions rega~ding the design and administration of t~e testing proced~re.
Throughout the course'of the project, the number of. laboratories on the roster was approximately 240. Additions and deletions f~om this, list were made as the information regarding staff changes and opening and closing of. facilities was forwarded to the project staff. The participating laboratories, located in the United States, its possessions ahd by special arrangement, Canada, were automatically included with no undue pressure imposed upon them if they chose not to participate.'
, TEST DESIGN
T~e task of deSigning the test structure for this project was primarily a responsibility of the Project Advisory Committee (pAc). Input was provided from the technical support pers'onne~ (CTS) pertairiing to the
.20
.. '

..
type af data generated by a specific type af question and haw that data might be best reduced~ tabulated and presented. The Praject Staff pravided input regarding project pro.cedures,the feasibility afpacka~ing and mailing a particular sample, v~riaus packaging difficulties which might be encauntered, as well as handling the pracessing af infarmatian germane to. a particular sample. Hawever, it was the PAC who. established the test criteria, the sample, criteria, generic categaries af physical evidence to. be used, sample specificatians~ the questions that waul~be a~ked pertaining to. 'thase sampl es, and an eva 1 uati an af the data presentati an of the test results.
'The initial meeting af the Praject Advisary Cammittee (September 1974) addressed itself to. establishing the essential criteria far canducting this praject. A testing pragram af this type was new to the criminalistics labarataries (and viewed with skepticism), therefare, the PAC felt that the primary objective in the early stages w~s to en~ourage participatian in what was structured as a complet~lY val untary program.
To meet the established gaals, the fallawing criteria were established far the design af the first ten samples. These same criteria subse-
.' queritly 'were declared valid for twenty-ane samples, manufactured and distributed during the caurse of this project'. These criterlawere:
• Camman, representative samples
It was felt that samples shauld be common types of 'physical evidence rautinely analyzed in the crime labaratary. While it was recagni zed that nat all the 1 abaratari es were "fullservice labs" in the sense that they were able to. analyze a 11 forms of evi dence (i. e., drugs, fi rea rms, trace evi dence, etc.) it was felt that sample selectian shauld be restricted to thase areas which most laboratories wauld be capable of processing. As the testing pragressed and became slightly mar~ sophisticated, some physical evidence categories. were selected, which admittedly, were applicable to only a limited number of laboratory facilities equipped for'that specific type of analysis. However, these explorations of what may appear to be "uncommonll types of evidence were undertaken with specific objectives in mind, variaus problems had presented themselves that were best answered by encompassing these tests into the Proficiency Testing Program. Individual tests and the ratianale far their selection are discussed in a subsequent sectian.
• Canductive to. analysis ·by a wide range of testlng techniques and pracedures
It was recagnized by the PAC, as it is by the prafessian as a whale, that no standard methads exist far canducting, an analysis
21
and for arriving at a conclusion regarding any evidence type. This n,ecessitated designing samples that would lend themselves to various modes of testing ... that which would accommodate the examiner who had to rely on relatively simple methodology as well as the examiner with the opportunity to use sophisticated systems and instrumentation.
• Available in sufficient quantity
To ensure fairness in testing, the samples selected had to be available in 'quantities suffic,ient for distribution to 240 laboratories. Also a vital part of this criterion was the "quality control" of the sample .•• not only must the quantity available be sufficient, but it needed also to be homogeneous to allow only min'imal differences between samples' sent to participants.
• .§.ui tab 1 e fo'r, referee; n9
Again, to ensure fairness, the samples had to be selected from batch lots on a random basis for analysis by the referees. It would be impractical to design a sample wherein each unit (for subsequent distribution) had to be, individually tested and analyzed. Tests had to be designed so that referee samples could be selected randomly from the general production of a sample, thus insurin~ that the referee laboratory received a representative sample, i.e., the same quality and quantity of materia; sent to all other parti cipants.
• Straightforward samples containing no tricks
To encourage participation at the outset of the project, the PAC chose to confine the samples to relatively straightforward selections. Since the confidence and participation oftne laboratories was being sought, to prepare and distribute complicated or complex samples this early in the project would have been uriwise. As the testing progressed, the samples became more complex and sophisticated a~ a means to further challenge the capabilities of the laboratories. An attempt was made to keep the samples realistic, but this proved to be one of the most difficult criteria to meet. Manufacturing procedures proved to be more, complicated than originally thought, sample size determination was often a problem, and the need for maintaining quality control tended to result in "sterile" and not actually representative of the actual types of evi.dence entering a crime 1 ab from a crime scene. For example, samples could not'be contaminated with
22'
..

dirt, oil, etc., (as is often found in the laboratory) because of the difficulties in replicating such contamination. Generating samples of uniform size often required that samples be largef than thrise usually submitted to the laboratory for analysis from a crime scene.
Once the general criteria for testing were established, the .PAC generated a "sample constituent list" (SCL) which consisted of candidate test sample c.ategories which met _ the established criteria. Those which did not conform were removed and retai ned for future use, shoul d the criteri a employed for sample Selection ever be altered or expanded. Items listed were from generic categories such as controlled substances, firearms~ glass and paint, etc., not specific sample descriptions. .
After the specific category for a test sample was seleCted, the Project Advisory Committee then discussed the specific test sample design. A set of Test Parameters and Sample Parameters was designed to structure this process. The sample (witli few exceptions) had to meet an of the established parameters in -each of the Test Class and Sample Class.
TEST PARAMETERS
The following were the Test Parameters used:
• Testdbjectives
•
The objectives and rationale for conducting this particular test had to be defined. "What is the sample designed to test, what information are we looking for etc.?"
Realistic Laboratory Capability
The main question asked was, "Does this test lie within the capabilities of most laboratories or does it represent too great ornot enough of a challenge?" Also taken into account unqer this parameter was the amount of equipment required to process the sample, as well as the amount of examiner time (both bench and administrative,) needed to complete the test. One must again point out that participation in this project was strictly ona voluntary basis, and the case load in virtually all crime laboratories was well known to be nearly overwhelming. If a test was sent out that required an inordinate amount of an examinerls time be taken away from his required duties, or tied up a vital piece of; laboratory
23

equipment so as to interfe~e with the routine function of that ljb, it w~s felt that participation would drop markedly from a purely practical point of view. The test desJgn had to,
, adapt itself to the unique caseload problems and manpower shortages wh i ch are experi enced by many 1 abora tori es,.
Tests had to be structured so that an answer could be arrived at in several different ways, or by using any one or combination of different available methods. Small laboratories with limited instrumentation could not be excluded from participation because of the lack of sophisticated equipment; they woul<;1 have to be able to arrive at a conclusion using the facilities and equipment available to th~m.
• Plausible scenarioS , ,
Shor~ scenarios accompanied most samples as a device to better define the type of information requested because the depth of the examination performed on some of the , evidence types might be dependent on defining the sample in the context of a case type situation. One of the instructions given to laboratories was that they should handle the test sample evidence in a manner similar to that used for,actual case evidence suomitted to that laboratory. A ,scenario served to define, to a greater extent, the nature of the evidence. The'scenarios became more abbreviated as the laboratories became mOre familiar with the 'project.
The, scenarios were also deSigned to'elicit from those laboratories with restrictive repDrting practice$ as much information as 'they w~re able to develop. For example, a laboratory may have developed more informa-tion in the course of testing a sample than either its reporting practice or state statute required. The scenarios, however, wer~ de'singed toelicit all information derived, not just that required by statute or operating procedure. This situation occurred primarily in the analysis of drugs, where, in some instances, laboratories are regu~red to report only the drug of highest schedule found (elther State or federal statute) or, only the first drug identified which would be necessary to file on the charge. Other laboratories are required to fully report all identified controlled substances, whiJe still others, are required to report all. the controiledsiJbstances and any dil uents found. ,Some 1 aboratori es routi ne ly quantify substances identified, though most do not.
24
•
•
By providing'the examiner with a scenario which requested all information developed in the examimition, it was hoped that more extensive ,data could be Sathered. (See data sheets for Test Samples #6 and #15',)
Number of samples per scenario
The decision as to the number of samples which would comprise a given test involved judgment as to whether the test was to be a source comparison or a substa'nce identification~ In those tests where a comparison was being made (e.g., paint) the number of items to be compared ;'1ad to be determined as well as the source of each of those 'items. Would all three components be the same, two the same or would all be different? Qnce estab'lished~ it was necessary to determine the qualities by which the' differing samples would vary from each other.
Candidate questions
The basic test objectives came into focus with the design of the test questions. T~roughout the course of testing, several different modes of test questions were employed. These ranged from very broad and open ended, to fairly' specific and defined. (See Sample Discussion, Data Sheets p. 32.) This is another indication that this project was indeed a research project; that it was necessary to experiment with different forms of documents to create the lIideal ll questioning form; questions had to be designed in light of the information being sought and the specific, test objecti.ves. Input was necessary from those providing technical support as to the adaptability of the data 'gener~ted by a spectfic type of questioning to reduction and tabulation, as wel1 as the statistical. validity of that generated data .. The previous testing experience of the National Bu~eau of Standards and'Collaborative Testing Services personnel was extremely useful in this regard. By drawi'ng on their previous and on-going testing projects in areas such as paper, ,color and rubber, they were able to offer suggestions pe'rtinent to the design and structure of test questions. Again, in this instance, the unique nature of the crime lab and its operation was illustrated by the fact that many standard questions used in other forms of testing did not lend themselves to the crime lab because quantitation is uncommon ,. tes ti ng is, often compa ra t i ve in nature Jor which it is diffjcult to prepare statistical presentations, and there is virtually no standardization of methods--a fact which other forms of testing rely on quite. heavily.
25

The 's'cope of work performed by a crime 1 aboratory has to conform to the specific problem--in one case exclusion of a pi~ce of evidence rather than an exact identification may be required. In another case, exact identification of the composition may be required to satisfy the law as written. Common origin determination is often what is sought, and this too sets the crt.me lab apart from other types of testing laboratories. No other proficiency testing program concerns itself with the possibility of common sources of test samples. These different approaches do. not lend themselves to the type of testing that is carried out by most other types of "testing" laboratories wherein a set protocol for the examination of a given sample of anything must be followed. Lacking the uniformly applicable protocol and procedure, it bec~me quite difficult to devise test questions ~hat would be palatable to both the examiner of the evidence and the statistician who compiled the results.
SAMPLE PARAMETERS
Once the test parameters were established, it was then necessary to . examine the items selected to be samples in light of the following cOhsider~ttons. '
• Replication capabilities
The sample had to be manufactured in such a manner as to ensure homogeneity. If produced in a batch lot (such as a drug), the methods which would assure homogeneity had to be specified. In cases of samples which had to be produced individually, such as firearms, a procedure had to be established for examining the, products to ascertain they were all sufficiently alike and possessed the characteristics that had been specified. A sample that did not lend itself to replication in large quantities could not be used •.• all laboratories had to receive virtually identical samples to ensure validity of the test. Therefore, if a variation might alter the nature of the degree of difficulty of a sample, it could not be used. As an example, in an arson examination sample, if burned pieces of material were to be sent out for examination, the amount of burning, residue, etc.,. would have to be controlled carefully. The PAC considered this to be too difficult to control for the number of samples required and ex-·~ludedi·t from the project.
26

• .P.h¥S i ca L.make.\1l2
•
. The makeup of the sample had to be ascertained in view of the subsequent packaging and mailing requirements. Various s~bstances posed packaging problems such as locating suitable containers (as in the arson sample) others posed mailing , problems, such as the controlled substances. The physical properties also affected scheduling the sample. If a quality of the sample selected could be altered ~y' the passage of time, as is the case with blood, manufacture had· to be scheduled fairly clos~ly to mai1ing. time to assure
. the value of the sample did not deteriorate. Also to be considered was the nature of the testing vis-a-vis the sample. If the sample required destructive testing rather than non'destructive testing, an adjustment would hav~to be made in the amount sent to each participant. The intention, as stated in the initial project plans, was that the remaining portion of each test sample could be retained by the laboratories and used as shelf reference materials, since they would receive a complete repor.t of its composition. This, while feasible in some cases, was unrealistic in others.
Packaging and mailing requirements
As noted above, the packaging for each individual sample depended on' the sample's physical makeup and "life". The manner in which sample components (in the case of multiple samples per test) would be identified (marking or labelling, depending on the nature of the sample) had to be determined' as well as specifying the wrapping or packaging whichwo~1d be used for each of those individual components. Also to be taken into consideration was the method of handling the sample to avoid accidental contamination or destruction. Once these requirements were defined and specified, ,t was the task of th~ project staff to see that they were carried out. The pitfalls of conducting testing of this sort for the first time were evident in this step in the process. In several cases the packaging proved to b~ inadequate or the container proved to be less d~rable than had be~n expected. In cases where necessary, special methods of operation (such as usi~g'certified, return receipt mail, air mail, etc.) were employed.
A'special project logo was designed to ensure easy recognition of the· parcels and letters pertaining to the project. All correspondence pertaining to the project carried the
27
distinctive IItarget ll in red and black. ,(Figure 5.) .
. The mail i ng procedures employed for the di stributi on of samples underwent rnarked.chahges during the course of the project. These ar~ described in detail in the s~ction covering sample mailing~
• Manufacture availability
The expertise.of the Project Advisory Committee particularly the PAC member designated as the Manufacture Ag~nt, was relied on to determine if a sample could be manufactured according to specifications .. Following that determination, the procedure for the actual manufacture of the samples was implemented. (See samp·le manufacture section.)
• Cost/Time factors
The final consideration in the selectioh of a substance or an item to be a test sample was the relative cost of preparing that sample and the amount of time the production would take. It would have been impractical to arrange for the production of a sample which required Qn inordinate amount of time and equipment to facilitate manufacture. The time required to examine the samples for homogeneity and specificity had to be taken into consideration as well. Through the experience acquired during the course of the project most of the samples selected readily lay within the bOUhds of reasonabl~ time ~nd cost considerations.
DESIGN TEST QUESTIONS
Following the selection of a sample type and the determination of the specific nature of the material to be used~ the test questions were
28
discussed. As stated previously, the questions basicall~ fol16wed one of ,two formats; either open ended, broad questions or. objective type questions. The .PAC, along wi.th the' project Staff andCTS would draft the language ,which was .to be employed'in these questions . . Sample Manufacturing Procedure
Once the criteria for a specific sample were established, it became necessary to restrict knowledge of thQ~e criteria, as well as the answers to ,the questions posed in the data sheet, to as few individuals as possible to avoid compromising the test. The original sample manufacturing procedure specified in the grant proposal (for grant #76-NI-99~0048) outlined a fairly complicated procedure in which potential manufacturers would be invited to bid for the contract to manufacture the sample. This procedure, while conforming to the guidelines used by the Federal government in contract bids for large items, proved to be unusable for a project as unique as this. Firstly, the number of items which required production was I~latively small as the roster consisted of approximately 240 laboratories, and secondly, the samples to be manufactured did not fa1l into any established descriptions. The process was exploy'ed and attempted in part, if not exactly as written. Unfortunately, the results of this experiment were virtually disastrous, requiring that the entire procedure be changed~ This was refle~ted in the ~rant proposal for the continuation of the project.
After the Proj ect Advi sory Commi.ttee he 1 d its fi rs t. meet i rig, it ,was decided that, in the interest ·of expediting the production of the first sample, the prescribed manufacturing process would be abbrevlated, in light of the fact that several potential manufacturers offered to provide sample materials at u> cost.
The sample selected was amphetamine. Since relatively few pharmaceutical concerns manufacture this SUbstance, direct contact with one of th~se concerns, rather than requesting bids, woUld be advisable. Also, the total quantity of the substance required to prepare enough samples for all participants was quite small, suggesting that no potential bidder would be interested.
A major drug company was contacted and apprised of the requirements. They offered to provide adequate material to the project at no cost and the offer was accepted by the Project Advisory Committee.
Unknown to the PAC, Staff and NBS, that same manufacturer had provi,ded a quantity. of the same controll ed substance to the Nati ona 1 lnsti:tute on D~ug Abuse located in th~ same buildtng as the Forensi~ Sciences
29
· . Foundation offices in Rockville, Maryland. The information regarding the material provided to NIDA was not "secret", and within a matter of weeks many 'i ndi,vi Qua 1 s knew, that the substances were the. same. Test Sample #1 had mistakenly been·compromised before it was mailed to the participating laboratories. A new sample had to be manufactured.
As a result of an emergency meeting of the Project~dvisory Committee, 'the new procedure for manufacturing, which stated th9t the responsibility be turned over to·~ member of the PAC, was established ..• thus materially reducing the possibility of "leaks". The committee member was then able. to draw from the professional resources available to him in his capacity as a criminalistics authority. Arrangements with commercial establishments were made based upon an expressed desire to participate or a previously demonstrated ability to produce samples of this type to conform to the specifications required. The PAC member was also free to 'engage the serv1ces of another· laboratory, or professional organization to assist in the manufacturing process.
Although the compromise of the first sample was an unfortunate coincidence rather than the fault of any particular indi,vidual, it served to illustrate some of the unanticipated problems which would continually arise if the manufacturing process were to be followed as ori gina lly proposed. The change to PAC responsibi 1 i ty for manufacturing· proved to be effective, not only from the standpoint of guaranteeing the secrecy of the composition of the sample, but in circumventing other problems which would have arisen because of industry's unfamiliaritywith the unique problems dealt with in the crimina]istics. 1 aboratory •
An unforseen benefit of the procedural change was the reduction in cost of the preparation of the samples. In the initial grant proposal, $2,000 per sample had bee~ allocated for manufacture. Under the revised procedure, manufacturing costs were reduced markedly. Manufacturers contacted by the PAC members often were willing to provide samples at no cost, and where costs did occur, they were nominal. .
Through contact with members of the, criminalistics profession actually participating in the project, it became apparent that there was an additional advantage to having a member of the profession directly involved in the manufacture of the samples. By having a fellow member of the profession directly involved, the participants felt. the samples would be produced fairly and with the workings of the criminalistics laboratory in clear perspective and this reduced some of the skepticism about th~ project and encouraged participation.
30
..

Throughout .the course of the project, the problems presented in manufacturing were constantly underestimated. Every sample had problems,· whether it was riot being able to locate the test materials decided upon, or achieving the realism intended. Logistical problems presented themselves, which on occasion, necessitated a change in the sample. As an example, it was difficult for the laboratories to accept the intended realism of an auto paint (Test Sample #5) that was presented uniformly spread on a metal backing, but manufacture and distribution any other way would have been impractical. Ideally,
. taking scrapings off a car might have been more realistic; however, . the qua·l ity control problem of ensuring that each laboratory
received the same quantity and quality of sample precluded that approach. Homogeneity of samples was a factor which constantly had to be closely mon.itored. In the case of the headlight glass {Test Sample #9),·to insure that all laboratories were receiving the sa.me s~mple~, 'only one lens was used. This proved to be logistically, diffic~lt as it was virtually impossible to break one he~dlight lens into 240 uniform size pieces. To remedy this, the lens was sawed, which left striation marks from the saw on the glass, created uniform ,size cube shaped pieces of gla~s, but .destroyed the intended r~alism. No crime lab receives a smashed headlight in uniform size cubes.
Occasionally minor errors were made in marking, packaging or sample' question design. However, none of the samples was ever erroneously described, that is, nothing was sent out which was not what it was supposed to have been. In any proficiency testing program, the conformi tyof the manufacturer's product to designed specification is a major activity and often beset with problems. However, it is felt that in spite of the problems cited (many of which are present in other on-going proficiency testing projects), the overall products were remarkably good.
It is recognized, and should be noted here, that if testing of this type continued on a similar scale or be enlarged in any way, the method for manufacturing which evolved from this first· effort would probably be continued with modifications. PAC responsibility for manufacture required many man hours of volunteer time contributed by each member of the committee. This was done in an . effort to see this project succeed as a prototype for future testing. It would be unreasonable to expect these or other individuals, all of whom have many other responsibilities in their professional capacities, to continue to extend the same amount of volunteer time in the future without compensation. However, afte~ making changes as a result of the experience gained by manufacturing twenty-one ' different samples, it is believed that some of the problems initially encountered, could be avoided.
31

In a peer evaluation study of the project conducted by the Foundation (See p. 42.), a recurring criticism in the midst of high praise was that· the samples lacked realism and were not truly representati ve, of actual case materi a 1 s. Whi 1 e the PAC recogni zes this as previously st!'lted, it is extremely difficult to replicate what amounts to a case type situation while maintaining homogeneity
. amongst a·.iarge number ofsamp1es. However, the samples,a·long , with the accompanying scenarios, did in fact present a plausible pack~ge. '
Design of Test Questions
After arranging for the manufacture of a particular sample, the PAC addressed itself to the formulation of the questions which would accompany the sample. While candidate questions had been discussed during the test and sample parameter phases, it was now necessary to formulate the !'lctual wording and format which would comprfse the data sheet. This document, the data sheet, went through an evolution of its own during the course of the project.
In the early stages of the project, NBS was a strong proponent of questions which would produce quantitative answers and a great deal of numerical data. The highly sophisticateq,forms of testing being carried out at the Bureau lent themselves easily to this type of quantitative analysis and statistical presentation. ' However, the nature of· the testing being carried out in this project did not-
The generation of many statistically oriented charts and graphs which ~esult from quantitatively o~iented questions and standardized laboratory procedures were felt to be too ambitious for a testing program in its very early stages and not fully applicable to the various types of evidence encountered in the crime lab.
Since the initial goal of encouraging participation had been established and samples were being designed as "results oriented"; that is, the greater ; nterest was in the answer rather than how it w'as arri ved at, it was decided that the questionnaires would be worded in an open ended fashion. What was sought was any kind of information the laboratory ordinarily would develop in the analysis of the same type of evidence. A persuading argument in the decision not to ask detailed questions was that the more specific the requests were concerning protocol, the more hesitant the laboratories might be to participate-. Since the sensitive issue of standardization of laboratory methods and procedures (or lack of it) was also a consideration, it' was thought that detailed requests for information 'might leave the impression with participants that proficiency testing was to become'synonymous with standardization, which was not the case.
32

Whenever categories were repeated, more specific infqrmation (when it was felt to be appropriate) was requested. Data sheets were reconstructed in a more objective manner allowing the respondent to i ndi cate hi s fi ndi ngs by checki.ng the appropri ate answer. The same treatment was also given to the methods section of the data sheet (where appropriate; see Test Sample #lOA, Paint) and, in addition~ examiners were asked to indicate the sequence of tests they performed and the point at which a decision regarding the conclusion was reached. While this proved to be useful in some cases, it.was not uniformly applicable .. Each time a new category of physical evidence was incorporated into the ~roject, the questioris again became of the
., 'open-'ended variety.
Again in this phase of operation, because this was a project to explore how to conduct this type of testing, unforseen problems
. arose. Some questions were too vague--some respondents had difficulty in discerning exactly what was being as~ed--others overstepped the bounds in which the criminalist functions. For example, in Arson Examination, Test Sample #14, a question was i ncl uded refe'rri ng to any ev; dence of conspi racy. The purpose of
. the question was to determine if one aspect of physical evidence could be related to another, in this instance a physical match between two pieces of cloth. The question as posed was poorly phrased and· one that would be inappropriate for a criminalist to
'-' answer iT' asked in court; therefore, it did not belong in the test and responses to it were not. tabul ated.
Since the tests remained geared to producing results, the various types of questioning used proved,to be successful: Whi~e,som~ w~o have been· involved in other testlng programs 9utslde crlmlnallstlcs . might 'criticize the data collected as being quantitatively ~ns~fficient, the Project Advi sory Commi ttee cl early feel s that the questl 001 ng was'properaridthe results support .this view whe~ the distinct nature and function of the laboratories is considered!
TEST EXECUTION
Following the design and preparation of the sample, the next phase to be accomplished was the test execution, a task which was ~rimarily assigned to the project staff. There was constant close coordination between project staff and PAC to effect the test execution within the timeframe set up. (See Figure 6.), Unforseen obstacles discussed above calJsed delays in the schedule established for the production and mailing of the ~amples necessitating changes in the order of samples on occasion or delaying the distribution on other occasions.
33

FIGURE 6
MANUFACTURE DELIVERY DATE 'DATE. SAMPLE MAILED, ALERT POST CARD CUT-OFF/QUICK REPORT DRAFT ANALYSIS FINAL REPORT MAILING
Assignment of Code Numbers
M-20
M-DAY M+20
M+35 M+55 M+75:'85
To ensure the confidentiality and anonymity of the laboratories in this project (that being the basis for participation and fundamental understanding· in a volunt,ary research project of this sort),asystem of identifyfng the laboratories by a randomlyassigl)ed code number was estaplished.
The most crucial issue that was addressed, and upon which the success or failure of the project was based, was that of confidentiality.of data and complete anonymity of participating laboratories. The needfor'these conditions could not be overemphasized, and time and time again was reiterated fn the initial concept paper, the grant proposal, the grant award, the correspondence with participating ...,J laboratories, the project reports, the deliberations during Project Advi sory Commi ttee meetings, as well as the 1 anguage in the continuation grant under which the project is currently operating. Both LEM and the' Foundation were aware that without the promise pf confi dent; a 1; ty and anonymi ty wri tten into', the grant, 1 aboratory participation wo~ld be negligible. "
To this end, two sp~cial conditions were written into the Grant Award. (See Chapter.I ; page 8.)
It was emphatically clear that the reasons the project was funded and the data gathered were solely for research and statistical purposes.
After being convinced by the Project Advisory Committee (PAC) and the staff of the Foundation that anonymity and confidentiality' would be guaranteed and that the principal thrust of the project would be to benefit the laboratories by giving them insight into their own proficiencies, and allow them to compare and contrast their procedures and capabi1ities with other laboratories around the country, most crime laboratories decided to participate.
34
. After the mailing roster had been compiled and revised, laborat.ories were assigned a "code ll number. The numberstfor·this."code ll were ,drawn ·from the Rand Hst of random numbers. The . prefi x (letter) preceding the assigned number (A series, B series) was not an integral part of the code. '
Laboratory Directors were given their assigned code numbers and advised to limit the knowledge of that number to as few individuals as possible. To further pr'otect the anonymity and confidentiality of the participants, code numbers were assigned for tests 1-10, reassigned,for 11-'15 and then iigain for samples .#16, 17, 18,19, 20 and.21, ,bringing the total nUmber ~f todes assigned to a given laboratory to eight.
Following completion of the data reduction and analysis, the Fo~ndation's record of code numbers was returned to the·respective laboratory directors. In this manner,. the 'key to identifying the performance of ahy part; cu1 ar ,laboratory remai ned wi th the director of that laboratory, and thereby ensured .the Foundation's· promise to participants that testing would be anonymous.
In retrospect, the ·PAC feels that the use of code numbers did not serve the .purpose~ of the project well. The problems that could have and did ~rise from the maintenance of such a list were not balanced by their usefulness as a record keeping device. In future testing of this sort~ code numbers would not be utilized in: order' to guarantee complete anonymity iind confirlenti.ali.ty to participants.
Packaging ~nd M~iling
. . Following the preparation .of the test samples by a member of the Project Advi sory Commi ttee accordi ng to speci fi cat; ons. set forth, the items were prepared for dist~ibution to participants.
The type of wrappings and containers used for each sample were determi ned at the .time of the di scussi on ,of the sampl e spec; fi c.ations. The proj~ct staff then locat~d the proper packaging materials and containers. An effort was made, wherever possible, to find packaging materials which would be suitable for storing the remaining durable samples as shelf reference materials, if so desired by the participants. Tamper-proof evidence tape produced by the 3-MCompany was used to seal the packages to impart authentic'ity, and all packages were marked with the easily recognizable proJect logo.
35

I
The wrapped sample was then placed in a protec::tive mailer of the, cushioned type to protect the samples from the rigors of travellin,g through the u.s. mail system.
While most s~mples arrived at their destination intact, there were several instances when packaging was inadequate. In one instance, poor packaging caused the cancellation of the test. Specifically, in Test Sample #10, housepaints were drawn on g1ass plates, scraped and a pred~termined quantity of the scrapings were placed in a ' glassine bag. In this instance, the bags were improperly folded, allowin~ the paint chips to escape into the plastic box which enclosed ',the bag. This presented the possibility of the three different samples contained in the same box cross contaminating ea,ch other. Since it could not be determined whether this had happened, the t~st had to be cancelled and the entire process repeated.
All items which comprised the test were labelled by an "Item" designation dependent on the, total number of samples which comprise the test. If there were three pieces of "evidence" to be examined, items would be labelled A, Band C. Labelling was, uniform (except in the firearms examinations); like items were assigned the same letter. The Item A sent to anyone laboratory was the same materlal as the Item A sent to another laboratory. The exception to this procedure was firearms examination, ,in which bullets and cartridge cases were marked in "batch lots", so that a particular item was assigned several sets of letters and responses could be categorized based on the particular letters reported by respondants. In this manner, with so many different letters in use, it was not nec~ssary to retain records of which letter items were sent to any particu1ar laboratory. A description along with item marking would characterize the sample sufficiently.
The package included the documents which accompanied the sample--the covering letter, an instruction sheet and a data sheet with the code number assigned to that particular laboratory on it. The cover letter' itemized the contents of the package, an i~dication of the closing date for the test, and any special information which pertained to that test~ The instruction sheet contained specific information pertaining to examination and reporting require~ents, and the data' sheet contai ned the actual scenari 0 and quest; ons asked. Also enclosed was a postage paid return envelope for the submission of data.
Mailing
The mailing procedure was an operation that underwent considerable change from the mechanism originally described in the proposal for th~ ~rig1nalgrant. The first item ~o.be discussed concerning ma111ng 1S the development of the ma111ng roster. As previ:ously stated~ various sources were used to develop the list of participants
36
..
I

including LEAA, the FBI, DEA, etc. Other sources were. the National Library of Medicine'survey of toxicology laboratories, va~ious regional association rosters, --in short any laboratory that seeme9 to be a plalJsibl~ candidate for inclus:ion in this proficiency testing project was included. Addresses,telephdne numbers as well as the name and title of the director were verified.
This roster, after several revisions, was put into a·format suitable for xerox reproduction and label generation. At a later date, the list was 'computerized and the roster, updates and labels were processed in the computer. The only information contained in this roster was the laboratory name, director's name and address. No information regarding code numbers, laboratory capabilities or
. performance were at any time part of this roster. Its function was tO,expedite mailings of Test Samples and r~port. (This roster is attached at Appendix A.)
At the outset of the project, the mailing procedures employed were so used to assure all possible precautions and safeguards were being tak~n to ensure that samples arrived at their destination~ To notify laboratories the sample would be coming, an alert letter was sent. to recipients approximately five days before the sample was to be 'mailed. Packages were mailed from the Follndation office in Rockville, Maryland using first class,. certified, return receipt
~ request mail. Five days after the package was sent, a letter followed stating the package had in fact been sent, and the Foundation was to be advised if it had not' been received. Several problems arose with this procedure, causing the.project staff to modify it as needed, resulting in a· marked simplificationa It was reported by many laboratories that the alert letter sent prior to the sample was arriving at the sametime.as the samp)e .package, thus negating the intent of the alert letter. Using first class, certified return receipt mail to ensure delivery also turned out to be useless. In many instances, the return receipt cards never found. their way back to the Foundation office, even though through investigation it was ascertained that the package had indeed been delivered. ~f itwere,determined that a package had been lost, the post office did little or nothing to locate or trace it.· Therefore, the added expense and effort (in terms of extra postal f~es and record keeping, etc.) to send the packages in this manner was fruitless. As a result, packages were simply sent by first class mail. The overall loss rate remained the same.
The follow up letter was retalnedsinceit became the only means by which th~ project staff could ascertain whether the packages had been delivered. The letter included instructions to notify the Foundation office if the parcel had not arrived, or had arrlved in a condition which was damaged or destroyed. In these cases the samples were replaced.
37
\ I
The mailing problems remained constant throughout the course of the project.. Oth~r parcel carriers (United Parcel Service) were considered, but si.nce their delivery areas did not reach the entire country, this proved to be unusable. Although packaging and mailing were under full control of the project staff for those operations conducted at the Foundati on offi ces, there were i·nstances where samples ran into difficulties because of conditions which' were outside project staff control. For example, a blood sample was distributed in the summer m~mths during what. was a particularly warm period for the entire nation. Several complaints were received that the sample had arrived at its destination in a putrified state. After checking temperatures across the country for that time, it was found that most areas of the country were experienti ng daytime temperatures in the ninety degree range, and not being able to trace the specific route.of any package it was not inconceivable that several of the packages had. been subjected to temp'eratures while in transit (particularly in a closed truck) which might in fact have qltered them in some way. So, although the packaging and mailing were done under controlled conditions, once the packages had left the Foundation office there was little that could be done to circumvent unforseen occurrences such as those previously' described.
Referee Laboratories
Th~ original grant proposal stated that the purpose of using the· Referee Laboratory procedure woul d be to ensure that as close . to a "true" value possible was obtained for each test sample used in the project. Also stated was the intention that participating laboratories not be used as referees. This in practice was impractical if not impossible, for virtually all the laboratories
'\;Iith the necessary capabilities and understanding of the particular problems addressed in the testing were participants.
Referee laboratories were selected in two different manners--first laborato~ies with reputations for excellence in a particular area of testing were' singled out by the PAC and requested to analyze the materials to be sent to all laboratories. Th~re was sufficient reason to believe these laboratories would work the cases in a complete and ~ccurate manner. In the second mode, applicable only to multiple iterations of test categories, laboratories were selected who had submitted data that indicated the capability to perform above average analysis in that particular field. Generally, three laboratories were contacted to serve as referees for a particular test sample; however, not all those who originally agreed to act as referees submitted data, bringing the number of referees for any given test from three to none. In effect, for some tests there were no results from referee laboratories ..
38

In the P;roficiency Testing Project, as it was conducted, referees did riot serve in the""class;cal referee" capacity. Because of time constraints. in both the manufacturing procedure and the time allowed for participant response, ·the results reported by those laboratories selected to serve as referees ,generally could not be reviewed before the ~ample was mailed to all participants. Thi~ precluded the opportunity to make any changes in the sample design based on the referee findings. Often, the referee results came in at the conclusion of the test period along with ·the other par.ticipant data.
Another factor whi ch minimi zed the useful ness of the referee laboratories as used in this project was that there exists ho un~formity of methods employed in examining any particular class of physical
. evi dence; therefore, the enti r~ range of methods reported by parti dpati n9' 1 aborator.i es was not necessari ly covered by the methods reported, by the, referee laboratories. In addition, much of the testing is comparative in nature and does. not require the determination of absolute values to arrive at a conclusion.
While it is recognized that the referee procedure as employed in this'project was inadequate, ,it is felt that the procedure (en-: compassing manufacturing and mailing alterations) could be adapted to work well within such a- testing system. Additional lead time is needed for manufacture of samples and an adequate period of time need be a 11 owed for the )~eferees to exam; ne the samp 1 es before they aremai1~dtotheparticipants.This procedurewQuld allow necessary changes in mailing and packaging materials and accompanying documents to be made. As the project was structured, there was insufficient time between the manufacture and general mailing to accomplish this. The Project Advisory Committ~e feels that in any continuation.of',proficiency testing, the timetable $houldbe modified to allow for adequate refereeing of the samples prior to' general distribution .
. Response and Re~ords
The package sent to participants contained, as previously stated, a cover letter, an instruction sheet, a data sheet and a return envelope. For purposes -of recordkeeping, laboratories w.ere assigned a code number to enable the project staff to properly process the responses submitted.
The appropriate code number for a particular test was placed in the upper right hand corner of ' the data sheet and the respondent was asked to check it against :the assigned, code sent under separate cover.
39

Ali st was kept (by code number) of those 1 aboratori es that ~/ere . sent a particular sample, whether a response was received, and whether that 1 aboratory stated they di d not have the capabi 1 ii ty to process that particular sample. In this way, a tabulation of the'response rates for sta'tistical purposes could be made. The
, partiG;pati~n rate was calculated CIS folloWs,: .
Number of Responses with Data 1----..-------------- X 100= Participation rate .(%)
Total Number of Number of "00 Not Do" Samples Sent Sample Replies
A record of participation was kept for each laboratory. 'This was a listing by laboratory name, with no accompanying code numbers, kept
, for purposes of tabulating responses on a geographical basis and for ascertaining capabilities in p~rticular areas of evidence examination. This became particularly important in tnose instances where the samples required complicated manufacturing procedures, such as quest; oned doc'uments and fi rearms. If the total number of samples to be produced could be reduced by reviewing the records pertaining to ca~abilities that was compiled, and t~ose laboratories lacking the ability to process that type of evidence eliminated, manufacturing time and costs, as well as mailing time and costs" could be reduced.
After the receipt of all responses following the cut-off date, the data sheets were turned over to th~ Collaborative Testing Services, Inc. All identifying items which might have been placed on any data sheet (signatures, laboratory time stamps etc.) Were removed prior to being turned over to CTS.
As stated, one of the basic goals of the project was to conduct, research into how to perform a project of this nature, therefore, following the tabulation of the collected data, the cO,de numbers were returned to the respective laboratories leaving the project staff with only aggregate lists of numbers. The records contained lists of numbers assigned to a particular laboratory during the course of testing, but there remained no link between a laboratory name and any numbers. As a result"the project collected participation data (in terms of whether a laboratory had respon~ed, but no ;nf~rmation regarding ,the content of the response) by name, and
40

technical response' (data) by number, with no accompanying names. It was felt that in this 'manner the necessary data would be retained in a.manner·m.ost useful to all involved ... the laboratories would be guaranteed 'the anonymi·ty and confidentiality promised to them at the outset of the project, arid the project staff ~rid the PAC
.would.ha,ve th~.data ~eeded to evaluate the, project in the perspec-tive of the stated goals. .
Alert Post Card
To encourage timely responses, an "alert post card" was sent to those labo~atories who.had be~n sent samples but had not yet returned th~ir data prio,r to the cut-off date for the return of data. It ,was noted that this post card caused an influx of respohses, at least toward the end .of the stated examination period. Many more responses Were
'r~ceivedby the project staff following the mailing of .thes'e cards.
TEST STATISTICS
Data Reduction
Upon completion of the testing period, all data sheets submitted were turned over to Collaborative Testing Services, Inc. for data reduction and report preparation.
Information compiled.was a summary ,of the referee responses,. the manufacturer's statements, as well asa summary of the responses submitted by all participating laboratories.
Among the t~chnical tasks completed were compilation of a summary of methods reported used, instruments used (if applicable), the point at which a decision was reached (again, if applicable) and calc4lation of pertinent percentages. Any appropriate charts and graphs of the repor~ed results, were drawn up and included in the draft of the Test Sample report.
Data reduction was accomplished manually, as the materials did not easiiy lend themselves to computer reduction. The wide range of reporting policies, methods used, and the Project Advisory Committee's decision to 'use the open ended form of questioning Were in part responsible for the continued need for manual data reduction.
41

I ~
TEST EVALUATION
Quick Report
'Following ~he cut-off date for the return of data~ a quick report was sent to all laboratories who had submitted data for that test. The qLiick report consisted of the manufacturers statement of des-cri pt i on Of the sampl e andi ts contents . This w~s done to a 11 ow ' laboratories to rapidly judge their results against the manufacturer's description without having to wait for the final.report ofa particular test sample to be distributed.
. lest sample Reports
. The completed draft test report, prepared by CTS was then distributed to the PAC for comment and criticism. Following the critique, the recommended changes in the report were made. Test reports were prepared for. printing by the Project Staff. When completed, individual test rep'orts were distributed to participating'laboratories and the project grant monitor at LEAA.
PROJECT EVALUATION
Background.
To assess the success of the project, per se, an evaluation questionnairewas distributed to all participating laboratories. This was done following the "first phase II of the project by .which time 5 different classes of physical evidence had been distributed twice.
DUring that period the samples were distributed to approximately 240 laboratories. (Some laboratories did not routinely examine some of the classes of evidence used in the test.) At the concl~sion nf the tenth test, an evaluation questionnaire was distributed to all the laboratories on the project rolls. This' report of the results
. ~overs the ratil1gs given by 144 laboratories--representing a response rateaf 60%--whose evaluations arrived in time to be included in the tabulation.*
Numerical Results and Computation Procedure
Following is a numerical tabulation of the r:esu1ts ·of the responses, together with the computation procedures used to prepare the numerical tabulation nf respohses.
*5 additional laboratories submitted evaluation after the cutoff date and are not included in the tabu1ation. However, in interest of reporting the true response rate to this survey, these untabulated responses would increase the total response rate to 62%. .
42
. ... "

,.
" ,
~ - TABLE 1
NUMERICAL TABULATION. OF RESPONSES*
- -SIZE 'PROFESSIONAL STAFF
QUESTIONS 1-4 5-9 '10-19 20+ , ,
#1: Rate the Choice (6'6 Labs) t35 Labs) (30 labs) (13 Labs) , of Ca tegori es
a. Controlled Sub. 3,0 3". 1 3.0 3.1 b. Firearms 3.0 2.9 2.9 3.0 c. Blood 2.9 2.8 2.8 3.0' d. Glass 3.0 2.7 2.6 3.1 e. Paint 2.8 2.9' 2.8 2.8
#2: Rate Phxsical ~haracteristics
\wi Q4antity 3.2 2.7 2.7 2.6 , b. Qual ;'ty 3. 1 ,2.8 2.5 2.7 ,
--, ,
#3: Rate Data Sheet 2.5 2.2 2.3 2.7 0_ .. -
#4: Rate Statistical Reports 3.2 2.5 2.7 2.8
#5: Rate Test' Admi n~ istration 3.2 2.8 3.1 3.1
"
#6; Overall Rating 3. 1 2.7 2.8 3.4 -#7:' How 30 days 13 ]2 6 4
Often' 45 days 11 8 4 3 Test 60 days 37 18 16 6 --' --
Rating St"ale: . 4 = Exceilent 3 = Very Good 2 = Good 1 = Fair
*An explahation of the computati on procedure beg; ns on page 4 5 .
43
OVERALL RATING , '
(144 Total)
3.0 2.9 2.8 2.8 2.8
2.8 2.7
2.4
2.8
3.0
3.0
35
.26 77
o = Poor

Conclusions
The laboratories with the small~st (1~4) and the largest (20+) staffs of physical evidence examiners tended to rate e~~h question hig~er than the laboratories with staffs of 5-9 and 10-19. The re'asons for thi s vari ance are unknown.
The major reasons cited for the relatively low ratings given to Question #2 were:
(l) Samples are too bi g
(2) Samples lack realism
it was assumed that the low rating assigned to the Data Sheets stems fro~ the errors made in structuring the earlier test forms.
There was, however, a,constanttug-or-war going on re: Data Sheets. Some wanted them to be', much more expl i ci t. Others wanted them to be completely open ended;
It was, ev~dent that the rate of testing had to be decreased to, at most, ~me testpe'r45 days.
44

COMPUTATION PROCEDURE
STEP 1 'Laboratory Characteristics
In an effort to ascertain if laboratory characteristics (size, population served, ,services offered) played a significant'part in the evaluation ratings, the laboratories Were grouped according to the, reported number of persons examining physical evidence versus the rep'orted population served. Following is the result of that tabOlatioh.
, Nr. of Persons Examining Physical Evidence In Lab
1-4
5-9
10-19
20>
*Not all reports 'cited staff size or population served
Number of Laboratories by Staff Size and Population Served
,
Population Served* <100,000 100,00 500,000
to to 499,99 999,999
6 25 25
"
4 13
1 0 5
0 ° 1
1,000,000>
, 10
19
24
12
TOTAL
66
35
30
13
Note that, with the exception of the large number of small staffs that reported serving large populations, there is a direct correlation beh/een the size of the staff and the population s~rved. Accordingly, the tabulation of the results of the survey was made on the basis of the number of evidence examiners employ-
,ed by the, -report; hg 1 aboratory .
. 45

Sixteen laboratories indicated that they perform only drug, blood, or .firearms examinations (or a combination of two). There was no signi-ficant variance in their ratings from those of full service laboratories. ~ Eight of the 16 iaboratories serve populations in excess of 1,000,000' but th~tewasno significant concent~ation of them in any of the cells in the ta.bte.
STEP 2. Quantification of Rating~
Because or the difficulty associated 'with averaging qualitative answers (Excel1ent--Very Good, .etc.) each such rating was reduced to a numer.kal value as follows:
Excellent Very Good Good· Fai·r Poor
4 3 2 1 0
STEP 3. Numerical Computation of Answers
Size Lab
1-4
Size
1-4
A. Th~ number of responders fo~ each question was first tallied as showing in the following. example for Question #l -Controned Substance (as rated by the laboratories with 1-4 'Will . examiners .
. Rating Offered in the Questionnaire
Excell. Very Good Good Fai r Poor
18 31 13 1 ° B. The numerical value for each rating was substituted for
the \'/ol"d values and multiplied by the corresponding number of responders.
Rating Values
Excellent Very Good Good Fair Poor . TOTAL
Lab· 4 3 2 1 0 VALUE
72 93 26 1 0 192
C. The Total Value was then divided by the total number of responders --producing an average value: ~ .
192· divided by 63 = 3.0 (equivalent to liVery Good ll)
~ 46

~.
SUMMARY OF COMMENTS*
I . DATA SHEETS/DATA ANALYSIS/REPORTS
• In ~he test reports, more "in-depth!' analysis is needed.
.• Verified values for all relevant examinations should be-included ·as well as graphic representation of participating laboratory
results, whenever appropriat~.
• The program should allow each laboratory to critically evaluate it~ procedures and identification criteria.
• Compiling of data has not always taken into account the limitations'of the comparison process.
• Repetitious questions have been included on data sheets.
• Compl ete ana.lyti ca 1 procedures used by referees shciul d be i ncl uded in rep·orts.
.• On occassion, serology nomenclature has not been good - use of NIH recommended nomenclature would have been better.
• Data sheets (particularly the more recent,ones) hav'~ been helpful i~ widening knowledge of the scope of tests performed on'various samples by different laboratories.
• Some analysts would prefer to record their. observations and 'cohclusions on the data she~ts as the tests are run rather than summarize them later.
, Data sheet should include a question as to whether the analyst knew it was a proficiency test.
• Some questions on data sheet are not possible to answer.
II PERSONNEL/EQUIPMENT TRAINING
• Test·results should provide fuel ,for personnel and equipment requests for la~ administrators ... at budget time .
. -• The reports point out areas where increased training is needed.
• An individual's experience in the use of specific techniques . to examine test samples should be correlated with his results.
~. * Accolades to the project were greatly appreciated but were not included in this summary.
47

• Results should be used to encourage adequate education and training programs throughout the country. The. reports show there is a .vital need for practica1 education as well as .the need for continuing education to keep current with new developments and technology.
• There should be a review of the college/university programs for Criminalistics to deter~ine what batkg~ound is b~ing taught.
III SAMPLEPACKING t CHOICE, SIZE
• In fwo c~ses there have been problems with sample pa~kaging-breakage, cross contamination.
• Sampl~ quantities were reported as being both too large or too small for a given test.
• Drugs--choose somethi ng more obscure.
• Request for samples in Toxicology.
• Include a non-controlled substance in a drug sample.
• Poor quality of one blood sample produced weak results.
• Samples not satisfactory for placement in routine case work. Therefore, more than routine work done.
• Samples concentrated too heavily on micro-chemical area of laboratory.
• Samples should be more consistent with real cases submitted by police agencies.
• Obtain drug samples from DEA seizures .
•. Headlight lens specimens should be obtained by smashing:.;not cutting.
• Paint samples should be obtained from old buildings or cars.
• Almost all samples routinely received in the lab are contaminated. Why not contaminate proficiency samples? .
• Several categories of testing should be included in one sample, e.g., blood on paint.
• Some .samples too easy - others too difficult.
48

'..;,.1 • ...
IV 'METHODS/ERRORS
• Some correct responses' were obtained'by laboratories without sufficient analytic~l data to support conclusions.
• Program would be more helpfu,l if defin'ite conclusions were . drawn as to "good, better, best" technique to use On any given test.
, ,
• ThesulMlary should include the number of labs that were in error.
• ,What controls and standards were used in the manufacture and, in the referee testing for each test?
• Labs should include a brief explanation of methods (particularly non-instrumental) and techniques used.
• Evaluations of methods and suggested references would be useful.
• Speci fi c methods shoul d be recommended fQr use to exam; ne the ' evidence. It is difficult to evaluate results without us~ of uniform methods.
• Tables 'showing correlation between method and success would be useful.
• Project shoul d eva illate methods that have been thought by the profession to be standard f~r a given type of physical evidence.
• 'The project should publish a compendium of methods used by, participating labs.
V CODE NUMBERS/ANONYMITY
• Assignments of code numbers,and publishing responses by code numbe~ jeopardizes anonymity of responses.
VI SAMPLE FREUUENCY
• . The Cqse load in laboratory ;s too heavy to devote as much time to proficiency testing as desired.
• Samples are submitted too close together.,
,49

I ..
CHAPTER III
. .
TEST SAMPLE DISCUSSION
INTRODUCTION
This chapter is a summary of the various test samples which were manufactured, distributed and examined during th:i':s research study. Because the selection and preparation of samples constituted one of the most challenging and problemmatical components of. the project, it is important to detail how the test samples were obtained and/or manufactured, the structure of the data .sheets which accompanied.thesamples to the partitipating laboratories and on which they recorded their results, a discussion of any problems which the manufacturer experienceq during sample preparation and, lastlYt a summary of the results and methods reported by laboratories in the examination of each test sample.
The chapter is arranged sample by sample, beginning with Test Sample #1 - Controlled Substance .. Each sample discussionis proken down as follows :
f'! Da ta Sheet
• Manufacturer's Specifications and Discussion
• Summary of Results and.Methods Reported
51

'.~
FIGURE 7
CONTROLLED SUBSTANcE
PROFICIENCY TESTING PROGRAM
TEST NO. 1
Lab Code A--------
Examine according to your.normal laboratory procedures and complete portion(s) below which cqmplies with your laboratory policy.
1. (a) What is the controlled (narcotic or dangerous drug) substance ------------------------------
(b) . Ind.icate method(s) used.
2. (a)' Please add any other data (quantitative -qualitative) that you routinely develop.
(b) Indicate method(s) used.
IMPORTANT
DO. NOT SIGN THIS DATA SHEET OR IN ANY OTHER WAY IDENTIFY YOUR LABORATORY.
RETURN coPy. TO: KENNETH S. FIELD, FORENSIC SCIENCES FOUNDATION, SUITE 515, 11400 ROCKVILLE PIKE, ROCKVILLE, MARYLAND 20852.
53

The manufacturer characterizes Test Sample 411 as being the control1ed (Narcotic or dangerous drug) substance was PENTOBARBITAL. According to the manufacturer the sample is, a blend with a nominal value of 74% SODIUM PENTOBARBITAL. . Resu1 ts submitted by two Referee Laboratories have an average value of 71% Sodium Pentobarbital.
This first druq sample was to be a controlled substance of sufficient concentration and amount to ensure a reply from the laboratory as well as provide what could be 'used as a shelf reference material following the test. The material was obtained from a commercial manufacturer and approximately one gram was supplied to each 'participant. Containers for packaging were submitted to the proje'ct starf for, packaging 'at the Foundation offices.
54 \

CJ1 CJ1
,( { (
TABLE 2
CONTROLLED (NARCOTIC OR DANGEROUS DRUG) SUBSTANCE FOUND,
Part I of this table names the 'drug found as the. laboratory would normally report it. If more than'one name Was used in answer to question la, the more descriptive name was counted in ~art I. Drug. reporting may'involve state law, laboratory procedure, or reporter's discretion. Part II names the drug as actually identified.' ,
Part I Part II Reported. As normalllre~orted As actualllidentified . name number percentage of number percentage of
of of labs, total labs of labs total labs substance reporting reporting reporting reporting
l. barbiturate 8 4% 5 2.5%
2. barbituric acid derivative 15 7.5 8 4
3. pentobarbital 136 68 138 69 5-ethyl-5(1-methylbutyl)
barbituric acid 4. soluble pentobarbital 4 2 4 2
salt of pentobarbital 5. sodium pentobarbital 24 12 30 ' 15
pentobarbital sodium 6. amobarbital 2 1 '3 1.5
7. butabarbital 4 2 4 2
8. secobarbital 2 1 2 1
9. phenobarbital 1 .5 1 .5
10. sodium butabarbital 1 .5 1 .5
1l. sodium secobarbital 1 .5 2 1
*12. barbituric acid 13. 1ibrium 1 .5 1 .5
14. no drug found 1 .5 1 .5 * Reported as a product of an intermediate analysis.

(J1 en
AMOBARBITAL
(
L LIBRIUM
~
TABLE" 3
RELATIONSHIP AMONG THE DRUG NAMES USED /
..--:f /." / ~ / .. ..'/
CONJROl~ SUBSTANCE , ,1'/· -'.< I . ··· .. -,·111,11·'· •
~URATE I
....... ,.,. ". ,....
1 BARBITURIC ACID I
'J
BARBITURIC ACID It------,-------.......;.---..
BUTABARBITAL
SOD.IUM BUTABARBITAL
DERIVATIVE
PENTOBARBITAL
SALT OF PENTOBARBITAL
SODIUM PENTOBARBITAL
(
SECOBARBI~ . '
SODIUM SECOBARB IT AL
PHENOBARBITAL
t

~
TABLE 4 METHODS USED IN DETERMINING' SUBSTANCE
'This table gives the number of laboratori.es which used each type of test. Since most laboratories used more than one test, the total number of. tests perTormed is more than the total nurriber of laboratories.
Test or Number of % of total labs method laboratories (total=200)*
A Color Tests 166 83% ,
B KMn04 2 1% C .Crystalline Tests 97· 49% D Commercial Kit 1 .5% E Flame Test 2 1% F Melting Point 13 7% G TLC 50 25% H UV 121 61% I IR 99 .50% J NMR 3 2% K GC 79 40% L GCIMS 7 4% M· MS 3 2%
* Late responses (5) not included in tabulation.
57
I , ; , I
1
I I , I 1
I I I I I
, I

TABLE 5
. ~ . . INSTRUM£NtS AND METHODS. . (IN APPROXIMATE ORDER FROM ·PRESUMPTIVE TO DEFINITIVE)
A SCREENING COLOR TESTS [PRESUMPTIVE]
1. Koppanyi Reagent 2. Di11e-Koppanyi Spot Color Test [cobalt acetate-isopropyl amine, test
for barbiturates] . 3. Zwicker's [copper sulfate-pyridine, test for barbiturates] 4. Mayer's [screening test], positive for alkaloids 5. Marquis' [screening test, positive for alkaloids and amphetamine] 6. Mecke [screening tes~, positive for alkaloids and amphetamine] 7. fluorescence in tartaric acid 8. PDMB [p-:,dimethylaminobenzaldehyde, screening test, positive for LSD]
. '9. coba1t(II) thiocyanate [Co(CNS)2', screening test,' positive for cocaine type materials 1
10. Furf~ra1/HC1 .. 11. Froehd~'s (screening test]. 12. Liebermann's [screening test] 13. Parri [Dille-Koppanyi] .14.· VanUrk . 15. cobalt nitrate [Co(N03)2' screening test] . 16. Sanchez
. . .
B POTASSIUM PERMANGANATE FOR SECOBARBITAL ( KMn04 )
C CRYSTALLINE TESTS
1. Wagenaar's Reagent [copper sulph~t~-ethylehedia~ine, positive for barbiturates]
2. Davis Silver Reagent 3. sulphu~ic ~cid and water ( H2S04~H20 ) 4. .potassium hydroxide and phosphoric acid ( KOH-H3P04 5. Wagn~r's reagent ( I2-KI ) . 6. potassium iodide ·and phosphoric acid ( KI-H3P04 ) 7. pptd free acid, microscopic recognition 8. perch10ric acid ( HC104 ) 9. gold chloride
D COMMERCIALLY AVAILABLE ANALYSIS KIT
E FLAME TEST
F MELTING POINT
1. melting .point 2. mixed melting point
58

TABLE 5 . '-" CONTINUED'
G [tHIN LAYER CHROMATOGRAPHY] TLC
'H UV [ULTRAVIOLET SPECTROPHOTOMETRY] FOR IDENTIFICATION
I IR [IN~RARED SPECTROPHOTOMETRY] FOR IDENTIFICATtON
J NMR [NUCLEAR MAGNETIC RESONANCE]
K 'GAS CHROMATOGRAPHY (including: 1) gas chromatography-GC, 2) gas-liquid chromatography-GLC, 3) vapor phase chromato~raphy-VPC )
L GAS' CHROMATOGRAPHY/MASS SPECTROMETRY [GC/MS]
M MAss SPECTROMETRY [MS]
59 ,

..-
FIGURE 8
FIREARMS
LAB CODE A- ___ _
CJ CHECK HERE (AND RETURN IF YOU Q!! NOT PERFORM FIREARMS ANALYSIS)
~SIiEET
PROFICIENCV TESTING PROGRAM TEST NO.2
Examine aC,cording, 1.0 your normal hboratory procedures and complete portion(s) below which complies with YOUI' laborltory policy.
I. PROBABLE WI~fo(itlS(S)
1. .'ili. I/l;"dt':"" "",.r·D,to the proJ.oHZ. id6ntifi.d with a throe citqi.t l~.
What is' the nlO~t probable weapon(s) frolll which this projectile was fired (type ~ make - ""del - caliber-I? ,
2. :hltJ "IidBti,(m Nfi:l'B co th9 cartndqll aaBQ' icJgnti),ied with a thl'ss df.:tft numbel'".
'-' WhAt is the,mostprobable 'we,ipon(s) from which this cartridge ciSe was ejected (type - make - model - caliber)?
, DATA SHEET
PROfiCIENCY TESTlilG PROGIWI TEST NO. Z
11. ADUITIONAL INFORMATION ROUTINELY DEVF.LOPED
I. Projectile marked ~ith three digit number
LAB CODE A-. __ _
•• Other Data (Numbers of lands, groves, direction of twist, weight, dimensions, ca~nelUre, probable load, etc.)
b. Indi cate Methods
~ •. C4rtridge cau marked with three digit number
d. Other Data (Position of extractor, ej!ctor, form of firing pin impression, etc.)
b. Indic.te Methodl
61
- 2 -
3. Thi. qUMBtion N.f~rB to the oaJOt:.>idqB";". identifiea rJith an "!".
What is the mos,t probable weipon(s) from which this cartridge, elSe WIS ejecte4 (type, - llIo1kl' • model - calfber)?
------------------_._---, 4. ThiB qu.sti.on l'fJfsrs to the projflotilfl L)hioh haD "0 BpeaiaL "tsat" lI'W'ka.
Wh.t is the most probable weapon(s) from which this projectile was fi.red (type _ make - model - caliber)?
3. Cortridge case l1llrked wi th an "X".
a. Other Data (Position of extractor, ejector, form of firing pin impression, .t~.
b. Indiclte Methods
4. Projectile. with nospecial "test" marks
a. Other Data (Number of landS, grolles, direction of twist, weight, dimension, cannelure, probable load, etc.)
b. Indicate Methods
00 NOT SIGN THIS DATA SHEET OR IN ANY OTHER WAY IDENTIfY YOUR LABORATORY.
RETURN COpy TO; KENNETH S. FIELD fORENSIC SCIENCES fOUNDATION, INC. 11400 ~OCKVILLE PIKE, SUITE 515 ROCKVillE, MARYLAND 20a~2

The manufacturer p~epared the four firearms items for Test Sample #2 as follows:
Item' #1 CIAII and three digit lead projectile) and Item #2 (three digit marked cartridge case) were prepared by firing 200 rounds ofa .38 Special Remington (R-P)~ 158 grainlead ammunition of one lot i,n a .38 Smith and Wesson Special, ' M&P, revol ver, Sere No. C222994, frame-crane #33244, blue-steel, ~aving a five inch barrel and being'in f_ir to gbod crin~ition.
Item #3 (IIXII marked cartridge case) and Item #4 (unmarked jacketed projectile) were'prepared by firing 200 rounds of .380 auto Winchester Cw-w), 95 grain, full metal case ammunition of two lots iii a P. Beretta 9 mm Corto (.380 Auto) Mod~l, 1934, Brev~ttato auto'loading Pistol, Sere No. #686256 (Bardone V.T. 1938-XVI), being in good condition and ~it~'a fa~,r barrel.
A1thou~~. the cartridge~ and, projectiles were prepared together, the ,assumpti on shoul d not have been made i nadvance,that they came from the same weapons.
The purpose of this sample was to assess the capabilities, practices and repo~ting methods of the various laboratories in hahdling "no 'g.unll cases and the breadth, distribution and completeness of firearms rifling data and cartr'idg~ case class characteristic information:
62
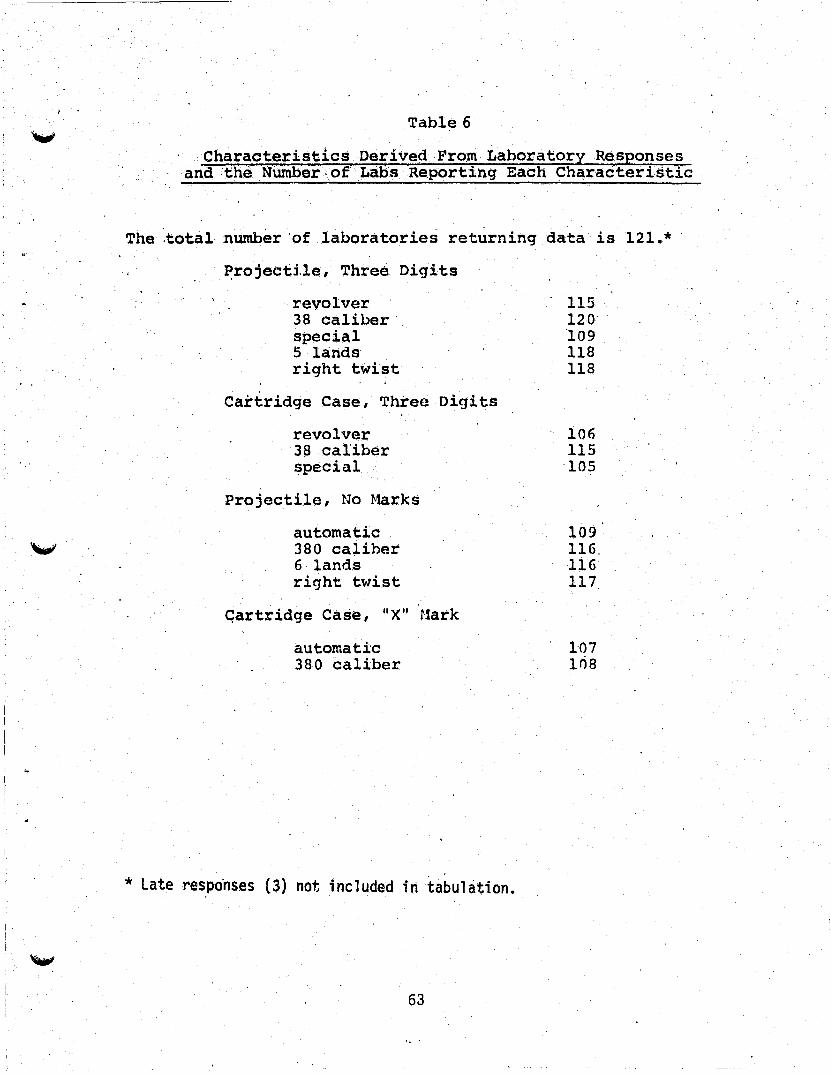
Table 6
Characteristics Derived Fro,m Laboratory Responses and ·the Nwnber -of Labs Re.porting Each Characteristic
The ,total number 'of laboratories returning data is 121.*
~rojectile, Three Digits
revolver 38 caliber special 5 lands right twist
Cartridge Case, Three Digits
revolver 38 caliber f?pecial
Projectile, No Harks
automatic 380 caliber 6 lands right twist
Gartridge Case, "X" nark
automatic 380 caliber
* late respo'nses (3) not included in tabulation.
63
" .
115 120' 109 118 118
106 115 105
109 116. 116 117
107 ln8

, "
Table 7
REVOLVERSNAMEO FOR PROJECTILE (ITEM 1)
Smith & Wesson Sturm Ruger I.N.A. (Brazilian) Harrington ,& Richardsori Iver Johnson Hopkins & Allen Meriden Fire Arms Co. Llama (Gabi1ondo y Cia Victoria-Llama) 'Bibar ,(Spanish) Forehand & "Wadsworth
, Ruby Orbea (Spanish)
'''Alamo Ranger" Alfa Century Arms (Spanish) O~strbyer (Spanish) Eastern Arms Co. Gabilondo y Cia Ga'rantaza'd() Guisasu1aBros. & Co., G.n. (~pariish) Great Western Derringer Ind. DeArms ' Nerwin-Hubert Miroku (Japanese) Rossi SEN 'Sociadad Alpha
Any ~38 SPL Caliber
64
Number of Laboratories Reporting This,Name For
Projecti Ie
III 36 16, 14 'II
7 6 5
, '4 3 3 2 2 1 1 1 1 1 1 1 1 1 1
,,1 1 1 1
8
.. ,

'~
,Table 8
REVOLVERS NAt,lED', FOR CARTRIDGE CASE· (ITEM ~)
Smith & Wesson Colt sturm Ruger I.N.A. ' (Brazilian), Rohm' " Rossi EIG Llama (Gabilondo y Cia Victoria-Llama) '1'aurus Arminus Charter Arms ' Hawes Harri'ngton & Richardson Iver Johnson 'Miro~u (Japanese) Andrew Fyrderg & Co. Astra Astra-Unceta y Cia century Arms (Spanish) Dardick
NUmber of Laboratories 'Reporting This' r-~ame For,
Cartridge
j6 14 '
8 .6 4 3 3 3 3 2 2 2 2 2 2 1 1 1
Destroyer (Spanish) Fabric DeArms Garatazades Eibar (Spanish) Foreh.i:,md & Wadsworth
'1 1 1 1 1 1 i 1 1 1 1 i ,I 1 1 1 I'
Garantazado Garate Btos. & Co., G.ll. (Spanish) J.P. Gawer G. H. Revolver (Spain) Great Western l:Ierters Hopkins & Allen By Hunter Interarms Meriden Fire A~s co. Merril. Orbea (Spanish) Remington & Sons Rl:lby , Sociadad Alpha Spesco Star 'I'AC (Spanish) Thompson-Center Arms Titan A. Uberti and Co. Dan Wesson
Any .38 SPL
" 65
1 1 1 1 1 1 1 1 1 1
80
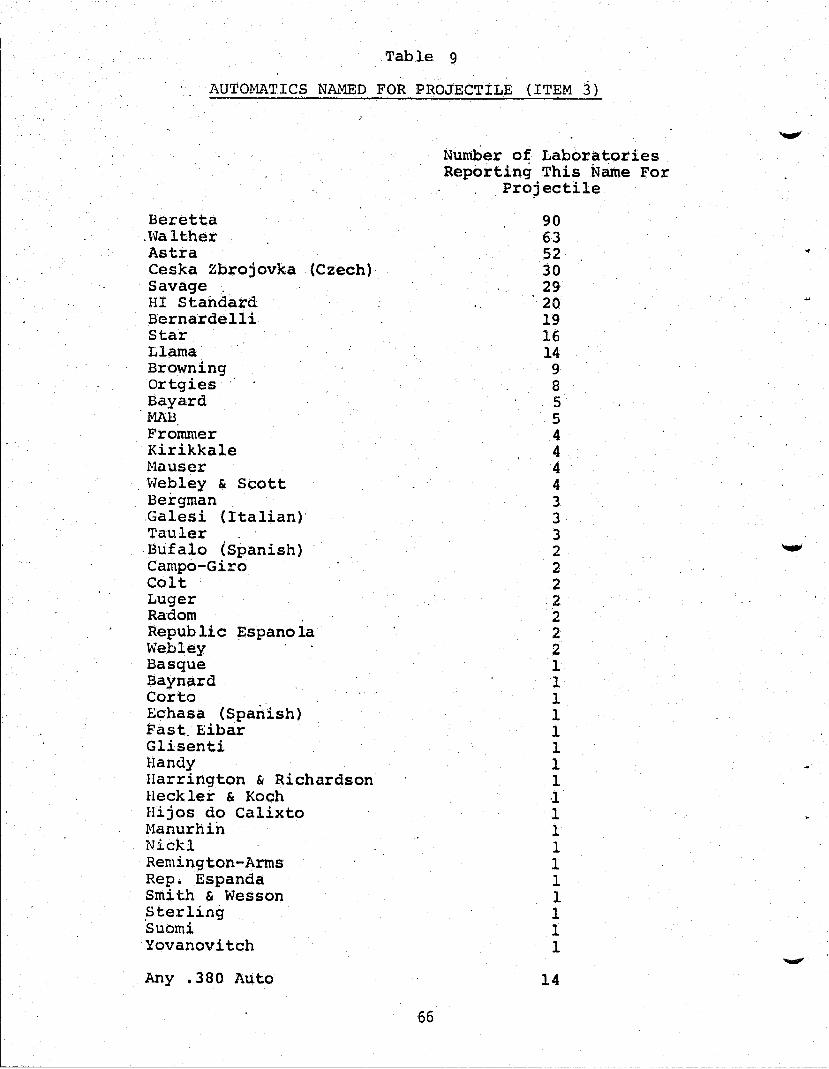
Table 9
AUTO~~TICS NAMED FOR PROJECTILE (ITEM 3)
Beretta .~valther Astra Ceska Zbrojovka (Czech) Savage . HI Standard Bernardelli Star Ll~ma Browning Ortgies . Bayard MAB. Frommer Kirikkale Mauser
. vlebley & Scott Bergman .Galesi (Italian) Tauler . Bufalo (Spanish) Campo-Giro Colt Luger Radom Repub lic f:spano la Webley Basque Baynard. Corto . Echasa (Spanish) Fast. Eihar Glisenti Handy Harrington & Richardson Heckler & Koch rIijos do Calixto Hanurhin NickI Remington-Arms Rep. Espanda Smith & Wesson Sterling 'Suomi Yovanovitch
Any .380 Auto
66
Number of Laboratories Reporting This Name For
pro~ectile
90 63 52 30 29 20 19 16 14
9 8 5 5 4 4 4 4 3 3 3 2 2 2 2 2 2 2 1 1 1 1 1 1 1 1 -1 1 1 1 1 1 1 1 1 1
14

Table 10
AUTOMATICS NAME,D FOR CARTRIDGE CASE (ITEM 4)
Beretta Astra Walther Savage Browning Llama Bernarde11i . Ces~a Zbrojovka HI Standard Remington Colt Frommer Kirikk'a1e MAD Mauser Ortgies Star Tau1er Bergman Brixia Bufa10 (Spanish) Campo-Giro D~JA Fimaru Fimaru-Fegyuer Ga1esi (Italian) 'Handy Lahti' Luger 1wlugica Radom Sauer SIG Smith & Wesson Sterling Suomi
Any .380 Auto
N~er of Labpratories , Reporting This Name For
Cartridge
67
69 18 16
8 7 ., 6 6 3 3 2 2 2 2 2 2 2 2 1 1
'I 1
,I 1 1 1 1 1 ~ 1 1 1 1 1 1 1
41

DIAMETER OF .38 SPECIAL PROJECTILE
r·1easured Diam(;'!ters of,. 38 Special Projectiles, In Inches
Number of: Labor.atories 'T(eportinq This Diameter
, 0.313 .345 .346 .349 .35 , .350 •. 351 .3.52 .353 .354 • 355
, .356 .357 .350 .359
.• 361 • 375
1\veraqe = 0.354
Standard Deviation = 0.006
Total Laboratories
1 1 1 2 3 1 1 6
12 10
8 . 10
9 3 1 1 1 .
Reporting .= 73
Tah1e 12
LAND WIDTHS OF .38 SPECIAL PROJECTILE
Measur~d,L~nd Widths of .38 Sp~cia1 projecti1~s, In Inches
0.091 .093 .094 .. 095 .09'6 .097 .098 .099 .100 ~101
.• 102 .103 .104 .105 .108 .10Q .110 .114 .115
Number of Laboratories Re'potting This t~idth
1 1 1 1 2 3 2 7
10 '5 7 8 2 2 1 1 1 1 1
Average = 0.101
Standard Deviation = 0.004
Total Laboratories' Reporting = 57
68 ... " ',.

, . V
~.
Table 13
GROOVE WIDTHS OF .38 SPECIAL PROJECTILE
Measured Groove Widtbs of .38 Special projectii~s, Ih In~h~s
o ~,100 .102 .104 ' .10"7 .108 .109 .110 .111 .112 .113 .114 .115 .116
.• 117 '.120 .121 .122
Number of Laboratories Reporting This Width
2 ,2 1 3 1 1 3 2
, ,3
3 ,4 9 3 3 1
'1 1
Average = 0.112
Standard Deviation D 0.005
Total Laboratories Reporting = 43
. Table 14 DIAMETER OF .,380 AUTOMATIC PROJECTI,LE
'Heasured Diar:tetcrs of .380 Automatic p'rojecti1es, In Inches
0.345 , .350 .351 .352 .353 .354 .355, .356 .357 .358 .359 .36{) .362 .364
Number of Laboratories Reportinq This ,Diameter
1 2 5 1 2 6
13 9
10 10
6 1 1 1
Average = 0.356 Total Laboratorie~
Standard Deviation D 0.003
Reportirig = 68
69
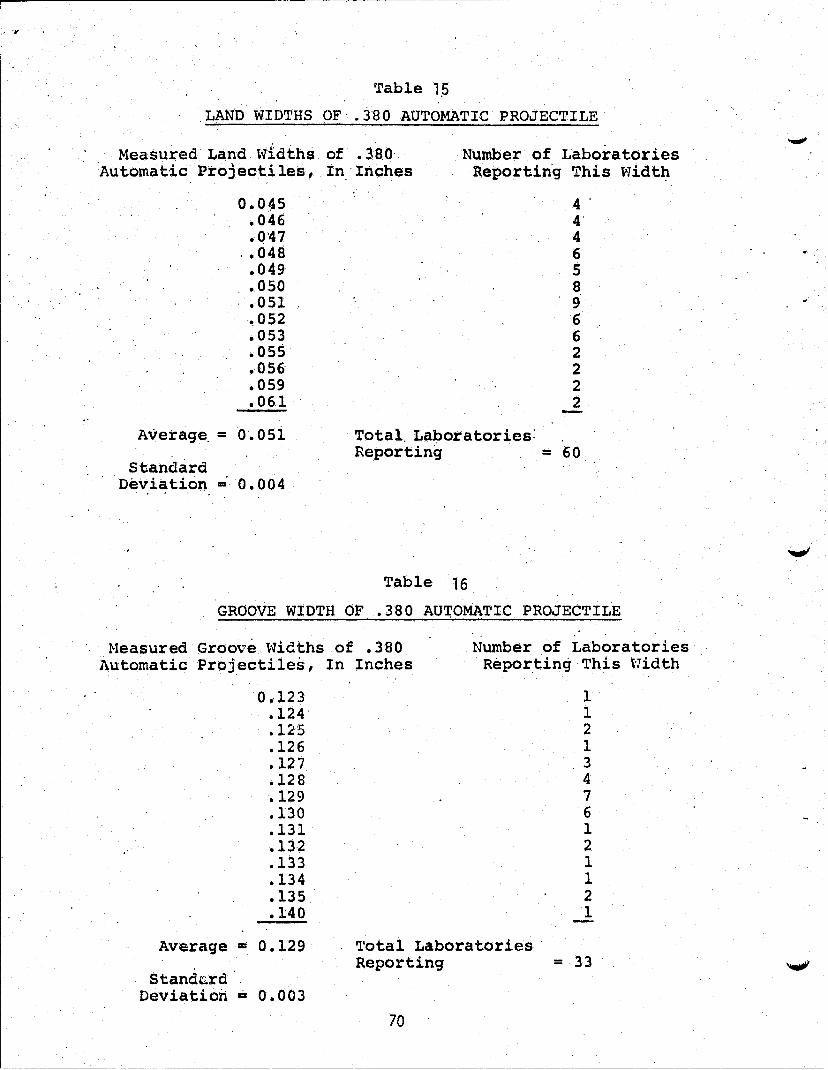
I, ...
'rable 1,5
LAND WIDTHS OF' .3'80 AUTOMATIC PROJECTILE
Measured Land \'lfdths of .38.0' Automatic Projectiles, In'Inches
Number of Laboratories Reportin'g This Width
0.045 .046 .0'47
, .048 .049 .050
- -.·051 ~052 .053 .055 .056 .059 .061
Average, = 0.051
Standard Deviation = 0.004
Total, Laboratories:
4' 4' 4 6 5 8 9' 6 6 2 2 2 2
Reporting = 60
Table 16
GROOVE WIDTH OF .380 AUTOMATIC PROJECTILE
Heasured Groove -~Udths of .380 Automatic Projectiles, In Inches
Number of Laboratories Reporting This t']idth
0.-123 .124 .125 .126 .127 .128 .129 .130 .131 .132 .133 .134 .135 .140
Average II: 0.129
Stand~rd
Deviation - 0.003
'l'otal Laboratories -
1 1 2 1 3 4 7 6 1 2 1 1 2 1
Reporting = 33
70

......., t-I
'( (
lAB CODE A-
o CHECK HERE (AND RETUP.N) IF YOU DO NOT PERFORH6LODO MAl.YSIS
DATE R!:CEIVED IN LAV. ______ ~
DATA SHEET
PROFICIENCY TESTING PROGRAM
TEST 13
HUMAN BLOOD A~ALYSIS
DATE. PROCESSED IN lAB.~ __ _
The sample is.a human blood'stdin, therefore we ask that you supply only the methodology yOu tlould use in answering questions 1 and 2. It is not necessary. to perfonn the actual tests. This applies to questions 1 and 2 only.
1. Indicate the metho!ls you I~ould nOnTIally use to ascertain' that the sampJe· is blood·.
Methodes):
2. Indicate' the me~ds you l10uld nonnally use to ascertain that the blood is from ~~cies.
RethGd(s):
.. ('
- 2 -
Examine ·according to your nonnal. laboratory procedures and complete portiones) \'Ihich comply with you~ labc.ratory pOlicy.
3. a. What is the ABO'factor? _____________ _
b. IndiCate methodes) used:
txJ ro o o rr1 X l=o
" ..... G'> c: :;0 rr1
';:5 1.0 :z
4. If your laboratory lias. the capabilities to perf 01"111 any "tiler group,ing or su;- ~ grouping procedures (such as 1'0/1, Rh, or isoenzymes, etc.) run any or all of ..... them and report your findings here. (For each grouping or subgrouping id2ntif~. please indicate the methods used. Attach atl:litional sheets if necessary.)
Group: .
f1ethod(s) :
Group:
Hethod(s~ :

The human blood.stain sampl~(Test Sample#3} 'was characterized by . the manufacturer as foll ows:
ABO factor: grolip B Rh: Po~itive, Cc'D Ee· MN: type MN EAP: , type A
AK: type 1 PGM: type 2-1
The objectives for Test Samp1e #3 were to test ~he c.apabiliti~s of the laboratories in the ABO g.rouping system under ,controlled conditions which included large sample s;,zes, clean substrate and a bloodstain in clean, uncontaminated condition.
The sample consi'sted of four, drops of a known (type B) b'lood from a s';ngle donor collected by finger 1 alice on 'clean sheeting. The sample. was air dried~
Problems encountered were obtaining sufficient quantity of sample iii this case requiring multiple finger sticks. the method of choice which was employed in subsequent blood tests was venipuncture.
. . Samples were hand carried to the project staff for packaging :and mai1ing.wfth as little ·delay as possible.' to' prevent deterioration of :.tne sample. .
72
....,.

TABLE 17
METHODS FOR DETERMINING THAT SAMPLE IS BLOOD
This table gives the number of laboratories indicating their normal use of each test method for determining that a sample is blood (Question 1). Note t~at laboratories were not requested to' actually perform this analysis. Since 'many laboratories indi'cated more than one method, the total numbe.t is greater.tha~ the total number of iaboratories·reporting.
Number of Laboratories
1
110 1
20 2
14 4
19 45
1 2 2
41 7
2
1
8
13
3
1
1
1
Test Method
A 'absorption elution
,B Color Tes ts 1. benzidine 2. benzylidine dimethylaniline 3. hematest (commercial) 4. Kastle-Hayer reagent 5. leucomalachite green 6. luminol spray (commercial) 7. ortho-tolidine 8. phenolphthalein
C Crystal Tests 1. hematoporphyrin 2. hemin crystals 3. hemochromogen 4. Takayama 5. Teichmann
D electrophoresis ..
! gel diffusion precipitin reaction
! macroscopic examination
G microscopic examination
H precipitin tests
, ! spectrophotometric method
j ultraviolet method
K Wright-Giemse method
73
I

TABLE 18
Mil:'riIODS FOR DETE~Nl;NG .THAT "~A}fi'LE IS HUMAN BLOOD
this table gives the number o.f laboratories indicating their normal use of ~ach test. "method for determining "that a sample is human blood (Question 2). Note that laboratories were not requested to actually perform this analysis. Since many labOratories.indicated more than one methQd, the total number "is greater than the total number" of iaboratod.es reporting.
Number of Laboratories
1
1
34
1
136
Test Method
A agglutination test
B an experimental technique using sens.itized" latex particles
C electrophoretic tests
b microscopic examination
E pre~ipitin tests (agar, gel, or liquid phase)
•
74
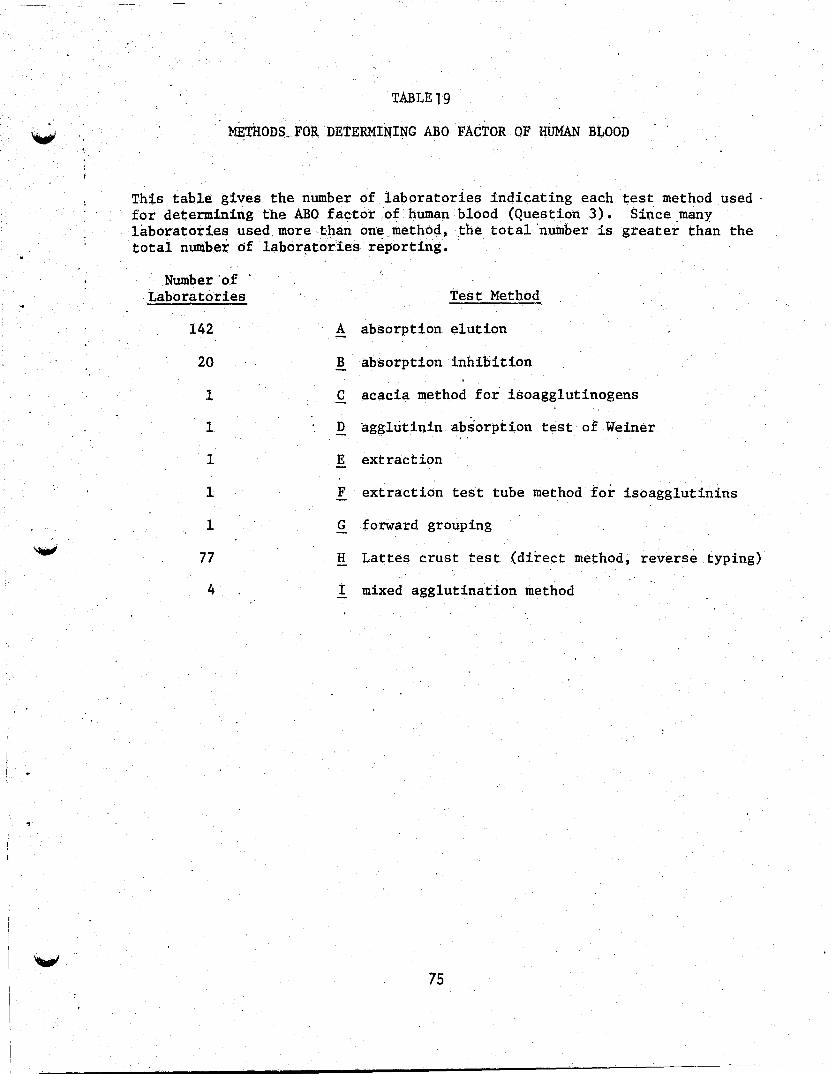
TABLE 19
METHODS" FOR DETERMINING ABO FACTOR OF HiIMAN BLOOD .. . .
This table gives the number of laboratories indicating each for determining the ABO factor of'human blood (Question 3). laboratories used more than on'e"meth6<;l, the total 'number is total number of laboratories reporting.
test method used ' Since.many
greater than the
,Number 'o,f Laboratories
142
20
1
1
1
1
1
77
4
Test Method
A absorption elution
B absorption inhibition
C acacia method for isoagg1utinogens
D agglutinin absorption test'of Weiner
E extraction
F extraction test tube method for isoagg1utinins
G forward grouping
H Lattes crust test (direct method, reverse typing)
I mixed agglutination method
75

TABLE 20
METHbDS FOR DETERMIN:diG'ADDITiONAL BLOOD SUBGROUPS
. This table gives the number of laboratories indicating each method used for the determination of additional"groups and subgroups (Q~esti.on 4). Since some laboratories' used. mpre than one method, the total number is gteat~r than the total number·of laboratories repotting such tests.
Number' of .. Laboratories
3
15
2'
4
6
2
1
24
1
20
1
23
1
1
Test Method
A electrophoresis test for 4K'
B electrophoresis test for EAP
C starch gel electrophoresis test forEsD
D electrophoresis test for Hb
E 'cellulose. acetate or membrane strip electrophoresis tfJst for Hb
F electrophoresis test for Hp
G electrophoresis test for LDH
H absorption elution test for MN
I absorption inhibition test for MN
J gel elect·rophoresis. test for PGM
K cellulose acetate or membrane. strip electrophoresis test for PGM
L absorption elution test for Rh
M absorption inhibition tes", for Rh
N Leister & Kirk test for Rheumatoid Arthritis }'actor
76

I'
•
.• ~\ .. I.~ (I . .
.~
FIGURE 10
LAII CODE A· ____ '_
·0 CIIECK HERE (AHO RETURN) IF yOU DO NOT PERFOIUI GLASS EXAMINATIoN
DATE RECEIVED IN LAB DATE PROCESSED IN UB _____ _
, ~SHEET
PaGfiCIEICY TEstiNG PROGRAM
.,
TEST 14 flt.ASS EXAMINATlOll
It. A r.prulnts a glais silopi. teten f~ tile ic_ of a,burgllry. IteM II represent. " glln • ...,1 •. ~lketI f~ tilt trausers of • 'suspect.
1. It .. A coUld hlV' _ ilrlglh .Ith It. I.
0 YES
0 NO
0 I_Ius Iv.
Z; liha't In,_tlon (quantltlttv. and qualitativ.) did yOu d~vilop tD arrlv. It YOl',' conclusion In 110. 11 . .
ll!!..!
". I •
DATA SI§ETS MIST 8E RECEIVED AY Tit[ FOUIlllATIOII OfFICE 'BY HAY 30, lil7S.
77
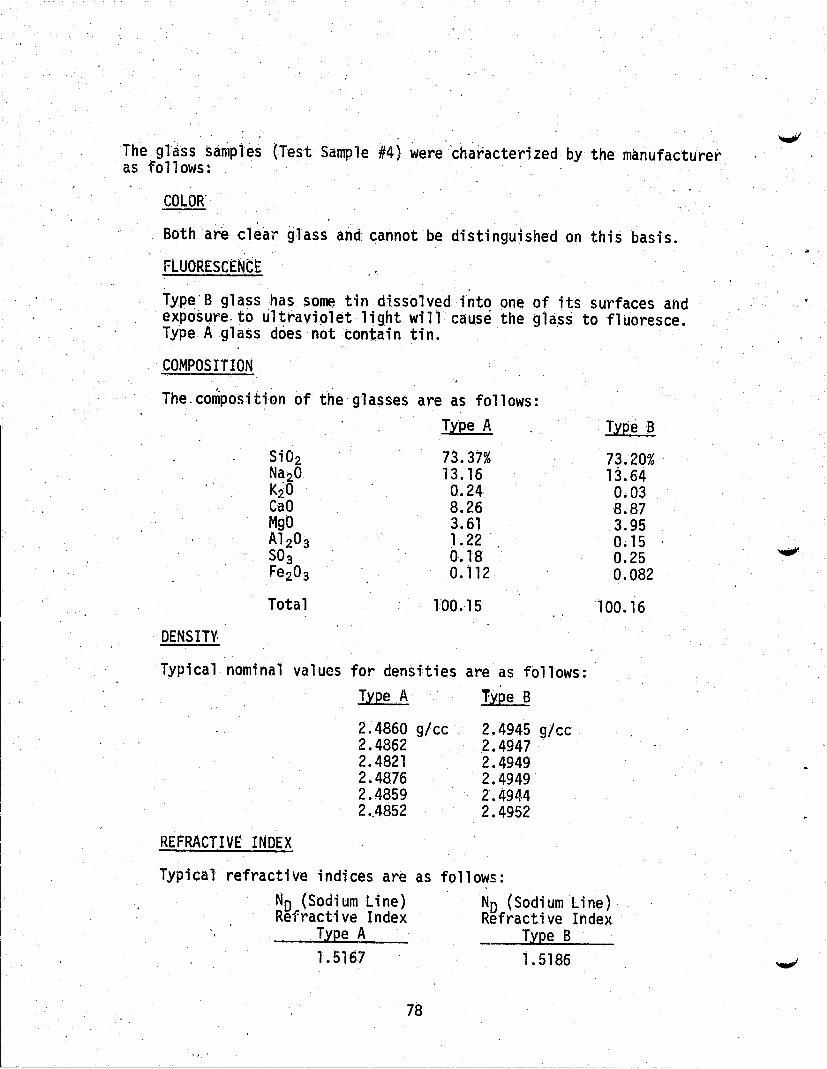
The glass samples (Test Sample #4) were characterized by the manufacturer as Tollows: .
COLOR'
Both ar~ cle~r glass and cannot be distinguished on thi~ basis.
FLUORESCtNCE
Type'B glass has some tin di.ssolved into one of its surfaces and exposure, to ultraviolet light will caus~ the gla~~ to flUoresce. Type A glass does not contain tin.
COMPOSITION
The.composition of the glasses are as follows: Type A
5i02 73.37% Na20 13.16 K~O 0.24 CaO 8.26 MgO 3.61 A1 20g J.22 SOg 0.18 Fe20g 0.112
Total lOO.,15
DENSITY.
·Typical nominal values for densities are as follows:
REFRACTIVE INDEX
Typical
Type A T-ype B
2.4860 glee 2.4862 2.4821 2.4876 2.4859 2 • .4852
2.4945 glee 2.4947 2.4949 2.4949 2.4944 2.4952
follows:
Type B
73.20% 13.64 0.03 H.87 3.95 0.15 0.25 0.082
100.16
refractive indices are as ND (Sodium Line) Refractive Index
Type A
NO (Sodium Line) Refractive Index
Type B 1. 5167 1. 5186
78
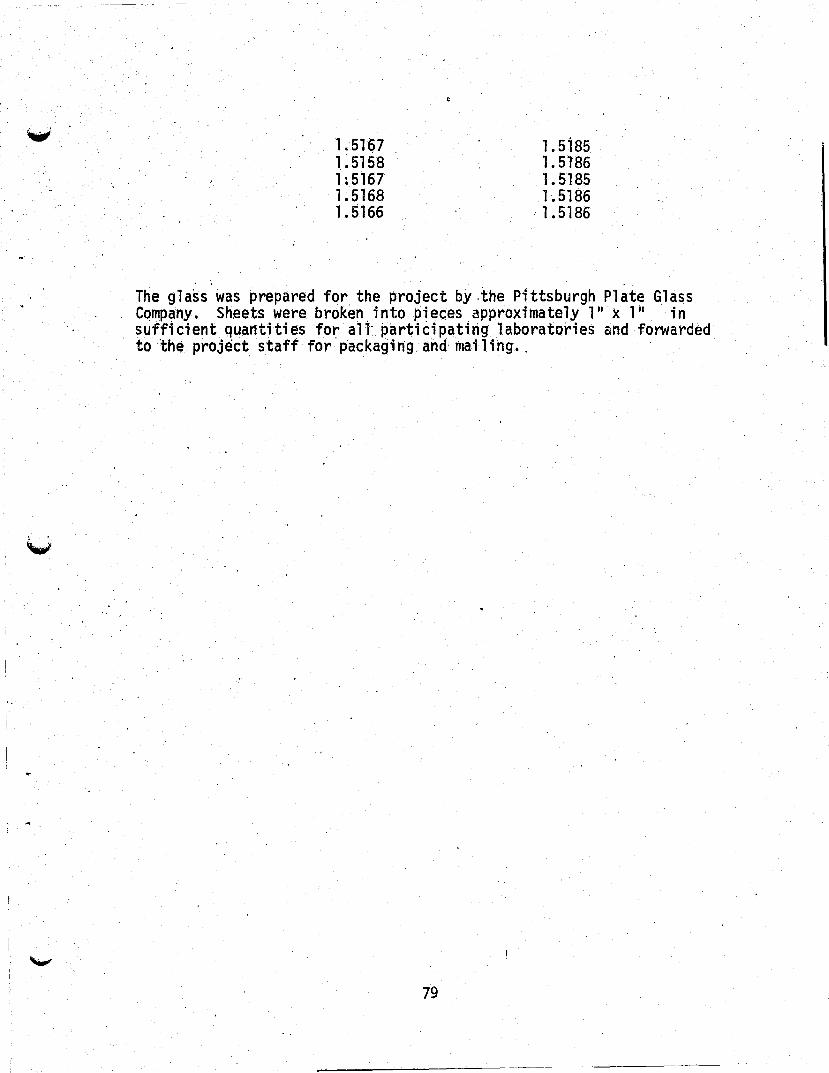
, '
~
1.5167 1 : 5158 h5167 1. 5168 1. 5166
1. 5i85 1. 5186 1. 5185 1-.5186
·1.5186
The glass was prepared for the project by.the Pittsburgh Plate Glass Company. Sheets were broken, into piec;es . approximately 111 x'" in suffi cient quanti ti es for all part; ci pating laboratories and forwarded to :the project staff for' packagi ng. and' mai 1; ng ..
79

Table 21
Refractive Index and Density Differences:
Laboratory 1 .. Ave. of 3 pieces
Laboratory 2
Laboratory 3 -RI measured at 3 A's
Sampler Supplier -Ave. of' 6' pieces'
Average of Results from .35 Labs
Standard Deviation of these 35 results
B minus A .
Differences in Refractive Index
0.00261
0.002
O.0029/0.od28/0.0031
0.00205
0.00254
.0,0007
80
Differences in Density - g/cm3
0.01575
0.006
0.01430
0.00930
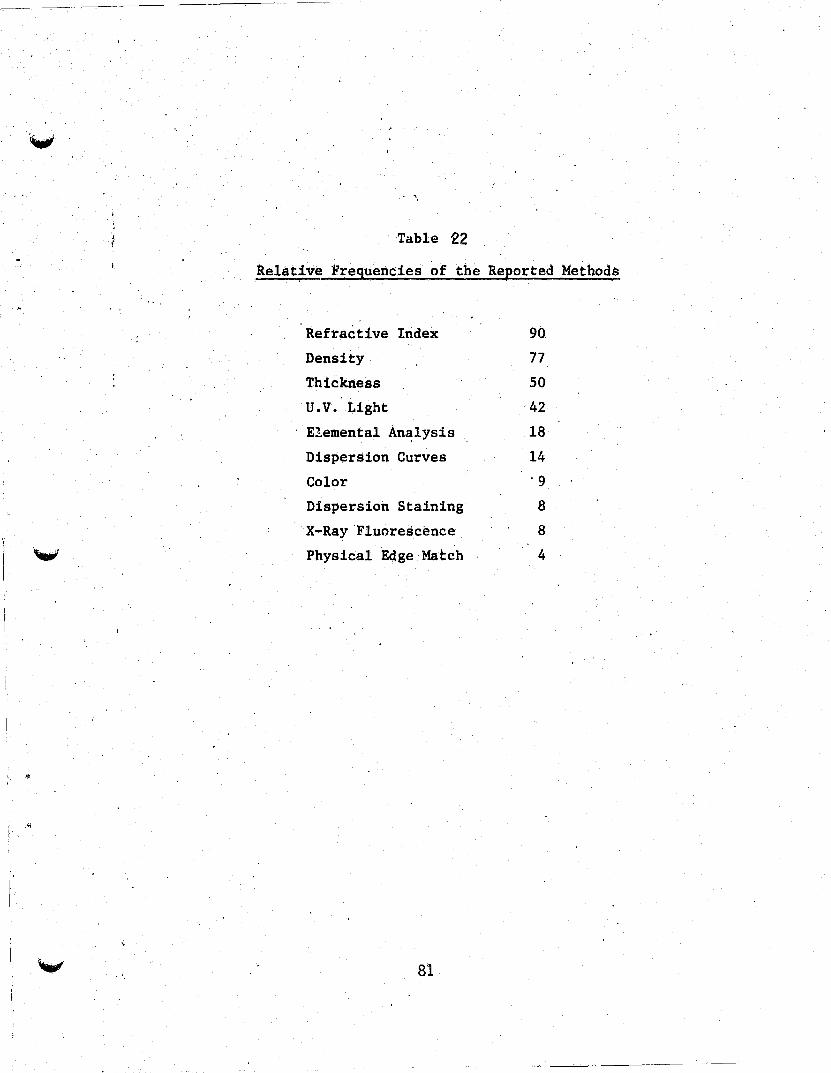
" ,
, ,
Table 22
Relative Frequencies of the Reported Methods
Refractive Index 90
Density 77
Thickness 50
u.v. Light 42
Elemental An~lysis 18
Dispersion Curves 14
Color '9
Dispersion Staining 8
X-Ray Fluorescence 8
Physical Edge Match 4
81
-------- --_ .. -
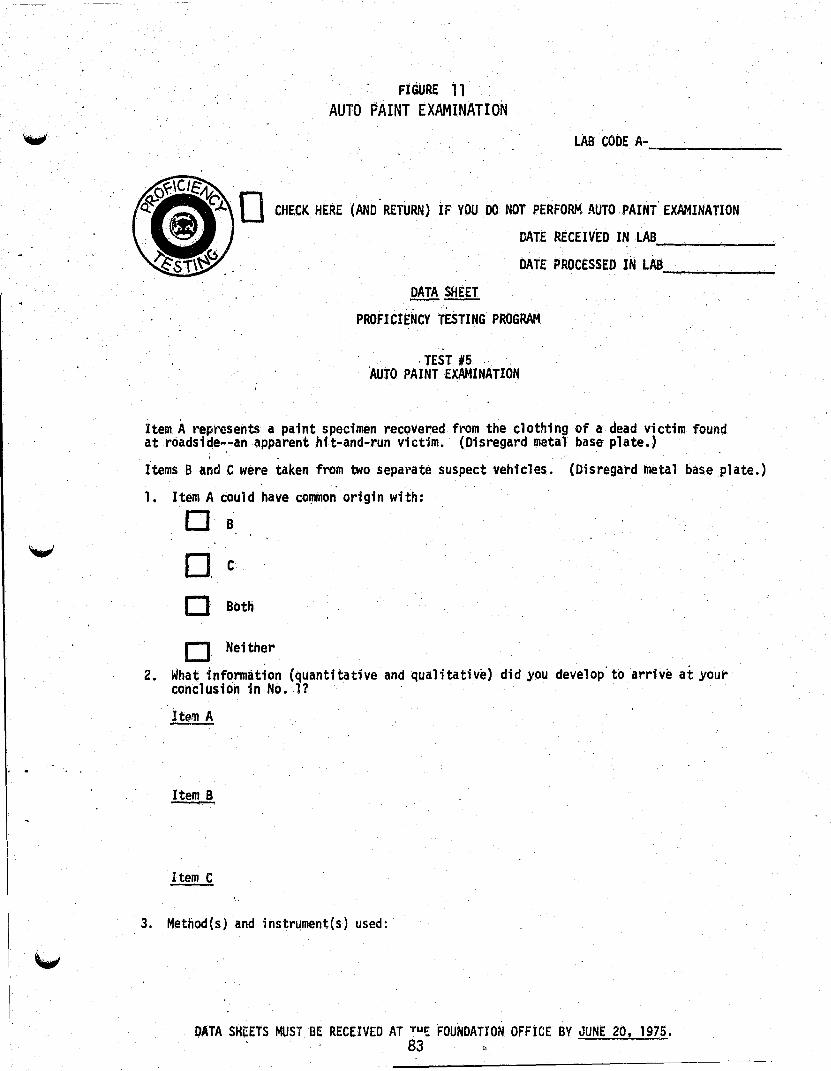
. ...
FIGuRE 11· AUTO PAINT EXAMINATION
LAB CODE A--------
CHECK HERE (AND RETURN) iF YOU DO NOT PERFORM AUTO PAINT' EXAMINATION
DATE RECEIVED IN LAB ------DATE PROCESSED IN LAB
DATA SHEET
PROFICIENCY TESTING PROGRAM
,TEST #5 'AUTO PAINT EX.AMINATION
----:----
Item A represents a paint specimen recovered from the clothing of a dead victim found at roads1qe--an apparent hit-and-run victim. (Disregard metal base plate.)
, , . ,
Items B an~ C were taken from two separate suspect vehicles. (Disregard metal base plate.)
1. Item A coul~ have co~on origin with:
DB 0, C
o Both
o Neither
2. What information (quantitative and qualitative) did you develop'to arrive at your conclusion in No. 11
Item A
Item B
Item C
3. Method(s) and instr~ment(s) used:
DATA SHeETS MU5i BE RECEIVED AT TU~ FOUNDATION OFFICE BY JUNE 20, 121i. . 83"

The auto paint samples (Test Samp·le #5) can be characterized . according to the sample manufacturer specifications as follows:
, . Samples A, B, and C are the sam~ color - American Motors Sienna Orange (G6.). All three samples have a triple .layer sequence of orange topcoat, medium gray primer and dark gray primer. Samples ,A and C are the same and were prepared using, topcoat and primer from U.S. paint suppliers. Sample B was prepared using a t.opcoat and primer suppl ied by a Canadian supplier andi-s representative of material used,at the American Motors Canad.fan plant~ There is a difference (formulation) in'. comPPS·ition.be:t;ween the topcoats of-Sample B versu.s A and ~, the'refore Item. A could have coriimon origHt only with C. "
In future tests of this type, the Project Advisory Committee,feels that it would be preferable to take actu~l scrapings of paint off a vehicle. While it is re.cognized that this would pose rather large problems in the area of quality control, the approximation of actual case type situations would:.be valuable. " The metal 'h,ase plat$ the'
',samples were actually prepared on was unrealisti.c and misieading.
84

Table 23
Relative:Frequeneies of the Reported Methods
lNbWhLIJ U;&i'~'o p'~
METHODS USED
1. r1icroscope 98
2. Solubility tests 88
3. Infrared analySis Sl
4 ~ Emission spec,troscopy 41
5. Pyrolysis gas chromatography 40 , \
6. x-ray fluorescence 22
7. Reference collec.tlon of automotive paint colors 14
8. Ultraviolet spectrophotometry 14
9. Visual 11.
10. X-ray diffraction
11. Thin 'layer chromatography
12. Density test
13. Fluorescen~ 'studies
14. Filters, wratten and dichroic
15. Pyrolysis IR
16. Photographic color derisitometer
17. Microcrystal
18. Spot plates
19. Quantitative elemental analysis
20. Reflectance spectrum
21. None listed
10
3
3
3
1
1
1
'1
1
1
1
1
··k ......
Since most laboratories indicated more than one method, the , total nuInbe,r is greater than the total number of laboratories reporting e.
85

Table 24
Ten Most Frequently' Reported Methods
Nuinber of Labs· Number of Labs co Number of Labs Reporting They Reporting Use 0\
Of This. Nethod Total ,Reporting They Could Not Number of Labs Could Distignguish Distinguish Item' Without Reporting Reporting Use Item B from A and ~, ' from, A· and C Their Findings
Method' Of This Method C By Thi s Hethod By This'Method for The ~lethod
1. Microscope 98 i9 .54 2'5.
2 .• Solubility Tests 88 41 25 22.
3. Infrared Analysis 51 2 37 12.
4. Emission Spectroscopy 41 18 14 ·9
5. Pyrolysis Gas Chromatography 40 27 1 ,12'
6. X-Ray Fluorescence 22 21 1 . 0
7. Reference Collection of Automotive Paint Colors 14 1 11 2
8. Ultraviolet Spectrophotometry 14· 1 6 7
9. Visual 11 3 6. 2
10. X-Ray Diffraction 10 1 7 2
{ ( ,t
{
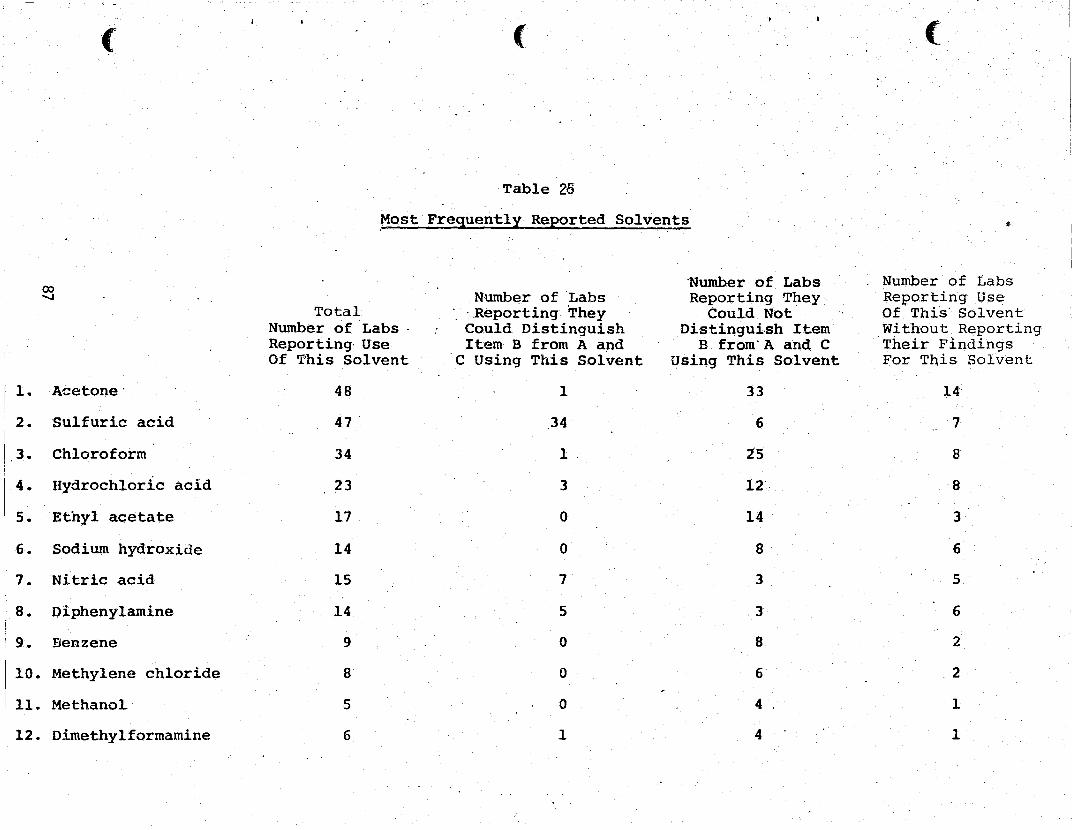
( ( ,(
Table 28
fotost Frequently Reported Solvents. ..
co 'Number of Labs Number of Labs '-I Numb~r of Labs Reporting They, Reporting Use
Total ' ,Reporting 'They Could Not Of This' Solvent Number of Labs ' Could Distinguish Distinguish Item Without Reporting Reporting' Use Item B from A and B from'A and C Their Findings Of This Solvent C Using This Solvent Using This Solvent For This Solvent
1. . Acetone , 48 1 33 14
2. Sulfuric acid 47 34 6 7
3. Chloroform 34 1 15 8
4. Hydrochloric acid 23 3 12 8
5. Ethyl acetate 17 0 14 3
6. Sodium hydroxide 14 0 8 6
7. Nitric acid 15 7 3 5
8. Diphenylamine. 14 5 .3 6
9. Benzene 9 0 8. 2
10. Methylene chloride 8 0 6 2
11. Methanol. 5 0 4 1
12. Dimethylformamine 6 1 4 1

( FIGURE 12 DRUG EXAMINATION
'LAB CODE A-----
o . CHECK HERE (AND RETURN) IF YOU DO' NOT PERFORM DRUG ANALYSIS
\ .
DATE RECEIVED IN LAB
DATE PROCESSED IN LAB
DATA SHEET
PROFICIENCY TESTING PROGRAM
TEST #6
DRUG ANALYSIS
--'----
----
1. The. enclosed sU.bstance was a street buy. The agent needs all the qualitative and' quantitative informati·on you can 'give h1m.
2. Indicate method(s) used:
89
The manufacturer has characterized test sample #6 as a blend with a nominal val~e of 31 heroin, 3% cocaine, 3% procaine and 91% lactose. Results submitted by two referee laboratories have an averag'e value of 2.7% heroin, 2.6% cocaine and 3.1% procaine.
The intent of the secona drug sample was .to provide the laboratories with a combinati on of IIhard" drugs that are commonly encountered, speci fi ca lly. hero; nand cocai ne. The dill,Jents chosen were common types, prQcai ne and 1 actose. The sUbstances ,were obtained from DEA and mixed in a small mechanica" mixer to ensure homogeneity.
The mixed sample was then forwarded to the project staff for packaging and distribution.
90
....,.
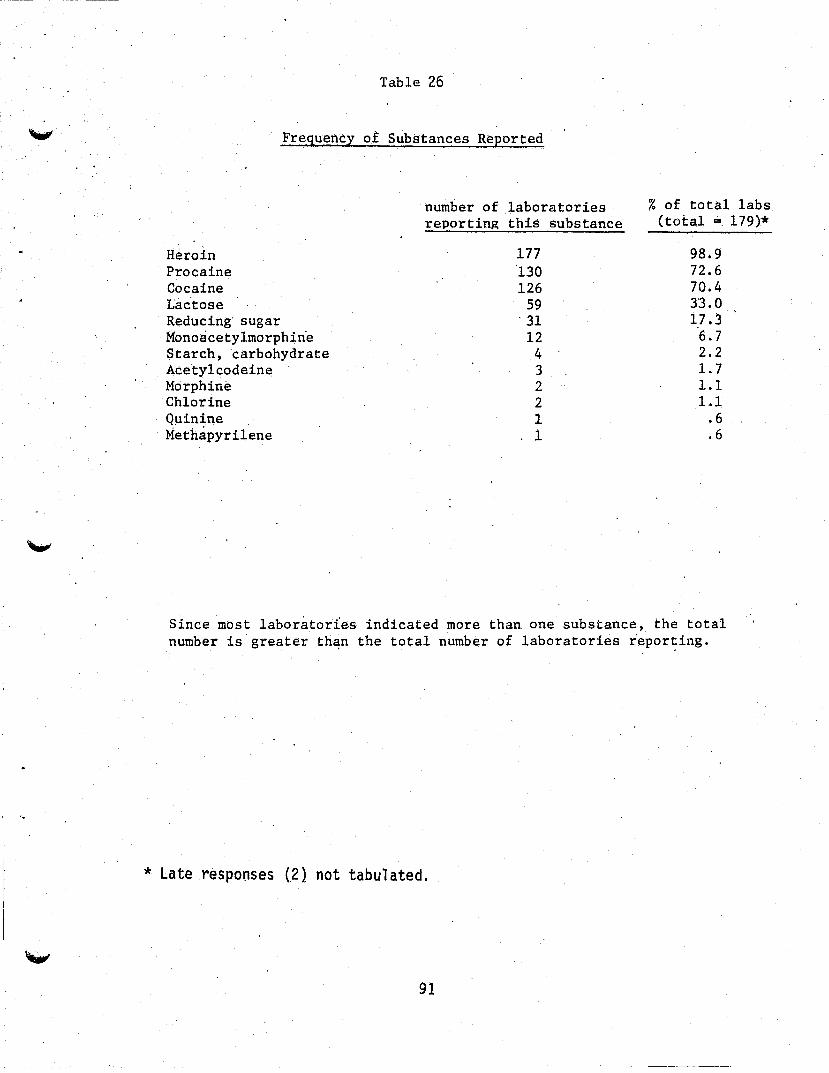
'.
Table 26
Frequency of Substances Reported
Heroin Procaine Cocaine Lac'tose Reducing' sugar Monoacetylmorphin'e Starch, carbohydrate Acetylcodeine Morphine Chlorine Q).linine Methapyrilene
number of laboratories reporting this substance
177 '130 126
59 , 31 12 .4 3 2 2 1 1
% of total labs (total .... 179)*
98.9 72.6 70.4 33.0 17.3 '6.7 2.2 1.7 1.1 1.1
.6
.6
Since most 1aboratorie.s indicated more than one substance, the total number is greater than the total number of laboratories r'eporting.
* Late responses (2) not tabulated.
91

Table 27
Frequenc.y of Methods Used in Determining Substanc.e
1. Color Tests 2. Thin Layer Chromatography 3. Gas Chromatography 4. UV Sp~ctrometry 5. Microcrystalline Tests
'6. IR Spectrometry 7. Gas Chromatography/Mass Spectrometry 8. Extraction 9. Column Chromatography
10. Melting Point Test 11. Precipitation 12. Nakamurais Procedure 13. X-ray Diffraction 14. Odor Test 15. Fluorescence Exam
number of laboratories reporting use of this method
154 120 118 118
96 66 29 26 17
6
4 3 2
16. General screen for acid and neutral drug 17. Ashing
2 2 2 1 1 1 1 1 1
18. Tollens Test . 19. Arthur and Smith test for Cl-20. X-ray fluorescence 21. ~aper Chromatography 22. Alpha-napthol test for carbohydrates
23. No methods indicated 3
% of totai labs (total·= 179)*
86.0 67.0 65.9 65.9 53.6 36.9 16.2 14.5
9.5 3.4 2.2 1.7 1.1 1.1 1.1 1.1
.6
.6
.6
.6
.6
.6
1.7
Since most laboratories iridicated more than one method, the total number is- greate! than the total number of laboratories reporting.
* Late responses (2) not tabulated.
92

Table 28
Frequency of Color Tests Used in Determining Substance number of laboratories
1. Color Tests reporting use test
154 laboratories reported using color tests. 52 (or 33.8%) did not specify which color test(s).
102 laboratories did specify color test(s) used.
of this
102 71 61 57 35 33 27 19 11
8 7 7 5 5 4 3 3 3 3 2 2 2 2 2 2 1 1 1 1" 1 1 1 1 1 1 1 1 1 1
Since most laboratories indicated more than one color test, the total number is greater than the total number of laboratories reporting.
93
% of specifying labs (total == i02)
·100.0 .69.6 59.8 55.9 34.3 32.4 26.5" 18.6 10.8
7.8 6.9 6.9 4.9 4.9 3.9 2.9 2.9 2.9
~ 2.9 2.0
J 2.0 2.0 2.0 2.0 2.0 1.0 1.0 1.0 LO 1.0 1.0 1.0 1.0 1.0 1.0 1.0 1.0 1.0 1.0

Table 29
Frequency of Microcrystalline Tests Used iIi Determining Substance
5. Microcrystalline Tests
number of laboratories reporting use of this test
% of specifying labs (total = 64)
a. Mercuric Iodide 43 b. Mercuric Chloride 13 c. Gold Chloride 13 d. Platinum Chloride 12 e. Wagt:ters ,tes i: 10 f. Gold Bromide 6 g. Sod,ium Acetate 4 h. Acetic Acid 3 L Lead Iodide 1 j ~ Potassium Ac~tate 1 k. Platinum Bromide 1 1.' Sodium Chloride 1
96 laboratories reported using microcrystalline testes). 32 (or 33.3%) did not specify which microcrystalline testes). 64 did specify which microcrystalline testes) used.
Since many laboratories reported more that: one microcrystalline test used,the tO,tal number is greater than the total number of laboratories ~eporting~
94
67.2 20.3 20.3 18.8 15.6
9.4 6.3 4.7 1.6 1.6 1.6 1.6

Table 30 Frequency of Methods Used in Determining Substance .fnr TAb"~RtnTips thAt T~entifip~ B~r"in and r""Ain p
1. Color Tests 2. Thin Layer Chromat~graphy 3. Gas Chromatography 4. UV Spectrometry ,
·5. Microcrystalline Tests 6.IR Spectrometry 7. Gas Chromatography/Mass Spectrometry 8. Extraction 9. Column Chromatography
Table 31
number of laboratories reporting use of this
method
104 93
101 82 55 46 26 22 13
Frequency of Methods Used in Determining Substance' for Laboratories That Identified Heroin Only
1. Color Tests 2. Thin Layer Chromatography 3. Gas Chromatography 4. UV Spectrometry 5. Microcrystalline Tests 6. IR Spectrometry 7. Gas Chromatography/Mass Spectrometry 8. Extraction 9. Column Chromatography
95
number of laboratories reporting use of this
method
48 27 18 35 33 18
1 3. 4
% of t,otal labs (total :: 125)
83.2 74. q. 80.8 65.6 44.0 36.8 20.8 17.6 10.4
% of total labs (total = 52)
92.3 51. 9 34.6 67.3 63.5 34.6 1.9 5.8 7.7

FIGURE 13 FIREARMS EXAMINATION LAB CODE A-
CHECK HERE (AND RETURN) IF YOU DO NOT ~ERFORM FIREARMS EXAMINATIONS
DATE RECEIVED IN LAB
DATE PROCESSED IN LAB
DATA SHEET
PROFICIENCY TESTING PROGRAM TEST NO. 7
FIREARMS EXAMINATION
-,-----
-----
Examine :accor(Hng to your normal laboratory procedures and complete portion(s) below whi ch compl i es wi th your 1 abbratory po) i cy.
SCENARIO: TWO' homicides have occurred, approximately ten days apart. At the scene of homicide #1 there were recOvered one projectile and one cartr; dge case.' 'At the scene of homi ci de #2 there were' recovered two projectiles and one cartridge case.
(All bullets ara marked with a l~tter on the base; c~rtridge cases, with a number on the side liear the open end, read wi th the open end to your ri ght.)
1. BULLET AND CARTRIDGE CASE COMPARISONS
a. Which, if any, of the thr.ee projectiles 'were fired from the same gun?
o None
D Projectilesriredfrom same gun ( Li s t 1 e t te·rs ) .
o Inconclusive , Explanation of inconclusive answer:
b. ~'Jere the tlt/O ca rtri dge cases fi red in the same gun?
DYes
D No
..... ,0 Inconclusive'
2. ADDITIONAL COMMENTS 97

The firearms samples (test sample #7). can be characterized according to the sample manufacturer as follows: .
. IICrim~ Scene 111
The copper-jacketedbulle't (marked on the base with any one of the foliowingletters assigned on the basis of random selection: A, B, C,. 0, E, F,G, H, J, K, L, 0, P, Q, R, S; T, U., V, Y) was fired from a Colt .32
.. Auto p'istol, Serial #214325. A total of 352 rounds was fired lin groups of 16.
The cartridge case (marked oh the side with anyone, of the · following numbers 'assigned on the basis of random selection: 5;,7,8) was also.fired in the Colt .32Autopistol,· Seria.l # 21432~, ment,i,?ned ·above.
, . , IICrime Scene 2"
The copper-jacketed bullet (marked on the base with any one of the fQllowing letters assigned on the basis of . random. selection: A, B, C, D, E~ 'F, G, H, J, K, L, 0,
· P, Q, R, S, T~ U, V, Y) was fired from the s~e gun and within the same group.as the bullet from "Crime Scene P; the Colt .32 Auto pistol, Serial #214325. .
The other copper-jacketed bullet (marked on the ,base with any on~ of the .following letters 'assigned on the basis of random
·s,election: I, M, N, X, Z)was fired from a second Colt .32 Auto pistol, Serial #521524. ~
· The cartridge case (markeCt on the side. with anyone of the following numbers assigred on ,the basis of random selection:, 2, 3,4).w~s alsofir'ed in. the same Colt .32 A~to pistol, Serial #521S24.
This test,was designed to measure the proficiency of laboratories in' the comparison of individual characteristics of fired bullets and cartridge cases with highly individual markings.
Bullets and cartridge cases were assembled into test samples that were made up from within the same firing batch. Sixteen to twentyfour bullets fired consecutively was a batch. In order to minimize the
'possible changes that might have occurred in the barrels over a period of time, no bullets from the first batch of firings were packaged with any bullets f.rom the last batch.
98

FIGURE 14 '
BLOOD EXAMIN~TION LAB CODE A-' ---
o CHECK HERE (AND RETURN) IF YOU' DO NOT PERFORM BLOOD MiALYS I S
DATE RECEIVED iN LAB -----DATE,PROCESSED IN LAB
DATA SHEET
PROFICIENCY TESTING PROGRAM
TEST 118 ,
BLOOD ANALYSIS
----
Please,examine samples according to your, normal laboratory procedures and complete pcrtion(s) which comply with ypur laboratory policy. the checklists are int~ndedas a convenience in filling out,thereport~ they are not iritendedtosuggest any specific test or battery of tests. Please add any additional information you coriside'r pertinent to your response.
1. Have the stains been confirmed as blood?
It!2m A Item B ,Methods Used:
~ 0 0 Yes
No 0 0 Inconclusive 0 0
[] Color test (Specify)~ ________________ ___ tJ Crystal test (Specify)...;., ____________ _ o Macroscopic o Hicr6scop'ic o Precipitin ,0 Other (Specify) ___ _
Comments: ______________ ~ __________________________________ . ___________ _
2. Have the stains been confirmed as human blood?
Yes
No
Item A
o o
Inconclusive 0
Item B
o o o
Methods Used:
o Electrophoresis o Precipitin D Other (Specify} ______________ _
~~nents: ____________________________ ~--------------~-------~----------------
~·-99 - -

3. Could Item A and Item B have originated from the same source?
DYes o No o Inconclusiv.e
4. -What information did y~lU develop to arrive at your conclusion in Question3? (Attach additional sheets 1f -necessary.) The.table is provided for your c0!lvenience. It is not intended to· suggest: any particular test or battery of tests. -
....... o o
,
Grouping Item A Item. B Methods Used: .Lj'J.Jt:: .L~t!
-, ABO .
'. , .. -AK (adenylate kinase) " .
-. . -Amylase .. , p
~, "
..
EAP (er..Ythrocyte acid phosphatase) '.'
EsD (esterase D)
Rb (hemoglobin)
I Hp (h~toltlobin)
LDR (factic dehydrogenase)
~lN . I
PG!-1 (Ehos..E.hojilucomutase)·
Rh
Rheumatoid Arthritis factor
S
Other (~ecify)
DATA SHEETS HUST BE RECEIVED IN THE FOU~'DATION OFFICE BY SEPTEMBER 5, 1975.
( ( •
-.-. , ., ;:' ... :--;
~ .. ';-) , .
-' " : ._-..... (j~
" . ,:',., -.
.(

~
...
The blbod ~a~ples (Test Samp)e #8) can b~ characterized accordihg 'to, ':'he, sample mantifactureras' foll OWS: .
lTE'r~ B ,,'allow Cloth) (B1 ue·Wh-j te Cloth)
A B
, . : (Type O) : (Type 0)
D + + C + -E ... + c I + + • 1 't
e + , + M , - + N " + -s + -+ s + + Kel1 - - -Duffy - -Kidd -- -ADA - ---1-1 1-1 AK 1 -1 1-1 G-6PD A-:A A-A Gm (a)
,. + +
Gm (x) - + Gm (fl ) Gm (b ) Inv 1
+ + ---.,,-'-+ +
"'-<'-'-- + EAP AB AA ._-----PGN 2-1 2-1 H E~D
2-1 1 '- 1 --1-1 1-1
Gc 2-1 2-1 Amylase2. 13
-A
101
· . The blood was drawn by ve.nipuncture with a sterile syringe and then immediately dropped from the syringe needle on.to cloth spread over a polyethylene sheet. After drying for 24 hours at room temperature, 'the cloth was cut into ihdividuA'l squares and mailed the .same day to the Forensic Sciences Foundation. Plastic gloves were worn when the cloth.was cut up to avoid conta~inatton .. As th~ cloth was cut up~ it was visually checked to ensure that the stain was dry.
The following problems aroSe during the preparation of the sample. The cloth used was new cotton and was washed twice without detergent before the blood was applied to it. It was not washed with detergent becaLse.detergent is known to tnhibit agglutination of red b100d tells . .In retrospect, thi s was a mi stake. The cloth had appare.mtly been subjected to some type of fabric treatment which rendered tWe surface somewhat hydrophobic, causing the ~rops Of blood to ball up on the surface. The stains did not~ therefore) spread o~t as much as anticipated. If this e><peril1l!ntwere attemptt!d in the future, it would ·be· more appropriate to wash the. fabric severa·l times with detergent before rinsing sever~l times with bOiiing·water. - .
5i nce thi s s.ampl e was prepared and di stri buted dU}'i ng the summer months, .the posSibility of sample deterioration.{due to heat) which is out of the control of the manufacturer must be considered. As stated in the Methods chapter,. the sample was prepared under controllled conditions, but no control could bp. exerci,sed over the samples after they were out of .. the Foundation Offi.ce. Future bloo.d samples would probably fare better i ~ p.repared in other .than summer months.
102
L __________ _

Table 32
Frequencies of Reporteq'ColorTests for Question 1
Que~tion 1: Have the stains been cOrifirmed as blood?
Instruments or Number of ·%of reporting labs
a. b.
c.
d. e.
f. g.
h.
i.
a.
b.
Methdd.s U$ed Laboratories (total = 115) .
Benzidine 83
Phenolphthalin (Kastle-Merer 33 reagent Ortho-tolidine 15
Hematest (commercial) 14
Leucomalachite green 5
Spectrophotometer 1 Luminol spray (commercial) 1
Benzylidine ·Dimethylaniline 1
Misc'ellaneous 1
. Table 33 '.
Relative Frequencies of Reported C~ystal
Tests for Question 1
72.2
28.7 13 ~;o
12.2
4.3
."9
.9
. 9
.9
Instruments or NUmber. of % of reporting Methods Used Laboratories (total =
Takayama 41 95.3
Teichmann 6 14.0
Since many laboratories indicated use of more than one method, the' total number is greater than the total number of laboratories r~por~ing.
103
43) labs

Table 34
Frequencies of the 'Reported Methods for Question 1
..
QUA:3stion 1: Have the stains' beien confi rmed as blood?
1.
2. 3.
4. 5.
6. 7. 8.
9.
.10.
Instruments or Number of % of total labs Methods Used Laboratories (total=128 )*
Color tests +15 89.8
Crystal tests 43 33.6
Macroscopic 23 18.0
Precipitin 19 14.8
Microscopic 17 13.3
ElectrophoresiS 2 1.6
Gel diffusion 2 1.6
Suds when. wet 1 .8
Hematoporphyrin FluoreScence 1 .8
. Spectrophotometric Method 1 . 8
Since most laboratories indicated use of more than one method, the. total~urnber is greater than the total number of laboratories reporting.
I'
* Late responses (~) not tabulated.
104.
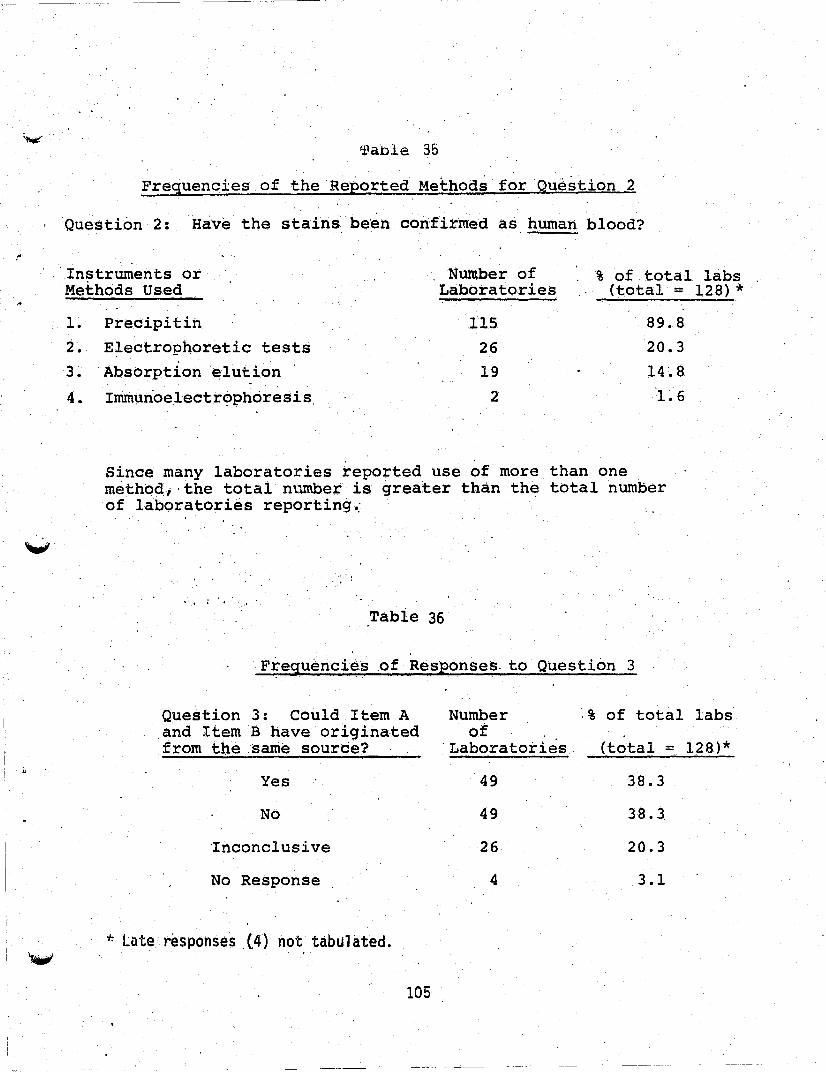
Wable 35
Frequencies of the 'Reported Methods for Que~tion 2
Question 2: Have the stains been confirmed as human blood?
'Instruments or Nwnber of % of total labs Methods Used Laboratories (total =
l.
2.
3~
4.
Precipitin 115 89.8
E~ectrophoretic tests 26 20.3
Absorption elution 19 14.8
Imm~n·oelectrophoresis. 2 1.6
Since many laboratories reported use of more than one method;·the totalnurnber is greater than the total numBer of laboratori.s reporting~
• ~ I :
Tabie 36
Frequemcies of Responses. to Question 3
Question 3: Could Item A Number .% of total and It.em B have origina·ted of from tbe same source? . Laboratories. (t.otal =
Yes 49 38.3
No 49 38.3.
Inconclusive 26 20.3
No Response 4 3.1
+. Lnte responses .(4) not tabulated.
105
128) *
labs
128)*

Table '37
Number bf Grouping Methods Used for Each Response t.o Question :3
.Response to Number of Methods Used Question 3 1 2 3. 4 5 6 ·7 8
NO 6 9 14 10 4 3 1 1
Yes 35 7 2 4 0 1 0 0
INCONCLUSIVE 18 3 1 2 0 () O· 0
Table 38
Frequencies of Use of Grouping. Methods for Question 3
GrouEing Method Used ResEonse to Question 3
NO YES INCONCLUSIVE
ABO 46 49 24
EAP :, 28 3 2
PGM 23 6 2
MN 24 5 1
Rh' 13 6 1 .' Hb 7 3 ,3
EsD 5 2 1
AK 6 1 0
106

. ,
. I
Table 39
Freque~cies of GroupJ..ng Tests' Reported 'for Question 4
Number o,f % of total labs . Grou12ing Laboratories (total =- 128)*
ABO .... ' 123 9,6.1
EAP 33 25.8 PGM 33 25.8 MN 30 23.4
Rh 20 15.6
Hb 15 11.7 EsD 8 6.3
AK 7 5.5
Hp 2 1.6
LOH 1 .8 Rheumatoid Arthritis Fact,or 1 .8 S 1 .8
6-GPD. 1 .8 PCE2 1 .8
Misce1~aneo\i's 3 2.3
Since most laboratories indicated use of more than one grouping, the total number is greater than the total number,of·laboratories reporting.
* Late responses (4) not tabulated.
107
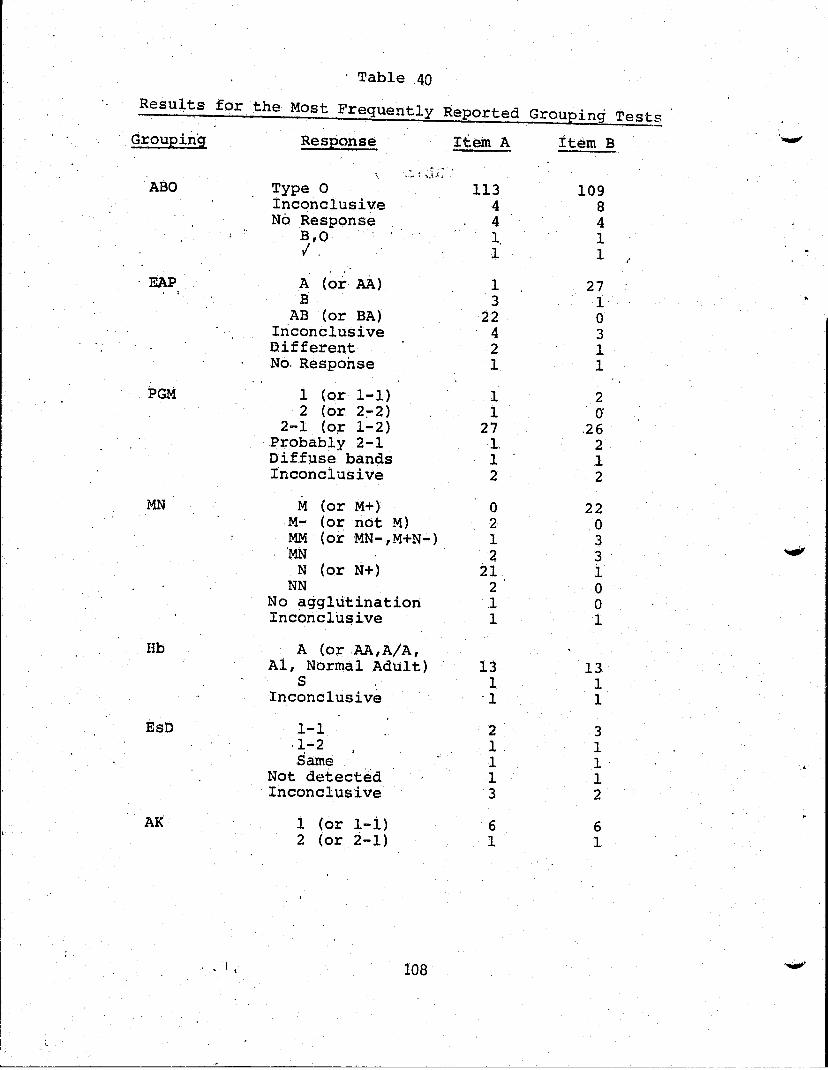
. Table 40
Resu~ts for the Most Frequently Reported GrouEin~ Tests Grouping Response Item A Item B '.....,
, '.:. ! ... .\~,
ABO Type 0 113 109 Inconc1usiv:e . . 4 8 No 4 Respons.e 4
B,O 1 1 I. 1 1
. EAP A (or AA) 1 27 I
B· 3 1 AB (or BA) 22 0
Inconclusive 4 3 D.ifferent 2 1 No. Response 1 1
. PGM 1 (or 1-1) 1 2 2 (or 2:,",2) 1 a
2-1 (o;r 1-2) 27 .26 Probably 2-1 1. 2 Dif£).lse bands 1 1 Inconclusive 2 2
MN M (or M+) 0 22 M- (or not M) 2 0 MM (or MN-,M+N':') 1 3 'MN 2 3
...., N (or N+) 21 1
NN 2 0 No agg1titination .1 0 Incc>Iic1uf?i ve 1 1
lIb A (orAA,A/A, A1, Normal Adult) 13 13
S 1 1 Inconclusive '1 1
BsD 1-1 2 3 ·1-2 1 1 Same 1 1·
Not detected 1 1 Inconclusive 3 2
AK 1 (or 1-i) 6 6 2 (or i-1) 1 1
, , I I 108
L--_~~ ______ ---..!..-____ --,-__________ ~ ____________ _

FIGl'JRE 15 GLASS EXAMINATION LAB CODE A - ---:-------
o C~E'CK HERE (AND RETURN) IF YOU DO NOT PERFORM GLASS EXAMINATION
DATE RECEIVED IN LAB DAT'E PROCESSED iN LAB-' ---
DATA SHEET . PROFICIENCY TESlING PROGRA~
TEST #9 GLASS EXAMINATION
Item A and 8 represent glasssample~re~ved.from tnec10thirtg of b'lo hit and run victims found in different 10catio~s. Item C represents glass removed from a suspect vehi c1e. ' .
1. Could. Item A,ilndB have common origin with Item C1
Item A f Item B
Yes D 0 No D 0 Incone1 us i ve 0 0
2., What information (.qualitativeandquantitative) did you develop to arrive' ·at . your .. conclusion,s .in, Question 11 (Please check. all appropriate 'boxes and provide .values where applicable.) ,
Item Item ItElm A B C
a. Color
b. Density
c. Dispersion Curves
d. Elemental Analysis
e. Physical Match
f. Refractive Index
g. Thi C1cness
~ h. U. V. Light,
i. X-ray Fluorescence
j. Other (Speci fy)
109

.' "
: .. .'tf .... ~..
. . 3. Plea$e specify the methods and/or instructions which were used. for those
methods.checked in Q.uestion 2: -{Example: Refractive Index using .Cargille . liquids, ·hot· stage; Densi.ty gr~dient. tUbes with mixture of t:iromobenze'le . and bromoform, etc. Attach additional sheets if necessary.}
Method:·
..
Method:
Method:
Nethod:
,J
DATA SHEETS ~1UST BE RECEI VEO AT THE FOUNDATION .. '" . OFF! CE BY OCTOBE'R 6 ~ 1975
110 , . '.' ' ..
. . . '.
',-, '
.The glass samples (test sample #9) were all prepared from a single headlight lens (Corning) with a refractive index of 1.47777. When pieces from different 'locations on the ,lens ,were measured, the r,efractive index differed by no more than 4 in the 5th decimal place. Therefore, samples A, B, and Care the same.
. . The unlikelihood of breaking a single headlight lens into a sufficient number of pieces for distribution to all participants caused the manu-
, facturer to saw the lens. This created some problems as far as realism 'was concerned, however~it did-ensure that all the laboratorie~ received equal quantities to analyze.
Samples were mixed following cutting to randomize the distribution and minimi'ze -the possibility of adjacent pi-eces being sent to anyone-1 aboratory.
111

Table 41
Frequency of the 'Reported' Methods Used to Answer Question 2
Question 2: What information did'you develop to arrive at your 'conclusions in Question I?
Method
Color U.V. Light
, Density Refractive Index Thickness Physical Match Elemental Analysis Dispersion Curves X-Ray Fluorescence Microscopic Examination Differential I.R. Emission Spectro"scopy Visual Inspection Polarized Light Dispersion Staining SEM/EDX Opacity'
Number of Laboratories Reporting Use of
This Method
95 95 92 91 60 53 44 37 16
Isotropic & Conchoidal Fracture Scratch'
4 2 2 2 2 1 1 1 1 1 1 1 1
DTA Trace Hardness
112
% of Total Lab. , (Total = i12)
'84.8 84.8 92.1 81.3 53.6 47.3 39.3 33.0, 14.3
3.6 1.8 1.8 1.8 1.8 0.9 0.9 0.9
'0 .. 9 0.9 0.9 0.9 0.9
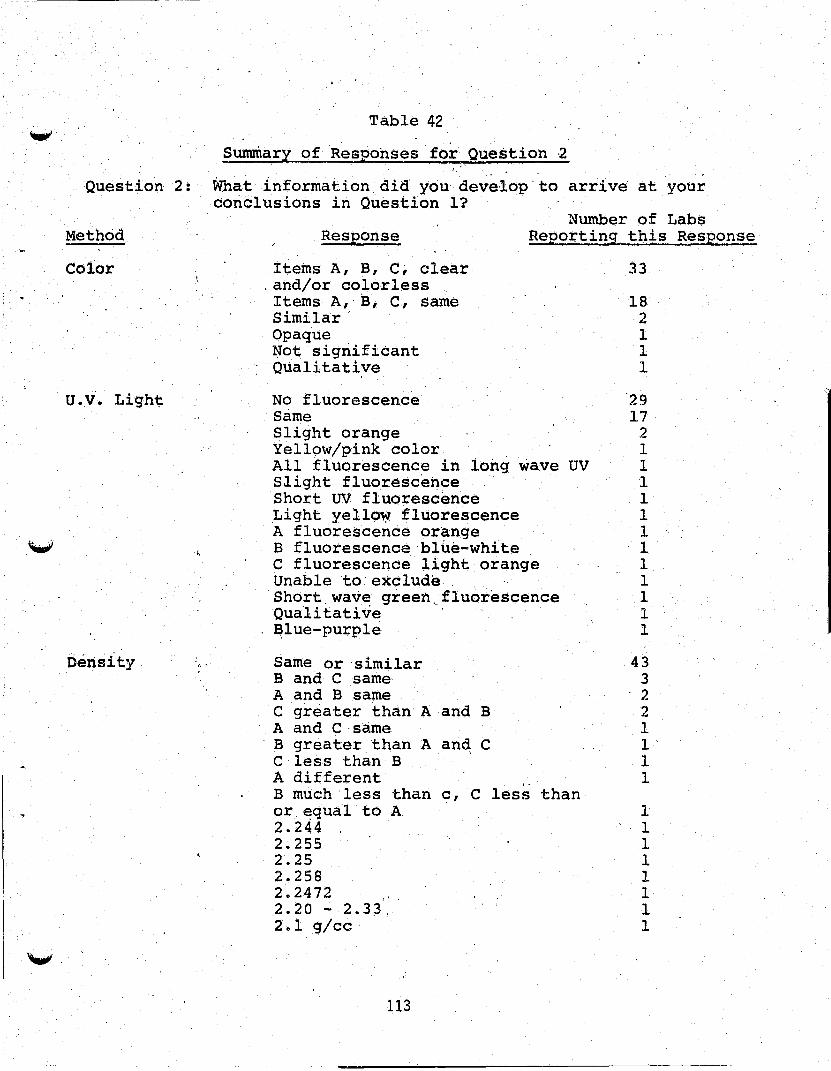
Table 42
Sumniary of Responses for Question -2
Question 2:' What information did you develop'to arrive at your conclusions in Question I? .
Method
Color
U .v'. Light.
Density , '
Response Number of Labs
Repo~ting this Response
Items A, B, C; clear . ,and/or colorless
Items A, B, C,' same Similar' Opaque ~ot significant Qualitative
No fluorescence Same Slight orange Yellow/pink color , All fluorescence in long wave UV Slight fluor~sc~nce Short UV fluorescence Light yellow. fluorescence A fluorescence orange B fluorescence 'blue-white C fluorescence light orange Unable to'exclud~ Short~wa~e green~fluor~scence Qualitative ' Blue-purple
Same or 'sim.:i,.lar B and C same A and B same C greater than' A and B A and C'same B greater, than A and C C less than B A different B much 'less than c, C less than or ~qual to A 2.244 2.255 2.25 2.258 2.2472
" 2.20 - 2.3;3, 2.1 g/cc'
113
33
18 2 1 1 1
'29 17
2 1 I 1 1 1 I 1 I 1 1 1 1
43 3 2 2 1 1 I 1
1 1 1 I 1 1 1 1
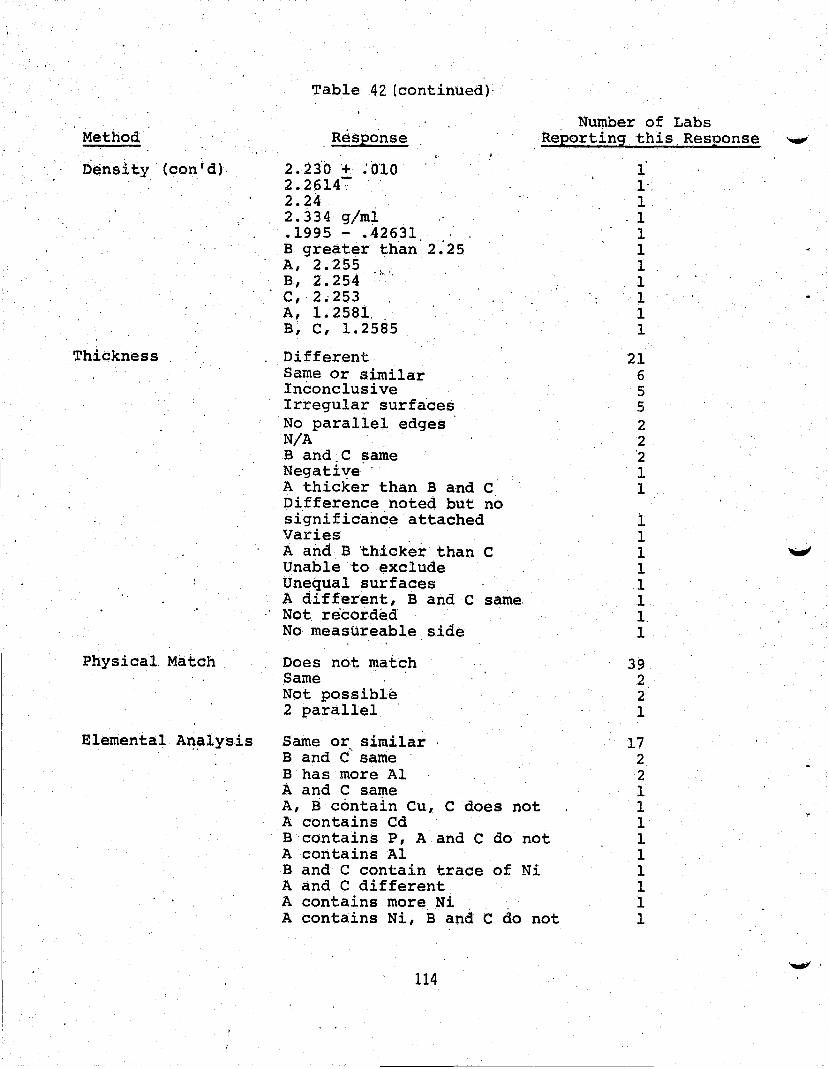
Method
Density (con'd)
Thickness
Physical Match
Elemental An~lysis
Table 42 (continued)
Number of Labs Respcinse Reporting this Response ~
2.23'0 + :C)lO 2.2614':" 2.24 2.334 glm1 .1995 - .42631 B greater than 2~25 A, 2.255 ' B, 2.254 ':". C, 2.253 A, 1.2581. ,. B~ C, 1.2585
Different Same or similar Inconclusive Irregular surfa'ces No parallel edges N/A B and,C ~ame Negative' A thicker than B a'nd C' Difference noted but no si'gnificance attached Varies A and B 'thicker than C Unable to exclude Unequal surfaces A different, Band C same. Not, recorded No measureable side
Does not match Same . Not possible 2 parallel .
Same or similar B and C" sarrie B has more Al A and C same A, B c6ntain Cu, C does not A contains Cd Bcontains P, A and C do not A contains Al Band C contain trace of Ni A and C different A contains more, Ni . A contains Ni, Band C do not
114
1 1', 1 1 1 1 1 1
·1 1 1
21 6 5 5 2 2 '2 1 1
i 1 1 "WI 1 1 1 1. 1
39 2 2 1
17 2 2 1 1 1 1 1 1 1 1 1
......, .
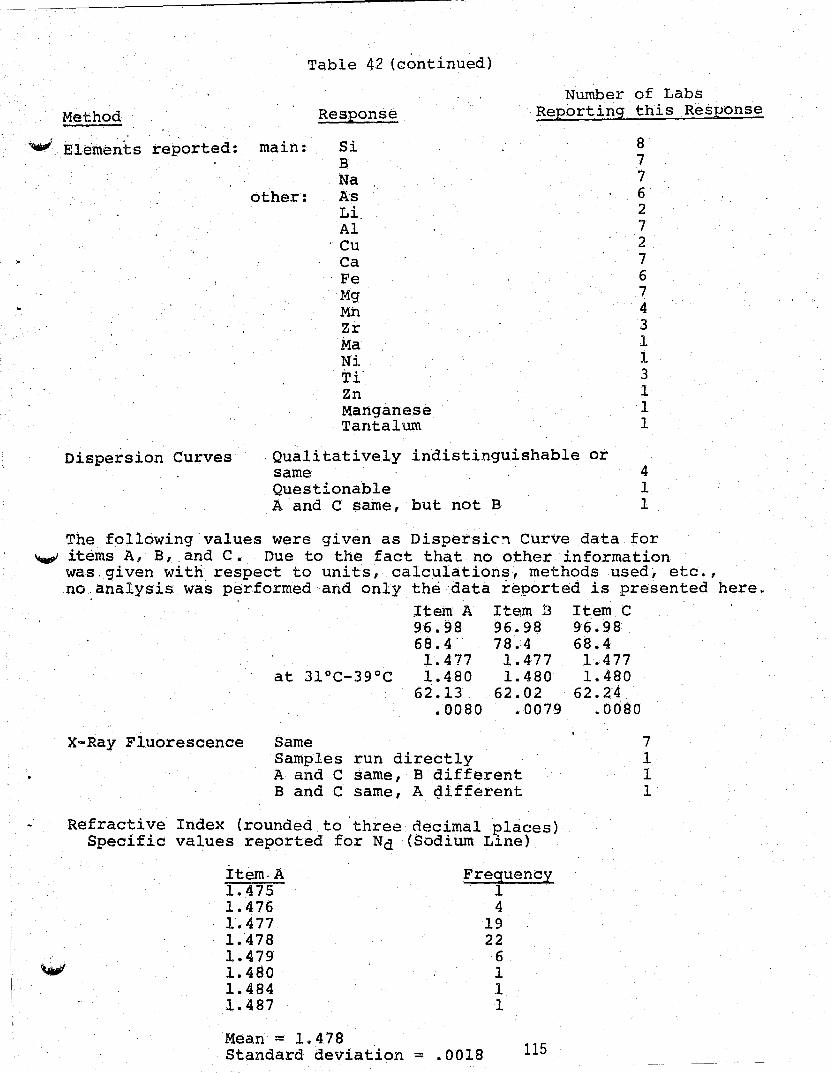
·~-----------------------------~
Table 42 (continued)
Method Response Number of Labs
Reporting this Response
~ Elements reported: main: Si B Na
other: As Li Al
, Cu
Dispersion Curves
Ca Fe Mg Mn Zr Ma Ni Ti' Zn Manganese Tantalum
Qualitatively indistinguishable or same Questionable A and C same, but not B
8 7 7 6 2 7 2 7 6 7
·4 3 1 1 3 1 1 1
4 1 1
The following values were given as Dispersic~ Curve data for ~ items A, B,. and C. Due to the fact that no other information
was, given with respect to units, calculations, methods used, etc., no:analysis was p~rform~dand onlyth~data ~eported is presented here.
ltem A Item B Item C 96.98 96.98 96.98 68.4' 78.4 68.4 1.477 1.477 1.477
at 31°C-39°C 1.480 1.480 1.480 62.13 62.02 62.2·4
.0080 .0079 .0080
X-Ray Fluorescence Same Samples run directly A and C same, B different Band C same, A gifferent
Refractive Index (rounded to 'th~ee decimal places) Specific values reported for Nd (Sodium Line)
Item,A 1.475 1.476 1.477 1.478 1.479 1.480 1.484 1.487
Frequency . 1
4 19 22
6 1 1 1
Mean = 1.478 Standard deviation = .0018 115
7 1 1 1

Tab1e42 (continued)
Refra·cti.ve ,Index (continued)
Item B
~.475 1.476 1.477 1.478 1.479 1.480 1:~484
'1.487
Mean = 1.478 Standa~d de~iation = Item C
1.474 1.476 1.477 1.478 1.479 1.480 1.484 1 •. 487
Mean = 1.478
Frequency
1
.0018
4 18 21
8 1 1 1
'Frequency
'1 4
16 23
8 1 1 1
Standard deviation = .0018
'..".,
Other respons.es (statistical outliers· excluded from above calculations) report~~:
Item A Item B Item C
1.655 1.655 1.571 1.571
57.7 57.7 Other qualitative responses reported:
Same Different Comparative basis only Very close Specific re~ractive index
not determined
l16
1.655 1.571
57.7
7 2 2 1
1

1.,
FIGURE 16 LAB CODE A '-------PAINT EXAMINATION o CHECK HERE (AND RETURN') IF YOU DO NOT PERFORM PAINT EXAMINATION'
DATE RECEIVED IN LAB ---DATE PROCESSED IN LAB --
DATA SHEET , PROFICiENCY TESTING PROGRAM
TEST #lOA PAINT EXAMINATION
'Item B represents a paint sal'i1ple removed from 'the door jamb of a burglarized building. Items A and C represent samples found on the clothing of two different suspects.
touldItems'A or C have common origin with B1
ITEM A iTEM C
YES 0 0 NO 0 0 INCONCLUSIVE 0 0
2. What information (qualitative and quantitative) did you develop to arrive at your conclusions in Question 11 Please check all appropriate boxes and provide values where applicable.
In the left hand column indicate ,the sequence (1 .?,3 etc.) in which the tests \o/ere run. Indit. ..• e , with an asterisk ('II') the point \'1here a conclusion was reached, even though subsequent tests
were perfonned for confi rniatory purposes.
Sequence of Testing
DErlSITY STUDIES
EtnSSION SPECTROSCOPY (Specify Elements Identified)
FLUORESCENT STUDIES' . ' INFRARED ANALYSIS
MACROSCOPIC EXAMINATION
MICROSCOPIC EXAMINATION
PYROLYSIS G-C
SOLUBILITY TESTS (Specify Solvents Used)
THIrl LAYER CHROMATOGRAPHY
UV SPECTROPHOTOMETRY
X-RAY DIFFRACTION
X-RAY FLUORESCENCE (Count Ratio)
OTHER {SPEC I FY} .
ITEM A ITEN B , ITEH C
117

,
3. Please specify the information developed with each of the. methods and ins.truments. checked in Question 2. (Example: Solubility tests uSi'ng HC1, 'H2~OL'" Aceto~~ 'and .HN03). Pl~ase. prov; de speci fi c and compl~teresponses • Attach . add1 ti on'alsheets if nece~sary.
Nethod:
Method:'
MetHod:
4. Additional Comments:
DATA SHEETS NUST BE RECEIVED AT THE FOUNDATION OFFICE BY NOVEMBER 26, 1975
118
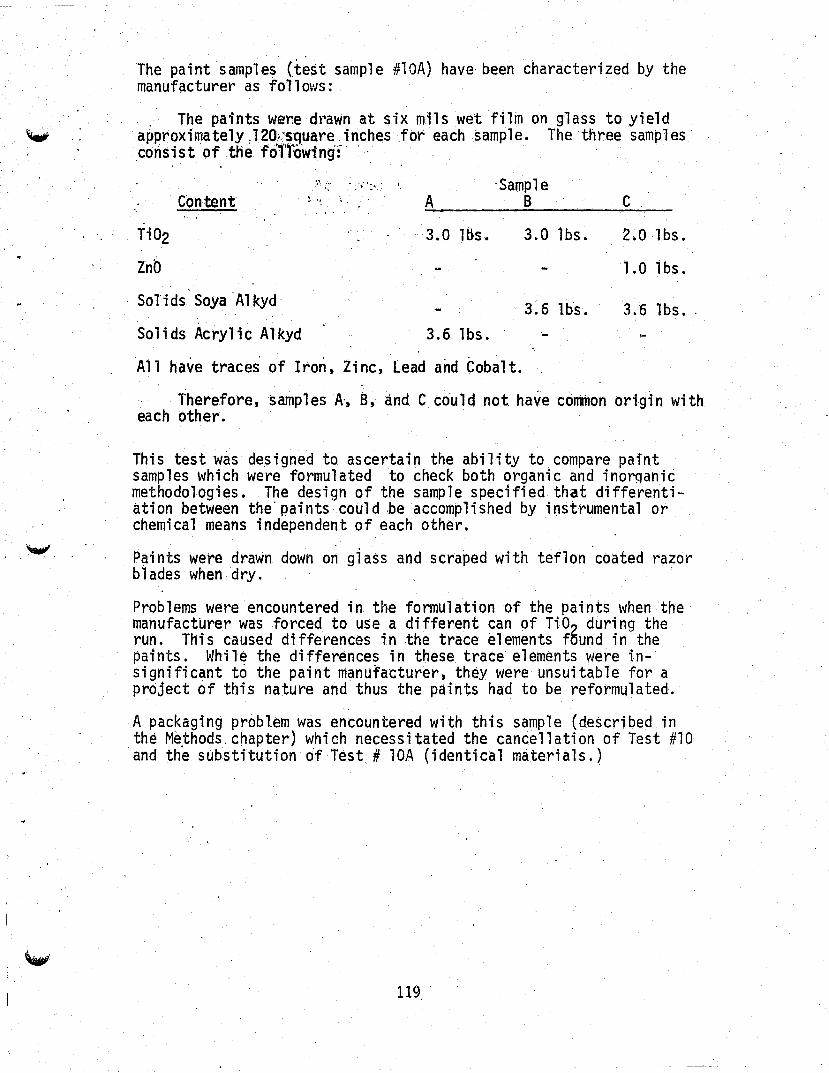
, ~
The paint sample~ (test sample #10A) have, been characterized by the manufacturer as foll m'/s:
. The paints we~e dt1 awn at six mils wet filin on glass to yield approximately ,120i:~square, inches for each sample. The three sampl es ' .consiSt of the folTowing:-' ", ,
Ti02
Znb
Content
Solids SoyaAl kyd'
Solids Acrylic Alkyd
. • ,.,+, •
3.0 1 bs.
3.6 lbs.
'Sample B
3.0 lbs.
, 3.6 lhs.
All ha~e tracei of Iro~, Zinc, Lead a~d tobalt.
C
2.0 lbs.
1.0 1 bs.
3.6 lbs ..
Therefore, samples A" B, and C could not have conmon origin with each other.
This test was designed to ascertain the ability to compare paint samples which were formulated to check both organic and ino~anic methodologies. The design of the sample specified that differentiation between the'paints could .be accomplished by instrumental or chemical means independent of each other.
Pqints were drawn down on giass and scraped with teflon coated razor blades when dry. '
Problems were encountered in the formulation of the paints \oJhenthe manufacturer was forced to use a different can of Ti02 during the run. This caused differences in the trace elements found in the paints. While the differences in these trace elements were insignificant to the paint manufacturer, they were unsuitable for a project of this nature and thus the paints had to be reformulated.
A packaging problem was encountered with this sample (described in the Me~hods. chapter) which necessitated the cancellation of Test #10 and the substitution of Test # lOA (identical m~terials.)
119 ..

Table 43
· of the Reported Meth9_ds Frequencl.es -
Instruments or Methods Used
Microscopic Examination Solubility Tests M~cr9scopic Examination
, Pyrolysis G-C Infrared Analysis Fluorescent Studies Emission Spectrqscopy
. X-ray Fluorescence Density Studies X-ray Diffraction
. uV Spectrophotometry G-C Solid Sampler ATR Color-Marquis Pyrolysis Infrared
. Atomic Absorption Spot Test
. Spectral Reflectance
., , , ,t,
* Late responses (11 not tabuiated.
Number of Laboratories
120
104 100
94 57 56 43 39 26
8 7 4 2 1 1 1 1 1 1
Percent of total labs ttotal=110 )*
94.5% 90.9% 85.5% 51.8% 50.9% 39.1% 35.5% 23.6%
7.3% 6~4% 3.6% 1.8%
.9%
.9%
.9%
.9%
.9%
.9%

~'
..
I
Table 44
'. Comparison of Item, A and Item B by the Eight Most Frequently Reported Methods
Method
Microscopic Exam
Solubility Tests
Macroscopic Exam
Pyrolysis G-C
Infrared Analysia
Fluorescent Studies
Total Number of Labs Reporting Comparison of Item A'and,Item B by This Method.
92
92
80
53
48
39
Emi~sion Spectroscopy
X-ray Fluorescence
35
20
Table 45
Number of Labs Reporting' They Could Differentiate Item A and Item B by This r1ethod.
17 (18.5%)
43' (46.,7%)
5 ( 6.3%)
50 (94.3%)
20 (41.7%)
2 ( 5.1%)
7 (20.0%)
4 (20.0%)
Comparison of Item Band Item C
Number of Labs Reporting They Cou'ld Not D.l.fferentiate Item A and Item B by This Method.
75
49
75
3
28
37
28
16
by the Eight Most Frequently Reported Methods
Method
Microscopic Exam
Solubility Test
Macroscopic E~am
Pyrolysis G-C
Infrared Analysis
Fluorescent Studies
Total Number of Labs Reporting Comparison of Item B and Item C by This Method.
92
90 '
80
51
47
39
Emission Spectroscopy
X-ray FlUOrescence 37
21
121
Number of Labs Reporting They C::>uld Differentiate Ttem B and Item C by This r,1ethod.
11 '(12.0%)
28 (31.1%)
'I ( 1.3%)
14 (27.5%)
3 ( 6.4%)
20 (51.3%)
26 (70.3%)
18 (85.7%)
Number of Labs Reporting They Could Not Differentiate Item B and Item C by This Method.
81
62
79
37
44
19
11
3
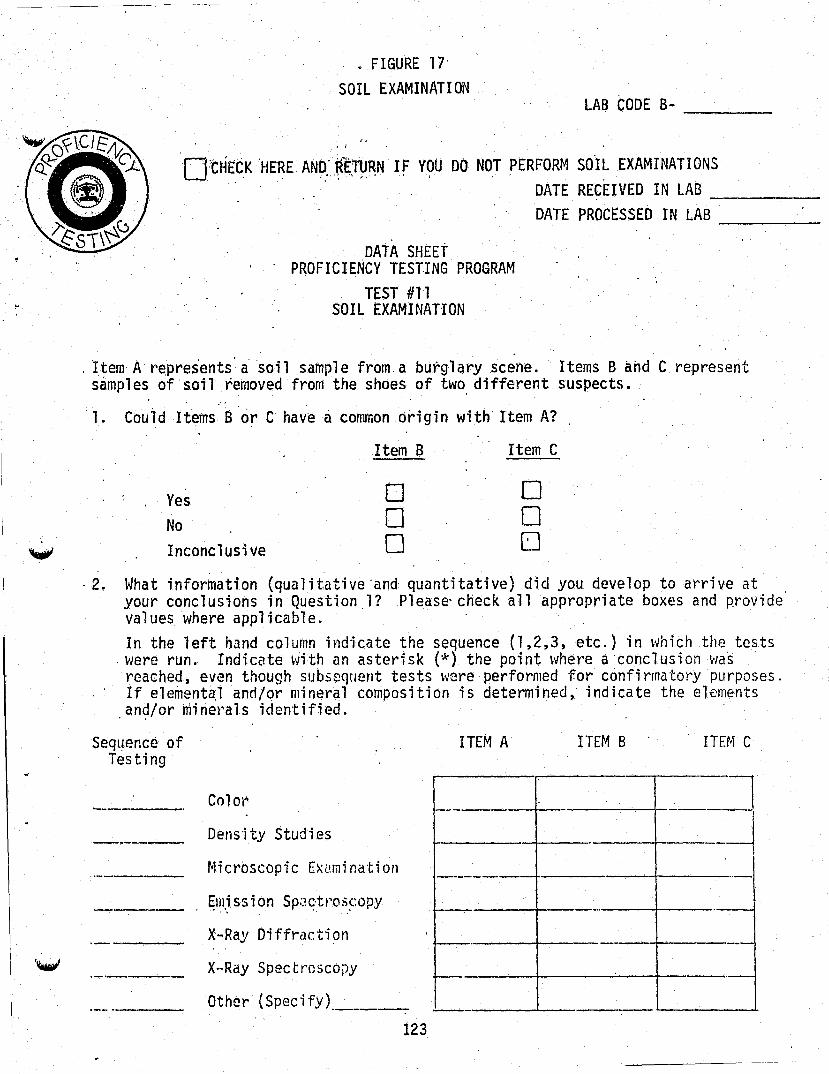
• FIGURE 17'
SOIL EXAMINATI ON ' LAB CODE B- ---.--..;. __
OtHECK 'HEREAN9:"~~:TYRN If Y9U DO NOT ,PERFORM So'IL EXAMINATIONS' " DATE RECEIVED IN LAB -----
DATE PROCESSED I N LAB '
, DATA SHEET PROFICIE~CY TESTING PROGRAM
TEST #11 SOIL EXAMINATION
-----
. 'Item A r~pres'ents' a soil sample from a burglary scene. Items Band C represent s~mples of ' soil ~emoved from the shoes of tw~ different suspects.
1. Could Items B or C have a common origin with Item A?
Item B Item C
Yes 0 0 No 0 0 Inconclusive 0 []
,2. What information (qualitative 'and quantitative) did you develop to arrive at your conclusions in Question l? Please' check all appropriate boxes and provide values where applicable. In the left hand column indicate the sequence {1,2,3, etc.} in which the tests
, were run. Indicate with an asterisk (*) the point where a conclusion wa~ reached, even though subs,8quent tests \-Jcre performed for confi rrnatory purposes. If elementa.l anci/or mineral composition is determined, indicate the elements
.an~/or ~inerals identified.
Seqllence of Testing
Colo!"
Dens'ity Studies
Micrbscopic Examination
ElIli S5 i on Sp:.~Ctt'05COPY . . .'
X-Ray Diffraction
X·-Ray Spec troscojJy
Other (Specify). ____ _
123
ITEM A
I--
_ .. _--I-.
f---.
f--
ITEM 8 ITEN C
-l ._---/
~ "-
-- '--
-- --
"-

3. Please provide the results obtained with each of the methods and instruments checked in Question 2. (Example: Density Gradient tubes using mixture of,bromoform andbromobenzene~ etc.) Pleas~ provide specific and complete responses. Attacn additional sheets' if necessarY.
Method:- ,
Method:
Method:
4. Additional Comments
DATA SHEETS MUST BE RECEIVED AT THE FOUNDATION OFFICE,BY JANUARY 2, 1976
124
....",'
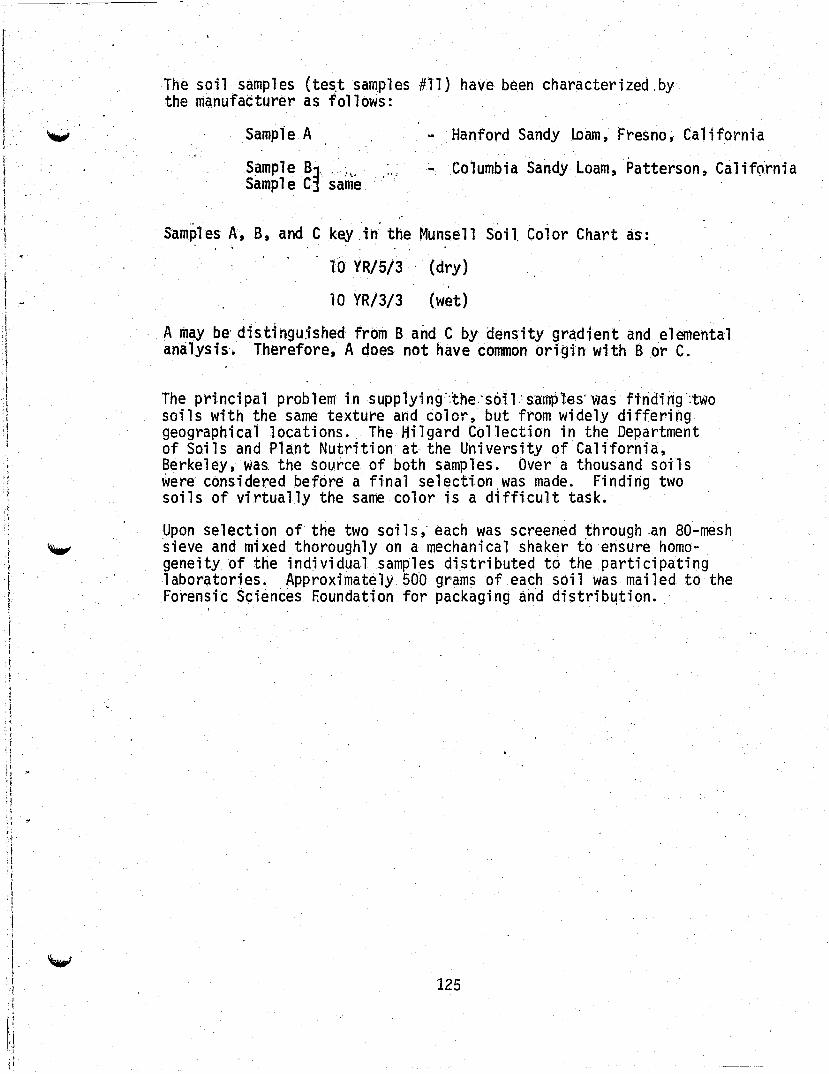
-----------
I : '. I '/
f ~ I ,;
'! ,I :1
"
" J ~
r :f
I
I
i :1 ! I i I
I • i
',I I
~ ~
~: \ 1:\ ;1 I,
The soil samples (tes,t samples #11) have been characterized,by the manufacturer as follows:
Sample A
~::~{:~~' same
Hanford Sandy lDam, Fresno, California
Columbia Sandy Loam, Patterson, CalifQ'rnia
Samples A, B, and C key ,in the Munsell Soil. Color Chart as:
10 YR/5/3 (dry)
10 YR/3/3 (wet)
, ,A may be' distinguished from Band C by density gradient and elemental analys is'. Therefore, A does not have cornmon or; gin wi th B or C.
The principal problem in supplying':the:so",:s'a:mples'was ftriding':two soils with the same texture and color, but from widely differing geographical locations. The Hilgard Collection in the Department of Soils and Plant Nutrition at the University of California, Berkel ey, was, the source of both sampl es. Over a thousand soil s were considered before a final se1ection,was made. Finding two soils of virtually the same color is a difficult task.
Upon selection of the two soils; each was screened through ,an 80-mesh ~ieve and mixed thoroughly on a mechanical shaker t6 ensure homogeneity of the individual samples distributed to the participating 1abor(ltories. Approximately 50"0 gram~ of each soil was mailed to the Forensic Sciences Eoundation for packaging and distrib4tion.
125
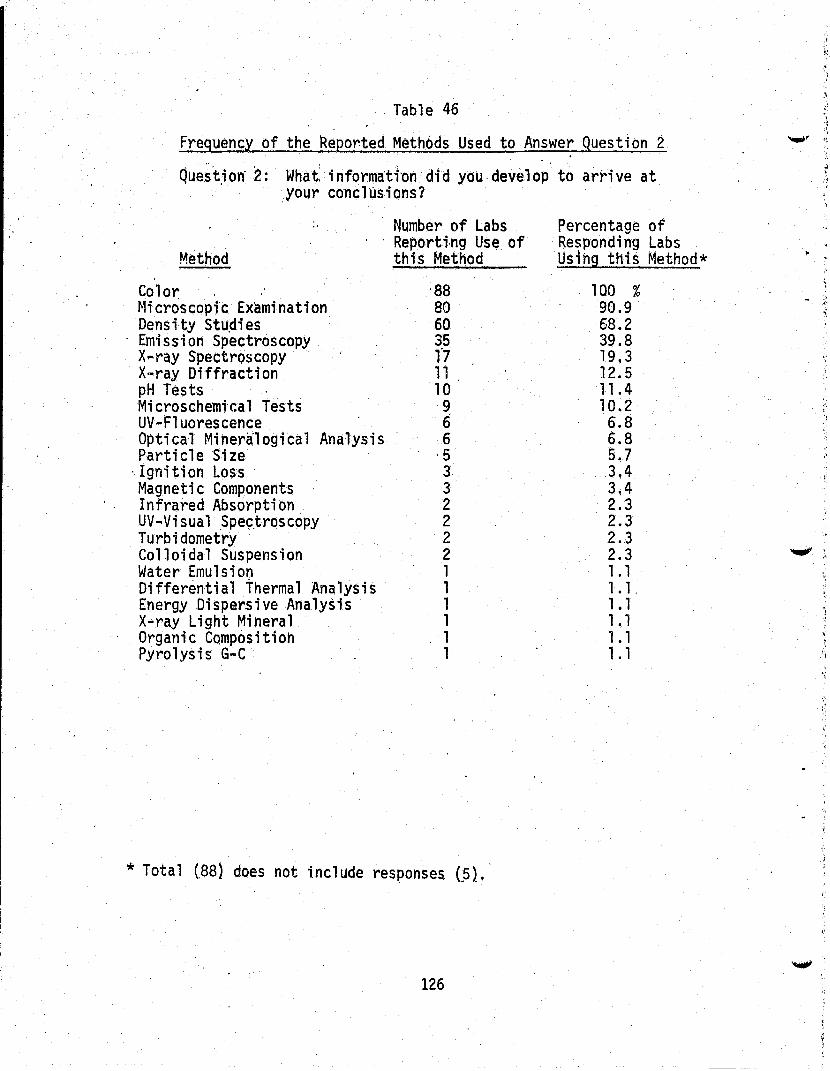
- -- - ----------~---
Table 46
Frequency of the Reported Methods Used to Answer Question 2
Quest,ion' 2: What: informa'ti'on did you develop' to arrive at :your conclOsions?
M~thod
Color Micr6scopf6 Examination Dens i ty Stu.di es Emission Spectroscopy X~ray Spectroscopy X-ray Diffraction pH Tests Microschem;ca1 Tests UV-Fl uorescence .
Number of Labs . Reporti·ng Use of
this Method
'88 80 60 35 1'7 11
Optical Mihera10gical Analysis Particle Size
10 9 6 6
·5 3 3 2 2 2 2 1 1 1 1 1 1
. 19ni ti on Loss . Magnetic Components Infrared Absorption UV ... Vi sua 1 Spe~.troscopy Turbidometry Colloidal Suspension Water Emulsion Differential Thermal Analysis Energy Dispersive Analysis X-ray Light Mineral Organic CQmpositioh Pyrolysis G-C
* Total (88) does not include responses (~l.
126
Percentage of . Responding Labs Usihg this Method*
100 % 90.9 68.2 39.8 19.3 12.5 11.4 10.2 6.8 6.8 5.7 3.4 3.4 2.3 2.3 2.3 2.3 1.1 1.1. 1.1 1 • 1 1.1 1 . 1
...... ,.
,.
., ,t, 'f
, t

I
I I I ~
I t • , I
I
I ,
! j
I
!
'W'.
''-'"
'~
Method
, Color 'M; croscopi c
Exam Density
Studies Emission
Spectr~scop'y
Number of Labs ,Comparing I~em A and Item B by , thi s Method,
77
62
50
' '30
Table 47
Number of Labs Reporting, they Could Di'f~rentiate Item A and Item B by thi's Method
37
11
25
X~r.ay Spectroscopy 16
2 6,
X-ray Diffraction p'H
Method
CoTor Microscopic
Exam Density
Studies Emission
Spectroscopy
11
10
Table 48
3
9
Comparison of Item A and Item C by th~ Seven Most Frequently Reported Methods
Number of Labs Number of Labs Reporting they Comp,aring Item B Could Differentiate and Item C ,by Item A and Item B this Method by this Method
77 37
62 11
50 27
30 2
X-ray Spectroscopy' 16' 7 X-ray Diffraction 11 3 pH 10 9
127
Number of Labs Reporting they
, Could Not Differ, enti ate Item A
and Item B by ,this Method
40
51
25
28
10
8
1
Number of Labs Reporting they Could Not Differ-entiate Item A and Item B by this Method
40
51
23
28
9
8
1
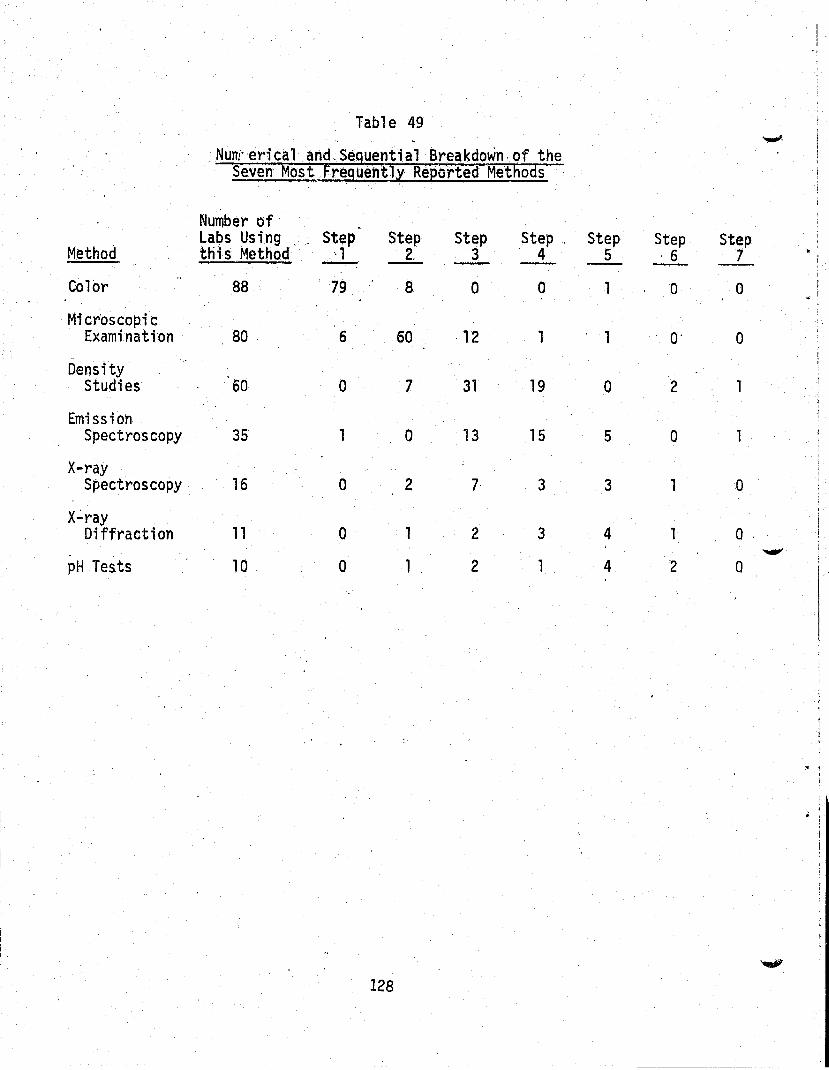
Table 49 .
Num:erital and,S~9uential ~reakdo~n~of the Seven Most Fre9u~ntlY R~ported Methods
Number of
Method Labs Using Step Step Step Step, this Method ,1 2, 3 4
Color 88 79 8 0 0
Microscopic Examination 80 . 6 60 12 1
Oensity Studies 60 0 7 31 19
Emission Spectroscopy 35' 1 0 13 15
X-ray Spectroscopy 16 0 2 7 3
X':' ray Diffraction 11 0 1 2 3
pH Tes.ts 10 0 1 2 1
128
Step Step 5 '6
1 0
1 0'
0 2
5 0
3 1
4 1
4 2
Step 7
0
0
1
1
0
o ' 0
.....".
""'-"
I '" I
I'
w , , I

. Ta~le· 50
. Number of Tests Performed to Reach a ConclUsion
Step
1 2 3 4 5· 6 7
.8
: .Number of· Cone 1 us ions i Reached·at thi s Step
17 6
21· 17
5 o 1 1
Cumulative Percent ·(68 Labs)
25,0% 8.8
30.9 25.0 7.4 o 1.5 1.5
Note: 20 Labs did not report the pOint where a conclusion was reached. (i.e., n'o * shown)
Table 51
Number of Conclusions Reached From Each .of the Seven Most FreauentTy Used
. .. Metho s
Method
Color ~icroscopic Examiqation Density Studies E~ission Spectroscopy X-ray Spectroscopy X-ray Diffraction pH Tests
, . \ "
129
Number of Conclusions Reached From this Method
15 4
20 7 3 "I
2

Table 52
Elements Reported by Participating Labs
.' Elements
Al (Aluminium) As (Arsenic) B (Boron) Ba (Ba~ium) C (Carbon) Ca (Cal ci'um) Cd (Cadmium) Cl (Chlorine) Co (Cobalt) Cr (Chromi urn·)
,. Cu (Copper) Fe (Iron) Ga (Galium) Ir (Iridium) K (Potassium)
. Mg (Magnesium) Mn (Manganese) Mo (Molybdenum) Na (Sodium) Ni (Nickel) o (Oxygen) Os (Osmium) Pb (Lead) Rb (Rubidium) Rh (Rhodi urn) Ru (Ruthenium) S (Sulfur) 5b (Antimon,y) S1' (Silicon) Sr (Strontium) Ti (Titanium) V (Vanadium) Y (Yttrium) Zn (Zinc) Zr , (Zi reoni urn)
. Number of Labs Which Report~d Fihdirig the Elements in a Sample
22 1 1 1 1
23 1 2 . 1 4 8
26 1 1
13 20 15 1
17 3
11 1 4 3 1 1 3
26 7
20 6 1 7 9
Note: 28 laboratories reported specific elements that they had found in the samples.
130
...,.;' ,
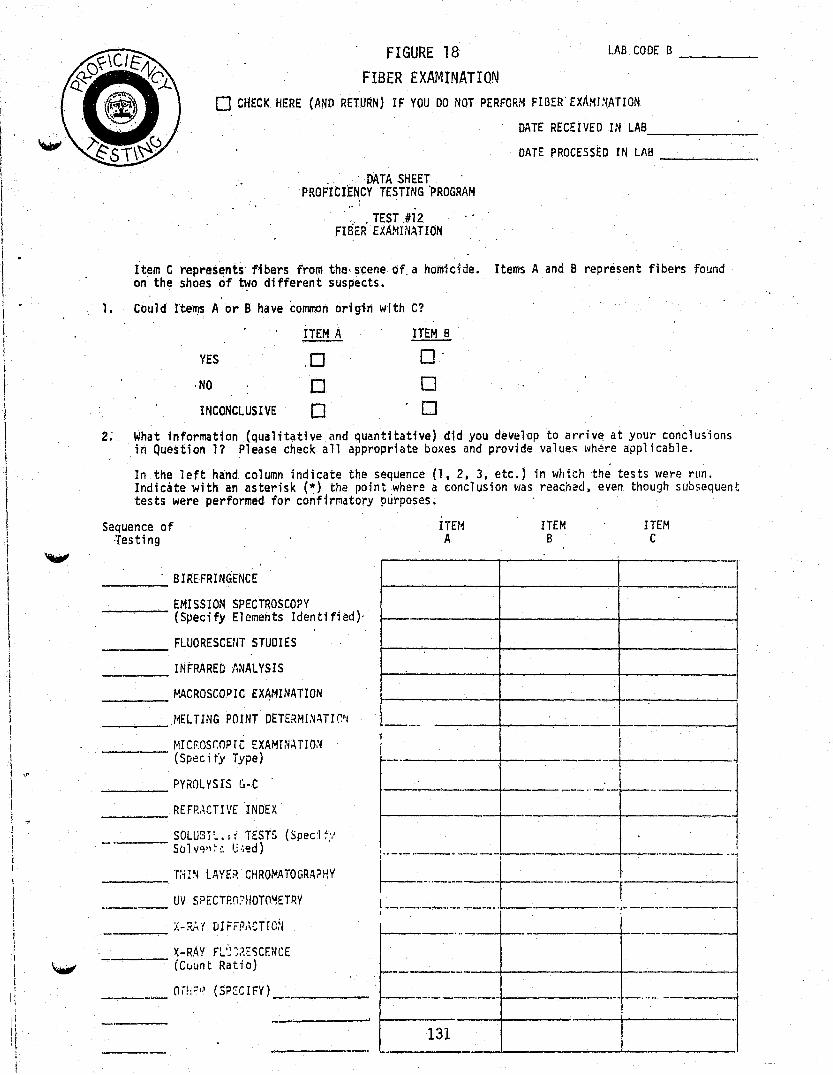
\ I ! \ I I 1
\
I f ! • I I ! l
I
! i !
I I ,
I
I 1
!
I
t ! ! ,
I
I ' t f .. 1
!
FIGURE 18 FIBER EXAMINATION
LAB CODE B ___ _
o CHECK HERE (AND RETURN) IF YOU DO NOT PERFORM FIBER EX'\~H~ATION
DATE RECEIVED IN LAB ------
1.
_ _ . -DATA SHEET . 'PROFICltNCY TESTING 'PROGRAM
r '; • TEST .#12
FIBER EXAMINATION
DATE PROCESSED IN LAH ----
Item C represents' fibers from the· s-cene Of. a homicide. Items A and B represent fibers found on the shoes of ~o different suspects.
Cou 1 d I'tell)S A or B ha ve -common ori gin wi th C1
ITEM A ITEM B
YES _0 O·
·NO 0 0 INCONCLUSIVE 0 0
2~ What information (qualitative and quantitative) did you develop to arriv~ at your conclusions in Question 11 Please check all appropriate boxes and provide values \~here appl icable.
In the left h~nd column indicate the sequence (1. 2.3, etc.) in which the tests were run. Indicate with an asterisk (~) the point where a conclusion ~/as reached, even though subsequent tes ts were performed for confirr.'ldtory purposes. .
Sequence of -Testing
ITEr~ A
ITEM B
ITEM C
---- BIREFRINGENCE -ic-------.-ll
EMISSION SPECTROSCO?Y ---- {Specify Elements Identified}· f--.-.----r-------4---------l
____ FLUORESCENT STUDIES
INFRARED ANALYSIS ----____ I-'ACROSCOPIC EXAMINATION
____ .I1EL rING POINT DETERIWIATIG',
'·IICROSr.t1PTC EXAMPIATIO,'1 ----- (Speci fy Type)
____ PYKOLYSIS !~-C
____ REFR.~CTIV£ INDEX
SOLUS!:'; I i TESTS (Spec -j ~/ So 1 ... ")" ~:: U 'i<:!d)
UV SPECTp.n?HOT0~ETRY
X-RAY FL0~~E5CENCE ----- (C{Junt Ratio)
(S?:::CIFY) __ .. ____ _
___ ._-+--________ L ______ ---I I
-----4-----.--._.--+-! --------/
--=~~-t·---~-----~- ~~ !
E~~~ _=~_l====t_-~-_=J I • 1
~~~- --=t---~ -----,_. "-' ---]
131
3. Please spe,cify .the information developed \-/ith each of the'methods and instrulllents checked in -Question 2. (Example: Solubility tests using HC1~-H2S04,Aceto~e ahd HN0 3 ; microscopic-fibers, identified as cotton, nylon; etc.) _ _
-~leaseprovide specific and ~omplete responses. Attach additional sheets if necessary~ ,
r·;ethod:' ,
Nethod:
t~ethod :
4. Additional Comments:
DinA SHEETS r·1UST f1E P.E('E I VED AT THE FOUNDATiO,'j OFFiCE r;y FF.CmUARY H), 1975
132

I. I t
I -t r
I I
I 1 I
I ! I
The Fibers. (test samples #12) can be characterized according to the sample manufacturer as follows:
Item A - Composition: Manufacturer: Color:
100'% wool· Philadelphia Carpet Company. Heather Green
, Item B ~ Composition:
Manufacturer: Acrylic (70% acrylic + 30% modacrylic) Brtnkcrest Company #1014 Avocado Color:
. Itein C - Compositi"on: 100% Dacron Polyester Manufacturer: Burlington Industries Color: #31 Pine
Three di fferent fi ber specimens were submi tted. The specimens were deliberately. small in quantity to duplicate the sample size generally found in ·casework.
Fibers were pulled directly out of carpet samples, placed in foJded glassine.paper and inserted into coin envelopes.
One specimen was 100% wool; the other two were different synthetics . . Fiber size and color were selected as nearly as possible to being the same to the naked eye. The test was so designed that macroscopic examination would probably not differentiate the samples. However, a thorough microscopic examination would indicate differences in the fibers. Also, these differences could be detected by several other analytical methods available in some of the laboratories, and those laboratorles which conducted that thorough of an examination could be be expected to identify the specific fiber·s. . . ,
Difficulty was encountered in obtaining specimens close in color and size, which would also have sufficiently different characteristics that a simple mi~roscopic examination could tell them apart. It was d~sirable that phase ~ontrast microscopy, polarized light, dark field illumination, etc., would need to be used.
Of interest was the high percentage of correct results which were reached by several ,different .methods of examination. Subsequent tests should use the same type of fibers from different sources which would be 'more difficult to differentiate than in the mere elimination
. process that was requ; red here. .
133

Table 53
FREQUENCY OF THE REPORTED METHODS USED TO ANSWER QUESTION 2
Question 2: What ,information did you develop to arrive at your conclusions?
Method
'Microscopic Examinatio,n Macroscopic Examination' Solubility Test Birefringence r1elting Point Determination Refractive Index Fluorescent Studies lrifrared Analysis Flame Test
, Dens i ty Studi es Thin-layer Chromatography Dupont 1.0. Stain #4 Thermal Depolarization Analysis Color Test . UV Spectrophotometry Diameter of Fibers
Number of RepprtedUse of this Method
121* * . 84 55 46 20 19 13 10' 2 1 1 1 1 1 1 1
* Total (117) does not include 1 ate responses (.3}.
Percentage of Responding Labs ' Using this Method.
N/A** 71.8% 48.2% 40.4% '17.1 % 16.7% 11.1 %
9.4% 1. 7%
.9%
.9%
.9%
.9%
.9%
.9%
.9%
**Some Laboratories reported more than one micro~copic examination in response to Question 2. 113 different Labs did some kind of microscopic examination
134

Table 54
~ " ,Compari son of Items 'A 'arid C b~ . the Eight Most Frequently Report~d Methdds
Number of Labs Number of Labs Reporting they
Number of Labs Reporting they Could Not Differ-Comparing Item A Could Differentiate . enti ate Item A and Item C by Item A from Item C from Item C by
Method this Method b~ this.Method this Method
Mi cr'oscopi c Exam 108 108 ' 0
Macroscopic , Exam· 56 38 18
Solubility I
Tests 26 22 ' 4
Birefringence 22 19 3
Melting Point Detennination 10 10 0
Refractive ~ Index 4 4 Q
Fluorescent Studies 8 3 5
Infrared Analysis 3 2 1
135

Table. 55 C6mEarison of [terns Band C .b~ .
the Eight Most FreguentlyReported Methods ..."
Number of Labs Number of Laos Reporting they
Number of Laos Reporting tney Could Not Differ-Comparing Item B Could Differentiate entiate Item B and Item Coy Item B from Item C from Item C by
Method thl~S Method' DY tni.s Method thi.s. Method. , ~
Microscopic Exam 107 99 8
Macroscopic Exam 56 20 36
Solubility tests 45 39 6
Birefringence 36 33 3
Melting Point Determination 19 19 0
Refractive Index 16 16 0
Fluorescent Studies 10 5 5
....".
Infrared· Anal.ysis 9 9 0
136

Table 56
r ~ . Numer:-ical and Seguential Breakdown I Of the Ei ght._)1ost FreguentlY Reported Methods I
Number of labs Using Step Step Step Step Step Step Step Step
Method this Method" 1 2 3 4 5 ,.
7 8 \)
Mi cros'copi c I Examination 121 * 30 79 8 2 0 1 0 1
Macroscopic Examination 83 80 3 0 0 0 0 0 0
Sol ubi iity Tests 55 0 9 26 13 5 2 0 0
Birefringence 46 2 12 17 . 10 3 2 0 0
Melting Point . Oetermination 20 0 1 7 6 3 2 1 0
Refractive Index 19 0 1 6 7 5 0 0 0
Fluorescent "W Studies 13 1 5 4 3 0 0 0 0
Infrared . Ana1ysi s 10 1 1 4 2 1 0 1 0
*Some labs reported more than one microscopic examination.
i 1 t
I 137
I
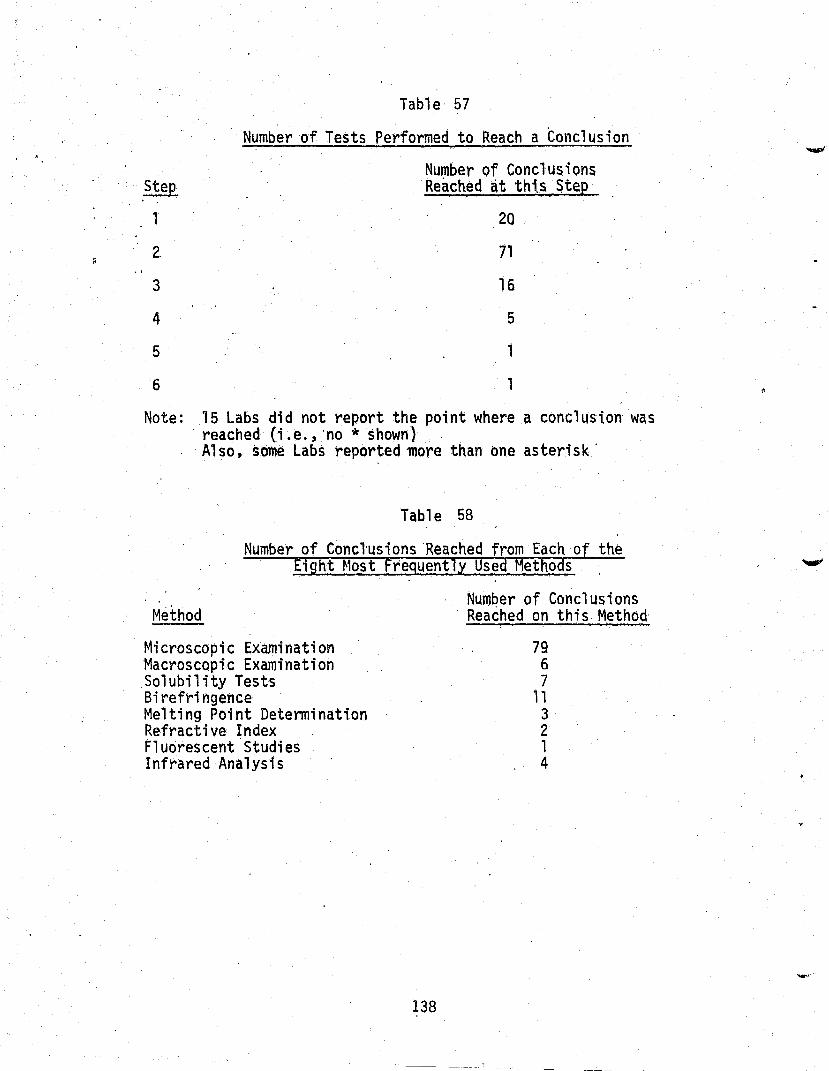
Tabl e 57
Number of Tests Performed to Reach a tonc1usion
Number of Conclusions Step
1
2.
3
4
5
6
Reached at this Step
20
71
16
5
1
1
Note: 15 Labs did not report the point where a conclusion was reached (i .e. , 'no * shown) . Al so, sOme Labs reported more than one asterisk'
Table 58
Number of Conclusions Reached from Each of the Eight Most F~eguentlx Used Methods
Method
Microscopic Examination Macroscopic Examination Solubility Tests Birefl"ingence Melting Point Determination Refractive Index F1uorescent'Studies Infrared Analysis
138
Number of Conclusions Re~6hed on this Method
79 6 7
11 3 2 1 4

._--------..--._.- -------., •. ----,--.--.. ~"-~,-----....... -----~---~-'-.-....... ---- --.. -.. ~ .. -~---~-------.---- ._._- ... -----._-- "-- -.... --'..--. .. ----~- ~----~.- --,. -----
( (.
LAB CODE B ____ _
CHECK HERE (AIID RETURN) IF YOU IXi NOT DO PHYSIOLOGICAl flUID . EXAMINATION.
DATA SHEET PROFICIENCY TESTING PROGRAM
TEST #13 PHYSIOLOGICAl FLUID EXAMINATION
DATE RECEIVED DATE PROCESSEO'-·-----
Items A and B represent evidence collected in connection with a rape case. Please 'examine the items according to your normal laboratory procedures and complete portiones) which comply with your laboratory policy~ Please add any additional information you consider pertinent to your response.
la. The stain on Item A (Blue Cloth): r=Jwas examined with inconclusive results c=Jwas examined and determined [] tentatively as representing a stain.
[J conclusive1y
lb. The following tests were conducted to arrive at the answer to question la: c=J' Microscopic examination c=J Phase contrast
~ c=J Bright field (specify stains used) ~ ~
c=J Acid phosphatase determination specify substrate: ______ _
(:] Starch amYlase c=J Microcrystalline (specify)
specify dye:
. ,DBlood group determination (specify factors sought, and methods used).
Factors: Methods used:
c=J Other (specify)
(OVER)
- 2 -
2a. The stain on Item B'{Pink Cloth): r=Jwasexamined with inconclusive results
(
.. (:]was examined and determined.(:] tentatively as' repres.ent~ng a ____ -. . 0 conclusively stain
2b. .The following tests were conducted to arrive at the answer to question 2a:
(:] Microscopic examination o Phase contrast c=J Bright field (specify stains used)
r=J.Acid phosphatase determination specify substrate: _______ _ specify dye: _____ _
(:] Starch amylase E:J Microcrystalline (specify)
E:J Blood group determination (specify factors sought, and methods used). Factors: Methods used:
(:] Other (specify)
.'. 3. Additional Comments:
-0 ::J: -<. en ..... 0 r- ." 0 ...... G') G) ..... c: ("') ;:0
~ I'l1
." ~ r-c ..... 1::1

The,stains, (test samples #13) are ch'aracterized by the manufacturer as follows:
Item A: (Blue Cloth) is stained wtth saliva from a Type A secretor individual
,Item B: (Pink Cloth) is staineQ w;'th seminal fluid from a Type A secretor individual with a normal sperm count.
The saliva stain was deposited on clean cloth by touching a swatch of , I cloth previously cut into 2-inch squares, to the tongue of the donor.
Approximately 20 stains were deposited at a time. After 20 stains, however, 'a period of time was necessary to generate more saliva.
Plastic gloves were worn while handling the ~loth swatches. The stains were allowed to dry at room temperature for 24 hours on a sheet of polyethylene. They were then packaged in manila envelopes and mailed to the Forensic Sciences Foundation. The cloth was color~oded (blue) to distingui~h the saliva stain and the semen stain (pink). If this experiment were attempted in the future, the approach used in thi s test sample would appear to be adequate and satisfactory.
To manufacture approximately 250 samples for the semen test, the volume of semen that is necessary exceeds ,that which is produced in the normal volume of ejaculate. At the same time it was felt that the' homogeneity of the total sample was critical to ensure that each laboratory is given identical samples insofar as p~ssible. The semen was pooled from three separate ejaculations. All three ejacu.lations were collected within a 12 hour period, the' first and second consecutive ejaculates being stored at 4° C after collection. Following the third ejaculation, the pooled sample was allowed to liquify for approximate1y one hour at 4°C. Microscopic examination of a small aliquot showed a normal sperm count. The sample was then stirred to ' insure homogeneity, and two drops were deposited on 2-inch squares of clean cotton cloth spread on a polyethylene sheet. The stains were allowed to air dry for 24 hours at, room temperature, packaged in a manila envelope and, with the package of saliva stains, mailed on the same day to the Forensic Sciences Foundation. If this experiment were attempted, in the future, the approach used in this test sample would appear" to be adequate and satisfactory.
140
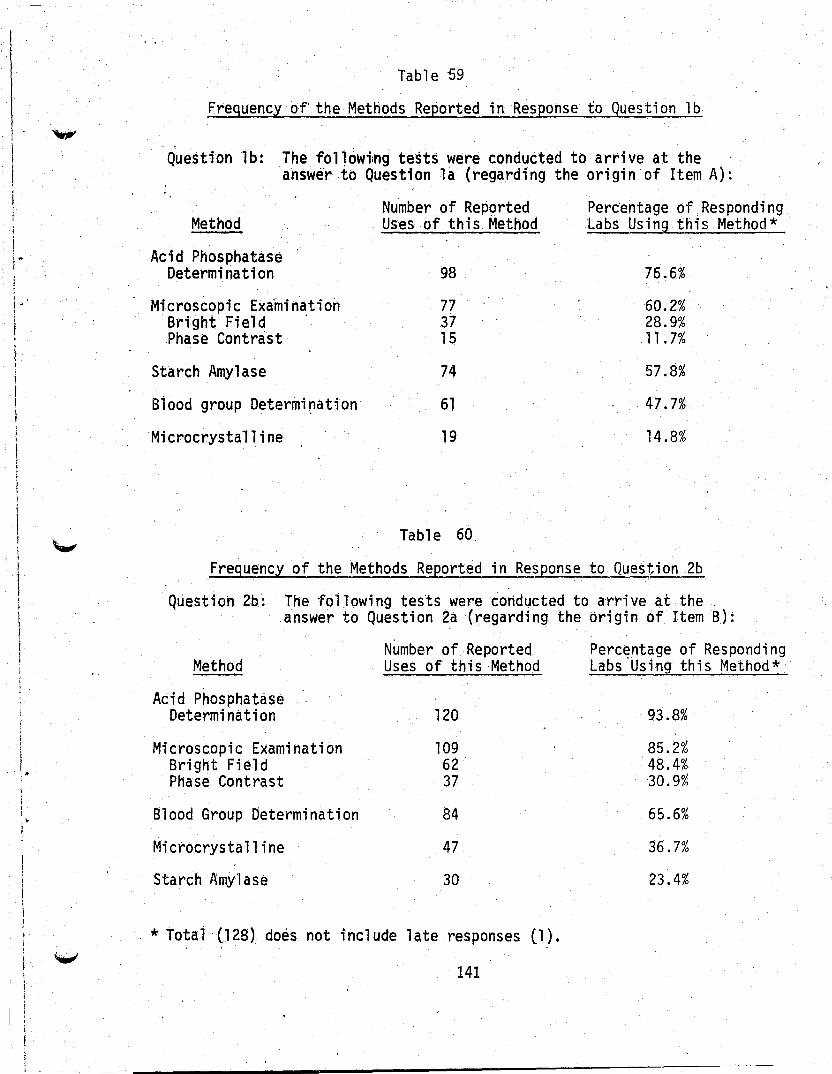
J
I' '"
I
I-
I I
I i
I !
I ! I , I ! t , I j
I I '-' i I I
I ,
I f I I
I . ;
I
!" I
Table '59
Freguency of'the Methods Reported in Response to Question lb
Question lb: The fOl1owi tng tests were conducted to arrive at the answer to Question 1a (regarding the origin of Item A):
Number of Reported Perc'entage of. Respondi ng Method Uses of this Method Labs Using this Method*
Acid Phosphatase Determination 98 76.6%
Microscopic Exa'mination 77 60.2% Bright Field ' 37 28.9% Phase Contrast 15 11.7%
Starch Amylase 74 57.8%
Blood group Determi~ation 61 47.7%
Microcrystalline 19 14.8%
Table 60,
Freguency of the Methods Reported in Response to Question 2b
Que.st i on 2b: The fo 11 owi ng tests were conducted to arri ve at the answer to Question 2a (regarding the origin of Item B):
Method
Acid Phosphatase Determination
Microscopic Ex~mination Bright Field Phase Contrast
Blood Group Determination
Microcrystalline
Starch Amyl ase
Number of Reported Uses of this Method
120
109 62 37
84
47
30
* Total '(,128) does not include late responses (1),
141
Percentage of Responding Labs 'Using this Method*
93.8%
85.2% '48.4% 30.9%
65.6%
36.7%
23.4%

Table 61 -'Summary of Responses to Question. la of Those Labs
Reporting Use of Starch 'Amylase Determination in Question lb
. Response
Inconclusive
Saliva, tentatively
~aliva, conclusively
Vaginal, conclusively
Non-seminal.
Not
Response
Inconclusive
Saliva, tentatively
Saliva, conclusively
Non-seminal
Vaginal, tentatively
Vaginal, conclusively
No Response
Table 62
Number of Labs Reporting this Response
8
43
21
1
1
1a of Those Labs Determination in uestion lb
. 142
Number of L?bs Reporting thi s Res'ponse
29
4
2
15
1
1
2
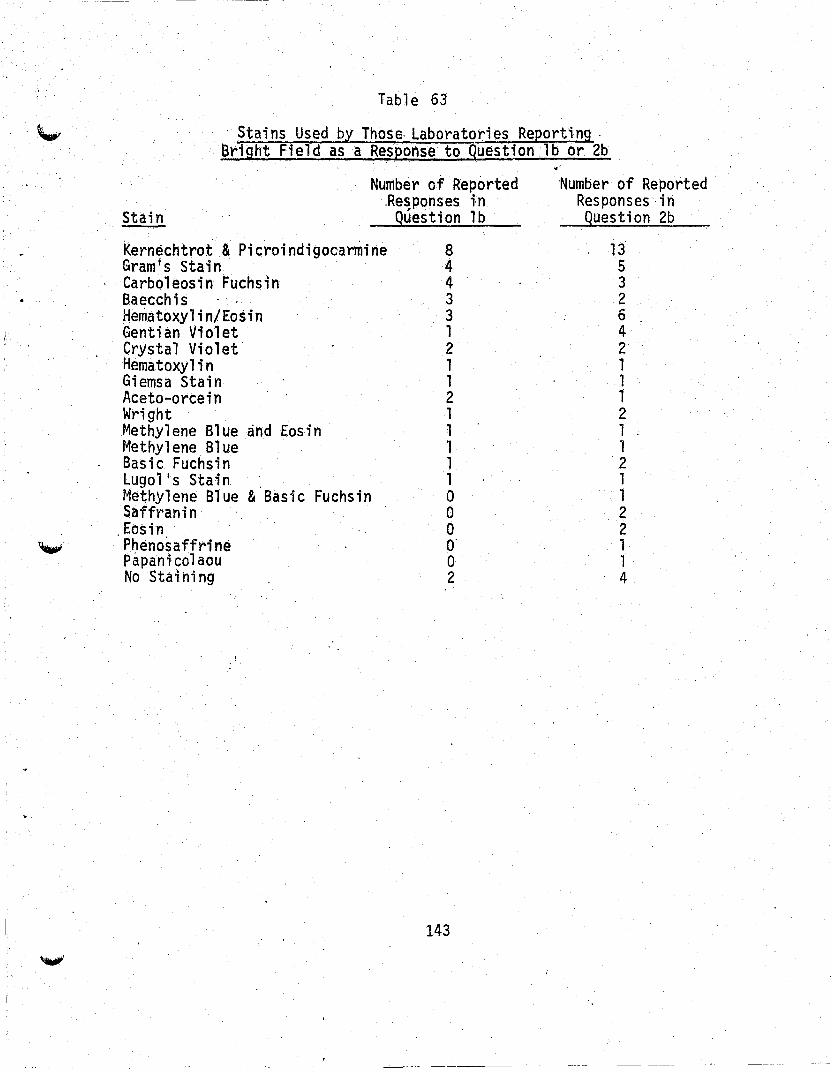
Table 63
. Stains Used by Thos& Laboratories Reporting. Bright Field as a Res~onse to Question lb or 2b
Stain
Number of Reported .Responses in
Question lb
kernechtrot & Picroindigocarmine Gram I s Staih
8 4 4 3 3 1 2 1 1 2 1 1 1 1 1 o o o O·
Carboleosin Fuchsin Saecchis Hematoxyl in/Eosin Gentian Violet Crystal Violet' H.ematoxyl in Giemsa Stain Aceto-orcein Wright Methylene Blue ~nd Eosin Methylene Blue Basic Fuchsin Lugol 's Stain . Methylene Slue & Basic Fuchsin Saffranin
. Eosin Phenosaffrine Papanicolaou No Staihing
o 2
143
Number of Reported Responses in Question 2b
13 5 3 2 6 4 2 1 1 1 2 1 1 2 1 1 2 . 2 1 1 4
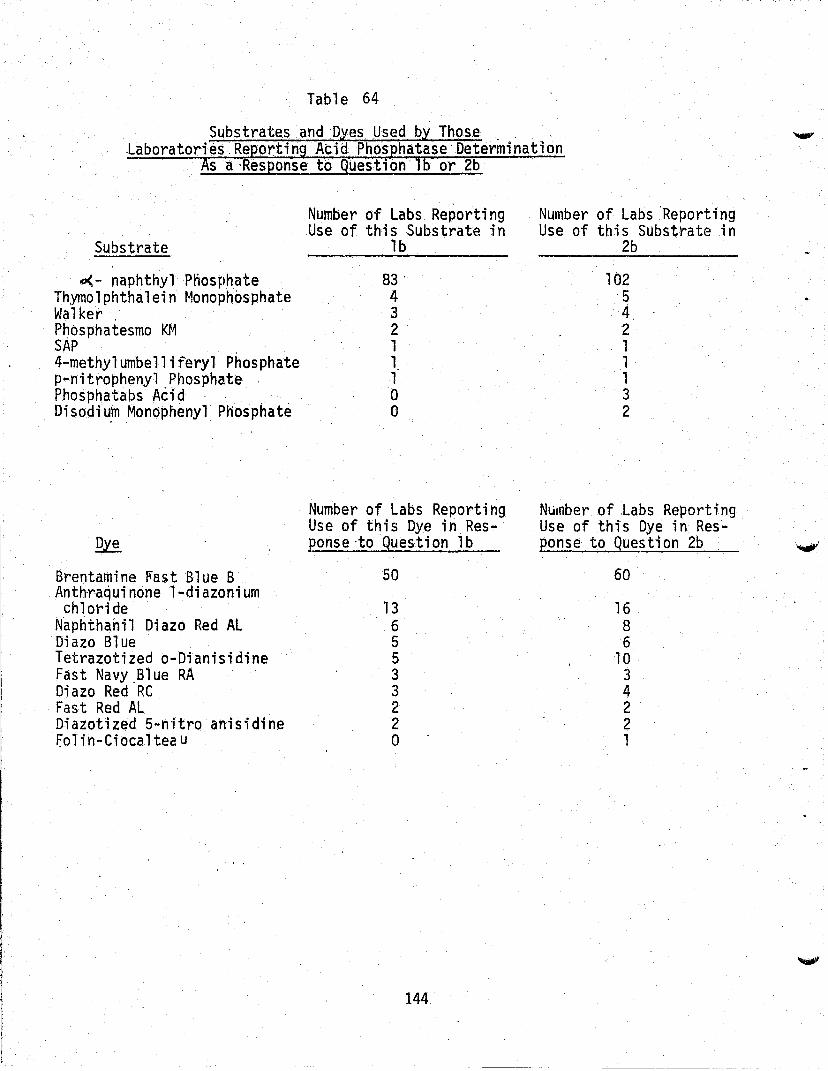
Table 64
Substrates and Dyes Used by Those , .Laboratori~s.RepoY'tin9 Ada Phosphatase'Determination
As a ·Response to Question 16 or 2b
Number of Labs Reporting Use of this Substrate in
Substrate . ___ l..;..,b ____ _
D(- naphthyl Pliosphate 83 ' Thymolphthalein Monophosphate 4 Walker , ~ Phosphatesmo KM 2 SAP . 1 4-methyl umbe 11 i feryl Phosphate 1 p-nitrophenyl Phosphate 1 Phosphatabs AcidO Disod;~m Monopheny1 Phosphate 0
Number of Labs Reporting Use of this Dye in Response ·to Question lb
Brentamine ~a~t Blue B Anthra~uinone l-diazonium chloride
N~phthahil Diazo Red AL Diazo Blue Tetrazotized o-Dianisidine Fast Navy.Blue RA Diazo Red RC Fast Red AL Oiazotized 5-nitro anisidine ~ol in-Ciocal tea u
50
13 6 5 5 3 3 2 2 o
144
Number of Labs 'Reporting Use of this Substrate in
2b
102 5 4 2 1 1 1 3 2
N~nber of .Labs Reporting Use of this Dye in Response to Question 2b
60
16 8 6
10 3 4 2 2 1

t
I I I -I t I t •
f
t
I ! I
I :
r ! . ! I
:
If I , f
I
Test
Florence Test
Barberios
. Chol ine
Lugel's
Tetramethylbenzidine
Table 65
Number of Labs Reporting this Test
in Question lb
145
17
4
3
o
1
Number of Labs Reporting this Test
in QUestion 2b
44
1
1
1
o
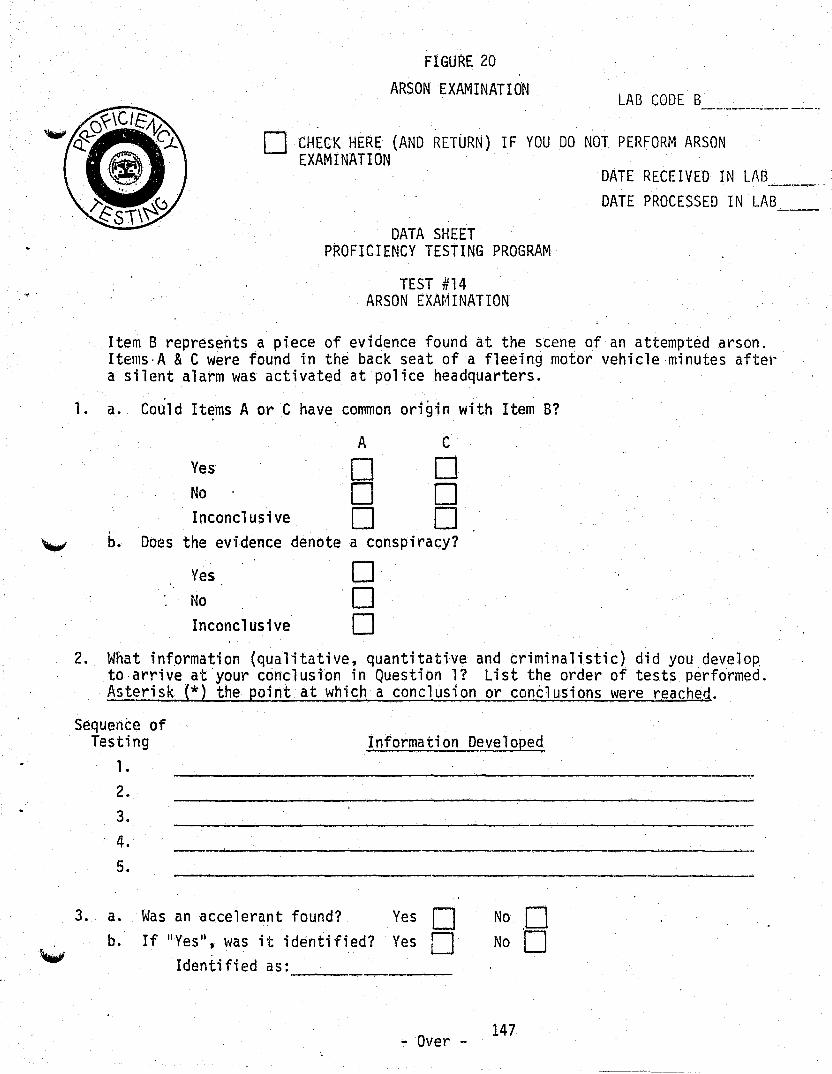
'-'
1-
FIGURE 20
ARSON EXAMINATION LAB CODE B
o CHECK HERE (AND RETURN) I F YOU DO NOT PERFORM ARSON EXAMINATION
DATA SHEET PROFICIENCY TESTING PROGRAM
TEST #14 ARSON EXAMINATION
DATE RECEIVED IN LAB DATE PROCESSED IN LAB
Item B represents a piece of evidence found at the scene of an attempted arson. Items·A & C were found in the back seat ofa fleeing motor vehicle minutes after a silent alarm was activated at police headquarters.
a. Could Items A or C have common origin with Item B?
A C
Yes 0 0 No 0 0 Inconclusive 0 0
b. Does the evidence denote a conspiracy?
Yes 0 No '0 Inconclusive 0
2. What information (qualitative, quantitati~e and criminalistic) did you develop to arrive at your conclusion in Question l? List the order of tests performed. Asterisk (*) the po;ntat which a conclusion or conclusions were reached.
Sequence of Testing Information Developed
1.
2.
3.
4. 5.
3. a. b.
----.~------------------------
Was an accelerant found? If "Yes", was it identified?
Identified as: ---
Yes Yes
D o
- Over -
No .0 No 0
147
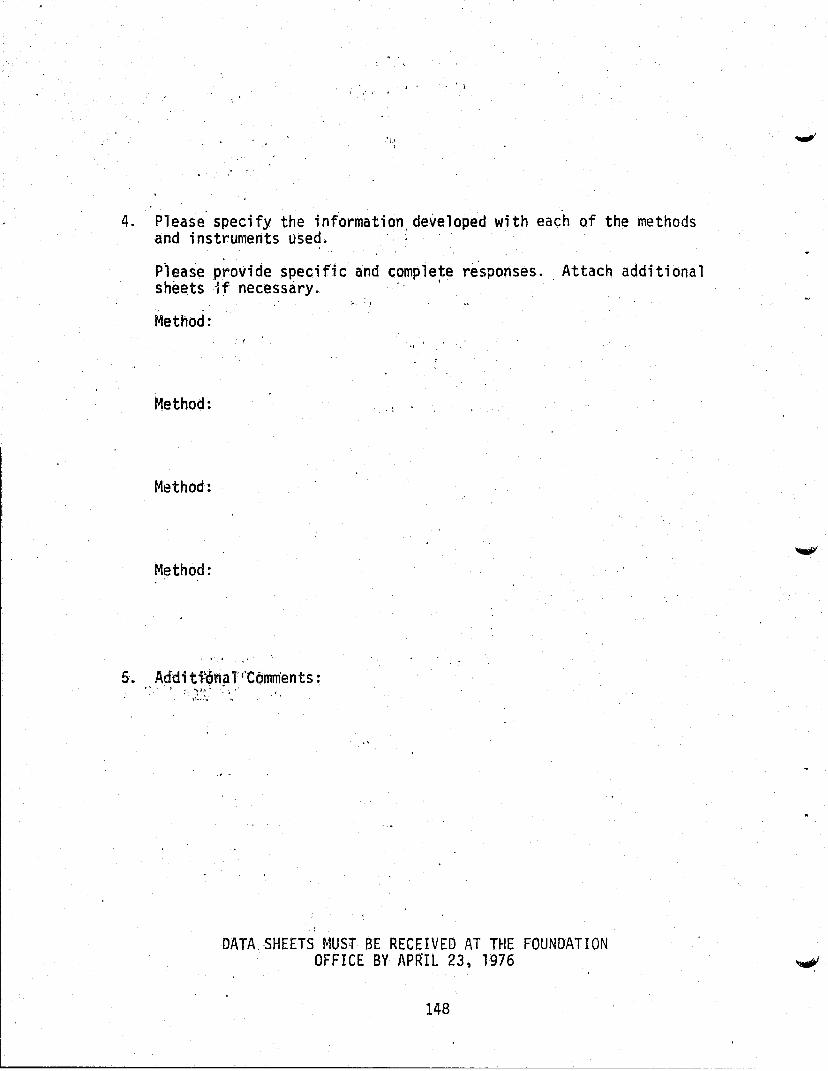
,'. ,
.. ,r 1
4. Please" specify the inf"ormation. developed with eac"h of the methods and instruments used. . ;
P)ea~e p~ovide specific and complete r~~ponses. Attach additional sheets '1f necessary. ". . '.
Method:
Method:
Method:
Method:
- ,
DATA SHEETS MUST BE RECEIVED AT THE FOUNDATION OFFICE BY APRIL 23, 1976
148

---------------------------------------------------------------------------~
The arson examination sample (test samples #14) is characterized by the manufacturer as follows:
Item A
Item a
Contained approximately 8 ml of leaded gasoline Ctlf:Vt'f.':Ifl §up .... bIt1c (lligh tpd) 94.5 Octane
A portion of a 8" square of 100% white cotton cloth purchased at J.C. Penney"s with 2 ml of Item A absorbed thereon.
Item C The other portion of the 8" square used in Item B.
The cloth inB and C was cut with scissors. Therefore:
• •
Gasoline of Item A exhibits all the same characteristics as the ga,soline of Itein B.
Cloth of Item B is an exact fit ~o the cloth of Item C and at one time was a sirtgle unit.
Various problems were encountered in the manufacture of this sample as well as the construction of the test questions. The packaging originally chosen for the gasoline sample, a 4 oz. metal paint can proved to be inadequate for the purposes intended. Lids blew off shortly after placing the gasoline in them, necessitating finding an alternate type of container for the volatile fluid (glass vials with screw tops were chosen) and resulting in the delay of the distribution of the sample.
One of the questions posed regarded evidence of a conspiracy and was later judged to be inappropriate for this type of test and was not tabulated in the test results. The in~ent or question as posed was to determine whether or not the laboratories were able to determine that cloth swatches were originally one piece and that the gasoline samples were from a common source. However, the demonstration of conspiracy is a legal question and one that is best answered by the courts.
149

. T~bJe 16.~ , I ." ,I,.
Frequency 'ofthe Methods Reported in .Response,to Question 2
Question .2: ,What information did you develop to arrive at your conclusion in QUestion 11 .
Number of Labs Percentage of Reporting Use Responding Labs
Method of this Method Using this ~1ethod*
Gas Chromatography 110 96.5% Fabri c & Cut 'Examinati ons 105 92.1% Odor 45 39.5% Infrared \, ....
28 24.6% Flammability Tests '/
18 15.8% Fluorescent Tests 9 7.9% Thin layer Chro'matography 6 5.3% Hydrocarbon Detector' ' , ' ' 4 3.5% Dye Staining 4 3.5% Energy Di sper'sive X'-ray 3 2.6% Flash Point Tests 3 2.6% AtomicJ\bsbrption 2 1.8% ..., Color Tests 2 1.8% Refractive: 'Index 1 .9% Solubility , 1 .9% Nuclear Magnetic Resonance 1 .9% S. P. F. 1 .9% . "
"
* Total (114) does not include late responses (4).
150

, ,
FiGURE 21
DRUG EXAMINATION
LAB CODE B, ___ _
IF V'OU ."00 NOT PERFORM DRUG ANAL Y SIS
DATE RECEIVED IN LAB ------DATE PROCESS EO IN LAB, ____ _
DATA SHEET
PROFICIENCY TESTING PROGRAM "
TEST #15
"DRUG ANALYSIS
1. The encJosed sUbstance was a street buy. The agent needs all the qualitative and'quanti'tative information you can provide.
2. Indi cate method (s) used:
, I
151 '
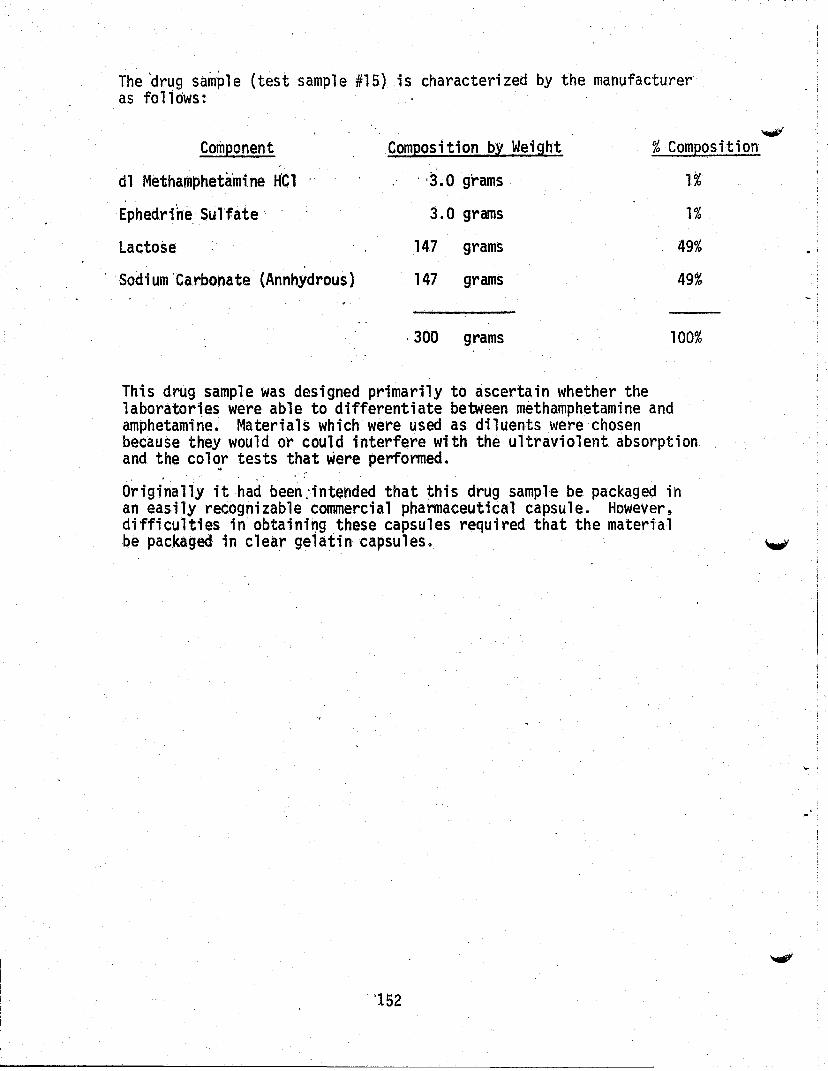
The drug sample (test sample #15) is characterized by the manufacturer as fo11ows:
Component
d1 Methamphetamtne HC1
Ephedrine. Sulfate
Lactose
Sodium'Carbonate (Annhydrous)
Composition by Weight
. '3.0 grams
3.0 grams
147 grams
. 147 grams
·300 grams
...,;I % Composition
1%
1%
49%
49%
100%
This drug sample was designed primarily to ascertain whether the laborator1es were able to differentiate between methamphetamine and amphetamine. Materials which were used as di1uents were chosen because they would or could interfere with the ultraviolent absorption and the col~r tests that were performed.
Originally it had been :intended that this drug sample be packaged in an easily recognizable commercial pharmaceutical capsule. However, difficulties in obtaini~g these capsules required that the material be packaged in clear gelatin capsules.
'152
'----------------------------------------------------------- ---
• I
. '

, .. ,
V
Table 07
Summary of Responses to Question 1
Question 1: The enclosed substance was a street buy.
The agent needs ~lJ tthe qualitative and quantitative information you can provide.
A)
B)
Di1uents:
Diluent found
Sugar oniy Carbonate only.. Sugar and Carbonate
Total Labs Repo'rting Cutting Agents
Contrell ed Substances:'
Controll ed Sub~ stance Found
Methamphetamine only Ephedrine only None Other Amphetamines Methamphetamine and Ephedr.i ne
Total
153
Number of L.abora-tories Reporting
this ResEonse
14 23 46
83
Number of Labs Reportir.g this Response
,31 17 7 4
87
146
% of Res ... ponding Labs
{'N=146) i
9.6% 15.8% 31.5%
56.8%
% of Responding Labs
21.2% 11.6%
4.8% 2.7%
59,6%
100.0%

Tabl e 68 "
Frequency of RepoTted Methods
Method
Chemical Tests
. - UV Spectroscopy
Gas Chromatography
. ~ ,"
Thin ... layer Chromatography. " .
. '.
'-
Micrcx;rystal1ine Tests"
Infrared Analysis
GC/Ma,ss Spectroscopy -
Extraction
X..;rii~~Diffraction
,-l 11'
pH
Microscopic Examinat10n
Fluorescent Studies ,"
Emi ssi,ori Spectroscopy-
Melting.Point
Paper Chromatography
Flam~ Test
Derivitization
Micro .. diffus;on
Phenylisothiocyanate Derivatives
Number of Labs Re~ porting Use of
this Method
154
127 .
115
lO~
96
65
6i
33
16
11
9
9
4
3
2
1
1
1
1
1
Percentage of Labs Reporting-Use of
this Method
87.0
78.8
70.5
65.8
44.5
41.8
22.6
11.0
7.5
6.2
6.2
2.7
2. 1 '
1.4
.7
.7
.7
.7
.7
-..,.;/

lAll CODE -----•. ---
DATE RECEIVED IN LAB ----
-DATA SHEET· PROFI CIEt/CY TESTING PROGRAM
TEST # i6 PAINT EXAHINATION
Item B represents a paint sample removed from the door jamb of a burglarized building. Iuems ~ and C represent samples found on. the clothing of two different suspects. ~ .
1. Could Items A or C have common origin with B1
YES
NO
INCONCLUSIVE
ITEM A
o o o
ITEM C
o o o
2. What infonnation (qualitative and quantitative) did you develop to arrive at your conclusions in Question 11 Please check all appropriate boxes and provide values where ~pplicable.
In the left hand column i!1dicateth~ s.equence (1,2.3 etc.) in which the tests \>/ere run. Indicate with an asterisk (*) the point where a conclusion was reached. even though subsequent tests were performed for confi~ato~ purposes.
Sequence of Testing
---
DEtlSITY STUDIES
EMISSION SPECTROSCOPY (Specify Elements Identified)
·FLUORESCENT STUDIES
INFRARED ANALYSIS
NACROSCO?IC EXAMINATION
-MICROSCOPIC EXAMINATION
PYROLYSIS G-C
SOLUBILITY TESTS (Specify Solvents Used)
THIll LAYER CHROMATOGRAPHY
UV SPECTROPHOTOMETRY
X-RAY DIFFRACTION
X-RAY FLUORESCENCE (Count Ratio)
OTHER (SPECIFY)
ITEM A . ITEN B ITEt1 C
r------------;----~--~--~-----------.---
r---------~-;------------~---------------.
r----------r----------+-----~----
155

, ,
'3. Please specify th~ information developed with each of the methods and ,instruments checked in Question' 2. (Example: Solubility tests usi n9 ~Cl» H2S04 » Acetone and HN03). ,Please, provi de speci fi c and complete responses. Attach' additional sheets if necessary.
, ,
Nethod: '
"
, "
",
Method: , '
r1ethod:
4. Additional Comments:
, ,.
DATA SHEETS NUST BE RECEIVED AT THE FOUNDATION OFfICE BY AuGUST 9,1976
156
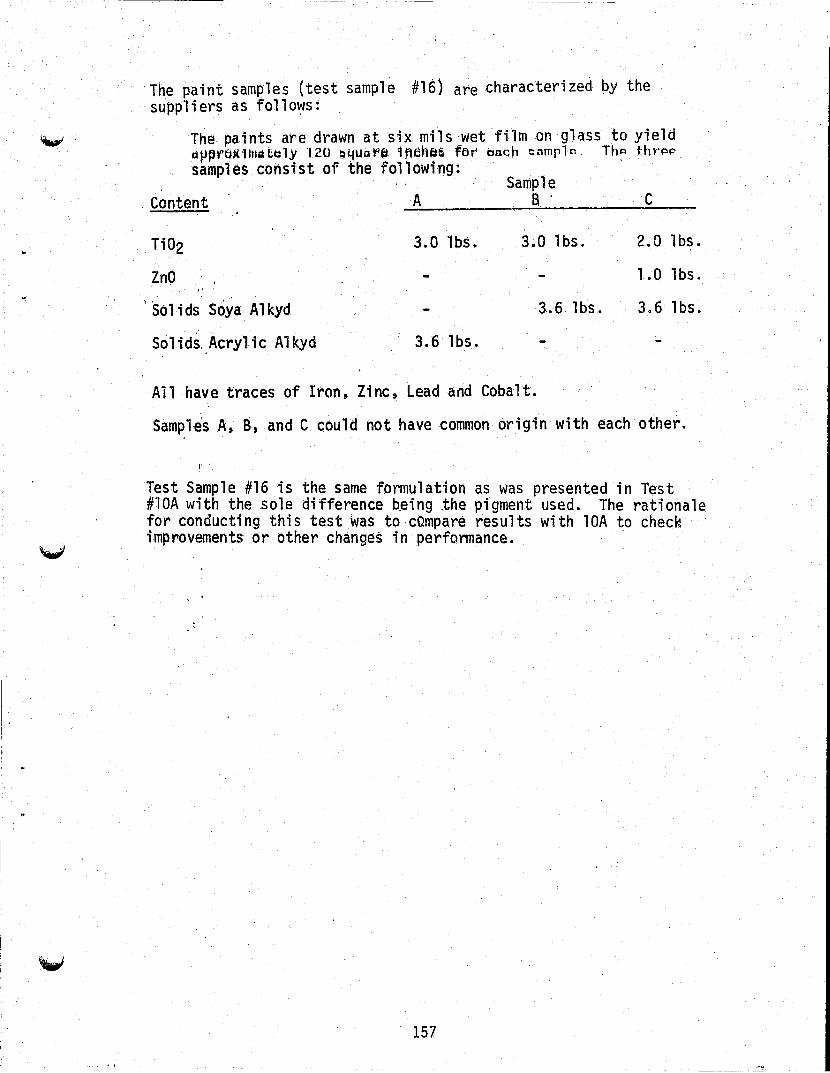
...... , "'" ~
The paint samples (test sample #16) are characterized by the suppliers as fo110~s:
The paints are drawn ,at six mils wet film on glass to yield dlJprOxllllfittlly '120 ~4uil\'le 1"ehf.t~ for' tJl1c;h l':i'IInpln Th~ thn:lp samples consist of the following:
Content
Ti02
ZnO
'Solids Soya Alkyd
Solids. Acrylic Alkyd
A
3.0 lbs.
3.6 lbs.
Sample B '
3.0 lbs.
3.6 lbs.
All have traces of Iron t Zinc, Lead and Coba1t.
C
2.0 lbs.
1 .0 1 bs.
3.6 1bs.
Sample's A, B, and C could not have common origin with each other.
Test Sample #16 is the same formulation as was presented in Test U10A with the sole difference b,eing the pigment used. The rationale for conducting this test Was to cOmpare results with lOA to check! improvements or other changes in performance.
157
--~

Table 69
FREQUENCY OF REPORTED METHODS USED TO ANSWER QUESTION 2
QUestion 2: What information did you develop to arrive at your conclusion?
Method
Mi.croscopic Examination Mac'roscopic Examination
, Sol ubi 1 i ty~ Tests Pyrolysi s G-C • Infrared ,Analysis ' Emission Spectroscopy Fluorescent Studies X-r~y Fluorescence X-ray Diffraction Thin Layer Chromatography UV Spectrophotometry Density Studies Visible Spectrophotometry Microchemical EDAX Energy Dispersive Spectroscopy Thermogravimetric Analysis Polarizing Microscopy Scanning Electron Microscope Spectral Reflectance GC of Binder Extract
Number of Reported Uses,of
Th i' s Method
95 88 87 61 48
.35 '31 22 14 14 8 4 2 2 1 1 1 1 1 1 1
* Total (102) does not include late responses ell.
158
% of Responding Labs
U~inS'Thi~ M~thod*
93.1% 86.3% 85.3% 59.8% 47.1% '34.3% 30.4% 21.6% 13.7% 13.7%
7.8% 3.9'% 2.0% 2.0% 1.0% 1.0% 1.0%
, 1.0% 1.0% 1.0% 1.0%
-
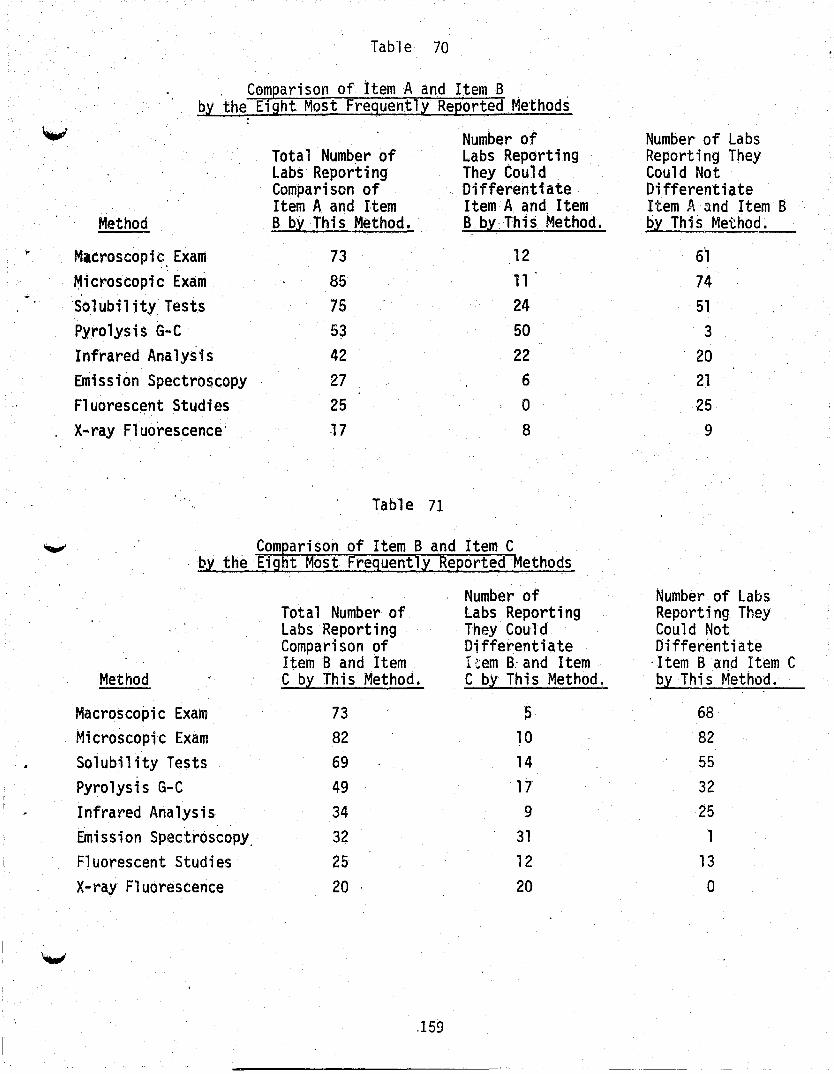
Table 70
. C0mpari son of item A and Item B, . by the Eight Most Frequently Reported Methods
~ Number of Total Number of Labs Reporting Labs Reporting They Could Comparison of Differentiate· Item A and ltem Item.A and Item
Method B bX This Method. B.bX'This Method. ...
Microscopi~: Exam 73 12 ~icroscopic Exam 85 11 'Solubility Tests 75 24 Pyrolysis G-C 5~ 50 Infrared Analysis 42 22 Emission Spectroscopy 27 6 Fluoresc~ht Studies 25 0
X-ray Fluorescence' 17 8
Table 71
Comparison of Item B and Item C . by the Eight Most Frequentlx Reported Methods
Number of Total Number of Labs Reporting Labs Reporting They Could Comparison of Differentiate Item B and Item r ::em B.' and Item
Method C bl This Method. C bl This Method.
Macroscopic Exam 73 ~
Mi croscopi'c Exam 82 10 Solubility Tests 69 14 Pyrolysis G-C 49 17 Infrared Analysis 34 9 Emission Spectroscopy.· 32 31 Fluorescent Studies 25 12
X-ray Fluorescence 20 20
.159
Number of Labs Reporting They Could Not Differentiate Item A and Item B bX This Method.
61 74 51 3
20 21 25
9
Number. of Labs Reporting They Could Not Differentiate
'Item B and Item C bX Thi s Method.
68 82 55
32 25
1
13 o

FIGURE 23 ~1ETAL EXAMINATlON
LAB CODE
o CHECK HERE (AND RETURN) IF YOU DO NOT PERFORM t'IETAL EXAr~INATION
DATE RECEIVED IN LAP
DATE PROCESSED IN LAB
DATA SHEET ' PROFICIENCY TESTING PROGRAM
TEST #17 , METAL EXAMINATION
Items A;B; and C represent metal'samples submitted iii connection with a crimi na 1 case.
1. a) Could Items 'A and B have a COlMlori origin? - ,.-
DYes
DNa D Inconcl us i ve
, . b) Could Items A and .£ have a cominon origin?
, DYes
DNo o Inconclusive
c) Gould Items £ and ,Chave a common orig'in?
DYes
DNa o InconCl us i ve
2. What tests were employed to answer Question l? (Please bespecif-ic, e.g. emissi on spectroscopy, energy di spers i vI:! X-Ray, etc.) 'Use paga 4 if additional space is requited. a. __________________ _
b. ----------------------------.----------------~----------
c.
d.
161

Element -
3. Please. report any elemental data (both qualitative and quantitative)' developed in the analysis of Items At Bt and C. Report. quantitative dat.a in either % byweightqrppm •. Indicate which instrumental techniques identified each ~lement reported.
ITEM A . I.EM B ITEM C
Instrument· Quantity Element Instrument Quantity Element Instrument
..
162
Quantity
..
...,
:
i'" i I i-
i J.

~ , .4':.},t;g~t.ticlnar elelnentswer:" s?ught but found .~9! to be present in :'~'Ftrems'A,B, and C, plea~e lndlcate those elements below.
ITEM A ITEM B ITEM C
Element Instru'ction Instruction Element Instruction
163
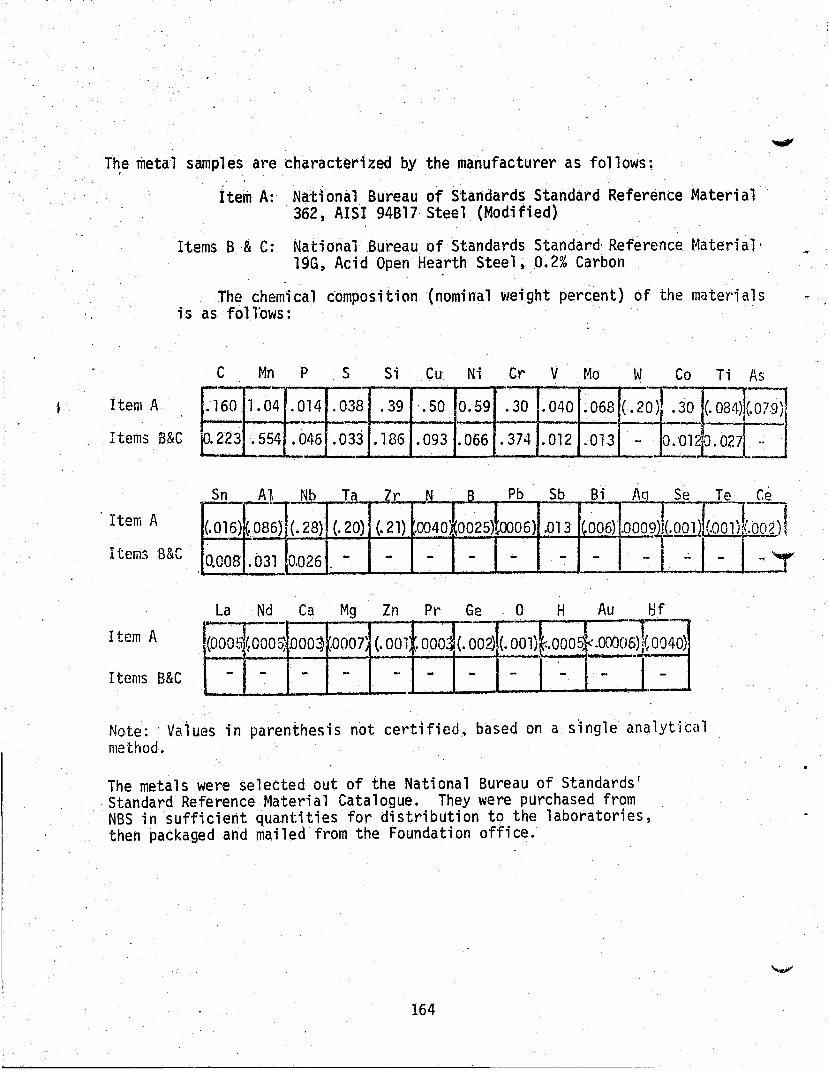
The 'meta'l sampl es are characteri zed by the manufacturer as follows;
Item A
item A: National Bureau of Standards Standard Reference Material 362, AISI 94B17, Steel (Modified)
Items B & C: National.Bureau of Standards Standard· Reference t4aterial· 19G, Acid Open Hearth Steel, 0.2% Carbon
The chemical c'omposition '(nominal weight percent) of the mateY'ials is as follows:
C Mn P ,S S1 Cu Ni Cr V Mo w Co Ti As - ;r . 160 1.04 .014 .038 .39 '.50 0.59 . 30 .040 .068 ( .20) . - -Items B&C 0. 223 .554 .046 .033 .186 .093 .066 .374 .012 .013 - O.
30 (. 08~(.0~i!1 01~'~[~
Item A
Sn Al Nb Ta Zr N B Pb Sb Bi Ag Se Te Ce (.016)1~ 08;,1(. 28) (.20) (.21) .0040 0025)lOO06) .013 'W06) l.o00g)'1001l(~;,;1(.b02 0.008 .031 0,026 - - - - 1- - - I -l ~ - : Items B&C
La Nd Ca Mg Zn Pr Ge o H Au I::lf
{D005 ~OOO~ DOO~~OOO7' (.001 ,OOO~ (. 002)(. 00l)~.0005f< .oooo~J~oo·; "'1 .. Item A
Items B&C - - - - - - - - - - -
Note: ' Va1ues in parenthe5is not certified. based on a s~ng1e analytical method.
The metals were selected out of the National Bureau of Standards' Standard Reference Material Catalogue. They were purchased from NBS in sufficient quantities for distribution to the laboratories, then packaged and mailed from the Foundation office.
164
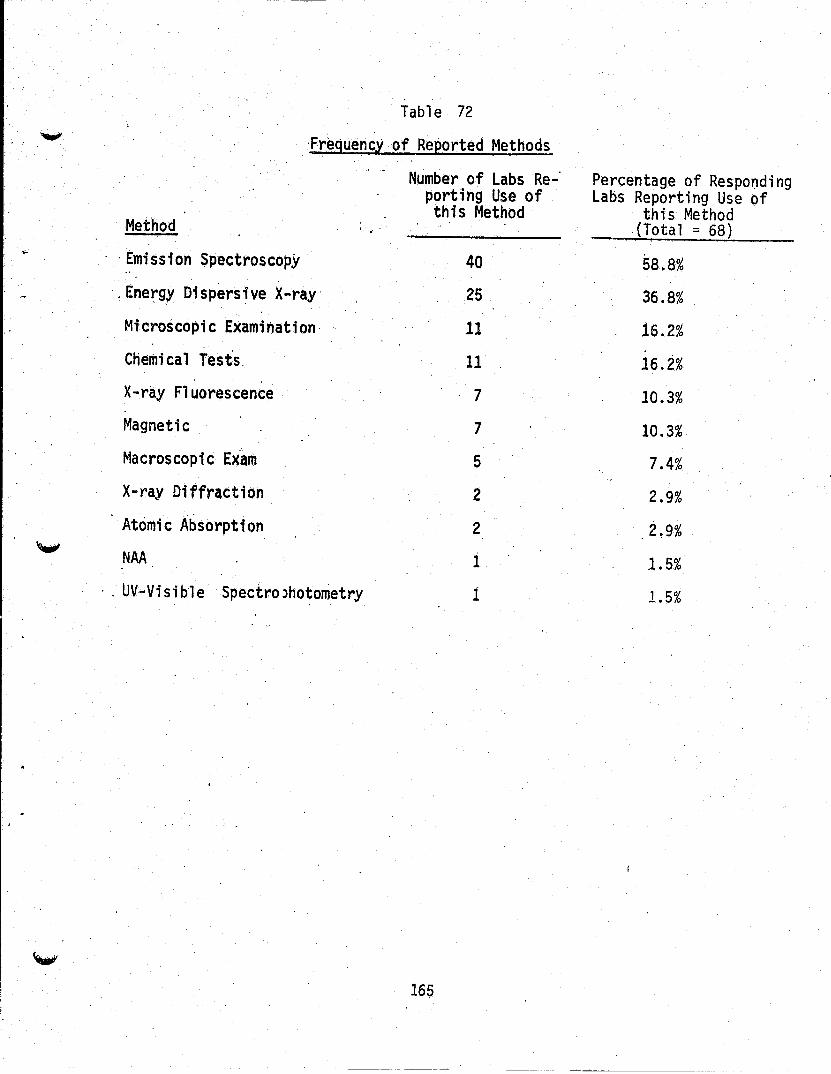
~
Method
... Emission Spectroscopy
Table 72
"FrequencY" of Reported Methods
Number of Labs Re-" porting Use of this Method
40
".Energy Dispersive X-ray 25
Microscopic Examination 11
Chemical Tests 11
X-ray Fluorescence 7
Magnetic 7
Macroscopi c Ex"am 5
X-ray Diffraction 2
Atomic Absorption 2
NAA 1
" . UV-Visible SpectroJhotometry 1
165
Percentage of Responding Labs Reporting Use of
this Method (Total = 68)
58.8%
36.8%
16.2%
16.2%
10.3%
10.3%
7.4%
2.9%
1.5%
1.5%
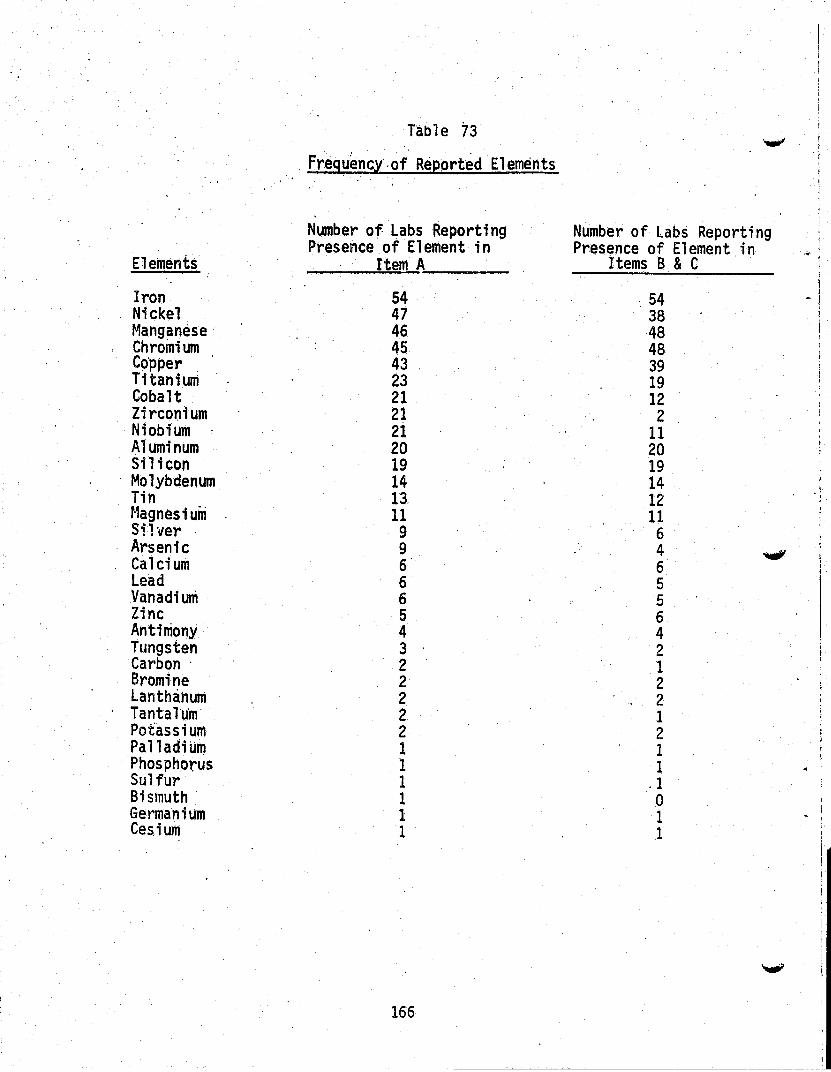
Elements
Iron Nickel Manganese Chromium CO'pper , Titanium Cobalt Zirconium Niobium . Aluminum Silicon Molybdenum Tin Magnesium Si1ver Arsenic Calcium Lead Vanadium Zinc Antimony Tungsten Carbon' Bromine Lanthanum Tantalum' Potassium Palladium Phosphorus Sulfur Bi smuth Germanium Ces.ium
Table 73
, Frequency:of Reported Elements
Number of Labs Reporting Presence of Element in ~ ____ ~It~e~m~A~ ____ __
54 47 46 45 43 23 21 21 2i 20 19 14 13, 11 9 9 6' 6 6 5 4 3 2 2 2 2 2 1 1 1 1 1 1
166
Number of Labs Reporting Presence of Element in
Items B & C
, 54 38 48 48 39 19 12 2
11 20 19 14 12 11 6 4 6 5 5 6 4 2 1 2 2 1 2 1 1
.1 o 1 1

U\8 CODE --_.-FIGURE 24 HAI~ EX.tl."1I~IATIO~l o CHECK HERE (AND RETURN) I F YOU DO NOT PERFORM HAIR EXAMINATION
DATA SHEEt PROFICIENCY TESTING PROGRAM
TEST SAr~PLE #18 HAIR EXAMINATION
DATE RECEIVED IN LAB
OATE PROCESSED IN lAR
The hair samples A, B, C, D and E were collected in connection'with a criminal investigatiDn ..
. l. Please provide species origin for each hair sample.
, , S'ample A
Sample B ,
Sample D
, ,Sainpl e E
:. 2. Please specify the methods used to answer question 1.
1.
2.
3.
- Over -
167
---

2 - .
3. Dqe.s yoLir laboratory have a reference collection of hairs?
o Ves D No
If liVes"; is this your own "in-house ij collection or a commercially available collection?
. '.0 .. i n-house ll D commercial
Please: specify __ ...,....-'--___ _
4. Additiona'l· Comments:
DAlA SHEETS MUST BE POSH1ARKED BY OCTOBER 31, 1976
168
L-____________________________________________ _

The hair sampies are chaOracterized by the manufacturer as 'follows:
Item A Dog Item B Cat Item C Deer Item 0 Cow
0' Item E Mink
The decision to use hair as a sample °type was made because it is encountered in many laboratory investigations. The rationale for the choices of hair specimens was based on the following:
l)oOog and Cat hairs because they are commonly encountered domestic animals;
2) Mink hair because it is often encountered in stolen property;
3) Cow hair because it is encountered in livestock theft ° which is a prominent crime in many areas;
4) Deer hair because it is encountered in cri.mes such as hit-and-run accidents and shooting animals out of season.
The hair from the domestic animals (dog and cat) was obtained from the pets of employees. The mink hair was obtained from a local mink farm. The cow hair was obtained. from a local processing meat packing house, and the deer hair came from 'a freshly killed animal from the game department.
The major problem encountered in the packaging of the hairs was ensuring that there were both br.istle o(guard) and wool hairs amongst each sample that was packaged.
The hairs were placed in glassine envelopes and sealed. They were then placed in brown manila envelopes, marked and sent to the Forensic Sciences Foundation. °
169

Table 74
. Summary of Responses toguestion.l* for Sample A
Response
dog cow
. bear horse cat ;rat
. skunk non-human inconclusive no response
Number of Laboratories giving Response
Table 75
44 6 5 2 2 2 1
17 8 3
Sunrnary of Responses to guestionl* for SaJl)ple '8
Response
cat dog mouse squirrel fox non .. human inconclusive no response ..
Number of Laboratories giving Response
Table 76
66 3 1 i 1
13 2 3
Summary of Responses to Questionl~ for SallJPle C
Response
. deer elk horse goat cow pig dog non-human inconclusive no response
Number· of Laboratories giving Response
41 13 9 5' 2 1 1
10 4 4
*Question 1: Please provide species origin for each hair sample.
170 .
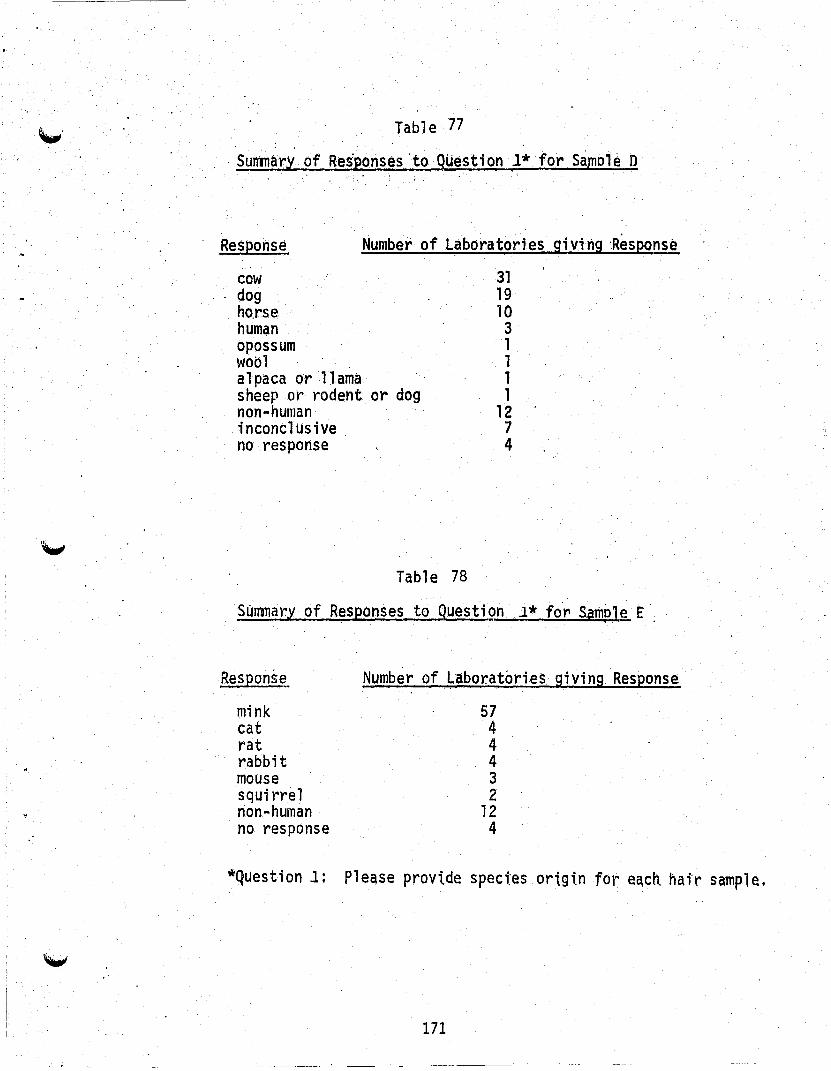
Table 77
Surrmaryof Responses 'to QUestion 1* for Samole D
Response Number of Laboratories giving 'Respo~
cow 31 dog 19 hO.rse 10 human 3 opossum 1 wool 1 alpaca or llama. 1 sheep or rodent or dog 1 non-human 12 inconclusive 7 no response 4
Table 78
Summary of Responses to Questi9n 1* fo~ SamDle E , .
Response,;..
mink cat rat rabbit mouse squirrel non-human no response
Number of Laboratories giving Response
57 4 4 4 3 2
12 4
·Question 1: please provide speci,'es origin for each. hai'r sample.
171

Tnble 79
SUnlnary of Responses.to QUestion 2
Questioh ,2:. Please. specify the methods used to answer Questfoh 1.
Method
Microscopic*
Macroscopic
No Response
Number of Labs. Reporting Use of this Method·
88
9
2
.*Microscopic refers to use of anyone or more of 'v.arioiJs types 'of microscopic examinations
172
..

LAB, CODE __ ___
'FIGURE 25 WOOD'EXAMINATION
o CHECK HERE (AND RETURN) IF YOU DO NOT PERFORM WOOD EXAMINATION
DATA SHEET PROFICIENCY TESTING PROGRAM
TEST '#19 WOOD EXAMINATION
DATE RECEIVED IN LAB
DATE PROCESSED iN LAB
Items A, B,and Crepresent wood 'samples subm1ttecr in connection with a criminal case ..
1. a) Could Items A an'd',B h~vea common origin?
DYes o No
o InconcluSive
b) Could Items ,A and C have a common origin?
'-" 0 Yes,'
o No o Inc~nclusive c) Could Items Band C have a common origin?
o Ye~ o No,
o Inconcl usive
2. Please indicate species for:!
Item A .----------------------------~-----------
Item B -----------------------------------------------Item C
------------------------~---------------------
(over)
173
-_._--
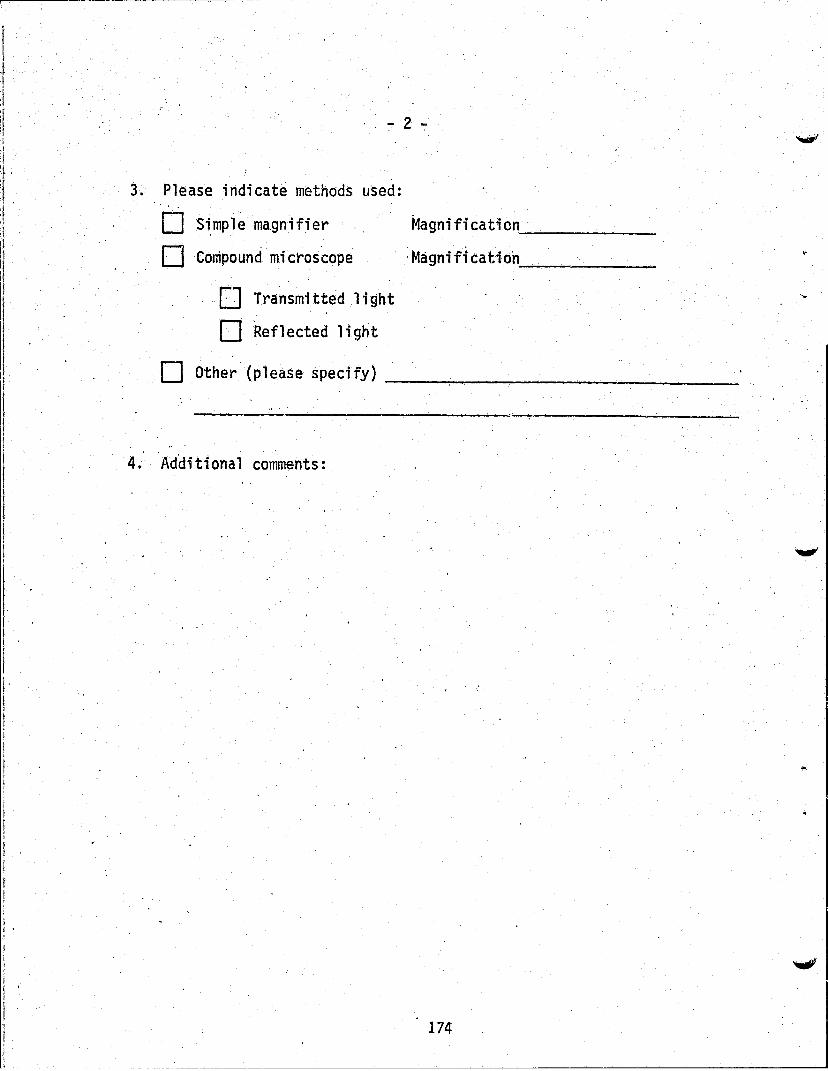
,I
I
r' I I I
I r .
f . [ I ! I
! f
f !
I !, I f I I
3.
4.
Please indicate methods used: , ,
0 Simple magnifier Magnification
0 Co~pound microscope 'Magnification
0 Transmitted light '. 0 Reflected light
0 Other (please specify)
"~
Ad'di ti ona 1 comments:
174

>'''WI
"""he wood samples are char,acterized,by the manufacturer as the following:
Item A - Abies .grandis. Fir
> Whfti'sh to yellowish, brown, straight grained, with no characteristic odor or taste. Growth rings distinct. Parenchyma not apparent with unaided eye. Rays ve\"y fine, not, distinct with unaided eye. Res.in canals absent (cross sect; on). Trachei ds average 30-50 mi crons in di ameter. 'Oi ffuse
. porous vessels (cross section). Intervessel pits linear. Pit apertures 'markedly elongated in the horizontal directiqn across a vessel element (tangential section, pulp). Parenchyma arrangement apotracheal. Parenchyma arranged independently of vessels, appearing as several white lines within growth ring, a'nd running in a direction parallel to the growth dng (cross section). Rays exclusively uhiseriate and variable in height (tangential section).
Item B - Acer saccharum. Maple
Growth rings distinct .. Sapwood white with a reddish tinge. Heartwood light redding brown. No characteristic odor or taste. Uniform pores, apparent only with magnification, distributed evenly throughout the growth ring (cross section). Parenchyma not visible without magnification. Rays of two distinct \'Iidths. , Rays unstoried and essentially homogeneous, 1 to 8 seriate (tangential section}. Rays unicellular, composed entirely of procumbent or upright cells (radial section). Vessels 70-90 microns in diamete~, numbering 40-80 per square mm. Spiral thickening apparent (radial or tangential section, pulp), Perforation plates simple' (radial section, pulp). Alt~rnate intervessel pits orbicular to hexagonal, 6-10 microns in diameter (tangential section, pulp).
Item C - Pinus monticola. ·Pine
Sapwood nearly white to pale yellowish white. Heartwood cream colored to light brown. Slight resinous, non-characteristic odor. No characteristic taste. Growth rings distinct. Parehchyma not visiblr with unaided eye. Rays very fine, not ordinarily visible with unaided eye. Normal longitudinal resin canals ~resent. Intercellular spaces scatte~ed throughout growth rings (cross section). Thin-walled resin canal epithelium. Cells immediately surrounding resin canal are thin-walled and frequently badly torn in sectio;,lng (cross section, tangential section). ~verage diameter of longitudinal resin canal about 135-150 microns, measured in direction parallel to growth rings, and including epithelium (cross section). ~ay tracheids regularly present. Cells often confined to margins of the rays and may be recog-nized by theirsn1c111 bordf-~red pits (rad'ial section). Ray parenchyma' end walls smooth (radial section, pulp). Fenestriform ~ross-fie~d pits. 1 to 2 rectangular window':'1ike Pits per field ()'adial section, pulp).
175

The wood samples were small portions of trees rigorously identified as ,to genus'and species before they were fe1led. The speci'mens were intended initially for use as standards i~ a wood identification course at the University of California, Berkeley. The identification of the wood as to species waS confirmed by the faculty of the School of Forestry, at the Berkeley campus; as gross specimens and by microscopic examination of sections and of mascerated fibers.
The larger pieces of wood, measuring approximatelY,6,II, X 4" X 5/16", were split into small pieces and delivered to the. Forensic Sciences Foundation. The three species were split and packaged sequentially to av~id possible confusion of the samples.. If thi,s experiment were attempted in,the, future, the,~pproach used in.this test sample woul,d appear to be adequate and satisfactory.
i76
..

Tab le 80
Responses to Question 2 for Item A
Question 2: Please ihdicate species for Item A
Percentage of Labs Giving
Response Nu~be~ of b~bs Giving Response Response
Softwood' 7 10.9
Fir 16 25.0
Pine 8 12.5·
Cedar 2 3.1 .
Spruce 2 3,1
Redwood 1 1.6
Hemlock 1 1,6
Cha~maecyerfs 1 1.6
Not determtned 26 40.6
Table 81
Responses to Question 2 for Item B • 4
Question 2.: Ple~se indicate ~p~cies for Item B
Response
Hardwooa
Number of Labs Giving Response.
Maple
Beech
Lithiocarpus Tanbark Qak
Birch
Basswood
Halnut'
Mahogany
Oak
Not determtned
8
20
2
1
1
1
1
1
1
28
177
Percentage of Labs Giving
Response
12.5
31.3
3.1
1.6
1.6
1.6
1.6
1.6
1.6

I i I f , ;
I t
r I
.'
! :,\ il .', "
Softwood'
Pine
Cedar
ftr
Redwood
Table 82
Responses to'guestion'2 for Item C
Questton 2: Please indicate species for Item C
"Num~~~of'la5~ Gt~t~9~Response • i •• 4 ••• 4 • q • ; •• 4 ... ., ,
7
23
2
1
1
Percentage of Labs Giving
Response
10.9
35.9
3.1
1.6
1,6
Not determined 30 46.9
178
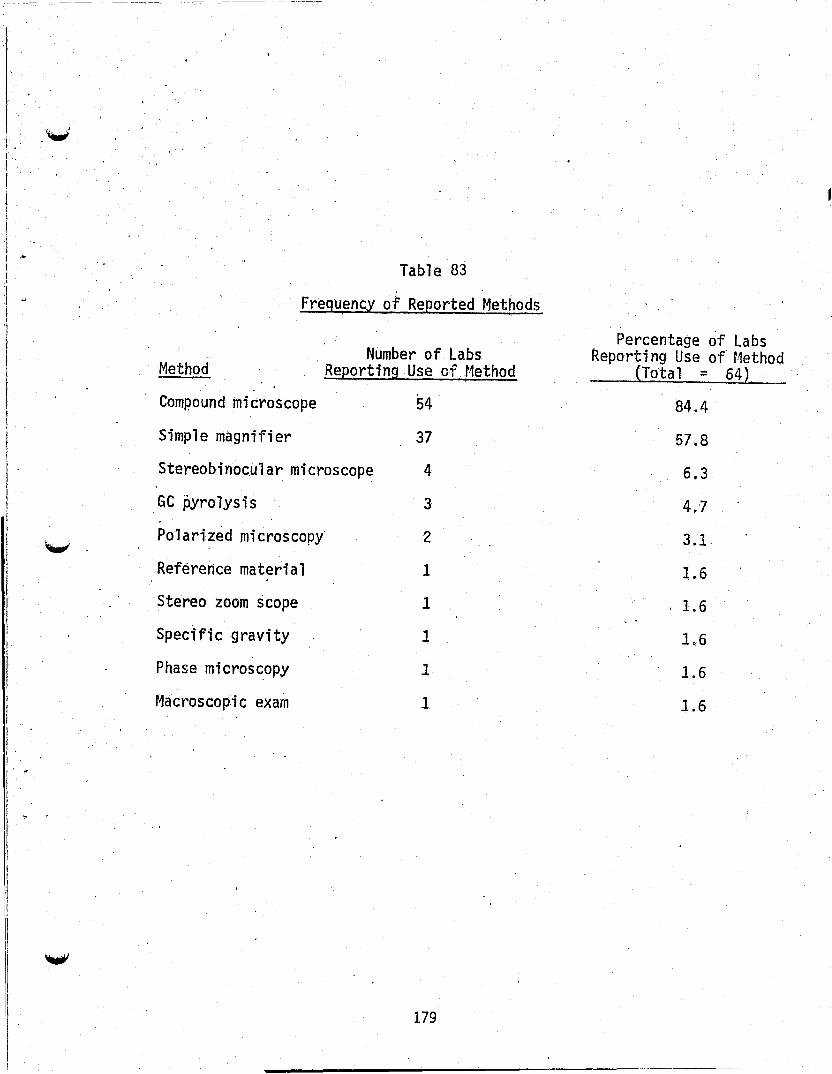
i I.
I ! ! j 1 I ! I ,.. J
I
I I I ! I ! ! . I I I
! I
I I
i I ! I .
I I' ~
I r
! I I
! I I f
'" .
Table 83
Frequency of Reported Methods
Number of Labs Method Reporting Use of Method
Compound microscope 54
Simple magnifier 37
Stereobinocular microscope 4
GC pyrolysis 3
Polarized microscopy 2
Reference material 1
Stereo zoom scope 1
Specific gravity 1
Phase mi croscopy 1
Macroscopic exam 1
179
Percentage of Labs Reporting Use of Method
(Total = 64)
84.4
57.8
6.3
4.-?
3.1
1.6
1.6
1.6
1.6
1.6
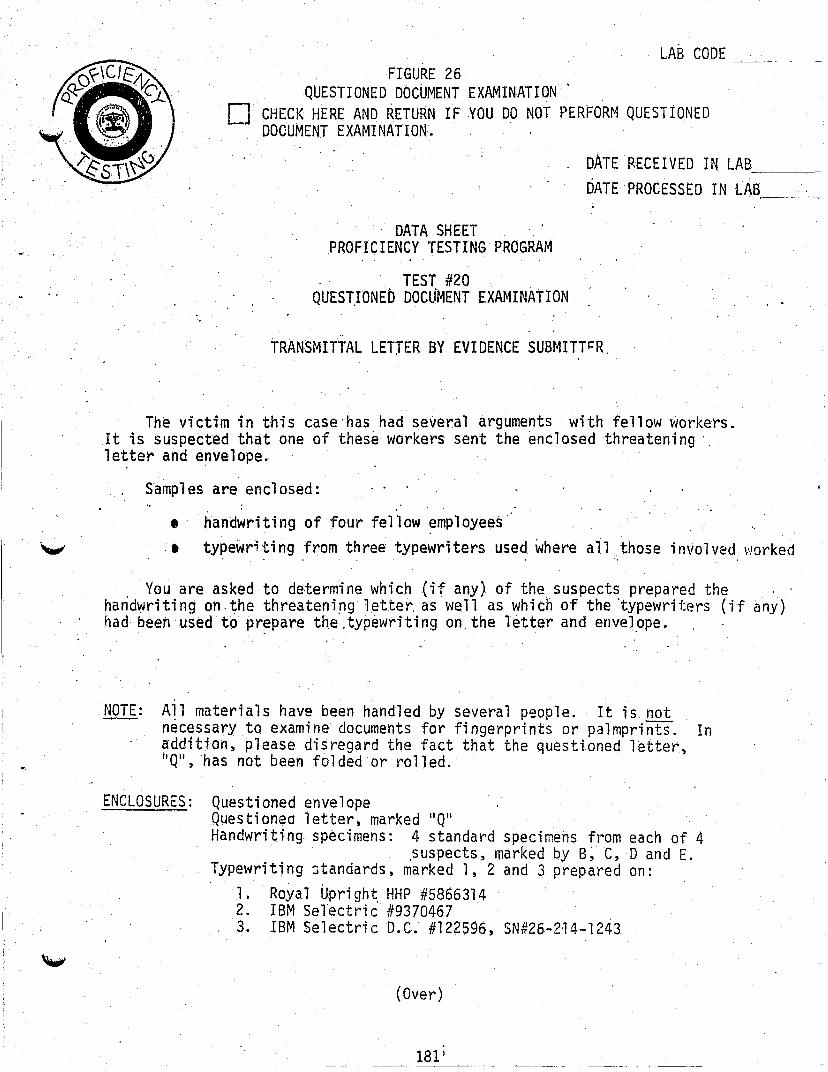
o
LAB CODE FIGURE 26
QUESTIONED DOCUMENT EXAMINATION . . ,
CHECK HERE AND ~ETURN IF YOU DO NOT PER~ORM QUESTIONED DOCUMENT EXAMINATION.
DATE RECEIVED IN LAB .-~~-
DATA SHEET PROFICIENCY TESTING PROGRAM
. TEST #20 QUEST,IONED DOcUMENT EXAMINATION
DATE'PROCESStD IN LAB,_~. _
TRANSMITTAL LETTER BY EVIDENCE SUBMITT~R,
The victim in this case'has had several arguments with fellow workers. Itis suspected that one of these'workers sent the enclosed threatening '. lette~ and envelope.
Samples are enclosed:
.' handwriting of four fellow ~mployees • typewriting from three typewriters used where all those involved \"iorked
, You are asked to determine.which.(if any) of the suspects prepared the handwriting on,the threateni!1g letter, as well as which of the 'typewriters (if any) .had been used' topr~pare the, typewriti n9 on, the 1 etter and enve l.ope.
NOTE: A1l materials have been handled by several people. It is not necessary to examine documents for fingerprints Or palmprints. In addition, please disregard the fact that the questioned letter, "Q", has not been folded or rolled.
ENCLOSURES: Questioned envelope Questionea letter, marked IIQ" Handwriting sp~cimens: 4 standard specimens from each of 4
,suspects, marked by B, C, 0 and E. Typewriting standards, marked 1, 2 and 3 prepared on:
1. Royal Upright, HHP#5866314 2. IBM Sel~ctric #9370467 3. IBM Selectric D.C. #122596, SN#26-2~4-l243
(Over)
181 1

- 2 -
l. Did any of the susp'ects execute the handwriting on the questioned 1 etter?
D Yes ,If "yes", whi ch one'~ D 13
0 No 0 C
0 In.conclusive D 0
D E
2. Was any of the three typewri ters used' to prepare the envelope?
0 Yes If lIyes ll, which one? 0 1
0 No 0 2
0 I nconcl us i ve 0 3
,3. Was any of the three typewriters used to prepare the questioned 1 etter?
0 Yes If lIyes li, which one? 0 1
0 No 0 2
0 Incond us i ve D 3
,4. Could any of the three typew,riters be excluded as having been liSed to prepare the questioned letter?
0 Yes If lIyes ll,' i ndi cate
,0 No which one(s) 0 1
0 Inconclusive 0 2
0 3
5. Please explain any factors or observations which influenced the development of your opinion. (Attach additional sheets if necessary.)
6. boes your laboratory maintain a reference file of ~ypewriting standards? ,DYes 0 No
"
Please describe briefly: ______________________ _
7. Additional Comments: (Attach additional sheets.)
182

i I I I
'Wo. The quest;'oned document samples are' characterized by the manufacturer as folim'Js:
,Handwriting
Ideal Answer: Suspect Bwrote the qtiestioned writing on the threatening letter (thus eli,minating Suspects C,.D,E).
Conservative Answer: Variaiiol'1s in suspectts wrlting precluded definite opinion but sOille similarities noted. Differences noted with writing of Suspects C,D,E. .
All samples were prepared by having Messrs. B, C, D and ~ write the specimens from a typewritten message. All four people who executed handwriting in this specimen were sel~cted from the manufacturer's laboratory staff. One individual (writer E) had a reasonably similar handwriting to that Of the Q writer (writer B). Writer E was asked to modify his "Y II and "I" to conform to those executed by writer B. This actiOn ,tQ make the test slightly more difficult was taken b,ecause critiqu~s of the preliminary specimens i.ndicated the test Was too simple. .
Typewriting
Ideal Answer: Typewriter used to type Std. #1 \'las used to type the envelope. The typing element or ball, used to type Std. #3 was used to type the Q letter possibly using the sahle typewriter. Q could not have been typed on,the same typewriter used to prepare typewriter Std. #2.
The machine'which typed typewriter Std. #2 could not have typed th~ Q letter because it cannot type 12 spaces to the inch. The typing element. characters do'not bear the relatively large number of individual, characterizing letterface defects present in the Q letter.
The Courier 12 ball used in Q and typing Std. #3 has the following defects:
lower case II mil n.=!o ~;, center serif missing, lower case "gil !i:'5 tefect at approximately 1 o'clock, lower case "y" h·:.s Im.,rer left sed f shortened, lm'ler case "r" r.as lQl,4er right serif shortened, lower case lit" n"· the crossing bar shortened from the -:::. right.
Handwriting and typewriting are the most commonly encountered types
I 'W
1
of questioned documents evidence. Th~ questioned documents specimens were oriented towards stimulating the. largest possible number of laboratories. which were doing any document work at all, to participate. Thus, the test was very simple in design and easy to answer correctly. This thinking and execution were proven to be quite satisfactory with a large number of laboratories responding. The original specimens.were mOdified only very slightly because of the previewers' feedback that the sample was far too easy to analyze. l
183
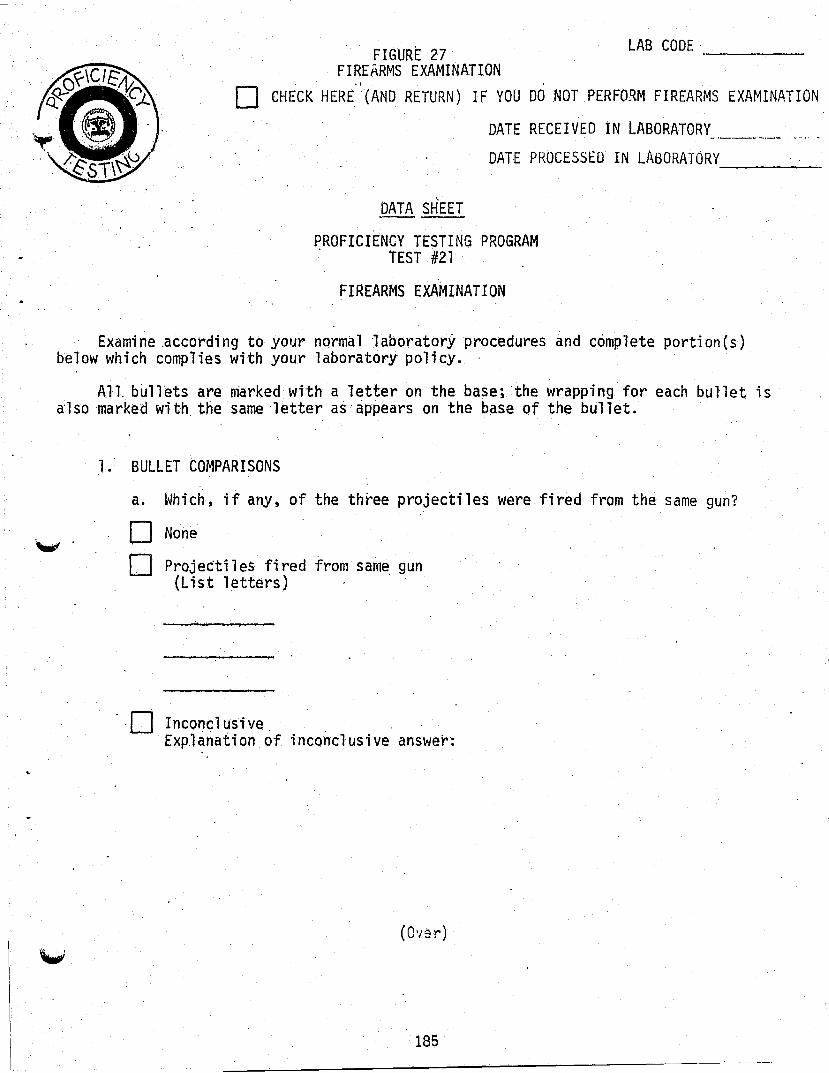
o FIGURE 27
FIREARMS EXAMINATION ., .
LAB CODE -----
CHECK HERE (AND RETURN) IF YOU DO ,NOT PERFORM FIREARMS EXAMINATION
DATE RECEIVED IN LABORATORY
DATE PROCESSED IN LABORATORY _____ ,
DATA SH'EET
PROFICIENCY TESTING PROGRAM , TEST #21
FIREARMS EXAMINATION
Exami ne ,accordi ng to yOI .. 1r nQrma 11 aboratory procedures and complete porti on (5) below which complies with your laboratory policy. '
All. bullets are m'arked with a letter on the base;'the wrapping for each bul1et;s a'lsomarked with the same letter as' appears on the b~se of the bullet.
1. BULLET COMPARISONS
a. Which, if any, of the three projectiles were fired from the same gun?
o o
'0
None
Projettiles fired from same gun (List letters)
Inconc 1 us i ve , Explanation of inconclusive answe~:
(Over)
185
! I
!
t
r , I
I I
! f I , i t
! I
I
I I I I
I I II It It 'I I,
II I, il
II II 'i • f I
!
It II
I!
- 2 -
2., ADDITIONAL COMMENTS:
DATA SHEETS MUST' BE POST:-!ARKED BY MARCH 4, 1977
186

I·
I I I
f
I l I •
l
t
I ! !
II !! , ! I . ,I '. Ii ! I
I I j
I ,j
I I I t r ! 1
, I
: I : I I
i r
: I , I
I I; , I
The firearms sample can be characterized according to the sample manufacturer as follows:
"The co~per-jacketed bullet (,marked on the base with any one of the following letters assigned on the basis of random selection: A, B, C, 0, E, F, G, H, J, K, L~ 0, P, Q, R, S, T, U, V, V) was fired from a Wilkinson .25 Auto pistol, Diane Model, Serial Number 00386. A total of 127 rounds \'/ere fi red in seven groups.
The copper-jacketed ·bullets (marked on the base with,any one of the following letters assigned on the basis of random selection: I, M~ N, X, Z)'were fired from a second Wilkihson .25 Auto pistol, Diane Model, Serial Number 00113. A total of 263 rounds were fired in six groups.
The two· barrels used were rifled within 10 of each other.1I
This test was designed to measure the proficiency of laboratories in the comparison of individual characteristics of fired bullets with less than highly individual marking.
\~ The bullets were assembled into test samples that were made up from within the same firing batch. Eighteen to forty-four bullets fired consecutively was a batch. In order to minimize the possifule changes
'V .
that might have occurred in the barrels avera period of time; no bullets ftom the first batch of·firings were packaged with any bullets from the last batch.
187
\ ! ~ I
I I
\
I I I t
, i ! t
I l '\ I 1 •
i I I , . , ! !
t
'\ :, I ,;
'n
'\ ! t l
i I
I !
w
..
. '-'"
INTRODUCTION
CHAPTER IV
'FINDINGS
In this volume, the project has been described in. the context of the' parameters within which it was conducted throughout its :three year duration. It is worthwhile to review the more significant .of those
. parameters before citing and discussing the findings drawn from obServations presented in previous chapters.
The' overriding prqject parameter, the one that did more to dictate the conditions under which most scheduled activities of the project were undertaken, was cited in the opening paragraph of Part IV of the Grant Proposal: 1I**a research study of how to prepare and , distribute specific samples; how to analyze'laboratory results; and how to report those results in a meaningful manner. III As such, the project could not also be conducted like an established, proven, sustaining proficiency testing program--a point overlooked by some laboratories and observers. The fact that the activities of the project produced accurate and meaningful data by which to make a li.mited assessment of general laboratot:'y.capabilities is a tribute to the contri but; on made by r:~e _ i ndi vi dua 1 sand 1 aboratori es who participated;n the research effort.
The s'econd parameter of significance to the conduct of project activities was the constant uncertainty of participation by the approximately 240 laboratories in the United States, its possessions and Canada, and the constant requirement fOr sensitivity to laboratory reaction to various activities, while, at the same time conducting an honest research program. Because of the autonomY exercised by the cities, counties and states for whom most of the laboratories work, participation was openly declared to be "VOluntary". Non-participation could result from any number of conditions among which were: a simple dishelief in proficiency testing; concern that confidentiality of data would not be maintained; and, not least, the concern that the; r 1 aboratory woul d not do well in the tests. Note that such reasons for non-participation as a heavy laboratory workload or non-performance-of particular types of tests are not inclUded in the conditions cited above because workload and limited servic~
IFi rst Paragraph~ Part IV, Program Narrati ve, "Project Pl an Summary," Application for Federal Assistance, January 27,19.76
189

are uncompromising facts of life. The others are opinions .
. In sUlTIllary, the manner in which various activities were accomplished was significantly influenced by the fact that this was a research project ... not an on-going proficiency testing program ... and that participation by the laboratories was, of necessity, voluntary. In that context, the findings which follow are divided into two broad categories: . those that apply to the research in how to conduct a criminalistics proficiency testing program and those applicable to the results obtained from actual tests of proficiency.

. ;
Table 84 RESPONSE RATES
TEST SAMPLE NUMBER 1: CONTROLLED SUBSTANCE
(205)
(n :: 236) '2* Participation Rate = 90%
TEST SAMPLE NUMBER 2: FIREARMS EVIDENCE
I (124) -----r~-r--"?,-"7( 3~~.--y--,,-"""ii:-:-:i~":""':I;~ (n = 170)3*
Participation Rate = 78%
TEST SAMPLE NUMBER 3: BLOOD ANALYSIS
, (158)
(n = 235) Participation Rate = 81%
TEST, SAMPLE NUMBER 4: GLASS EXAMINATION
(129)
(n = 234) Participation Rate = 70%
TEST SAMPLE NUMBER 5: AUTO PAINT EXAMINATION
(121 )
(n = 232) Participation Rate = 67%
D = Response With Data
. :~ = No. Response
:::::: = Do No~ P~rform This ~yp~ ~f Analysis
* - See Page 195. 191 . , .
~ .......... , .................... :i8) :~<i3:9{< . . . . . . . . , . . . . . . . . . . . . . . . . . . . . . j ••••••••••••••••••••
'.' .......... . " ............. . · ........... . • •••• III •••••••
-: -: -: • :- (' 4' 9'): -: -: -: -:-: • • III • • • •••• · . . . . .... . · ........... . · ........... . , ............ . · ........... . · ........... .
· ............ . · ............ . · ............ . · ............ . ...... : ......... ) .......... . · .' ... (51 ..... . · . . . . . . ... . ........... . . ........... . · ............ . · ............ . · ............ . · ............ .

TEST SAMPLE NUMBER 6: DRUG ANALYSIS
(181 )
(n = 233) Participation Rate = 80%
TEST SAMPLE NUMBER 7: FIREARMS EVIDENCE
I (132)
(n = 165)3* Participation Rate = 85%
TEST SAMPLE NUMBER 8: BLOOD ANALYSIS
I (132)
(n = 187)3*
Participation Rate = 73%
TEST SAMPLE NUMBER 9: GLASS EXAMINATION
(112)
(n = 189)3* Participation Rate = 65%
TEST SAMPLE NUMBER 10: PAINT EXAMINATION
I (lll)
(n = 183)3*
Participation Rate = 63%
D = Response With Data"
~ = No Response ... :;:;:; = Do Not Perfonn Thi s Type of Ana 1ys is
192 * - See Page 195'.
'.

I
~
TEST SAMPLt NUMBER 11: SOIL EXAMINATION
(93)
TEST SAMPLE NUMBER 12:
( 120)
TEST SAMPLE NUMBER 13:
(11 = 236)
Participation Rate = 53%
(n = 238)
Participation Rate = 61%
PHYSIOLOGICAL FLUIDS
• •• It ••••••••••••• · ...... " ....... . · ............... . · .............. " · ................ . • :-:- :-:-:-:- (' 6' 2' )' -: -: -: -: -: -: • · ..... ,. . ..... . · .............. . · ............... . " ............... . · ............... . · .............. .
· ......... . · ........ . · ......... . · ........ . · ........ . ·······X·4·1·}······ · . . . , .. . · . . . .. . · ......... . · ........ . · ......... . · ........ . · ........ ', .
I (129) ~7~; tUM/j ........ ................. . . . . . . . . . . . . . . . . .
TEST SAMPLE NUMBER 14:
(118)
(n = 235)
Participation Rate = 64%
(n = 241)
Participation Rate = 61%
TEST SAMPLE NUMBER 15: DRUG ANALYSIS
I (143) .
~ = Response With Data
~ = No Response
(n = 241)
Participation Rate = 62%
= Do Not Perform This Type of Analysis 193
:.:.:.:.:.:.:.:.:.:.:.: · ......... . . . . . . . . . . . . . ::::::: :(42J::::::::: .:.:.:.:.:.:.:.:. :.:.: . . . . . . . . . . . . . · ......... .
~----------------------~-----
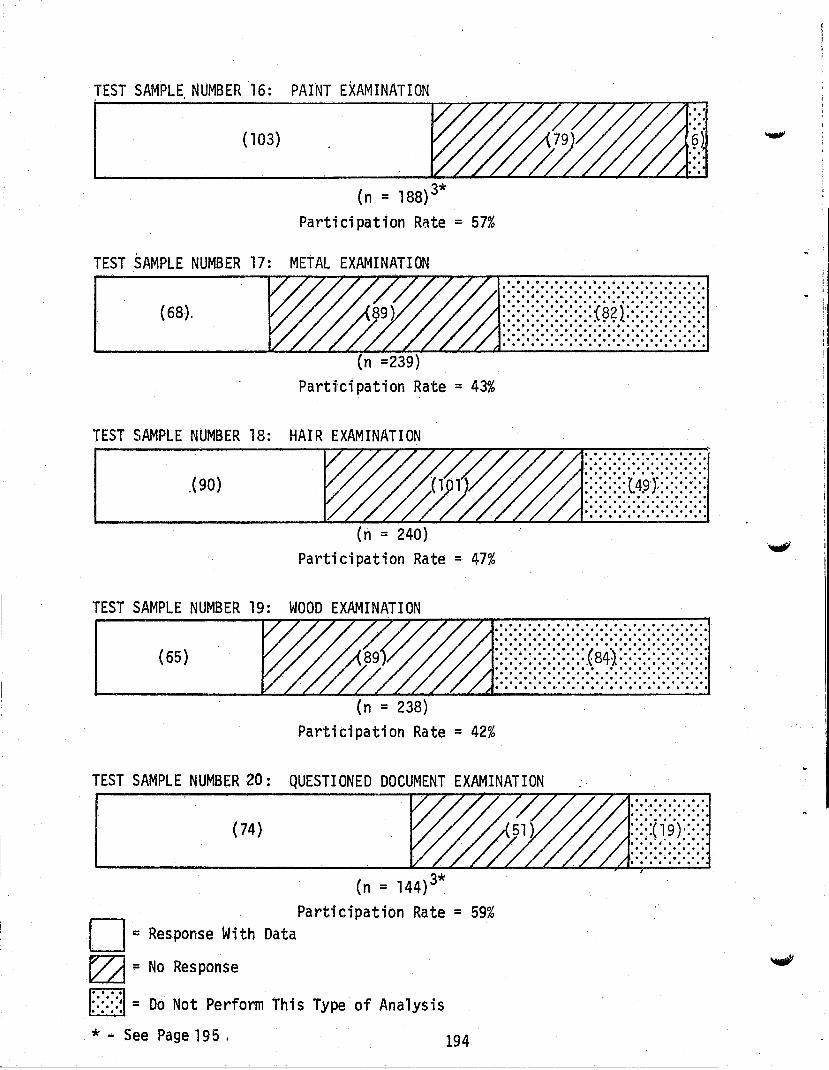
PAINT EXAMINATION
(n = 188)3*
Participation Rate = 57%
TEST SAMPLE NUMBER 17: METAL EXAMINATION
(68).
Participation Rate = 43%
TEST SAMPLE NUMBER 18: HAIR EXAMINATION
,(90)
(n = 240) Participation Rate = 47%
TEST SAMPLE NUMBER 19: WOOD EXAMINATION
· .. , ................ . · .................... . · ................... . • •• II ••••••••• It •••••• I • .............. ·····i· 8' 2')"- I' II ••••••••••• · . . . . . . . . . " ..... . · . . . . . . . . . . ....... . · ................... . · .................... . · ................... . · ..................... . · ................... . · .................... .
· ........... . · ........... . .......................... · ........... . • ••.• 49' .•••• · ... t ) ..... . · . . . , .... . · . . .. . .... . · ........... . · ......... ' .. . · ........... . '.' .' . '.' ................ .
· .................... . ................ ..... .............. .... . ' .' .. · ..................... . · .................... . (65) ................... ( i··················· · ......... ·84· . $, ••••••• · . . . . . . . . . . ....... . · . . . . . . . . .. . ......... .
• ••••••• II ••••••••••••• · ..................... . · .................... . · ...... ' ............... . (n = 238)
Participation Rate = 42%
TEST SAMPLE NUMBER 20: QUESTIONED DOCUMENT EXAMINATION
(74)
(n = 144)3* Participation Rate = 59%
~ = Response With Data
~ = No Response
::::::: = Do Not Perform This Type of Analysis
* - See Page 195 I 194
· ...... . · ....... . · ...... . · ...... . :::::( ':9);:::: · ...... . · ...... . · ...... . •••••• ••••• • II· ••

I~""
I t
i I :,..
I i ,
TEST SAMPLE NUMBER 21: FIREAru~S EVIDENCE
I (88)
D = Response With Data
~ = No Response
(n = 123)3 Participation Rate = 72%
I::~~I = Do Not Perform This Type of Analysis
1 _ "nil represents the total number of samples sent.
2 _ See page 40 for definition.
3 _ The basic roster of laboratories was reduced by removing those laboratories who previously indicated that they do not perform such examinations.
195

I ~
I I
I 'I I I j !
l' I I
TEST #1 - CONTROLLED SUBSTANCE
The controlled substance~ Sodium Pentobarbital, sent out as Test Sampl~ #1 was correctly identified by .189 of the 205 laboratories reporting. This represents 92.2% of the laboratories participating. A response of "barbiturate" or "a barbituric acid derivative".was considered a correct response, since a,numberof jurisdictio~sare not required by' statutory considerations to carry the analysis beyond this point.
Sixteen laboratories reported incorrect 'or imperfect results. Of these, one, laboratory found no drug material,.one found Librium, and fourteen identified the material as some other barbiturate.
. The 'Pr'oj ect' Advi soryCommi ttee is in accord with the fo 11 owi ng general comments in regard to this Sample:
• The laboratories reporting "no drug" and "Librium" apparently used methodology which was not sufficient to the task. Although TLC and UV were us'ed by many' laboratories correctly reporting peh~obarbital, it is apparent that Much more emphasis w~s pl~ced on GC, IR, and microcrystalline tests.
• Of the 14 laboratories reporting a barbiturate other than , pentobarbital,TLC was ~sed in seven instance~, GC in six
instances, IR in ten instances, and microcrystalline tests in three instances. The Project Advisory Committee can conclude ~hat either one or both of thefollowin~ may have occurred:
t. Mislabelled or contaminated primary standard, .
t. Misinterpretation of the test results by the operator resulting from carelessness or lack of experience. Examples of this area would include the misinterpretation of IR
. spectra, the failure to properly recognize and interpret crystal forms, and other types of operator error.
,197

TEST #2 - FiREARMS EXAMINATION
Analysis of the responses to Test Sample #2, Firearms, reveals that .~ the test actually addressed two separate areas:
1) The ability of the laboratory to examine and measure the evidence, and
2) Th'e extent of the data maintained by the laboratory on class characteristics of firearms.
The Project 'Advisory Committee is in accord with the following general comments in regard to this Sample.
• ~eporting that projectile Item #1 could have be~n fired in ~ .38 caliber weapon, or that projectile Item #3 could have been fired in ~ .380 automatic pistol, would seem to be a questionable practice. The Project Advisory Committee recognizes the responsibility of the laboratory not -to exclude possible weapons. how~ver, the ciass characteristics of the evidence do, in fact, exclude certain weapons,. Failure to ,indicate either'possible weapons, or, alternatively,
-improbable weapons, could well result in a situation whe~e the investigating officers needlessly channel investigative effort into following improbable weapons, squandering time that could be used more profitably elsewhere.
This statement, however, should not in any way be construed as in opposition to the practice of many laboratories of appending a general statement to the effect that the list of possible weapons may not be inclusive"
·t
• The Committee recognizes that the class characteristics of w~apons donat, in many instances, permit an unequivocal determination of manufacturer and/or model to be made. However, the weapon involved in Items #1 and #2 was a Smith
, -and Wesson; and the weapon involved in Items #3 and #4 was a Beretta. The Project Advisory Committee is in accord that cQrrect responses to the questions regarding possible weapons shoUld have specifically mentioned Smith and Wessan and Beretta in some form.
In connection with Item #1, 8% of the respanses failed ta mention Smith and Wesson. In cannection with Item #3, 26% .of the responses failed· to report Beretta. In conriection with Item #4, 43% of the responses failed to repart Beretta.
• It is apparent fram the respanses to this test sample that some labarataries have access to data on class characteristics that were not available .or not invoked by ather laboratories. These data are fragmented to such an extent that it
198
is_RPp~~pntlv.DO~ heihq used uniforml~ ~nd possibly arp not belng used effl(:lently. The ProJect Auvl::,u(j LOllimILLt!t: .
urges LEAA/NILECJ or other groups to consid~r the compilation and publication of firearms 'class characteristics under one cDver.
199
TEST #3 - BLOOD ANALYSIS
Typ~ s' blood was 'reported correctly by 152 of the ·158 laboratories participating.
Five laboratories reported results at variance with tYpe B blood. Two reported type 'AB, two reported type.O, and one lab failed to find any indication of either blood group antigen 6r blood g~oup antibody.
,The Project Advisory Committee ·is in accord with the following general comments in regard to this sample:
• One of the laboratories reporting type a conducted only a test for the antibody. The Project Advisory Committee believes that'the Lattes test Or other test'for blood group antibodies is, by itself, i nsuffi ci ent for purposes of forens i c b 1 ood- , stain analysis.
• In the remainihg four instances, the absorption elution technique was attempted. Errors here may have arisen from inexperience or carelessness on the part of the examiner.
Type MN blood was reported corre'<;tly by 15 of 25 laboratories attempting this system. This represents 60% of the attempts.
The Project Advisory Committee ;s in accord with the fo1l6wing general comments in regard to this sample:
• ,All of the laboratories attempting the MN typing used. the absor~tion elution method. Each of 'the 9 laboratories reporting type M had also used the absorption elution techniqtie in the ABO typing; and had correctly typed the stain as type B. The Project Advisory Conmittee concludes that the errors may well be attributable to cQns~derations other than technique. MN antisera. is widely held to be treacherous, and the erroneous ,results may possibly be attributed to poor antisera.
The Project Advisory Committee urges LEAA/NILECJ to investigate the possibility of funding research projects to develop more reliable antisera for the MN system, ~s well as other antisera specifically for forensic purposes.
, The,incorrect responses relative to the Rh typing illustrates a significant point; the frequency of occurrence of certaih Rh factors in such that a single error may exert a profound influence in the interpretation of typing data.
200
I
Of the 158 laboratories responding to this Test Sample, only 20 attempted the PGM type, only 15 attempted the EAP type, only 2 attempted to. perform a Haptoglobin determin~tion, 3 attempted the .AK type, and 10 attempted the Hemoglobin type.
The 'Project Advisory Committee recognizes that in this instance, the blood samples were distinguishable by ABO typing alone. However·, the Committee believes that the Crime Laboratories in the nation cannot rely upon ABO grouping alon~ as a general rule. Laboratories doing so. are ignoring
. the very powerful discriminating abilities of the isoenzyme and serum protein techniques. There isa rapidly growing awareness of the value of these techniques in the criminal justice system. The skill inventories required to conduct these examinations should be within the reach of virtually any laboratory conducting forensic blood testing. Tne capital out~~y for equipment is modest, and the techniques are neither controversial nor untested. The Project Advisory Committee considers the number of laboratories conducting these examinations to be deficient, and urges laboratories .notnow conducting these examinations to systematically build ~ capabi 1 i ty in th is area. .
201

TEST #4 - GLASS ANALYSIS
Test Sa,mple #4 was reported,correctly by 123 of the 129labora-tories responding. This represents 95.3% of the laboratories participating.
six laboratories responded that the glass samples could have shared a common origin, at' that their tests were inconclusive.
The Project Advisory Committee is in accord with the following general comments in regard to this sample:
• The Committee does not condemn in any way the reporting of . inconclusive results, when apprbpriate. Situations in which
such a r~sponse would'be appropriate might include an inadequate amount of ' evidence, a contaminated sample, or where, the sample possesse's few inherent charazterizing features. This is not the case in this test sample. The state.of the art in criminalistics is certainly advanced to the point that these samples of glass should be easily distinguished by techniques available to any laboratory attempting to conduct glass examinations. The Project Advisory Coinmittee·belfeves that an inconclusive re~ort in this sample is not supportable.
,The two inconclusive responses emerged out of different situations. In one case, the methodology employed was insufficient;
. in the other case exhaListive data we,re produced to demonstrate the dissimilarities between t~e two samples, but the operator apparently failed to interpret the data p,roperly.
• Laboratories should exercise great caution in relying upon a single technique for the characterization of evidence.
• Of the four laboratories reporting that th~ samples could have shared a cqmmon origin, all incorrectly performed or interpreted refractive index determi,nations. This would appear to be an area, deserving some attention.
202
I ,. , , .,
I I I
i J
\ ,
II" I
!
1 I ~
I j ! \ ! j i ! t I I
t
I \ .. I ;
~,
'.
------.
TEST #5 AUTOMOBILE PAINT EXAMINATION
Test Samp.1e #5. was reported correctly by 97 of the 121 laboratories responding. This represents 80% of the laboratoties participating.
Twenty-four laboratories reported results at varianc~. with the manufacturers I statement and the results of the referee 1 aboratories. Twenty-two . laboratories reported that Ite'm A could have .had a common origin with both Items 8. and C, one laboratory reported inconclusive results.
The Project Advisory Committee is in accord with the following general comments in regard to this sample.
• The Committee does not condemn in any way the reporting of inconclusive results, when appropriate. Situations in which such a response would be appropriate might include an inadequate amount of evidence, a 'contaminated sample, or where the sample possesses few inherent characterizing features. This is not the case in this test sample. The state of the art in criminalistics is certainly advanced to the point that these
•
•
samples of paint should be easily distinguished by techniques available to any laboratory attempting to conduct paint examinations. The Project Advisory Committee believes that an inconclusive report in this sample is not supportabie.
The laboratory reporting that neither Item B or C could have shared a common origin wHh Item A relied upon a spectrographic analy~is but provided no details. The Project Advisory Committee believes that a spectrographic analysis alone is not sufficient to characterize paint for forensic purposes.
Many of the remaining twenty-two laboratories reporting that all three paints could have shared a common origin failed to make proper use of solubility tests; solubility tests possess the. inherent ability to distinguish Item C from Item A and Item B. It should be. noted,. however, that a number of the laboratories that reported that all three paints were indistinguishable did make use of solubility tests. The Project Advisory . Committee concludes that these. tests were either interpreted incorrectly, or that inappropriate solvents were employed. No test is infallible, and solubility tests, like all others, must be properly conducted and properly interpreted .
. '. Several laboratories reported similar or identical results for all paints when subjected to pyrolysis-gas chromatogr~~hy. The error het'e may be due to either or both of the fo 11 owi ng:
203 ._.-_._--
A Inexperience or carelessness on the part of the examiner, or,
A Improper operating conditions for this type of instrumental approach.
• A number of other laboratories ·reporting that all three ~amp1es were indistinguishable provided so little detail with respect to methodology that. the Project Advisory Cormnittee is unable to draw any meaningful conclusions regarding weaknesses or possibl~ sources of error.

, I.
i ! !' i
f
i .. l
i , I
I ! i
i i ,
TEst #6 DRUG ANALYSIS
A mixture of heroin, cocaine, procaine, and lactose was sent out as Test SamRle #6. Th~ mixtur~ was made up with the levels of heroin,. 'cocaine, a~dprDcaine set at 3% each, the remainder being lactose.
Heroi n 'was correctly reported by 178 of the 181 1 aboratori es participating, representing·98.3% of the laboratories involved in this study. Cocaine was identified by 126 of the laboratories, or ',69.6%' of those participating. Procaine was correctly identified by 130 laboratories, or 71.8% of the laboratories participating. It should be noted that in some instances statutery considerations or laboratory or agency policy require that only one controlled material need be identified.
Eight laboratories reported traces of monoacetylmorphine in addition to heroin, many having used sensitive techniques such as Gel MS in performing' these analyses. Although the supplier's statement makes no mention of monoacetylmorphine, it is reasonable to expect a trace of·this material 'due to incomplete acetylation hydrolysis of the Heroin. Three laboratories, also utiliting GC/MS, found traces of acetylcodeine'. Again, it is not unreasonable to encounter a trace quantity of acetyl codei ne as a constituent normally found wi th heroi n, and, although the supplier's statement makes no mention of acetylcodeine, the Project Advisory Committee does not consider the reporting of either
.acetylcodeine or'monoacetylmorphine to be an incorrect r.esponse.
One laboratory failed to identify any controlled 'subs'~ance in the test sample, one laboratory identified qUinine, three laboratories identified starch, one laboratory found tentative indications of methapyrilene, one laboratory found morphine but DO monoacetylmorphine, and two laboratories identified monoacetylmorphine as the major component with heroin present in lesser or trace concentrations.
The Project Advisory Committee is in accord with the following general comments in regard to these responses:
• The laboratory reporting no controlled drug material used only an unspecified color reaction and a microcrystal test. The limited methodology applied was insufficient for the purpose of detection and identification of drug or narcotic materials.
• Three laboratories reported starch, although from the data sheets returned it is unclear what methodology was used in the i,dentifications. The Project Advisory Committee concludes that the cause of these errors most likely rests in carelessness or lack of experience on the part of the examiner.
205

• On'e laboratory reported a trace of morphine, but specifically eliminated, the presence of monoacetylmorphine~ On the basis of what is known of the hydrolysis of ,heroin thr'ough monoacetylmorphine to'morphine, the Project Advisory Committee views these results with skepticism.
The laboratory reporting quinine used UV, IR, Spot Tests, Microcrystal jests, and Melting Point Tests. The Project Advisory Committee can conclude that either one or both of the following may have oC,curred:
• Mislabelled or contaminated primary standard.
• Misinterpretation of the Test results by the operator resulting from carelessness or lack of experience. Examples of this type ,wo.uld include the misinterpretation of IR spectra, the failure to properly recognize and ihterpret crystal forms, and other types of operator error.
Two laboratories reported' traces of heroin and larger concentrations of monoacetylmorphine. The Project Advisory Committee regards these as two instances of misidentification. One of the laboratories reported using' Color Tests, Microcrystal Tests, UV Spectrophotometry, and TLC. The other laboratory reported, using Color Tests. Melting Points, GC, and TLC in t.hree solvent systems .. The Project Advisory Committee concludes that one or more errors such as those previously cited may have occurred. '
206
1 •
I ! . ;. ,
. TEST #7 - FIREARMS EXAMINATION
Ea~h laboratory received three proje~tiles and. two cartridge cases, in accord with a specific scenario (See App~ndix. Data Sheet #7 and Quick Report #7). The scenario required the participating
. laboratory to compare the three projectiles to determine if they had been fired through the same weapon, and to compare the two cartridge cases to determine if they had been fired in the same weapon.
The projectiles marked A, B, C, D, E, F, G, H, J, K, L, 0, P, Q, R, S, 1, U, V, or V, and the ,cartridge cases marked 5, 7, or 8, were fired thro~gh one weapon, a Colt .32 Auto pistol, Serial #214325. The projectiles marked I, M, N, X, or Z, and the c~rtridge cases fuarked 2, 3, or 4, were flred'in another weapon, a Colt '.32 Auto piitol, Serial #521524.
One laboratory reported inconclusive results'in the portion of the exercise involving projectiles, and 26 laboratories reported inconclusive res~lts in the portion dealing with the comparison of cartridge cases. Five laboratories ~eported results in the section
~ dealing with projectiles which are at variance with the s~pplier's statement, and four laboratorie$ reported results in the section dealing with cartridge case comparisons which are at variance with ~he supplier's statement.
The Project,' Advisory Committee is in accord with the following, general statements in regard to these responses:
Either a "no" or an lIinconclusivell response to question lb (dealing with the cartridge cases) is acceptable., The Project Advisory Committee recognizes that although a "no" response is more correct in an absolute sense, the general area of firearms identification is one that calls for considerable caution. Ultimately, unless other issues are involved, it remains for the examiner to determine for himself the modicum of proof necessary to arrive. at a definitive opinion. At the same time, however, the firearms examiner should not divest ~imself of,the responsibility to refine his attitudes in light of additional experience so that a,more definitive opinion can be rendered when the circumstances warrant~
Five iaboratories misidentified a proje~ti1e. reporting that one of the projectiles actually fired through the Colt .32 Auto pistol, Serial #521524, had been fired through the other weapon, the Colt .32 Auto pistol, Serial #214325. Five laboratories (including three of the laboratories who misidentified a projectile) misidentified a cartridge case, reporting that one of the cartridge cases actually fired through the Colt .32 Aut6 pistol, Serial #521~24, had been fired in the other weapon, the Colt .32 Auto
2C7
pistol, Serial #214325. Five laboratories represent 3.8°/ of all the laboratories participating in this study. The project Advisory Committee considers these errors to be particularly grave in nature, and urges the laboratories involved to immediately undertake such measures as necessary to correct their deficiencies. A criminal prosecution may hinge entirely, or virtually so, upon firearms evidence and the testimony of the firearms identification,e~pert. and the potenti~l exists for a truly severe miscarriage of justice. Responsibility for errors such as those under discussion rests squarely with the examiner and th~se responsible for his supervision .. The Project Advisory Committee concludes that these errors may have resulted from one, 'or more o'f the following:
• Carelessness on the part of the examiner.
• A lack 6f experience or trainin~ on the part of the examiner.
• Inadequate supervision by a qualified firearms identification expert.
208

f • ; I , I
i ,~ { 1
1 I
I , I
I I !
, ~
I '~
l
I , I
I
TEST #8 - BLOOD ANALYSIS
Two samples, each consisting of several drops of blood on a swatch of cloth, were sent to participating laboratories. Reports were received from 131 labo~ator;es. The following four questions were asked, (See Appendi x, Data Sheet #8 a'nd Qui ck Report #8):
Question 1 :
Question 2:
Question 3:
Have the stains been confirmed as blood?
Have the stains been confirmed as human blood?
Could Item A and Ite~ B (the' two stains) have originated from the same source?
Question 4: What information did you develop to arrive at your conclusion in Question #3?
The responses to these questions have been tabulated in considerable detail in the document entitled "Laboratory Proficiency Testing Program Report No .. 8 - BLOOD". The Project Advi sory Commi ttee wiShes to address several broad, areas, and the reader is advi sed to refer to Report No.8 for details concerning specific areas .
. Fifty-two of the 132 laboratories returning data reported that the two bloodstains. could not have shared a common source, however, fourteen of these laboratories made errors in typing in various systems; Therefore, thirty-eight laboratories responded correctly as to common origin and correctly typ~d the samples. This represents 28.8% of the laboratories responding. Fifty laboratories incorrectly reported that the two stains could have shared a common origin and twenty-six reported inconclusive results. Four laboratories performed some aspect of, typing the samples but did not respond t,o the question regarding common origin. Two laboratories reported incorrect results for the ABO system. This represents 1.6% of the 123 laboratories reporting this system. Six laboratories, or 20% of the 30 laboratories using this system, reported incorrect results for the MN system. Five of the 20 laboratories reporting results for the Rh system reported incorrect results. This represents 25% of the laboratories reporting the Rh system. Two laboratories, or 6.1% of the 33 laboratories attempting the PGM system reported incorrect results. One laboratory of the 8 laboratories reporting Esteras~ D results reported an incorrect type. One laboratory of the 7 attempting the AK system reported incorrect results, and 1 of the 15 labs reporting the Hemoglobin type reported an incorrect type.
The Project Advi sory Commi ttee is; n accord wi th the fo 11 owi ng general comments in regard to these results:
Fifty laboratories incorrectly reported that two stains could have shared a common origin, and 26 laboratories reported incon-cl usi ve r,esul ts. In the overwhel mi ng majority of these, cases these opinions ,were 'based on minimal data, in most cases based only on the
209
ABO type .. The Project Advisory Committee takes issue with the practice ...., of conducting only an ABO typing and reporting that two stains could have shared a common origin, and is only slightly more sympathetic with the practice of reporting inconclusive results after conqucting only ABO typing. The Project Advisory Committee is on record previously on this point, but wishes to reiterate its opinion that the Crime Laboratories in the nation cannot rely upon' ABO grouping alone as a
.general rule~ Laboratories doing so are ignoring the very powerful discriminating abilities of the isoenzyme and serum protein techniques. With proper education and training these examinations should be . within the reach of virtually any laboratory conducting forensic biood testing .. The capital outlay for equipment is modest, and the techniques are based on sound· scientific principles. The Project Advisory Committee considers the number of laboratories conducting the more recently developed blood protein and isoenzyme group examinations to be insufficient, and urges, laboratories not now conducting these examinations to systematically build' a capability in this area.
One of the laboratories reporting an incorrect response for the ABO type relied upon the Lattes slide method alone. The Project Advisory Committee wishes to reiterate its previous comments, that the Lattes test or other test for blood group antibodies .is, by itself, insufficient fo·r purposes of forensic blood group analysis.
The error rate with the Rh system reflects, in part, the multi-plicity of factors in this. system. A number of laboratories reported ...." all five factor~, correctly reporting all but one of the factors. Nevirtheless, the error rates encountered in the Rh system, points out the need for reliable, avid antisera, painstaking attention to technique, proper training on the part of the examiner, and proper supervision. Laboratories reporting incorrect responses for these systems, as well as in the isoenzyme and serum protein types, should undertake an assessment of the reliability of their methodologies and review the interpretive aspects of their determinations. -
Several laboratories correctly r~ported that the stains A and B could not have shared a common source, but made an error at some point in the typing procedure. Although they obtained the correct answer, they did so for the wrong reasons. The Project Advisory Committee wishes to point out that a correct answer which is only coincidental still constitutes an error.
-The Project Advisory Committee has observed that in a -number of instances laboratories are invoking a sequence of testing which does not provide maximum discrimination. An example of this situation would be a laboratory that attempts three systems--the ABO system, the Hemoglobin type as a second choice, and, as the third choice, the AK system. The Project Advisory Committee encourages laboratories to reflec~ upon the probability of ~iscrimination when establishing the order in which the tests are to b~ run.
210
I I I i , I 1 I t • ! j I ~
I 1 1
,
! ! I I , I I . I
I I I
I r
I r. I
I I
I I I i
i " 1 !
I i : I" . I , I I . I
t I !
I
I t I -j , I
1
~
TEST #9 - GLASS ANALYSIS
Each 'laboratory received three items of glass marked Item A, B, arid C in accord with a specific hit. and run scenario. The scenario
.required the laboratories to compare the .three glass samples and to determine if Items A and B could have had common origin with C.
. All of the glass samples were prepared from a single Corning headlight lens with a'supplier's repdrted refractive index of 1.47777. When pieces from different locations of the lens-were-measured, the refractive index differed by no more than 4 in the 5th decimal place.
Test Sample #9 w~s reported correctly by 77 of the 112 laboratories re~pohding. This repreients 68~3% of the laboratories participating.
Ten (8.9%) l~boratories reported only A could hav~had a common origin with C, While nine (8.0%) reported that only B could have shared a common origi'n with C.
Nine (8.0%) laboratories reported that neither A or B could have . had -a common origin with C, and 4 (3.6%) reported inconclus'ive results' for both A and B .
. The Project Advi~ory .Committee is in accord with the following general,. comments in regard"to this sample:
At least six of the incorrect respcinses were the result of laboratories performing an insufficient number of tests leading to the form.ulation of inappropriate conclusions. Density measurements, particularly those relying orr the sink-float method, were too imprecise to be used as the only ~ethod for determining the origin of multiple glass samples.
Errors in refractive index and density determinations were largely responsible for incorrect responses from approximately eighteen laboratories. Refractive index variations were 1i~e1y due to errors or cal"elessness by the operator, and failure to employ sufficiently sensitive techniques for the control and measurement of temperature and the ~efractive index of·the immersion liquid itself. Accuracy and precision Were generally improved through the utilization of more sophisticated instruments such as the phase contrast microscope and hot stage. Their use, however, di d not assure corr.ect answers as evi denced by errors from laboratoriss employing such refinements.
211

Several laboratories reported the correct answers (A and B shared '~ a commOh origin with e), but reported incorrect density or refractive index values. The measurements were sufficiently precise but lacked accuracy. Such a condition indicates that these 'laboratories need to examine the immersion liquids and to calibrate toe refractometers being utilized.
At least twelve laboratories reported that one or more of the glass samples fluoresced,under UV light, with colors rangi'ng from orange to blue-purple. The glass should not have fluoresc'ed when. subjected to either short or lOng wave UV; it is likely that several operator~ mistook the spillover from the UV light source itself as fluorescence of the sample, or,that the supportin~ m~dium contribtited to a background fluorescence ..
Elemental analyses were significant in leading ten laboratories to erroneously report that A, B, and e did not all share a common origin. In fact, it appeared that wer~ it not for the e~ployment of elemental analysis, most of these. laboratories would have submitted correct responses. The Project Advisory COlTlTlittee does not suggest that elemental analysis should not be employed but does observe that in-.strumental and/or operator error res~lted in spurious results in a sizeable number of caseS. This area will be elaborated upori in a subsequent section of this report.
Although these glass specimens were not truly representative of evid~nce recovered from hit and run cases in that the pi~ces had been cut,' rather than broken from a single he'adlight lens, their shape and size should not have led laboratories to conclude .th.at they could not have shared a common origin. It appeared that some laboratories placed 'too much weight on the linear dimensions of the samples contributing to a c~nclusion that A, B, and C did not have a common origin.
212
j. , i i
! ; , I· i
i , -
I [ . ! !
! ! i ! I I
i ! !
I ~ , f I
. !
! , I I • '. !
II
TEST #10A- PAINT EXAMINATION
Laboratories received three paint samples, Item B representing a sample removed from the door jamb of a burglarized building and Items A and C representing samples'found on the clothing bftwo different suspe~ts. Laboratories were asked if Items A and C CQu.1d have had a
, cOlTVllonori gi·n with B.
Item A was an acrylic based paint while Items Band C were soya alkyd based' paint samples. Item C contained a substantial quantity of ZnO.while Items A and B contained only trace amounts of ~inc.
Gtve!n the above specifi. cat; ons neither A nor C' coul d have shared a common origin with B.
Test Sample #10 was reported correctly by '54 of the 111 laboratorie~ responding. This represents 48.9% of the l~boratories particfpating. This sample was intended to be a test of both the organic and inorganlc analysis capabilities of forensic science laboratories. That is, laboratories needed organic capab{litieS to differentiate Item A from It~m B and inorganic ~nalysis ca~abilities to differentiate Item C from Item B ..
Of the laboratories reporting res~lts, 24 were unable to discriminate Item A ·from Item B (those with diffe~ent organic compositions), and 36 were· unable to differentiate Item C from Item B (samples possessing inorganic dissimilarities). In the first category 16 laboratories reported Item A and Item B could have had a common origin, with.B laboratories repor.ting inconclusive results. In the second category, 31
-laboratories reported Item B and Item C could have had a common origin, with the remaining 5 labor~tories ciiting inconclusive results. Only two laboratori~s .incorrectly ~eported both A and C could have shared a common origin with B.
The Project Advisory committee is in accord with the following general comments in reg~rd to this sample:
The laboratories which failed to detect. the organic differences in Items A and B should review their instrumentation, methodologies and operator skills in the organic analysis area. Of the 16 laboratories that reported Items A and B to share a common origin, only 2 employed Pyrolysis G-C and 14 did not. Those laboratories. which utilized PGC shOUld haVe been able to detect. differences in the two samples.
213

Practically twice as many 1aboratories, (31) reported that Items Band C could have shared a common origin and therefore failed to detect the higher le~el of zinc in C. Of the 31 incorrect ~esponses, 21 failed to employ any elemental analysis techniques, while 10 did. Tho$e not employing elemental analysis should consider doing so and those that did, but failed to detect the large.quantitative difference in zinc composition between Items Band C should undertake an assessment of the validity and reliability of their instrumentation, methods of analysis and guidelines for the ;nterpretat'jon of results.
A single laboratory reported the use of Marquis, Mecke,and Froehde reagents in an effort to differentiate the paint samples. Such procedures have no basis fOr the characterization 'of paint and should be discontinued. .
. There was great variation among laboratories in the use and interpretation of chemical spot tests/solubility tests. The manufactureI" of the paint samples reports that the samples could have been differentiated on the basis of non-instrumental tests alone. It seems clear from reviewing the data sheets that there exi sts great variabil i ty in the use and interpretation of solubility tests'among the nations crime laboratories and that ·LEAA/NILE.CJ should fund efforts incompi 1 ;ng and dissemjnating' infqrmation/guidelines on the use and interpretation of chemical spot tests/solubiiity tests.
214

I I I !
I '
INSTRUMENTAL ANALYSIS
The Project Advisory Committee wishes to draw attention to the fact that the results of instrumental analyses reported in connection with variou~ test samples have varied widely, both qualitatively and quantitatively. The following two tables attempt to depict this . variati~n, ~~ing data abstracted from Te~t Sample No.9, Glass, and Test Sample No. lOA, Paint.
Table 85 illustrates the elements reported by a number of laboratories.for the glass samples. The glass samples were homogeneous and were cut from a single automobile heaQlamp. The Project Advisory Committee recognizes that the failure of a laboratory to report a specific element does ncit necessarily imply that the element was in fact sought for wtth negative results. Nevertheless, the wide variation in the reporting of the elements present suggests to the Project Advisory Committee that those laboratories utilizi.ng elemental analysis by whatever instrumental approach should take whatever precautions necessary to ensure that proper standards are run and that the operator possesses the requisite skill inventories to interpret the instrumental data.
Table 86 illustrates the elements reported by a number of 1 aboratories for the three paint samples~ Test Sample No. lOA. Again, the lack of consistency in the reporting of the elements present suggests to the Project Advisory Committee that elemental analysis is an area that deserves 'attention, and su'ggests that laboratories emploYing instrumental techniques .for elemental analysis carefully review their methodo~og'y.
215

TABLE 85 . INSTRUMENTAL ANALYSIS OF GLASS - TEST SAMPLE #9
Elements Reported Lab A Lab B Lab C Lab D Lab E
Li X X
B X X X
Na X X
Mg .. - X X X
Al X • X X
Si x· X X X
P 'X
Ca X X X
Ti X -J Mn X ·x
Fe X X X
Cu X X
Ni X ..
Zn X
As X X X
Zr X
Pb X
216

, , I
!
, i
t ,
I i
I I .
, . I
I , ! ,
" I \
Lab
A
B
C ..
0
E
F
TABLE 86 INSTRUMENTAL ANALYSIS OF pAIN7 - TEST SAMPLE #10
Elements P',~ported for Paint Samples
A B C
Sb Mg FeT; Ca Zn Sb Mg' 'Fe ti Mg . Ti Ca Al Si no Al Ca Zn Si Zn Si
no Al nO.Fe or Sb .'
ji .' Mg Si Ti Mg Si Ti Mg Si high Zn iow Zn low Zn
·Ti Ti Ti low Zn low Zn high Zn
Cu Cu Cu
"
Ph Ti Ca Pb Ti Ca Pb Zn
Sb Ti Cr Cu Sb Ti Cr Cu Sb Ti Cr Cu Al. Al Zn Al Zn High Zn
217

TEST #11 SOIL EXAMINATION
Test Sample #11 consisted of three items: Item A was a soil sample from near Fresno, California. Items Band C were duplicate samp1e$ of soil from hear Patterson, California. Laboratories were asked if Items Band C could have shared a common origin with Item,A
.Ninety-three laboratories returned ·results for this exercise. Of these laboratories~ 60 or 64.5%, correctly reported that neither Bnor C could have shared a common origin with Item A. Twenty-five laboratories, or 28.4%, inco~rectly reported that both Band C could have shared a common origin with A. Two laboratories, or 2.3% of the total, reported that Item a could have shared a common origin with Item A, but that Item C could not. Five laboratories, or 5.7% of the laboratories responding, reported incdnclusive resuHs for both Band C. One '1 aboratory' reported that Item B caul d not have shared ,a common origin with Item A, and indicated no response for Item C.
To summarize these data in terms of total responses, 56 laboratories (63.5%) reported that Item B could not have shared'a common origin with Item A, and 57 laboratories (63.6%) reported that Item C could not have shared a common origin with Item A. Twenty-seven laboratories (30.7%) incorrectly stated that Item B could have shared a common origin with Item A, and 25 laboratories (28:4%) intorrectly reported that Item C could have shared a common origin wi.th ItemA.
The Project Advisory Committee is in accord with the following general comments regarding this sample:
The Project Advisory Committee notes a positive relationship between incorrect responses and the failure to perform comparative density determinations; those laboratories who did not perform a density determination .were more likely to draw an erroneous conclusion in this exer.cise than those who did perform the density determinations. At the same time, a number of laboratories reporting incorrect results did in fact conduct a density determination and reported identical density distributions for both A and B/C. Other laboratories reported a difference between Band C when tested by density gradient, despite the fact that Band C were replicate samples taken from a homogenous whole.
From this, the Project Advisory Committee concludes that the density gradient technique is very useful for discriminating among soil samples, but in itself is not a guarantee of success in soil comparisons. The Project Advisory Committee also concludes that in those inst"ances in wh.ich the density gradient technique was attempted but erroneous res ul ts reported,' one or more of the .fo nowi ng may have occurred:
218
-,-----------------------

I ;.
i r
• Carelessness or' lack of experience on'the part of the examiner,
• Coarseness or heterogeneity in the density gradients resulting from improper technique in their preparation.
The Project Advisory Committee notes that in a number of instances in which incorrect results were reported, instrumental analysis was performed. In some instances the ambiguous or erroneous -data from the fnstrumenta 1 approaches (emi ss i on spectroscopy, x..:'ray spectroscopy)
'was apparently given more weight than more correct data derived from other tests. The Project Adviso~yCommittee cautions laboratories ag~inst an unjustified faith in instrumental approaches, and wishes to point out that the proper utilization of these instrumental approaches
'presumes both a correct operating technique and careful interpretation of the results projected against an adequate data base. The Project Advisory.Committee most emphatically is not suggesting that sophisticated instrumentatjon not be acquired and used, but wishes to emphasize the necessity for the proper training of personnel, the use of in-house 'standards and blind controls,and properly selected protocols of analysis.
219

TEST #12 FIBER EXAMINATION
Test Sample #12 consisted of three items of virtually the same color: Item A'was wool, Item B was acrylic (70% acrylic + 30% modacrylic) and Item C was polyester. Laboratories were asked if ItemA could have 'shared a common origin with Item C, and if Item B could have shared a common origin with Item C.
All 120 laboratories participating in this exercise correctly reported that Item A could not have shared a common origin with Item C. Two laboratori'es., or 1.. 7% of, the ,total, incorrectly reported that Item B could have shared a comm6n origin with Item C. '
The Proj ect Advisory, Committee is in accord wi th the fo 11 owi ng genera 1 comments rega rdi ng thi s sample':
One laboratory reporting that Items Band C could have shared a cOl1111on origin used microscopic examlnation of the fiber and of its cross section, melting point determination, and solubility tests. On the basis of these tests, Item B was identified as acrylic and Item C was' tentatively identified as polyester. The differences in solubilitY,and cross sectional appearance were noted. 'The analytical results clearly do not support a determination of possible common origin, and the Project Advisory Committee concludes that a check was made in the wrong box in Question 1 of the Data Sheet.
The Project Advisory Committee wishes to point out, however, that an error in reporting may have the same consequences as an' error in the analytical work, and suggests that laboratorie? r~v;ew their procedures for ensuring that 'th~ conclusions stated'in reports are in consonance with the laboratory work that has been performed.
The second laboratory reporting that Items Band C could have shared a common origi~ used microscopic examination, solubility tests, Pyrolysis-GC, and birefringence determination. Solubility tests and Pyrolysis-GC were reported as giving the same results on Items B and C, and both fibers were identified as being an acrylic. The Project Adv,isory Committee concludes that one or more of the following errors may have occured:
e Inadequate or erroneous data base relative to solubility tests and Pyrolysis-GC,
• Misinterpretation of, the test results by the operator resulting 'from carelessness or lack of experience.
Several laboratories correctly reported that Items A and B could not have shared a common origin with Item C, but did so for incorrect reasons. One laboratory reported that Item C was a p'lant fiber, one
220
, ....".

I
I I
! -I
, ~ . \
! i
I
laboratory identified Item C as nylon, and two laboratories tentatively identified Item C as nylon. The Project Advisory Committee wishes to point out that a correct answer which is only coincidental is still an ~rror, and urgss the laboratories·who" misidentified the 'polyester of Item C to review their methodology to eliminate the possibls sources of error.cited -above. .
221

TEST #13 - PHYSIOLOGICAL FLUID
Test Sample #13 consisted of two items: Item A was a saliva stain from a: Type A secretor individual, and Item B was a seminal stain from ij' Type.A,?ecretor individual with a normal sperm count., One hundr.ed a'nd, twenty-nine laboratories . responded in this exercise. With respect to Item" A (saliva stain) 48 laboratories, or 37.2% of those reporting, tentatively identified the stain as a saliva stain and 23 laboratories (17.8%) conclusively identified the stain as a saliva stain., Thirty-seven laboratories (34.1%) reported inconclusive results. Eleven laboratories (8.5%) did not answer part A. One laboratory (0.8%) tentatively i-dentified Item A as vaginal exudate and 2 laboratories (1.5%) conclusively identified the stain as vaginal exudate. With respect to Item B (seminal stain) 109" laboratories, or 84.4% of the total number responding, conclus~vely identified th~ stain asa seminal stain. Fifteen labotatories (11.6%) tentatively identified it as a seminal stain and 3 laboratories (2.3%) reported inconclusive results. .
The Project Advisory Committee' is in accord with the following general comments regarding this sample:
The Project Advisory Committee recognizes that the probative value of the identification of saliva stain may be low in ma.ny instances, and that many laboratories have adopted a policy' in routine cases of terminating an examination .once it has been established that a stain is not a ·seminal stain. The Project Advisory Committee does not, ther~fore, consider the response tlnot a seminal stain" to represent an incorrect response.
. " In ali ke manner, the Project Advi sory Commi ttee does not take issue with the tentative identification of th~ stain as a saliva stain if it i~ the normal laboratory policy not to pursue a rigorous identification in situations of this sort. At the same time, the Project Advi sory Committee wou1 d urge 1 aboratori es to push for a ri gorous identification when it is of concern to establish that the stain is in fact ~ saliva stain. Among the situations that would call for a rigorous id~ntificati6n would include those cases in which a blood group determination is attempted.
The two laboratories that reoorted that Item A was conclusively a vaginal stain both failed to attempt a starch amylase test. Since the identification of a stain as a vaginal stain rests heavily on negative evidence, the Project AdvisofY Committee wishes to point out the necessity of attempting the appropriate tests to indicate the probable nature of the stain. In this instance, the positive sta,rch amylase' test would have suggested the probability of. the stain being attributable to saliva.
,222

I
! ! I
I I
, .
Two laboratories reported inconclusive results for Item B (seminal stain), . One of these laboratories failed to indicate any methods used, and the Project Advisory Committee cannot express any meaningful statement regarding the adequacy of the methodology, used. In the remaining instance where an inconclusive result was reported, a microscopic examination was performed and an acid phosphatase test was conducted. No speci fi c resuJ ts were repor·ted, but the Project Adv; sory Commi ttee ass~mes that no intact spermatazoa w~re recovered.
Eighteen laboratories reported Item B as being tentatively identified as~ se~inal sta~n, Virtually all of these laboratories reported being unable to demonstrate intact spermatazoa in the stain. No positive relationship Was observed between the stain used and. the abil ity or' ;nabil ity to recover intact spermatazoa. In view of the fact that the overwhelmfng majority of laboratories were able to recover spermatazoa from the stain, the Project Advisory Committee concludes that one or more of the following may have occurred:
• Improper extraction and fixing of the stain, • Failure to systematically examine the slides prepared from
the stain, • Or a failure to riontinue the search for cells after an
initial lack of success.
The Project A'dvi sory Commi ttee urges 1 aboratories to revi ew the; r method~ for· the extractio~ of stains. and the fixation of the cells to the mk,roscope slide, and tO'ensure that reasonable perseverance is axcercised in the search fo~spermatazoa.
223
TEST #14 ~ ARSON EXAMINATION
Test Sample #14 consisted of three items: Item A was approximately ·8 ml of leaded gasoline, specifically C~evron Supreme (94.5 octane).
Item B was a piece of 100% cotton cloth with 2 m1 of the gasoline described under Item A absorbed in the cloth. Item C was another piece of tloth ide~tical to that described under ltem B, but with no gasoline. Items Band C were cut with scissors from one piece of' cloth. ~aboratories were asked if Items A or C could have a common origin with Item B. One hundred and eighteen laboratories responded in this e~ercise. Ninety la,boratories, or 7b.3% of the total laboratories responding, stated correctly that Item A could have shared a common origin with Item B. One hundred and one laboratories, or 85D%, correctly reported that Item C could have shared a common origin with Item B. Twelve laboratories (10.2%) stated incorrectly that Item A could not have shared, a common origin with Item B, and 4 laboratories (3.4%) incorrect:ly 'reported tnat Item C, could not have shared a common origin with 'Item B. .
The Project Advisory Committee is in accord with the following general comments regarding this sample:
The four laboratories that reported that Item C and Item B and the five laboratories that reported inconclusive results for this portion of'the exercise failed t9 recognize the physical match between the cotton cloth'in the two items .. The Project Advisory Committee urges ~ 1 aboratori es ,to take the steps necessary to ensure that one form of physical evidence is I')ot ignored simply because it is not typical of the type of case under examination.
The twelve laboratories reporting that Item A could not. have shared a common origin with Item B relied in part on gas chromatographic ana lysi s. The Proj ect Advi sory Committee concludes that careles'sness or lack of experience on the p~rt of the operator may have lead to these erroneous conclusions.
Several laboratories reported less than correct results which appear in part to reflect an unjustified reliance on Infrared Spectrophotometry to discriminate between gasoline mixtures. The Project Advisory Committee urges that considerable caution be exercised in th~ intarpretation of IR data on complex miitures of hydrocarbons and p~troleum distillates.
I 224
'----.~~~~~~--~~~.-~~-~--~~-.----.-.-- --- ------- --------- ._-_._----------- ----'

I I ! I I I )
,
I --I
; .. I
I ' I I , ,
!
I i ,
! i
! I I
I.
TEST #15 - DRUG ANALYSIS
A mt.xture of methamphetamine and ephedrine in lactose and sodium carbonate was sent out as Test Sample #15. ·One hundred forty-six laboratories reported results. Eighty-seven laboratories, or 59.6% of the total!' correctly reported both methamphetamine a'nd ephedrine. Thirty-one laboratories,. or 21.2%, reported methamphetamine only. Four 1a~oratories, or 2.7%, reported amphetamine and seven laboratories, representlng 4.8% of the total laboratories, reported no drug material present. Three
'laboratories, responding did so.late; their results are not included in Tab·les· 88 nor are they reflected in Tables 84, 89, 90 or 91.
The Project Advisory Committee is in accord with the following general comments regarding this sample:
The. Project Advisory Committee recognizes that many laboratories have a policy of pursuing an analysis only to the point whe~e relevant statutory considerations are fulfilled, and, having identified the methamphetamine, would conclude the examination. The Project Advisory Committee cannot conclude that any error has taken place if a laboratory. reported only methamphetamine.
, Seven laboratories failed to report either ~phedrine or metham-phet~mine. Among the methods used by these laboratories were Gas Chromatography; UV and IR Spectrophotometry~ Color and Crystal Tests~ GC/MS, X-.Ray Di ffractometry, and Thin-Layer Chromatography. In no instance wQuld it appear that the failure to identify the drug materials coul d be attri buted to a ,1 ack of avail ab 1e instrumentati on or to i nsuffi cierit methodology. The Project Advi sory Committee can concl ude that one of the following may have occurred:
• lnadequate data ~ase or inadequate standard spectra, • Mi si nterpretati on of the test results by the operator
resulting from' carelessness or lack of experience.
Four laboratories reported the presence of ampheta~ine, the four being split on whether the amphetamine was the dextrorotary isomer or the racemic mixture. Each laboratory reported the use of gold chloride or platinic chloride for the identification of the material. The Project Adv~sory Committee can c9nclude that one of the following may have occurred:
• Mislabelled or contaminated primary standard, • Reagent made up incorrectly, • Misinterpretation of test results by the operator re-
. sulting from carelessness or lack of experience leading to failure to 'properly recognize and 'interpret crystal forms.
225

The Project Advisory Committee wishes, also to pOint out that a quickly performed and easily interpreted color test exis'ts to distinguish ~ primary and secondary amines, and urges the application of this test when the circumstances warrant. The application, of this test would have avoided the mistakes of the type under discussion.
. Seventeen laboratories reported only ephedrine. The Project Advisory ,Committee considers the reporting of ephedrine only to be a less than correct response for this sample. The methods used by these laboratories run a full gamut of instrumental approa'ches, color and crystal tests, and chromatographic methods. The Project Advisory Committee urges the laboratories missing the methamphetamine to review thei~ analytical approach to ensure that the presence of one noncontrolled material will not mask the presence of another, controlled drug material. In the case of the phenethylamines, considerable cauti on shoUl d. ,be pl aced'bn the i nterpretat i on of the results of Ultraviolet Spe'c~rophotorriet.ry and color tests.
,"
2.26

i •
, . .
TEST SAMPLE #16 - PAINT
Test Sample #16 consisted of three items; Item A was an acrylic alkyd paint with titanium oxide as the pigment. Item B possessed t~e titanil.l.m oxide pigment also, but was a soya alkyd paint. Item C was also a soya alkyd paint, but contained, in addition to titanium dioxide, a substantial quantity of zinc oxipe. All three items have traces of iron, zinc" lead and cobalt. This test sample Sample #16, is id~ntical to the paint sample previously distributed as Test Sample #lOA. A total number of 103'laboratories participated in this exercise.
, '
Laboratories were asked if Item A. could have shared a common orlgln with Item B, arJd if Item C could have shared a common origin with Item B~ The correct responses to both questions would be, no. Sixty-eight laboratories, or 66.0% of the total number participating, correctly reported no for Item A and no for Item C. Eleven laboratories, or 10.1~ of the total, correctly reported no for Item C, but incorrectly reported yes for Item A. Eleven laboratories (10.7%) correctly reported no for Item A, but incorrectly reported yes for Item C. Three laboratories, or 2.9% of the total participating, incorrectly reported yes for both Item A and Item C. Three laboratories reported inconclusive results for Item A, but correctly reported no for Item C. Five laboratories (4.8%) reported inconclusive results for Item C, but correctly reported no for Item A. Two laboratories, representing 1.9% of the tota1 number participating,. 'reported inconclusive results for both Item A and Item C.
The Project Advi,sory CQmmittee is in accord with the following general comments in regard to this sample:
Since Test Sample #16 was, in essence, a replicate of Test Sample #10A, some inprovement in the technical correctness of the test results was anticipated by the Project Advi?ory Committee and was observed. The overall performance of the participating laboratories was somewhat better for Test Sample #16 than for Test Sample #lOA. A cross tabulation of the results reported from these two test samples is included in this section .. The Project Advisory Committee wishes, however, to reaffirm the statements made in Supp 1 ementa 1 Report #1 OA, and strongly urges that 1 abor,atori es experiencing difficulty with Sample #16 review that Supplemental Report.
In particular,'the Project Advisory Committee takes note of the ~reat,variation among laboratories in the use and interpretation of chemical spot tests and solubility tests. The Committee
227

reaffirms its statement made in conncect'iol1 with Test Sample H10A that LEAA/NILECJ should consider funding efforts in cdmpiling and
. diSseminating information and· guidelines 6n the use and interpretation of spot tests and solubility tests, and for the standardization of solubility tests.
I.
Those laboratories not employing elemental analysis should consider incorporating this type of approach in their pr~tocol of analysis. Those laboratories who did employ elemental analysis, but failed to detect the large quantitative difference in Zinc composition . between Items Band C shou.ld undertake an assessment of the validity and reliability of their instrumentation, methods of analysis, and guidelines for the interpretation of results.
Those laboratories failing to detect the ,organic differences in the vehicles in Items A and B should review their instrumentation, methodology, and operator skills in the organic analysis area. The Project Advisory Committee suggests that' additional consideration be ,given to Pyrolysis-Gas Chromatography. :
CROSS TABULATIONS OF RESPONSES
FOR SAMPLES #lOA & 16
Responded to Tests #lOA and #16
Responded to #lOA, No Response to #16
No Respon~e to Tests #lOA & #16
83
28
49
10
10
No Response'to #lOA, Responded to #16
No Sample #lOA, Responded to #16
No Response to #lOA. ,DND #16
'Note: DND =Di d Not Do
.228
. 2

, 0'
i' ! ,
: ..
I "
II. Of the'S3 laboratories responding to Test Samples #lOA and #16:
ACCEPTABlE* responses for both#10A and #16 33
ACCEPTABLE responses for #idA, UNACCEPTABLE** responses for #16 10
UNACCEPTABLE responses for U10A, ACCEPTABLE responses for '#16
UNACCEPTAsl.E responses for both #lOA and #16
25
15
III. Of the 28 l~boratori~s. resp6nding to test Sample #lOA, ,but not to Test Sample #16.:
ACCEPTABLE responses.
UNACCEPTABLE responses
10
18
iv. Of the 10 lab6ratories who did not respond to Test Sample #lOA, but responded to Test Sample #16:
ACCEPTABLE responses
UNACCEPTABLE responses 5
5
* The PAC defines an ACCEPTABLE response as Items A, Band C could not have common origin. ** The PAC defines an UNACCEPTABLE response as any response other than A, Band C could not have shared common.origin or an inconclusive response.

TEST SAMPLE #17 - .METAL
Test Sample #17 consisted of three items. Item A was a sample of National Bureau of Standards Reference Material 362, AISI 94B17 Steel. Items Band C were replicate samples of National Bureau of Standards Referenc~ Material 19G, Acid Open Hearth Steel. A total of 68 laboratories participated in this exercise.
Laboratories were asked if Items A and B could have shared a common origin, if Items A andC could have shared a common origin, and if Items Band C could have shared a cOlTlmon origin. The correct response is amo to the first two quest; ons, and a yes to the thi rd. Sixty-two laboratories, or 91.2% of the total number responding, correctly reported that Items A and B could hot have shared a common origin. Sixty-one laboratories, or 89~7%, correctly reported that Items A and C coul d not have shared a common ori gi n. Fi fty-.one. laboratories, or 75.0% of the total responding, correctly reported that Items Band C could have shared a common· origin. Two laboratories, or 2.9%, incorrectly reported that Items A and B could have shared a common origin. Three laboratories, or 4.4%, incorrettly reported that Items A and C could have shared a common origin. Seven laboratories, or 10.3% of the total laboratories responding, :incorrectly reported that Items Band C could not hilve shared a common origin.
The Project 'Advisory Committee is. in accord with the following general comments in regard to this sample: . . .
The correct response rate in the comparison mode suggests to the Project Advisory Committee that relatively few laboratories are experiencing difficulty in the analysis and characterization of metals. The Project Advisory Committee notes that the majority of the laboratories submitting incorrect responses relied heavily or,exclusively on the emission spectrograph. The Project Advisory Committee concluded that these errors may have resulted from one or more. of the following:
, Carelessness or lack of training or experience on the part of the operator;
• Failure to run appropriate standards to establish the sensitivity and resolution of this instrumental approach. '
Two laboratories reporting that Items Band C could not have shared a common origin reported qual itative data derived from X-Ray fluorescence studies that would ~eem to support the correct response, i.e., that Items Band C could have shared a common origin, but that Item A is dissimilar. The Project Advisory Committee wishes to point
230
out, as it has in previous Supp.lementary Reports, that an error in -reporting may have the same consequences as an error in the an~lytical work, and suggests that laboratories review thejr procedures for en'suring that the conclusions stated i~the reports are in cOnsonance with the laboratory work which has been performed.
Very few laboratories responded with quantitative data, although they were encouraged to do so by the data report sheet, and despite the fact that many laboratories included quantitative data in connection with the paint samples #lOA and #16 and the glass samples #4 and #9. The paucity of quantitative data-prevents a det~iled analysis of the data-to be perfonned. _ The Project Advisory Committee, howev~r, notes that the concentration of the metallic elements reported by different 1aboratories and determined by different instrumental tethniques v~rie~ ~s much as 250 fold for the same metal sample, i.e., the same Item. The Project Advisory Committee wishes to reaffirm its comments made in connection with Supplemental Report #10, that those laboratories utilizing elemental analysis by whatever instrumental approach should take whatever precautions necessary to ensure that proper standards are run and that the operator posseSses the reqUisite skill inventories to interpret the instrumental data. The
. lack of consistency in the reporting of the elements in the present exercise, both qualitatively and quantitatively, suggests to the
-Project Advisory Committee .that elemental analysis is an area that deserves ~tt~ntion,andthat labor~tories should carefully review their methodology.
231

TEST SAMPLE #18 - HAIR
Te·st. Sample #18 consisted of 5 it'ems. Item A was Dog hair; Item B was Cat hai·r; Item C was Deer. hai rj Item D' was Cow. hai r; Item E was r~ink hair. The total number of laboratories responding in this exercise was ninety.
With respect to Item A, 43 laboratories, or 47.8% of the total responding~ 'correctly identified the hair as having originated from a dog. Seventeen laboratories, or 18.9%, reported the hair as "non-human." Eight laboratories reported inconclusive results, and three laboratories provided no response for this item'. Nineteen laboratories, or 21.1% of the total 1aboratoriespartfcipating, identified the· hair as being of some animal other than dQg. Among these incorrect responses were Cow, Bear, Horse, Cat, Rat and Skunk.
With respect to Item B, 66 laboratories, or 73.3% of the total responding, correctly identified the hair as having originated from a cat. Thirteen laboratories, or 14.4%, reported the hair as "non-human." Two laboratories reported inconclusive results; and three laboratories provided no r~sponse for this item. Six laboratories, or 6.7% of the total participating, ·identified the hair as being of some animal other than cat. Among these incorrect responses were Dog, Mouse, Squirrel and Fox.
With respect to Item C, 41 laboratories, or 45.6% of the total responding, correctly identified the hair as having originated from a deer. Ten· laboratories., or·ll.l%, reported the hair as "non-human." Four laboratories reported inconclusive results, and four laboratorie~ provided no. response for this item. Thirty-one laboratories, or 34.4% of the total participating, identified th~ hair as being of some ani~al other ~han deer. A~cing these intorrect responses w~re Elk, Horse, Goat, Cow, Pig and Dog.
With respect to Item D, 31 laboratories, or 34.4% of the total responding, correctly identified the hair as havir.g originated from a cow. Twelve laboratories, or 13.3%, reported the hair as "non-human." Seven laboratories reported inconclusive results, and 4 laboratori.es provided no response for this item. Thirty-six laboratories, or 40.0% of the total participating, identified the hair as being of. some other animal than cow. Among these incorrect responses were Dog, Horse, Human, Opossum, Sheep (wool), Alpaca or Llama, and Rodent. .
With resprct to Item E, 57 laboratories, or 63.3% of the total responding, correctly i~entified the hair as having originated from a mink. Twelve laboratories, or 13.3%, reported the hair as "non-human." . Four laboratories provided no response for this item. Seventeen laboratories, o~ 18.9% bf the laboratories participating, identified th~ hair as some
232
Ii

, I I
I I !
, .
animal other than mink. Among'these incorrect responses were Cat, Rat, Rabbit, Mouse and Squirrel.
The Prbject Advisory Committee is in accond with the following general comments in regard to this ~jmple:
The Project Advisory Committee notes that the incorrect response rate ranged from 6.7% in the case of Cat hair to 40.0% in the case of Cow hair. The Project Advisory Committee 'urges that consideration be given to the greater likelihood of a misidentification with hairs. of certain animals. The Project Advisory Committee wisnes to draw particu.lar attention to the situation involving Dog hair. Item A, the Dog hair, was misidentified by 21.1% of the laboratories. responding. Item 0, the Cow hair, was identified as Dog hair by 20 laboratories, or 22.2% of the total laboratories participating. The Project Advisory Committee views this error rate as being intolerably high, considering the fact that dog hair isso commonly encountered in hair evidence, and given the ease with which exemplar standards may be collected for a reference collection.
The Project Advisory Committee concludes that in the case of misidentifications of the animal hairs in this exercise, one Or more of the following may have occurred:'
• Misinterpretation of the microscopic appearance of the hairs resulting fr'om carelessness or lack of expertence on the part of the examiner;
• InadeqUate reference collection of standard hairs, or mislabeled standards ..
Since the identification of animal hairs rests almost exclusively on the microscopic appearance of the hairs, a greater premium is placed on the adequacy of the standard collection of 'hairs, and on the training and .exper.ience of the examiner. The ~roject Advisory Committee urges those laboratories experiencing difficulty in' this exerci:se to reView their methodology to ensure that these two areas are properly addressed.
The Project Advisory Committee urges LEAA/NILECJ to consider funding a project which will provide standard collections of hairs of various animals, much in the same manner as the autorlllltive paint samples collected and distributed by the National Bureau of Standards.
233

TEST SAMPLE #19 - WOOD
Teit Sample #19 consisted of three items: Item A was a specimen of Fir . (Abies grandis); Item B was a specimen of MaRle (Acer saccharum); Ite'm C ,was a sPecimen of Pine (Pinus monticola). The total number of laboratories participating in this exercise was sixty.;. five.
Participating laboratories were asked if Items A, B, and C could have shared a common'origin, and to provide a species origin for each sample if such a determination was part of the normal laboratory procedure for dealing with wood evidence. Fifty-one laboratories, or 78.5% of the total participating, correctly reported that Items A, B, and C could not have shared a common origin. Eight laboratories reported that Items A ahd C could not have had a common origin, but reported inconclusive results for I~em B. One laboratory reported that Items A and B could not have had a common origin, but reported i nconcl'usi ve resul ts for Item C. One laboratory reported that
, Items A and B' could not have shared a common origin and, indicated no response for. Item C. ,Four laboratories, or 6.2% of the total number participating in this exercise, incorrectly reported that Item Ccould have shared a cornmon orig"in with Items A and B.
Twenty-eight laboratories did not attempt to determine the species for Item A. Sixteen laboratories, or 25.6% of the total number responding correctly identified the wood as Fir. Seven laboratories, or 10.8% of the total reporting, identified the wood as being a IIsoftwood ll
• Eight laboratories, or 12.3% of the total number participating, incorrectly identified the wood as Pine. Two laboratories i.ncorrect1y identified the wood as Cedar; two.laboratories identified the wood as Spruce, one laboratory identified the wood as Redwood, one laboratory identified the wood as Hemlock, and one laboratory identified the wood as Chamaecyparis Cedar.
Twenty-eight laboratories did not attempt to determine the species for Item B. Twenty laboratories, or 30.8% of the total number responding, correctly identified the wood as Maple. Eight laboratories, or 12.3%, reported the wood as being a IIhardwood ll
• Two laboratories incorrectly reported the wood as Beech. One laboratory incorrectly reported the wood as Lithiocarpus (Tanbark Oak), one laboratory reported Birch, .one laboratory reported Walnut, one laboratory reported Basswood, one laboratory reported Mahogany, and one 1 aboratory reported Oak.
Thirty laboratories did not attempt to determine the species for. Item C. Twenty-three laboratories, or 35.4% of the total number participating, correctly identified the wood as Pine. Seven laboratories, or 10.8% reported the wood as being a IIsoftwood". Two laboratories incorrectly reported the wood as Cedar, one laboratory \ -:orted the wood as Fir, and one laboratory reported Redwood.
.234

I l
1 i
, ~
i I
d ;
i I
, i ,
I I !
, I \ .-
I i , I I
The Project'Advisory Committee'is in accord with the following general comments in regard to thfs sample:
The Project Advi sory Commi ttee consi ders the number of mi si denti fi cations of the wood samples to be intolerably high.
Since the identification of wood rests almost exclusively on a microscopic examination, a very great premium is placed on the training and experience of the examiner, and on the adequacy of standards and other reference sources. The, Project Advisory Committee cOhcludes that mis-
'identifications of the wood samples may be attributed to one qr more of the following:
., Carelessness or lack of ~xperience on the part of the examiner
• Inadequate reference standards of known woods, or mislabeled standards
The Project Advisory Committee recognizes that many laboratories examine wood evidence only in a comparison mode, and do not attempt to identify the genus or species. The Project Advisory Committee further recognizes that while,this approach will suffice in many instances, it does not develop the information that' will fully exploit this type of evidence, and urges laboratori es not now possess i rig the' capabi'l i ty of i dent; fyi ng woo<;l samples to initiate, the actions necessary to acquire this capability.
,235

. . TEST SAMPLE #20 - QUESTIONED DOCUMENTS
Test Sample #20 cOhsisted of the following items: ~nvelope bearing questioned typewriting; letter bearing questioned typewriting and handwriting, marked IIQ"; exemplar handwriting consisting of four standard specimens from each of four individuals, and marked "8", "C II
, "0 11 , and liE", respectively; typewriting standards prepared on Royal Upright, IBM Selectric, and IBM Selectric II, and marked "1", "2 11 , and 113", respectively. A total number of seventy-four laboratories participated in this exercise. Several laboratories completeq only portions of the exercise.
The typewriting on the questioned envelope was typed on typewriter "1", the Royal typewriter. The handwriting on the questioned letter wa? written by the individual designated "B". The typewriting on the questioned letter was typed on' typewri te r II 3" (i. e., typed wi th the typ i n\g element or typ i ng head on typewri ter II 3" ) .
Sixty-six laboratories, or 89.2% of the total number participating identified individual "8" as having executed the handwriting on the questioned note. Four laboratories, or 5.4%, reparted incanclusive results but specifically mentioned in their reports that they noted significant agreement between the questianed material and the exemplar handwriting of 118". One labaratory, representing 1.4% of the tata1 number responding, identified suspect 118" for having executed ane portian of the handwritten nate, and incorrectly identified suspect "C" far the remainder of the note.
'Sixty-six laborataries, or 89.2% of the total number participating carrectly identified typewri,ter 111" as having typed the text an the questianed envelop~. Seven'laborataries, 6r 9.5% of the tatal, reparted incanclu-si ve resul ts but made spec; fi c note af the agreement between the typewri tten text on the envelope and the exemplar fram typewriter "1" ..
Farty-eight labarataries, ar 64.9% af the tatal number participating, correctly identified typewriter "3" as being respansible far the typewriting an the q~estianed nate. (This includes the nine laborataries who. made the distinctian between identifying th.e typewriter and identifyi.ng the typing element.) Twelve labarataries, ar 16.2%, reparted incanclusive results for this phase af the examinatian but specifically nated the agreement between the questioned typewriting and the exemplar prepared fram typewriter "3". Ten labarataries" ar 13.5% af the tatal respanding, incarrectly elminated typewriter "3" as having typed the questianed text.
The' Praject Advisory Committee is in accard with' the follaw1ng general comments in regard to. this sample: .
. In cannectian with the handwriting partian af this exercise, ane labaratory incorrectly repartted that the exemplars labeled "8" and the exemplars
tAo r(;
. 236
....
\ ' t
;~ ;
, , , I
!
I j
;
t ..
labeled "E" were both written by the same person. One laboratory reported that one portion of the questioned note was written by suspect IIB", and the remainder written by suspect "EII. The Project Advisory Committee concludes that in these instances, the error resulted from inexperience or inadequate, training O.n the part of the examiner. The Project Advisory COlTimittee ur.ges these laboratories to take appropriate actiOh$ to acquire the requisite t~aining and exp~rtenc~ to ~hsure technical competency.
Seven laboratories incorrectly eliminated typewriter 113" as having typed the text on tli~' questioned note, but provided no information as to the bases of their conclusions.· The Project Advisory Committee cannot, therefore, comment on the possible reasons fo~ their erroneous conclusions. Three laboratories, however, eliminated, typewriter "3" on the basis of pitch. The Project Advisory Committee wishes to .draw attention to the possibility of encountering typewriters with variable pitch or proportional
'spacing, and cautioris against the use of pitch as the sole criterjon in eliminating certain typewriters as having possibly typed a questioned text.
One laboratory incorrectly reported that typewriter "3" could not,have typed the questioned "letter, and under the section of the data report form that asked for an explanation of. any factors or observations which influenced the development of the opinion replied to the effect that limy opinions were reached based on my year:s of training and ,experience in the field of questioned documents ll
• The Project Advisory Committee wish~s to emphas;-ze that the real issue is not the extent of an examiner1s
. ~xperience, but the quality, of that experience, and that years of ex-.. perience in, ~lie' fie'ld of q.uestioned documents does not, in itself gLlarantee ·:technica1 ·competency.
. I

TEST SAMPLE #21 - FIREARMS EXAMINATION
. Test Sample #21 consisted of three .25 caliber projectiles, each mark~d with a letter on the base. Those pro~ectiles marked A, B, C~ D, E, F, G, H, J, K, .L, 0, P, Q, R, S, T, U, V, Y were fired through a Wilkinson '.25 Auto pistol, Serial Number 0038Q. Those projectiles marked I, M, N, X, Z were fired through a second Wilkinson .25 Auto pistol, Serial Number 00113. A total number of 88 laboratories participated in this exercise.
Five laboratories misidentified one projectile, incorrectly reporting that all three projectiles had been fired through a single weapon. This represents 5.7% of all laboratories responding. Three laboratories, or 3.4% of the total responding, incorrectly reported that none of the three projectiles could have been fired ihrough the same weapon. A total number of nine laboratories, or 9.1%' of the total responding, reported results that are c"learly in error. Four laboratories, or 4.6% of the total, reported inconclusive results.
The Project Advisory Committee is in accord with the following ge~eral comments in regard to this sample:
The Project Advisory Committee wishes to reiterate the comments made in the Supplemental Report pertaining to Test Sample #7$ which also dealt with firearms evidence. Misidentifications such as those reported by five laboratoriesin the present exercise are particularly grave in nature, ,and the Project Advisory Committee urges the laboratories involved to immediately undertake such m~asu~es as necessary to correct their deficiencies~ A criminal . prosecu~ionmay hinge entirely, or virtually so, upon firearms evidence and the testimony of the firearms identification expert, and the potential exists for a truly severe miscarriage of justice. Responsibility for errors such .as those under discussion rests squarely with the examiner and those responsible for his supervision. . Similarly, the Project Advisory Committee wishes to point out the obvious fact that an erroneous elimination of firearms evidence may also lead to a miscarriage of justice. The Project Advisory Committee concludes that' these errors may have resulted from one or more of the foll owing:
, Carelessness on the part of the examin~r.
e A lack of experience or training on the part of the examiner.
e Inadequate or ineffectual supettvi s i on by aqua 1 ified firearms identification expert.
238
. .
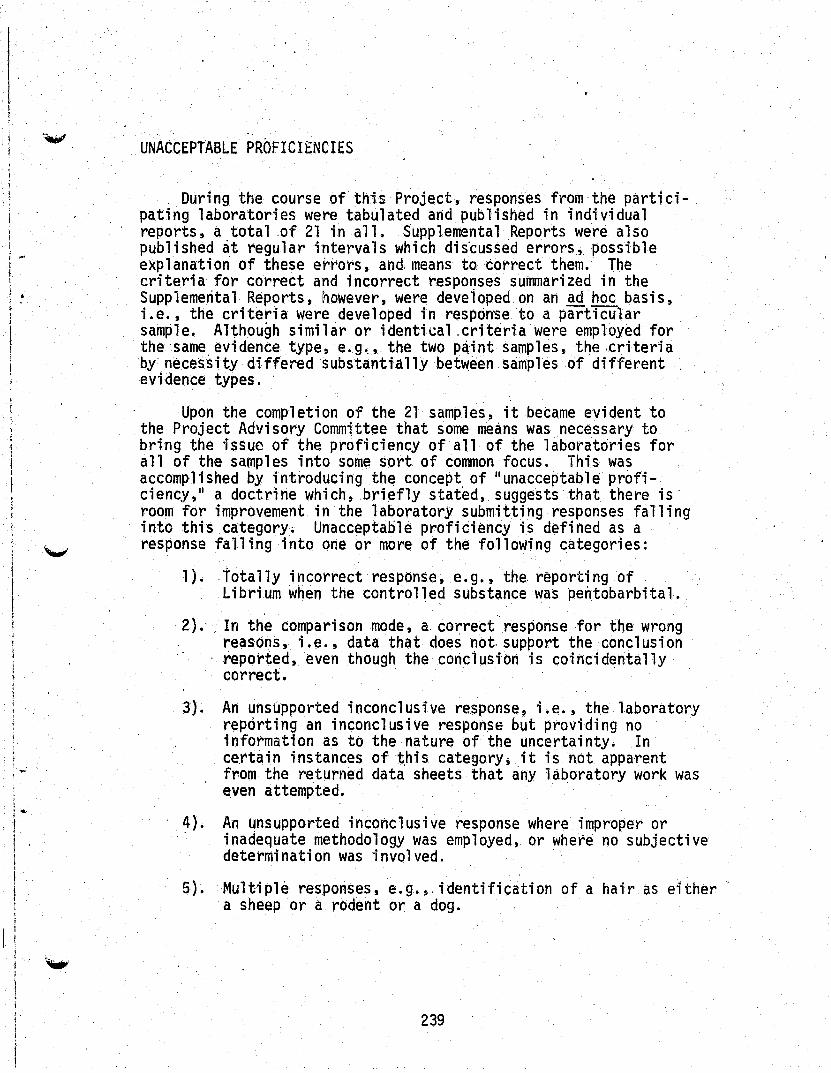
I
i .... I
! I I t
I , r
i t
, , i 1 ! '
UNACCEPTABLE PROFICIENCIES
, ' '
During the course of this Project, responses from,the partici-pating laboratories were tabulated and published in individual reports, a total of 21 in all. Supplemental Reports were also published ~t regular intervals which dis~ussed errors, possible explanation of these errors, and; means to correct them. The criteria for correct and incorrect responses summarized in the Supplemental Reports, however, were deveiopedon an ad hoc basis, i.e., the criteria were developed in response to a particular sample. Although similar or identi~al .criteria were employed for the same evi dente type, e. g .. , the two pc\:i nt samp 1 es, the .cri teri a by necessity differed substantially between samples of different evidence types.
Upon the completion of the 21 samples, it became evident to the Project Advisory Committee that some means was necessary to bring the issue of the proficiency of all of the laboratories for a 11 of the samples into some sort of common focus. This was accomplished by introducing th~ concept of lIunacceptable proficiency/ a doctrine which, briefly stated, suggests that there is' room for improvement in the 1 abora tory s ubmi tt i ng respons es fa 11 i ng into this category. Unacceptable proficiency is defined as a response falling into one or more of the following categories:
1). ,Iota lly incorrect response, e.g., the. report; ngof Librium when the controlled substance was pe~tobarbital.
2).' In the comparison mode, a. correct response ,for the wrong reasons, i.e., data that does n6t support the,c~nclusion ,reported, even though the conc 1 us ion is coi nci denta lly
3). '
4) •
5) .
correct. '
An unsupported inconclusive re,sponse, i.e., the laboratory reporting an inconclusive response but,providing no information as to the nature of the uncertainty. In certain instances of t.his category, it ;s not apparent from the returned data sheets that any laboratory work was even attempted.
An unsupported inconcl usive response where improper or inadequate methodology was employed, or wh,ere no subjective determination was involved. .
Multipl~ responses, e.g."identifi~atioh of a hair as either' a sheep or a rodent or a dog.
239

6). An incomplete response, Le., reporti.ng results of a portion ",-,' of the exer~ise but not the entire exercise .
. Usi I1g these categori~s,. the Project Advisory Committee developed criteria for unacceptable proficiency for all 21 samples (See Table 87).
The Project Advisory Committee is concerned that the concept of unacceptable proficiency not be misconstrued, and elaboration is perhaps necessary. The designation of unacceptable proficiency is not necessarily synonymous with error nor is it necessarily a measure of laboratory competency. It is instead a reflection of the fact that 'a 1 aboratory must demonstrate profi ciency in order to cl aim it. An imperfect response, for whatever reason (most certainly including legitimate reasons}, does not consti.tute that showing of proficiency. This is probably most apparent in connection with inconclusive r~sponseg. From an ethical,professional, and technical perspective, an inconclusive response is in many instances the on1y possible conclusion. At the same time, there is nothing inherent in an inconclusive opinion that demonstrates proficiency. In applying the doctrine of unacceptable proficiency, the laboratory correctly identifying 4 hairs and reporting an inconclusive response for the fifth has not made an error. It simply has not demonstrated a proficiency with respect to this fifth hair.
Using. the lIunaccepta:ble proficienci' criteria as indicated in Table 87, sUb.sequent tables were developed illustrating the responses of all participating laboratori.es to each sample (see Tables 88, 89 and 90).
Table 90 summarizes the acceptable and unacceptable' responses, the percehtag~ of responses wh.; ch wereacceptab 1 e, and the number of laboratories falling into each percentile. category, based on the number of tests performed. For example, of the 49 laboratories which fall into the 100% category, that 100% calculation is based on their responses to the number of tests they participated in; this can range from one test to nineteen tests (test numbers 18 and 21 are not included). Responses may total more than nineteen due to several. tests requiring multiple answers. Table 91 further summarizes these data and illustrates, for example, that 25% of all laboratories which participated in the study had 100% acceptable responses; 34% of the laboratories had 90% or greater of their responses acceptable; and 66% or approximately two-thirds of the laboratories having 80% or more of their res~onses fall in the acceptable category.
240
-_._--_._-
...

TABLE 87
SUMMARY OF "UNACCEPTABLE PROFICIENCY" CRITERIA
S~mple Sample Criteria for "Unacceptable Proficiency"
"' Number Type
1 Drug Responses of: Amobarbital, Butabarbitai, .. Secobarbital, Phenobarbital, Sodium' butabarbital, Sociium secobarbital, Librium, No drug found
2 Fi rearms ' Failure to at least mention Smith & Wesson and Beretta among the possible candidate weapons
3 Blood Any respqnse other. than blood type B; Un-supported inconclusive response
4 Glass . A re~ponsestating that the glass samples could have shared a common origin; inconclusive response
5 Paint Any response other than C could have shared a common origin w~th A; inconclusive response
''\wf' 6 Drug A response wh·i ch fai 1 ed to menti on ei ther heroi ri , or cocaine j
. '7 Fi rearms Misidentification r
I 8 Blood Typing error in any system; unsupportable inconclu-sive
! 9 Glass Any response other than A and B could have shared a common origin with C; inconclusive response
lOA Paint Any response other than A, B, and C could not have shared a common origin; inconclusive response
11 Soil Any res~6nse other than Band C could not have shared a common origin with A; inconclusive response
12 Fibers Any response other than A and B could not have shared a common origin with C.
13 Physio- Part A - Misidentification logi ca 1 Part B - Unsupportable inconclusive Fluid
14 Arson Any response other than A and C could have shared a common origin with B
15 Drug Responses of: amphetamlne, ephedrine only, oY' no drug found
~
241
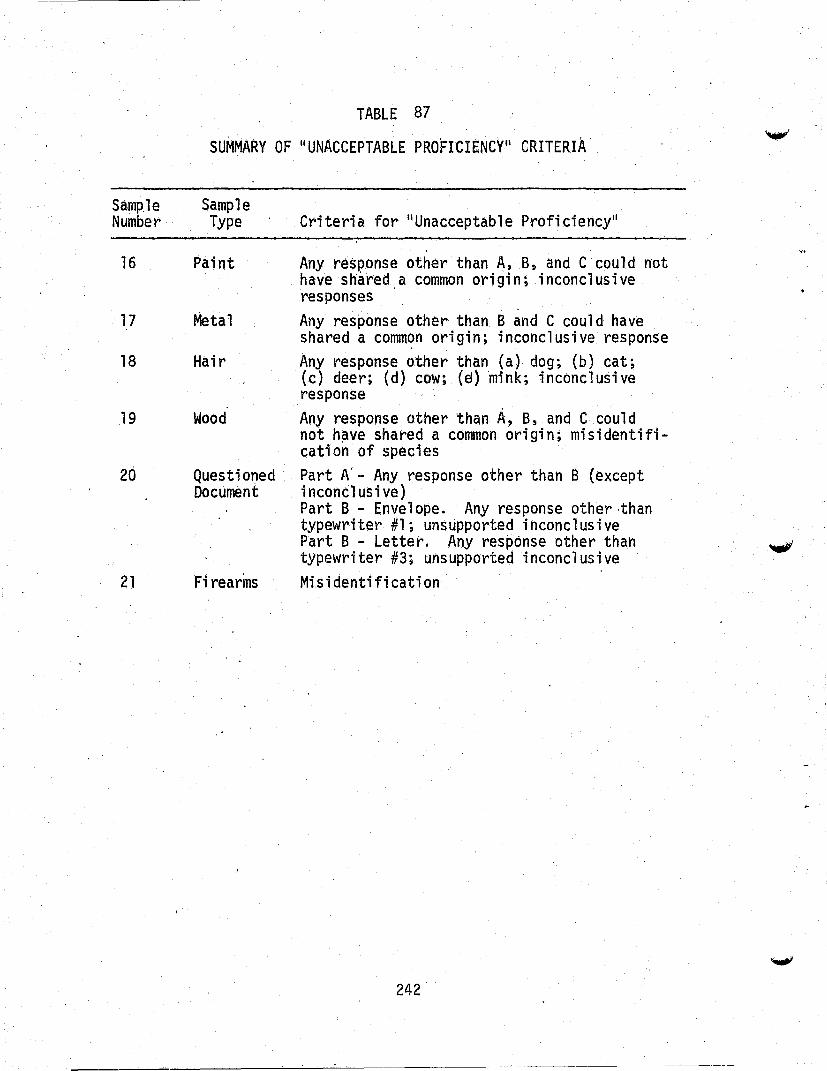
TABLE 87
SUMMARY OF "UNACCEPTABLE PROFICIENCY" CRITERIA
Sample Sample Number Type Criteria for "Unacceptable Proficiency"
16 Paint Any response other than A, B, and C could not have shared. a common ori gi n; i nconcl us i ve . responses
17 Metal Any response other than Band C could have shared a common origin; inconclusive response
18 Hair Any response other than (a) dog; (b) cat; (c) deer; (d) cow; (9) mink; inconclusive response
19 Wood Any response other than A, B, and C could not h~ve shared a common origin; misidentifi-cation of species
20 Questi oned . Part A' - Any response other than B (except Document inconclusive)
Part B - Envelope. Any response other ·than typewriter #1; unsupported inconclusive Part B - Letter. Any response other than typewriter #3; unsupported inconclusive
21 Fi rearins Misidentification
242

j' ~ l
I !
f ~
i ! • I
I , , I
I
. TABLE 88
t' AGGREGATE RESULTS OF PARTICIPATING LABORATORY RESPONSES TO TEST SAf1PLES # 1-21 *
.Lab. ·,'1' Number _ 234 6
Test Sample Number 7' 8 9· 10 .11 12 13 14 15 16 17 19 20
1 A NR UA
U DND A
A
U
A
A
'A U A U U A AlA NR A NR
NR
NR U NS
NR DND NS
NR NS NS
NR NR NS
DND NR NS
DND NR NS
DND DND NR
U A NS
NS NS NS
NR NR DND
2 A A NR A U NR A DND U U
3
4
5
6
7
8
9
16
11
12
13
14
15
16
17
18
19
20
21
22
23
24
25
26
27
28
29
30
31
32
33
34
35
36
37
A A A A A A NS U U
A A A A A A A NR A
A A A A A A A U A
A NR A' A A A A U A
U U DNO A A A U NS A
A U A NR U A U U A
A DND DND DND DND A NS NS NS
A U DND A . A A A NS NR
U DND A DND DND NR NS U NS
NS A DND NR NS NS A NS NR
NR NR NR A NR NR NR NR NR
A U A A U A A U A
NR NR NR NR NR NR NR
U NR NR NR U A NR
U A A A/A A U A
U A A NR NR·U U
NR U. A A/U U U NR
U . A A A/A A U A
NS DND DND· A/A DND· DND NS
NR NR' NR NR U U NR
NS NR DND NR U NR NS
DND DND DND DND DND DND NS
NR NR NR NR NR NR NR
U U A A/A A A U
U A NS
DND DND A/U
NR NR NR
DND A A/A
A
A
U
A
'NR
A A A A A A U A A A A A/A A A
A
NR
A
NR
NS
NR
U
NR A
U U
NR NR
NR
A/A
NS
A/A
A
A
A
A
A
A
A
A
A
A
A
A
A
A
U
A
A
A
A A DND DND A' A U NS NS U NR A/A NR
NS li
A A
A A A NS NR NR NR NR NR NR A
U A A/A U A A A A, U A A A A
NR DND DND DND NR
A A A U A
A A A A A
A A A A A
DND DND DND DND NR
A A' A A A
A A A NR A
A A
U A
U NR
A A
U A
NS A
. U A
A A
NR U
A A
A A
U A
A A A
A A A
NR NR NR
A A A
NR NR A
A U A
A
NR
A
A
A
A
NR A
A NR
NR A
A A
U A
A A
NR
U
A
A
NS
A
A
A
A
A
.A
A
NS
NS
A
U
U
NS
A
U
A
U
U
U
NR
A
U U
A A
A NR
A U
A A A' U
NS
A
A
U
NS
A
NR
A
A
A
A
A
NR
NS NR NR
U A A
U A A
U A A
NS DND NR
U A A
U NR NR
A NR A
A U A
U U A
A A A
NR NR A
NR NR NR
NR DND NR NS DND DND NR
A/A A A U A A A/A
A/A A A A A DND NR
A/A A A A A A A/A
NR A NR NS PND DND NS
A/A A A U DND NR A/A
A/A A NR NR NR NR NR
A/A NR U U DND NR NR
A/A DND A A A U NS
NR NR NR NR NR NR NS
NR A A U DND NR NS
A/A NR U NR NR A A/A
NR NR NR A DND DND NS
A A
NR NR
NR A A/A NR
NR NR NR NR
A
NR
A
A
A
A
NR
NR
A
A
NR
A
NR U
DND NR
NS
NS
A/U
A/A
AlA NS
U U A DND NR A A NR
A U U A A/A A A A
U U A A A/A A A A
U NR A A A/A A NR A
243

AGGREGATE'RESULTS OF PARTICIPATING LABORATORY ~ESPONSES TO TEST SAMPLES # 1-21*
Lab Test Sample Number Number 1", 2 . 3 4 5 6 7 8. 9 10 11 12 13 14 15 16 17 19 20
. 38
39
40
41
42
43
44
45
46
47
48
49
50
51
52
53
54
55
56
57
58
59
60
61
62
63
64
65
66
67
68
69
70
71
72
73
74
U.
A
A
A
A
A
A
A
A
A
A
A
A
A
DND A A A A
A A A U A
NS DND DND DND A
DND A DND DND A
U A A NR A
A A A A A
NS .DND DND DND· NR
NS A A U A
A A A A A
A NR A A A
DND DND NR
NR A NR
A A A
DND A
NR NR
A A
A U A' A
A U ~:R u NR U NS NR
NS NR NS NS
A A' NR NR
A U U A
NS NS NS NS
DND NR NR NR
A U A A
NR NR A NR
NS NS
NS' NR
A A
DND NS
tlR· NR
A U
A A U U
NR NR NR NR NR NR NR NR. NR NR
A U A A A A A A U U
A A A A A A A U U A
AU' A A DND A A A A NR
NR A DND A NR NR A NS NR NR
A NS NR NR NR A NR NR NR NR
A A A NR NR A NR U NR A
DND U NSA A DND A U A . A
NS A A NR NR DND A NR NR NR
A NS NR NR NR NR NS NR NR NR
A NS DND DND DND U NS NS NS NS
A DND A DND U A DND A NS U
A
A
NR
A
A
A
A
A
A
NS
A
NS DND DND DND A NS NS NS NS
NR A A A A A A A NR
NR
A
NS
NS
NS
A
NS
NS
A
NR NR NR NR NR
A DND NR NR A
A DND DND A NS
DND DND DND A NS
DND,DND DND A NS
A .A A A A
DND NR NR NR NS
NS NS .NS NS NS
AA A A A
NR
U
U
NS
NS
A
NS
NS
U
NR NR
NS U
NS NR
NS NS
NS NS
U U
NR NR
A A
U U
244
A 'A AtA A A
A NR AlA U A
DND DND DND A U
DND A
NR A
·u A
DND NR
NR NR
A A
NR U A
NR NR NR
A/A U A
DND DND NR
NR NR NR
A/A U A
A· NR A/A NR NR
DND DND' DND DND A
NR NR NR NR NR
U A U/A A U
A A A/A A A
U
A
NS
NS
NR
NR
NS
Nil
A
NR
NS
NR
NR
A
NR NR
NR A
NR NR
A/A U
NR NR
U A
A U
U NS
A A A/A
A A NS
DND DND NS
U DND DND
DND DND N$
NR NR A/A
DND NR. NS
NR NR DND
A DND NS
NR AU/A
DND DND NS
NR NR NR
NR NR A/A
A U NS
NR NR NR
A DND A/A
DND DND A/U
DND DND NR
NE A A/A A
DND DND A/A A
DND DND NR NR
NR NR NR U
NR NR NR A
A A A/A A
DND DND DND DND A/A
NR NR NR NR NS
A.A NR NR NR
DND A A A A/A
NR A NR NR DND NR DND DND A/A
DND DND DND DND A DND NR DND NS
DND DND NR NR DND NS DND DND NR
DND A A/A U A NR DND DND A/A
DND DND DND DND A
DND A A/A U A
NR NR NR NR NR
DND A A/A A U
DND NR A/A NR A
DND DND DND DND NR
DND NR
NR A
NR NR
U A
DND DND U
A/A A U
NR DND NR
A/A A A
A A A/A A A
NS DND DND NS
U DND DND A/U
NR
A
NS
NS
NS
NR
NR
A
A
NR NR NR
DND DND DND
DND DND NR
DND DND NS
DND DND NS
NS NR NR
NR NR NR
A A A/A
A A A/A

I -
I
TABLE 88 (cont'd)
AGGR~GATE RESULtS O~ PARTICIPATING LABORATORY RESPriNSES TO TEST SAMPLES # 1-21*
I Lab II' Number _
Test >Sampl e Number 2 3 4 5 6 7 ~ 9, 10 11 12 13 14 15 16 17 19 20
'75 NS NS NS NS NS NS NS NS NS NS U A A/A U A U DND A NS
'76 A ,A A A A A A A A A U A UtA A A A A A U/U
77 A NR A A A A A U A, U A A A/A U A A A A A/A
78 NR NR NR NR NR NR NR NR NR NR NR NR NR NR NR NR NR NR NR
, 79
80
NS NS NS NS NS NS Ns NS NS NS NS NS NS NS Ns DND DND DND NR
A U A DND DND A A U NS NS DND A A/A U A NS DND DND NR
81 AU, A A A A A A A A A A A/A A A A A DND U/A
82 A A ' A A 'A A A A A A A A A/ A U NR A A NR AI A
, 83 ANSA DND DND A NS U NS NS DND A A/A A NR NS DND DND NS , ,
84 A U A A A A A' U U U U A A/A NR, A A DND DND A/A
85 A U A A A A A U A, A A A A/ A U NR A ' A 'DND NS
86 A A A A A, A A U A U DND A A/A A A A A DND A/A
87 A A A A A A A U A A DND NR A/A U A NR A A A/A
88 A NS A DND DND A DND NR NS NS U NR NR A NR NS DND DND NS
89 A NS NS NR NR NR A NR NR U NR NR NR A NR NR NR DND NS
90 NSNS NS NS NS NS NS NS NS NS NS NS NS NS NS A A DND NS
91 A NS 'DND DND DND.A NS NS DND DND DND DND DND DND A DND DND DND NS
92 A DND DND DND DND A NS' NS NS NS DND DND DND DND A NS DND DND DND
93 A U A: A A A' A U A A U A A/A ,A A A NR DND NR
94 NR NR ,NR NR NR A NR U DND NR NR U A/A DND A A DND NR NS
95 'A NR NR NR DND A NR NR DND NS DND DND DND DND NR NS DND NR NR
,96 A NS DND DND DND DND DN!:! NS NS NS NR NR NR NR NR NS NR NR NR
97 A NR A U ,A' A NR NR NR NR NR NR NR A NR NR DND DND DND
98 A A A DND DND A A U NS NS DND DND A/ A A A NS DND DND NS,
99 ' A A A A U A A A NR NR NR A A/A NR NR NR NR NR A/A
100 NR NS NR NR NR DND NS NR DND DND DND DND DND DND DND NS DND DND DND
101
102
103
104
A U A U A A A U A U A A A/A U A A A A A/A
A A A U A A A A NR U A A A/A U A U DND NR NS
NR NR, NR NR NR NR NR NR NR NR NR NR NR NR NR NR NR NR NS
A NS A A, A A DND U A A U A A/U U A A A U NS
105 A A A A A A A A A A U A A/A A NR A DND NR U/U
106 A U A A A A A U A U U A A/A NR A U DND U NS
107 NR NR;· NR NR NR NR NR NR NR NR NR NR NR NR NR NR NR NR NS
108 A A A 'DND DND DND DND DND NS NS DND DND DND DND DND NS DND DND NS
109
110
111
A A A DND A A A U A A A A AlA AU' A NR DND A/A
NR NR NR NR ,NR NR NR NR NR NR NR NR NR NR NR NR NR NR NR
A A A A A A A U A A A A A/A A A A NS A NS
245

AGGREGATE RESULTS OF PARTICIPATING LABORATORY ~ESPONSES TO TEST SAMPLES # 1-21*
Lab , Number
Test Sample Number 1, 2 3 4 5 6 7 8 9 10 11 12 13 14 15 16 17 19 20
A NS DND NR DND A NSNS DND NS DND NR NR DND NR NS NR NR NR
113 A NS OND DND DND NR NS N~ NS NS DND DND DND DND NR NS NR NR AlA
114 NR A A A A A A U NR U NR NR NR NR NR NR NR NR NR
115 DND U A DND DND DND U NR NS NS NR NR AlA NR DND NS NR NR AlA
116 ' A A A A NR A A DND NR A NR NR DND DND' A NR NR NR NR
117 A A A A. A A AU. A A A A AI A DND A NR DND A AlA
118 A NS NR NR NR A NS NR NR NR NR NR NR NR NR NR NR NR NR
119 NR A NR NR NR DND A DND DND DND DND DND DND NR NR NS DND A DND
120 A NR DND NR NR A NR NS NR NR DND NR NR NR' A NR NR NR NS
121 NS NS NS NS NS NS 'NS NS· NS NS A A A/A A A U DND NR NS
122 A NR A A A A A A A A U A AI A A A A A A A/ A
123 A NS NR NR NR A NS NR NR NR NR NR NR NR NR NR NR NR NR
124 A NS DND DND DND A. NS NS .NS NS DND DND DND U A NS DND DND DND
125 A A A A A A A 11 U A (J A A/ A A A A DND DND NR
126 A A A A A A A A A A NR A AlA DND A A A DND A/U
127 A A U A NR A U NR A NR NR NR NR NR NR NR NR NR NS
128 A A A A A A A W A A A A AI A U A A A A NS
129 A NS A A A A DND A A A U A AlA A A A U U NS
130 A NS A A A U NS U U U A A AI A U A A U NR NR
131 A A A A A A A A A A U A AI A A A A U A NS
132 A A NR, A A A A A A NS A A AI A A NR A A DND NS
133 A A A A AA A A A U A A AI A A A U DND DND A/A
134 A NS DND U 'NR A NS NS NR NR NR' NR AlA NR NR NR NR NR ·NR
135 . A NR A A A NR A NR NR NR NR NR NR NR NR NR A NR NR
136 A NS A DND A A DND U NS A DND A AI A A NR U DND A NS
137 NS NS NS NS NS NS NS NS NS NS NS NS NS NS A DND DND DND NS
138 A A A A A A A NR A A A A A/A A A A A A A/A
139 A NS A DND DND A NS U NS NS DND DND A/A A U U DND NR NS
140 A NR A NS A A A A U A NR' A NR U A A A DND NR
141 NS NS NS DND DND A NS NS DND NS DND DND NR DND A NS DND DND NS
142 A A A A A A A U A Nil NR NR NR A A A NR NR AlA
143 A NR NR A NR NR NR DND DND DND NR NR NR NR NR NR NR NR NR
144 A NR NR NR NR NR NR NR NR NR NR NR NR NR NR NR NR NR AlA 145
146
A A A A A A A U A A A A U/A A A A A DND A/U
A NR A A NR A A U NR NR NR NR A/A NR A NR NR NR AlA
147 NS NS NS NS NS NS NS NS NS NS NS NS NS NS NR DND DND A DND
148 A NS DND DND DND A DND NS NS DND DND DND DND DND A NS DND NR NS
246
~:
...

TABLE 88 (cont'd)
'AGGREGATE RESULTSOF PARTICIPATING LABORATORY RESPONSES TO TEST SM1PLES # 1-21*
Lab NiJ1TIber
"
1 2 3 4 '5
Test Sample Nu~ber 6 7 '8 9 10 11 12 13 14 15 16 17 19 20
149 A' 'NSOND DND' DNDA DND NS NS DND OND DND OND DNO A NS DND DND DND
150 A A A A, A A A A A U A U A/A U A A A A A/A , ,
15i NR NR NR NR NR NR NR NR NR NR NR NR NR NR NR NR NR NR NR
152 U A U U U A A U' U NR NR A A/A A 'A U DND DND NR
153 . A NS A A A A OND U A A OND A A/A A A A DNO DND DND
154 U A A A NR A A U NS U NR 'NR NR NR U NR NR A A/A
155 U li ONO OND U NR A DND OND NR' DND OND DND NR AU. DND U A/A
156 A A A A NR NR A U A U NR NR NR NR NR NR NR NR A/A
157 t-!RU A NR NR, NR Nir NR NR A NR NR A/A NR DNO NR NR NR NS
,158 A NR NR NR N~ U NR DNO DNO DNO DND DND DND NR V NS DND NR NR
159 A A U A A A A U A A A A A/A A U U U , A NS
160 A NR A A U A A li U A. A A AlA A A A U DND A/~
161 A ONO A ONO ONO NR DNO U NS OND A A A/A A NR NS DND DNO NS
162 NS NS NS NS NS NS NS NS U U DND ,A A/A A A' U U A A/U
163 NR NS DNO DND ONO A NS OND DND DNO NR NR NR NR NR NS NR NR NS
i64 A NS A OND ONO A NS U NS NS A A A/ A NR A NS DNO DND NS
165 A NS A DND DND A NS U NS NS DND DND A/A NR . U NS DND ONO NS
166 A A A. NR A A A NR NR NR NR NR NR NR NR NR NR NR A/U
167 A A A, A U A A A A U U A A/A U A U A DND A/A
168 NR NR NR ,NR NR NR NR NR NR NR NR NR NR NR NR NR NR NR. NR
169 U, NR A NR NR A A NR NR NR NR NR NR NR' NR U OND NR NS
170 A A A A A A A U A U NR A A/A A A' U NR DNO NS
171 A A A A A A A U A A ,A A A/A A A A DND A A/A
172 U U A ' NR NR NR NR NR NR NR NR NR NR NR NR NR NR NR NR
173 A NS A OND NR NS 'NS U NS DND A A A/A OND NR NS OND DND DND
174 A NS NR 'NR NR NR NS NR NR NR NR NR NR NR NR NR NR NR NR
175 A NS A NR NR A NS U NR NR NR NR NR A NR NR NR NR NS
176 A A OND A A A A NS U U U A NS .A A NR DND DND NS
177 U ~R NR NR NR NR NR NR NR NR NR NR NR NR NR NR NR NR NR
178 A A A NR NR NR NR NR NR NR NR A NR OND NR U NR NR NR
179 A A A A U A A U A U A A A/A A A A DND DND NS
180 NR NR NR NR NR NR NR NR NR NR NR NR NR NR NR NR NR NR NR
181 A A NR NR NR NR A NR DND NR DND NR NR DND NR NR NR NR A1A
182 A NS A A NR A NS NR NR NR NR NR NR NR NR NR DND NR NS
183 NS NS NS NS NS NS NS NS NS NS .NR A NR A A NR NR NR NS
184
185
U NS' A A A A A U NR U NR A A/ A U A NR NR DND NS
A .DNO DND DND DND A NS NS NS NS DND OND DND DND DNO NS DND DND NS
247

AGGREGATE RESULTS OF PARTICIPATING LABORATORY RESPONSES TO TEST SAMPLES # 1-21*
. Lab . Test Sample Number
Number 1 2 3 4 5 6 7 8 9 10 11 12 13 14 15 16 17 19 20
186
187
188
189
190
191
192
'193
194
195
196
197
198
199
200
A DND A A
NS . NS NS NS
A A A. A
A NR NR NR
NR A NR
A
NS
U
A
U
A
Ns A
A
A
NS . DND DND DND A
A A A A, A
A A A A A
U NR A A A
AA NR NR A
DND .DND DND A
A 'A A A
NS
NS
A
A
A
NS
U
NS
A
NR
U
NS
A
NS
U
NR
NR
NS
U
NS
A
NR
U
NS
NR
A
A
A
A A' A
NR A NR
U
NR
DND NS
A A
NR. NR
NR
NS
U
NR
NS
U
A
A
U
A
NR A DND A
U U A A
A
A
A
NR
DND A
NR NR
AlA A
NR A
DND NR
NR NR
A
NR
A
NR
DND DND A/A DND A
U
A
A
NR
U
DND DND DND NR DND NS
A A A/A A
NR NR' NR NR
A
NR
DND DND NR NR NR
DND NR NR NR NR
DND A A/A DND A
U
NR
A
A
NR
A
AlA A A
NR NR
AlA A
A
A
NS
A
A
A
A
A
A
A
A
NS
U
A
A
NS
A
A
A DND NR A NS
NR
A
NR NS NR . DND DND NR NR
NR
NR
NR
A
NR
NR
NR
NS
U
NR
A
NR
A A NR
A NR DND
NR DND A/U
NR NR NS
DND DND A/U
NR DND A/U
NR A A/A
A NR DND
NR NR DND
DND NR NS
DND DND NS
U A A/A
NR NR NR
A A DND
DND DND NS
201 A NS A ' A DND A NS l,l U NS NR' NR NR NR A A U A NR
202 A U A A NR A A U NR NR NR NR AI A A NR NR NR NR NR
203 A NS DND NR DND NR NS DND DND NS DND DND DND DND NR NS NR DND DND
204 A NS A DND DND A NS U NS NS DND DND DND DND NR NS A DND NS
205 NR DND DND DND DND DND NS NS NS NS DND DND DND DND NR NS DND DND NS
206
207
208
209
210
211
212
213
214
215
216
217
218
219
220
221
222
A
A
A
A
NS
U
A
A
, U
A
A
A
A
A
U
A
A
NS A DND DND A
U DND DND DND A
NS
A
NS
U
NS
NS
NS
NS
U
A
A
NS
U
A
NS
A DND DND A
A A A A
NS NS NS NS
NR NR NR A
A A U A
A
A
A
A
A
A
A
A
A
A
A U A
A A A
A A A
A A A
A A A
A A A
AQ A A
A U A
A A A
DND DND A
NS U NS NS DND DND DND DND DND NS NR DND DND
A NS NS NS NR NR DND NR A NR NR NR NS
NS U
A U
NS NS
U A
NS U
NS U
NS U
NS U
A U
A U
A A
NS U
A A
A U
NS U
NS NS
A U
U U
DND U
U A
U
U
A
A
A
U
A
A
A
NS
U
A
U
A
A
U
A
U
U
NS
248
DND DND A/A A A
NR
A
P.
U
A A A/A A
NR A A/A A
NR NR NR A
A A A/A NR
U A
U A
A A
A A
A A
U A
U A
A A
U A
DND NR
A/A NR U
A/A NR NR
AlA DND U
AlA U NR
A/A A A
AlA A A
A/A A A
A/A A U
AlA DND ,A
NR NR A
NS
A
NR
U
A
A
U
A
A
A
U
A
NR
A
NS
DND NR NS
A DND AlA
NR NR A/A
NR NR A/A
U A DND
NE
NR
A
NR
A
U
A
NR
A
A
A
NR
U
A
U
U
U
NR
A
U
NS
A/A
NS
NS
NS
A/A
NS
NR '
NS
NS

. 'TABLE,88 (cont'd) 'AGGREGATE RESULTS OF PARTICIPATING LABORATORY RESPONSES TO TEST SAr-1PLES # 1-21*
Lab, Number 2 3 4 5 6
T~st Sample Number 7 8 ·9 10 11 12 13 14 15 16 i7 19 20
223 A NS DND DND DND A Ns NS. NS NS A OND DND DND A NS DND DND NS
224 A A DND A A A' A NS ~ U: U OND DND DND DND A A DND A A/A
225 A NR A NR NR' A NR NR HR' NR NR' NR NR NR A NR DND DND NS
226 A A 'A A DND A A U A NS DND NR A/A NR A NS NR NR NS
227 A NS A 'DND DND A NR U NS NS NR A A/ A DND A NS DND DND NS
?28 NR NR DND NR NR NR' NR NS NR NR· NR NR NR NR NR NR NR NR NR
229
230
A A A A' A A A U U AU· A A/A A A U A A NS
Ii. , A A ' NR A A . A U NR NR NR NR A/A NR A A NR A NR
231 A A' A' A U A A . NR U U . DND A NR DND A NR NR NR A/A
232 A A 'A A U A ' A NR A' A A A AI A A A NR A DND A/U
233 A U A A A A A U A A A A AlA A A A A 'DND AlA
234 NS NS' NS NS NS NS NS NSNS NS NS NS NS NS NS NR A NR NR
235
236
237
~ ~ ~ ~ ~ ~ ~ ~ ~ ~ A A ~ A
"NS A A A A NR A A U NS NR A AI A A
. NS A A A A NS A U A NR NS A AI A A
A A A A A/A
A A A A AlA
NR NR NR NR A/A
238 A U .A A NR A A NR U NR U NR NR NR NR, U DND DND NS
239 A A A, DND· DND A A A NR A A A A/A, NR A NR NR NS NS
240 A A A A A A A U A A A A AlA U U U U A A/A
241 NS NS NS ,NS NS NS NS NS NS NS NS NS NS NS NS NS NS NS NS
242 NR NR NR NR NR NS NS NS NS NS NS NS NS NS NS Ns NS NS NS
243 NSNS NS NS NS NS NS NS NS NS A NS DND NS NS NS NS NS NS
244 NS NS NR NR NR NR NS NR NR NR NS NS NS NS NS NS NS NS NS
245 NS NS NR 'NS NS NS NS NS NS NS NS NS NS NS NS NS NS NS NS
246 A A DND A A A A NR U A DND DND AlA U A U DND DND NS
247 A A A' A A A A NR DND DND DND A NR U NR 'NS NR DND NS
248 A NS DND NS NS NS NS NS NS NS NS NS NS NS NS NS NS NS NS
249 A NS NR NR NS NS NS NS NS NS NS NS NS NS NS NS NS NS NS
251 NR NS NS NS NS NS NS NS NS NS NS NS NS NS NS NS NS NS NS
252 NS NS NS NS NS NS NS NS NS NS NS NS NS NS NS NS NS NS NS
253 A NS NS NR NR A NS NR NR NS NS NS NS NS NS NS NS NS NS
254 U NS A A U A NS A U NR NR NR A/A DND NS NS NS NS NS
249

TABLE 88 (cont'd) AGGREGATE RESULTS OF PARTICIPATING LABORATORY ~ESPONSES TO TEST SAr~PLES # 1-21*
*Each point in the matrix represents the response given .by a laboratory for a particular test which i.s coded as follows:
~S - Sample N~t Sent
.NR - No Response Received
DNQ - Does not perform test
A - Acceptable Proficiency Demonstrated
U - Unacceptable Proficiency
The "Lab Numper" in the far left-hand column 'bears no relationship to the code number assigned to laboratories in the course of the research study. .
Test Sample #18 is not included in this table because it contained five (5), different responses.
r~st Sample #13 has been broken down into two (2) responses per the instructions on the Data Sheet. ~
250 .' "
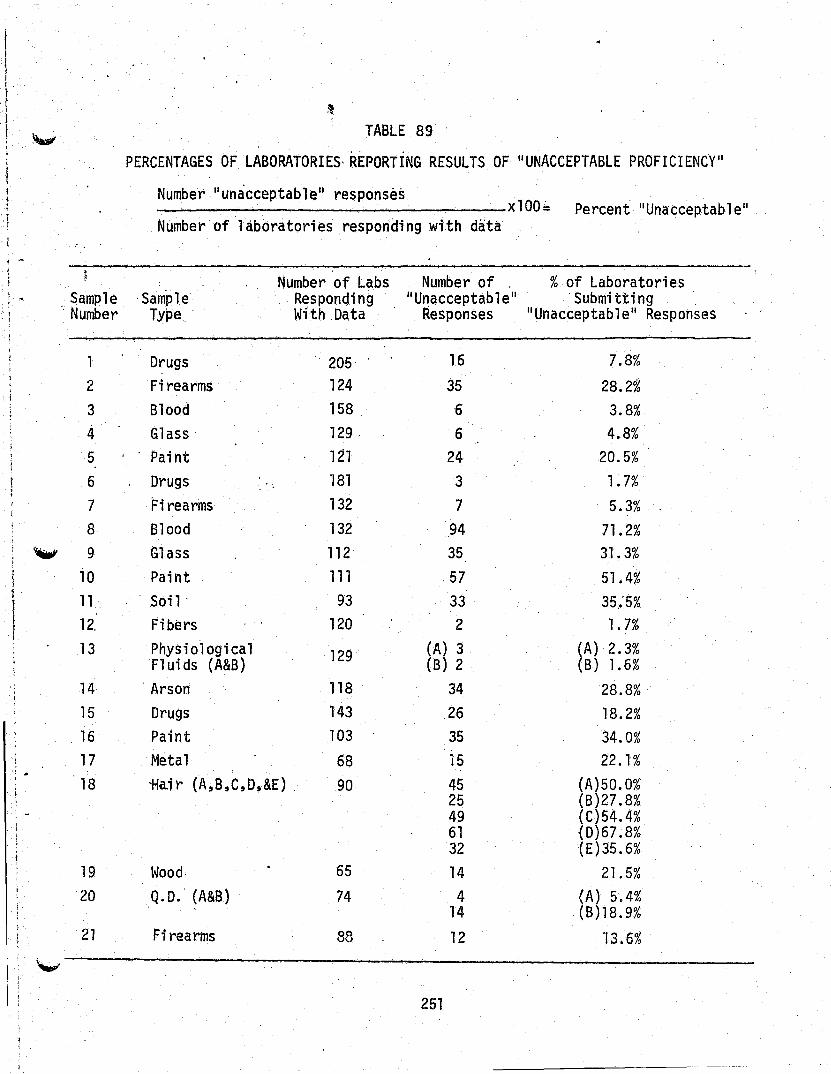
~ TABLE 89
PERCENTAGES OF LABORATORIES, REPORTING RESULTS OF "UNACCEPTABLE PROFICIENCY"
Number "unacceptable" responses xlOO= Percent "Unacceptable"
Number'oflaboratories ,responding with data
! ~
Number of Labs Number of % of Laboratories , Sample 'Sample Responqing "Unacceptable" , Submi tti ng t ~ I . Number Type, ' With Data Responses "Unacceptable ll Responses f
1 Drugs ' 205, 16 7.8% 2 Firearms 124 35 28.2% 3 Blood 158 6 3.8% 4 Glass 129 . 6 4.8% 5 Paint 1 ~1 24 20.5% 6 Drugs 181 3 1. 7% 7 Firearms 132 7 5.3% 8 Blood 132 94 71.2%
-- 9 Glass 112 35 31.3% 10 Paint 111 .57 51. 4% 11 Soi 1 . 93 33 35,;5% 12. Fi bers 120 2 1. 7% 13 Physiological 129 (A) 3 (A) 2.3%
Fluids (A&B) (8) 2 (8) 1.6% 14 ' Arson 118 34 28.8% 15 Drugs 143 26 18.2%
, 16 Paint 103 35 34.0% 17 Metal 68 15 22.1% 18 -Hair (A,B,C,D,&E) , 90 45 {A)50.0%
25 (8)27.8% 49 {C)54.4% 61 {D)67.8% 32 (E)35.6%
19 Wood, 65 14 21.5% 20 Q. D. (A&B) 74 4 (A) 5.4%
14 (8) 18.9% 21 Firearms 88 12 '13.6%
~
251

TABLE 90
DISTRiBUTION OF PROFICIENCY RATINGS AMONG PARTICIPATING LABORATORIES*
Number of Number of Percentage A U Labs Percentage A U Labs
100.0 20 0 1 90.0 18 2 2 .A
18 0 1 9 1 1
15 0 1 89.9 17 2 7
12 0 1 88.9 16 2 6
11 0 1 8 1 3
9' 0 1 88.2 15 2 1
8 0 1 87.5 7 1 5
6 0 4 86.7 .13 2 2
5 0 3 85.7 18 3 5 .."
4 0 6 6 1 6
3 0 13 85.0 17 3 ·4
2 . 0 13 '84.6 11 2 3
1 O' 3 83.3 15 3 2
95.0 19 1 2 10 2 2
94.7 18 1 1 5 1 1
94.4 17 1 3 82.4 14 3 10
94. 1 16 1 2 81.8 9 2 2
92.·9 13 1 2 81.3 13 3 2
92.3 12 1 ,3 81.0 17 4 2
~l. 7 11 1 2 80.0 12 3 2
90.9 10 1 2 8 2 2
* Does not include Jests 18 and 21.
252

TABLE 90 ~.'
DISTRIBUTION OF PROFICIENCY RATINGS AMONG PARTICIPATING LABORATORIES
Number of Number of Perceritage A U Labs Percentage A U Labs
4 1 7 69.2 9 4 2 ~
78.9 15 4 .2 68.8 ·11 . 5 2
Ti.8 14 4 4 66.7 10 5 2
7 2 1 8 4 1
76.9 10 '3 3 6 3 1
76.5 13 4 1 4 2 1
76.2 16 5 2 2 1 3
75.0 1~ 5 1 64.7 11 6 1
12 4 2 64.3 9 5 1 '-'
9 3 2 62.5 10 6 1
6 2 3 5 3. 2
3 . 1 5 61.5 8 5 1
73.7 14 5 3 61.1 11 7 1
72.7 8 3 1 60.0 9 6 1
72.2 13 5 1 3 2 2
71.4 15 6 2 58.3 7 5 1
10 4 2 55.6 5 4 1
5 2 7 54.5 6 5 2
70.6 12 5 1 53.3 8 7 1
70.0 14 6 1 50.0 4 4 1
7 3 1 1 1 1
~
253
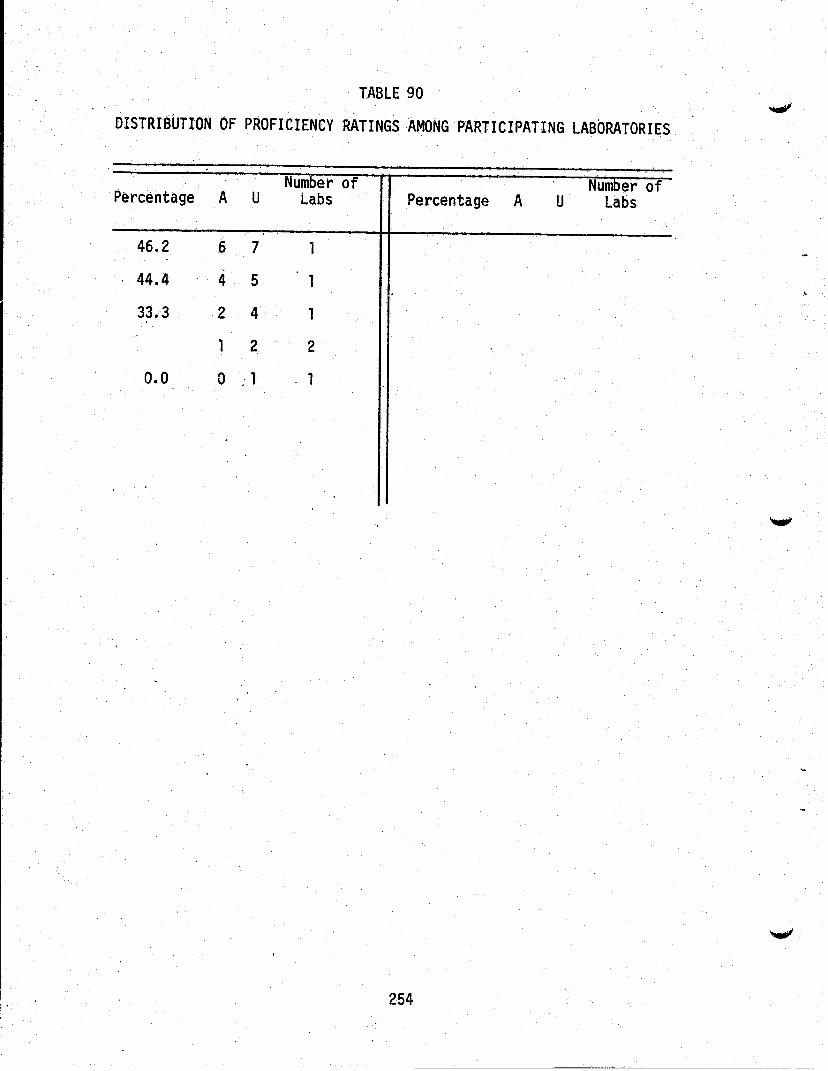
TABLE 90
DISTRIBUTION OF PROFICIENCY RATINGS AMONG PARTICIPATING LABORATORIES
Number of Nu er of Percentage A U Labs Percentage A U Labs
46.2 6 7 1
44.4 4 5 1
33.3 2 4 1
1 2 2
0.0 0 . 1 . 1
254

TABLE 91
PE~~~~~A~~S~~N~~~pe~~~~~ ~~~O~~~~~~~B~~XI~~S;~~~EO~A~~~~~~~ OF
Percentage of Number of Percentage of All Total Responses Laboratories Participating Cumulative Consi dered In This· Laboratories Frequency
!~ Acceptable* Percentage Range . Having This Rating In Percent
~
{ 100% 59 25.3 25.3 i . ,
95.0·-99.9% 2 0.9 26.2
90.0-94.9% 18 7.7 33.9
80.0-89.9% 74 31.8 65.7
70.0-79.9% 45 19.3 85.0
60.0-69.9% 22 9.4 94.4
'"-" 50.0-59.9% 7 3.0 97.4
Below 50% 6 2.6 100.0
TOTALS 233 100.0 N.A.
* Does not include Tests 18 and 21.
255

,:
GENERAL FINDINGS
). Voluntary, anonymous proficiency testing,is both feasible and necessary as indicated by the consistentlY high participation rates throughout the course of the project and the ability of such testing to identify areas in need of improvement.
2. The data collected from the participating criminalistics laboratories are not amenable to classical statistical formatting and presentation. However, other meaningful statistica1 formattings for the tabulation and presentation of what are considered to be unique data collection were possible.
3. There is a need for continuous proficiency testing programs at either the national, state or local levels to provide a means to monitor the progress of efforts to upgrade and maintain high quality criminalistics services.
4. There are still areas in which the proficiency testing program can expand:
a) Many evidence types have yet to be tested (e.g., toolmarks, explosives, imprint evidence, fracture, tear and splatter patterns);
b) Many of the evidence types that were selected for sample manufacturing were not fully exploited and ~ere often presented in their simplest or most unchallenging fonns (e.g.,the hair sample did 'not include h.uman hair, the fireanns sample included only bullets and cartridge cases);
c) The samples can become more realistic by incorporating contamihants and by minimizing sample size and qu.anti ty.
5. Laboratory anonymity and the confidentiality of the submitted data are key factors to insure a high participation rate in a voluntary program such as this one.
6. A wide range of proficiency levels among the partic,ipating laboratories exists, and in general, there are several evidence types with which the laboratories are having serious difficulties.
7. The need for a practical time table which does not tax the workload o~ the participating laboratories, the sample manufacturers and the program administrators has been implicitly demonstrated.
8. Many of the nation's crime laboratories lack one or more of the fundamental criminalistics services as evidenced by the variability of participation and reporting rates with respect to the various evidence samples.
257
9. There was no uniform procedure by which the crime laboratories processed the evidence samples. Personal contact with some of the laboratories confirmed that the handling of the samples were subject to the following variables:
a) The examiner ranged from being the most competent and experienced in the laboratory to the novice or trainees;
b) The methods for analyzing the samples ranged from the ~outine to a complete overkill;
c) The number of examine~s analyzing the sample ranged from one to an entire group;
d) The sample may have been processed either in-house or may have been sent out of the laboratory for analysis.
10. The data derived from this research project cannot be utilized to make evaluative or comparative judgements between individual crime laboratories with respect to their abilities to perform in the ~arious evidence categories. The results must be viewed within the parameter of the test design and only then in regard to general performance of all laboratories. .
11. The responses to the questions on the data sheets suggest that a lack of uniformity exists in examination and reporting procedures. For instance, a saliva sample might be reported as IInon-seminal," an animal hair' as II non-human,1I or a blood sample is characterized solely by its ABO grouping.
12. UnacceptablE~ laboratory proficienci.es most often could be attributed to one or more of the fo 11 ow;. ng problems.:
a) Misinterpretation of the test results by the examiner resulting from carelessness or lack of experience;
b) Failure to employ adequate methodology, or failure to employ appropriate methodology;
c) Mislabelled or contami.nated primary standards; .'
d) Inadequate data bases or standard spectra.
13. Laboratory responses toa survey show that most laboratories cannot afford to participate in a proficiency testing program on a subscription (fee) basis.
258

CHAPTER V
RECOMMENDATIONS
1. A nationwide program of continuous proficiency testing of cr'ime laboratories should be established and admini~tered by a peer group such as the one developed in this research program.
2. Future proficiency testing programs should contain provisions to render technical assistance to the laboratories which desire and request such help.
3 .. A series of LEAA funded remedial training workshops which are des'i gned to address the shortcpmi ngs in 1 aboratory performance i denti fi ed in the findings of this project should be immediately developed.
4 .. Future proficiency testing progrqms of this type (i.e., one with voluntary, anonymous participants) should develop a fail-safe means for anonymous mailings as well as record keeping.
5. The Law Enforcement Assistance Administration is urged to recognize and undertake the continued, financial responsibility for maintaining what has been a successful proficiency testing program.
6. It is recommended that LEAA respond to the following specific laboratory needs:
a) The compilation and publication of firearms class characteristics under a single cover;
b) The, funding, of research projects to develop more reliab,le antisera for the MN blood grouping' system, as well as other anti sera specifi ca lly used for forensic purposes; ,
c) The funding of research efforts to compile and disseminate information/guidelines on the use and interpretation of solubility' tests in,the examination of paint.
d) The funding of a project which will provide standard collections of hairs of various animals, much in the same manner as the automotive paint samples 'collected and distributed by the National Bureau of Standards.
7. There should be continuous LEAA support of certificati?n and accreditation programs within the field of criminalistics as eVldenced by the problems identified in this report. Such p~ograms ~ho~ld be . carefully conceived and administered by professlonals wlthln the fleld.
8. Law enforcement agencies at all levels of government should . recognize that the existing crime laboratory problems that were noted during the course of this research project may be linked to deficiencies in the budgets, physical and human resources of laboratories which have been ci,ted in previous studies and other reports and should allocate the ~uffici~nt resources to finally correct these deficiencies.
259

. ...,
CHAPTER VI
EPILuGUE
This final report has attempted to navigate the reader through a three-year long p,roject, one that \lias both ambitious in scope and productive in the final analysis. Many of the findings however, ar.e neither new nor unexpected to anyone who has kept abreast of the literature emanating from the assessments, evaluations, surveys and task force 'reports pertaining to the qyalitative aspects of forensic science, specifically, the crime laboratory. In realitY', the final report of the proficiency test.iog project has documented in greater and more concrete detail many of the observations and findings of these earlier works. .
Duri:lg the course of/'the proficiency testing program, it was quickly t'ecognized that many of the laboratories were experiencing difficulty in the examination and analysiS of various physical evi~ence types. To be perfectly candid, this could be expected. All of the previous reports wh(;ch have addressed the issue have inferred the likelihood of such a finding. An examination of the criminal justice literature published during the last fifteen years reveals an increasing awareness of the crime laboratory's role in the adjudication of crint'inal justice. Many believe that this new awarehe?s was sparked in pa¥'t by the advent of the Miranda and Escobedo deci s ions. .
We have learned the lesson of history, ancient and modern, that a system of criminal law enforcement whi ch comes to depend on the "confess i on" will, in the long ru~, be less reliable and more subject to 'abuse 'than a system which depends on extrin~ic evidence independently secured through skillful investigation. l .
This sentiment was reiterated by the President's Crime Commission in 1967 which stated:
More and more, the solution of major crime will' hinge upon the discovery at crime scenes and subsequent scientific laboratory analysiS of late~t fingerprints, nair, fibers, blood and similar traces.
1 Escobedo v. Illinois, 3i8 U.S. 478, 488 (1964).
2 President's Commission on Law Enforcement and Administration of 'Justice, Task Force Re o.rt: The Police (Washington, D.C.: U.S.
Government Printing ffice, 1967 ~ p~ 51.
261

Thus, the need for the crime 1aboratory was firmly es~abl;shed ~ during the 1960's which consequently initiated several research studies. on various aspects of the crime laboratory. The results of these studies were, in many ways, discouraging. As early as 1963, a study conducted by Brian Parker revealed that less than one percent of the total criminal violations at the local level received laboratory 'exal'!li natj on; n~methele~s, crime,1aboratories were so short handed that they were estimated to handle caseloads five times the size they should have been. 3 . , ' ,
Alfred Blumstein, in an article published in, 1967, remarked that II ••• most polic~ crime labs contain little more than a fingerprint klt , a camera, maybe a darkroom, and's{)metimes a compari son microscope. II The Law Enforcement Assistance Administration's predecessor, the Office of Law Enforcement Assistance, published a study in 1968 which disclosed that II ••• nearly every laboratory in the United States and Canada is overcrowded, understaffed, und~rpaid, underequi pped and overworked. 115 An L~AA funded project,by the;,~j,dwest Re$earch In~titue published in 1970 noted .the .pressing need f:qr II .. ~ .short courses, seminars and formal gcademic programs at the graduate leve1 .•• " in the criminalistics field.
The poor conditions which prevailed in the crime laboratories did attraQt the attention of the federal government. The creation of the LEAA'in 1968 provided the means forsome.federa1 aid to reach the laDoratories. Unfortunately, the late 1960's also witnessed an ..., overwhelming influx of street drugs which, by law, mandated ~cientific .' analyses if the alleged offender was to be held and prosecuted. Thus, the laboratories wercl forced to direct the majority of their resources to the development of their drug analysis capabilitieS which stunted the growth of their overall laboratoryc~pabilities. Currently, laboratories still devote a very substantial proportion ofthe'ir limited resourc;es to the examination and identification of controlled substances~ ,
It is acknowledged that crime laboratories have improved , noticeably during the past ten years. However, ~his has, nqt been sufficient 'to meet the incr'e~sing -responsibilities that they must
3 Brian Parker', "The Status of Forensic Sciencein the Administration of Criminal Justice," Rev. Jur. U.P.R., XXXII, No.2 (1963),414,417.
4'Alfred Blumstein, "Police 'Technology,1I Science and Technology, No. 72 (December, 1967), p. 42.
5 Alexander Joseph,' Crime Laboratories--Thr.ee Study Reports, LEAA Project Report (Washington, D.C.: U.S. Department of Justice, 1968), p. 84.
6 Walter R. Benson, John E. Stacy, Jr. and Michael L. Worley, Systems Analysis- of CriminaHsticsOperations, lEAA Grant NI-044 (Kansas City, Mo.: Midwest Research Institute. 1'970), p. 9.
262

fulfill. One of the most fundamental problems is inadequate budgetary support from the laboratorfes.' .parent agencies. The National Advisory Commission on Criminal Justice Standards and Goals Report of Police (1973) stated: "Too many police crime laboratories have been set up on budgets that preclude the recruitment of qualified, professional personne1." And further: ,"Too Dften the ?aboratory is not 'considered a primary budget item and is one of thf first units to suffer when budgets are trimmed. Such pr.~ctices relegate the crime laboratory to an inferior position among other support services. 1I 7 ,The National Advisory Commission also included a recommendation which now appears to be a forerunner of the prO,fidency testing concept: IIIt is recommended that a nati,onal program 'be established to insure that all
, tests andana'lyses perfonned by State, regional or local laboratory facilities are procedura11.y sound and scientifically vc.lid." 8
In short, the final report of the proficiency testing project has described the symptoms of old problems, problems which have been brought to our attention on numerous occasions in the past. Consequently, the crime laboratories are not demonstrating optimal proficiency because it is Circumstantially impossible for them to do so. The casual relationships between managerial and budgetary problems and the degree of laboratory proficiency are, needless to say, complex; .still, we can cite some more obvious ones. Can we not, for exampl~, deduce that a laboratory in financial straits is incapable of attracting and supporting superior scientific personnel? And would not the absence of such personnel negatively affect the proficiency of laboratory performance? Can we not deduce that a laboratory in need of additional manpower .would be forced to IImove cases through" as quickly as possible to c:ombat an increasing backlog, foregoing additional confirmatory analyses or double checks by a second criminalist? And would this not also negatively affect laboratory proficiency as a whole? There
, are a host of other considerations,among them, unsatisfied needs for on-going education and training, unsatisfied needs for advanced or superior instrumentation, unsatisfied needs for adequate laboratory facilities and unsatisfied needs for better.administrative decision and policy making, which all adversely affect laboratory proficiency in varying ·degrees. This report documents that crime ,laboratories have been and are still in nepd of help. '
7 National Advisory Commission on Criminal Justice Standards and Goals, Police; Standard 12-2 (Washington, D.C.: U.S. ,Government Printing Office, 1973), pp. 304~305.
8 Ibid, p. 316.
263

The proficiency testing program has been controversial in that many laboratory directors wondered whether the findings indicated by the research would constructively or destructively affect the laboratories.
,Again, it should be stated that the research findings, for the most part, could be pr'edicted. To deliberately document the shortcomings of the crime laboratory operations with hard data and t;l~n walk away from it would be completely destructive and senseless. However, based on previous experiences where needed aid has been refused, many of the directors'feared this. In the best interest of both the crime laboratory as well as equitable criminal justice, the proficiency testing program was supported,,in the end, by the laboratory directors with the optimistic hope that the results would compel a change for th~ better. Indeed, the findings of the profiCiency testing data should be the last straw in bringing whatever aid is necessary to the crime laboratories. The laboratories acknowledge that they are helpless without the support. of the federal, state and municipal governments,'and it is to them that the crime laboratories must turn for aid in taking remedial measures and securing adequate resources for improved laboratory operations.
, ,
Aside from greater resource allocations to the laboratories at the local level, the most pressing needs of the crime laboratories fall into the areas of certification of personnel, accreditation of crime laboratories, accreditation of forensic science degree programs, regional remedial workshops to upgrade the training of current laboratory personnel, research for improved techniques in the analysis ,of the various physical evidence ,types. 'The criminalistics community ~as already 'addressed many of these needs and developed several others lnto concept papers or grant .. proposals for federal support.
As a final note, the prof~ciency testing program has shown that laboratories can ~ extremely proficient. Many of the laboratories around the country displayed excellence in the examination and analysis of virtually.all the categories of physical evidence submitted by the project staff. This is, without a doubt, a great tribute to those laboratories; as well as to the~r supporting agencies and lotal
. g'overrirnents . .
264

APPENDIX A
ROSTER OF PARTICIPATING LABS*
*Note: Thi s roster is not intended to ser've as a, 'comprehens iva 1 is t of criminalistics facilities, but as a list of locations which were at some time included in this project. The appearance of any particular laboratory on this roster does not necessaril,y indicate participation in testing. .
During the course of this project, several of the facilities which appear on this ro~ter withdrew, others consolidated and yet others were closed.
265

D1 rector Alaska Crime Lab
. 7337 Old Seward Highway Anchorage, AK 99503
M. Dale Bloomer, Criminalist P.O. Box 866 Selma, AL 36701
James C. Britton, III Toxicologist P.O. Box 2411 . Tu~caloosa, AL 35401
James M. Buttram, .Ph;D., Director Alabama Dept. Toxicology and . Criminal Investigation P.O. Box·2646 Birmingham, AL 35202
John Case Criminalist P.O. Box 529 Jacksonville, AL 36265
John H. Kilbourn, TOkicologist P.O. Box 2234 . Florence, AL 35630
Lamar Miller, Criminalist P.O. Box 119 .
.Enterprise, AL 36330
Vanri V. Pruitt, Jr. Toxic.o·1ogist P.O. Box 128 Huntsville, AL 36804
Dr. C.J. Rehling, Director A1 abam~ Dept. Tox.i cology and Criminal Investigation Box 231 Auburn " AL 36830
Richard A. Ropert Toxicologist P.O. Box 565 Montgomery, AL 36101
James L. Small Courthouse Church & Royal Streets Mobile, AL 36602
266
Capt. James L. Neighbours . Criminal ~nvestigative Service Arkansas State Police P.O. Box 4005 Little Rock, Ar~ansas 72203
W.J~ Collier, Director Crime Detection Lab. .620 W. Wa~hi ngton Phoenix, AZ 85003
Carl R. Kempe, Director City County Crime Lab P.O. Box 1071 270 South State Avenue Tucson, AZ 85702
David Kutob, Ph.D. Crime Lab 2010 West Encanto Blvd. Phoenix, AZ 85009
Lt. Wayne Bailey San Diego Co. Sheriff's Ofc. Crime Lab 3520 Kurtz Street San Diego, CA 92110
All en J •. Boudreau Fresno County Sheriff's Ofc. 2200 Fresno Street Fresno, CA 93721·
James W. Brackett, Jr.) Dir. Lab. of Criminalistics Office of the D.A~ . 1557 Berger Drive' San Jose, CA 95112
G. L. Budd Orange Police Dept. Crime Lab 300 E. Chapman Orange, CA 92669
W. Jack Cadman Orange Co. Sheriff's Dept. Division of Criminalistics 550 N. Flower Street Santa Ana, CA 92702
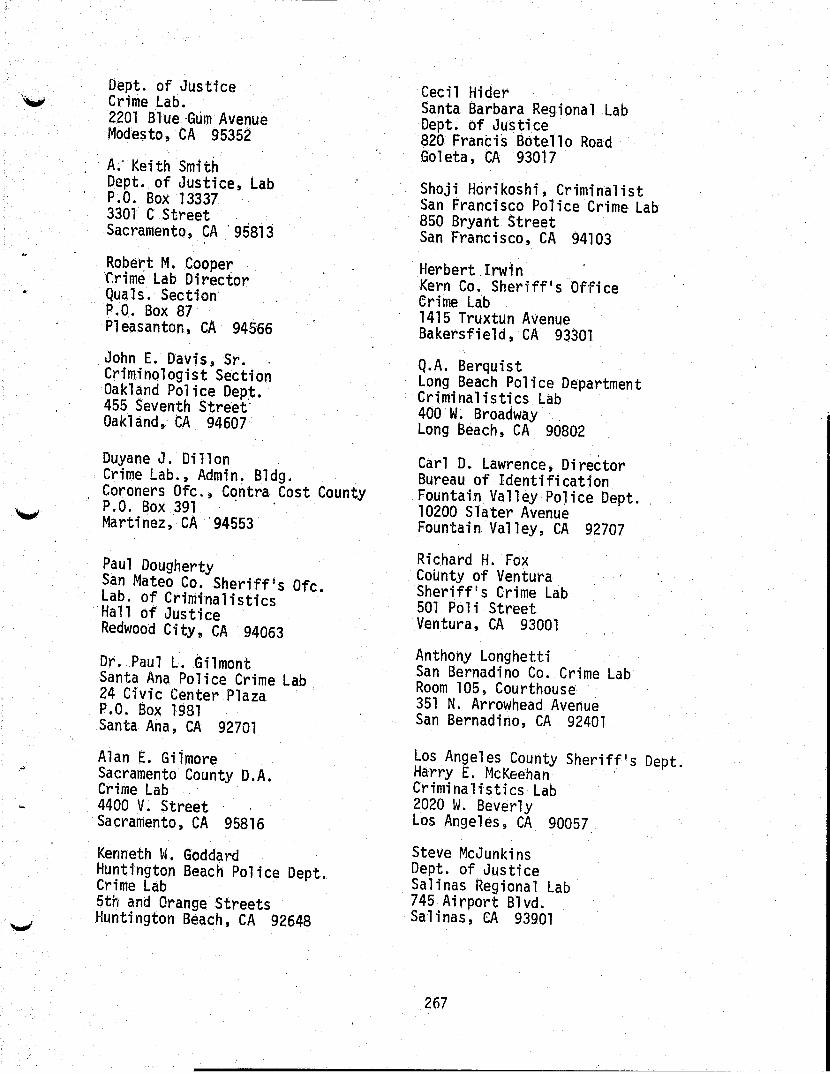
Dept. of Justice Crime Lab. 2201 B1 ue 'Gum ,Avenue Modesto, CA 95352
A; Keith Smith Dept. of Justice, Lab P.O. Box 13337 3301 C Street Sacramento, CA '95813
Robe~t M. Cooper Crime Lab Director Quals. Section P.O. Box 87 P1easantoh, cA 94566
John E. Davis, Sr. Criminologist Section Oakland Police Dep~. 455 Seventh Street' Oakland, CA 94607
Duyane J. Dillon Crime Lab., Admin. Bldg. . Coroners Of c., Contra Cost County P.O. Box 391 ' , Martinez, CA '94553
Paul Dougherty . San Mateo Co. Sheriff's Ofc. Lab. of Criminalistics
'Hall of Justice Redwood City, CA 94063
Dr. Paul L. Gilmont Santa Ana Police Crime Lab 24 Civic Center Plaza P.O. Box 1981 Santa Ana, CA 92701
Alan E. Giimore Sacramento County D.A. Crime Lab 4400 V. Street Sacramento, CA 95816
Kenneth W. Goddard Huntington Beach Police Dept. Crime Lab 5th and Orange Streets Huntington Beach, CA 92648
Cecil Hider Santa Barbara Regional Lab Dept. of Justice 820 Francis Botello Road Goleta, CA 93017
Shoji Hcirikoshi, Criminalist San Francisco Police Crime Lab 850 Bryant Street San Francisco, CA 94103
Herbert .Irwin Kern Co. Sheriff's Office erime Lab 1415 Truxtun Avenue Bakersfield, CA 93301
Q.A. Berquist Long Beach Police Department Criminalistics Lab 400 W. Broadway Long Beach, CA 90802
Carl D. Lawrence, Director Bureau of Identification Fountain Valley PoJice Dept. 10200 Slater Avenue Fountain Valley, CA 92707
Richard H. Fox County of Ventura Sheriff's Crime Lab 501 Poli Street Ventura, CA 93001
Anthony Longhetti San Bernadino Co. Crime Lab Room 105, Courthouse 351 N. Arrowhead Avenue San Bernadino, CA 92401
Los Angeles County Sheriff's Dept. Harry E. rkKeehan Criminalistics Lab 2020 W. Beverly Los Angeles, CA 90057
Steve McJunkins Dept. of Justice Salinas Regional Lab 745 Airport Blvd.
. Salinas, CA 93901
267
Lindberg B. Miller lnst. of Forensic Science l~4b.Webster btpea~ . Oakland, CA 94609'
Lt. Col. Maurice D. Milton USACIL Pacific APO San Francisco CA 96343
Alfred J. MOses West Covina Satellite L~b Dept. of Justice 609'S. Sunset Avenue West Covina, CA 91790
D.r. Thomas T. Noguchi Ofc. of the Medical Examiner Co~nty of Los Angeles 1104 N.Mission Road Los Angeles, CA 90023
Robert Ogle Santa Rosa Regional Lab 7505 Sonoma Highway !
Santa Rosa, CA' 95405
Joseph M. Orantes Senior Criminalist San Diego Police, Crime Lab 801 West ~1arket Street San Diego, CA 92101 ,
Oroville Satellite Lab, 33 County Center Drive Oroville, CA 95965
Sandra A. Rakestraw San Luis Obispo Satellite Lab Dept. of Justice P.O. Box 1484, Kansas Ave San Luis Obispo, CA 93401'
William C. Smith. Criminalist California Dept. of Justice Criminalistic Lab Ca1i.forhia State University Fresno, CA 93701
John Thornton Dept. Biomed. & Envir. He'alth Science iGA~@~ ~f ~ijMlip Hp~lt~ Univ. of California Betke 1 ey, CA 94720,
Basil Travnikoff, Jr. Stockton Satellite Lab Dept. of Justice 130 S. Center Street Stockton, CA 95202
Glenn R. Vaniman Redding Regional Lab Calif. Dept. of Justice 1515 N. Old Oregon Trail Redding, CA 90016
San Rafael Satellite Lab Richard Waller Dept. of Justice . Hall of Justice, Civic Center San Rafael, CA 94903
Michael White, Criminalist California Dept. of Justice Criminalistics Lab 1500 Castellano Road Riverside, CA95209
Dewayne A. ~Iolfer Los Angeles Police Dept. Criminalistics Lab 150 N. Los Angeles Street Los Angeles, CA 90012
Cordell G. Brown ColoraoJ Bureau of Investigation 2002 S. Colorado Blvd. Denver, CO 80222
Nelson K. Jennett CBI Agent City Hall Office Montrose, CO 81401
268
~"

Robert E. Nicoletti, Director Denver Police Dept. Crime and Forensic Lab. 13th and Champa Street Denver, CO 80901 Jerome S. DrugQnis Conn. State Police Forensic Lab p.O. Box A-b~ Atnity Station Newhaven, CT 06525
Dr. Joel Mi1zoff Toxicolog.ist . Connecticut State Dept. Health 10 Clinton Street Hartford, CT 06106 .:'
Jay 'Cochran, Jr. Assistant Director FBI Lab 9th St. & Penn. Avenue, NW Washington, D.C. 20535
Dr. Frank J. Kreysa Chief, Scientific Servo Div. Rm. 7575 - IRS Building Washington, D.C.' 20226
Dr. Robert Zoller Identification & Records Metropolitan Police Dept. Washington, D.C. 20001
Ali Z. Hameli, M.D. Chief Medlca1 Examiner Delaware Forensic Science Lab 200 South Adams Street Wilmington, DE 19801
Edward G. Bigler Crime Laboratory Bureau Dept. of Criminal Law Enforcement P.O. 'Box 1489 Tallahassee, FL 32302
Robert D. Blackledge Indian River Reg. Crime Lab Indian River Comm. College 3209 Virginia Avenue Fort Pierce, FL 33450
John T. Pennie Broward County Crime Lab Broward County Sheriff's Dept~ Box 9507 Ft. Lauderdale, FL 33310
269
Mrs. Martha C. Gray Pinellas Co. Forensic Lab Sheriff's Adm. Bldg.
. .250 W. Ulmerton Largo, FL 33540
D. H. Heideman, Director . Sanford Crime Lab Building 139 Sanford Airport P.O.' BoX 1737 Sanford, FL 32771
Norman T. Lee Monroe Co .. Sheriff's Dept .. Crime Lab Stock Island, P.o. Box 1269 Key West, FL 33040
Jay Pintacuda Crime Lab . 1134 Palm Beach IntI. Airport ~tJildJ.ng "F" West Palm' Beach, FL 33406
William H. Ragsdale Region IV Crime L~b. Bldg. 139 Sanford Airport P.O. Box .1737 Sanford, FL 32771
Fred Smith Crime Lab 42 S. Alcaniz Street Pensacola, FL 32501
Dr. Clark Davison, Chemist Lee County Sheriff's Dept. Second Street, P.O. Box-132 Ft. r4yers, FL 33901
Edward Whittaker, Supervisor Crime L~b., Central Svc. Div. Dade County Public Safety Dept. 1320 NW 14th Street Miami, FL 33125
Mr. Brian Bouts State Crime Laboratory Columbus .Branch P.O. Box 8 Midland, GA 31820

Lt. Col. Robert J. Campbell USACIL CONUS Ft. Gordon, GA 30905
Dr. Larry B. Howard . . Georgia Dept. Public Safety Crime Lab 959 E. Confederate Avenue, SE Atlanta, GA 30312
Norman A •. Wade Savannah Branch Lab P.O. Box' 523 . Savannah, GA 31402
Edward S. H. Tom Honolulu Police Dept. Crime Laboratory 1455 S. Beretania Street Honolulu, HI 96814 .
Michael L. Rehberg Iowa Crimina ti sties Lab Bureau of Criminal Investigation E. 7th & Court, 2N~FL. Des MOines, IA 50319
Robert M. Dews Chief, Forensic Lab Idaho Dept. of Env~ & Com. Svc. 212b Warm Springs Avenue Boise, ID 83702
James H. Wiggs, Criminalist P.O. Box I Pocatello, 10 83201
Joseph Bubonic Illinois Bureau of Identification Dept. of Law Enforcement 229 1/2 ~ourt Stre~t Pekin, IL 51443
James Cerven Dept. of Law Enforcement Bureau of Identification 515 E. Woodruff Road Joliet, IL 60432
Francis Flanagan Crimina1istics Div. Chicago Police Dept. 1121 S. State Street Chicago, IL 60605
James A. Flynn, Director Bureau of Identification Dept~ of Law Enforcement 10338 Lincoln Trail Fai'rview Heights, IL 622Q8
Thomas Hughes . Illinois Bureau of Identification Rockford Satellite Lab 2620 11th Street Rockford, IL 61191
James Kreiser Illinois State Bureau of. Identification Dept. of Law Enforcement 2168 S. 9th Street Springfield, IL 62703
Daniel Lecocq, Supv. Crim1st. ~ Bureau of Identification Highway 51 P.O. Box 437 Desoto, IL 62924
Andrew H. Principe Northern Illinois Crime Lab 1677 Old Deerfield Road Highland Park, IL 60035
Karsten Rilying Dept. of Law·Enforcement Bureau of Identification· 333 15th ·Street Rock Island, IL .61201
Cha rl es Turcottl~ DuPage County Crime Lab 208 Reber Street, P.O. Box 300 Whe~ton, IL 60187
Bruce Vander Kolk Supervising Criminalist Illinois Bureau of Identification 1401 Maybrook Dri ve ... .J Maywood,· I L 60·153
270

Dr. Michael Caplis NW Indiana Criminal Tox. Lab. c/o St. Mary Mercy Hospital '540 Tyler Street . Gary, Indiana 46402
H. F. Davis Ft. Wayne Police Dept. 1 Main Street Fort Wayne, 'IN 46802
Lt. Kenneth Houck Indiana State Police L~b. 100 North Senate Avenue Room 102 . Indiariipolis, IN 46204
Dr. Carl R. Phillips Grime Laboratory Indianapolis Police Dept. 50 N. Alabama St., Rm. E-3Q8 Indianapplis, IN 46204
Daniel ·Radcliffe City County Building Evansville·Police Dept. 17 NW Seventh Street S. Evansville, IN 47708
Joseph Zabik Bloomington Forensic Tech. Ctr. P.O. Box 100, Municipal Bldg. 220 East Third Street Bloomington, IN 61701
Rozetta R. Hallcock Assistant Director Johnson County Crim. Lab. 6000 Lamar Avenue Shawnee Mission, KS 66202
Lt. Jordan D. Jones Police Dept. Forensic Lab. P.O. Box 670 Wichita, KS 67201
271
Ronald L. Jones Kansas Bureau of Investigation Lab. Division 3420 Van Buren Topeka, KS 66611
Sedgwick Co. Sheriff's Dept. Forensic Lab 525 N. Main Street Wichita, KS 67203
T. A. Easterling Lab Unit Kentucky State Police 1250 Louisville Road Frankfort, KY 40601
Paul L. Cobb, Jr. . Division of State Police Crime Lab P.O. Box 1791 Baton Rouge, LA 70821
Donald Starkovich S.W. Louisiana Crim. Lab. 1032 Ryan Street Lake Charles, LA 70601
Ray Herd Northwest Louisiana Crime 'Lab. 1115 Btooks Shreveport, LA 71101
Major John J. Koch New Orleans Police Dept. Crime Lab. 715 S. Broad Street New Orleans, LA 70119
Travis E. Owen Acadiana Criminalistics Lab. P.O. Box'643 New Iberia, LA 70560
Herman Lee Parrish S.E. Louisiana Crim. Lab. 3022 Deribigny Street Metarie, LA 70001
David Brody Boston Police Dept. Crime Laboratory 7 I~arren Avenue Boston, MA 02116
John McHugh , MA State Pplice Chem. Lab. 1010 Commonwealth Avenue, Boston, MA 02215
Det. Sgt. Rocco J. Gabriele Crime Lab Maryland State Police HQ. Pikesville; MD 21204
R i chard Gervason i, Sr'. Chemist Montgomery County Police Crime Lab P.O. Box 208 Rockville, MD 20850
, Thomas M. Muller Baltimore City Police Dept. Lab. Division 601 East Fayette Street Baltimore, MD 21202
Clarence E. Polk Ocean City Police Lab. Ocean City Police Dept. 107 Dorchester Avenue Ocean C'i ty, MD 218l~2
Lt. Phillip J. Scarborou~h BaltimQre County Po'lice Dept. Crime Lab. . 400 Keni h~orth Dri ve Towson, MD 21204
Rob~rt ~ricson, Chief Chemist Public Health Lab Dept. of Humqn Services State 'House P.O. Augusta, ME 04330
Lt. Kenneth Shaw Director Maine State Police Crime Lab 36 Hospital Street Augusta, ME 04330
Lt. Phillip Arreola Detroit Police Dept. Scientific Division 1300 Beaubien Street De~roit, ru 48226
Capt. Kenard K. Christensen Scientific' Lab.
, Michi~an :Oep.t~ of State Police 714 So. Har~ison Road East Lansing, MI 48823
John Devries Holland Regional Crime Lab 304 Garden ,Street, Box 115C Holland, MI 49423
Lt. Lewis M. Doule, Jr., CMDR. Oakland County Sheriff's Dept. 1200 North Telegraph Road Pontiac, MI 48480
John Guyer Grand Rapids Police Dept. Lab. 333 Monroe ,Avenue, NW Grand Rapids, MI 49502
John A. Juhala; Ph.D. Bridgeport Regional Crime Lab 6296 Dixie Hwy., Box r~ Bridgeport, MI 48722
nr. Edgar W. Kivela Div. of Crime Detection Bureau of Lab. 3500 N. Logan Street Lansing, MI 48914
Thomas J. Nasser Michigan State Police 1024 S. Mill Street Plymouth, MI 48170
Nicholas A. Pamphillis Genessee County Crime Lab. 1007 Beach Street Flint, MI 48503
Sgt. Robert J. Ruddy Crawford County Sheriff's Dept. Courthouse Grayling, MI 49739
272

F. M. Saad, Ph.D. Div. of Crime Detection Michigan Dept. of Public Health 30950 Van Dyke Street Warren, MI 48089
Lt. Eugene Weiler Michigan State Police Scientific Lab. ' 42145 W. Seven Mile Road Northville~ MI 48167
Lt. Gerald A. Hanggi, Sr. Crime Lab., Dept. of Police 101 E. 10th Street. St. P~u1, MN 55101
James O. Rhoads· Bureau of Criminal Apprehension 1246 University Avenue St. Paul; MN 55104
Lt. William Armstrong St. Louis Metrol. Police Lab. 1200 Clark Street St. Louis, MO 63103
Robert C. Briner, Director LEAC Crime Lab. S.E. Missouri State Univ.ersity Cape Girardeau, MO 63701
Donald Brocksmith St. Louis County. Police Lab 7900 Forsythe Street Clayton, MO 63105
Gary R .. Howell, Dir. Regional Criminalistics Lab. 2100, N. Noland Road Independence, MO 64051
Dona 1 d E. Smi th Regional Crime Lab 321 E .. Chestnut Exp. Springfield, MO 65802
273
Chief Gerald Stone Marshall Police Dept. Lab.
. 171 West Morgan Marshall, MO 65340
Afton L. Ware, Asst. Dir. Missouri State Highway Patrol Technical Lab. 1510 East Elm Street Jefferson City, MO 65101
Phillip R. Whittle Regional Crime Lab. Police Academy Building Missouri Southern State College Joplin~ MO 64801
Dr. Arthur S. Hume, Director Mississippi Crime Lab P.O. Box 6097 Jackson, MS 39208
William E. Patterson Jackson Police Lab. 327 E. Pascagoula Street J~ckson, Ms 39201
Arnold Melnikoff Criminal Investigation Lab. Wilma Building; Suite 115 Missoula, MT 59801
Ray H. Garland N.C. Bur. of Invest. Che~. Lab 421 North Blount Street Raleigh, NC 27601
L. F. Lance Criminal Lab. High Point Police Dept. High Point, NC 27261

Vincent E. Severs Charlotte Police Dept. Crime Lab. 825 East Fourth Street 'Char1otte, NC 28202
Aaron Rash, Supervisor Drug Div. State ,Crime Lab., Dept. 7th & Main Streets . Bismark, NO 58561
John W. Friend Omaha Police Dept. Criminalistics Lab. 505 South 15th Street Omaha, NE 68102
Harold W. Moon ' Nebraska State Patrol Crim. Lab P.O. Box 94637 Lincoln, NE 68509
Ro~er Beaudoin Crlme Lab, Div. of St. John O. Morton Bldg. Concord, NH 03301'
Joseph Barry, Lieutenant North Regional Lab Division of State Police Little Falls, NJ' 07424
Dr. Jew-Ming Chao Burl i ngton County Forens i c Lab Wooklake Road Mount Holly, NJ 08060
Mrs. Dorothy Gordimer Union Co. Narcotic Strike Force Lab
300 N. Avenue East Westfi eld, NJ '01090
Maris J. Jaunakais, Chemist Gape May County Prosecutors Office ' Court House Cape May, NJ 98210
214
Vincent Peterson, Det. Sgt. Forensic Science Bureau Div. of State Police ~ Dept. of Law and Public Safety West Trenton, NJ 08625
Sgt. John Sazdowsky Crim. Invest. Unit Ocean County Sheriff's Dept. 110 Hooper Avenue Toms River, NJ 08753
William Seligman, Director Newark Police Lab 1008 18th Avenue Newark, NJ 07106
Lt. Ralph White South Regional Lab. Div. of State Police Box 126 ' Hammonton, NJ . 08037
Donald W. Hannah New Mexico State Police Crime Lab. Division P.O. Box 1628 Santa Fe, NM 87501 ~
Lt. Thomas R. Hubeny . Criminalist,Unit 401 Marquette~ NW Albuquerque, NM 87102
John F. X. Degan, Captain Crimina1istics Bureau, Tech. Servo Las Vegas Metro. Police Dept. . 400 E. Stewart Las Vegas, NV 89101
Vincent Vitale Lab of Criminalistics P.O. Box 2915 170 South Si erra Street' Reno, NV 80505
Lloyd A. Whalen, Director State Narcotics Lab 790 Sutro Street Reno, NV 80502
... !
i I
i I
,

..
V·incent Crispino Westchester Co. Med. Examiner Lab. Valhalla, NY 10595
Dr. Angelo M. Fatta Buffalo'Police Crime Lab. 74 Franklin Street
. Buffalo,· NY 1420l Warren Darby Syracuse Police Dept. 511 S. State St., Rm. 305 Syracuse, NY 13202
Capt. Stark Ferriss NevI York State Pol ice
. Scientific Lab. . . State Campus - Bldg. 22 Albany, NY 12226
Wilbur G. Kirch~essner, Director. Monroe Co. Pub 1 i'c Safety Lab. Public Safety Building, Rm. 524 Rochester, NY . 14614·
. Lt. Col. David Nydam, Commander USACIL Europe APO New York ,NY 09757
Patrolman Peter Pi zzol i Yonkers Po1ice Dept. Lab. 87 Nepperhan Avenue Yonkers, NY 10701
Charles V. Rorke New York Police Dept: Crime Laboratory 235 E. 20th Street New York, NY 10003
Henry Siegel, M.D. Forensic Science Lab Dept. of Labs and Research Grasslands Reservation Valhalla, NY 10595.
275
Lt. Vincent Sullivan Suffolk County Police Dept. Pol ice Laboi'atory Veterans Highway Hauppa!Jge, NY 17787
Inspector William H. Syrett, Jr. Scientific Invest. Bureau Nassau County Police Dept. 1490 Franklin Avenue Mineola, NY 11501
Dr. Charles:Umburger Forens i c Lab Dutchess Co. Sheriff's Ofc. 150 N. Hami~ton Street Poughkeepsie, NY 12602
.~r61d M. Alfultis, Director f1ulti-County Community College 1005 North Abbe Road Elyria, OH 44035
Snt.John F. Andes Cleveland Police Dept. Lab 2001 Payne Avenue, Rm. 301 Cleveland, Ohio 44114
Kenneth M. Betz f'1iami Valley Reg. Crime Lab. 335. West Third Street Dayton, OH 45402
Robert L. Ely Ohio State Highway Crime Lab. '660 East Main Street Columbus, OH 43205
Frank Feeny ATF Lab. Rm. 29 Cincinnati, OH 45202
Dr. Samuel R.Gei"ber, Director Lab, Cuyahoga Co. Coroner 2121 Adelbert Road Cleveland, Ohio 44106

Det. Richard Kent Chester T. ~olice Anal. Lab. 8400 Mayfield Road, Chesterland, OH 44026
John Klosterman, Director Eastern Ohio Forensic Lab Young~town State University Youngstown, Ohio 44555
Fred C. Martin, Director Canton-State Co. Crime Lab. Canton Police Dept. 2'21 Third Street, SW Canton, Ohio 44702
Walter Mills' Director~ ~ocking Tech. College Regional Crime -Lab'., Route 1 Nelsonville, OH 45764
Richard O. Pfau, Supervi;.or City of Columbus, Div. Police P.O; Box 15458 Civic CenterStatinn Columbus, OH 43215
Russell Tye, Lab Dit'ector Hamilton Co. Institute 3159 Eden Avenue Cincinnati, Ohio 45219
Sgt. Donald Victor, Asst. Dir. Mansfield-Richland Crime Lab 27 W 2nd Street Mansfield,. OH 44902
Capt. Lucien t~aitE!rs City of Springfield Division of Police 120 South Center Street Springfie'd:p OH 45502
276
'Sgt. Richard B. Zielinski Crime Lab Toledo Police Dept. 525 N. Erie Street
, Toledo, OH 43624
Gerald Belyeu Oklahoma State Bureau of Invest. P.O. Box 602 McAlester, OK 74501
William J. Caveny Oklahoma Bureau of Invest. Regional Office 1303 Gore Blvd., Suite 4 Lawton, OK 73501
John McAuliff Oklahoma State Bureau of Invest. Forensic Lab. Division P.O. Box 11497, Cimmarron Station Oklahoma City, OI~ 73111
Dennis Reimber Oklahoma State Bu. of Investigation P.O. Box 761 Tahl equah 'J OK 7'446.4
Maryann Vaughan Fdrensic Chemist, Lab Tulsa Polic:e Dept. 600 Civic Center Tulsa, OK 74103
Robert C. Williams Ada Police Dept. City Hall 13th & Townsend Ada, OK 74820
~ I
I
Roger Dingeman, Lab Director Oregon State Police Crime Lab 222·SW Plne Street Portland, OR 97204
Sgt. Robin Hunter tugene Police Department 777 Pearl Street . Eugene, Oregon 97401
Capt Larry .Laws l.ane Co. Sheriff's Office Lane County Courthouse Eugene, OR 97401
Lt. Reginald B. Madsen Oregon State Police Crime Detection Lab 364 1/2 W7th Street Eugene, OR 97401
Lt. Robert W. Pinnick Oregon State Police Crime Detection Lab .. 3181SW Sam Jackson Park Road Portland, Oregon 972vl
Trooper John Spilker Crime Detection Lab. Blue Mountain Community College Umatilla Hall, Box 1519 Pendelton, OR 97801
Trpr. Ronald Tobias Oregon State Police Crime. Detection Lab P.O. Box 1648 . Medford, OR 97501
Capt. A. E. Halltwerker, Co. Lab Division
. Police Admin. Building Franklin Square Philadelphia, PA 19106
277
Michael A. Horvath Penn. State Police Crime Lab. P.O. Box 2005 Bethlehem, PA 18001
Chemist: Mr. Walter Hrynkiw Pennsylvania State Police Crime Lab 475 Wyoming Avenue Wyoming, PA '18644
Dennis Hahn, Acting Director Pitts & Anegheny County Crime Lab 311 Ross Street, 7th Floor Pittsburgh~ PA 15219
Lt. James Sagans Pennsylvania State Police Crime Lab 21st and Herr Streets Harrisburg, PA 17120
Eugene Schultz Bucks Co. Crime Lab District Attorney's Office 2659 Trenton Road Levittown,.PA 17120
Director, Toxicology Lab. Dept. of Corrections Commonwealth of Puerto Rico San Juan, PR 00901
Lt. Egbert D. Hawes R.I. St. Police Lab. P.O. Box 1805 North Scitu'ate, R.I. 02857
Lt. James K. Wilson S.C. Law Enforcement Division Crime Lab P.O. Box 1166 Columbia, SC 29210

Charles J. Hi11 Identification Officer Crime Lab., Atny. Gen.Ofc. Div. of Criminal Investigation Pierre, SO 57501
William H. Anderson, Asst. Dlrector Div. of Toxicology. 'Middle Tenn~ Chest Disease Hospital Nashville, TN 37216
William J. Darby, III, Director Tenn. Dept. of Safety Crime Lab 3021 Lebanon Road P.O. Box 2305 Donelson, TN 37214
Dr. David T. Stafford~ Director Memphis Toxicology Lab. 3 North Dijnlap 11emphi s, TN 38102
J.D. Chastain Texas Dept. of Public Safety Crime Lab. Box 4143 Austin, TX 78765
Pat Donley Texas Dept. of Public Safety Crime Lab. Box 420 Lubbock, TX ·79408 Captain Harold Fiske Police Lab. P.O. Box 9346 214 W. Avenlie San Antonio, TX 78285
Calude Latta Texas Dept. of Public Safety Crime Lab. Box 4428 .Tyl er, TX 75701
David Legg Texas Dept. Public Safety Crime Lab Box 4367 Midland, TX 79701
270
Floyd E. McDonald, Director Houston Police Lab 61· Riesner Street, Rm~ 430 Houston, TX 77002
Charles F. Mott Texas Dept. Public Safety Crime Lab Box 4514 . Waco, TX 76705
John R. Rudd Texas Dept. of Public Safety Crime Lab Box 27022 El Pa~o, TX 79926
Frank D. Schiller Criminalistics Lab Fort Worth Police Dept. 1000 Throckmorton Street Fort Worth, TX 76102
Dr. Irving C. Stone Dallas Co. Crim. Invest. Lab. P. O.Box 35728 ""'" 5230 Medical Center Drive Dallas, TX 75235 Don C. Taylor Texas Dept. of Public Safety Crime Lab. Box 56· McAllen, TX 78501
Bobby W. Urbanovsky Texas Dept., of P~blic Safety Crime Lab. 10110 Northwest Freeway Houston, TX 77092
Manuel Valadez, Jr. ' Texas Dept. Publ,;c Safety Crime Lab. 350 IH 30 Garland, TX 75041
James l4a 11 er Texas Dept. of Public Safety Crime Lab Box 5277 Corpus Christi, TX 78405
i l"1li1
I i ~
I ,II ,
-
.,..
.t
Melvin Gortattorwski Chief, Chemical Section Utah State Lab 44 M~dical Drive Salt Lake City, UT 84113
Cha'rles L. Killion Regional Director
. . Bureau of Forensi c Sci ence P.O. Box 486 Merrifield, VA 22116
Charle's E. O'Rear, Dept. Dir. Bureau of Forensic Sciences Div. of Consolidated Lab Services 1 North 14th Street Richmond, VA 23219 Charles E. O'Rear, Dept. Dir. Bureau of Forensic Sc'iences Div. of Consolidated Lab Services 401A Callery Avenue Norfolk, VA 23507
Ch~r1es E. O'Rear, Dept. Dir. Div. of Consolidated Lab. 920 S. Jefferson Street, Room 219 Roanoke, VA 24106
John Richards Police Science Lab Dept. of Public Safety P. O. Box 210 St. Thomas·, VI 00801
Lt. Ronald J. Woodard Vermont State Police Crime Lab. Dept. of Public Safety P.O. Box 827 Montpelier, VT 05602
John Anderson Eastern Washington Regional Crime Li Public Safety Building, Rm. 100 Srokane, Washington 98201
279
. George Ish; i Western Washihgton state Crime Lab Public Safety Building Seattle, WA 98104 Robert Sullivan Drug Control Asst. Unit Pub 1 i c Safety Bldg . Seattle, WA 98104 K. M. S\~eeney King Co. Crime Laboratory King Co. Cdurthouse Seattle, WA 98104
Daniel J. Dowd Crime Lab Bureau' 4706 University Avenue Madison, I~I5371)2
Director Glendale Crime Laboratory, Inc. 5909 North t1ilwaukee River Pky. Milwaukee, WI . 53209
John linssen,'Director Wisconsin Regional Crime Lab 15725 W. Ryerson Avenue New Berlin, ~JI 53151 Dr. Henry .J. Wisniewski Milwaukee Health Dept. Bu. of Labs. 841 North Broadway Milwaukee, WI 53202
Richard Dixon Wyoming State Crime Lab. New State Off. Bldg. Cheyenne, WY 82001
Lt. O. Scott Neeley West Virginia State Police 725 Jefferson Road S. Charleston, WY 25303
Douglas M. Lucas, Director Centredf Forensic Sciences 25 Grosvenor Street Toronto~ ONT M7A 2G8 Canada
Bernard Peclet Institut de Medicine Legale Et de Police Scientifique 1701 Rue Parthenais Montreal 133, Canada
Frank Ishizak~, Director Crime Lab Department of Public Safety Government of Guam P.O. Box 425 Agana, Guam 96910

APPENDIX B
LABORATORY LOCATIONS
•
•
,
V
281
------------.---------- -

N ex> w
(
•
~ -~
D ~ "" (1) :<\> \)
•
( 3) •
• (2)
•
(
(1 ) •
• (l)
(2) •
(4) •
I (6) •
, . • (14) • •
•
• •
• •
• ~
• •
(.
(\ (' 'NH: (1) ~ VT: (l)
MA: (1) CT: (2)
):0
.-- NJ: (8)::g • ITT
:z DE: (1) 8
_, MD: (5) ><
Virgin Islands: (1)
Guam: (1)
Canada: (2)
OJ
':='1

..
,.
SELECTED BIBLIOGRAPHY
B.lack, W. A. et al. "A regional quality control program in microbiology. 1. Administrative Aspects.". Aml:!rican Journal of Clinical Path-ology. Vol. 66, no. 2, pp. 401-6, August 1976. .
"II. Advantages of simulated clinical specimens." ---~A~m-e~ri~c-an Jciurnal of Clinical Pathology, Vol. 66, no. 2, pp. 407-15,
August 1976.
Burke; .J.A. et al. "Quality.awareness in the Food and Drug Administration's Pesticide Residue Analytical Laboratories." Environmental Quality and Safety. (Supp1.) Vol. 3, pp. 25-31, 1975 .
Cali, P. J. "An idea whose time has come." Clinical Chemistry. Vol. 19, p. 291 (1973). '.
Eilers, R. J. "Total quality control for the medical laboratory." American Journal of Clinical Pathology, Part II, Vol. 54, no. 3, September 1970.
Finkel, P. W.; Miller, T. R. A Proficiency Test Assessment of Clinical Laboratory Capability in The United States. National Bureau of Standards, NBSIR 73-163, May 1973.
Fullerton; D. 5.; Kurzman, M. G. "'The identification and misidentification of mari j uana." Contemporary Drug Problems. 291-344 (Fall 1974).
Grannis, G. F.; Griimer, H. D.; Lott, J. A.; Edison, J. A. and McCabe, W. C. "Proficiency evaluation of clinical chemistry laboratories." Clinical Chemistry. Vol 18, no. 3, March 1972. .
Green, A. E. et. al. "Regional quality control." Journal of Clinical Pathology. Vol. 29, no. 8, pp. 724-6, August 1976.
In Pursuit of Excellence. The College of American Pathologists, Chicago, Illinois.
Inhorn, ~tanley L. "Quality assurance practices in health laboratories. II Laboratory Management, April 1975.
Jacobsen, A. "How good are our medical labs?" Potomac ~agazine, (The Washington Post). February 1974.
Martinek, R. G.; Becktel, J. M.; Forster, G. F.; Morrissey., R. A. "Comparison of methods for conducting laboratory proficiency surveys." Health Laboratory Science, Vol. 5, no. 4, October 1968.
National Bureau of Standards. Collaborative Calibration Check Programs. U.S. Oep'artment of COl11TJerce, Washington, D.C.
285

Nicols., J. D. "Assurance ofquali:ty i.n crimtnalistics and forensic science. 1I
. Legal Medicine Annual, 1973. Appleton-Century-Crofts Publisher, New York City. .
Oweh, G. W. Quality Control HomeOffi.ce Central Research Establish-ment. England. July 1972. .
Prier, J.E.; Sidman, L.; Yankevi.tGh, I.J. IIClinical laboratory proficiency testing. II Health LaboratorY'Sci'ence, Vol. 5., no. 1, . January 1968. .
IIProficiency Testingll. Laboratory Management, November 1974.
proficienc! Testing in Syphf1ic Serology~ .College of American Patho: ogists, Chi cago, III i noi s, 1971. '
Quality Evaluation. The College of American Pathologists, Chicago, Illinois.
Quality Evaluation Program for Toxicol09l~ College of American Pathologists, Chicago, Illinois, Undated.
Schaeffer, M. et a1. liThe clinical laboratory improvement program in New York Ci ty. I. Methods of eva 1 uation and resul ts of performance tests.' Health Laboratory Science, Vol. 4, no. 4. Apri 1 1967.
Sine, H. E. et al. IIRole of state health departments in testing proficiency of drug abuse toxicology for intrastate clinical laboratories. 1I Clinical Chemistry, Vol. ,18, no. 6~ June 1972.
Stein, G.; Laessig"R. H.; Indriksons, A. IIAn evaluation of drug testing procedures used by forensic laboratories and the qualifications of their analysts. II Wisconsin Law Review, 3, 1973.
II Standards for 'an interlaboratory (profi ciency) testi ng program. II American Journal of Clinical Pathology; Vol. 6, no. 1, pp. 276-8, Jul~ 1976.
Sunde~ann, F. W~ "Twenty-five years of proficiency testing for clinical laboratory. II Annals of Clinical Laboratory SC'ience, 2, September/October 1972.
Thompson, J. F. et al. "Analytical quality control in a pesticide residue 1aboratory.1I Environmental Quality and Safety (Supp1.) Vol. 3, pp. 32-9, 1975.
286
. f
•
1
~
I
I'
Tonks, David B. A study of the accuracy and preC1Slon of clinical chemistry determinations in l7Q Canadian laboratories. Clinical Chemistry, Vol. 9, no. 2, February 1963.
Ward, Po,A. et a1. "Interlaboratory trials: a national proficiency assessment scheme in Britain. 1I in ,Qual ity Control in Haematolog,>:. S. M. Lewis and J. F. Coster, eds. Academic Press, London, 1975'.
Wieme, R. J. et al. liThe position of national surveys in proficiency testing of clinical chemistry laboratories. Results of the national surveys in Belgium, 19~1-1973.11 Acta Clinita Belgica, (English abstract). Vol. 30, no. l, pp. 9-18, 1975.
,. ....~ .......
237
Related Documents