Thesis presented in partial fulfilment of the requirements for the degree Master of Science in Biochemistry at the University of Stellenbosch LABORATORY OPTIMIZATION OF A PROTEASE EXTRACTION AND PURIFICATION PROCESS FROM BOVINE PANCREAS IN PREPARATION FOR INDUSTRIAL SCALE UP By Tinus Andre De Wet Supervisor: Prof. Pieter Swart Co-Supervisor: Dr Michael Graz Faculty of Science Department of Biochemistry December 2012

Welcome message from author
This document is posted to help you gain knowledge. Please leave a comment to let me know what you think about it! Share it to your friends and learn new things together.
Transcript

LABORATORY OPTIMIZATION OF A PROTEASE
EXTRACTION AND PURIFICATION PROCESS FROM BOVINE
PANCREAS IN PREPARATION
FOR INDUSTRIAL SCALE UP.
by
Tinus de Wet
March 2012
Thesis presented in partial fulfilment of the requirements for the degree
Master of Science in Biochemistry at the University of Stellenbosch
Supervisor: Prof Pieter Swart
Co-supervisor: Dr Michael Graz
Faculty of Science
Department of Biochemistry
LABORATORY OPTIMIZATION OF A PROTEASE EXTRACTION
AND PURIFICATION PROCESS FROM BOVINE PANCREAS IN
PREPARATION FOR INDUSTRIAL SCALE UP
By
Tinus Andre De Wet
Supervisor: Prof. Pieter Swart
Co-Supervisor: Dr Michael Graz
Faculty of Science
Department of Biochemistry
December 2012

II
DECLARATION
By submitting this dissertation electronically, I declare that the entirety of the work contained
therein is my own, original work, that I am the owner of the copyright and that I have not
previously in its entirety or in part submitted it for obtaining any qualification.
December 2012
Copyright © 2012 Stellenbosch University
All rights reserved
Stellenbosch University http://scholar.sun.ac.za
III
BRIEF SUMMARY
This study describes:
a) Characterization of traditional methodologies and testing methods used to purify and
quantify trypsin and α-chymotrypsin
b) Re-engineering / development of a new method for purifying trypsin and α-chymotrypsin
that delivered higher product yields and improved control exercised over the process by
investigating:
i. Extraction methods
ii. Centrifugation
iii. Ultrafiltration
iv. Chymotrypsinogen and trypsin crystallization
v. Column chromatography
vi. Investigation into different raw material sources for pancreatic enzyme production
c) Development of kinetic and ELISA testing methodologies for in-process QC analysis.
Stellenbosch University http://scholar.sun.ac.za

IV
OPSOMMING
Hierdie Studie beskryf:
a) Karakterisering van die ou prosessering metodes en toets metodes wat gebruik word
om Tripsien en Alpha-chimotripsien te suiwer en te kwantifiseer.
b) Herontwerp / ontwikkeling van 'n nuwe metode vir die suiwering Tripsien en
Chimotripsien wat „n hoër opbrengs lewer en meer kontrole oor die proses uit oefen
deur ondersoek in te stel na:
i. Ekstraksie- metodes
ii. Sentrifugering
iii. Ultrafiltrasie
iv. Chymotripsienogeen - en tripsien kristallisasie
v. Kolom chromatografie
vi. Ondersoek na verskillende rou materiaal bronne vir die produksie van
pankreas ensieme.
c) Die ontwikkeling van kinetiese- en ELISA toets metodes vir die in-proses
kwaliteitkontrole.
Stellenbosch University http://scholar.sun.ac.za

V
ACKNOWLEDGEMENTS
I hereby wish to express my sincere gratitude to the following persons and institutions:
My Heavenly Father to whom belongs all the glory. (1 Corinthians 10:31)
Sunandi de Wet my wife for all the moral support, patience, coffee and food she prepared
whilst writing this thesis.
My parents for all the motivation and support in the world.
Prof. P. Swart for his expert advice and guidance.
Dr J. Carney for his assistance and expert advice.
Dr M Graz for always questioning everything I did.
Dr S Clark for support throughout the writing of this thesis.
Gabriel Mashabela for his generous support in the laboratory.
Almero Barnard for entertaining and inspiring.
BBI Enzymes for financial support.
Desmond February for always being willing to give a helping hand throughout this project.
Stellenbosch University http://scholar.sun.ac.za
VI
TABLE OF CONTENTS
DECLARATION……………………………………………………………………..……….I
ABSTRACT………………………………………...……………………………………......II
ACKNOWLEDGEMENTS ………………………………………………………………..IV
ABBREVIATIONS………………………………………………………………………...VII
LIST OF FIGURES ………………………………………………………………….…...XIII
LIST OF TABLES…………………………………………………………………….…..XVI
TABLE OF CONTENTS
CHAPTER 1
1. INTRODUCTION ............................................................................................................... 1
CHAPTER 2
2. THE PANCREAS AS A COMPLEX SOURCE OF ENZYMES ...................................... 4
2.1 ENZYMES OF THE BOVINE PANCREAS ..................................................................... 4
2.1.1. DEOXYRIBONUCLEASE (EC # 3.1.21.1) ................................................................. 4
2.1.2. RIBONUCLEASE (EC # 3.1.27.5) ................................................................................ 5
2.1.3. AMYLASE (EC # 3.2.1.1) ............................................................................................. 5
2.1.4. CARBOXYPEPTIDASE (EC # 3.4.17.1) ...................................................................... 5
2.1.5. ELASTASE (EC # 3.4.21.71) ......................................................................................... 5
2.1.6. LIPASE I (EC # 3.1.1.3) ................................................................................................. 6
2.1.7. CHOLESTEROL ESTERASE (EC # 3.1.1.13) ............................................................. 6
2.1.8. TRYPSIN (EC# 3.4.21.4) ............................................................................................... 7
2.1.9. CHYMOTRYPSIN (EC# 3.4.21.1) ................................................................................ 8
2.2 MODE OF ACTION OF THE SERINE PROTEASES ...................................................... 9
Stellenbosch University http://scholar.sun.ac.za
VII
CHAPTER 3
3. OVERVIEW OF THE TRADITIONAL TRYPSIN AND CHYMOTRYPSIN
PROCESSING METHODOLOGIES ............................................................................... 12
3.1 PRIMARY PROCESSING ............................................................................................... 14
3.2 SECONDARY PROCESSING ......................................................................................... 17
3.2.1. PURIFICATION OF CHYMOTRYPSINOGEN ......................................................... 18
3.2.2. PURIFICATION OF CHYMOTRYPSIN .................................................................... 19
3.2.3. PURIFICATION OF TRYPSIN ................................................................................... 20
3.3 SHORTCOMINGS OF THE TRADITIONAL PROCESSING
METHODOLOGIES ......................................................................................................... 21
3.3.1. EXTRACTION ............................................................................................................. 22
3.3.2. AMMONIUM SULPHATE PRECIPITATION ........................................................... 23
3.3.3. PH MEASUREMENT .................................................................................................. 25
3.3.4. CHYMOTRYPSINOGEN CRYSTALLIZATION (ZYMOGEN
SEPARATION) ............................................................................................................ 26
3.3.5. TRYPSIN CRYSTALLIZATION ................................................................................ 26
3.4 CHARACTERIZATION OF PRODUCTS PRODUCED BY TRADITIONAL
PROCESSING METHODOLOGIES ............................................................................... 28
CHAPTER 4
4. RE-ENGINEERING A NEW PROCESS FOR PURIFICATION OF BOVINE
TRYPSIN AND CHYMOTRYPSIN ................................................................................ 32
4.1 IMPROVED EXTRACTION OF PANCREATIC PROTEASES .................................... 32
4.1.1. MATERIALS AND METHODS ................................................................................. 32
4.1.2. RESULTS ..................................................................................................................... 35
4.1.3. CONCLUSION ............................................................................................................. 36
4.2 OPTIMIZED CLARIFICATION TECHNIQUES ............................................................ 37
4.2.1 ALFA LAVAL DECANTER CENTRIFUGE OPTIMIZATION ............................... 40
4.2.2 DISC CENTRIFUGE OPTIMIZATION ...................................................................... 40
Stellenbosch University http://scholar.sun.ac.za
VIII
4.2.1 CONCLUSION ............................................................................................................. 42
4.3 INVESTIGATING DIFFERENT CRYSTALLIZATION CONDITIONS FOR
CHYMOTRYPSINOGEN AND TRYPSIN ..................................................................... 42
4.3.1. INTRODUCTION ........................................................................................................ 42
4.3.2. CRYSTALLIZATION AT BBI ENZYMES ................................................................ 44
4.3.3. CHYMOTRYPSINOGEN CRYSTALLIZATION ...................................................... 45
4.3.3.1. MATERIALS AND METHODS ............................................................................ 47
4.3.3.2. RESULTS ................................................................................................................ 48
4.3.3.3. CONCLUSION ....................................................................................................... 50
4.3.4. TRYPSIN CRYSTALLIZATION ................................................................................ 50
4.3.4.1. MATERIALS AND METHODS ............................................................................ 51
4.3.4.2. RESULTS ................................................................................................................ 51
4.3.4.3. CONCLUSION ....................................................................................................... 55
CHAPTER 5
5. NEW TECHNIQUES AND METHODS CONSIDERED FOR TRYPSIN AND
CHYMOTRYPSIN PURIFICATION. .............................................................................. 57
5.1 ULTRAFILTRATION TECHNOLOGY AS A MEANS OF PROTEIN
PURIFICATION AND VOLUME REDUCTION. .......................................................... 58
5.1.1. INTRODUCTION ........................................................................................................ 58
5.1.2. MATERIALS AND METHODS ................................................................................. 62
5.1.3. RESULTS ..................................................................................................................... 64
5.1.4. CONCLUSION ............................................................................................................. 69
5.2 CHROMATOGRAPHY DEVELOPMENT TO SEPARATE TRYPSIN(OGEN)
FROM CHYMOTRYPSIN(OGEN). ................................................................................ 70
5.2.1. INTRODUCTION ........................................................................................................ 70
5.2.1.1. AFFINITY CHROMATOGRAPHY ...................................................................... 71
Stellenbosch University http://scholar.sun.ac.za
IX
5.2.1.2. HYDROPHOBIC INTERACTION CHROMATOGRAPHY ................................ 74
5.2.1.3. ION EXCHANGE CHROMATOGRAPHY........................................................... 75
5.2.2. MATERIALS AND METHODS ................................................................................. 78
5.2.2.1. AFFINITY CHROMATOGRAPHY ...................................................................... 78
5.2.2.2. HYDROPHOBIC INTERACTION CHROMATOGRAPHY ................................ 80
5.2.2.3. ION EXCHANGE CHROMATOGRAPHY OF TRYPSIN AND
CHYMOTRYPSIN USING CM SEPHAROSE RESIN. ....................................................... 82
5.2.2.4. ION EXCHANGE CHROMATOGRAPHY OF TRYPSINOGEN AND
CHYMOTRYPSINOGEN USING CM SEPHAROSE RESIN. ............................................ 85
5.2.3. RESULTS ..................................................................................................................... 90
5.2.3.1. AFFINITY CHROMATOGRAPHY ...................................................................... 90
5.2.3.2. HYDROPHOBIC INTERACTION CHROMATOGRAPHY ................................ 92
5.2.3.3. ION EXCHANGE CHROMATOGRAPHY OF TRYPSIN AND
CHYMOTRYPSIN ................................................................................................................. 93
5.2.3.4. BINDING STUDIES OF TRYPSINOGEN AND CHYMOTRYPSINOGEN
TO CM SEPHAROSE RESIN. ............................................................................................... 98
5.2.4. CONCLUSION ........................................................................................................... 103
5.2.4.1. AFFINITY CHROMATOGRAPHY .................................................................... 103
5.2.4.2. HYDROPHOBIC INTERACTION CHROMATOGRAPHY .............................. 104
5.2.4.3. ION EXCHANGE CHROMATOGRAPHY......................................................... 104
5.2 INVESTIGATING THE FEASIBILITY OF USING NON-ACID DIPPED
PANCREAS AS A RAW MATERIAL SOURCE FOR PROTEASE ENZYME
PRODUCTION. .............................................................................................................. 105
5.2.1 INTRODUCTION ...................................................................................................... 105
5.3.2. MATERIALS AND METHODS ............................................................................... 105
Stellenbosch University http://scholar.sun.ac.za
X
5.3.3. RESULTS ................................................................................................................... 107
5.3.4. PROCESSING A LARGE SCALE BATCH TO INVESTIGATE THE EFFECT
OF USING NON-ACID DIPPED PANCREAS ON THE ZYMOGEN
SEPARATION. .......................................................................................................... 113
5.3.4.1. RESULTS .............................................................................................................. 113
5.3.5. CONCLUSION ........................................................................................................... 115
CHAPTER 6
6. DEVELOPMENT OF IN-PROCESS QC ANALYSIS TO QUANTIFY THE
TOTAL AMOUNT OF ENZYME AT DIFFERENT STAGES OF THE PROCESS ... 116
6.1 OVERVIEW OF THE TESTING METHODOLOGIES USED..................................... 116
6.1.1. DETERMINATION OF TRYPSIN ACTIVITY ........................................................ 116
6.1.2. DETERMINATION OF CHYMOTRYPSIN ACTIVITY ......................................... 117
6.2 SHORTCOMINGS OF THE TRADITIONAL TESTING METHODOLOGIES .......... 117
6.3 DEVELOPMENT OF NEW TESTING METHODOLOGIES ...................................... 118
6.4 DEVELOPMENT OF A MICROTITRE KINETIC ASSAY FOR TRYPSIN............... 122
6.4.1 INTRODUCTION ...................................................................................................... 122
6.4.2 MATERIALS AND METHODS ............................................................................... 123
6.4.3 RESULTS ................................................................................................................... 124
6.4.4 INVESTIGATION OF CROSS REACTIVITY OF CHYMOTRYPSIN IN THE
TRYPSIN ASSAY ...................................................................................................... 125
6.4.4.1. RESULTS .............................................................................................................. 125
6.4.5 CONCLUSION ........................................................................................................... 126
6.5 ELISA DEVELOPMENT FOR TESTING TRYPSINOGEN CONTENT .................... 126
6.5.1 MATERIALS AND METHODS ............................................................................... 126
6.5.2 RESULTS ................................................................................................................... 128
6.5.3 INVESTIGATION OF CROSS-REACTIVITY WITH CONTAMINATING
ENZYMES. ................................................................................................................ 129
Stellenbosch University http://scholar.sun.ac.za
XI
6.5.4 CONCLUSION ........................................................................................................... 131
CHAPTER 7
7. PROCESS OVERVIEW OF THE NEW PURIFICATION PROCESS
DEVELOPED FOR TRYPSIN AND CHYMOTRYPSIN ............................................. 133
7.1 PREPARATION OF CHYMOTRYPSINOGEN ............................................................ 136
7.2 PREPARATION OF CHYMOTRYPSIN ....................................................................... 136
7.3 PREPARATION OF TRYPSIN ...................................................................................... 136
7.4 CHARACTERIZATION OF PRODUCT PRODUCED BY THE NEW PROCESS..... 138
7.4.1 SDS PAGE ANALYSIS OF FINAL LYOPHILIZED TRYPSIN PRODUCTS ....... 138
7.4.2 SDS PAGE ANALYSIS OF FINAL LYOPHILIZED CHYMOTRYPSIN
PRODUCTS COMPARING TRADITIONALVERSUS NEW PROCESSING
METHODOLOGIES .................................................................................................. 139
CHAPTER 8
8. CONCLUSION ............................................................................................................... 143
CHAPTER 9
9. BIBLIOGRAPHY .......................................................................................................... 149
10. APPENDICIES................................................................................................................ 155
Stellenbosch University http://scholar.sun.ac.za

XII
ABBREVIATIONS
BBI - British Biocell International
PDF - Pancreas Derived Factor (s)
QC - Quality Control
kDa - Kilo Dalton
CTG - Chymotrypsinogen
DNase - Deoxyribonuclease
RNase - Ribonuclease
DNA - Deoxyribonucleic acid
RNA - Ribonucleic acid
A/S - Ammonium Sulphate
MBR - Master Batch Record
A280 - Absorbance at 280 nanometres
TRIS - Tris(hydroxymethyl)aminomethane
RML - Recovery Mother Liquor
BAEE - N-Benzoyl-L-Arginine Ethyl Ester
ATEE - N-Acetyl-L-Tyrosine Ethyl Ester
SDS PAGE - Sodium Dodecyl Sulphate Poly Acrylamide Electrophoresis
UF - Ultrafiltration
FTU - Formazin Turbidity unit
TFF - Tangential Flow Filtration
MWCO - Molecular Weight Cut-Off
TMP - Trans Membrane Pressure
NWP - Normalised Water Permeability
PES - Poly Ether Sulfone
HIC - Hydrophobic interaction Chromatography
CM - Carboxy Methyl
pABA - p-Amino Benzamidine
RO - Reverse Osmosis
pI - Isoelectric Point
IPC - In Process Control
ELISA - Enzyme-linked immunosorbent assay
L-BAPNA - Na-Benzoyl-L-Arginine 4-nitroanilide Hydrochloride
DMF - Dimethyl Formamide
PBS - Phosphate Buffered Saline
BSA - Bovine Serum Albumin
HRP - Horseradish Peroxidase
TMB - Tetramethylbenzidine
BU - Billion Units
Stellenbosch University http://scholar.sun.ac.za
XIII
LIST OF FIGURES
Figure 1: Catalytic mechanism of the serine proteases as it occurs in four steps . ................................................ 10
Figure 2. Flowchart of the entire traditional extraction and purification process for chymotrypsin, CTG and
trypsin. ......................................................................................................................................................... 13
Figure 3: Frozen blocks of beef pancreas lined up to be flaked into the perforated basket submerged in extraction
medium.. ....................................................................................................................................................... 14
Figure 4. Perforated basket filled with tissue debris after submersion in extraction medium .............................. 15
Figure 5. Coffin filter filled with precipitate being dried under a vacuum.. .......................................................... 16
Figure 6. Zymogen separation incubation vessel in which the CTG crystallized for 48 hours. ............................. 18
Figure 7. Large pieces of pancreas collected after extraction.. .............................................................................. 23
Figure 8. Closed tops of the precipitation tanks complicated the volume determinations ..................................... 24
Figure 9: SDS PAGE analysis of all the products produced by the traditional processing method. ...................... 29
Figure 10. Difference between the two maceration methods.. ............................................................................... 33
Figure 11. Schematic presentation of the two different extraction methodologies compared. .............................. 34
Figure 12. Principle of solid removal by centrifugal force using a stacked disc centrifuge .................................. 38
Figure 13. The principle of protein crystal formation. ........................................................................................... 43
Figure 14. Protein phase diagram indicating the four different phases. ................................................................. 44
Figure 15: SDS page of trypsin produced through A/S saturation. ........................................................................ 54
Figure 16 Trypsin crystals (400x magnification) after 7 days of crystallization under the newly defined
conditions. ..................................................................................................................................................... 55
Figure 18. Liquid passes through the feed channel and along the surface of the membrane as well as through the
membrane. ..................................................................................................................................................... 60
Figure 19. Three different TMP‟s and crossflows were investigated to determine the optimal conditions for the
best filtrate flux. ........................................................................................................................................... 65
Figure 20. The second trial carried out on clarified 0/20 material at a constant TMP of 1.5. ................................ 67
Figure 21. Third trial carried out on clarified 0/20 material at a constant TMP of 1.5, but at higher crossflow.. .. 68
Figure 22. Experimental design of the chromatography development aiming to separate trypsin(ogen) from
chymotrypsin(ogen) using Affinity chromatography (Benzamidine), Hydrophobic Interaction
Chromatography (Phenyl Sepharose) and Ion Exchange chromatography (CM Sepharose). ...................... 71
Figure 23. Basic principles of affinity chromatography where the enzyme substrate / ligand is immobilized onto
a resin.. .......................................................................................................................................................... 72
Stellenbosch University http://scholar.sun.ac.za

XIV
Figure 24. Benzamidine linked to phenyl sepharose fast flow (High sub) resin via stable ether linkages.
(Amersham Pharmacia Biotech, 2001) ......................................................................................................... 73
Figure 25. The structure of the trypsin – pABA complex formed when trypsin binds to the immobilized
Benzamidine on the sepharose resin.. ........................................................................................................... 73
Figure 27. Net charge of the protein of interest is dependent on the pH of the buffer it is solubilised in relative to
its pI.. ............................................................................................................................................................ 76
Figure 28 Flow diagram of the experimental design of the Ion exchange chromatography for the separation of
trypsin(ogen) from chymotrypsin(ogen). ...................................................................................................... 77
Figure 29. Elution profile of Sigma trypsin using benzamidine sepharose as an affinity resin.. ........................... 90
Figure 30. Elution profile of trypsin when loaded onto Benzamidine affinity column in the presence of 35%
A/S.. .............................................................................................................................................................. 91
Figure 31. Superimposed elution profiles (A280) of the two individual experiments when the zymogens were
loaded onto phenyl sepharose resin at high pH (pH 8.00). ........................................................................... 92
Figure 32. Superimposed elution profiles (A280) of the two individual experiments when the zymogens were
loaded onto Phenyl Sepharose resin at low pH (pH 3.00). ............................................................................ 93
Figure 33. Superimposed elution profile of Sigma trypsin and chymotrypsin on CM-Sepharose loaded with 50
mM sodium acetate buffer, pH 3.2 and eluted with the same buffer containing increasing concentrations of
sodium chloride. ............................................................................................................................................ 94
Figure 34. Elution profile of chymotrypsin when loaded onto a CM column in 0.05M Sodium Acetate buffer,
0.05 M NaCl, pH 3.5, and elution with increasing pH of the eluting buffer.. ............................................... 95
Figure 35: Superimposed elution profile of trypsin and chymotrypsin on CM-Sepharose loaded in 0.05 M
sodium acetate, 0.05 M NaCl buffer, pH 5.5 and eluted with increasing concentration of NaCl in the elution
buffers. . ....................................................................................................................................................... 96
Figure 36. Elution profile of trypsin and chymotrypsin on CM-Sepharose at low pH (<3.00). The enzyme
dissolved in 50 mM Gly, HCl buffer, pH 3.2 was charged on the column which had been equilibrated with
the same buffer.. ............................................................................................................................................ 97
Figure 37. Elution profile of trypsinogen and CTG at pH 8.45 with increasing concentrations of NaCl in the
elution buffer.. ............................................................................................................................................... 98
Figure 38. Elution profile of trypsinogen using a Sodium Phosphate buffer, pH 6.1 with increasing
concentrations of NaCl in the elution buffer.. ............................................................................................... 99
Stellenbosch University http://scholar.sun.ac.za

XV
Figure 39. Elution profile of chymotrypsinogen using a Sodium Phosphate buffer, pH 6.1 with increasing
concentrations of NaCl in the elution buffer.. ............................................................................................... 99
Figure 40. Elution profile of trypsinogen and CTG on a CM sepharose column at pH 7.2 with increasing NaCl
concentrations.. ........................................................................................................................................... 100
Figure 41. Elution profile of a mixture of trypsinogen and CTG using a Sodium Phosphate buffer, pH 7.2 and
eluting only with 50 mM NaCl and 150 mM NaCl in the elution buffer.. .................................................. 101
Figure 42. Elution profile of a mixture clarified 0/20 material from the factory floor using a sodium phosphate
buffer, pH 7.2 and eluting only with 50 mM NaCl and 150 mM NaCl in the elution buffer. .................... 102
Figure 43. A Comparison of the two extraction media after the completion of the extraction process. .............. 109
Figure 44. SDS PAGE Analysis comparing three different process stages of the small scale purification.. ....... 111
Figure 45. Activation plots for both trials.. .......................................................................................................... 112
Figure 46. Light pink colour observed during the initial stages of the extraction of the untreated bovine
pancreas.. .................................................................................................................................................... 114
Figure 47. Schematic presentation of the cleavage of BAEE by trypsin, resulting in Nα-Benzoyl-L-Arganine and
ethanol.. ....................................................................................................................................................... 116
Figure 48. Schematic presentation of the cleavage of ATEE by chymotrypsin, resulting in -acetyl-L-tyrosine
acid and ethanol. ........................................................................................................................................ 117
Figure 49. Process control by means of in process controls as described by the GMP manual ........................... 119
Figure 50. Diagram indicating the principle of a sandwich ELISA where the primary antibody is coated onto a 96
well microplate. .......................................................................................................................................... 120
Figure 51. Basic reaction mechanism of trypsin hydrolysis of L-BAPNA, yielding the substrate p-nitroalanine
which could be quantified at 405 nm. ......................................................................................................... 122
Figure 52: Trypsin activity standard curve. Sigma trypsin was used for the assay.............................................. 124
Figure 53: Chymotrypsin assayed using trypsin specific substrate.. .................................................................... 125
Figure 54. The standard curve obtained with standards ranging from 125 – 0.98 ng/ml. .................................... 129
Figure 55. Anti-trypsinogen ELISA cross reactivity with the major contaminants in the primary processing
stages. .......................................................................................................................................................... 130
Figure 56. Flowchart of the newly developed production process for pancreas derived factors including
chymotrypsin, CTG and trypsin. ................................................................................................................. 133
Figure 57. SDS PAGE analysis of three consecutive representative batches of trypsin produced by the new
process compared to a control samples from the traditional process. ......................................................... 138
Stellenbosch University http://scholar.sun.ac.za

XVI
Figure 58. SDS PAGE analysis of three consecutive representative batches of chymotrypsin produced by the
new process compared to a control samples from the traditional process. .................................................. 139
Figure 59. The chymotrypsin yield (Expressed as BU/ton) over the 12 month period from Sept 2010 until Sept
2011, indicating positive growth.. ............................................................................................................... 143
Figure 60. The trypsin yield (Expressed as BU/ton) over the 12 month period from Sept 2010 until Sept 2011,
indicating steady positive growth................................................................................................................ 144
Figure 61. Definition of in-process QC samples to characterize the processing steps. ....................................... 146
LIST OF TABLES
Table 1. Additional A/S added as a result of miscalculations of the volume of the tanks ..................................... 24
Table 2. Lyophilized chymotrypsin Quality Control analysis of product produced by traditional processing
methodologies according to product specification. ....................................................................................... 30
Table 3. Lyophilized Trypsin Quality Control analysis of product produced from by traditional processing
methodologies according to product specification ........................................................................................ 31
Table 4. Comparison of the total protein content of the two different extraction methods for the same batch. .... 35
Table 5. Summary of the results where two different extraction methods were compared. .................................. 36
Table 6: Yields of pancreatic derived factors (enzymes) affected by zymogen separation ................................... 46
Table 7: Batches affected by A/S saturation and products produced during the study .......................................... 47
Table 8. Set of A/S standards were prepared. ........................................................................................................ 47
Table 9: Conductivities and volumes of saturated ammonium sulphate added ..................................................... 48
Table 10. Yields and specific activities of CTG, trypsin and chymotrypsin as a result of varying final % A/S
saturations. .................................................................................................................................................... 49
Table 11: Total trypsin and chymotrypsin activities after completion of trypsin activation and the
trypsin:chymotrypsin ratio achieved as an indication of the CTG crystallization efficiency. ....................... 49
Table 12: Trypsin crystallization efficiency of 7 consecutive batches was calculated to investigate the effect A/S
saturation on trypsin crystallization. ............................................................................................................. 52
Table 13: Trypsin Yields achieved for batches that underwent A/S saturation during the trypsin crystallization
process. ......................................................................................................................................................... 53
Table 14: Trypsin quality of the final lyophilized product. According to the specification .................................. 53
Table 15. Summary of the parameters controlled during the first optimization trials. .......................................... 65
Stellenbosch University http://scholar.sun.ac.za

XVII
Table 16. Summary of the second trial where clarified 0/20 material was concentrated at a constant TMP of 1.5
...................................................................................................................................................................... 66
Table 17. Summary of the third trial where clarified 0/20 material was concentrated at a constant TMP of 1.5,
but at higher crossflow. ................................................................................................................................. 68
Table 18. Summary of the iso-electric points of the different enzymes................................................................. 77
Table 19. Summary of the activity assay results of the fractions collected from the Benzamidine column. ......... 91
Table 20. Comparison between the two pancreas sources before and after the extraction. ................................. 108
Table 21. Summary of the total protein content and precipitate weight .............................................................. 110
Table 22. Absorbance at 450 nm of 4-nitroaniline produced by trypsin enzymatic cleavage of L-BAPNA
substrate after a 10 minute incubation. ....................................................................................................... 124
Table 23. Summary of the chymotrypsin Quality Control results of the final lyophilized material of product
produced by new processing method.. ........................................................................................................ 141
Table 24. Summary of the trypsin Quality Control results of the final lyophilized material of product produced
by new processing method .......................................................................................................................... 142
Table 25. Comparison of the major differences between the traditional and the new processing methods. ........ 147
Stellenbosch University http://scholar.sun.ac.za

1
CHAPTER 1
1. INTRODUCTION
This project was part of an investigation at BBI Enzymes South Africa to optimize the output
of a protein purification process from acid treated bovine pancreas. Although there are a
number of different enzymes that were purified from bovine pancreas such as
deoxyribonuclease, ribonuclease, trypsin, chymotrypsin and chymotrypsinogen, the focus of
this thesis was to describe the process improvements of only the trypsin, chymotrypsin and
chymotrypsinogen (CTG) processes due to their annual monetary value to the company. The
aim of this project was to develop a high yielding controlled protein purification process for
trypsin and alpha chymotrypsin (ogen) by making use of adapted, optimized laboratory
techniques. These methods needed to be simple, cost effective and should consistently be able
to produce high quality enzymes. The laboratory based research had to yield a process that
could be scaled up to an industrial production process. The outcome of this study will have
major financial benefits for the company, and was considered an extremely high priority
within BBI Enzymes.
BBI Enzymes is one of the largest natural enzyme producing companies in the world. The
traditional methods for enzyme purification used at the facility in Cape Town were time
consuming, out-dated, inconsistent and inefficient. The time required to produce the enzymes
was not financially viable, and the company was thus in need of new methods to rapidly and
consistently purify high quality enzymes. The traditional extraction and purification process
of pancreatic proteases was extremely long due to a series of crystallizations at various stages
during the process, and low yields were achieved at final product, due to inefficient extraction
and poor control over the process. Because of the complexity of the manufacturing process,
and the out-dated in-process testing methodologies, BBI was only able to predict the yield of
the process during the latter stages of the process.
In this study, the three focus areas were:
1. Characterization of the traditional manufacturing process, and the enzymes
2. Re-Engineering/development of a new method for purification of the pancreatic proteases.
3. Development of new testing methodologies for in-process Quality Control (QC) analysis
Stellenbosch University http://scholar.sun.ac.za
2
1. Characterization of the existing manufacturing process
By making use of the developed assays for trypsin and chymotrypsin allowed us to gain a
better understanding of the limitations of the current manufacturing methodologies. Analysis
of the final products revealed additional information on efficiency of current methods to
purify specific enzymes. A determination of the maximal amount of enzyme that could be
extracted per mass of raw material input would determine if the outcome of the study was
achievable, in terms of product yield.
2. Re-engineering/development of a new method for purification of pancreatic protease
After a detailed study of each of the processing steps, and after the main process inefficiencies
had been identified, a new process was designed. Laboratory scale experiments would
determine the optimal conditions for plant scale production, all laboratory based studies
needed to be reproducible on plant scale.
Laboratory scale trials included the following:
2.1. Improved extraction of pancreatic proteases by better maceration of frozen pancreas
and more vigorous agitation of extraction medium.
2.2 Optimized clarification techniques using high-speed centrifuges and diatomaceous
earth filters.
2.3 Ultrafiltration technology as a means of protein purification and volume reduction.
Investigating different types of membranes optimal performance.
2.4 Investigating different conditions to establish the optimal conditions for crystallization
of chymotrypsinogen and trypsin.
2.5 Chromatography development to separate trypsin from chymotrypsin.
2.5.1 Affinity chromatography of trypsin.
2.5.2 Hydrophobic Interaction chromatography
2.5.3 Ion exchange chromatography
2.6 Usage of untreated bovine pancreas as an alternative source of enzyme production.
Stellenbosch University http://scholar.sun.ac.za
3
3. Development of testing methodologies for in-process QC analysis
To allow BBI Enzymes to perform proper protein purification, well established, robust testing
methodologies were required to quantify the amount of enzyme (and precursor) present at
every stage in the process, and to track the effectiveness of the methods and processes. These
assays needed to be rapid, reliable, sensitive, specific and repeatable in order to feedback real
time information to the process operators. Enzyme specific assays (microtitre assays) would
be used to test the activity of the active protease during the latter stages of the process. These
assays would include a set of standards and a control against which the in-process sample
could be tested.
Because the precursor enzymes (zymogens) did not have activity, these testing methods could
not be considered to test for the presence of the zymogens. In addition to the use of
commercial reagents, immunoassays would be developed to quantify the zymogens during the
initial stages of the process.
These testing methodologies would give a better indication of the amount of enzyme present
in the initial stages of the process. Quantitative analysis would allow for characterization of
the material at all stages during the process, and would facilitate tracking the outcome of
every individual stage. The new testing methods would primarily be used to track the
development of the new process, and would eventually allow us to compare the new method
against the one previously used.
Stellenbosch University http://scholar.sun.ac.za
4
CHAPTER 2
2. THE PANCREAS AS A COMPLEX SOURCE OF ENZYMES
The pancreas is a complex organ and a rich source of different digestive enzymes. These
enzymes include trypsin, chymotrypsin, ribonuclease, deoxyribonuclease, elastase, amylase to
name only a few. Some of these enzymes have been identified to have industrial value,
especially in the pharmaceutical industry. The study of pancreatic enzymes dates back to late
1876 when Kuhne et al. started to investigate the proteolytic properties of pancreatic juice.
The work of Kunitz et al. revolutionized the way in which pancreatic enzymes were studied
when they started crystallizing bovine trypsin and chymotrypsin (Northrop, 1948).
The predominant two enzymes in the bovine pancreas are trypsin and chymotrypsin. These
are the two best defined and characterised enzymes and are of great commercial significance.
This study focussed primeraly on the purification of trypsin and chymotrypsin(ogen).
2.1 ENZYMES OF THE BOVINE PANCREAS
The process described in this study did not allow the purification of trypsin and chymotrypsin
only, but also of two other pancreatic enzymes, deoxyribonuclease and ribonuclease. The
pancreas is a rich source of digestive enzymes that are all secreted into the duodenum to
facilitate hydrolysis of proteins, nucleic acids, carbohydrates and fats. These enzymes include:
2.1.1. DEOXYRIBONUCLEASE (EC # 3.1.21.1)
Deoxyribonuclease (DNase) is a 31.3 kilo Dalton (kDa) endonuclease enzyme consisting of
282 amino acids that hydrolyses phosphodiester bonds adjacent to pyrimidine nucleotides of
deoxyribonucleic acid (DNA) yielding 5‟-phosphate terminated polynucleotides with a free
hydroxyl group at the 3‟ position (Chen, 2006). DNase plays an important role in apoptosis
and in the regulation of actin polymerization in cells. DNase I has been used as a treatment for
cystic fibrosis and systemic lupus erythematous. DNase greatly decreases the viscosity of
cystic fibrosis sputum, transforming it from a gel into a liquid after incubation, and this
viscosity reduction is accompanied by a reduction in sputum DNA strand size (Thomson,
1995, Chen, 2006).
Stellenbosch University http://scholar.sun.ac.za
5
2.1.2. RIBONUCLEASE (EC # 3.1.27.5)
Ribonuclease (RNase) consists of 124 amino acid residues with a molecular mass of 16 kDa
and includes four disulphide bonds. RNase is classified as an endonuclease, which
specifically cleaves phosphodiester bonds at the 3‟-end of pyrimidine nucleosides and at the
5'-ribose of a nucleotide, ribonucleic acid (RNA) (Smyth, 1963). RNase operates in an
optimum pH range of 7.0 - 7.5. A major application for RNase is the removal of RNA from
preparations of plasmid DNA. RNase demonstrates a series of important biological functions,
such as killing tumour cells and inhibiting viruses by degradation of RNA. Several
Ribonucleases are known to be toxic to tumour cells (Kim, 2009).
2.1.3. AMYLASE (EC # 3.2.1.1)
Amylase is a 60 kDa enzyme with the primary function of hydrolysis of dietary starch into di-
or tri–saccharides, which are subsequently further hydrolysed into primary sugars. Amylase is
not produced in the pancreas only, as there are other sources of amylase, such as saliva and
the liver. Plant, bacterial and fungal amylase have been identified. Compared to the proteases,
the amylase concentration in the pancreas is very low, and constitutes less than 2% of the total
protein of the pancreas (Keller, 1958). Amylases are widely used in the industry to convert
starch into sugars and syrups. These hydrolytes are often used as carbon sources during
fermentation processes (Aiyer, 2005).
2.1.4. CARBOXYPEPTIDASE (EC # 3.4.17.1)
Carboxypeptidase is a 47 kDa protease that is secreted into the small intestine, and serves as
the activator of trypsin by cleaving off the activation peptide of trypsinogen, causing a
conformational change that leads to the activation of trypsin. Carboxypeptidase performs its
function by hydrolysing the first peptide or amide bond at the carboxyl or C-terminal end of
proteins or peptides (Cox, 1962).
2.1.5. ELASTASE (EC # 3.4.21.71)
Elastase is a 25 kDa serine protease that exerts its function by hydrolysing amides and esters
in elastin (mainly), but also in other proteins (Schotton 1973). It has the ability to release
soluble peptides from insoluble elastin fibers. Elastase is also produced in the pancreas as an
inactive enzyme (like trypsinogen and CTG), and is called proelastase. Proelastase is
activated by trypsin when it reaches the duodenum. Elastase is also classified as a serine
protease.
Stellenbosch University http://scholar.sun.ac.za
6
2.1.6. LIPASE I (EC # 3.1.1.3)
Triglycerides cannot be absorbed into the blood stream from the small intestine if they are not
hydrolysed. Lipases hydrolyse triglycerides (lipids) into fatty acids and glycerol for uptake
from the gut. Unlike the zymogens, trypsinogen and chymotrypsinogen, lipase is produced as
an active enzyme and secreted into the pancreatic juice. Pancreatic lipases have a molecular
mass of approx. 45 – 50 kDa (Verger, 1969).
2.1.7. CHOLESTEROL ESTERASE (EC # 3.1.1.13)
Cholesterol esterase catalyses the hydrolysis of sterol esters into sterols and fatty acids. The
enzyme is primarily found in the pancreas, but has been detected in other tissues as well. Bile
salts, such as chelate and its conjugates, are required to stabilize the enzyme in its native
polymeric form and to protect it from proteolytic hydrolysis in the intestine. Cholesterol
esterase finds clinical applications in the determination of serum cholesterol (Allain, 1974).
THE PROTEASES OF INTEREST: TRYPSIN AND CHYMOTRYPSIN
The focus of this study, however, was on the purification of trypsin, chymotrypsin and
chymotrypsinogen because of the commercial interest and the monetary value of these
enzymes for BBI Enzymes. These enzymes contribute up to 50% of the revenue of BBI
Enzymes, and were considered a high priority.
Trypsin and chymotrypsin are classed as serine proteases, and are synthesized and excreted by
the acinar cells of the exocrine pancreas as inactive pro-enzymes (trypsinogen and
chymotrypsinogen-A). The zymogens are stored in zymogen granules acting as intracellular
storage sites (Greene, 1963).
Having inactive precursors in storage is a way for the cells to safely express and process these
enzymes. Trypsin inhibitor is also found within the secretory vesicles and serves as an
additional safeguard should some of the trypsinogen be activated to trypsin. Being
encapsulated in a vesicle, the local concentration of trypsin inhibitor is relatively high. When
the proteolytic enzymes are secreted and released into the lumen of the small intestine, trypsin
inhibitor is diluted out and becomes ineffective.
Once secreted into the lumen of the duodenum, trypsin and chymotrypsin digests proteins into
peptides of various sizes. These enzymes are, however, incapable of digesting proteins and
Stellenbosch University http://scholar.sun.ac.za

7
peptides to single amino acids. The hydrolysis of peptides into individual amino acids is
executed through carboxypeptidase and mainly through peptidases on the surfaces of small
intestinal epithelial cells from where the amino acids are absorbed into the blood stream
(Roxas, 2008).
2.1.8. TRYPSIN (EC# 3.4.21.4)
Trypsinogen, secreted into the duodenum as a 26.3 kDa pro-enzyme, is activated when
Enterokinase (Kunitz, 1939), secreted by the duodenal mucosa, cleaves the peptide bond
between Lysine 15 and Isoleucine 16 resulting in active trypsin with a molecular mass of 25.8
kDa (Bringer, 1986). The activation of trypsin by enterokinase disrupts the hydrogen bond
between His-40 and Asp 194. This causes a conformational change within the enzyme, and
allows Asp 194 to associate with the N-terminus of Isoleucine (Ile)-16. This conformation
change allows the creation of the active pocket of trypsin, and aligns the catalytic triad (His-
57-Asp-102-Ser-195) (Hedstrom, 1996).
Trypsin has a high degree of substrate specificity as it catalyses the hydrolysis of peptide
bonds on the carboxyl terminus of positively charged amino acids such as Lysine (Lys) and
Arginine (Arg). The optimum pH of trypsin is pH 8. The presence of (minimum 20 mM)
CaCl2 is required for optimal enzyme activity and stability. Trypsin has a high affinity
calcium binding site that is essential for the enzyme‟s stability. Auto-degradation rapidly
occurs once this calcium binding site is mutated (Higaki, 1985). The catalytic efficiency
(kcat/Km) of trypsin for substrates with Lys and Arg is 105 times higher than that for any other
amino acids (Craik, 1985). Binding of substrate to the active site of trypsin influences both the
Kcat and the Km. The binding of the substrate to the active site is the rate limiting step in the
hydrolysis reaction (Corey, 1992). Once trypsin is activated, it can act on trypsinogen by
cleaving the peptide bond at Lysine 15, thus resulting in autocatalysis and accelerated
activation within the duodenum, thereby facilitating protein digestion and ultimately
enhancing protein absorption. Trypsin is also responsible for the activation of
chymotrypsinogen and pro-elastase in the duodenum. Trypsin is very stable at pH 3.0 or as a
lyophilized powder (Corey, 1992).
Trypsin possesses anti-inflammatory as well as potent proteolytic properties that can be used
in molecular research and as an active pharmaceutical ingredient in various anti-inflammatory
medicines (Swamy, 2008). Trypsin may be useful in removing dead tissue, and might alter the
fibrous structure of blood clots. Localization of tissue damage, a cardinal aspect of the
inflammatory process, is in part due to fibrin deposition, with the consequent formation of a
Stellenbosch University http://scholar.sun.ac.za
8
mechanical barrier (connective tissue) in the tissue spaces. Trypsin facilitates breakage of
these blockages, and allows passing of blood and nutrients to inflamed areas (Martin, 1957).
See Appendix1 for the complete amino acid sequence of bovine trypsin. Trypsin is reversibly
inhibited by protein inhibitors such as ecotin, soybean trypsin inhibitor, α1-proteinase
inhibitor, benzamidine (pABA) and the natural pancreatic trypsin inhibitor (Bringer, 1986).
2.1.9. CHYMOTRYPSIN (EC# 3.4.21.1)
Chymotrypsinogen (CTG) is activated when trypsin cleaves the peptide bond between Arg-15
and Ile-16, and will undergo structural modification to form/expose the substrate binding site.
Chymotrypsin (25 kDa) specifically catalyses the hydrolysis of peptide bonds formed by
hydrophobic amino acid residues such as Tyrosine, Phenylalanine and Tryptophan (Boeris,
2009). Activation of three different isozymes of chymotrypsin have been described (alpha,
beta and gamma); however, this study will merely focus on the extraction and purification of
α-chymotrypsin (Hudaaky, 1999, Folk, 1965). Depending on the mechanism of CTG
activation, this would dictate which isoform of chymotrypsin is formed. Two primary modes
of activation have been described for CTG; slow activation by trypsin only would yield the γ
and α-isoforms, and fast activation by both trypsin and chymotrypsin would yield the β
isoform (Desnuelle, 1960, Neurath, 1949). α-Chymotrypsin is a serine protease of the
peptidase S1 family consisting of 241 amino acid residues. The molecule has three peptide
chains: an A chain consisting of 13 residues, a B chain consisting of 131 residues, and a C
chain consisting of 97 residues. α-chymotrypsin is the predominant form of active enzyme
produced from its zymogen, chymotrypsinogen A. There is a striking similarity between
trypsin and chymotrypsin with regards to synthesis, structure, activation, function, molecular
mass and isoelectric points (Walsh, 1964) .
Chymotrypsin possesses anti-inflammatory properties that enable it to hasten the resorption of
inflammatory oedema, as well as post-operative and post-traumatic haematoma.
Chymotrypsin also possesses proteolytic properties that enable to in situ destroy the fibrinous
formations resulting from sub-acute or chronic inflammatory processes in-situ. See
Appendix1 for the complete amino acid sequence of bovine chymotrypsin.
Trypsin and chymotrypsin are both classed as serine proteases. The tertiary structure of these
two enzymes are nearly identical, however there is a 50% difference in the primary structure.
Even though there are such similarities in the tertiary structure of these two enzymes, they
Stellenbosch University http://scholar.sun.ac.za
9
have different substrate specificities (Higaki, 1985). The position of the catalytic triad (His-
Asp-Ser) of both trypsin and chymotrypsin is located at the same position. The fact that these
enzymes are secreted as inactive zymogens is an important characteristic trait that is used
during the purification process. It is essential to maintain these enzymes in the zymogen state
during the primary processing, as activation into the active forms of the enzymes will lead to
auto activation and eventually to product loss. Activation as well as the catalytic activity of
the enzymes is pH dependant. To understand the rational for some of the processing steps
described in Chapter 3, an understanding of the mode of action of the Serine proteases is
required. The pH of the solution in which the enzyme is solubilised in will have an effect on
the catalytic activity of the enzymes. Trypsin activates trypsinogen and chymotrypsinogen
into the respective active forms of the enzyme. Trypsin does not distinguish between itself,
CTG or any other protein or peptide.
2.2 MODE OF ACTION OF THE SERINE PROTEASES
Both trypsin and chymotrypsin belong to the greater enzyme family called the serine
proteases. The name is derived from a serine residue located within the active site of the
enzyme that facilitates the catalytic mechanism of serine proteases (Outzen, 1996). Serine
proteases can hydrolyse either ester or peptide bonds (Northrop, 1948).
Serine proteases all share three amino acids within the active site, which function together to
hydrolyse a specific bond. These amino acids are Serine-195 (Ser-195), Histidine-57 (His-57)
and Aspartate-102 (Asp-102) (Keller, 1958). Peptide bond hydrolysis occurs in four steps (see
figure 1). For the reaction to occur, Ser-195 is deprotonated by His-57 converting it into a
strong nucleophile (Northrop, 1948). To prevent the His-57 from being deprotonated
immediately, the Asp-102 residue is positioned to stabilize the deprotonated His-57 (Keller,
1958).
In the first reaction, the nucleophilic oxygen in the side chain of Ser-195 attacks the
electrophilic centre (carbonyl carbon) of the substrate scissile bond, and forms a tetrahedral
intermediate. During the second reaction, the tetrahedral intermediate decomposes to form an
acyl-enzyme intermediate with the assistance of His (proton transfer to the new amino
terminus). The third reaction sees the nucleophilic attack of water (reaction occurs in an
aqueous medium) on the acyl-enzyme intermediate with assistance of His-57 and the
Stellenbosch University http://scholar.sun.ac.za
10
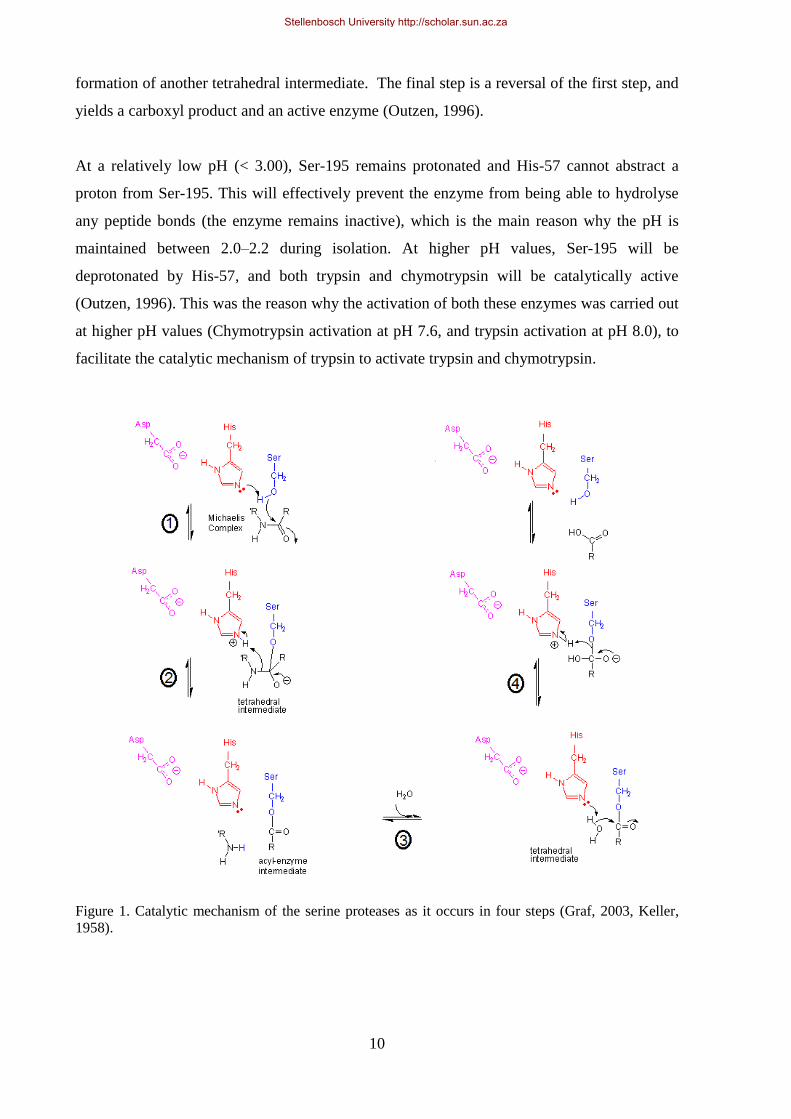
formation of another tetrahedral intermediate. The final step is a reversal of the first step, and
yields a carboxyl product and an active enzyme (Outzen, 1996).
At a relatively low pH (< 3.00), Ser-195 remains protonated and His-57 cannot abstract a
proton from Ser-195. This will effectively prevent the enzyme from being able to hydrolyse
any peptide bonds (the enzyme remains inactive), which is the main reason why the pH is
maintained between 2.0–2.2 during isolation. At higher pH values, Ser-195 will be
deprotonated by His-57, and both trypsin and chymotrypsin will be catalytically active
(Outzen, 1996). This was the reason why the activation of both these enzymes was carried out
at higher pH values (Chymotrypsin activation at pH 7.6, and trypsin activation at pH 8.0), to
facilitate the catalytic mechanism of trypsin to activate trypsin and chymotrypsin.
Figure 1. Catalytic mechanism of the serine proteases as it occurs in four steps (Graf, 2003, Keller,
1958).
Stellenbosch University http://scholar.sun.ac.za
11
With an overview of the complexity of the pancreas, and the main enzymes produced and
secreted by this complex organ, it is clear that trypsin and chymotrypsin are considered
valuable enzymes in the pharmaceutical industry, as well as having great financial importance
for BBI Enzymes in Cape Town.
Apart from the enzymes listed above, numerous other nonspecific proteins are released when
a pancreas is finely minced and extracted in a defined extraction medium. The aim of the
purification process is to eliminate as many of these nonspecific proteins and to purify trypsin
and chymotrypsin as final products. During the primary stages of the purification process, it is
essential to prevent the activation of trypsinogen, as this will lead to further activation of both
trypsin and chymotrypsin, and eventually cause autolysis and product loss.
Throughout the description of the purification processes used, the pH of the product is
emphasised. Having gained an understanding of the mode of action of the serine proteases,
the pH of the environment the enzymes are processed in would be a major contributing factor
to the success of the outcome of the process. It is clear that an acidic environment (pH<3) will
prevent any proteolytic activity which can lead to auto activation of trypsin and eventually to
product loss. Chapter 3 provides an overview of the processing steps used to eliminate the
nonspecific proteins that are present in the pancreas, and the specific techniques used to purify
chymotrypsin and trypsin as final lyophilized products.
The traditional processing methodologies used to purify trypsin and chymotrypsin was
considered time consuming and low final lyophilized product yield was achieved. To gain a
better understanding of the process used to purify trypsin and chymotrypsin, chapter 3 will
give an overview of the methods used and will elaborate on the inefficiencies observed in the
process.
Stellenbosch University http://scholar.sun.ac.za

12
CHAPTER 3
3. OVERVIEW OF THE TRADITIONAL TRYPSIN AND CHYMOTRYPSIN
PROCESSING METHODOLOGIES
The pancreas is a complex organ, and a rich source of enzymes. When the pancreas is
homogenized and extracted, multiple enzymes are released. As described in Chapter 2, the
two enzymes with the highest commercial value are trypsin and chymotrypsin. Traditional
processing methodologies used to purify these two enzymes have been used for more than 50
years at BBI Enzymes. This section will describe these processing methodologies used to
purify pancreatic proteases on an industrial scale at BBI Enzymes. Although there have been
numerous process changes from the original methodologies applied when the process was
started, the process described here was the one followed at the time of this study. This section
will only describe the production of chymotrypsinogen, chymotrypsin and trypsin. Although
deoxyribonuclease and ribonuclease are also co-purified with this method, they do not form
part of this process description.
The method described below cannot deliver the enzymes at sufficient yields for the company
to be sustainable, and was in need of review, this method differs significantly from the
original methodologies applied and which were derived from the work of Kunitz et al. (1936).
The trypsin and chymotrypsin processes are divided into primary and secondary purification
processes. The primary processing of both enzymes is identical, and consists of a sulphuric
acid extraction followed by a series of ammonium sulphate (A/S) precipitation steps. The
purpose of the A/S precipitations is to 1) selectively remove nonspecific proteins and 2) to
selectively precipitate the two zymogens. The zymogen precipitate generated during the
primary processing is transferred to the secondary processing. Two different processes are
described for the secondary processing of trypsin and chymotrypsin (see figure 2). The onset
of the secondary processing is marked by the separation of the two zymogens during a
crystallization of chymotrypsinogen (referred to as the zymogen separation).
Chymotrypsin and trypsin are purified separately. During the CTG purification, the CTG
crystals obtained during the zymogen separation are washed, dissolved and prepared for
lyophilisation. The Chymotrypsin purification process is similar to the CTG purification
process, but includes a chymotrypsin activation stage prior to the product being lyophilised.
Stellenbosch University http://scholar.sun.ac.za
13
Bovine Pancreas Extraction
Extract
700Kg Beef Pancreas into 1000L ext bufferTop up to 2000L using tap waterEXTRACTION BUFFER: 3L Conc H2SO4
1.2 Kg CaCl2
Dunking until 17:00 - Stop dunking for O/N extraction in liquid.(NO DUNKING)Next morning - start dunking for 1.5 hours
0/20 precipitationFilter through filter press, and Discard ppt together with remaining solids
20/40 precipitation
FILTRATE± 3000L
DNAse PPT is dissolved and Dialysed
FILTRATE± 3300L
PRECIPITATE
40/65 precipitation
PRECIPITATE
FILTRATE± 3500L 65/80 Precipitation RNAse Final product
- Dissolve 100 Kg ppt in 75L Water (1,33 : 1)- Dilute with 35% Ammo if native Trypsin is high
- a 35% A/S solution- pH of dissolved ppt Adjusted to ± 2.3
Zymogen Split- Ajust pH to 5.2- Heat to 25oC- Stir slowly (48h)
Chymotrypsinogen
CRYSTALS
Trypsinogen
S/N
Active Trypsin
ACTIVATION
Wash and RE-dissolve crystals
Re-Crystalization
Filter Chymotrypsinogen crystals
CHYMOTRYPSINOGEN
FREEZE DRY
CHYMOTRYPSIN
ἀ-Chymo / Trypsin1300 - 1500U/mg / 250 U/mg
FREEZE DRY
Concentrate &
Activate
Dialyse / Diafilter
Dialyse / Diafilter
Precipitate 35/70
Crystalize Trypsin
Filter crystals
Recovery Mother Liquir
TRYPSIN CRYSTALS
Trypsin / Chymo3000U/mg / <250 U/mg
Diafilter /Dialyse
Freeze Dry
TRYPSIN
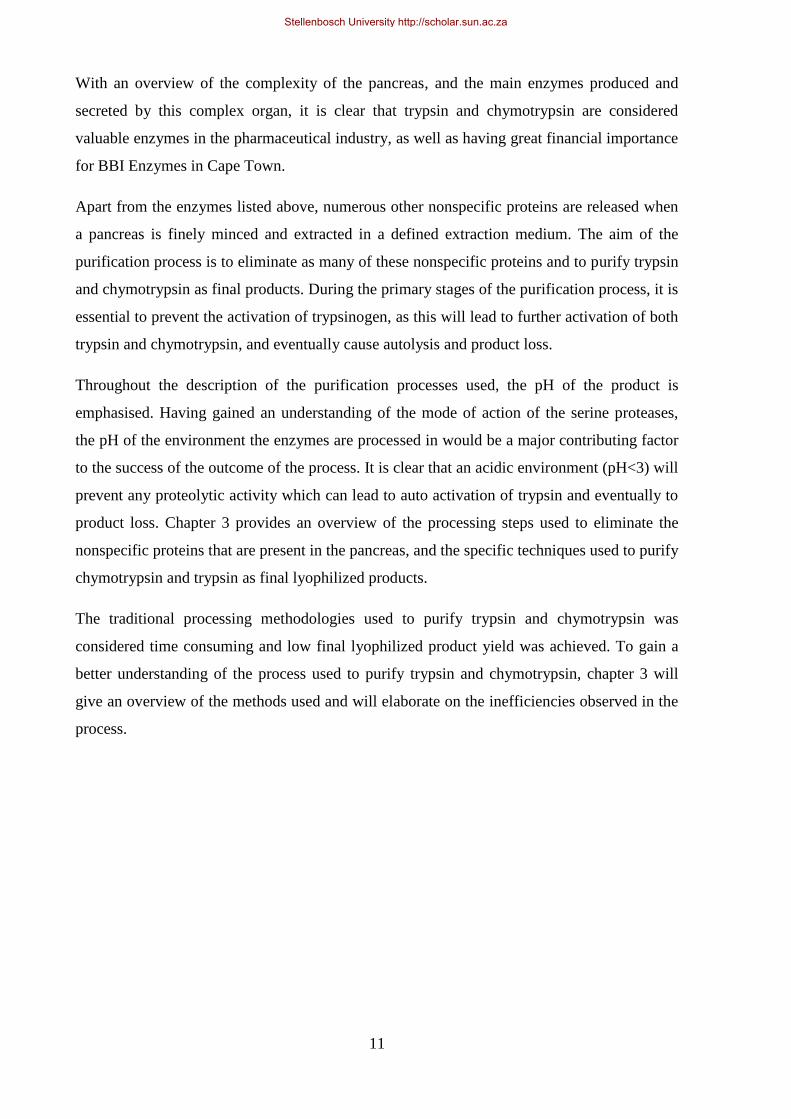
Trypsin purification starts with the supernatant of the zymogen separation. The trypsin is
activated and subsequently crystallized to obtain pure trypsin crystals. The trypsin crystals are
dissolved and prepared for lyophilisation. Figure 2 is a flowchart that illustrates the
processing of the pancreatic enzymes. There is no difference in the primary processing of
trypsin and chymotrypsin, but different purification methods for these two enzymes are
described.
Figure 2. Flowchart of the entire traditional extraction and purification process for chymotrypsin, CTG
and trypsin. The primary processing of both enzymes is similar. The two different processes for the
purification of trypsin and chymotrypsin(ogen) are indicated.
Stellenbosch University http://scholar.sun.ac.za

14
3.1 PRIMARY PROCESSING
Deep frozen acid dipped bovine pancreas were semi thawed overnight. Semi-thawed blocks
(20 kg) were flaked into baskets which were submerged into an acidic (acidified with H2SO4)
extraction medium containing 1000 L water (37oC) and CaCl2 (1.2 g/l). The flaker is a
machine that cuts the frozen pancreas into flakes 2-20 mm thick (see figure 3). The flaker
used a hydraulic arm that forced a block of frozen pancreas into a rotating blade that shaved
off flakes of pancreas that fell into big perforated baskets submerged into the extraction
medium. The pH of the extraction medium was adjusted to between 1.8 and 2.2 using
concentrated H2SO4.
Figure 3: Frozen blocks of beef pancreas lined up to be flaked into the perforated basket submerged in
extraction medium. The frozen block is forced into a rotating blade that slices the pancreas into flakes.
The baskets were repeatedly submerged into the extraction medium for 3 hours with a crane
mounted on a platform adjacent to the tanks, and then completely submerged in the extraction
medium for a 16-hour static extraction. At the end of the extraction period (16 hours), the
baskets were removed from the extraction medium (see figure 4) and the extraction medium
was pumped to a holding tank, where the tissue was re-extracted in fresh extraction buffer by
continuously submerging the basket containing the tissue into the fresh extraction buffer for a
further 30 – 60 minutes.
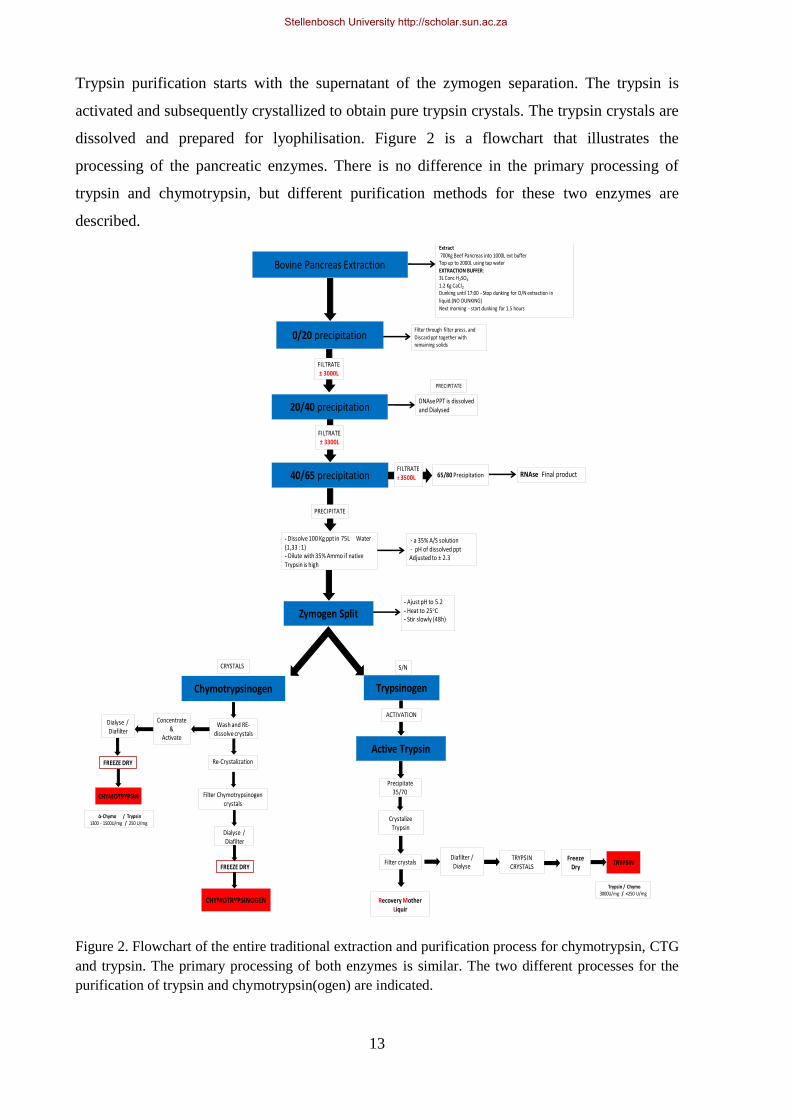
Stellenbosch University http://scholar.sun.ac.za
15
Figure 4. Perforated basket filled with tissue debris after submersion in extraction medium for 16
hours. This basket is submerged into the extraction medium with a hydraulic arm.
At BBI Enzymes, the A/S concentration of a solution is expressed as percentage saturation.
Percentage saturation is calculated as described by Dawson et al (1989). A/S precipitation
tables were used to determine the amount of solid A/S to add to a defined volume of liquid to
obtain the desired final % A/S saturation. From the A/S precipitation table, the desired % A/S
saturation corresponds to a certain amount of solid A/S to be added to the liquid. When a %
A/S is quoted, it is referring to the % saturation of that product. To achieve a 20% saturated
A/S solution, solid A/S (114 g/l) was added to the extract, and stirred until all the A/S had
dissolved.
There is specific terminology used at BBI Enzymes to describe the different stages of A/S
precipitation. The precipitate formed when the % A/S saturation of an extract (containing no
A/S) is raised to 20% is referred to as a 0/20 precipitate. This implies that the % A/S
saturation was increased from 0% to 20%. Typically, the precipitate formed during that
specific precipitation stage would be removed, and the clear supernatant (containing 20%
A/S) will be further processed.
After re-extraction, the tissue debris was discarded as solid waste, and the liquid phase of the
re-extract was used as the extraction medium for the next batch.
The liquid from the extracts was then transferred to a holding tank where it would be
precipitated with 20% ammonium sulphate. When all the salt was dissolved and the 20%
saturation point had been achieved, the pH of the solution was adjusted back to 1.8 – 2.2
Stellenbosch University http://scholar.sun.ac.za
16
using 2.5M H2SO4, as there was an increase in pH because of the A/S addition. A/S
dissociates in water to form ammonium and sulphates. The ammonium is primarily
responsible for the increase in pH observed. This increase in pH after A/S addition was
observed with every precipitation step during the primary processing, and the pH of the
extract was subsequently adjusted to 1.8 – 2.2. As described in section 2.2, this was
performed to prevent the auto activation of trypsin during the primary purification stages.
The proteins that precipitated at 20% A/S were removed by depth filtration using
diatomaceous earth as a filtration medium in a filter press. The clear supernatant was
transferred to a holding tank where it was further precipitated with A/S. The solid waste and
20% protein precipitate, removed by the filter press, was discarded as solid waste.
The A/S concentration of the liquid was further raised to 40% saturation by the addition of
solid A/S (123 g/L) to the clear supernatant. During this step, deoxyribonuclease is
precipitated (referred to as the 20/40 precipitate). This precipitate was removed by draining
the tanks onto large filters colloquially called “coffin filters” where the precipitate was
retained on a filter bed under vacuum. Coffin filters are used very successfully to separate
precipitate from the supernatant (see figure 5). A thin filter bed of diatomaceous earth was
prepared on filter paper lining the bottom of the filter. A vacuum was applied to the sump of
the filter, drawing the liquid through the filter bed, and retaining the precipitate on the filter
bed.
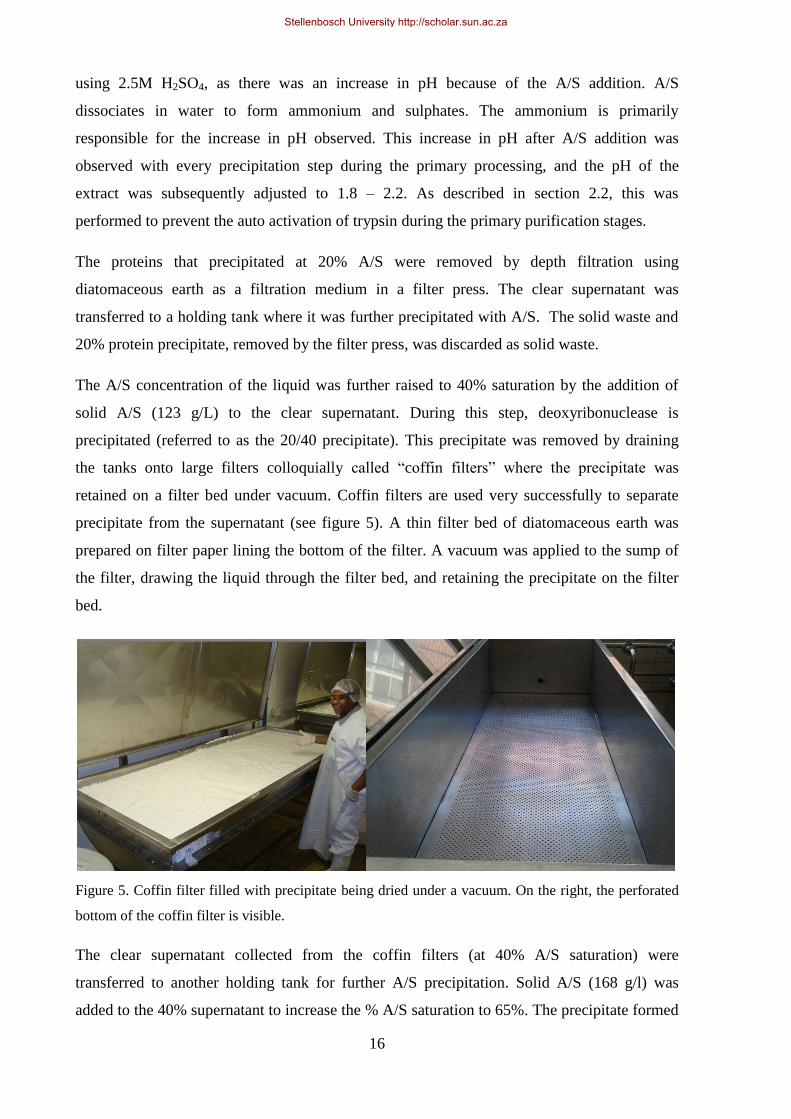
Figure 5. Coffin filter filled with precipitate being dried under a vacuum. On the right, the perforated
bottom of the coffin filter is visible.
The clear supernatant collected from the coffin filters (at 40% A/S saturation) were
transferred to another holding tank for further A/S precipitation. Solid A/S (168 g/l) was
added to the 40% supernatant to increase the % A/S saturation to 65%. The precipitate formed
Stellenbosch University http://scholar.sun.ac.za
17
with this precipitation step (referred to as the 40/65 precipitate) contains the proteases,
trypsinogen and CTG. The precipitate was removed by draining the tanks onto coffin filters
where the precipitate was filtered and dried under vacuum as described above for further
processing to purify trypsinogen and CTG. The 40/65 precipitate was collected and stored in a
freezer (at -20oC) until further processing was required. This step marked the end of the
primary processing stages. The supernatant was collected and further processed to purify
ribonuclease.
3.2 SECONDARY PROCESSING
At the start of the secondary processing, the enzymes (trypsinogen and CTG) are both still
present as zymogens as the conditions of the primary processing were designed to prevent the
activation of trypsin that would lead to the rapid activation of both trypsinogen and CTG. If
the pH and temperature during the primary processing was not properly controlled, and
allowed to exceed the limits specified in the Master Batch Records (MBR‟s), conditions
would be favourable for trypsinogen activation, and the native trypsin activity in the final
40/65 precipitate would be very high, which would affect the secondary processing. If the
native trypsin activity of the dissolved 40/65 precipitate was >300 U/ml, CTG would not
crystallize, as the majority of the CTG would be converted to chymotrypsin, and could not be
separated from trypsin(ogen) under the specified conditions. The traditional practice applied
to reduce the trypsin specific activity was to dilute the trypsin with a 35% saturated A/S
solution to reduce the trypsin activity to < 300 U/ml.
To separate the zymogens from each other, CTG was selectively crystallized out of solution
during a process referred to at BBI Enzymes as the “Zymogen separation”. The 40/65
precipitate was dissolved in 0.75 times (m/v) potable water (1 Kg precipitate – 750 ml water)
to achieve a final % A/S saturation of 35%. The dissolved precipitate was transferred into a
temperature-controlled vessel where CTG would undergo crystallization (see figure 6). The
pH of the suspension was raised to 5.2 using NaOH, and the temperature adjusted to 25oC by
an element that was fixed to the bottom of the incubation vessel.
Stellenbosch University http://scholar.sun.ac.za
18
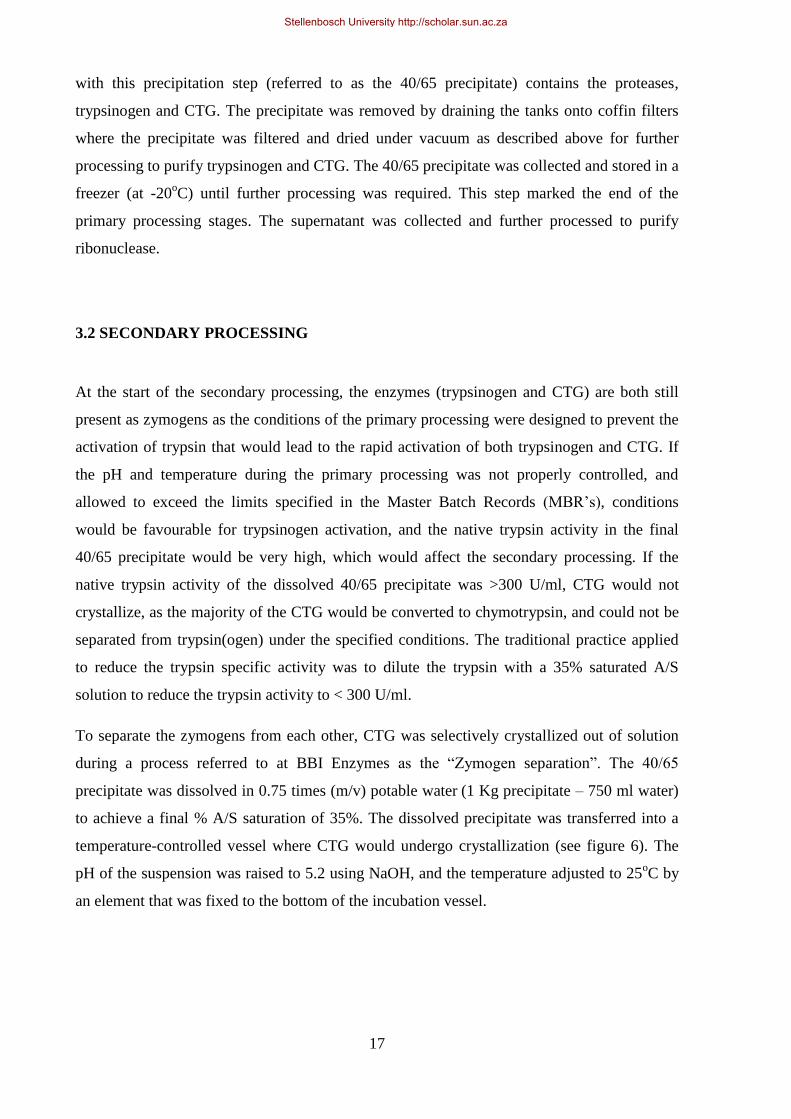
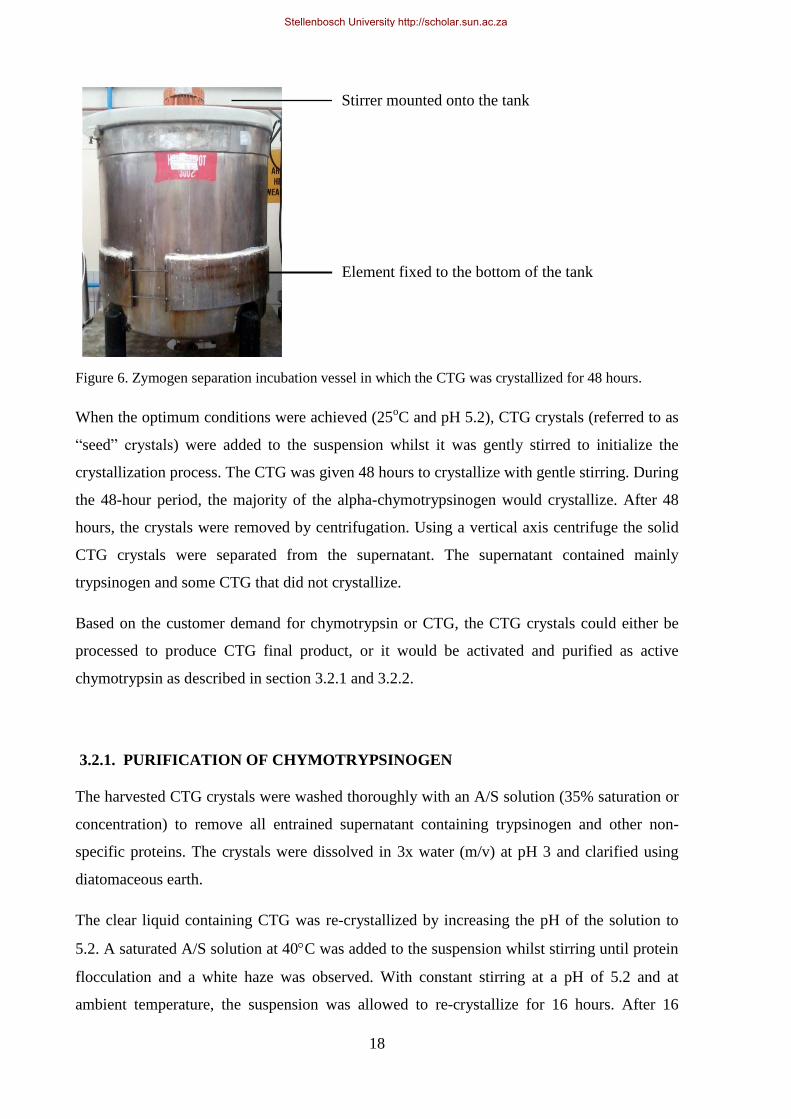
Figure 6. Zymogen separation incubation vessel in which the CTG was crystallized for 48 hours.
When the optimum conditions were achieved (25oC and pH 5.2), CTG crystals (referred to as
“seed” crystals) were added to the suspension whilst it was gently stirred to initialize the
crystallization process. The CTG was given 48 hours to crystallize with gentle stirring. During
the 48-hour period, the majority of the alpha-chymotrypsinogen would crystallize. After 48
hours, the crystals were removed by centrifugation. Using a vertical axis centrifuge the solid
CTG crystals were separated from the supernatant. The supernatant contained mainly
trypsinogen and some CTG that did not crystallize.
Based on the customer demand for chymotrypsin or CTG, the CTG crystals could either be
processed to produce CTG final product, or it would be activated and purified as active
chymotrypsin as described in section 3.2.1 and 3.2.2.
3.2.1. PURIFICATION OF CHYMOTRYPSINOGEN
The harvested CTG crystals were washed thoroughly with an A/S solution (35% saturation or
concentration) to remove all entrained supernatant containing trypsinogen and other non-
specific proteins. The crystals were dissolved in 3x water (m/v) at pH 3 and clarified using
diatomaceous earth.
The clear liquid containing CTG was re-crystallized by increasing the pH of the solution to
5.2. A saturated A/S solution at 40C was added to the suspension whilst stirring until protein
flocculation and a white haze was observed. With constant stirring at a pH of 5.2 and at
ambient temperature, the suspension was allowed to re-crystallize for 16 hours. After 16
Element fixed to the bottom of the tank
Stirrer mounted onto the tank
Stellenbosch University http://scholar.sun.ac.za
19
hours, the crystals were harvested by filtration. The harvested crystals were washed with a
35% saturated A/S solution to remove any non-specific proteins entrained between the
crystals.
CTG crystals were dissolved in water and dialysed until salt free in MC 110 dialysis tubing
against acidified tap water (pH 2.0, acidified with 1M H2SO4) in a cold room (2 – 8 oC). The
salt free solution was clarified and prepared for lyophilisation.
3.2.2. PURIFICATION OF CHYMOTRYPSIN
The harvested CTG crystals were washed thoroughly with 35% A/S to remove all entrained
supernatant containing trypsinogen and other non-specific proteins. The crystals were
dissolved in water and clarified using diatomaceous earth.
CTG was activated by adding 26.1 g/L of K2HPO4 to the clarified liquid, and raising the pH to
7.6. The activation of CTG was reliant on native trypsin present in the mixture. If the native
trypsin activity in the solution was < 300 U/ml, lyophilized trypsin was added to the solution to
initialize the chymotrypsin activation process. The chymotrypsin activity was monitored over a
4 – 6 hour period, and was assayed every hour. The completion of the chymotrypsin activation
was marked by a plateau or decline in the specific activity of chymotrypsin (>750 U/A280). The
pH of the solution was subsequently lowered to 3.0 by the addition of 0.5M H2SO4 to terminate
the activation.
The solution was immediately precipitated with 70% A/S by the addition of 472 g/L solid A/S.
All chymotrypsin was precipitated at 70% Ammonium Sulphate. The precipitate was collected
on a coffin filter under a vacuum, dissolved in water and dialysed against acidified tap water
(pH 2.0, acidified with 1 M H2SO4) for 3 days until salt free. The salt free solution was clarified
using diatomaceous earth and prepared for lyophilisation.
It is important to note that at BBI Enzymes, the protein content of a solution was determined
as the absorbance of the solution at 280 nm using a spectrophotometer (referred to as an A280).
Although this was not an absolute protein concentration determination, it was used as a quick
convenient reference (Smith, 1985) are too time consuming, and could not be used as an in-
process measurement of total protein. Unless otherwise specified, protein concentration was
always expressed as A280.
Stellenbosch University http://scholar.sun.ac.za
20
Protein concentration is expressed as A280. To determine the protein concentration of a
solution, the sample is appropriately diluted to obtain an absorbance reading at 280 nm of
0.8 – 1.2 over a 1cm light path. This absorbance reading is multiplied by the dilution factor to
obtain the A280 units for the solution. To determine the total amount of protein or total A280 of
the solution, the A280 value is multiplied by the total volume of the solution. The term U/A280
describes the specific activity of an enzyme preparation. This is calculated as the U/ml of the
solution divided by the A280 of the solution.
3.2.3. PURIFICATION OF TRYPSIN
Two grades of trypsin can be purified during the secondary purification stages, but only one
of the two can be prepared from any single batch processed, both grades could not be
prepared simultaneously. The first was a product that contained both trypsin and
chymotrypsin in a ratio of trypsin: chymotrypsin of 6:1. A purer grade of trypsin could also
be prepared which involved further processing that contains less than 1% chymotrypsin and a
trypsin specific activity of >3000 U/mg. This study will only focus on the preparation of purer
grade of trypsin with a specific activity of >3000 U/mg.
After the CTG crystals were harvested and washed with a 35% saturated A/S solution, the
supernatant of the zymogen separation and the washings of the crystals were combined and
further processed to purify trypsin. 2.42 g/L tris(hydroxymethyl)aminomethane (TRIS) (0.02
M) and 2.94 g/L CaCl2 (0.02M) was added to the trypsinogen containing solution in
preparation for trypsin activation.
While stirring, the pH of the trypsinogen liquid was slowly raised to 8.0 with 1M NaOH to
initialize the trypsin activation at 5oC. The liquid was continually assayed for trypsin activity
to monitor the activation sequence. If the starting trypsin activity was <100 U/ml, 100 g of
lyophilized trypsin (3000U/mg) was added to the stirring liquid. The activation was monitored
hourly (assayed for trypsin activity (U/ml) and A280), to monitor the increase in the trypsin
specific activity. The activation was completed when the trypsin activity (U/ml) reached a
plateau and the specific activity (U/A280) of trypsin was between 900 to 1000.
The activation was terminated by lowering the pH of the activation mixture to 3.0 with 2.5M
H2SO4 followed by immediate A/S precipitation by increasing the A/S saturation to 75% by
adding solid A/S (278 g/L) to the liquid. The precipitate was removed by filtration using a
coffin filter. This precipitate is referred to as the 35/75 precipitate, indicating this is the
Stellenbosch University http://scholar.sun.ac.za
21
precipitate that formed when the % A/S saturation of the material after the activation was
increased to 75%.
In preparation for trypsin crystallization, the 35/75 precipitate was dissolved in 0.4 M borate
buffer at a pH of 9.0 in a cold room (8oC). The trypsin was left to crystallize at 2-8
oC for 7
days whilst gently stirring the liquid. After the 7th
day, the trypsin crystals were harvested by
filtration on a coffin filter. The crystals were washed with 0.4 M borate buffer, 35% A/S, pH 9
to remove any entrained proteins. After the crystals were thoroughly washed, they were
dissolved in reverse osmosis water (RO water) at pH 3 (acidified with H2SO4). The liquid was
either diafiltered or dialyzed until salt free and prepared for lyophilisation.
The supernatant of the trypsin crystallization and the washings of the crystals were combined
and referred to as Recovery Mother Liquor (RML). This liquid contained any un-crystallized
Trypsin and any chymotrypsin that carried through from the CTG crystallization. The RML
was precipitated with 70% A/S and stored in the freezer at -20oC.
The processes described in section 3.2.1 – 3.2.3 was capable of producing high quality final
products, however, the yields (expressed as kilograms of final product produced per ton of
raw material input) achieved were extremely low. This was as a result of some inefficient
proceeding steps, and methodologies that were applied. These shortcomings of the traditional
processing methods are described in section 3.3.
3.3 SHORTCOMINGS OF THE TRADITIONAL PROCESSING METHODOLOGIES
Although the traditional processing methodologies were based on the original work of Kunitz
et al. (1936) there have been many changes to the original process, leading to a process that
was not properly controlled and could not consistently deliver high quality product at high
yields. Following an process overview, and investigating every step of the process, it was
possible to specify which processing steps could be improved.
Stellenbosch University http://scholar.sun.ac.za
22
3.3.1. EXTRACTION
The first major processing inefficiency observed was the extraction process of the bovine
pancreas. The mechanism of tissue maceration was executed by means of forcing flozen
blocks of tissue through a rotating cutter that shaves off flakes of tissue which fell directly
into the extraction medium. Observing the efficiency of the maceration of the Flaker, it was
clear that there were still large pieces of intact pancreas present at the end of the extraction
process. This indicated that the efficiency of maceration of the pancreas was not optimal, and
the flaker could not deliver a consistent output (particle size of the macerated tissue). The
second observation was that the flaking process was extremely time consuming. To flake 1.4
tonnes of pancreas took approximately 1 – 2 hours. This allowed additional time for pancreas
to thaw, and pancreatic juice containing valuable enzymes was lost.
The 16 hour static extraction also did not allow for the proper extraction of all the enzymes.
This was revealed by A280 spectophotometric measurements1 when the protein concentration
of an extract sample was compared to the protein concentration of different extraction
methods, see section 4.1.
There was inconsistent exposure of the tissue to the extraction medium throughout the basket
and as a result the enzymes could not be extracted efficiently. This problem was identified by
inspecting the appearance of the tissue at the centre of the basket post extraction. Pancreas
that had been in contact with the acidified extraction medium had a pale light brown colour,
whilst pancreas that have not been exposed to acid had a light pink colour (see figure 7). The
majority of the tissue found at the centre of the basket was light pink in colour. The
macerated pancreas, after being exposed to acidic medium, formed strings of tissue and fat.
This stringy tissue caused the perforations in the baskets to block and did not allow for proper
flow of extraction medium into and out of the basket and through the flaked pancreas.
1 See note on page 19 for the calculation of the total protein content of a solution my means of
measuring absorbance at 280 nm.
Stellenbosch University http://scholar.sun.ac.za
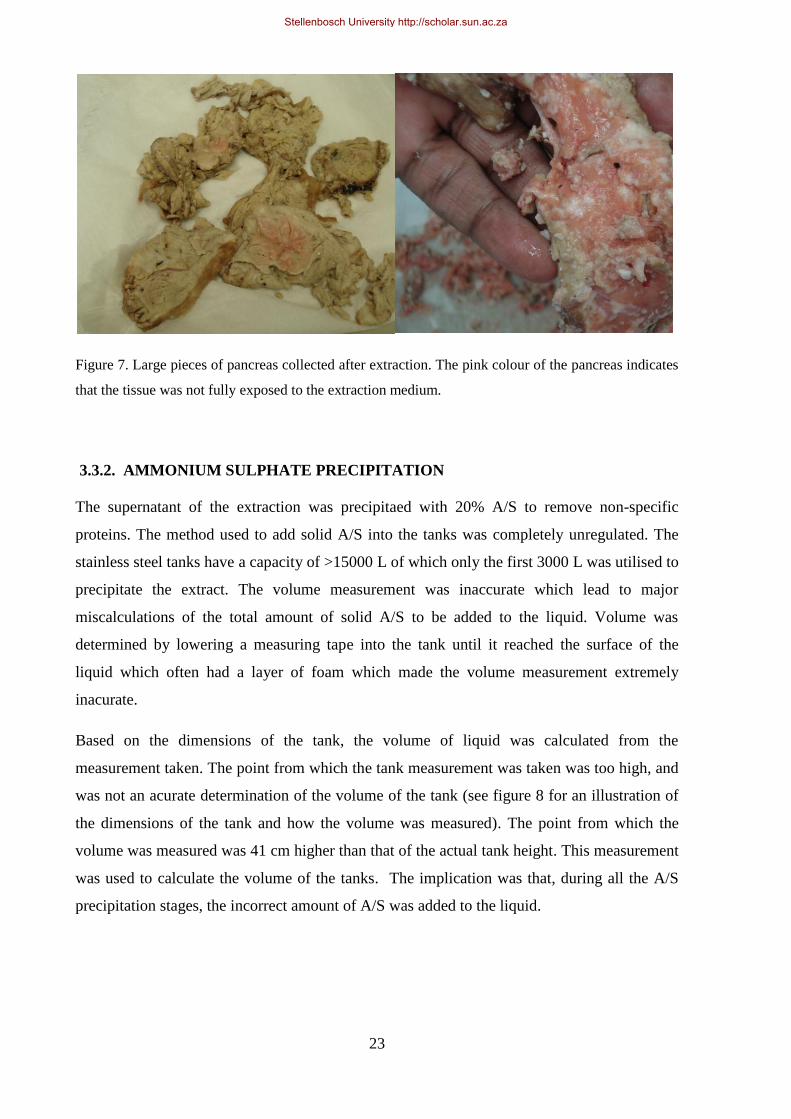
23
Figure 7. Large pieces of pancreas collected after extraction. The pink colour of the pancreas indicates
that the tissue was not fully exposed to the extraction medium.
3.3.2. AMMONIUM SULPHATE PRECIPITATION
The supernatant of the extraction was precipitaed with 20% A/S to remove non-specific
proteins. The method used to add solid A/S into the tanks was completely unregulated. The
stainless steel tanks have a capacity of >15000 L of which only the first 3000 L was utilised to
precipitate the extract. The volume measurement was inaccurate which lead to major
miscalculations of the total amount of solid A/S to be added to the liquid. Volume was
determined by lowering a measuring tape into the tank until it reached the surface of the
liquid which often had a layer of foam which made the volume measurement extremely
inacurate.
Based on the dimensions of the tank, the volume of liquid was calculated from the
measurement taken. The point from which the tank measurement was taken was too high, and
was not an acurate determination of the volume of the tank (see figure 8 for an illustration of
the dimensions of the tank and how the volume was measured). The point from which the
volume was measured was 41 cm higher than that of the actual tank height. This measurement
was used to calculate the volume of the tanks. The implication was that, during all the A/S
precipitation stages, the incorrect amount of A/S was added to the liquid.
Stellenbosch University http://scholar.sun.ac.za
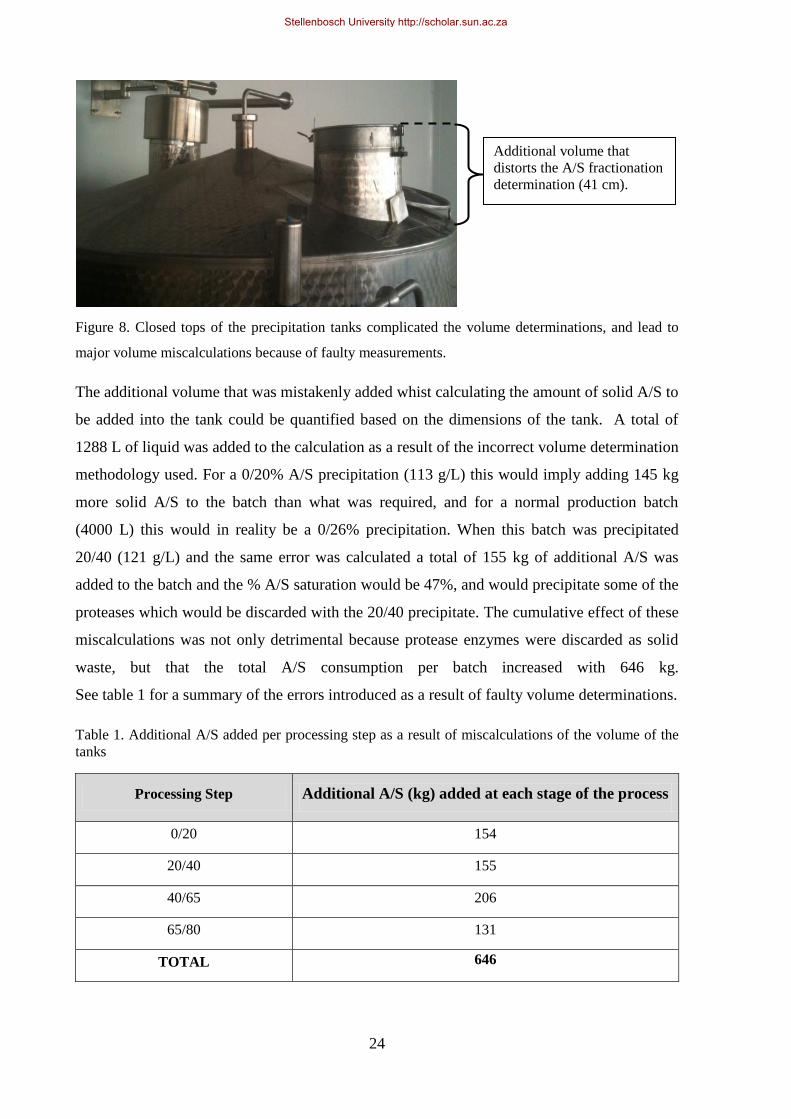
24
Figure 8. Closed tops of the precipitation tanks complicated the volume determinations, and lead to
major volume miscalculations because of faulty measurements.
The additional volume that was mistakenly added whist calculating the amount of solid A/S to
be added into the tank could be quantified based on the dimensions of the tank. A total of
1288 L of liquid was added to the calculation as a result of the incorrect volume determination
methodology used. For a 0/20% A/S precipitation (113 g/L) this would imply adding 145 kg
more solid A/S to the batch than what was required, and for a normal production batch
(4000 L) this would in reality be a 0/26% precipitation. When this batch was precipitated
20/40 (121 g/L) and the same error was calculated a total of 155 kg of additional A/S was
added to the batch and the % A/S saturation would be 47%, and would precipitate some of the
proteases which would be discarded with the 20/40 precipitate. The cumulative effect of these
miscalculations was not only detrimental because protease enzymes were discarded as solid
waste, but that the total A/S consumption per batch increased with 646 kg.
See table 1 for a summary of the errors introduced as a result of faulty volume determinations.
Table 1. Additional A/S added per processing step as a result of miscalculations of the volume of the
tanks
Processing Step Additional A/S (kg) added at each stage of the process
0/20 154
20/40 155
40/65 206
65/80 131
TOTAL 646
Additional volume that
distorts the A/S fractionation
determination (41 cm).
Stellenbosch University http://scholar.sun.ac.za
25
CTG precipitate at 40% A/S saturation. This is evident from figure 9 lane 7 when a DNase
sample was loaded. The protein band visible at 25 kDa corresponds to the molecular weight
of the proteases. This would imply that more proteases would precipitate when the % A/S
saturation was raised higher than 40% as a result of volume miscalculations. All subsequent
precipitation stages were not accurately executed, as a result of the miscalculation of the
volume of the tanks.
The rate at which solid A/S was added to the product also lead to process instability. When
adding A/S in large quantities into a stirring tank with liquid product, it was importaint not to
add the solid A/S too rapidly, as this caused an accumulation of solid A/S at the bottom of the
tank, and lead to local supersaturation at the bottom of the tank which in turn leads to an
accumulation of non-specific precipitation of proteins at the bottom of the tank.
After A/S precipitation, when the liquid was transferred onto the coffin filters to remove the
precipitate, solid A/S crystals were often found that had not dissolved. This implied that A/S
precipitation was not accurately carried out, and the % A/S saturation was not homogenous
throughout the tank. This lead to incomplete precipitation of certain proteins and precipitation
of unwanted proteins resulting in major batch to batch process variation.
3.3.3. pH MEASUREMENT
The pH of the extract during the entire primary processing stage was maintained between 1.9
– 2.2. This was to prevent trypsin activation (see section 2.2). This could have had a direct
impact on the yield of any production batch because of the proteolytic action of trypsin. As
trypsin and chymotrypsin are both unstable at a pH < 1.6, this would imply that the lower pH
limit of the process was too close to the pH at which the enzymes could be destabilized
(Outzen, 1996).
Operators would sometimes overcompensate while adjusting the pH of a solution, or pH
meter calibrations were not carried out properly, which often lead to observed pH values well
below 1.6, severely compromising the stability of the proteins.
The liquid product, as it was processed during the primary processing, had a high fat content,
and often contained small tissue debris particles. The pH probes used on the factory floor
often got blocked or coated in a layer of fat. The pH probes were never properly cleaned with
Stellenbosch University http://scholar.sun.ac.za
26
a pepsin solution to remove any proteins that coated the probe. This lead to major variation in
the pH measured throughout the process.
3.3.4. CHYMOTRYPSINOGEN CRYSTALLIZATION (ZYMOGEN SEPARATION)
Inefficiencies observed at this stage were related to the way in which heat was applied to the
tanks to regulate the temperature. An element, linked to a temperature control unit, was
mounted in the bottom of the tank. The control unit could switch the element on when the
core temperature of the liquid was below 25oC, and off when the core temperature of the
liquid was above 25oC. Being an element, this strip would get extremely hot (>70
oC), and
burned the product that got into direct contact with it. This was identified by a visible strip of
protein / crystals that got burnt to the walls of the tank where the element was in contact with
the tank (see figure 6).
During the CTG crystallization process, the protein content of the supernatant was
continously reduced as a result of CTG crystal formation. This had a major effect on the
efficiency of the zymogen separation, as the crystallization process was dependent on protein
concentraion (Garcia-Ruez, 2003). The two day crystallization procedure did not compensate
for the major decline in the protein content of the supernatant and as a result CTG
crystallization efficiency was significantly reduced.
The second CTG crystallization step had no benefit for the production of CTG (with regards
to yield specifically). The purpose of the step was to further purify the CTG and to remove
any contaminating trypsin and non-specific proteins found in the supernatant of the first
zymogen separation. The conditions for this crystallization were, however, also not optimal
for CTG crystallization and an overnight crystallization was insufficient to crystallize all the
CTG present. Major losses were observed during this processing step with no real gain in
enzyme purity.
3.3.5. TRYPSIN CRYSTALLIZATION
Trypsin was allowed to crystallize for 7 days. Before the onset of the crystallization the total
amont of trypsin was quantified by testing the trypsin activity and expressed as millions of
units (MU‟s) of trypsin. The total trypsin at the onset of crystallization could be used to
determine the efficiency of the crystallization process. This was calculated by quantifying the
Stellenbosch University http://scholar.sun.ac.za
27
total activity recovered when the trypsin crystals were resuspended divided by the total
trypsin content at the onset of the crystallization. Alternatively, the total trypsin content of the
supernatant was determined which gave an indication of the total amount of trypsin that did
not crystallize during the 7 day crystallization step. The inefficiency of the seven day
crystallization process was clearly illustrated when the total trypsin content of the supernatant
post trypsin crystallization (referred to as the recovery mother liqor or RML) was taken into
consideration. Up to 50% of the total trypsin was found present in the RML as a result of
inefficient crystallization conditions. The conditions did not allow for proper crystallization of
trypsin, and the long time period allowed for crystallization also allowed for autolysis of
trypsin (indicated by the loss of total trypsin content before and after this crystallization step).
Protein crystallization is dependant on the protein concentration of the material
(Chayen, 2004). During the crystallization process, the protein content of the supernatant
continously decreased as solubilised proteins were converted to protein crystals
(Garcia-Ruez, 2003). This implied that the efficiency of the crystallization process decreased
as the process continued. The decreasing protein concentration was not being accounted for,
and was considered an area for improvement.
Although the products that were produced when the traditional processing methods were
executed conformed to the final product specifications, these methods did not consistently
deliver product at a yield that was profitable. The products produced by the traditional
methods were analysed and characterized to set a benchmark for the quality of the products.
The products produced by the improved process needed to be equal to or of a higher quality
than those being produced by the traditional methods.
Stellenbosch University http://scholar.sun.ac.za
28
3.4 CHARACTERIZATION OF PRODUCTS PRODUCED BY TRADITIONAL
PROCESSING METHODOLOGIES
The products produced during the traditional processing methods were characterized by
Sodium dodecyl sulphate Polyacrylamide gel electrophoresis (SDS PAGE) analysis and a
variety of assay methods used in BBI Enzymes Cape Town to assess compliance to the
specifications (see tables 2 and 3). The SDS PAGE gave an indication of the purity of the
products, and was used to confirm that inefficiency of the A/S precipitation described in
section 3.3.2. (This is visible when inspecting the final deoxyribonuclease sample analyses in
lane 7 of figure 9). A clear protease band (corresponding to the molecular weight of
chymotrypsin) is visible at approximately 25 kDa. Deoxyribonuclease is purified from the
20/40 precipitate, which contained a large amount of protease enzymes. Final lyophilized
products were used for this analysis. The trypsin and chymotrypsin samples were compared to
that of an industrial standard, Sigma (Sigma life sciences, St. Louis, USA).
For all SDS PAGE analysis during this study, the following materials and methods were used.
The samples were prepared (10 mg/ml) in deionised water and diluted 1:1 with sample buffer
(Bio-Rad, Hercules, USA, product # 161-0737) containing β mercapthoethanol. Samples
were further denatured by heating for 5 minutes at 100oC prior to loading onto the gel.
10 well 4 – 20% precast gels (Thermo scientific, Rockford, USA, product # 25204) were
used for SDS PAGE analysis. Tris-HEPES-SDS Running buffer (Thermo scientific,
Rockford, USA, prod # 28398) was used as the electrophoresis buffer. A broad protein
molecular weight marker (Takara, 3-4-1, Otsu, Shiga 520-2193, Japan, product # 3452) was
used for the analysis. Samples were loaded at 5 µg/ml, and the gel was run for 3 hours at
21 mV. The gel was stained using Gelcode blue safe protein stain (Thermo scientific,
Rockford, USA, product # 1860957) for 1 hour, and de-stained with deionised water for 16
hours.
Stellenbosch University http://scholar.sun.ac.za

29
Figure 9: SDS PAGE analysis of all the products produced by the traditional processing
method, trypsin and chymotrypsin as compared to an industrial standard (Sigma). All samples
were prepared as 10 mg/ml protein, and 8 µl of sample was loaded per well. Lane 1:
Molecular weight marker, Lane 2: BBI trypsin, Lane 3: Sigma trypsin, Lane 4: BBI
chymotrypsin, Lane 5: Sigma chymotrypsin, Lane 6: BBI ribonuclease, Lane 7: BBI
deoxyribonuclease, Lane 8: Molecular weight marker.
The final product is released after testing according to a customer specification. The tests used
to qualify the products are listed as appendices at the end of the document. The trypsin and
chymotrypsin, prepared by the traditional methodologies, complied with the specifications.
These were again used to set a benchmark for the products to be produced by the newly
developed method.
1 2 3 4 5 6 7 8
DNase
Trypsin
Chymotrypsin
RNase
Stellenbosch University http://scholar.sun.ac.za
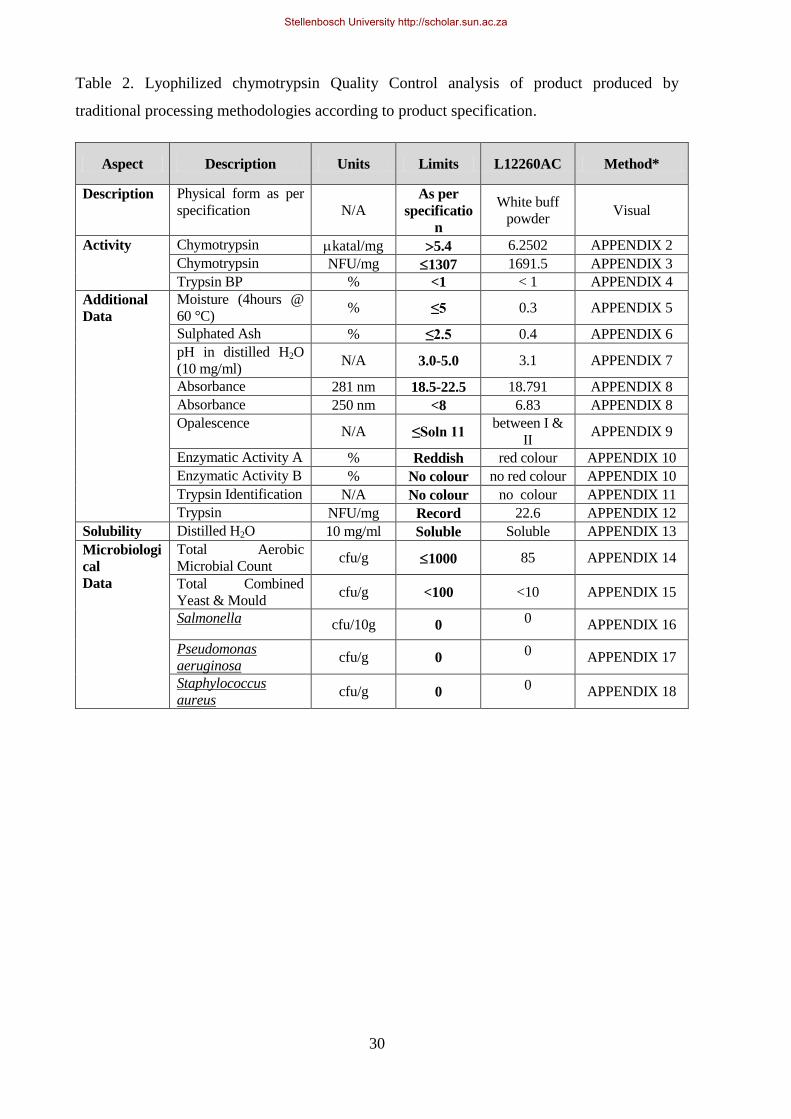
30
Table 2. Lyophilized chymotrypsin Quality Control analysis of product produced by
traditional processing methodologies according to product specification.
Aspect Description Units Limits L12260AC Method*
Description Physical form as per
specification N/A As per
specificatio
n
White buff
powder Visual
Activity Chymotrypsin katal/mg 5.4 6.2502 APPENDIX 2
Chymotrypsin NFU/mg 1307 1691.5 APPENDIX 3
Trypsin BP % <1 < 1 APPENDIX 4
Additional
Data
Moisture (4hours @
60 °C) % ≤5 0.3 APPENDIX 5
Sulphated Ash % ≤2.5 0.4 APPENDIX 6
pH in distilled H2O
(10 mg/ml) N/A 3.0-5.0 3.1 APPENDIX 7
Absorbance 281 nm 18.5-22.5 18.791 APPENDIX 8
Absorbance 250 nm <8 6.83 APPENDIX 8
Opalescence N/A ≤Soln 11
between I &
II APPENDIX 9
Enzymatic Activity A % Reddish red colour APPENDIX 10
Enzymatic Activity B % No colour no red colour APPENDIX 10
Trypsin Identification N/A No colour no colour APPENDIX 11
Trypsin NFU/mg Record 22.6 APPENDIX 12
Solubility Distilled H2O 10 mg/ml Soluble Soluble APPENDIX 13
Microbiologi
cal
Data
Total Aerobic
Microbial Count cfu/g 1000 85 APPENDIX 14
Total Combined
Yeast & Mould cfu/g <100 <10 APPENDIX 15
Salmonella cfu/10g 0 0 APPENDIX 16
Pseudomonas
aeruginosa cfu/g 0
0 APPENDIX 17
Staphylococcus
aureus cfu/g 0
0 APPENDIX 18
Stellenbosch University http://scholar.sun.ac.za

31
Table 3. Lyophilized Trypsin Quality Control analysis of product produced from by
traditional processing methodologies according to product specification.
Aspect Description Units Limits 1031 Methods*
Description Physical form as per
specification
N/A Buff
coloured
powder
Buff
coloured
powder
Visual
Activity Trypsin NFU/mg >3000 3946 APPENDIX 12
Trypsin µKatal/mg 0.831 1.03 APPENDIX 19
Additional
Data
Trypsin Identification A N/A Purple Purple APPENDIX 20
Trypsin Identification B N/A No colour No Colour APPENDIX 20
Chymotrypsin pH >Reference Complies APPENDIX 21
Loss on drying
(0.5 g for 2 hrs @60°C) %m/m ≤5.0 1.00
APPENDIX 23
pH (10 mg/ml) N/A 3.0 – 6.0 3.3 APPENDIX 7
Absorption 280 nm N/A 13.5-16.5 15.2 APPENDIX 22
Absorption 250 nm N/A ≤7.0 5.2 APPENDIX 22
Opalescence (0.10 g in
10 ml water) N/A Ref Sol II
Similar to
Ref I
APPENDIX 9
Microbiologi
cal Data
Salmonella Count/10g 0 0 APPENDIX 16
E. coli Count/g 0 0 APPENDIX 24
Total Aerobic Microbial
Count cfu/g ≤1000 5
APPENDIX 14
Solubility Distilled water 10 mg/ml
Sparingly
soluble Soluble
APPENDIX 13
*All assay methods are given in Appendices.
This chapter described the traditional processing methodologies used to purify trypsin and
chymotrypsin. The methods used were considered out-dated and were unable to consistently
deliver high yielding products. This was because of the inefficiencies observed during the
manufacturing processes. These inefficiencies include the inefficient extraction where all the
enzymes were not extracted, the inaccurate A/S precipitation and pH measurements and
inefficient crystallization of both CTG and trypsin. These inefficiencies were investigated,
and improved. New technologies were also considered to reduce the overall production time.
Chapter 4 describes the work done to improve each one of the inefficiencies identified, and
subsequently, in Chapter 5, new techniques and methods considered to purify trypsin and
chymotrypsin are discussed.
Stellenbosch University http://scholar.sun.ac.za
32
CHAPTER 4
4. RE-ENGINEERING A NEW PROCESS FOR PURIFICATION OF BOVINE
TRYPSIN AND CHYMOTRYPSIN
From the discussion in Chapter 3 it is evident that the traditional methods followed at BBI
enzymes for the production of trypsin and chymotrypsin were inefficient and not
economically sustainable. The discussions in this section will therefore focus on the
development of more efficient and effective isolation and purification techniques which could
be up scaled and implemented in a large scale production facility. The aim of all of these
method improvements was to increase the process yields obtained at lyophilized stage, and to
reduce production costs by reducing raw material input costs and the total production time.
Therefore each experiment executed and described in this chapter was focussed on either
yield improvement or cost reduction.
4.1 IMPROVED EXTRACTION OF PANCREATIC PROTEASES
In section 3.3.1, the inefficiencies in the extraction of trypsin and chymotrypsin from the
pancreas were highlighted. In summary, the methodology used was time consuming, and did
not allow for optimal protein extraction (determined by A280 measurements). In this section
the methodologies applied to investigate the inefficient process, and the work done to improve
the extraction methodology to increase the extraction efficiency and allow for maximal
liberation of enzymes at the onset of the process are explained. The aim of these trials were to
increase overall process efficiency and process yields.
.
4.1.1. MATERIALS AND METHODS
To substantiate the claims that not all the enzymes were extracted during the flaking / dunking
process, a simple comparison study was carried out where an extraction sample from the
factory floor was compared with a sample generated in the laboratory. The laboratory sample
was prepared by collecting flaked pancreas from the factory flaker and was further macerated
by blending it in a Hamilton Beach commercial 1L blender. Acidified potable water (pH 2.0,
Stellenbosch University http://scholar.sun.ac.za
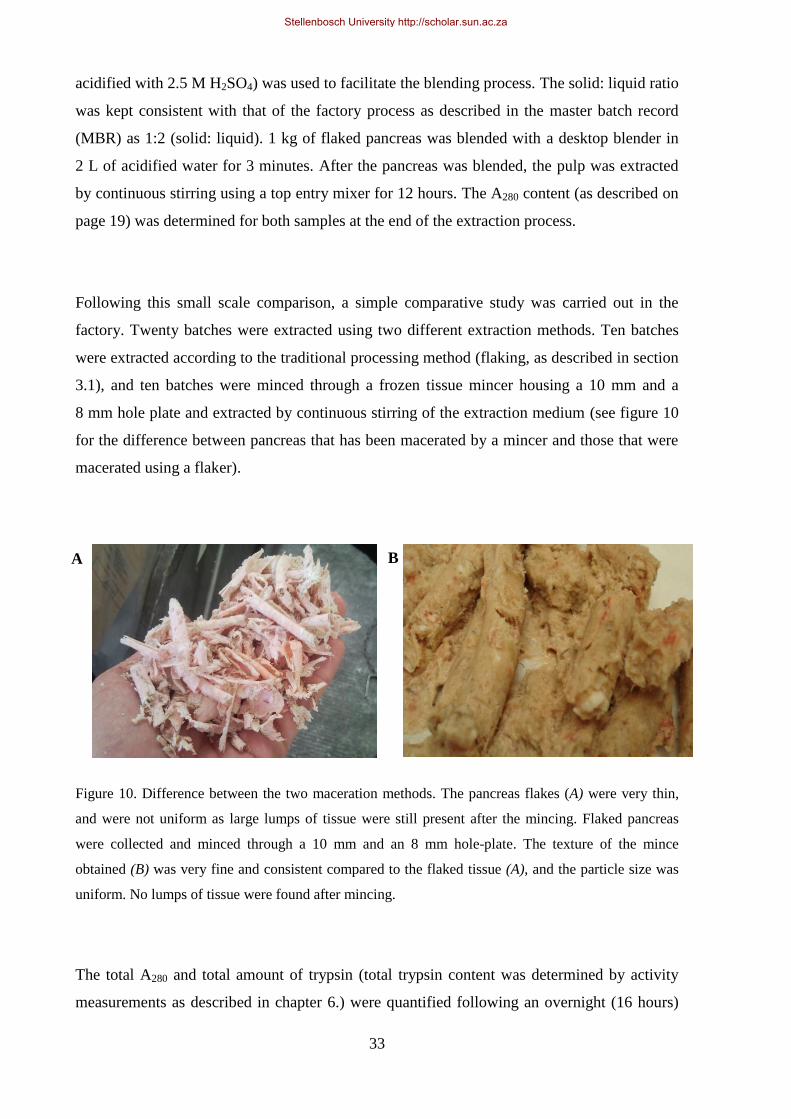
33
B
acidified with 2.5 M H2SO4) was used to facilitate the blending process. The solid: liquid ratio
was kept consistent with that of the factory process as described in the master batch record
(MBR) as 1:2 (solid: liquid). 1 kg of flaked pancreas was blended with a desktop blender in
2 L of acidified water for 3 minutes. After the pancreas was blended, the pulp was extracted
by continuous stirring using a top entry mixer for 12 hours. The A280 content (as described on
page 19) was determined for both samples at the end of the extraction process.
Following this small scale comparison, a simple comparative study was carried out in the
factory. Twenty batches were extracted using two different extraction methods. Ten batches
were extracted according to the traditional processing method (flaking, as described in section
3.1), and ten batches were minced through a frozen tissue mincer housing a 10 mm and a
8 mm hole plate and extracted by continuous stirring of the extraction medium (see figure 10
for the difference between pancreas that has been macerated by a mincer and those that were
macerated using a flaker).
Figure 10. Difference between the two maceration methods. The pancreas flakes (A) were very thin,
and were not uniform as large lumps of tissue were still present after the mincing. Flaked pancreas
were collected and minced through a 10 mm and an 8 mm hole-plate. The texture of the mince
obtained (B) was very fine and consistent compared to the flaked tissue (A), and the particle size was
uniform. No lumps of tissue were found after mincing.
The total A280 and total amount of trypsin (total trypsin content was determined by activity
measurements as described in chapter 6.) were quantified following an overnight (16 hours)
A
Stellenbosch University http://scholar.sun.ac.za
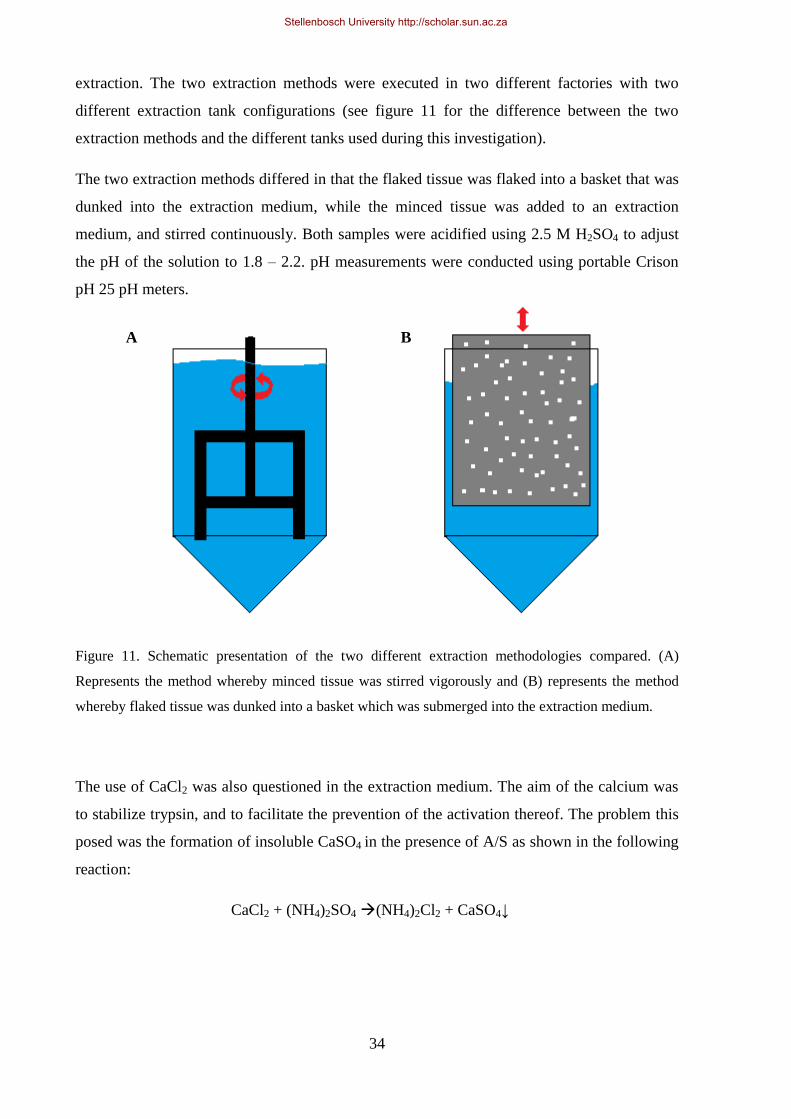
34
extraction. The two extraction methods were executed in two different factories with two
different extraction tank configurations (see figure 11 for the difference between the two
extraction methods and the different tanks used during this investigation).
The two extraction methods differed in that the flaked tissue was flaked into a basket that was
dunked into the extraction medium, while the minced tissue was added to an extraction
medium, and stirred continuously. Both samples were acidified using 2.5 M H2SO4 to adjust
the pH of the solution to 1.8 – 2.2. pH measurements were conducted using portable Crison
pH 25 pH meters.
Figure 11. Schematic presentation of the two different extraction methodologies compared. (A)
Represents the method whereby minced tissue was stirred vigorously and (B) represents the method
whereby flaked tissue was dunked into a basket which was submerged into the extraction medium.
The use of CaCl2 was also questioned in the extraction medium. The aim of the calcium was
to stabilize trypsin, and to facilitate the prevention of the activation thereof. The problem this
posed was the formation of insoluble CaSO4 in the presence of A/S as shown in the following
reaction:
CaCl2 + (NH4)2SO4 (NH4)2Cl2 + CaSO4↓
A B
Stellenbosch University http://scholar.sun.ac.za
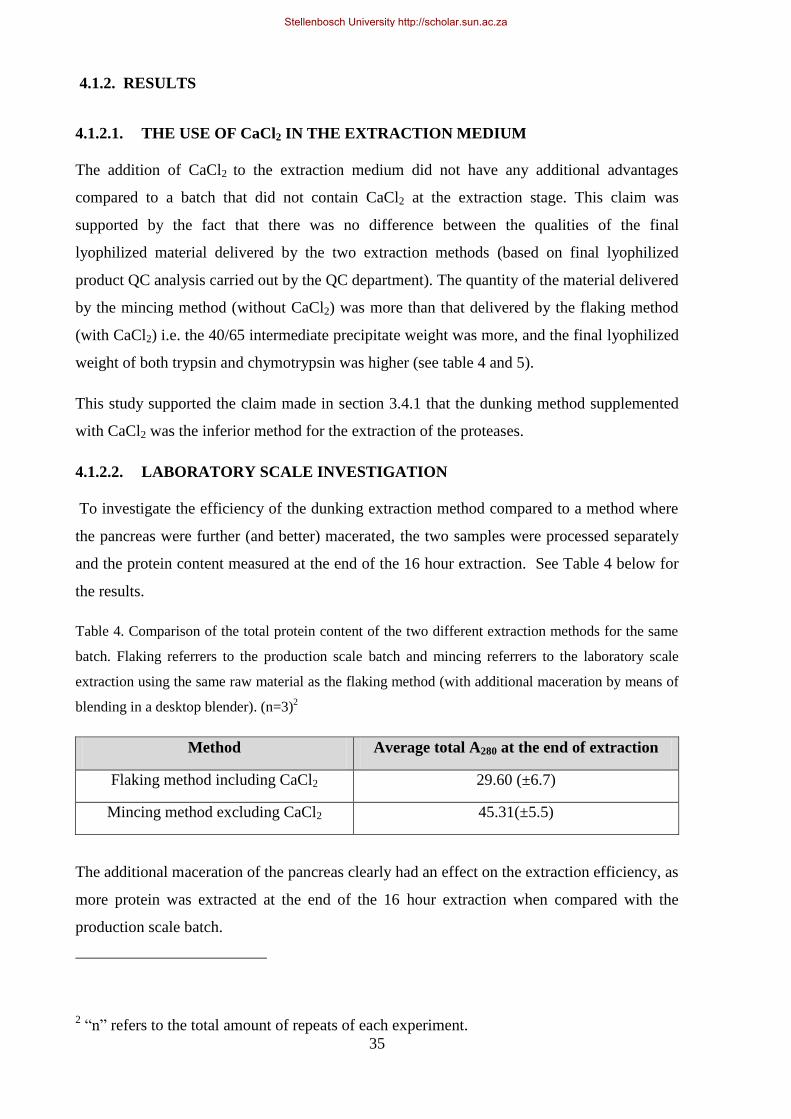
35
4.1.2. RESULTS
4.1.2.1. THE USE OF CaCl2 IN THE EXTRACTION MEDIUM
The addition of CaCl2 to the extraction medium did not have any additional advantages
compared to a batch that did not contain CaCl2 at the extraction stage. This claim was
supported by the fact that there was no difference between the qualities of the final
lyophilized material delivered by the two extraction methods (based on final lyophilized
product QC analysis carried out by the QC department). The quantity of the material delivered
by the mincing method (without CaCl2) was more than that delivered by the flaking method
(with CaCl2) i.e. the 40/65 intermediate precipitate weight was more, and the final lyophilized
weight of both trypsin and chymotrypsin was higher (see table 4 and 5).
This study supported the claim made in section 3.4.1 that the dunking method supplemented
with CaCl2 was the inferior method for the extraction of the proteases.
4.1.2.2. LABORATORY SCALE INVESTIGATION
To investigate the efficiency of the dunking extraction method compared to a method where
the pancreas were further (and better) macerated, the two samples were processed separately
and the protein content measured at the end of the 16 hour extraction. See Table 4 below for
the results.
Table 4. Comparison of the total protein content of the two different extraction methods for the same
batch. Flaking referrers to the production scale batch and mincing referrers to the laboratory scale
extraction using the same raw material as the flaking method (with additional maceration by means of
blending in a desktop blender). (n=3)2
Method Average total A280 at the end of extraction
Flaking method including CaCl2 29.60 (±6.7)
Mincing method excluding CaCl2 45.31(±5.5)
The additional maceration of the pancreas clearly had an effect on the extraction efficiency, as
more protein was extracted at the end of the 16 hour extraction when compared with the
production scale batch.
2 “n” refers to the total amount of repeats of each experiment.
Stellenbosch University http://scholar.sun.ac.za

36
4.1.2.3. PLANT SCALE INVESTIGATION
Following these laboratory trials, further production trials were conducted to investigate these
findings on a larger scale. The A280 of twenty in-process batches was compared at the
extraction stage, ten of which were extracted using the flaker method and ten of which were
extracted using a mincer fitted with a 10 mm and an 8 mm hole-plate, and continuously
stirring the extraction mixture. The 40/65 intermediate precipitate weight was also used as an
indication of the recovery of proteases at the end of the primary purification stage. The final
lyophilised products were used to compare the two extraction methods. The results of this
experiment is summarised in table 5 below. The flaking method included CaCl2 in the
extraction, and the mincing method excluded CaCl2 from the extraction process.
Table 5. Summary of the results where two different extraction methods were compared. The
traditional flaking method compared with a mincing method where minced tissue was extracted by
stirring the quoted values is averages of ten batches of each extraction method. (n=10)3
Method A280 at
extraction
40/64 precipitate
weight (Kg)
Final trypsin
weight (Kg/t)
Final chymotrypsin
weight (Kg/t)
Flaking 30.66 (±6.8) 35.5 (±5.6) 0.7 (±1.1) 1.40 (±1.0)
Mincing 40.51(±5.5) 41.3 (±6.1) 0.82 (±0.9) 1.92 (±0.8)
4.1.3. CONCLUSION
Major differences were observed between the two extraction methods. The protein content of
the minced pancreas at the end of the extraction was higher than what was observed for the
flaking method, indicating increased protein liberation as a result of improved cell
maceration. This was supported by other findings in the process. The protease precipitate
(40/65% precipitate) increased in weight from 35.5 –41.3 kg precipitate per 1.4 ton batch,
which indicated that at this stage of the process, more proteases or protein were present.
Other areas where increases were observed (indicating improved liberation of enzymes) when
the improved mincing method was implemented:
CTG crystal weight (after Zymogen separation) increased from 30 to 40 kg per batch.
Total amount of chymotrypsin after the activation stage increased from 12 to 14 BU.
3 “n” refers to the total amount of individual batches monitored for each extraction method.
Stellenbosch University http://scholar.sun.ac.za
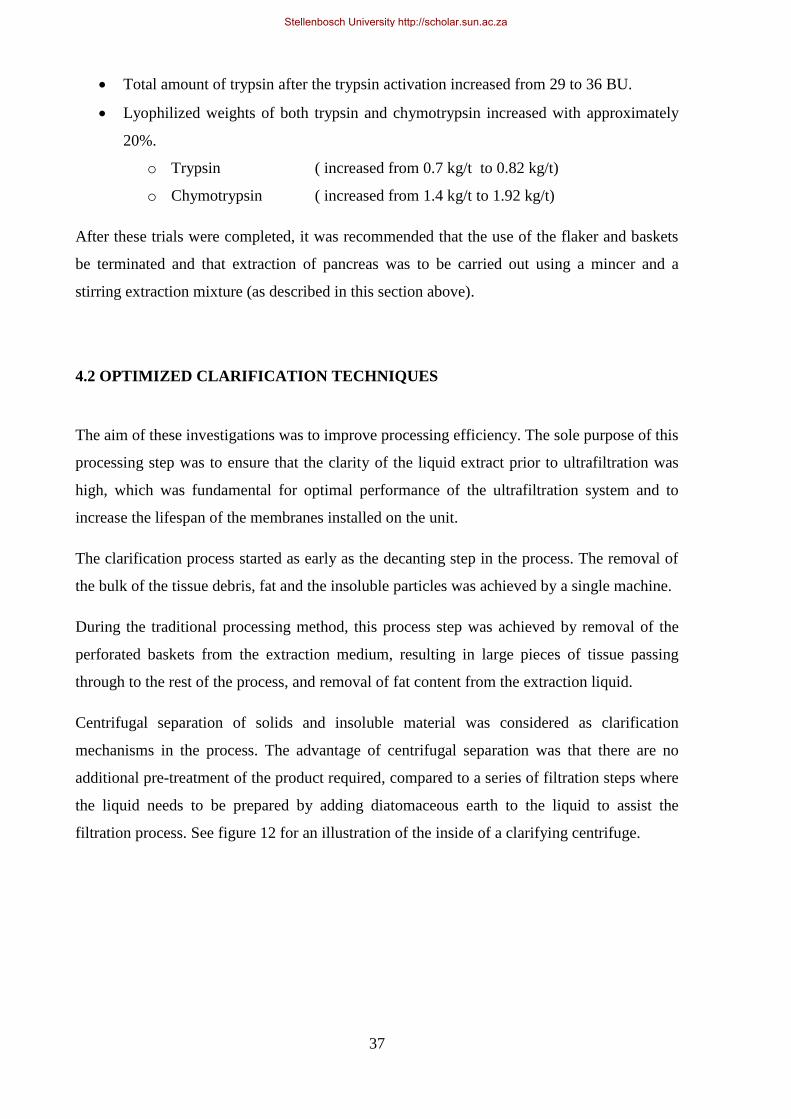
37
Total amount of trypsin after the trypsin activation increased from 29 to 36 BU.
Lyophilized weights of both trypsin and chymotrypsin increased with approximately
20%.
o Trypsin ( increased from 0.7 kg/t to 0.82 kg/t)
o Chymotrypsin ( increased from 1.4 kg/t to 1.92 kg/t)
After these trials were completed, it was recommended that the use of the flaker and baskets
be terminated and that extraction of pancreas was to be carried out using a mincer and a
stirring extraction mixture (as described in this section above).
4.2 OPTIMIZED CLARIFICATION TECHNIQUES
The aim of these investigations was to improve processing efficiency. The sole purpose of this
processing step was to ensure that the clarity of the liquid extract prior to ultrafiltration was
high, which was fundamental for optimal performance of the ultrafiltration system and to
increase the lifespan of the membranes installed on the unit.
The clarification process started as early as the decanting step in the process. The removal of
the bulk of the tissue debris, fat and the insoluble particles was achieved by a single machine.
During the traditional processing method, this process step was achieved by removal of the
perforated baskets from the extraction medium, resulting in large pieces of tissue passing
through to the rest of the process, and removal of fat content from the extraction liquid.
Centrifugal separation of solids and insoluble material was considered as clarification
mechanisms in the process. The advantage of centrifugal separation was that there are no
additional pre-treatment of the product required, compared to a series of filtration steps where
the liquid needs to be prepared by adding diatomaceous earth to the liquid to assist the
filtration process. See figure 12 for an illustration of the inside of a clarifying centrifuge.
Stellenbosch University http://scholar.sun.ac.za
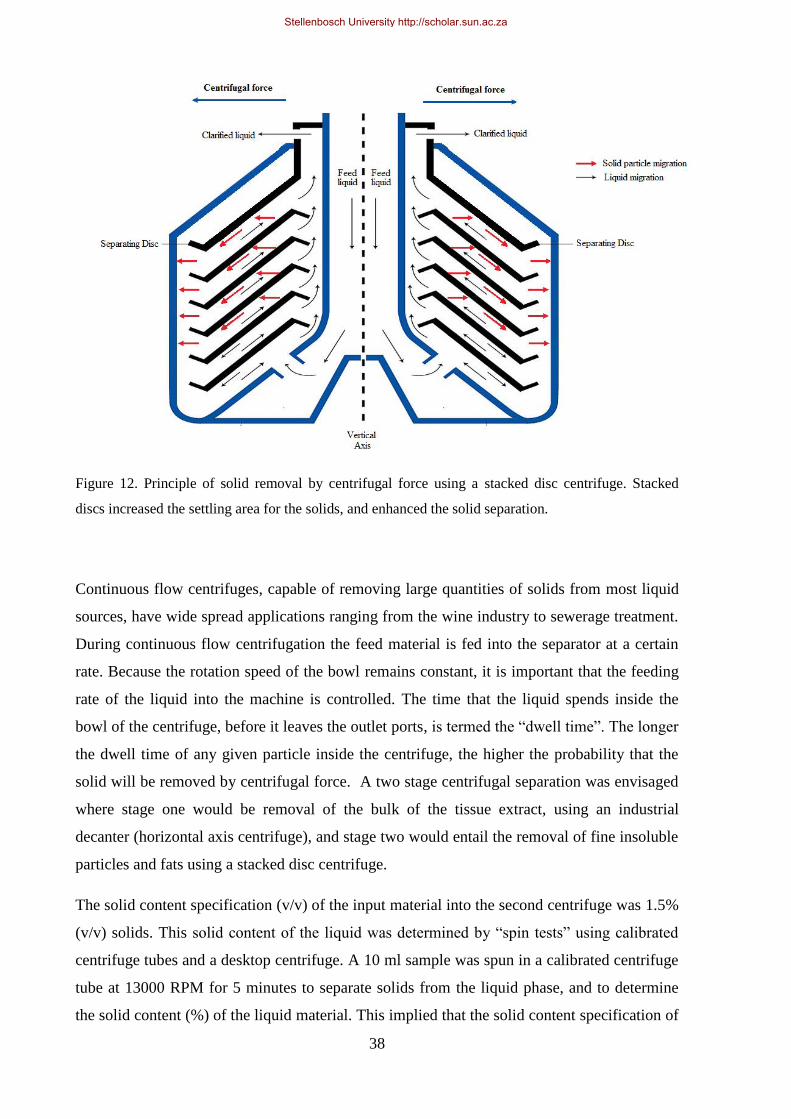
38
Figure 12. Principle of solid removal by centrifugal force using a stacked disc centrifuge. Stacked
discs increased the settling area for the solids, and enhanced the solid separation.
Continuous flow centrifuges, capable of removing large quantities of solids from most liquid
sources, have wide spread applications ranging from the wine industry to sewerage treatment.
During continuous flow centrifugation the feed material is fed into the separator at a certain
rate. Because the rotation speed of the bowl remains constant, it is important that the feeding
rate of the liquid into the machine is controlled. The time that the liquid spends inside the
bowl of the centrifuge, before it leaves the outlet ports, is termed the “dwell time”. The longer
the dwell time of any given particle inside the centrifuge, the higher the probability that the
solid will be removed by centrifugal force. A two stage centrifugal separation was envisaged
where stage one would be removal of the bulk of the tissue extract, using an industrial
decanter (horizontal axis centrifuge), and stage two would entail the removal of fine insoluble
particles and fats using a stacked disc centrifuge.
The solid content specification (v/v) of the input material into the second centrifuge was 1.5%
(v/v) solids. This solid content of the liquid was determined by “spin tests” using calibrated
centrifuge tubes and a desktop centrifuge. A 10 ml sample was spun in a calibrated centrifuge
tube at 13000 RPM for 5 minutes to separate solids from the liquid phase, and to determine
the solid content (%) of the liquid material. This implied that the solid content specification of
Stellenbosch University http://scholar.sun.ac.za

39
the output material from the decanter needed to be ≤1.5% to justify the installation of a high
speed disc centrifuge in series with the decanter for optimal solids removal.
A decanter is a continuous flow horizontal axis centrifuge used to remove the bulk of the
solids from a liquid suspension (can process liquid with a solid content of up to 70% solids).
A stacked disc centrifuge is a continuous flow centrifuge used to remove insoluble particles
from a liquid suspension. This is a vertical axis centrifuge that uses a slightly different
application of centrifugal force to separate solids from liquid phase. A disc stack centrifuge
separates solids from liquids in a single continuous process, using extremely high centrifugal
forces. As the liquid is fed into the disc centrifuge, dense solids are subjected to the extremely
high centrifugal force generated by the rotating bowl, and are forced outward against the
rotating bowl of the centrifuge whilst the less dense liquid phase form concentric inner layers
around the vertical axis. By inserting special plates (the “disc stack”) this provides additional
surface settling area for the solids, which contributes to speeding up the separation process
dramatically.
The use of the high speed disc centrifuge was initially considered to completely remove the
diatomaceous earth filtration step. This was, however, not possible, as the fatty nature of the
material prevented the disc centrifuge to completely remove all the solids to a clarity
specification of <5 Formazin Turbidity Units (FTU‟s). The installation of a disc centrifuge
was then considered to reduce the workload placed on the downstream clarification
equipment.
After considering two of the world‟s leading manufacturers of centrifuges, Alfa Laval and
Westfalia, both companies made their test units available to test the performance of the
machines on bovine pancreas. An Alfa Laval NX 418 decanter and a fully automated
Westfalia XSC 15-06-177 disc centrifuge were purchased as a secondary centrifuge installed
in series with the Alfa Laval decanter disc centrifuge. The reason for the purchase of these
units from two different suppliers, rather than from a single supplier, was the cost benefits and
the value for money each of the different machines offered. The budget for this project also
did not allow the purchase of both units from the same supplier as the decanter from Westfalia
and the disc centrifuge from Alva Laval were very expensive units.
Stellenbosch University http://scholar.sun.ac.za
40
4.2.1 ALFA LAVAL DECANTER CENTRIFUGE OPTIMIZATION
The Alfa Laval decanter was a semi-automated unit. Once the machine was started, the bowl
would spin at a constant speed (3250 rpm) for the duration of the production run. There were
two variables that could be changed to optimize the performance of the unit. The optimal
performance was achieved when the solids discharged from the machine had a very low liquid
content, and when the solid content of the output material was ≤ 1.5%.
The first parameter that could be changed was the rate at which product was fed into the
machine. The second parameter was the “pond depth” which is the level of liquid retained
within the bowl of the centrifuge whilst in rotation. The pond depth was controlled by discs
placed over the outlet ports of the decanter. The deeper the pond depth, the longer the dwell
time of the liquid inside the machine, which resulted in a cleaner liquid output.
The machine was capable of delivering a maximum water flux of 10 000 L/h when operated
at optimal conditions. A cautious approach was taken when assessing the performance of this
unit on a pancreas extract. To test the performance of this unit when pancreas extract was
used, the feed pump was set to deliver 5000 L/h as a starting point to the optimization, and the
solid content of the output material was measured. The machine was capable of delivering
10 000 L/h with pure water, the product optimization trials were started at 50% of the
maximum). Throughput was another important consideration that needed to be considered
when these trials were executed. For this machine to be a suitable replacement for the
traditional methodologies, a minimum feeding rate of 1000 L/h was set.
Following a series of trials on process equipment, it was concluded that a feeding rate of
1200 L/h yielded optimal performance, which resulted in a dry solids discharge and a
supernatant with a solid content (v/v) of 1.3 %.
4.2.2 DISC CENTRIFUGE OPTIMIZATION
Following the optimization of the decanter, it was clear that a solid content of <1.5% was
achievable with the Alfa Laval decanter.
The aim of the disc centrifuge optimization was to reduce the solids and fat content to as low
as possible and to yield a liquid product that was clear and contained no fats. The bowl of the
disc centrifuge rotated around a vertical axis at a constant speed of (12000 RPM / 24000 g).
The same principle that applied to the decanter centrifuge regarding the dwell time of the
Stellenbosch University http://scholar.sun.ac.za
41
product inside the bowl of the centrifuge, applied to the disc centrifuge where a longer dwell
time of the particles in the bowl resulted in a higher probability of removal by centrifugal
force. The disc centrifuge had a maximum water capacity of approximately 10 000 L/h.
A second variable with this machine was the time interval between solid discharges. A
discharge is when the bowl periphery was cleared form the build-up of solids by a jet of high
pressure water. The more frequent the discharges, the lower the risk of these accumulated
particles to be re-introduced into the liquid.
The optimization process was started using a feeding rate (50% of maximum capacity) of
5000 L/h and a discharge interval of 10 minutes. The clarity of the product was not sufficient
(did not comply with the clarity specification of < 5FTU‟s), and caused the filter press to
block up immediately. This meant that not sufficient fines/fats were removed from the liquid.
The discharge time was investigated, and it was found that a more frequent discharge time
improved the clarity of the liquid after centrifugation. Three different discharge times were
investigated (3, 5 and 10 minute intervals).
It was found that a three minute discharge time resulted in the clearest liquid. The feeding rate
was also investigated. The slower the feeding rate, the longer the retention time inside the
bowl of the centrifuge, which in turn would mean a higher probability that the solid particles
would be removed by centrifugal force. The feeding rate was reduced to 1200 L/h. The
discharge interval was further reduced to every 1 minute. This was all controlled
automatically from a central control panel. The best performance was achieved when the solid
content was reduced from 1.5% to 0.5%.
It was concluded that the stacked disc centrifuge would not be able to yield product that
would comply with the final clarity specification of <5 FTU‟s, but would reduce the burden
placed on the downstream clarification equipment but would increase the production time.
Following the two stage centrifugal separation and a single pass through a filtration system
utilizing diatomaceous earth as a filter aid, a very clear supernatant was consistently achieved
that met the specification.
Stellenbosch University http://scholar.sun.ac.za
42
4.2.3 CONCLUSION
Proper clarification techniques were identified to improve the process efficiency and to
improve the quality of the product being applied to the ultrafilter. Two different centrifuges
were installed in series, an Alpha Laval NX 418 Decanter to remove extracted tissue debris,
and a Westfalia high speed disc centrifuge to remove small particles and fats.
The installation of these two centrifuges ensured a consistent product to be supplied to the
clarification equipment (cloth filter press) and reduced the load placed on these machines. The
processing time was increased with 2 hours per batch as a result of the installation of these
machines.
4.3 INVESTIGATING DIFFERENT CRYSTALLIZATION CONDITIONS FOR
CHYMOTRYPSINOGEN AND TRYPSIN
4.3.1. INTRODUCTION
The aim of this investigation was to improve the protein crystallization conditions, and
ultimately increase the overall process yields of trypsin, chymotrypsin and CTG.
Protein crystallization, still one of the best methods of protein purification (Chayen, 2004), is
a process whereby solid protein crystals are formed from a homogeneous protein solution.
Protein crystal formation is initiated by the process called nucleation, which is the formation
of clusters of molecules that display a high degree of structural order. Nucleation is an
important key to the initiation of crystallization, and controls the structure of the crystallizing
phase and the number of particles appearing in a crystallization system (Garcia-Ruez, 2003).
Supersaturation, a state in which a solution contains more protein molecules than would
normally dissolve, should be achieved for the initialization of crystallization. Increasing
concentration of a precipitant increases the saturation state of a solution until it reaches a
supersaturation point. Most commonly used precipitants are salts, organic polymers and
alcohols. During this study A/S was used to bring the solution to a state of supersaturation
(Chayen, 2004). The thermodynamics of a supersaturated solution will dictate that the
solution must return to equilibrium by segregating a solid phase until equilibrium is achieved.
Stellenbosch University http://scholar.sun.ac.za
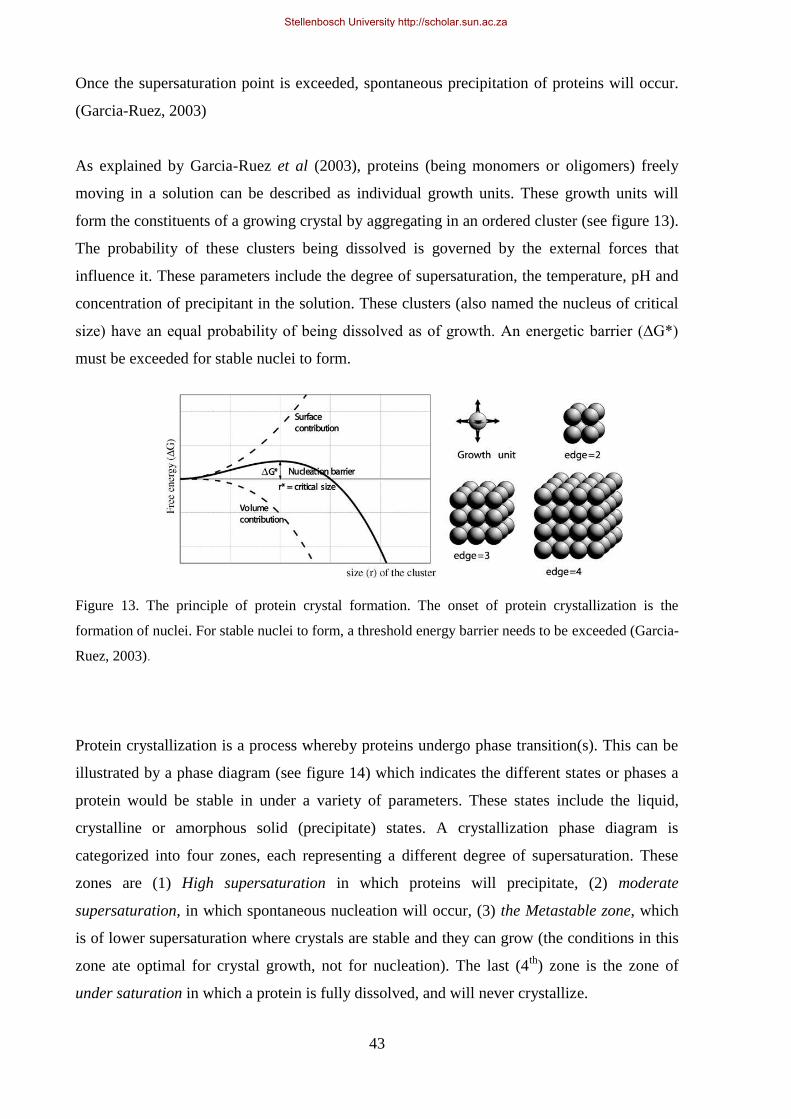
43
Once the supersaturation point is exceeded, spontaneous precipitation of proteins will occur.
(Garcia-Ruez, 2003)
As explained by Garcia-Ruez et al (2003), proteins (being monomers or oligomers) freely
moving in a solution can be described as individual growth units. These growth units will
form the constituents of a growing crystal by aggregating in an ordered cluster (see figure 13).
The probability of these clusters being dissolved is governed by the external forces that
influence it. These parameters include the degree of supersaturation, the temperature, pH and
concentration of precipitant in the solution. These clusters (also named the nucleus of critical
size) have an equal probability of being dissolved as of growth. An energetic barrier (ΔG*)
must be exceeded for stable nuclei to form.
Figure 13. The principle of protein crystal formation. The onset of protein crystallization is the
formation of nuclei. For stable nuclei to form, a threshold energy barrier needs to be exceeded (Garcia-
Ruez, 2003).
Protein crystallization is a process whereby proteins undergo phase transition(s). This can be
illustrated by a phase diagram (see figure 14) which indicates the different states or phases a
protein would be stable in under a variety of parameters. These states include the liquid,
crystalline or amorphous solid (precipitate) states. A crystallization phase diagram is
categorized into four zones, each representing a different degree of supersaturation. These
zones are (1) High supersaturation in which proteins will precipitate, (2) moderate
supersaturation, in which spontaneous nucleation will occur, (3) the Metastable zone, which
is of lower supersaturation where crystals are stable and they can grow (the conditions in this
zone ate optimal for crystal growth, not for nucleation). The last (4th
) zone is the zone of
under saturation in which a protein is fully dissolved, and will never crystallize.
Stellenbosch University http://scholar.sun.ac.za
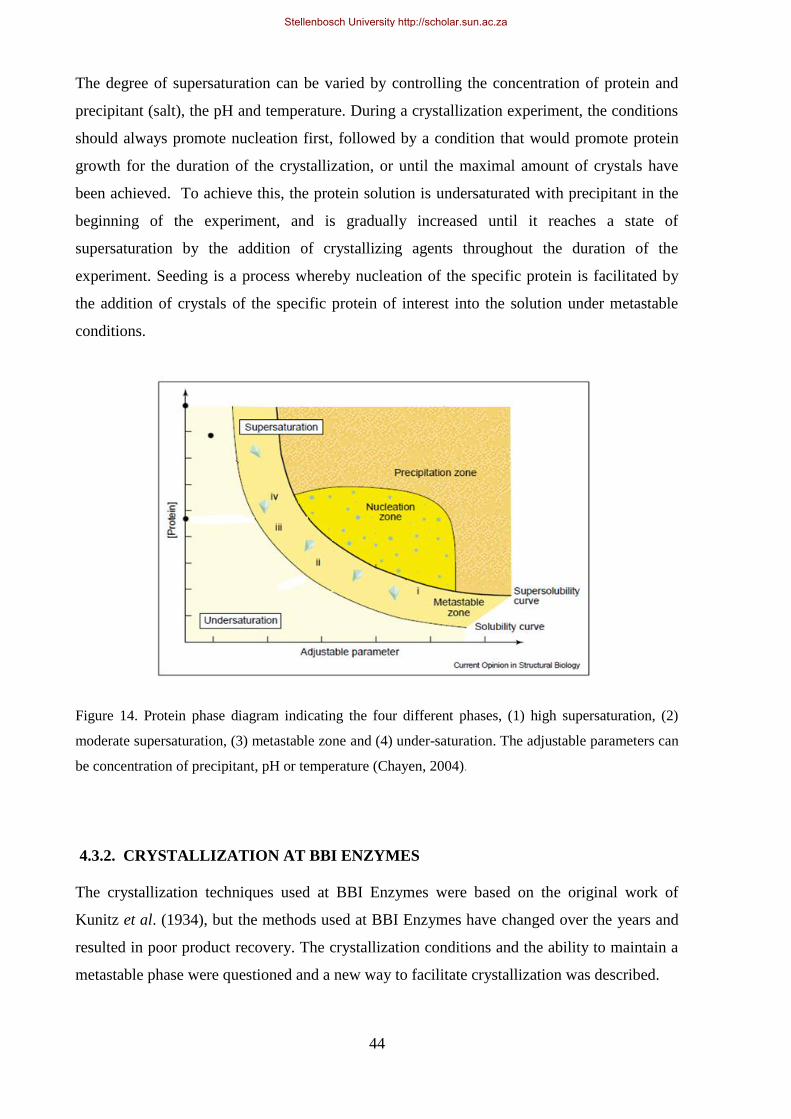
44
The degree of supersaturation can be varied by controlling the concentration of protein and
precipitant (salt), the pH and temperature. During a crystallization experiment, the conditions
should always promote nucleation first, followed by a condition that would promote protein
growth for the duration of the crystallization, or until the maximal amount of crystals have
been achieved. To achieve this, the protein solution is undersaturated with precipitant in the
beginning of the experiment, and is gradually increased until it reaches a state of
supersaturation by the addition of crystallizing agents throughout the duration of the
experiment. Seeding is a process whereby nucleation of the specific protein is facilitated by
the addition of crystals of the specific protein of interest into the solution under metastable
conditions.
Figure 14. Protein phase diagram indicating the four different phases, (1) high supersaturation, (2)
moderate supersaturation, (3) metastable zone and (4) under-saturation. The adjustable parameters can
be concentration of precipitant, pH or temperature (Chayen, 2004).
4.3.2. CRYSTALLIZATION AT BBI ENZYMES
The crystallization techniques used at BBI Enzymes were based on the original work of
Kunitz et al. (1934), but the methods used at BBI Enzymes have changed over the years and
resulted in poor product recovery. The crystallization conditions and the ability to maintain a
metastable phase were questioned and a new way to facilitate crystallization was described.
Stellenbosch University http://scholar.sun.ac.za
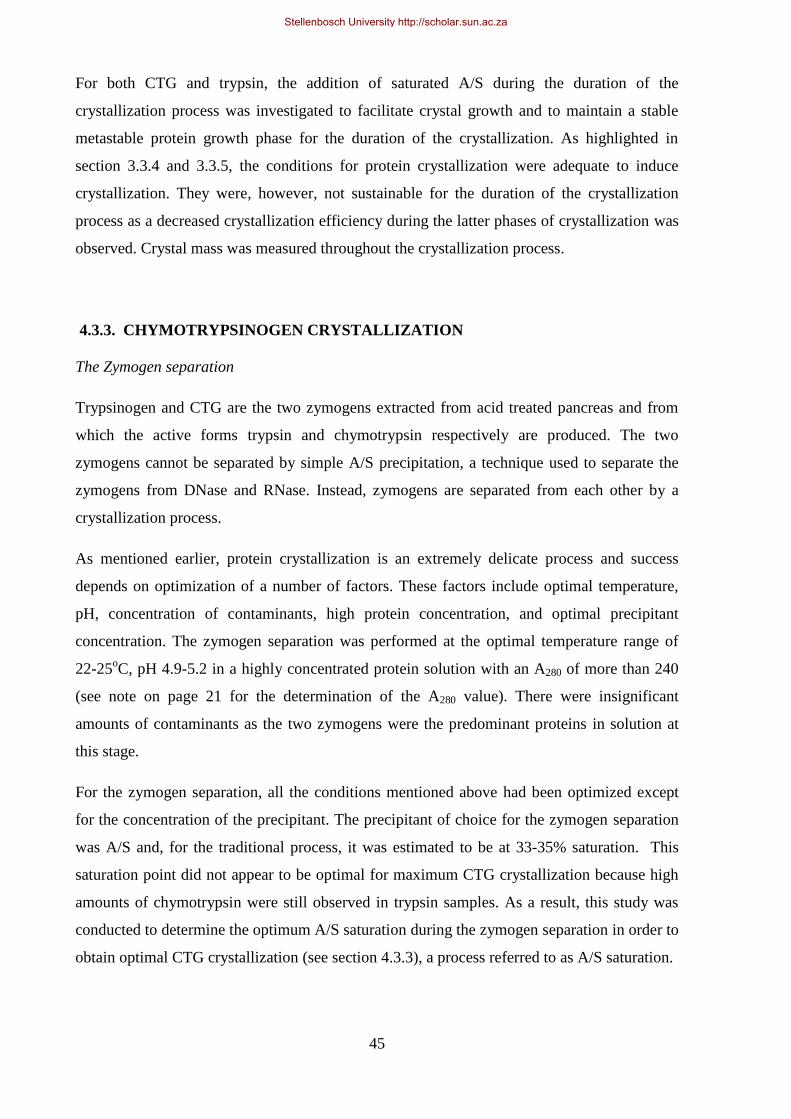
45
For both CTG and trypsin, the addition of saturated A/S during the duration of the
crystallization process was investigated to facilitate crystal growth and to maintain a stable
metastable protein growth phase for the duration of the crystallization. As highlighted in
section 3.3.4 and 3.3.5, the conditions for protein crystallization were adequate to induce
crystallization. They were, however, not sustainable for the duration of the crystallization
process as a decreased crystallization efficiency during the latter phases of crystallization was
observed. Crystal mass was measured throughout the crystallization process.
4.3.3. CHYMOTRYPSINOGEN CRYSTALLIZATION
The Zymogen separation
Trypsinogen and CTG are the two zymogens extracted from acid treated pancreas and from
which the active forms trypsin and chymotrypsin respectively are produced. The two
zymogens cannot be separated by simple A/S precipitation, a technique used to separate the
zymogens from DNase and RNase. Instead, zymogens are separated from each other by a
crystallization process.
As mentioned earlier, protein crystallization is an extremely delicate process and success
depends on optimization of a number of factors. These factors include optimal temperature,
pH, concentration of contaminants, high protein concentration, and optimal precipitant
concentration. The zymogen separation was performed at the optimal temperature range of
22-25oC, pH 4.9-5.2 in a highly concentrated protein solution with an A280 of more than 240
(see note on page 21 for the determination of the A280 value). There were insignificant
amounts of contaminants as the two zymogens were the predominant proteins in solution at
this stage.
For the zymogen separation, all the conditions mentioned above had been optimized except
for the concentration of the precipitant. The precipitant of choice for the zymogen separation
was A/S and, for the traditional process, it was estimated to be at 33-35% saturation. This
saturation point did not appear to be optimal for maximum CTG crystallization because high
amounts of chymotrypsin were still observed in trypsin samples. As a result, this study was
conducted to determine the optimum A/S saturation during the zymogen separation in order to
obtain optimal CTG crystallization (see section 4.3.3), a process referred to as A/S saturation.
Stellenbosch University http://scholar.sun.ac.za
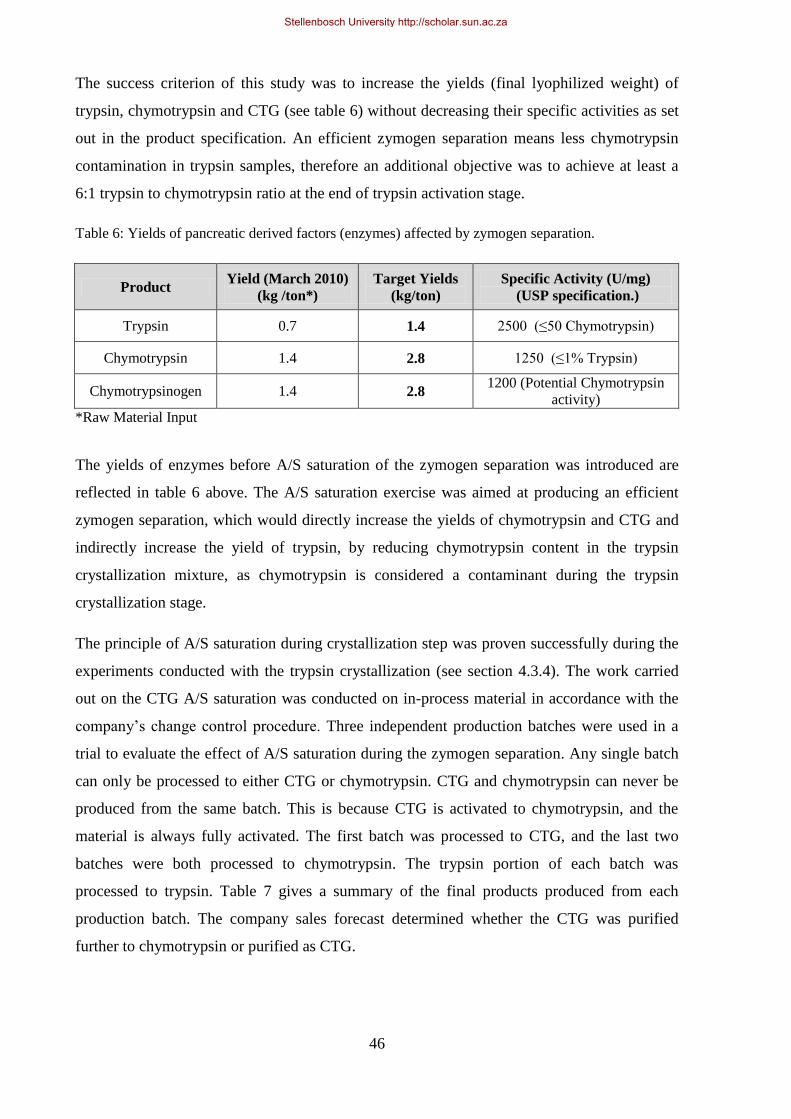
46
The success criterion of this study was to increase the yields (final lyophilized weight) of
trypsin, chymotrypsin and CTG (see table 6) without decreasing their specific activities as set
out in the product specification. An efficient zymogen separation means less chymotrypsin
contamination in trypsin samples, therefore an additional objective was to achieve at least a
6:1 trypsin to chymotrypsin ratio at the end of trypsin activation stage.
Table 6: Yields of pancreatic derived factors (enzymes) affected by zymogen separation.
Product Yield (March 2010)
(kg /ton*)
Target Yields
(kg/ton)
Specific Activity (U/mg)
(USP specification.)
Trypsin 0.7 1.4 2500 (≤50 Chymotrypsin)
Chymotrypsin 1.4 2.8 1250 (≤1% Trypsin)
Chymotrypsinogen 1.4 2.8 1200 (Potential Chymotrypsin
activity)
*Raw Material Input
The yields of enzymes before A/S saturation of the zymogen separation was introduced are
reflected in table 6 above. The A/S saturation exercise was aimed at producing an efficient
zymogen separation, which would directly increase the yields of chymotrypsin and CTG and
indirectly increase the yield of trypsin, by reducing chymotrypsin content in the trypsin
crystallization mixture, as chymotrypsin is considered a contaminant during the trypsin
crystallization stage.
The principle of A/S saturation during crystallization step was proven successfully during the
experiments conducted with the trypsin crystallization (see section 4.3.4). The work carried
out on the CTG A/S saturation was conducted on in-process material in accordance with the
company‟s change control procedure. Three independent production batches were used in a
trial to evaluate the effect of A/S saturation during the zymogen separation. Any single batch
can only be processed to either CTG or chymotrypsin. CTG and chymotrypsin can never be
produced from the same batch. This is because CTG is activated to chymotrypsin, and the
material is always fully activated. The first batch was processed to CTG, and the last two
batches were both processed to chymotrypsin. The trypsin portion of each batch was
processed to trypsin. Table 7 gives a summary of the final products produced from each
production batch. The company sales forecast determined whether the CTG was purified
further to chymotrypsin or purified as CTG.
Stellenbosch University http://scholar.sun.ac.za

47
Table 7: Batches affected by A/S saturation and products produced during the study
4.3.3.1 MATERIALS AND METHODS
Saturated A/S solution (759 g/L at 22oC) was slowly added to the product with the use of a
Seko PR-4 peristaltic pump feeding from a reservoir (feeding rate of 1 L/hr.). Because there
was no rapid assay available at the time to determine the A/S concentration of a batch, a set of
standards were prepared with different A/S concentrations with corresponding conductivity
measurements. These standards were prepared by adding increasing amounts of solid A/S to a
clarified 0/20 sample that was concentrated 10 fold to obtain a final A2280 of 240. The
samples were stirred continuously for 1 hour to allow all A/S to dissolve. After 1 hour, the
samples were filtered using 0.45 µm syringe filters to remove any insoluble particles and the
conductivity of the clear liquid was measured using a Eutech PC650 multimeter. See table 8
for a summary of the A/S concentrations with corresponding conductivity measurements. The
conductivity of a solution is affected by the protein concentration. An increasing protein
concentration will reduce the conductivity measurement. The standards were all prepared
using product with a high protein concentration (A280 of 240 – 280, see footnote page 20), and
a pH of 5. This is the protein concentration at the onset of the zymogen separation.
The concentration of A/S was monitored by conductivity measurements, using a Eutech
PC650 multimeter, to ensure that the parameter being changed could be accurately monitored.
Table 8. Set of A/S standards and their corresponding a conductivity measurements.
% A/S saturation Corresponding conductivity (milliSiemens)
30 80 – 90
35 100 – 110
40 120 – 125
Batch Final Product
Batch 1 Chymotrypsinogen /Trypsin
Batch 2 Chymotrypsin / Trypsin
Batch 3 Chymotrypsin / Trypsin
Stellenbosch University http://scholar.sun.ac.za
48
At the end of the CTG crystallization step, the suspension was diluted with 40% (244 g/L at
22oC) saturated A/S 1:1 (v/v), to facilitate better centrifugation, and centrifuged on a vertical
axes centrifuge to harvest the crystals. The harvested crystals were washed with a 40% A/S
solution and recovered by filtration through Viking filter paper on a coffin filter.
The CTG crystals were processed either to CTG or chymotrypsin (see table 7) while the
combined supernatant was further processed to trypsin. The processing of CTG was
performed as per the master batch record that describes CTG production (CTGP1, revision
11). Further trypsin processing was performed following normal trypsin protocol as described
in the master batch record for trypsin production (TP 1, Revision 12).
Three different final conductivity measurements were investigated to see at which % A/S
saturation the crystallization process was most effective. Table 9 gives a summary of the
initial and final conductivity measurements for each one of the batches.
Table 9: Conductivities and volumes of saturated ammonium sulphate added
Batch Starting Volume
(L)
Volume (L) Sat.
A/S added
Initial
Conductivity
(mS/cm)
Final
Conductivity
(mS/cm)
Batch 1 170 8.5 80.1 100
Batch 2 170 8.7 86 108
Batch 3 240 22.25 84 125
4.3.3.2 RESULTS
The outcome of these trials was determined by the lyophilized weights achieved for each of
the batches. From the results presented in table 10, it was clear that the yield of the
chymotrypsin(ogen) increased with increasing A/S saturation. The highest yield was achieved
at a conductivity of 125 mS/cm for both chymotrypsin and trypsin. This indicated that when
the decrease in protein concentration of the supernatant (as a result of protein crystallization)
was compensated for by systematically increasing the A/S concentration of the supernatant,
the crystallization efficiency was improved. The specific activity of all three trypsin batches
was above specification. This implied that the implementation of A/S saturation did not affect
the quality of the trypsin produced. The specific activity of the chymotrypsin produced (batch
2 and 3) also complied with the specification, indicating that the implementation of A/S
saturation did not affect the quality of the final chymotrypsin product either.
Stellenbosch University http://scholar.sun.ac.za
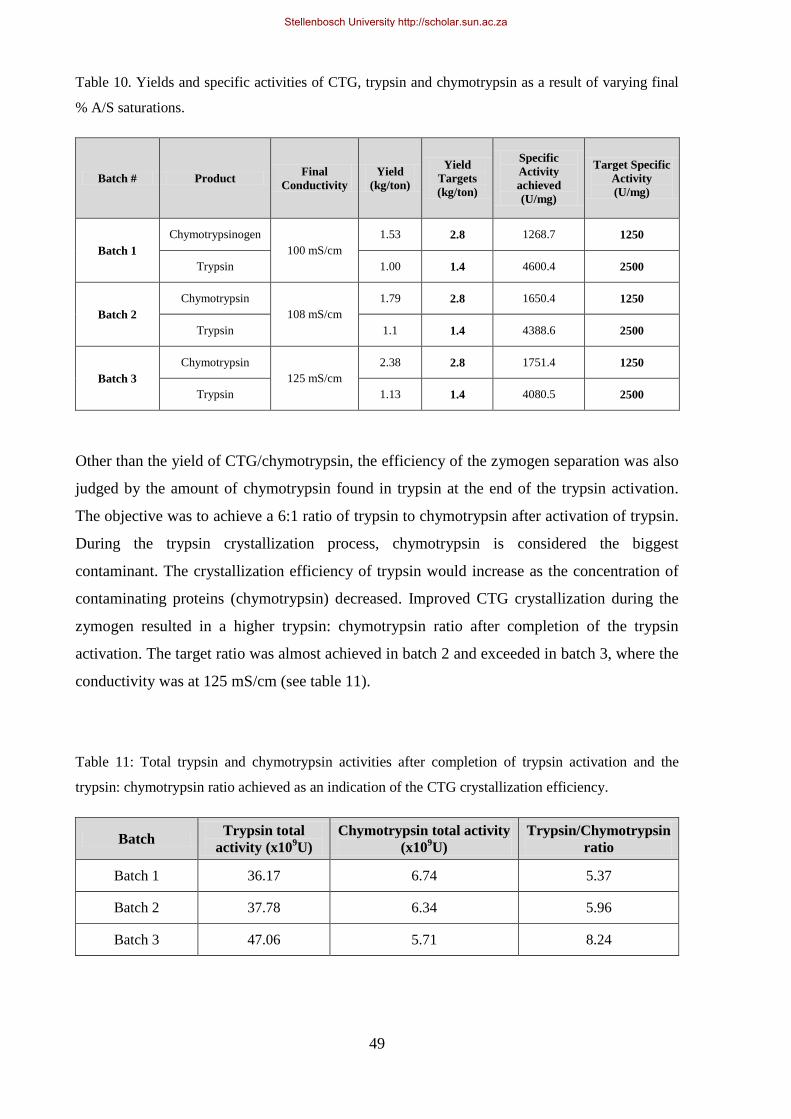
49
Table 10. Yields and specific activities of CTG, trypsin and chymotrypsin as a result of varying final
% A/S saturations.
Batch # Product Final
Conductivity
Yield
(kg/ton)
Yield
Targets
(kg/ton)
Specific
Activity
achieved
(U/mg)
Target Specific
Activity
(U/mg)
Batch 1
Chymotrypsinogen
100 mS/cm
1.53 2.8 1268.7 1250
Trypsin 1.00 1.4 4600.4 2500
Batch 2
Chymotrypsin
108 mS/cm
1.79 2.8 1650.4 1250
Trypsin 1.1 1.4 4388.6 2500
Batch 3
Chymotrypsin
125 mS/cm
2.38 2.8 1751.4 1250
Trypsin 1.13 1.4 4080.5 2500
Other than the yield of CTG/chymotrypsin, the efficiency of the zymogen separation was also
judged by the amount of chymotrypsin found in trypsin at the end of the trypsin activation.
The objective was to achieve a 6:1 ratio of trypsin to chymotrypsin after activation of trypsin.
During the trypsin crystallization process, chymotrypsin is considered the biggest
contaminant. The crystallization efficiency of trypsin would increase as the concentration of
contaminating proteins (chymotrypsin) decreased. Improved CTG crystallization during the
zymogen resulted in a higher trypsin: chymotrypsin ratio after completion of the trypsin
activation. The target ratio was almost achieved in batch 2 and exceeded in batch 3, where the
conductivity was at 125 mS/cm (see table 11).
Table 11: Total trypsin and chymotrypsin activities after completion of trypsin activation and the
trypsin: chymotrypsin ratio achieved as an indication of the CTG crystallization efficiency.
Batch Trypsin total
activity (x109U)
Chymotrypsin total activity
(x109U)
Trypsin/Chymotrypsin
ratio
Batch 1 36.17 6.74 5.37
Batch 2 37.78 6.34 5.96
Batch 3 47.06 5.71 8.24
Stellenbosch University http://scholar.sun.ac.za
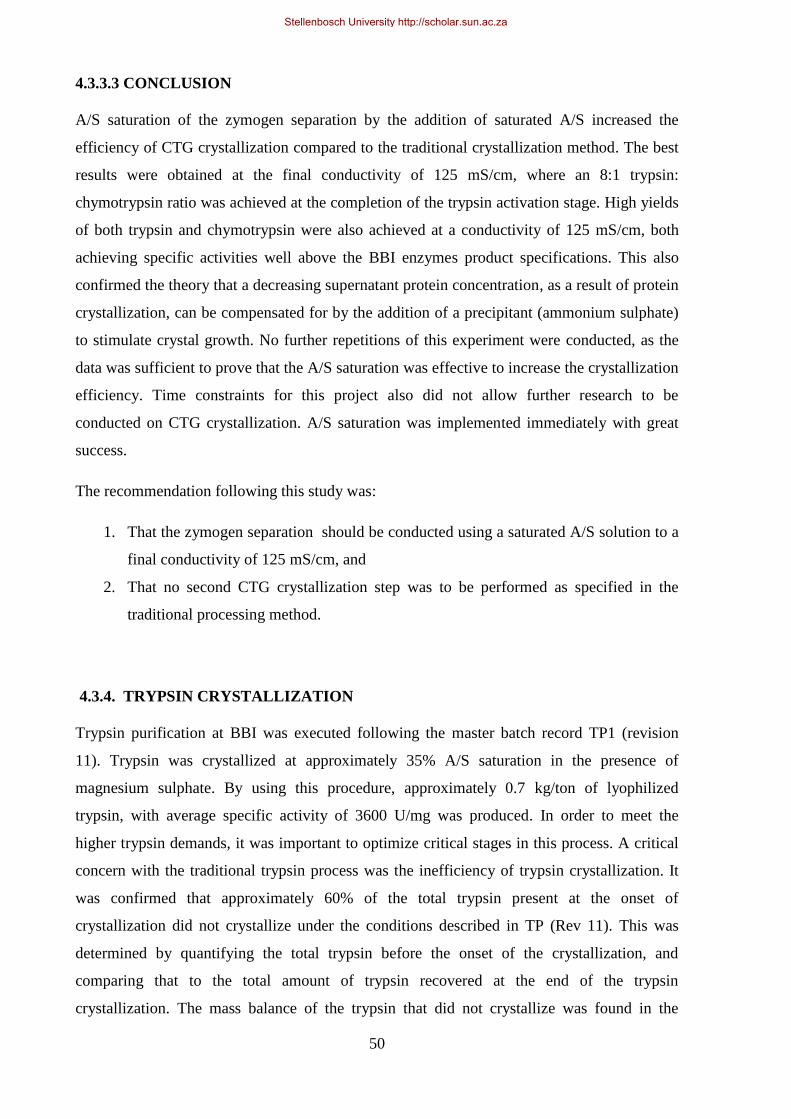
50
4.3.3.3 CONCLUSION
A/S saturation of the zymogen separation by the addition of saturated A/S increased the
efficiency of CTG crystallization compared to the traditional crystallization method. The best
results were obtained at the final conductivity of 125 mS/cm, where an 8:1 trypsin:
chymotrypsin ratio was achieved at the completion of the trypsin activation stage. High yields
of both trypsin and chymotrypsin were also achieved at a conductivity of 125 mS/cm, both
achieving specific activities well above the BBI enzymes product specifications. This also
confirmed the theory that a decreasing supernatant protein concentration, as a result of protein
crystallization, can be compensated for by the addition of a precipitant (ammonium sulphate)
to stimulate crystal growth. No further repetitions of this experiment were conducted, as the
data was sufficient to prove that the A/S saturation was effective to increase the crystallization
efficiency. Time constraints for this project also did not allow further research to be
conducted on CTG crystallization. A/S saturation was implemented immediately with great
success.
The recommendation following this study was:
1. That the zymogen separation should be conducted using a saturated A/S solution to a
final conductivity of 125 mS/cm, and
2. That no second CTG crystallization step was to be performed as specified in the
traditional processing method.
4.3.4. TRYPSIN CRYSTALLIZATION
Trypsin purification at BBI was executed following the master batch record TP1 (revision
11). Trypsin was crystallized at approximately 35% A/S saturation in the presence of
magnesium sulphate. By using this procedure, approximately 0.7 kg/ton of lyophilized
trypsin, with average specific activity of 3600 U/mg was produced. In order to meet the
higher trypsin demands, it was important to optimize critical stages in this process. A critical
concern with the traditional trypsin process was the inefficiency of trypsin crystallization. It
was confirmed that approximately 60% of the total trypsin present at the onset of
crystallization did not crystallize under the conditions described in TP (Rev 11). This was
determined by quantifying the total trypsin before the onset of the crystallization, and
comparing that to the total amount of trypsin recovered at the end of the trypsin
crystallization. The mass balance of the trypsin that did not crystallize was found in the
Stellenbosch University http://scholar.sun.ac.za
51
recovery mother liquor (the supernatant of the trypsin crystallization). A different method for
trypsin crystallization was therefore required.
According to TP1, (revision 11), ammonium sulphate salt was the precipitant of choice for
trypsin crystallization at BBI at 35% saturation. It was however believed that at 35%
saturation, the trypsin solution was only in the early metastable phase that only allows slow
crystal growth. In an effort to increase the efficiency of the crystallization, a trial was
conducted in which trypsin crystallization was performed by increasing the saturation of A/S
until a labile supersaturation phase was achieved. At this phase rapid crystal initiation and
crystal growth occurred, leading to efficient crystallization.
4.3.4.1 MATERIALS AND METHODS
The 75% trypsin precipitates (obtained after trypsin activation) from selected batches were
dissolved in 0.4 M borate buffer, pH 9.0 in a 2: 1 (w/v) ratio (2 kg ppt in 1L buffer). The A/S
concentrations of the solutions were reduced to 35% by diluting with 0.4 M borate buffer
followed by addition of 1 M calcium chloride solution (20 ml/L), and the pH was adjusted to
7.0 using 1 M NaOH. The crystallization was initiated by seeding the product (90 g/L) with
trypsin crystals from previous bathes.
After overnight incubation, when crystallization was observed, a saturated A/S solution
(767 g/L) was added to the stirring solution slowly (0.5 L/h) using a Seko PR-4 peristaltic
pump to increase the A/S saturation in the solutions from 35% to 40% or 45% and the
crystallization was allowed to continue for 7 days. The crystals were recovered by filtration in
a coffin filter and washed with a 40% saturated A/S solution to remove any entrained
proteins. The washed crystals were re-dissolved in RO water and diafiltered until salt free in
preparation for freeze drying using a 10 kDa PALL diafiltration system.
4.3.4.2 RESULTS
The 7 batches used for these trials were all crystallized as described in section 4.3.4.1 above,
and the results of these trials are summarised in tables 12 – 14. Batch 1 and 2 both had a final
% A/S saturation of 40%, whilst batches 3 – 7 had a final % A/S saturation of 45%.
Stellenbosch University http://scholar.sun.ac.za
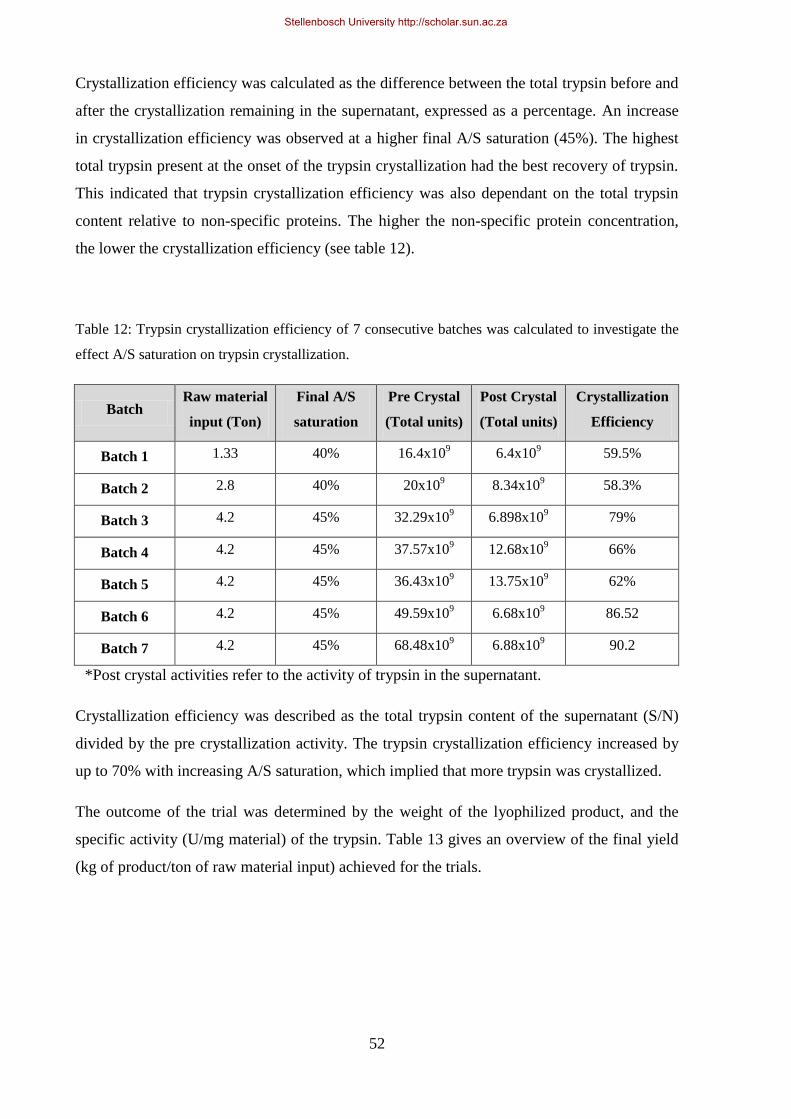
52
Crystallization efficiency was calculated as the difference between the total trypsin before and
after the crystallization remaining in the supernatant, expressed as a percentage. An increase
in crystallization efficiency was observed at a higher final A/S saturation (45%). The highest
total trypsin present at the onset of the trypsin crystallization had the best recovery of trypsin.
This indicated that trypsin crystallization efficiency was also dependant on the total trypsin
content relative to non-specific proteins. The higher the non-specific protein concentration,
the lower the crystallization efficiency (see table 12).
Table 12: Trypsin crystallization efficiency of 7 consecutive batches was calculated to investigate the
effect A/S saturation on trypsin crystallization.
Batch Raw material
input (Ton)
Final A/S
saturation
Pre Crystal
(Total units)
Post Crystal
(Total units)
Crystallization
Efficiency
Batch 1 1.33 40% 16.4x10⁹ 6.4x10
9 59.5%
Batch 2 2.8 40% 20x109 8.34x10
9 58.3%
Batch 3 4.2 45% 32.29x10⁹ 6.898x10
9 79%
Batch 4 4.2 45% 37.57x10⁹ 12.68x10
9 66%
Batch 5 4.2 45% 36.43x10⁹ 13.75x10
9 62%
Batch 6 4.2 45% 49.59x10⁹
6.68x10⁹
86.52
Batch 7 4.2 45% 68.48x10⁹
6.88x10⁹ 90.2
*Post crystal activities refer to the activity of trypsin in the supernatant.
Crystallization efficiency was described as the total trypsin content of the supernatant (S/N)
divided by the pre crystallization activity. The trypsin crystallization efficiency increased by
up to 70% with increasing A/S saturation, which implied that more trypsin was crystallized.
The outcome of the trial was determined by the weight of the lyophilized product, and the
specific activity (U/mg material) of the trypsin. Table 13 gives an overview of the final yield
(kg of product/ton of raw material input) achieved for the trials.
Stellenbosch University http://scholar.sun.ac.za
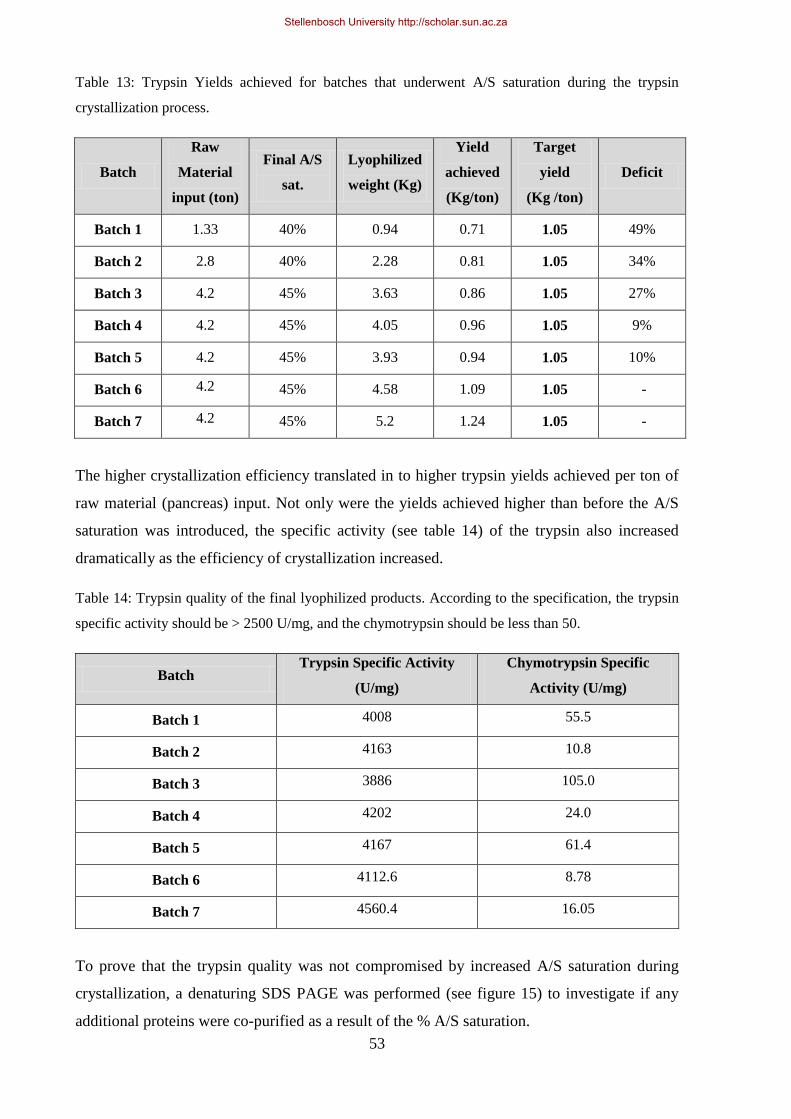
53
Table 13: Trypsin Yields achieved for batches that underwent A/S saturation during the trypsin
crystallization process.
Batch
Raw
Material
input (ton)
Final A/S
sat.
Lyophilized
weight (Kg)
Yield
achieved
(Kg/ton)
Target
yield
(Kg /ton)
Deficit
Batch 1 1.33 40% 0.94 0.71 1.05 49%
Batch 2 2.8 40% 2.28 0.81 1.05 34%
Batch 3 4.2 45% 3.63 0.86 1.05 27%
Batch 4 4.2 45% 4.05 0.96 1.05 9%
Batch 5 4.2 45% 3.93 0.94 1.05 10%
Batch 6 4.2 45% 4.58 1.09 1.05 -
Batch 7 4.2 45% 5.2 1.24 1.05 -
The higher crystallization efficiency translated in to higher trypsin yields achieved per ton of
raw material (pancreas) input. Not only were the yields achieved higher than before the A/S
saturation was introduced, the specific activity (see table 14) of the trypsin also increased
dramatically as the efficiency of crystallization increased.
Table 14: Trypsin quality of the final lyophilized products. According to the specification, the trypsin
specific activity should be > 2500 U/mg, and the chymotrypsin should be less than 50.
Batch Trypsin Specific Activity
(U/mg)
Chymotrypsin Specific
Activity (U/mg)
Batch 1 4008 55.5
Batch 2 4163 10.8
Batch 3 3886 105.0
Batch 4 4202 24.0
Batch 5 4167 61.4
Batch 6 4112.6 8.78
Batch 7 4560.4 16.05
To prove that the trypsin quality was not compromised by increased A/S saturation during
crystallization, a denaturing SDS PAGE was performed (see figure 15) to investigate if any
additional proteins were co-purified as a result of the % A/S saturation.
Stellenbosch University http://scholar.sun.ac.za
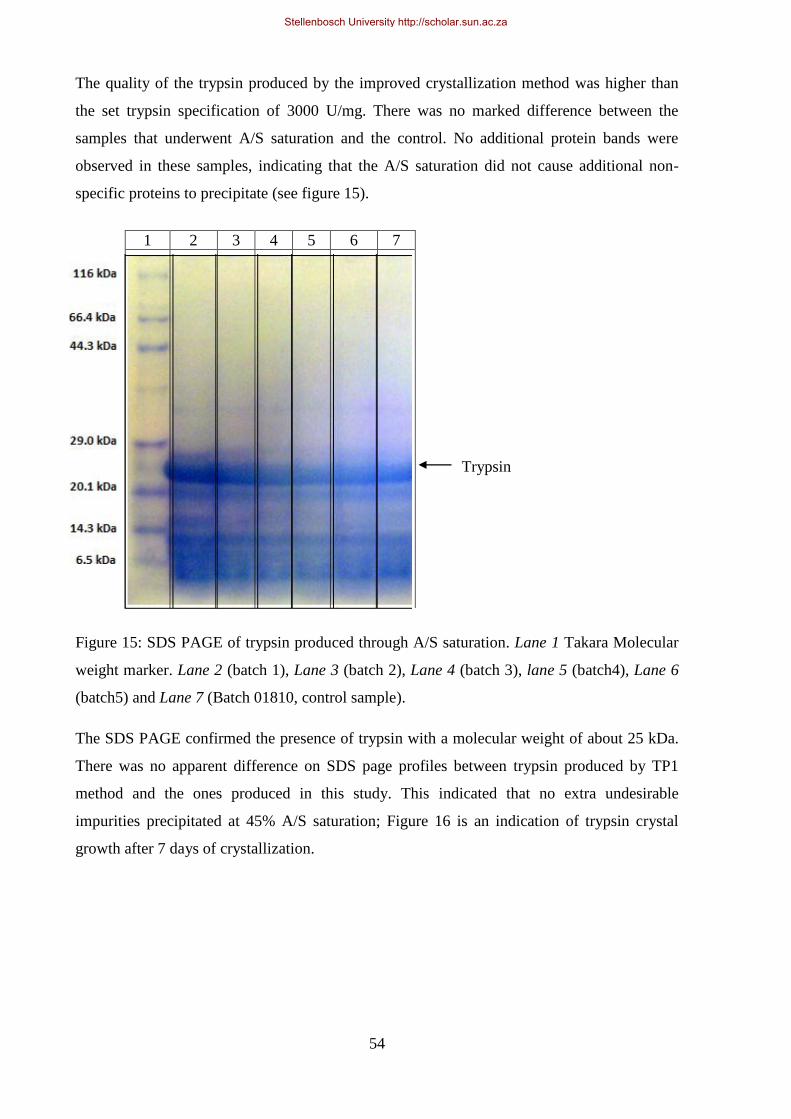
54
The quality of the trypsin produced by the improved crystallization method was higher than
the set trypsin specification of 3000 U/mg. There was no marked difference between the
samples that underwent A/S saturation and the control. No additional protein bands were
observed in these samples, indicating that the A/S saturation did not cause additional non-
specific proteins to precipitate (see figure 15).
Figure 15: SDS PAGE of trypsin produced through A/S saturation. Lane 1 Takara Molecular
weight marker. Lane 2 (batch 1), Lane 3 (batch 2), Lane 4 (batch 3), lane 5 (batch4), Lane 6
(batch5) and Lane 7 (Batch 01810, control sample).
The SDS PAGE confirmed the presence of trypsin with a molecular weight of about 25 kDa.
There was no apparent difference on SDS page profiles between trypsin produced by TP1
method and the ones produced in this study. This indicated that no extra undesirable
impurities precipitated at 45% A/S saturation; Figure 16 is an indication of trypsin crystal
growth after 7 days of crystallization.
1 2 3 4 5 6 7
Trypsin
Stellenbosch University http://scholar.sun.ac.za
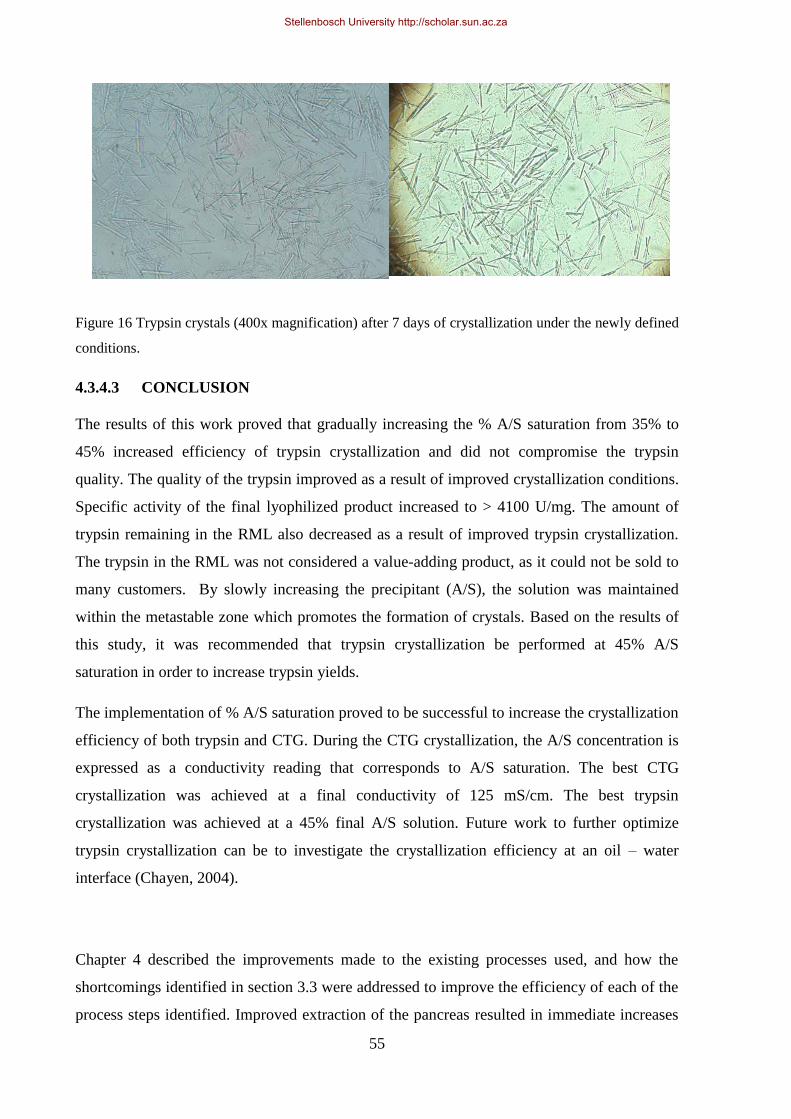
55
Figure 16 Trypsin crystals (400x magnification) after 7 days of crystallization under the newly defined
conditions.
4.3.4.3 CONCLUSION
The results of this work proved that gradually increasing the % A/S saturation from 35% to
45% increased efficiency of trypsin crystallization and did not compromise the trypsin
quality. The quality of the trypsin improved as a result of improved crystallization conditions.
Specific activity of the final lyophilized product increased to > 4100 U/mg. The amount of
trypsin remaining in the RML also decreased as a result of improved trypsin crystallization.
The trypsin in the RML was not considered a value-adding product, as it could not be sold to
many customers. By slowly increasing the precipitant (A/S), the solution was maintained
within the metastable zone which promotes the formation of crystals. Based on the results of
this study, it was recommended that trypsin crystallization be performed at 45% A/S
saturation in order to increase trypsin yields.
The implementation of % A/S saturation proved to be successful to increase the crystallization
efficiency of both trypsin and CTG. During the CTG crystallization, the A/S concentration is
expressed as a conductivity reading that corresponds to A/S saturation. The best CTG
crystallization was achieved at a final conductivity of 125 mS/cm. The best trypsin
crystallization was achieved at a 45% final A/S solution. Future work to further optimize
trypsin crystallization can be to investigate the crystallization efficiency at an oil – water
interface (Chayen, 2004).
Chapter 4 described the improvements made to the existing processes used, and how the
shortcomings identified in section 3.3 were addressed to improve the efficiency of each of the
process steps identified. Improved extraction of the pancreas resulted in immediate increases
Stellenbosch University http://scholar.sun.ac.za
56
in protein liberated. These improvements resulted in an increased final yield of the products.
The advances made in the improved clarification techniques by the implementation of new
centrifuges increased the efficiency of the clarification stages, and resulted in a reduction in
the total processing time, and as a result of new equipment installed, the mechanical strain
placed on the diatomaceous earth filtration equipment was reduced. Improved crystallization
techniques allowed for better crystallization of the specific enzymes, and resulted in an
increase in final product yield for both trypsin and chymotrypsin. In addition to the
improvements made to the existing processing methodologies, new innovative techniques
were evaluated (as described in chapter 5) to optimize the trypsin and chymotrypsin
purification processes. These improvements were investigated in an attempt to reduce overall
process time and cost and will be described in Chapter 5.
Stellenbosch University http://scholar.sun.ac.za
57
CHAPTER 5
5. NEW TECHNIQUES AND METHODS CONSIDERED FOR TRYPSIN AND
CHYMOTRYPSIN PURIFICATION
Further to the process improvements described in Chapter 4, this chapter describes the new
techniques considered to further improve the extraction and purification process of trypsin
and chymotrypsin. The main aim of the process re-engineering strategy was to reduce the
overall production cost to produce trypsin and chymotrypsin, and to reduce the time in which
these enzymes were manufactured. Ultrafiltration technology was investigated as a means to
reduce the volumes of product handled during the primary process. Ultrafiltration would also
reduce the time of the primary processing, and the total amount of A/S used during the
primary processing. The benefits of introducing ultrafiltration technology were thus two-fold;
a reduction in the overall process time and a cost saving in ammonium sulphate.
Chromatography development was considered as a protein purification technique to reduce
the overall processing time of the secondary processing. The time-consuming crystallization
stages during the secondary purification of both trypsin and chymotrypsin could be shortened
by implementation of column chromatography. The advantage of implementing column
chromatography as a protein purification technique was a reduction in the overall secondary
processing of both trypsin and chymotrypsin. This was also a more elegant approach to purify
the enzymes as supposed to the methods described in the traditional methods.
The use of non-acid treated pancreas as a raw-material source was investigated to reduce the
raw material costs of the process. The acid treated pancreas constituted the biggest portion of
the process raw material costs, whereas non-acid treated pancreas could be processed at a
lower cost.
Stellenbosch University http://scholar.sun.ac.za
58
5.1 ULTRAFILTRATION TECHNOLOGY AS A MEANS OF PROTEIN
PURIFICATION AND VOLUME REDUCTION
5.1.1. INTRODUCTION
One of the major challenges faced by BBI Enzymes was that the price of the raw materials
used in the processes had increased over time, and the processing methods used did not adapt
or change to accommodate for this factor. Because of the nature of the traditional processing
method, large quantities of A/S were used to perform precipitation steps. The price of A/S
increased by 297% over the last 13 years, and has become one of the biggest expenses of the
process. To eliminate the usage of large quantities of A/S, a concentration step, in which the
volume of the extract was reduced, was investigated. The aim of the ultrafiltration step was to
reduce the working volumes to better controllable volumes, to reduce the raw material input
cost (A/S), to reduce the overall process time and to minimise the chances of product loss due
to inaccurate A/S precipitation (as described in section 3.3.2 above).
Tangential flow filtration (TFF) is the pressure driven process whereby liquid is circulated
through a series of membranes that only allows the passage of water and molecules of a
certain size. Depending on membrane porosity, the applied process can be classified as a
microfiltration or ultrafiltration process. Microfiltration membranes, are generally used for
clarification, sterilization, and removal of micro particles (10 μm > pore sizes > 0.1 μm).
Ultrafiltration membranes have much smaller pore sizes between 0.001 and 0.1 μm and are
used for concentrating and desalting dissolved molecules such as proteins, peptides and
nucleic acids. Ultrafiltration membranes are classified by molecular weight cut-off (MWCO)
rather than pore size. The process described in this study only focuses on the usage of
ultrafiltration as a means to reduce the working volumes.
Ultrafiltration is the pressure driven process whereby liquid is circulated through a series of
semi permeable ultrafiltration membranes where liquid and small e.g. proteins, peptides and
salts permeate through the membranes as a result of different hydrostatic forces. The main
driving force behind the passage of liquid and proteins and or peptides across a membrane is
the trans membrane pressure (TMP). The resulting pressure difference across the membranes
serves as the driving force for liquid and proteins to permeate though a membrane. When a
certain volume of liquid is circulated through an ultrafiltration system, the volume thereof
Stellenbosch University http://scholar.sun.ac.za
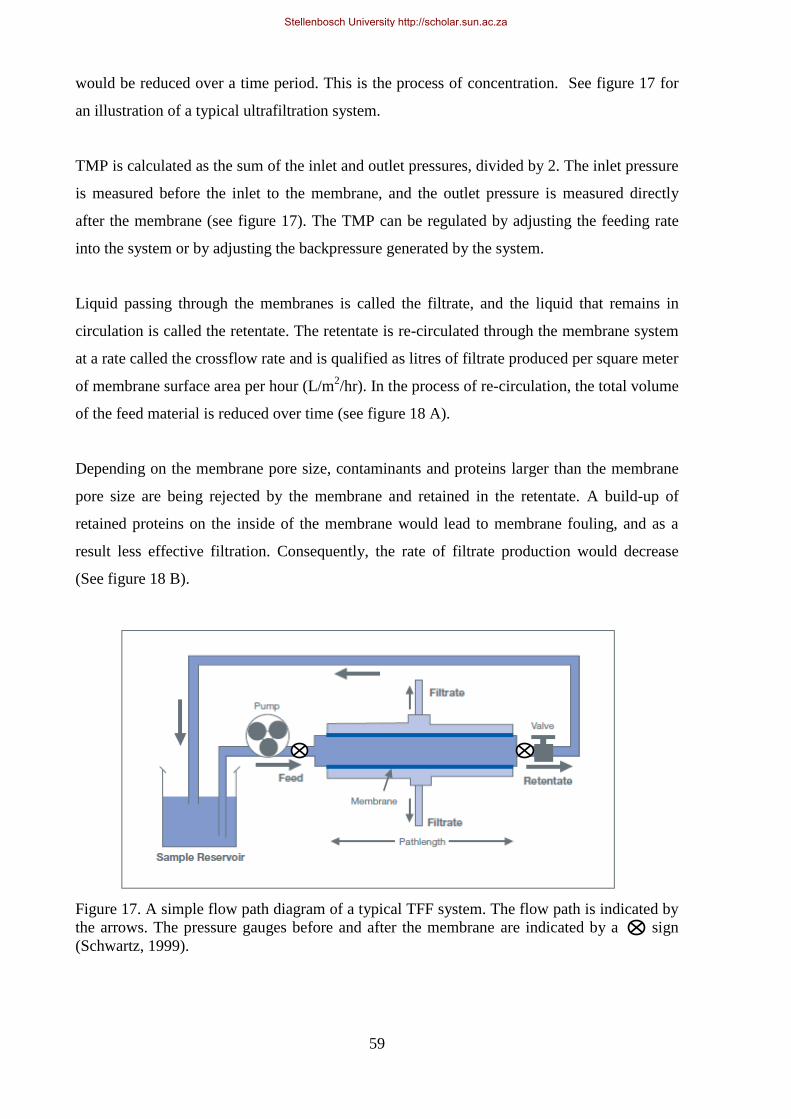
59
would be reduced over a time period. This is the process of concentration. See figure 17 for
an illustration of a typical ultrafiltration system.
TMP is calculated as the sum of the inlet and outlet pressures, divided by 2. The inlet pressure
is measured before the inlet to the membrane, and the outlet pressure is measured directly
after the membrane (see figure 17). The TMP can be regulated by adjusting the feeding rate
into the system or by adjusting the backpressure generated by the system.
Liquid passing through the membranes is called the filtrate, and the liquid that remains in
circulation is called the retentate. The retentate is re-circulated through the membrane system
at a rate called the crossflow rate and is qualified as litres of filtrate produced per square meter
of membrane surface area per hour (L/m2/hr). In the process of re-circulation, the total volume
of the feed material is reduced over time (see figure 18 A).
Depending on the membrane pore size, contaminants and proteins larger than the membrane
pore size are being rejected by the membrane and retained in the retentate. A build-up of
retained proteins on the inside of the membrane would lead to membrane fouling, and as a
result less effective filtration. Consequently, the rate of filtrate production would decrease
(See figure 18 B).
Figure 17. A simple flow path diagram of a typical TFF system. The flow path is indicated by
the arrows. The pressure gauges before and after the membrane are indicated by a sign
(Schwartz, 1999).
Stellenbosch University http://scholar.sun.ac.za

60
This technology can be used successfully in a protein purification processes to reduce the total
volume of a protein mixture, and retain the protein of interest, in the process removing
proteins and molecules smaller than MWCO of the membrane. It is important that the correct
MWCO of the membrane is selected for the process so that the protein of interest is not lost
into the filtrate.
It is recommended to use a membrane with MWCO of 4 times less than the molecular weight
of the protein of interest to avoid passage of the protein of interest into the filtrate (Schwartz,
1999). High concentrations of contaminants (proteins and organic foulants) in a membrane
system can lead to fouling of the membranes which will compromise the performance of the
membrane, i.e. reduce the rate at which filtrate is generated (referred to as the filtrate flux).
Figure 18. (A) Liquid passes through the feed channel and along (tangent to) the surface of the
membrane as well as through the membrane. The crossflow prevents build-up of molecules at the
surface that can cause fouling. (B) The TFF process prevents the rapid decline in flux rate seen in
direct flow filtration allowing a greater volume to be processed per unit area of membrane surface
(Schwartz, 1999).
The temperature of the circulating liquid could alter the performance of the membrane.
Elevated temperatures (35 – 40oC) allow the Poly Ether Sulfone (PES) membrane to expand,
and subsequently increased pore size of the membrane, resulting in enzyme leaching into the
filtrate. It was thus important to maintain the operating temperature of the liquid to < 21oC to
avoid any potential enzyme loss into the filtrate. It was also observed that elevated
temperatures during concentration of the zymogens (>25oC) spontaneously denatured the
zymogens, and forced them out of solution.
Stellenbosch University http://scholar.sun.ac.za
61
In an industrial protein purification process, when ultrafiltration technology is used to reduce
the volume of a batch, it is important that this process should be completed in the shortest
possible time. The end of an ultrafiltration cycle is marked by the achievement of a certain
concentration factor, or when a defined protein concentration of the retentate is achieved. In
this study, protein concentration was determined by measuring the A280 of the concentrated
solution, see note on page 21.
To achieve the optimal concentration factor, the operating conditions for the system were to
be determined beforehand. Important considerations when determining the process
parameters includes the MWCO of the membranes, the amount of membrane modules needed
(total surface area of membranes) to achieve the desired concentration within a specified time
frame, the cross flow and backpressure required to achieve a certain TMP, the crossflow flux
rate (crossflow rate per unit area of membrane; L/m2/hr.) and the TMP to achieve minimal
membrane fouling. The design of a TFF system is easily scalable, and can be trailed on pilot
scale and scaled up directly for use in an industrial process.
Concentration polarization is the accumulation of the retained molecules (gel layer) on the
inner surface of the membrane caused by a combination of the following factors: trans-
membrane pressure, crossflow rate, sample viscosity and solute concentration
(Bauser, 1986). This is why it is important to always maintain a high crossflow and TMP
during a concentration cycle. Such organic foulants can be removed by the circulation of
0.4 M NaOH solution at 40oC at high crossflow through the system with a maximum contact
time of 50 minutes (as recommended by the supplier).
Inorganic fouling of the membranes by e.g. silica is extremely hard to remove. Prior to any
ultrafiltration process would be a clarification process to ensure the liquid clarity is suitable
for concentration. In the industry, diatomaceous earth is commonly used as a filtration
medium. When membranes are fouled with filter aid (diatomaceous earth), it is impossible to
remove all the silica residues from the membrane. It is thus always recommended to have a
proper in-line pre-filtration system (5 μm pore size pre-filter) installed upstream of the
membrane to avoid any particulate materials passing into the membrane and causing
irreversible membrane fouling.
After a cleaning cycle was performed, the normalised water permeability (NWP) of the
membrane was determined to indicate the effectiveness of the cleaning cycle that was
Stellenbosch University http://scholar.sun.ac.za
62
executed. The NWP is also referred to as the clean water flux, where clean water is passed
through the system (after the system was cleaned) at a constant TMP and crossflow. As the
membrane ages, and irreversible fouling starts to block the membrane, the NWP will decrease
over time.
5.1.2. MATERIALS AND METHODS
PALL life sciences supplied two models of cassettes in the TFF range of membranes, a T-
series and an F-series. Both these cassettes were made out of PES. PES membranes are
hydrophilic, are highly resistant to chemicals such as NaOH and are not prone to protein
binding. The difference between the PALL T-series and F-series cassettes was that the T-
series was designed to create additional turbulence as the liquid passed through the membrane
channel, and thereby reduce the possibility of membrane fouling. This was achieved by an
irregular membrane surface (bumps) that generated turbulence as the liquid passed through
the channel. Because the ultrafiltration process was considered to be used early in the primary
purification process, the risk of concentration polarization was high as the protein
concentration was high (the only proteins that were removed at this stage were the proteins
precipitated with 20% A/S).
The use of 10 kDa PALL4 T-series Centramate® cassettes were considered for the trials
carried out in this study. The centramate cassettes are lab scale equivalents of the large-scale
membranes, and were designed for laboratory trials in preparation for industrial scale up. It
was recommended that a MWCO of four times less than the size of the protein of interest
should normally be used indicating that a 5 kDa membrane was required for these trials.
Based on experience with industrial scale 5 kDa membranes, the use of such low MWCO
membranes was discouraged, as the filtrate flux obtained by these membranes was too low.
As a result, the 10 kDa membrane was considered. Two different kinds of PALL 10 kDa
membranes were considered, PES hollow fibre and PES cassette membranes. The usage of
PES hollow fibre membranes was discouraged following a trial with a small-scale 10 kDa
PALL hollow fibre membrane concentrating a solution of ribonuclease. The process at BBI
4 PALL is a leading manufacturer of tangential flow membranes. The Centramate cassette is a
laboratory replica of the T-series cassettes that is used on industrial scale.
Stellenbosch University http://scholar.sun.ac.za
63
Enzymes required RNase to be purified as a further product, and 90% of the RNase that was
used for this trial passed through the hollow fibre membrane, but did not pass through a
10 kDa cassette. The nominal cut-off on cassette membranes is closer to the quoted MWCO
than hollow fibre membranes. This statement was supported by the supplier (PALL).
The Pall T-series Centramate® membrane could withstand a maximum pressure of 6 Bar, and
a maximum TMP of 4 Bar. The pH range of this membrane was 2 – 14 which allowed the
liquid extract from the process with a pH of 2 – 2.2 to be concentrated. This membrane had a
0.1 m2 surface area, and was fitted to a PALL cassette housing. A peristaltic pump fitted with
a WEG frequency drive was used to control the circulation speed of the liquid through the
membrane. The liquid product used for these trials (clarified 0/20 material) was collected
from the production plant, and when necessary, it was re-clarified to avoid excessive
membrane fouling. To control the temperature of the extract the sample reservoir, containing
the extract, was cooled with ice and water.
The aim of these trials was to define the operating conditions for the large-scale process, and
to determine the amount of cassettes required to achieve the concentration factor required in a
set time period. In the production scale process, the average volume at clarified 0/20 stage
was approx. 4000 L which needed to be concentrated down to a approx. 200 L (20x
concentration factor) to achieve a final A280 of 240 – 260. This A280 was equivalent to the
protein concentration of the dissolved 40/65 precipitate (pre zymogen separation) from the
traditional process. The aim was to concentrate the clarified 0/20 material to the defined A280
value and immediately perform the zymogen separation directly thereafter. The maximum
process time allowed for this step was 8 hours, which meant that an average filtrate flux of
500 L/h was required to concentrate the 4000 L down to approx. 200 L.
There were two reasons for implementing the ultrafiltration step directly after the clarification
of the 20% A/S precipitation. Firstly because this was the first stage in the process where the
clarity of the product was sufficient (< 15 FTU‟s), and secondly because this was the point in
the process with the lowest A/S concentration. The viscosity of the liquid would increase as
the % A/S saturation increased which would have a negative effect on the flow dynamics of
the TFF system (Viscosity is one of the factors that could accelerate membrane fouling). A/S
is very corrosive, and could potentially cause damage to the machinery used during the
ultrafiltration process. Any steel structures on the system were at risk to start rusting which
would be detrimental to the process.
Stellenbosch University http://scholar.sun.ac.za
64
In all of the experiments conducted, when the performance of a membrane was assessed, the
samples were properly clarified to avoid false negative results. The clarified product was re-
circulated through the UF system using a peristaltic pump. The pressures (inlet and outlet)
were controlled by valves installed in the system (as described in figure17). Pressure readings,
filtrate fluxes and crossflows were measured over the concentration period until a certain
concentration factor was achieved. The temperature of the product was read using a digital
thermometer, and adjusted by the addition of ice around the vessel containing the
recirculating liquid.
The filtrate of the experiment was all collected and assayed for enzyme activity at the end of
the experiment to assess if there was any leakage of the enzymes through the membrane. SDS
PAGE analysis was also conducted to verify the passage of any of the proteins of interest.
5.1.3. RESULTS
The first experiment was carried out to investigate the optimal TMP and crossflow required to
give the best and most stable filtrate flux. Three different crossflows and TMPs were
considered. Table 15 gives a summary of the parameters that were monitored during the
duration of the concentration run, and figure 19 is the graphical translation of table 15 where
the filtrate flux and TMP was measured over time. This experiment to investigate the optimal
TMP was only conducted once due to time constraints for UF membrane optimization.
During the lab scale investigations, it was easier to express the filtrate flux as L/m2/min as the
fluxes were considerably lower than those achieved on a large-scale membrane (where filtrate
flux is measured as L/m2/min).
Stellenbosch University http://scholar.sun.ac.za

65
Table 15. Summary of the parameters controlled during the first optimization trials. The crossflow and
the TMP were varied to investigate the optimal performance.
Time
(min)
Pin
(Bar)
Pout
(Bar)
Feeding
rate
(Hz)
Crossflow
(L/min/m2)
Filtrate
flux
(L/min/m2)
Temp
(oC)
TMP
0.00 1.2 0.8 7.57 4.00 0.355 19.7 1
15.00 1.2 0.8 7.57 4.00 0.32 21 1
25.00 1.2 0.8 7.57 4.00 0.305 22.3 1
35.00 1.2 0.8 7.57 4.00 0.28 23.6 1
40.00 2 2 7.57 4.00 0.375 23.6 2
50.00 2 2 13.4 8.33 0.35 25.2 2
55.00 2 1 13.4 7.67 0.32 25.2 1.5
65.00 1.5 1.5 13.4 8.67 0.31 26 1.5
150.00 2 1 13.4 8.67 0.265 26.5 1.5
210.00 2 1 13.4 8.67 0.26 27.1 1.5
Figure 19. Three different TMP‟s and crossflows were investigated to determine the optimal
conditions for the best filtrate flux. Filtrate flux (L/min/m2) and TMP (Bar) was plotted against time.
At a TMP of 1, the filtrate flux decreased rapidly. This indicated that this TMP was too low to
sustain a proper production run, and on a production scale process, the membranes would
require cleaning during the concentration cycle.
Stellenbosch University http://scholar.sun.ac.za
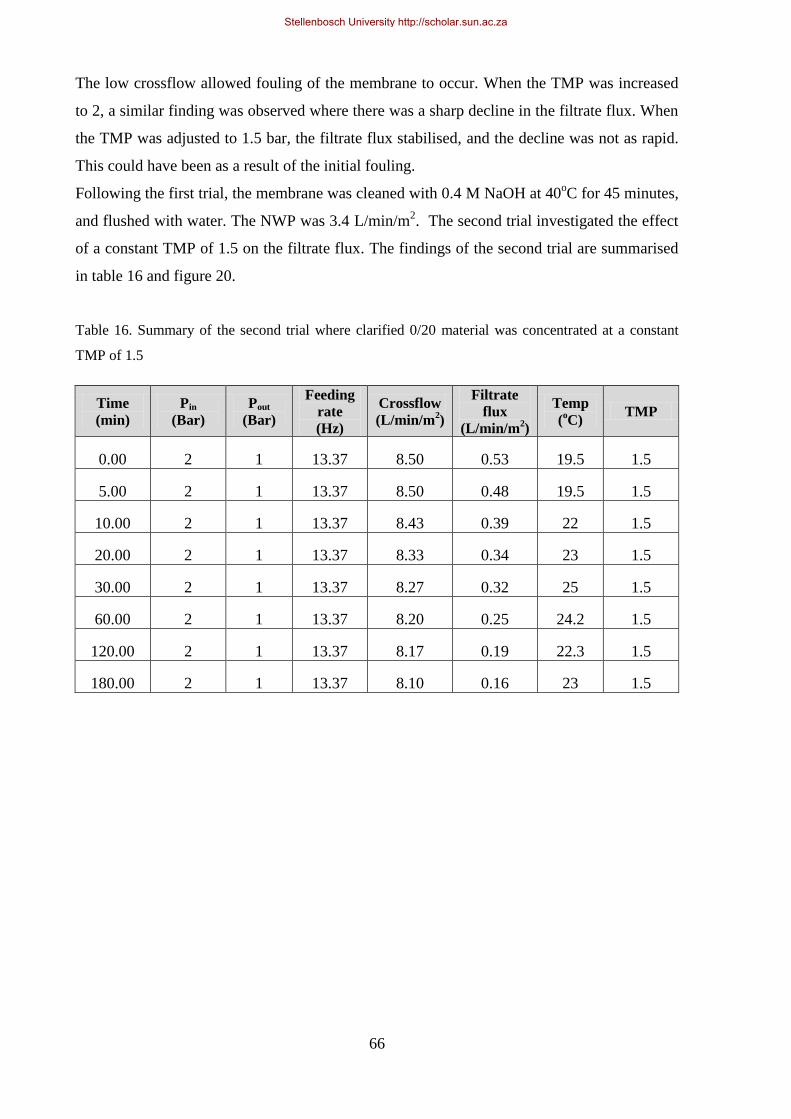
66
The low crossflow allowed fouling of the membrane to occur. When the TMP was increased
to 2, a similar finding was observed where there was a sharp decline in the filtrate flux. When
the TMP was adjusted to 1.5 bar, the filtrate flux stabilised, and the decline was not as rapid.
This could have been as a result of the initial fouling.
Following the first trial, the membrane was cleaned with 0.4 M NaOH at 40oC for 45 minutes,
and flushed with water. The NWP was 3.4 L/min/m2. The second trial investigated the effect
of a constant TMP of 1.5 on the filtrate flux. The findings of the second trial are summarised
in table 16 and figure 20.
Table 16. Summary of the second trial where clarified 0/20 material was concentrated at a constant
TMP of 1.5
Time
(min)
Pin
(Bar)
Pout
(Bar)
Feeding
rate
(Hz)
Crossflow
(L/min/m2)
Filtrate
flux
(L/min/m2)
Temp
(oC)
TMP
0.00 2 1 13.37 8.50 0.53 19.5 1.5
5.00 2 1 13.37 8.50 0.48 19.5 1.5
10.00 2 1 13.37 8.43 0.39 22 1.5
20.00 2 1 13.37 8.33 0.34 23 1.5
30.00 2 1 13.37 8.27 0.32 25 1.5
60.00 2 1 13.37 8.20 0.25 24.2 1.5
120.00 2 1 13.37 8.17 0.19 22.3 1.5
180.00 2 1 13.37 8.10 0.16 23 1.5
Stellenbosch University http://scholar.sun.ac.za

67
Figure 20. The second trial carried out on clarified 0/20 material at a constant TMP of 1.5. A sharp
initial decrease in both filtrate flux and crossflow indicated that the membrane was slightly fouled
until a certain point was reached after an hour where both fluxes stabilised, and the decrease in flux
was gradual (as expected).
The average filtrate flux for this run was 0.33 L/min /m2. This could be directly scaled to an
industrial scale process. The large T-series cassettes had a total surface area of 2.5 m2 per
cassette. Extrapolating the laboratory scale data, a total of 10 cassettes were required to
concentrate the total volume of 4000 L down to approx. 200 L in 8 hours.
The NWP of the membrane after cleaning was 3.3 l/min/m2, which was similar to the NWP
obtained after the first trial, indicating that the cleaning regime used was successful to remove
any organic foulants.
The third trial served as verification for the second trial where a constant TMP of 1.5 was
maintained throughout the production run. For this trial, a higher crossflow was investigated
to see if this would improve the performance of the membrane. The results of the third trial
are summarised in table 17 and figure 21.
Stellenbosch University http://scholar.sun.ac.za
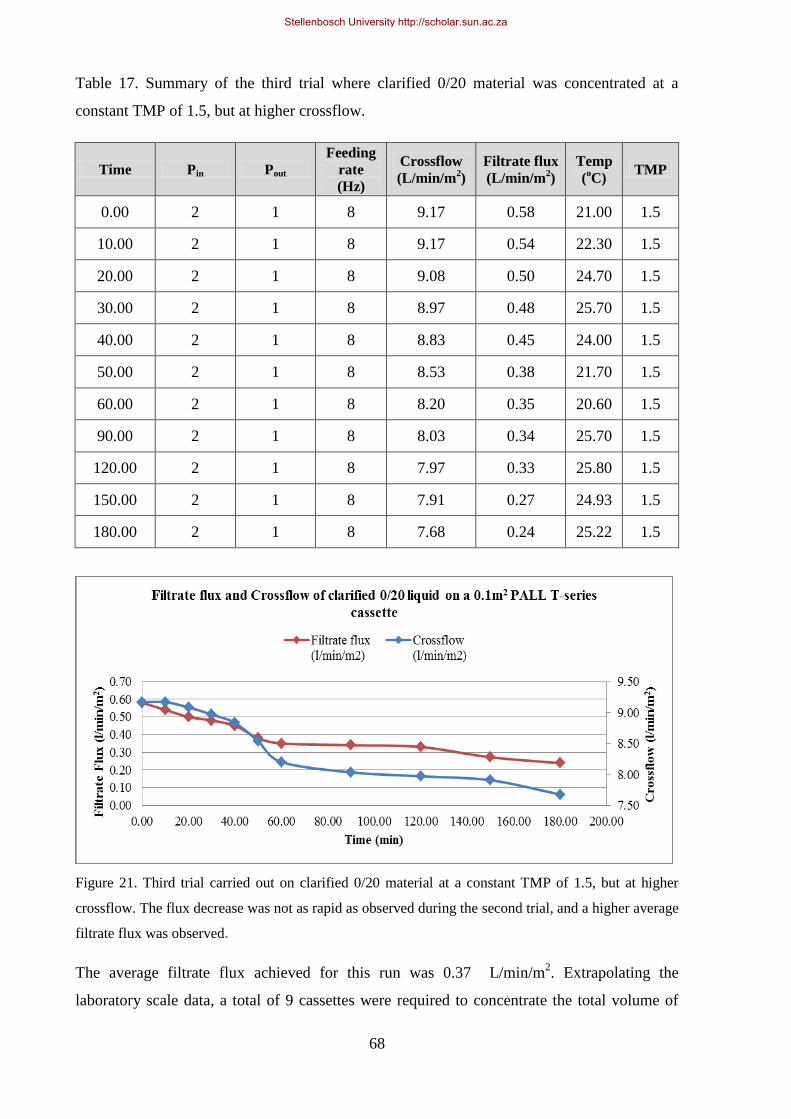
68
Table 17. Summary of the third trial where clarified 0/20 material was concentrated at a
constant TMP of 1.5, but at higher crossflow.
Time Pin Pout
Feeding
rate
(Hz)
Crossflow
(L/min/m2)
Filtrate flux
(L/min/m2)
Temp
(oC)
TMP
0.00 2 1 8 9.17 0.58 21.00 1.5
10.00 2 1 8 9.17 0.54 22.30 1.5
20.00 2 1 8 9.08 0.50 24.70 1.5
30.00 2 1 8 8.97 0.48 25.70 1.5
40.00 2 1 8 8.83 0.45 24.00 1.5
50.00 2 1 8 8.53 0.38 21.70 1.5
60.00 2 1 8 8.20 0.35 20.60 1.5
90.00 2 1 8 8.03 0.34 25.70 1.5
120.00 2 1 8 7.97 0.33 25.80 1.5
150.00 2 1 8 7.91 0.27 24.93 1.5
180.00 2 1 8 7.68 0.24 25.22 1.5
Figure 21. Third trial carried out on clarified 0/20 material at a constant TMP of 1.5, but at higher
crossflow. The flux decrease was not as rapid as observed during the second trial, and a higher average
filtrate flux was observed.
The average filtrate flux achieved for this run was 0.37 L/min/m2. Extrapolating the
laboratory scale data, a total of 9 cassettes were required to concentrate the total volume of
Stellenbosch University http://scholar.sun.ac.za
69
4000 L down to approximately 200 L in 8 hours. This compared well with the results obtained
in the second trial (see figure 20). The NWP of the membrane after cleaning was again
3.3 L/min/m2 which was again similar to the NWP obtained the first trial, and exactly the
same as that measured for the second trial, confirming that the cleaning regime used was
successful.
The filtrate was tested for trypsin, deoxyribonuclease and ribonuclease activity. No activity
could be indicated for any of these enzymes showing that there was no passing of these
enzymes through the membrane, proving that the membrane successfully retained all the
desired enzymes.
5.1.4. CONCLUSION
The 10 kDa PALL T-series cassette was capable of fully retaining the zymogens under the
defined conditions, even when the clarified 0/20 material was concentrated up to 20 fold. The
flow characteristics of the 0.1 m2 test membrane indicated that it was capable of achieving the
desired volume reduction within a 16-hour period by using 15 membranes. The running
conditions were defined at a constant TMP of 1.5 with an inlet pressure of 2 Bar and an outlet
pressure of 1 Bar. After multiple concentration cycles, the NWP remained constant, indicating
that no irreversible membrane fouling was observed as a result of the nature of the liquid
product.
It was recommended that appropriate pre-filtration system was to be installed prior to the
cassette inlets. The risk of damage to the membranes was high as there was upstream
clarification using diatomaceous earth as a filtration medium, which could cause irreversible
membrane fouling. The installation of an ultrafiltration unit had major financial benefits as the
overall raw material inputs (A/S) were reduced significantly, and the processing time was
reduced with 5 days.
Stellenbosch University http://scholar.sun.ac.za
70
5.2 CHROMATOGRAPHY DEVELOPMENT TO SEPARATE TRYPSIN(OGEN)
FROM CHYMOTRYPSIN(OGEN)
5.2.1. INTRODUCTION
The traditional purification methodologies used to purify both trypsin and chymotrypsin were
extremely time-consuming due to a series of crystallization and precipitation stages, in the
case of trypsin being up to 7 days, and in the case of chymotrypsinogen a total of three days
of crystallization. With the increased demand for these products, it was essential to find new
ways to increase the throughput during the secondary purification stages. Liquid
chromatography was a technique already used elsewhere within the organization with great
success, and was considered for the purification of both trypsin and chymotrypsin.
Figure 22 illustrates the three different kinds of liquid chromatography techniques were
considered for purification of the enzymes: Affinity chromatography using P-amino-
Benzamidine resin to purify trypsin specifically, Hydrophobic Interaction chromatography
(Phenyl Sepharose) and Ion Exchange chromatography (weak cation exchange resin, Carboxy
Methyl (CM) sepharose).
Affinity Chromatography focussed on the separation of activated trypsin from chymotrypsin
as a means to purify trypsin, Hydrophobic Interaction chromatography (HIC) focussed on the
separation of the zymogens as a potential replacement of the zymogen separation and Ion
Exchange chromatography focussed on the separation of both the active enzymes and the
zymogens from each other (the zymogens were separately investigated from the active
enzymes).
The investigation of the implementation of column chromatography during the secondary
purification process was performed to devise methods to increase the overall processing time
(to replace the crystallization stages) and to recover more enzymes during the secondary
purification that would ultimately contribute to higher yields being achieved. The aim was to
develop a purification strategy that would be able to produce products that are in compliance
with the product specifications as set out in tables 2 and 3.
Stellenbosch University http://scholar.sun.ac.za
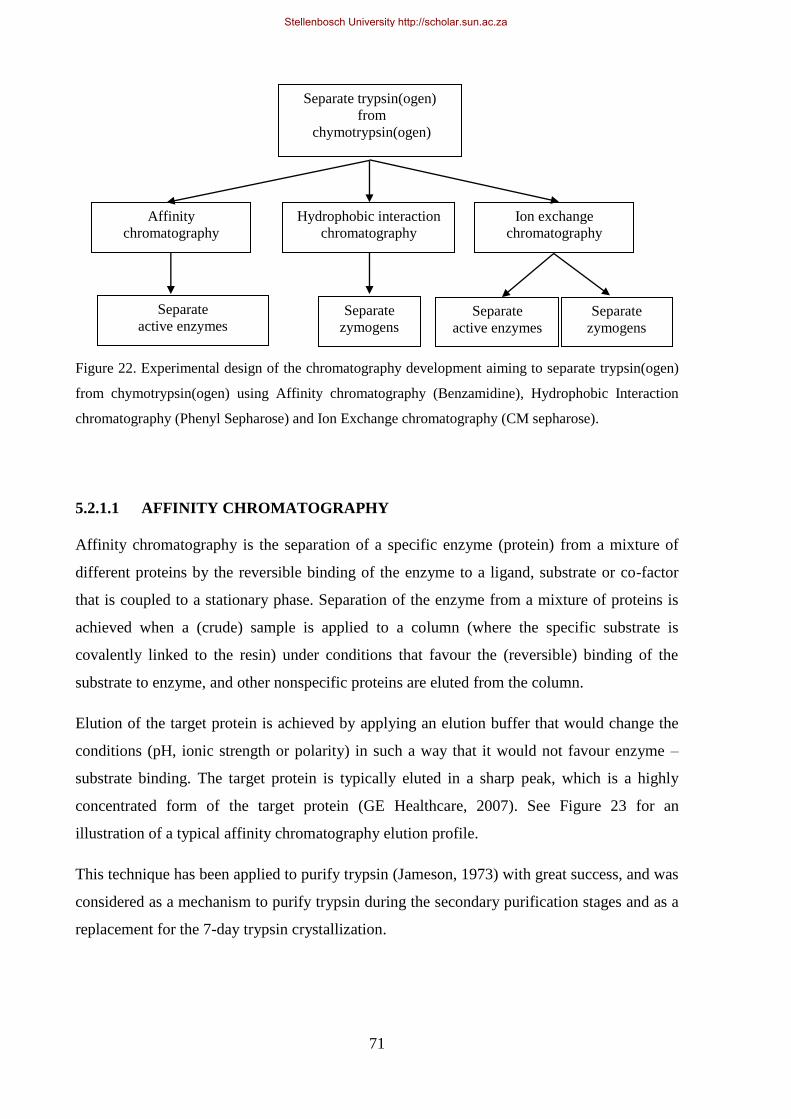
71
Figure 22. Experimental design of the chromatography development aiming to separate trypsin(ogen)
from chymotrypsin(ogen) using Affinity chromatography (Benzamidine), Hydrophobic Interaction
chromatography (Phenyl Sepharose) and Ion Exchange chromatography (CM sepharose).
5.2.1.1 AFFINITY CHROMATOGRAPHY
Affinity chromatography is the separation of a specific enzyme (protein) from a mixture of
different proteins by the reversible binding of the enzyme to a ligand, substrate or co-factor
that is coupled to a stationary phase. Separation of the enzyme from a mixture of proteins is
achieved when a (crude) sample is applied to a column (where the specific substrate is
covalently linked to the resin) under conditions that favour the (reversible) binding of the
substrate to enzyme, and other nonspecific proteins are eluted from the column.
Elution of the target protein is achieved by applying an elution buffer that would change the
conditions (pH, ionic strength or polarity) in such a way that it would not favour enzyme –
substrate binding. The target protein is typically eluted in a sharp peak, which is a highly
concentrated form of the target protein (GE Healthcare, 2007). See Figure 23 for an
illustration of a typical affinity chromatography elution profile.
This technique has been applied to purify trypsin (Jameson, 1973) with great success, and was
considered as a mechanism to purify trypsin during the secondary purification stages and as a
replacement for the 7-day trypsin crystallization.
Separate trypsin(ogen)
from
chymotrypsin(ogen)
Affinity
chromatography
Hydrophobic interaction
chromatography
Ion exchange
chromatography
Separate
active enzymes Separate
zymogens Separate
zymogens
Separate
active enzymes
Stellenbosch University http://scholar.sun.ac.za
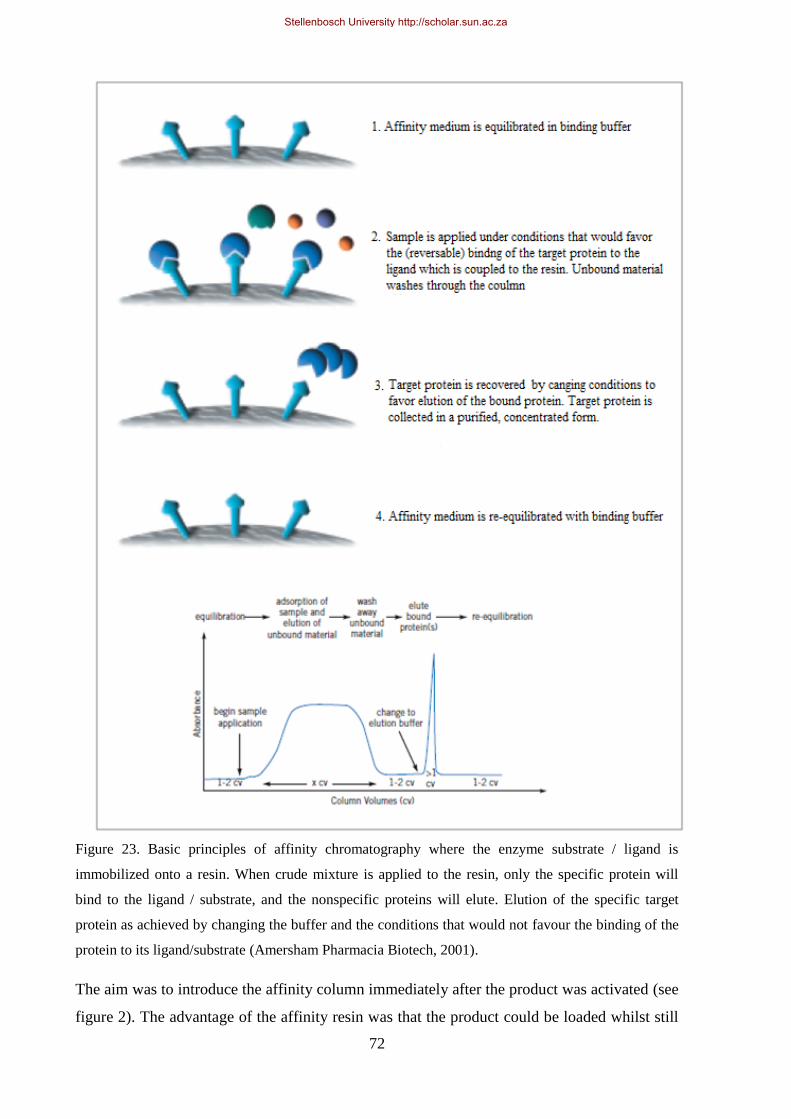
72
Figure 23. Basic principles of affinity chromatography where the enzyme substrate / ligand is
immobilized onto a resin. When crude mixture is applied to the resin, only the specific protein will
bind to the ligand / substrate, and the nonspecific proteins will elute. Elution of the specific target
protein as achieved by changing the buffer and the conditions that would not favour the binding of the
protein to its ligand/substrate (Amersham Pharmacia Biotech, 2001).
The aim was to introduce the affinity column immediately after the product was activated (see
figure 2). The advantage of the affinity resin was that the product could be loaded whilst still
Stellenbosch University http://scholar.sun.ac.za
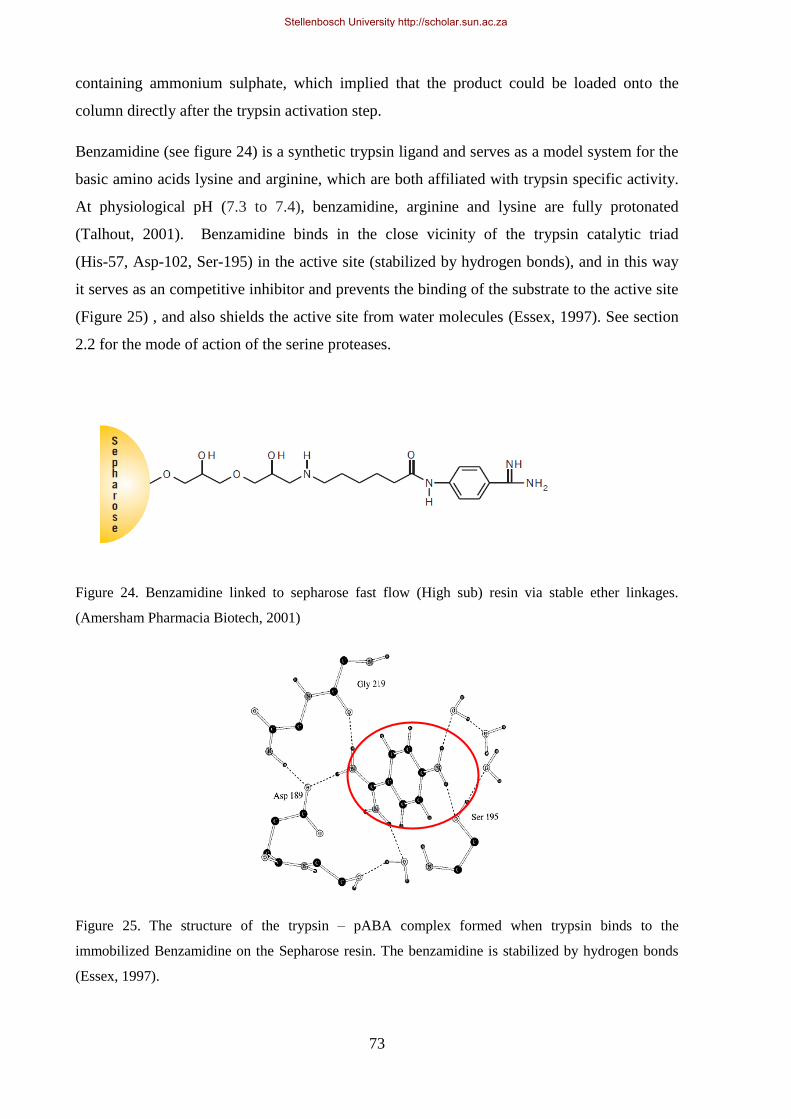
73
containing ammonium sulphate, which implied that the product could be loaded onto the
column directly after the trypsin activation step.
Benzamidine (see figure 24) is a synthetic trypsin ligand and serves as a model system for the
basic amino acids lysine and arginine, which are both affiliated with trypsin specific activity.
At physiological pH (7.3 to 7.4), benzamidine, arginine and lysine are fully protonated
(Talhout, 2001). Benzamidine binds in the close vicinity of the trypsin catalytic triad
(His-57, Asp-102, Ser-195) in the active site (stabilized by hydrogen bonds), and in this way
it serves as an competitive inhibitor and prevents the binding of the substrate to the active site
(Figure 25) , and also shields the active site from water molecules (Essex, 1997). See section
2.2 for the mode of action of the serine proteases.
Figure 24. Benzamidine linked to sepharose fast flow (High sub) resin via stable ether linkages.
(Amersham Pharmacia Biotech, 2001)
Figure 25. The structure of the trypsin – pABA complex formed when trypsin binds to the
immobilized Benzamidine on the Sepharose resin. The benzamidine is stabilized by hydrogen bonds
(Essex, 1997).
Stellenbosch University http://scholar.sun.ac.za
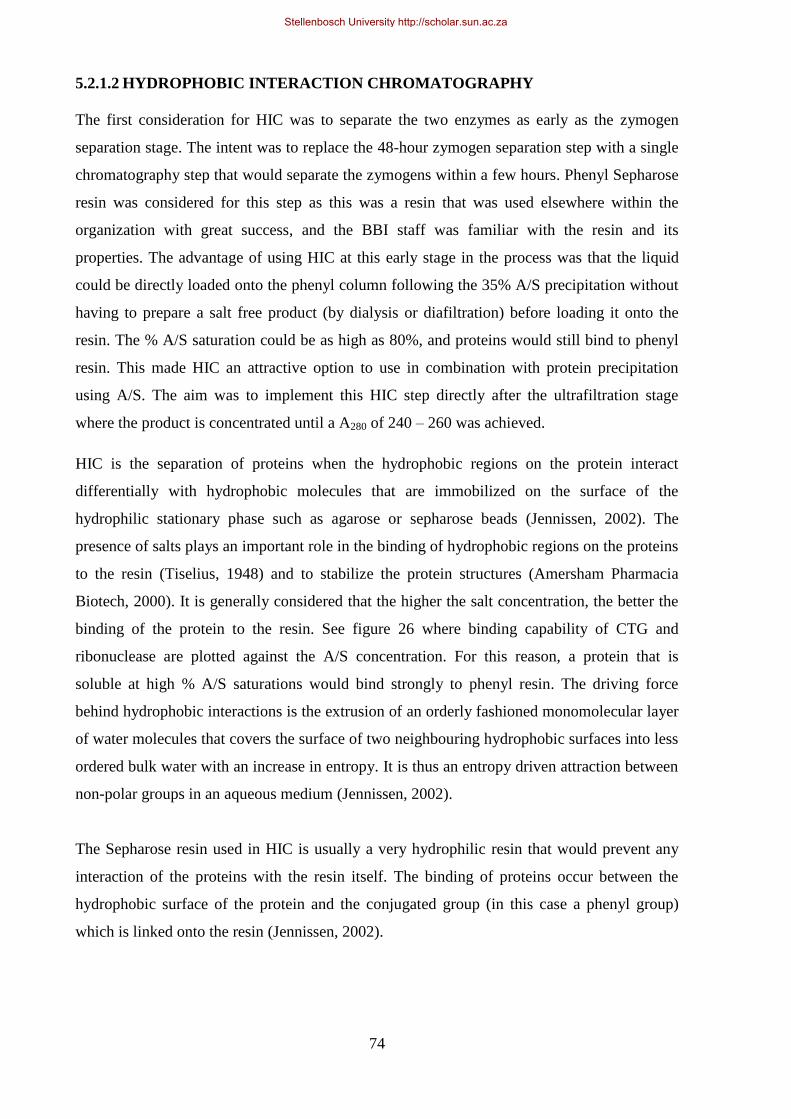
74
5.2.1.2 HYDROPHOBIC INTERACTION CHROMATOGRAPHY
The first consideration for HIC was to separate the two enzymes as early as the zymogen
separation stage. The intent was to replace the 48-hour zymogen separation step with a single
chromatography step that would separate the zymogens within a few hours. Phenyl Sepharose
resin was considered for this step as this was a resin that was used elsewhere within the
organization with great success, and the BBI staff was familiar with the resin and its
properties. The advantage of using HIC at this early stage in the process was that the liquid
could be directly loaded onto the phenyl column following the 35% A/S precipitation without
having to prepare a salt free product (by dialysis or diafiltration) before loading it onto the
resin. The % A/S saturation could be as high as 80%, and proteins would still bind to phenyl
resin. This made HIC an attractive option to use in combination with protein precipitation
using A/S. The aim was to implement this HIC step directly after the ultrafiltration stage
where the product is concentrated until a A280 of 240 – 260 was achieved.
HIC is the separation of proteins when the hydrophobic regions on the protein interact
differentially with hydrophobic molecules that are immobilized on the surface of the
hydrophilic stationary phase such as agarose or sepharose beads (Jennissen, 2002). The
presence of salts plays an important role in the binding of hydrophobic regions on the proteins
to the resin (Tiselius, 1948) and to stabilize the protein structures (Amersham Pharmacia
Biotech, 2000). It is generally considered that the higher the salt concentration, the better the
binding of the protein to the resin. See figure 26 where binding capability of CTG and
ribonuclease are plotted against the A/S concentration. For this reason, a protein that is
soluble at high % A/S saturations would bind strongly to phenyl resin. The driving force
behind hydrophobic interactions is the extrusion of an orderly fashioned monomolecular layer
of water molecules that covers the surface of two neighbouring hydrophobic surfaces into less
ordered bulk water with an increase in entropy. It is thus an entropy driven attraction between
non-polar groups in an aqueous medium (Jennissen, 2002).
The Sepharose resin used in HIC is usually a very hydrophilic resin that would prevent any
interaction of the proteins with the resin itself. The binding of proteins occur between the
hydrophobic surface of the protein and the conjugated group (in this case a phenyl group)
which is linked onto the resin (Jennissen, 2002).
Stellenbosch University http://scholar.sun.ac.za
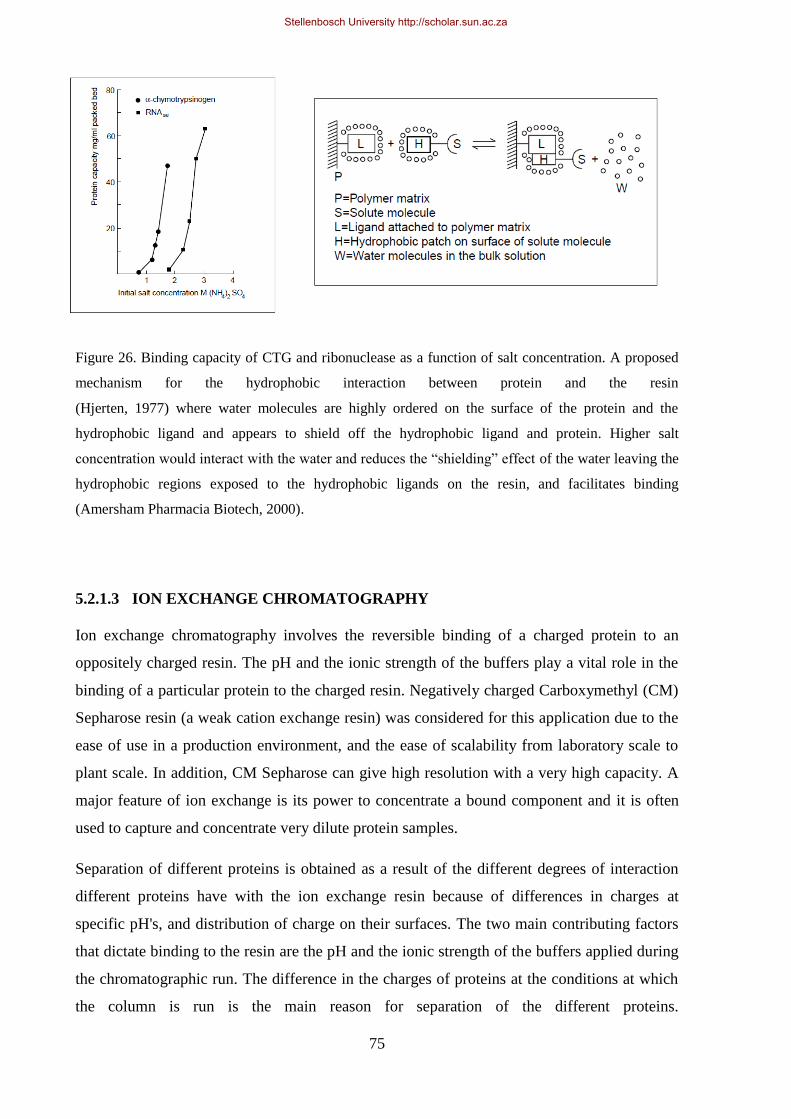
75
Figure 26. Binding capacity of CTG and ribonuclease as a function of salt concentration. A proposed
mechanism for the hydrophobic interaction between protein and the resin
(Hjerten, 1977) where water molecules are highly ordered on the surface of the protein and the
hydrophobic ligand and appears to shield off the hydrophobic ligand and protein. Higher salt
concentration would interact with the water and reduces the “shielding” effect of the water leaving the
hydrophobic regions exposed to the hydrophobic ligands on the resin, and facilitates binding
(Amersham Pharmacia Biotech, 2000).
5.2.1.3 ION EXCHANGE CHROMATOGRAPHY
Ion exchange chromatography involves the reversible binding of a charged protein to an
oppositely charged resin. The pH and the ionic strength of the buffers play a vital role in the
binding of a particular protein to the charged resin. Negatively charged Carboxymethyl (CM)
Sepharose resin (a weak cation exchange resin) was considered for this application due to the
ease of use in a production environment, and the ease of scalability from laboratory scale to
plant scale. In addition, CM Sepharose can give high resolution with a very high capacity. A
major feature of ion exchange is its power to concentrate a bound component and it is often
used to capture and concentrate very dilute protein samples.
Separation of different proteins is obtained as a result of the different degrees of interaction
different proteins have with the ion exchange resin because of differences in charges at
specific pH's, and distribution of charge on their surfaces. The two main contributing factors
that dictate binding to the resin are the pH and the ionic strength of the buffers applied during
the chromatographic run. The difference in the charges of proteins at the conditions at which
the column is run is the main reason for separation of the different proteins.
Stellenbosch University http://scholar.sun.ac.za
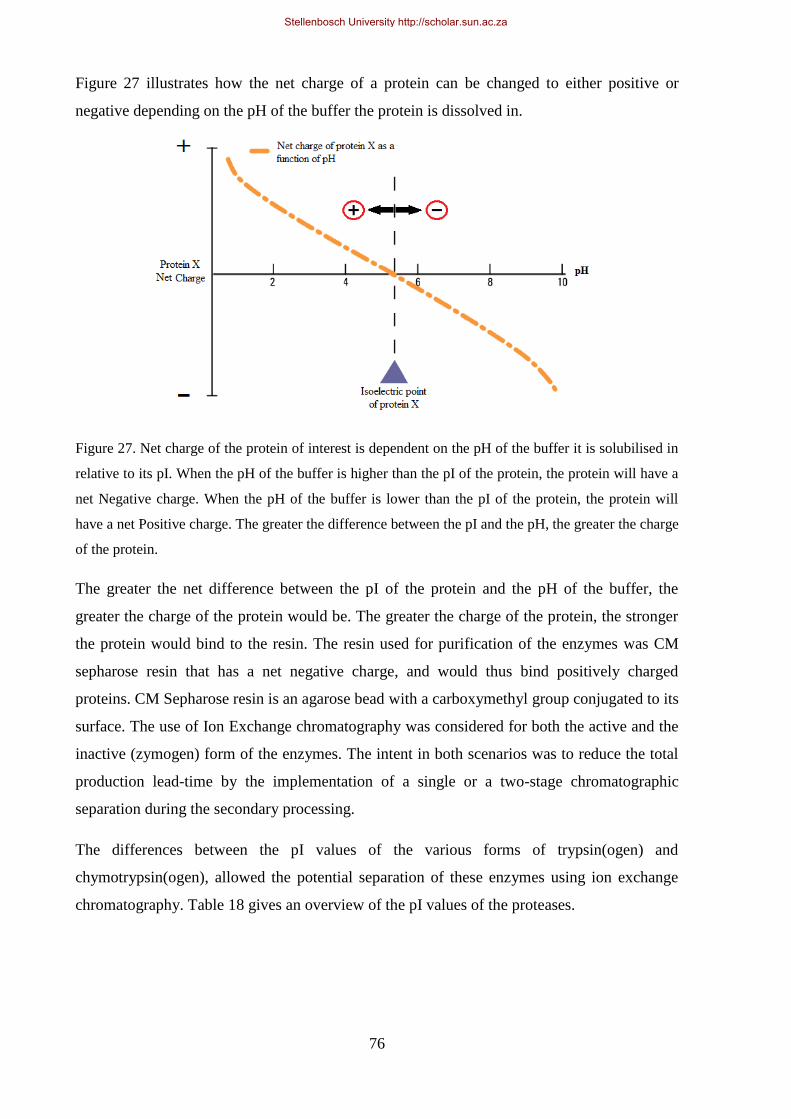
76
Figure 27 illustrates how the net charge of a protein can be changed to either positive or
negative depending on the pH of the buffer the protein is dissolved in.
Figure 27. Net charge of the protein of interest is dependent on the pH of the buffer it is solubilised in
relative to its pI. When the pH of the buffer is higher than the pI of the protein, the protein will have a
net Negative charge. When the pH of the buffer is lower than the pI of the protein, the protein will
have a net Positive charge. The greater the difference between the pI and the pH, the greater the charge
of the protein.
The greater the net difference between the pI of the protein and the pH of the buffer, the
greater the charge of the protein would be. The greater the charge of the protein, the stronger
the protein would bind to the resin. The resin used for purification of the enzymes was CM
sepharose resin that has a net negative charge, and would thus bind positively charged
proteins. CM Sepharose resin is an agarose bead with a carboxymethyl group conjugated to its
surface. The use of Ion Exchange chromatography was considered for both the active and the
inactive (zymogen) form of the enzymes. The intent in both scenarios was to reduce the total
production lead-time by the implementation of a single or a two-stage chromatographic
separation during the secondary processing.
The differences between the pI values of the various forms of trypsin(ogen) and
chymotrypsin(ogen), allowed the potential separation of these enzymes using ion exchange
chromatography. Table 18 gives an overview of the pI values of the proteases.
Stellenbosch University http://scholar.sun.ac.za
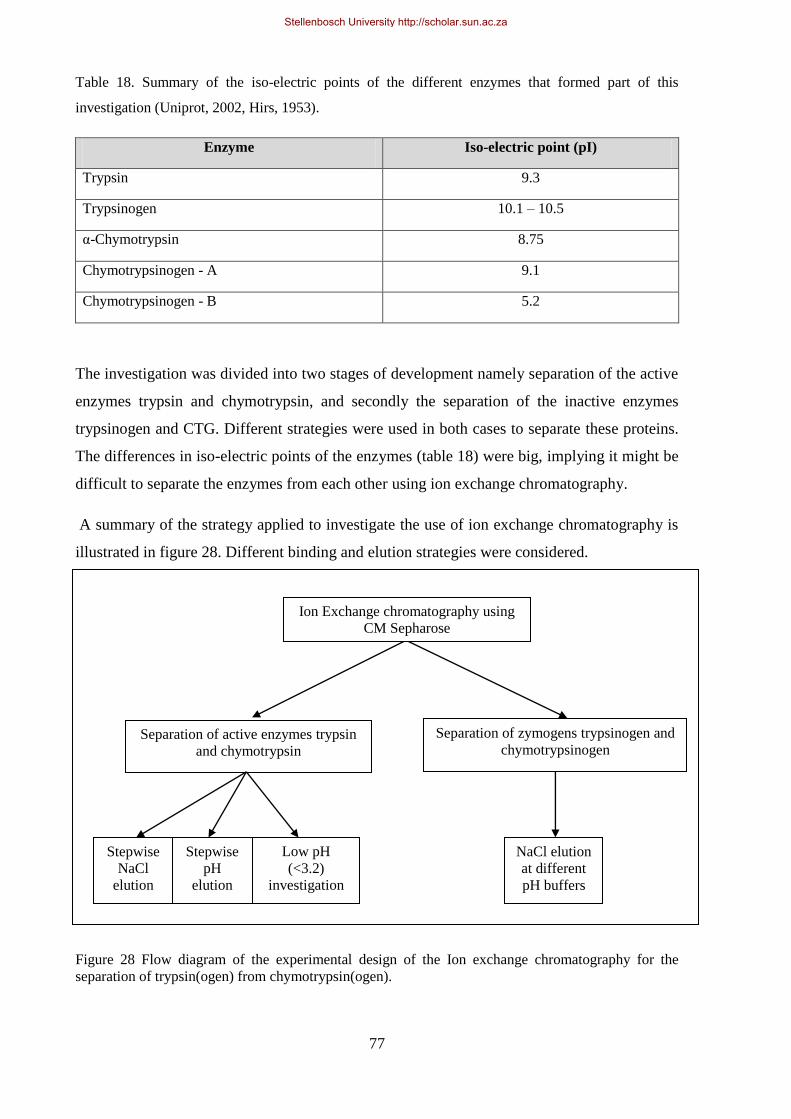
77
Table 18. Summary of the iso-electric points of the different enzymes that formed part of this
investigation (Uniprot, 2002, Hirs, 1953).
Enzyme Iso-electric point (pI)
Trypsin 9.3
Trypsinogen 10.1 – 10.5
α-Chymotrypsin 8.75
Chymotrypsinogen - A 9.1
Chymotrypsinogen - B 5.2
The investigation was divided into two stages of development namely separation of the active
enzymes trypsin and chymotrypsin, and secondly the separation of the inactive enzymes
trypsinogen and CTG. Different strategies were used in both cases to separate these proteins.
The differences in iso-electric points of the enzymes (table 18) were big, implying it might be
difficult to separate the enzymes from each other using ion exchange chromatography.
A summary of the strategy applied to investigate the use of ion exchange chromatography is
illustrated in figure 28. Different binding and elution strategies were considered.
Figure 28 Flow diagram of the experimental design of the Ion exchange chromatography for the
separation of trypsin(ogen) from chymotrypsin(ogen).
Separation of zymogens trypsinogen and
chymotrypsinogen
NaCl elution
at different
pH buffers
Separation of active enzymes trypsin
and chymotrypsin
Stepwise
NaCl
elution
Stepwise
pH
elution
Low pH
(<3.2)
investigation
Ion Exchange chromatography using
CM Sepharose
Stellenbosch University http://scholar.sun.ac.za
78
5.2.2. MATERIALS AND METHODS
5.2.2.1 AFFINITY CHROMATOGRAPHY
Benzamidine Sepharose 4 fast flow (high sub) resin was used for the affinity chromatography
development of trypsin. Resin samples were obtained from GE Healthcare (GE healthcare,
Uppsala, Sweden, product # 17-5123-10). The binding capacity of the affinity resin was ≥35
mg trypsin/ml resin as specified by GE Healthcare. The implication thereof was that for
production scale processing, approximately 56 L of resin was required for a 1.4 t extraction
batch at a yield of 1.4 kg/t.
A 20 ml benzamidine column was packed in a clear 1.5 X 20 cm Perspex column under
gravity. The benzamidine resin was equilibrated with 10 column volumes of equilibration
buffer consisting of 0.05 M Tris-HCl, 0.5 M NaCl, pH 7.4. All chemicals used during this
investigation were obtained from Sigma (Sigma Life sciences, St. Louis, USA). The column
was fed using a Gilson MINIPLUS 3 peristaltic pump at a constant feeding rate of 1.5 ml/min.
Fractions (6.5 ml) were collected using a Pharmacia Biotech FRAC-100 fraction collector and
assayed for protein content (A280) with a Schimadzu UV-1601 spectrophotometer. An in-line
UV detector (Gilson 112 UV/VIS) was installed to monitor the elution profile. This
instrument was used for indication purposes only, to visualise the elution profile in real-time.
The A280 values obtained of each fraction were used to plot elution profiles of the enzymes.
Trypsin activity assays were performed using the trypsin microtitre assay that was developed
for this project (described in section 6.4).
Two different loading and elution conditions were investigated for the purification of trypsin.
Both methods were derived from the instruction manual booklet that came as an appendix
with the resin.
Experiment 1
The first experiment was conducted exactly according to GE Healthcare prescribed method
(GE Healthcare, 2007) to mimic the elution of trypsin as described by the supplier.
Commercial preparations of lyophilised trypsin and chymotrypsin were obtained from Sigma
(Sigma life sciences, St. Louis, USA, trypsin product# T8003-1G, chymotrypsin product#
Stellenbosch University http://scholar.sun.ac.za
79
C4129). The samples were prepared (10 mg/ml) in equilibration buffer (0.05 M Tris-HCl,
0.5 M NaCl, pH 7.4), and 10 ml was loaded onto the column at a constant feeding rate of
1.5ml/min using a Gilson MINIPLUS 3 peristaltic pump. After the sample was loaded onto
the column, the column was washed with washing buffer (0.05 M Tris-HCl, 0.5 M NaCl, pH
7.4) at 1.5 ml/min until the A280 of the eluate had reached a stable baseline (as visualised by
the in-line UV detector). Once a baseline was reached, the column was eluted at a flow rate of
1.5 ml/min with elution buffer ( 0.05 M Glycine buffer, pH 3.00) until the A280 of the eluate
had reached a stable baseline.
Fractions (6.5 ml) were collected for A280 determinations with a Pharmacia Biotech FRAC-
100 fraction collector, and the A280 of the fractions was determined using a Schimadzu UV-
1601 spectrophotometer. An in-line UV detector (Gilson 112 UV/VIS) was installed to
monitor the elution profile. The A280 values of the collected fractions were plotted to establish
an elution profile for both enzymes.
Experiment 2
After an elution profile was obtained using the prescribed method as specified by GE
Healthcare, the elution profile of trypsin in the presence of 35% A/S was investigated. The
aim of this investigation was to determine if there was any difference between the two elution
profiles with and without A/S present. This experiment was conducted to investigate the
implementation of a benzamidine column step directly after trypsin was activated in the
process (see figure 2). Activated trypsin material collected from the factory floor (containing
0.02 M Tris-HCl, 0.02 M CaCl2, 35% A/.S, pH 8.0) was used for this trial.
The column was equilibrated with equilibration buffer (0.05 M Tris-HCl, 0.5 M NaCl, 35%
A/S, pH 7.4). The trypsin sample obtained from the factory floor was loaded onto column
using a Gilson MINIPLUS 3 peristaltic pump at a constant feeding rate of
1.5 ml/min. The column was washed with washing buffer (0.05 M Tris-HCl, 0.5 M NaCl,
35% A/S, pH 7.4) until the A280 of the eluate had reached a stable baseline (as visualised by
the in-line UV detector). Once a baseline was reached, the column was eluted at a flow rate of
1.5 ml/min with Elution buffer: 0.05 M Glycine buffer, pH 3.00 (Sigma Aldrich, St Louis,
USA product # 410225) until the A280 of the eluate had reached a stable baseline.
The fractions collected during experiment 1 and 2 were assayed for protein content and
prepared for lyophilisation. The samples were dialyzed in RO water until salt free prior to
Stellenbosch University http://scholar.sun.ac.za

80
lyophilisation. The lyophilised samples were assayed according to the QC procedures for
trypsin and chymotrypsin content. (Trypsin: appendix 12, Chymotrypsin: appendix 3). After a
chromatographic run, the column was regenerated by washing the column with 2 column
volumes 1 M NaCl, and washed with water until no NaCl was present in the flow through.
Thereafter the column was equilibrated with the loading buffer.
Due to the time constraints placed on the development of this process, each experiment was
only conducted once. If there was a significant finding, the experiment was repeated.
5.2.2.2 HYDROPHOBIC INTERACTION CHROMATOGRAPHY
Phenyl Sepharose, fast flow (High sub) resin obtained from GE Healthcare (GE Healthcare,
Uppsala, Sweden, Product # 17-0973-10) was used for the trials conducted during the trials. A
10 ml (1,2 x 10 cm) column was packed with 7.5 ml resin under gravity and fed with a Gilson
MINIPLUS 3 peristaltic pump at 1.5 ml/min. For all the experiments, 6.5 ml fractions were
collected using a Pharmacia Biotech FRAC-100 fraction collector, and assayed for protein
content (A280) with a Schimadzu UV-1601 spectrophotometer. These values were used to plot
elution profiles of the enzymes. An in-line UV detector (Gilson 112 UV/VIS) was installed to
monitor the elution profile. This instrument was used for indication purposes only, to visualise
the elution profile in real-time.
Purified preparations of trypsinogen and CTG samples were purchased as lyophilized
powders from Sigma (Sigma life sciences, St. Louis, USA. Trypsinogen product # T1143-1G,
CTG product # C4879-1G ). Trypsinogen and CTG samples were prepared (2.5 mg/ml) in
equilibration buffer (0.05 M Tris-HCl buffer, 35% A/S, pH 8.00.) and were loaded separately
onto two separate columns to determine the individual elution profiles of the pure enzymes.
The two elution profiles of the pure enzymes were superimposed to determine what level of
separation was achieved.
The elution buffer for the two pH studies differed. To investigate HIC at higher pH values, a
Tris-HCl buffer was prepared at pH 8.00, and for the lower pH trials, a sodium Acetate buffer
at pH 3.00 was prepared. Both buffers contained 35% A/S to mimic the reaction conditions on
the factory floor. All experiments were conducted at 23oC in a temperature-controlled
laboratory. All buffers were prepared in advance and stored at 2 – 8 oC, but were allowed to
acclimatise before application to the columns.
Stellenbosch University http://scholar.sun.ac.za
81
Experiment 1
The starting point for the investigation was to investigate the elution profiles of trypsinogen
and CTG at a high pH value (pH 8.00). The column was equilibrated with Tris-HCl buffer,
35% A/S, pH 8.00. The samples were individually prepared (2.5 mg/ml) in 10 ml of a 0.05 M
Tris-HCl buffer, pH 8.00 in 35% A/S. The samples were individually loaded onto two
separate columns with a Gilson MINIPLUS 3 peristaltic pump at a consistent feeding rate of
1.5 ml/min and the column washed with 0.05 M Tris-HCl, 35% A/S, pH 8.00 until a baseline
was achieved (as visualised by the in-line UV detector). Thereafter the samples were eluted
with RO water at 1.5 ml/min until a baseline was achieved. Fractions (6.5 ml) were collected
with a Pharmacia Biotech FRAC-100 fraction collector and the A280 values were determined
for each individual fraction using a Schimadzu UV-1601 spectrophotometer.
The A280 values of each of the fractions were plotted on a graph to establish an elution profile
for each of the enzymes. The elution profiles of trypsinogen and CTG were superimposed to
establish if the two enzymes could be separated under the conditions.
Experiment 2
The second part of the investigation was to investigate the elution profile of trypsinogen and
CTG at a low pH buffer, pH 3.00. The column was equilibrated with 35% A/S, pH 3.00. The
samples were individually prepared (2.5 mg/ml) in 10 ml of a 0.05 M sodium acetate buffer,
pH 3.00 in 35% A/S. The samples were individually loaded onto two separate columns with a
Gilson MINIPLUS 3 peristaltic pump at a consistent feeding rate of 1.5 ml/min. The column
was washed with 0.05 M sodium acetate buffer until a baseline was achieved (as visualised by
the in-line UV detector), followed by elution with RO water at 1.5 ml/min. Fractions (6.5ml)
were collected with a Pharmacia Biotech FRAC-100 fraction collector and tested for protein
content using a Schimadzu UV-1601 spectrophotometer.
The A280 values of each of the fractions were plotted on a graph to establish an elution profile
for each of the enzymes. The elution profiles of trypsinogen and CTG were superimposed to
establish if the two enzymes could be separated under the conditions.
Stellenbosch University http://scholar.sun.ac.za
82
5.2.2.3 ION EXCHANGE CHROMATOGRAPHY OF TRYPSIN AND
CHYMOTRYPSIN USING CM SEPHAROSE RESIN
To determine the elution profile of the active enzymes, purified preparations of trypsin and
chymotrypsin were purchased from Sigma (Sigma life sciences, St. Louis, USA) as
lyophilized powders.
A 10 ml CM sepharose column was packed under gravity in a 1.2 x 10 cm clear Perspex
column housing with 7.5 ml of resin. CM Sepharose (fast flow) resin was obtained from GE
healthcare (GE Healthcare, Uppsala, Sweden, Product # 17-0719-10) as a free sample. The
column was fed with a Gilson MINIPLUS 3 peristaltic pump at a consistent feeding rate of
1.5 ml/min. 6.5 ml fractions were collected with a Pharmacia Biotech FRAC-100 fraction
collector, and the A280 of the fractions was determined using a Schimadzu UV-1601
spectrophotometer. An in-line UV detector (Gilson 112 UV/VIS) was installed to monitor the
elution profile. This instrument was used for indication purposes only, to visualise the elution
profile in real-time.
All samples were prepared from a fresh weighing of lyophilized powder obtained from Sigma
(Sigma life sciences, St. Louis, USA. Trypsin product # T8003-1G, chymotrypsin product #
C4129-1G). All experiments were conducted at 23oC in a temperature-controlled laboratory.
All buffers were prepared in advance and stored at 2 – 8 oC, but were allowed to acclimatise
before application to the columns. After every chromatographic run, the column was
regenerated using 1 M NaCl and 1 M NaOH to remove any bound proteins, and subsequently
equilibrated with the loading buffer of the next experiment.
The different techniques used to load and elute the enzymes included; 1) a stepwise NaCl
elution where the ionic strength of the buffer was changed and the pH of the buffer kept
constant. Increasing concentrations of NaCl in the elution buffer was considered in an attempt
to separate trypsin and chymotrypsin. 2) A stepwise pH elution where the pH of the buffer
was changed and the ionic strength was kept constant and 3) using CaCl2 as an elution buffer.
Stellenbosch University http://scholar.sun.ac.za
83
Experiment 1
The starting point for the investigation was to investigate the elution profile of trypsin and
chymotrypsin with a stepwise NaCl elution at low pH (pH 3.2). Trypsin and chymotrypsin
samples were prepared (2.5 mg/ml) in 10 ml of 0.05 M sodium acetate buffer, pH 3.2 and
were loaded separately onto two separate columns at a flow rate of 1.5 ml/min using a Gilson
MINIPLUS 3 peristaltic pump. Three different eluting buffers were prepared containing
increasing concentrations of NaCl (100 mM, 125 mM and 1 M NaCl in a 0.05 M Sodium
acetate buffer, pH 3.2). The column was eluted with the eluting buffers. After each elution,
the A280 was allowed to stabilise before applying the next elution buffer. Fractions (6.5ml)
were collected and the A280 of each of the fractions was determined and plotted on a graph to
establish an elution profile for each of the enzymes. The elution profiles were superimposed
to establish if the two enzymes could be separated under these conditions.
Experiment 2
The effect of a stepwise (increasing) pH elution was investigated. A chymotrypsin sample
was prepared (2.5 mg/ml) in 10 ml of 0.05 M sodium acetate, 0.05 M NaCl, pH 3.2 buffer.
The column was equilibrated with 0.05 M sodium acetate, 0.05 M NaCl, pH 3.2 buffer.
Prepared chymotrypsin sample was loaded onto the column at a flow rate of 1.5 ml/min using
a Gilson MINIPLUS 3 peristaltic pump. Four different eluting buffers were prepared with
varying pH values ranging from 4.0 – 5.5. A: 50 mM Na/Ac, 50 mM NaCl, pH 4.0 buffer,
B: 50 mM Na/Ac, 50 mM NaCl, pH 4.5 buffer, C: 50 mM Na/Ac, 50 mM NaCl, pH 5.0
buffer, D: 50 mM Na/Ac, 50 mM NaCl, pH 5.5.
The column was eluted with the eluting buffers. After each elution, the A280 was allowed to
stabilise before applying the next elution buffer. Fractions (6.5ml) were collected and the
A280 of each of the fractions was determined and plotted on a graph to establish an elution
profile for chymotrypsin. The protein content of each of the fractions was determined and
plotted on a graph to establish an elution profile for each of the enzymes. The elution profile
of chymotrypsin was assessed to see if separation from trypsin was possible.
Stellenbosch University http://scholar.sun.ac.za
84
Experiment 3
Following the stepwise pH elution trials, this experiment was conducted to investigate the
elution profile of trypsin and chymotrypsin with a stepwise NaCl elution at pH 5.5 with
increasing concentrations of NaCl ranging from 75 mM to 1 M NaCl. Trypsin and
chymotrypsin samples were prepared (2.5 mg/ml) in 10 ml of 0.05 M sodium acetate, 0.05 M
NaCl buffer, pH 5.5. Trypsin and chymotrypsin samples were loaded separately onto two
separate columns at a flow rate of 1.5 ml/min using a Gilson MINIPLUS 3 peristaltic pump.
The column was equilibrated with 0.05 M sodium acetate, pH 5.5 buffer. Four different
eluting buffers were prepared with increasing NaCl concentrations ranging from 75 mM to
150 mM. Elution buffer A: 0.05 M sodium acetate, 0.075 M NaCl, pH 5.5, elution buffer B: 0.05 M
sodium acetate, 0.1 M NaCl, pH 5.5, elution buffer C: 0.05 M sodium acetate, 0.125 M NaCl, pH 5.5
and elution buffer D: 0.05 M sodium acetate, 0.15M NaCl, pH 5.5.
The column was eluted with the eluting buffers as specified. After each elution, the A280 was
allowed to stabilise before applying the next elution buffer. Fractions (6.5 ml) were collected
and the A280 of each of the fractions was determined and plotted on a graph to establish an
elution profile for each of the enzymes. The protein content of each of the fractions were
determined and plotted on a graph to establish an elution profile for each of the enzymes. The
elution profiles were superimposed to establish if the two enzymes could be separated under
the chromatographic conditions.
Experiment 4
Trypsin is at risk of auto activation at higher pH values. The elution profile of trypsin and
chymotrypsin at low pH (pH <3.00) prevented the activation of trypsin. This experiment
investigated the ability of CM resin at a very low pH to separate trypsin and chymotrypsin.
The column was equilibrated with 0.05 M Glycine-HCl buffer, pH 3.2. Three different eluting
buffers were prepared with decreasing pH values ranging from 3.2 – 2.6. Buffer A: 50 mM
Glycine-HCl buffer, pH 3.2, buffer B: 50 mM Glycine-HCl buffer, pH 2.8 and buffer
C: 50 mM Glycine-HCl buffer, pH 2.6.
Trypsin and chymotrypsin samples were prepared at 2.5 mg/ml in 10 ml of 50 mM Glycine-
HCl buffer, pH 3.2, and were loaded separately onto two separate columns at a flow rate of
Stellenbosch University http://scholar.sun.ac.za

85
1.5 ml/min using a Gilson MINIPLUS 3 peristaltic. The enzymes were eluted in a stepwise
manner with 50 mM Glycine-HCl buffer at decreasing pH‟s.
The column was eluted with the eluting buffers as specified. After each elution, the A280 was
allowed to stabilise before applying the next elution buffer. Fractions (6.5 ml) were collected
and the A280 of each of the fractions was determined and plotted on a graph to establish an
elution profile for each of the enzymes. The elution profiles were superimposed to establish if
the two enzymes could be separated under the chromatographic conditions.
5.2.2.4 ION EXCHANGE CHROMATOGRAPHY OF TRYPSINOGEN AND
CHYMOTRYPSINOGEN USING CM SEPHAROSE RESIN
The only technique used during the investigation of separation of the zymogens using Ion
Exchange chromatography was considering different elution conditions of increasing
concentrations of NaCl at three different pH values. The intent of this step was to replace the
zymogen separation to allow rapid and efficient separation of the zymogens using ion
exchange chromatography. A new 7.5 ml CM Sepharose column was packed under gravity in
a
1.5 x 15 cm clear Perspex column with fresh resin for these experiments. CM Sepharose (fast
flow) resin was obtained from GE healthcare (GE Healthcare, Uppsala, Sweden, Product #
17-0719-10) as a free sample.
Sigma lyophilized material (Sigma life sciences, St. Louis, USA. Trypsinogen product #
T1143-1G, CTG product # C4879-1G ) was used for the preparation of all the samples in
order to establish elution profiles for the pure enzymes before sample material from the
factory was used.
Two pH buffers were considered for the separation of trypsinogen and CTG using CM
sepharose. Sodium phosphate buffers were used for the preparation of the samples because of
the buffering capacity. The buffering capacity of Sodium phosphate buffer was higher than
that of Sodium acetate buffer, as shown below.
- Buffering range of sodium acetate: pH 3.7 - 5.6. (Sigma Chemicals, 2003)
- Buffering range of sodium phosphate: pH 5.8 – 8.5 (Sigma Chemicals, 2003)
Stellenbosch University http://scholar.sun.ac.za

86
Experiment 1
The first experiment was the investigation of the elution profile of trypsinogen and CTG when
loaded onto a CM Sepharose column at high pH values (pH 8.45) and eluted with increasing
concentrations of NaCl.
Trypsinogen and CTG were individually prepared at 13.3mg/ml in 15 ml of a 0.05 M sodium
phosphate buffer, pH 8.45 and were loaded separately onto two separate columns at a flow
rate of 1.5 ml/min using a Gilson MINIPLUS 3 peristaltic pump.
The column was equilibrated with 0.05 M sodium phosphate buffer, pH 8.45 and after the
samples were loaded, the column was washed at a flow rate of 1.5 ml/min with 0.05 M
sodium phosphate buffer, 0.05 M NaCl, pH 8.45 and eluted at a flow rate of 1.5 ml/min with
increasing NaCl concentration in the elution buffer.
The NaCl concentration range of the elution buffers investigated was 50 mM – 1 M (elution
buffer. A: 0.05 M sodium phosphate, 0.05 M NaCl, pH 8.45, buffer B: 0.05 M sodium phosphate,
0.2 M NaCl, pH 8.45 and buffer C: 1 M NaCl solution). After application of each eluting buffer,
the A280 was allowed to stabilise before applying the next elution buffer. Fractions (7.5 ml)
were collected for A280 determinations with a Pharmacia Biotech FRAC-100 fraction
collector, and the A280 of the fractions was determined using a Schimadzu UV-1601
spectrophotometer. An in-line UV detector (Gilson 112 UV/VIS) was installed to monitor the
elution profile. This instrument was used for indication purposes only, to visualise the elution
profile in real-time.
The A280 values of the collected fractions were plotted to establish an elution profile for both
enzymes. The elution profiles were superimposed to establish if the two enzymes could be
separated under the chromatographic conditions.
Experiment 2
Following the investigation of zymogen elution at a high pH (pH 8.45), the elution profiles of
the zymogens was investigated at a low pH (pH 6.1). The same strategy as experiment 1 was
applied where the column was eluted in a stepwise fashion with increasing NaCl
concentrations of the elution buffers at a set pH value.
Stellenbosch University http://scholar.sun.ac.za
87
The column equilibrated with 0.05 M sodium phosphate buffer, pH 6.1. The zymogens were
individually prepared at 13.3 mg/ml in 15 ml of a 0.05 M sodium phosphate buffer, pH 6.1
and were loaded separately onto two separate columns at a flow rate of 1.5 ml/min using a
Gilson MINIPLUS 3 peristaltic pump.
The column was equilibrated and washed at a flow rate of 1.5 ml/min with 50 mM podium
phosphate buffer, pH 6.1 and eluted at a flow rate of 1.5 ml/min with increasing NaCl
concentration in the elution buffer. The NaCl concentration range of the elution buffer was
50 mM – 1 M (elution buffer. A: 0.05 M sodium phosphate, 0.05 M NaCl, pH 6.1, buffer B:
0.05 M sodium phosphate, 0.2 M NaCl, pH 6.1 and buffer C: 1 M NaCl solution).
Fractions (7.5 ml) were collected for A280 determinations with a Pharmacia Biotech FRAC-
100 fraction collector, and the A280 of the fractions was determined using a Schimadzu UV-
1601 spectrophotometer. An in-line UV detector (Gilson 112 UV/VIS) was installed to
monitor the elution profile. This instrument was used for indication purposes only, to visualise
the elution profile in real-time. The A280 values of the collected fractions were plotted to
establish an elution profile for both enzymes.
Experiment 3
The elution profiles of trypsinogen and CTG were investigated at a pH value between that of
experiment 1 and 2. Separation of the zymogens was investigated at pH 7.2 using a 0.05 M
sodium phosphate buffer with increasing concentrations of NaCl in the elution buffers.
Trypsinogen and CTG were individually prepared at 13.3 mg/ml in 15 ml of a 0.05 M sodium
phosphate buffer, pH 7.2 and were loaded separately onto two separate columns at a flow rate
of 1.5 ml/min using a Gilson MINIPLUS 3 peristaltic pump.
The column was equilibrated with 0.05 M sodium phosphate buffer, pH 7.2 and after the
samples were loaded, the column was washed at a flow rate of 1.5 ml/min with 0.05 M
Sodium Phosphate buffer, 0.05 M NaCl, pH 7.2 and eluted at a flow rate of 1.5 ml/min with
increasing NaCl concentration in the elution buffer.
The NaCl concentration range of the elution buffers investigated was 50 mM – 1 M (elution
buffer. A: 0.05 M sodium phosphate, 0.05 M NaCl, pH 7.2, buffer B: 0.05 M sodium
phosphate, 0.15 M NaCl, pH 7.2 and buffer C: 1 M NaCl solution). After application of each
eluting buffer, the A280 was allowed to stabilise before applying the next elution buffer.
Stellenbosch University http://scholar.sun.ac.za
88
Fractions (7.5 ml) were collected for A280 determinations with a Pharmacia Biotech FRAC-
100 fraction collector, and the A280 of the fractions was determined using a Schimadzu UV-
1601 spectrophotometer. An in-line UV detector (Gilson 112 UV/VIS) was installed to
monitor the elution profile. This instrument was used for indication purposes only, to visualise
the elution profile in real-time
The A280 values of the collected fractions were plotted to establish an elution profile for both
enzymes. The elution profiles were superimposed to establish if the two enzymes could be
separated under the chromatographic conditions.
Experiment 4
This experiment was a repeat of experiment 3 where the zymogens were separated at pH 7.2
with increasing concentrations of NaCl in the elution buffers. The difference between
experiment 3 and 4 was that trypsinogen and CTG were prepared together in a single
preparation and loaded onto a single column.
Trypsinogen and CTG were prepared at 13.3 mg/ml in 15 ml of a 0.05 M sodium phosphate
buffer, pH 7.2 and loaded onto the CM column at a flow rate of 1.5 ml/min using a Gilson
MINIPLUS 3 peristaltic pump.
The column was equilibrated with 0.05 M sodium phosphate buffer, pH 7.2 and after the
samples were loaded, the column was washed at a flow rate of 1.5 ml/min with 0.05 M
sodium phosphate buffer, 0.05 M NaCl, pH 7.2 and eluted at a flow rate of 1.5 ml/min with
increasing NaCl concentration in the elution buffer.
The NaCl concentration range of the elution buffers investigated was 50 mM – 1 M (elution
buffer. A: 0.05 M sodium phosphate, 0.05 M NaCl, pH 7.2, buffer B: 0.05 M Sodium
phosphate, 0.15 M NaCl, pH 7.2 and buffer C: 1 M NaCl solution). After application of each
eluting buffer, the A280 was allowed to stabilise before applying the next elution buffer.
Fractions (7.5ml) were collected for A280 determinations with a Pharmacia Biotech FRAC-
100 fraction collector, and the A280 of the fractions was determined using a Schimadzu UV-
1601 spectrophotometer. An in-line UV detector (Gilson 112 UV/VIS) was installed to
monitor the elution profile. This instrument was used for indication purposes only, to visualise
the elution profile in real-time.
Stellenbosch University http://scholar.sun.ac.za
89
The A280 values of the collected fractions were plotted to establish an elution profile for both
enzymes from the same column.
Experiment 5
A clarified 0/20 sample from the production line was loaded onto the CM column to
investigate the ability of the CM column to separate the zymogens at pH 7.2 using
representative material.
The sample was dialysed against 0.05 M sodium phosphate buffer, pH 7.2 in preparation for
column chromatography and subsequently concentrated using a 10kDa ultrafiltration system
until the product had a A280 of 245.
The column was equilibrated with 0.05 M sodium phosphate buffer, pH 7.2 and after the
samples were loaded, the column was washed at a flow rate of 1.5 ml/min with 0.05 M
sodium phosphate buffer, 0.05 M NaCl, pH 7.2 and eluted at a flow rate of 1.5 ml/min with
increasing NaCl concentration in the elution buffer. The NaCl concentration range of the
elution buffers investigated was 50 mM – 1 M (elution buffer. A: 0.05 M sodium phosphate,
0.05 M NaCl, pH 7.2, buffer B: 0.05 M sodium phosphate, 0.15 M NaCl, pH 7.2 and buffer
C: 1 M NaCl solution). After application of each eluting buffer, the A280 was allowed to
stabilise before applying the next elution buffer. Fractions (7.5ml) were collected for A280
determinations with a Pharmacia Biotech FRAC-100 fraction collector, and the A280 of the
fractions was determined using a Schimadzu UV-1601 spectrophotometer. An in-line UV
detector (Gilson 112 UV/VIS) was installed to monitor the elution profile. This instrument
was used for indication purposes only, to visualise the elution profile in real-time
The A280 values of the collected fractions were plotted to establish an elution profile for both
enzymes from the same column and the ability of the column to separate the zymogens by
using representative product from the factory floor.
Stellenbosch University http://scholar.sun.ac.za

90
5.2.3. RESULTS
5.2.3.1 AFFINITY CHROMATOGRAPHY
Experiment 1
For experiment 1 the elution profile of Sigma trypsin was obtained by plotting the A280 values
obtained for each fraction collected (see figure 29). Elution of trypsin was achieved as
described in the protocol recommended by GE Healthcare (GE Healthcare, 2005).
Figure 29. Elution profile of Sigma trypsin using benzamidine sepharose as an affinity resin. The
sample was prepared and loaded onto the column in 0.05 M Tris-HCl, 0.5 M NaCl, pH 7.4, and eluted
with elution buffer A: 0.05 M Glycine buffer, pH 3.00.
Experiment 2
The elution of trypsin from a benzamidine column was investigated in the presence of
35% A/S to mimic the material on the factory floor. Activated trypsin from the production
line was collected and loaded onto the column. Figure 30 shows the elution profile of the
trypsin obtained from the production line. Elution of trypsin was achieved as described in the
protocol recommended by GE Healthcare (GE Healthcare, 2005).
A
Stellenbosch University http://scholar.sun.ac.za

91
Figure 30. Elution profile of trypsin when loaded onto Benzamidine affinity column in the presence of
35% A/S. The column was loaded and washed with 0.05 M Tris-HCl, 0.5 M NaCl, 35% A/S, pH 7.4,
and eluted with elution buffer A: 0.05 M Glycine buffer, 35% A/S, pH 3.00.
In both these experiments, separation of trypsin from chymotrypsin was achieved. There was
no marked difference in the elution profiles between the pure preparations of trypsin and
chymotrypsin compared to that of the material obtained from the production line. The specific
activity of the material that was eluted from the columns is summarized in table 19 below.
Chymotrypsin did not bund to the column , and was collected in the flow through, whereas
trypsin eluted after application of buffer A.
Table 19. Summary of the activity assay results of the fractions collected from the Benzamidine
column.
Experiment
Trypsin Specific activity
(U/mg)
(Fraction A)
Chymotrypsin specific
activity(U/mg)
(Flow through)
Experiment 1 2304.8 661.5
Experiment 2 3252.9 448.6
A
Stellenbosch University http://scholar.sun.ac.za
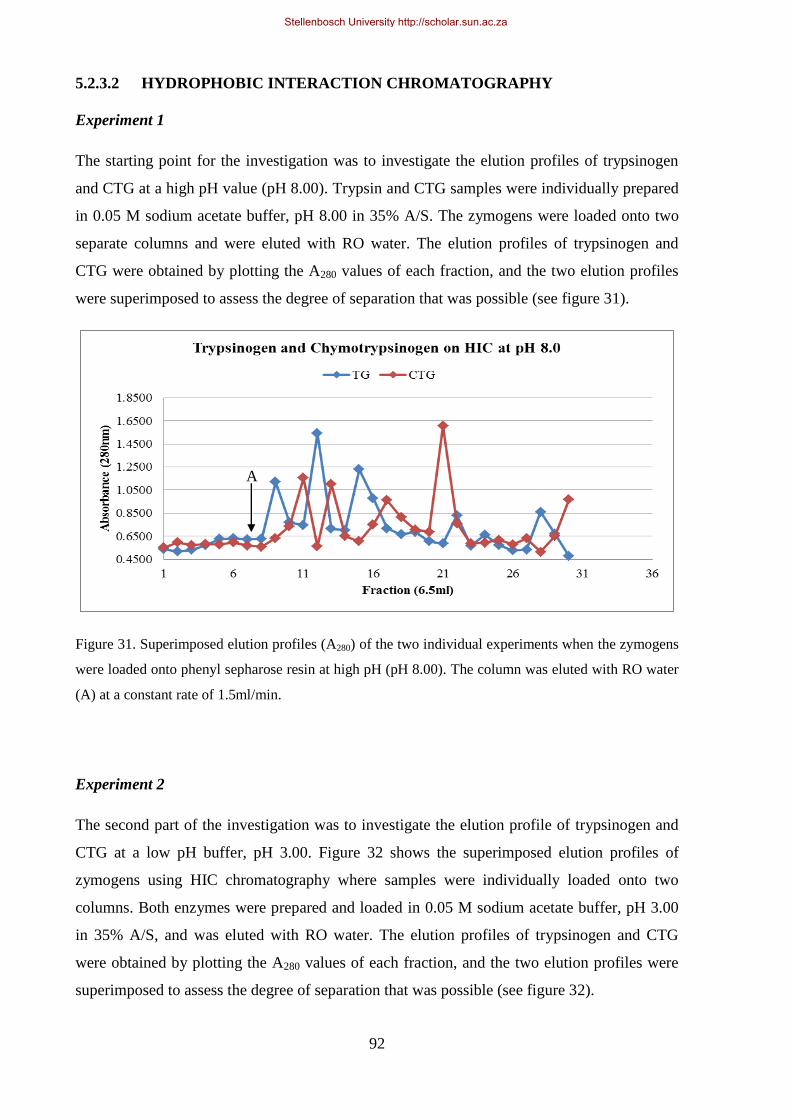
92
5.2.3.2 HYDROPHOBIC INTERACTION CHROMATOGRAPHY
Experiment 1
The starting point for the investigation was to investigate the elution profiles of trypsinogen
and CTG at a high pH value (pH 8.00). Trypsin and CTG samples were individually prepared
in 0.05 M sodium acetate buffer, pH 8.00 in 35% A/S. The zymogens were loaded onto two
separate columns and were eluted with RO water. The elution profiles of trypsinogen and
CTG were obtained by plotting the A280 values of each fraction, and the two elution profiles
were superimposed to assess the degree of separation that was possible (see figure 31).
Figure 31. Superimposed elution profiles (A280) of the two individual experiments when the zymogens
were loaded onto phenyl sepharose resin at high pH (pH 8.00). The column was eluted with RO water
(A) at a constant rate of 1.5ml/min.
Experiment 2
The second part of the investigation was to investigate the elution profile of trypsinogen and
CTG at a low pH buffer, pH 3.00. Figure 32 shows the superimposed elution profiles of
zymogens using HIC chromatography where samples were individually loaded onto two
columns. Both enzymes were prepared and loaded in 0.05 M sodium acetate buffer, pH 3.00
in 35% A/S, and was eluted with RO water. The elution profiles of trypsinogen and CTG
were obtained by plotting the A280 values of each fraction, and the two elution profiles were
superimposed to assess the degree of separation that was possible (see figure 32).
A
Stellenbosch University http://scholar.sun.ac.za
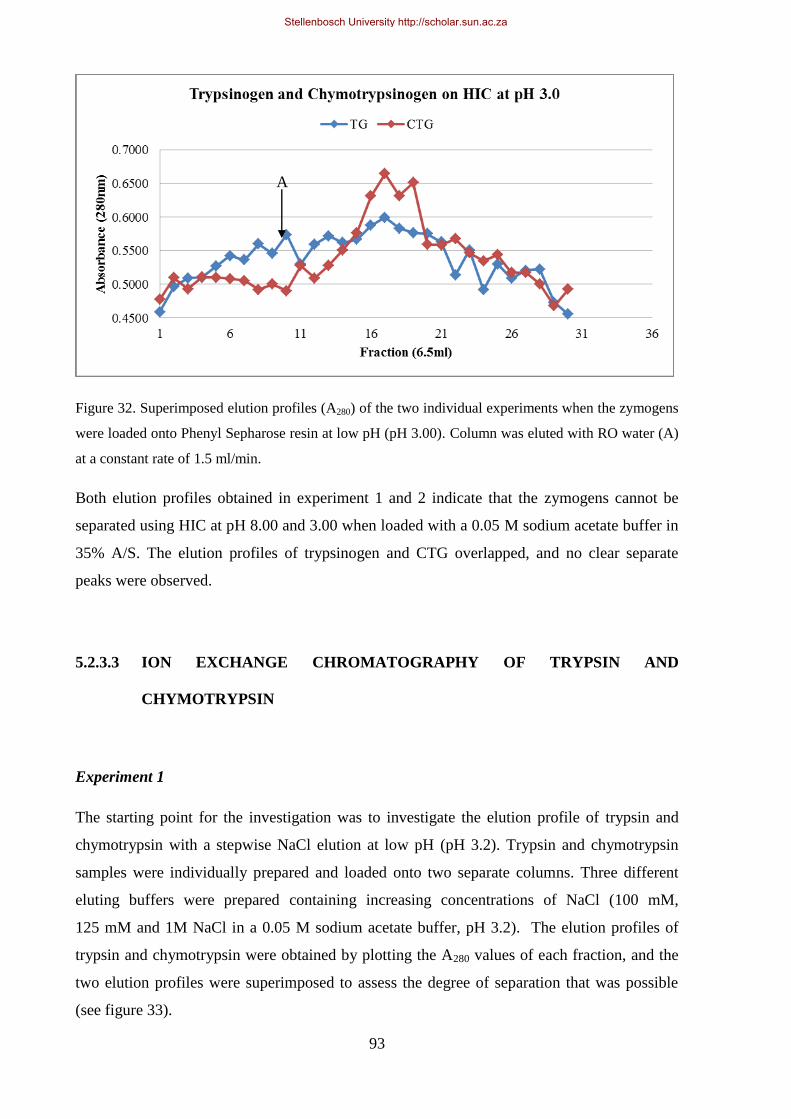
93
Figure 32. Superimposed elution profiles (A280) of the two individual experiments when the zymogens
were loaded onto Phenyl Sepharose resin at low pH (pH 3.00). Column was eluted with RO water (A)
at a constant rate of 1.5 ml/min.
Both elution profiles obtained in experiment 1 and 2 indicate that the zymogens cannot be
separated using HIC at pH 8.00 and 3.00 when loaded with a 0.05 M sodium acetate buffer in
35% A/S. The elution profiles of trypsinogen and CTG overlapped, and no clear separate
peaks were observed.
5.2.3.3 ION EXCHANGE CHROMATOGRAPHY OF TRYPSIN AND
CHYMOTRYPSIN
Experiment 1
The starting point for the investigation was to investigate the elution profile of trypsin and
chymotrypsin with a stepwise NaCl elution at low pH (pH 3.2). Trypsin and chymotrypsin
samples were individually prepared and loaded onto two separate columns. Three different
eluting buffers were prepared containing increasing concentrations of NaCl (100 mM,
125 mM and 1M NaCl in a 0.05 M sodium acetate buffer, pH 3.2). The elution profiles of
trypsin and chymotrypsin were obtained by plotting the A280 values of each fraction, and the
two elution profiles were superimposed to assess the degree of separation that was possible
(see figure 33).
A
Stellenbosch University http://scholar.sun.ac.za
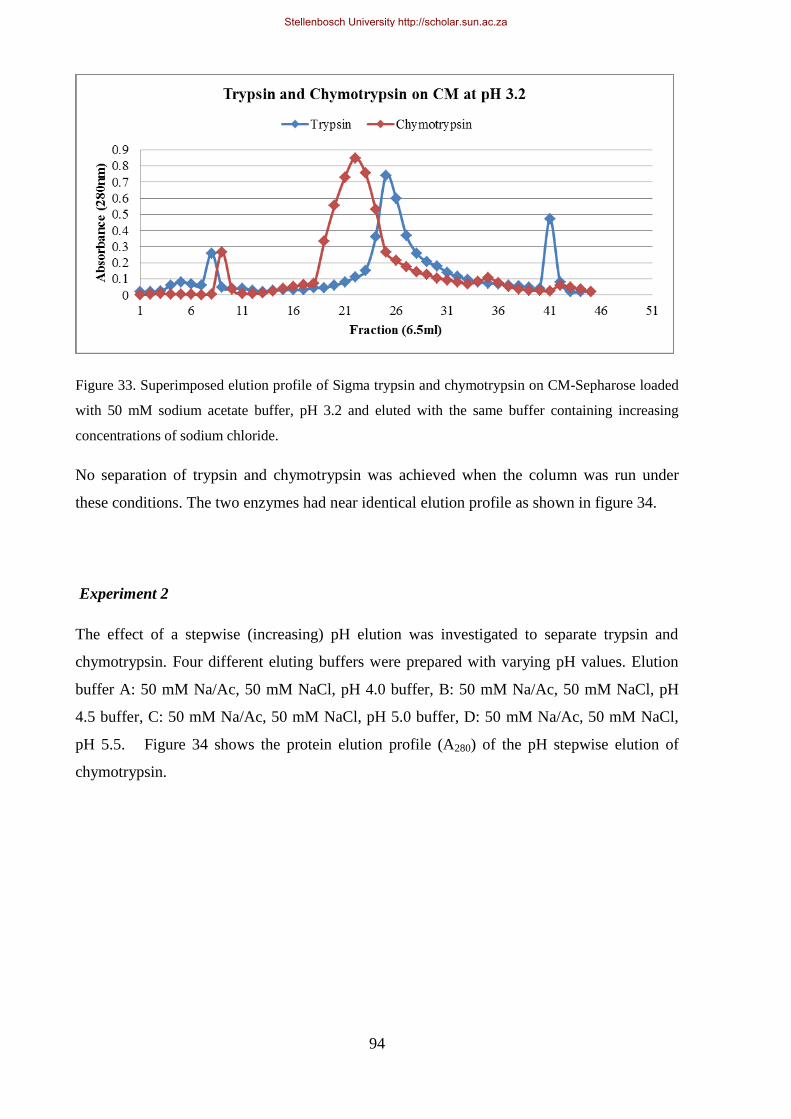
94
Figure 33. Superimposed elution profile of Sigma trypsin and chymotrypsin on CM-Sepharose loaded
with 50 mM sodium acetate buffer, pH 3.2 and eluted with the same buffer containing increasing
concentrations of sodium chloride.
No separation of trypsin and chymotrypsin was achieved when the column was run under
these conditions. The two enzymes had near identical elution profile as shown in figure 34.
Experiment 2
The effect of a stepwise (increasing) pH elution was investigated to separate trypsin and
chymotrypsin. Four different eluting buffers were prepared with varying pH values. Elution
buffer A: 50 mM Na/Ac, 50 mM NaCl, pH 4.0 buffer, B: 50 mM Na/Ac, 50 mM NaCl, pH
4.5 buffer, C: 50 mM Na/Ac, 50 mM NaCl, pH 5.0 buffer, D: 50 mM Na/Ac, 50 mM NaCl,
pH 5.5. Figure 34 shows the protein elution profile (A280) of the pH stepwise elution of
chymotrypsin.
Stellenbosch University http://scholar.sun.ac.za
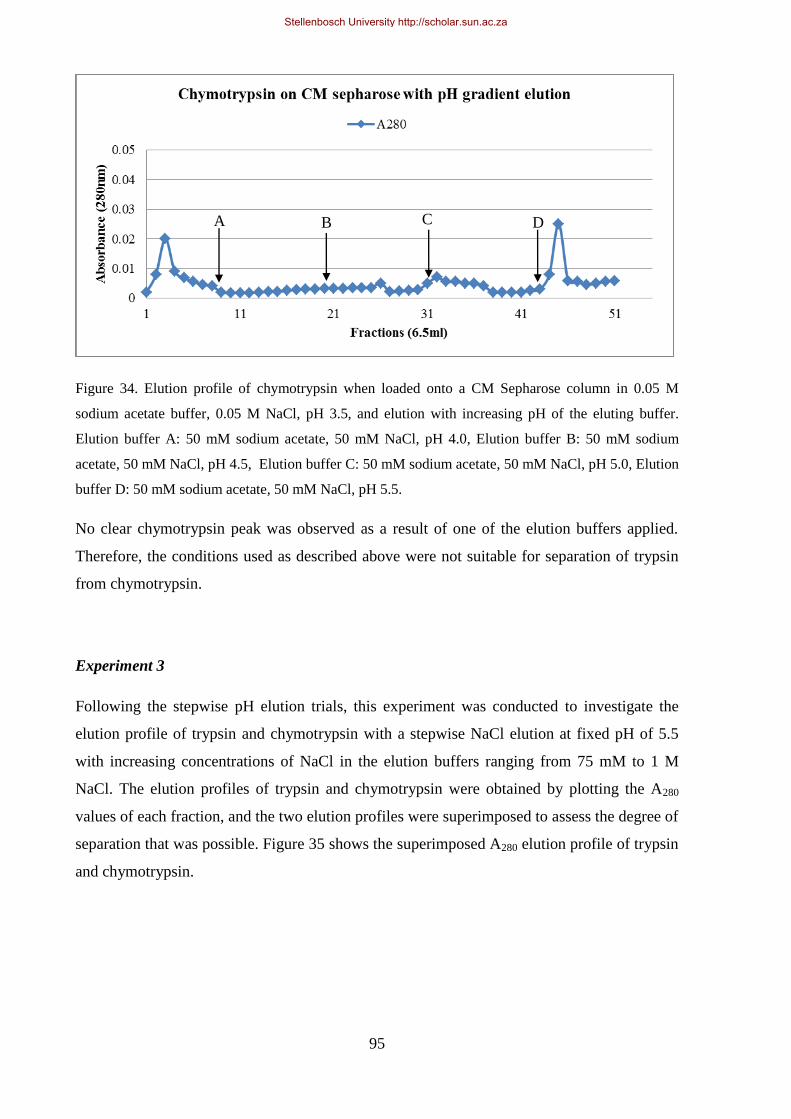
95
Figure 34. Elution profile of chymotrypsin when loaded onto a CM Sepharose column in 0.05 M
sodium acetate buffer, 0.05 M NaCl, pH 3.5, and elution with increasing pH of the eluting buffer.
Elution buffer A: 50 mM sodium acetate, 50 mM NaCl, pH 4.0, Elution buffer B: 50 mM sodium
acetate, 50 mM NaCl, pH 4.5, Elution buffer C: 50 mM sodium acetate, 50 mM NaCl, pH 5.0, Elution
buffer D: 50 mM sodium acetate, 50 mM NaCl, pH 5.5.
No clear chymotrypsin peak was observed as a result of one of the elution buffers applied.
Therefore, the conditions used as described above were not suitable for separation of trypsin
from chymotrypsin.
Experiment 3
Following the stepwise pH elution trials, this experiment was conducted to investigate the
elution profile of trypsin and chymotrypsin with a stepwise NaCl elution at fixed pH of 5.5
with increasing concentrations of NaCl in the elution buffers ranging from 75 mM to 1 M
NaCl. The elution profiles of trypsin and chymotrypsin were obtained by plotting the A280
values of each fraction, and the two elution profiles were superimposed to assess the degree of
separation that was possible. Figure 35 shows the superimposed A280 elution profile of trypsin
and chymotrypsin.
A B C D
Stellenbosch University http://scholar.sun.ac.za

96
Figure 35: Superimposed elution profile of trypsin and chymotrypsin on CM-Sepharose loaded in 0.05
M sodium acetate, 0.05 M NaCl buffer, pH 5.5 and eluted with increasing concentration of NaCl in the
elution buffers. Four different eluting buffers were prepared with increasing NaCl concentrations.
Elution buffer A: 0.05 M sodium acetate, 0.075 M NaCl, pH 5.5, elution buffer B: 0.05 M sodium
acetate, 0.1 M NaCl, pH 5.5, elution buffer C: 0.05 M sodium acetate, 0.125 M NaCl, pH 5.5 and
elution buffer D: 0.05 M sodium acetate, 0.15M NaCl, pH 5.5.
Fractions eluted with 0.075 M NaCl (buffer A) had little protein content as detected by A280
but had significant amount of trypsin activity in the same area where chymotrypsin eluted.
The high trypsin activity in this area was concerning as the activity of trypsin will cause
autolysis of chymotrypsin. These conditions were therefore not suitable for the separation of
trypsin from chymotrypsin.
Experiment 4
Trypsin is at risk of auto activation at higher pH values. The elution profile of trypsin and
chymotrypsin at low pH (pH <3.00) prevented the activation of trypsin. This experiment
investigated the ability of CM resin at a very low pH to separate trypsin and chymotrypsin.
Figure 36 shows the protein elution profile (A280) of the investigation of CM chromatography
at a low pH range using glycine buffer. Samples were prepared in 0.05 M Glycine-HCl buffer,
pH 3.2, and were loaded onto the column that had been equilibrated with the same buffer. The
enzymes were eluted in a stepwise manner with 50 mM Glycine-HCl buffer at decreasing
pH‟s. Three different eluting buffers were prepared with decreasing pH values ranging from
A B
C D
Stellenbosch University http://scholar.sun.ac.za
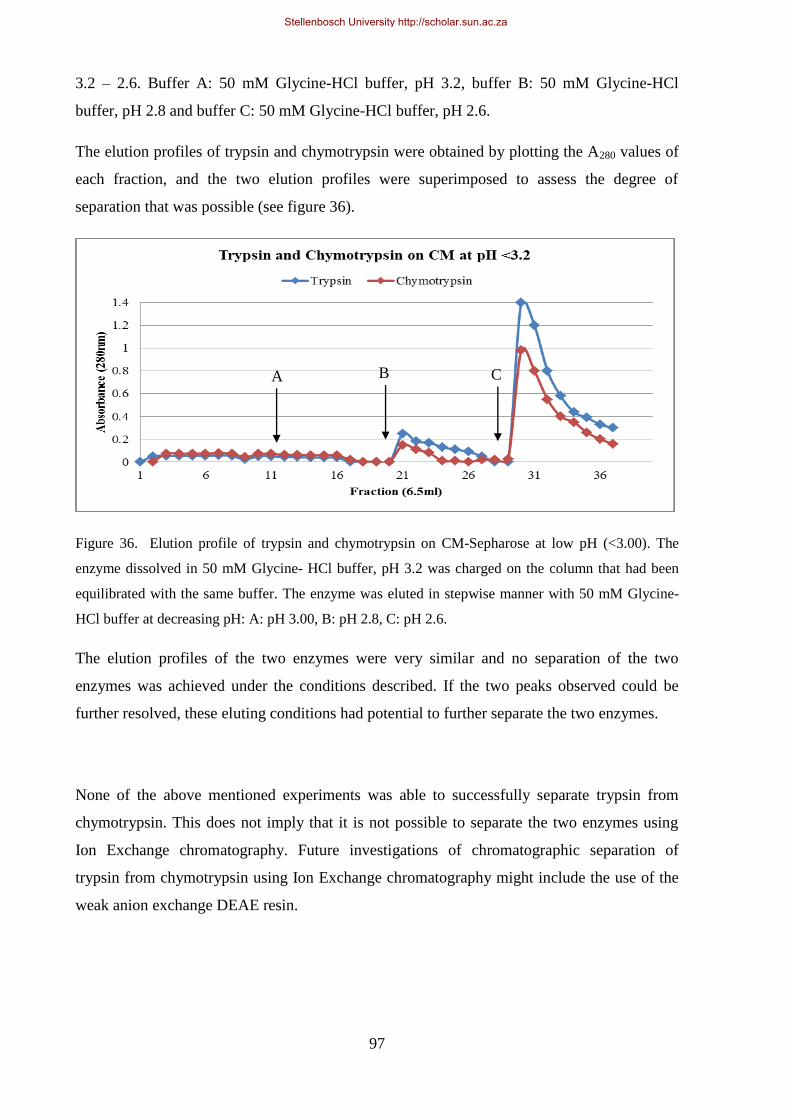
97
3.2 – 2.6. Buffer A: 50 mM Glycine-HCl buffer, pH 3.2, buffer B: 50 mM Glycine-HCl
buffer, pH 2.8 and buffer C: 50 mM Glycine-HCl buffer, pH 2.6.
The elution profiles of trypsin and chymotrypsin were obtained by plotting the A280 values of
each fraction, and the two elution profiles were superimposed to assess the degree of
separation that was possible (see figure 36).
Figure 36. Elution profile of trypsin and chymotrypsin on CM-Sepharose at low pH (<3.00). The
enzyme dissolved in 50 mM Glycine- HCl buffer, pH 3.2 was charged on the column that had been
equilibrated with the same buffer. The enzyme was eluted in stepwise manner with 50 mM Glycine-
HCl buffer at decreasing pH: A: pH 3.00, B: pH 2.8, C: pH 2.6.
The elution profiles of the two enzymes were very similar and no separation of the two
enzymes was achieved under the conditions described. If the two peaks observed could be
further resolved, these eluting conditions had potential to further separate the two enzymes.
None of the above mentioned experiments was able to successfully separate trypsin from
chymotrypsin. This does not imply that it is not possible to separate the two enzymes using
Ion Exchange chromatography. Future investigations of chromatographic separation of
trypsin from chymotrypsin using Ion Exchange chromatography might include the use of the
weak anion exchange DEAE resin.
B A C
Stellenbosch University http://scholar.sun.ac.za

98
5.2.3.4 BINDING STUDIES OF TRYPSINOGEN AND CHYMOTRYPSINOGEN
TO CM SEPHAROSE RESIN
The only technique used during the investigation of separation of the zymogens using ion
exchange chromatography was considering different elution conditions of increasing
concentrations of NaCl at three different pH values.
Experiment 1
The first experiment was the investigation of the elution profile of trypsinogen and CTG when
loaded onto a CM column at high pH values (pH 8.45) and eluted with increasing
concentrations of NaCl in the elution buffers. Figure 37 shows the superimposed A280elution
profile of the zymogens at pH 8.45 using a 50 mM sodium phosphate buffer with increasing
concentrations of NaCl.
Figure 37. Elution profile of trypsinogen and CTG at pH 8.45 with increasing concentrations of NaCl
in the elution buffer. Elution buffer A: 0.05 M sodium phosphate, 0.05 M NaCl, pH 8.45, elution
buffer B: 0.05 M sodium phosphate, 0.2 M NaCl, pH 8.45 and buffer C: 1 M NaCl solution.
In both cases, trypsinogen and CTG eluted with the initial elution buffer at 0.05 M NaCl. An
increase in buffer molarity up to 1 M NaCl did not lead to more protein eluting from the
column. This indicated that trypsinogen and CTG could not be separated when loaded in 50
mM sodium phosphate, pH 8.45.
C A B
Stellenbosch University http://scholar.sun.ac.za

99
Experiment 2
Following the investigation of zymogen elution at a high pH (pH 8.45), the elution profiles of
the zymogens was investigated at a low pH (pH 6.1). The same strategy as experiment 1 was
applied where the column was eluted in a stepwise fashion with increasing NaCl
concentrations of the elution buffers at a set pH value. Figure 38 and 39 shows the protein
A280 elution profile of the zymogens at pH 6.1 using a 50 mM sodium phosphate buffer with
increasing concentrations of NaCl.
Figure 38. Elution profile of trypsinogen using a sodium phosphate buffer, pH 6.1 with increasing
concentrations of NaCl in the elution buffer. Elution buffer A: 0.05 M sodium phosphate, 0.05 M
NaCl, pH 6.1, elution buffer B: 0.05 M sodium phosphate, 0.2 M NaCl, pH 6.1.
Figure 39. Elution profile of chymotrypsinogen using a Sodium Phosphate buffer, pH 6.1 with
increasing concentrations of NaCl in the elution buffer. Elution buffer A: 0.05M sodium phosphate,
0.05 M NaCl, pH 6.1, elution buffer B: 0.05 M sodium phosphate, 0.2 M NaCl, pH 6.1.
A B
A B
Stellenbosch University http://scholar.sun.ac.za
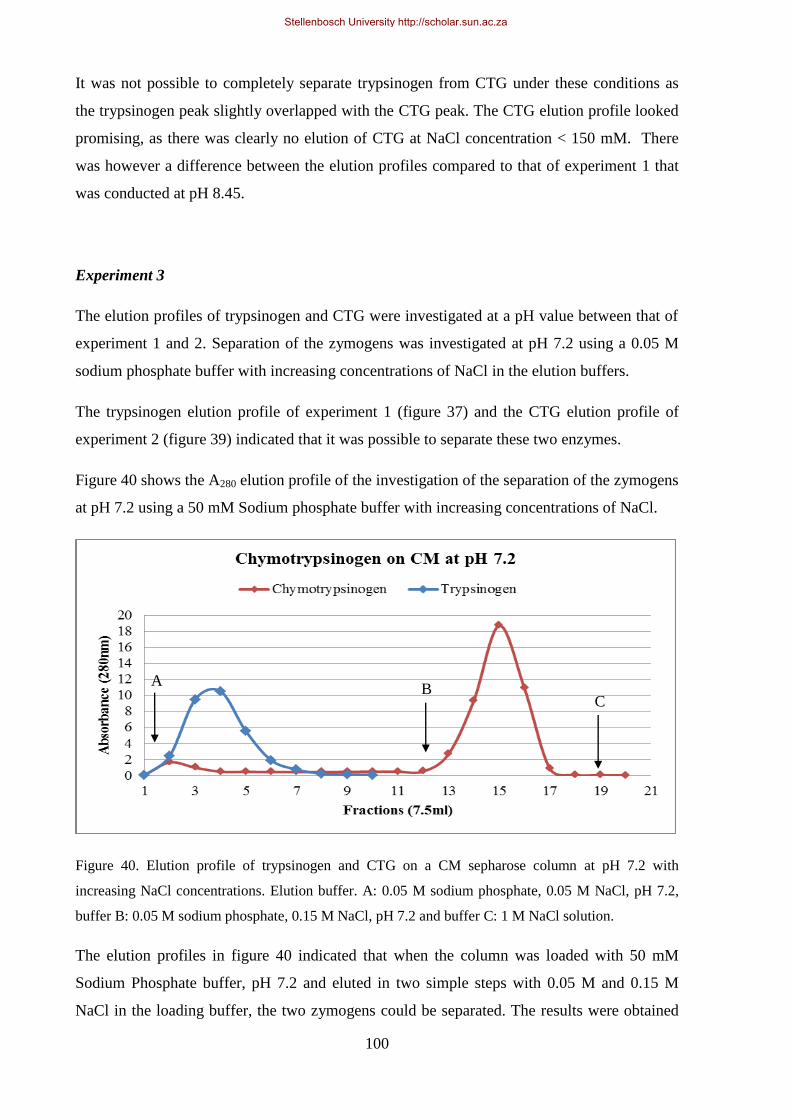
100
It was not possible to completely separate trypsinogen from CTG under these conditions as
the trypsinogen peak slightly overlapped with the CTG peak. The CTG elution profile looked
promising, as there was clearly no elution of CTG at NaCl concentration < 150 mM. There
was however a difference between the elution profiles compared to that of experiment 1 that
was conducted at pH 8.45.
Experiment 3
The elution profiles of trypsinogen and CTG were investigated at a pH value between that of
experiment 1 and 2. Separation of the zymogens was investigated at pH 7.2 using a 0.05 M
sodium phosphate buffer with increasing concentrations of NaCl in the elution buffers.
The trypsinogen elution profile of experiment 1 (figure 37) and the CTG elution profile of
experiment 2 (figure 39) indicated that it was possible to separate these two enzymes.
Figure 40 shows the A280 elution profile of the investigation of the separation of the zymogens
at pH 7.2 using a 50 mM Sodium phosphate buffer with increasing concentrations of NaCl.
Figure 40. Elution profile of trypsinogen and CTG on a CM sepharose column at pH 7.2 with
increasing NaCl concentrations. Elution buffer. A: 0.05 M sodium phosphate, 0.05 M NaCl, pH 7.2,
buffer B: 0.05 M sodium phosphate, 0.15 M NaCl, pH 7.2 and buffer C: 1 M NaCl solution.
The elution profiles in figure 40 indicated that when the column was loaded with 50 mM
Sodium Phosphate buffer, pH 7.2 and eluted in two simple steps with 0.05 M and 0.15 M
NaCl in the loading buffer, the two zymogens could be separated. The results were obtained
A B
C
Stellenbosch University http://scholar.sun.ac.za
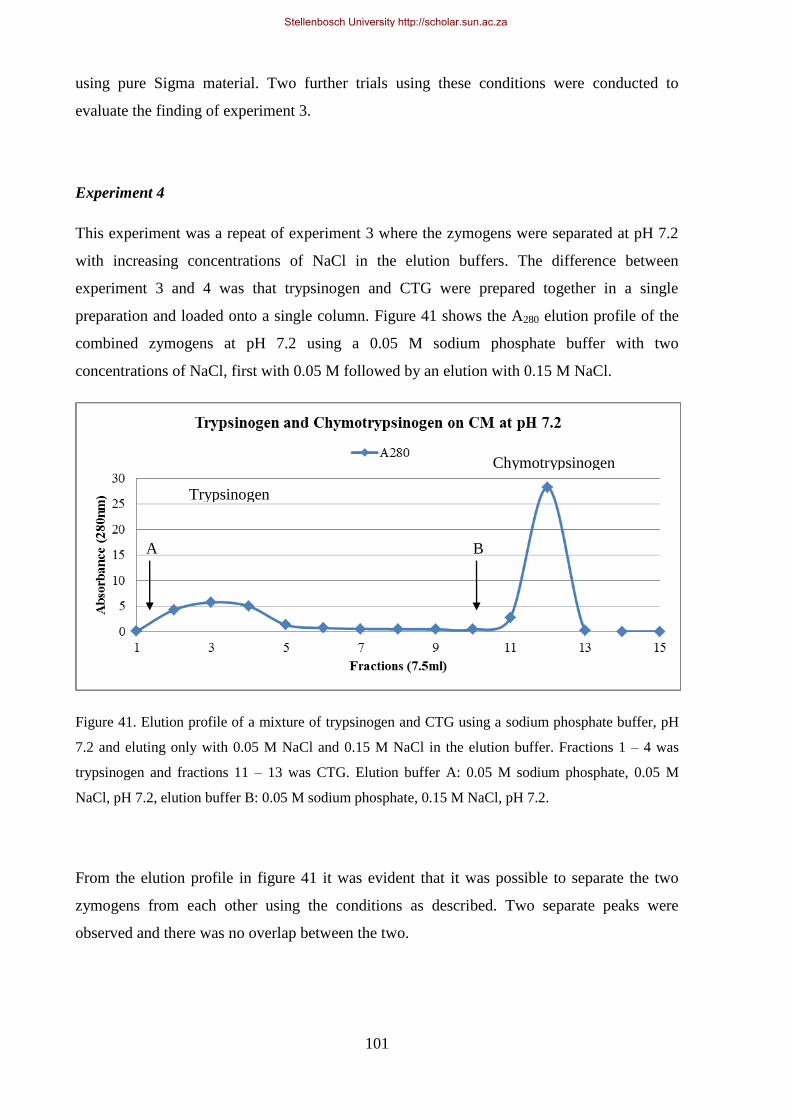
101
using pure Sigma material. Two further trials using these conditions were conducted to
evaluate the finding of experiment 3.
Experiment 4
This experiment was a repeat of experiment 3 where the zymogens were separated at pH 7.2
with increasing concentrations of NaCl in the elution buffers. The difference between
experiment 3 and 4 was that trypsinogen and CTG were prepared together in a single
preparation and loaded onto a single column. Figure 41 shows the A280 elution profile of the
combined zymogens at pH 7.2 using a 0.05 M sodium phosphate buffer with two
concentrations of NaCl, first with 0.05 M followed by an elution with 0.15 M NaCl.
Figure 41. Elution profile of a mixture of trypsinogen and CTG using a sodium phosphate buffer, pH
7.2 and eluting only with 0.05 M NaCl and 0.15 M NaCl in the elution buffer. Fractions 1 – 4 was
trypsinogen and fractions 11 – 13 was CTG. Elution buffer A: 0.05 M sodium phosphate, 0.05 M
NaCl, pH 7.2, elution buffer B: 0.05 M sodium phosphate, 0.15 M NaCl, pH 7.2.
From the elution profile in figure 41 it was evident that it was possible to separate the two
zymogens from each other using the conditions as described. Two separate peaks were
observed and there was no overlap between the two.
A B
Trypsinogen
Chymotrypsinogen
Stellenbosch University http://scholar.sun.ac.za
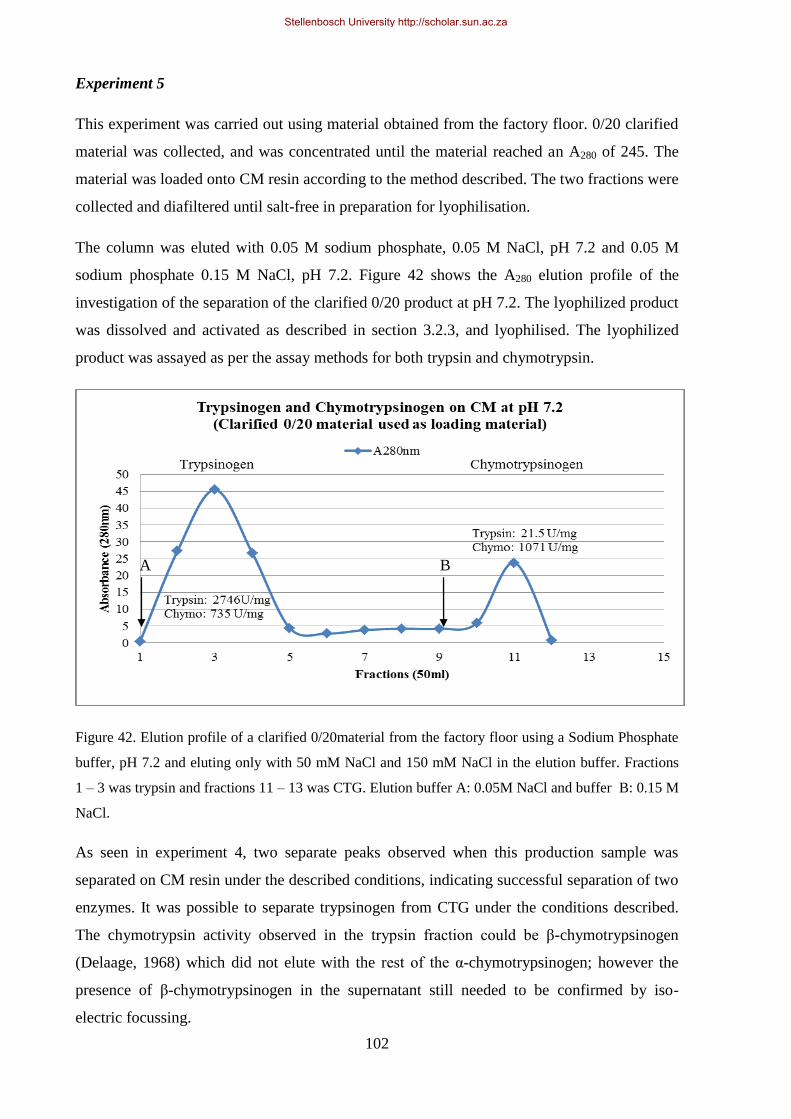
102
Experiment 5
This experiment was carried out using material obtained from the factory floor. 0/20 clarified
material was collected, and was concentrated until the material reached an A280 of 245. The
material was loaded onto CM resin according to the method described. The two fractions were
collected and diafiltered until salt-free in preparation for lyophilisation.
The column was eluted with 0.05 M sodium phosphate, 0.05 M NaCl, pH 7.2 and 0.05 M
sodium phosphate 0.15 M NaCl, pH 7.2. Figure 42 shows the A280 elution profile of the
investigation of the separation of the clarified 0/20 product at pH 7.2. The lyophilized product
was dissolved and activated as described in section 3.2.3, and lyophilised. The lyophilized
product was assayed as per the assay methods for both trypsin and chymotrypsin.
Figure 42. Elution profile of a clarified 0/20material from the factory floor using a Sodium Phosphate
buffer, pH 7.2 and eluting only with 50 mM NaCl and 150 mM NaCl in the elution buffer. Fractions
1 – 3 was trypsin and fractions 11 – 13 was CTG. Elution buffer A: 0.05M NaCl and buffer B: 0.15 M
NaCl.
As seen in experiment 4, two separate peaks observed when this production sample was
separated on CM resin under the described conditions, indicating successful separation of two
enzymes. It was possible to separate trypsinogen from CTG under the conditions described.
The chymotrypsin activity observed in the trypsin fraction could be β-chymotrypsinogen
(Delaage, 1968) which did not elute with the rest of the α-chymotrypsinogen; however the
presence of β-chymotrypsinogen in the supernatant still needed to be confirmed by iso-
electric focussing.
A B
Stellenbosch University http://scholar.sun.ac.za
103
5.2.4. CONCLUSION
The aim of the investigation was to develop chromatographic methods to purify trypsin(ogen)
from chymotrypsin(ogen). Three different chromatographic strategies were investigated in an
attempt to separate the enzymes, Affinity, hydrophobic interaction and ion exchange
chromatography.
5.2.4.1 AFFINITY CHROMATOGRAPHY
The material obtained from affinity chromatography was not pure enough (see table 19) to
satisfy the requirement according to the product specification for pure trypsin, the
chymotrypsin content in the trypsin samples was too high (specification: <50 U/mg). It was,
however a satisfactory purification result, as trypsin could be purified in a single
chromatographic step. The material would have been sufficiently pure to market as a lower
grade of trypsin, but not for the pure grade trypsin (>2500 U/mg trypsin and <50 U/mg
chymotrypsin). These results implied that the benzamidine ligand was not sufficiently specific
for trypsin and also bound chymotrypsin, which eluted with the trypsin. This was not an
uncommon occurrence, as it was also experienced by Evans et al. (1982) .
GE Healthcare indicated that the lifespan of benzamidine resin for industrial application was
approximately 300 purification cycles. This implied that the resin needed to be replaced after
every 300 purification cycles. Affinity resins are extremely expensive, and this was thus not a
financially viable option as the resin (56 L) needed to be replaced annually at a cost of
R160,000/L, resulting in a total cost of replacement of R9 million. Even though proper
separation and a semi-pure trypsin product was obtained using benzamidine affinity
chromatography, this was not a viable production scale purification methodology.
The use of p-Aminobenzamidine was investigated as a purification technique for trypsin
specifically. This step was envisaged to be implemented after trypsin activation as a potential
replacement for the 7-day trypsin crystallization. Although we were able to purify trypsin
using benzamidine resin, the resultant product did not comply with the specific activity
criteria (specifically the chymotrypsin content). The chymotrypsin content (U/mg material)
was too high as a result of some competitive binding to the resin. The product that was eluted
from this column did comply with the specifications of a lower grade of trypsin (Trypsin:
Chymotrypsin 6:1).
The capital investment required to purchase approx. 56 L of benzamidine resin was outside
the budget of the entire project that made this a less favourable option. According to the
Stellenbosch University http://scholar.sun.ac.za
104
manufacturer, the lifespan of the resin would be approx. 2 years of continual usage, which
was another financial constraint, as the cost to replace the resin would be approximately
R9 million.
Benzamidine affinity resin was thus not a viable option to purify trypsin from chymotrypsin
for our industrial application.
5.2.4.2 HYDROPHOBIC INTERACTION CHROMATOGRAPHY
According to the results of both these experiments, it was concluded that it was not possible to
separate the zymogens using HIC with the conditions described as there were overlapping
elution profiles (of trypsinogen and CTG) and no separate enzyme peaks observed. This does
not imply that it is impossible to separate the two zymogens using HIC, as there are still more
loading and elution conditions that were not investigated.
Hydrophobic interaction chromatography was investigated specifically as a potential
replacement of the 48-hour CTG crystallization step. The intent was only to separate the
zymogens. None of the strategies applied to investigate HIC was successful in separating the
zymogens as a replacement for the Zymogen separation step. This did not imply that it was
impossible to separate the zymogens using HIC. The timeframe for the investigation did not
allow the investigation of further HIC development.
HIC (using the defined conditions) was thus also not a viable option to separate the zymogens
as a replacement for the zymogen separation step.
5.2.4.3 ION EXCHANGE CHROMATOGRAPHY
Ion exchange chromatography was the last method investigated to separate both the active and
the inactive enzymes. None of the conditions investigated to separate the active enzymes was
successful in separating the active enzymes. This did not imply that it was impossible to
separate the two active enzymes.
The intent to separate the inactive enzymes was to replace the 48-hour Zymogen separation. A
sodium Phosphate buffer, pH 7.2 and eluting buffers 50 mM NaCl and 150 mM NaCl were
used to separate the zymogens using a weak cation exchange resin.
Stellenbosch University http://scholar.sun.ac.za
105
The specific activities of the material produced using this method did not reach the required
levels of trypsin and chymotrypsin. Further processing was required to produce a product that
complied with the required specification. It was, however, a successful separation of the two
zymogens, and the methodology could be applied in the production environment. The risk
associated with working at the relative high pH (pH 7.2) was that the trypsin could potentially
activate over a period of time, which could lead to reduced recoveries over the step. This was
verified when the column was operated in a cold room for extended periods and the recovery
over the step was approximately 50%. This could be overcome if the CM column is operated
at <3oC to prevent the catalytic effect of trypsin (Outzen, 1996).
5.3 INVESTIGATING THE FEASIBILITY OF USING NON ACID DIPPED
PANCREAS AS A RAW MATERIAL SOURCE FOR PROTEASE ENZYME
PRODUCTION
5.3.1 INTRODUCTION
The aim of this investigation was to determine the feasibility of using quick frozen non acid
dipped bovine pancreas for the production of pancreas derived factors (PDF) at BBI
Enzymes‟ Cape Town production facility. The investigation was driven by the need to reduce
the cost of the raw material input to the PDF process. Treated bovine pancreas was available
at $2.14 per kg whereas untreated pancreas could be purchased at $ 1.70 per kg, which made
untreated pancreas an attractive option as a raw material.
Simple laboratory techniques, such as protein determination (A280), activity assays and SDS
PAGE analysis were used to characterize the product as it was processed. The aim of the
laboratory investigation was to establish if there were significant differences in the processing
and the amount of trypsin present from both these sources, and to qualify untreated bovine
pancreas as a raw material source for the production of trypsin and chymotrypsin.
5.3.2. MATERIALS AND METHODS
To investigate the feasibility of processing quick frozen non-acid dipped bovine pancreas, a
small-scale laboratory investigation was carried out. Acid dipped and quick frozen non-acid
dipped pancreases were purchased from a local supplier (Jack Grey tissue supplies) from the
Stellenbosch University http://scholar.sun.ac.za
106
Free State in South Africa. The untreated pancreases were frozen immediately after removal
from the animals to eliminate the possibility of trypsin activation, which could lead to
activation of CTG and potentially caused autolysis during processing. The acid treated
pancreas were dipped in 0.25 M H2SO4 for 30 min before they were frozen.
A) Extraction
Frozen pancreas (acid dipped and non-acid dipped) was cut into thin slices by first flaking
large frozen blocks into smaller flakes using an industrial scale flaker, and afterwards
blending the flaked pancreas pieces with a desktop blender (using water as a liquid phase) into
a pulp to liberate maximal amounts of protein. The blended pancreas was extracted overnight
(16 h) in acidic water containing H2SO4 (pH 1.9 – 2.2) with continuous stirring. The pH of
both extraction media was adjusted to 2.01 for the extraction process. An extraction ratio
(m/v) of 1:2 (pancreas: extraction liquid) was used to extract the proteins to mirror the
conditions of the production scale process. One kg of macerated pancreas was extracted in 2 L
of acidified water. At the end of the extraction process, the material was left to settle for 3
hours and analysed for any noticeable differences in texture, pH and fat content. The
untreated pancreas was expected to have a higher pH at the end of the overnight extraction
period because of the alkaline nature of the pancreas (Patel, 1995).
B) Clarification and 20% A/S fractionation
The first step of the clarification process was to remove the solid mince debris. The minced
bovine pancreases were removed from the extraction liquid using different sized sieves to
retain all the tissue particles. This was done to mimic the decanting process used in the
production facility.
A diatomaceous earth filter aid suspension was used to prepare a thin filter cake on a 30 cm
Buchner filter. A coarse filter aid (Celite 545) was used to remove insoluble particles (10 – 50
μm), and fats, to mimic the BRPX centrifugation step. The protein content (A280) of the
supernatant liquid was determined with a Schimadzu UV-1601 spectrophotometer to see if
there was a difference between the total protein content of the two sources. The supernatant of
the initial clarification step was fractionated with 20% A/S (114 g/l solid A/S). At 20% A/S
saturation, non-specific proteins were precipitated and subsequently enhanced the final
clarification step. The 0/20% suspension was filtered through a thin Celite Hyflo filter bed on
a 30 cm Buchner filer to remove any insoluble particles and protein precipitate (1 – 5 μm) to
Stellenbosch University http://scholar.sun.ac.za
107
mimic the filter press clarification step. The protein content (A280) of the clear supernatant
was measured to establish the non-specific protein loss in both samples.
C) 20/80% Ammonium Sulphate fractionation
To allow for further quantitative and qualitatively analysis, the samples were further
concentrated. Both samples were fractionated with 80% A/S by the addition of 424 g/l solid
A/S to precipitate all trypsinogen and CTG. The resulting 20/80 precipitates were collected
using a Whatman filter paper in a 30 cm Buchner filter. The precipitates were dried under
vacuum and removed from the filter paper. The precipitate was re-dissolved in a 0.75 (m/v)
ratio in acidified water (pH 2.00, acidified with 1 M H2SO4) to obtain a highly concentrated
protein solution. This solution contained deoxyribonuclease, ribonuclease, trypsinogen and
CTG.
D) Activation of the 20/80 precipitate to quantify and investigate trypsin content of the
samples
The activation experiment was used to determine the amount of total trypsin present in the
two samples. The native trypsin content was an important factor at this stage of the process, as
this determined the success of the zymogen separation step (refer to section 4.3.3). Both
samples were activated in accordance with the activation procedure described section 3.2.2 –
3.2.3. A 10g aliquot of 20/80 trypsinogen precipitate of each source was dissolved for trypsin
activation in 20 mM Tris buffer pH 8, 20 mM CaCl2. 20 mg of pure lyophilized trypsin was
added to both samples to initiate the activation. The trypsin activity was assayed every hour
using trypsin activity assays (Schwert, 1955) and plotted against time to create an activation
plot. At the end of the activation, when the trypsin content had reached a plateau, the
activation was terminated by lowering the pH to 3 using 2.5 M H2SO4.
5.3.3. RESULTS
A) Raw materials and extraction
There was a distinct difference between the raw materials used. These differences are
summarized in Table 20 below.
The acid treatment thus had a significant effect on the pancreatic fat. It facilitated fat
aggregation and separation from the extraction liquid. Considering the role of bile acids in the
Stellenbosch University http://scholar.sun.ac.za
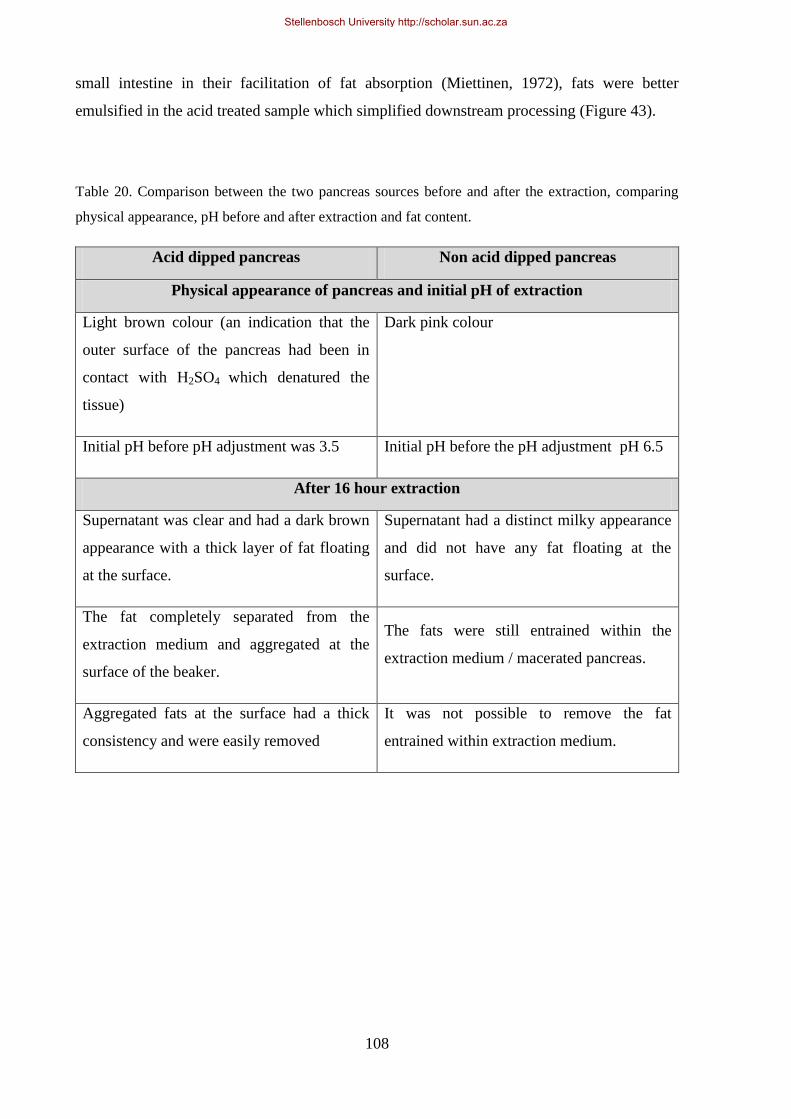
108
small intestine in their facilitation of fat absorption (Miettinen, 1972), fats were better
emulsified in the acid treated sample which simplified downstream processing (Figure 43).
Table 20. Comparison between the two pancreas sources before and after the extraction, comparing
physical appearance, pH before and after extraction and fat content.
Acid dipped pancreas Non acid dipped pancreas
Physical appearance of pancreas and initial pH of extraction
Light brown colour (an indication that the
outer surface of the pancreas had been in
contact with H2SO4 which denatured the
tissue)
Dark pink colour
Initial pH before pH adjustment was 3.5 Initial pH before the pH adjustment pH 6.5
After 16 hour extraction
Supernatant was clear and had a dark brown
appearance with a thick layer of fat floating
at the surface.
Supernatant had a distinct milky appearance
and did not have any fat floating at the
surface.
The fat completely separated from the
extraction medium and aggregated at the
surface of the beaker.
The fats were still entrained within the
extraction medium / macerated pancreas.
Aggregated fats at the surface had a thick
consistency and were easily removed
It was not possible to remove the fat
entrained within extraction medium.
Stellenbosch University http://scholar.sun.ac.za
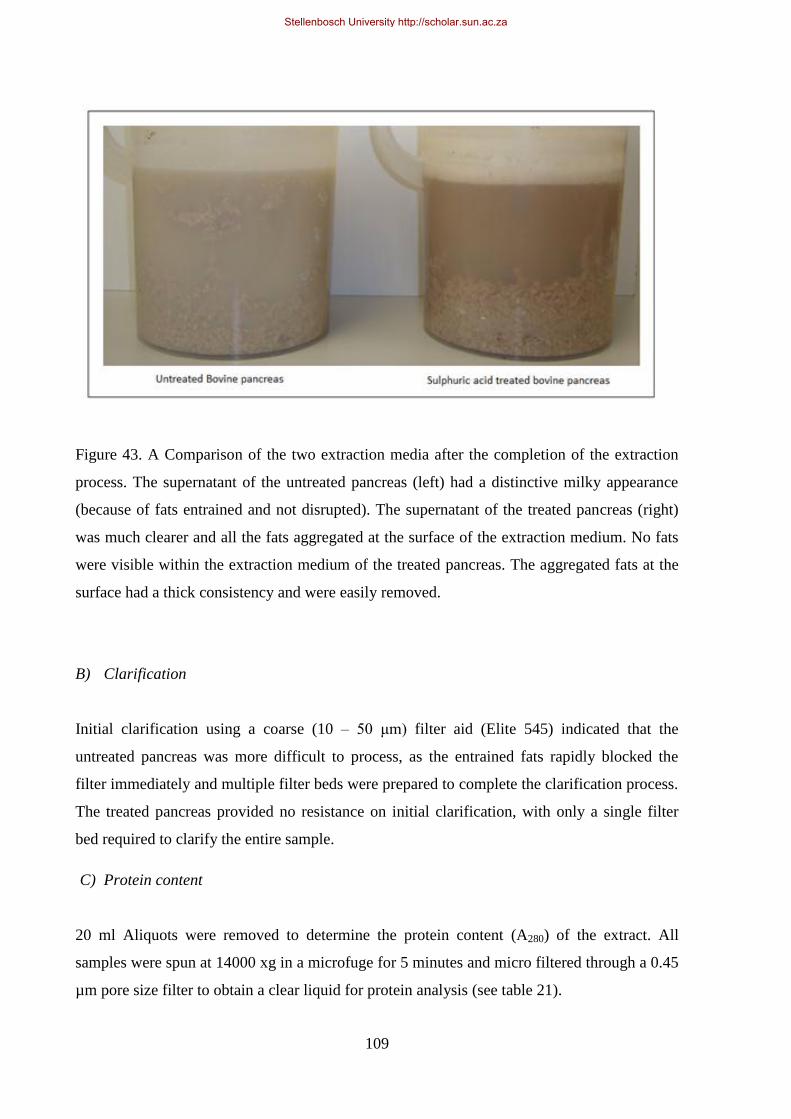
109
Figure 43. A Comparison of the two extraction media after the completion of the extraction
process. The supernatant of the untreated pancreas (left) had a distinctive milky appearance
(because of fats entrained and not disrupted). The supernatant of the treated pancreas (right)
was much clearer and all the fats aggregated at the surface of the extraction medium. No fats
were visible within the extraction medium of the treated pancreas. The aggregated fats at the
surface had a thick consistency and were easily removed.
B) Clarification
Initial clarification using a coarse (10 – 50 μm) filter aid (Elite 545) indicated that the
untreated pancreas was more difficult to process, as the entrained fats rapidly blocked the
filter immediately and multiple filter beds were prepared to complete the clarification process.
The treated pancreas provided no resistance on initial clarification, with only a single filter
bed required to clarify the entire sample.
C) Protein content
20 ml Aliquots were removed to determine the protein content (A280) of the extract. All
samples were spun at 14000 xg in a microfuge for 5 minutes and micro filtered through a 0.45
µm pore size filter to obtain a clear liquid for protein analysis (see table 21).
Stellenbosch University http://scholar.sun.ac.za
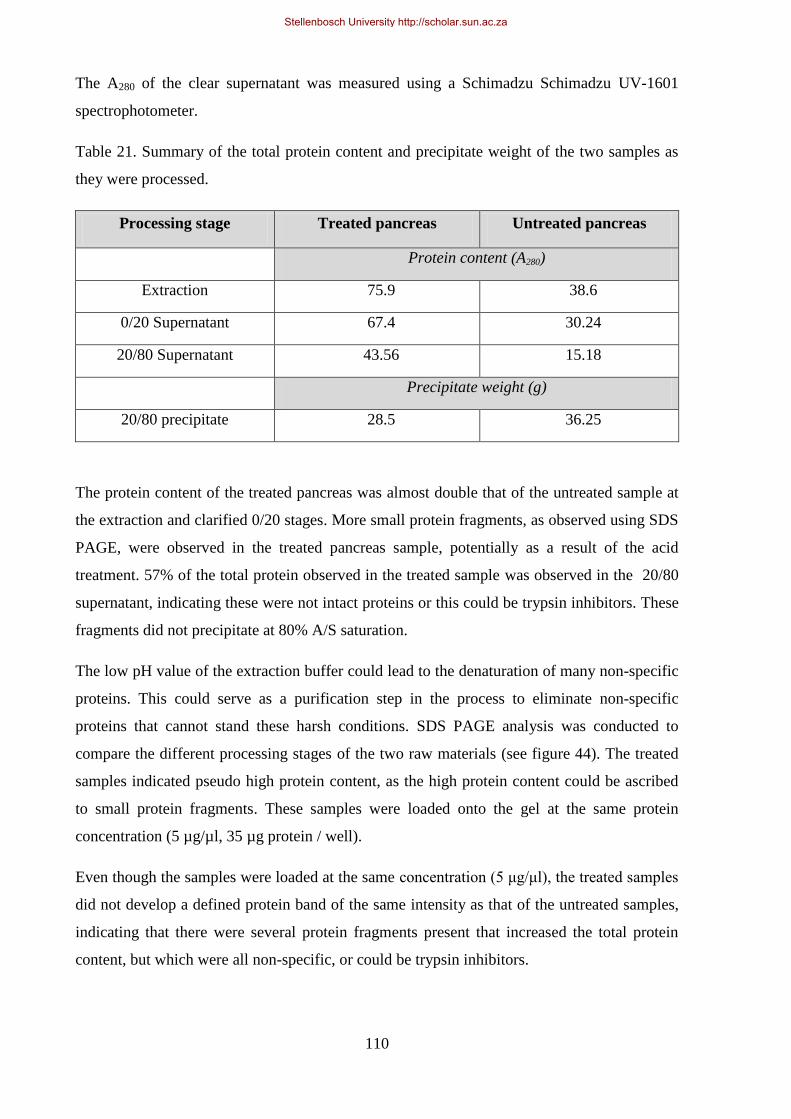
110
The A280 of the clear supernatant was measured using a Schimadzu Schimadzu UV-1601
spectrophotometer.
Table 21. Summary of the total protein content and precipitate weight of the two samples as
they were processed.
Processing stage Treated pancreas Untreated pancreas
Protein content (A280)
Extraction 75.9 38.6
0/20 Supernatant 67.4 30.24
20/80 Supernatant 43.56 15.18
Precipitate weight (g)
20/80 precipitate 28.5 36.25
The protein content of the treated pancreas was almost double that of the untreated sample at
the extraction and clarified 0/20 stages. More small protein fragments, as observed using SDS
PAGE, were observed in the treated pancreas sample, potentially as a result of the acid
treatment. 57% of the total protein observed in the treated sample was observed in the 20/80
supernatant, indicating these were not intact proteins or this could be trypsin inhibitors. These
fragments did not precipitate at 80% A/S saturation.
The low pH value of the extraction buffer could lead to the denaturation of many non-specific
proteins. This could serve as a purification step in the process to eliminate non-specific
proteins that cannot stand these harsh conditions. SDS PAGE analysis was conducted to
compare the different processing stages of the two raw materials (see figure 44). The treated
samples indicated pseudo high protein content, as the high protein content could be ascribed
to small protein fragments. These samples were loaded onto the gel at the same protein
concentration (5 µg/µl, 35 µg protein / well).
Even though the samples were loaded at the same concentration (5 μg/μl), the treated samples
did not develop a defined protein band of the same intensity as that of the untreated samples,
indicating that there were several protein fragments present that increased the total protein
content, but which were all non-specific, or could be trypsin inhibitors.
Stellenbosch University http://scholar.sun.ac.za
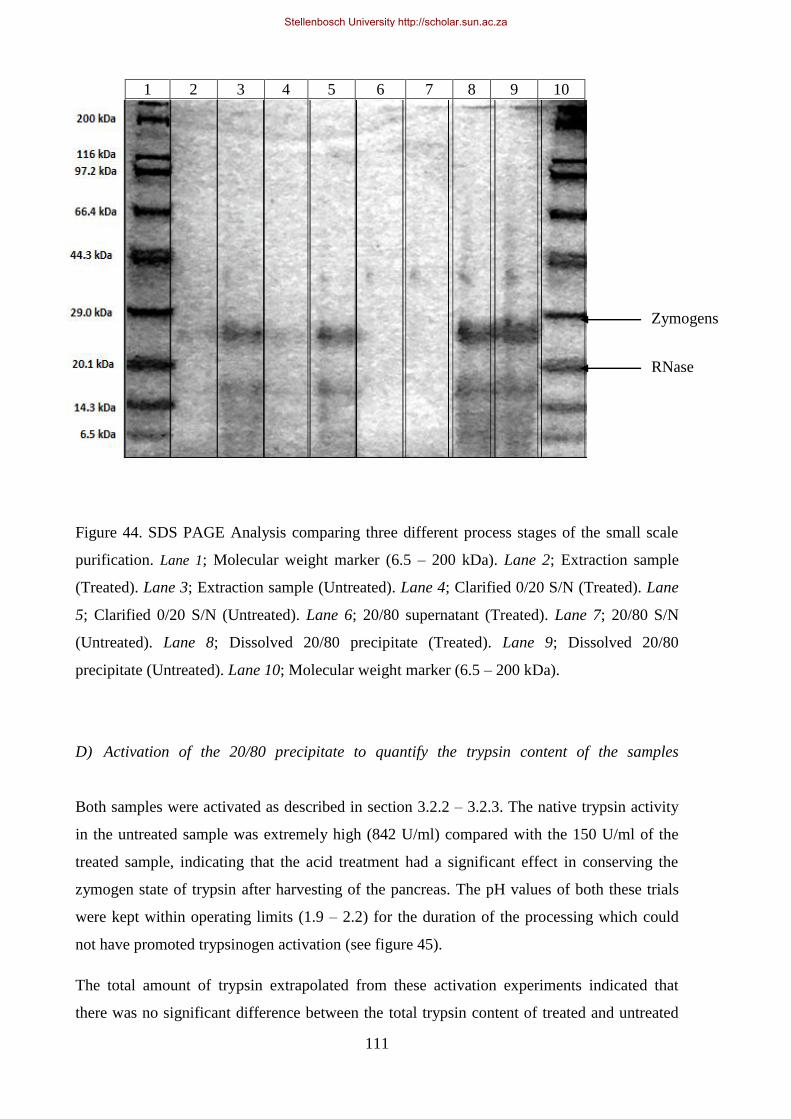
111
Figure 44. SDS PAGE Analysis comparing three different process stages of the small scale
purification. Lane 1; Molecular weight marker (6.5 – 200 kDa). Lane 2; Extraction sample
(Treated). Lane 3; Extraction sample (Untreated). Lane 4; Clarified 0/20 S/N (Treated). Lane
5; Clarified 0/20 S/N (Untreated). Lane 6; 20/80 supernatant (Treated). Lane 7; 20/80 S/N
(Untreated). Lane 8; Dissolved 20/80 precipitate (Treated). Lane 9; Dissolved 20/80
precipitate (Untreated). Lane 10; Molecular weight marker (6.5 – 200 kDa).
D) Activation of the 20/80 precipitate to quantify the trypsin content of the samples
Both samples were activated as described in section 3.2.2 – 3.2.3. The native trypsin activity
in the untreated sample was extremely high (842 U/ml) compared with the 150 U/ml of the
treated sample, indicating that the acid treatment had a significant effect in conserving the
zymogen state of trypsin after harvesting of the pancreas. The pH values of both these trials
were kept within operating limits (1.9 – 2.2) for the duration of the processing which could
not have promoted trypsinogen activation (see figure 45).
The total amount of trypsin extrapolated from these activation experiments indicated that
there was no significant difference between the total trypsin content of treated and untreated
1 2 3 4 5 6 7 8 9 10
Zymogens
RNase
Stellenbosch University http://scholar.sun.ac.za

112
pancreas. There was however a difference in the rate of activation between the two samples
with the activation rate of the non-acid dipped pancreas being higher than that of the acid
treated pancreas. The high native trypsin present in the untreated pancreas may have led to
problems with trypsin stability throughout the process and could have affected the zymogen
separation negatively. Effective zymogen separation does not occur if the native trypsin in the
solution was high. If the native trypsin content is >350 U/mg, trypsin would activate CTG to
chymotrypsin and less chymotrypsin would be able to crystallize as the majority of the CTG
would be converted to chymotrypsin.
Figure 45. Activation plots for both trials. The untreated pancreas had very high native trypsin
(842 U/ml), which accelerated trypsin activation. The treated pancreas with lower native
trypsin content was slow to activate, but both samples activated to the same amount of total
trypsin (approx 78 BU).
The high activity of active native trypsin present in the untreated pancreas explained the rapid
activation and supported the hypothesis that the additional non-specific proteins present in the
treated pancreas could act as trypsin inhibitors. This study indicated that there was no major
difference between the total amount of trypsin present in treated and untreated pancreas. The
high native trypsin content of the untreated pancreas suggested that this material could not be
used to purify trypsin and chymotrypsin, using the existing methodologies where CTG was
crystallized to separate the zymogens.
Stellenbosch University http://scholar.sun.ac.za

113
5.3.4. PROCESSING A LARGE SCALE BATCH TO INVESTIGATE THE EFFECT
OF USING NON ACID DIPPED PANCREAS ON THE ZYMOGEN
SEPARATION
A plant scale trial was initiated to further investigate the effect of the high native trypsin
activity in observed the untreated pancreas on the zymogen separation. This was also
conducted to confirm the findings of the laboratory trials (difficulty in clarification as a result
of non-emulsified fat and high native trypsin observed at the end of primary processing).
Seven hundred kg of untreated pancreas were processed to investigate the possibility of the
usage of untreated pancreas for the production of PDF‟s. The 700 kg of non acid dipped
pancreas was purchased and processed according to the prescribed processing records.
5.3.4.1 RESULTS
At the extraction stage, the non acid treated pancreas extract had a milky appearance with an
initial pH of 6.28. The extract also had a light pink colour, similar to what was found in
pancreas used for routine production that had high starting pH values (see figure 46).
The batch had an extremely high fat content (visibly) after being processed through a BRPX
centrifuge and the high fat content severely complicated clarification of the batch on the filter
press. Two separate filter cakes were prepared to process this specific batch. In contrast, for a
normal 1.4 t production scale batch, the operators prepared 2, or possibly 3, filter cakes on the
filter press to clarify the batch.
No abnormalities were observed during the 0/20 % precipitation, and the concentration with a
10 kDa MWCO ultrafiltration system did not appear to be any more time consuming when
compared with a routine production batch. It was possible to concentrate the full volume
(1700 L) down to 60 L without any difficulty.
The aim of this trial was to determine the feasibility of crystallizing CTG using material from
untreated pancreas.
Stellenbosch University http://scholar.sun.ac.za

114
Figure 46. Light pink colour observed during the initial stages of the extraction of the
untreated bovine pancreas. This colour was only observed when pancreas was extracted with
very high pH values above 6. Routinely the extract has a light brown colour as a result of the
low pH of the extract.
The aim of this trial was to determine the feasibility of crystallizing CTG with material from
untreated pancreas. Normally, if the native trypsin activity of a batch was >350 U/ml, CTG
crystallization does not occur.
As expected the native trypsin activity exceeded 500 U/ml at the zymogen separation, and the
material could not be processed to trypsin or chymotrypsin and needed to be activated and
processed to a very low grade of trypsin where the trypsin: chymotrypsin ratio was approx.
1:1. The final Lyophilized yield was only 480 grams. The assay results for the lyophilized
material were 552.0 U/mg trypsin and 1810.0 U/mg chymotrypsin.
These results confirmed the laboratory scale findings on, and proved that untreated bovine
pancreas was not a suitable source for producing PDFs.
Stellenbosch University http://scholar.sun.ac.za
115
5.3.5. CONCLUSION
Untreated pancreas, for the production of PDFs, was shown not to be a viable raw material
source whilst using the current technology. The high pH of the material during the early
stages of processing allowed for trypsin activation that led to protein degradation. The high fat
content of the material complicated the processing of the material. High native trypsin activity
at the zymogen separation stage did not allow for CTG crystallization. It was thus concluded
that it was not possible to purify CTG/chymotrypsin or pure trypsin from untreated pancreas.
Further exploration is necessary to investigate possibilities to prevent the activation of trypsin
during the harvesting and freezing of the pancreas. The consideration of the usage of non-acid
treated pancreas was an innovative recommendation to reduce the cost of the raw material,
which was the biggest contributor to the production cost.
Chapter 5 described innovative methodologies considered to improve the production
throughput and reduce the overall production time and cost. The implementation of
ultrafiltration technology reduced the overall production time, and reduced the amount of A/S
used per batch. Column chromatography presented a new and innovative platform for
zymogen separation and had the potential to decrease the production of trypsin and
chymotrypsin.
The final aspect of the protein purification process at BBI that was investigated was the
testing methodologies used to quantify the amount of enzyme at various stages during the
production of trypsin and chymotrypsin. Both these enzymes had catalytic activities that could
be quantified by spectrophotometric assays. Chapter 6 will give an overview of the testing
methodologies used and present new methodologies that were considered to quantify the
active and inactive enzymes.
Stellenbosch University http://scholar.sun.ac.za

116
CHAPTER 6
6. DEVELOPMENT OF IN-PROCESS QC ANALYSIS TO QUANTIFY THE TOTAL
AMOUNT OF ENZYME AT DIFFERENT STAGES OF THE PROCESS
6.1 OVERVIEW OF THE TESTING METHODOLOGIES USED
The ability to successfully purify an enzyme relies on the ability to test for the presence of the
enzyme throughout the process. It was essential that real-time information was fed back to the
operators working with the product, as failure to communicate these results in real time could
have lead to major product losses. The only two assays used during the production of trypsin
and chymotrypsin were two kinetic assays for both enzymes. In both these 5 minute kinetic
assays the substrate was digested by the proteases and the change in absorbance of the
reaction mixture was measured at a certain wavelength and plotted against time. Although
these two enzymes indicate a high level of structural similarities (Walsh, 1964) , they do have
completely different substrate affinities (Neurath, 1949). N-benzoyl-L-arginine ethyl ester
(BAEE) was used as a substrate for trypsin activity measurement, and N-acetyl-L-tyrosine
ethyl ester (ATEE) was used as substrate for chymotrypsin activity measurement (Schwert,
1955).
6.1.1. DETERMINATION OF TRYPSIN ACTIVITY
The trypsin assay method was one suggested by Schwert and Takenaka (Schwert, 1955) in
which BAEE is hydrolysed at the ester linkage causing an increase of absorbance measured at
253 nm and 25°C (see Figure 47).
Figure 47. Schematic presentation of the cleavage of BAEE by trypsin, resulting in Nα-Benzoyl-L-
Arganine and ethanol. The reaction volume was 3.2 ml, the light path was 1cm, and the approximate
reaction time was 5 minutes. The reaction is carried out at 25oC where one trypsin unit will produce a
change in absorbance of 0.001 per min at 253 nm (ΔA253) (pH 7.6 and 25 °C) (Schwert, 1955).
Stellenbosch University http://scholar.sun.ac.za

117
6.1.2. DETERMINATION OF CHYMOTRYPSIN ACTIVITY
A method for the activity measurement was published and used with great success until today
(Schwert, 1955). N-Acetyl-L-Tyrosine Ethyl Ester [ATEE] is hydrolysed at the ester linkage
causing a decrease of absorbance measured at 237 nm and 25°C (see figure 48).
Figure 48. Schematic presentation of the cleavage of ATEE by chymotrypsin, resulting in -acetyl-L-
tyrosine acid and ethanol. The reaction is carried out at 25oC where one chymotrypsin unit will
produce a change in absorbance of 0.0075 per min at 237 nm (ΔA237) (pH 7.6 and 25 °C). The reaction
volume was 3.2 ml, the light path was 1 cm, and the approximate reaction time was 5 minutes.
6.2 SHORTCOMINGS OF THE TRADITIONAL TESTING METHODOLOGIES
The testing methodologies used to determine the activity of the enzymes during isolation and
purification were not inadequate, as they were reliable and robust activity assasys. The one
major limitation of the traditional testing methodologies was the inability to monitor primary
process efficiency. Because both the enzymes are expressed as zymogens and remained in
their zymogen state during the primary processing, there was no assay to monitor primary
process efficiency, and no way in which to quantify the total amount of enzyme present. For
both trypsin and chymotrypsin, the first opportunity to quantify the total amount of enzyme
(units)5 for a single production batch was immediately after the activation stages during the
latter stages of the secondary purification. If a particular batch showed low trypsin or
chymotrypsin activity, there was no way to determine if this was as a result of direct process
loss or if the raw material used had a low protease content to start off with. It became apparent
5 Unit Definition: That amount of enzyme causing a decrease in absorbance at 237 nm of
0.0075 per minute at 25°C under the specified conditions.
Stellenbosch University http://scholar.sun.ac.za
118
that there was a need to monitor the primary processing stages before enzyme activation took
place. The number of sampling points across the purification process needed to increase to
gain better insight into the efficiency of every production step. A rapid method was also
required that allows for real-time results to be fed back to the oparatos on the production
floor.
6.3 DEVELOPMENT OF NEW TESTING METHODOLOGIES
The ability to purify an enzyme properly from a complex mixture relies on the ability to
monitor the performance of all the purification stages in the process and to quantify the
protein of interest throughout the purification process. Kinetic assays were used successfully
to quantify the presence of an active enzyme such as trypsin or chymotrypsin in a complex
mixture of proteins.
In-process controls (IPC) are checks that are routinely performed on the product before the
manufacturing process is completed (see figure 49). The functions of IPC‟s are to monitor the
performance, and when necessary, adapt the process to produce a product that fully complies
with the final product specification (see Table 2 and 3).
Proper in-process QC testing provides a means to ensure that a stable process is maintained. A
stable process is a controlled process that can consistently deliver the same end product (that
conforms to the specification) with little or no step-to-step variability.
This implies that for equal amounts of raw material processed, a similar final yield is
consistently to be achieved and that losses observed across a certain process step never exceed
the accepted tolerances. The process parameters should be tightly controlled to minimize
specific protein losses.
Stellenbosch University http://scholar.sun.ac.za
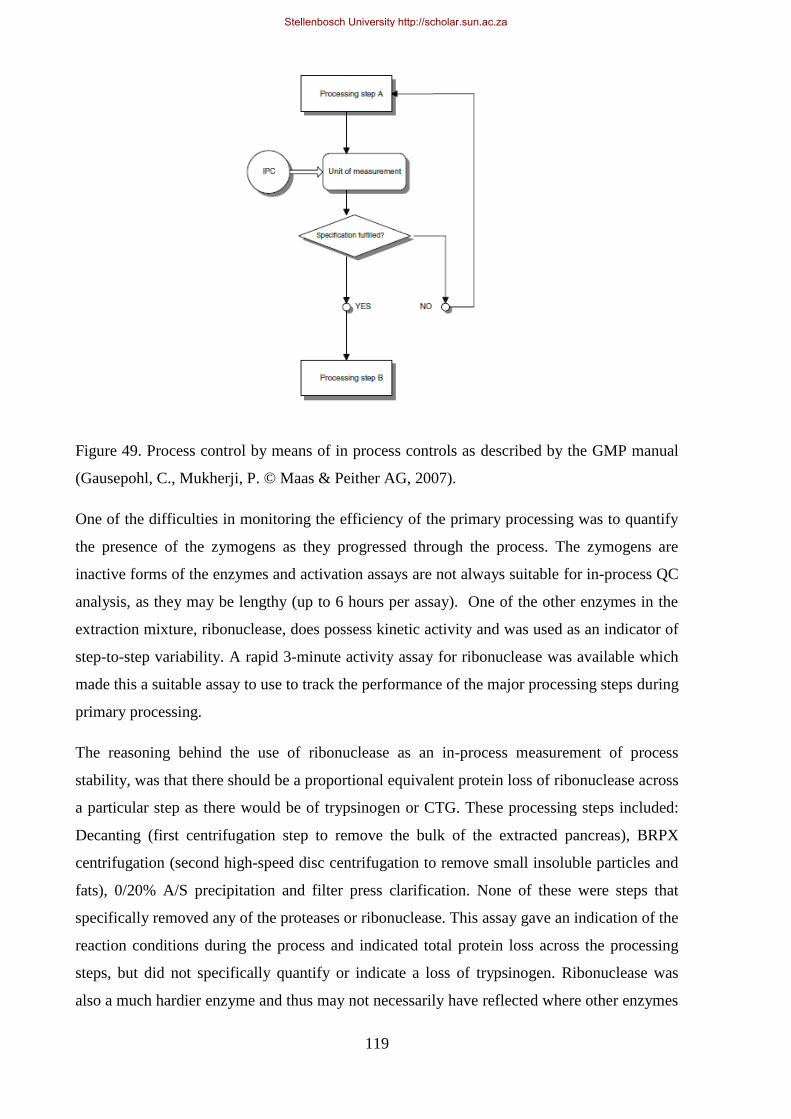
119
Figure 49. Process control by means of in process controls as described by the GMP manual
(Gausepohl, C., Mukherji, P. © Maas & Peither AG, 2007).
One of the difficulties in monitoring the efficiency of the primary processing was to quantify
the presence of the zymogens as they progressed through the process. The zymogens are
inactive forms of the enzymes and activation assays are not always suitable for in-process QC
analysis, as they may be lengthy (up to 6 hours per assay). One of the other enzymes in the
extraction mixture, ribonuclease, does possess kinetic activity and was used as an indicator of
step-to-step variability. A rapid 3-minute activity assay for ribonuclease was available which
made this a suitable assay to use to track the performance of the major processing steps during
primary processing.
The reasoning behind the use of ribonuclease as an in-process measurement of process
stability, was that there should be a proportional equivalent protein loss of ribonuclease across
a particular step as there would be of trypsinogen or CTG. These processing steps included:
Decanting (first centrifugation step to remove the bulk of the extracted pancreas), BRPX
centrifugation (second high-speed disc centrifugation to remove small insoluble particles and
fats), 0/20% A/S precipitation and filter press clarification. None of these were steps that
specifically removed any of the proteases or ribonuclease. This assay gave an indication of the
reaction conditions during the process and indicated total protein loss across the processing
steps, but did not specifically quantify or indicate a loss of trypsinogen. Ribonuclease was
also a much hardier enzyme and thus may not necessarily have reflected where other enzymes
Stellenbosch University http://scholar.sun.ac.za

120
(trypsinogen) may have lost activity. This assay could not indicate if the reaction conditions
during the process were in any way unfavourable to the zymogens.
Immunosorbent Assays
There was thus a need for an assay that could quantify the zymogens during the primary
purification stages of the process to indicate process efficiency. Immunochemical techniques
may readily detect small quantities of specific proteins in a complex mixture of proteins and
provide a means by which it may be possible to quantify the zymogens and provide better
insight into the efficiency of the primary processing stages.
Figure 50 is an illustration of an Enzyme-Linked Immunosorbent Assays (ELISA‟s) which
have been used with great success to quantify the amount of specific protein present in a
mixture. This study only focussed on the development of an ELISA for trypsinogen. If
trypsinogen was damaged or lost during a certain processing step, it was anticipated that CTG
would also be affected in the same way.
Figure 50. Diagram indicating the principle of a sandwich ELISA where the primary antibody
is coated onto a 96 well micro plate (Thermo Scientific Tech Tip #65 ELISA Technical guide
and protocol).
An ELISA must be simple, repeatable and robust and must be able to detect the presence of
the zymogen at very low concentrations.
Stellenbosch University http://scholar.sun.ac.za
121
Kinetic Assays
Kinetic assays have been used extensively over the years at BBI enzymes to quantify the
amount of active enzyme during the secondary processing stages. The shortcoming of these
kinds of assays was that they only considered a single dilution per sample, and there were no
control samples included when assaying any sample. These assays could not be used to
quantify the zymogens during the primary processing. The setup of these assays was
extremely time consuming, and required a great deal of preparation. Although the assays used
during the secondary processing were extremely accurate, the lack of a control sample and the
ability to perform the assays in duplicate raised concerns regarding assayists to assayists
variance.
The use of kinetic microtitre assays for monitoring in process control was considered, and a
kinetic assay for trypsin was developed. This assay included a standard curve and required
each sample to be assayed in duplicate. Each sample was assayed at three dilutions, and
multiple samples could be assayed with a single assay. In the same way as the ELISA, this
assay needed to be simple, reproducible and accurate.
Defining a standard curve
A standard curve is a quantitative research tool that may be used to determine the
concentration of a specific protein. A dilution series of defined protein concentration is
prepared by diluting a standard and measuring the absorbance thereof at a certain wavelength.
A standard curve is obtained when the absorbance at a certain wavelength is plotted against a
defined protein concentration or activity. When an unknown sample is analysed under the
same conditions as the standards, and an absorbance value is obtained which falls within the
absorbance range of the standard curve, it can directly be correlated to a corresponding
protein concentration or enzyme activity. If the absorbance value obtained for the unknown
sample falls outside of the specified absorbance range, the sample can be diluted accordingly
so that the absorbance of the diluted sample falls within the defined absorbance range. The
corresponding protein concentration is multiplied by the dilution factor to obtain an accurate
protein concentration or enzyme activity of the unknown protein sample.
Another important consideration when defining a standard curve is the curve fit or R2
value.
This gives an indication of the linearity of the data points when looking at distribution of data
points. An R2 value of 1.00 indicates a perfect curve fit, being linear or quadratic polynomial.
Stellenbosch University http://scholar.sun.ac.za
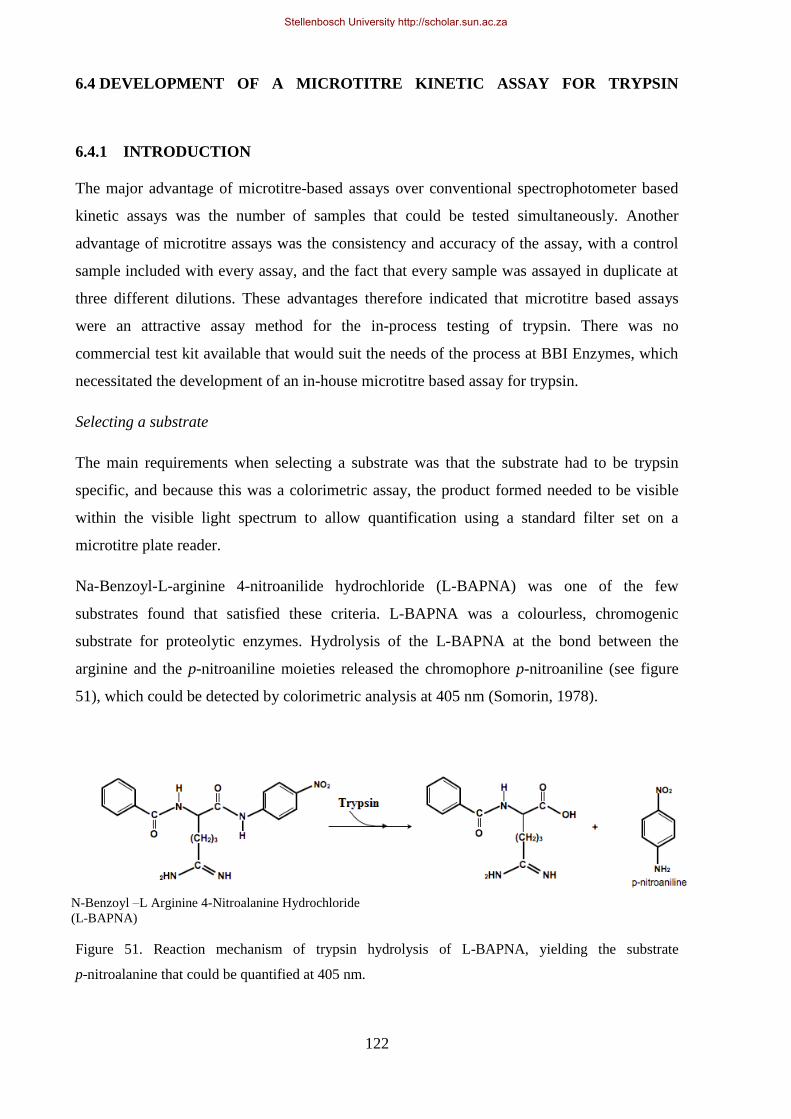
122
6.4 DEVELOPMENT OF A MICROTITRE KINETIC ASSAY FOR TRYPSIN
6.4.1 INTRODUCTION
The major advantage of microtitre-based assays over conventional spectrophotometer based
kinetic assays was the number of samples that could be tested simultaneously. Another
advantage of microtitre assays was the consistency and accuracy of the assay, with a control
sample included with every assay, and the fact that every sample was assayed in duplicate at
three different dilutions. These advantages therefore indicated that microtitre based assays
were an attractive assay method for the in-process testing of trypsin. There was no
commercial test kit available that would suit the needs of the process at BBI Enzymes, which
necessitated the development of an in-house microtitre based assay for trypsin.
Selecting a substrate
The main requirements when selecting a substrate was that the substrate had to be trypsin
specific, and because this was a colorimetric assay, the product formed needed to be visible
within the visible light spectrum to allow quantification using a standard filter set on a
microtitre plate reader.
Na-Benzoyl-L-arginine 4-nitroanilide hydrochloride (L-BAPNA) was one of the few
substrates found that satisfied these criteria. L-BAPNA was a colourless, chromogenic
substrate for proteolytic enzymes. Hydrolysis of the L-BAPNA at the bond between the
arginine and the p-nitroaniline moieties released the chromophore p-nitroaniline (see figure
51), which could be detected by colorimetric analysis at 405 nm (Somorin, 1978).
Figure 51. Reaction mechanism of trypsin hydrolysis of L-BAPNA, yielding the substrate
p-nitroalanine that could be quantified at 405 nm.
N-Benzoyl –L Arginine 4-Nitroalanine Hydrochloride
(L-BAPNA)
Stellenbosch University http://scholar.sun.ac.za

123
6.4.2 MATERIALS AND METHODS
For the development of the microtitre assay, pure trypsin was purchased from Sigma (Sigma
life sciences, St. Louis, USA, product # T8003), (specific activity 13400 U/mg BAEE) and
used to prepare the dilution series and standards. The substrate (L-BAPNA) was also
purchased for Sigma (Sigma Aldrich, St. Louis, USA, product # B3279).
A Thermo Fisher Multiskan FC series plate reader was used for the incubation and reading of
the plates. Skanit software (version 2.5.1) was used to operate the plate reader and to analyse
the results.
Buffer and reagents
A 50 mM Tris-HCl, pH 8.4 buffer was prepared as assay buffer and was used as dilution
buffer for the substrate. A 5 mM Glycine-HCl buffer, pH 3.0 containing 30% glycerol was
prepared to prepare and store trypsin samples for assay.
Trypsin stock solutions were prepared (2 mg/ml) in 5 mM Glycine-HCl buffer, pH 3.0
containing 30% glycerol.
Trypsin substrate stock (5 mg/ml L-BAPNA) was prepared in dimethyl formamide (DMF)
and stored at -20oC. For a single assay, the substrate stock solution was diluted 1:18 with
assay buffer (50 mM Tris-HCl, pH 8.4) and mixed well before use. The substrate was light
sensitive, and needed to be prepared in amber glass bottles and stored in the dark when not
used.
Preparation of a standard curve
The following dilutions were made from trypsin stock solution (2 mg/ml) using a 5 mM
Glycine-HCl buffer, pH 3.0 containing 30% glycerol: 1/6, 1/12, 1/24, 1/48 and 1/96.
The diluted enzyme solutions were transferred into duplicate microtitre wells (20μl/well). The
substrate solution (200 μl/well) was added into each well to obtain a final volume of
220 μl. The reaction mixture was shaken (medium shaking) for 10 minutes on a microtitre
instrument before absorbance was read at 405 nm.
Stellenbosch University http://scholar.sun.ac.za

124
6.4.3 RESULTS
Standard curve
Standard curves were plotted of the Absorbance at 405 nm against the corresponding enzyme
concentrations. Total dilutions were calculated as follows: Dilutions made under enzyme
dilutions (see general method) x Dilution in the reaction mixture (1/20).The results of these
standard curves are summarized in table 22 and figure 52 below.
Table 22. Absorbance at 450 nm of 4-nitroaniline produced by trypsin enzymatic cleavage of L-
BAPNA substrate after a 10 minute incubation. (n=3)
Total dilutions Absorbance 405 nm Trypsin Activity
(U/ml)
1/120 1.552 (±0.051) 223.8
1/240 0.884 (±0.040) 111.9
1/480 0.483(±0.05) 55.6
1/960 0.270 (±0.081) 28.1
1/1920 0.155(±0.064) 14.1
Figure 52: Standard curve obtained for the trypsin activity assay. Sigma trypsin was used for the assay.
Stellenbosch University http://scholar.sun.ac.za
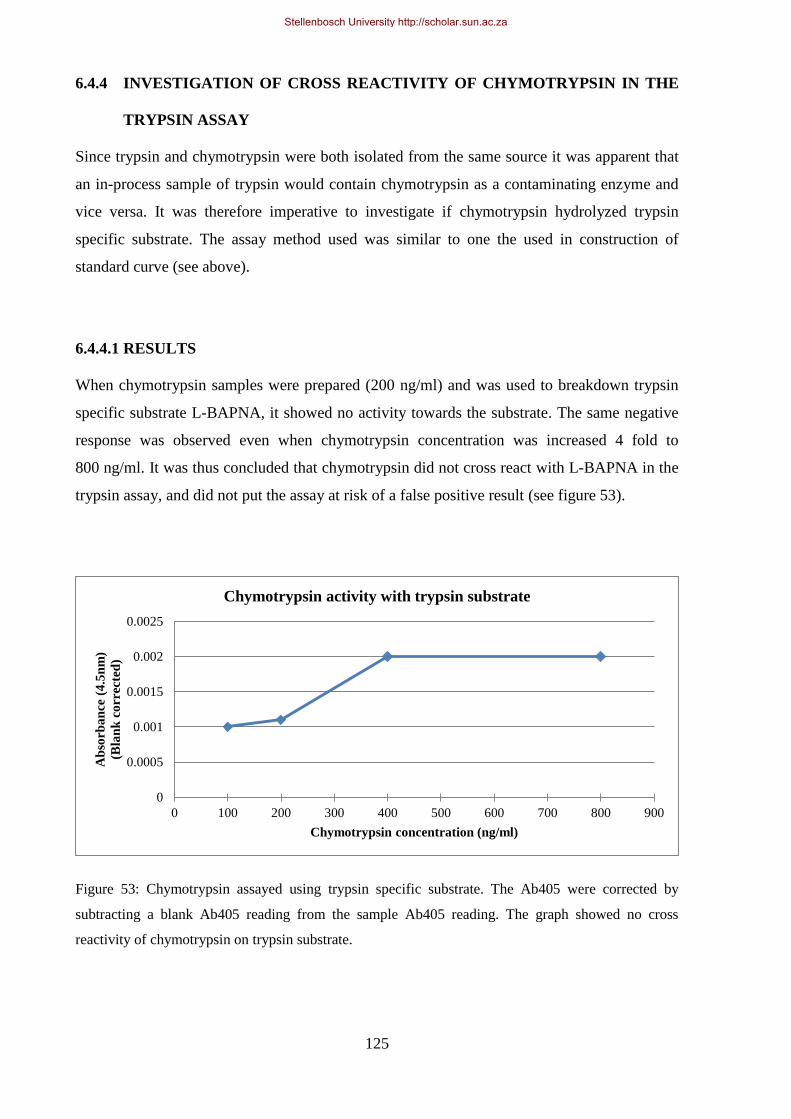
125
6.4.4 INVESTIGATION OF CROSS REACTIVITY OF CHYMOTRYPSIN IN THE
TRYPSIN ASSAY
Since trypsin and chymotrypsin were both isolated from the same source it was apparent that
an in-process sample of trypsin would contain chymotrypsin as a contaminating enzyme and
vice versa. It was therefore imperative to investigate if chymotrypsin hydrolyzed trypsin
specific substrate. The assay method used was similar to one the used in construction of
standard curve (see above).
6.4.4.1 RESULTS
When chymotrypsin samples were prepared (200 ng/ml) and was used to breakdown trypsin
specific substrate L-BAPNA, it showed no activity towards the substrate. The same negative
response was observed even when chymotrypsin concentration was increased 4 fold to
800 ng/ml. It was thus concluded that chymotrypsin did not cross react with L-BAPNA in the
trypsin assay, and did not put the assay at risk of a false positive result (see figure 53).
Figure 53: Chymotrypsin assayed using trypsin specific substrate. The Ab405 were corrected by
subtracting a blank Ab405 reading from the sample Ab405 reading. The graph showed no cross
reactivity of chymotrypsin on trypsin substrate.
0
0.0005
0.001
0.0015
0.002
0.0025
0 100 200 300 400 500 600 700 800 900
Ab
sorb
an
ce (
4.5
nm
)
(Bla
nk
co
rrec
ted
)
Chymotrypsin concentration (ng/ml)
Chymotrypsin activity with trypsin substrate
Stellenbosch University http://scholar.sun.ac.za
126
6.4.5 CONCLUSION
The trypsin standard curve had an R2 value close to 1, suggesting that this assay could be used
to determine the unknown activities of trypsin in in-process samples. The stability of the
standards would have to be established before these assays are used for in-process samples.
The trypsin assay was found not to be sufficiently sensitive at low concentrations. As a result,
trypsin assays could not be used to determine activity of in-process pancreatic extracts prior to
activation because the activity of native trypsin in the extracts was always less than 100 U/ml.
An efficient microtitre assay for analysing the activity of trypsin was developed. With
suitable standards the assay could be used for analysis of in-process samples for trypsin at the
secondary stage of purification, after the activation stage
6.5 ELISA DEVELOPMENT FOR TESTING TRYPSINOGEN CONTENT
6.5.1 MATERIALS AND METHODS
The following materials have been purchased from KALON Biological (Kalon, Guildford,
UK):
Assay buffer (PBS pH 7 containing 1% BSA and 0.05% Tween 20), used as a diluent for the
trypsinogen standards and the antibody conjugates. Wash buffer concentrate (dilute 40x with
dH2O before use), used for intermittent plate wash steps between additions of samples and
conjugates. Anti-bovine trypsinogen coated 96-well microtitre plates (10 μg/ml, 100 μl per
well), used as a platform for the ELISA. 1000 ng/ml trypsinogen standard, horseradish
peroxidase (HRP)-conjugated anti-Bovine trypsinogen solution (Dilute 20x with assay buffer
before use) used to selectively bind bovine trypsinogen. Tetramethylbenzidine (TMB)
Chromagen (Dilute 40x with substrate buffer before use) and TMB Chromagen substrate
buffer used to quantify the HRP activity.
A Thermo Fisher Multiskan FC series plate reader and a Thermo Fisher plate washer were
used for the incubation and washing of the plates. Skanit software (version 2.5.1) was used to
operate the plate reader and to analyse the results.
The starting point of the development of the ELISA was to setup a standard curve against
which the protein concentration of the zymogen could be measured. In order to establish the
concentration range for the standard curve (to define the linear range of the curve), a dilution
series of trypsinogen (1000 ng/ml) was prepared and assessed for linearity. For each of the
Stellenbosch University http://scholar.sun.ac.za
127
concentrations of the dilution series, a corresponding absorbance value was obtained which
was used to plot on a standard curve.
The most linear and reproducible part of the curve obtained was further investigated and the
protocol adjusted to obtain a standard curve that was reproducible, had an R2
value of >0.99
with an absorbance range between 3.5 – 0.1 absorbance units at 450 nm. .
Given the target yield for trypsin was 1.4 kg lyophilized product/tonne of pancreas processed
and the average volume after extraction was approximately 3000 L for a standard 1.4 tonne
batch, it implied that, after extraction, the trypsinogen concentration was approximately 653
µg/ml. This was the lowest concentration of trypsinogen that the assay needed to be able to
detect, as the specific protein concentration increased as it progressed through the process due
to concentration steps. This was easily achieved since the trypsinogen standard supplied was
1µg/ml. The implication thereof was that the starting dilutions for the assay were
approximately 1:10000 to obtain absorbance values that fell within the limits of the standard
curve.
Following the development of the ELISA assay, the method needed to be validated according
to the requirements as prescribed by the QA department of BBI Enzymes before this assay
could be used within the production.
Assay protocol used during method development
On a separate (non coated) 96-well plate, a standard curve dilution series was prepared by
double diluting a 125 ng/ml trypsinogen sample 8 times with assay buffer. (Concentration
range: 125 – 0.98 ng/ml.) All sample dilutions were prepared on the same plate. The starting
dilution for the samples was always 1:10000. All sample dilutions were prepared in duplicate.
100 μl of both the standard curve and the sample were transferred onto an anti-trypsinogen
pre-coated 96-well plate. The samples and standards were incubated for 12 minutes at room
temperature with brief (30 seconds) initial shaking. During this interval, a 15x dilution of the
secondary antibody-HRP conjugate was prepared in assay buffer. After the 12 min incubation,
the plate was washed 4 times with washing buffer, and the plate tapped dry to remove any
excess buffer from the wells after washing. A 100 µl of suitably diluted (15x) conjugate was
transferred into each well. The HRP conjugate was incubated for 12 minutes at room
temperature with brief (30 seconds) initial shaking. During this interval, the enzyme substrate
solution was prepared by preparing a 40x dilution of the TMB Chromagen in substrate buffer.
After the 12 min incubation, the plate was washed 4 times with washing buffer, and the plate
Stellenbosch University http://scholar.sun.ac.za
128
tapped dry to remove any excess buffer from the wells after washing. A 100 µl of suitably
diluted (40x) HRP Chromagen was transferred into each well. The HRP Chromagen was
incubated for 12 minutes at room temperature with brief (30 seconds) initial shaking. 100 µl
of stop solution (0.25 M H2SO4) was transferred into each well to terminate the reaction. The
plate was read at 450 nm using a microtitre plate reader.
6.5.2 RESULTS
Preparation of a standard curve
After assessing the protein standards provided (1000 ng/ml stock solution) for linearity, it was
found that the best working range for the standard curve lay between 125 – 0.98 ng/ml.
Concentrations greater than 125 ng/ml did not have any higher absorbance values, indicating
that a level of saturation was achieved. The highest standard for this assay thus needed to be
≤125 ng/ml.
A second dilution series of 125 – 0.98 ng/ml was prepared to assess linearity (see figure 54).
The standard curve had a sigmoidal shape, but did not plateau as the higher protein
concentrations (>125 ng/ml) did, indicating that a level of saturation was not achieved.
Absorbance values for this concentration range were evenly distributed with the absorbance
of the upper standard at 3.7 and the lowest absorbance value at 0.26.
Figure 54 below shows the standard curve obtained between 125 – 0.98 ng/ml. This dataset
was obtained by multiple (8 times) repetitions of the standard curve at the specified
conditions. Error bars indicate little / no variance, indicating that the standard curve was
extremely reproducible, the average standard deviation was 0.02.
Stellenbosch University http://scholar.sun.ac.za

129
Figure 54. The standard curve obtained with standards ranging from 125 – 0.98 ng/ml. The running
conditions were the same as the final defined protocol. n = 3, error bars not visible as the assay
repeatability was too high to insert error bars.
6.5.3 INVESTIGATION OF CROSS-REACTIVITY WITH CONTAMINATING
ENZYMES
After a standard curve for the assay had been established, the robustness of the assay was
assessed since the cross reactivity of the assay with other proteins present needed to be
established. During the initial stages of the purification, several other proteins were present in
the pancreas extraction mixture which included: CTG, chymotrypsin, deoxyribonuclease,
ribonuclease and trypsin. To ensure that there was no cross reactivity of the anti-trypsinogen
antibodies with any of these proteins, lyophilized samples of each of these proteins were
prepared and incubated with the anti-trypsinogen antibodies to see if any of them would bind
to the antibodies under the reaction conditions. If it was found that the antibodies bound to
many of the other proteins in the mixture, indicating that the assay was not specific enough to
be considered as an in-process assay, and new (more specific anti-trypsinogen antibodies)
needed to be prepared.
Lyophilized samples (obtained from BBI Enzymes) were prepared in 10 ml dH2O in the
following concentrations (these concentrations are roughly the concentrations of the enzymes
during the initial stages of the process): Chymotrypsin (1 mg/ml), CTG (1 mg/ml),
Ribonuclease (0.2 mg/ml), Deoxyribonuclease (0.2 mg/ml) and trypsin (0.6 mg/ml). These
Stellenbosch University http://scholar.sun.ac.za
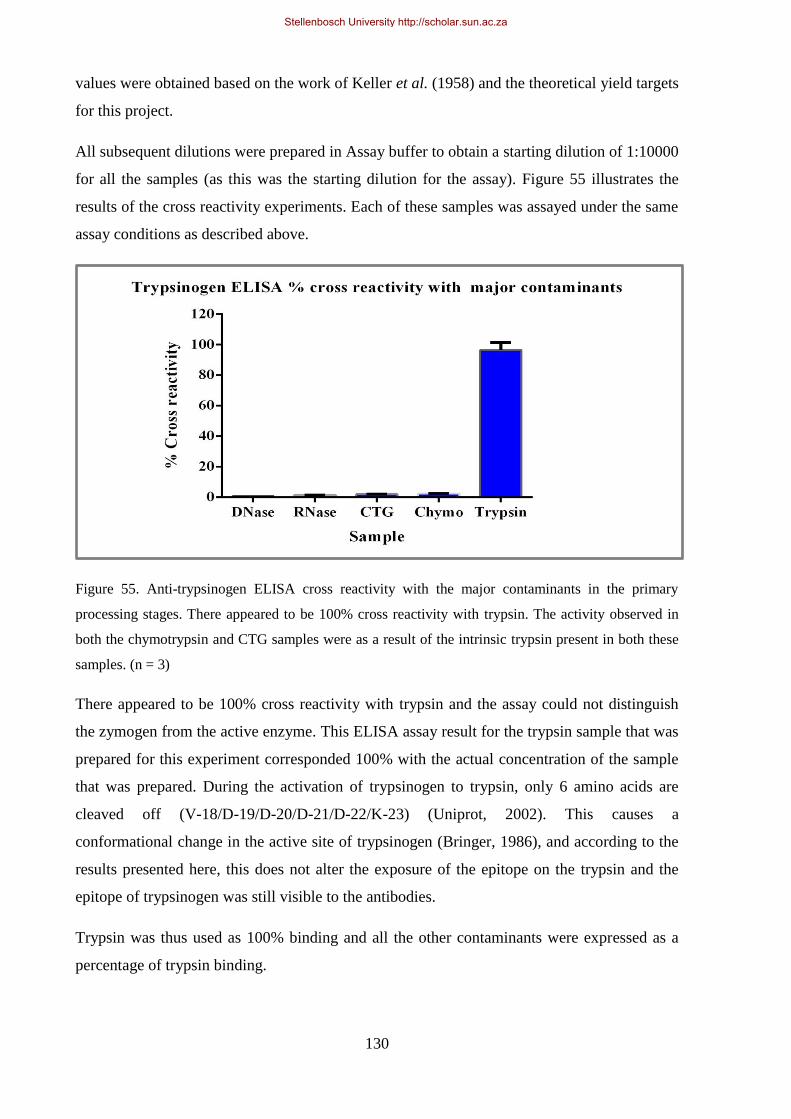
130
values were obtained based on the work of Keller et al. (1958) and the theoretical yield targets
for this project.
All subsequent dilutions were prepared in Assay buffer to obtain a starting dilution of 1:10000
for all the samples (as this was the starting dilution for the assay). Figure 55 illustrates the
results of the cross reactivity experiments. Each of these samples was assayed under the same
assay conditions as described above.
Figure 55. Anti-trypsinogen ELISA cross reactivity with the major contaminants in the primary
processing stages. There appeared to be 100% cross reactivity with trypsin. The activity observed in
both the chymotrypsin and CTG samples were as a result of the intrinsic trypsin present in both these
samples. (n = 3)
There appeared to be 100% cross reactivity with trypsin and the assay could not distinguish
the zymogen from the active enzyme. This ELISA assay result for the trypsin sample that was
prepared for this experiment corresponded 100% with the actual concentration of the sample
that was prepared. During the activation of trypsinogen to trypsin, only 6 amino acids are
cleaved off (V-18/D-19/D-20/D-21/D-22/K-23) (Uniprot, 2002). This causes a
conformational change in the active site of trypsinogen (Bringer, 1986), and according to the
results presented here, this does not alter the exposure of the epitope on the trypsin and the
epitope of trypsinogen was still visible to the antibodies.
Trypsin was thus used as 100% binding and all the other contaminants were expressed as a
percentage of trypsin binding.
Stellenbosch University http://scholar.sun.ac.za
131
During the chymotrypsin purification process, lyophilized trypsin was added to the liquid to
initiate the activation of CTG (see section 3.2.2). The 2.6% cross reactivity observed in the
chymotrypsin sample was largely due to the trypsin present in the chymotrypsin sample (The
native trypsin in this specific batch was 26.7 U/mg). During the secondary purification stages,
the CTG was crystallized out of the solution and removed via centrifugation. The crystals
were washed to remove any entrained contaminating proteins (trypsinogen being one of
them), but all the trypsinogen is not removed as there are still small traces present. The
trypsin(ogen) observed in the CTG sample was largely as a result of the trypsin(ogen) which
could not be washed out of the CTG.
Little or no cross reactivity was observed with the DNase sample.
Ribonuclease indicated 1.5% cross reactivity. This was potentially from the fragments
observed in the final product. During the ribonuclease final purification stages, there was a
protease denaturing stage where the proteases are denatured by heating. These small
fragments are clearly visible when analysing lyophilized ribonuclease product on SDS PAGE.
There was thus little cross reactivity observed with the major contaminants in the mixture
during the primary processing. The cross reactivity observed with the major contaminants was
mainly as a result of the portion of trypsin still present as a contaminant in the preparations
that was used.
Future development of this assay to make it more specific would be to specifically raise
polyclonal antibodies against the 6 amino acid activation peptide of trypsinogen in order to
make the assay specific for trypsinogen. High purity preparations of each of the contaminants
needed to be analysed to confirm the findings.
6.5.4 CONCLUSION
Two testing methods were developed to test for the presence of trypsinogen during the
primary processing, and to test for the presence of trypsin during the secondary processing.
Both these methods were microtitre plate based assays, and were proven to be specific for the
enzyme of interest. In the case of the ELISA assay for trypsinogen, further development is
recommended to develop an assay that is completely specific for trypsinogen as cross
reactivity was observed with a trypsin sample. Both these assays include a control sample for
every plate assayed, and every sample is assayed in duplicate at at-least three different
Stellenbosch University http://scholar.sun.ac.za
132
dilutions. This made these assays very reliable and accurate. The advantage these assays gave
was improved process control. For the first time the primary processing could be monitored
and with an increased amount of samples being submitted during the process, the kinetic
assay is capable of handling multiple samples at once, allowing for a bigger capacity.
By implementing these assays into the process, the level of control exercised on the process
was greatly improved, and the chances of unexpected and unexplainable yield losses were
reduced.
Stellenbosch University http://scholar.sun.ac.za
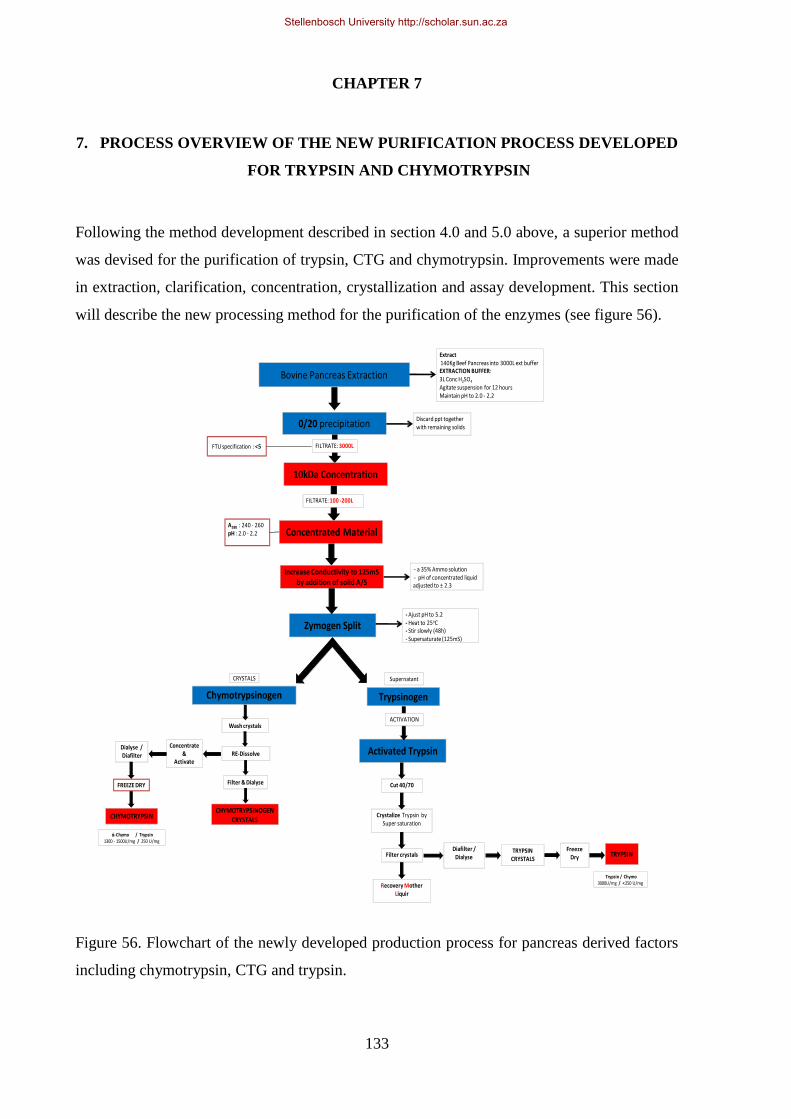
133
CHAPTER 7
7. PROCESS OVERVIEW OF THE NEW PURIFICATION PROCESS DEVELOPED
FOR TRYPSIN AND CHYMOTRYPSIN
Following the method development described in section 4.0 and 5.0 above, a superior method
was devised for the purification of trypsin, CTG and chymotrypsin. Improvements were made
in extraction, clarification, concentration, crystallization and assay development. This section
will describe the new processing method for the purification of the enzymes (see figure 56).
Figure 56. Flowchart of the newly developed production process for pancreas derived factors
including chymotrypsin, CTG and trypsin.
Bovine Pancreas Extraction
Extract140Kg Beef Pancreas into 3000L ext bufferEXTRACTION BUFFER: 3L Conc H2SO4
Agitate suspension for 12 hours Maintain pH to 2.0 - 2.2
0/20 precipitationDiscard ppt together with remaining solids
FILTRATE: 100 -200L
- a 35% Ammo solution- pH of concentrated liquid adjusted to ± 2.3
Zymogen Split- Ajust pH to 5.2- Heat to 25oC- Stir slowly (48h)- Supersaturate (125mS)
Chymotrypsinogen
CRYSTALS
Trypsinogen
Supernatant
Activated Trypsin
ACTIVATION
10kDa Concentration
FILTRATE: 3000L
A280 : 240 - 260 pH : 2.0 - 2.2
Cut 40/70
Crystalize Trypsin by Super saturation
Filter crystals
Recovery Mother Liquir
TRYPSIN CRYSTALS
Trypsin / Chymo3000U/mg / <250 U/mg
Diafilter /Dialyse
Freeze Dry TRYPSIN
Concentrated Material
Increase Conductivity to 125mS by addition of solid A/S
FTU specification : <5
Wash crystals
CHYMOTRYPSIN
ἀ-Chymo / Trypsin1300 - 1500U/mg / 250 U/mg
Filter & Dialyse
CHYMOTRYPSINOGEN CRYSTALS
FREEZE DRY
RE-DissolveConcentrate
& Activate
Dialyse / Diafilter
Stellenbosch University http://scholar.sun.ac.za
134
Extraction
Frozen bovine pancreas are minced through a frozen tissue grinder which houses a 10 mm and
8 mm hole plate into a fine pulp which is mixed with the extraction medium in a hopper.
From the hopper, the tissue / extract is pumped into extraction tanks where it is continuously
stirred via a top entry agitator. As the tissue is transferred to the extraction tanks, the pH of
the extract is adjusted to 2.0 – 2.2 using 2.5 M H2SO4.
A total of 1.4 ton of pancreas is mixed with 3000 L of extraction medium. The 3000 L of
water is measured through a calibrated flow meter, ensuring a total of 3000 L is added to the
extraction mixture. The extract is agitated for 16hours to allow maximal extraction of the
proteases. The mincing process was superior to the flaking method, and better yields were
achieved as a result of proper extraction.
The use of a mincer – hopper configuration increased the process time with 3.5 hours, and the
extraction efficiency with 20% compared to the traditional processing methodologies.
After 16 hours, the tissue is separated from the liquid extract by means of centrifugation. A
continuous flow centrifuge (decanter) was installed to remove the tissue. The new centrifuge
had a throughput of approx. 1200 L/h that reduced the processing time with another hour
compared to the traditional process where the tissue was removed with a batch centrifuge. The
tissue debris of this new decanter had a very low liquid content, and as a result, there was not
a major loss of product into the tissue debris (See section 4.2.1).
Clarification
The decanted liquid still contained some insoluble particles and fine tissue debris that could
not be removed by the decanter. A new high-speed centrifuge was installed to remove any
excess insoluble particles and fats. This unit had a maximum rpm of 12000 rpm, and
maximum G-force of 23,000. This machine was able to reduce the solid content with 80%,
and the output solid content was approximately 0.8%. The solid content was measured with
calibrated centrifuge tubes (See section 4.2.2).
After the additional solids and fats have been removed by centrifugation, the material was
precipitated with 20% A/S (114 g/L) to remove non-specific proteins. Because the A/S
precipitation is volume dependant, the tanks used to perform the precipitation were calibrated
by an external calibration specialist to ensure the volume measured for the A/S precipitation
was as accurate as possible. The addition of A/S was regulated by a specially designed hopper
Stellenbosch University http://scholar.sun.ac.za

135
configuration that allowed solid A/S to be added into the tank at a constant (controlled feeding
rate) to prevent that excessive solid A/S accumulates at the bottom of the tank.
The precipitated material is clarified through a cloth filter press. The clarity of the liquid after
clarification had to be < 5 Formazin Turbidity Units (FTU‟s) to allow it to progress to the
next step in the process. If the material did not meet the specification, it had to be re-worked
to ensure a clear liquid.
Ultrafiltration
The clarified 0/20 material was concentrated with a 10 kDa PALL ultrafiltration system. The
end of the concentration step was marked by a final protein concentration (A280) of 240 – 260.
The volume of the extract was typically reduced 14 – 20 fold to achieve this protein
concentration. The filtrate was routinely tested for any potential trypsin / chymotrypsin
activity to ensure there was no leakage of the enzymes through the membranes. The filtrate
was discarded as liquid waste. The concentration step was performed at a TMP of 1.5 with 2
bar inlet pressure and 1 bar outlet pressure (See section 5.1).
Zymogen Separation
The % A/S saturation of the concentrated 0/20 material was increased to 35% by the addition
of solid A/S to the liquid. The 35% extract was clarified through a diatomaceous earth filter
bed to remove any insoluble particles that formed during the 20/35 precipitation
(Deoxyribonuclease precipitates at 35% A/S).
The clarified liquid is transferred into a temperature-controlled vessel where it will undergo
crystallization of CTG for 48 hours. The temperature of the tank was maintained at 25oC by
circulating hot water through the jacketed vessel. The pH of the liquid was raised to 5.1 – 5.2
using 1 M NaOH. The conductivity of the liquid is measured and slowly to 108mS by the
addition of saturated A/S solution after 16 hours of crystallization. Once the conductivity had
reached 108 mS/cm, the conductivity was further increased to 125 mS/cm by the addition of
saturated A/S (refer to section 4.3.3 for more details on CTG crystallization).
After 48 hours, the crystals were removed from the supernatant by centrifugation in a vertical
axes batch centrifuge. The crystals were washed with a 40% A/S solution, pH 5.2 to remove
any entrained trypsinogen from the crystals. The washings were combined with the
supernatant recovered from the centrifugation step, and used to further purify trypsin. All the
Stellenbosch University http://scholar.sun.ac.za
136
crystals were combined and used to purify CTG or chymotrypsin from, depending on the
demand for product.
7.1 PREPARATION OF CHYMOTRYPSINOGEN
The harvested crystals were washed with 40% A/S to remove any entrained trypsinogen.
Washed crystals were dissolved in water at a pH of 2 – 3. The dissolved crystals were
clarified and diafiltered until salt-free in preparation for freeze dry.
7.2 PREPARATION OF CHYMOTRYPSIN
The harvested CTG crystals were washed thoroughly with 40% A/S remove all entrained
supernatant containing trypsinogen and other non-specific proteins. The crystals were
dissolved in water and clarified using diatomaceous earth.
CTG was activated by adding 26.1 g/L K2HPO4 to the clarified liquid, and raising the pH to
7.6. The activation of CTG was reliant on native trypsin. If the native trypsin activity in the
solution was < 300 U/ml, lyophilized trypsin was added to the solution to initialize the
chymotrypsin activation cascade. The chymotrypsin activity was monitored over a 4 – 6 hour
period, and was assayed every hour. The end of the chymotrypsin activation was marked by a
plateau or decline in the specific activity of chymotrypsin (>750 U/A280). The pH of the solution
was lowered to 3.0 by the addition of H2SO4 to terminate the activation.
The solution is immediately precipitated with 70% A/S by the addition of 205 g/L solid A/S. All
chymotrypsin is precipitated at 70% A/S. The precipitate is collected on a coffin filter under a
vacuum.
The precipitate is dissolved in water and dialysed against acidified tap water for 3 days until
salt free, or the product is diafiltered until salt free. The salt free solution is clarified using
diatomaceous earth and prepared for freeze dry.
7.3 PREPARATION OF TRYPSIN
After the CTG crystals are harvested and washed, the supernatant and the washings of the
crystals are combined and further processed to purify trypsin. 2.42 g/L Tris (0.02 M) and
2.94 g/L CaCl2 (0.02 M) was added to the trypsinogen containing solution in preparation for
trypsin activation.
Stellenbosch University http://scholar.sun.ac.za
137
While stirring, the pH of the trypsinogen liquid is slowly raised to 8.0 with 5 M NaOH to
initialize the trypsin activation at 5oC. The liquid is continually assayed for trypsin activity to
monitor the activation sequence. If the starting trypsin activity is <100 U/ml, 100 g
lyophilized trypsin is added to the stirring liquid. The activation is monitored hourly (assayed
for trypsin activity (U/ml) and protein content (A280). The activation is completed when the
trypsin activity (U/ml) has reached a plateau and the specific activity (U/A280) of trypsin is
between 900 to 1000.
The activation is terminated by lowering the pH to 3.0 with H2SO4 and immediately
precipitated with 75% solid A/S by adding 245 g/L solid A/S to the liquid. The precipitate is
removed by filtration using a coffin filter.
In preparation for trypsin crystallization, the 40/75 precipitate is dissolved in 0.4 M borate
buffer at a pH of 9.0 in a 2 : 1 (w/v) ratio in a cold room (8oC)
The % A/S saturation of the solutions was reduced to 35% using 0.4 M borate buffer followed
by addition of 1 M calcium chloride solution (20 ml/L). The pH was adjusted to 7.0 using 5 M
NaOH. The crystallization was started by seeding (90g/L) with trypsin crystals from previous
bathes.
Overnight, when crystallization was obvious, saturated A/S was added slowly
(0.8L/h) to increase the % A/S saturation in the solutions from 35% to 45% saturation and the
crystallization was allowed to continue for 7 days. After the 7th
day, the trypsin crystals were
harvested by filtration on a coffin filter. (See section 4.3.4).
The crystals are washed with 0.4 M borate buffer, 45% A/S, pH 9 to remove any entrained
proteins. After the crystals are thoroughly washed, they are dissolved in RO water at pH 3
(acidified with H2SO4). The liquid is either diafiltered or dialyzed until salt free and prepared
for freeze dry.
The supernatant of the trypsin crystallization and the washings of the crystals are combined
and referred to as recovery mother liquor (RML). This liquid contains any un-crystallized
trypsin and any chymotrypsin that carried through from the CTG crystallization. The RML is
precipitated with 70% A/S and stored in the freezer.
Stellenbosch University http://scholar.sun.ac.za
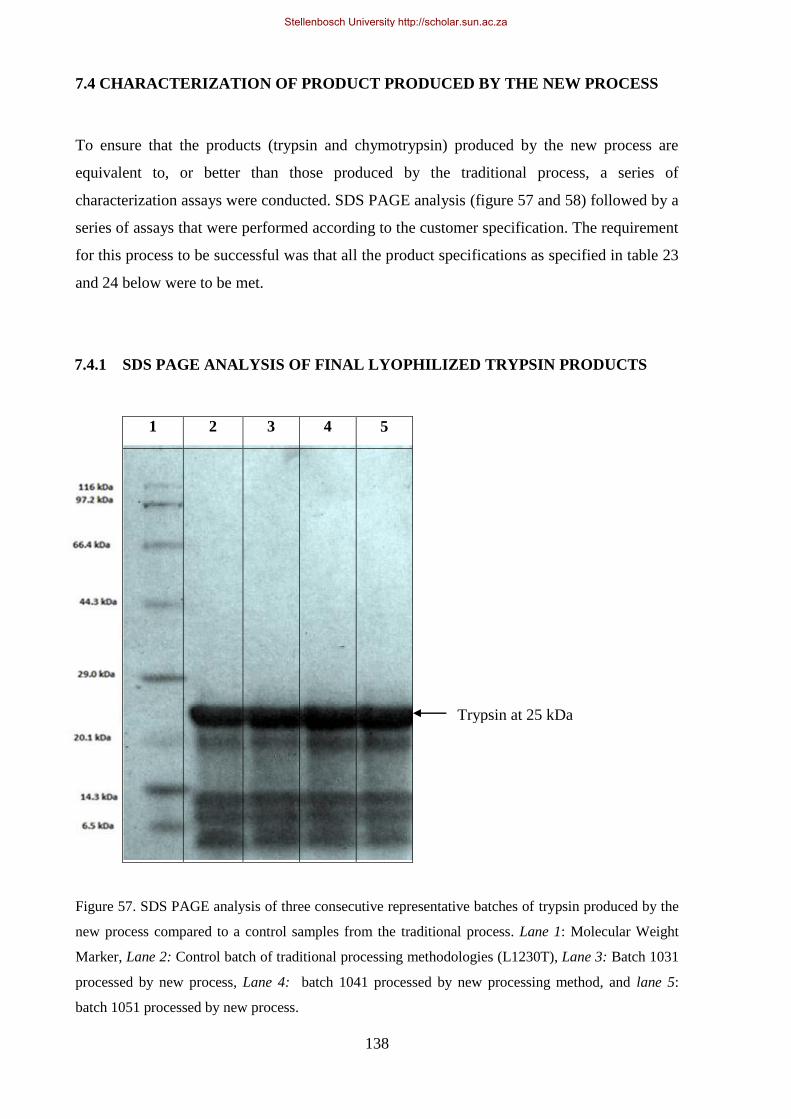
138
Trypsin at 25 kDa
7.4 CHARACTERIZATION OF PRODUCT PRODUCED BY THE NEW PROCESS
To ensure that the products (trypsin and chymotrypsin) produced by the new process are
equivalent to, or better than those produced by the traditional process, a series of
characterization assays were conducted. SDS PAGE analysis (figure 57 and 58) followed by a
series of assays that were performed according to the customer specification. The requirement
for this process to be successful was that all the product specifications as specified in table 23
and 24 below were to be met.
7.4.1 SDS PAGE ANALYSIS OF FINAL LYOPHILIZED TRYPSIN PRODUCTS
Figure 57. SDS PAGE analysis of three consecutive representative batches of trypsin produced by the
new process compared to a control samples from the traditional process. Lane 1: Molecular Weight
Marker, Lane 2: Control batch of traditional processing methodologies (L1230T), Lane 3: Batch 1031
processed by new process, Lane 4: batch 1041 processed by new processing method, and lane 5:
batch 1051 processed by new process.
1 2 3 4 5
Stellenbosch University http://scholar.sun.ac.za
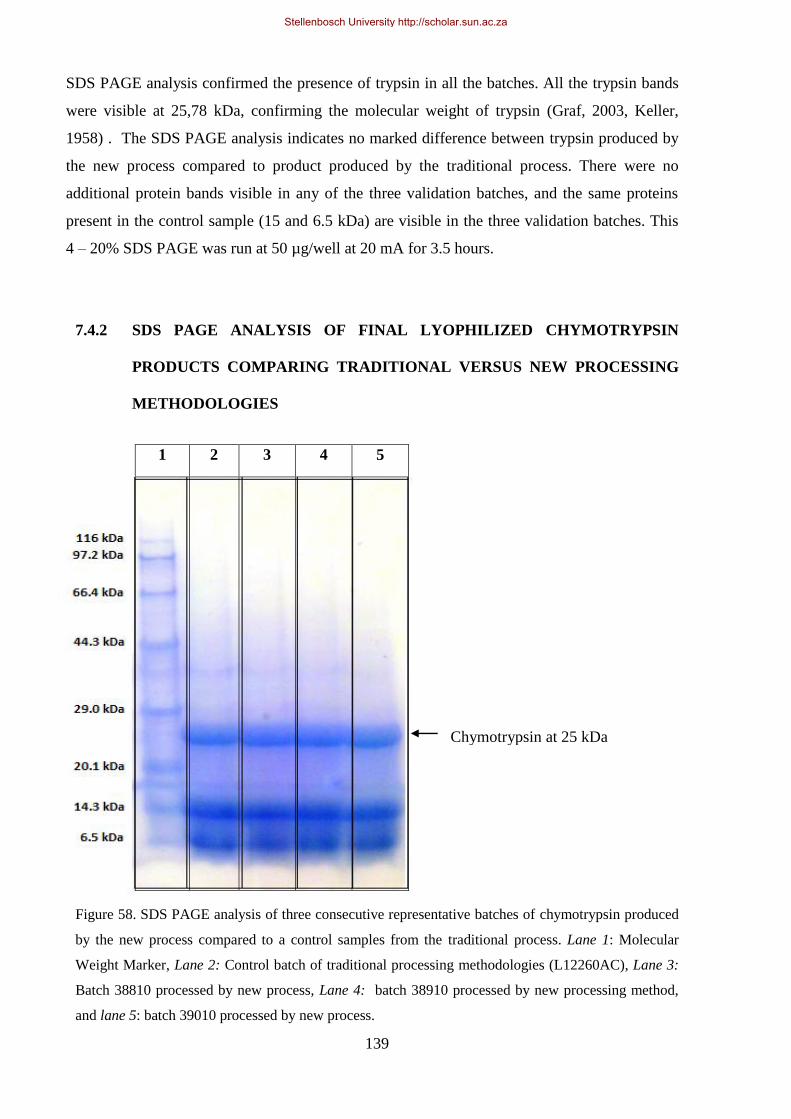
139
SDS PAGE analysis confirmed the presence of trypsin in all the batches. All the trypsin bands
were visible at 25,78 kDa, confirming the molecular weight of trypsin (Graf, 2003, Keller,
1958) . The SDS PAGE analysis indicates no marked difference between trypsin produced by
the new process compared to product produced by the traditional process. There were no
additional protein bands visible in any of the three validation batches, and the same proteins
present in the control sample (15 and 6.5 kDa) are visible in the three validation batches. This
4 – 20% SDS PAGE was run at 50 µg/well at 20 mA for 3.5 hours.
7.4.2 SDS PAGE ANALYSIS OF FINAL LYOPHILIZED CHYMOTRYPSIN
PRODUCTS COMPARING TRADITIONAL VERSUS NEW PROCESSING
METHODOLOGIES
Figure 58. SDS PAGE analysis of three consecutive representative batches of chymotrypsin produced
by the new process compared to a control samples from the traditional process. Lane 1: Molecular
Weight Marker, Lane 2: Control batch of traditional processing methodologies (L12260AC), Lane 3:
Batch 38810 processed by new process, Lane 4: batch 38910 processed by new processing method,
and lane 5: batch 39010 processed by new process.
1 2 3 4 5
Chymotrypsin at 25 kDa
Stellenbosch University http://scholar.sun.ac.za
140
SDS PAGE analysis confirms the presence of chymotrypsin in all the batches. All the
chymotrypsin bands were visible at 25 kDa, confirming the molecular weight of chymotrypsin
(Graf, 2003). The SDS PAGE analysis indicated no marked difference between chymotrypsin
produced by the new process compared to product produced by the traditional process. There
were no additional protein bands visible in any of the three validation batches, and the same
contaminating proteins present in the control sample (15 and 6.5 kDa) were visible in the three
validation batches. This 4 – 20% SDS PAGE was run at 50 ug/well at 20 mA for 3.5 hours.
To determine the success of the process development, the final lyophilized products needed to
be fully compliant with the specification s set out in table 23 and 24 respectively.
Stellenbosch University http://scholar.sun.ac.za

141
Table 23. Summary of the chymotrypsin Quality Control results of the final lyophilized material of the validation batches. These batches were all tested at the
same conditions according to methods indicated in the last column. All assay methods are attached as appendices to this document.
Aspect Description Units Limits L12260AC
(Control) 38810 38910 39010 Method
Description Physical form as per
specification N/A
As per
specification
White buff
powder
White buff
powder
White buff
powder
White buff
powder Visual
Activity Chymotrypsin katal/mg 5.4 6.2502 6.2053 6.2468 6.2273 APPENDIX 2
Chymotrypsin NFU/mg 1307 1691.5 1770.3 1942.4 1730.5 APPENDIX 3
Trypsin BP % <1 < 1 < 1 < 1 < 1 APPENDIX 4
Additional Data
Moisture (4hours @ 60 °C) % ≤5 0.296 1.095 0.579 0.297% APPENDIX 5
Sulphated Ash % ≤2.5 0.438 0.948 0.542 0.742% APPENDIX 6
pH in distilled H2O (10
mg/ml) N/A 3.0-5.0 3.1 3.15 3.16 3.19 APPENDIX 7
Absorbance 281 nm 18.5-22.5 18.791 18.52 18.717 18.62 APPENDIX 8
Absorbance 250 nm <8 6.83 6.678 6.875 6.698 APPENDIX 8
Opalescence N/A ≤Soln 11
between I &
II
between I &
II
between I &
II
between I &
II APPENDIX 9
Enzymatic Activity A % Reddish red colour red colour red colour red colour APPENDIX 10
Enzymatic Activity B % No colour no red colour no red colour no red colour no red colour APPENDIX 10
Trypsin Identification N/A No colour no colour no colour no colour no colour APPENDIX 11
Trypsin NFU/mg Record 22.57 41.34 36.14 23.1 APPENDIX 12
Solubility Distilled H2O 10 mg/ml Soluble Soluble Soluble Soluble Soluble APPENDIX 13
Microbiological
Data
Total Aerobic Microbial
Count cfu/g 1000 85 145 40 5 APPENDIX 14
Total Combined Yeast &
Mould cfu/g <100 <10 <10
<10 <10 APPENDIX 15
Salmonella cfu/10g 0
Not detected Not detected
Not detected Not detected APPENDIX 16
Pseudomonas aeruginosa cfu/g 0
Not detected Not detected
Not detected Not detected APPENDIX 17
Staphylococcus aureus cfu/g 0
Not detected Not detected
Not detected Not detected APPENDIX 18
Stellenbosch University http://scholar.sun.ac.za
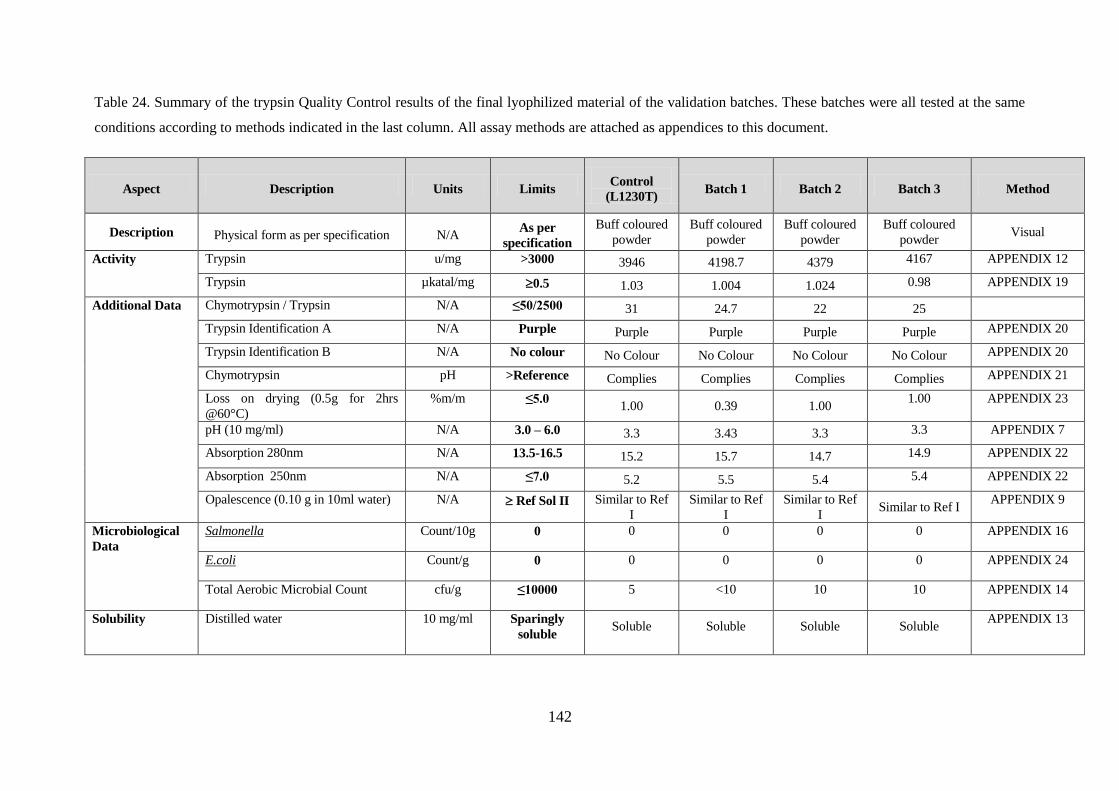
142
Table 24. Summary of the trypsin Quality Control results of the final lyophilized material of the validation batches. These batches were all tested at the same
conditions according to methods indicated in the last column. All assay methods are attached as appendices to this document.
Aspect Description Units Limits Control
(L1230T) Batch 1 Batch 2 Batch 3 Method
Description Physical form as per specification N/A As per
specification
Buff coloured
powder
Buff coloured
powder
Buff coloured
powder
Buff coloured
powder Visual
Activity Trypsin u/mg >3000 3946 4198.7 4379 4167 APPENDIX 12
Trypsin µkatal/mg 0.5 1.03 1.004 1.024 0.98 APPENDIX 19
Additional Data Chymotrypsin / Trypsin N/A ≤50/2500 31 24.7 22 25
Trypsin Identification A N/A Purple Purple Purple Purple Purple APPENDIX 20
Trypsin Identification B N/A No colour No Colour No Colour No Colour No Colour APPENDIX 20
Chymotrypsin pH >Reference Complies Complies Complies Complies APPENDIX 21
Loss on drying (0.5g for 2hrs
@60°C)
%m/m ≤5.0 1.00 0.39 1.00
1.00 APPENDIX 23
pH (10 mg/ml) N/A 3.0 – 6.0 3.3 3.43 3.3 3.3 APPENDIX 7
Absorption 280nm N/A 13.5-16.5 15.2 15.7 14.7 14.9 APPENDIX 22
Absorption 250nm N/A ≤7.0 5.2 5.5 5.4 5.4 APPENDIX 22
Opalescence (0.10 g in 10ml water) N/A Ref Sol II Similar to Ref
I
Similar to Ref
I
Similar to Ref
I Similar to Ref I
APPENDIX 9
Microbiological
Data
Salmonella Count/10g 0 0 0 0 0 APPENDIX 16
E.coli Count/g 0 0 0 0 0 APPENDIX 24
Total Aerobic Microbial Count cfu/g ≤10000 5 <10 10 10 APPENDIX 14
Solubility Distilled water 10 mg/ml Sparingly
soluble Soluble Soluble Soluble Soluble
APPENDIX 13
Stellenbosch University http://scholar.sun.ac.za
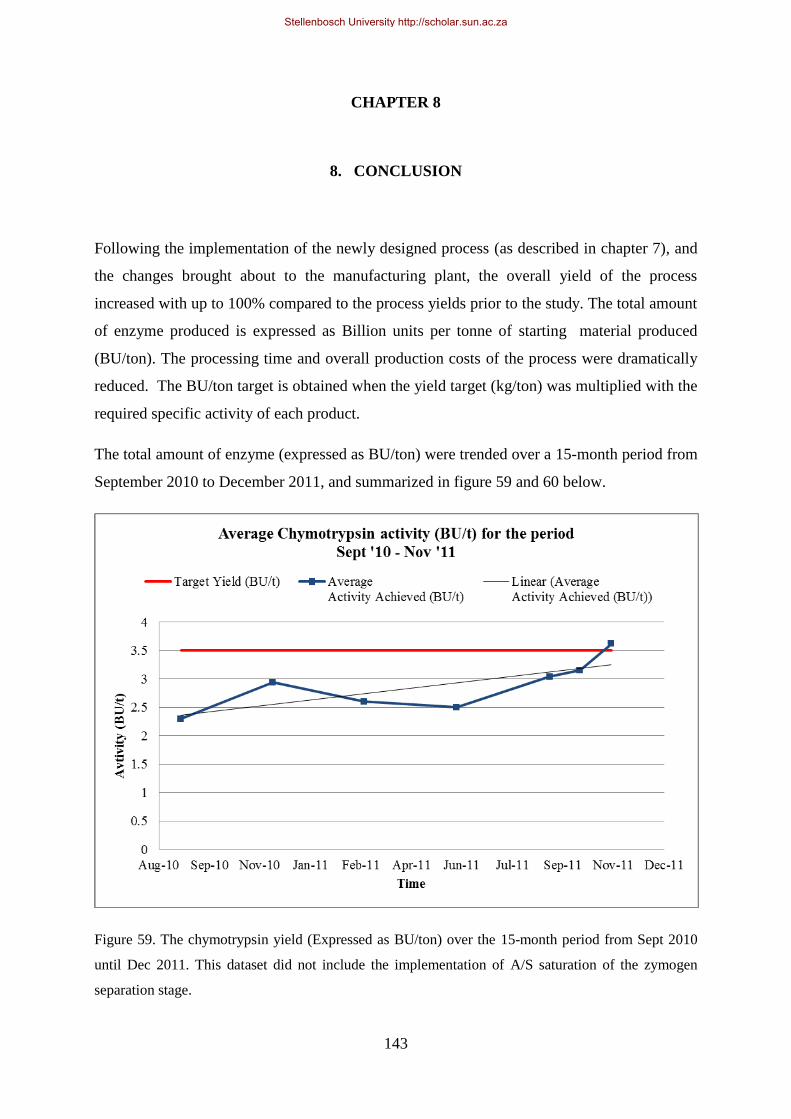
143
CHAPTER 8
8. CONCLUSION
Following the implementation of the newly designed process (as described in chapter 7), and
the changes brought about to the manufacturing plant, the overall yield of the process
increased with up to 100% compared to the process yields prior to the study. The total amount
of enzyme produced is expressed as Billion units per tonne of starting material produced
(BU/ton). The processing time and overall production costs of the process were dramatically
reduced. The BU/ton target is obtained when the yield target (kg/ton) was multiplied with the
required specific activity of each product.
The total amount of enzyme (expressed as BU/ton) were trended over a 15-month period from
September 2010 to December 2011, and summarized in figure 59 and 60 below.
Figure 59. The chymotrypsin yield (Expressed as BU/ton) over the 15-month period from Sept 2010
until Dec 2011. This dataset did not include the implementation of A/S saturation of the zymogen
separation stage.
Stellenbosch University http://scholar.sun.ac.za
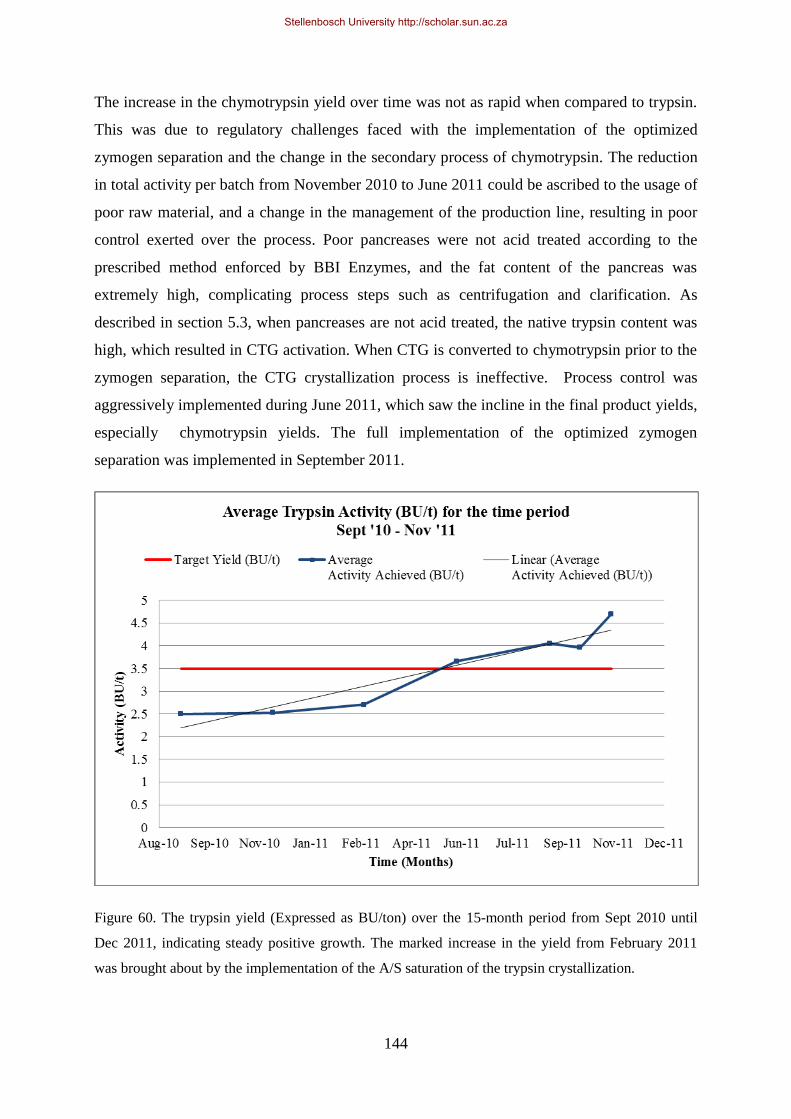
144
The increase in the chymotrypsin yield over time was not as rapid when compared to trypsin.
This was due to regulatory challenges faced with the implementation of the optimized
zymogen separation and the change in the secondary process of chymotrypsin. The reduction
in total activity per batch from November 2010 to June 2011 could be ascribed to the usage of
poor raw material, and a change in the management of the production line, resulting in poor
control exerted over the process. Poor pancreases were not acid treated according to the
prescribed method enforced by BBI Enzymes, and the fat content of the pancreas was
extremely high, complicating process steps such as centrifugation and clarification. As
described in section 5.3, when pancreases are not acid treated, the native trypsin content was
high, which resulted in CTG activation. When CTG is converted to chymotrypsin prior to the
zymogen separation, the CTG crystallization process is ineffective. Process control was
aggressively implemented during June 2011, which saw the incline in the final product yields,
especially chymotrypsin yields. The full implementation of the optimized zymogen
separation was implemented in September 2011.
Figure 60. The trypsin yield (Expressed as BU/ton) over the 15-month period from Sept 2010 until
Dec 2011, indicating steady positive growth. The marked increase in the yield from February 2011
was brought about by the implementation of the A/S saturation of the trypsin crystallization.
Stellenbosch University http://scholar.sun.ac.za

145
The specific activity of both products improved as a result of process improvements. The
average chymotrypsin activity increased from 1300 to ± 1900 U/mg lyophilized product, and
trypsin specific activity increased from 3500 to ± 4300 U/mg.
The overall production time was reduced by 4 days, and the total production costs was
reduced with R 15 000 per batch.
The overall impact of the process changes had a major impact on the performance of the
business. The installation of additional equipment and equipment with higher throughput
capabilities ensured that the overall throughput through the factory was increased. The total
amount of pancreas processed per month increased from 56 ton to 72 tons.
In addition to the process changes and improvements made to the production processes, the
importance of establishing control in a production process was also addressed.
Before the process changes were brought about, the production processes were not properly
controlled, and losses during the process could not be established. In the production
environment, the methods used to purify proteins should be simple, and instructions should be
clear. It should be difficult for production operators to make mistakes. As part of the
investigation into the optimization of the purification a process, process control was addressed
and measures were put into place to improve the overall control exerted over the production
processes. Additional control measures include the following:
Tighter pH controls. The pH range for the primary process was 1.8 – 2.2. This was
changed to 2.0 – 2.2, as 1.8 was too close to the lower stability of trypsin and
chymotrypsin (Outzen, 1996).
Adjustment of pH with 2.5 M H2SO4 instead of concentrated H2SO4 .
Better control over the addition of solid A/S into the fractionation tanks by the
modification of the hopper used to add the A/S. This prevented operators from adding
the A/S too fast, and prevented excessive build-up of solid A/S in the bottom of the
tanks.
Strict pH control (pH adjusted to 2.0 – 2.2) across the entire primary processing
prevented the activation of trypsin and/or chymotrypsin.
Accurate calibration of A/S fractionation tanks. The tanks were calibrated using an
extremely sensitive and accurate flow meter. This allowed for better volume
Stellenbosch University http://scholar.sun.ac.za

146
determination when performing A/S fractionation. All the tanks were externally
calibrated with sight glasses to simplify volume measurements.
Liquid clarity specifications were established for the clarified 0/20 liquid (< 5FTU) to
allow for optimal performance of the ultrafiltration unit.
Conductivity measurements when performing crystallization
A/S saturation of CTG and trypsin crystallization
Additional QC analyses were introduced (see figure 61) into the process to quantify and
characterise the production process.
Figure 61. Definition of in-process QC samples to characterize the processing steps. Additional
ELISA assays were conducted during the primary processing stages to quantify the total amount of
trypsin present in a batch.
This document provides documented evidence that the improvements made to the trypsin and
chymotrypsin manufacturing processes did not change the quality of the final product when
compared to that of the traditional processing method. All the batches produced as validation
batches (incorporating all the changes discussed within this report) did comply with the
specification set out in Table 2 and 3.
All the process operators within the PDF business unit have received formal training on all
newly installed equipment, and are acquainted with the new processing methodologies.
Competency evaluations of each operator proved that the staff working with the new
equipment are fully capable / competent to operate the equipment. The master batch records
Stellenbosch University http://scholar.sun.ac.za

147
were updated to reflect the process as described within this report. All the new equipment
used in the new process was incorporated in these documents.
BBI Enzymes strive to continually improve all their processes and the practices applied to
produce their products better and faster, any future improvements to the process will be
managed via the site change control in accordance to their quality management system. BBI
Enzymes can implement the changes and equipment described in this report with a measure of
confidence in the production plant. Furthermore, the process proved to be flexible and robust.
The final product did not differ from the material previously supplied to our customers.
Table 25. Comparison of the major differences between the traditional and the new processing
methods.
TRADITIONALPROCESSING
METHODS NEW DEVISED METHOD
Low yields achieved Target yield (100% improvement on old)
achieved.
Time consuming due to a series of
precipitation and crystallization stages.
5 days shorter than the traditional processing
method, and did not require a series of A/S
precipitation steps
Large amounts of A/S used which increased
production costs.
5 times less A/S used for precipitation
No in-process assays during primary and
limited number of assays during secondary.
In-process control applied in both primary
and secondary processing
± 55% crystallization efficiency Up to 90% crystallization efficiency
Poor process control Improved process control
Very high specific activities achieved at
final product stage
Stellenbosch University http://scholar.sun.ac.za
148
Future work to be investigated leading on from the work presented in this document include:
1. Optimization of Chromatographic conditions for the purification of trypsin and
chymotrypsin and as a replacement for the Zymogen separation.
2. Recovery of trypsin from the TRML that was precipitated and stored in the freezers.
This remained a rich source of trypsin and chymotrypsin, and can be further
investigated.
3. Crystallization of proteins (CTG and trypsin) at an oil – water interface. This was
discovered as a production non-conformance when oil leaked into the product whilst
crystallizing, when increased yields were observed. The work of Chayen et al. (2004)
indicates this is still a developing science, and can be further developed for
commercial application.
4. The ELISA assay method for determining trypsinogen content during the primary
processing can be further optimized by obtaining new antibodies against a specific
Amino acid sequence unique to trypsinogen (a 6 amino acid sequence called the
Activation peptide) which is cleaved during trypsinogen activation. This would ensure
a higher level of specificity of the assay for trypsinogen, and would not cross react
with trypsin.
Stellenbosch University http://scholar.sun.ac.za
149
CHAPTER 9
9. BIBLIOGRAPHY
Uniprot. (2002). Retrieved October 27, 2011, from www.uniprot.org
sweco.com. (2010, March). Retrieved June 12, 2012, from http://www.sweco.com
Uniprot. (2011, July 27). Retrieved August 15, 2012, from Uniprot:
http://www.uniprot.org/uniprot/P00760
Aiyer, P. V. (2005). Amylases and their applications. African J. Biotech., 4 (13), 1525-1529.
Allain, C. P. (1974). Enzymatic Determination of Total Serum Cholesterol,. Clin. Chem. 20,
470 - 475.
Amersham Pharmacia Biotech. (2000). Hydrophobic interaction Chromatography : Principles
and methods.
Amersham Pharmacia Biotech. (2001). Affinity Chromatography : principles and methods.
Bachovin, W. W. (1981). Catalytic mechanism of serine proteases: re-examination of the ph
dependence of the histidyl 1J13C2-H coupling constant in the catalytic train of alpha-
lytic protease. PNAS. 17(12), 7323–7326.
Bauser, H. C. (1986 ). Control of concentration polarization and fouling of membranes in
medical, food and biotechnical applications. J. Membr. Sci. 27 (2), 195 - 202.
BBI Enzymes. (n.d.). Chymotrypsin activity assay (ATEE). BP6.2.2 -WI11. BBI Enzymes.
BBI Enzymes. (n.d.). Trypsin activity assay (BAEE). BP6.2.2-WI20. BBI Enzymes.
Boeris, V. R. (2009). Purification of chymotrypsin from bovine pancreas using precipitation.
Process Biochem. 44, 588 - 592.
Bringer, A. T. (1986). Trypsinogen-Trypsin Transition: A Molecular Dynamics Study of
Induced Conformational Change in the Activation Domain. Biochemistry , 26(16),
5153 – 6512.
Stellenbosch University http://scholar.sun.ac.za
150
Chayen, N. E. (2004). Tirning protein crystallization from art into a science. Curr. Opin.
Struct. Biol., 14, 577 - 583.
Chen, W. L. (2006). Structure and Function of Bovine Pancreatic Deoxyribonuclease I.
Protein & Peptide Letters, 13, 447-453.
Cole, R. K. (1961). A chromatographic study of Trypsin. J. Biol. Chem, 263, 2443 – 2445.
Corey, D. R. (1992). An investigation into the minimum requirements for peptide hydrolysis
by mutation of the catalytic triad of serine proteases. J. Am. Chem. Soc., 114, 1784 -
1790.
Cox, D. W. (1962). Bovine Pancreatic Procarboxypeptidase B. II. Mechanism of Activation.
Biochemistry, 1078 - 1082.
Craik, C. S. (1985). Redesigning trypsin: alteration of substrate specificity, catalytic activity
and protein conformation. Science, 228, 291 - 297.
Dawson, R. M. (1989). Data for Biochemical Research (Vol. 3). New York, New York, USA:
Oxford University Press.
Delaage, M. A. (1968). Physico-Chemichal Properties of Bovine Chymotrypsinogen B, a
comparative study with Trypsinogen and Chymotrypsinogen A. Eur. J. Biochem, 5,
285 - 293.
Desnuelle, P. (1960). The Enzymes (Vol. 4). (P. D. Boyer, Ed.) New York: Academic Press.
Essex, W. J.-R. (1997). Monte Carlo Simulations for Proteins: Binding Affinities for Trypsin-
Benzamidine Complexes via Free-Energy Perturbations. J. Phys. Chem. B, 101, 9663-
9669.
Evans, S. A. (1982). p-Aminobenzamidine as a Flourescent probe for teh active site of serine
proteases. J. Biol. Chem., 257(6), 3014 - 3017.
Folk, J. E. (1965). Chymotrypsin C, isolation of the zymogen and the active enzyme:
preliminary structure. J. Biol. Chem., 240(1), 181 - 192.
Garcia-Ruez, J. M. (2003). Nucleation of protein crystals. J. Struct. Biol., 142, 22 – 31.
Gausepohl, C., Mukherji, P. © Maas & Peither AG. (2007). GMP Manual (Up07).
Stellenbosch University http://scholar.sun.ac.za
151
GE Healthcare. (2005). Instructions 71-5020-61 AC. Benzamidine Sepharose 4 Fast flof (high
sub).
GE Healthcare. (2007). Benzamidine Sepharose 4 Fast Flow (high sub) HiTrap Benzamidine
FF (high sub). Data File 18-1139-38 AC.
Gomez, J. E. (1974). The metal ion acceleration of the Conversion of Trypsinogen to Trypsin.
Lanthanide Ions as Calcium Ion substitutes. Biochemistry , 13, 3745 – 3750.
Graf, L. S. (2003). Trypsin: is there anything new under the sun? J. Mol. Struct.-Theochem,
666-667, 481 - 485.
Greene, L. J. (1963). On the protein composition of Bovine Pancreatic Zymogen Granules.
J. Biol. Chem., 238 (6), 2054 – 2070.
Hedstrom, L. L. (1996). Hydrophobic interactions control zymogen activation in the trypsin
family of serine proteases. Biochemistry, 35, 4515 - 4523.
Higaki, J. N. (1985). The identification of neotrypsinognens in samples of bovine
trypsinogen. Anal. Biochem., 148, 111 - 120.
Hirs, C. H. (1953). A Chromatographoc separation of Chymotrypsinogen A. Federation
proc., 12, 93 - 99.
http://employees.csbsju.edu/hjakubowski/olcatenzmech.html. (n.d.). Retrieved September 19,
2011, from http://employees.csbsju.edu/hjakubowski/olcatenzmech.html
Hudaaky, P. K. (1999). The differential specificity of Chymotrypsin A and B is determined by
amino acid 226. Eur. J. Biochem., 259, 528±533.
Hyun, J. S. (1971). Cholesterol Esterase - A Polymeric Enzyme. Biochem. Biophys. Res.
Comm., 44, 819.
Jameson, G. W. (1973). Affinity chromatography of Bovine Trypsin. Biochem. J, 141, 555 –
565.
Jennissen, H. P. (2002). Hydrophobic interaction chromatography. Nature Encyclopedia of
Life Sciences, 9, 353 - 361.
Stellenbosch University http://scholar.sun.ac.za
152
Kassell, B. L. (1961). The amino acid composition of Chymotrypsinogen. J. Biol. Chem.,
236, 1996 – 2000.
Keller, P. C. (1958). The proteins of bovine pancreatic juice. J. Biol. Chem., 230(1), 344-349.
Kim, W. C. (2009). The role of mammalian ribonucleases (RNases) in cancer. Biochim.
Biophys. Acta.,, 2, 99 - 113.
Kunitz, M. (1939). Formation of trypsin from crystalline trypsinogen by means of
enterokinase. J. Gen. Physiol., 22(4), 429 - 446.
Kunitz, M. N. (1934). Isolation, crystallization and general properties of a new proteolytic
enzyme and its precursor. J. Gen. Physiol., 18, 433 – 458.
Kunitz, M. N. (1936). Isolation from beef pancreas of crystalline Trypsinogen, Trypsin, a
Trypsin inhibitor, and an inhibitor-Trypsin compound. J. Gen. Physiol., 19, 433 – 458.
Martin, G. J. (1957). Proteolytic Enzymes and their Clinical Applications. Ann. NY Acad.
Sci., 68(1), 70 - 88.
Mc Donald, M. R. (1946). An improved method for the crystallization of Trypsin. J. Gen.
Physiol., 29, 155 – 156.
Miettinen, T. A. (1972). Lipid absorption, bile acids, and cholesterol metabolism in patients
with chronic liver disease. Gut., 13(9), 682–689.
Miller, D. H. (1971). Reevaluation of the activation of bovine Chymotrypsinogen A.
Biochemistry, 10(25), 4641 – 4648.
Neurath, H. S. (1949). The mode of action of the crystalline pancreatic proteolytic enzymes.
Chem. Rev., 46(1), 69 - 153.
Northrop, J. H. (1938). Crystalline Enzymes. New York: Columbia Univ. Press.
Northrop, J. K. (1948). Crystalline Enzymes. 96(2nd ed), New York: Columbia Univ. Press.
Ota, G. (1999). Non-Boltzmann Thermodynamic Integration (NBTI) for Macromolecular
systems:Relative free energy of binding of Trypsin to Benzamidine and Benzylamine.
Eng. Med. Biol. Soc., 37, 641–653.
Stellenbosch University http://scholar.sun.ac.za
153
Outzen, H. B. (1996). .Temperature and pH sensitivity of Trypsins from Atlantic Salamon
(Salmo salar) in comparison with Bovine and Porcine Trypsin. Comp. Biochem.
Physiol, 115B, 33-45.
Patel, A. G. (1995). Pancreatic interstitial pH in human and feline chronic pancreatitis.
Gastroenterology, 109(5), 1639-1645.
Radisky, E. S. (2006). Insights into the serine protease mechanism from atomic resolution
structures of Trypsin reaction intermediates. PNAS of the USA, 103(18), 6835–6840.
Roxas, M. (2008). The Role of Enzyme Supplementation in Digestive Disorders. Alternative
Medicine Review, 13(4), 307 - 314.
Schwartz, L. S. (1999). Introduction to Tangential Flow Filtration for laboratory and process
development applications PALL information brocure PN33213.
Schwert, G. W. (1955). A spectrophotometric determination of Trypsin and Chymotrypsin.
Biochim. Biophys. Acta, 16(4), 570 – 575.
Shotton, D. H. (1973). Evidence for the Amino Acid Sequence of Porcine Pancreatic
Elastase,. Biochem. J., 131, 643.
Sigma Chemicals. (2003). Sodium acetate buffer solution product information. GCY/AJH
8/03.
Silver, B. R. (2011). Protein crystallization at oil/water interfaces. New J. Chem., 35, 602 -
606.
Simon, M. L. (2001). A comparative study of the conformational stabilities of Trypsin and α-
Chymotrypsin. Acta. Biol. Szeged, 45, 43 – 49.
Smith, P. K. (1985). Measurement of protein using bicinchoninic acid. Anal. Biochem.,
150(1), 67 - 85.
Smyth, D. G. (1963). The sequence of amino acid residues in bovine pancreatic ribonuclease:
Revisions and confirmatoins. J. Biol. Chem., 238(1), 227 - 234.
Somorin, O. T. (1978). The actin of Trypsin on Synthetic Chromogenic arginine substrates.
J. Biochem., 85, 157 - 162.
Stellenbosch University http://scholar.sun.ac.za
154
Swamy A., H. M. (2008). Effect of Some Clinically Used Proteolytic Enzymes on
Inflammation in Rats. Indian J. Pharm. Sci., 70(1), 114–117.
Talhout, R. E. (2001). Thermodynamic analysis of binding of p-substituted benzamidines to
trypsin. Eur. J. Biochem., 268, 1554 -1560.
Thermo Scientific Tech Tip #65 ELISA Technical guide and protocol) . (n.d.).
Thomson, A. H. (1995). Human recombinant DNase in cystic fibrosis. Journal of the Royal
Society of Medicine, 88(25), 24 - 29.
Tiselius, A. (1948). Adsorption Separation by Salting Out. Arkiv For Kemi, 26B(1), 1 - 5.
Verger, R. D. (1969). Purification from Porcine Pancreas of Two Molecular Species with
Lipase Activity. Biochim. Biophys. Acta, 188, 272.
Voet, D. V. (2004). Biochemistry (3 ed.). (D. F. Harris, Ed.) Wiley international edition.
Walsh, K. A. (1964). Trypsinogen and Chymotrypsinogen as homologous proteins.
Biochemistry, 52, 884 – 889.
Stellenbosch University http://scholar.sun.ac.za

155
10. APPENDICIES
APPENDIX 1
Primary amino acid sequence of Bovine Trypsin. (Uniprot, 2002)
10 20 30 40 50 60
MKTFIFLALL GAAVAFPVDD DDKIVGGYTC GANTVPYQVS LNSGYHFCGG SLINSQWVVS
70 80 90 100 110 120
AAHCYKSGIQ VRLGEDNINV VEGNEQFISA SKSIVHPSYN SNTLNNDIML IKLKSAASLN
130 140 150 160 170 180
SRVASISLPT SCASAGTQCL ISGWGNTKSS GTSYPDVLKC LKAPILSDSS CKSAYPGQIT
190 200 210 220 230 240
SNMFCAGYLE GGKDSCQGDS GGPVVCSGKL QGIVSWGSGC AQKNKPGVYT KVCNYVSWIK
QTIASN
Primary amino acid sequence of Bovine Chymotrypsin. (Uniprot, 2002)
10 20 30 40 50 60
CGVPAIQPVL SGLSRIVNGE EAVPGSWPWQ VSLQDKTGFH FCGGSLINEN WVVTAAHCGV
70 80 90 100 110 120
TTSDVVVAGE FDQGSSSEKI QKLKIAKVFK NSKYNSLTIN NDITLLKLST AASFSQTVSA
130 140 150 160 170 180
VCLPSASDDF AAGTTCVTTG WGLTRYTNAN TPDRLQQASL PLLSNTNCKK YWGTKIKDAM
190 200 210 220 230 240
ICAGASGVSS CMGDSGGPLV CKKNGAWTLV GIVSWGSSTC STSTPGVYAR VTALVNWVQQ
TLAAN
Stellenbosch University http://scholar.sun.ac.za
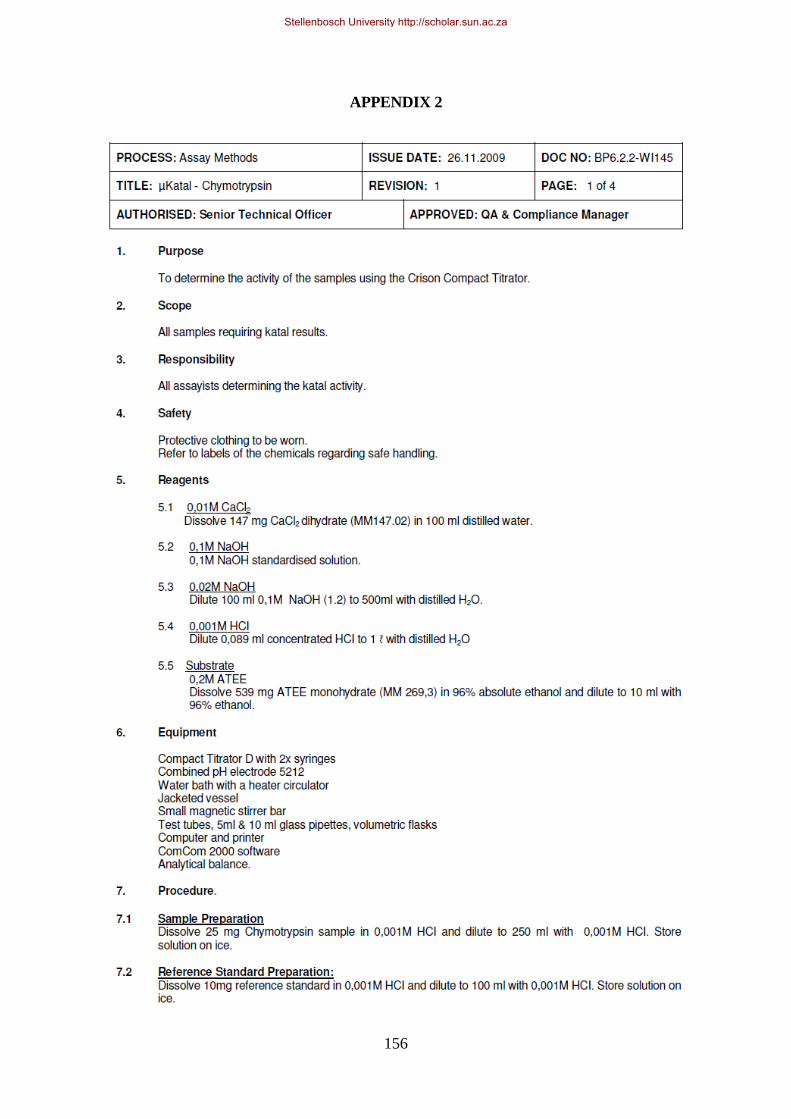
156
APPENDIX 2
Stellenbosch University http://scholar.sun.ac.za
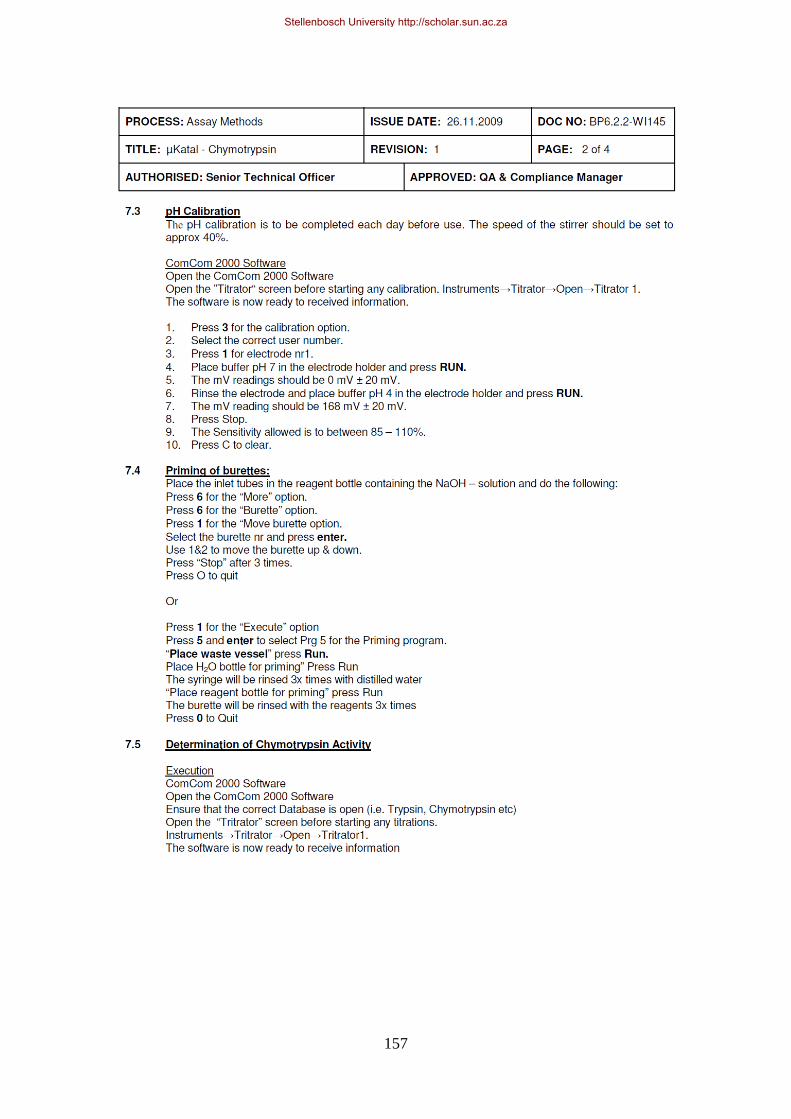
157
Stellenbosch University http://scholar.sun.ac.za
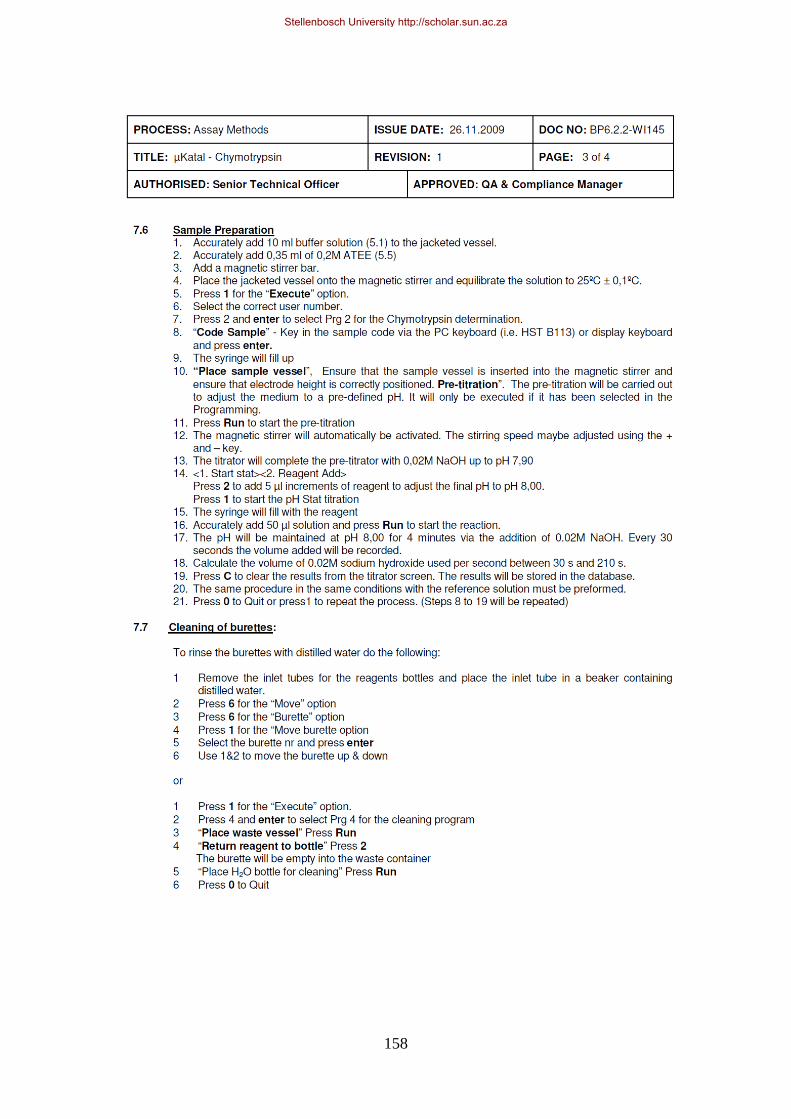
158
Stellenbosch University http://scholar.sun.ac.za
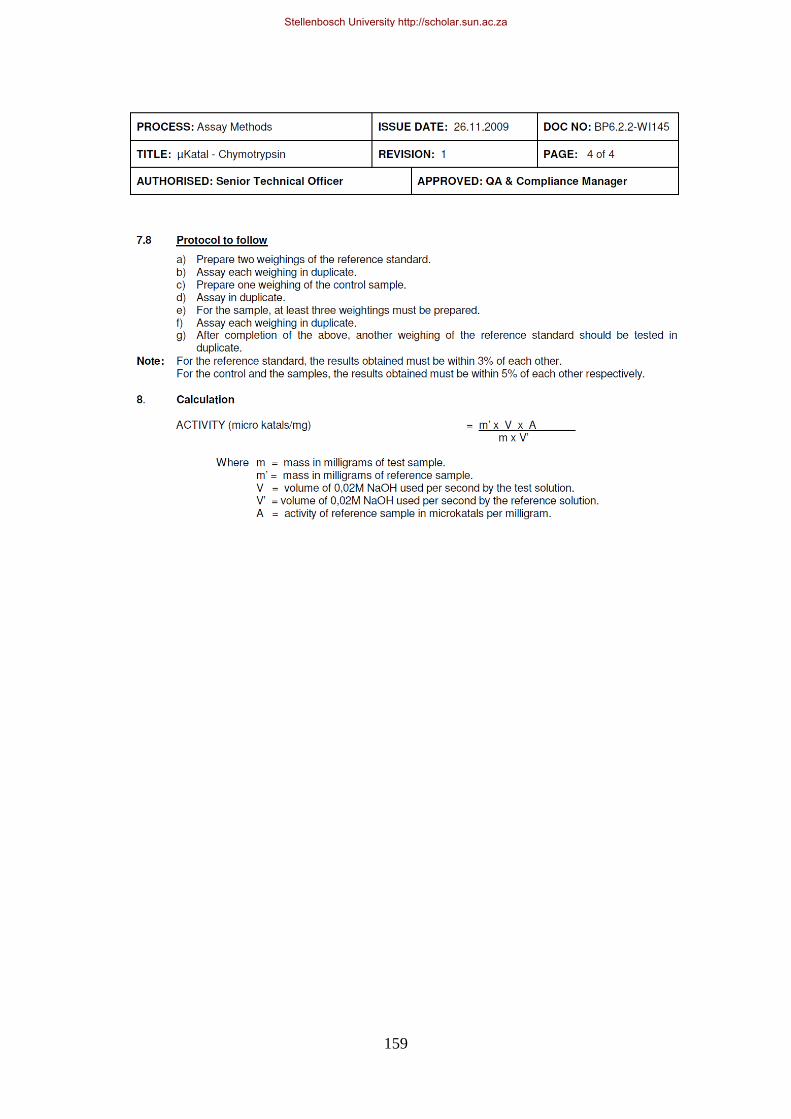
159
Stellenbosch University http://scholar.sun.ac.za
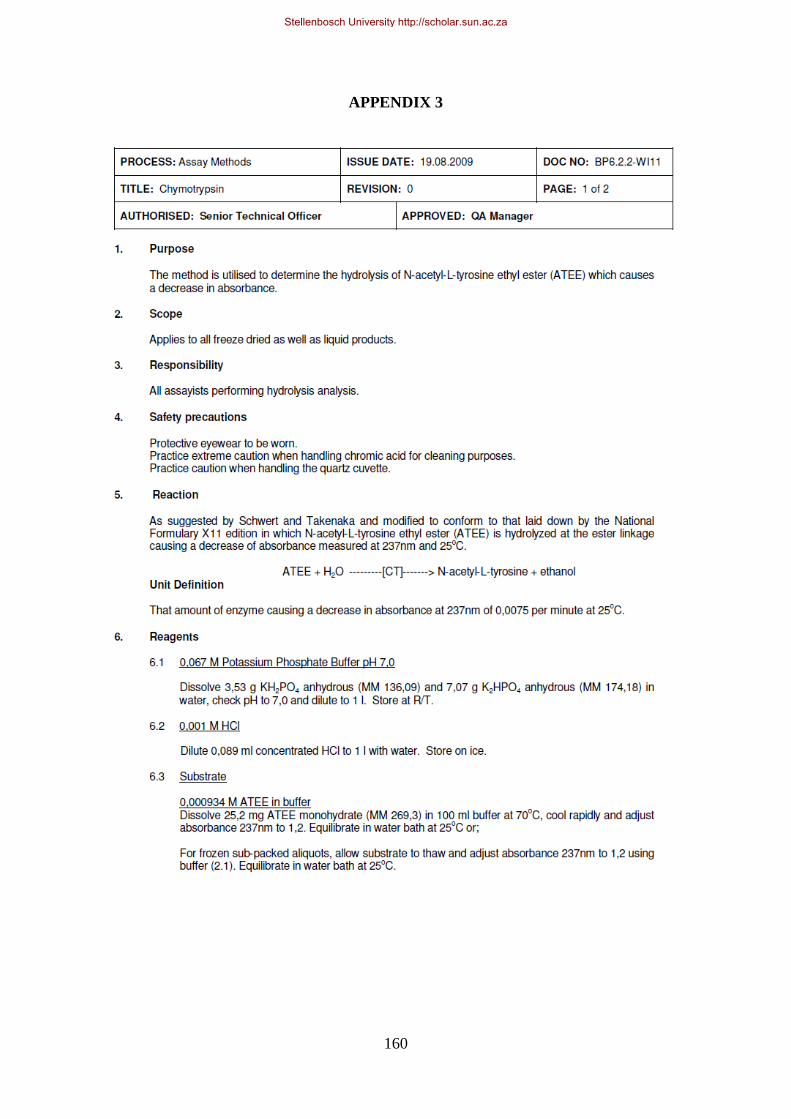
160
APPENDIX 3
Stellenbosch University http://scholar.sun.ac.za
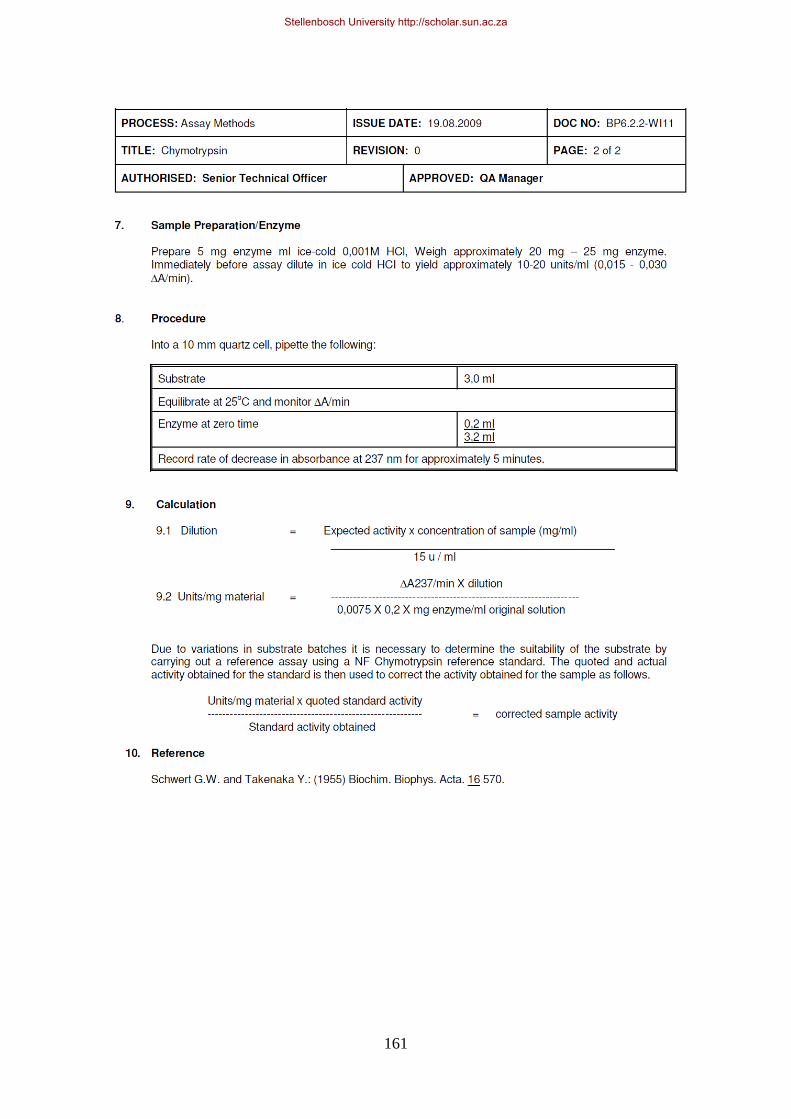
161
Stellenbosch University http://scholar.sun.ac.za
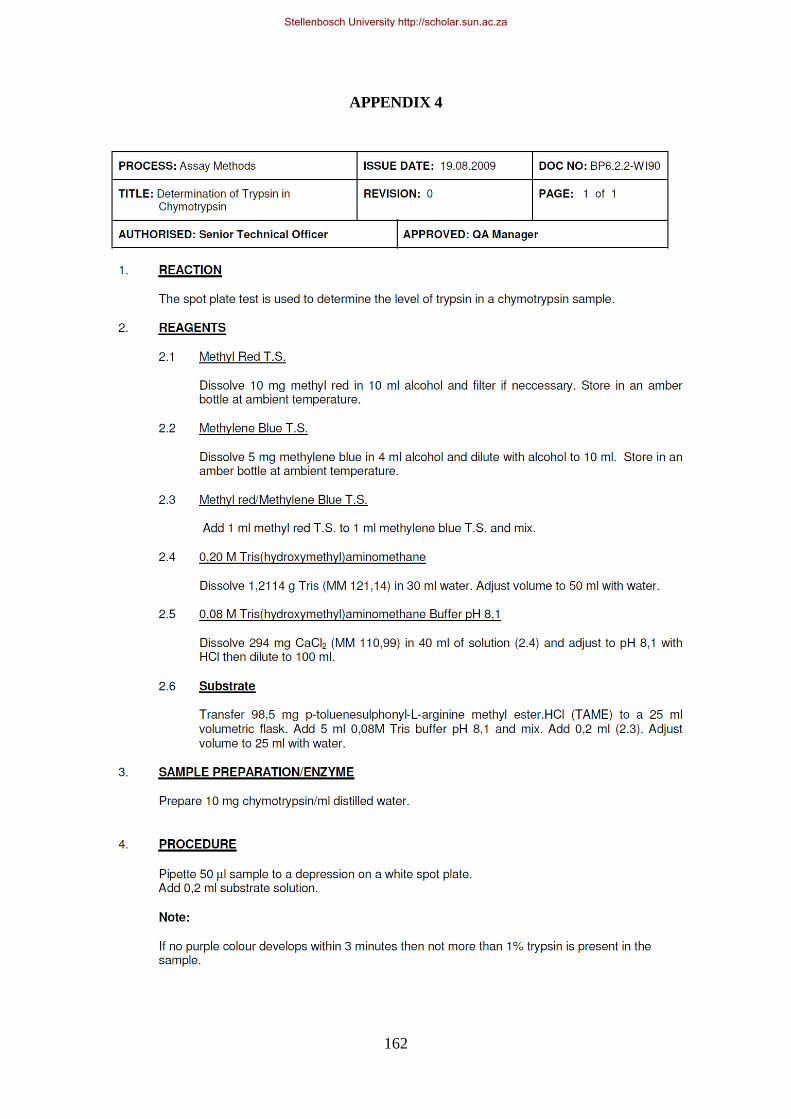
162
APPENDIX 4
Stellenbosch University http://scholar.sun.ac.za
163
APPENDIX 5
Stellenbosch University http://scholar.sun.ac.za
164
Stellenbosch University http://scholar.sun.ac.za
165
APPENDIX 6
Stellenbosch University http://scholar.sun.ac.za
166
Stellenbosch University http://scholar.sun.ac.za
167
APPENDIX 7
Stellenbosch University http://scholar.sun.ac.za
168
Stellenbosch University http://scholar.sun.ac.za
169
Stellenbosch University http://scholar.sun.ac.za
170
APPENDIX 8
Stellenbosch University http://scholar.sun.ac.za
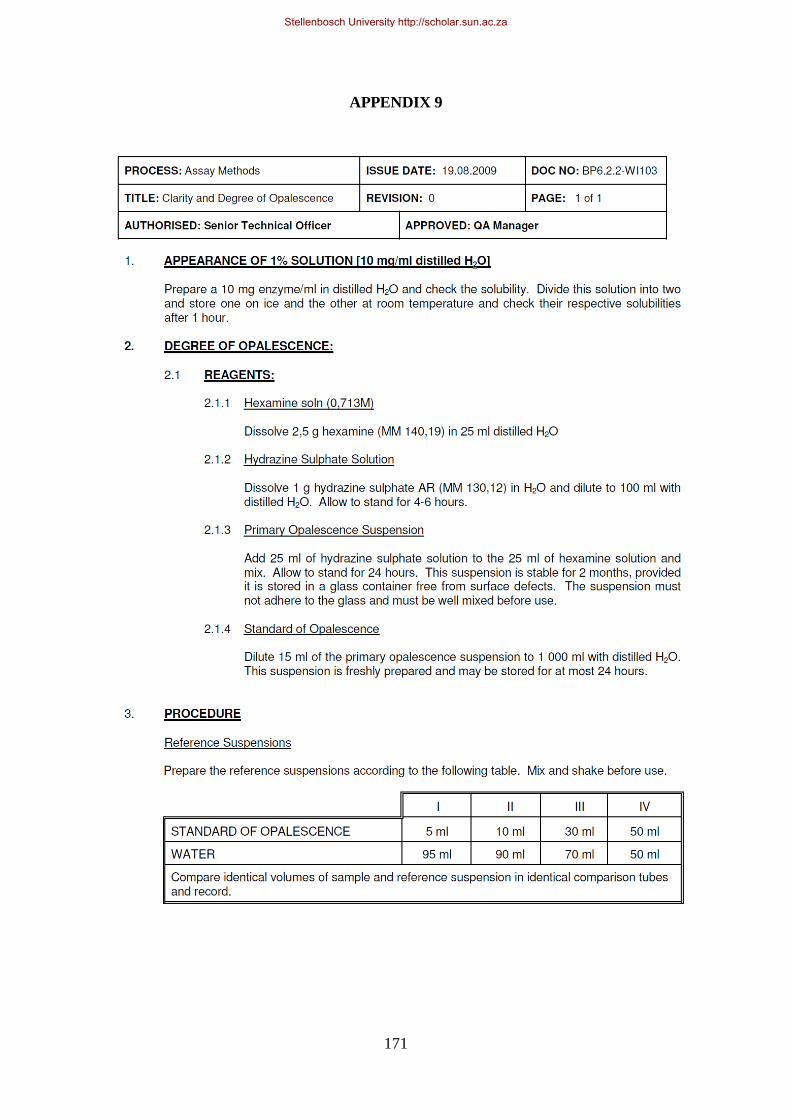
171
APPENDIX 9
Stellenbosch University http://scholar.sun.ac.za

172
APPENDIX 10
Stellenbosch University http://scholar.sun.ac.za
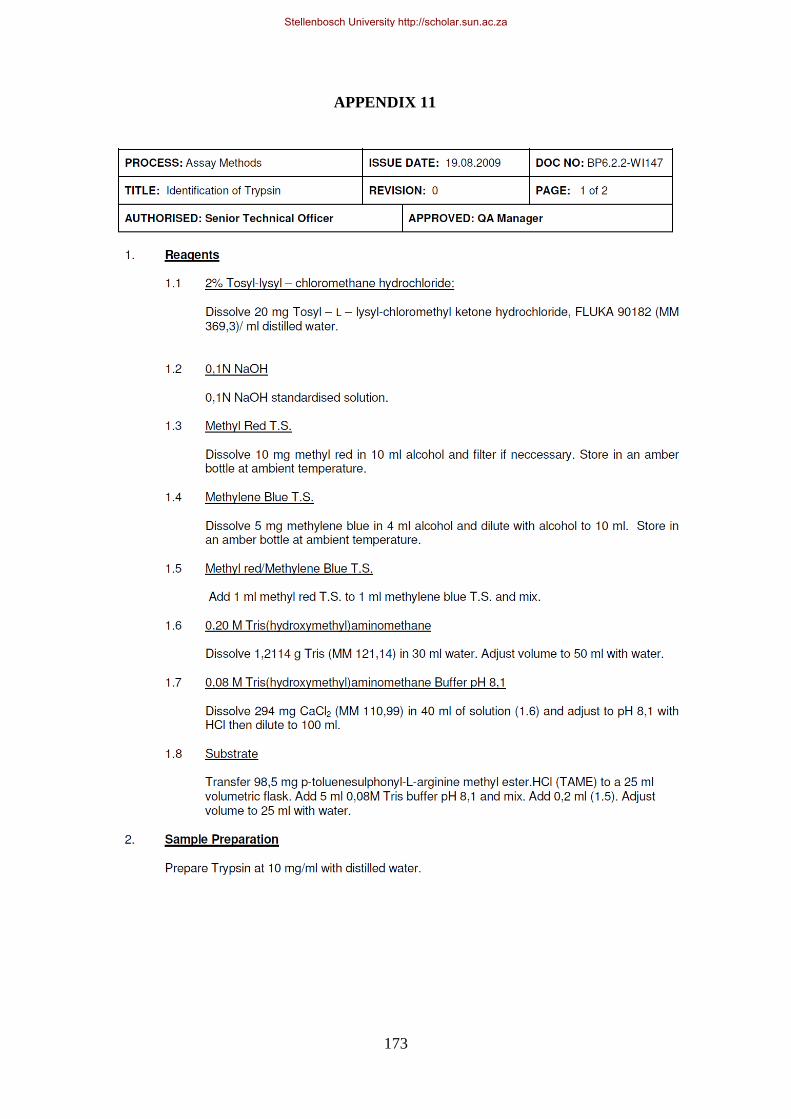
173
APPENDIX 11
Stellenbosch University http://scholar.sun.ac.za
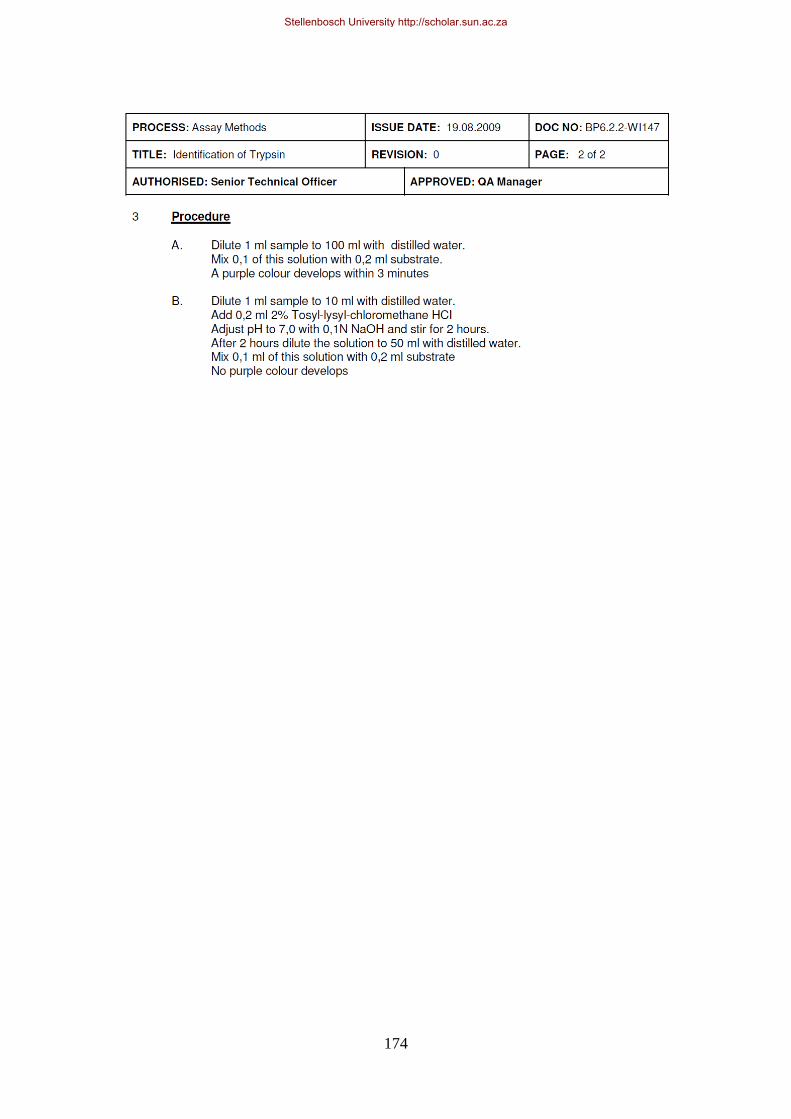
174
Stellenbosch University http://scholar.sun.ac.za

175
APPENDIX 12
Stellenbosch University http://scholar.sun.ac.za
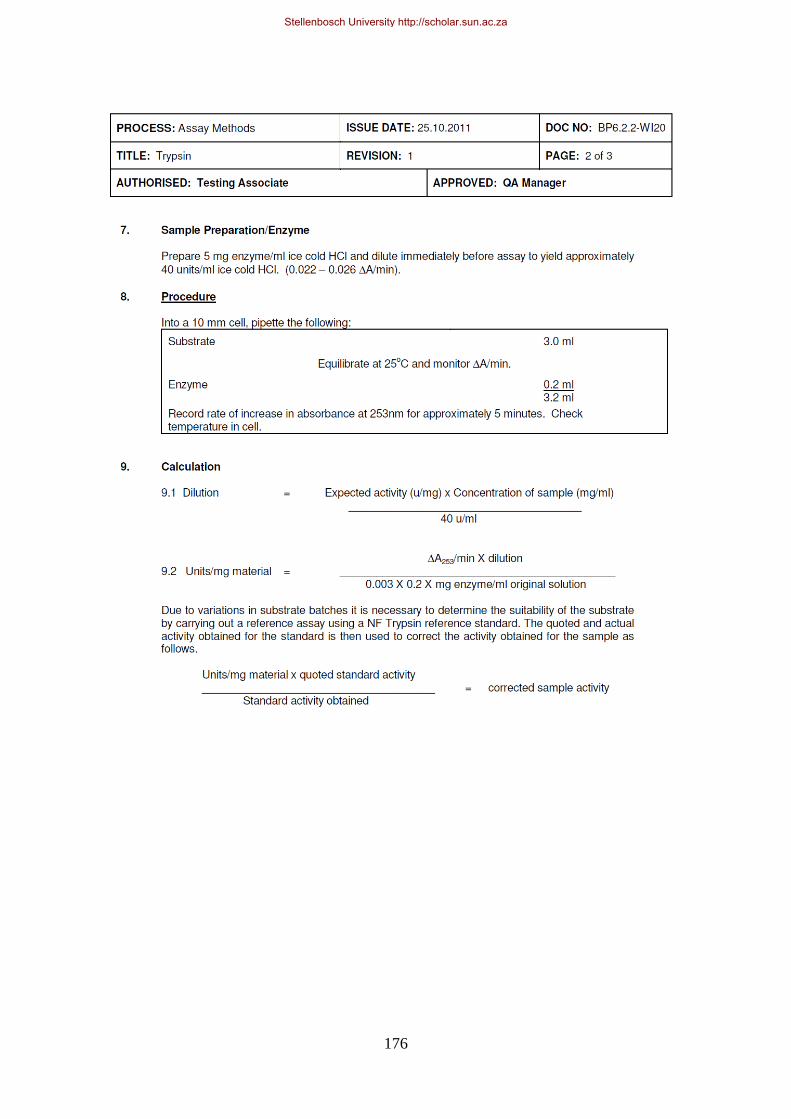
176
Stellenbosch University http://scholar.sun.ac.za
177
Stellenbosch University http://scholar.sun.ac.za
178
APPENDIX 13
Stellenbosch University http://scholar.sun.ac.za
179
APPENDIX 14
Stellenbosch University http://scholar.sun.ac.za
180
Stellenbosch University http://scholar.sun.ac.za
181
APPENDIX 15
Stellenbosch University http://scholar.sun.ac.za
182
Stellenbosch University http://scholar.sun.ac.za
183
APPENDIX 16
Stellenbosch University http://scholar.sun.ac.za
184
Stellenbosch University http://scholar.sun.ac.za
185
APPENDIX 17
Stellenbosch University http://scholar.sun.ac.za
186
APPENDIX 18
Stellenbosch University http://scholar.sun.ac.za
187
Stellenbosch University http://scholar.sun.ac.za
188
APPENDIX 19
Stellenbosch University http://scholar.sun.ac.za

189
Stellenbosch University http://scholar.sun.ac.za

190
Stellenbosch University http://scholar.sun.ac.za

191
Stellenbosch University http://scholar.sun.ac.za
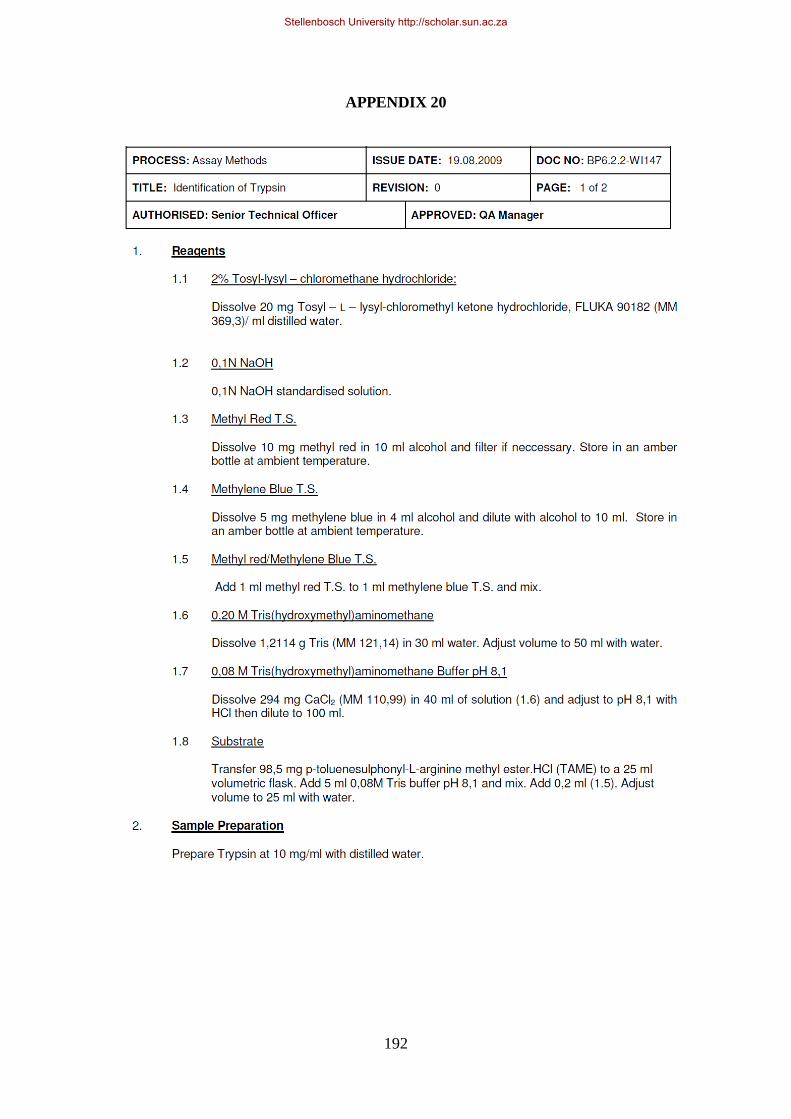
192
APPENDIX 20
Stellenbosch University http://scholar.sun.ac.za
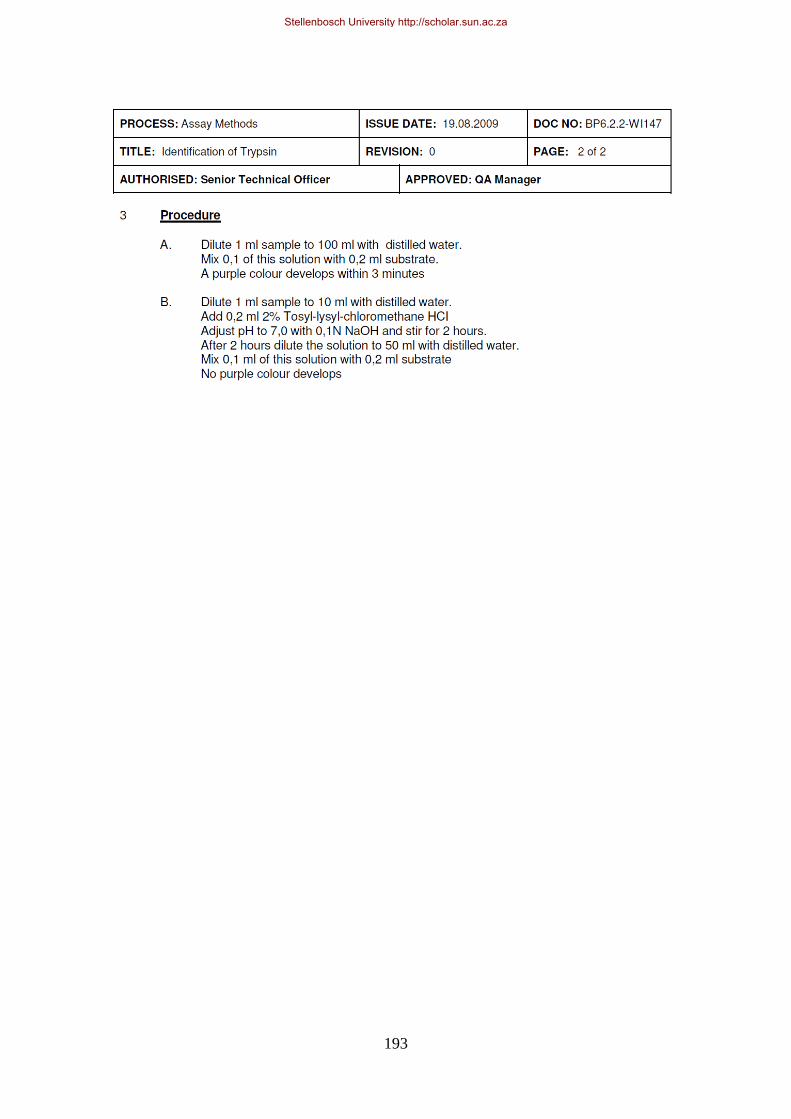
193
Stellenbosch University http://scholar.sun.ac.za

194
APPENDIX 21
Stellenbosch University http://scholar.sun.ac.za
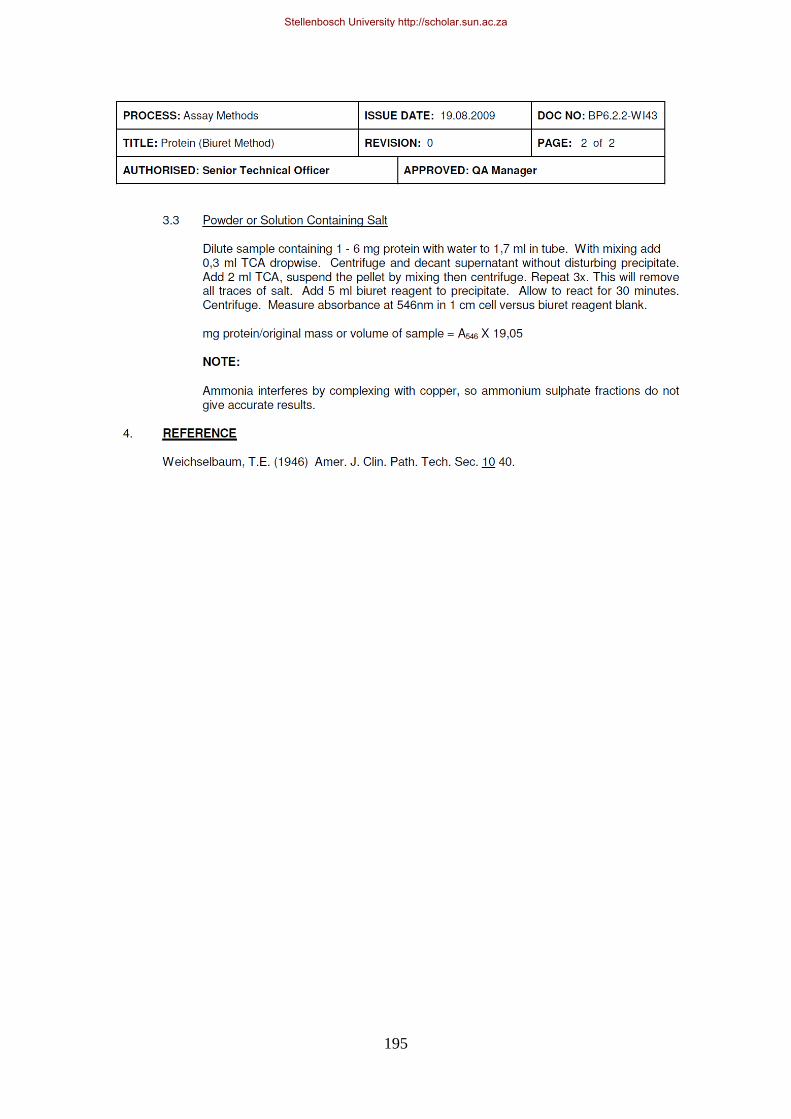
195
Stellenbosch University http://scholar.sun.ac.za
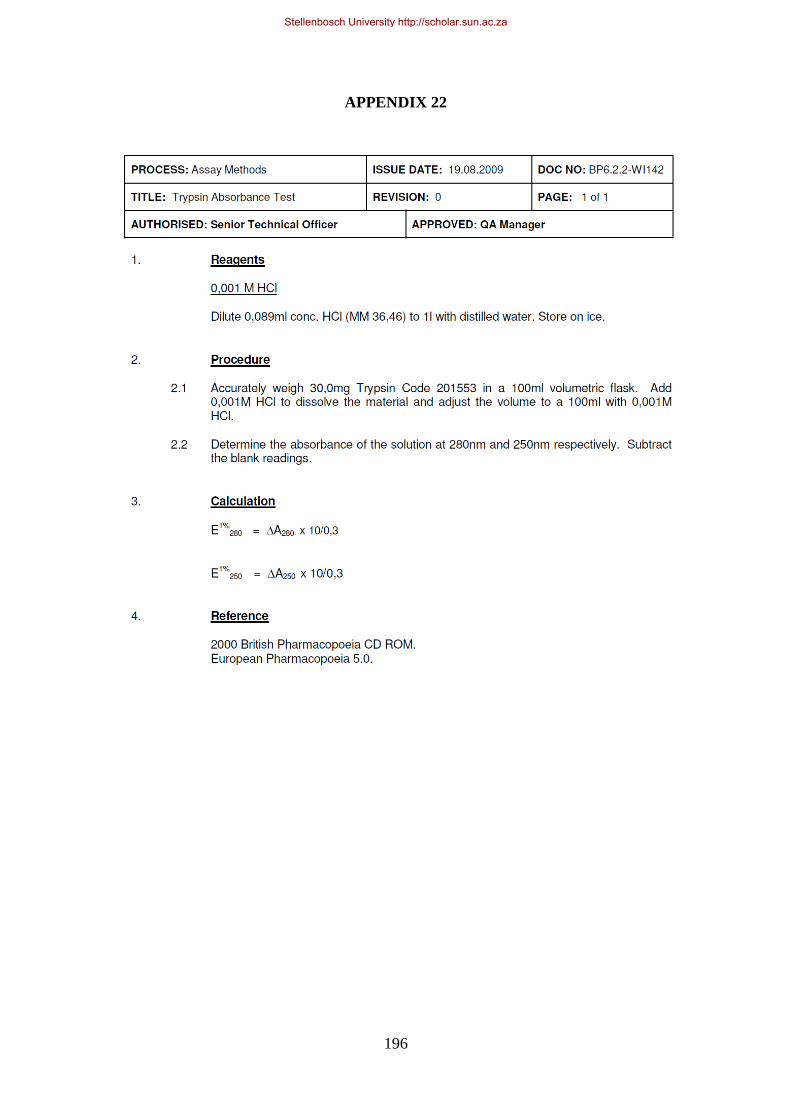
196
APPENDIX 22
Stellenbosch University http://scholar.sun.ac.za
197
APPENDIX 23
Stellenbosch University http://scholar.sun.ac.za
198
APPENDIX 24
Stellenbosch University http://scholar.sun.ac.za
199
Stellenbosch University http://scholar.sun.ac.za
Related Documents