u.s DEpari men1 01 Tronsportotlon federal Higl1wa}f Laboratory of VergHn1it and Office 01 Research and Development Turner-Fairbank Highway Research Center 6300 Georgetown [-'ike i,1cLean, Virginia 22101-2296 === PublicJlion No, FHWA-RD-Y-j-In3 /\lillclJ IY')-I APR 17 1891

Welcome message from author
This document is posted to help you gain knowledge. Please leave a comment to let me know what you think about it! Share it to your friends and learn new things together.
Transcript

u.s DEpari men1 01 Tronsportotlon
federal Higl1wa}f f~drnin~slrQlion
Laboratory Eva~[Jlation of VergHn1it and P~usRide
Office 01 Research and Development Turner-Fairbank Highway Research Center 6300 Georgetown [-'ike i,1cLean, Virginia 22101-2296
===
PublicJlion No, FHWA-RD-Y-j-In3
/\lillclJ IY')-I
APR 17 1891

FORD!DPli
Th S f'(;;port Viill be uf- interest to if)dividu(l'j~ concenled Vilth i'educing the tlU ldur of snow and ice Ofl asphalt concret.e pa\le)nenis. ltle two deicirlg fll(i FI'ia']2' 0Vz;,"Jurted under this study ntE' ?,ddeci dir'ectly to all (1srha1t surface ITIi"llir(' "j the hot-mix pl2ni. Hie rniX]IWe i" 1hen ['ldeed as ? th'in oveda.v in ZYr:().'; vJhen:: the buildup of snow and iCE; is iJ fi'equent pr"oblern. {\n (=xamp"le l1f th-!::. is (1 moufilain pa.::-s highway ~'!hich often becomes icy in 'lDcalized spots. V2,rioll:" ~.i ate hi~lhV~i1Y (l,gencies hi)V(:, used illPSE adrJitives~ maill1y on a. trial !l?:::-is, '10 clEtenTli!l(l their- efft.:cts on meltinG snov! and ice and reducinq thf:: l\Utlllwr of tl'ilft-ic ar:'cidents, This l"epU\"t deals \t.!ith the effects of tf19SP
additi\!i's on mixture pl'opert-ies determined in the labll)'atory such as aging, iTlui~iur-c ~USCPliti!lilltYl pETlTlrilleill defcnnat-iu)l, i1nd 10llJ tf~mr\er'atu(e cr2eVing.
Sufficient copies (if this report av'e beinSi distributed to provide one copy to each rflvJ(l, t'e~l'ifJnaT ofr'rce) F1H1A division office, rnd State highway agency. [1'I'((;ct cli:~i"rib\JtiDn is beinq made:: to the division offices. /\dditional copies fer the pl!blic ore "vai'ioille from the Natiur\ril Tecllnical Jnfoymation Service un 15); 1.i.), Dep2Ytlli!.~ld- flf Cntr!lw:rc0, ~'_;?2-~\ [--;ofi r~().Y?:l PONd. Sfl\'-ingfield~
V-ir~l-i)I:I;:) ?21CI,
NUTlC[
lhis document 'is disseminated under the sponsorship of the Department of Tt'ollSpoltiltiull in th~ inteIE:;; of illfonnatioll exchangE. The United States I;UI/[Tnmr,ni. " >0, 11IIIe 5 110 1 iilbri ity for 'its cnntents or IISf3 thereof. The contents of this n'pL1li reneet the views of till' authol's, who arE respunsible for the facts awl accuracy of t.he data JlY'Esentc"j herein. The conir'nts do not Ifccessariiy Y'etlee\ tire official poiicy of the Department of hansportation. This tepol1 dOES not ccnstitutE a standard, specification, or regulation.
"lht: tilJii cd ~li.ate:_; [;CVt~rl"lm(~llt doe::: no·! PllrJur-se p;'oducts or rna.nufactun:;rs, 'l)'aue Or" 1l1anUfactlil el--s i name::, appei1t' herein only hecaliSP they are considerE~d e C,5entiill to the, eb.!",i. of Ulis rioCUnl"nt.
US Deportment of Transportation
Federal Highway Administration
FHWA Contact:
Kevin Stuart. HNR-20
(703) 285-2627
Research and Development
Turner-Fairbank Highway Research Center 6300 Georgetown Pike McLean, Virginia 22101·2296
TECHNICAL SUMMARY
LABORATORY EVALUA TlON OF VERGlIMIT AND PLUSRIDE
Publication No. FHWA-RD-91-0 13 March 1991
Materials & Operations
This technical summary announces the key findings of a Federal Highway Administration (FHWA) staff study that is fully documented in a separate report of the same title (FHWA-RD-91-013). (See report-ordering information on the last page of this summary.)
PURPOSE OF REPORT
One technique to help control the formation of ice on asphalt pavements, and possibly reduce the use of salt and abrasives such as sand, is to use additives in the weari~ course mixture. Two additives that have been used are Verglimit and PlusRideT
• The increased material and construction costs due to-these additives can be justified if accidents are reduced. These additives are currently being tested in the field to determine their effects on reducing ice and the number of traffic accidents. Their effects on mixture properties are not well established. These properties have generally not been measured in these field studies.
The objective of this study was to investigate the effect of adding Vergl imit and PlusRide on the properties of asphalt mixtures in terms of their resistance to agi ng, moi sture damage, rutt i ng, and low temperature cracki ng. Tests i ncl uded (1) Marshall stability and flow, (2) indirect tensile strengths, and (3) creep and repeated load moduli and permanent deformations or strains. Specimens were also moisture conditioned to determine (1) retained tensile strength ratios, (2) retained resilient modulus ratios, and (3) visual stripping.
Verglimit consists of 0.004- to 0.2-in (0.1- to 5-mm) particles of calcium chloride with a small amount of sodium hydroxide. The particles are encapsulated with linseed oil or polyvinyl acetate to keep the material inactive until they break under the action of traffic. The additive then mixes with moisture from the air or on the pavement to form a dilute salt solution. Verglimit is supposed to work over the life of the pavement.
PlusRide rubber is granulated tire rubber. Most particles are 1/16 to 1/4 in (0.16 to 0.64 cm). They act as elastic aggregates which flex on the pavement surface under traffic. This flexing helps to break up ice.
(Juued February 1991)

CONCLUSIONS - VERGLIMIT
~ Verglimit reduced the temperature susceptibility of the mixtures as measured by the creep moduli, repeated load moduli, and permanent deformations and strains. The effects were slight below 77 of (25°C). Verglimit provided Marshall stabilities and flows similar to the control.
~ Vergl imit increased the moisture susceptibil ity of the mixtures. The Verglimit particles absorbed water and the specimens swelled. Even though thi s effect produced low retai ned tens il e strength and resil i ent modul us ratios, Verglimit caused a significant reduction in visual stripping. The mechanism behind this reduction is unknown, but it was hypothesized that it was related to the calcium in the Verglimit.
~ Specimens containing Verglimit stored in air at room temperature also swelled and cracked within 28 days of aging at 77 of (25°C). How this relates to field performance is unknown, although it seems to explain why there have been reports of raveling in pavements.
~ The Verglimit specimens had a slippery feeling when handled. (Problems with reduced pavement skid resistance immediately after placement have been reported.) This appeared to be mainly related to the calcium chloride particles forming a solution on the surfaces of the specimens after absorbing moisture. (However, a part of this effect could be related to the linseed oil coatings.)
• Because Verglimit particles crush, it may be difficult to check the gradati on for qual i ty assurance purposes. It is unknown if the amount of crushing found in the laboratory duplicates the amount of crushing under a roller in the field. The gradations may also change slightly over time because the Verglimit dissolves out of the mixture.
~ Verglimit had no effect on the asphalt content or asphalt binder properties, although the asphalt content must be corrected for absorbed moisture using ASTM D 1461 or AASHTO T 110. (The long-term effects of Verglimit on asphalt binder properties were not evaluated.)
Some changes to the testing procedures were required. Verglimit is water soluble so the volumetric flask method of AASHTO T 209 and ASTM D 2041 or a volumeter must be used for determining the maximum specific gravity of the nixture. For determining bulk specific gravities, only a I-minute period of 'mmers i on in the water was used. To mi x the materi a 1 s, the unheated erglimit particles were added after the asphalt cement and aggregate were 'xed, and an additional 15 to 30 seconds of mixing was needed to ensure ating and a visually homogenous distribution.
IONS - PLUSRIDE
Ride increased the resistance to low temperature cracking and decreased tesistance to rutting. PlusRide reduced the Marshall stability, creep repeated load moduli, while it increased the flow and permanent nations and strains. This was directly related to the rubber and the ated 1.5 percent increase in asphalt content. The increase in asphalt t was attributed to the rubber particles causing the mixture to
less.

o PlusRide can have a variable effect on moisture susceptibility. In some cases Pl usRi de may increase the retai ned tensil e strength and res il i ent modulus ratios and decrease the amount of swelling. In other cases, it may decrease the retained ratios and increase the amount of swelling. A cause for the difference in the amounts of swelling was not investigated.
o Specimens containing PlusRide stored in air at room temperature developed hairline cracks by 90 days of aging at 77 DF (25 DC). How this relates to field performance is unknown. The rubber particles on the outer edges of the specimens also began to stick out. This swelling of the rubber particles was attributed to the absorption of asphalt hydrocarbons.
o Extraction tests showed a decrease in the amount of material passing the #30 sieve size for the PlusRide mixture compared to the raw components. This was probably due to agglomerations caused by the rubber, but the cause was not investigated. As with mixtures containing Vergl imit, it may be difficult to check the gradation for quality assurance purposes.
o The recovered binder was soft and the extracted asphalt content was high. This indicated that the binder contained rubber. It was concluded that most of the rubber remained with the aggregate, but a portion was in the binder. Because the rubber in the mixture and in the extracted solution may be altered by the heat and solvents used in the extraction and recovery processes, the recovered binder properties are probably not the true binder properties. .
• Some changes to the testing procedures were required. To prevent expansion and cracki ng of the specimens, weights must be placed on the compacted specimens for 24 hours while they are still in the molds. A 10-lbm (4.5-kg) weight was used for Marshall-size specimens and 30-lbm (136-kg) for 4- by 8-in (10.2- by 20.3-cm) cylindrical size specimens. The field implications of this are unknown.
• The rubber was considered an elastic aggregate in this study. If the rubber part i ally combi nes wi th the asphalt, then cal cul ated effective aggregate gravities may not be correct. Effective aggregate gravities and air void levels also may not be correct because swelling and the volumes of the materials in compacted and uncompacted mixtures may be different. An uncompacted mixture is used to determine the maximum specific gravity of the mixture while a compacted specimen is used to determine the bulk specific gravity of the mixture. (Air void levels are calculated from specific gravities, which are calculated using volumes.) The VMA for the PlusRide mixture also may not be correct because the procedure for calculating VMA does not consider swelling.
RECOMMENDATIONS
o Mixtures containing either additive should be tested for moisture susceptibility and an antistripping agent used if necessary. However, this will not control the inherent swelling that occurs during moisture conditioning.
• Because both additives had some detrimental effects on the test data, both should be used in surface layers less than 1 in (2.54 cm) thick. Possibly, a harder grade of asphalt shoul d be used in Pl usRide mixtures. (Most

pavement sections are less than 1 in (2.54 cm) thick in order to reduce costs and because the additives only act at the surface of the pavement.)
$ Because Vergl imit particles crush, gradations should be determined from loose mixtures during construction. The gradatio"ns of the materials used in PlusRide mixtures can only be estimated because the rubber appears to form agglomerations with the aggregate.
$ The literature review and discussions with highway engineers indicated that the degree of rutting of PlusRide mixtures in pavements has generally not been as excessive as the data in this study indicate it should be. This could be due to the thin pavement layers often used. Part of the discrepancy also coul d be rel ated to di fferences in the phys i cal properties of rubbers used.
• Rubber particles on the outsides of PlusRide specimens would swell and protrude excessively over time. The gradation of the aggregate may need to be altered to reduce the number of protruding particles if there is an excessive loss of particles from pavements.
• The supply of rubber was depleted in this study and a new supply having the same physical properties could not be obtained. A stricter or more descriptive specification may be needed for the rubber to ensure consistency.
$ The effect of calcium chloride on stripping or debonding should be further investigated. Even though Verglimit decreased the retained ratios, it acted like an antistripping agent.
Researcher - Pavements Division, HNR-20, Federal Highway Administration, 6300 Georgetown Pike, McLean, VA 22101-2296
Distribution - This technical summary is being distributed according to a limited distribution. Direct distribution is being made to the Regions and Divisions.
Availability - This publication will be available in June 1991, Copies will be available ,only from the National Technical Information Service, 5285 Port Royal Road, Springfield, Virginia 22161.
Key Words - Verglimit, PlusRide, deicers, asphalt additives, creep test, repeated load test, resil i ent modul us test, moi sture suscept i bil i ty, low temperature cracking.
Notice - This technical summary is disseminated under the sponsorship of the Department of Transportat i on in the interest of i nformat i on exchange. The summary provides a synopsis of the study's final publication. The summary does not establish poliCies or regulations, nor does it imply FHWA endorsement of the study's concl usi ons or recommendat ions. The U. S. government assumes no 1 i abil i ty for the contents or their use.

Technical Report Documentatian Page
I 1. Report No. I FHWA-RD-91-013 2. Government Accession No. 3, Recipient's Catalog No.
! •. Tifle and Subtitle 5. Report Dole I
March 1991 LABORATORY EVALUATION OF VERGLIMIT AND PLUSRIDE 6, Performing Orgoni%olion Code
8. Performing Organization Report No. 7. Author's)
K. D. Stuart and W. S. Mogawer 9. Performing Organization Noma and Address 10. Work Unit No, (TRAIS)
Office of Engineering and Highway Operations R&D NCP 2E1b2242 Federal Highway Administration 11. Contract or Grant No.
6300 Georgetown Pike in-house report McLean, VA 22101-2296 13. Type of Report and Period Covered
12. Sponsoring Agl:mcy Nome ond Address
Office of Engineering and Highway Operations R&D Fi na 1 Report Federal Highway Administration Nov. 19B7 - Nov. 1991 6300 Georgetown Pike 14. Sponsoring Agency Code
McLean, VA 22101-2296 15. Supplementary Noles Laboratory support for this work was provided by D. A. Grachen of the FHWA Pavements Division, HNR-20, and S. M. Parobeck and F. G. Davis, Jr. of Pandalai Coating Company. Pandalai Coating Company provides on-site laboratory support for the FHWA.
16. Abstract Verglimit and PlusRide, The effects of two additives, on the laboratory properties
of asphalt mixtures, in terms of their resistance to aging, moisture damage, rutting, and low temperature cracking, were determined. These two additives have been used to control the formation of ice on pavements. Fi eld studies have mainly consisted of determining the action of the additives on melting ice and the related changes in the number of traffic accidents. The effects of these two additives on laboratory mixture properties were not established in these field studies. Both Verglimit and PlusRide are added directly to the asphalt mixture at the mixing plant.
Verglimit slightly reduced the temperature susceptibility of the mixtures mainly by increasing the resistance to rutting at the high temperatures. Verglimit increased the suscept i bil ity to moisture damage, measured by retained tensile strength and resilient modulus ratios, because the particles absorbed water and the specimens swelled. However, there was a decrease in the amount of stripping determined visually.
PlusRide reduced the stiffness of the mixtures and increased the amount of permanent deformation at all temperatures, thereby increasing the resistance to low temperature cracking but decreasing the resistance to rutting. PlusRide had a variable effect on moisture susceptibility. In some cases PlusRide may increase the retained tensile strength and resilient modulus ratios and decrease the amount of swelling which occurs when conditioning the specimens in water. In other cases, PlusRide may decrease the retained ratios and increase the amount of swelling during conditioning.
17. Key Words 18. Distribution Statement
Vergl imit, Pl usRide, Deicers, Asphalt No restrictions. This document is additives, Creep test, Repeated load available to the public through the test, Resilient modulus, Moisture sus- National Technical Information Service, ceptibil ity, Low temperature cracking Springfield, Virginia 22161
19. Security Classif. (of this report) 20. Security Clossif. {of this pogel 21. No. of Pages 22. Price
Unclassified Unc 1 as s i fi ed 119
Form DOT F 1700.7 (8_721 Reproduction of completed poge authorized

APPROXIMATE CONVERSIONS TO SI UNITS APPROXIMATE CONVERSIONS FROM SI UNITS
Symbol When You Know MUltiply By To Find Symbol Symbol When You Know Multiply By To Find Symbol
LENGTH LENGTH
in inches 25.4 millimetres mm mm millimetres 0.039 inches in ft feet 0.305 metres m m metres 3.28 feet ft yd yards 0,914 metres m m metres 1.09 yards yd mi miles 1.61 kilometres km km kilometres 0.621 miles mi
AREA AREA
iff square inches 645.2 millimetres squared mm2 mw millimetres squared 0,0016 square inches inl ft2 square feet 0.093 metres squared m2 m2 metres squared 10.764 square feet ft2
ycf2 square yards 0.836 metres squared m2 ha hectares 2.47 acres ae ae acres 0.405 hectares ha km:1 kilometres squared 0.386 square miles mi2
:::: III mP square miles 2.59 kilometres squared km2
VOLUME VOLUME mL millilitres 0.034 fluid ounces floz
floz fluid ounces 29.57 ~illilitres mL L litres 0.264 gallons gal gal gallons 3.785 htres L m3 metres cubed 35.315 cubic feet ft3 ttl cubic feet 0.028 metres cubed m3 mJ metres cubed 1.308 cubic yards ydJ
ydl cubic yards 0.765 metres cubed mJ
NOTE: Volumes greater than 1000 L shall be shown in m3• MASS
g grams 0.035 ounces oz MASS III kg kilograms 2.205 pounds Ib
Mg megagrams 1.102 short tons (2000 Ib) T OZ ounces 28.35 grams 9 Ib pounds 0.454 kilograms kg T short tons (2000 Ib) 0.907 megagrams Mg III TEMPERATURE (exact)
DC Celcius 1.Be + 32 Fahrenheit DF
TEMPERATURE (exact) temperature temperature OF
OF Fahrenhen 5(F-32)/9 Celcius °C _0:0 0 1'40 80 1.6,20 160 20~r temperature temperature 1""""1"'" 1""'" I ,I • I' " I
-40 -20 0 20 40 60 BO 100 DC 37 DC

TABLE OF CONTENTS
Section
CHAPTER 1: INTRODUCTION AND OBJECTIVES 1
CHAPTER 2: LITERATURE REVIEW......................................... 2
1. Verglimit ...................................................... '" 2 2. PlusRide.......................................................... 3
CHAPTER 3: EXPERIMENTAL PROGRAM - PHASE I ............................ 5
1. Materials......................................................... 5 2. Testing Program................................................... 5 3. Effect of Agi ng ................................................... 7
a. Resil i ent Modul us ............................................. 7 b. Creep Modulus and Permanent Deformation ....................... 9 c. Res i stance to Moi sture Damage ................................. 9
4. Resistance to Rutting............................................. 10 5. Resistance to Low Temperature Cracking ............................ 13 6. Extraction and Recovery........................................... 13
CHAPTER 4: EVALUATION OF VERGLIMIT - PHASE I ......................... 14
1. Laboratory Mixture Design......................................... 14 2. Effect of Aging................................................... 17
a. Resilient Modulus............................................. 17 b. Creep Modulus and Permanent Deformation ....................... 19 c. Res i stance to Moi sture Damage ................................. 19
3. Resistance to Rutting............................................. 24
a. Creep Test .................................................... 24 b. Repeated Load Test ............................................ 24
4. Resistance to Low Temperature Cracking............................ 26 5. Extraction and Recovery........................................... 30 6. Conclusions ....................................................... 30
CHAPTER 5: EVALUATION OF PLUSRIDE - PHASE I .......................... 33
1. Laboratory Mixture Desi gn ......................................... 33
iii

TABLE OF CONTENTS (Continued)
Section
2. Effect of Aging 35
a. Resil i ent Modul us ............................................. 35 b. Creep Modulus and Permanent Deformation ....................... 37 c. Resi stance to Moi sture Damage ................................. 37
3. Resistance to Rutting............................................. 42
a. Creep Test .................................................... 42 b. Repeated Load Test ............................................ 42
4. Resistance to Low Temperature Cracking............................ 45 5. Extraction and Recovery ........................................... 45 6. Concl usi ons ....................................................... 49
CHAPTER 6: EVALUATION OF VERGLIMIT - PHASE II ........................ 51
1. Laboratory Mixture Design......................................... 51 2. Effect of Aging................................................... 51 3. Resistance to Moisture Damage ..................................... 53 4. Res i stance to Rutting ............................................. 53 5. Resistance to Low Temperature Cracking............................ 53 6. Conclusions....................................................... 57
CHAPTER 7: EVALUATION OF PLUSRIDE - PHASE II ......................... 58
1. Laboratory Mixture Design......................................... 58 2. Effect of Agi ng ................................................... 58 3. Resistance to Moisture Damage ..................................... 58 4. Resi stance to Rutti ng ............................................. 61 5. Resistance to Low Temperature Cracking ............................ 61 6. Marshall Hammer Versus Kneading Compaction ........................ 61 7. Alternate Design for PlusRide ..................................... 65 8. Conclusions....................................................... 65
CHAPTER 8: STRUCTURAL ANALYSIS USING VESYS-3AM 67
CHAPTER 9: CONCLUSIONS AND RECOMMENDATIONS ........................... 72
1. Conclusions - Verglimit ........................................... 72 2. Conclusions - PlusRide ............................................ 73 3. Recommendations ................................................... 74
iv

TABLE OF CONTENTS (Continued)
Section Page
APPENDIX A: MIXTURE DESIGN PROPERTIES ................................ 77
APPENDIX B: EVALUATION OF TEST PROCEDURES ............................ 97
1. Introduction...................................................... 97 2. Effect of Agi ng ................................................... 97
a. Resi 1 i ent Modul us ............................................. 97 b. Creep Modulus and Permanent Deformation ....................... 97 c. Resistance to Moisture Damage ................................. 98
3. Resistance to Rutting............................................. 99
a. Modulus versus Temperature .................................... 99 b. Permanent Deformations versus Temperature ..................... 102
4. Res i stance to Low Temperature Cracki ng ............................ 105 5. Conclusions ....................................................... 106
REFERENCES ............................................................ 108
v

LIST OF FIGURES
Figure
1. Diametral resilient modulus apparatus and specimen .. ............. 8 2. Diametral creep test apparatus and specimen ...................... 8 3. Setup for the 4- by 8-in (10.2- by 20.3-cm)
cylindrical specimens............................................ 12 4. Verglimit - Resilient modulus versus aging time
and test temperature ............................................. 18 5. Verglimit - MrR and TSR versus aging time ........................ 22 6. Verglimit - MrR and TSR based on the dry values from the
second day versus aging time..................................... 22 7. Verglimit - Wet and dry tensile strengths versus aging time ...... 23 8. Verglimit - Wet and dry resilient moduli versus aging time ....... 23 9. Verglimit - Tensile strength versus temperature for evaluating
low temperature cracki ng ......................................... 29 10. Verglimit - Resilient modulus versus temperature for evaluating
low temperature cracking......................................... 29 11. PlusRide - Resilient modulus versus aging time
and test temperature ............................................. 36 12. PlusRide - MrR and TSR versus aging time ......................... 40 13. PlusRide - MrR and TSR based on the dry values from the
second day versus agi ng time ..................................... 40 14. PlusRide - Wet and dry tensile strengths versus aging time ....... 41 15. PlusRide - Wet and dry resilient moduli versus aging time ........ 41 16. PlusRide - Tensile strength versus temperature for evaluating
low temperature cracki ng ......................................... 47 17. PlusRide - Resilient modulus versus temperature for evaluating
low temperature cracking......................................... 47 18. Phase II - Resilient modulus versus temperature for evaluating
the low temperature cracking properties of Verglimit ............. 57 19. Phase II - Resilient modulus versus temperature for evaluating
the low temperature cracking properties of PlusRide .............. 62 20. Predicted rut depth using VESYS-3AM .............................. 70 21. Predicted area cracked using VESYS-3AM ........................... 70 22. Predicted present serviceability index (PSI) using VESYS-3AM ..... 71 23. Predicted rut depth using VESYS-3AM and measured rut depth ....... 71 24. Mixture design properties for the Verglimit
contro 1 mi xture - phase I ........................................ 78 25. Mixture design properties for the Verglimit mixture - phase I .... 79 26. Gradations for the Verglimit study - phase I ..................... 80 27. Mixture design properties for the PlusRide
control mixture - phase I ........................................ 82 28. Mixture design properties for the PlusRide mixture - phase I ..... 83 29. Gradations for the PlusRide study - phase I ...................... 84 30. Mixture design properties for the Verglimit
control mixture - phase II ....................................... 86 31. Mixture design properties for the Verglimit mixture - phase II ... 87 32. Gradations for the Verglimit study - phase II .................... 88 33. Mixture design properties for the PlusRide
control mixture - phase II ....................................... 90 34. Mixture design properties for the PlusRide mixture - phase II .... 91
vi

LIST OF FIGURES (Continued)
Figure
35. Gradations for the Pl usRi de study - phase II ..................... 92 36. Mixture design properties for the PlusRide mixture
compacted by the Marshall hammer ................................. 94 37. Mixture design properties for the PlusRide mixture
compacted by the kneading compactor .............................. 95 38. Gradations for the PlusRide mixtures compacted by the
Marshall hammer and kneading compactors .......................... 96 39. Modulus versus temperature for the Verglimit control mixture ..... 100 40. Modulus versus temperature for the Verglimit mixture ............. 100 41. Modulus versus temperature for the PlusRide control mixture ...... 101 42. Modulus versus temperature for the PlusRide mixture .............. 101 43. Permanent deformation versus temperature for the
Verglimit control mixture ........................................ 103 44. Permanent deformation versus temperature for the
Vergl imit mixture ................................................ 103 45. Permanent deformation versus temperature for the
Pl usRi de control mi xture ......................................... 104 46. Permanent deformation versus temperature for the
PlusRide mixture ................................................. 104
LIST OF TABLES
1. Phase I test i ng program .......................................... 6 2. Aggregate and mixture design properties
for the Vergl imit study .......................................... 15 3. Asphalt properties............................................... 16 4. Effect of aging - resilient modulus test results ................. 16 5. Effect of aging - diametral creep test results at 77 of (25°C) .. 20 6. Effect of aging - moisture damage test results ................... 21 7. Resistance to rutting - creep test results ....................... 25 8. Resistance to rutting - repeated load test results ............... 27 9. Resistance to low temperature cracking ........................... 28
10. Extraction test results.......................................... 31 11. Aggregate and mixture design properties
for the Pl usRi de study ........................................... 34 12. Effect of aging - resilient modulus test results ................. 36 13. Effect of aging - diametral creep test results at 77 of (25°C) .. 38 14. Effect of aging - moisture damage test results ................... 39 15. Resistance to rutting - creep test results ....................... 43 16. Resistance to rutting - repeated load test results ............... 44 17. Resistance to low temperature cracking ........................... 46 18. Extraction test results .......................................... 48 19. Phase II - Aggregate and mixture design
properties for the Verglimit study ............................... 52
vi i

LIST OF TABLES (Continued)
20. Phase II - Moisture damage test results for Verglimit ............ 54 21. Phase II - Resistance to rutting at 104 of (40°C) for Verglimit . 55 22. Phase II - Resistance to low temperature cracking for Verglimit .. 56 23. Phase II - Aggregate and mixture design
properties for the PlusRide study ................................ 59 24. Phase II - Moisture damage test results for PlusRide ............. 60 25. Phase II - Resistance to low temperature cracking for PlusRide '" 62 26. Phase II - Aggregate and mixture design properties
for the PlusRide mixtures compacted by the Marshall hammer and kneading compactor ........................... 64
27. Phase II - Gradations for the PlusRide materials ................. 66 28. Inputs for the VESYS-3AM program ................................. 68 29. Mixture design properties for the Verglimit study - phase I ...... 77 30. Mixture design properties for the PlusRide study - phase I ....... 81 31. Mixture design properties for the Verglimit study - phase II ..... 85 32. Mixture design properties for the PlusRide study - phase II ...... 89 33. Mixture design properties for the PlusRide mixture
compacted by the Marshall hammer ................................. 93 34. Mixture design properties for the PlusRide mixture
compacted by the kneading compactor .............................. 93 35. Statistical comparison of TSR and MrR (Probability that
the retained ratios are equal) ................................... 98 36. Resilient moduli (ksi) using two methods of testing specimens .... 107
viii

CHAPTER 1: INTRODUCTION AND OBJECTIVES
Highway surface ice deposits are a major problem especially with high traffic volumes and stop-and-go movements. Costs of maintaining ice-free pavements by applying deicing chemicals or improving traction with abrasives such as sand are very high. Excessive amounts of sodium chloride have the potential to pollute ground water, damage vegetation, and corrode steel structures and vehicles. Abrasives only provide temporary increased skid resistance. Stopping distances on sanded ice are usually greater than on dry pavement. In addition, sand often must be removed from gutters and inlets in the spring to avoid blockage of the drainage system.
One technique to help control the formation of ice on asphalt pavements, and possibly reduce the use of salt and abrasives such as sand, is to use additives in the wearing course mixture. Two additives that have been used are Verglimit and PlusRide™. Verglimit consists mainly of calcium chloride
particles encapsulated with a layer of either linseed oil or polyvinyl acetate. PlusRide is ground tire rubber. The increased material and construction costs due to these additives can be justified if accidents are reduced. These additives are currently being tested in the field to determine their effects on reducing the buildup of ice and also snow. Their effects on mixture properties are not well established because they have generally not been measured in these field studies.
The primary objective of this study was to investigate the effects of adding Verglimit or PlusRide on the properties of asphalt mixtures in terms of their resistance to aging, moisture damage, rutting, and low temperature cracking. In phase I of this study, a comprehensive testing program was performed to accomplish this objective. Phase II was used to verify the findings of phase I by testing additional mixtures at a reduced testing level.
A secondary objective was to evaluate the different tests and procedures used in this study to measure mixture properties. The findings were used to develop the reduced testing plan for phase II.
1

CHAPTER 2: LITERATURE REVIEW
1. Vergl imit
In the 1970's a new deicer called Verg1imit was developed by Chemische Fabrik Ka1k in Cologne, West Germany and tested in Europe as a means of improving ice control. Verg1imit particles are 0.004 to 0.2 in (0.1 to 5 mm) in size and consist of calcium chloride with a small amount of sodium hydroxide. This mixture is coated with a water-resistant layer of either linseed oil or polyvinyl acetate and is used as an integral part of the wearing course mixture. The encapsulation should keep the material inactive until the particles break under the action of traffic. The additive then mixes with moisture from the air or on the pavement to form a dilute salt solution. Because Verg1imit is blended into the mixture, the salt solution is supposed to come to the surface of the pavement throughout its life. Five to 6 percent Verg1imit by weight of the mixture is generally used. There is very little technical information available on this product.
Applications in Europe, Japan, Canada, and the United States appear to verify the manufacturer's claims concerning Verglimit's ability to reduce, though not eliminate, pavement icing problems and related accidents. Snow is generally retained unless the snowfall is slight, but the layer on the pavement surface often turns to slush and is easier to remove. There have been reports that the skid resistance of the pavement may be lower than that of a standard mixture in dry weather and the life of the pavement may be reduced up to 50 percent, but the available reports on pavement performances give mixed performances. Pavement sections have been placed in Arizona, California, Colorado, Connecticut, Massachusetts, New Hampshire, New Jersey, New Mexico, Minnesota, New York, Ohio, Oregon, Pennsylvania, Rhode Island, South Dakota, and Virginia. See references 1 through 13.
A project in New York performed well in light snowfalls, but was less effective in heavy snowfalls. No problems with pavement performance were observed in B years. 111
2

Verglimit did melt ice in two Colorado projects, but the deicing action was so slow the effects were often masked by normal salting and sanding operat ions. (7.121 In an earl ier Colorado project, the pavement ravel ed. (8.121
This raveling was attributed to poor quality control at the hot-mix plant and during pavement construction. The pavement was also slick because of the attraction of a high amount of moisture to the surface. It was found that the Verglimit particles crushed by the roller quickly absorbed moisture from the air. Slickness on the other projects in Colorado was controlled by placing an application of sand on the pavement after construction.
In Pennsylvania, slickness was controlled by first sanding the surface and later by flushing the surface with water several times.(111 This practice has
become recommended by the supplier. The slick surface was attributed to the crushed Verglimit particles absorbing moisture, although the linseed oil which encapsulates the calcium chloride was suggested as a contributing factor.
No deicing benefits were found in Minnesota, and portions of a pavement shoved and were replaced. (131 Poor compaction 1 ed to ravel i ng probl ems on a
California project, but a decrease in icing still occurred. WI In Oregon and New Jersey, some Vergl imi t secti ons were repl aced because of ravel i ng. (3.101
Verglimit generally triples the cost of the mixture and thus is used in selected problem areas. The additional cost is not offset by reductions in sanding and salting operations but may be offset if accidents are reduced.
2. PlusRide
In the late 1960's, two Swedish companies, Skega AB and AB Vaegfoerbaettringar, developed a product named Rubit. The Swedish incorporated 3 to 4 percent rubber by weight of a mixture into an asphalt pavement surface mixture to increase skid resistance. The mixture provided a new form of ice control as well as reduced pavement/tire interaction noise. The rubber particles are 1/16 to 1/4 in (0.16 to 0.64 cm), which are relatively large compared to particles used in asphalt-rubber mixtures. They act as elastic aggregates which flex on the pavement surface under traffic and break ice. In the United States, the trademark PlusRide™ is used to designate this material. The
3

patent is owned by the Pavetech Corporation, Bellevue WA. PlusRide rubber is granulated tire rubber and includes buffings and chopped fibers. Several suppliers of ground rubber may offer the rubber. Pavement sections have been placed in Alaska, California, Massachusetts, Minnesota, Montana, Nevada, New Jersey, New Mexico, New York, Oklahoma, Rhode Island, South Dakota, Tennessee, Rhode Island, Utah, and Washington. See references 14 through 23. Like Verglimit, there is very little technical information available on this product.
The Alaska Department of Transportation installed experimental pavement sections in Fairbanks during 1979 and in Anchorage during 1980.(1'1~ Vehicle
stopping distances were measured and significant reductions in distances during icy conditions were observed compared to control sections. Condition surveys were also made and some raveling was observed.
In 1983 the New Jersey Department of Transportation constructed a test site using PlusRide on route NJ 41 in Cherry Hill.(16) Periodic skid tests
showed that PlusRide improved the skid resistance of the pavement. Initial condition surveys indicated that there was slightly more rutting in the PlusRide section than in the control section. The rate of rutting then slowed and the section was giving acceptable performance.
A project placed in 1984 by the State of Washington was evaluated for 5 years.(22) The control was the State's standard asphalt-rubber open-graded
asphalt concrete. The required density could not be obtained in the PlusRide section and the air void level was close to 12 percent. Sections of the PlusRide material had to be patched. It was concluded that the PlusRide material did not give better frictional properties, noise reduction, or service life.
Eight out of 10 PlusRide pavements surveyed under a previous Federal Highway Administration (FHWA) study showed no difference in performance (rutting, cracking, and raveling) compared to control sections.(23) One
PlusRide pavement exhibited better performance while another showed a slight decrease in performance.
PlusRide generally doubles the cost of the mixture and like Verglimit has been used in selected problem areas.
4

CHAPTER 3: EXPERIMENTAL PROGRAM - PHASE I
1. Materials
The aggregate and asphalt cement used to prepare mixtures in this phase of the study were the same as those used in constructing the wearing and binder courses of the FHWA Accelerated Loading Facility (ALF) pavement sites. These pavements consist of a wearing course, binder course, crushed aggregate base, and prepared subgrade. (241 The aggregates were a bl end of traprock
coarse aggregate and screenings from Manassas, Va, and natural quartz sand from Fredericksburg, Va. The asphalt cement was an AC-20 from ARCO, Dumfries, Va. The Verglimit was supplied by PK Innovations, Hamilton, Ontario, Canada. PlusRide was supplied by Baker Rubber Inc., South Bend, Indiana in two different sizes: coarse particles (1/4 in to plus #20 sieve (6.3 to 0.85 mm)) designated as WTP-l/4 and fine particles (minus #20 sieve) designated as GR-20. The coarse particles contained chopped fibers generally between 1/2 to 3/4 in (1.3 to 1.9 cm) in length. An 80/20 blend of coarse/fine particles was used as recommended. The four mixtures evaluated in this phase were designated as: (1) Verglimit, (2) Verglimit control, (3) PlusRide, and (4) PlusRide control. The Verglimit control mixture was the actual mixture used in the wearing courses of the ALF pavements, which were tested by the FHWA accelerated loading machine. An additional control was used for the PlusRide mixture in order to determine the effects of the gap aggregate gradation required by the PlusRide design procedure. The effects of the rubber are confounded with the effects of the gap gradation when using PlusRide mixtures.
2. Testing Program
A 50-blow Marshall mixture design was performed on each mixture to determine the optimum asphalt content. Specimens were then fabricated at the optimum asphalt content and tested to compare aging, rutting, and low temperature properties. The resistance to moisture damage was a part of the aging study. Extraction and recovery tests were also performed to obtain supplementary information. The testing program is shown in table 1. All asphalt, aggregate, and mixture design tests and procedures were performed accordi ng to AASHTO and recommended pract ices. (25.301
5

Table 1. Phase I testing program.
Effect of Aging
(Diametral tests on Marshall size specimens)
1. Resilient modulus at 41, 77, and 104 of
2. Creep modulus and permanent deformation at 77 of
3. Resistance to moisture damage at 77 of
- Tensile strength ratio
- Resilient modulus ratio
- Visual percent damage
Resistance to Rutting
(4- by 8-in cylinders)
1. Creep modulus and permanent deformation at 65, 77, and 104 of
2. Dynamic modulus and permanent deformation at 65, 77, and 104 of
Resistance to Low Temperature Cracking
(Diametral tests on Marshall size specimens)
(Temperatures from -30 to 90 of (-34.4 to 32.2 °C)
1. Resilient modulus versus temperature
2. Tensile strength versus temperature
(OF _ 32)/1.8 = °C (in)(2.54)=(cm)
Extraction and Recovery
1. Gradations
2. Asphalt Content
3. Asphalt Properties
6

3. Effect of Aging
To compare the various mixtures and to determine the effects of shortterm, room temperature aging on the their properties, 50 Marshall specimens for each mixture were fabricated, and divided into five sets. Each set of 10 specimens were aged at 77 of (25°C) for a different period of time. Time
periods were: 2, 7, 14, 28, and 90 days. After each period the following properties were evaluated:
• Resilient modulus - two specimens. • Creep modulus and permanent deformation - two specimens. • Resistance to moisture damage - six specimens: three wet and three dry.
a. Resilient Modulus
Tests for moduli are often used to compared high and low temperature properties of mixtures. To determine the effects of aging on the modulus, the diametral resilient modulus test was performed at 41, 77, and 104 of (5, 25
and 40°C) using an apparatus manufactured by the Retsina Company, Oakland CA.
This apparatus, shown in figure I, produces a modulus at 0.1 second of loading time by applying a vertical load on a diameter of a specimen and measuring the horizontal deformation. 127J Two sets of measurements are taken along perpen
dicular diameters by rotating the specimen 90 degrees between the measurements. The data are then averaged. Because this test is nondestructive when testing is performed at low levels of deformation, the same specimens were tested at all three temperatures ySJ Deformation 1 evel s were ma i nta i ned
within a range of 30 to 80 microinches (76.2 to 203 E-06 cm) by varying the load. The specimens were tested at the design air void level. The equation used to calculate the resilient modulus was:127.2SJ
Mr = L (u + 0.2734)
(t)(H,)
where: Mr= resilient modulus, lbf/in2;
u Poisson's ratio; assumed as .35;
and H, horizontal total deformation, inches
7
L = load, lbf;
t specimen thickness, in,

Figure 1. Diametral resilient modulus apparatus and specimen.
Figure 2. Diametral creep test apparatus and specimen.
S

b. Creep Modulus and Permanent Deformation
The FHWA incremental creep test was performed at 77 of (25°C) to determine the effects of aging on the creep compliance (strain/stress) versus creep duration relationship and the permanent deformation versus creep duration rel ationship .128,291 Because thi s test is time-consumi ng and the resi stance to
rutting was evaluated in more detail in another phase of this study, only one temperature was employed. Increments of increasing load durations were applied along the vertical diameter of the specimen using a Materials Testing System (MTS), each followed by a rest period sufficient enough to allow for the recovery of resilient and viscoelastic deformations. Loading times (creep durations) were 0.1, 0.3, 1.0, 3.0, 10, 30, 100 and 1000 seconds, while the rest period after each of these were 1.0, 1.0, 2.0, 2.0, 2.0, 4.0, 4.0, and 8.0 minutes respectively. Vertical deformations during loading and rest were recorded using an MTS extensometer. Creep compliances for the various increments of time can be taken from the 1000-second trace or from the ends of the individual durations. The inverse of the compliance, defined as the creep modulus, is reported in this study. Permanent deformations, which are related to rutting resistance, were recorded at the end of each rest period. Specimens were tested at the design air void level and at a load of 75 lbf (334 N). The data can be used to compare properties using durations which represent moving or stopped traffic. The apparatus is shown in figure 2.
The equation used to compute the creep modul us was: 1281
where: Mc= creep modulus, lbf/in2 j
t = thickness, inches, and
(3.57)(L) Mc =
(t)(V,)
L = load, lbfj
V, = vert i ca 1 total deformat i on, in
c. Resistance to Moisture Damage
The American Society for Testing and Materials (ASTM) test method D 4867 was used to determine the effects of aging on the resistance to moisture damage. 126
,311 This method is commonly called the Root- Tunnicl iff method. Both
9
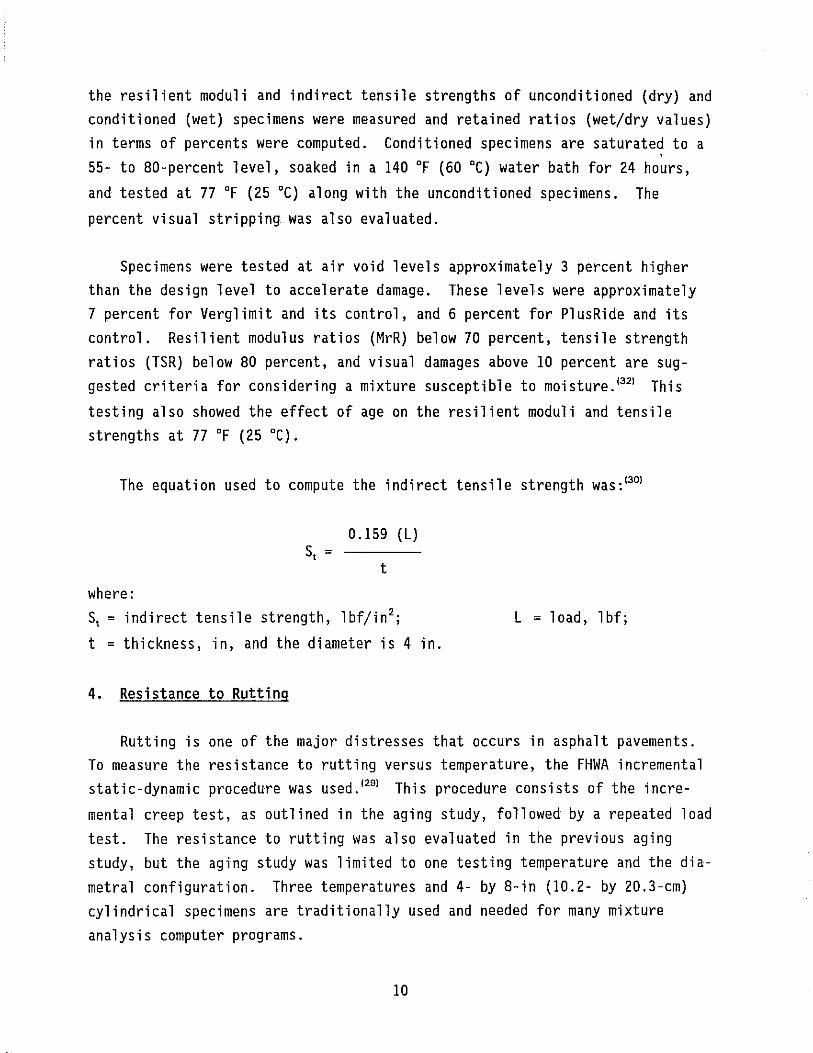
the resilient moduli and indirect tensile strengths of unconditioned (dry) and conditioned (wet) specimens were measured and retained ratios (wet/dry values) in terms of percents were computed. Conditioned specimens are saturated to a 55- to 80-percent level, soaked in a 140 of (60°C) water bath for 24 hours,
and tested at 77 of (25 °C) along with the unconditioned specimens. The
percent visual stripping was also evaluated.
Specimens were tested at air void levels approximately 3 percent higher than the design level to accelerate damage. These levels were approximately 7 percent for Verglimit and its control, and 6 percent for PlusRide and its control. Resilient modulus ratios (MrR) below 70 percent, tensile strength ratios (TSR) below 80 percent, and visual damages above 10 percent are suggested criteria for considering a mixture susceptible to moisture."2) This
testing also showed the effect of age on the resilient moduli and tensile strengths at 77 of (25°C).
The equation used to compute the i ndi rect tensil e strength was: 130)
0.159 (L)
t
where: St = indirect tensile strength, lbf/in 2
; L load, lbf;
t = thickness, in, and the diameter is 4 in.
4. Resistance to Rutting
Rutting is one of the major distresses that occurs in asphalt pavements. To measure the resistance to rutting versus temperature, the FHWA incremental static-dynamic procedure was used. 129
) This procedure consists of the incre
mental creep test, as outlined in the aging study, followed by a repeated load test. The resistance to rutting was also evaluated in the previous aging study, but the aging study was limited to one testing temperature and the diametral configuration. Three temperatures and 4- by 8-in (10.2- by 20.3-cm) cylindrical specimens are traditionally used and needed for many mixture analysis computer programs.
10

The FHWA incremental creep test was first used to measure the creep moduli and permanent strains. A repeated load consisting of a O.l-second sine wave (0 to 180 degrees only) followed by a 0.4-second rest period was then applied to determine the dynamic modulus at the 200th cycle and the permanent strain versus cycles relationship. The modulus at the 200th cycle represents the stress-strain characteristic of a mixture over the majority of its life.
Testing was performed on 4- by 8-in (10.2- by 20.3-cm) cylindrical specimens at a load of 1130 lbf (5026 N), which provides a pressure of 90 psi (6.2 E+05 Pal. Temperatures of 65, 77, and 104 of (18.3, 25, and 40°C) were chos
en so that a constant load could be used. It was found that the 41 of (5 °C)
temperature used in the resilient modulus test of the aging study could not be used. Loads high enough to produced nonerratic data at 41°F (5 °C) would
quickly fail specimens at 104 of (40°C), or provide data which went quickly
outside the range of the transducers. A constant load is needed to relate permanent deformations to temperature. Vertical compressive deformations were measured by averaging the outputs of two linear variable differential transducers (LVDT) placed along the sides of the specimens in the middle 4 in (10.2 cm). Strains were then calculated. The apparatus is shown in figure 3.
Two specimens were tested per temperature and mixture. Specimens were compacted at the design air void level using a California Kneading Compactor. Compaction was performed so that the air voids were uniformly distributed throughout the specimen. Trial specimens were sawed into three cylindrical portions to measure the distribution of these voids.
Missing creep data in the data tables of the following chapters indicates either the specimen failed, the strains exceeded the calibrated range of the transducers, or the test was aborted to avoid damage which could affect the results of the repeated load test. Missing repeated load data indicates either the specimen failed or the strains exceeded the calibrated range of the transducers.
The equation used to compute the creep and dynamic moduli was: 1291
L E =
(3.14159)(V)
11

Figure 3. Setup for the 4- by 8-in (10.2- by 20.3-cm) cylindrical specimens.
12

where: E = creep or dynamic modulus, lbf/in2;
V = vertical deformation, in; and the diameter the gauge length are both 4 in.
5. Resistance to Low Temperature Cracking
L = load, lbf; of the cylinder and
High stiffnesses at cold temperatures imply that a pavement has low flexibility and may be susceptible to cracking. To measure the resistance to low temperature cracking, 18 Marshall specimens were prepared and tested for diametral resilient modulus and indirect tensile strength at -30, -15, 0, 10, 32, 41, 65, 77, and 90 of (-34.4, -26.1, -17.8, 12.2, 0, 5, 18.3, 25,
32.2 °C) using two specimens at each temperature. This procedure gives a
relative comparison of low temperature performance. The log,o(modulus or
tensile strength) versus temperature is plotted for each mixture and the temperature di fference or "shift" between the plots is determi ned. (33) In
this study a reference tensile strength of 300 psi (2.1 E+06 Pal and a reference modulus of 3000 ksi (20.7 E+09 Pal were used to determine where the shift should be measured as these values were in the middle of the brittle-ductile transition zone (curved portion of the plot) for the two control mixtures. Indirect tensile strengths in this test were determined at a loading rate of 0.1 i nlmi n (2.54 mmlmi n) in accordance with the referenced procedure. (33)
Specimens were tested at the design air void level.
6. Extraction and Recovery
Compacted Marshall specimens were extracted by the centrifuge method of AASHTO T 164 to determine any changes in gradation due to the breaking of aggregate, the crushing of Verglimit particles, or the swelling and digestion of PlusRide rubber. (3D) The digestion of rubber could also affect the asphalt
content. A supercentrifuge was used to remove all dust from the solution. The binders were then recovered by the Abson procedure of AASHTO T 170 and tested to determi ne if the addi t i ves affected the bi nder pro pert i es. (3D)
These tests were also performed to determine if any deviations in the standardized extraction and recovery procedures are needed when testing Verglimit or PlusRide.
13

CHAPTER 4: EVALUATION OF VERGLIMIT - PHASE I
I. Laboratory Mixture Design
The aggregate gradation and Marshall mixture design properties for the Verglimit mixture and its control mixture are presented in table 2. The properties of the asphalt are given in table 3. The optimal asphalt contents for the Verglimit mixture and its control mixture were 5.9 and 5.6 percents, respectively, based on peak stability, peak density, and a 4-percent air void level. Both mixtures had similar Marshall stabilities and flows. (After the testing in this study was completed, the supplier began recommending air void levels of 1.5 to 3.0 percent in order to reduce the problem with the pavements becoming slick after construction.) Additional mixture design data are given in table 29 and figures 24, 25, and 26 of appendix A.
The aggregate gradation matched the gradation of the wearing course of the ALF pavements and conformed to the Virginia Department of Transportation S-5 specification for surface mixtures. The aggregate consisted of 50 percent 7/16-in (11.2 mm) traprock, 30 percent #10 traprock screenings, and 20 percent natural quartz sand. 1241
Verglimit is added by the total weight of the mixture, including the Verglimit. The most common level is 5 to 6 percent, and 5.5 percent was used in this study. However, the Verglimit particles are considered aggregates, and in order to compensate for the addition of the Vergl imit, the weight of the aggregate passing the #4 sieve size was reduced by 5.5 percent in accordance with the supplier's recommendation. This means there was a slight change in gradation because the fine aggregate and the Verglimit particles did not have the same gradation. There was also a slight change in volume as the two materials do not have the same specific gravity. Because the Verglimit particles can break during mixing and compaction, the true gradation can only be determined by extracting compacted mixtures. This gradation may be misleading because (1) the crushed Verglimit particles will not be uniformly distributed, (2) the particles may not provide the same effect on mixture properties as aggregate, and (3) Verglimit can dissolve over time due to the absorption of water.
14

Table 2. Aggregate and mixture design properties for the Verglimit study.
Aggregate Gradation Mixture Design Properties
(Percent Passing) Control Vergl imit
1/2 in 100.0 Asphalt Content, % 5.6 5.9
3/8 in 96.5 Theoretical Max SG 2.572 2.497
#4 66.8 Density, lbm/ft3 155.0 149.6
#8 46.8 Stabil ity, lbf 2500 2760
#16 34.6 Flow, 0.01 in 10.0 9.3
#30 23.1 Air Voids, % 3.4 3.8
#50 13.0 VMA, % 14.5 15.5
#100 7.9 VFWA, % 76.6 75.5
#200 5.3 Design Blows 50 50
Without With Verglimit Verglimit
Bulk Dry SG 2.744 Bulk Dry SG 2.668 Vergl imit SG 1.807 (Absorption is
Bulk SSD SG 2.790 Bulk SSD SG 2.710 assumed to be zero)
Apparent SG 2.877 Apparent SG 2.787
% Absorption 1.7 % Absorption 1.6
(in)(2.54)=(cm) (lbf)(4.448) = (N) (lbm/ft3 )(16.01) = Kg/m3
15

Table 3. Asphalt properties.
Physical Properties of the AC-20 Virgin TFOT
Penetration, 25°C (100 g, 5 s), 0.1 mm 79 53
Viscosity, 135°C, cSt 424 579
Viscosity, 60°C, P 1988 4186
Ductil ity, cm 150+ 150+
Loss, percent 0.08
Specific Gravity, 25/25 °C 1.026
Flash Point, COC, of 590
Solubility in Trichloroethylene, percent 99.96
(OF _ 32}/1.8 = °C (P}(O.l) = Pa-sec (cSt}(lE-06) = m2/s
Table 4. Effect of aging - resilient modulus test results.
Contro 1 Vergl imit
Temperature Days Days
of 2 7 14 28 2 7 14
Resilient Modulus (ksil Resilient Modulus
41 1540 1680
77 152 205
104 39.3 37.3
(ksi}(6895) = (KPa)
1400 1430 1040
231 179 170
42.4 39.5 50.0
(OF - 32}/1.8 = °C
16
1220 1220
171 190
41.0 57.5
28
( ksil
1120
181
54.0

Some changes to the testing procedures were required. Verglimit is water soluble, even though coated with linseed oil, so the volumetric flask method of AASHTO T 209 and ASTM D 2041 or a volumeter must be used for determining the maximum specific gravity of the mixture. 126.30' Also, for determining the
bulk specific gravities of specimens, only a I-minute period of immersion in the water could be used. To mix the materials, the unheated Verglimit particles were added after the asphalt cement and aggregate were mixed, and an additional 15 to 30 seconds of mixing was needed to ensure coating and a visually homogenous distribution. After the specimens were extruded from the molds, they were placed in plastic bags to prevent the absorption of moisture. All specimens were dried to constant weight at 140 of (60°C) after obtaining
their bulk specific gravity and placed back into the bags until tested, except those used in the aging study which were dried and left in air.
Within 28 days of aging, the Verglimit specimens left in air swelled and started to crack due to the absorption of moisture. The specimens also had a slippery feeling when handled. No tests could be performed after 28 days. Simi 1 ar effects have also been reported el sewhere. 11 l'
Data were analyzed using analysis of variance and t-test statistical methods at a significance level of 0.05. All reported significant differences are on a statistical basis.
2. Effect of Aging
a. Resilient Modulus
Resilient moduli are presented in table 4 and figure 4. Verglimit and the testing temperature had a significant effect on the moduli. Verglimit caused a significant decrease in modulus at 41°F (5 °C), a significant
increase in modulus at 104 of (60°C), and had no significant effect at 77 of
(25 °C). Therefore, Verglimit reduced the temperature susceptibility of the
mixture as measured by resilient modulus. Aging had little effect on the moduli, and thus the test did not measure the effects of the cracks at 28 days of aging.
17

(f)
~
0-0 6-6
<>-<> 1E41
CONTROL AT 41°F @-@ VERGLIMIT AT 41°F CONTROL AT 77 of A-A VERGLIMIT AT 77 of CONTROL AT 104 of +-+ VERGLIMIT AT 104 of
(ksi )(6895) = (KPa) ('F - 32)/1.8 = 'c I
~ 1000 ~-----~:========:=================~ ---l :::J o o ::2 IZ W ---l (f) W a::
~- -----=-i 100
• + -~---<> <>
10 0 5 10 15 20 25
AGING TIME, DAYS
Figure 4. Verglimit - Resilient modulus versus aging time and test temperature.
18
A
+ <>
~ 30

b. Creep Modulus and Permanent Deformation
Creep moduli and permanent deformations at 77 of (25°C) are presented in
table 5. Verglimit, aging, and creep time had a significant effect on both properties. Unlike the resilient modulus results, Verglimit caused a decrease in creep modulus at 77 of (25°C) at almost all ages and creep times. The
greatest difference was at 28 days where the Verglimit samples started to swell and crack. The effect of the Verglimit on the modulus was only slight within 28 days. Overall, Verglimit increased the amount of permanent deformation except at 7 days where the control produced higher deformations. A reason for this anomalous result was not apparent.
c. Resistance to Moisture Damage
Data from the moisture damage tests are given in table 6 and the TSR aild MrR are presented in figure 5. Figure 6 plots the retained ratios at all aging times computed using the wet value from the day of the test and the dry value from the second day test. Verglimit had a significant effect on the retained ratios computed both ways. Verglimit provided retained ratios lower than the control and also below suggested pass/fail criteria (70 percent for MrR and 80 percent for TSR). However, there was no visual stripping and the low retained ratios were attributed to the high amount of swelling which occurred during the 24-hour 140 of (60°C) soak. The percent swells by volume
are also given in table 6.
Tensile strengths and resilient moduli are presented in figures 7 and 8. The wet values for the Verglimit mixture were significantly lower than for the control mixture and were responsible for the lower retained ratios. The dry values of both mixtures varied with the aging time and caused the variations in the retained ratios shown in figure 5. Reasons for the changes in dry values are unknown except for the low 28-day values for the Verglimit mixture. Changes at 28 days were attributed to swelling and cracking. These low dry values led to higher calculated retained ratios and thus the retained ratios in figure 5 are misleading. Basing the retained ratios on the dry values from the second day test flattened the plots as shown by figure 6 and appeared to be the better method for calculating retained ratios.
19

Table 5. Effect of aging - diametral creep test results at 77 of (25°C).
Control Vergl imit
Creep Time Days Days
(sec) 2 7 14 28 2 7 14 28
Creep Modulus (ksi) Creep Modulus (ksi)
0.10 74 73 72 74 66 63 69 31
0.30 64 60 64 58 54 55 57 23
1.0 53 48 53 50 44 44 44 19
3.0 43 39 44 40 36 35 33 17
10.0 35 31 35 33 30 29 25 14
30.0 31 28 31 29 28 23 22 13
100.0 27 24 27 24 26 20 19 12
1000.0 18 14 17 15 19 15 12
Permanent Deformation Permanent Deformation
(microinches) (microinches)
0.10 147 415 147 157 431 59 392 4786
0.30 274 703 265 255 646 225 686 5335
1.0 402 835 421 460 901 382 1048 6911
3.0 666 1153 676 773 1146 754 1576 6862
10.0 969 1834 901 1096 1322 1185 2320 7792
30.0 1145 1920 1155 1429 1351 1586 2652 7870
100.0 1556 2471 1664 1880 1576 2770 3181 9093
1000.0 3465 5655 3554 4444 2790 4160 5961
(ksi)(6895) = (KPa) (i n)(2. 54 )=(cm) (OF _ 32)/1.8 = °c
20

Table 6. Effect of aging - moisture damage test results.
Control
Days
2 7 14 28
Tensile Strength (psi)
Wet 65.8 68.9 68.4 75.8
Dry 73.0 72.1 90.0 78.3
Resilient Modulus (ksi)
Wet
Dry
73.1 88.0 86.0 104.6
84.0 113.2 155.2 133.8
Retained Ratio, Percent
TSR
MrR
90.1 95.6 76.0 96.8
87.0 77.7 55.4 78.2
Vergl imit
Days
2 7 14 28
38.6 40.3 35.0 35.8
78.2 104.2 81.7 59.9
45.0 42.5 39.8 54.8
128.4 184.4 134.8 76.8
49.4 38.7 42.8 59.8
35.0 23.0 29.5 71.3
Retained Ratio Based on Dry Values From the Second Day, Percent
TSR
MrR
90.1 94.4 93.7 103.8
87.0 104.8 102.4 124.5
Visual Stripping, percent
<5 <5 <5 <5
Swell, Percent by volume
0.5 0.2 0.4 0.6
49.4 51.5 44.8 45.8
35.0 33.1 31.0 42.7
<5 <5 <5 <5
2.7 4.6 4.4 6.5
(ksi)(6895) ~ (KPa) (psi)(6895) ~ (Pa)
21

200~------------------------------------~
~ tj 150
0-0 CONTROL TSR t::,.-t::,. CONTROL MrR ~-~VERGLIMIT TSR A-A VERGLIMIT MrR a::
w a.. 0" t{ a:: Cl w z
~ a::
IZ
100
50
@O_________----------O ____ A 0 - ~ U______. - ;l!I;
:--~ ~:==;; ------~~ ----A A
o ~ ____ ~ ____ _L ____ ~ ______ ~ ____ ~ ____ ~
o 5 10 15 20 25 30
AGING TIME, DAYS
Figure 5. Verglimit - MrR and TSR versus aging time.
200~-------------------------------------,
tj 150
0-0 CONTROL TSR t::,.- t::,. CONTROL MrR ~-~VEGLIMIT TSR A-A VERGLIMIT MrR a::
w a.. 0" t{ 100 a:: Cl w z
~ a::
50
t::,..------@pc===:=:::OI-----
------~
OL-____ ~ ____ _L ____ ~~ ____ ~ ____ _L ____ ~
o 5 10 15 20 25
AGING TIME, DAYS
Figure 6. Verglimit - MrR and TSR based on the dry values from the second day versus aging time.
22
30

150 (psi)(6895) = (Pa) /:,.-/:,. CONTROL DRY
0-0 CONTROL WET UJ 120 A-A VERGLIMIT DRY a.. .-.VERGLIMIT WET :r:
/":>,,-l-t!) 90 z w ~ A==-=--==- =-=-===e c::: I-UJ 60
o e 0 w A ...J UJ • • z w 30 I-
O~----~----~------~----~------L-----...J o 5 10 15 20 25 30
AGING TIME, DAYS
Figure 7. Verglimit - Wet and dry tensile strengths versus aging time.
250 (ksi)(6895) = (KPa) /:,. - /:,. CONTROL DRY
0-0 CONTROL WET UJ 200 A-AVERGLIMIT DRY ~ .-.VERGLIMIT WET
,,/A UJ ::::>
/:,.-...J 150 ::::> 0 A -/:,. 0
~~o :::!: /:,. I- 100 B~O z w o A ::J UJ • w 50 • c::: • •
0 0 5 10 15 20 25 30
AGING TIME, DAYS
Figure 8. Verglimit - Wet and dry resilient moduli versus aging time.
23

An antistripping additive was not used in the mixtures. The aggregate reportedly was slightly susceptible to stripping, and an additive is used in practice, yet the mixtures did not visually strip. In order to evaluate the effect of Verglimit on stripping, a granite aggregate from Grayson, Ga, which is severely susceptible to stripping, was used to replace the traprock screenings in the mixtures while maintaining the gradation by weight. Both mixtures provided low retained ratios after moisture conditioning and the control had a high level of visual stripping. The Verglimit prevented stripping as the specimens had almost no visual damage. The control mixture provided values of TSR = 56.6, MrR = 40.0, and visual stripping of 40 percent. The Verglimit mixture provided values of TSR = 48.6, MrR = 46.8, and visual stripping less .than 5 percent. The Verglimit specimens swelled more during moisture conditioning as the average swell by volume was 3.8 percent compared to 1.1 percent for the control specimens. This apparently led to the low retained ratios rather than stripping. The mechanism behind the high reduction in visual stripping is unknown but it is hypothesized that it is related to the calcium in the Verglimit. Testing using the substitute granite aggregate was only performed at 2 days.
3. Resistance to Rutting
a. Creep Test
Creep moduli and permanent strains are presented in table 7. Verglimit, temperature, and creep time had a significant effect on both properties. Verglimit increased the creep modulus and decreased the permanent strain at the high temperature for each creep time. Verglimit generally decreased the creep modulus but had a variable effect on permanent strain at the low temperature. This supported the results of the resilient modulus test in that temperature susceptibility was reduced.
b. Repeated Load Test
The dynamic moduli at the 200th cycle and test temperatures of 65, 77, and 104 of (18.3, 25, and 40°C) for the control mixture were 850,000, 450,000 and
107,000 psi (5.9, 3.1, and 0.74 E+09 Pal respectively. For the Verglimit mix-
24

Table 7. Resistance to rutting - creep test results.
Control Verglimit
Creep Time Temperature Temperature
(sec) 65 of 77 of 104 of 65 of 77 of 104 of
Creep Modulus (ksi) Creep Modulus (ksi)
0.10 508 254 62 278 242 94
0.30 273 146 49 178 147 68
1.0 145 85 44 107 99 58
3.0 78 72 45 74 74 53
10.0 66 60 43 56 59 49
30.0 53 48 51 56 45
100.0 46 42 49 51 38
1000.0 38 32 42 47 27
Permanent Strain Permanent Strain
(microinches) (microinches)
0.10 28 70 281 12 43 34
0.30 72 161 493 63 129 245
1.0 148 274 688 131 207 365
3.0 240 325 811 282 324 454
10.0 346 422 871 419 464 445
30.0 389 437 516 375 422
100.0 560 653 550 608 783
1000.0 833 1144 759 800 1684
(ksi}(6895) = (KPa) (in}{2.54}=(cm) (OF _ 32}/1.8 = °C
25

ture they were 610,000, 443,000, and 102,000 psi (4.2, 3.1, and 0.70 E+09 Pal. (These data are not shown in a table.) Verg1imit caused a reduction in stiffness at the low temperature but had no effect at the other two temperat~res. This generally indicates an increased resistance to low temperature cracking.
Permanent strains versus the number of cycles at 65, 77, and 104 of (18.3,
25, and 40°C) are presented in table 8. Verg1imit, temperature, and cycles
had a significant effect on permanent strain. Verg1imit reduced the amount of permanent strain at 77 and 104 of (25 and 40°C) and slightly increased
the permanent strain at 65 of (18.3 °C) at the high number of cycles. Thus,
unlike the dynamic moduli, the permanent strains indicated a reduced susceptibility to rutting and a slight trend toward reducing cracking. Permanent strains are a much better indicator of performance than moduli, and thus the conclusions from the strain data should be used.
The aging study data of table 5 shows that Verg1imit generally increased the permanent deformations at 77 of (25°C) at almost all ages and creep
times. This does not agree with the data at 77 of (25 °C) in tables 7 and 9
where the amount of permanent strain generally decreased. Therefore, the diametra1 and 4- by 8-in (10.2- by 20.3-cm) cylinder tests may not be surrogates for each other at this temperature. Some of the discrepancy may be the result of testing at a temperature close to where the two mixtures have equal
properties.
4. Resistance to Low Temperature Cracking
Resilient moduli and tensile strengths versus temperature are presented in table 9 and figures 9 and 10. The resilient modulus test produced a shift of -3 of (-0.6 °C) at the 3000 ksi (20.7 E+09 Pal reference modulus for the
Verg1imit mixture relative to the control. This was due to a slight decrease in temperature susceptibility. The tensile strength test at 300 psi (2.1 E+06 Pal produced virtually equal data and a shift was not found. Overall, both mixtures would be expected to behave similarly in the field based on this
data.
26

Table 8. Resistance to rutting - repeated load test results.
Control Verglimit
number of Temperature Temperature
cycles 65 of 77 of 104 of 65 of 77 of 104°F
Permanent Strain Permanent Strain
{microinches} {microinches}
1 64 174 443 29 73 203
3 111 329 709 62 151 339
10 191 618 1035 141 295 552
30 328 940 1581 239 465 1081
100 400 1264 2515 310 660 1522
200 462 1384 3636 374 768 2162
300 464 1505 4508 390 836 2648
400 469 1559 5156 410 882 3096
500 471 1603 5938 421 917 3495
1000 475 1795 460 1065
3000 496 2216 552 1618
10000 606 3462 671 2694
20000 673 780
30000 734 861
40000 782 919
50000 845 968
{in)(2.54}={cm} {OF _ 32}/1.8 = °C
27

Table 9. Resistance to low temperature cracking.
Temperature
of Control Vergl imit Control Vergl i mit
Resilient Modulus (ksi) Tensile Strength (psi)
-30 5640 4570 462 487
-15 5440 5010 514 446
0 5150 4280 490 453
10 4730 4240 411 420
32 2070 1800 236 229
41 1430 1040 165 144
65 340 321 50 54
77 139 157 25 25
90 68 76 11 12
(ksi )(6895) = (KPa) (psi )(6895) (Pa) (OF - 32)/1.8 = °C
28

(fJ a. I
b r5 Il::
ti w ....J iii z W I-
(fJ :.::: (fJ
:3 :::> Cl o ~
IZ W ....J
~ Il::
1000r------------------------------------, 0--0 CONTROL <'lI--IIIVERGLIMIT
300
100
-----------~ '0
(psi)(6895) = (Pa)
('F - 32)/1. 8 = 'c
III
10L----L----~--~----~--~----~~-L~ -40 -20 o 20 40 60 80
TEMPERATURE, OF
Figure 9. Verglimit - Tensile strength versus temperature for evaluating low temperature cracking.
100
lE4 ~------------------------------------_. 0--0 CONTROL
3000
1000
100
(ksi)(6895) = (KPa)
{'F - 32)/1.8 = 'c
-3°F
10L---~----~--~L---~--~----~--~_.....I
-40 -20 o 20 40 60 80
TEMPERATURE, OF
Figure 10. Verglimit - Resilient modulus versus temperature for evaluating low temperature cracking.
29
100

5. Extraction and Recovery
The results of the extraction and recovery tests, shown in table 10, indicated that there was some crushing of the aggregate from compaction with the control mixture. As expected, the results for the Verglimit mixture indicated that a significant amount of the Verglimit particles were crushed. It is possible that the slight differences in the gradations of the two mixtures caused the small differences in temperature susceptibility as shown by some of the mixture properties, but this is speculative. Both mixtures had extracted asphalt contents close to the design contents, and there was little difference between the recovered binder properties of the two mixtures. Because Verglimit particles crush, it may be difficult to check the gradation for quality assurance purposes. Another problem is that it is unknown if the amount of crushing found in the laboratory duplicates the amount of crushing under a roller in the field. The gradations may also change slightly over time because the Verglimit dissolves out of the mixture.
The following additional observations were made during extraction testing. Because Verglimit absorbs moisture very rapidly, an extracted binder content generally must be corrected for the absorbed moisture if the specimens are allowed to stand in air. It was found that several hours may be needed to dry all of the moisture from a mixture specimen even if placed in an oven at 230 of (110°C) and broken apart. Lengthy drying periods like this will
affect the asphalt properties and must be avoided when asphalt properties are needed. Thus the binder content must be corrected for moisture using ASTM 01461 or AASHTO T 1l0.126.30) Verglimit can also be lost when exposed to
air because the particles absorb so much moisture that moisture and calcium chloride start to drip from the specimens.
6. Conclusions
@ Verglimit reduced the temperature susceptibility of the mixture as measured by the creep moduli, repeated load moduli (including resilient moduli), and permanent deformations and strains. However, the effects were generally slight. Verglimit provided Marshall stabilities and flows similar to the control.
30

Table 10. Extraction test results.
Sieve Design Control Verglimit Size Extraction Extraction
(Percent Passing)
1/2 in 100.0 100.0 100.0
3/8 in 96.5 95.8 96.7
#4 66.8 68.7 68.5
#8 46.8 48.8 50.3
#16 34.6 37.3 39.5
#30 23.1 26.3 28.9
#50 13.0 15.8 19.5
#100 7.9 9.6 13.9
#200 5.3 6.5 10.7
Percent Asphalt
Control 5.6 5.69 Vergl imit 5.9 5.93
Physical Properties of the Binder
(virgin) (After Mixing) (After Mixing)
Penetration, 25°C 79 69 66
Viscosity, 135°C, cSt 424 540 556
Viscosity, 60°C, P 1988 3113 3488
(in)(2.54)=(cm) (P)(O.l) = Pa-sec (cSt)(lE-06) = m2/s
31

• Verglimit increased the moisture susceptibility of the mixture. The particles absorbed moisture and the specimens swelled. Even though this produced low retained ratios, Verglimit caused a significant reduction in visual stripping. The mechanism behind this reduction is unknown but it is hypothesized that it is related to the calcium in the Verglimit .
• Dry specimens also swelled and cracked within 28 days of aging at 77 of
(25 DC). How this relates to field performance is unknown.
$ Because Verglimit particles crush, it may be difficult to check the gradation for quality assurance purposes. It is unknown if the amount of crushing found in the laboratory duplicates the amount of crushing under a roller in the field. The gradations may also change slightly over time because the Verglimit dissolves out of the mixture.
$ Verglimit had no effect on the asphalt content or asphalt binder properties, although the asphalt content must be corrected for absorbed moisture using ASTM D 1461 or AASHTO T 1l0ya,3DI The long-term effects of Verg
limit on asphalt binder properties were not evaluated.
$ Some changes to the testing procedures were required. Verglimit is water soluble so the volumetric flask method of AASHTO T 209 and ASTM D 2041 or a volumeter must be used for determining the maximum specific gravity.12MDI For determining the bulk specific gravities of specimens, only
some minimum period of immersion the water, such as I minute, can be used. To mix the materials, the unheated Verglimit particles were added after the asphalt cement and aggregate were mixed, and an additional IS to 30 seconds of mixing was needed to ensure coating and a visually homogenous distribution.
32

CHAPTER 5: EVALUATION OF PLUSRIDE - PHASE I
1. Laboratory Mixture Design
The gradations and Marshall mixture design properties for the PlusRide mixture and its control mixture are presented in table 11. The gradation in table 11 for the PlusRide mixture includes the rubber. Additional mixture design data are given in table 30 and figures 27, 28, and 29 of appendix A. The asphalt properties are given in table 3. The ALF binder layer aggregates were used but were sieved and regraded to obtain the average gradation specified by the patent for PlusRide™ 16, which is a 3/4-in (1.9-cm) mix
ture. 1241 (Gradations for other top sizes are designated differently.) The
patent specifies a gap gradation in order to provide space for the rubber particles. The aggregate was a blend of 55 percent coarse traprock aggregate, 35 percent #10 screenings, and 10 percent natural quartz sand. In the control mixture, aggregate was used in place of the rubber because the rubber is considered an elastic aggregate. The gradations of the two mixtures in table 11 are slightly different because the replacement was performed on a volume basis. However, any changes in gradation due to the rubber swelling during mixing and compaction could not be considered. The rubber gradation is also shown in table 11.
The PlusRide was added at the recommended level of 3 percent by the total weight of the mixture, including the PlusRide. Specimens were then prepared according to the supplier's recommendations. The unheated rubber particles were first dry mixed with the aggregates heated to 320 of (160°C) and then
the asphalt was added. The mixture was oven cured at 290 of (143 °C) for 1
hour before compaction. To prevent expansion and cracking of the specimens because of the swelling of the rubber, weights must be placed on the compacted sper.imens for 24 hours while they are still in the molds. A lO-lbm (4.5-kg) weight was used for Marshall-size specimens and 30-lbm (136-kg) for 4- by 8-in (10.2- by 20.3-cm) cylindrical size specimens.
The optimal asphalt contents for the PlusRide and control mixtures were 6.0 and 4.5 percents respectively based on peak stability, peak density, and a 3-percent air void level. A 2- to 4-percent air void level is recommended
33

Table 11. Aggregate and mixture design properties for the PlusRide study.
Aggregate Gradation, Percent Passing Mixture Design Properties
Control PlusRide" Control PlusRide
3/4 in 100.0 100.0
1/2 in 75.0 73.9 Asphalt Content, % 4.5 6.0
3/8 in 59.2 57.4 Theoretical Max SG 2.659 2.488
1/4 i nb 41.4 39.0
#4 38.0 35.6 Density, Ibm/ft3 160.5 150.5
#8 28.5 28.0 Stabil Hy, lbf 2050 1320
#lOb 26.5 26.3 Flow, 0.01 in 10.5 27.8
#16 22.3 21.2
#20b 20.5 19.8 Air Voids, % 3.3 3.1
#30 19.0 18.1 VMA, % 12.0 15.6
#50 13.9 13.9 VFWA, % 72.6 80.3
#100 10.7 11.0 Design Blows 50 50
#200 8.3 8.7
Bulk Dry SG 2.791 2.685 Rubber, Percent Passing
Bulk SSD SG 2.833 2.720 1/4 100.0
Apparent SG 2.912 2.787 #4 97.6
% Absorption 1.5 1.4 #10 36.2
#20 22.4
PlusRide SG 1.19 #30 20.4
#200 0.2
"Includes the 3 percent rubber. bSizes were added because the rubber specification used these sizes.
(in)(2. 54 )=(cm) (lbf)(4.448) = (N) (lbm/ft3 )(16.01) = Kg/m3
34

by the supplier and a 1.5 percent difference in asphalt content is typical. The PlusRide mixture was visually dense after compaction and less coarse in appearance than the control. The PlusRide mixture also appeared rich in asphalt. The higher asphalt content was attributed to the large rubber particles causing the mixture to resist densification under the Marshall hammer. The PlusRide mixture had a lower stability and a very high flow. The control mixture had a low voids in the mineral aggregate (VMA), but all aggregate particles were thoroughly coated.
The air void levels for the PlusRide mixture may not be correct because swelling in compacted and uncompacted mixtures may be different. An uncompacted mixture is used to determine the maximum specific gravity of the mixture while a compacted specimen is used to determine the bulk specific gravity of the mixture. Air void levels are calculated from these specific gravities, which are calculated using volumes. Swelling may affect these volumes. The VMA for the PlusRide mixture also may not be correct because the procedure for calculating VMA does not consider swelling.
By 90 days of aging, some of the PlusRide specimens developed observable hairline cracks. The rubber particles on the outer edges of the specimens also began to stick out, but the samples could be tested. The rubber particles swelled. This was attributed to the absorption of asphalt hydrocarbons.
Data were analyzed using analysis of variance and t-test statistical methods at a significance level of 0.05. All reported significant differences are on a statistical basis.
2. Effect of Aging
a. Resilient Modulus
Resilient moduli are presented in table 12 and figure 11. PlusRide and the testing temperature had a significant effect on the moduli. PlusRide caused a significant decrease in modulus at all three temperatures. Therefore, it is expected that PlusRide would decrease the resistance to rutting and increase the resistance to low temperature cracking. Age had no overall effect.
35

Table 12. Effect of aging - resilient modulus test results.
Control PlusRide
Temperature Days Days
of 2 7 14 28 90 2 7 14 28 90
Resilient Modulus (ksi) Resilient Modulus (ksi)
41 2140 2100 1970 2110 2130 904 909 1110 1160 1030
77 248 283 239 255 301 222 165 212 177 125
104 40.0 44.0 43.0 58.1 53.8 40.5 35.5 29.5 45.7 17.8
(ksi)(6895) = (KPa) (OF _ 32)/1.8 = °C
0-0 CONTROL AT 4PF @-@ PLUSRIDE AT 41°F 11-11 CONTROL AT 77 OF A-A PLUSRIDE AT 77 OF 1 E4 0-0 CONTROL AT 104 OF +-+ PLUSRIDE AT 104 OF
(.f) ~
gj 1000 -l ;::) o o :::2 IZ w 100 -l (.f) W a:::
(ksi)(6895) = (KPa) (OF _ 32)/1.8 = °C
0-0--0>-----0----------------------------,0
@-@--@@---------------------------->@
~-I1--~ 11---------------------------., ...--II1II----A -A·----------------________ A
+~~--o~~---------====---------------o --+ -----
10 ~--~~~~~~--~--~--~--~--~--~ o 1 0 20 30 40 50 60 70 80 90 1 00
AGING TIME, DAYS
Figure 11. PlusRide - Resilient modulus versus aging time and test temperature.
36

b. Creep Modulus and Permanent Deformation
Creep moduli and permanent deformations at 77 of (25°C) are presented in
table 13. PlusRide, aging, and creep time had a significant effect on both properties. PlusRide decreased the creep modulus and increased the permanent deformation at all aging and creep times. The creep modulus of the control mixture overall increased with aging time. With the PlusRide mixture, it increased and then decreased, possibly due to the hairline cracks.
c. Resistance to Moisture Damage
Data from the moisture damage tests are given in table 14 and the TSR and MrR are presented in figure 12. Figure 13 shows the plots where the retained ratios at all aging times were computed using the wet value from the day of the test and the dry value from the second day test. PlusRide and aging time had a significant effect on both retained ratios computed both ways. Aging time provided decreasing then increasing trends for both retained ratios. PlusRide decreased both the TSR and the MrR.
The TSR for both mixtures were generally above the 80-percent criterion and higher than the MrR. The PlusRide MrR were generally below the 70-percent pass/fail criterion. The control provided a low MrR at 7 days only. The reason for this anomalous result could not be determined. There was no visual stripping in either of the mixtures. The Verglimit mixture and its control in table 6 also did not visually strip. The degree of swelling by volume was greater in the PlusRide specimens as shown in table 14.
Tensile strengths and resilient moduli are presented in figures 14 and IS.
Both the dry and wet values for the PlusRide mixture were significantly lower than the values for the control mixture. Both the dry and wet values varied with aging time. Because the wet values varied significantly with age, calculating retained ratios using the dry values from the second day test, shown in figure 13, did not provide flatter plots. This method of calculating ratios flattened the plots for the Verglimit and Verglimit control mixtures. Reasons for these variations in dry and wet values were not evident.
37

Table 13. Effect of aging - diametral creep test results at 77 of (25 DC).
Control PlusRide
Creep Time Days Days
(sec) 2 7 14 28 90 2 7 14 28 90
Creep Modulus (ksi) Creep Modulus (ksil
0.10 64 59 78 78 95 50 52 61 36 34
0.30 52 52 60 62 80 38 42 48 26 22
1.0 40 39 47 47 62 28 31 36 19 15
3.0 32 32 37 36 48 21 23 27 14 11
10.0 27 26 30 28 38 16 16 19 10 7
30.0 25 24 27 24 33 13 12 15 8 6
100.0 22 21 23 21 28 10 9 11 6 4
1000.0 16 15 17 15 19 5 4 6 2 3
Permanent Deformation Permanent Deformation
(microinches) (microinches)
0.10 257 366 303 315 417 1185 879 1043 3440 1823
0.30 781 719 643 593 779 1395 1395 1296 3717 2690
1.0 1021 1122 1097 1046 911 2646 2108 1954 5166 4568
3.0 1311 1499 1424 1462 1263 3503 3129 2613 6161 6621
10.0 1525 1764 1713 1928 1592 4568 4601 3832 8555 10014
30.0 1613 1865 1903 2255 1801 5644 6017 4974 10987 13856
100.0 1827 2256 2331 2633 2174 7884 8652 6917 15509 21136
1000.0 2949 3881 3868 4675 3634 17600 20005 15635 40758 38747
(ksi)(6895) = (KPa) (in) (2.54)=(cm) (OF _ 32)/1.8 = DC
38

Table 14. Effect of aging - moisture damage test results.
Control
Days
2 7 14 28 90
Tensile Strength (psi)
Wet 74.8 81. 2 73.1 67.9 96.9
Dry 74.5 89.3 87.8 72.4 98.7
Resilient Modulus (ksi)
Wet
Dry
176.0 137.8 197.4 147.5 230.6
190.1 231.3 270.9 184.2 234.9
Retained Ratio, Percent
TSR
MrR
100.4 90.9 83.3 93.8 98.2
92.6 59.6 72.9 80.1 98.2
PlusRide
Days
2 7 14 28 90
55.6 55.3 47.0 43.4 55.4
60.5 60.4 62.7 50.9 60.0
83.6 64.1 67.2 56.8 89.2
120.8 145.8 138.5 96.8 114.2
91.9 91.6 75.0 85.3 92.3
69.2 44.0 48.5 58.7 78.1
Retained Ratio Based on Dry Values From the Second Day, Percent
TSR
MrR
100.4 109.0 98.1 91.1 130.1
92.6 72.5 103.8 77.6 121.3
Visual Stripping, percent
<5 <5 <5 <5 <5
Swell, percent by volume
-0.3 1.1 0.5 0.6 -0.2
91.9 91.4 77.7 71.7 91.6
69.2 53.1 55.6 47.0 73.8
<5 <5 <5 <5 <5
1.5 1.9 1.7 1.7 1.4
(ksi)(6895) = (KPa) (psi)(6895) = (Pa)
39

!z w () a:: w Il..
o
~ Cl W Z
~ a::
oL-______ L-____ ~L_ ____ ~ ______ ~ ______ ~
o 20 40 60 80 100
AGING TIME, DAYS
Figure 12. PlusRide - MrR and TSR versus aging time.
200~--------------------------------------~
150
100
50
0-0 CONTROL TSR b,.-b,. CONTROL MrR e-e PLUSRIDE TSR ~-~ PLUSRIDE MrR
o ~------~------~------~------~------~ o 20 40 60 80
AGING TIME, DAYS
Figure 13. PlusRide - MrR and TSR based on the dry values from the second day versus aging time.
40
100

150 (psi)(6895) = (Pa) 1.'::.-1.'::. CONTROL DRY
0-0 CONTROL WET Vi 120 A-A PLUSRIDE DRY a. .-. PLUSRIDE WET :r:
~ t; 90 z 1.'::.-1.'::. w
f/j?O ....... o~e a:: tii w 60 =6-A ___...... ...J ........ - -~ (/) z w 30 I-
o L-______ ~ ____ ~ ______ ~ ______ ~ ______ ~
o 20 40 60 80 100
AGING TIME, DAYS
Figure 14. PlusRide - Wet and dry tensile strengths versus aging time.
350r---------------------------------------~
300
250
200
150
100
50
(ksi)(6895) = (KPa) 1.'::.-1.'::. CONTROL DRY 0-0 CONTROL WET
I.'::. A-A PLUSRIDE DRY / "" .-.PLUSRIDE WET
I.'::. "" -9 ~/~l>~-/~-A 0
A ............... A
..... -.- -:'--_._------. o ~----~~----~------~------~------~
o 20 40 60 80 100
AGING TIME, DAYS
Figure 15. PlusRide - Wet and dry resilient moduli versus aging time.
41

The granite aggregate from Grayson, Ga was again used to replace the fine aggregate portion (minus #4 sieve) of both mixtures while maintaining the gradation by weight to determine the resistance to stripping. PlusRide increased the resistance to stripping although the mixture still stripped. The control mixture provided values of TSR = 31.1, MrR = 11.1, and visual stripping of 70 percent. The PlusRide mixture provided values of TSR = 70.7, MrR = 51.8, and visual stripping of 30 percent. The PlusRide specimens swelled less during moisture conditioning as the average swell by volume was 2.0 percent compared to 7.3 percent for the control specimens. The ability to resist swelling during the 24-hour, 140 DF (60 DC) soak apparently in
creased the resistance to moisture damage in this mixture. This increased resistance to swelling is probably related to the rubber and not to the increase in asphalt content, but this is speculative.
3. Resistance to Rutting
a. Creep Test
Creep moduli and permanent strains are presented in table 15. PlusRide, temperature and creep time had a significant effect on both properties. PlusRide decreased the creep modulus and increased the permanent strain at all temperatures and creep times. These effects are in agreement with the findings in table 13 from the creep tests performed under the aging study.
b. Repeated Load Test
The dynamic moduli at the 200th cycle and test temperatures of 65, 77, and 104 DF (18.3, 25, and 40 DC) for the control mixture were 1,010,000, 439,000
and 165,000 psi (7.0, 3.0, and 1.1 E+09 Pal respectively, while for the PlusRide mixture they were 467,000, 218,000, and 72,000 psi (3.2, 1.5, and 0.5 E+09 Pal. (These data are not shown in a table.) Again, PlusRide caused a reduction in modulus at all temperatures.
Permanent strains versus the number of cycles at 65, 77 and 104 DF (18.3,
25, and 40 DC) are presented in table 16. PlusRide, temperature, and cycles
had a significant effect on permanent strain. PlusRide increased the amount
42

Table 15. Resistance to rutting - creep test results.
Contro 1 Pl usRide
Creep Time Temperature Temperature
(sec) 65 of 77 of 104 of 65 of 77 of 104 of
Creep Modulus (ksi) Creep Modulus (ksi)
0.10 667 297 67 286 100 26
0.30 395 168 51 148 52 14
1.0 203 97 46 73 28 9
3.0 116 66 48 36 20 7
10.0 82 51 45 19 20 7
30.0 53 46 14
100.0 44 42
1000.0 34 37
Permanent Deformation Permanent Deformation
(microinches) (microinches)
0.10 19 124 535 65 167 386
0.30 56 223 733 109 540 1561
1.0 145 429 1002 414 1141 3362
3.0 283 626 1042 968 1879 6592
10.0 506 870 999 2168 2601 12503
30.0 628 981 3040
100.0 920 1163
1000.0 1619 1765
(ksi}(6895) = (KPa) (in) (2.54}=(cm) (OF _ 32}/1.8 = °C
43

Table 16. Resistance to rutting - repeated load test results.
Control Pl usRi de
number of Temperature Temperature
cycles 65 of 77 of 104 of 65 of 77 of 104 of
Permanent Deformation Permanent Deformation
(microinches) (microinches)
I 18 68 291 66 177 1644
3 36 138 496 134 376 3885
10 73 253 885 322 835 8343
30 ll5 379 1630 630 1562 10670
100 154 543 3244 ll28 2620 14453
200 177 667 4628 1487 3524 17765
300 185 754 5455 1617 4084 22239
400 194 835 6204 1692 4426 24769
500 198 910 6722 1760 4908 26627
600 201 976 6998 1826 5112 28857
1000 209 ll97 2079 6219
3000 235 2080 2681 8000
7000 285 3804 2994 105ll
10000 300 3143
20000 373 4055
30000 415 4451
40000 657 4881
50000 692 5552
( i n)( 2 . 54) = ( cm) (OF _ 32)/1.8 = DC
44

of permanent strain at all temperatures and cycles. This indicated an increased susceptibility to rutting, which was consistent with the results of the other tests.
4. Resistance to low Temperature Cracking
Resilient moduli and tensile strengths versus temperature are presented in table 17 and figures 16 and 17. The resilient modulus test produced a shift of -17 of (-9.4 DC) at the 3000 ksi (20.7 E+09 Pa) reference modulus for the PlusRide mixture compared to the control. The tensile strength test produced a shift of -14 of (-7.8 DC) at 300 psi (2.1 E+06 Pa). The PlusRide mixture
produced lower moduli and tensile strengths at all temperatures and thus was more resistant to low temperature cracking.
5. Extraction and Recovery
Extraction results are shown in table 18. The control mixture was slightly deficient in minus #200 sieve material. This indicated that possibly some error occurred when either batching the aggregates or when determining the gradations of the raw aggregates. The PlusRide mixture had less material on the sizes below the #30 sieve. This was probably due to agglomerations caused by the rubber, but the cause was not investigated. As with the Verglimit mixture, it may be difficult to apply conventional quality assurance gradation checks.
The asphalt content of the PlusRide mixture was approximately 0.26 percent high, and the recovered binder was softer than the original binder. Both of these indicate that the binder contained rubber. It was concluded that most of the rubber remained with the aggregate but a portion was in the binder. Some of the rubber particles in the aggregate should also contain absorbed asphalt, but the amount could not be measured. Because the rubber in the mixture and in the extracted solution may be altered by the heat and solvents used in the extraction and recovery processes, the recovered binder properties in table 18 are probably not the true binder properties.
45

Table 17. Resistance to low temperature cracking.
Temperature
of Control PlusRide Control PlusRide
Resilient Modulus (ksi) Tensile Strength (psi)
-30 6830 4680 552 379
-15 6990 4950 534 359
0 5830 5430 546 344
10 6350 3890 521 336
32 2910 1730 297 174
41 2070 1120 201 121
65 578 268 69 30
77 278 170 35 14
90 110 64 16 11
(ksi)(6895) = (KPa) (psi )(6895) ( Pal (OF - 32)/1.8 = °c
46

(f) 0..
:c b z W 0::: f(f)
W -1 (f)
Z W f-
(f) ~
(f)
::J -1 ::J 0 0 :::2 f-Z w ::.J (f) w 0:::
1000r---------------------------------------~
300
100
o~--~o--__ ~~
--~---'----.--~,
0-0 CONTROL ID-ID PLUSRIDE
O~o (psi)(6895) = (Pa) ID", ~o {"F - 32)/1. 8 = 'c '"
10L---~----L-~~ __ L_~ __ ~ ____ ~L_~~ -40 -20 o 20 40 60 80
TEMPERATURE. of
Figure 16. PlusRide - Tensile strength versus temperature for evaluating low temperature cracking.
lE4 0 o-oCONTROL
3000 .-ID PLUSRIDE -------------
.~ 1000
o~ -14°F
~o~ ID~O 100
• (ksi)(6895) = (KPa)
('F - 32)/1.8 = 'c 10
-40 -20 0 20 40 60 80
TEMPERATURE. OF
Figure 17. PlusRide - Resilient modulus versus temperature for evaluating low temperature cracking.
47
100
100
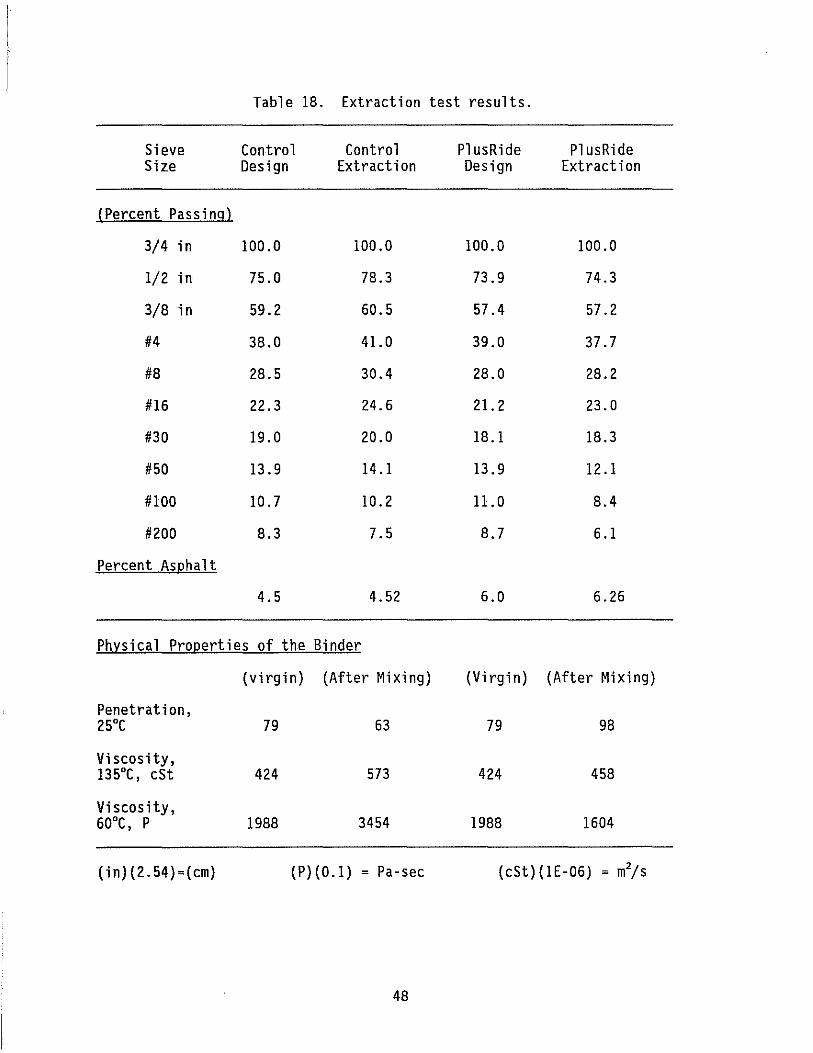
Table 18. Extraction test results.
Sieve Contra 1 Control Pl usRi de PlusRide Size Design Extraction Design Extraction
(Percent Passing)
3/4 in 100.0 100.0 100.0 100.0
1/2 in 75.0 78.3 73.9 74.3
3/8 in 59.2 60.5 57.4 57.2
#4 38.0 41.0 39.0 37.7
#8 28.5 30.4 28.0 28.2
#16 22.3 24.6 21. 2 23.0
#30 19.0 20.0 18.1 18.3
#50 13 .9 14.1 13.9 12.1
#100 10.7 10.2 11.0 8.4
#200 8.3 7.5 8.7 6.1
Percent Asphalt
4.5 4.52 6.0 6.26
Physical Properties of the Binder
(virgin) (After Mixing) (Virgin) (After Mixing)
Penetration, 25°C 79 63 79 98
Vi scos ity, 135°C, cSt 424 573 424 458
Viscosity, 60°C, P 1988 3454 1988 1604
(i n)(2. 54) =( cm) (P)(O.l) = Pa-sec (cSt)(lE-06) = m2/s
48

6. Conclusions
• The PlusRide reduced the Marshall stability, creep moduli, and repeated load moduli, while it increased the flow and permanent deformations and strains. Thus there was an increased resistance to low temperature cracking and a decreased resistance to rutting. These effects were directly related to the rubber and the associated 1.5 percent increase in asphalt content. It was hypothesized that the large rubber particles caused the mixture to resist densification under the Marshall hammer. The asphalt content had to be higher in order to meet the air void requirements.
• In one mixture, PlusRide decreased the amount of stripping, although the PlusRide mixture still stripped. There was a decrease in the amount of swelling of the specimens during the conditioning process compared to the control mixture. With another aggregate, neither the PlusRide nor the control mixtures stripped. However, the PlusRide mixture provided lower retained ratios compared to the control. There was an increase in the amount of swelling during the conditioning process compared to the control mixture. (The variable effect on swelling was not investigated.)
• PlusRide specimens developed hairline cracks by 90 days of aging at 77 of
(25°C). How this relates to field performance is unknown. The rubber particles on the outer edges of the specimens also began to stick out. This swelling of the rubber particles was attributed to the absorption of asphalt hydrocarbons.
o Extraction tests showed a decrease in the amount of material passing the #30 sieve size for the PlusRide mixture compared to the raw materials. This was probably due to agglomerations caused by the rubber. As with the Verglimit mixture, it may be difficult to apply conventional quality assurance gradation checks using extractions methods.
• The recovered binder was soft and the extracted asphalt content was high. This indicated that the binder contained rubber. It was concluded that most of the rubber remained with the aggregate, but a portion was in the
49
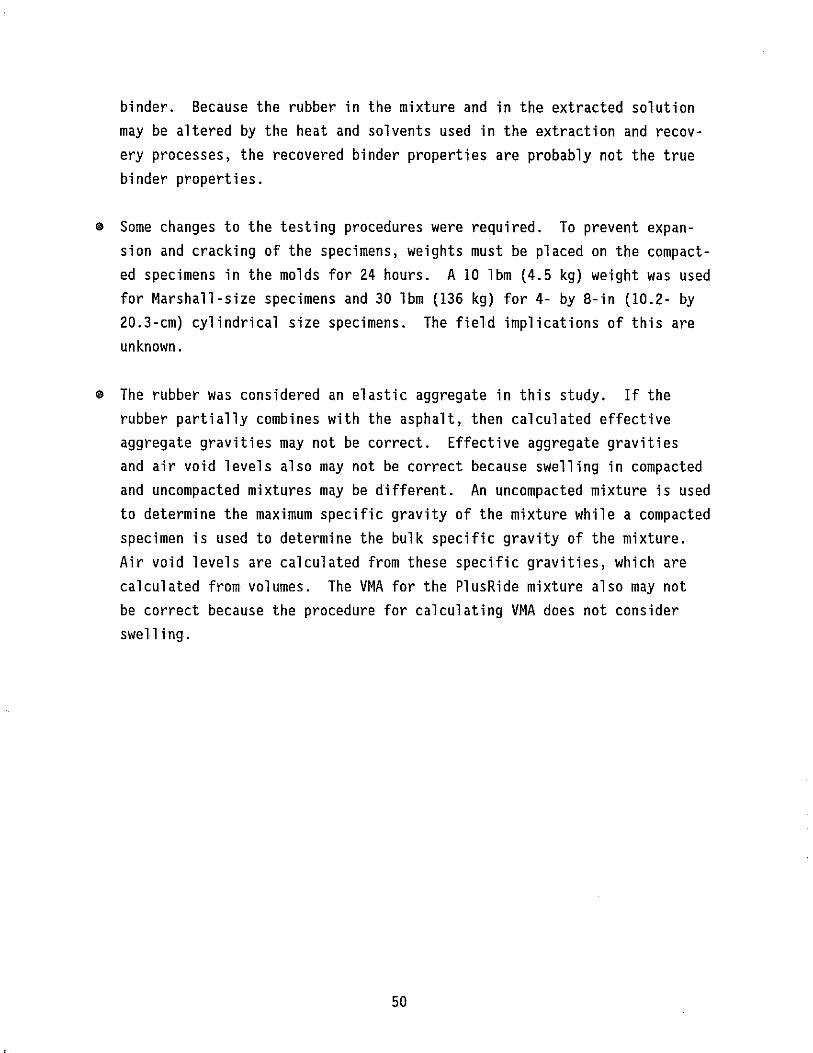
binder. Because the rubber in the mixture and in the extracted solution may be altered by the heat and solvents used in the extraction and recovery processes, the recovered binder properties are probably not the true binder properties.
• Some changes to the testing procedures were required. To prevent expansion and cracking of the specimens, weights must be placed on the compacted specimens in the molds for 24 hours. A 10 lbm (4.5 kg) weight was used for Marshall-size specimens and 30 lbm (136 kg) for 4- by 8-in (10.2- by 20.3-cm) cylindrical size specimens. The field implications of this are unknown .
• The rubber was considered an elastic aggregate in this study. If the rubber partially combines with the asphalt, then calculated effective aggregate gravities may not be correct. Effective aggregate gravities and air void levels also may not be correct because swelling in compacted and uncompacted mixtures may be different. An uncompacted mixture is used to determine the maximum specific gravity of the mixture while a compacted specimen is used to determine the bulk specific gravity of the mixture. Air void levels are calculated from these specific gravities, which are calculated from volumes. The VMA for the PlusRide mixture also may not be correct because the procedure for calculating VMA does not consider swelling.
50

CHAPTER 6: EVALUATION OF VERGLIMIT - PHASE II
Phase II of thi s study was used to verify the results of phase I by testing additional mixtures at a reduced testing level. Only one Verglimit mixture and one PlusRide mixture was tested in phase I. The test procedures used in phase I were analyzed in order to reduce the number of tests and the testing time. The test procedures themselves were also evaluated. The results are presented in appendix B. Based on the findings, it was decided the effects of aging would be determined visually. The indirect tensile test, resilient modulus test, and the percent visual stripping were used to evaluate the moisture susceptibility of the mixtures. For rutting, the repeated load test at 104 of (60°C) was used. For low temperature cracking, resilient
moduli versus temperature were determined.
1. Laboratory Mixture Design
The aggregate gradation and Marshall mixture design properties for the phase II Verglimit and Verglimit control mixtures are presented in table 19. Additional mixture design data are given in table 31 and figures 30, 31, and 32 of appendi x A. The asphalt was the same as used in phase 1. Asphalt properties are given in table 3. The aggregate consisted of 25 percent crushed Riverton Virginia limestone, 65 percent fine Riverton limestone, and 10 percent natural quartzite sand. The gradation was not the same as used in phase I. In this phase of the study, 5.5 percent Verglimit was again used.
The optimal asphalt contents for the two mixtures were both 5.3 percent. Both mixtures had similar Marshall stabilities and flows.
2. Effect of Aging
Within 28 days of curing, the Verglimit specimens swelled and started to develop hairline cracks due to absorption of moisture. The specimens also had a slippery feeling when handled. The cracks were not as wide as those in the Verglimit specimens tested under phase I. In phase I, the specimens eventually began to break apart. The specimens tested in this phase remained intact. A cause for this difference was not investigated.
51

Table 19. Phase II - Aggregate and mixture design properties for the Verglimit study.
Aggregate Gradation Mixture Design Properties
(Percent Passing) Control Verglimit
3/4 in 100.0
1/2 in 87.4 Asphalt Content, % 5.3 5.3
3/8 in 73.4 Theoretical Max SG 2.519 2.483
#4 50.4 Density, lbm/ft3 151.6 147.6
#8 32.7 Stability, lbf 1990 1990
#16 20.9 Flow, 0.01 in 10.2 8.9
#30 14.2 Air Voids, % 3.4 4.7
#50 9.3 VMA, % 13.8 13.9
#100 6.0 VFWA, % 75.0 66.0
#200 4.7 Design Blows 50 50
Without With Vergl imit Verglimit
Bulk Dry SG 2.669 Bulk Dry SG 2.601 Vergl imit SG 1.807 (Absorption is
Bulk SSD SG 2.697 Bulk SSD SG 2.626 assumed to be zero)
Apparent SG 2.744 Apparent SG 2.668
% Absorption 1.0 % Absorption 1.0
(in)(2.54)=(cm) (lbf)(4.448) = (N) (lbm/ft3 )(16.01) = Kg/m3
52

3. Resistance to Moisture Damage
Data from the moisture damage tests are given in table 20. As in phase I,
Verglimit again provided lower retained ratios, which were below suggested pass/fail criteria, and no visual stripping. A 70-percent criterion was used for the MrR and BO-percent for TSR. The low ratios were attributed to the specimens swelling during the 24-hour, 140 of (60 DC) water soaking process.
The dry tensile strengths of the two mixtures were equal but the Verglimit mixture significantly increased the dry resilient modulus. An antistripping additive was not used in the mixtures and the aggregate reportedly has a low susceptibility to stripping.
4. Resistance to Rutting
The dynamic modulus at the 200th repetition and a test temperature of 104 of (40 DC) for the control mixture was 305,000 psi (2.1 E+09 Pa), while
for the Verglimit mixture it was 494,000 psi (3.4 E+09 Pa). Verglimit increased the stiffness of the mixture.
Permanent strains versus the number of repetitions are presented in table 21. Verglimit reduced the amount of permanent strain 104 of (40 DC) and
therefore the susceptibility to rutting.
5. Resistance to Low Temperature Cracking
Resilient moduli versus temperature are presented in table 22 and figure 18. The resilient modulus test produced a shift of -2.5 of (-1.4 DC) at the
3000 ksi (20.7 E+09 Pa) reference modulus for the Verglimit mixture relative to the control. Overall, both mixtures would be expected to behave similarly in the field with regard to low temperature performance. Verglimit only significantly affected the properties at high temperatures for this mixture.
53

Table 20. Phase II - Moisture damage test results for Verglimit.
Contro 1 Verglimit
Dry Tensile Strength, psi 62.9 67.4 Wet Tensile Strength, psi 50.3 35.0
St Retained Ratio, percent 80.0 51.9
Dry Resilient Modulus, ksi 120.3 162.1 Wet Resil ient Modulus, ksi 97.9 73.4
Mr Retained Ratio, percent 81.4 45.3
Vi sua 1 Stripping, percent 7.5 0
Swe 11, percent by vo 1 ume 0 1. 3
(ksi)(6895) = (KPa) (psi)(6895) = (Pa)
54

Tabl e 21. Phase II - Resistance to rutting at 104 of (40°C) for Vergl imit.
number of Vergl ;mit cycles Control Vergl ;m;t
Permanent Strain (m;cro;nches)
1 130 68
3 255 123
10 541 253
30 959 441
100 1558 698
200 1987 864
300 2278 980
400 2507 1045
500 2694 1089
600 2851 1140
1000 3336 1258
3000 4580 1613
7000 2111
10000 2418
(;n)(2.54) = (cm) (OF - 32)/1.8 = °C
55

Table 22. Phase II - Resistance to low temperature cracking for Verglimit.
Temperature, of Control Vergl imit
Resilient Modulus (ksi)
-25 5681 5420
-15 5112 5092
0 4914 4652
10 3708 3954
32 2666 3001
41 1619 1952
65 424 605
77 217 442
90 89 202
104 37 116
(ksi)(6895) = (KPa) (OF - 32)/1.8 = °C
56

6. Conclusions
• Verglimit reduced the temperature susceptibility of the mixture. This supported the findings of phase I. However, with this mixture, the effect was only significant at the higher temperatures. Verglimit provided Marshall stabilities and flows similar to the control.
• Verglimit increased the moisture susceptibility of the mixture. The particles absorbed moisture and the specimens swelled. Even though this produced low retained resilient modulus and tensile strength ratios, the Verglimit caused a significant reduction in visual stripping. The mechanism for this reduction is unknown.
• Dry specimens also swelled and cracked within 28 days of aging at 77 of
(25°C). How this relates to field performance is unknown.
1E4~----------------------------------~
iii 3000 ~
vi :::l 1000 ..J :::l o o ::E IZ L&J 100 ::i iii L&J Q.:
10
-2.5 OF
(ksi)(689S) = (KPa)
('F - 32)/1.8 = 'c
-40 -20 o 20 40 60
TEMPERATURE. OF'
0-0 CONTROL I!I - I!I VERGUMIT
80 100 120
Figure 18. Phase II - Resilient modulus versus temperature for evaluating the low temperature cracking properties of Verglimit.
57

CHAPTER 7: EVALUATION OF PLUSRIDE - PHASE II
1. Laboratory Mixture Design
The gradations and Marshall mixture design properties for the phase II P1usRide and P1usRide control mixtures are presented in table 23. The gradation in table 23 for the P1usRide mixture includes the rubber. Additional mixture design data are given in table 32 and figures 33, 34 and 35 of appendix A. The asphalt was the same as used in phase I. Asphalt properties are given in table 3. The aggregate was a blend of 35 percent crushed Riverton Virginia limestone, 55 percent fine Riverton limestone, and 10 percent natural quartzite sand. The gradation was very close to the one used in phase I, and is the average gradation specified by the supplier. In the control mixture, aggregate was again used in place of the rubber.
The optimal asphalt contents for the P1usRide and control mixtures were 5.5 and 4.0 percent respectively. As with the mixture tested under phase I, the following were found: (1) P1usRide increased the asphalt content by 1.5 percent, (2) the P1usRide mixture was visually dense after compaction and less coarse in appearance compared to the control, (3) the P1usRide mixture appeared rich in asphalt, (4) the P1usRide mixture had a lower stability and a very high flow, and (5) the control mixture had a low VMA but all aggregate particles were thoroughly coated. As stated in phase I, the effective specific gravity of the aggregate, VMA, and air voids for P1usRide mixtures may not be correct because the rubber may swell and react with the asphalt.
2. Effect of Aging
By 90 days of curing, the rubber particles on the outer edges of the specimens began to stick out. Unlike the mixture in phase I, no hairline cracks developed. A cause for this difference was not investigated.
3. Resistance to Moisture Damage
Data from the moisture damage tests are given in table 24. P1usRide decreased both retained ratios and both were below the suggested pass/fail criteria (70 percent for MrR and 80 percent for TSR). The control mixture
58

Table 23. Phase II - Aggregate and mixture design properties for the PlusRide study.
Aggregate Gradation, Percent Passing Mixture Design Properties
Control PlusRide"
3/4 in
1/2 in
3/B in
1/4 i nb
#4
#16
#20b
#30
#50
#100
#200
100.0
73.3
56.2
40.0
36.0
27.2
25.5
21.9
19.3
16.9
13.3
10.4
B.9
Bulk Dry SG 2.6BO
Bulk SSD SG 2.702
Apparent SG 2.741
% Absorption O.B
PlusRide SG 1.19
100.0
73.0
55.7
3B.6
34.4
27.2
25.7
22.3
19.7
17 .3
14.0
11.2
9.7
2.577
2.595
2.627
0.7
Control PlusRide
Asphalt Content, % 4.0
Theoretical Max SG 2.564
5.5
2.3B1
Density, 1 bm/ft3
Stabil i ty, 1 bf
Flow, 0.01 in
Air Voids, %
VMA, %
VFWA, %
Design Blows
155.2
2130
14.5
3.0
10.9
72.3
50
142.6
lOBO
>35.0
4.0
16.2
75.2
50
Rubber Gradation
1/4
#4
#10
100.0
97.6
36.2
#20 22.4
#30 20.4
#200 0.2
"Includes the 3 percent rubber. bSizes were added because the rubber specification used these sizes.
(in)(2.54)=(cm) (lbf)(4.44B) = (N) (lbm/ft3)(16.01) = Kg/m3
59

Table 24. Phase II - Moisture damage test results for PlusRide.
Dry Tensile Strength, psi Wet Tensile Strength, psi
S, Retained Ratio, percent
Dry Resilient Modulus, ksi Wet Resilient Modulus, ksi
Mr Retained Ratio, percent
Visual Stripping, percent
Swell, percent by volume
(ksi)(6895) = (KPa)
Control
72.9 55.9
76.7
174.2 120.8
69.3
5.0
0.1
(psi)(6895) = (Pa)
60
PlusRide
53.8 36.8
68.4
107.0 56.5
52.8
2.5
2.1

produced borderline, but failing, values. Visual stripping was very low in both mixtures. Both the dry and wet values of the PlusRide mixture were significantly lower than those of the control mixture. The PlusRide mixture swelled during the conditioning process. This may have contributed to the lower retained ratios. A cause for the difference in the amounts of swelling was not investigated.
4. Resistance to Rutting
Repeated load tests to determine the resistance to rutting were not performed. The reduction in Marshall stability and the increase in flow were greater in this mixture than in the mixture used in phase I. Based on the Marshall and low temperature cracking data, an increase in rutting would be expected.
5. Resistance to low Temperature Cracking
Resilient moduli versus temperature are presented in table 25 and figure 19. The resilient modulus test produced a shift of -10 of (-5.6 DC) at the
3000 ksi (20.7 E+09 Pal reference modulus for the PlusRide mixture compared to the control. The PlusRide mixture produced lower moduli at all temperatures and thus was more resistant to low temperature cracking but less resistant to rutting.
6. Marshall Hammer Versus Kneading Compaction
The data collected for the PlusRide mixtures under both phases I and II of this study indicated that the mixtures should be susceptible to rutting. However, the literature review and discussions with highway engineers indicated that the degree of rutting of PlusRide mixtures in pavements has generally not been excessive, and most rutting has occurred when the mixture was not adequately compacted. Although many PlusRide mixtures have been designed using the Marshall method and a 1.5 percent higher asphalt content is common, it was hypothesized that the Marshall hammer may not have been effective for compacting the mixtures in this study. In order to determine this, two Marshall mixture designs were performed on a mixture similar to the one used
61

Table 25. Phase II - Resistance to low temperature cracking for PlusRide.
Temperature, "F Control PlusRide
Resilient Modulus (ksi)
-25
-15
0
10
32
41
65
77
90
104
1E4
3000 .
1000 VI
:3 :;) o o :I!
~ La.I 100 :::i
6147
6212
5382
4837
3210
2154
585
359
136
55
II
iii La.I (ksi) (6895) = (KPa) 0:::
("F - 32)/1.8 = "C
5705
4226
4626
3484
3208
1372
319
182
71
21
-10 of
(ksi)(6895) = (KPa)
("F - 32)/1. 8 = "C
0-0 CONTROL II -.. PLUSRIDE
10~--~--~--~~~--~~--~--~--~
-40 -20 o 20 40 60 80 100 120
TEMPERATURE, OF' Figure 19. Phase II - Resilient modulus versus temperature for evaluating
the low temperature cracking properties of PlusRide.
62

in phase I. The 50-blow Marshall hammer was used in one design while the standardi zed kneadi ng compaction method was used in the other. (26.30) Although
a kneading compactor was used, the specimens were tested using the Marshall apparatus.
The gradation and Marshall mixture design properties for both mixtures are presented in table 26. The gradation includes the rubber. Additional mixture design data are given in tables 33 and 34 and figures 36, 37, and 38 of appendix A. The asphalt properties are given in table 3. The ALF binder layer aggregates and the gradation of phase I were used, but the 10 percent natural quartz sand was eliminated and replaced with traprock for convenience. New shipments of aggregates had been obtained which had slightly different gradations than those used in phase I. It would have been difficult to obtain exactly the same mixture used in phase I and therefore the sand was eliminated for convenience.
Optimal asphalt contents for the mixtures could not be obtained. The Marshall flows were greater than 35 at nearly all asphalt contents and peak stabilities were not obtained. A 3-percent air void level could not be obtained using Marshall hammer compaction. The mixture would not compact. The mixture compacted by the kneading compactor produced a slightly better air void versus asphalt content relationship, but the lack of smoothness of the void and density plots in figure 37 of appendix A indicates there was still a problem with compaction. Eliminating the la-percent natural quartz sand had a deleterious effect on the design.
The mixture designs were compared at a 5-percent air void level even though a 2- to 4-percent level is recommended. Data for both mixtures were available at this level. The kneading compactor provided a 0.4-percent lower asphalt content and may be a better method for compacting PlusRide mixtures. This would have to be verified through field studies. However, changing the method of compaction did not appear to be a solution to solving the problem of measuring excessive permanent deformations in the laboratory and having high Marsha 11 flows.
63

Table 26. Phase II - Aggregate and mixture design properties for the PlusRide mixtures compacted by the Marshall hammer and kneading compactor.
Aggregate Gradation
(Percent Passing)·
3/4 in 100.0
1/2 in
3/8 in
73.9
57.4
1/4 inb 39.0
#4
#16
#20b
#30
#50
#100
#200
35.6
28.0
26.3
21.2
19.8
18.1
13.9
11.0
8.7
Bulk Dry SG 2.712
Bulk SSD SG 2.777
Apparent SG 2.797
% Absorption 1.18
PlusRide SG 1.19
Mixture Design Properties
Marshall Kneading
Asphalt Content, % 5.5
Theoretical Max SG 2.516
5.1
2.527
Density, lbm/ft3
Stab il ity, 1 bf
Flow, 0.01 in
Air Voids, %
VMA, %
VFWA, %
Design Blows
149.2
>1500
>35.0
5.0
16.7
70.2
50
149.8
>1500
>35.0
5.0
16.0
67.8
Rubber Gradation
1/4
#4
#10
100.0
97.6
36.2
#20 22.4
#30 20.4
#200 0.2
·Includes the 3 percent rubber. bS izes were added because the rubber specification used these sizes.
( i n)( 2 . 54) = ( cm) (lbf)(4.448) = (N) (lbm/ft3 )(16.01) = Kg/m3
64

7. Alternate Design for PlusRide
For all compacted PlusRide mixtures, rubber particles on the outsides of specimens would swell and protrude over time. While some protrusion of particles is desirable because they flex under traffic to help prevent the formation of ice, it appeared that an excessive number of particles were protruding. Specimens prepared in phase I also cracked over time. It was hypothesized that the gradations of the mixtures were not open enough to accommodate the swelling rubber particles. If so, the gap in the aggregate gradation should be changed to reduce the susceptibility to rutting and losing particles from the surface of a pavement. The specified gradation limits or bands for rubber and aggregate used in the PlusRide mixture are given in table 27.
It was planned to increase the gap in the aggregate gradation to the maximum allowable, and redesign the mixture. However, the supply of coarse rubber was insufficient and more rubber had to be ordered. It was then learned the supplier no longer offered rubber for PlusRide and the rubber would have to be obtained from a new source. (Several suppliers may offer the rubber.) Both fine and coarse rubbers from the new source were obtained, but neither had the same gradation as the original materials. This meant that the rubbers had to be sieved and regraded before use. However, there was noticeably less rubber close to the 1/4-in (6.3-mm) sieve in the new coarse material, and no chopped fibers. There were also more buffings, or extremely elongated pieces, in the new rubber. Because of these differences in the rubbers, the testing plan was not carried out. Additional tests would have to be performed to determine whether the rubbers from the two sources give the same properties.
8. Conclusions
o PlusRide increased the resistance to low temperature cracking and decreased the resistance to rutting. PlusRide reduced the Marshall stability and increased the flow. This supported the findings of phase I .
• The PlusRide mixture provided lower retained ratios compared to the control. There was an increase in the amount of swelled during the moisture conditioning process compared to the control mixture.
65

• PlusRide specimens developed hairline cracks by 90 days of aging at 77 of
(25°C). How this relates to field performance is unknown.
• The degree of rutting of PlusRide mixtures in pavements has generally not been excessive, and most rutting has occurred when the mixture was not adequately compacted. Changing from the Marshall hammer method of compaction to the standardized kneading compaction method did not appear to be the solution to solving the problem of measuring excessive permanent deformations in the laboratory and having high Marshall flows. It was hypothesized that the gradations of the mixtures were not open enough to accommodate the swelling rubber. Rubber particles on the outsides of specimens would swell and protrude excessively over time. This was not evaluated in this study, but it is recommended for future research.
• The supply of rubber was depleted in this study and the same material could not be obtained. Changing the rubber could affect pavement performance. Therefore, a stricter or more descriptive specification may be needed for the rubber. The variability of the rubber used in various pavements is unknown.
Table 27. Phase II - Gradations for PlusRide materials.
Specified Aggregate Gradation
Limits for PlusRide™ 16, Percent Passing
by weight 1
3/4 in 100.0
3/8 in 50 62
1/4 in 30 - 44
#4
#10 20 - 32
#20
#30 12 - 23
#200 7 - 11
'This does not i ncl ude the rubber.
Specified Rubber Gradation
Limits, Percent Passing
by weight
100
76 - 100
28 - 42
16 - 24
66
Rubber Gradation used in this study,
Percent Passing by weight
100.0
97.6
36.2
22.4
20.4
0.2

CHAPTER 8: STRUCTURAL ANALYSIS USING VESYS-3AM
The objective of this part of the research was to predict and compare the performances of the four phase I mixtures using the VESYS-3AM computer program. The VESYS-3AM model is a structural analysis procedure which uses traffic, system geometry, climate, and the structural properties of the materials to predict rutting, fatigue cracking, and the present serviceability index (PSI). The structural design chosen for the analysis matched one of the FHWA ALF pavements. The four mixtures were analyzed to determine how they would perform if used in the surface layer of this pavement and loaded by the ALF machine. They are referred to as surface layer mixtures in this chapter. Sufficient test data were not available to analyze the phase II mixtures.
The pavements at the ALF site consisted of two lanes and four test sections per lane. 124) Performance, climate, and structural data for lane 2,
section 2 were used in the analysis because this section had been tested by the ALF machine and all of the necessary data were available. Performance data included measuring rut depths and total cracking. The Verglimit control mixture of phase I was the actual mixture used in the surface layer of this section. Both the specimens prepared in the laboratory using this mixture and pavement cores had similar air void levels. The inputs used for the VESYS-3AM model are given in table 28.
The structural properties needed for each layer using VESYS-3AM are the dynamic modulus and the permanent deformation versus number of cycles. 129)
Fatigue coefficients are also needed for bound layers. Unbound materials are generally tested at one temperature while bound material are tested at three temperatures.
The dynamic moduli and permanent deformations for the four surface layer mixtures were taken from the repeated load tests performed under phase I using the 4- by 8-in (10.2- by 20.3-cm) cylindrical specimens. The dynamic moduli for the binder layer were measured using the same procedures. The dynamic moduli for the subgrade and the crushed aggregate base were measured under another study.124) Tests were not performed to determine the permanent defor
mation properties of the subgrade and crushed aggregate base. The binder
67

Table 28. Inputs for the VESYS-3AM program.
1. Traffic
Tire pressure = 140 psi (0.97 MPa). Dual wheel load = 19,000 lbf (84,500 N). (Corresponds to a single-axle load of 38,000 lbf (169,000 N). Speed = 12 mph (19.3 kilometre/hr). Number of wheel passes = 578,142 over 107 days from 6/18/87 to 11/24/87.
2. System Geometry
2-in (5.1-cm) surface layer. 5-in (12.7-cm) binder layer. 12-in (30.5-cm) crushed aggregate base. Prepared subgrade.
3. Climate
Pavement temperatures ranged from 20 to 100 of (-6.7 to 37.8 DC).
Temperature, and the associated number of wheel passes, were divided in 22 segments or subclimates.
4. Material Properties
Subgrade modulus = 7 ksi (48 MPa) at 77 of (25 DC).
Crushed aggregate base modulus = 20 ksi (138 MPa) at 77 of (25 DC).
Binder layer modulus (E): log,o(E) = 6.964 - 0.017 (OF). Binder layer fatigue coefficients: K, = 0.3 x 10-" and K2 = 5. Surface layer: Dynamic moduli and permanent deformation versus cycles were taken from the laboratory test data collected in this study at 65, 77, and 104 of (18.3, 25, and 40 DC).
68

layer was tested but the data was eliminated when it was found that the VESYS-3AM analyses using this data would predict ruts greater than 1 in (2.54 cm) within 50,000 cycles of loading. This was not close to matching pavement performance. The rutting in the pavement section was not attributed to the subgrade or binder layers and thus the VESYS-3AM inputs for permanent deformation were assigned values which produced no rutting. The majority of the rutting in the pavement section occurred in the crushed aggregate base. VESYS-3AM permanent deformation inputs for this layer were found by trial and error so that the predicted rutting was close to the measured rutting.
The fatigue coefficients for the binder layer were measured by stresscontrolled beam fatigue tests performed at 77 DF (25 DC). The test procedure
is reported elsewhere. 129) Fatigue tests were not performed on the surface
layer mixtures. Cracking in the pavement section initiated in the binder layer. No cracking was associated with the surface layer mixture.
The predicted rut depth, area cracked, and the PSI from VESYS-3AM are shown in figures 20, 21, and 22. The initial PSI was 4.0 and a minimum acceptable level was set at 2.5. Analyses using all four mixtures produced the same amount of fatigue cracking after 200,000 axle passes. Although there are some differences before 200,000 cycles, the differences in the PSI in figure 22 were mainly a function of the amount of predicted rutting. This supported the field observation where cracking in the pavement section was associated with the binder layer. Based on the PSI, the mixtures ranked from best to worse as follows: (1) Verglimit and Verglimit control, (2) PlusRide control, and (3) PlusRide. The PSI for the Verglimit control mixture remained above the minimum level of 2.5 even though the pavement section failed.
Figure 23 shows the average measured rut depth in the ALF pavement section and the rut depth predicted by VESYS-3AM using the properties for the Verglimit control mixture. This mixture was used in the pavement. The actual and predicted amounts of rutting do not agree over the life of the pavement. A similar problem was found for the cracking data. These findings and the unreasonably high amount of predicted rutting for the PlusRide mixture, which averaged more than 3 in (7.6 cm), indicate that the VESYS-3AM model is not applicable for the materials and loads used in this study.
69

Cl W ~ u
c .-I f-a.. w Cl
f-:::J OC
Cl w f-u Cl w OC a..
« ....... OCN U '1:J « >w 0 OC g « ,....
Cl W OC a..
10.0
9.0
8.0
7.0
6.0
5.0
4.0
3.0
2.0
1.0
0.0 0
0-0 VERGLIMIT CONTROL MIXTURE 0-0 VERGLIMIT MIXTURE t::.-t::. PLUsRIDE CONTROL MIXTURE A-A PLUsRIDE MIXTURE
(in) (2.54) = (em)
100 200 300 400 500
THOUSANDS OF AXLE PASSES
Figure 20. Predicted rut depth using VESYS-3AM.
600
1200r-----------------------------------~
1100 1000 900 800 700 600 500 400 300 200 100
o o
:;t= if 0-0 VERGLIMIT CONTROL MIXTURE A 0-0 VERGLIMIT MIXTURE / t::.-A PLUsRIDE CONTROL MIXTURE /, A-A PLUS RIDE MIXTURE
t t::. (yd) (0.914) = (m)
100 200 300 400 500
THOUSANDS OF AXLE PASSES
Figure 21. Predicted area cracked using VESYS-3AM.
70
600
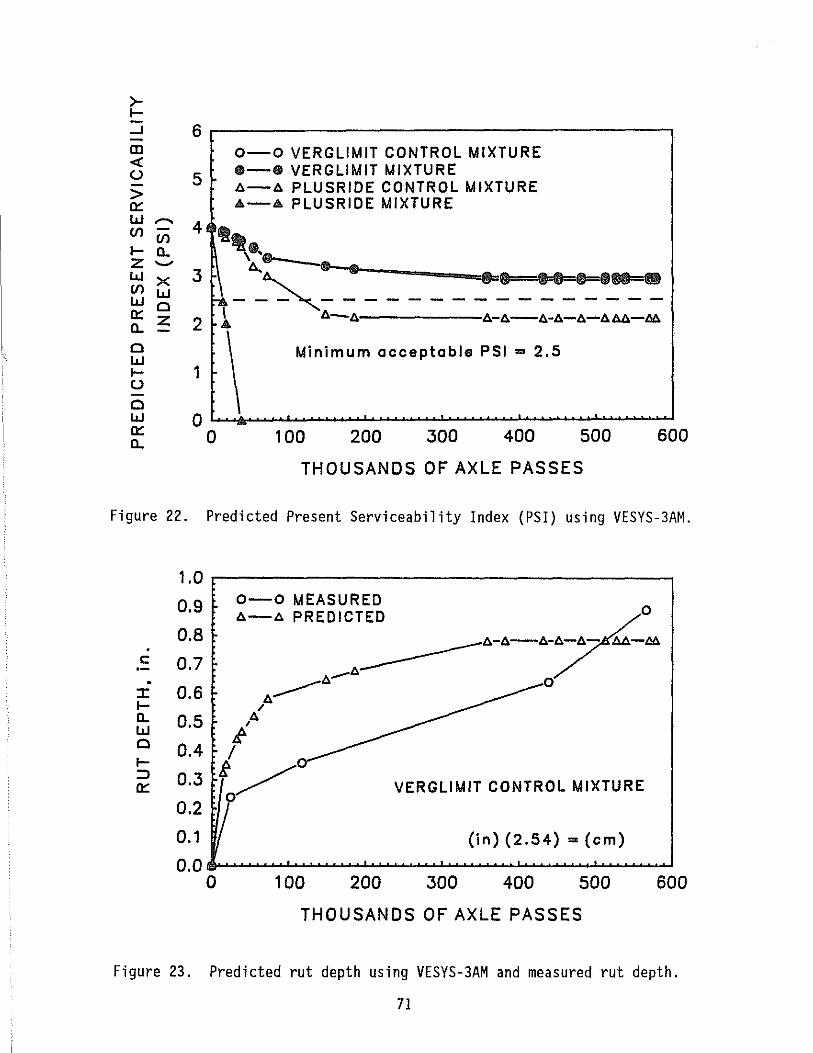
>-I-....J -II)
« u > a:: w ""' (f)
(f)
I- a.. z '-' w x (f) w w Cl a:: z a.. Cl W I-U -Cl w a:: a..
6 r-------------------------------------. 5
0-0 VERGLIMIT CONTROL MIXTURE Ell-@! VERGLIMIT MIXTURE 1:>.-1:>. PLUSRIDE CONTROL MIXTURE A--A PLUSRIDE MIXTURE
4 'It ~.~~~-.-.--------
3 ~_~~@I @I _____ ~~_~~,~_~ 2 l 1:>.-1:>. 1:>.-1:>.-1:>.-I:>.-A-I:>.A.l>.-tJA
Minimum acceptable PSI ... 2.5 1
600
THOUSANDS OF AXLE PASSES
Figure 22. Predicted Present Serviceability Index (PSI) using VESYS-3AM.
1.0
0.9
O.B . c: 0.7 .-.
:J: 0.6 I-a.. 0.5 w Cl 0.4 I-::J 0.3 a::
0.2
0.1
0.0 0
0-0 MEASURED A-I:>. PREDICTED ~O
A _______ A-I:>.-I:>.-A-I:>.- A.l>.-tJA
A- a 1:>.---it! / f/
100 200
VERGLIMIT CONTROL MIXTURE
(in) (2.54) '" (em)
300 400 500
THOUSANDS OF AXLE PASSES
600
Figure 23. Predicted rut depth using VESYS-3AM and measured rut depth.
71

CHAPTER 9: CONCLUSIONS AND RECOMMENDATIONS
1. Conclusions - Verglimit
• Verglimit reduced the temperature susceptibility of the mixtures as measured by the creep moduli, repeated load moduli, and permanent deformations and strains. The effects were slight below 77 of (25°C). Verg
limit provided Marshall stabilities and flows similar to the control.
• Verglimit increased the moisture susceptibility of the mixtures. The Verglimit particles absorbed water and the specimens swelled. Even though this effect produced low retained tensile strength and resilient modulus ratios, Verglimit caused a significant reduction in visual stripping. The mechanism behind this reduction is unknown, but it was hypothesized that it was related to the calcium in the Verglimit.
• Specimens containing Verglimit stored in air at room temperature also swelled and cracked within 28 days of aging at 77 of (25°C). How this
relates to field performance is unknown, although it seems to explain why there have been reports of raveling in pavements.
• The Verglimit specimens had a slippery feeling when handled. (Problems with reduced pavement skid resistance immediately after placement have been reported.) This appeared to be mainly related to the calcium chloride particles forming a solution on the surfaces of the specimens after absorbing moisture. (However, a part of this effect could be related to the linseed oil coatings.)
• Because Verglimit particles crush, it may be difficult to check the gradation for quality assurance purposes. It is unknown if the amount of crushing found in the laboratory duplicates the amount of crushing under a roller in the field. The gradations may also change slightly over time because the Verglimit dissolves out of the mixture.
• Verglimit had no effect on the asphalt content or asphalt binder properties, although the asphalt content must be corrected for absorbed moisture
72

using ASTM D 1461 or AASHTO T 110.126.30) (The long-term effects of Verg
limit on asphalt binder properties were not evaluated.)
@ Some changes to the testing procedures were required. Verglimit is water soluble so the volumetric flask method of AASHTO T 209 and ASTM D 2041 or a volumeter must be used for determining the maximum specific gravity of the mixture.126.30) For determining bulk specific gravities, only a 1-
minute period of immersion in the water was used. To mix the materials, the unheated Verglimit particles were added after the asphalt cement and aggregate were mixed, and an additional 15 to 30 seconds of mixing was needed to ensure coating and a visually homogenous distribution.
2. Conclusions - PlusRide
@ PlusRide increased the resistance to low temperature cracking and decreased the resistance to rutting. PlusRide reduced the Marshall stability, creep and repeated load moduli, while it increased the flow and permanent deformations and strains. This was directly related to the rubber and the associated 1.5 percent increase in asphalt content. The increase in asphalt content was attributed to the rubber particles causing the mixture to compact less.
@ PlusRide can have a variable effect on moisture susceptibility. In some cases PlusRide may increase the retained tensile strength and resilient modulus ratios and decrease the amount of swelling. In other cases, it may decrease the retained ratios and increase the amount of swelling. A cause for the difference in the amounts of swelling was not investigated.
e Specimens containing PlusRide stored in air at room temperature developed hairline cracks by 90 days of aging at 77 of (25°C). How this relates to
field performance is unknown. The rubber particles on the outer edges of the specimens also began to stick out. This swelling of the rubber particles was attributed to the absorption of asphalt hydrocarbons.
e Extraction tests showed a decrease in the amount of material passing the #30 sieve size for the PlusRide mixture compared to the raw components.
73

This was probably due to agglomerations caused by the rubber, but the cause was not investigated. As with mixtures containing Verglimit, it may be difficult to check the gradation for quality assurance purposes.
• The recovered binder was soft and the extracted asphalt content was high. This indicated that the binder contained rubber. It was concluded that most of the rubber remained with the aggregate, but a portion was in the binder. Because the rubber in the mixture and in the extracted solution may be altered by the heat and solvents used in the extraction and recovery processes, the recovered binder properties are probably not the true binder properties.
• Some changes to the testing procedures were required. To prevent expansion and cracking of the specimens, weights must be placed on the compacted specimens for 24 hours while they are still in the molds. A 10-lbm (4.5-kg) weight was used for Marshall-size specimens and 30-lbm (136-kg) for 4- by 8-in (10.2- by 20.3-cm) cylindrical size specimens. The field implications of this are unknown.
• The rubber was considered an elastic aggregate in this study. If the rubber partially combines with the asphalt, then calculated effective aggregate gravities may not be correct. Effective aggregate gravities and air void levels also may not be correct because swelling and the volumes of the materials in compacted and uncompacted mixtures may be different. An uncompacted mixture is used to determine the maximum specific gravity of the mixture while a compacted specimen is used to determine the bulk specific gravity of the mixture. (Air void levels are calculated from specific gravities, which are calculated using volumes.) The VMA for the PlusRide mixture also may not be correct because the procedure for calculating VMA does not consider swelling.
3. Recommendations
• Mixtures containing either additive should be tested for moisture susceptibility and an antistripping agent used if necessary. However, this will not control the inherent swelling that occurs during moisture conditioning.
74
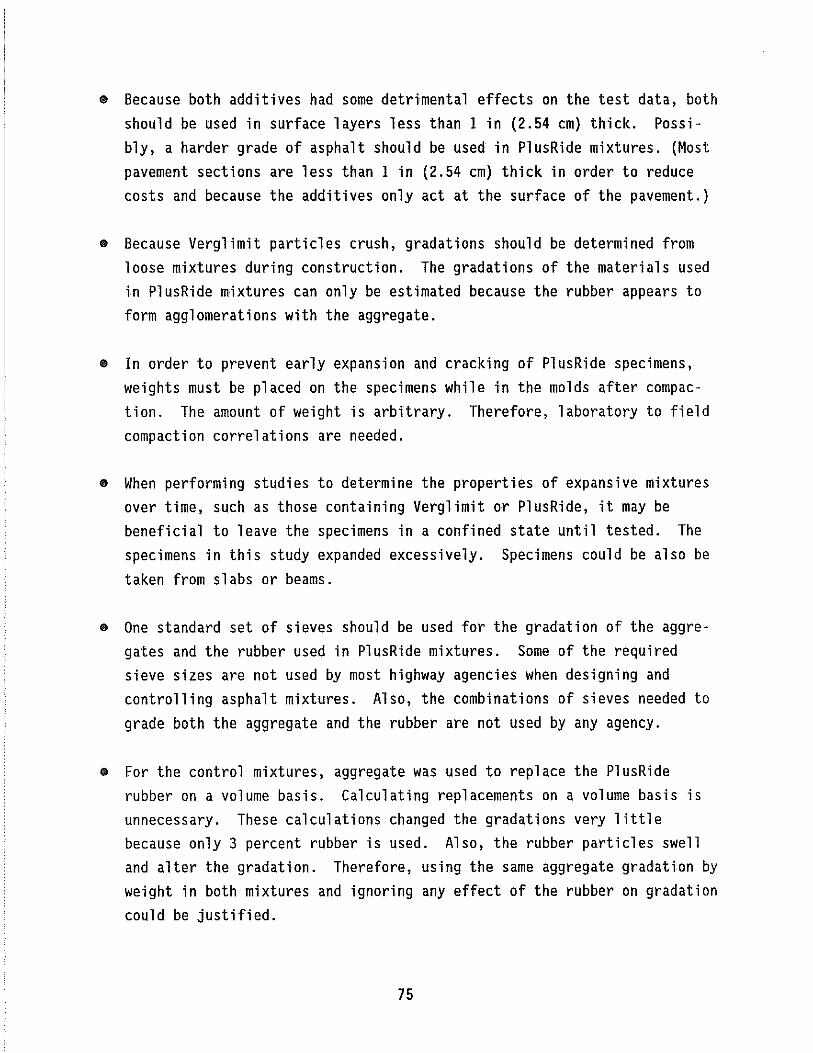
• Because both additives had some detrimental effects on the test data, both should be used in surface layers less than 1 in (2.54 cm) thick. Possibly, a harder grade of asphalt should be used in PlusRide mixtures. (Most pavement sections are less than 1 in (2.54 cm) thick in order to reduce costs and because the additives only act at the surface of the pavement.)
• Because Verglimit particles crush, gradations should be determined from loose mixtures during construction. The gradations of the materials used in PlusRide mixtures can only be estimated because the rubber appears to form agglomerations with the aggregate.
• In order to prevent early expansion and cracking of PlusRide specimens, weights must be placed on the specimens while in the molds after compaction. The amount of weight is arbitrary. Therefore, laboratory to field compaction correlations are needed.
• When performing studies to determine the properties of expansive mixtures over time, such as those containing Verglimit or PlusRide, it may be beneficial to leave the specimens in a confined state until tested. The specimens in this study expanded excessively. Specimens could be also be taken from slabs or beams.
• One standard set of sieves should be used for the gradation of the aggregates and the rubber used in PlusRide mixtures. Some of the required sieve sizes are not used by most highway agencies when designing and controlling asphalt mixtures. Also, the combinations of sieves needed to grade both the aggregate and the rubber are not used by any agency.
• For the control mixtures, aggregate was used to replace the PlusRide rubber on a volume basis. Calculating replacements on a volume basis is unnecessary. These calculations changed the gradations very little because only 3 percent rubber is used. Also, the rubber particles swell and alter the gradation. Therefore, using the same aggregate gradation by weight in both mixtures and ignoring any effect of the rubber on gradation could be justified.
75

• Rubber particles on the outsides of specimens would swell and protrude excessively over time. The gradation of the aggregate may need to be altered to reduce the number of protruding particles if there is an excessive loss of particles from pavements. (Discussions with highway engineers have indicated that there are some concerns over a loss of rubber from the surfaces of a pavements.)
• The supply of rubber was depleted in this study and the same material could not be obtained. It is hypothesized that changing the rubber could affect the performance of a pavement, but this was not studied. The current specification is a method specification. A stricter or more descriptive specification may be needed for the rubber to ensure consistency. The variability of the rubber used in various pavements is unknown.
• The literature review and discussions with highway engineers indicated that the degree of rutting of PlusRide mixtures in pavements has generally not been as excessive as the data in this study indicate it should be. This could be due to the thin pavement layers often used. Part of the discrepancy also could be related to differences in the physical properties of rubbers used. (Note that for thin pavements, the maximum aggregate size of 3/4 in (1.9 cm) used in this study must be reduced.)
• Both PlusRide and Verglimit are added by weight of the mixture which includes the additive. Because the unit weight of the mixture varies during the mixture design, the weight of the additives also varies from asphalt content to asphalt content. This makes the calculations for determining the weight of the additives tedious. It is recommended that an optimal asphalt content be assumed prior to the design and the additives be added by weight of the aggregate. The weight of the aggregate is constant and thus the weight of the additive will be constant. This is also logical because the additives are used to replace or act as aggregates. Also, the variations in the weights of the additives which now must be calculated are minor.
• The effect of calcium chloride on stripping or debonding should be further investigated. Even though Verglimit decreased the retained ratios, it
acted like an antistripping agent.
76

APPENDIX A: MIXTURE DESIGN PROPERTIES
Table 29. Mixture design properties for the Verglimit study - phase I.
Verglimit Control Mixture (Phase I)
Asphalt Content, percent by wt 4.5 5.0 5.5
Theoretical Maximum S.G. 2.618 2.597 2.576
Density, 1 bm/ft3 152.0 153.1 154.9
Stabil ity, 1 bf 2520 2520 2520
Flow, 0.01 in 9.0 9.7 10.0
Air Voids, percent 6.9 5.5 3.6
VMA, percent 15.2 15.0 14.5
VFWA, percent 54.3 63.4 75.0
Design Blows = 50
Verglimit Mixture (Phase I )
Asphalt Content, percent by wt 4.5 5.0 5.5
Theoretical Maximum S.G. 2.545 2.525 2.506
Density, lbm/ft3 148.0 148.2 148.7
Stabil i ty, lbf 2670 2630 2720
Flow, 0.01 in 8.5 9.0 9.2
Air Voids, percent 6.8 5.9 4.9
VMA, percent 15.1 15.4 15.6
VFWA, percent 55.0 61.7 68.6
Design Blows = 50
6.0 6.5
2.556 2.536
155.5 155.5
2440 2390
10.2 11.5
2.5 1.8
14.6 15.1
83.2 88.5
6.0 6.5
2.486 2.467
149.6 150.3
2760 2670
9.3 10.7
3.5 2.4
15.5 15.6
77.4 84.6
(in)(2.54)=(cm) (1 bf)( 4.448) (N) (lbm/ft3)(16.01) = Kg/m3
77

165..----------------------,
I'l 160
~ - 155
!i CI
~ 150 t: ~ 145
140~~~~--~-w~~~~~
3.5 4.0 4.5 5.0 5.5 6.0 6.5 7.0
ASPHALT PERCENT BY MIX WEIGHT
3000 ,...----------------,
2500 GI e o
li -: 2000
5 iii 1500 ~
1000 (lbf) (4.448) = (N)
500~~--~~~~~~~~~
3.5 4.0 4.5 5.0 5.5 0.0 6.5 7.0
ASPHALT PERCENT BY MIX WEIGHT
36.0,..------------...,
32.0
~ 28.0
~ 24.0 o
• 20.0
~ ... 16.0
12.0
(In) (2.54) - (em)
6.0 L ............. .S!::::!:::::~~J 3.5 4.0 4.5 5.0 5.5 6.0 0.5 7.0
ASPHALT PERCENT BY MIX WEIGHT
6.0 ....--------------------..,
7.0
6.0
5.0
4.0
3.0
2.0
1.0
0.0 ...... ~-~ ........ ~-.....~~ ....... --~ 3.5 4.0 4.5 5.0 5.5 6.0 6.5 7.0
ASPHALT PERCENT BY MIX WEIGHT
20.0 ..---------------------, 19.0 18.0
:5 17.0
15a. 16.0 15.0
$ 14.0 $! 13.0
12.0 11.0 10.0 ~ ........ - ...... -~~~ ........ ~--~
3.5 4.0 4.5 5.0 5.5 6.0 6.5 7.0
ASPHALT PERCENT BY MIX WEIGHT
100.0.-------------,
90.0
:5 ~ 60.0
i 70.0
60.0
50.0 ~~--.............. ~~~ ........ ~--...... 3.5 4.0 4.5 5.0 5.5 6.0 0.5 7.0
ASPHALT PERCENT BY MIX WEIGHT
Figure 24. Mixture design properties for the Verglimit control mixture - phase I.
78

165 B.O
7.0 I'l 160
~ ~ 6.0 ..Q
5.0 - 155
~ D..
IS 4.0
Ii! 150 9 -4)
3.0 III II 8 g
I: ~
II: 2.0 145 :if
(lbm/ft3) (18.01) .. K9/m3 1.0
140 0.0 3.5 4.0 4.5 5.0 5.5 6.0 6.5 7.0 3.5 4.0 4.5 5.0 5.5 6.0 6.5 7.0
ASPHALT PERCENT BY MIX WEIGHT ASPHALT PERCENT BY MIX WEIGHT
3000 20.0
0- Il Q b 19.0
6 2500 18.0 ... 15 17.0 .e
• 2000 (J 16.0
i 1500 ~ m iii II I}
15.0 &-
~ 14.0
iii 13.0 1000 12.0
(Ibt) (4.448) = (N) 11.0 500 10.0
3.5 4.0 4.5 5.0 5.5 6.0 6.5 7.0 3.5 4.0 4.5 5.0 5.5 6.0 6.5 7.0
ASPHALT PERCENT BY MIX WEIGHT ASPHALT PERCENT BY MIX WEIGHT
36.0 100.0 (In) (2.54) = (em)
32.0 90.0
s:: 28.0 15 u .5 ~ 24.0 Iii I!IO.O
~ D..
;Ii 20.0
i 70.0
~ 16.0 60.0
12.0 ..s 8.0 50.0
3.5 4.0 4.5 5.0 5.5 6.0 6.5 7.0 3.5 4.0 4.5 5.0 5.5 6.0 6.5 7.0
ASPHALT PERCENT BY MIX WEIGHT ASPHALT PERCENT BY MIX WEIGHT
Figure 25. Mixture design properties for the Verglimit mixture - phase I.
79

IX) a
Form PR_HI5 ([lc", 11-11'1)
GRADATION CHART
U.S. DEPARTM{NT Of TRANSPORTATION rEOERAt HIGHWAY ADMINISTRATION
100 HORIZONTAL SCALE REPRESENTS SIEVE SIZES RAISED TO TttE 0.45 POWER. "SIMPLIFIED PRACTiCe" SIZES INDICATED BY •
90
BO
70
(!)
z 60 Vi U) .. "-I- 50 z '" u ~ 40 "-
§"0 '\>
. >0"'> ~'y
~ 3;4 IN. liN. 1~4 IN
SIEVES NO. TOTAL NO.
~ % PASs.. RETAINED "T. % PASSING WT.
INO ON
30
verglimit and verglimit Control 20
(same gradation)
10
0 0 No.2 "" 50 30 i; a 4 3'SIN. ''lIN.
511 2°11 N,ao 40 20 10 6 ~4 IN
SIEVE SIZES
STATE PROJECT NO. TYPE CONSTj LOCATION ON PROJECT
TYPE, SOURCE. PRODUCER OF AGG.
SAMPLED FROM SAMPLED BY DATE QUANT. REPRESENTED SIEVED BY DATE SIEVE METHOD REMARKS
OWET
-'---- _DORY
Existing ltcch 01 PR-1l15 [Rev. lG-6JI will b~ used.
Figure 26. Gradations for the Verglimit study - phase I.
100
90
BO
70
60
,1'fIN.
TOTAL %
% PASSING

Table 30. Mixture design properties for the PlusRide study - phase I.
PlusRide Control Mixture (Phase I)
Asphalt Content, percent by wt 4.5 5.0 5.5
Theoretical Maximum S.G. 2.659 2.637 2.615
Density, lbm/ft 3 160.5 161. 4 161.4
Stability, lbf 2050 1980 1980
Flow, 0.01 in 10.5 12.0 12.5
Air Voids, percent 3.3 2.0 1.1
VMA, percent 12.0 12.0 12.4
VFWA, percent 72.6 83.8 91.1
Design Blows = 50
PlusRide Mixture (Phase Il
Asphalt Content, percent by wt 5.0 5.5 6.0
Theoretical Maximum S.G. 2.532 2.509 2.488
Density, lbm/ft 3 149.9 150.8 150.5
Stabil ity, lbf 1470 1460 1320
Flow, 0.01 in 28.0 25.0 27.8
Air Voids, percent 5.1 3.7 3.1
VMA, percent 15.0 15.0 15.6
VFWA, percent 66.0 75.4 80.3
Design Blows = 50
6.0 6.5
2.594 2.573
161.0 159.9
1840 1470
13.8 19.2
O.S 0.4
13 .1 14.2
95.9 97.1
6.5 7.0
2.469 2.446
150.6 148.6
1310 1120
33.8 34.3
2.2 2.6
16.0 17.6
86.1 85.1
(in)(2.S4)=(cm) (lbf)(4.448) (N) (lbm/ft3 )(16.01) = Kg/m3
81

165r------------------------,
/I I'l 160 .( .a - 155 !i CJ ~ 150 I: ~ 145
140~~~~~~~~~w-~~ ... 3.5 4.0 4.5 5.0 5.5 6.0 6.5 7.0
ASPHALT PERCENT BY MIX WEIGHT
3000 ...------------------------,
2500
;g • 2000
5 iii 1500 ~
1000 (Ibt) (4.448) - (N)
500~~~~~~~~~~~~
3.5 4.0 4.5 5.0 5.5 6.0 6.5 7.0 ASPHALT PERCENT BY MIX WEIGHT
36.0 r------------------------, 32.0
-5 28.0 .E Ci 24.0 o • 20.0
31: 9 ... 16.0
12.0
(In) (2.54) - (em)
o
8.0 .............. ~~~ ...... ~ ................................ ~ ...... 3.5 4.0 4.5 5.0 5.5 6.0 6.5 7.0
ASPHALT PERCENT BY MIX WEIGHT
8.0 r------------, 7.0
6.0
5.0
4.0
3.0
2.0
1.0
0.0 L ............................. ~ ........ ~:::!........J 3.5 4.0 4.5 5.0 5.5 6.0 6.5 7.0
ASPHALT PERCENT BY MIX WEIGHT
20.0 r------------------------, 19.0 18.0
~ 17.0
lrJo.fi1 18.0 15.0
S 14.0 ~ 13.0
12.0 11.0 10.0 ...... ~~ ......... ~ ........ ~"'_~w_~~ ...
3.5 4.0 4.5 5.0 5.5 6.0 6.5 7.0 ASPHALT PERCENT BY MIX WEIGHT
100.0 ...-----------------------,
90.0
~ ffi 80.0 0.
~ 70.0
60.0
50.0 ............ ~~~~~~~w_~~ ... 3.5 4.0 4.5 5.0 5.5 6.0 6.5 7.0
ASPHALT PERCENT BY MIX WEIGHT
Figure 27. Mixture design properties for the PlusRide control mixture - phase I.
82

lB5r---------------------~
.., 160
~ - 155
~ i 150 t: ~ 145
140w-~~~--~~~~--~-w
3.5 4.0 4.5 5.0 5.5 B.O 6.5 7.0 ASPHALT PERCENT BY MIX WEIGHT
3000..,----------------,
2500
li -: 2000
5 Iii 1500 ~
1000 (lbf) (4.448) - (N)
500~~~~~~~--~-w~~
3.5 4.0 4.5 5.0 5.5 B.O 6.5 7.0 ASPHALT PERCENT BY MIX WEIGHT
36.0....--------------,
32.0
-5 28.0 .5 o 24.0 o
• 20.0
~ lB.O
12.0
o
o 0
o
(In) (2.54) - (em) 8.0 '--....... -~ ......... '---'-'--............. -~
3.5 4.0 4.5 5.0 5.5 6.0 6.5 7.0 ASPHALT PERCENT BY MIX WEIGHT
8.0...-------------.,
7.0
B.O
5.0
4.0
3.0
2.0
1.0 0.0 '--..... __ .w... __ ................ _ ...... __ ~_w
3.5 4.0 4.5 5.0 5.5 B.O 6.5 7.0 ASPHALT PERCENT BY MIX WEIGHT
20.0.---------------, 19.0 18.0
~ 17.0
150. 16.0 15.0
S 14.0 ~ 13.0
12.0 11.0 10.0 ~~--~--................ ~ ........ --~ .........
3.5 4.0 4.5 5.0 5.5 6.0 6.5 7.0 ASPHALT PERCENT BY MIX WEIGHT
100.0...-------------,
90.0
I 80.0
~ 70.0
80.0
50.0 ~ ....... ~~ ................. -.....--~ ...... -~ 3.5 4.0 4.5 5.0 5.5 6.0 6.5 7.0
ASPHALT PERCENT BY MIX WEIGHT
Figure 28. Mixture design properties for the PlusRide mixture - phase I.
83

CO ...
Fonn PR-1115 (lte",II_W)
GRADATION CHART
u.s. OEPARTM[tH or TRANSPORTATION F(OERAL HIGHWAY ADMltHSTRATION
100 HORIZONTAL SCALE REPRESENTS SIEVE SIZES RAISED TO TttE 0.45 POWER. "SIMPLIFIED PRACTICe" SIZES INDICATED BY •
90
80
70
to Z 60 Ui
'" « "->- 50 z W Q
~ 40 "-
(y ~e .;7
c? ~d 0
~ #.~ 3;4 IN. liN. 1~4 IN ~ q,y.::r tY
SIEVES NO. TOTAL NO. ~ 7 q,y.::r % PASS- RETAINED WT. 7, PASSING WT. 'NG ON
30
20
10
0 0 .... ,00 iOO " 30 ;; 8 4 3,,, ...
'21N
SIEVE SIZES
STATE PROJECT NO. TYPE CONST; LOCATION ON PROJECT
TYPE. SOURCE, PRODUCER OF AGG.
SAMPLED FROM SAMPLED BY DATE QUANT. REPRESENTED SIEVED BY DATE SIEVE METHOD REMARKS
OWET
DORY
Exi,ting .Iocks of PR-1115 IlIl!v. 11)....63J will be u.ed.
Figure 29. Gradations for the PlusRide study - phase I.
100
90
80
70
60
j "2 IN.
TOTAL %
% PASSING

Table 31. Mixture design properties for the Verglimit study - phase II.
Verglimit Control Mixture (Phase III
Asphalt Content, percent by wt 4.5 5.0 5.5
Theoretical Maximum S.G. 2.551 2.531 2.506
Density, 1 bm/ft 3 150.4 151. 2 151. 9
Stabil ity, lbf 1930 1910 2010
Flow, 0.01 in 9.7 9.8 10.7
Air Voids, percent 5.5 4.3 2.8
VMA, percent 13.8 13.8 13.8
VFWA, percent 59.9 69.0 79.6
Design Blows = 50
Verglimit Mixture (Phase II)
Asphalt Content, percent by wt 4.5 5.0 5.5
Theoretical Maximum S.G. 2.513 2.494 2.475
Density, lbm/ft 3 146.5 147.1 147.9
Stabil ity, lbf 2140 2000 1990
Flow, 0.01 in 8.8 8.8 9.0
Air Voids, percent 6.6 5.5 4.2
VMA, percent 13.8 13.9 13.9
VFWA, percent 52.2 60.7 69.7
Design Blows = 50
6.0 6.5
2.494 2.475
152.7 152.6
2060 1820
11. 2 14.2
1.9 1.2
13.2 14.3
85.6 91.8
6.0 6.5
2.457 2.439
148.1 147.9
1970 1860
10.7 12.7
3.4 2.8
14.3 14.8
75.9 88.8
(in)(2.54)=(cm) (1 bf)( 4.448) (N) (lbm/ft 3 )(16.01) = Kg/m3
85

165,----------------------,
.... 160
~ - 155 !i i 150 I: !S 145
9 EI
140~~~~~~~~--~~~~
3.5 4.0 4.5 5.0 5.5 6.0 6.5 7.0 ASPHALT PERCENT BY MIX WEIGHT
3000 ,..------------------...,
2500
;g • 2000 o
5 iii 1500 ~
1000 (lbf) (4.4411) - (N)
500~~--~~~~~~~~~
3.5 4.0 4.5 5.0 5.5 6.0 6.5 7.0 ASPHALT PERCENT BY MIX WEIGHT
36.0 ,----------------------,
32.0 (In) (2.54) - (em)
'5 28.0 .5 o 24.0 ci • 20.0
~ 16.0
12.0
8.0 I......~ __ ~~~ ...... ~ ................ ~...J
3.5 4.0 4.5 5.0 5.5 6.0 6.5 7.0 ASPHALT PERCENT BY MIX WEIGHT
8.0,--------------...,
7.0
6.0
5.0
4.0
3.0
2.0
1.0
0.0 '--....... ~ .............. ~-'-"~"'--....... ~~ 3.5 4.0 4.5 5.0 5.5 6.0 6.5 7.0
ASPHALT PERCENT BY MIX WEIGHT
20.0 r------------------, 19.0 18.0
:s 17.0 " 16.0 ~ 15.0 S 14.0 ~ 13.0
o CI- _ -0-
o
12.0 11.0 10.0 ............ ~.w...~ ............... ~ ........ ~ ......... ......J
3.5 4.0 4.5 5.0 5.5 6.0 6.5 7.0 ASPHALT PERCENT BY MIX WEIGHT
100.0 r----------------------,
90.0 o
~ UI 80.0 Q.
~ 70.0
60.0
50.0 ............ _.w...~ ............... ~ ........ ~ ......... ......J
3.5 4.0 4.5 5.0 5.5 6.0 6.5 7.0 ASPHALT PERCENT BY MIX WEIGHT
Figure 30. Mixture design properties for the Verglimit control mixture - phase II.
86

165r------------------~
n 160
~ J:I - 155
!i " ~ 150
!f :::I 145
III
140 ............... ~ ....... ~ ....... _...~ ........ _ ......... ........J
;s
3.5 4.0 4.5 5.0 5.5 6.0 6.5 7.0
ASPHALT PERCENT BY MIX WEIGHT
3000 r---------------,
2500
• 2000
5 !i! 1500 Iii
1000 (lbl) (4.448) - (N)
500~~-~~~-w~~~--~
3.5 4.0 4.5 5.0 5.5 6.0 6.5 7.0
ASPHALT PERCENT BY MIX WEIGHT
36.0....---------------,
32.0
ii 28.0 .5 .- 24.0 ~ • 20.0
~ 16.0
12.0
(In) (2.54) - (em)
B.O L-"""--..!2;=2=::~:.......~ ........... ....J 3.5 4.0 4.5 5.0 5.5 6.0 6.5 7.0
ASPHALT PERCENT BY MIX WEIGHT
B.O ....---------------,
7.0
6.0
5.0
4.0
3.0
2.0
1.0
0.0 r...-....... _ ................................ ~~ ....... _...J 3.5 4.0 4.5 5.0 5.5 6.0 6.5 7.0
ASPHALT PERCENT BY MIX WEIGHT
20.0....----------------...,
19.0 16.0
~ 17.0 (J 16.0
~ 15.0
$. 14.0 $! 13.0
12.0 11.0 10.0 L.... ......... ~ ....... _ ........ ._..~_w~ ....... .....J
3.5 4.0 4.5 5.0 5.5 6.0 6.5 7.0
ASPHALT PERCENT BY MIX WEIGHT
100.0....---------------,
90.0 o I 80.0
~ 70.0
60.0
50.0 '--......... --....-........ ~ .......................... ~~ 3.5 4.0 4.5 5.0 5.5 6.0 6.5 7.0
ASPHALT PERCENT BY MIX WEIGHT
Figure 31. Mixture design properties for the Verglimit mixture - phase II.
87

0:> 0:>
form PR-1115 (ltC\", 11-(;'1)
GRADATION CHART
U.S. O{PARTMHIT Of TRANSPORTATION FEDERAL HIGHWAY ADMHIISTRATION
100 HORIZONTAL SCALE REPRESENTS SIEVE SIZES RAISED TO T~E 0.45 POWER. "SIMPLIFIED PRACTice" SIZES INDICATED BY •
90
80
70
'" z 60 iii VI <t 0-I- 50 z W Q
f5 40 0-
.~e 'v '\
,,~~ ':>
",e~ 3;4 IN. liN. I~", IN.
,,~.;:,~ SIEVES NO. TOTAL NO. %
~"1>i- PASS- RETAINED "T. % PASSING "T. INO ON
30
20 Verglimit and Verqlimit Control --. - --
. (same gradation) 10
0 ~ ,",00 tOO 50 50 i; 4 3'SIN. ''lIN.
5~ 2011 NoBa 40 20 10 6 1,<4 IN.
SIEVE SIZES
STATE PROJECT NO. TYPE CONST; LOCATION ON PROJECT
TYPE, SOURCE, PRODUCER OF AGG.
SAMPLED FROM SAMPLED BY DATE QUANT. REPRESENTEe SIEVED BY DATE SIEVE METHOD REMARKS
OWET
o DRY
hiding ,Ioeles of PR-1115 !R~v. 10-63) will be u!ed.
Figure 32. Gradations for the Verglimit study - phase II.
100
90
80
70
60
I 1/2 IN.
TOTAL %
% PASSING

Table 32. Mixture design properties for the PlusRide study - phase II.
PlusRide Control Mixture (Phase III
Asphalt Content, percent by wt 3.5 4.0 4.5
Theoretical Maximum S.G. 2.584 2.564 2.541
Density, lbm/ft 3 153.7 155.2 155.4
Stability, lbf 2340 2130 2050
Flow, 0.01 in 19.3 14.5 13.3
Air Voids, percent 4.7 3.0 2.0
VMA, percent 11.3 10.9 11.2
VFWA, percent 58.7 72.3 82.5
Design Blows = 50
PlusRide Mixture (Phase III
Asphalt Content, percent by wt 5.0 5.5 6.0
Theoretical Maximum S.G. 2.398 2.381 2.369
Density, lbm/ft 3 142.7 142.6 141. 6
Stabil i ty, lbf 1100 1080 910
Flow, 0.01 in >35.0 >35.0 >35.0
Air Voids, percent 4.7 4.0 4.2
VMA, percent 15.7 16.2 17.2
VFWA, percent 70.4 75.2 75.8
Design Blows = 50
5.0 5.5
2.519 2.500
155.4 155.1
2090 2030
18.7 17.7
1.2 0.6
11.7 12.4
90.0 95.1
6.5 7.0
2.353 2.336
141. 4 141. 5
770 740
>35.0 >35.0
3.7 2.9
17.8 18.2
79.2 83.9
(in)(2.54)=(cm) (lbf)(4.448) = (N) (lbm/ft 3 )(16.01) = Kg/m3
89

165r------------------------,
I"l 160 ~ .., - 155 !i V ~ 150
2 ::l 145
140L-~~~~~~~~~~~
3.5 4.0 4.5 5.0 5.5 6.0 6.5 7.0 ASPHALT PERCENT BY MIl( WEIGHT
3000.----------------------,
2500
;e ~ • 2000 ---EI----..., 5 1'500
1000 (Ibf) (4.448) - (N)
500~~~~~~~~~~~~
3.5 4.0 4.5 5.0 5.5 6.0 6.5 7.0 ASPHALT PERCENT BY MIl( WEIGHT
36.0 r-------------------------, 32.0
-5 28.0 .5 Ci 24.0 o • 20.0
~ II. 16.0
12.0
(In) (2.54) = (em)
o o
o o
8.0 '--........ ~ .............. ~ ........... ~ .................. ~ ... 3.5 4.0 4.5 5.0 5.5 6.0 6.5 7.0
ASPHALT PERCENT BY MIl( WEIGHT
8.0 r-------------, 7.0
6.0
5.0
4.0
3.0
2.0
1.0
0.0 t.-. ......... ~ ................. '""_ ........... ~ .............. ~-I 3.5 4.0 4.5 5.0 5.5 6.0 6.5 7.0
ASPHALT PERCENT BY MIl( WEIGHT
20.0 r---------------------, 19.0 18.0
ffi 17.0 (J 16.0
~ 15.0 S 14.0 $: 13.0
12.0 11 .0 r~--E"--10.0 ~ ......... ~~~ ......... ~ .................. ~ ...............
3.5 4.0 4.5 5.0 5.5 6.0 6.5 7.0 ASPHALT PERCENT BY MIl( WEIGHT
100.0 r------------------------,
90.0
~ [iJ 80.0 a. f 70.0
60.0
50.0 ~ ......... ~ ......... ~ ......... ~~ ........ ~ .................. 3.5 4.0 4.5 5.0 5.5 6.0 6.5 7.0
ASPHALT PERCENT BY MIl( WEIGHT
Figure 33. Mixture design properties for the PlusRide control mixture - phase II.
90

185 B.O (lbm/tt J) (16.01) - K9/mJ 7.0
I'] 180 § ~ 6.0 .a Q: 5.0 - 155 w GI... !i D..
4.0 0- 0 CII iii --JJ
~ 150 0 --g 3.0 t: z Q: 2.0 ::I 145 <
G Q 1.0 D D
140 0.0 3.5 4.0 4.5 5.0 5.5 8.0 8.5 7.0 3.5 4.0 4.5 5.0 5.5 8.0 8.5 7.0
ASPHALT PERCENT BY MIX WEIGHT ASPHALT PERCENT BY MIX WEIGHT
3000 20.0 (Ibf) (4.4411) - (N) 19.0
2500 18.0 ... ~ 17.0 .a -: 2000 u 18.0
5 15 15.0 D..
~ 1500 ~
14.0 In 13.0
1000 ~ 12.0 11.0
500 10.0 3.5 4.0 4.5 5.0 5.5 8.0 8.5 7,0 3.5 4.0 4.5 5.0 5.5 8.0 8.5 7.0
ASPHALT PERCENT BY MIX WEIGHT ASPHALT PERCENT BY MIX WEIGHT
36.0 100.0
32.0 90.0
r- 2B.0 ~ " .5 ~ 24.0 80.0 ~ NO DATA 15
D..
~ 20.0 t 70.0
16.0 80.0
12.0 (In) (2.34) - (em)
8.0 50.0 3.5 4.0 4.5 5.0 5.5 6.0 8.5 7.0 3.5 4.0 4.5 5.0 5.5 8.0 8.5 7.0
ASPHALT PERCENT BY MIX WEIGHT ASPHALT PERCENT BY MIX WEIGHT
Figure 34. Mixture design properties for the PlusRide mixture - phase II.
91

\0 N
100
90
80
70
~ 60 in (/)
'" "-.... 50 z w
" f5 40 "-
30
20
"onn PR_l11S (ll,""' 11 ,,'1)
GRADATiON CHART
u.s. Dfr>A,RTMtUT Dr rRflNsrORTATIOl1
T[Il[RAl HIGHWAY fl[lMlflISTIlI\TION
HORIZONTAL SCALE REPRESENTS SIEVE SIZES RAISED TO TI:-iE 0.45 POWER. "SIMPLIFIED PRACTICe" SIZES INDICATED BY ..
. "'~ S" <::Jr&'"
. """"" --" ~"1>i-"
• ",r& 'v"
-r- I I I ._ . .1_
liN. I~<! IN
PASS-
'NO
100
90
80
70
60
11'21N .
TOTAL
10
Plus Ride and P 1 u sR i de Con t ro 1 -==I-+--t----t---t--t--+---t--ir---i (Approx i rna te 1 y the s arne g ra da t i on ) -~-+--t----t---t--t--+---t--ir---i
o No.2& & 50 30 • 3'8 IN. 1'21N. 5" 2011 NoBD 40 20 10 6 \.14 IN
SIEVE SIZES
STATE PROJECT NO. TYPE CONST; LOCATION ON PROJECT
TYPE, SOURCE, PRODUCER OF AGG.
SAMPLED FROM SAMPLED BY DATE QUANT. REPRESENTED SIEVED BY DATE SIEVE METHOD REMARKS
OWET
DORY ~-- ----
Exi!ling !lo~ks "I PR-1115 (Rev. 10-63) will be uled.
Figure 35. Gradations for the PlusRide study - phase II.

Table 33. Mixture design properties for the PlusRide mixture compacted by the Marshall hammer.
Asphalt Content, percent by wt 5.0
Theoretical Maximum S.G. 2.535
Density, lbm/ft3 148.6
Stabil ity, 1 bf 1350
Flow, 0.01 in 31.0
Air Voids, percent 6.1
VMA, percent 16.6
VFWA, percent 63.4
Design Blows = 50
5.5
2.516
149.2
>1500
>35.0
5.0
16.7
70.2
6.0
2.496
148.8
>1230
>35.0
4.4
17.3
74.4
6.5
2.478
147.8
>1150
>35.0
4.4
18.4
75.9
·7.0
2.459
147.0
>1000
>35.0
4.2
19.2
78.1
(i n)(2. 54)= (cm) (lbf)(4.448) = (N) (lbm/ft3)(16.01) = Kg/m3
Table 34. Mixture design properties for the PlusRide mixture compacted by the kneading compactor.
Asphalt Content, percent by wt 5.0 5.5 6.0 6.5 7.0
Theoretical Maximum S.G. 2.535 2.516 2.496 2.478 2.459
Density, 1 bm/ft3 149.5 150.7 152.1 150.3 150.9
Stabil ity, lbf >1500 >1500 >1500 >1500 >1400
Flow, 0.01 in >35.0 >35.0 >35.0 >35.0 >35.0
Air Voids, percent 5.5 4.0 2.4 2.8 1.6
VMA, percent 16.1 15.8 15.5 16.9 17.1
VFWA, percent 65.9 74.8 84.8 83.7 90.3
(in)(2.54)=(cm) (lbf)(4.448) = (N) (lbm/ft3)(16.01) = Kg/m3
93

165r-----------------------~
1"1 160 ~ .ll - 155 !i CJ ~ 150 I::
II a ---e.. ----~ 145
14D ............... ~ ....... ~ ............................ - ........ .........J 3.5 4.0 4.5 5.0 5.5 6.0 6.5 7.0
ASPHALT PERCENT BY MIX WEIGHT
3000r-------------------, (Ibt) (4.448) - (N)
2500
:li -: 2000
5 NO DATA
iii 1500 ~
1000
500~ ........ ~ ....... ~ ............... ~ ....... - ........ ~ 3.5 4.0 4.5 5.0 5.5 6.0 6.5 7.0
ASPHALT PERCENT BY MIX WEIGHT
36.0 .----------------------.....
32.0
ii 28.0 oS o 24.0 c:i • 20.0
~ 16.0
12.0
NO DATA
(In) (2.54) - (em) 11.0 .............. - ................................ - .............. ~ .....
3.5 4.0 4.5 5.0 5.5 6.0 6.5 7.0 ASPHALT PERCENT BY MIX WEIGHT
8.0 .---------------------~
7.0
6.0
5.0
4.0
3.0
2.0
1.0
0.0 t...... ........ _ ................ _ ....... ~ ........ ._...~_I
3.5 4.0 4.5 5.0 5.5 6.0 6.5 7.0 ASPHALT PERCENT BY MIX WEIGHT
20.0 r-------------------, 19.0 18.0
ffi 17.0
Iii 16.0 11. 15.0 S 14.0 $! 13.0
12.0 I 1.0 10.0 ............. - ....... ~ ...... -~-....... .-....-......
3.5 4.0 4.5 5.0 5.5 6.0 6.5 7.0 ASPHALT PERCENT BY MIX WEIGHT
100.0 r--------------------......
90.0
ffi o 80.0
~ ~ 70.0
60.0
50.0 ~ ....... - ....... ~ ...... - ...... - ............ - ..... 3.5 4.0 4.5 5.0 5.5 6.0 6.5 7.0
ASPHALT PERCENT BY MIX WEIGHT
Figure 36. Mixture design properties for the PlusRide mixture compacted by the Marshall hammer.
94

165 8.0
7.0 ,., 160 § ~ 6.0
0
- 155 15 5.0 , ~
a. , 0 IS
4.0 0, t!I
~ 150 ~ 0 """ , §! 3.0
'0 I: 0 , Z 0: 2.0 :::I 145 :oil "
(lbm/ftl) (111001) _ Kg/m3 1.0
140 0.0 3.5 4.0 4.5 5.0 5.5 6.0 6.5 7.0 3.5 4.0 4.5 5.0 5.5 6.0 11.5 7.0
ASPHALT PERCENT BY MIX WEIGHT ASPHALT PERCENT BY MIX WEIGHT
3000 20.0 (Ibf) (4.4411) - (N) 19.0
2500 18.0
:0 ~ 17.0 0,,-
-: 2000 16.0 "--9--...-
0
5 NO DATA 15 0 a. 15.0
~ 1500
~ 14.0
13.0
1000 12.0
11.0
500 10.0 3.5 4.0 4.5 5.0 5.5 11.0 6.5 7.0 3.5 4.0 4.5 5.0 5.5 6.0 6.5 7.0
ASPHALT PERCENT BY MIX WEIGHT ASPHALT PERCENT BY MIX WEIGHT
36.0 100.0
32.0 90.0 -"5 28.0 ~ 0,,-
...-.5 0 - 24.0
0 80.0 /'
~ NO DATA 15 ef' a.
~ 20.0
f 70.0 /
tI ~ 16.0
60.0 12.0
(In) (2.54) - (em)
8.0 50.0 3.5 4.0 4.5 5.0 5.5 6.0 6.5 7.0 3.5 4.0 4.5 5.0 5.5 6.0 11.5 7.0
ASPHALT PERCENT BY MIX WEIGHT ASPHALT PERCENT BY MIX WEIGHT
Figure 37. Mixture design properties for the PlusRide mixture compacted by the kneading compactor.
95

'" (J)
Fonn PR-1115 (Ilc\'. 11- r.~l)
GRAOA TlON CHART
U.S. DEPARTMENT OF TRANSPORTATION fEDERAL HIGHWAY ADMltllSTRATION
100 HORIZONTAL SCALE REPRESENTS SieVE SIZES RAISED TO TtiE 0.45 POWER. "SIMPLIFIEO PRACTice" SIZES INDICATED BY •
90
BO
70
(!) z 60 Vi Ul
. <:-e 'v"
<[ "-I- 50 z w '-' ffi 40 "-
. '\,~ ,>"
3;4JN. 1~41N <,;f?'<:- liN.
,;:,<$> SIEVES NO. TOTAL NO. % '<'" PASS- RETAINED WT.
% PASSING WT.
~'1>i- 'NG ON
30
PlusRide· 20
10
a ) No.Wo 100 50 30 ffi 8 4 3'SIN. 12 IN.
5" 20" NoSD 40 10 '0 6 it41N
SIEVE SIZES
STATE PROJECT NO. TYPE CONST; LOCATION ON PROJECT
TYPE, SOURCE, PRODUCER OF AGG.
SAMPLED FROM SAMPLED BY DATE
Exisling !lc~ks or PR-1115 IRev. 10-63) will be u,ed.
Figure 38.
QUANT. REPRESENTED SIEVEO BY OATE SIEVE METHOD REMARKS
OWET
o CRY_L---------- -
Gradations for the PlusRide mixtures compacted by the Marshall hammer and kneading compactors.
100
90
BO
70
60
I 1'2 IN.
TOTAL %
% PASSING
._-
._-_ ..•
APPENDIX B: EVALUATION OF TEST PROCEDURES
1. Introduction
In this appendix, the test procedures used to evaluate the mixtures in phase I of the study are compared in order to (1) reduce the number of tests used in phase II, and (2) to evaluate the test procedures themselves.
2. Effect of Aging
Aging was only performed at 77 of (25 DC). To determine long-term performance, higher aging temperatures or other conditioning processes would have to be used.
a. Resilient Modulus
In evaluating the effects of aging on the four mixtures, the resilient modulus data in tables 4 and 12 provided no trends in the data over time for the two control mixtures. The Verglimit specimens also provided no trend, although the test could not be performed at 90 days. The specimens swelled and cracked prior to 90 days because the Verglimit absorbed moisture. There was some damage at 28 days, but it did not affect the test results. Moduli for the PlusRide specimens decreased at 90 days at the two higher temperatures, namely 77 and 104 of (25 and 40 DC).
b. Creep Modulus and Permanent Deformation
The creep moduli and permanent deformations in tables 5 and 13 did measure the damage in the Verglimit specimens at 28 days and also showed the softening effect over time for the PlusRide specimens. Again, the data for the controls displayed no trends. How the effects of the additives on the modulus and permanent deformation over time translate to changes in field performance, where the mixtures are confined, is unknown. It can be speculated that the Verglimit would ravel.
97

c. Resistance to Moisture Damage
The effects of aging on moisture susceptibility, shown in tables 6 and 14, were complex and could not be explained for all mixtures. A more detailed study is required to explain these effects. Basing the retained ratios on the dry value from the second day rather than on the dry values for individual days seemed more justifiable. The dry Verglimit and PlusRide specimens became damaged over time because of swelling. However, this method of calculating ratios cannot always be used. For example, a pavement can undergo moisture damage and can harden at the same time. Other forms of damage can also be present. If the pavement hardens, then basing the retained ratio on dry values determined immediately after the pavement is built may produce a retained ratio above 100 percent even though there may be visual stripping.
A paired t-test was used to determine if the TSR and MrR reported in tables 6 and 14 were equivalent. Data for each day formed the pairs. Table 35 gives the probabilities of whether or not the two methods for determining the retained ratios are equal. At a 95 percent confidence level, those that are equal have probabilities above 0.05. The MrR were statistically lower than the TSR in four out of eight comparisons, and by reviewing the data in tables 6 and 14, it could be observed that at any given day, the retained ratios may be different even where the overall analysis using all days indicated the retained ratios were not significantly different. The MrR for the four mixtures containing the substitute Grayson aggregate were also lower than the TSR in three out of the four cases.
Table 35. Statistical comparison of TSR and MrR (Probability that the retained ratios are equal).
Retained Ratio
Verglimit Control
.03 *
Retained Ratio 0.16 NS Based on the Second Day Dry Values
Verglimit
.31 NS
.03 *
PlusRide Control
0.07 NS
0.15 NS
NS = no significant difference between the two retained ratios * = MrR was lower than TSR
98
PlusRide
0.01 *
0.00 *

3. Resistance to Rutting
a. Modulus versus Temperature
Moduli versus temperature were determined by three methods: (1) diametral resilient moduli at 0.1 second using Marshall-size specimens, (2) creep moduli at 0.1 second using 4- by 8-in (10.2- by 20.3-cm) cylinders, and (3) peak-topeak dynamic moduli at 200 cycles using the same cylinders. The resilient modulus device applies the load in a curvilinear fashion with the full load being obtained within 0.05 second. The specimen is under a creep load at 0.1 second. This is a pneumatic system and the waveform is a function of how the air pressure pushes the piston which applies the load. The creep test applies a O.I-second square wave. The dynamic modulus is obtained using a sine wave (0 to 180 degrees) which peaks at 0.05 second. The peak load and peak deformation, which occurs after 0.05 second, are used to calculate this modulus.
The comparisons of moduli are shown in figures 39 through 42. Diametral resilient moduli at 65 of (18.3 °C) were interpolated because the test was
performed at 41°F (5 DC) and not at 65 DF (18.3 °C). As expected, the creep
moduli were lower than the dynamic moduli because the creep test applies more impulse (area under a force versus time plot) to the specimen. Both are compressive moduli. The diametral resilient moduli produced by the Retsina device is determined in the tensile direction, but the diametral theory assumes that the tensile and compressive moduli of the material are equal. How the diametral resilient moduli should relate to the creep and dynamic moduli is unknown because (1) the material may not be isotropic, (2) the Retsina device uses a nonstandard waveform, (3) Poisson's ratios were assumed to be 0.30 in calculating the diametral resilient moduli, whereas calculations for the creep and dynamic moduli do not include a Poisson's ratio, and (4) the diametral resilient modulus test was performed by controlling the deformation level and thus the load varied with temperature. This last difference between the tests appeared to have little effect on the data because the slopes for the resilient moduli data did not differ significantly from those for the other two moduli. Thus, it appears that most moduli were obtained in the linear viscoelastic range. The data does show that the diametral resilient moduli were generally lower than the dynamic moduli.
99

2000,------------------------------------. 1lII-1lII DYNAMIC MODULUS
iii :.:: vi :3
(ksi)(6895) • (KPa)
1000 ('F - 32)/1-8 • 'c
::::l 100 c o ::::;:
A-A CREEP MODULUS @--@ DIAMETRAL Mr
VERGLIMIT CONTROL MIXTURE
50 60 70 80 90 100 110
TEMPERATURE, of
120
Figure 39, Modulus versus temperature for the Verglimit control mixture,
2000,-----------------------------------. 1lII-1lII DYNAMIC MODULUS A-A CREEP MODULUS @-@ DIAMETRAL Mr
iii :.:: vi :3
(ksi)(6895) • (KPa)
1000 ('F - 32)/1-8 • 'c
::::l 100 c o ::::;:
VERGLIMIT MIXTURE
50 60 70 80 90
TEMPERATURE, of
100 110
Figure 40, Modulus versus temperature for the Verglimit mixture.
100
120
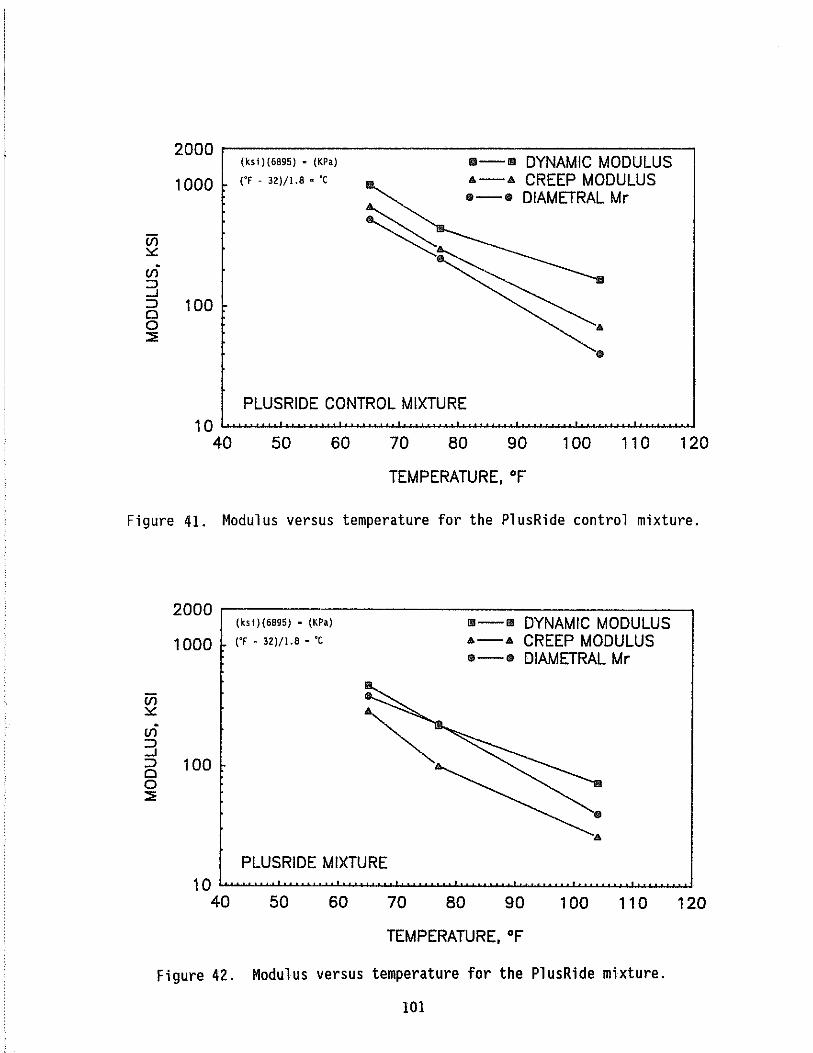
2000r-------------------------------------~
en :::.::
vi :::J ....I
(ksi)(6895) • (KPa)
1 000 ("f - 32)(1.8 • "C
:::J 100 o o :::E
1111--l1li DYNAMIC MODULUS A--A CREEP MODULUS ID--ID DIAMETRAL Mr
PLUSRIDE CONTROL MIXTURE 10~~~~~~~~~~~~~~~~~~~~
40 50 60 70 80 90 100 110 120
TEMPERATURE, of
Figure 41. Modulus versus temperature for the PlusRide control mixture.
2000r-----------------------------------~
en :::.:: en :3
(ksi)(6895) • (KPa)
1000 ("f - 32)(1.8 • "C
l1li--l1li DYNAMIC MODULUS A--A CREEP MODULUS ID--ID DIAMETRAL Mr
:::J 1 00 o o :::E
PLUSRIDE MIXTURE
50 60 70 80 90 100 110
TEMPERATURE, OF
Figure 42. Modulus versus temperature for the PlusRide mixture.
101
120

The graphs can also be used to compare all four mixtures to each other. Overall, the PlusRide control mixture produced the highest creep, dynamic, and resilient moduli while the PlusRide mixture produced the lowest creep and dynamic moduli. There were some differences in air voids, which could affect the results; however, the largest difference in air voids between any of the mixtures was only 0.7 percent.
b. Permanent Deformations versus Temperature
As shown in tables 7, 8, 15, and 16, permanent deformations were recorded in the creep and repeated load tests. Figure 43 through 46 show the comparisons between 0.1 second of creep and 1 repeated load cycle, and between 10 seconds of creep and 157 repeated load cycles. Ten seconds was chosen because this was the longest creep loading time where data were available for all four mixtures. The impulse (area under a force versus time plot) for a 10-second creep loading time is equal to 157 cycles of repeated loading. This assumes that the data from the 10-second test were in the linear viscoelastic range and were not affected by the creep loads applied before it. Equating impulses is not a correct method for comparing the tests if the creep test goes into the nonlinear viscoelastic range. The rest periods in the two tests are also different. This could also affect the test data and analyses.
Because the creep test at 0.1 second provides more impulse and a lower modulus than the repeated load test at 1 cycle, it would be expected that the creep test would provide more permanent deformation than the repeated load test. Figures 39 through 42 do not show this, probably because of the difference in the rest periods of the two tests. The creep test results are slightly more erratic. This was also noticed in preliminary testing where some specimens produced either a very low or very high nonreproducible deformations, especially at the shorter loading times.
For the comparison between the 10-second creep test and 157 cycles of repeated loading, the permanent deformations for the creep test are less temperature susceptible. Overall, the graphs show that the repeated load test is a better test for measuring rutting for highway applications because the data are less erratic, or provide more consistent trends.
102

z ::t z 0
!;t ::2 0:: 0 I..L.. W 0 I-z w z « ::2 0:: W 0...
z ::t z o
lE4 .------------------ -------,
1000
100
III CREEP LOAD, 0.10 SEC TEST tl REPEATED LOAD, 1 CYCLE I!I CREEP LOAD, 10.0 SEC TEST o REPEATED LOAD, 157 CYCLES ~
(i.)(2.54) • (em)
("F - 32)/1.8 • "C
~------~~ ~~
/
VERGLIMIT CONTROL MIXTURE 10 ~~~~~~~"~,~,,~,,~'u .. ~,,~ ... ~,~,,~,,~,~,,~,,~,~,,~ .. ~I,~,~ .. ~,,~,~,,~I!~,-~~~~~
40 50 60 70 80 90 100 110
TEMPERATURE, of
Figure 43. Permanent deformation versus temperature for the Verglimit control mixture.
lE4.-----III CREEP LOAD, 0.10 SEC TEST tl REPEATED LOAD, 1 CYCLE I!I CREEP LOAD, 10.0 SEC TEST
120
!;t 1000 ::2
OR~ITDl~~~
0::
f2 w o IZ W
~ ::2 0:: W 0...
100
//---!lI (i.)(2.54) • (em)
('F - 32)/1.8 • 'c /. VERGLIMIT MIXTURE 10~~~~~~~~~~~~·~~~~~~~~
40 50 60 70 80 90 100 110
TEMPERATURE, OF
Figure 44. Permanent deformation versus temperature for the Verglimit mixture.
103
120

1E4r---------------------------------------~ z ~
z o !;( 1000 :::E 0:::
~ W o !z 100 w ~ :::E 0::: W a.
III CREEP LOAD, 0.10 SEC TEST C REPEATED LOAD, 1 CYCLE ill CREEP LOAD, 10.0 SEC TEST o REPEATED LOAD, 157 CYCLES
(in)(2.54) • (em)
("f - 32)/1.8 • 'c PLUSRIDE CONTROL MIXTURE 10~~~~~~~~~~~~~~~~~~~~~
~ ~
Z o ~
40 50 60 70 80 90 100 110
TEMPERATURE, of
Figure 45. Permanent deformation versus temperature for the PlusRide control mixture.
120
5E4r---------------------------------------,
1E4
III CREEP LOAD, 0.10 SEC TEST C REPEATED LOAD, 1 CYCLE ill CREEP LOAD, 10.0 SEC TEST o REPEATED LOAD, 157 CYCLES
:::E 0::: ~ 1000 w o
!z w ~ :::E 0::: W a.
100
(in)(2.54) • (em)
("F - 32)/1.8 • ·c PLUSRIDE MIXTURE 10~~~~~~~~~~~~~~~~~~~~
40 50 60 70 80 90 100
TEMPERATURE, OF
Figure 46. Permanent deformation versus temperature for the PlusRide mixture.
104
110 120

When comparing the four mixtures, the PlusRide mixture had the highest deformations and the lowest moduli. The deformations for the other mixtures do not necessarily match the moduli. This is expected when evaluating different mixtures, especially those containing additives. Permanent deformations increase with modulus in only a very generalized fashion. For all mixtures, the coefficient of determination, r2, for the creep moduli versus permanent
deformations at 10 seconds is 0.46. For the dynamic modulus versus permanent deformation at 200 cycles, it is 0.25. Therefore, there was little correlation between the moduli and permanent deformations.
4. Resistance to Low Temperature Cracking
For evaluating low temperature cracking, two specimens were tested for diametral resilient modulus and indirect tensile strength at each of the nine test temperatures.. Because the resilient modulus test is generally nondestructive when performed at low levels of deformation, the number of specimens could be reduced if only the resilient modulus was measured and the same specimens used at all temperatures.
To determine whether the number of specimens could be reduced, two specimens for each mixture were fabricated and tested for Mr at each temperature starting with the lowest temperature. The test results compared to those using different specimens are given in table 36. Differences in the data can be noted, but they were not due to the specimens being damaged. In fact, retesting the same specimens may decrease the effects of specimen to specimen variability and create a smoother plot.
Moduli and tensile strengths shown in tables 9 and 17 were correlated and it was found that either test could be used to evaluate low temperature cracking as they produced similar relationships. The equations produced by four linear regressions were:
Log lO (Mr) = 0.999 + 1.015(10g,o(5,) ) - O.OOl(T) r2 = 0.988
Mr = 351. 7 + 10.44(5,) - 7.114(T) r2 = 0.955
Log,o(Mr) = 0.645 + 1.150(10g,o(5,)) r2 = 0.986
Mr = -206.5 + 11.79(5,) r2 = 0.955
105

where Mr - resilient modulus, ksi
St - tensile strength, psi
T - test temperature, of
Temperature had little effect on the relationships. These equations were developed using only four mixtures, eight temperatures, 50-blow Marshall size specimens, and the test procedures given in chapter 3. These limitations must be considered when using the equations. An additional comment on this procedure is that it assumes that pavement response is related to the log of the tensile strength and resilient modulus.
5. Conclusions
After reviewing the conclusions that were obtained from the aging study, it was decided only to visually determine the effects of aging in phase II. Because the TSR and MrR were not equal in many cases, and visual stripping often did not match the retained ratios, all three measurements were included in evaluating the moisture susceptibility of the mixtures in phase II. For rutting, the repeated load test was chosen because it provided less erratic data and smoother relationships between deformation and temperature than the creep test. Tests for rutting were only performed at 104 of (60°C) in phase
II. For low temperature cracking, only the resilient modulus would be obtained with the same two specimens being tested at each temperature.
106
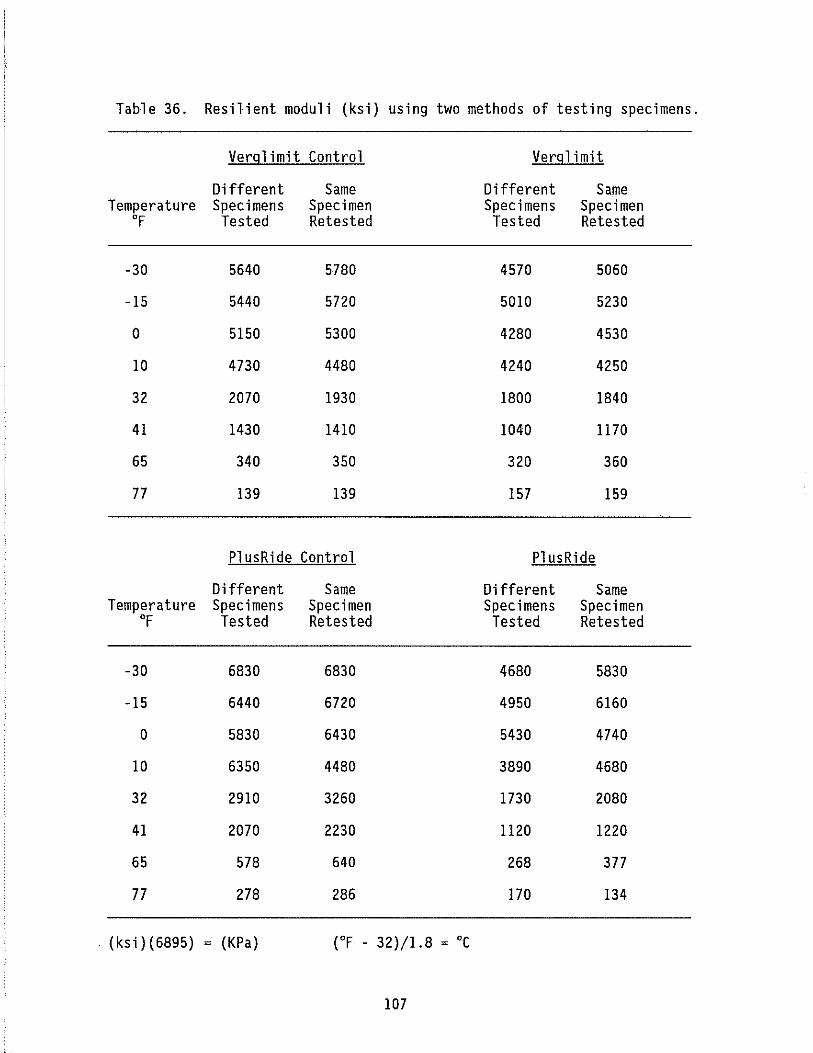
Table 36. Resilient moduli (ksi) using two methods of testing specimens.
Verglimit Control Vergl imit
Different Same Different Same Temperature Specimens Specimen Specimens Specimen
of Tested Retested Tested Retested
-30 5640 5780 4570 5060
-15 5440 5720 5010 5230
0 5150 5300 4280 4530
10 4730 4480 4240 4250
32 2070 1930 1800 1840
41 1430 1410 1040 1170
65 340 350 320 360
77 139 139 157 159
PlusRide Control PlusRide
Different Same Different Same Temperature Specimens Specimen Specimens Specimen
of Tested Retested Tested Retested
-30 6830 6830 4680 5830
-15 6440 6720 4950 6160
0 5830 6430 5430 4740
10 6350 4480 3890 4680
32 2910 3260 1730 2080
41 2070 2230 1120 1220
65 578 640 268 377
77 278 286 170 134
. (ksi)(6895) = (KPa) (OF - 32)/1.8 = DC
107

REFERENCES
1. J. H. Tanski, "Performance of Two Ice Retardant Overlays," Report No. FHWA/NY/RR-86/132, New York State Department of Transportation, Albany, NY 12232, 1986.
2. "Vergl imit," Research Project HPR-1085, Report No. FHWA/CT/RD-1085-2-87-6, Connecticut Department of Transportation, Wethersfield, CN 06109, November 1987.
3. Progress Report From Oregon Department of Transportation, Project No. ER-331(4), Oregon Department of Transportation, Salem, OR 97310, 1988.
4. "The 1987 Annual Report on Highway Safety Improvement Programs," Office of Highway Safety, Federal Highway Administration, Washington, DC 20590, April 1987.
5. J. F. Kelly, "Roads with 24-Hour 'on cue' deicing," Rural and Urban Roads, May-June 1982, pp 14-16.
6. H. Bisco, "Allentown's Magic Road," North American Snow Conference, Edmonton, Alberta, May 16, 1984.
7. "Verglimit Study Concludes," Colorado DOH Research Newsletter, Technology Transfer Unit, Colorado Department of Highways, Denver, CO 80222, October 27, 1988.
8. "Performance of an Ice Retardant Overlay," Final Report, Colorado Department of Highways, Denver, CO 80222, November, 1982.
9. "Resurfacing with 'Verglimit' (CA-84-09), Elizabeth Lake Road," CALTRANS Newstech Number 5, California Department of Transportation, Sacramento, CA 95814, December 1987.
10. A. DePalma, "Paving Suspected as Road Becomes Deadly," The New York Times, December 22, 1988.
108

11. K. E. Highlands, "Verglimit Deicing Chemical Asphalt Additive," FHWA-PA-88-007+83-39, Pennsylvania Department of Transportation, Harrisburg, PA 17120, December 1988.
12. J. Kiljan, "Verglimit Evaluation (Boulder)," CDOH-DTD-R-89-4, Colorado Department of Highways, Denver, CO 80222, February 1989.
13. C. M. Turgeon, "Evaluation of Verglimit (A deicing additive in plantmixed bituminous surface)," FHWA/MN/RD-89/02, Minnesota Department of Transportation, St. Paul, MN 55155, July 1989.
14. D. C. Esch, "Construction and Benifits of Rubber-Modified Asphalt Pavements," Alaska Department of Transportation, Report No. AK/RD/82-17, Alaska Department of Transportation and Public Facilities, Juneau, AK 99811, 1982.
15. H. B. Takallov, J. Mcquillen, Jr., and R. G. Hicks, "Effect of Mix Ingredients on Performance of Rubber Modified Asphalt Mixtures," FHWA/AK/RD-86-05, Alaska Department of Transportation and Public Facilities, Juneau, AK 99811, April 1985.
16. K. T. Diringer, and J. Smith, "Asphalt Additives," Construction Report FHWA/NJ-85/007-7713, New Jersey Department of Transportation, Trenton, NJ 08625, October 1982.
17. "Rubberized Asphalt Road Surface Demonstration," Final Report, South Dakota Department of Transportation, Pierre, SD 57501, July 1984.
18. "Evaluation of Rubberized Asphalt Surfacing Material: Mt. St. Helen's Study," Federal Highway Administration, Western Direct Federal Division, Vancouver, WA 98661, September 1984.
19. "Evaluation of PlusRide," Post Construction Report, Minnesota Department of Transportation, St. Paul, MN 55155, January 1985.
109

20. R. G. Hicks, K. Martin, and J. E. Wilson, "Evaluation of Asphalt Additives: Lava Butte Road - Fremont Highway Junction," FHWA-OR-RD-87-03, Interim Report, Oregon Department of Transportation, Highway Division, Salem, OR 97310, April 1986.
21. J. L. Anderson, "PI usRi de and Bonifi bers Pavement Eva I uat ion: SR-530, Stanwood Vic," WA-RD 147.1, Washington State DOT, Olympia, WA 98501, September 1987.
22. R. E. Allison, ''PLUSRIDE™ Asphalt Concrete Pavement," WA-RD 130.2,
Washingtion State Department of Transportation, Olympia, WA 98504, January, 1990.
23. J. S. Shuler, R. D. Pavlovich, J. A. Epps, and C. K. Adams, "Investigation of Materials and Structural Properties of Asphalt-Rubber Paving Mixtures," FHWA/RD-86/027, Federal Highway Administration, Washington DC 20590, September 1986.
24. D. A. Anderson, W. P. Kilareski, and Z. Siddiqui, "Pavement Construction and Instrumentation for the Accelerated Loading Facility," FHWA/RD-86/027, Federal Highway Administration, Washington DC 20590, August 1987.
25. "Principles of Construction of Quality Hot-Mix Asphalt Pavements," FHWA Report 80-R-00426, Prepared by the The Asphalt Institute for the Federal Highway Administration, Washington, DC 20590, August 1982.
26. American Society for Testing and Materials, 1989 Annual Book of ASTM Standards, Section 4--Volume 04.03, 1916 Race Street, Philadelphia, PA 19103-1187, May 1989.
27. R. J. Schmidt, "A Practical Method for Measuring the Resilient Modulus of Asphalts-Treated Mixes", Highway Research Record No. 404, Highway Research Board, Washington, DC 20418, 1972, pp 22-32.
110

28. K. D. stuart, "Comparison of Mechanical Tests For Bituminous Concrete," FHWA Interim Report FHWA-RD-88-174," Federal Highway Administration, 6300 Georgetown Pike, McLean, VA 22101-2296, September 1988.
29. W. J. Kenis, "Predictive Design Procedures, VESYS Users Manual," Report No. FHWA/RD-77/154, Federal Highway Administration, Washington DC 20590, January 1978.
30. American Association of State Highway and Transportation Officials, Standard Specifications for Transportation Materials and Methods of Sampling and Testing--Part II, Methods of Sampling and Testing, 444 North Capital Street, NW, Suite 225, Washington DC 20001, August 1986.
31. D. G. Tunnicliff and R. E. Root, "Use of Antistripping Additives in Asphaltic Concrete Mixtures--Laboratory Phase," NCHRP Report 274, Transportation Research Board, Washington, DC. 20418, December 1984.
32. K. D. Stuart, "Evaluation of Procedures Used to Predict Moisture Damage in Asphalt Mixtures," FHWA Report FHWA/RD-86/090, Federal Highway Administration, Washington DC 20590, September 1986.
33. D. A. Anderson, D. W. Christensen, R. Dongre, M. G. Sharma, J. Runt, and P. Jordhal, "Asphalt Behavior at Low Service Temperatures," FHWA-RD-88-078, Federal Highway Administration, Washington DC 20590, January 1989.
III
Related Documents


