Solar Energy Vol. 68, No. 5, pp. 453–474, 2000 2000 Elsevier Science Ltd Pergamon PII: S0038–092X(00)00005–0 All rights reserved. Printed in Great Britain 0038-092X / 00 / $ - see front matter www.elsevier.com / locate / solener LABORATORY EVALUATION AND SYSTEM SIZING CHARTS FOR A ‘SECOND GENERATION’ DIRECT PV-POWERED, LOW COST SUBMERSIBLE SOLAR PUMP , ² C. PROTOGEROPOULOS* and S. PEARCE** *CRES, Centre for Renewable Energy Sources, 19th km Marathonos Av., 190 09 Pikermi, Athens, Greece **SHURflo Ltd, Unit 5, Sterling Park, Gatwick Road, Crawley, West Sussex, RH10 2QT, UK Received 20 May 1999; revised version accepted 3 November 1999 Communicated by ROBERT HILL Abstract—A ‘new generation’ solar operated low-power and low capital cost submersible diaphragm pump designed for medium head applications is evaluated in this paper. The pump is designed and made by SHURflo Ltd. and is the 9325 type. The primary use of this pump is in providing water for remote homes and clinics, for human consumption and for agricultural use. In all tests, the pump was connected to a dedicated controller that allows either 12 V or 24 V operation. The experiments were undertaken by using the pumping test rig at CRES, and the evaluation methodology was ‘simulated field conditions’. The instantaneous water flow versus head characteristics were functions of the global irradiance on the array plane. The PV array power varied between 55 Wp and 220 Wp and both voltage modes were examined. The hydraulic efficiency was also calculated with respect to equivalent head. The daily operation charts were obtained by using the instantaneous pump performance in combination with typical daily irradiation profiles and the pump starting and stopping characteristics. These charts are useful for system sizing, taking into account the solar resource at the site of application, the required daily water delivery at a particular head and the available PV array. The results show that with this ‘new generation’ of direct solar-powered pumping systems, the PV array has been minimised, and so has been the capital investment cost, the need for battery storage has been eliminated and adequate water is delivered at an affordable price. 2000 Elsevier Science Ltd. All rights reserved. 1. INTRODUCTION the ‘second generation’ pumping systems is pre- sented in this paper. The main aim of the work is A few years ago, the solar pumping market was to analyse the potential of a small pumping dominated by the so-called ‘first generation’ PV system in terms of water delivery capability at a pumping systems, i.e. centrifugal pumps, usually low investment cost. The solar pump tested is driven by variable frequency AC motors, with made by SHURflo, type 9325. The ‘simulated proven long-term reliability and hydraulic ef- field testing’ procedure was adopted, i.e. head is ficiency in the order of 25 to 35%. The so-called maintained by artificial means, as defined in detail ‘second generation’ PV pumping systems refer to in the AVICENNE Programme (1995). The ex- positive displacement pumps, progressing cavity periments were carried out at CRES using the pumps or diaphragm pumps, generally character- existing test rig and instrumentation. The tests ised by the low PV input power requirements distinguished between instantaneous performance (between 100 Wp and 400 Wp), low capital cost evaluation and daily operation of the pump. Both and high hydraulic efficiencies of even 70%. A 12 V and 24 V operation modes were examined. comparison assessment of the performance of In all tests, the SHURflo 9325 pump was con- different types of PV pumps available in the nected to a dedicated controller, type LCB-G. The market is found in the AVICENNE Programme instantaneous flow vs. head characteristics are (1995), EC Contract No. AVI-CT94-0004. An presented as a function of the global irradiance on overview of the solar pump types tested and the the array plane and the PV array power. The main experimental results obtained for these hydraulic efficiency is calculated with respect to pumps are presented in Appendix A. the equivalent head. The performance of a typical representative of Compared to the technical analysis undertaken in previous works, the pump daily operation ² charts presented here provide a concise meth- Author to whom correspondence should be addressed. odology for PV pumping system sizing. The Tel.: 130-1-603-9900; fax: 130-1-603-9905; e-mail: [email protected] determining parameters are the nominal PV 453

Welcome message from author
This document is posted to help you gain knowledge. Please leave a comment to let me know what you think about it! Share it to your friends and learn new things together.
Transcript

Solar Energy Vol. 68, No. 5, pp. 453–474, 20002000 Elsevier Science Ltd
Pergamon PII: S0038 – 092X( 00 )00005 – 0 All rights reserved. Printed in Great Britain0038-092X/00/$ - see front matter
www.elsevier.com/ locate / solener
LABORATORY EVALUATION AND SYSTEM SIZING CHARTS FOR A‘SECOND GENERATION’ DIRECT PV-POWERED, LOW COST
SUBMERSIBLE SOLAR PUMP
,†C. PROTOGEROPOULOS* and S. PEARCE***CRES, Centre for Renewable Energy Sources, 19th km Marathonos Av., 190 09 Pikermi, Athens, Greece
**SHURflo Ltd, Unit 5, Sterling Park, Gatwick Road, Crawley, West Sussex, RH10 2QT, UK
Received 20 May 1999; revised version accepted 3 November 1999
Communicated by ROBERT HILL
Abstract—A ‘new generation’ solar operated low-power and low capital cost submersible diaphragm pumpdesigned for medium head applications is evaluated in this paper. The pump is designed and made by SHURfloLtd. and is the 9325 type. The primary use of this pump is in providing water for remote homes and clinics, forhuman consumption and for agricultural use. In all tests, the pump was connected to a dedicated controller thatallows either 12 V or 24 V operation. The experiments were undertaken by using the pumping test rig at CRES,and the evaluation methodology was ‘simulated field conditions’. The instantaneous water flow versus headcharacteristics were functions of the global irradiance on the array plane. The PV array power varied between55 Wp and 220 Wp and both voltage modes were examined. The hydraulic efficiency was also calculated withrespect to equivalent head. The daily operation charts were obtained by using the instantaneous pumpperformance in combination with typical daily irradiation profiles and the pump starting and stoppingcharacteristics. These charts are useful for system sizing, taking into account the solar resource at the site ofapplication, the required daily water delivery at a particular head and the available PV array. The results showthat with this ‘new generation’ of direct solar-powered pumping systems, the PV array has been minimised,and so has been the capital investment cost, the need for battery storage has been eliminated and adequatewater is delivered at an affordable price. 2000 Elsevier Science Ltd. All rights reserved.
1. INTRODUCTION the ‘second generation’ pumping systems is pre-sented in this paper. The main aim of the work is
A few years ago, the solar pumping market wasto analyse the potential of a small pumping
dominated by the so-called ‘first generation’ PVsystem in terms of water delivery capability at a
pumping systems, i.e. centrifugal pumps, usuallylow investment cost. The solar pump tested is
driven by variable frequency AC motors, withmade by SHURflo, type 9325. The ‘simulated
proven long-term reliability and hydraulic ef-field testing’ procedure was adopted, i.e. head is
ficiency in the order of 25 to 35%. The so-calledmaintained by artificial means, as defined in detail
‘second generation’ PV pumping systems refer toin the AVICENNE Programme (1995). The ex-
positive displacement pumps, progressing cavityperiments were carried out at CRES using the
pumps or diaphragm pumps, generally character-existing test rig and instrumentation. The tests
ised by the low PV input power requirementsdistinguished between instantaneous performance
(between 100 Wp and 400 Wp), low capital costevaluation and daily operation of the pump. Both
and high hydraulic efficiencies of even 70%. A12 V and 24 V operation modes were examined.
comparison assessment of the performance ofIn all tests, the SHURflo 9325 pump was con-
different types of PV pumps available in thenected to a dedicated controller, type LCB-G. The
market is found in the AVICENNE Programmeinstantaneous flow vs. head characteristics are
(1995), EC Contract No. AVI-CT94-0004. Anpresented as a function of the global irradiance on
overview of the solar pump types tested and thethe array plane and the PV array power. The
main experimental results obtained for thesehydraulic efficiency is calculated with respect to
pumps are presented in Appendix A.the equivalent head.
The performance of a typical representative ofCompared to the technical analysis undertaken
in previous works, the pump daily operation† charts presented here provide a concise meth-Author to whom correspondence should be addressed.
odology for PV pumping system sizing. TheTel.: 130-1-603-9900; fax: 130-1-603-9905; e-mail:[email protected] determining parameters are the nominal PV
453

454 C. Protogeropoulos and S. Pearce
power, the head and the daily irradiation available missions between Primary and Secondary Ele-at the site of application. A solar pumping system ments’lifetime economic analysis in terms of cost of • ISO 2785 (1986) ‘Guidelines for the Construc-hydraulic energy yield and quantity of water tion of Water Pipelines; Code of Practice’.delivered is also presented. A general layout of the pumping test rig at
CRES is shown in Fig. 1.In Fig. 1, numbers 6, 7, 8 and 9 refer to
2. DESCRIPTION OF THE PUMPING TESTvoltage, current, pressure and flow measurements,
RIG AND SET-UP AT CRESrespectively; 10 is a pressure control valve and 12
The experimental solar water pumping facility to 15 is a PC-based measuring system.at CRES is designed for evaluating submersiblePV water pumping systems. The non-conductive 2.1. Solar modulesDN25 piping is made of PVC. The fittings such Two types of photovoltaic modules were usedas, elbows, tees, socket unions, double sockets, in the experimental procedures with the SHURfloreducers, socket flanges, support clips etc., are type 9325 pump. The modules are made by BPthreaded. The geometrical design of the piping is Solar, types BP255F and BP585F, rated 55 Wpin accordance to international standards for pump and 85 Wp, respectively. Both solar modulestesting, especially the sections before and after the comprise 36 cells in series and their responsepressure transducer and the flowmeter. Indicative under different global irradiance levels is pre-references for the design of closed water conduits sented in Appendix B, Table B.1.for laboratory pump testing are given below,• ISO Standards Handbook 28 (1986) ‘Pipes, 2.2. Measuring equipment and devices
Fittings and Valves’• ISO/DIS 6817 (1990) ‘Measurement of Con- 2.2.1. Electromagnetic flowmeter. A Danfoss
ductive Liquid Flow in Closed Conduits; DN25 electromagnetic flowmeter was used for theMethod using Electromagnetic Flow-meters’ water flow measurement. This instrument incorpo-
• BS 5200 (1986) ‘Specification for Dimensions rates a MAG 3100 type sensor and a MAG 3000of Hydraulic Connectors and Adapters’ signal converter and is an IP67 version. Potential
• BS 5728 (1988) ‘Specification for Installation equalisation is achieved by using a special ear-Requirements for Single Meters’ thing flange placed between the flowmeter and
• ISO 2186 (1973) ‘Fluid Flow in Closed Con- pipe flanges. The electrodes are surrounded by aduits; Connections for Pressure Signal Trans- standard neoprene liner. The signal converter
Fig. 1. Layout of the PV pumping test facility at CRES.

Laboratory evaluation and system sizing charts for a ‘second generation’ submersible solar pump 455
gives an output signal proportional to flow, in the 3.1. Pumprange 0 mA to 20 mA. The pump is a positive displacement type and
The measuring range of this flowmeter with features a three-chamber piston /diaphragm ar-nominal accuracy 60.25% of the actual flow is rangement driven by the motor through an eccen-
21 21between 0.1 l s and 5.0 l s . For lower than tric thrust system.210.1 l s flow rate, the accuracy of the flowmeter
decreases. For example, the minimum flow rate 3.1.1. Construction. The pump is constructedmeasured with the SHURflo 9325 solar pump was from materials selected specifically for the appli-
21 21around 0.014 l s (50 l h ). According to a cation to resist corrosion, salt water and chemicalgraph supplied by the manufacturer, the measur- attack. Internal parts are of Food Grade plastics,
21ing error at 50 l h for DN25 is 61.5% of the elastomer and stainless steel. External parts are ofactual flow. high impact plastics with stainless steel fasteners.
3.1.2. Reliability. Servicing is recommended2.2.2. Pressure transducer. The Danfoss pres-once per year under normal PV operating con-sure transmitter, type AKS 33, features a piezo-ditions. This is a straightforward task carried outresistive sensor whose specific resistance changesusing simple tools.when pressure is applied on a silicon membrane.
The main annual service items are,Resistance variation is in linear proportion to the• Motor Endbell Assembly (including new car-pressure applied. This instrument requires an ex-
bon brushes)ternal power supply of 10 V DC. The output sig-• Diaphragm/drive module.nal is 4 mA to 20 mA, corresponding to 2 1 bar
The regular replacement of these items returnsto 1 7 bar pressure, respectively. The manufac-the pump to near-new condition, since the mainturer claims linearity of better than 0.2% over thebearing surfaces are also replaced under the abovefull measuring range.procedure.
2.2.3. Control valve. A manually operated 3.1.3. Likely pump life. The model 9325 pumpcontrol valve was used to obtain variable system can be simply and economically refurbished, andpressure, and thus simulate water head. in theory can be kept in service for as long as the
spare parts are available from the manufacturer.2.2.4. Solar sensor. An ESTI silicon sensor
was used for global irradiance measurements 3.2. Motorduring the experiments with the SHURflo 9325
The DC motor is of ‘conventional’ permanentpump. It was serial no. ES1390, and was cali-magnet carbon-brush design, incorporating pro-brated at JRC-ISPRA in September 1994. The
22 prietary materials and processes. This design wascalibration factor at 258C, 1000 W m globalchosen in preference to the more modern alter-irradiance and AM 5 1.5 is 32.8060.02 mV. Thenatives (brushless DC) for reasons of economy,temperature correction coefficient is 0.00760.001
21 motor performance and service compatibility.mV 8C .
3.3. Controller2.2.5. Voltage and current measurements. Volt-A DC/DC converter, type LCB-G, is used asage values from the pump DC motor were con-
an interface between the SHURflo 9325 pump andverted to recordable signals by means of a voltagethe PV array (or other DC power source). Thedivider constructed by high precision resistors.main function of this controller is to maximise theMotor current was calculated by measuring volt-daily water output while providing protection forage across a high precision shunt.the pump. The controller can be used in 12 V DCand 24 V DC systems and features currentboosting for matching the load of the pump
3. SHURflo 9325 SUBMERSIBLE SOLAR PUMPmotor.
INFORMATION AND CHARACTERISTICSThe manufacturer’s general information con-
The SHURflo 9325 pumping system consists of cerning the pumping system under evaluation isa diaphragm pump, powered by a DC motor, presented in Table 1.while control is achieved by a DC/DC dedicated A cross-section of the pump and motor and theconverter. Details of the components are given parts in exploded view are presented in Fig. 2.below. In Fig. 2, letters correspond to:
456 C. Protogeropoulos and S. Pearce
Table 1. Technical specifications summary of the SHURflo pumping system
Pump Series: 9300Type: Three-chamber diaphragm positive displacement
Model no. tested: 9325-043-101Cam: 3 degree
Serial no. tested: 014689Manufactured: August 1996
21 5Design Q and P: 0.063 l s at 6.9310 Pa (1 gpm at 100 psi)Maximum head: 70.1 m (230 ft)
Maximum submersion: 30 mOutput port: 1 /2 inch (12.7 mm)Materials: High strength engineered plastics and stainless
steel fasteners and metal partsWeight: 2.72 kg
Dimensions: 305 mm395 mm
Motor Type: DC, permanent magnet, brushed, thermally protectedNominal voltage: 24 V DC
Maximum amperage: 4.0 ANominal power: 120 W
Controller Type: LCB-GMax. input voltage: 45 V DC (open circuit)
Start-up voltage, 12 V: 12.5 V62% (one module)Start-up voltage, 24 V: 25.0 V62% (two modules in series)
Shut-down voltage: 28.0 VMaximum power: 150 W (PV/pump system)
Max. output current: 7 AFuse: 10 A
Self-consumption: 25 mAOperation temperature: 2108C to 1458COver-temp. shut-down: 1808C
provided in the owner’s manual. These data areItem Description Quantitypresented in Fig. 4 for both 12 V and 24 V
A Cable 1 operational voltage modes.B Inner cable boot 1
The curves shown in Fig. 4 are indicative onlyC Outer cable boot 1of the pump performance and refer to fixedD Nut 1
E Screw (lift plate) 6 voltage operation. In Fig. 4, the reference voltageF Lift plate 1 for 12 V DC and 24 V DC modes is 18.6 V andG Outlet fitting 1 37.6 V, respectively. In system operation, whereH O-ring (outlet fitting) 1
the pump is coupled to a PV array, the solarI O-ring (lift plate) 3generator power is not constant, strongly depend-J Receptacle (cable adapter) 1
K Set screw (receptacle) 2 ing on the instantaneous variability of globalL Screw (motor) 3 irradiance, thus affecting the operation point ofM Filter screen 1 the pump. In practice, voltage will vary with head.N Upper housing 1
The motor voltage change as a function of headO O-ring (upper housing) 2and global irradiance is presented in Section 4.5.P Spring (bypass) 3
Q Poppet (bypass) 3R Valve housing assembly 1S Lower housing assembly 1T Motor 1
4. SHURflo 9325 INSTANTANEOUSU Canister 1V Screw (canister) 3 PERFORMANCE EVALUATIONW Lock washer (motor screw) 3
4.1. Method of testing
In the instantaneous performance pump evalua-tion, the experimental measurements refer to.
A general view of an assembled SHURflo 9325 water flow, equivalent head, DC motor voltagesolar pump is shown in Fig. 3. and current, and global irradiance on the array
Additional information on the pump hourly plane. At 12 V configuration, using one, two andflow rate as a function of the vertical lift is three BP255F solar modules, the nominal PV

Laboratory evaluation and system sizing charts for a ‘second generation’ submersible solar pump 457
Fig. 2. Engineering and design details of a SHURflo, type 9325 solar pump.
power was 55 W, 110 W and 165 W, respectively. level was achieved at 12:00 h, with the PV arrayFor 24 V mode, the 110 W and 220 W tests were surface tilt adjusted to be vertical to the sun. Thecarried out with two and four BP255F modules, other two global irradiance levels were obtainedwhile two BP585F modules were used for the 170 W in afternoon and late afternoon hours.experiment. The tests were carried out at CRES, In all cases, the measuring period for a headoutdoors, during clear blue-sky summer days, at versus water flow characteristic was aroundthree representative global irradiance levels, 1000 2 min. In this time, change in global irradiance
22 22 22W m , 700 W m and 400 W m . These was negligible. After setting the array power andvalues were selected in order to characterise the voltage mode, measurements started at atmos-pumping system in a representative range of solar pheric pressure, corresponding to almost 0 m
22power input. The 1000 W m global irradiance head, towards higher values. Measurements were

458 C. Protogeropoulos and S. Pearce
4.2. Calculations
The instantaneous hydraulic power is given by
P 5 rghQ. (1)hyd
As it is seen in Fig. 1, the voltage and currentmeasurements were taken in points 6 and 7,respectively, between the SHURflo dedicatedcontroller and the pump DC motor. Thus, control-ler losses are not included in the calculations.
The DC motor input power is the product
P 5 I V . (2)M M M
Hydraulic efficiency is the ratio between hy-draulic output and controller output and is calcu-lated, in %, by
h 5 (P /P ) 3 100. (3)hyd hyd M
4.3. SHURflo 9325 instantaneous performanceat 12 V mode
The SHURflo model 9325 pump operates on anominal supply voltage of 24 V DC. However,the motor used to power the pump will run with awide range of voltage with no resulting damage. Itis this feature of the pump that is used tocharacterise the LCB-G controller.
Unlike an MPP tracker, the LCB-G controller isdesigned to maximise current supplied to thepump motor under varying PV input power.Under high radiation, the pump and moduleimpedance is matched 100%, provided that PVoutput current is higher than pump motor demand.Under lower input power, the LCB-G acts as animpedance converter, providing lower voltage butFig. 3. View of a SHURflo 9325 solar pump with basichigher current to the pump motor.dimensions.
The SHURflo pump instantaneous head versuswater flow characteristics at 12 V are presented inFigs. 5–7, while the hydraulic efficiency versus
taken in the whole range of equivalent head, up to head characteristics are shown in Figs. 8–10.70 m. In case that a h vs. Q curve was not As it is seen in Figs. 5–7, the maximum in-
21satisfactory, the measurements were repeated. The stantaneous water flow at 12 V mode is |370 l haccuracy of the measurements depends on the at 5 m head, irrespective of the input power. Sinceaccuracy of the individual measuring equipment the pump is a positive displacement type, pump(see Section 2.2), and is 61.2% in normal output is proportional to motor speed. At lowmeasuring conditions. heads, the pump performance is limited by the
Note that for the water flow Q, although the SI maximum output voltage of the LCB-G controller3 21unit is (m s ), in the figures presented in this to prevent motor overload in peak sun conditions.
21paper, the unit (l h ) is used. Due to the Comparing the characteristics of Figs. 6 and 7, it22relatively small Q values of this pumping system is noticed that for 700 W m global irradiance and
compared to other general use pumps, the use of higher, water flow is almost constant for 110 Wpthe original SI unit would lead to confusion at low or 165 Wp solar array power. Therefore, thewater flow rates. three-module configuration should be selected if

Laboratory evaluation and system sizing charts for a ‘second generation’ submersible solar pump 459
Fig. 4. Manufacturer’s data on the performance of a SHURflo 9325 pump.
only high water flow is needed even at relatively results for a ‘first generation’ pump were obtained22low irradiance, e.g. 400 W m . in AVICENNE, see Appendix A, Fig. A.2. This
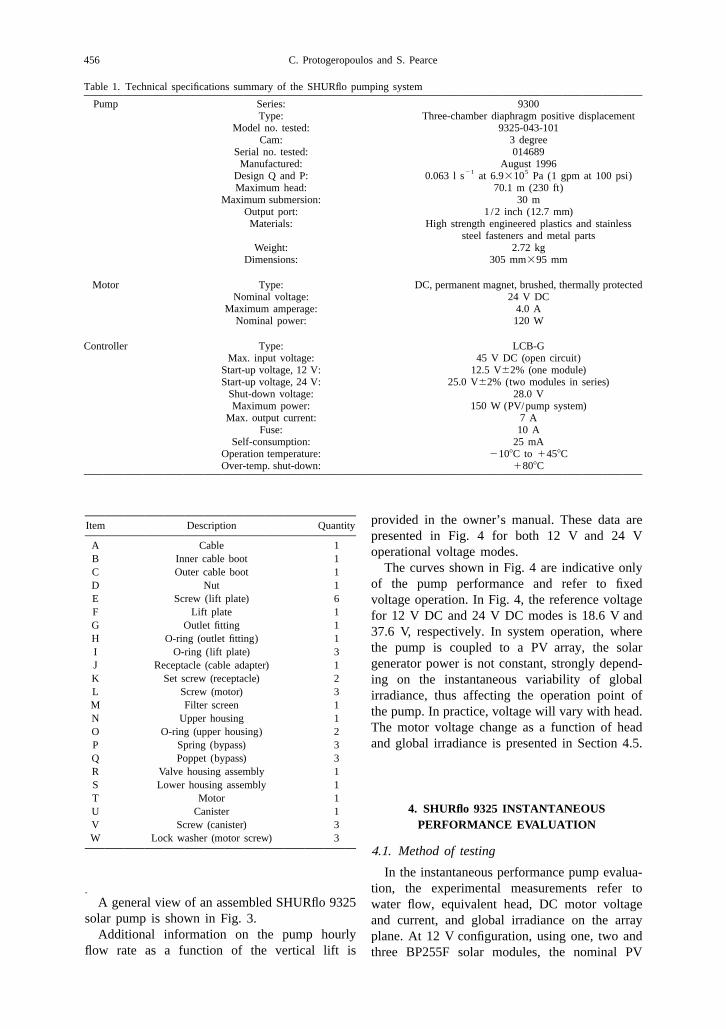
The hydraulic efficiency (controller output to comparison shows a substantial technologicalwater), of the SHURflo solar water pumping 9325 improvement in low-power ‘second generation’system at 12 V mode reached 60%, irrespective of water pumping systems as hydraulic efficiencythe input power. This is seen in Figs. 8–10; the has been doubled.optimum efficiency was obtained between 20 m
4.4. SHURflo 9325 instantaneous performanceand 40 m water lift. The maximum hydraulicat 24 V modeefficiency of a ‘first generation’ 1.5 kWp centrifu-
gal solar water pumping system tested under the The SHURflo pump instantaneous head versussame conditions at CRES (see Protogeropoulos water flow characteristics at 24 V mode areand Tselikis, 1997) was around 28%. Similar presented in Figs. 11–13, while the hydraulic
Fig. 5. SHURflo 9325 h vs. Q characteristics at 12 V mode and 55 Wp array power.

460 C. Protogeropoulos and S. Pearce
Fig. 6. SHURflo 9325 h vs. Q characteristics at 12 V mode and 110 Wp array power.
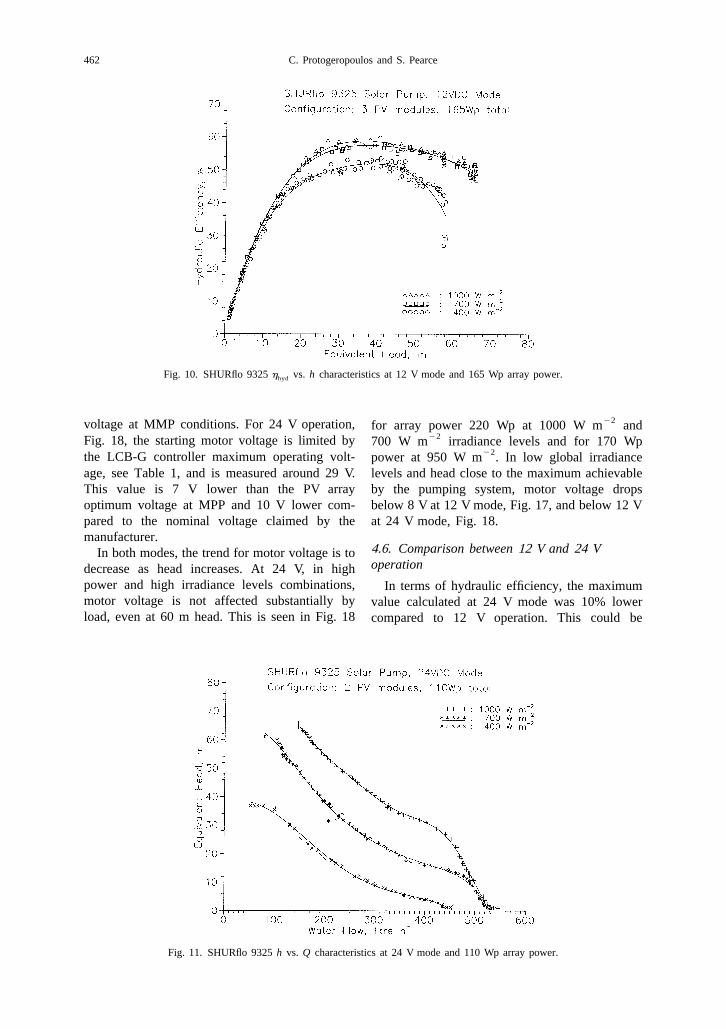
efficiency versus head curves are shown in Figs. The use of two PV modules connected in series14–16. of total 110 Wp would result in moderate water
At 24 V operation and 5 m head, the instanta- delivery as shown by the characteristics in Fig.21neous water flow is around 500 l h for all PV 11. For a 170 Wp PV array, Fig. 12, the water
module configurations as is noticed in Figs. 11–13. supply improves, although a distinctive ‘knee’ on21 22That is 130 l h more compared to the 12 V the curve at 700 W m irradiance occurs at |30 m
mode, i.e. 35.1% increase of water delivery at head. The situation improves for 220 Wp array,shallow conditions. At 24 V mode and almost 0 m Fig. 13, where the combination of 2p/2s modulehead, higher controller voltage results in higher connection shows the benefits of parallel con-DC motor speed compared to the 12 V mode. The nection at 24 V mode.manufacturer’s characteristics (dashed lines), As of the hydraulic efficiency at 24 V, theshown in Figs. 12 and 15 refer to fixed voltage maximum value calculated was 50% between 40 moperation. and 50 m head as is seen in Figs. 14–16 for 110
Fig. 7. SHURflo 9325 h vs. Q characteristics at 12 V mode and 165 Wp array power.

Laboratory evaluation and system sizing charts for a ‘second generation’ submersible solar pump 461
Fig. 8. SHURflo 9325 h vs. h characteristics at 12 V mode and 55 Wp array power.hyd
Wp, 170 Wp and 220 Wp PV array power, function of head with varying parameters PVrespectively. array power and global irradiance for 12 Vand 24 V
modes, respectively.4.5. Motor voltage variation with head during As it is seen in Fig. 17, the measured DC motorinstantaneous testing voltage at shallow head for 12 V mode is between
As was mentioned in a previous section, practi- 17 V and 18 V in almost all cases. This voltagecally motor voltage changes with head. In Figs. 17 range is virtually identical to the manufacturer’sand 18, motor voltage values are presented as a value at very low heads and equal to the array
Fig. 9. SHURflo 9325 h vs. h characteristics at 12 V mode and 110 Wp array power.hyd
462 C. Protogeropoulos and S. Pearce
Fig. 10. SHURflo 9325 h vs. h characteristics at 12 V mode and 165 Wp array power.hyd
22voltage at MMP conditions. For 24 V operation, for array power 220 Wp at 1000 W m and22Fig. 18, the starting motor voltage is limited by 700 W m irradiance levels and for 170 Wp
22the LCB-G controller maximum operating volt- power at 950 W m . In low global irradianceage, see Table 1, and is measured around 29 V. levels and head close to the maximum achievableThis value is 7 V lower than the PV array by the pumping system, motor voltage dropsoptimum voltage at MPP and 10 V lower com- below 8 V at 12 V mode, Fig. 17, and below 12 Vpared to the nominal voltage claimed by the at 24 V mode, Fig. 18.manufacturer.
4.6. Comparison between 12 V and 24 VIn both modes, the trend for motor voltage is tooperationdecrease as head increases. At 24 V, in high
power and high irradiance levels combinations, In terms of hydraulic efficiency, the maximummotor voltage is not affected substantially by value calculated at 24 V mode was 10% lowerload, even at 60 m head. This is seen in Fig. 18 compared to 12 V operation. This could be
Fig. 11. SHURflo 9325 h vs. Q characteristics at 24 V mode and 110 Wp array power.

Laboratory evaluation and system sizing charts for a ‘second generation’ submersible solar pump 463
Fig. 12. SHURflo 9325 h vs. Q characteristics at 24 V mode and 170 Wp array power.
explained by the fact that motor voltage at 24 V when the available array power is in the rangemode is limited by the shut-down voltage of 28 V, 50 Wp and 130 Wp and head is between 30 m andsee technical specifications in Table 1. Thus, at 24 V 40 m in order to obtain maximum system ef-mode, the controller output voltage does not much ficiency. Parallel module connection offersto an array MPP operation, i.e. a voltage value of quicker start-up at low global irradiance valuesaround 36 V. It is thus concluded that an improve- and average water flow characteristics even atment on controller regulation is needed at 24 V heads close to 60 m.operation. However, at 24 V, the maximum ef- If the input PV power supply can be increased,ficiency of 50% is reached between 45 m and 55 e.g. four PV modules of around 200 Wp, them water head, i.e. 15 m higher compared to the 12 SHURflo system dedicated controller should thenV mode. be set at 24 V in order to maximise water de-
22The instantaneous SHURflo pump performance livery. For example, at 65 m head and 1000 W mevaluation shows that 12 V operation is preferable irradiance, the instantaneous water flow with a
Fig. 13. SHURflo 9325 h vs. Q characteristics at 24 V mode and 220 Wp array power.

464 C. Protogeropoulos and S. Pearce
Fig. 14. SHURflo 9325 h vs. h characteristics at 24 V mode and 110 Wp array power.hyd
170 Wp/24 V system (Fig. 12), is approximately the instantaneous performance characteristics pre-sented in the previous sections were used intwice as much compared to a 165 Wp/12 Vcombination with the PV module response atconfiguration (Fig. 7).different irradiance levels (Appendix B, TableB.1), a set of typical daily global irradiationprofiles (Appendix C, Fig. C.1), and the starting
5. SHURflo 9325 DAILY PERFORMANCE AND and stopping pump characteristics (Appendix D,SYSTEM SIZING CHARTS Fig. D.1).
It must be stressed that the results presented5.1. Method of calculation herein were obtained by using monocrystalline
In order to calculate the water delivery of a PV modules of 36 cells in series. A quantitativeSHURflo 9325 pumping system on a daily basis, analysis and the results for the effect of 33-cell
Fig. 15. SHURflo 9325 h vs. h characteristics at 24 V mode and 170 Wp array power.hyd

Laboratory evaluation and system sizing charts for a ‘second generation’ submersible solar pump 465
Fig. 16. SHURflo 9325 h vs. h characteristics at 24 V mode and 220 Wp array power.hyd
22and 36-cell type crystalline PV modules connected at the site of application. In steps of 3.6 MJ m22in series and in parallel on the operation of the (1 kWh m ), the global irradiation values vary be-
22 22 22SHURflo pumping system was presented by tween 7.2 MJ m (2 kWh m ) and 32.4 MJ m22Alonso-Abella et al. (1995). (9 kWh m ). A 2nd degree polynomial interpo-
lation between the calculated points was made.5.2. SHURflo 9325 daily water delivery
The characteristics presented in Figs. 19–265.3. Discussion of the resultsrefer to PV nominal power of 55 Wp, 110 Wp and
165 Wp at 12 V configuration and 110 Wp, 170 As it is seen in Fig. 19, very little water will beWp and 220 Wp at 24 V operation. Each figure delivered from a SHURflo 9325 system at sites orrefers to a particular total daily global irradiation time periods of extremely low irradiation, espe-
Fig. 17. SHURflo 9325 motor voltage at 12 V mode.

466 C. Protogeropoulos and S. Pearce
Fig. 18. SHURflo 9325 motor voltage at 24 V mode.
daily water delivery remains almost constant. Atcially for heads around 30 m and higher. Thethe same wattage, the system operation at 24 Vperformance of the pump is satisfactory for daily
22 would increase the water delivery, for the sameglobal irradiation of more than 14.4 MJ m22 head and daily irradiation values.(4 kWh m ), even with only 80 Wp array power,
The charts presented in Figs. 19–26 are valu-see Fig. 21.able for sizing a SHURflo 9325 solar-poweredFrom the results, the general conclusion is thatpumping system. The varying parameters are12 V system operation is preferable when low PV• daily solar energy resource on the array planearray power is available. The daily performance• nominal PV input powercalculations have shown that, at |160 Wp solar• operational voltagePV power, the characteristics level out, i.e. the
22Fig. 19. SHURflo daily water delivery, H57.2 MJ m .

Laboratory evaluation and system sizing charts for a ‘second generation’ submersible solar pump 467
22Fig. 20. SHURflo daily water delivery, H510.8 MJ m daily.
• well head 190 Wp and the system voltage should be set at24 V mode.• required water delivery.
As an example, a 9325 SHURflo pumpingsystem installed at a Mediterranean site and
6. ECONOMIC ANALYSISpowered by a 100 Wp PV array at 12 V, would3deliver 1.5 m water from a 50-m well in a The ‘end user’ product cost for a 200 Wp
22 22summer day of 28.8 MJ m (8 kWh m ) SHURflo 9325 pumping system is presented inirradiation on the array plane, see Fig. 25. Under Table 2.
3the same conditions, for 3.0 m water requirement The PV module cost in Table 2 was assumedon a daily basis, the PV array should be around $US 6.0 /Wp. The calculated total cost of
22Fig. 21. SHURflo daily water delivery, H514.4 MJ m daily.

468 C. Protogeropoulos and S. Pearce
22Fig. 22. SHURflo daily water delivery, H518.0 MJ m daily.
for the pumping system is calculated to be$US 2085 indicates that a ‘second generation’$US 86.low-power water pumping system offers an econ-
The hydraulic energy yield over the lifetimeomically attractive solution to the end user inperiod is a general criterion for the economicterms of capital investment. It must be stressedassessment of pumping systems. In this way,however, that a significant part of the system costconfusion between pumping systems of differentis due to the PV array. In this particular pumpingtechnologies, designs and input power require-system, the 200 Wp PV array accounts for aboutments is avoided. The hydraulic energy is the60% of the capital cost.productTypical maintenance activities for the pumping
system refer to replacement of the motor carbonE 5 P ta 5 rghQta. (4)hyd hydbrushes ($US 56) and the main pump diaphragm
drive ($US 30). Considering that maintenance isnecessary every year, the annual maintenance cost For long-term calculations, the availability of
22Fig. 23. SHURflo daily water delivery, H521.6 MJ m daily.
Laboratory evaluation and system sizing charts for a ‘second generation’ submersible solar pump 469
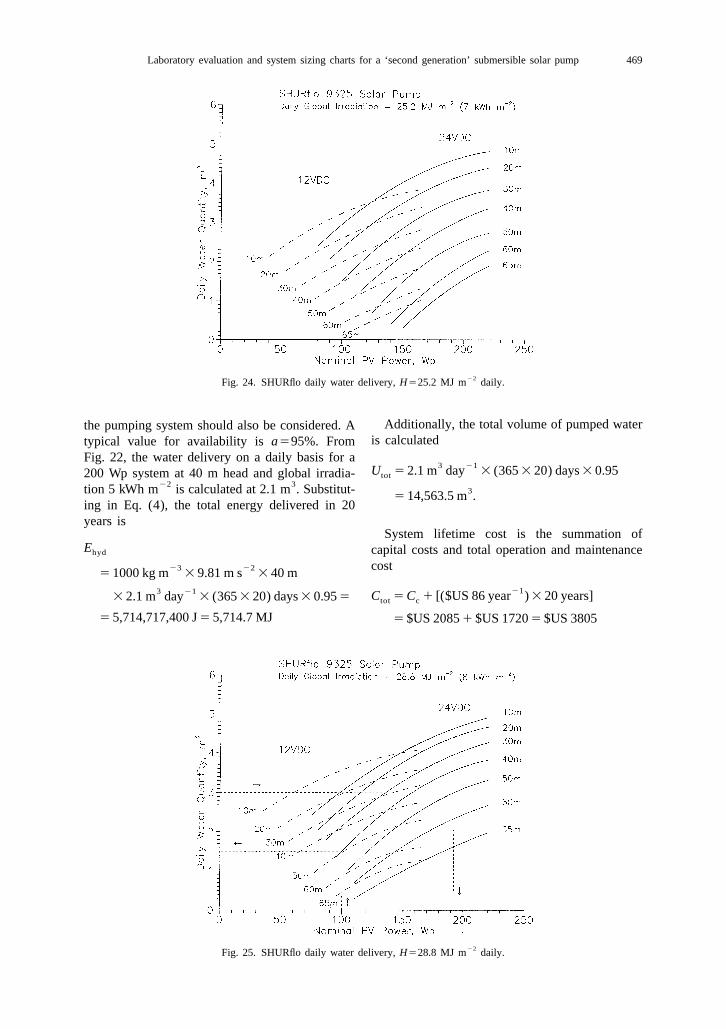
22Fig. 24. SHURflo daily water delivery, H525.2 MJ m daily.
Additionally, the total volume of pumped waterthe pumping system should also be considered. Ais calculatedtypical value for availability is a595%. From
Fig. 22, the water delivery on a daily basis for a3 21U 5 2.1 m day 3 (365 3 20) days 3 0.95200 Wp system at 40 m head and global irradia- tot
22 3tion 5 kWh m is calculated at 2.1 m . Substitut- 35 14,563.5 m .
ing in Eq. (4), the total energy delivered in 20years is
System lifetime cost is the summation ofE capital costs and total operation and maintenancehyd
cost23 225 1000 kg m 3 9.81 m s 3 40 m
213 21 C 5 C 1 [($US 86 year ) 3 20 years]3 2.1 m day 3 (365 3 20) days 3 0.95 5 tot c
5 5,714,717,400 J 5 5,714.7 MJ 5 $US 2085 1 $US 1720 5 $US 3805
22Fig. 25. SHURflo daily water delivery, H528.8 MJ m daily.

470 C. Protogeropoulos and S. Pearce
22Fig. 26. SHURflo daily water delivery, H532.4 MJ m daily.
Table 2. Cost breakdown for a SHURflo solar pumping system
Item Cost ($US), 1999 prices
Pump, type 9325 650Controller, type LCB-G75, including 235
well probes and other accessories200 Wp PV array 1200
System total 2085
The hydraulic energy cost is then The assumptions and the results for a SHURflosolar pumping system presented above are sum-21 21C 5 C E 5 $US 3805 3 (5714.7 MJ)hyd tot hyd marised in Table 3.
21 The system lifetime cost analysis shows that5 $US 0.67 MJthis ‘second generation’ pumping system has a
3specific cost of $US 0.26 per m water pumped.More indicative is the specific cost of waterThis is comparable, if not lower, to the presentpumped. This is calculated bytariff policy that water distribution companies21 3 21C 5 C U 5 $US 3805 3 (14,563.5 m )U tot tot follow in Europe.
235 $US 0.26 m As an example, the cost of potable water in
Table 3. Solar water pumping system lifetime cost analysis
System Pump type: SHURflo 9325Controller: LCB-G
Voltage: 24 V
22 22Assumptions Average daily H: 18.0 MJ m (5 kWh m )PV array: 200 WpHead, h: 40 m
PV cost per Wp: $US 6.0Total capital investment, C (Table 2): $US 2085c
Annual O&M cost: $US 86Pump availability, a: 95%
System lifetime: 20 years
3Calculations Daily water delivery, Fig. 22: 2.1 mTotal energy, E , Eq. (4): 5714.7 MJ (1587.4 kWh)hyd
3Total water pumped, U : 14,563.5 mtot
System lifetime cost, C : $US 3805tot21Energy cost, hydraulic, C : $US 0.67 MJhyd
23Cost of water pumped, C : $US 0.26 mU

Laboratory evaluation and system sizing charts for a ‘second generation’ submersible solar pump 471
Table 4. Water tariff in the household sector in Greece3Water consumption (m ) Cost of potable water in Greece,
bills every 4 months, 1999 prices23 23(Drs m ) ($US m )
Up to 30 130 0.4231 to 60 150 0.4861 to 100 200 0.65101 to 150 300 0.97
More than 151 350 1.13
h head, (m)Greece as function of consumption is presented in 22H global irradiation, (J m )Table 4. I current, (A)
22 22g gravity, (m s ), g 5 9.81 m s22G global irradiance, (W m )
MPP maximum power point of a solar module /array7. CONCLUSIONSp parallel electrical connectionP power, (W)The performance of a low-cost SHURflo 9325
3 21 21Q water flow rate, (m s ) in equations, (l h ) or (lsolar pump coupled through a dedicated controller 21s ) in figuresto a small PV array was analysed in this paper. s series electrical connection
t timeThis ‘second generation’ water pumping systemT temperature, (8C)has two operational modes, i.e. 12 V and 24 V. 3U water volume, (m )
The experimental results refer to both instanta- V voltage, (V)neous pump operation and daily performance
Greek symbolsunder different global irradiance profiles.b surface tilt, (degrees)
The instantaneous water flow versus head g azimuth angle, (degrees)23 23characteristics were functions of the global ir- r density, (kg m ), for water r 51000 kg m
h efficiency, (%)radiance on the array plane and the PV inputpower. The hydraulic efficiency was calculated Subscriptswith respect to head and reached 60% at 12 V c capital cost
hyd hydraulicoperation. From the measurements, it was conclu-M pump motorded that the 12 V system mode is preferable when max maximum
the available PV array is in the order of 80 Wp p peaktot totalto 130 Wp and head is below 30 m. For higher
heads up to 70 m and maximum daily waterdelivery, the voltage should be set at 24 V, APPENDIX Aprovided that adequate PV input power is avail-
The main results obtained in the AVICENNEable, e.g. more than 150 Wp.project, contract No. AVI-CT94-0004, from lab-The daily operation charts of the SHURflooratory testing of solar-powered pumps are pre-9325 pumping system can be used for sizing,sented in this section. The experimental data weretaking into account the required daily waterkindly provided by Oldach (1999), and the crucialquantity, the lift, the nominal PV power, the dailyfigures were reproduced for use in this paper.total solar energy of the site and the system
Most of the pumps chosen for testing werevoltage.‘second generation’ pumps, representing the stateThe economic assessment showed that theof the art in pumping technology. Additionally, a‘second generation’ solar low-power pumping‘first generation’ centrifugal solar pump wassystems have a relatively low investment cost.included in the tests to enable comparison of theMore important to the end user is the fact that, on
3 performance.the lifetime basis, the cost per m dischargedA range of tests was carried out as part of thewater is of the order, if not lower, of the present
so-called, round-robin test programme, betweenprices of water utility companies in urban areas.the participating laboratories. The test programmewas split into laboratory testing and field testing.
NOMENCLATURE Information on the types of solar pumps tested arepresented in Table A.1.
a availabilityIn Fig. A.1 is shown the head versus water flowC cost, ($US)
E energy, (J) instantaneous characteristics of six different

472 C. Protogeropoulos and S. Pearce
Table A.1. Solar pump types tested in AVICENNE No. AVI-CT94-0004 project
Pump ID no. Type PV array power (W)
1 Single-acting positive displacement pump 100(piston pump, ‘second generation’)
2 Centrifugal (‘first generation’ pump) 4003 Diaphragm (‘second generation’ pump) 604 Diaphragm (‘second generation’ pump) 755 Helical rotor (progressive cavity, ‘second 400
generation’ pump)6 Helical rotor (progressive cavity, ‘second 400
generation’ pump)
Fig. A.1. Water flow rate vs. head for solar pumps tested in AVI-CT94-0004 project.
pumps, while Fig. A.2 presents the hydraulic as is illustrated in Fig. A.1. Fig. A.2 shows thatefficiency against normalised head for the pumps there are considerable differences in the perform-tested. Heads were normalised by dividing actual ance of the pumping systems tested. In all cases,values by the optimum head. the maximum hydraulic efficiency was obtained
The pumps chosen for testing encompass a for normalised head51. The ‘first generation’range of heads, water flow rates and power levels centrifugal pump (Pump 2), reached a maximum
Fig. A.2. Efficiency vs. normalised head for solar pumps tested in AVI-CT94-0004.
Laboratory evaluation and system sizing charts for a ‘second generation’ submersible solar pump 473
22 22Table B.1. PV module response, T5258C (9 kWh m ) the highest, in steps of 3.6 MJ m22 22G (W m ) Solar module type (1 kWh m ).
BP255F BP585F The profiles calculated in Fig. C.1 refer to clearP (W) P (W)max max blue-sky days and they were used for the calcula-
100 4.4 6.7 tions of the daily water delivery of a SHURflo200 10.1 15.6
9325 solar pumping system.300 15.7 24.3400 21.3 32.9500 27.0 41.6600 32.6 50.3 APPENDIX D700 38.3 59.0800 43.9 67.7 Solar pump start / stop thresholds are important900 49.5 76.4 in assessing the daily performance of a system in1000 55.0 85.0
terms of water delivery. The test aims to de-termine the values of the PV array nominal power
efficiency of less than 30%. In contrast, all at which a pumping system will start and stop, as‘second generation’ solar pumps obtained ef- solar power increases from zero and decreases,ficiencies of more than 40%. An exceptional respectively. The starting and stopping points areperformance is noticed for the two helical rotor a function of array power and nominal head.pumps (Pump 5 and Pump 6), that achieved a The starting and stopping conditions for thepeak efficiency above 70%. For the end user, a 9325 SHURflo pump were kindly provided byhigher efficiency results in more water being Alonso-Abella (1997). In Fig. D.1, the startingdelivered at the same input power. and stopping pump characteristics are presented
as a function of PV power and head in both 12 Vand 24 V modes. These curves were taken intoaccount in the calculations of the pump operationAPPENDIX Bon a daily basis.
The power at the maximum point as a function The start-up and shut-down characteristics ofof the global irradiance of the two module types the 9325 pump strongly depend on the operationalused in the experiments with the SHURflo pump mode, i.e. 12 V or 24 V. For example, as it is seenis presented in Table B.1. in Fig. D.1, for head h530 m, the required PV in-
put power for the system to start pumping at 12 Vis 28 W. At 24 V mode, the starting point is 21.4%higher, i.e. 34 W. Thus, the 12 V configurationAPPENDIX Cprovides longer pump operation due to quicker
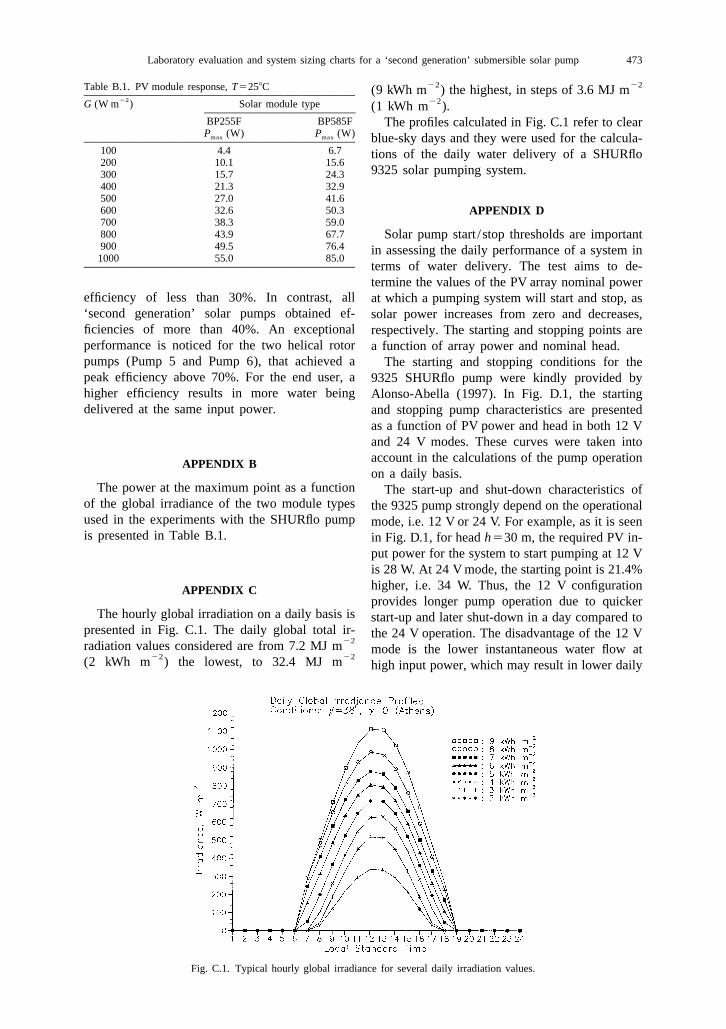
The hourly global irradiation on a daily basis is start-up and later shut-down in a day compared topresented in Fig. C.1. The daily global total ir- the 24 V operation. The disadvantage of the 12 V
22radiation values considered are from 7.2 MJ m mode is the lower instantaneous water flow at22 22(2 kWh m ) the lowest, to 32.4 MJ m high input power, which may result in lower daily
Fig. C.1. Typical hourly global irradiance for several daily irradiation values.

474 C. Protogeropoulos and S. Pearce
Fig. D.1. SHURflo 9325 starting and stopping thresholds.
Alonso-Abella M. (1997). Personal communication on 26water delivery. This also depends on the dailyNovember 1997, CIEMAT, Spain.
solar resource of the site on a yearly basis and the AVICENNE Programme (1995). In Concerted Action for theavailable PV array power. Testing and Cost Reduction of PV Water Pumping Systems,
Final Report, EC Contract No. AVI-CT94-0004.Oldach R. (1999). Personal communication on 16 September
1999, IT Power Ltd, UK.Protogeropoulos C. and Tselikis N. (1997) Technical evalua-REFERENCES
tion of a low-cost, low-power photovoltaic water pumpingAlonso-Abella M., Chenlo F. and Fabero F. (1995) Parameters DC system and comparison assessment with a typical
influencing the efficiency of DC powered PV pumping marketed PV pump. In Proceedings of the 14th Europeansystems. In Proceedings of the 13th European Photovoltaic Photovoltaic Solar Energy Conference, 30 June–4 July,Solar Energy Conference, 23 –27 October, Nice, France, p. Barcelona, Spain, Vol. II, p. 2542, H.S. Stephens and999, H.S. Stephens and Associates, UK. Associates, UK.
Related Documents