LABORATORY DATA CONSULTANTS, INC. 2701 Loker Ave. West, Suite 220, Carlsbad, CA 92010 Bus: 760-827-1100 Fax: 760-827-1099 AECOM November 24, 2021 1001 Bishop Street Suite 1600 Honolulu, HI 96813 ATTN: Ms. Alethea Ramos [email protected] SUBJECT: Red Hill Bulk Storage Facility, CTO 18F0126 - Data Validation Dear Ms. Ramos, Enclosed are the final validation reports for the fraction listed below. These SDGs were received on November 11, 2021. Attachment 1 is a summary of the samples that were reviewed for the analysis. LDC Project #52547B: SDG # Fraction B21101919 TPH as Extractables, TPH as Extractables (SGCU) The data validation was performed under Stage 2B & 4 validation guidelines. The analysis was validated using the following documents and variances, as applicable to the method: ! Work Plan/Scope of Work, Investigation and Remediation of Releases and Groundwater Protection and Evaluation, Red Hill Bulk Fuel Storage Facility, Joint Base Pearl Harbor - Hickam, O’ahu, Hawai’i (Revision 02, January 2017) ! Sampling and Analysis Plan, Investigation and Remediation of Releases and Groundwater Protection and Evaluation, Red Hill Bulk Fuel Storage Facility, Joint Base Pearl Harbor - Hickam, O’ahu, Hawai’i (Revision 01, April 2017) ! Sampling and Analysis Plan, Addendum 01, Investigation and Remediation of Releases and Groundwater Protection and Evaluation, Red Hill Bulk Fuel Storage Facility, Joint Base Pearl Harbor-Hickam, O’ahu, Hawai’i (Revision 00, September 2017) ! Sampling and Analysis Plan, Addendum 03, Investigation and Remediation of Releases and Groundwater Protection and Evaluation, Red Hill Bulk Fuel Storage Facility, Joint Base Pearl Harbor-Hickam, O’ahu, Hawai’i (Revision 00, June 2018) ! U.S. Department of Defense (DoD) Quality Systems Manual (QSM) for Environmental Laboratories, Version 5.3 (2019) ! DoD General Validation Guidelines (November 2019) ! U.S. Department of Defense (DoD) Data Validation Guidelines Module 4: Data Validation Procedure for Organic Analysis by GC (March 2021) ! EPA SW 846, Third Edition, Test Methods for Evaluating Solid Waste, update 1, July 1992; update IIA, August 1993; update II, September 1994; update IIB, January 1995; update III, December 1996; update IIIA, April 1998; IIIB, November 2004; update IV, February 2007; update V, July 2014; update VI, July 2018 Please feel free to contact us if you have any questions. Sincerely, Stella Cuenco Operations Manager/Senior Chemist [email protected] L:\AECOM\Red Hill\52547COV_B.wpd ADV t r , , , , , , , , , O [ ~- n~

Welcome message from author
This document is posted to help you gain knowledge. Please leave a comment to let me know what you think about it! Share it to your friends and learn new things together.
Transcript

LABORATORY DATA CONSULTANTS, INC. 2701 Loker Ave. West, Suite 220, Carlsbad, CA 92010 Bus: 760-827-1100 Fax: 760-827-1099
AECOM November 24, 20211001 Bishop Street Suite 1600Honolulu, HI 96813ATTN: Ms. Alethea [email protected]
SUBJECT: Red Hill Bulk Storage Facility, CTO 18F0126 - Data Validation
Dear Ms. Ramos,
Enclosed are the final validation reports for the fraction listed below. These SDGs were received on November 11, 2021. Attachment 1is a summary of the samples that were reviewed for the analysis.
LDC Project #52547B:
SDG # Fraction
B21101919 TPH as Extractables, TPH as Extractables (SGCU)
The data validation was performed under Stage 2B & 4 validation guidelines. The analysis was validated using the following documentsand variances, as applicable to the method:
! Work Plan/Scope of Work, Investigation and Remediation of Releases and Groundwater Protection and Evaluation, Red HillBulk Fuel Storage Facility, Joint Base Pearl Harbor - Hickam, O’ahu, Hawai’i (Revision 02, January 2017)
! Sampling and Analysis Plan, Investigation and Remediation of Releases and Groundwater Protection and Evaluation, Red HillBulk Fuel Storage Facility, Joint Base Pearl Harbor - Hickam, O’ahu, Hawai’i (Revision 01, April 2017)
! Sampling and Analysis Plan, Addendum 01, Investigation and Remediation of Releases and Groundwater Protection andEvaluation, Red Hill Bulk Fuel Storage Facility, Joint Base Pearl Harbor-Hickam, O’ahu, Hawai’i (Revision 00, September2017)
! Sampling and Analysis Plan, Addendum 03, Investigation and Remediation of Releases and Groundwater Protection andEvaluation, Red Hill Bulk Fuel Storage Facility, Joint Base Pearl Harbor-Hickam, O’ahu, Hawai’i (Revision 00, June 2018)
! U.S. Department of Defense (DoD) Quality Systems Manual (QSM) for Environmental Laboratories, Version 5.3 (2019)
! DoD General Validation Guidelines (November 2019)
! U.S. Department of Defense (DoD) Data Validation Guidelines Module 4: Data Validation Procedure for Organic Analysis byGC (March 2021)
! EPA SW 846, Third Edition, Test Methods for Evaluating Solid Waste, update 1, July 1992; update IIA, August 1993; updateII, September 1994; update IIB, January 1995; update III, December 1996; update IIIA, April 1998; IIIB, November 2004;update IV, February 2007; update V, July 2014; update VI, July 2018
Please feel free to contact us if you have any questions.
Sincerely,
Stella CuencoOperations Manager/Senior [email protected]
L:\AECOM\Red Hill\52547COV_B.wpd ADV
t ~ r
, , ,
, , , ,
, ,
r~~
O[ ~-
n~

74 pages-EM 3 DAY TAT Attachment 1
90/10 2B/4 EDD LDC# 52547 (AECOM - Honolulu, HI / Red Hill Bulk Storage Facility, CTO 18F0126)
LDC SDG#
DATE
REC'D
(2)
DATE
DUE
TPH-E
(8015C)
SGCU
TPH-E
(8015C)
Matrix: Water/Soil W S W S W S W S W S W S W S W S W S W S W S W S W S W S W S
B B21101919 11/11/21 11/16/21 6 0 3 0
B B21101919 11/11/21 11/16/21 1 0 1 0
Shaded cells indicate Level D validation (all other cells are Level C validation). These sample counts do not include MS/MSD, and DUPs L:\AECOM\Red Hill\52547ST-18F0126.wpd
LDC Report# 52547B8
Laboratory Data Consultants, Inc.
Project/Site Name:
LDC Report Date:
Parameters:
Validation Level:
Laboratory:
Data Validation Report
Red Hill Bulk Storage Facility, CTO 18F0126
November 16, 2021
Total Petroleum Hydrocarbons as Extractables
Stage 2B & 4
Energy Laboratories, Billings, MT
Sample Delivery Group (SDG): B21101919
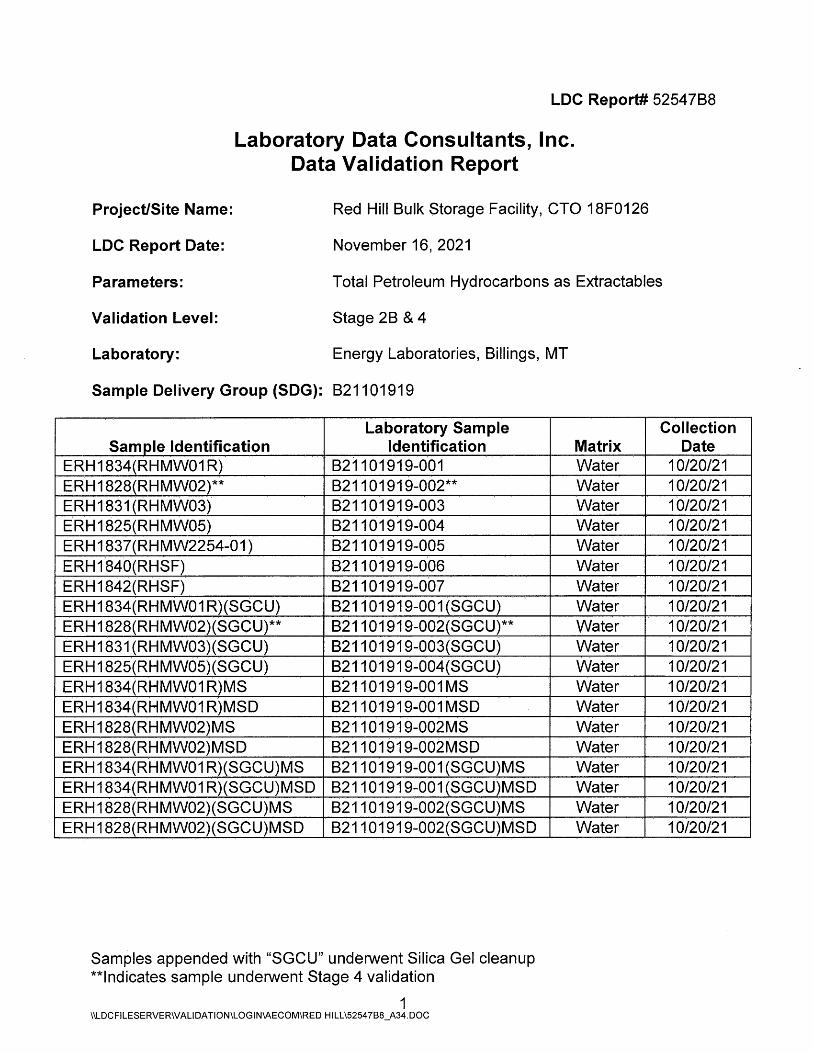
Laboratory Sample Collection Sample Identification Identification
ERH1834(RHMW01 R) B21101919-o'01 ERH1828(RHMW02)** B21101919-002** ERH1831 (RHMW03) B21101919-003 ERH1825(RHMW05) 821101919-004 ERH1837(RHMW2254-01) B21101919-005 ERH 1840(RHSF) B21101919-006 ERH 1842(RHSF) B21101919-007 ERH1834(RHMW01 R)(SGCU) B21101919-001 (SGCU) ERH 1828(RHMW02)(SGCU)** B21101919-002(SGCU)** ERH1831 (RHMW03)(SGCU) B21101919-003(SGCU) ERH1825(RHMW05)(SGCU) B21101919-004(SGCU) ERH1834(RHMW01 R)MS B21101919-001 MS ERH1834(RHMW01 R)MSD B21101919-001 MSD ERH1828(RHMW02)MS B21101919-002MS ERH1828(RHMW02)MSD B21101919-002MSD ERH 1834(RHMwo·1 R)(SGCU)MS 821101919-001 (SGCU)MS ERH1834(RHMW01 R)(SGCU)MSD B21101919-001 (SGCU)MSD ERH 1828(RHMW02)(SGCU)MS B21101919-002(SGCU)MS ERH1828(RHMW02)(SGCU)MSD B21101919-002(SGCU)MSD
Samples appended with "SGCU" underwent Silica Gel cleanup **Indicates sample underwent Stage 4 validation
1 \\LDCFILESERVER\VALIDATION\LOGIN\AECOM\RED HILL\52547B8_A34.DOC
Matrix Date Water 10/20/21 Water 10/20/21 Water 10/20/21 Water 10/20/21 Water 10/20/21 Water 10/20/21 Water 10/20/21 Water 10/20/21 Water 10/20/21 Water 10/20/21 Water 10/20/21 Water 10/20/21 Water 10/20/21 Water 10/20/21 Water 10/20/21 Water 10/20/21 Water 10/20/21 Water 10/20/21 Water 10/20/21
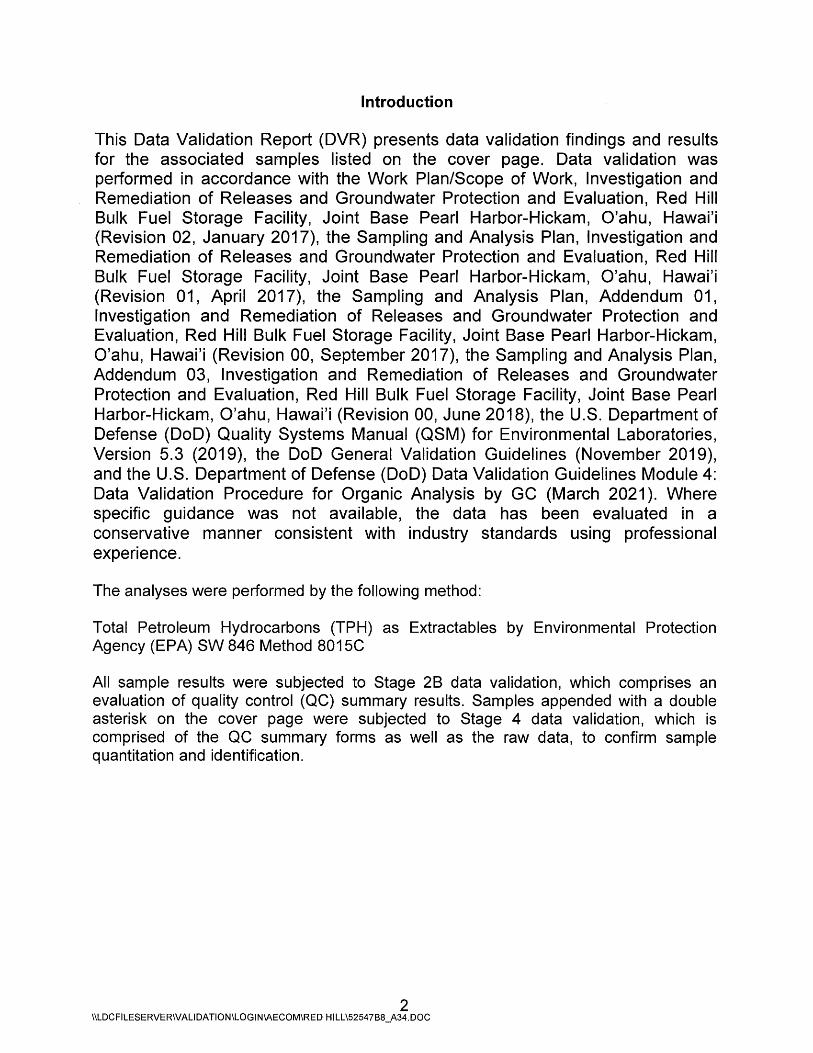
Introduction
This Data Validation Report (DVR) presents data validation findings and results for the associated samples listed on the cover page. Data validation was performed in accordance with the Work Plan/Scope of Work, Investigation and Remediation of Releases and Groundwater Protection and Evaluation, Red Hill Bulk Fuel Storage Facility, Joint Base Pearl Harbor-Hickam, O'ahu, Hawai'i (Revision 02, January 2017), the Sampling and Analysis Plan, Investigation and Remediation of Releases and Groundwater Protection and Evaluation, Red Hill Bulk Fuel Storage Facility, Joint Base Pearl Harbor-Hickam, O'ahu, Hawai'i (Revision 01, April 2017), the Sampling and Analysis Plan, Addendum 01, Investigation and Remediation of Releases and Groundwater Protection and Evaluation, Red Hill Bulk Fuel Storage Facility, Joint Base Pearl Harbor-Hickam, O'ahu, Hawai'i (Revision 00, September 2017), the Sampling and Analysis Plan, Addendum 03, Investigation and Remediation of Releases and Groundwater Protection and Evaluation, Red Hill Bulk Fuel Storage Facility, Joint Base Pearl Harbor-Hickam, O'ahu, Hawai'i (Revision 00, June 2018), the U.S. Department of Defense (DoD) Quality Systems Manual (QSM) for Environmental Laboratories, Version 5.3 (2019), the DoD General Validation Guidelines (November 2019), and the U.S. Department of Defense (DoD) Data Validation Guidelines Module 4: Data Validation Procedure for Organic Analysis by GC (March 2021 ). Where specific guidance was not available, the data has been evaluated in a conservative manner consistent with industry standards using professional experience.
The analyses were performed by the following method:
Total Petroleum Hydrocarbons (TPH) as Extractables by Environmental Protection Agency (EPA) SW 846 Method 8015C
All sample results were subjected to Stage 28 data validation, which comprises an evaluation of quality control (QC) summary results. Samples appended with a double asterisk on the cover page were subjected to Stage 4 data validation, which is comprised of the QC summary forms as well as the raw data, to confirm sample quantitation and identification.
2 \\LDCFILESERVER\VALIDATION\LOGIN\AECOM\RED HILL\5254788_A34.DOC
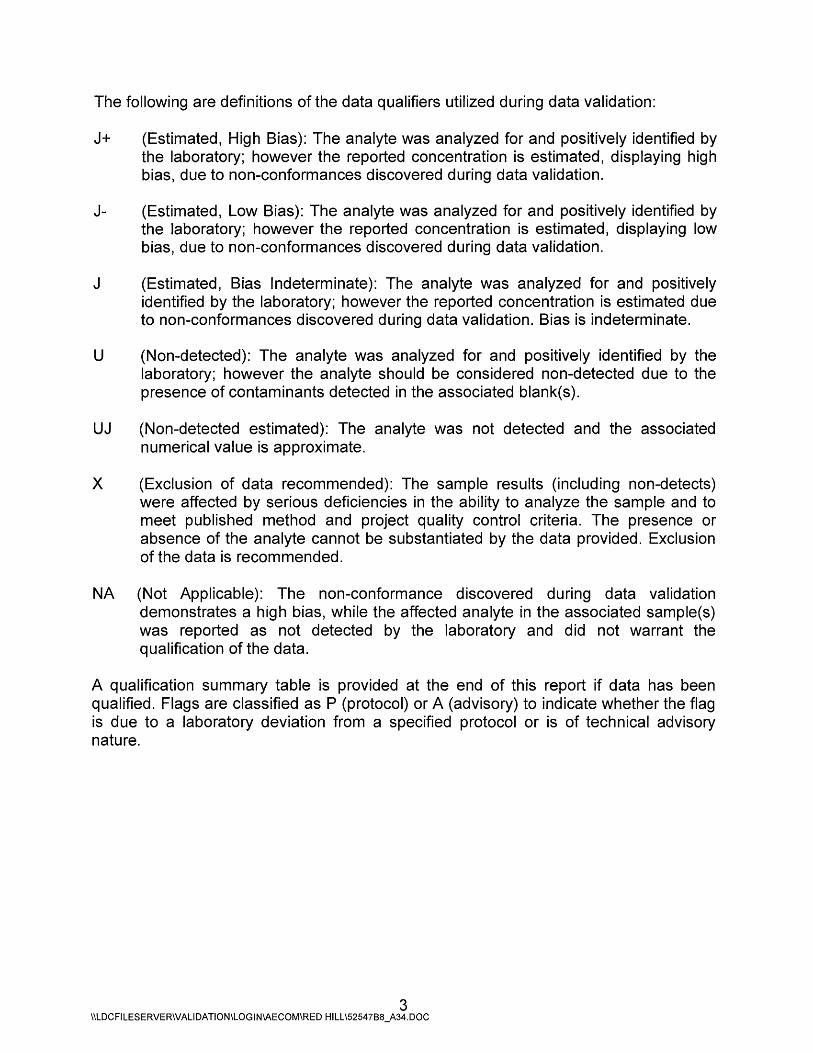
The following are definitions of the data qualifiers utilized during data validation:
J+ (Estimated, High Bias): The analyte was analyzed for and positively identified by the laboratory; however the reported concentration is estimated, displaying high bias, due to non-conformances discovered during data validation.
J- (Estimated, Low Bias): The analyte was analyzed for and positively identified by the laboratory; however the reported concentration is estimated, displaying low bias, due to non-conformances discovered during data validation.
J (Estimated, Bias Indeterminate): The analyte was analyzed for and positively identified by the laboratory; however the reported concentration is estimated due to non-conformances discovered during data validation. Bias is indeterminate.
U (Non-detected): The analyte was analyzed for and positively identified by the laboratory; however the analyte should be considered non-detected due to the presence of contaminants detected in the associated blank(s).
UJ (Non-detected estimated): The analyte was not detected and the associated numerical value is approximate.
X (Exclusion of data recommended): The sample results (including non-detects) were affected by serious deficiencies in the ability to analyze the sample and to meet published method and project quality control criteria. The presence or absence of the analyte cannot be substantiated by the data provided. Exclusion of the data is recommended.
NA (Not Applicable): The non-conformance discovered during data validation demonstrates a high bias, while the affected analyte in the associated sample(s) was reported as not detected by the laboratory and did not warrant the qualification of the data.
A qualification summary table is provided at the end of this report if data has been qualified. Flags are classified as P (protocol) or A (advisory) to indicate whether the flag is due to a laboratory deviation from a specified protocol or is of technical advisory nature.
3 \\LDCFILESERVER\VALIDATION\LOGIN\AECOM\RED HILL\52547B8_A34.DOC

Qualification Code Reference
a ICP Serial Dilution %D was not within control limits.
b Presumed contamination from preparation (method blank).
c Calibration %RSD, r, r2 , %Dor %R was noncompliant.
d The analysis with this flag should not be used because another more technically sound analysis is available.
e MS/MSD or Duplicate RPO was high.
f Presumed contamination from FB or ER.
g ICP ICS results were unsatisfactory.
h Holding times were exceeded.
Internal standard performance was unsatisfactory.
k Estimated Maximum Possible Concentration (HRGC/HRMS only)
LCS/LCSD %R was not within control limits.
m Result exceeded the calibration range.
o Cooler temperature or temperature blank was noncompliant and/or sample custody problems.
p RPO between two columns was high (GC only).
q MS/MSD recovery was not within control limits.
s Surrogate recovery was not within control limits.
t Presumed contamination from trip blank.
v Unusual problems found with the data not defined elsewhere. Description of the problem can be found in the validation report.
w LCS/LCSD RPO was high.
y Chemical recovery was not within control limits (Radiochemistry only).
4 \\LDCFILESERVER\VALIDATION\LOGIN\AECOM\RED HILL\5254788_A34.DOC
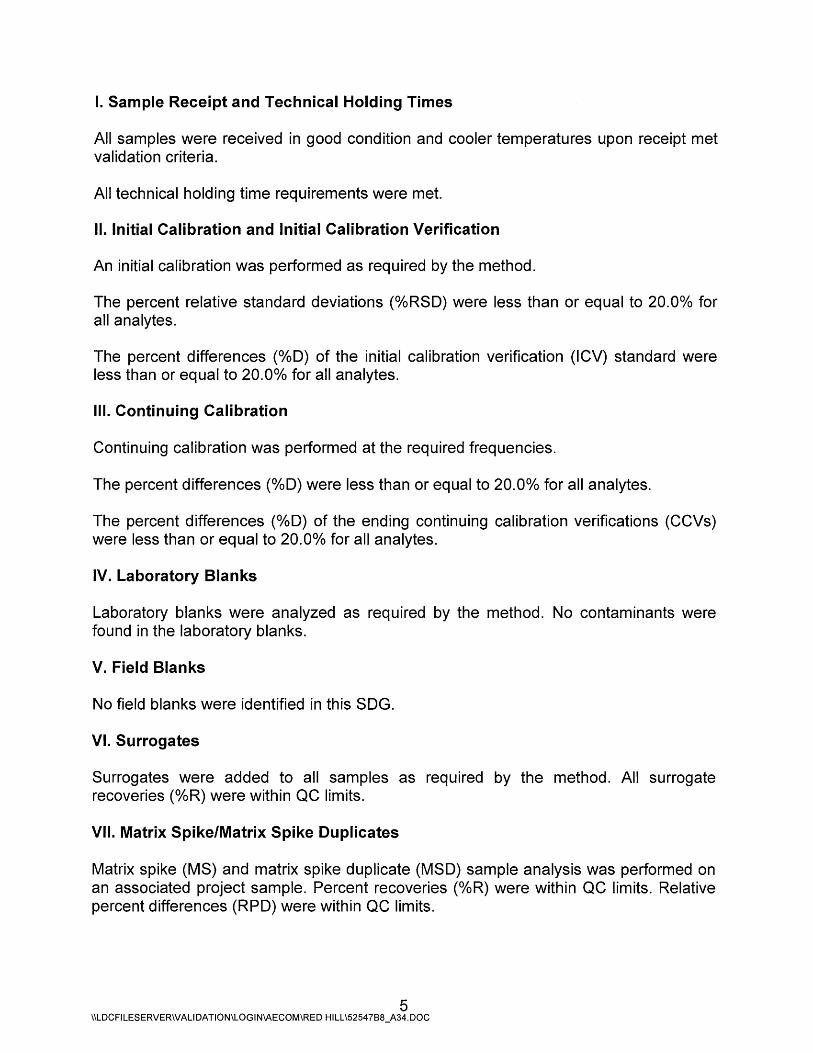
I. Sample Receipt and Technical Holding Times
All samples were received in good condition and cooler temperatures upon receipt met validation criteria.
All technical holding time requirements were met.
II. Initial Calibration and Initial Calibration Verification
An initial calibration was performed as required by the method.
The percent relative standard deviations (%RSD) were less than or equal to 20.0% for all analytes.
The percent differences (%D) of the initial calibration verification (ICV) standard were less than or equal to 20.0% for all analytes.
Ill. Continuing Calibration
Continuing calibration was performed at the required frequencies.
The percent differences (%D) were less than or equal to 20.0% for all analytes.
The percent differences (%D) of the ending continuing calibration verifications (CCVs) were less than or equal to 20.0% for all analytes.
IV. Laboratory Blanks
Laboratory blanks were analyzed as required by the method. No contaminants were found in the laboratory blanks.
V. Field Blanks
No field blanks were identified in this SDG.
VI. Surrogates
Surrogates were added to all samples as required by the method. All surrogate recoveries (%R) were within QC limits.
VII. Matrix Spike/Matrix Spike Duplicates
Matrix spike (MS) and matrix spike duplicate (MSD) sample analysis was performed on an associated project sample. Percent recoveries (%R) were within QC limits. Relative percent differences (RPO) were within QC limits.
5 \\LDCFILESERVER\VALIDATION\LOGIN\AECOM\RED HILL\52547B8_A34.DOC

VIII. Laboratory Control Samples
Laboratory control samples (LCS) were analyzed as required by the method. Percent recoveries (%R) were within QC limits.
IX. Field Duplicates
Samples ERH 1840(RHSF) and ERH 1842(RHSF) were identified as field duplicates. No results were detected in any of the samples.
X. Target Analyte Quantitation
All target analyte quantitations met validation criteria for samples which underwent Stage 4 validation. Raw data were not reviewed for Stage 28 validation.
XI. Target Analyte Identification
All target analyte identifications met validation criteria for samples which underwent Stage 4 validation. Raw data were not reviewed for Stage 28 validation.
XII. Overall Assessment of Data
The analysis was conducted within all specifications of the method. No results were rejected or recommended for exclusion in this SDG.
6 \\LDC Fl LESERVER\VALI DATION\LOG IN\AECOM\RED HI LL \5254 788 _A34. DOC
Red Hill Bulk Storage Facility, CTO 18F0126 Total Petroleum Hydrocarbons as Extractables - Data Qualification Summary -SDG 821101919
No Sample Data Qualified in this SDG
Red Hill Bulk Storage Facility, CTO 18F0126 Total Petroleum Hydrocarbons as Extractables - Laboratory Blank Data Qualification Summary - SDG 821101919
No Sample Data Qualified in this SDG
Red Hill Bulk Storage Facility, CTO 18F0126 Total Petroleum Hydrocarbons as Extractables - Field Blank Data Qualification Summary - SDG 821101919
No Sample Data Qualified in this SDG
7 \\LDC FILESERVER\VALIDATION\LOGIN\AECOM\RED HI LL \5254 7B8_A34. DOC

2
5 4
LDC #: 5254 7B8 SDG #: B21101919
VALIDATION COMPLETENESS WORKSHEET Stage 28/4
Laboratory: Energy Laboratories. Billings. MT
METHOD: GC Di8~81 Ran~ Organies (EPA SW 846 Method 8015C) -yt?\4 \::- 'j( t<°'- C. ~\o \a.I:)
Date:_ilW:i ),, ) Page:--lof--!
Reviewer: f 2nd Reviewer: __ ..__
The samples listed below were reviewed for each of the following validation areas. Validation findings are noted in attached validation findings worksheets.
I I I.
II.
Ill.
IV.
V.
VI.
VII.
VIII.
IX.
X.
XI.
YII
Note:
~alidatica A[ea
Sample receipt/Technical holdinq times
Initial calibration/lCV
Continuinq calibration ~"J
Laboratory Blanks
Field blanks
Surrogate spikes
Matrix spike/Matrix spike duplicates
Laboratory control samples
Field duplicates
Target analyte quantitation
Target analvte identification
().,,...r...,11 nf M...,+...,
A = Acceptable N = Not provided/applicable SW = See worksheet
lJ
** Indicates sample underwent Stage 4 validation
Client ID
1+ ERH1834(RHMW01 R)
l ERH 1828(RHMW02)**
+ 3 ERH1831 (RHMW03) -1-4 ERH 1825(RHMW05) -5 ERH1837(RHMW2254-01)
-6 ERH1840(RHSF) 0 _.. 7 ERH 1842(RHSF) 0 l ERH1834(RHMW01 R)(SGCU)
+ 9 ERH 1828(RHMW02)(SGCU)**
-t-10 ERH1831 (RHMW03)(SGCU)
"t 11 ERH1825(RHMW05)(SGCU)
12 ERH1834(RHMW01 R)MS
13 ERH1834(RHMW01 R)MSD
14 ERH1828(RHMW02)MS
15 ERH1828(RHMW02)MSD
16 ERH1834(RHMW01 R)(SGCU)MS
17 ERH1834(RHMW01 R)(SGCU)MSD
L:\AECOM\Red Hill\52547B8W.wpd
I I Ccmmeats
~ tA.. . A-1 f\ ·10 ~0 /\l\J ~ -iV -I ILJr) ~ {!...c..N 1:::- -,,a . {>.
tv
A ~
A l.~
tJ() 0 :::: (p '-,
A Not reviewed for Stage 28 validation.
~ Not reviewed for Stage 28 validation.
" ND= No compounds detected R = Rinsate FB = Field blank
.;
1
Lab ID
D = Duplicate TB = Trip blank EB = Equipment blank
821101919-001
821101919-002**
821101919-003
821101919-004
821101919-005
821101919-006
821101919-007
821101919-001 (SGCU)
821101919-002(SGCU)**
821101919-003(SGCU)
821101919-004(SGCU)
821101919-001 MS
821101919-001 MSD
B21101919-002MS
821101919-002MSD
821101919-001 (SGCU)MS
B21101919-001(SGCU)MSD
SB=Source blank OTHER:
Matrix Date
Water 10/20/21
Water 10/20/21
Water 10/20/21
Water 10/20/21
Water 10/20/21
Water 10/20/21
Water 10/20/21
Water 10/20/21
Water 10/20/21
Water 10/20/21
Water 10/20/21
Water 10/20/21
Water 10/20/21
Water 10/20/21
Water 10/20/21
Water 10/20/21
Water 10/20/21
I
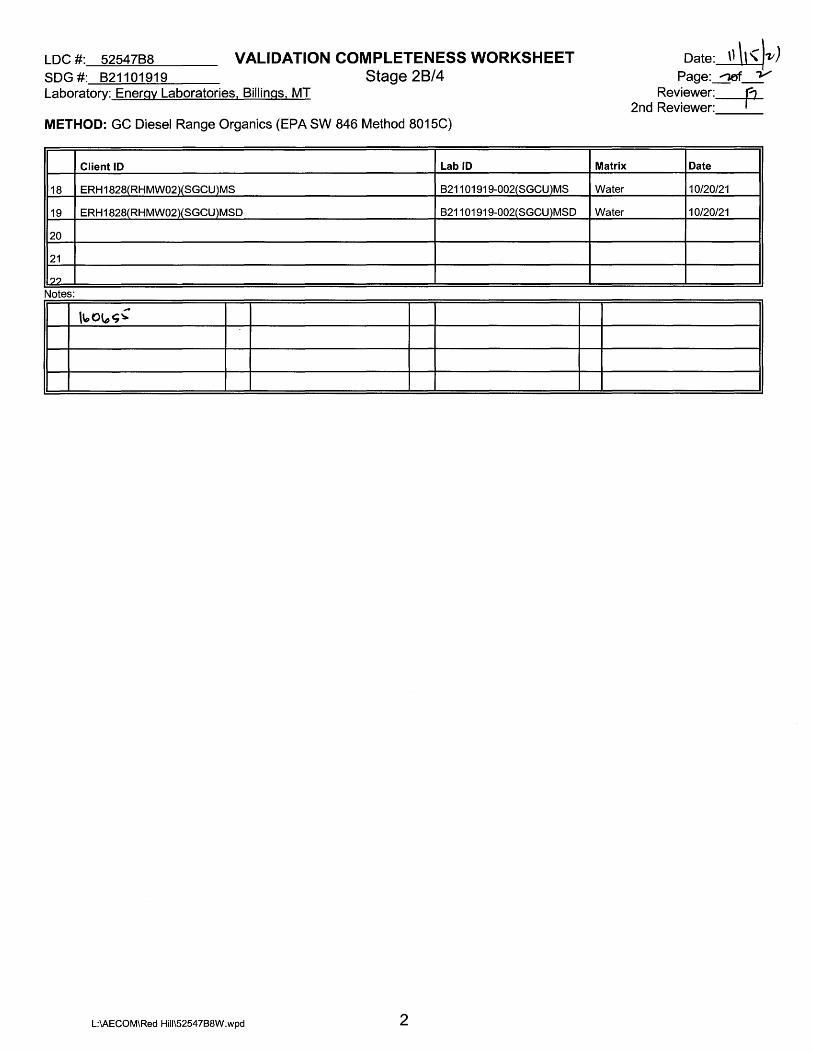
LDC #: 5254 788 SDG #: 821101919
VALIDATION COMPLETENESS WORKSHEET Stage 28/4
Laboratory: Energy Laboratories, Billings, MT
METHOD: GC Diesel Range Organics (EPA SW 846 Method 8015C)
Client ID Lab ID
18 ERH1828(RHMW02)(SGCU)MS B21101919-002(SGCU)MS
19 ERH1828(RHMW02)(SGCU)MSD B21101919-002(SGCU)MSD
20
21
'J'J
Notes·
\\oO\o<;'
L:\AECOM\Red Hill\5254788W.wpd 2
Matrix
Water
Water
Date:--11.s.Jv) Page: __:::!ffl ~
Reviewer: p 2nd Reviewer: __ _
Date
10/20/21
10/20/21
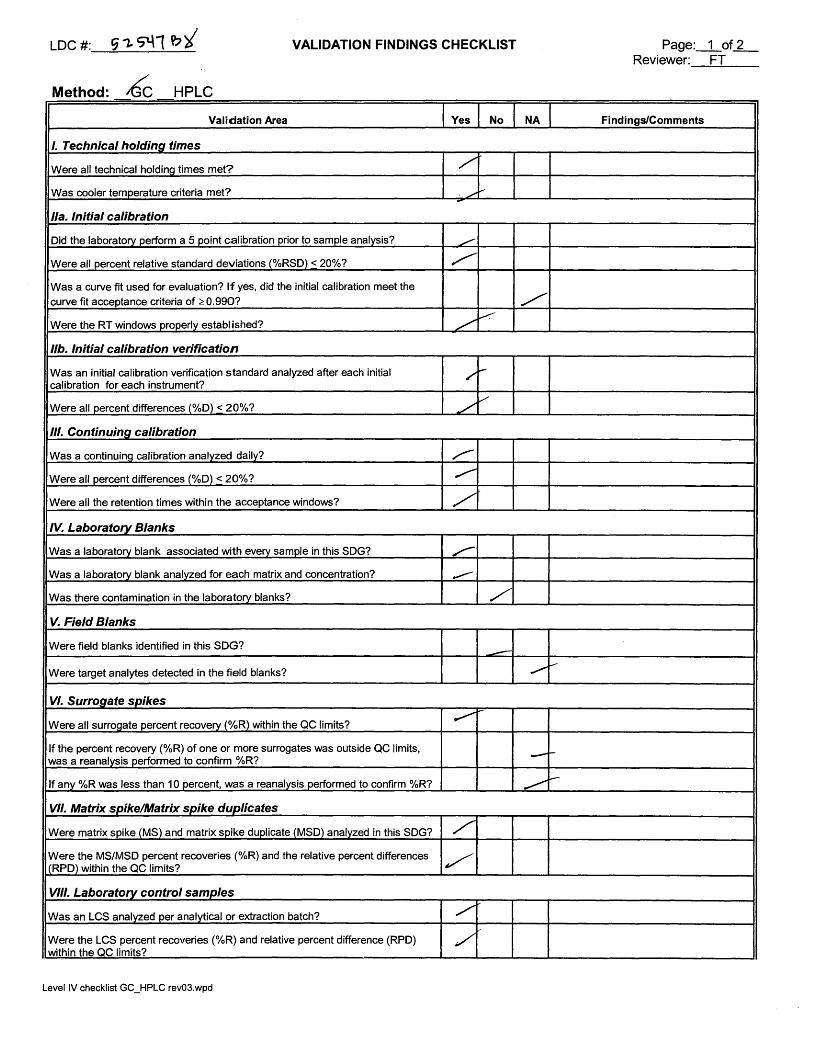
LDC#: VALIDATION FINDINGS CHECKLIST
Method: HPLC
Validation Area Yes No
I. Technical holding times
Were all technical holdinq times met? /
Was cooler temperature criteria met? ..,,..,,. -
Ila. Initial calibration
Did the laboratory perform a 5 point calibration prior to sample analysis? ..,,..,,.
Were all percent relative standard deviations (%RSO) < 20%? /" Was a curve fit used for evaluation? If yes, did the initial calibration meet the curve fit acceptance criteria of ~ 0.990?
Were the RT windows properly established? / .-:--
/lb. Initial calibration verification
Was an initial calibration verification standard analyzed after each initial / :.-
calibration for each instrument? /
Were all percent differences (%0) < 20%? /
/II. Continuing calibration
Was a continuinQ calibration analyzed dailv? /""
Were all percent differences (%0) < 20%? ,,,,,--
Were all the retention times within the acceptance windows? / IV. Laboratory Blanks
Was a laboratory blank associated with everv samole in this SOG? .,,,,--Was a laboratory blank analyzed for each matrix and concentration? ---Was there contamination in the laboratory blanks? / V. Field Blanks
Were field blanks identified in this SOG? -Were target analytes detected in the field blanks?
VI. Surrogate spikes
Were all surroQate percent recovery (%R) within the QC limits? ~
If the percent recovery (¾R) of one or more surrogates was outside QC limits, ~sa~~~~~~~~~ro~m%ITT
If any ¾R was less than 10 percent, was a reanalvsis performed to confirm %R?
VII. Matrix spike/Matrix spike duplicates
Were matrix spike (MS) and matrix spike duplicate (MSO) analyzed in this SOG? / Were the MS/MSO percent reroveries (¾R) and the relative percent differences ✓ (RPO) within the QC limits?
VIII. Laboratory control samples
Was an LCS analvzed per analytical or extraction batch? /
Were the LCS percent recoveries (¾R) and relative percent difference (RPO) // within the QC limits?
Level IV checklist GC_HPLC rev03.wpd
NA
/
.,,,, v
--.,,,,... ----
Page:_1_of _L_ Reviewer: FT
Findings/Comments

VALIDATION FINDINGS CHECKLIST Page: ___l_ of L_ Reviewer: FT
Validation Area Yes No NA Findings/Comments
IX. Field duplicates
Were field duplicate pairs identified in this SDG? /'
Were target analytes detected in the field duplicates? /
X. Target analyte quantitation
Did the laboratory LOQs/RLs meet the QAPP LOQs/RLs? /
Were analyte quantitation and Rls adjusted to reflect all sample dilutions and dry / weight factors applicable to level IV validation?
XI. Target analyte identification
Were the retention times of reported detects within the RT windows? /'
Were manual integrations reviewed and found acceptable? /
Did the laboratory provide before and after integration printouts? /
XIII. Overall assessment of data
Overall assessment of data was found to be acceptable. /I
Level IV checklist GC_HPLC rev03.wpd
LDC#: 5~ '51./7 /0 Y
METHOD:GC~ __ HPLC __ _
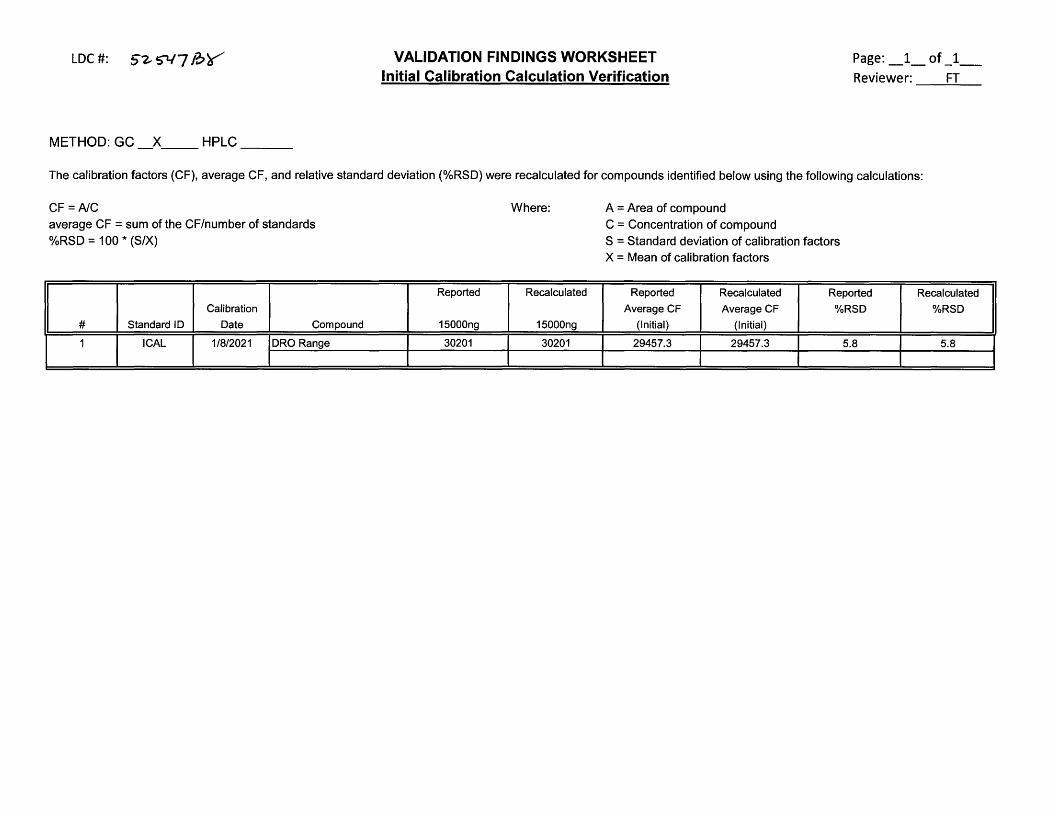
VALIDATION FINDINGS WORKSHEET Initial Calibration Calculation Verification
Page: _1_ of _1_
Reviewer: FT
The calibration factors (CF), average CF, and relative standard deviation (%RSD) were recalculated for compounds identified below using the following calculations:
CF= A/C average CF= sum of the CF/number of standards %RSD = 100 * (S/X)
Calibration
# Standard ID Date Compound
1 ICAL 1/8/2021 DRO Range
Where:
Reported Recalculated
15000ng 15000ng
30201 30201
A = Area of compound C = Concentration of compound S = Standard deviation of calibration factors X = Mean of calibration factors
Reported Recalculated Reported
Average CF Average CF %RSD
(Initial) (Initial)
29457.3 29457.3 5.8
Recalculated
%RSD
5.8

LDC #: S2- ':,-i/711:> ✓
METHOD: GC _X __ HPLC __ _
VALIDATION FINDINGS WORKSHEET Initial Calibration Calculation Verification
Page: _1_ of _1_
Reviewer: FT
The calibration factors (CF), average CF, and relative standard deviation (%RSD) were recalculated for compounds identified below using the following calculations:
CF= A/C average CF= sum of the CF/number of standards %RSD = 100 * (S/X)
Calibration
# Standard ID Date Compound
1 ICAL 2/18/2021 DRO Range
Where:
Reported Recalculated
5000ng 5000ng
28746 28746
A = Area of compound C = Concentration of compound S = Standard deviation of calibration factors X = Mean of calibration factors
Reported Recalculated Reported
Average CF Average CF ¾RSD
(Initial) (Initial)
28542.4 28542.4 4.5
Recalculated
¾RSD
4.5
LDC#: SJ. ~1-17Jay'
METHOD: GC /" HPLC ----
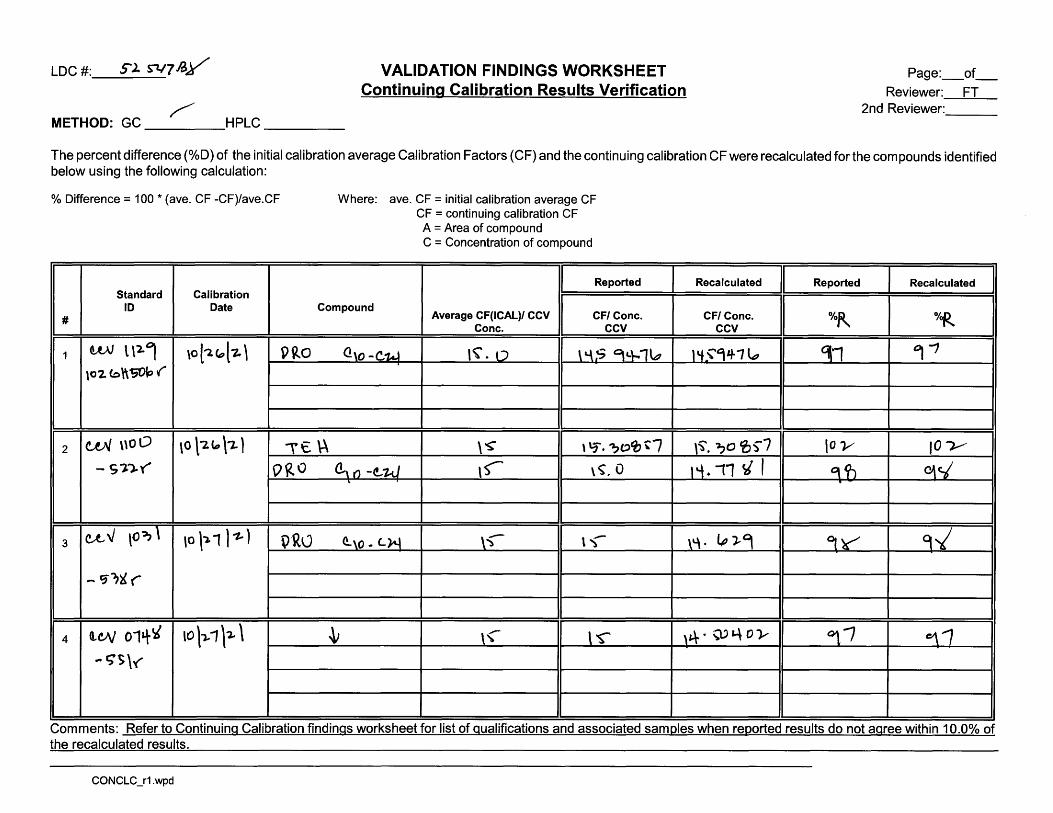
VALIDATION FINDINGS WORKSHEET Continuing Calibration Results Verification
Page:_of_
Reviewer:_fl 2nd Reviewer: __ _
The percent difference (%D) of the initial calibration average Calibration Factors (CF) and the continuing calibration CF were recalculated for the compounds identified below using the following calculation:
% Difference= 100 * (ave. CF -CF)/ave.CF
Standard Calibration
Where: ave. CF = initial calibration average CF CF = continuing calibration CF A = Area of compound C = Concentration of compound
I Reported
ID Date Compound Average CF(ICAL)/ CCV I CF/ Cone. #
Cone. CCV
1 UV l\'l-j ,o l 7. '° l-i. ' PRO Q\o-C-i.J '". 0 \ Lo\ $ 9 q ... 1 "'1
. \0'2.b\\~,('
2 u.Jt/\\00 10 \7. 1o \-z. l ,€ ~ \~ '13". 7t:J'bt7
- S1-~\""' ORO ~ () -e .. :i.J \) \~.o '
3 u✓ \O°>J \ 10 \~ 1 l -i- l QRlJ ~\O. L)'-1 \~ \ ")
- '3"?~ {
4 O,CA} 01&.\-~ lO \1-1 \~ \ ~ \' \~ .. ';'~\<
I Recalculated II Reported I Recalculated I I II I I
CF/ Cone. %R o/oP,._ CCV
1~5'441 '-4 ~1 °I -:1
\'~. ?0 't,5"7 fOY ,o..,,...,.,
1 '4 ♦ 11 c/ f q~ O\c/ .
\'-\ · ~ l-9 °t~ 9✓
\"t. OJ&-\ 0 y °11 t:-1\1
Comments: Refer to Continuing Calibration findings worksheet for list of qualifications and associated samples when reported results do not agree within 10.0% of the recalculated results.
CONCLC_r1 .wpd
LDC#: s- ? rs;-" 7 !bX
METHOD: ~C HPLC
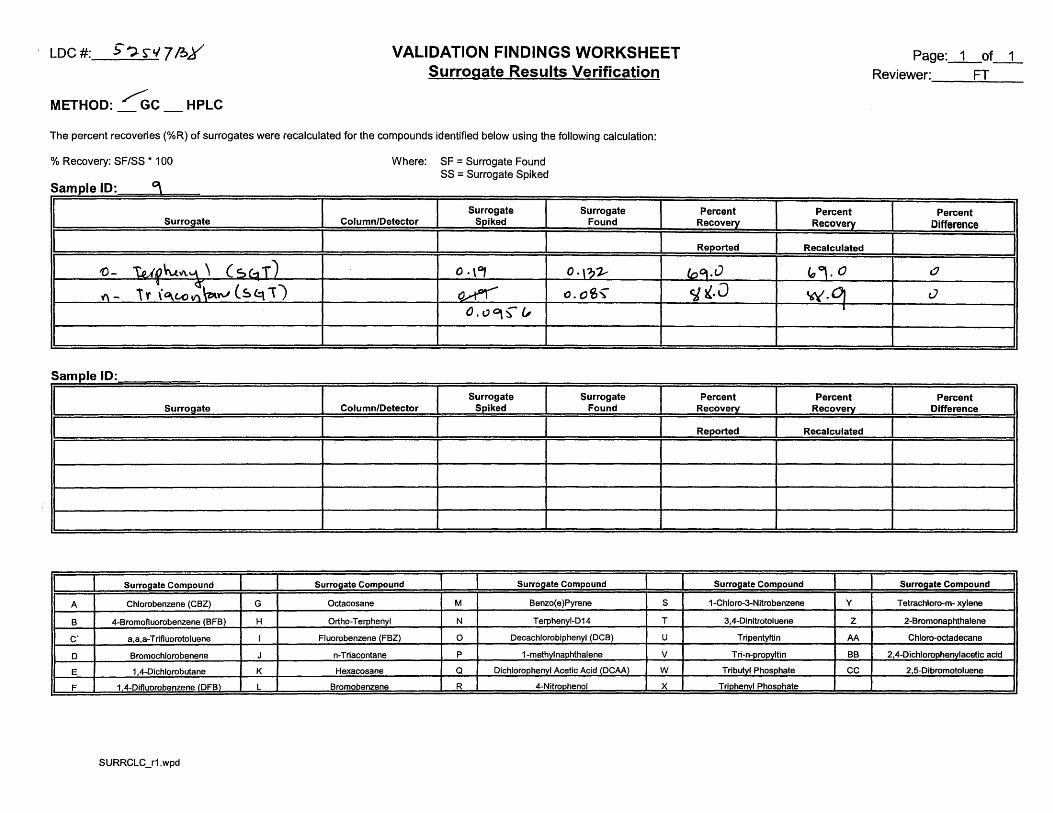
VALIDATION FINDINGS WORKSHEET Surrogate Result~Verification
The percent recoveries (%R) of surrogates were recalculated for the compounds identified below using the following calculation:
% Recovery: SF/SS * 100
----, -
Surrogate
I ,o_ 'to_.,{ 0 h.t II\.'-\ ' (sC-1T)
"'-1 <I; ( 1 r ( o..c.o \l\,~V\,I ~ l::\ 1 /
Sam~le ID: I
Surrogate
I
Surroaate Compound
A Chlorobenzene (CBZ) G
B 4-Bromofluorobenzene (BFB) H
c· a,a,a-Trifluorotoluene I
D Bromochlorobenene J
E 1,4-Dichlorobutane K
F 1 4-Difluorobenzene lDFB) L
SURRCLC_r1 .wpd
Where: SF = Surrogate Found SS = Surrogate Spiked
Surrogate Surrogate Column/Detector Spiked Found
I I I 0. \°1 0.\?2--
~ a.oS~ O,t,O\~v
Surrogate Surrogate Column/Detector Spiked Found
I I I
Surrogate Compound Surrogate Compound
Octacosane M Benzo(e)Pyrene
Ortho-Terphenyl N Terphenyl-D14
Fluorobenzene (FBZ) 0 Decachlorobiphenyl (DCB)
n-Triacontane p 1-methvlnaohthalene
Hexacosane Q Dichlorophenyl Acetic Acid (DCAA)
Bromobenzene R 4-Nitronhenol
I
I
s
T
u
V
w X
Page:_1 _of_1_ Reviewer: FT
Percent Percent Percent Recovery Recovery Difference
Reeorted I Recalculated I I tooi.o <o,.o CJ
siK•J w.OJ cJ I
Percent Percent Percent Recovery Recovery Difference
Reeorted I Recalculated I I
Surroaate Compound Surroaate Compound
1-Chloro-3-Nitrobenzene y T etrachloro-m- xylene
3,4-Dinitrotoluene z 2-Bromonaphthalene
Tripentyltin AA Chloro-octadecane
Tri-n-oroovltin BB 2,4-Dichloroohenvlacetic acid
Tributvl Phosohate cc 2,5-Dibromotoluene
Trinhenvl Phosohate
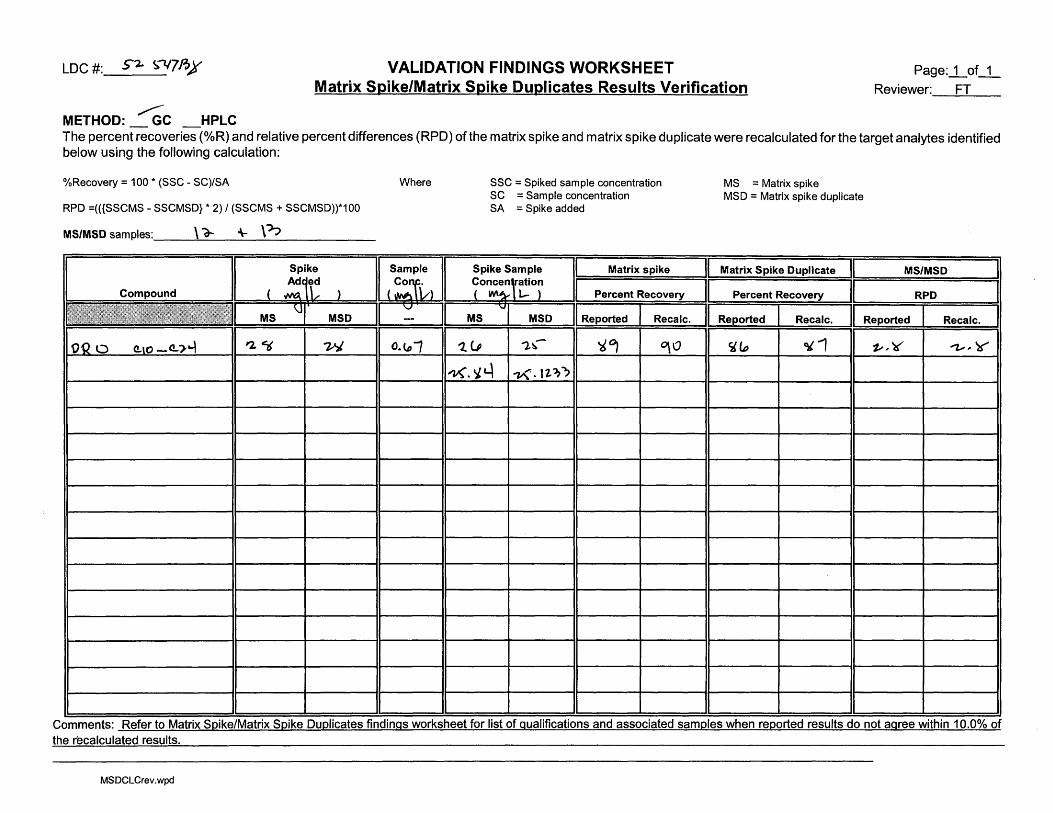
LDC#: S-7- ~·,qPJy VALIDATION FINDINGS WORKSHEET Page:_1_of_1_ Matrix Spike/Matrix Spike DuplicatesJ~esults Verification Reviewer: FT
METHOD:__::c;C _HPLC The percent recoveries (%R) and relative percent differences (RPO) of the matrix spike and matrix spike duplicate were recalculated for the target analytes identified below using the following calculation:
¾Recovery = 100 * (SSC - SC)/SA Where
RPO =(({SSCMS - SSCMSD} * 2) / (SSCMS + SSCMSD))*100
MS/MSD samples: \ o-- """ \ '?
I I Spike
~ Ade \~ Compound ( ..MtA )
liliil1il!!1!fli1lillil!iill1llll{l!lllf 1lrllilillltf 11!lll1l1IIJl!i1llill!li!I \J
.
MS MSD
OQo ct.10-C!..")~ "2. "is' w o.r.,,;
SSC = Spiked sample concentration SC = Sample concentration SA = Spike added
Spike Sample I Matrix spike Conce~lation ( W\~ L- ) I Percent Recovery
V I Reported I MS MSD Recalc.
"1 (.p "'l~ '6°1 qo
'v(. 'llY -i,(.12.??
MS = Matrix spike MSD = Matrix spike duplicate
II Matrix Spike Duplicate II MS/MSD I II II I Percent Recovery RPD
II Reeorted I II Reported I I Recalc. Recalc.
S!LIJ ~1 t,,, ){ '"1.,,,~
Comments: Refer to Matrix Spike/Matrix Spike Duplicates findings worksheet for list of qualifications and associated samples when reported results do not agree within 10.0% of the recalculated results.
MSDCLCrev.wpd
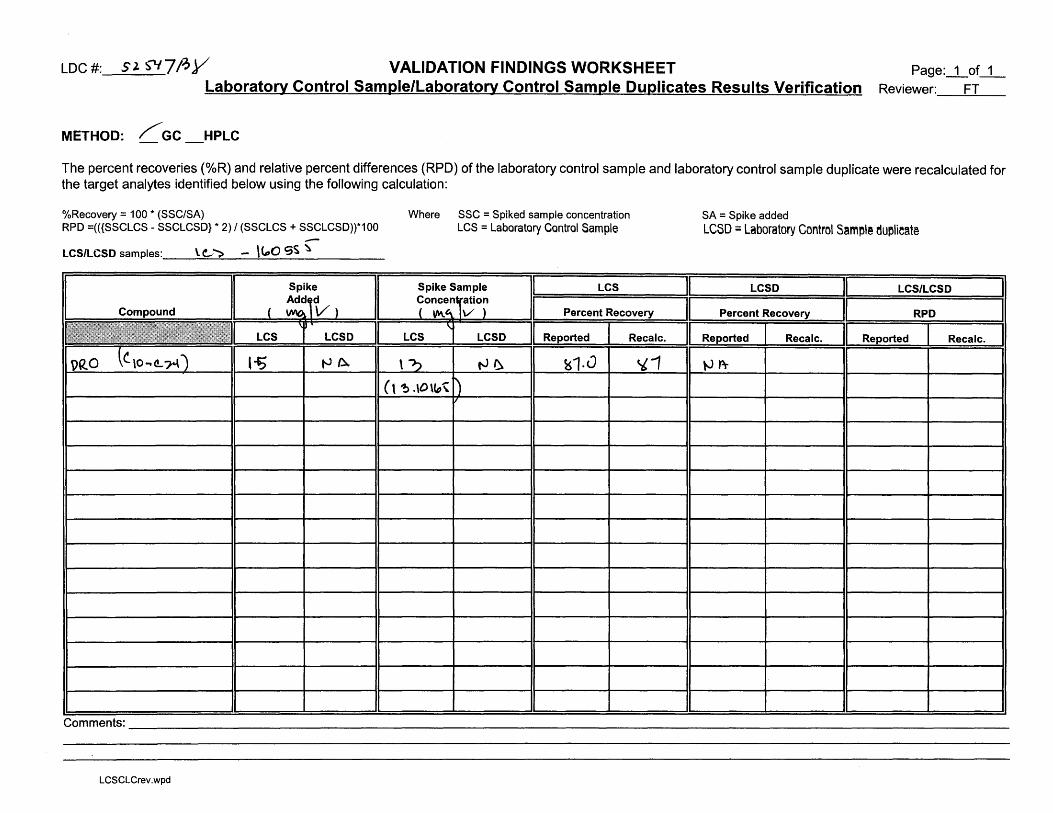
LDC#: si. ~]PJY VALIDATION FINDINGS WORKSHEET Page:_1_of_1_ Laboratory Control Sample/Laboratory Control Sample Duplicates R~sults Verification Reviewer: FT
METHOD: /' GC _HPLC
The percent recoveries (%R) and relative percent differences (RPO) of the laboratory control sample and laboratory control sample duplicate were recalculated for the target analytes identified below using the following calculation:
%Recovery= 100 * (SSC/SA) RPD =(({SSCLCS - SSCLCSD} * 2) / (SSCLCS + SSCLCSD))*100 -LCS/LCSD samples:_ LC..,""'> __ \ t,O SS ~
I I Spike
Ad~r Compound ( \M( V)
IIIII1l!iilll!'ilir]if1t1ill!t(lf:lltilil1llll[lil[l,ttfii!lfr!1ilil~i1i1!lfl1il ' .
LCS LCSD
~RO lt,o ... "-"") ,~ ""' ~
Where SSC= Spiked sample concentration LCS = Laboratory Control Sample
Spike Sample I LCS Conce~l
1ation I ( ~~ V ) Percent Recovery
' I Reported I LCS LCSD Recalc.
\? tJ~ ~1.0 ~, (t ~ .\D\(t,~ ~
V
SA = Spike added
LCSD = Laboratory Control Sami,le du~lie~t~
II LCSD II LCS/LCSD I II II I Percent Recovery RPD
II I II I I Reported Recalc. Reported Recalc.
µPt
Comments:-------------------------------------------------------------
LCSCLCrev.wpd
LDC#:
METHOD:
S l ~7B2(
~c HPLC
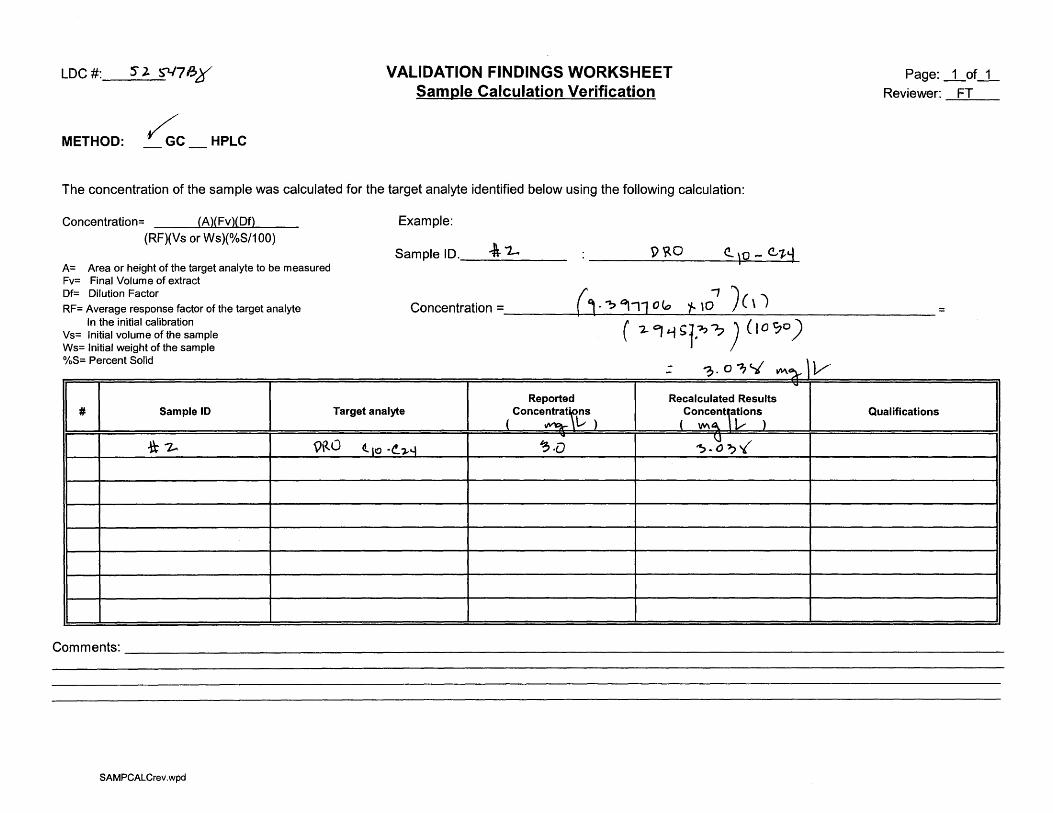
VALIDATION FINDINGS WORKSHEET SamQle Calculation Verification
The concentration of the sample was calculated for the target analyte identified below using the following calculation:
Concentration= (A)(Fv)(Df)
(RF)(Vs or Ws)(¾S/100)
A= Area or height of the target analyte to be measured Fv= Final Volume of extract
Example:
Sample ID. ,A. '1- \) 'RO ~ \0 - c..i~
Page: _1_of_1_
Reviewer: FT
Df= Dilution Factor RF= Average response factor of the target analyte Concentration = (, · °? "117 o lo 'f-- 10
1 ) ( I I =
In the initial calibration Vs= Initial volume of the sample Ws= Initial weight of the sample
( ;.. "'., f;r,,? ) (Io ':,O) %S= Percent Solid
"'3.0?r..../ , v - M~ -
"' Reported Recalculated Results
# Sample ID Target analyte Concentrati~rs Concent,ations Qualifications ( ~ \..,, ) ( W\°'-. I, )
~ \J * '2.. ~\lO ( IIO ·~l-'-1 '5-0 ~-O'}'I('
Comments: ---------------------------------------------------------
SAMPCALCrev.wpd
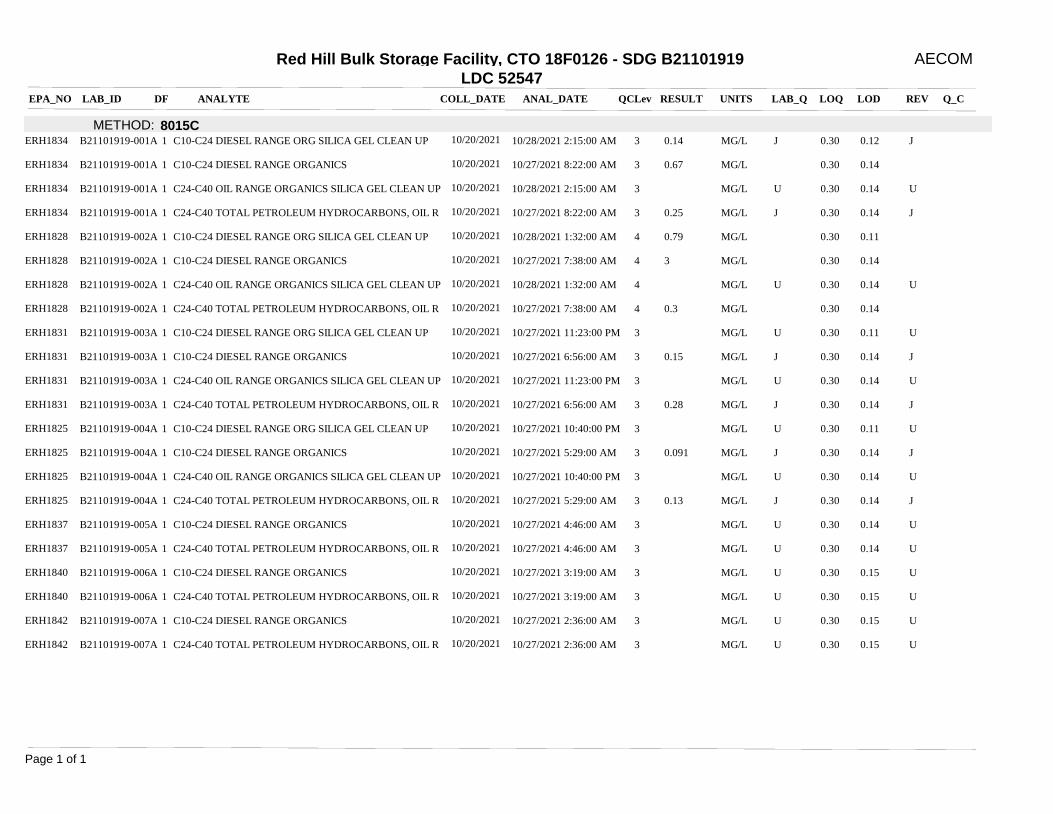
Red Hill Bulk Storage Facility, CTO 18F0126 - SDG B21101919
LDC 52547
AECOM
EPA_NO LAB_ID DF ANALYTE COLL_DATE ANAL_DATE QCLev RESULT UNITS LAB_Q LOD REV Q_CLOQ
METHOD: 8015CERH1834 B21101919-001A 1 C10-C24 DIESEL RANGE ORG SILICA GEL CLEAN UP 10/20/2021 10/28/2021 2:15:00 AM 3 0.14 MG/L J 0.12 J0.30
ERH1834 B21101919-001A 1 C10-C24 DIESEL RANGE ORGANICS 10/20/2021 10/27/2021 8:22:00 AM 3 0.67 MG/L 0.140.30
ERH1834 B21101919-001A 1 C24-C40 OIL RANGE ORGANICS SILICA GEL CLEAN UP 10/20/2021 10/28/2021 2:15:00 AM 3 MG/L U 0.14 U0.30
ERH1834 B21101919-001A 1 C24-C40 TOTAL PETROLEUM HYDROCARBONS, OIL R 10/20/2021 10/27/2021 8:22:00 AM 3 0.25 MG/L J 0.14 J0.30
ERH1828 B21101919-002A 1 C10-C24 DIESEL RANGE ORG SILICA GEL CLEAN UP 10/20/2021 10/28/2021 1:32:00 AM 4 0.79 MG/L 0.110.30
ERH1828 B21101919-002A 1 C10-C24 DIESEL RANGE ORGANICS 10/20/2021 10/27/2021 7:38:00 AM 4 3 MG/L 0.140.30
ERH1828 B21101919-002A 1 C24-C40 OIL RANGE ORGANICS SILICA GEL CLEAN UP 10/20/2021 10/28/2021 1:32:00 AM 4 MG/L U 0.14 U0.30
ERH1828 B21101919-002A 1 C24-C40 TOTAL PETROLEUM HYDROCARBONS, OIL R 10/20/2021 10/27/2021 7:38:00 AM 4 0.3 MG/L 0.140.30
ERH1831 B21101919-003A 1 C10-C24 DIESEL RANGE ORG SILICA GEL CLEAN UP 10/20/2021 10/27/2021 11:23:00 PM 3 MG/L U 0.11 U0.30
ERH1831 B21101919-003A 1 C10-C24 DIESEL RANGE ORGANICS 10/20/2021 10/27/2021 6:56:00 AM 3 0.15 MG/L J 0.14 J0.30
ERH1831 B21101919-003A 1 C24-C40 OIL RANGE ORGANICS SILICA GEL CLEAN UP 10/20/2021 10/27/2021 11:23:00 PM 3 MG/L U 0.14 U0.30
ERH1831 B21101919-003A 1 C24-C40 TOTAL PETROLEUM HYDROCARBONS, OIL R 10/20/2021 10/27/2021 6:56:00 AM 3 0.28 MG/L J 0.14 J0.30
ERH1825 B21101919-004A 1 C10-C24 DIESEL RANGE ORG SILICA GEL CLEAN UP 10/20/2021 10/27/2021 10:40:00 PM 3 MG/L U 0.11 U0.30
ERH1825 B21101919-004A 1 C10-C24 DIESEL RANGE ORGANICS 10/20/2021 10/27/2021 5:29:00 AM 3 0.091 MG/L J 0.14 J0.30
ERH1825 B21101919-004A 1 C24-C40 OIL RANGE ORGANICS SILICA GEL CLEAN UP 10/20/2021 10/27/2021 10:40:00 PM 3 MG/L U 0.14 U0.30
ERH1825 B21101919-004A 1 C24-C40 TOTAL PETROLEUM HYDROCARBONS, OIL R 10/20/2021 10/27/2021 5:29:00 AM 3 0.13 MG/L J 0.14 J0.30
ERH1837 B21101919-005A 1 C10-C24 DIESEL RANGE ORGANICS 10/20/2021 10/27/2021 4:46:00 AM 3 MG/L U 0.14 U0.30
ERH1837 B21101919-005A 1 C24-C40 TOTAL PETROLEUM HYDROCARBONS, OIL R 10/20/2021 10/27/2021 4:46:00 AM 3 MG/L U 0.14 U0.30
ERH1840 B21101919-006A 1 C10-C24 DIESEL RANGE ORGANICS 10/20/2021 10/27/2021 3:19:00 AM 3 MG/L U 0.15 U0.30
ERH1840 B21101919-006A 1 C24-C40 TOTAL PETROLEUM HYDROCARBONS, OIL R 10/20/2021 10/27/2021 3:19:00 AM 3 MG/L U 0.15 U0.30
ERH1842 B21101919-007A 1 C10-C24 DIESEL RANGE ORGANICS 10/20/2021 10/27/2021 2:36:00 AM 3 MG/L U 0.15 U0.30
ERH1842 B21101919-007A 1 C24-C40 TOTAL PETROLEUM HYDROCARBONS, OIL R 10/20/2021 10/27/2021 2:36:00 AM 3 MG/L U 0.15 U0.30
Page 1 of 1
Related Documents