Labor market consequences of trade openness and competition in foreign markets: the case of Mexico November 2nd, 2012 Daniel Chiquiar Enrique Covarrubias Alejandrina Salcedo The views and conclusions presented in this study are exclusively the responsibility of the authors and do not necessarily reflect those of Banco de Mexico.

Labor market consequences of trade openness and competition in foreign markets: the case of Mexico November 2nd, 2012 Daniel Chiquiar Enrique Covarrubias.
Dec 23, 2015
Welcome message from author
This document is posted to help you gain knowledge. Please leave a comment to let me know what you think about it! Share it to your friends and learn new things together.
Transcript
Labor market consequences of trade openness and competition
in foreign markets: the case of Mexico
November 2nd, 2012
Daniel ChiquiarEnrique CovarrubiasAlejandrina Salcedo
The views and conclusions presented in this study are exclusively the responsibility of the authors and do not necessarily reflect those of Banco de Mexico.
2
Index
1. Introduction
2. Regional exposure to trade openness and competition
3. Relationship between exposure measures and Mexican labor market indicators
4. Econometric analysisa) NAFTAb) Chinese competition
5. Conclusions

3
1. Introduction
This paper analyzes the labor market consequences of trade liberalization and of competition in international markets, for the Mexican case.
In particular, we look at the consequences of:
o The introduction of NAFTA in 1994, which increased Mexican exports to the US.
o The accession of China to the WTO in 2001, which increased Chinese exports to the US, substituting Mexican products in this market.

4
1. IntroductionMarket Share in US Imports
Percentage
0%
5%
10%
15%
20%
25%
1993 1995 1997 1999 2001 2003 2005 2007 2009
Mexico
China
China's accession to WTONAFTA
Source: Comtrade database, United Nations.

5
1. Introduction Given its initial comparative advantages, Mexico responded to trade
integration through NAFTA mostly by specializing in unskilled labor-intensive processes.• NAFTA boosted the formation of regional production-sharing arrangements
between Mexico and the US. • Maquiladoras are a clear example of such arrangements. Moreover, they
represent the increase in specialization of Mexican firms in unskilled labor intensive assembly activities.
The accession of China to the WTO increased competition for Mexican exports in the US market.• There is a large overlap in the kind of products that both Mexico and China
have specialized in, and therefore their export mixes are very similar.• Consequently, the increase in Chinese exports had a negative effect on
Mexico’s market share in US imports.
Mexican labor markets could have benefited from NAFTA, while increased Chinese competition could have had a negative impact.
6
1. Introduction We follow Autor, Dorn and Hanson (2012), who estimate the
effect that the increase in US imports from China had on the US labor market.
To identify such effect, they exploit regional variation in the exposure of local US labor markets to the increase in imports from China.
• Regions whose activities were more concentrated on the production of goods that experienced an important increase in imports would have a greater exposure, and their labor markets could have been more affected.
• They use an instrumental variables approach to identify a causal effect.
7
1. Introduction
Following their methodology, in this paper we estimate the effect of trade openness (NAFTA) and of the increase in Chinese competition in US markets on the Mexican labor market.
With this purpose, we estimate two measures of exposure:
o Exposure to trade openness.
o Exposure to Chinese competition in US markets.
Using variation at the regional level (metropolitan areas), we estimate the impact of a higher exposure level on labor market indicators in the last two decades.
We implement an instrumental variables approach too.
8
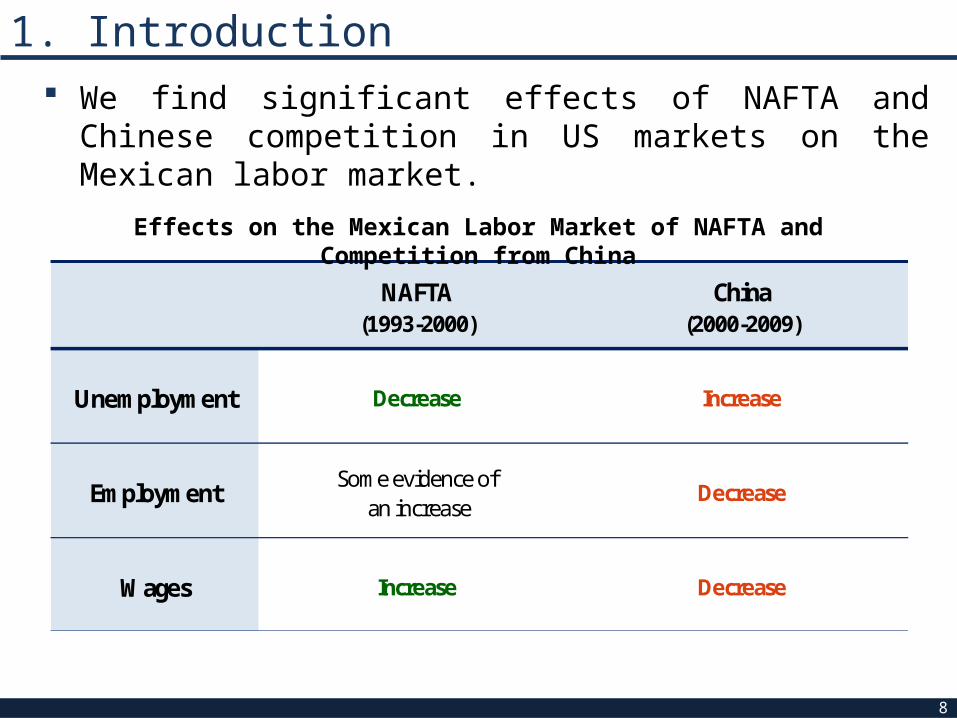
1. Introduction We find significant effects of NAFTA and Chinese competition in
US markets on the Mexican labor market.
NAFTA(1993-2000)
China(2000-2009)
Unemployment Decrease Increase
Employment Some evidence of an increase
Decrease
Wages Increase Decrease
Effects on the Mexican Labor Market of NAFTA and Competition from China

9
Index
1. Introduction
2. Regional exposure to trade openness and competition
3. Relationship between exposure measures and
Mexican labor market indicators
4. Econometric analysis a) NAFTA b) Chinese competition
5. Conclusions
2. Regional exposure to trade openness and competition
10
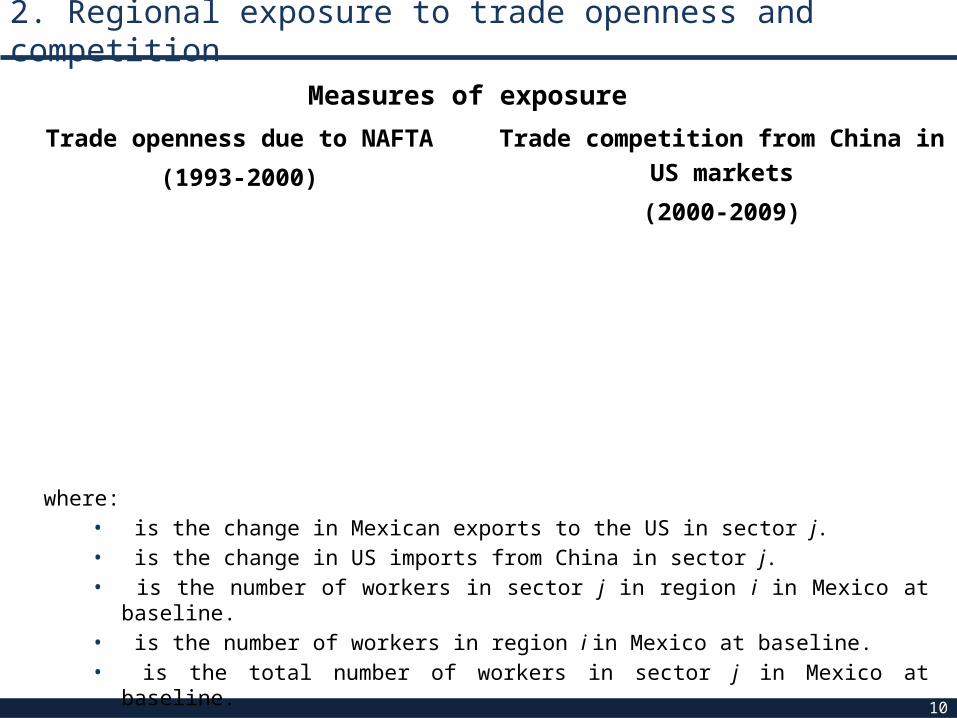
Measures of exposure
Trade openness due to NAFTA
(1993-2000)
Trade competition from China in US markets
(2000-2009)
where:• is the change in Mexican exports to the US in sector j.• is the change in US imports from China in sector j.• is the number of workers in sector j in region i in Mexico at baseline.• is the number of workers in region i in Mexico at baseline.• is the total number of workers in sector j in Mexico at baseline.

11
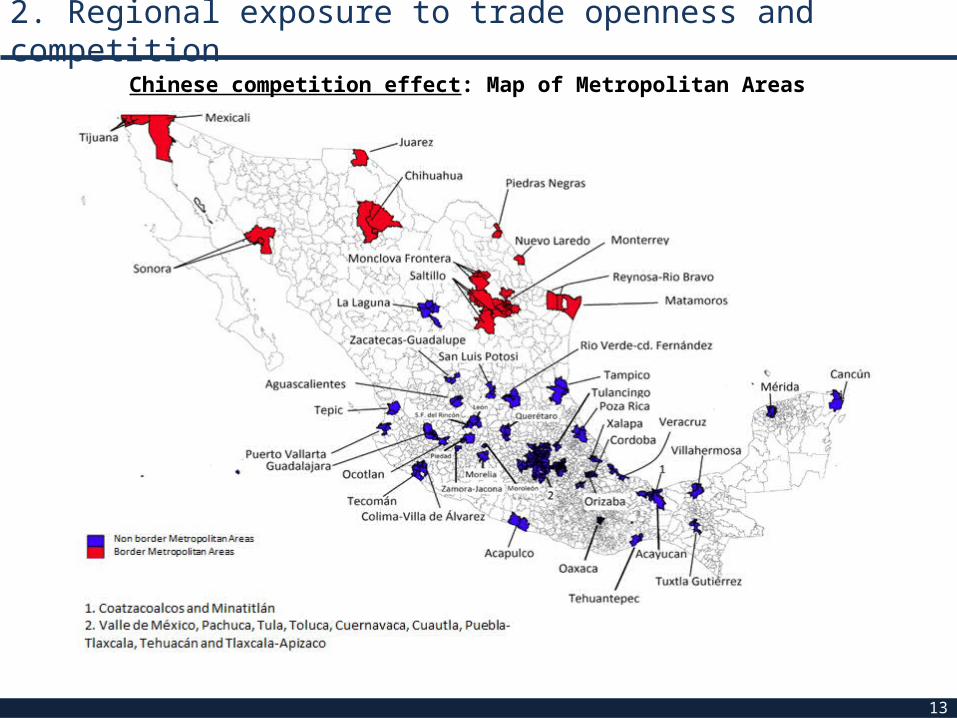
We base the analysis on metropolitan areas.
• NAFTA effect: 37 metro areas that comprise 161 municipalities and represent around 30 percent of the population.
• China effect: 56 metro areas that comprise 344 municipalities and represent around 60 percent of the population.
We distinguish between metropolitan areas in border and non border states.
The main data sources for the analysis are the employment survey, the economic censuses and UN Comtrade.
2. Regional exposure to trade openness and competition

12
Nafta effect: Map of Metropolitan Areas
2. Regional exposure to trade openness and competition
13
2. Regional exposure to trade openness and competition
Chinese competition effect: Map of Metropolitan Areas
14
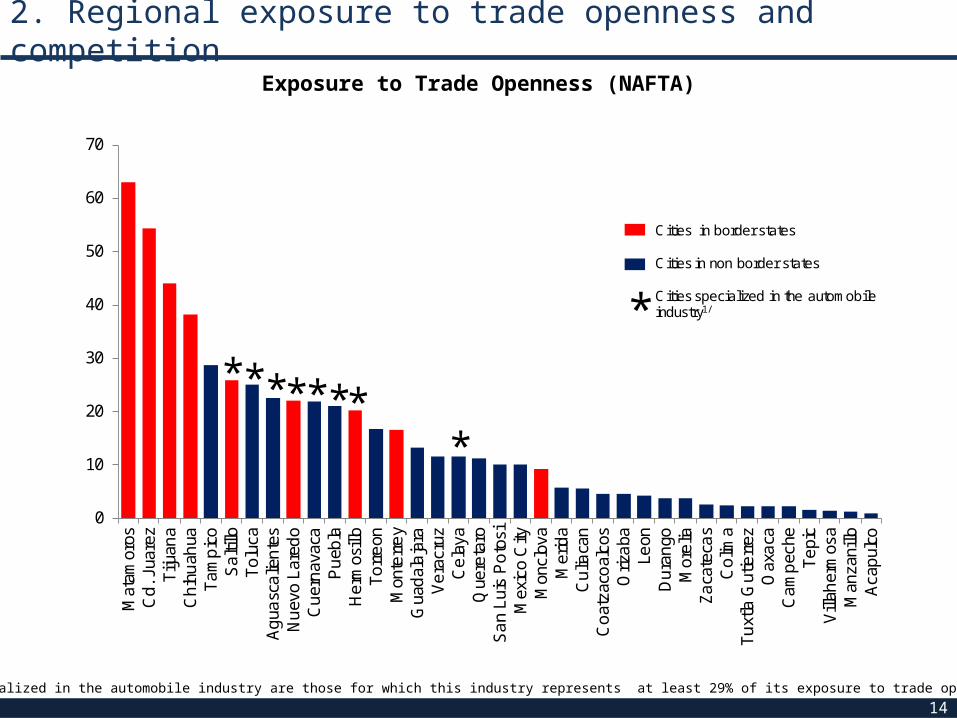
Exposure to Trade Openness (NAFTA)
0
10
20
30
40
50
60
70M
atam
oros
Cd
. Jua
rez
Tiju
ana
Ch
ihu
ahua
Ta
mp
ico
Sa
ltillo
To
luca
Ag
uasc
alie
nte
sN
uev
o L
ared
oC
uer
nav
aca
Pu
ebla
He
rmos
illo
To
rre
onM
onte
rre
yG
uad
ala
jara
Ve
racr
uzC
ela
yaQ
uere
taro
Sa
n L
uis
Po
tosi
Mex
ico
City
Mon
clov
aM
erid
aC
ulia
can
Co
atza
coal
cos
Oriz
aba
Leon
Du
ran
goM
ore
liaZ
aca
teca
sC
olim
aT
uxt
la G
utie
rrez
Oax
aca
Ca
mp
eche
Te
pic
Vill
aher
mos
aM
anza
nillo
Aca
pul
co
********
Cities in border states
Cities in non border states
Cities specialized in the automobile industry1/*
1/ The regions specialized in the automobile industry are those for which this industry represents at least 29% of its exposure to trade openness.
2. Regional exposure to trade openness and competition

15
Exposure to Chinese Competition in US markets
0
10
20
30
40
50
60
70
80
90
Tiju
ana
Juár
ezRe
ynos
a-Rí
o Br
avo
Mex
ical
iM
atam
oros
Nue
vo L
ared
oGu
aym
asTe
huan
tepe
cGu
adal
ajar
aCh
ihua
hua
Tehu
acán
Pied
ras N
egra
sTl
axca
la-A
piza
coM
onte
rrey
Agua
scal
ient
esSa
ltillo
Mor
oleó
n-Ur
iang
ato
La L
agun
aO
cotlá
nSa
n Fr
ancis
co d
el R
incó
nQ
ueré
taro
San
Luis
Poto
sí-SG
STo
luca
Pueb
la-T
laxc
ala
León
Pach
uca
Mon
clov
a-Fr
onte
raVa
lle d
e M
éxic
oCu
erna
vaca
Mér
ida
Zam
ora-
Jaco
naTu
lanc
ingo
La P
ieda
d-Pé
njam
oCó
rdob
aO
rizab
aTe
com
ánCo
atza
coal
cos
Tam
pico
Min
atitlá
nM
orel
iaTu
laZa
cate
cas-
Guad
alup
eVe
racr
uzCu
autla
Xala
paO
axac
aAc
apul
coRi
over
de-C
iuda
d Fe
rnán
dez
Colim
a-Vi
lla d
e Ál
vare
zPo
za R
ica
Villa
herm
osa
Tepi
cTu
xtla
Guti
érre
zAc
ayuc
anCa
ncún
Puer
to V
alla
rta
Metropolitan areas in border state
Metropolitan areas in non border state
2. Regional exposure to trade openness and competition

16
Exposure to trade openness (NAFTA) () vs. exposure to Chinese competition in US markets ()
∆ 𝐼𝑃𝑊 𝑖𝑈𝑆
∆𝑂𝑃𝑊
𝑖𝑈𝑆
2. Regional exposure to trade openness and competition
0
10
20
30
40
50
60
70
0 10 20 30 40 50 60 70 80 90
Specialized in automobile industry
Other
Specialized in automobile industry
Other non-border
border
3-digit SITC Industries that Contribute the Most to each Exposure Measure Grouped in 2-digit SITC Categories
17
2. Regional exposure to trade openness and competition
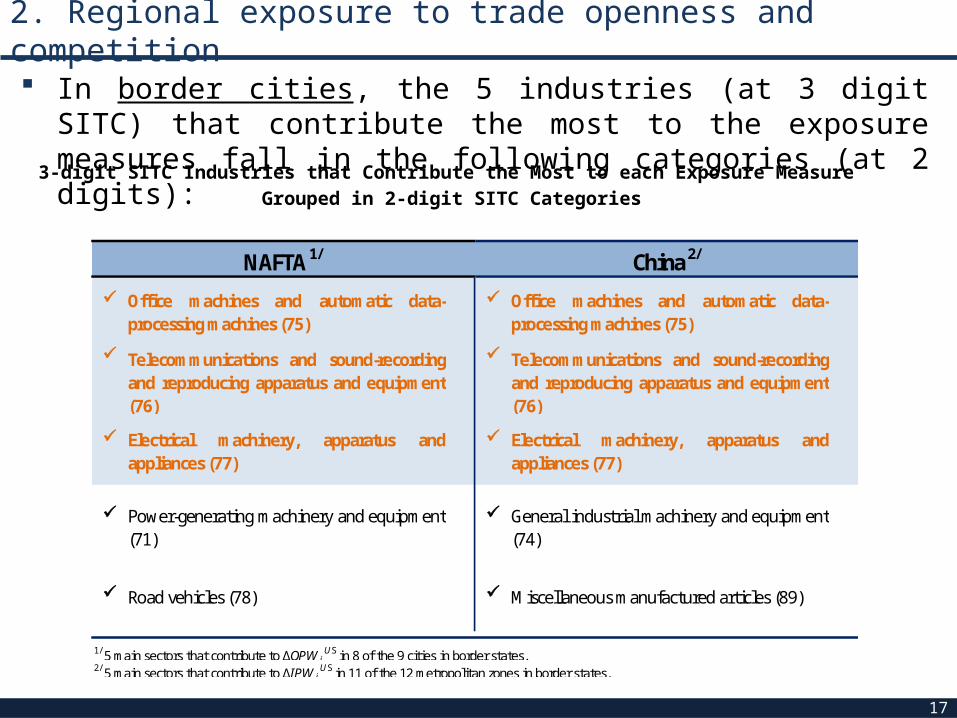
In border cities, the 5 industries (at 3 digit SITC) that contribute the most to the exposure measures fall in the following categories (at 2 digits):
2/ 5 main sectors that contribute to ∆IPW iU S in 11 of the 12 metropolitan zones in border states.
NAFTA 1/ China 2/
Office machines and automatic data-processing machines (75)
Office machines and automatic data-processing machines (75)
Telecommunications and sound-recordingand reproducing apparatus and equipment(76)
Power-generating machinery and equipment(71)
Road vehicles (78) Miscellaneous manufactured articles (89)
General industrial machinery and equipment(74)
Telecommunications and sound-recordingand reproducing apparatus and equipment(76)
Electrical machinery, apparatus andappliances (77)
Electrical machinery, apparatus andappliances (77)
1/ 5 main sectors that contribute to ∆OPW iU S in 8 of the 9 cities in border states.

18
The industries that allowed border regions to benefit from NAFTA are the kind of sectors in which Mexico has lost comparative advantage with respect to China, except for the automobile industry.
On the contrary, cities in non-border states do not show a clear specialization pattern.
2. Regional exposure to trade openness and competition

19
Revealed Comparative Advantage (RCA) of China and Sectorial Specialization Index (SSI) of Mexican Metropolitan Zones
RCA of China vs. SSI of Metropolitan Zones in Border States
(1999, SITC 2 digits)
RCA of China vs. SSI of Metropolitan Zones in Nonborder States
(1999, SITC 2 digits)
Source: China RCA: Comtrade database, United Nations. SSI index: Mexican Economic Census 1999, INEGI.
74 Industrial mach. and equip.
75 Computers
76 Telecomm.
77 Electrical
89 Miscellaneous manufact.
0
1
2
3
4
5
6
7
0 0.5 1 1.5 2 2.5 3
RCA
Chi
na 1
999
SSI Border MZ 1999
Spearman correlation coeff. = 0.3263**
0358
6263 65
66
82
0
1
2
3
4
5
6
7
0 0.2 0.4 0.6 0.8 1 1.2 1.4 1.6
RCA
Chi
na 1
999
SSI Nonborder MZ 1999
Spearman correlationcoeff. = -0.3263**
2. Regional exposure to trade openness and competition

Index
20
1. Introduction
2. Regional exposure to trade openness and competition
3. Relationship between exposure measures and Mexican labor market indicators
4. Econometric analysis a) NAFTA b) Chinese competition
5. Conclusions
21
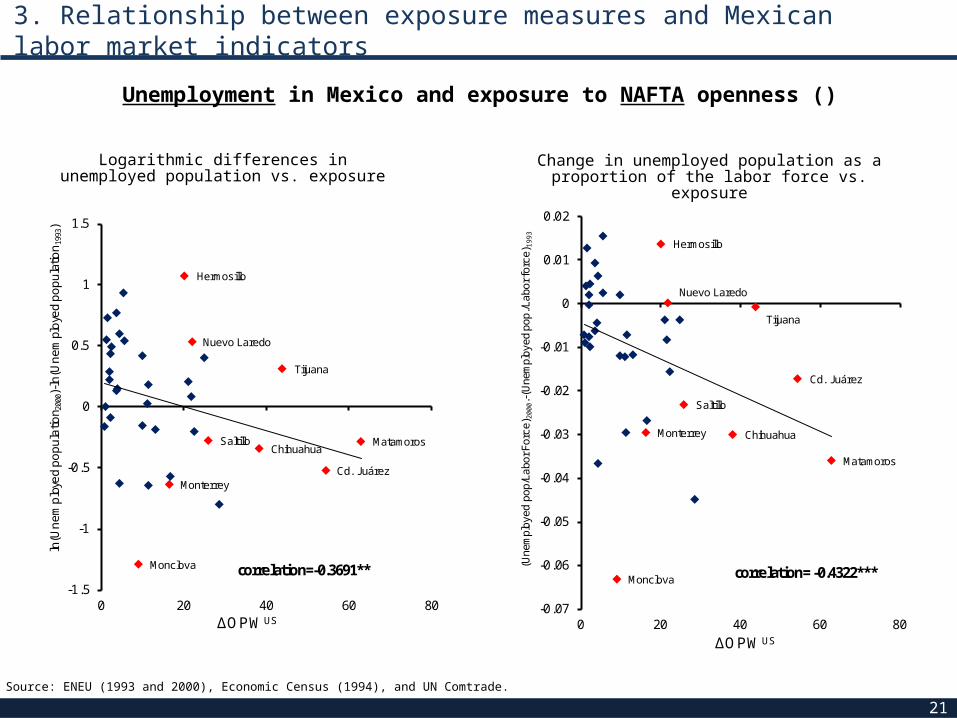
Unemployment in Mexico and exposure to NAFTA openness ()
Logarithmic differences in unemployed population vs. exposure
Change in unemployed population as a proportion of the labor force vs. exposure
Source: ENEU (1993 and 2000), Economic Census (1994), and UN Comtrade.
3. Relationship between exposure measures and Mexican labor market indicators
Monterrey
ChihuahuaSaltillo
Cd. Juárez
Tijuana
Matamoros
Nuevo Laredo
Hermosillo
Monclova
-1.5
-1
-0.5
0
0.5
1
1.5
0 20 40 60 80
ln(U
ne
mp
loye
d p
op
ula
tion 2
000)
-ln
(Un
em
plo
yed
po
pu
latio
n19
93)
ΔOPWUS
correlation=-0.3691**
Cd. Juárez
Tijuana
Nuevo Laredo
Monterrey Chihuahua
Saltillo
Matamoros
Hermosillo
Monclova
-0.07
-0.06
-0.05
-0.04
-0.03
-0.02
-0.01
0
0.01
0.02
0 20 40 60 80
(Une
mpl
oyed
pop
/Lab
or F
orce
) 20
00.-
(Une
mpl
oyed
pop
./Lab
or fo
rce)
19
93
ΔOPWUS
correlation= -0.4322***

22
Employment in Mexico and exposure to NAFTA openness ()
Logarithmic differences of employed population vs. exposure measure
3. Relationship between exposure measures and Mexican labor market indicators
All sectors Manufacturing Non-manufacturing
Monterrey
Chihuahua
Saltillo Cd. JuárezTijuana
MatamorosNuevo Laredo
Hermosillo
Monclova
-0.1
0
0.1
0.2
0.3
0.4
0.5
0.6
0 20 40 60 80
ln(T
otal
em
ploy
men
t 20
00)-
ln(T
otal
em
ploy
men
t 19
93)
ΔOPWUS
correlation= 0.2980*
Monterrey
Chihuahua
Saltillo
Cd. Juárez
Tijuana
Matamoros
Nuevo Laredo
Hermosillo
Monclova
-0.1
0
0.1
0.2
0.3
0.4
0.5
0.6
0.7
0.8
0 20 40 60 80
ln(M
anuf
actu
ring
empl
oym
ent 2
00
0)-
ln(M
anuf
actu
ring
empl
oym
ent 1
99
3)
ΔOPWUS
correlation=0.4182**
Monterrey
ChihuahuaSaltillo
Cd. Juárez
Tijuana
Matamoros
Nuevo Laredo
Hermosillo
Monclova
-0.2
-0.1
0
0.1
0.2
0.3
0.4
0.5
0.6
0 20 40 60 80
ln(N
on M
anuf
. em
ploy
men
t 20
00)-
ln(N
on M
anuf
. em
ploy
men
t 19
93)
ΔOPWUS
correlation=0.0315
Source: ENEU (1993 and 2000), Economic Census (1994), and UN Comtrade.

23
Wages in Mexico and exposure to NAFTA openness ()
Logarithmic differences in wages vs. exposure measure
3. Relationship between exposure measures and Mexican labor market indicators
All sectors Manufacturing Non-manufacturing
Monterrey
Chihuahua
Saltillo
Cd. Juárez
Tijuana
Matamoros
Nuevo Laredo
Hermosillo
Monclova
-0.4
-0.3
-0.2
-0.1
0
0.1
0.2
0.3
0 20 40 60 80
ln(W
ages
all
sect
ors 2
00
0)-
ln(W
ages
all s
ecto
rs1
99
3)
ΔOPWUS
correlation= 0.3675**
Monterrey
ChihuahuaSaltillo
Cd. Juárez
Tijuana
Matamoros
Nuevo Laredo
Hermosillo
Monclova
-0.6
-0.5
-0.4
-0.3
-0.2
-0.1
0
0.1
0.2
0.3
0.4
0 20 40 60 80
ln(W
ages
man
ufac
turin
g2
00
0)-
ln(W
ages
man
ufac
turin
g1
99
3)
ΔOPWUS
correlation= 0.4649***
Monterrey
Chihuahua
Saltillo
Cd. Juárez
Tijuana
MatamorosNuevo Laredo
Hermosillo
Monclova
-0.4
-0.3
-0.2
-0.1
0
0.1
0.2
0.3
0 20 40 60 80
ln(W
ages
non
man
ufac
turin
g2
00
0)-
ln(W
ages
non
man
ufac
turin
g 1
99
3)
ΔOPWUS
correlation= 0.3419**
Source: ENEU (1993 and 2000), Economic Census (1994), and UN Comtrade.

24
Unemployment in Mexico and exposure to Chinese competition ()
Logarithmic differences in unemployed population vs. index of exposure
Change in unemployed population as a proportion of the labor force vs. index of
exposure
3. Relationship between exposure measures and Mexican labor market indicators
-2
-1
0
1
2
3
4
0 20 40 60 80 100
ln(U
ne
mp
loye
d p
op
. 200
9) -
ln (U
ne
mp
loye
d p
op
. 200
0)
ΔIPWUS
Tijuana
Juárez
Reynosa-Río
Mexicali
Matamoros
Guaymas
Nuevo Laredo
Saltillo
ChihuahuaMonterrey
Piedras Negras
Monclova-Frontera
correlation= 0.3076**
-0.04
-0.02
0
0.02
0.04
0.06
0.08
0.1
0 20 40 60 80 100U
ne
mp
. po
p./L
ab
or F
orc
e20
09-
Un
em
p. p
op
./La
bo
r fo
rce
2000
ΔIPWUS
Juárez
Tijuana
Matamoros
Reynosa-Río Bravo
Mexicali
Nuevo Laredo
Guaymas
Chihuahua
Piedras Negras
Saltillo
Monclova-Frontera
Monterrey
correlation= 0.5225***
Source: ENE and ENOE (2000 and 2009), Economic Census (1994), and UN Comtrade.
25
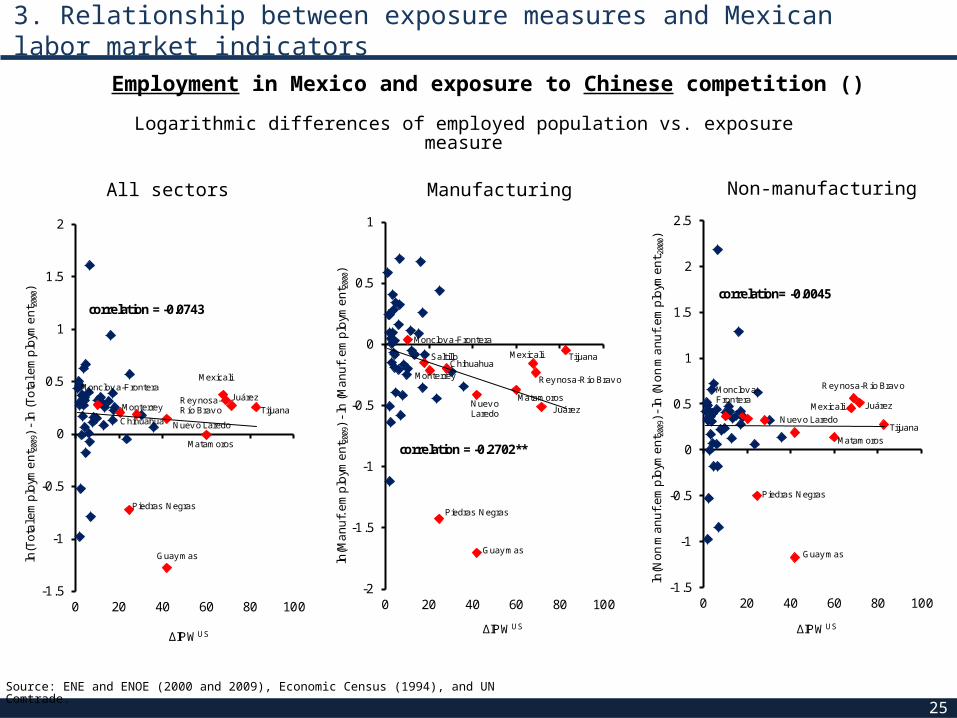
Employment in Mexico and exposure to Chinese competition ()
Logarithmic differences of employed population vs. exposure measure
3. Relationship between exposure measures and Mexican labor market indicators
All sectors Manufacturing Non-manufacturing
-1.5
-1
-0.5
0
0.5
1
1.5
2
0 20 40 60 80 100
ln(T
ota
l em
plo
yme
nt 2
009)
-ln
(T
ota
l em
plo
yme
nt 2
000)
ΔIPWUS
Tijuana
Mexicali
Rey nosa-Río Brav o
Juárez
Matamoros
Guay mas
Nuev o LaredoChihuahua
Monterrey
Piedras Negras
Monclov a-Frontera
correlation = -0.0743
-2
-1.5
-1
-0.5
0
0.5
1
0 20 40 60 80 100
ln(M
an
uf.
em
plo
yme
nt 2
009)
-ln
(M
an
uf.
em
plo
yme
nt 2
000)
ΔIPWUS
Tijuana
Juárez
Rey nosa-Río Brav o
Mexicali
MatamorosNuev o Laredo
Guay mas
ChihuahuaMonterrey
Saltillo
Monclov a-Frontera
Piedras Negras
correlation = -0.2702**
-1.5
-1
-0.5
0
0.5
1
1.5
2
2.5
0 20 40 60 80 100
ln(N
on
ma
nu
f. e
mp
loym
en
t 200
9) -
ln (
No
n m
an
uf.
em
plo
yme
nt. 2
000)
ΔIPWUS
Tijuana
Matamoros
Guay mas
Juárez
Rey nosa-Río Brav o
Mexicali
Nuev o Laredo
Monclov a-Frontera
Piedras Negras
correlation= -0.0045
Source: ENE and ENOE (2000 and 2009), Economic Census (1994), and UN Comtrade.
26
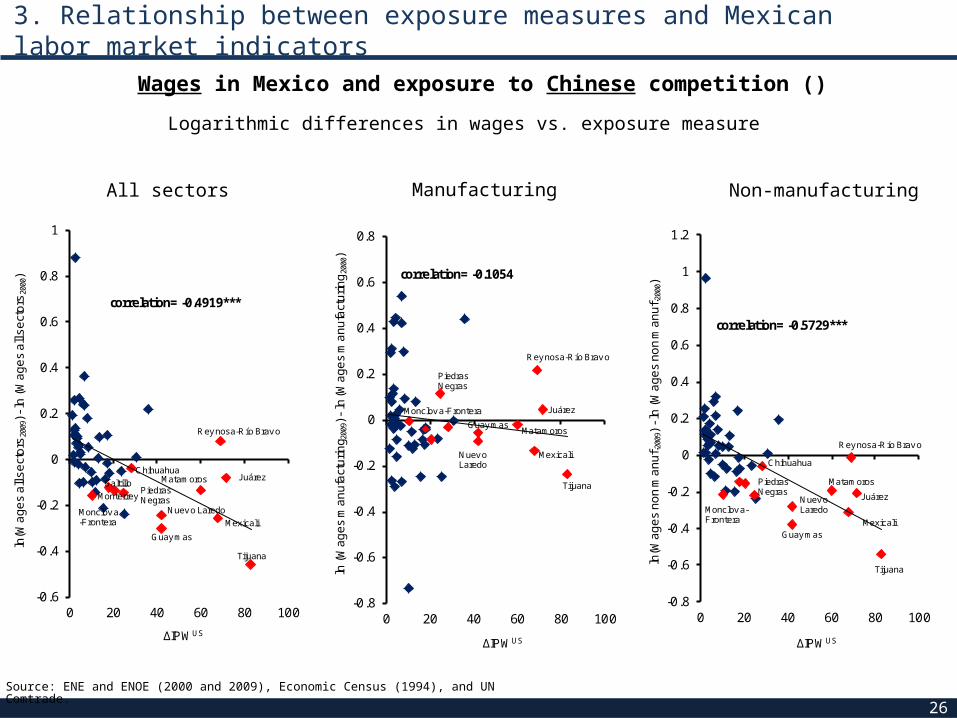
Wages in Mexico and exposure to Chinese competition ()
Logarithmic differences in wages vs. exposure measure
3. Relationship between exposure measures and Mexican labor market indicators
All sectors Manufacturing Non-manufacturing
-0.6
-0.4
-0.2
0
0.2
0.4
0.6
0.8
1
0 20 40 60 80 100
ln(W
ag
es
all
se
cto
rs20
09) -
ln (
Wa
ge
s a
ll s
ect
ors
2000
)
ΔIPWUS
Rey nosa-Río Brav o
JuárezMatamoros
Mexicali
Tijuana
Guay mas
Nuev o Laredo
Chihuahua
Piedras Negras
Monclov a-Frontera
Saltillo
Monterrey
correlation= -0.4919***
-0.8
-0.6
-0.4
-0.2
0
0.2
0.4
0.6
0.8
0 20 40 60 80 100
ln (
Wa
ge
s m
an
ufa
ctu
rin
g 200
9) -
ln (W
ag
es
ma
nu
fact
uri
ng
2000
)
ΔIPWUS
Tijuana
Rey nosa-Río Brav o
Juárez
Mexicali
Matamoros
Nuev oLaredo
Guay mas
Piedras Negras
Monclov a-Frontera
correlation= -0.1054
-0.8
-0.6
-0.4
-0.2
0
0.2
0.4
0.6
0.8
1
1.2
0 20 40 60 80 100
ln(W
ag
es
no
n m
an
uf. 2
009)
-ln
(W
ag
es
no
n m
an
uf. 2
000)
ΔIPWUS
Tijuana
Mexicali
Juárez
Rey nosa-Río Brav o
Matamoros
Guay mas
Nuev o Laredo
Chihuahua
Monclov a-Frontera
Piedras Negras
correlation= -0.5729***
Source: ENE and ENOE (2000 and 2009), Economic Census (1994), and UN Comtrade.

1. Introduction
2. Regional exposure to trade openness and competition
3. Relationship between exposure measures and Mexican labor market indicators
4. Econometric analysis a) NAFTA b) Chinese competition
5. Conclusions
Index
27
28
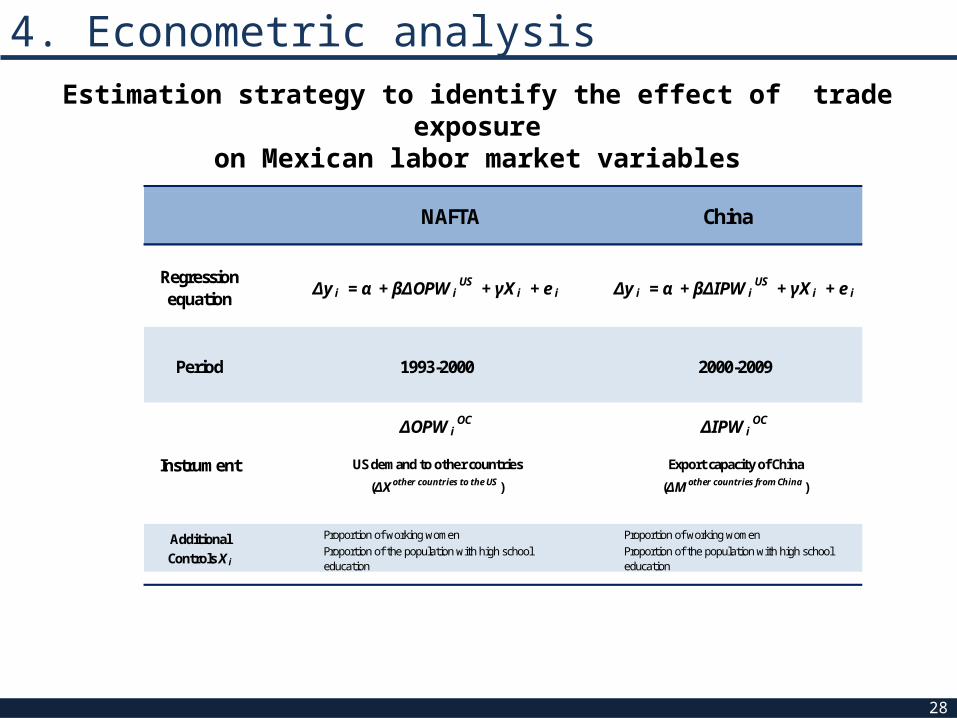
4. Econometric analysisEstimation strategy to identify the effect of trade exposure
on Mexican labor market variables
Regression equation yΔ i = α + OPWβΔ i
US + Xγ i + e i yΔ i = α + IPWβΔ iUS + Xγ i + e i
Period 1993-2000 2000-2009
OPWΔ iOC IPWΔ i
OC
US demand to other countries Export capacity of China
( XΔ other countries to the US ) ( MΔ other countries from China )
Proportion of working women Proportion of working womenProportion of the population with high school education
Proportion of the population with high school education
NAFTA China
Additional Controls X i
Instrument
1. Introduction
2. Regional exposure to trade openness and competition
3. Relationship between exposure measures and Mexican labor market indicators
4. Econometric analysis a) NAFTA b) Chinese competition
5. Conclusions
Index
29
30
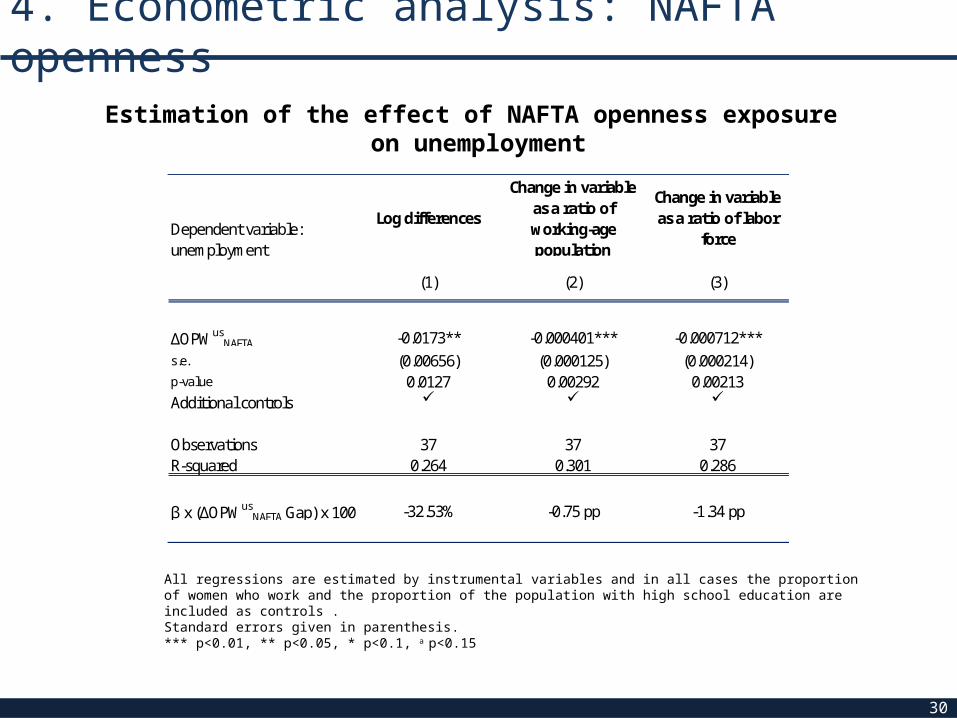
Estimation of the effect of NAFTA openness exposure on unemployment
All regressions are estimated by instrumental variables and in all cases the proportion of women who work and the proportion of the population with high school education are included as controls . Standard errors given in parenthesis. *** p<0.01, ** p<0.05, * p<0.1, a p<0.15
Log differences
Change in variable as a ratio of working-age population
Change in variable as a ratio of labor
force
(1) (2) (3)
ΔOPWusNAFTA -0.0173** -0.000401*** -0.000712***
s.e. (0.00656) (0.000125) (0.000214)p-value 0.0127 0.00292 0.00213Additional controls
Observations 37 37 37R-squared 0.264 0.301 0.286
β x (ΔOPWusNAFTA Gap) x 100 -32.53% -0.75 pp -1.34 pp
Dependent variable: unemployment
4. Econometric analysis: NAFTA openness
31
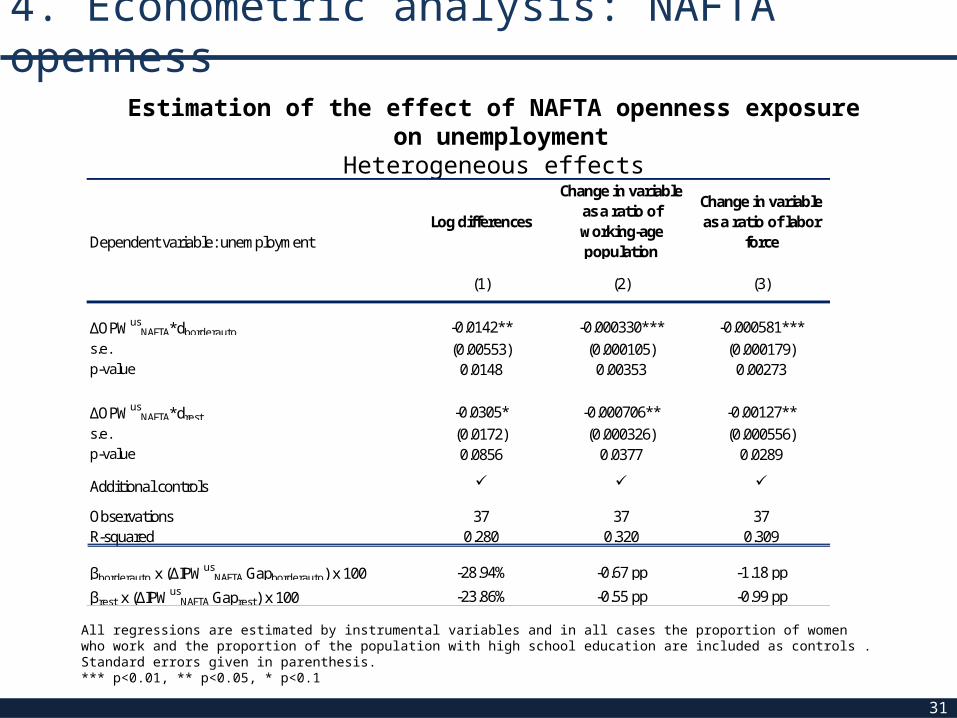
All regressions are estimated by instrumental variables and in all cases the proportion of women who work and the proportion of the population with high school education are included as controls . Standard errors given in parenthesis. *** p<0.01, ** p<0.05, * p<0.1
4. Econometric analysis: NAFTA openness
Estimation of the effect of NAFTA openness exposure on unemployment
Heterogeneous effects
Log differences
Change in variable as a ratio of working-age population
Change in variable as a ratio of labor
force
(1) (2) (3)
ΔOPWusNAFTA*dborderauto -0.0142** -0.000330*** -0.000581***
s.e. (0.00553) (0.000105) (0.000179)p-value 0.0148 0.00353 0.00273
ΔOPWusNAFTA*drest -0.0305* -0.000706** -0.00127**
s.e. (0.0172) (0.000326) (0.000556)p-value 0.0856 0.0377 0.0289
Additional controls
Observations 37 37 37R-squared 0.280 0.320 0.309
βborderauto x (ΔIPWusNAFTA Gapborderauto) x 100 -28.94% -0.67 pp -1.18 pp
βrest x (ΔIPWusNAFTA Gaprest) x 100 -23.86% -0.55 pp -0.99 pp
Dependent variable: unemployment

32
Effect of exposure on unemployment rates
4. Econometric analysis: NAFTA openness
1993 2000 Difference
Mean unemployment rateMetro areas in border states or specialized in auto industry 4.07% 2.37% -1.70 ppOther metro areas 3.31% 2.76% -0.54 ppDifference -1.16 pp
Mean ΔOPW Metro areas in border states or specialized in auto industry 26.08Other metro areas 6.20Difference (gap) 19.88
Unemployment explained by a greater exposure in metro areas in border states or specialized in auto industryCoeffi cient -0.000712Explained effect (coeffi cient x gap) -1.42 pp

33
Note: Workers with an education level lower than high school are classified as unskilled. Number of observations : 37 cities.All regressions are estimated by instrumental variables and in all cases the proportion of women who work and the proportion of the population with high school education are included as controls. Standard errors given in parenthesis. *** p<0.01, ** p<0.05, * p<0.1
Estimation of the effect of NAFTA openness exposure on employment
4. Econometric analysis: NAFTA openness
Dependent variable: logarithmic differences of employed population
Total employmentManufacturing
employmentNon-manufacturing
employmentSkilled workers Unskilled workers
(1) (2) (3) (4) (5)
ΔOPWusNAFTA 0.000987 0.00193 6.59e-05 -0.00259 0.00328
s.e. (0.00169) (0.00289) (0.00187) (0.00255) (0.00207)p-value 0.564 0.509 0.972 0.318 0.123
β x (ΔOPWusNAFTA Gap) x 100 1.86% 3.63% 0.12% -4.87% 6.17%

34
4. Econometric analysis: NAFTA openness
Note: Workers with an education level lower than high school are classified as unskilled. Number of observations : 37 cities.All regressions are estimated by instrumental variables and in all cases the proportion of women who work and the proportion of the population with high school education are included as controls. Standard errors given in parenthesis. *** p<0.01, ** p<0.05, * p<0.1
Estimation of the effect of NAFTA openness exposure on employment
Heterogeneous effects
Dependent variable: logarithmic differences of employed population
Total employmentManufacturing
employmentNon-manufacturing
employmentSkilled workers Unskilled workers
(1) (2) (3) (4) (5)
ΔOPWusNAFTA*dborderauto 0.00174 0.00423* 0.000353 -0.00134 0.00370**
s.e. (0.00140) (0.00239) (0.00158) (0.00211) (0.00176)p-value 0.224 0.0868 0.824 0.53 0.0429
ΔOPWusNAFTA*drest -0.00227 -0.00798 -0.00117 -0.00795 0.00147
s.e. (0.00437) (0.00744) (0.00491) (0.00657) (0.00546)p-value 0.607 0.292 0.813 0.235 0.789
βborderauto x (ΔOPWusNAFTA Gapborderauto) x 100 3.55% 8.62% 0.72% -2.73% 7.54%
βrest x (ΔOPWusNAFTA Gaprest) x 100 -1.78% -6.24% -0.92% -6.22% 1.15%

35
Mean wageMean wage in manufacturing
sector
Mean wage in non-manufacturing
sector
Mean wage of skilled workers
Mean wage of unskilled workers
(1) (2) (3) (4) (5)
ΔOPWusNAFTA 0.00362** 0.00742*** 0.00327* 0.00468** 0.00523***
s.e. (0.00165) (0.00257) (0.00167) (0.00208) (0.00172)p-value 0.0354 0.00672 0.0578 0.0314 0.00449
β x (ΔOPWusNAFTA Gap) x 100 6.81% 13.95% 6.15% 8.80% 9.84%
4. Econometric analysis: NAFTA opennessEstimation of the effect of NAFTA openness exposure
on wages
Dependent variable: logarithmic differences of wages
Note: Workers with an education level lower than high school are classified as unskilled. Number of observations : 37 cities.All regressions are estimated by instrumental variables and in all cases the proportion of women who work and the proportion of the population with high school education are included as controls. Standard errors given in parenthesis. *** p<0.01, ** p<0.05, * p<0.1
36
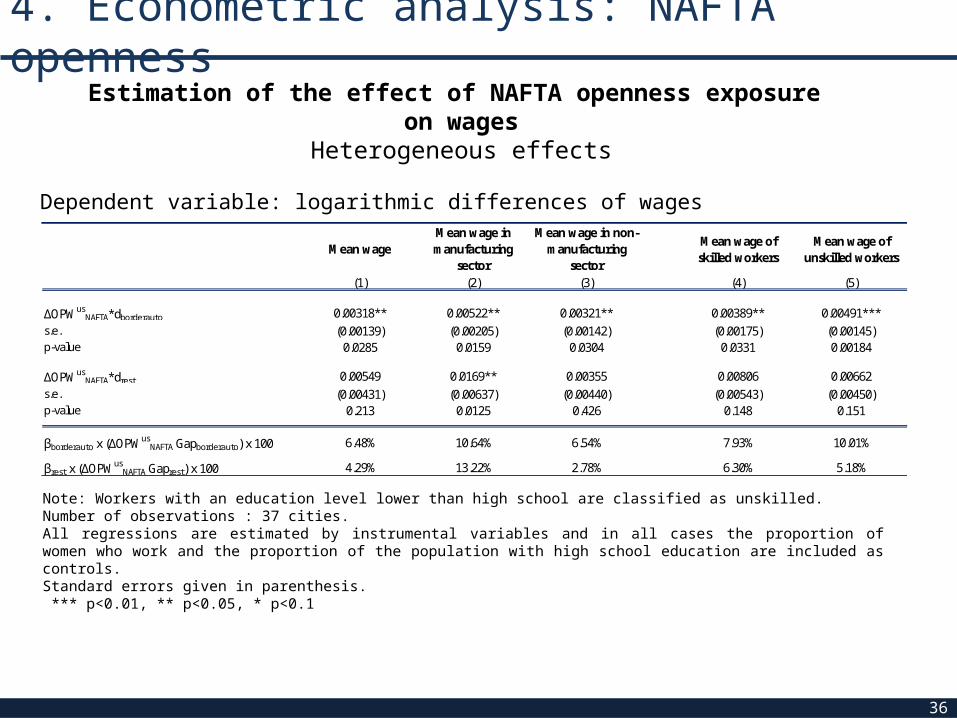
4. Econometric analysis: NAFTA opennessEstimation of the effect of NAFTA openness exposure
on wagesHeterogeneous effects
Dependent variable: logarithmic differences of wages
Note: Workers with an education level lower than high school are classified as unskilled. Number of observations : 37 cities.All regressions are estimated by instrumental variables and in all cases the proportion of women who work and the proportion of the population with high school education are included as controls. Standard errors given in parenthesis. *** p<0.01, ** p<0.05, * p<0.1
Mean wageMean wage in manufacturing
sector
Mean wage in non-manufacturing
sector
Mean wage of skilled workers
Mean wage of unskilled workers
(1) (2) (3) (4) (5)
ΔOPWusNAFTA*dborderauto 0.00318** 0.00522** 0.00321** 0.00389** 0.00491***
s.e. (0.00139) (0.00205) (0.00142) (0.00175) (0.00145)p-value 0.0285 0.0159 0.0304 0.0331 0.00184
ΔOPWusNAFTA*drest 0.00549 0.0169** 0.00355 0.00806 0.00662
s.e. (0.00431) (0.00637) (0.00440) (0.00543) (0.00450)p-value 0.213 0.0125 0.426 0.148 0.151
βborderauto x (ΔOPWusNAFTA Gapborderauto) x 100 6.48% 10.64% 6.54% 7.93% 10.01%
βrest x (ΔOPWusNAFTA Gaprest) x 100 4.29% 13.22% 2.78% 6.30% 5.18%
1. Introduction
2. Regional exposure to trade openness and competition
3. Relationship between exposure measures and Mexican labor market indicators
4. Econometric analysis a) NAFTA b) Chinese competition
5. Conclusions
Index
37

38
All regressions are estimated by instrumental variables and in all cases the proportion of women who work and the proportion of the population with high school education are included as controls . Standard errors given in parenthesis. *** p<0.01, ** p<0.05, * p<0.1, a p<0.15
Log differencesChange in variable as a ratio of working-age population
Change in variable as a ratio of labor force
(1) (2) (3)
ΔIPWus 0.0072a 0.0003*** 0.0006***(0.0049) (0.0001) (0.0001)
Additional controls
Observations 53 53 53R-squared 0.33 0.31 0.33
β x (ΔIPWus Gap) x 100 11.01% 0.51 pp 0.93 pp
Dependent variable: unemployment
4. Econometric analysis: Chinese competition
Estimation of the effect of exposure to Chinese competition on unemployment

39
Effect of exposure on unemployment rates
4. Econometric analysis: Chinese competition
2000 2009 Difference
Mean unemployment rateMetro areas in border states 2.54% 8.01% 5.47 ppMetro areas in non border states 2.70% 4.92% 2.22 ppDifference 3.25 pp
Mean ΔIPW Metro areas in border states 44.70Metro areas in non border states 9.20Difference (gap) 35.50
Unemployment explained by a greater exposure in metro areas located in border statesCoeffi cient 0.00061Explained effect (coeffi cient x gap) 2.17 pp
40
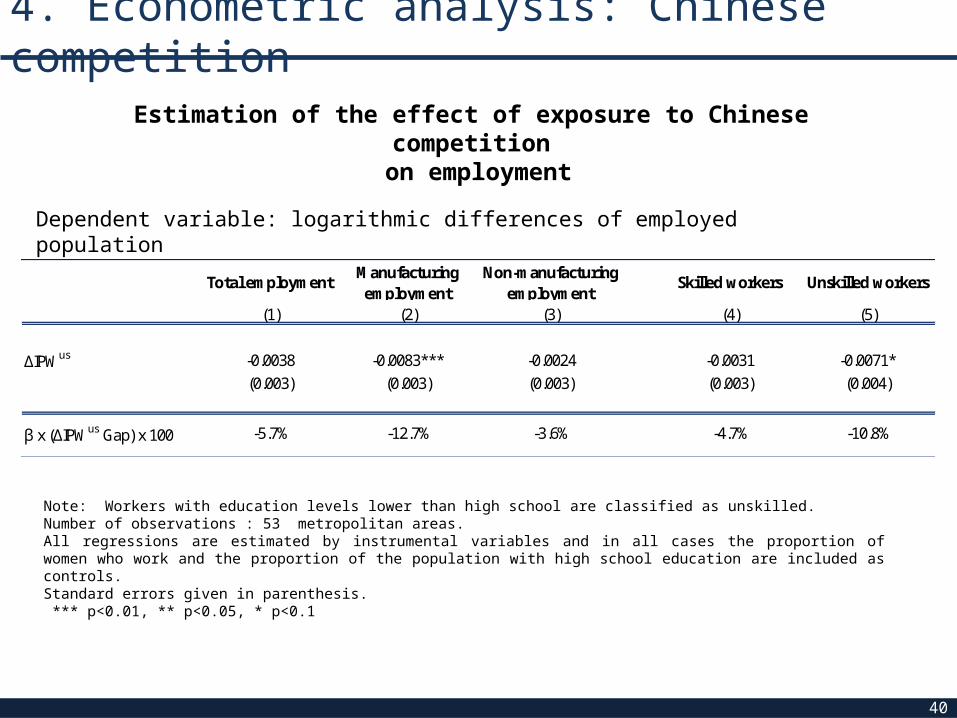
Note: Workers with education levels lower than high school are classified as unskilled. Number of observations : 53 metropolitan areas.All regressions are estimated by instrumental variables and in all cases the proportion of women who work and the proportion of the population with high school education are included as controls. Standard errors given in parenthesis. *** p<0.01, ** p<0.05, * p<0.1
Total employmentManufacturing
employmentNon-manufacturing
employmentSkilled workers Unskilled workers
(1) (2) (3) (4) (5)
ΔIPWus -0.0038 -0.0083*** -0.0024 -0.0031 -0.0071*(0.003) (0.003) (0.003) (0.003) (0.004)
β x (ΔIPWus Gap) x 100 -5.7% -12.7% -3.6% -4.7% -10.8%
4. Econometric analysis: Chinese competition
Estimation of the effect of exposure to Chinese competition on employment
Dependent variable: logarithmic differences of employed population
41
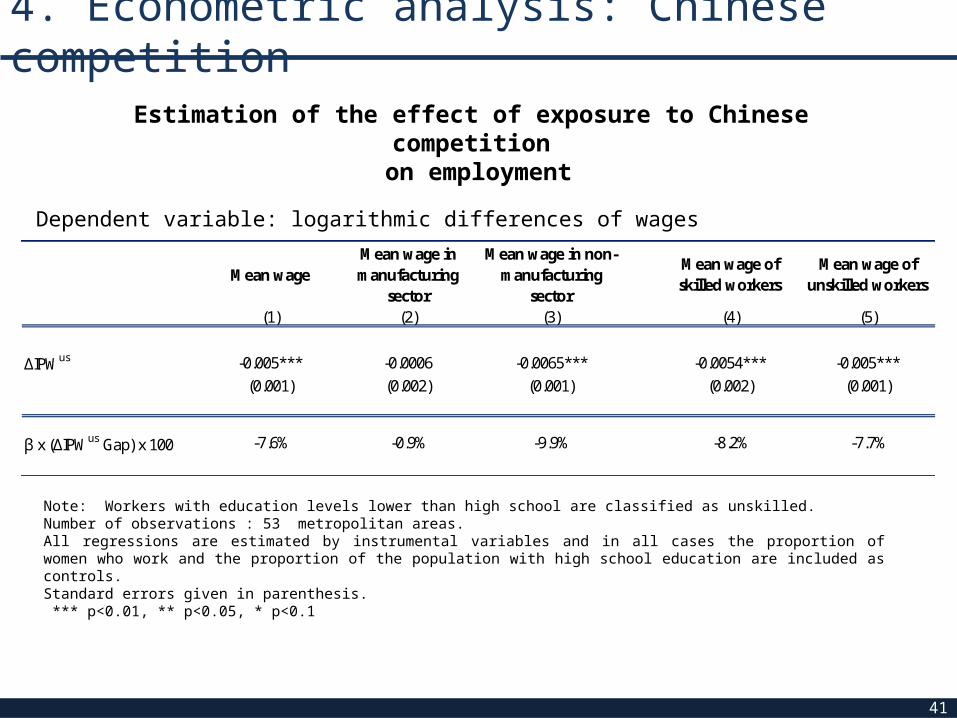
Mean wageMean wage in manufacturing
sector
Mean wage in non-manufacturing
sector
Mean wage of skilled workers
Mean wage of unskilled workers
(1) (2) (3) (4) (5)
ΔIPWus -0.005*** -0.0006 -0.0065*** -0.0054*** -0.005***(0.001) (0.002) (0.001) (0.002) (0.001)
β x (ΔIPWus Gap) x 100 -7.6% -0.9% -9.9% -8.2% -7.7%
4. Econometric analysis: Chinese competition
Note: Workers with education levels lower than high school are classified as unskilled. Number of observations : 53 metropolitan areas.All regressions are estimated by instrumental variables and in all cases the proportion of women who work and the proportion of the population with high school education are included as controls. Standard errors given in parenthesis. *** p<0.01, ** p<0.05, * p<0.1
Estimation of the effect of exposure to Chinese competition on employment
Dependent variable: logarithmic differences of wages
1. Introduction
2. Regional exposure to trade openness and competition
3. Relationship between exposure measures and Mexican labor market indicators
4. Econometric analysis a) NAFTA b) Chinese competition
5. Conclusions
Index
42

43
Based on the methodology proposed by Autor, Dorn and Hanson (2012), we have exploited regional variation in Mexico to study the effects of trade openness and trade competition on the Mexican labor markets in the last twenty years.
• We found that NAFTA had a positive impact on labor market indicators (unemployment, employment, and wages), while the increased competition from China in the US market has had a negative effect.
• It is noticeable that metro zones in border states were able to benefit more from NAFTA, but were also more vulnerable to Chinese competition.
Those metro zones specializing in the auto industry could be avoiding the negative effects of increased Chinese exports.
5. Conclusions
Related Documents