Tandon et al. BMC Cardiovasc Disord (2020) 20:521 https://doi.org/10.1186/s12872-020-01776-8 RESEARCH ARTICLE Label-free optical biomarkers detect early calcific aortic valve disease in a wild-type mouse model Ishita Tandon 1 , Shelby Johns 1 , Alan Woessner 1 , Jessica Perez 1 , Delaney Cross 1 , Asya Ozkizilcik 1 , Timothy J. Muldoon 1 , Srikanth Vallurupalli 2 , Muralidhar Padala 3 , Kyle P. Quinn 1 and Kartik Balachandran 1* Abstract Background: Calcific aortic valve disease (CAVD) pathophysiology is a complex, multistage process, usually diag- nosed at advanced stages after significant anatomical and hemodynamic changes in the valve. Early detection of disease progression is thus pivotal in the development of prevention and mitigation strategies. In this study, we devel- oped a diet-based, non-genetically modified mouse model for early CAVD progression, and explored the utility of two-photon excited fluorescence (TPEF) microscopy for early detection of CAVD progression. TPEF imaging provides label-free, non-invasive, quantitative metrics with the potential to correlate with multiple stages of CAVD pathophysi- ology including calcium deposition, collagen remodeling and osteogenic differentiation. Methods: Twenty-week old C57BL/6J mice were fed either a control or pro-calcific diet for 16 weeks and monitored via echocardiography, histology, immunohistochemistry, and quantitative polarized light imaging. Additionally, TPEF imaging was used to quantify tissue autofluorescence (A) at 755 nm, 810 nm and 860 nm excitation, to calculate TPEF 755–860 ratio (A 860/525 /(A 755/460 + A 860/525 )) and TPEF Collagen-Calcium ratio (A 810/525 /(A 810/460 + A 810/525 )) in the murine valves. In a separate experiment, animals were fed the above diets till 28 weeks to assess for later-stage calcification. Results: Pro-calcific mice showed evidence of lipid deposition at 4 weeks and calcification at 16 weeks at the valve commissures. The valves of pro-calcific mice also showed positive expression for markers of osteogenic differentiation, myofibroblast activation, proliferation, inflammatory cytokines and collagen remodeling. Pro-calcific mice exhibited lower TPEF autofluorescence ratios, at locations coincident with calcification, that correlated with increased collagen disorganization and positive expression of osteogenic markers. Additionally, locations with lower TPEF autofluores- cence ratios at 4 and 16 weeks exhibited increased calcification at later 28-week timepoints. Conclusions: This study suggests the potential of TPEF autofluorescence metrics to serve as a label-free tool for early detection and monitoring of CAVD pathophysiology. Keywords: Calcific aortic valve disease, Valve calcification, Two-photon excited fluorescence microscopy, Wild-type mouse model © The Author(s) 2020. Open Access This article is licensed under a Creative Commons Attribution 4.0 International License, which permits use, sharing, adaptation, distribution and reproduction in any medium or format, as long as you give appropriate credit to the original author(s) and the source, provide a link to the Creative Commons licence, and indicate if changes were made. The images or other third party material in this article are included in the article’s Creative Commons licence, unless indicated otherwise in a credit line to the material. If material is not included in the article’s Creative Commons licence and your intended use is not permitted by statutory regulation or exceeds the permitted use, you will need to obtain permission directly from the copyright holder. To view a copy of this licence, visit http://creativecommons.org/licenses/by/4.0/. The Creative Commons Public Domain Dedication waiver (http://creativeco mmons.org/publicdomain/zero/1.0/) applies to the data made available in this article, unless otherwise stated in a credit line to the data. Background Calcific aortic valve disease (CAVD) is the most com- mon form of valvulopathy in the western world, with a prevalence of 13.3% in people above 75 years of age [1, 2]. CAVD is associated with a 50% elevated risk of morbidity and mortality [3]. Once severe aortic stenosis develops, valve replacement, either via surgical or transcatheter approaches, is the current treatment standard, as early detection, prevention, and mitigation strategies have yet to be clinically adopted [1, 2, 4]. ere is thus a need to Open Access *Correspondence: [email protected] 1 Department of Biomedical Engineering, University of Arkansas, 122 John A. White Jr. Engineering Hall, Fayetteville, AR 72701, USA Full list of author information is available at the end of the article

Welcome message from author
This document is posted to help you gain knowledge. Please leave a comment to let me know what you think about it! Share it to your friends and learn new things together.
Transcript

Tandon et al. BMC Cardiovasc Disord (2020) 20:521 https://doi.org/10.1186/s12872-020-01776-8
RESEARCH ARTICLE
Label-free optical biomarkers detect early calcific aortic valve disease in a wild-type mouse modelIshita Tandon1, Shelby Johns1, Alan Woessner1, Jessica Perez1, Delaney Cross1, Asya Ozkizilcik1, Timothy J. Muldoon1, Srikanth Vallurupalli2, Muralidhar Padala3, Kyle P. Quinn1 and Kartik Balachandran1*
Abstract
Background: Calcific aortic valve disease (CAVD) pathophysiology is a complex, multistage process, usually diag-nosed at advanced stages after significant anatomical and hemodynamic changes in the valve. Early detection of disease progression is thus pivotal in the development of prevention and mitigation strategies. In this study, we devel-oped a diet-based, non-genetically modified mouse model for early CAVD progression, and explored the utility of two-photon excited fluorescence (TPEF) microscopy for early detection of CAVD progression. TPEF imaging provides label-free, non-invasive, quantitative metrics with the potential to correlate with multiple stages of CAVD pathophysi-ology including calcium deposition, collagen remodeling and osteogenic differentiation.
Methods: Twenty-week old C57BL/6J mice were fed either a control or pro-calcific diet for 16 weeks and monitored via echocardiography, histology, immunohistochemistry, and quantitative polarized light imaging. Additionally, TPEF imaging was used to quantify tissue autofluorescence (A) at 755 nm, 810 nm and 860 nm excitation, to calculate TPEF 755–860 ratio (A860/525/(A755/460 + A860/525)) and TPEF Collagen-Calcium ratio (A810/525/(A810/460 + A810/525)) in the murine valves. In a separate experiment, animals were fed the above diets till 28 weeks to assess for later-stage calcification.
Results: Pro-calcific mice showed evidence of lipid deposition at 4 weeks and calcification at 16 weeks at the valve commissures. The valves of pro-calcific mice also showed positive expression for markers of osteogenic differentiation, myofibroblast activation, proliferation, inflammatory cytokines and collagen remodeling. Pro-calcific mice exhibited lower TPEF autofluorescence ratios, at locations coincident with calcification, that correlated with increased collagen disorganization and positive expression of osteogenic markers. Additionally, locations with lower TPEF autofluores-cence ratios at 4 and 16 weeks exhibited increased calcification at later 28-week timepoints.
Conclusions: This study suggests the potential of TPEF autofluorescence metrics to serve as a label-free tool for early detection and monitoring of CAVD pathophysiology.
Keywords: Calcific aortic valve disease, Valve calcification, Two-photon excited fluorescence microscopy, Wild-type mouse model
© The Author(s) 2020. Open Access This article is licensed under a Creative Commons Attribution 4.0 International License, which permits use, sharing, adaptation, distribution and reproduction in any medium or format, as long as you give appropriate credit to the original author(s) and the source, provide a link to the Creative Commons licence, and indicate if changes were made. The images or other third party material in this article are included in the article’s Creative Commons licence, unless indicated otherwise in a credit line to the material. If material is not included in the article’s Creative Commons licence and your intended use is not permitted by statutory regulation or exceeds the permitted use, you will need to obtain permission directly from the copyright holder. To view a copy of this licence, visit http://creat iveco mmons .org/licen ses/by/4.0/. The Creative Commons Public Domain Dedication waiver (http://creat iveco mmons .org/publi cdoma in/zero/1.0/) applies to the data made available in this article, unless otherwise stated in a credit line to the data.
BackgroundCalcific aortic valve disease (CAVD) is the most com-mon form of valvulopathy in the western world, with a
prevalence of 13.3% in people above 75 years of age [1, 2]. CAVD is associated with a 50% elevated risk of morbidity and mortality [3]. Once severe aortic stenosis develops, valve replacement, either via surgical or transcatheter approaches, is the current treatment standard, as early detection, prevention, and mitigation strategies have yet to be clinically adopted [1, 2, 4]. There is thus a need to
Open Access
*Correspondence: [email protected] Department of Biomedical Engineering, University of Arkansas, 122 John A. White Jr. Engineering Hall, Fayetteville, AR 72701, USAFull list of author information is available at the end of the article

Page 2 of 15Tandon et al. BMC Cardiovasc Disord (2020) 20:521
develop better diagnostic and therapeutic approaches for CAVD.
The early pathogenic processes in CAVD are defined by the phenotypic transformation of valve endothelial (VEC) and interstitial (VIC) cells via cellular activation, osteogenic differentiation [5–7], as well as maladaptive extracellular matrix (ECM) remodeling [8, 9]. CAVD pathophysiology is marked by infiltration of cytokines, lipid deposition, and calcific nodule formation [4, 10, 11]. These early pathogenic processes are simulated using two- and three-dimensional in vitro models and in vivo models that mimic the CAVD process and valve milieu to varying degrees of accuracy [7, 12–15]. Wild-type diet-based mouse CAVD models have previously demonstrated deposition of monocyte-mac-rophages, lipids, and lipoproteins [16, 17], but to our knowl-edge no such diet-based models exhibit early calcification as demonstrated by positive Alizarin Red S (ARS) staining, as well as positive osteopontin and Runt-related transcrip-tion factor 2 (RUNX2) expression [14,17]. Assmann and colleagues have shown that a diet regimen supplemented with vitamin D, cholesterol and dicalcium phosphate caused significant calcification of the aortic root in Wistar rats [18]. Vitamin D in combination with cholesterol has been sepa-rately shown to increase vascular calcification in rats [19]. Vitamin D is responsible for maintaining serum calcium levels in humans and both deficiency and excess of Vitamin D has been shown to promote cardiovascular calcification [20–22]. Higher calcium phosphate and elevated serum cal-cium are also established risk factors for calcification pro-gression [21, 22]. We exploited a similar dietary regimen to develop a wild-type mouse model for early CAVD.
Multiple biochemical and imaging markers are associated with independent events such as endothelial dysfunction, inflammatory cytokine infiltration, matrix remodeling, and mineral deposition to assess either the presence or severity of calcification [2, 4, 10, 11, 23]. However, there is a dearth of label-free imaging biomarkers to monitor the progres-sion of calcification in the aortic valve, both in clinics and research laboratories [23]. Clinically, a stenotic aortic valve usually is detected by auscultation of a systolic murmur and confirmed by echocardiography, and relies on late hallmarks of CAVD like hemodynamic malfunction and impaired geometry of the valve [24]. Imaging techniques such as cardiac magnetic resonance imaging and cardiac computed tomography have also been shown to be sensi-tive to the late hallmarks of the disease; however, there is a specific lack of tools to detect early CAVD progression [24–26]. Two-photon excited fluorescence (TPEF) microscopy has recently shown potential in providing label-free quanti-tative metrics that might associate with osteogenic differen-tiation [27]. TPEF allows quantification of the endogenous fluorescence ratios of the cellular co-factors flavin adenine (FAD) and nicotinamide adenine (NADH) dinucleotides
in their oxidized and reduced forms, respectively and is known as the optical redox ratio (i.e. FAD/(FAD + NADH)) [27]. It was previously established in vitro that osteogenic differentiation of mesenchymal stem cells is associated with a reduction in TPEF-derived optical redox ratios [27]. We have also demonstrated that this TPEF-based optical redox ratios in VICs was reduced as cellular stretching increased from normal to pathologic magnitudes [13]. Additionally, optical redox ratio altered and correlated with temporal changes in VIC phenotype during osteogenic de-differen-tiation, in vitro [28]. In addition to NADH and FAD, mole-cules such as collagen, calcium and lipids within tissues will contribute to the autofluorescence emission in the visible range [27, 29–32]. Recently, TPEF has been used to iden-tify endogenous fluorescence from calcium deposition that correlated with mineralization in ApoE−/−mice and calci-fied human valves [29].
In this study, based on the above prior work, we hypoth-esized that TPEF autofluorescence markers would coin-cide with traditional phenotypic markers that indicate early progression of CAVD. We tested this hypothesis using ex vivo imaging of valves from a diet-based wild-type C57BL/6J mouse model that demonstrated early CAVD progression with lipid and calcium deposition, and matrix remodeling. In our model, the aortic valve com-missures showed lower TPEF autofluorescence ratios, which was concurrent with increased cell activation, inflammatory cytokine expression, cell proliferation and markers for osteogenic differentiation, and which was predictive of increased calcification at later time points.
MethodsExperimental animals for early‑CAVD modelAll animal experiments were performed in compliance with the University of Arkansas Institutional Animal Care and Use Committee (IACUC) approval and conform to all appropriate guidelines. Male wild-type C57BL/6J mice were obtained from The Jackson Laboratory (Bar Harbor, ME) and housed at most four per cage under optimum temperature, humidity and light cycle. Adult mice aged 20 weeks [33] were randomized and fed an open standard diet, with either a control or pro-calcific diet supplementa-tion (Research Diets, New Brunswick, NJ). The differences in the dietary supplements [18] are outlined in Table 1. The amount of food intake was monitored per cage and the mice were weighed every three to four days till 16 weeks. In a separate experiment, animals were fed the above diets till 28 weeks to assess for later-stage calcification.
Echocardiography for animal modelEchocardiography was performed for all the mice in the study using standard protocols [5]. At the 4, 8, 12, 16 and 28-week time points, mice were anesthetized using
Page 3 of 15Tandon et al. BMC Cardiovasc Disord (2020) 20:521
inhalative 4% isoflurane with 2 L/Min oxygen. Mice were maintained at 1% isoflurane with 2 L/Min oxygen through a nose cone on a heated pad for the entire echo-cardiography procedure. After hair removal from the ventral side, an Agilent SONOS 5500 (Agilent Technolo-gies, Santa Clara, CA) ultrasound machine was used to obtain and analyze 2D and M-mode images to measure the diastolic (LVIDd) and systolic (LVIDs) left ventri-cle internal dimensions. The heart rate (HR) was moni-tored and recorded simultaneously via Covidien Kendall 230 conductive adhesive hydrogel electrodes (Dublin, Ireland). Ejection Fraction (EF), End Diastolic Volume (EDV), End Systolic Volume (ESV) and Cardiac Output (CO) were assessed using Simpson’s Method, via the below Eqs. (5). At least seven animals per condition per time point were assessed.
Pathophysiological assessment and tissue processingAt the aforementioned time points, the animals were euthanized by cervical dislocation, and their hearts were extracted, washed thoroughly in cold, sterile PBS and fro-zen in optimum cutting temperature compound (Sakura Finetek USA Inc, Torrance, CA). Serial 5–8 µm trans-verse sections of the aortic valve were obtained using a Leica CM1860 cryotome (Buffalo grove, IL). Blood was collected in heparin coated tubes and plasma was stored at -80 freezer for further processing.
Histology and ImmunohistochemistryHematoxylin and eosin (H&E; IHC World, Woodstock, MD), Oil red O (Electron Microscopy Sciences, Hatfield,
EDV =7.0+ LVIDd3
2.4 + LVIDd
ESV =7.0+ LVIDs3
2.4 + LVIDs
EF(%) =
(
LVIDd3 − LVIDs3)
× 100
LVIDd3
CO = (EDV − ESV )×HR
PA), Alizarin Red S (ARS; Sigma-Aldrich, St. Louis, MO) and Picrosirius Red (PSR; Electron Microscopy Sciences, Hatfield, PA) staining were performed using standard protocols [5, 18]. Oil red O was utilized to assess lipid deposition, ARS was used for detecting calcium deposi-tion and PSR stain was used to analyze tissue collagen fibers. Immunohistochemistry was performed using primary antibodies (all from Abcam, Cambridge, MA) against αSMA (1:100), vimentin (1:300), RUNX2 (1:200), osteopontin (1:200), BMP4 (1:100), Ki67 (1:500), TGFβ1 (1:50). Appropriate Alexa fluor-488 and − 594 (1:200; Life Technologies, Carlsbad, CA) conjugated secondary antibodies were used for immunolabeling. Negative con-trols were labeled only with secondary antibodies (Addi-tional file 1: Fig. 1) to assess nonspecific binding. A Nikon (Tokyo, Japan) epifluorescence microscope in conjunc-tion with NIS Elements software was used to obtain both bright-field and fluorescent images. A Nikon C-SP simple polarizer eclipse (model no. MBB75370) was attached to the microscope and polarized light microscopy was uti-lized to image the PSR stained sections.
To quantify the ARS positive calcification, images were loaded onto Fiji-ImageJ and converted to 8-bit format. A constant threshold was applied and the plugin ‘Analyze Particles’ was used to output the percentage area posi-tive for the ARS staining (Additional file 1: Fig. 2) in leaf-lets, commissures, and root separately by outlining as described for TPEF metrics in Additional file 1: Fig. 3D. Analysis of PSR stained sections was performed using a custom MATLAB code (MathWorks, Natick, MA) for the aortic root, commissures and leaflet regions sepa-rately [5]. Collagen fiber thickness was assessed based on color and binned into four categories—thick (red), thick intermediate (orange), thin intermediate (yellow) and thin (green) [5]. At least three to four biological replicates per group were analyzed. For immunohistochemistry, three individual researchers, blinded to the study, quali-tatively assessed three biological replicates per group and provided a score of 0 for no or low expression, 1 for moderate expression, or 2 for high expression. Scores of the three individuals were averaged and assigned a “-” if scored as 0, “ + ” if the mean score was from 0—0.66, “ + + ” if scored from 0.66 to 1.33 or “ + + + ” if scored from 1.33 to 2. The averaged mean score from the three individuals was used to perform correlation analysis with TPEF metrics.
Quantitative polarized light imagingQuantitative polarized light imaging (QPLI) was used to image PSR stained sections, to measure collagen fiber orientation, and thickness through phase retardation. Briefly, a custom-built trans-illumination based QPLI microscope (Olympus BX51, Olympus Corp., Tokyo,
Table 1 Differences in supplementation for control and pro-calcific diets
Control diet Pro‑calcific diet
Cholesterol 0.0% (w/w) 2.07% (w/w)
Total Vitamin D3 934 (IU/kg) 75,042 (IU/kg)
Calcium 0.57% (w/w) 0.99% (w/w)
Phosphorus 0.435% (w/w) 0.75% (w/w)

Page 4 of 15Tandon et al. BMC Cardiovasc Disord (2020) 20:521
Japan) setup with a rotating polarizer and circular ana-lyzer was utilized [34–37]. Image collection was com-pleted using a 20 × objective (UPlanFL N 20x, 0.5 NA, Olympus Corp.) in order to accommodate the size of the samples, and full field images were produced via image stitching. The images were analyzed using a custom MATLAB code for the aortic root, commissures and leaf-let regions separately (Additional file 1: Fig. 3A). Average light retardation, which is proportional to the thickness of collagen at each pixel location, was assessed as the primary QPLI metric. A rotating polarizer and circular analyzer enabled the assessment of variance in collagen fiber direction at each pixel [36, 37], and directional vari-ance of fiber orientations was computed to evaluate the relative strength of collagen fiber alignment in the mean direction [37, 38]. At least three to four biological repli-cates per group were analyzed.
Two photon excited fluorescence (TPEF) imagingTPEF imaging was carried out using a custom-built resonant-scanning setup (Thorlabs, Newton, NJ) with a Mai-Tai ultrafast Ti:Sapphire tunable laser source (Spectra-Physics, Santa Clara, CA), [13] with a (20x, 0.75 NA) water immersion objective (Nikon, Japan). Tissue sections utilized for TPEF imaging were frozen, unprocessed and unfixed. It has been previously shown that TPEF autofluorescence ratio of ex vivo frozen tis-sue sections correlates highly with in vivo measurements [39]. The average intensity of the region of interest at a given excitation and emission wavelength is represented as Aexcitation/emission. TPEF autofluorescence was col-lected at 755 nm excitation with 460 nm/40 nm emis-sion for A755/460, 860 nm excitation with 525 nm/45 nm emission for A860/525 (Additional file 1: Fig. 3B), 810 nm excitation with 460 nm/40 nm emission for A810/460 and 525 nm/45 nm emission for A810/525 (Additional file 1: Fig. 3C) [27, 29]. Laser power of 40mW and photomul-tiplier tube (PMT) gain was kept consistent throughout imaging. Two TPEF autofluorescence metrics were cal-culated using a custom MATLAB code. The aortic root, commissures and leaflet regions were manually outlined and analyzed separately (Additional file 1: Fig. 3D). The following equations were utilized to obtain the autofluo-rescence intensity ratios at each pixel.
TPEF 755 - 860 Ratio =A860/525
A755/460 + A860/525
TPEF Collagen - Calcium (Col - Cal) Ratio
=A810/525
A810/460 + A810/525
It should be noted that both these TPEF autofluores-cence ratios are influenced by the collagen, lipids, min-eralized calcific deposits, NADH and FAD [29, 30]. TPEF 755–860 ratio has often been used as an optical redox ratio when NADH and FAD are the only significant fluo-rophores [27, 32, 40]. Four biological replicates were uti-lized for the TPEF imaging per experimental treatment group for the mice.
Statistical analysisAll data was represented as mean ± standard error of the mean (SEM). Two-way analysis of variance (ANOVA) was utilized for comparison between the treatment groups at different time points for the murine samples with Tukey’s post-hoc tests if data passed normality tests. A p-value of less than 0.05 was considered statistically significant. The exact p-value is reported wherever rel-evant, if it was less than 0.1. The Kruskal–Wallis ANOVA on ranks non-parametric test was utilized if data did not pass the normality tests. Pearson’s correlation coefficient was used for the correlation analysis of normally distrib-uted data and Spearman’s Rank correlation was used for the correlation analysis of non-parametric data including immunohistochemistry scoring. All scoring of immuno-histochemistry images was performed in a blinded man-ner. JMP (SAS Institute, Cary, NC) and SigmaPlot (Systat Software Inc., San Jose, CA) were utilized for the data analysis and graphing.
ResultsMice on pro‑calcific diet had lipid and calcium deposition at the aortic valve commissuresHistology was employed to assess the morphology of the aortic valve and typical hallmarks of CAVD progres-sion such as lipid deposition and calcification [11, 17, 18, 41]. Hematoxylin and Eosin staining revealed plaque-like structures in the aortic root proximal to the commissures at 4 weeks in the mice fed a pro-calcific diet (Fig. 1a–d). Oil Red O staining was performed to confirm if the pro-calcific mice did indeed have deposition of lipid vacuoles. The control mice did not stain positive for Oil Red O (Fig. 1e, f ), however, the pro-calcific mice showed posi-tive Oil Red O staining at 4 weeks at the valve commis-sures (Fig. 1g, h). Qualitatively, no increase in Oil Red O-positive lipid deposition was observed in the pro-cal-cific groups at 16 weeks compared to the 4-week time point. Alizarin Red S (ARS) staining was performed to assess calcium deposition. Positive ARS staining was not observed in the control mice for all time points (Fig. 1i, j). Pro-calcific mice showed positive ARS staining in the commissures at the 16-week time point (Fig. 1k, l).
Page 5 of 15Tandon et al. BMC Cardiovasc Disord (2020) 20:521
Mice on pro‑calcific diet had increased expression of markers for cell activation and osteogenic dedifferentiationImmunohistochemistry was performed to further inves-tigate the early and late markers of aortic valve disease
progression [18, 42]. Control mice showed lower α-SMA expression and higher vimentin expression suggesting a quiescent phenotype of the valve cells under this treat-ment (Fig. 2a, b, a′, b′) [43]. Higher α-SMA and lower
Fig. 1 Lipid and calcium Deposition assessed by Histology. a–d Representative Hematoxylin and Eosin stained transverse sections at 10 ×, and c, d 20 × depicting plaque-like structures near the commissural walls in pro-calcific mice as marked by arrows. e–h Representative Oil Red O stained transverse sections at 10 ×, and g, h 20 × depicting lipid deposition at the commissural walls in pro-calcific mice as marked by arrows. i–l Representative Alizarin Red S (ARS) stained transverse sections at 10 ×, and k, l 20 × depicting calcium deposition at the commissural walls in pro-calcific mice at 16 weeks, as marked by arrows. Scale Bars—500 µm. N = 3 (mouse)
Fig. 2 Expression of phenotypic and functional markers assessed by Immunohistochemistry. Representative transverse sections of aortic valves from control and pro-calcific mice at 4 weeks showing expression of a, h alpha smooth muscle actin (αSMA), b, i vimentin, c, j RUNX2, d, k osteopontin, e, l bone morphogenic protein 4 (BMP4), f, m Ki67 and g, n transforming growth factor β1 (TGFβ1). Representative transverse sections of aortic valves from control and pro-calcific mice at 16 weeks showing expression of a′, h′ alpha smooth muscle actin (αSMA), b′, i′ vimentin, c′, j′ RUNX2, d′, k′ osteopontin, e′, l′ bone morphogenic protein 4 (BMP4), f′, m′ Ki67 and g′, n′ transforming growth factor β1 (TGFβ1). Positive expression is marked by arrows and scored as -, + , + + or + + + . The stars denote autofluorescence from the calcified lesions. Scale Bars—500 µm. N = 3 (mice)
Page 6 of 15Tandon et al. BMC Cardiovasc Disord (2020) 20:521
vimentin (Fig. 2h, i, h′, i′) expression was observed in the pro-calcific mice, suggesting an activated cell pheno-type [43]. There was also higher osteopontin expression (Fig. 2d, k, d′, k′) at the commissures of pro-calcific mice as compared to control mice, suggesting an osteogenic phenotype in these samples [2, 18]. The expression of RUNX2 in pro-calcific mice was also qualitatively more pronounced at the 16-week time point (Fig. 2c′, j′) as compared to the 4-week time point (Fig. 2c, j) suggest-ing disease progression over the course of this timespan [2]. Osteopontin and BMP4 expression (Fig. 2e, l, e′, l′) showed an increase in pro-calcific mice only at 4 weeks suggesting early changes. Control mice had lower Ki67 expression as compared to pro-calcific mice at the com-missures, suggesting that the valvular cells in the pro-calcific groups were more proliferative [5, 39] (Fig. 2f, m, f′ m′). TGFβ1, a marker for inflammatory cytokines [42], expressed positively at the commissures in pro-calcific mice (Fig. 2g, n, g′, n′) at 16 weeks.
Mice on pro‑calcific diet showed increased collagen remodeling compared to control dietTo further characterize structural markers for disease progression, we assessed collagen remodeling via PSR staining and quantitative polarized light imaging (QPLI) techniques. PSR staining was performed to enhance the birefringence of collagen [44] present in the mouse valves (Fig. 3a). The PSR stained sections were first imaged through a linear polarizer to analyze the thickness of collagen fibers, a metric that is usually associated with collagen fiber diameter, where the increase in thick-ness corresponds to a shift from green (thinner) to red (thicker) fibers. It is important to note that this shift from green to red is also dependent on the packing density and alignment of collagen fibers [45]. A lower percent-age of thinner (green) fibers was observed in the leaflets (p = 0.057) (Fig. 3b) in the pro-calcific valves at 4 weeks as compared to the control valves. A higher percentage of thicker (red) fibers was observed in the commissures (p = 0.057) (Fig. 3c) in the pro-calcific valves at 4 weeks as compared to the control valves. However, at 16 weeks these differences disappeared. No differences were observed in fiber thickness between the roots of control versus pro-calcific mice (p > 0.1) (Fig. 3d).
Via QPLI, average retardation (Fig. 3e) showed a sig-nificant reduction in the leaflets of pro-calcific mice as compared to the control mice at 16 weeks (p = 0.0455) (Fig. 3f ). Compared to the control mice at 4 weeks, the average retardation was significantly higher in control mice at 16 weeks (p = 0.0269). The commissures showed no statistically significant differences in the average retar-dation (p > 0.1) (Fig. 3g). The aortic root tended to have
an increased average retardation in the pro-calcific group as compared to the control mice at 4 weeks (p = 0.092) (Fig. 3h).
Average local directional variance in the collagen fiber orientation was used as a metric to assess the alignment of collagen fibers (Fig. 3i) [38]. Average local directional variance increased in the leaflets of the pro-calcific mice as compared to the control mice at 16 weeks (p = 0.061) (Fig. 3j). There were no significant differences (p > 0.1) observed in the commissures (Fig. 3k) and roots (Fig. 3l).
Average collagen positive pixel density (Fig. 3m) was assessed as an additional parameter for collagen remod-eling [38]. The leaflets showed significantly reduced col-lagen positive pixel density in the pro-calcific group at 16 weeks, as compared to the control mice at 16 weeks (p = 0.0147) and pro-calcific mice at 4 weeks (p = 0.0747) (Fig. 3n). There were no significant differences (p > 0.1) observed in the commissures (Fig. 3o) and roots (Fig. 3p).
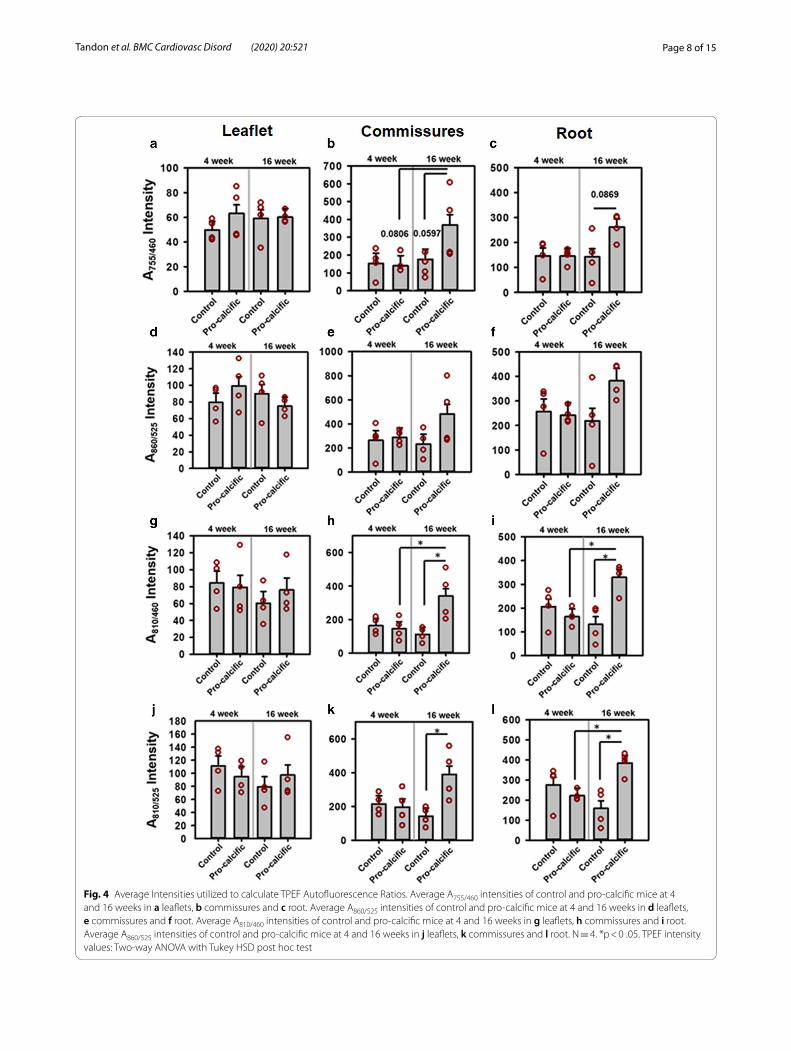
Changes in individual A755/460, A860/525, A810/460 and A810/525 autofluorescence intensitiesThe A755/460 and A860/525 autofluorescence intensities did not show significant differences in the leaflets (Fig. 4a, d), commissures (Fig. 4b, e), and roots (Fig. 4c, f ) (all p > 0.1) for control and pro-calcific mice at 4 and 16 weeks. The A755/460 intensity tended to increase at the commis-sures of the 16-week pro-calcific mice compared to the 16-week control mice (p = 0.0597) and 4-week pro- cal-cific mice (p = 0.0806). The A755/460 intensity also tended to increase at the roots of the 16-week pro-calcific mice compared to the 16-week control mice (p = 0.0869). The A810/460 (p > 0.1) and A810/525 (p > 0.1) autofluorescence did not change in the leaflets (Fig. 4g, j). The A810/460 intensity increased significantly at the commissures of the 16-week pro-calcific mice compared to the 16-week control mice (p = 0.0115) and 4-week pro—calcific mice (p = 0.0304) and also increased with respect to 4-week control mice (p = 0.0514) (Fig. 4h). The A810/525 intensity increased sig-nificantly at the commissures of the 16-week pro-calcific mice compared to the 16-week control mice (p = 0.0174) (Fig. 4k). The A810/460 intensity increased significantly at the roots of the 16-week pro-calcific mice compared to the 16-week control mice (p = 0.0045) and 4-week pro- calcific mice (p = 0.0154) and also increased with respect to 4-week control mice (p = 0.0775) (Fig. 4i). The A810/525 intensity increased significantly at the roots of the 16-week pro-calcific mice compared to the 16-week control mice (p = 0.0059) and 4-week pro-calcific mice (p = 0.0463) (Fig. 4l). The A810/460 intensity correlated significantly with the A755/460 intensity for commis-sures (R = 0.9482, p < 0.0001) and roots (R = 0.6938, p = 0.0029) but not for leaflets (R = 0.2028, p = 0.4512). The A810/525 intensity correlated significantly with the
Page 7 of 15Tandon et al. BMC Cardiovasc Disord (2020) 20:521
A860/525 intensity for commissures (R = 0.8644, p < 0.0001) and roots (R = 0.6501, p = 0.0064) but not for leaflets (R = 0.0302, p = 0.9117).
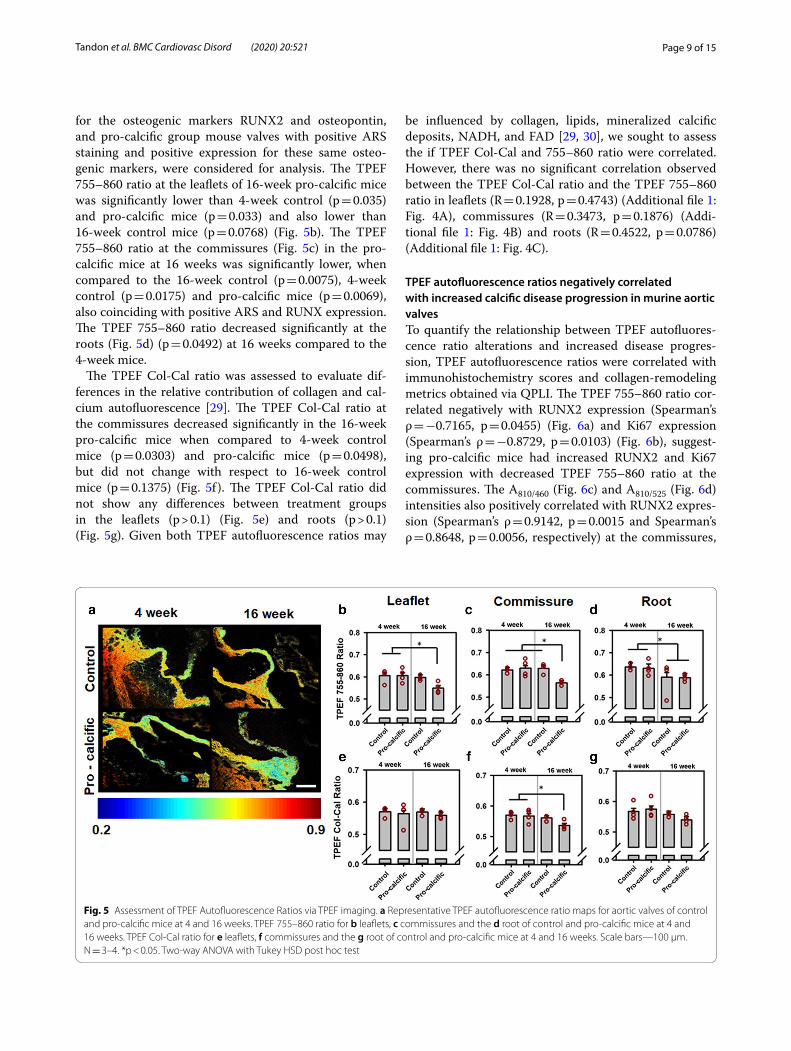
TPEF autofluorescence ratios altered with calcific disease progression in murine aortic valvesUsing the above autofluorescence intensities, we first obtained TPEF 755–860 ratio maps (Fig. 5a). Mouse valve sections from the control treatment group, without positive ARS staining and without positive expression
Fig. 3 Assessment of collagen remodeling via PSR and QPLI. a Representative picrosirius red (PSR) stained aortic valves for control and pro-calcific mice at 4 and 16 weeks imaged by linear polarized light microscopy. Scale Bar—500 µm. Percentage of thin, intermediate and thick collagen fibers for the b leaflets, c commissures and d roots. e Representative images for quantitative polarized light imaging (QPLI) analyzed aortic valves for control and pro-calcific mice at 4 and 16 weeks depicting average retardation ranging from 0˚ to 50˚. Scale Bar—500 µm. Computed average retardation for f leaflets, g commissures and h roots. i Representative images for control and pro-calcific mice at 4 and 16 weeks depicting average local variance in the collagen fiber orientation. Scale Bar—500 µm. Computed average local variance for j leaflets, k commissures and l roots. m Representative images for control and pro-calcific mice at 4 and 16 weeks depicting average collagen positive pixel density. Computed average collagen positive pixel density for n leaflets, o commissures and p roots. Scale Bar—500 µm. N = 4. **p < 0.01, *p < 0.05. Mice PSR, average retardation, average local directional variance and collagen positive pixel density: Two-way ANOVA with Tukey HSD post hoc test
Page 8 of 15Tandon et al. BMC Cardiovasc Disord (2020) 20:521
Fig. 4 Average Intensities utilized to calculate TPEF Autofluorescence Ratios. Average A755/460 intensities of control and pro-calcific mice at 4 and 16 weeks in a leaflets, b commissures and c root. Average A860/525 intensities of control and pro-calcific mice at 4 and 16 weeks in d leaflets, e commissures and f root. Average A810/460 intensities of control and pro-calcific mice at 4 and 16 weeks in g leaflets, h commissures and i root. Average A860/525 intensities of control and pro-calcific mice at 4 and 16 weeks in j leaflets, k commissures and l root. N = 4. *p < 0 .05. TPEF intensity values: Two-way ANOVA with Tukey HSD post hoc test
Page 9 of 15Tandon et al. BMC Cardiovasc Disord (2020) 20:521
for the osteogenic markers RUNX2 and osteopontin, and pro-calcific group mouse valves with positive ARS staining and positive expression for these same osteo-genic markers, were considered for analysis. The TPEF 755–860 ratio at the leaflets of 16-week pro-calcific mice was significantly lower than 4-week control (p = 0.035) and pro-calcific mice (p = 0.033) and also lower than 16-week control mice (p = 0.0768) (Fig. 5b). The TPEF 755–860 ratio at the commissures (Fig. 5c) in the pro-calcific mice at 16 weeks was significantly lower, when compared to the 16-week control (p = 0.0075), 4-week control (p = 0.0175) and pro-calcific mice (p = 0.0069), also coinciding with positive ARS and RUNX expression. The TPEF 755–860 ratio decreased significantly at the roots (Fig. 5d) (p = 0.0492) at 16 weeks compared to the 4-week mice.
The TPEF Col-Cal ratio was assessed to evaluate dif-ferences in the relative contribution of collagen and cal-cium autofluorescence [29]. The TPEF Col-Cal ratio at the commissures decreased significantly in the 16-week pro-calcific mice when compared to 4-week control mice (p = 0.0303) and pro-calcific mice (p = 0.0498), but did not change with respect to 16-week control mice (p = 0.1375) (Fig. 5f ). The TPEF Col-Cal ratio did not show any differences between treatment groups in the leaflets (p > 0.1) (Fig. 5e) and roots (p > 0.1) (Fig. 5g). Given both TPEF autofluorescence ratios may
be influenced by collagen, lipids, mineralized calcific deposits, NADH, and FAD [29, 30], we sought to assess the if TPEF Col-Cal and 755–860 ratio were correlated. However, there was no significant correlation observed between the TPEF Col-Cal ratio and the TPEF 755–860 ratio in leaflets (R = 0.1928, p = 0.4743) (Additional file 1: Fig. 4A), commissures (R = 0.3473, p = 0.1876) (Addi-tional file 1: Fig. 4B) and roots (R = 0.4522, p = 0.0786) (Additional file 1: Fig. 4C).
TPEF autofluorescence ratios negatively correlated with increased calcific disease progression in murine aortic valvesTo quantify the relationship between TPEF autofluores-cence ratio alterations and increased disease progres-sion, TPEF autofluorescence ratios were correlated with immunohistochemistry scores and collagen-remodeling metrics obtained via QPLI. The TPEF 755–860 ratio cor-related negatively with RUNX2 expression (Spearman’s ρ = −0.7165, p = 0.0455) (Fig. 6a) and Ki67 expression (Spearman’s ρ = −0.8729, p = 0.0103) (Fig. 6b), suggest-ing pro-calcific mice had increased RUNX2 and Ki67 expression with decreased TPEF 755–860 ratio at the commissures. The A810/460 (Fig. 6c) and A810/525 (Fig. 6d) intensities also positively correlated with RUNX2 expres-sion (Spearman’s ρ = 0.9142, p = 0.0015 and Spearman’s ρ = 0.8648, p = 0.0056, respectively) at the commissures,
Fig. 5 Assessment of TPEF Autofluorescence Ratios via TPEF imaging. a Representative TPEF autofluorescence ratio maps for aortic valves of control and pro-calcific mice at 4 and 16 weeks. TPEF 755–860 ratio for b leaflets, c commissures and the d root of control and pro-calcific mice at 4 and 16 weeks. TPEF Col-Cal ratio for e leaflets, f commissures and the g root of control and pro-calcific mice at 4 and 16 weeks. Scale bars—100 µm. N = 3–4. *p < 0.05. Two-way ANOVA with Tukey HSD post hoc test

Page 10 of 15Tandon et al. BMC Cardiovasc Disord (2020) 20:521
suggesting RUNX2-expressing diseased areas may exhibit higher collagen and calcium deposition.
The TPEF 755–860 ratio also correlated positively with average retardation (R = 0.5272, p = 0.0434) for pro-cal-cific mice and negatively with average directional vari-ance (R = −0.3909, p = 0.0438) (Fig. 6e), while average retardation correlated negatively with average directional variance (R = −0.6707, p = 0.0001) (Fig. 6f ). At 4 weeks, TPEF Col-Cal ratio also correlated negatively with retar-dation (R = −0.6139, p = 0.0067) suggesting decrease in Col–Cal ratio coincided with increased retardation and thicker collagen fibers. At 4 weeks, slightly thicker fibers were found in pro-calcific mice. We additionally found that at 16 weeks, A810/460 and A810/525 intensities also pos-itively correlated with average local variance (R = 0.7458, p = 0.021 and R = 0.728, p = 0.0262, respectively). Fur-ther, A810/460 (Fig. 6g) and A810/525 (Fig. 6h) intensities positively correlated with collagen positive pixel den-sity (R = 0.4937, p = 0.0089 and R = 0.5018, p = 0.0077, respectively).
Lower 755–860 Ratio may be predictive of increased calcificationTo assess if presentation of lower 755–860 ratio preceded increased calcification, the custom diet was continued to be fed to mice until week 28, in a separate trial. Con-trol and pro-calcific mice at 28 weeks were assessed for calcification via ARS staining (Fig. 7a) and ARS positive percentage area was quantified for leaflets, commissures, and root. It was observed that the leaflets of pro-calcific mice at 28 weeks showed significantly increased ARS positive calcification as compared to 16-week control (p = 0.0393), pro-calcific (p = 0.0305) mice and 4-week control mice (p = 0.0113) (Fig. 7b). It was also observed that the commissures (Fig. 7c) and roots (Fig. 7d) of pro-calcific mice at 28 weeks showed significantly increased ARS positive calcification as compared to 4- and 16-week mice and 28-week control mice (p < 0.0001). Additionally, commissures of pro-calcific mice at 16 weeks showed significantly increased ARS positive calcification as com-pared to 4-week mice (p < 0.01) and 16 (p = 0.0004) and 28 (p = 0.0006) week control mice (Fig. 7c). Indeed, the ARS positive percentage area correlated negatively with TPEF
Fig. 6 Correlation of TPEF Autofluorescence Ratios with Collagen remodeling and Osteogenic Protein Expression. TPEF 755–860 Ratio for commissures correlated with a RUNX2 expression and b Ki67 Expression score in control and pro-calcific mice for 4 and 16 weeks. c Average A810/460 intensity and d Average A860/525 intensity correlated with RUNX2 expression score in control and pro calcific mice for 4 and 16 weeks. e TPEF 755–860 Ratio correlated with average directional variance of collagen from leaflets, commissures and roots of control and pro calcific mice for 4 and 16 weeks. f Average retardation correlated with average directional variance of collagen from leaflets, commissures and roots of control and pro calcific mice for 4 and 16 weeks. g Average A810/460 intensity and h Average A860/525 intensity correlated with Collagen-positive pixel density from leaflets, commissures and roots of control and pro calcific mice for 4 and 16 weeks. N = 1–3. *p < 0.05. Correlations between TPEF Autofluorescence Ratios and Protein expression score: Spearman’s Rank Correlation; Correlations between TPEF Autofluorescence Ratios and Collagen remodeling metrics: Pearson’s correlation

Page 11 of 15Tandon et al. BMC Cardiovasc Disord (2020) 20:521
755–860 ratio for commissures (Spearman’s ρ = -0.8857, p = 0.0188) and roots Spearman’s ρ = -0.9429, p = 0.0048) suggesting a decreasing TPEF 755–860 ratio could indi-cate increasing calcification.
DiscussionThe most common small animal model for CAVD is the hypercholesterolemic mouse with apoE and/or low density lipoprotein receptor knockouts [14]. Other approaches involve genetically-modified mouse models with NOTCH1 +/− (NOTCH1 heterozygous), Postn−/− (periostin deletion), or NOS3−/− (endothelial nitric oxide synthase deletion) phenotypes [14, 46]. These genetic mouse models are typically combined with a high fat and high cholesterol western diet [14, 46]. Most of these models have been shown to develop valve calcification in aged mice, or require twenty weeks or more of treatment [41, 47]. Another prior CAVD mouse model was created using a guidewire inflicted aortic valve tissue injury and was shown to develop calcification by twelve weeks fol-lowing injury [41]. In the current study, we developed and validated a diet-based wild-type small animal model for early progression of valve calcification, without genetic manipulation which showed early hallmarks of CAVD by 4 and 16 weeks. Male mice were chosen due to the higher prevalence of CAVD in males [48]. We observed positive ARS staining of calcification at the commissural walls, similar to what Assmann et al. observed in a rat model [18]. However, unlike the rat model in Assmann et al. we did not observe evidence of calcification in the aortic roots.
The mice in the pro-calcific diet groups also had evi-dence of lipid deposition near the commissural walls at 4 weeks as has been previously reported in mice on a high-fat diet with added cholesterol [14]. Two previous
studies reported valve mineralization in wild-type diet-based mouse models without genetic manipulation approximately 16 weeks after initiation of diet [16, 17]. However, the diet employed in these studies incorpo-rated 58.7% fat, which is significantly more than the west-ern diet, and also contained additional carbohydrates. In addition, demonstration of CAVD in these earlier studies relied solely on positive von Kossa particulate staining, which can be confounded in a mouse model by melano-cytes or lipofuscin-containing granules with appearance similar to that of von Kossa positive calcification [17]. In our model, we have shown positive ARS staining concur-rent with the location of increased activation, prolifera-tion and osteogenesis, suggesting improved utility of our model [14]. To our knowledge, this is the only wild-type diet-based mouse model for early CAVD that has shown ARS-positive calcium staining.
Subtle increases in TGFβ1, which have been known to influence VIC proliferation, differentiation and apop-tosis, were observed in the pro-calcific mice at 4 and 16 weeks. This observation, together with increased Ki67, osteopontin, and RUNX2 expression suggest increased proliferation and osteogenic differentiation are occur-ring in the tissues, which are known hallmarks of CAVD [42] and has been previously reported in various other mouse models [5, 11, 14, 17, 18, 41, 46, 47]. Addition-ally, concurrent expression of TGFβ1, αSMA and Ki67 also suggests that increased TGFβ1 could have led to the increased proliferation of the myofibroblastic phenotype of VICs in our disease model [49].
Via QPLI, we observed that the 4-week pro-calcific mice had more mature collagen fibers and a higher posi-tive pixel density with minimal changes in collagen fiber orientation compared to controls, suggesting increased collagen remodeling [14, 45, 47]. In the 16-week
Fig. 7 Assessment of Alizarin Red S Positive Area. a Alizarin Red S (ARS) stained transverse sections of aortic valves of control and pro calcific mice from 4, 16 and 28 weeks. Mean percentage area covered by ARS positive region of the b leaflets, c commissures and d root of aortic valves of control and pro calcific mice from 4, 16 and 28 weeks. Scale bars = 500 µm. N = 2–3. **p < 0.0001, *p < 0.05. Two-way ANOVA with Tukey’s HSD post-hoc multiple comparisons
Page 12 of 15Tandon et al. BMC Cardiovasc Disord (2020) 20:521
pro-calcific mice, we observed a decrease in collagen thickness and density with an increased variance in col-lagen orientation in the leaflets. This was corroborated by the negative correlation between average retardation and average local directional variance. This led us to speculate that by 16 weeks, there was either greater collagen degra-dation or de novo collagen synthesis, leading to thinner fibers and increased variance in fiber orientation. Colla-gen remodeling is typically regulated by multiple factors including matrix metalloproteinases (MMPs), cathepsins or other pro-fibrotic factors like TGFβ and twist-1 [50]. In fact, increased MMP activity co-localized with calci-fication at the commissures in rats fed with a similar diet in other studies [18]. ECM changes have been associated with changes in phenotype [51]. Moreover, in our study, the pro-calcific mice demonstrated a more myofibroblas-tic phenotype, as evidenced by increased expression of αSMA, which could further contribute towards matrix remodeling. Pro-calcific mice also had a higher percent-age of matured collagen fibers in diseased regions at 4 weeks, consistent with CAVD progression [14, 45, 47].
Previously, TPEF microscopy has been used to dem-onstrate collagen remodeling through SHG imaging [45] and calcification through autofluorescence imag-ing [29] in the valve at the tissue level. TPEF microscopy can also be used to obtain an optical redox ratio ([FAD]/([FAD] + [NADH]) which reflects the metabolic state of the cell [13, 27, 39]. It has been shown in vitro that mesenchymal stem cells undergoing osteogenic differ-entiation exhibit decreased optical redox ratios [27]. We have also shown previously that VICs under pathologi-cal stretch have reduced optical redox ratios compared to unstretched cells [13]. We have also demonstrated that when VICs are subjected to osteogenic conditions in vitro, their optical redox ratio decreased and cor-related with gene expression of osteogenic markers like RUNX2, osteopontin and osteocalcin [28]. In the current study, we measured the TPEF 755–860 ratio (A860/525/(A755/460 + A860/525)) from ex vivo tissue sections by obtaining the autofluorescence intensities at 755 nm and 860 nm excitation, which correspond to the NADH and FAD excitation wavelengths. However, we did not term it an optical redox ratio, as tissue autofluorescence meas-ured via the TPEF 755–860 ratio can be attributable to multiple molecules including collagen, lipids, and miner-alized calcific deposits [29, 30]. The TPEF 755–860 ratio could thus have been influenced by collagen and cal-cium in the tissue [29]. We therefore assessed the TPEF Col-Cal ratio, where the individual A810/460 and A810/525 intensities correspond to collagen and calcium, respec-tively [29]. The TPEF Col-Cal ratio increased significantly in aortic valve roots and commissures for the 16-week
pro-calcific mice suggesting an increase in collagen and calcium autofluorescence.
In our study, we found that the TPEF autofluorescence ratio rather than the TPEF Col-Cal ratio was more sen-sitive to disease progression. While TPEF Col-Cal ratio did not show statistical significance between control versus pro-calcific mice, TPEF 755–860 ratio was sensi-tive to both time, presence of disease conditions, and their interaction. TPEF Col-Cal ratio only showed dif-ferences in the commissures, while TPEF 755–860 ratio showed significant changes in the leaflets, commissures and roots. We speculate the difference in sensitivity between TPEF 755–860 and TPEF Col-Cal ratios might be because of increased sensitivity of the TPEF 755–860 ratio to NADH. It should be noted, however, that both these TPEF autofluorescence ratios are influenced by col-lagen, lipids, mineralized calcific deposits, NADH, and FAD [29, 30].
Additionally, we observed that TPEF 755–860 ratio correlated with RUNX2 and Ki67 negatively suggesting increased osteogenesis and proliferation was marked by reduced TPEF 755–860 ratio, which is consistent with previous studies [13, 27, 32, 39, 52]. It is also interesting to note that A810/460 and A810/525 intensities positively correlated with RUNX2 expression leading us to believe that RUNX2-expressing diseased areas may exhibit higher collagen and calcium deposition. Indeed, A810/460 and A810/525 intensities also positively correlated with average directional variance and collagen positive pixel density. This suggested that the increase in A810/460 and A810/525 intensities indeed allude to increased collagen [45] and calcium [29] deposition during disease pro-gression. TPEF 755–860 ratio which showed a decrease during disease progression correlated negatively with average directional variance further evidencing, thin-ner disorganized fibers during disease progression. This may suggest increased de novo collagen and calcium deposition with increased CAVD progression. Simi-lar correlation between cell redox state and collagen synthesis is consistent with other studies [27, 53, 54]. The ratio of blue:green (i.e. 460 nm:525 nm emission) TPEF autofluorescence at 800 nm excitation has been shown to be sensitive to mineralization and altered CAVD progression [29]. Our current study is the first instance when a TPEF 755–860 ratio has been shown to demonstrate tissue level changes occurring during early CAVD progression in a mouse model that was more sensitive than the TPEF Col-Cal ratio. Like we had previously demonstrated in our in vitro studies [13, 28, 52], in this study also we observed TPEF autofluo-rescence ratios decreased at 16 weeks in the pro-calcific mice commissures and correlated with increased cal-cification, osteogenic differentiation and proliferation.

Page 13 of 15Tandon et al. BMC Cardiovasc Disord (2020) 20:521
This is also similar to the findings of Quinn et al. where the osteogenic differentiation of the mesenchymal stem cells correlated with the reduction in an optical redox ratio [27] and Jones et al. where increased prolifera-tion correlated with a reduction in redox ratio in skin wound healing [39]. TPEF 755–860 ratio not only cor-related with osteogenic progression and increased pro-liferation but also seemed to have a predictive quality for calcification. This further provides an incentive to explore TPEF 755–860 as an early biomarker for CAVD progression.
LimitationsOne limitation of this study was that the autofluores-cence signal from various endogenous fluorophores like NADH, FAD, lipids, collagen, elastin, and mineralization that are likely present in valves [29, 32] was not decou-pled. Additionally, this study was conducted ex vivo, con-sidering the limitations of current TPEF imaging probes to assess cardiac valves. Although intravital pericardial imaging has been a possibility in recent past [55–57], clinical translation of TPEF imaging in valves is yet to be realized. Enhanced probe flexibility and miniaturiza-tion might open avenues for pre-clinical studies on larger animal models in the future [58, 59]. Finally, we acknowl-edge that the sample size for our quantitative analyses was low. However, it should be noted that our effect sizes were sufficient to reach significant conclusions.
Future directionsDecoupling the signals from various endogenous fluo-rophores (e.g. NADH, FAD, lipids, collagen, elastin, and mineralization) that are likely present in valves could provide a detailed quantitative assessment of different aspects of disease progression [29, 32]. More robust stud-ies incorporating correlation between the TPEF met-rics and established metrics of disease progression both in vivo and in vitro, would further demonstrate the util-ity of TPEF metric to track disease progression. However, our study provides sufficient evidence to suggest that the TPEF 755–860 autofluorescence ratio can be fur-ther explored to serve as a label-free metric for assessing CAVD progression.
ConclusionsIn conclusion, we created a wild-type mouse model for early CAVD where the mice showed lipid deposition and collagen remodeling at 4 weeks and early evidence for calcification at 16 weeks. The valvular apparatus showed signs of proliferation, osteogenic differentiation, and increased inflammatory cytokine infiltration. The
diseased valves also showed altered TPEF autofluores-cence signatures, which were consistent with the findings in previous studies [27–29] and correlated with osteo-genic progression, ECM remodeling and calcification Additionally, 28-week ARS stains revealed presence of calcification in leaflets that was previously absent until 16 weeks. Enhanced calcification in the commissures and roots and negative correlation of TPEF 755–860 ratio with ARS positive calcification suggests lower autofluo-rescence ratios may be potentially explored as a predic-tive biomarker for calcification. This study suggests that with further validation, and imaging probe miniaturiza-tion, quantitative TPEF metrics hold promise to serve as a label-free tool to assess the progression of CAVD.
Supplementary informationSupplementary information accompanies this paper at https ://doi.org/10.1186/s1287 2-020-01776 -8.
Additional file 1. Supplemental methods and results.
AbbreviationsCAVD: Calcific aortic valve disease; VEC: Valve endothelial cell; VIC: Valve inter-stitial cell; ECM: Extracellular Matrix; TPEF: Two-photon excited fluorescence; SHG: Second harmonic generation; FAD: Flavin adenine dinucleotide; NADH: Nicotinamide adenine dinucleotide reduced; QPLI: Quantitative polarized light imaging; PSR: Picrosirius red; ARS: Alizaring Red S staining; EF: Ejection fraction; CO: Cardiac output; EDV: End-diastolic volume; ESV: End-systolic volume; LVIDs: Left ventricle internal diameter systolic; LVIDd: Left ventricle internal diameter diastolic; H & E: Hematoxylin and eosin; α-SMA: Alpha smooth mus-cle actin; BMP4: Bone morphogenic protein 4; TGFβ1: Transforming growth factor beta 1; MMP: Matrix metalloproteinase; ANOVA: Analysis of variance; SEM: Standard error of the mean.
AcknowledgementsNone.
Authors’ contributionsI.T. and K.B. were involved in the conception and design of the study. I.T., S.J., A.W., J.P., A.O. and D.C. helped in the data acquisition and analysis. I.T. and K.B. wrote the manuscript. T.J.M., S.V., M.P., K.P.Q. and K.B. reviewed and revised the manuscript. All authors have read and approved the final manuscript.
FundingThis work was supported by the National Science Foundation [CMMI-1452943 to K.B., CBET-1846853 to K.P.Q.], and the American Heart Associa-tion [18AIREA33900098 to K.B., 19PRE34370061 to I.T.]. This work was also supported by funding from National Institutes of Health [R00EB017723, R01AG056560 to K.P.Q.]. The custom-built multiphoton imaging setup was supported by the Arkansas Biosciences Institute to T.J.M. This work was also supported by the National Heart Lung and Blood Institute at the National Institutes of Health [1R01HL13514501A1, 1R01HL13366701A1, 1R01HL14032501A1, and 1R01HL14471401A1 to M.P.]. The above funding bodies had no role in design and execution of this study.
Availability of data and materialsThe data generated and/or analyzed during the current study are included in this article and supplementary information and also available from the cor-responding author on reasonable request.

Page 14 of 15Tandon et al. BMC Cardiovasc Disord (2020) 20:521
Ethics approval and consent to participateThis study was approved by all our relevant institutional ethics commit-tees. Research does not involve human participants, human material, or human data. All animal experiments were performed in compliance with the University of Arkansas Institutional Animal Care and Use Committee (IACUC) approval and conform to all applicable provisions of the USDA Animal Welfare Act and Regulations, the PHS Policy on Humane and Use of Laboratory Animals, and other federal, state, and local regulations relating to the use of vertebrate animals in research.
Consent for publicationNot applicable.
Competing interestsThe authors declare that they have no competing interests.
Author details1 Department of Biomedical Engineering, University of Arkansas, 122 John A. White Jr. Engineering Hall, Fayetteville, AR 72701, USA. 2 Division of Cardiology, University of Arkansas for Medical Sciences, Little Rock, AR 72205, USA. 3 Divi-sion of Cardiothoracic Surgery, Joseph P. Whitehead Department of Surgery, Emory University, Atlanta, GA 30322, USA.
Received: 21 August 2020 Accepted: 8 November 2020
References 1. Maganti K, Rigolin VH, Sarano ME, Bonow RO. Valvular Heart Disease:
Diagnosis and Management. Mayo Clin Proc. 2010;85(5):483–500. 2. Rajamannan NM, Evans FJ, Aikawa E, Grande-Allen KJ, Demer LL, Heistad
DD, et al. Calcific aortic valve disease: not simply a degenerative process: a review and agenda for research from the National Heart and Lung and Blood Institute Aortic Stenosis Working Group. Executive summary: cal-cific aortic valve disease-2011 update. Circulation. 2011;124(16):1783–91.
3. Otto CM, Lind BK, Kitzman DW, Gersh BJ, Siscovick DS. Association of aortic-valve sclerosis with cardiovascular mortality and morbidity in the elderly. N Engl J Med. 1999;341(3):142–7.
4. Lerman DA, Prasad S, Alotti N. Calcific aortic valve disease: molecular mechanisms and therapeutic approaches. Eur Cardiol. 2015;10(2):108–12.
5. Perez J, Diaz N, Tandon I, Plate R, Martindale C, Balachandran K. Elevated Serotonin interacts with angiotensin-ii to result in altered valve interstitial cell contractility and remodeling. Cardiovasc Eng Technol. 2017.
6. Yip CY, Chen JH, Zhao R, Simmons CA. Calcification by valve interstitial cells is regulated by the stiffness of the extracellular matrix. Arterioscler Thromb Vasc Biol. 2009.
7. Hjortnaes J, Shapero K, Goettsch C, Hutcheson JD, Keegan J, Kluin J, et al. Valvular interstitial cells suppress calcification of valvular endothelial cells. Atherosclerosis. 2015;242(1):251–60.
8. Sung DC, Bowen CJ, Vaidya KA, Zhou J, Chapurin N, Recknagel A, et al. Cadherin-11 overexpression induces extracellular matrix remodeling and calcification in mature aortic valves. Arterioscler Thromb Vasc Biol. 2016;36(8):1627–37.
9. Rodriguez KJ, Piechura LM, Porras AM, Masters KS. Manipulation of valve composition to elucidate the role of collagen in aortic valve calcification. BMC Cardiovasc Disord. 2014;14:29.
10. Mathieu P, Boulanger M-C. Basic mechanisms of calcific aortic valve disease. Can J Cardiol. 2014;30(9):982–93.
11. Small A, Kiss D, Giri J, Anwaruddin S, Siddiqi H, Guerraty M, et al. Bio-markers of calcific aortic valve disease. Arterioscler Thromb Vasc Biol. 2017;37(4):623–32.
12. Lam NT, Lam H, Sturdivant NM, Balachandran K. Fabrication of a matrigel-collagen semi-interpenetrating scaffold for use in dynamic valve intersti-tial cell culture. Biomed Mater. 2017.
13. Lam NT, Muldoon TJ, Quinn KP, Rajaram N, Balachandran K. Valve inter-stitial cell contractile strength and metabolic state are dependent on its shape. Integr Biol (Camb). 2016;8(10):1079–89.
14. Sider KL, Blaser MC, Simmons CA. Animal models of calcific aortic valve disease. Int J Inflamm. 2011;2011:364310.
15. Sider KL, Zhu C, Kwong AV, Mirzaei Z, de Lange CF, Simmons CA. Evalua-tion of a porcine model of early aortic valve sclerosis. Cardiovasc Pathol. 2014;23(5):289–97.
16. Mehrabian M, Demer LL, Lusis AJ. Differential accumulation of intimal monocyte-macrophages relative to lipoproteins and lipofuscin cor-responds to hemodynamic forces on cardiac valves in mice. Arterioscler Thromb Vasc Biol. 1991;11(4):947–57.
17. Drolet M-C, Roussel E, Deshaies Y, Couet J, Arsenault M. A high fat/high carbohydrate diet induces aortic valve disease in C57BL/6J mice. J Am Coll Cardiol. 2006;47(4):850–5.
18. Assmann A, Zwirnmann K, Heidelberg F, Schiffer F, Horstkötter K, Munakata H, et al. The degeneration of biological cardiovascular pros-theses under pro-calcific metabolic conditions in a small animal model. Biomaterials. 2014;35(26):7416–28.
19. Tang FT, Chen SR, Wu XQ, Wang TQ, Chen JW, Li J, et al. Hypercholester-olemia accelerates vascular calcification induced by excessive vitamin d via oxidative stress. Calcif Tissue Int. 2006;79(5):326–39.
20. Hsu JJ, Tintut Y, Demer LL. Vitamin D and osteogenic differentiation in the artery wall. CJASN. 2008;3(5):1542–7.
21. Nicoll R, Howard JM, Henein MY. A review of the effect of diet on cardio-vascular calcification. Int J Mol Sci. 2015;16(4):8861–83.
22. Kamath AR, Pai RG. Risk factors for progression of calcific aortic stenosis and potential therapeutic targets. Int J Angiol. 2008;17(2):63–70.
23. Beckmann E, Grau JB, Sainger R, Poggio P, Ferrari G. Insights into the use of biomarkers in calcific aortic valve disease. J Heart Valve Dis. 2010;19(4):441–52.
24. Lindman BR, Bonow RO, Otto CM. Current management of calcific aortic stenosis. Circ Res. 2013;113(2):223–37.
25. Kanwar A, Thaden JJ, Nkomo VT. Management of patients with aortic valve stenosis. Mayo Clin Proc. 2018;93(4):488–508.
26. Izquierdo-Gómez MM, Hernández-Betancor I, García-Niebla J, Marí-López B, Laynez-Cerdeña I, Lacalzada-Almeida J. Valve calcification in aortic stenosis: etiology and diagnostic imaging techniques. BioMed Res Int . 2017;2017:5178631.
27. Quinn KP, Sridharan GV, Hayden RS, Kaplan DL, Lee K, Georgakoudi I. Quantitative metabolic imaging using endogenous fluorescence to detect stem cell differentiation. Sci Rep. 2013;3:3432.
28. Tandon I, Kolenc OI, Cross D, Vargas I, Johns S, Quinn KP, et al. Label-free metabolic biomarkers for assessing valve interstitial cell calcific progres-sion. Sci Rep. 2020;10(1):10317.
29. Baugh LM, Liu Z, Quinn KP, Osseiran S, Evans CL, Huggins GS, et al. Non-destructive two-photon excited fluorescence imaging identi-fies early nodules in calcific aortic-valve disease. Nat Biomed Eng. 2017;1(11):914–24.
30. Croce AC, Bottiroli G. Autofluorescence spectroscopy and imaging: a tool for biomedical research and diagnosis. EJH. 2014;58(4):2461.
31. Zipfel WR, Williams RM, Webb WW. Nonlinear magic: multiphoton micros-copy in the biosciences. Nat Biotechnol. 2003;21(11):1369–77.
32. Kolenc OI, Quinn KP. Evaluating cell metabolism through auto-fluorescence imaging of NAD(P)H and FAD. Antioxid Redox Signal. 2019;30(6):875–89.
33. Krishnamurthy VK, Guilak F, Narmoneva DA, Hinton RB. Regional structure-function relationships in mouse aortic valve tissue. J Biomech. 2011;44(1):77–83.
34. Glazer AM, Lewis JG, Kaminsky W. An automatic optical imaging system for birefringent media. Proc R Soc Lond Ser A Math Phys Eng Sci 1996 . 1955;452:2751–65.
35. Tower TT, Neidert MR, Tranquillo RT. Fiber Alignment Imag-ing During Mechanical Testing of Soft Tissues. Ann Biomed Eng. 2002;30(10):1221–33.
36. Quinn KP, Winkelstein BA. Altered collagen fiber kinematics define the onset of localized ligament damage during loading. J Appl Physiol. 2008;105(6):1881–8.
37. Woessner AE, McGee JD, Jones JD, Quinn KP. Characterizing differences in the collagen fiber organization of skin wounds using quantitative polar-ized light imaging. Wound Repair Regener.
38. Quinn KP, Golberg A, Broelsch GF, Khan S, Villiger M, Bouma B, et al. An automated image processing method to quantify collagen fibre organi-zation within cutaneous scar tissue. Exp Dermatol. 2015;24(1):78–80.
Page 15 of 15Tandon et al. BMC Cardiovasc Disord (2020) 20:521
• fast, convenient online submission
•
thorough peer review by experienced researchers in your field
• rapid publication on acceptance
• support for research data, including large and complex data types
•
gold Open Access which fosters wider collaboration and increased citations
maximum visibility for your research: over 100M website views per year •
At BMC, research is always in progress.
Learn more biomedcentral.com/submissions
Ready to submit your researchReady to submit your research ? Choose BMC and benefit from: ? Choose BMC and benefit from:
39. Jones JD, Ramser HE, Woessner AE, Quinn KP. In vivo multiphoton micros-copy detects longitudinal metabolic changes associated with delayed skin wound healing. Communications Biology. 2018;1(1):198.
40. Zipfel WR, Williams RM, Christie R, Nikitin AY, Hyman BT, Webb WW. Live tissue intrinsic emission microscopy using multiphoton-excited native fluorescence and second harmonic generation. Proc Natl Acad Sci. 2003;100(12):7075.
41. Honda S, Miyamoto T, Watanabe T, Narumi T, Kadowaki S, Honda Y, et al. A novel mouse model of aortic valve stenosis induced by direct wire injury. Arterioscl Thrombo Vascul Biol. 2014;34(2):270–8.
42. Chester AH. Molecular and cellular mechanisms of valve calcification. Aswan Heart Centre Science & Practice Series. 2011.
43. Latif N, Quillon A, Sarathchandra P, McCormack A, Lozanoski A, Yacoub MH, et al. Modulation of human valve interstitial cell phenotype and function using a fibroblast growth factor 2 formulation. PLoS ONE. 2015;10(6):e0127844-e.
44. Wegner KA, Keikhosravi A, Eliceiri KW, Vezina CM. Fluorescence of picrosirius red multiplexed with immunohistochemistry for the quantita-tive assessment of collagen in tissue sections. J Histochem Cytochem. 2017;65(8):479–90.
45. Hutson HN, Marohl T, Anderson M, Eliceiri K, Campagnola P, Masters KS. Calcific aortic valve disease is associated with layer-specific alterations in collagen architecture. PLoS ONE. 2016;11(9):0163858.
46. Miller JD, Weiss RM, Heistad DD. Calcific aortic valve stenosis: methods, models, and mechanisms. Circ Res. 2011;108(11):1392–412.
47. Weiss RM, Ohashi M, Miller JD, Young SG, Heistad DD. Calcific aor-tic valve stenosis in old hypercholesterolemic mice. Circulation. 2006;114(19):2065–9.
48. Thomassen HK, Cioffi G, Gerdts E, Einarsen E, Midtbø HB, Mancusi C, et al. Echocardiographic aortic valve calcification and outcomes in women and men with aortic stenosis. Heart. 2017;103(20):1619–24.
49. Liu AC, Gotlieb AI. Transforming growth factor-beta regulates in vitro heart valve repair by activated valve interstitial cells. Am J Pathol. 2008;173(5):1275–85.
50. Leopold JA. Cellular mechanisms of aortic valve calcification. Circul Cardiovasc Interv. 2012;5(4):605–14.
51. Kim D-H, Provenzano PP, Smith CL, Levchenko A. Matrix nanotopography as a regulator of cell function. J Cell Biol. 2012;197(3):351–60.
52. Lam NT, Tandon I, Balachandran K. The role of fibroblast growth factor 1 and 2 on the pathological behavior of valve interstitial cells in a three-dimensional mechanically-conditioned model. J Biol Eng. 2019;13(1):45.
53. Hernandez-Munoz R, Diaz-Munoz M, Chagoya de Sanchez V. Possible role of cell redox state on collagen metabolism in carbon tetrachloride-induced cirrhosis as evidenced by adenosine administration to rats. Biochem Biophys Acta. 1994;1200(2):93–9.
54. Meleshina AV, Dudenkova VV, Bystrova AS, Kuznetsova DS, Shirmanova MV, Zagaynova EV. Two-photon FLIM of NAD(P)H and FAD in mesenchy-mal stem cells undergoing either osteogenic or chondrogenic differen-tiation. Stem Cell Res Therapy. 2017;8(1):15.
55. Jones JS, Small DM, Nishimura N. In vivo calcium imaging of cardiomyo-cytes in the beating mouse heart with multiphoton microscopy. Front Physiol. 2018;9:969.
56. Matsuura R, Miyagawa S, Fukushima S, Goto T, Harada A, Shimozaki Y, et al. Intravital imaging with two-photon microscopy reveals cellular dynamics in the ischeamia-reperfused rat heart. Sci Rep. 2018;8(1):15991.
57. Allan-Rahill NH, Lamont MRE, Chilian WM, Nishimura N, Small DM. Intravital microscopy of the beating murine heart to understand cardiac leukocyte dynamics. Front Immunol. 2020;11:92.
58. Ducourthial G, Leclerc P, Mansuryan T, Fabert M, Brevier J, Habert R, et al. Development of a real-time flexible multiphoton microendoscope for label-free imaging in a live animal. Sci Rep. 2015;5:18303.
59. Zhao Y, Sheng M, Huang L, Tang S. Design of a fiber-optic multiphoton microscopy handheld probe. Biomed Opt Express. 2016;7(9):3425–37.
Publisher’s NoteSpringer Nature remains neutral with regard to jurisdictional claims in pub-lished maps and institutional affiliations.
Related Documents