Symbology Prof. Dr. Sajid Rashid Ahmad [email protected] Atiqa Ijaz Khan _ Demonstrator [email protected]

Welcome message from author
This document is posted to help you gain knowledge. Please leave a comment to let me know what you think about it! Share it to your friends and learn new things together.
Transcript
Symbology
Prof. Dr. Sajid Rashid Ahmad
Atiqa Ijaz Khan _ Demonstrator
Symbology
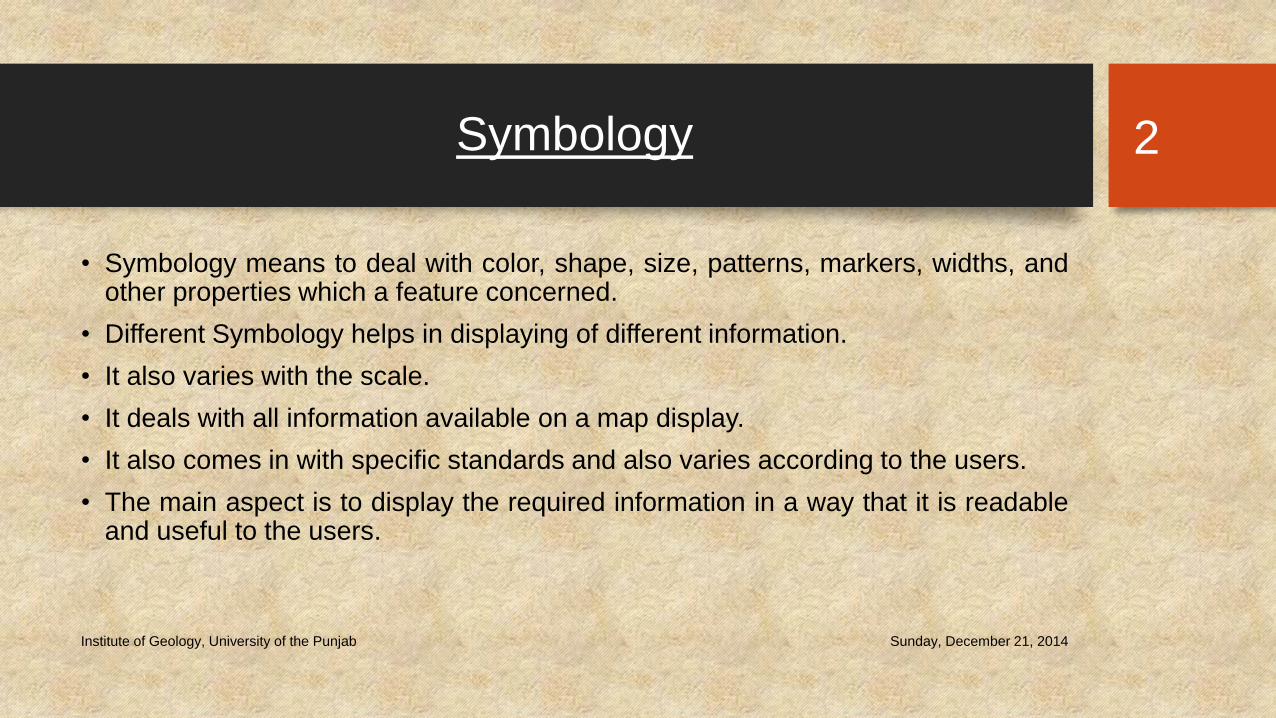
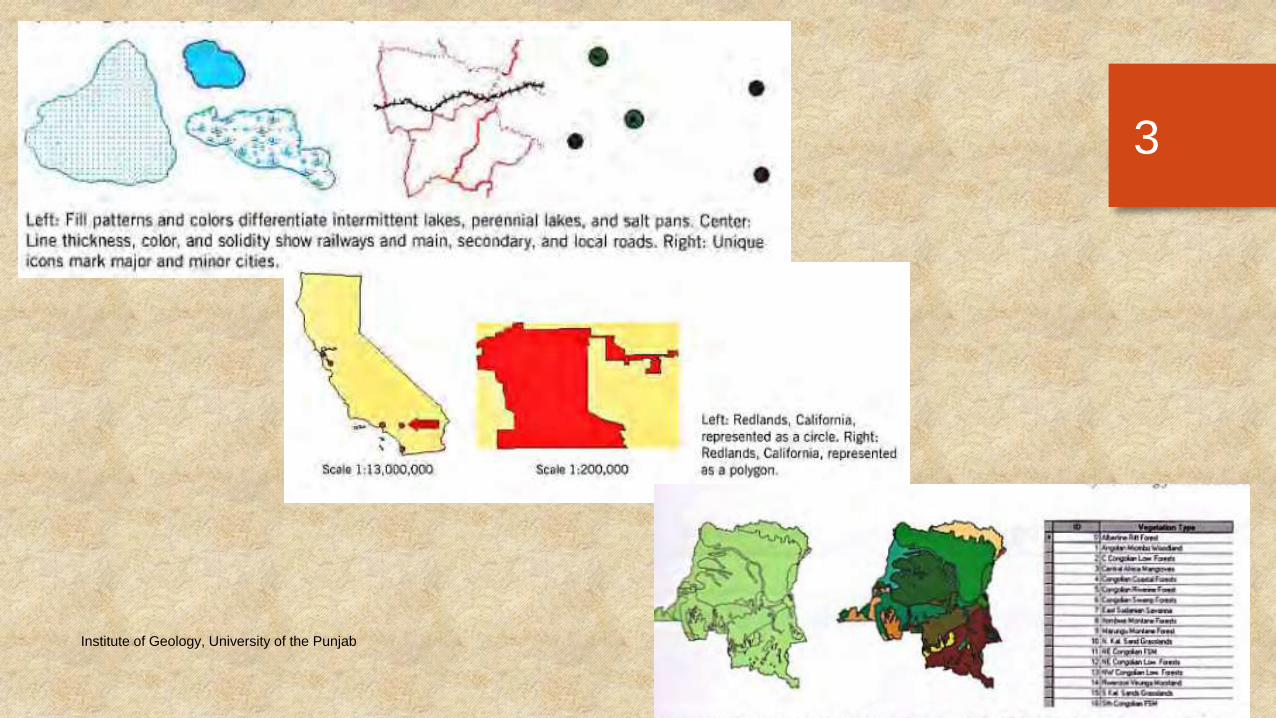
• Symbology means to deal with color, shape, size, patterns, markers, widths, andother properties which a feature concerned.
• Different Symbology helps in displaying of different information.
• It also varies with the scale.
• It deals with all information available on a map display.
• It also comes in with specific standards and also varies according to the users.
• The main aspect is to display the required information in a way that it is readableand useful to the users.
Sunday, December 21, 2014Institute of Geology, University of the Punjab
2
Sunday, December 21, 2014Institute of Geology, University of the Punjab
3
Sunday, December 21, 2014Institute of Geology, University of the Punjab
4
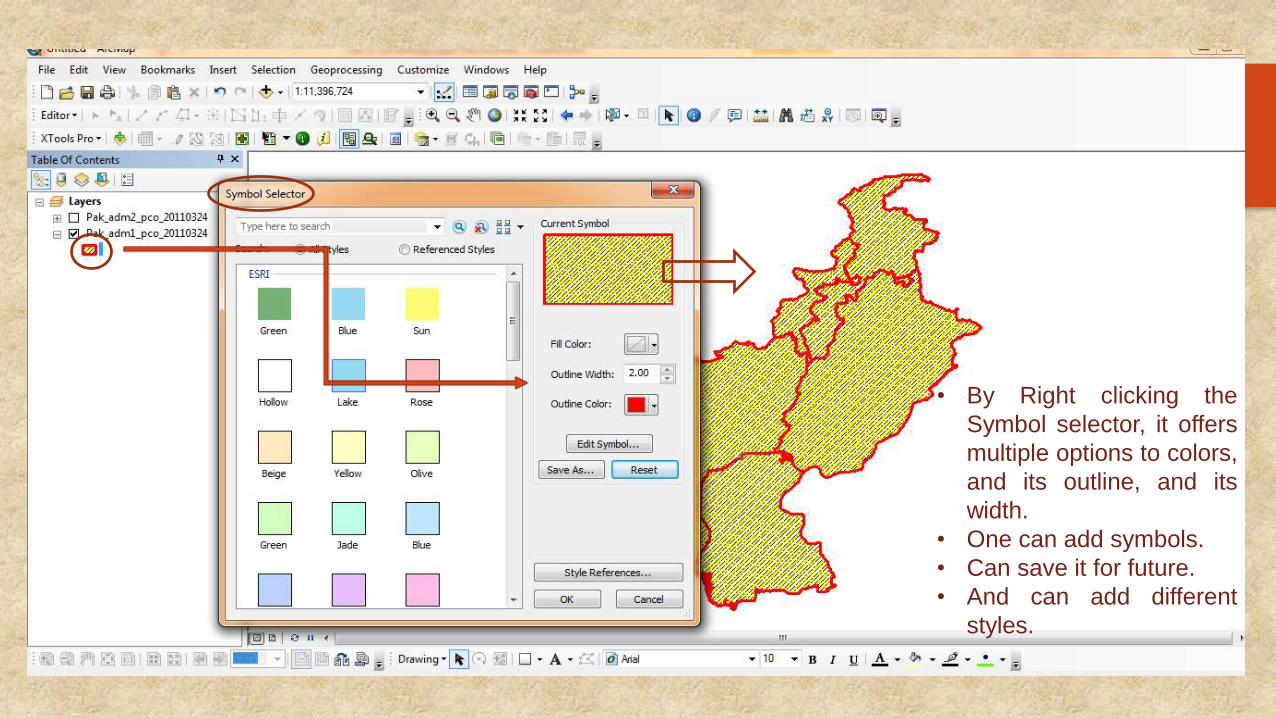
• By Right clicking the
Symbol selector, it offers
multiple options to colors,
and its outline, and its
width.
• One can add symbols.
• Can save it for future.
• And can add different
styles.
Symbology in ArcGIS
• In Arc-GIS, we deal with 5 types of Symbology:
• Features: Draw all features with a single color.
• Categories: Draw features on the basis of unique field.
• Quantities: Draw using color to show values.
• Chart: Draw pie chart for each feature.
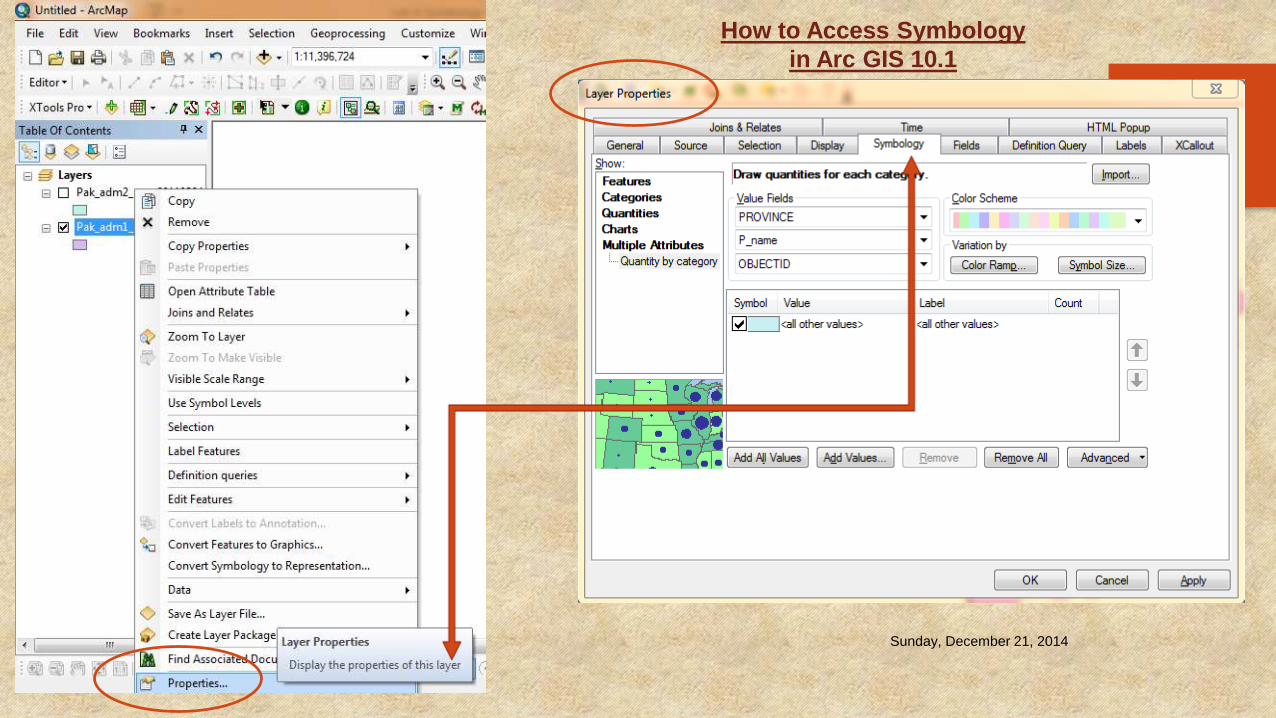
• Multiple Attributes: Draw quantities for each of the category.
• TO ACCESS SYMBOLOGY:
• Right click on any shapefile to get into the context menu, and then select Tab ofSymbology, under the layer Properties, after clicking Properties from the menu, toaccess its options.
Sunday, December 21, 2014Institute of Geology, University of the Punjab
5
Sunday, December 21, 2014Institute of Geology, University of the Punjab
6
How to Access Symbology
in Arc GIS 10.1
1. Features
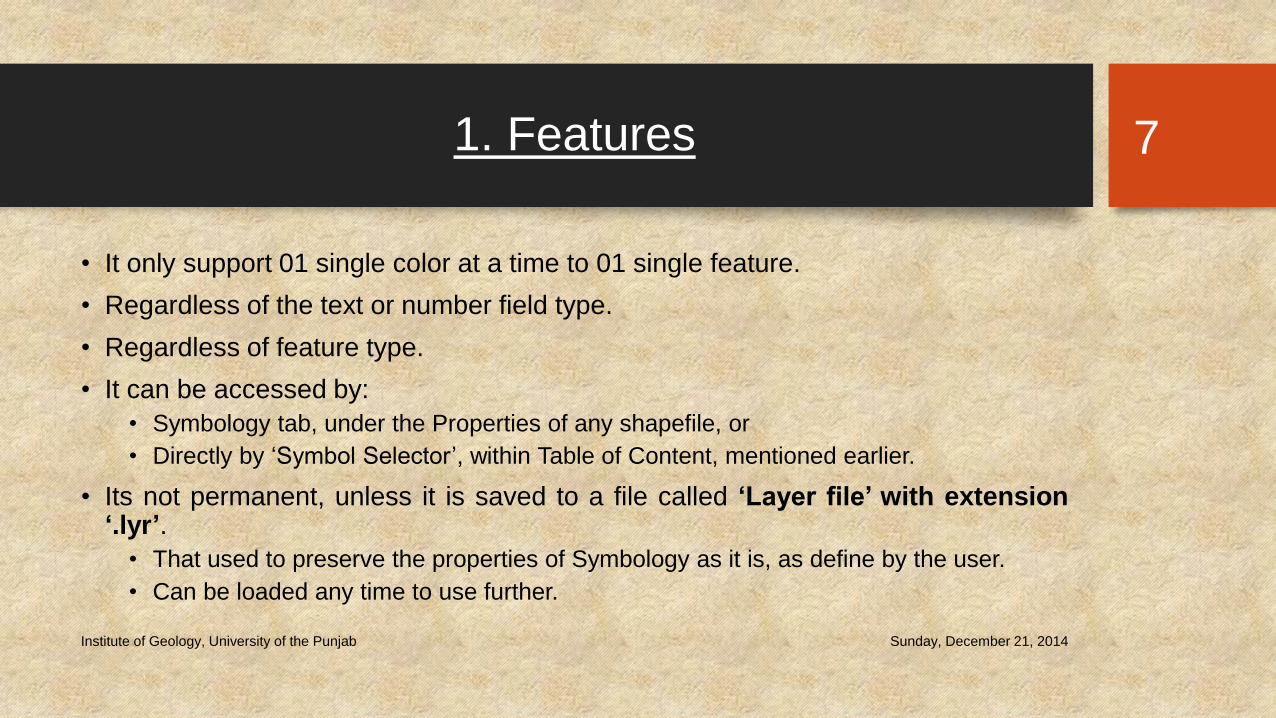
• It only support 01 single color at a time to 01 single feature.
• Regardless of the text or number field type.
• Regardless of feature type.
• It can be accessed by:
• Symbology tab, under the Properties of any shapefile, or
• Directly by ‘Symbol Selector’, within Table of Content, mentioned earlier.
• Its not permanent, unless it is saved to a file called ‘Layer file’ with extension‘.lyr’.
• That used to preserve the properties of Symbology as it is, as define by the user.
• Can be loaded any time to use further.
Sunday, December 21, 2014Institute of Geology, University of the Punjab
7
Sunday, December 21, 2014Institute of Geology, University of the Punjab
8
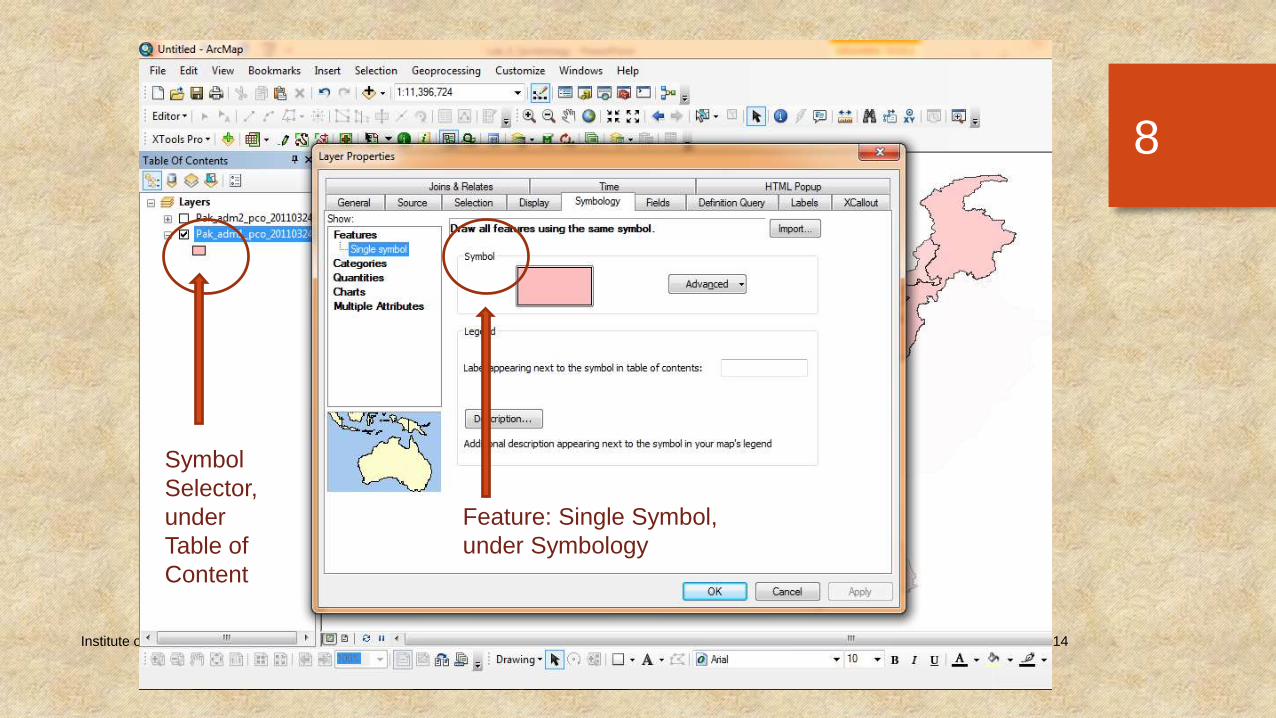
Symbol
Selector,
under
Table of
Content
Feature: Single Symbol,
under Symbology
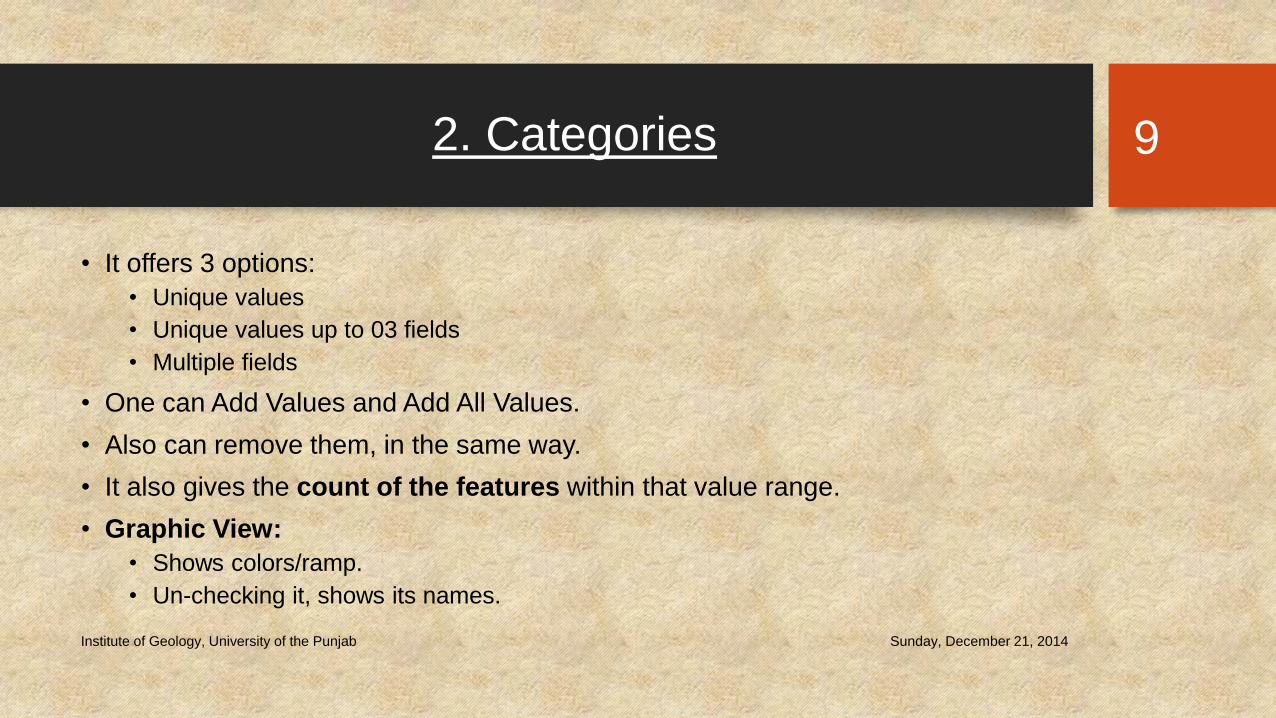
2. Categories
• It offers 3 options:
• Unique values
• Unique values up to 03 fields
• Multiple fields
• One can Add Values and Add All Values.
• Also can remove them, in the same way.
• It also gives the count of the features within that value range.
• Graphic View:
• Shows colors/ramp.
• Un-checking it, shows its names.
Sunday, December 21, 2014Institute of Geology, University of the Punjab
9
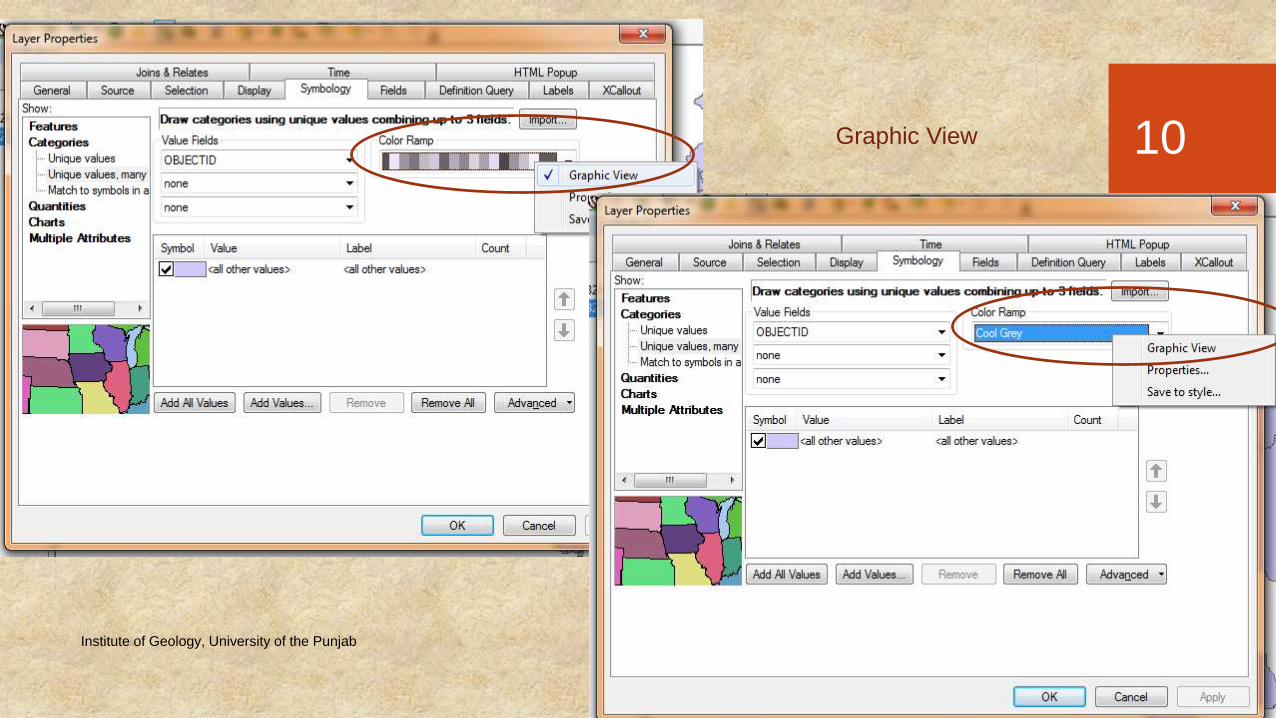
Sunday, December 21, 2014Institute of Geology, University of the Punjab
10Graphic View
Sunday, December 21, 2014Institute of Geology, University of the Punjab
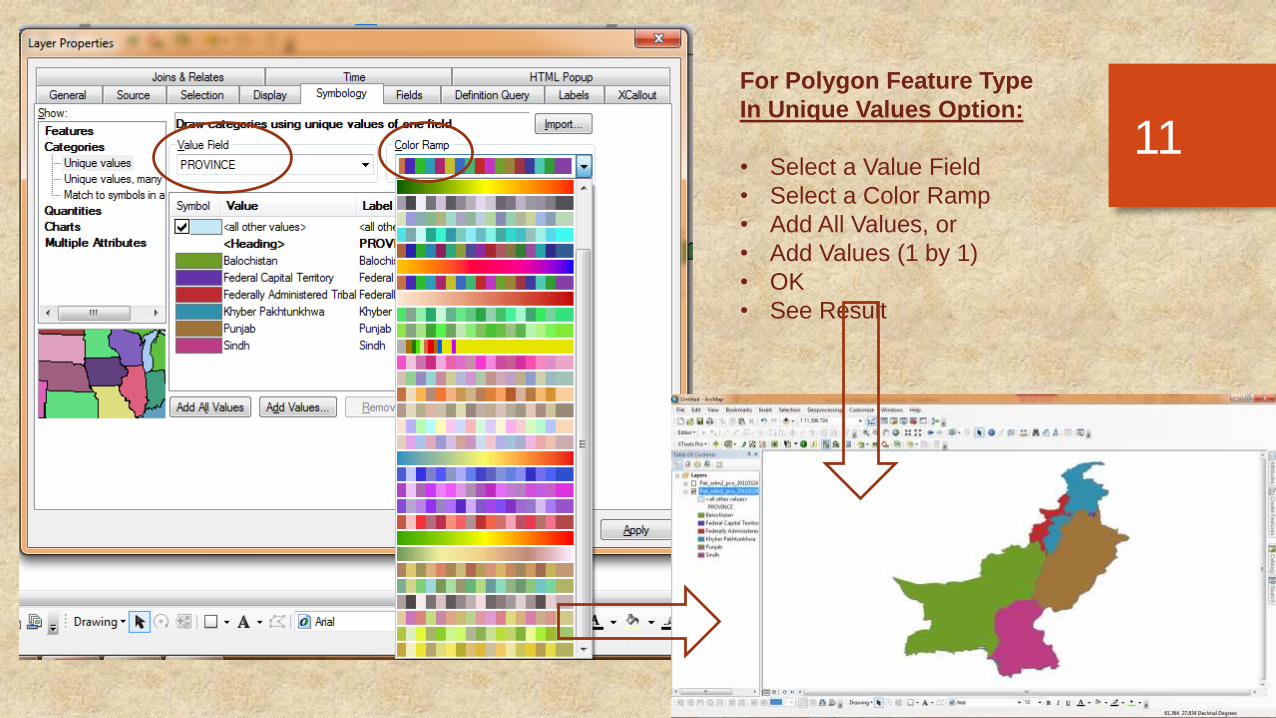
11
For Polygon Feature Type
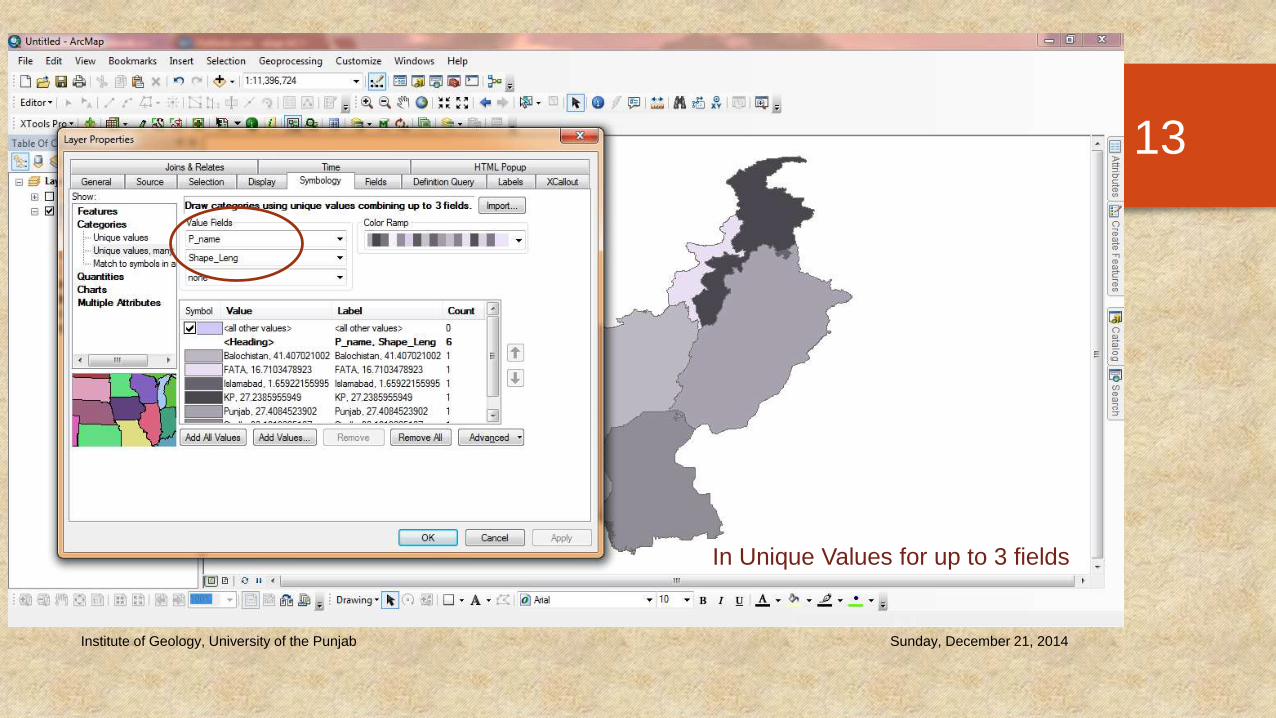
In Unique Values Option:
• Select a Value Field
• Select a Color Ramp
• Add All Values, or
• Add Values (1 by 1)
• OK
• See Result
Sunday, December 21, 2014Institute of Geology, University of the Punjab
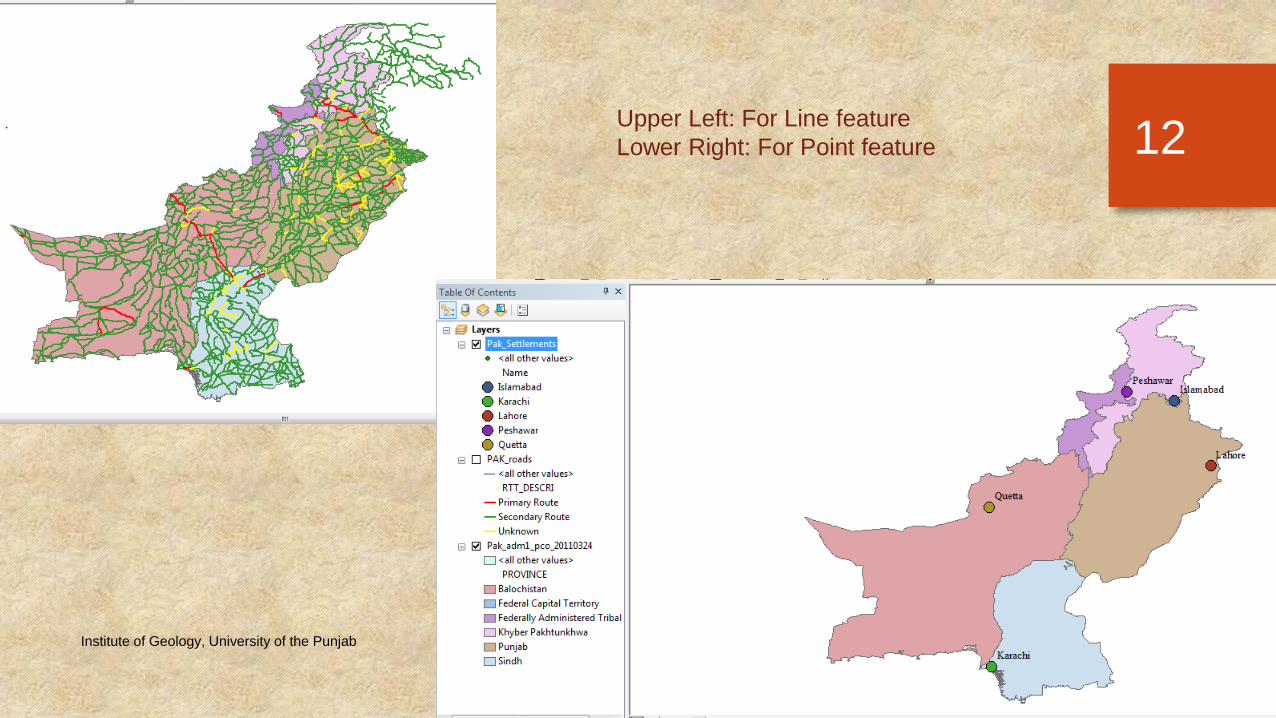
12Upper Left: For Line feature
Lower Right: For Point feature
Sunday, December 21, 2014Institute of Geology, University of the Punjab
13
In Unique Values for up to 3 fields
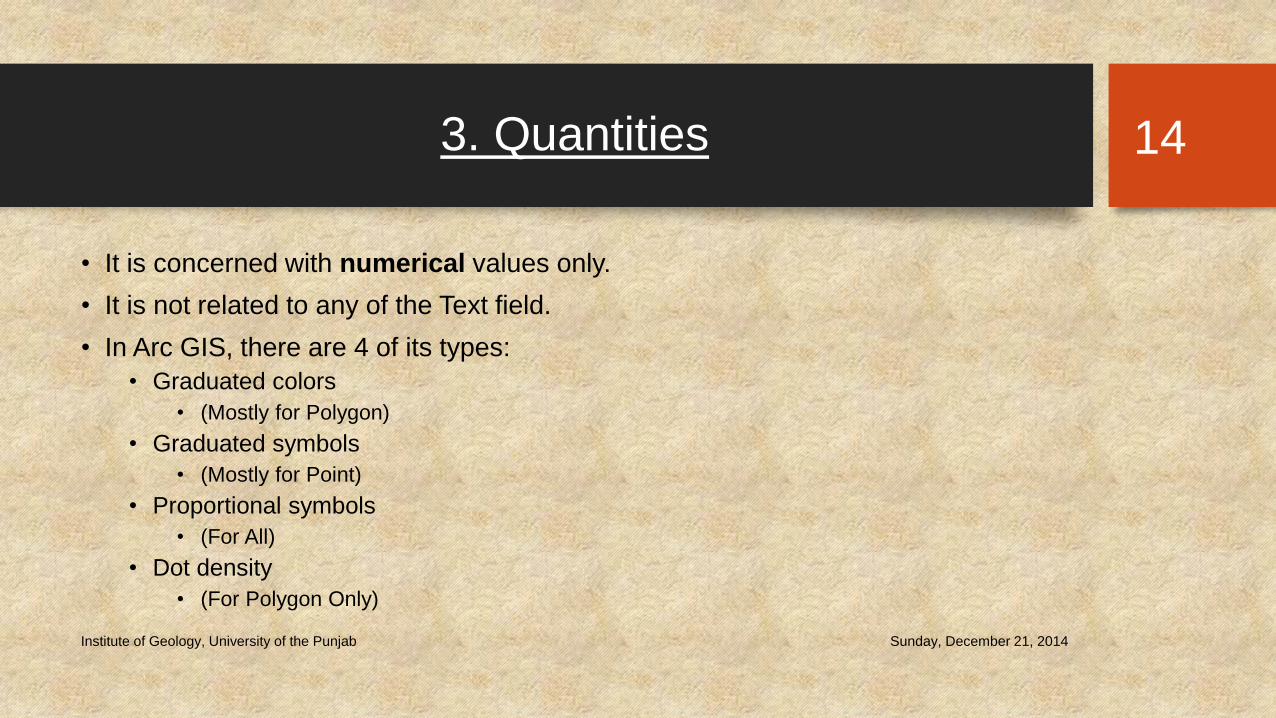
3. Quantities
• It is concerned with numerical values only.
• It is not related to any of the Text field.
• In Arc GIS, there are 4 of its types:
• Graduated colors
• (Mostly for Polygon)
• Graduated symbols
• (Mostly for Point)
• Proportional symbols
• (For All)
• Dot density
• (For Polygon Only)
Sunday, December 21, 2014Institute of Geology, University of the Punjab
14
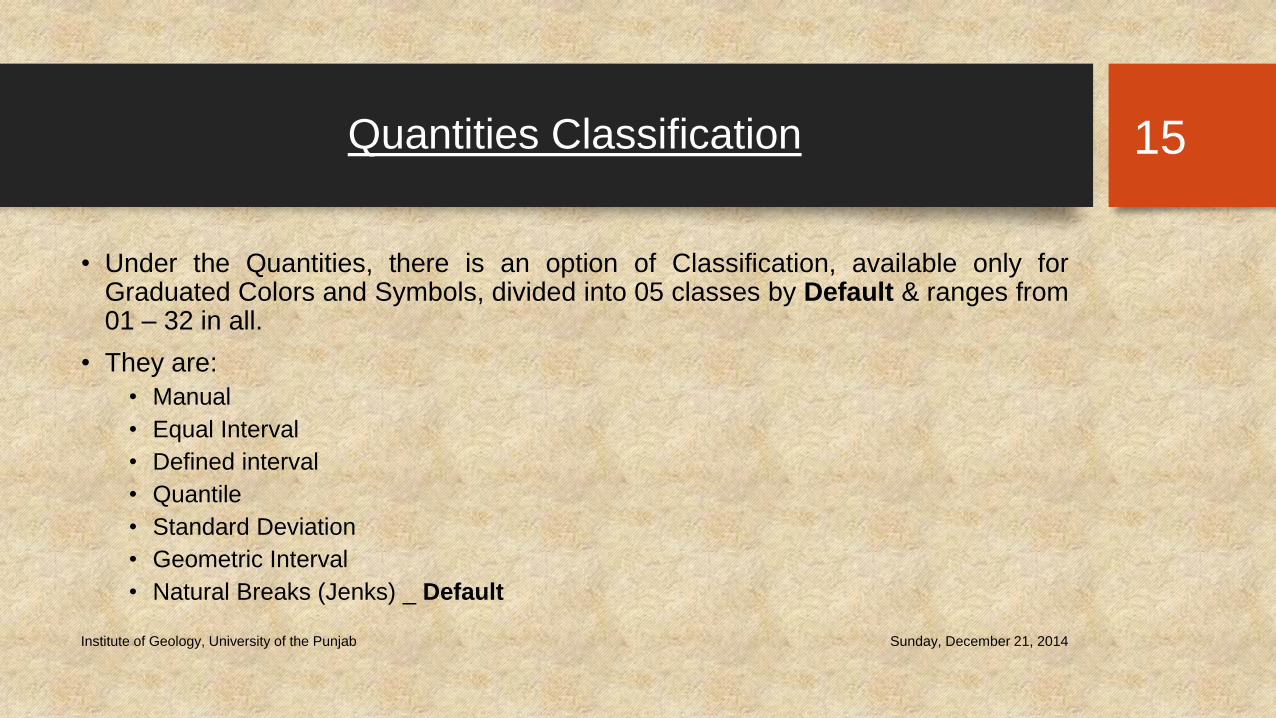
Quantities Classification
• Under the Quantities, there is an option of Classification, available only forGraduated Colors and Symbols, divided into 05 classes by Default & ranges from01 – 32 in all.
• They are:
• Manual
• Equal Interval
• Defined interval
• Quantile
• Standard Deviation
• Geometric Interval
• Natural Breaks (Jenks) _ Default
Sunday, December 21, 2014Institute of Geology, University of the Punjab
15
Sunday, December 21, 2014Institute of Geology, University of the Punjab
16
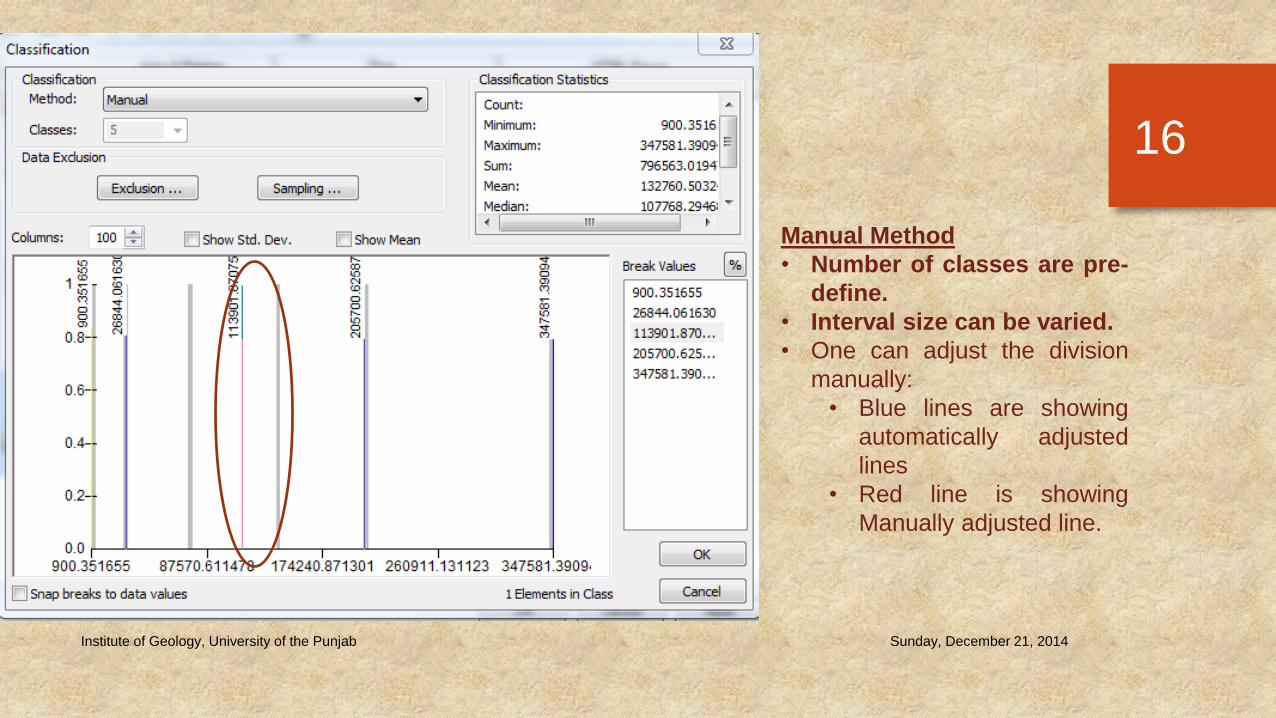
Manual Method
• Number of classes are pre-
define.
• Interval size can be varied.
• One can adjust the division
manually:
• Blue lines are showing
automatically adjusted
lines
• Red line is showing
Manually adjusted line.
Sunday, December 21, 2014Institute of Geology, University of the Punjab
17
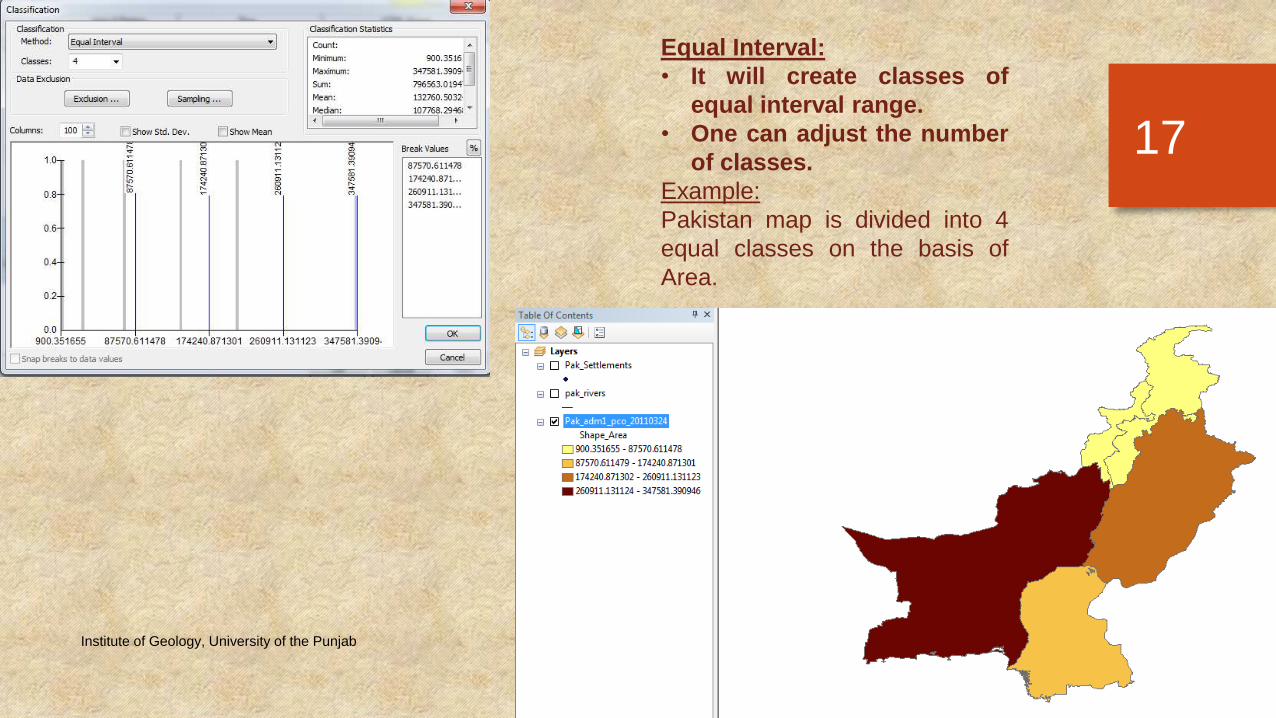
Equal Interval:
• It will create classes of
equal interval range.
• One can adjust the number
of classes.
Example:
Pakistan map is divided into 4
equal classes on the basis of
Area.
Sunday, December 21, 2014Institute of Geology, University of the Punjab
18
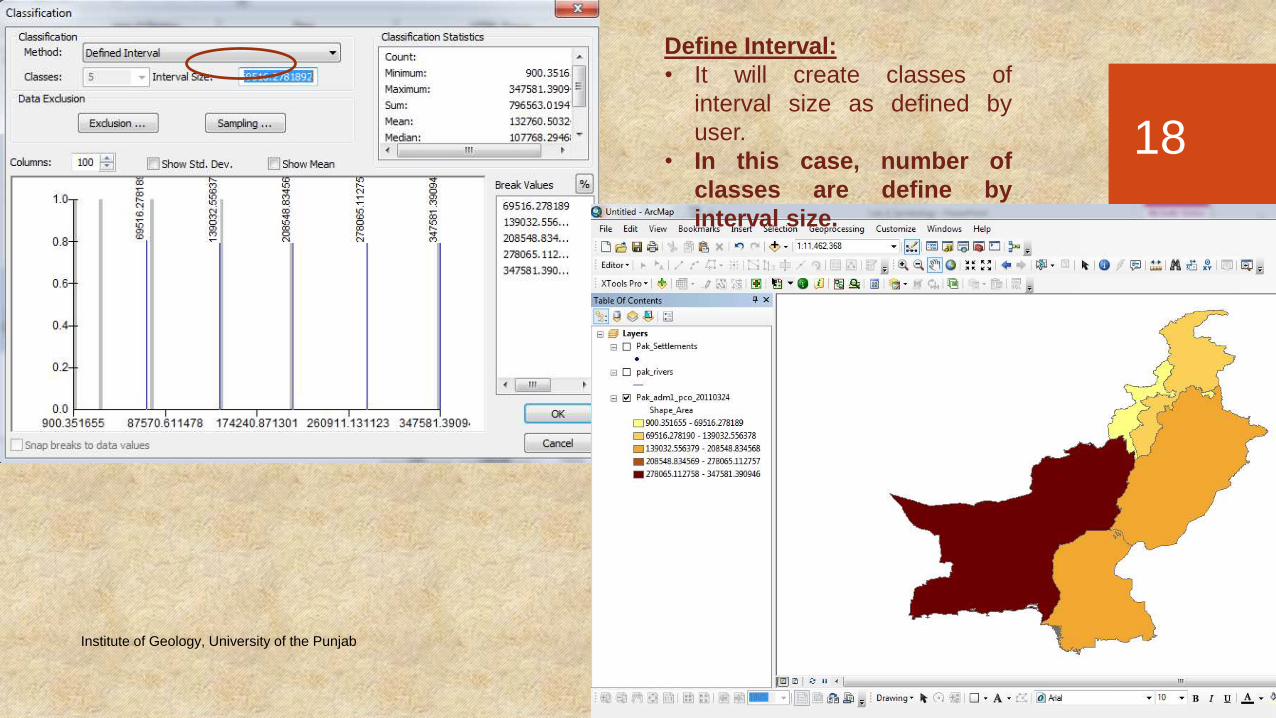
Define Interval:
• It will create classes of
interval size as defined by
user.
• In this case, number of
classes are define by
interval size.
Sunday, December 21, 2014Institute of Geology, University of the Punjab
19
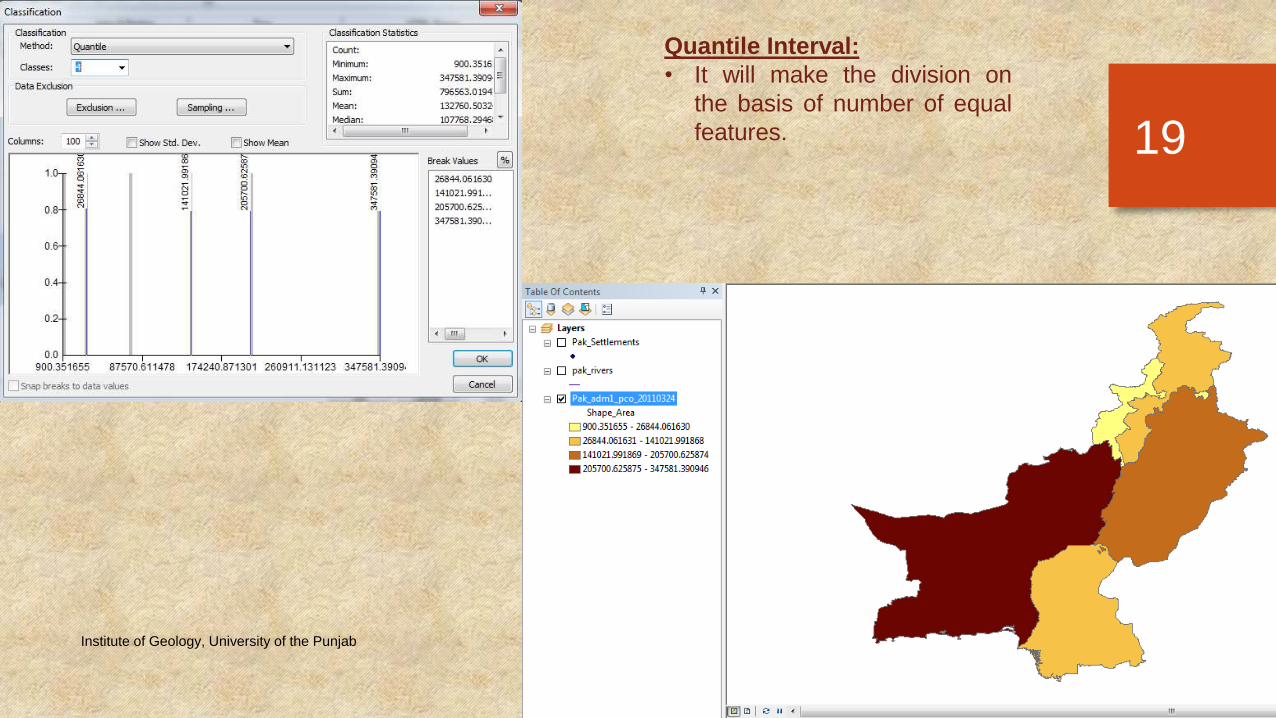
Quantile Interval:
• It will make the division on
the basis of number of equal
features.
Sunday, December 21, 2014Institute of Geology, University of the Punjab
20
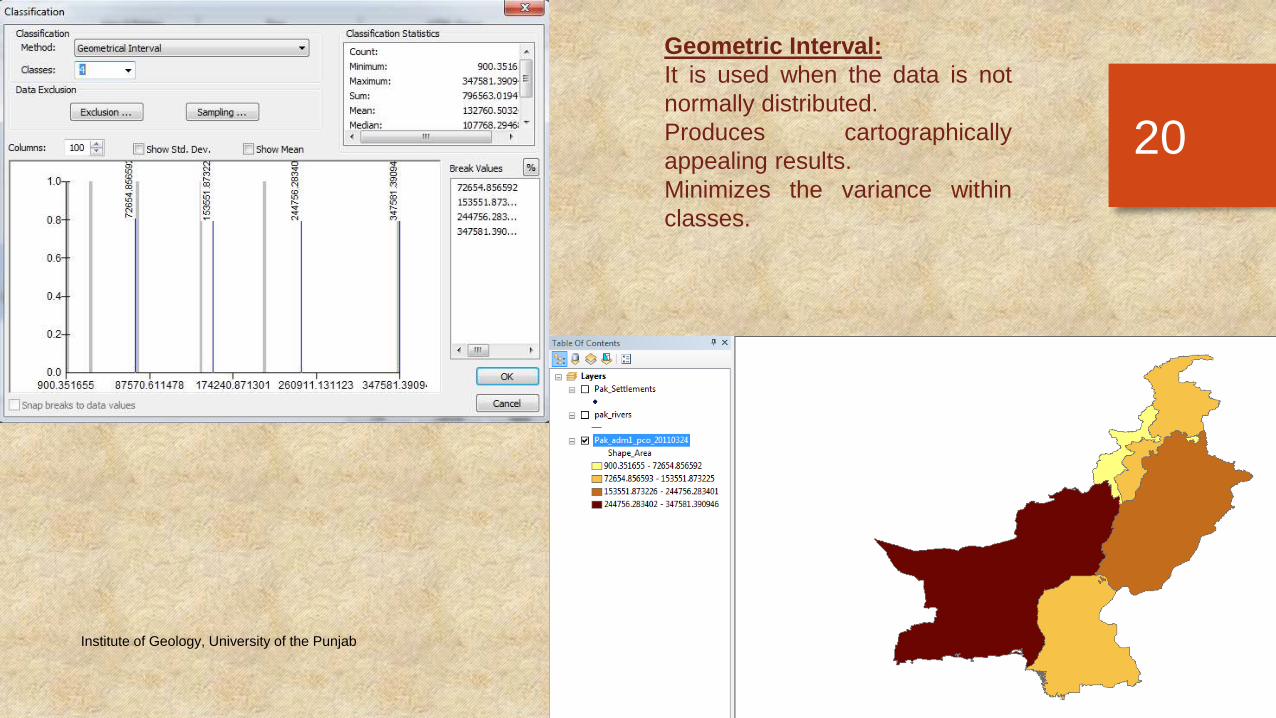
Geometric Interval:
It is used when the data is not
normally distributed.
Produces cartographically
appealing results.
Minimizes the variance within
classes.
Sunday, December 21, 2014Institute of Geology, University of the Punjab
21
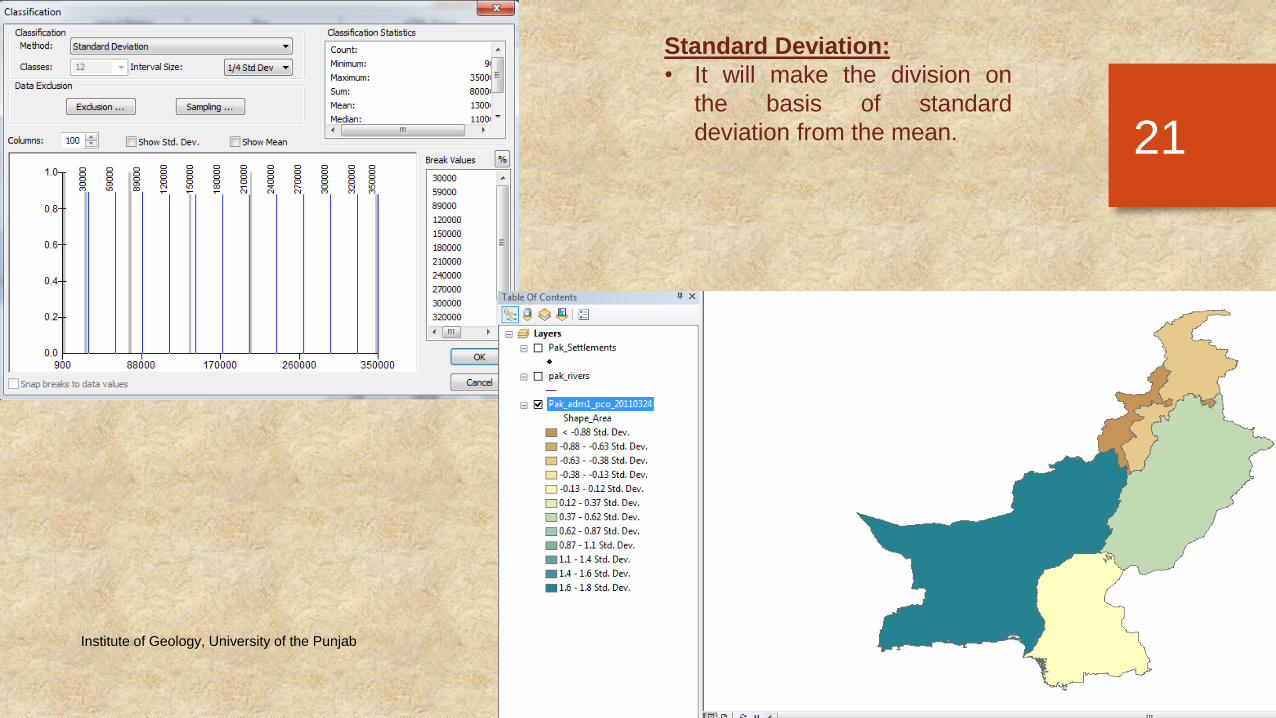
Standard Deviation:
• It will make the division on
the basis of standard
deviation from the mean.
Sunday, December 21, 2014Institute of Geology, University of the Punjab
22
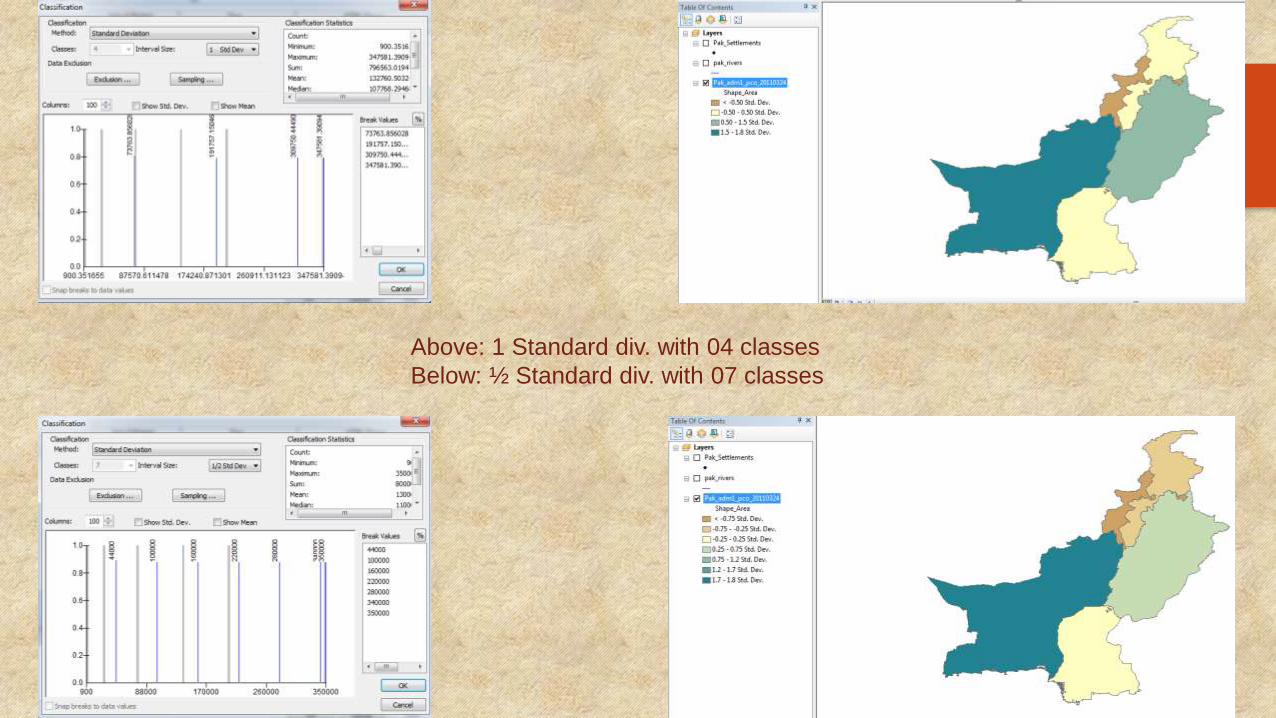
Above: 1 Standard div. with 04 classes
Below: ½ Standard div. with 07 classes
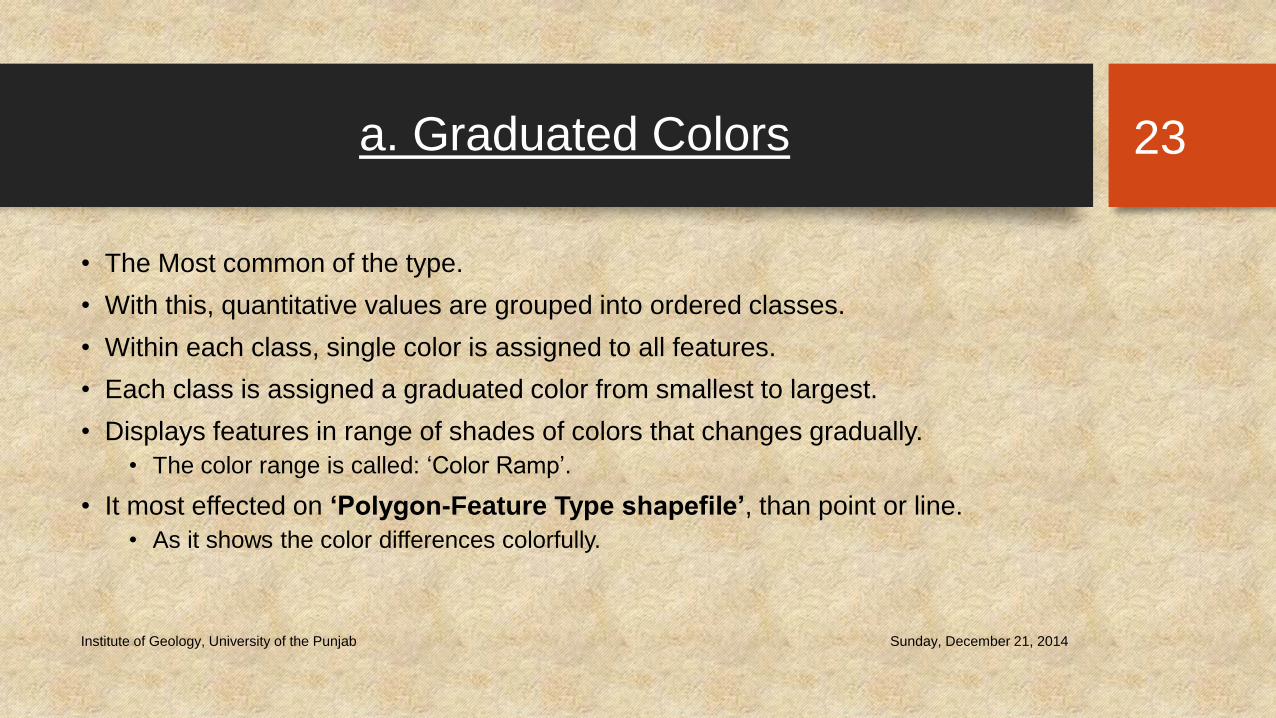
a. Graduated Colors
• The Most common of the type.
• With this, quantitative values are grouped into ordered classes.
• Within each class, single color is assigned to all features.
• Each class is assigned a graduated color from smallest to largest.
• Displays features in range of shades of colors that changes gradually.
• The color range is called: ‘Color Ramp’.
• It most effected on ‘Polygon-Feature Type shapefile’, than point or line.
• As it shows the color differences colorfully.
Sunday, December 21, 2014Institute of Geology, University of the Punjab
23
Sunday, December 21, 2014Institute of Geology, University of the Punjab
24
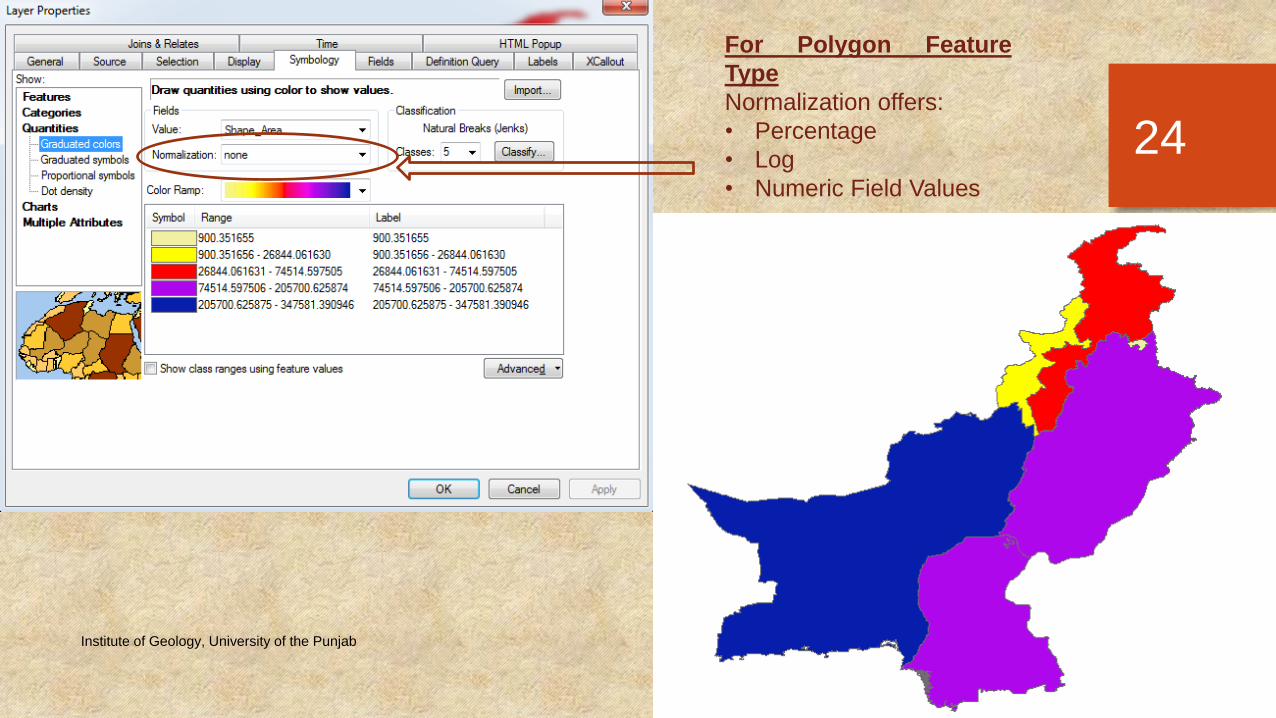
For Polygon Feature
Type
Normalization offers:
• Percentage
• Log
• Numeric Field Values
Sunday, December 21, 2014Institute of Geology, University of the Punjab
25
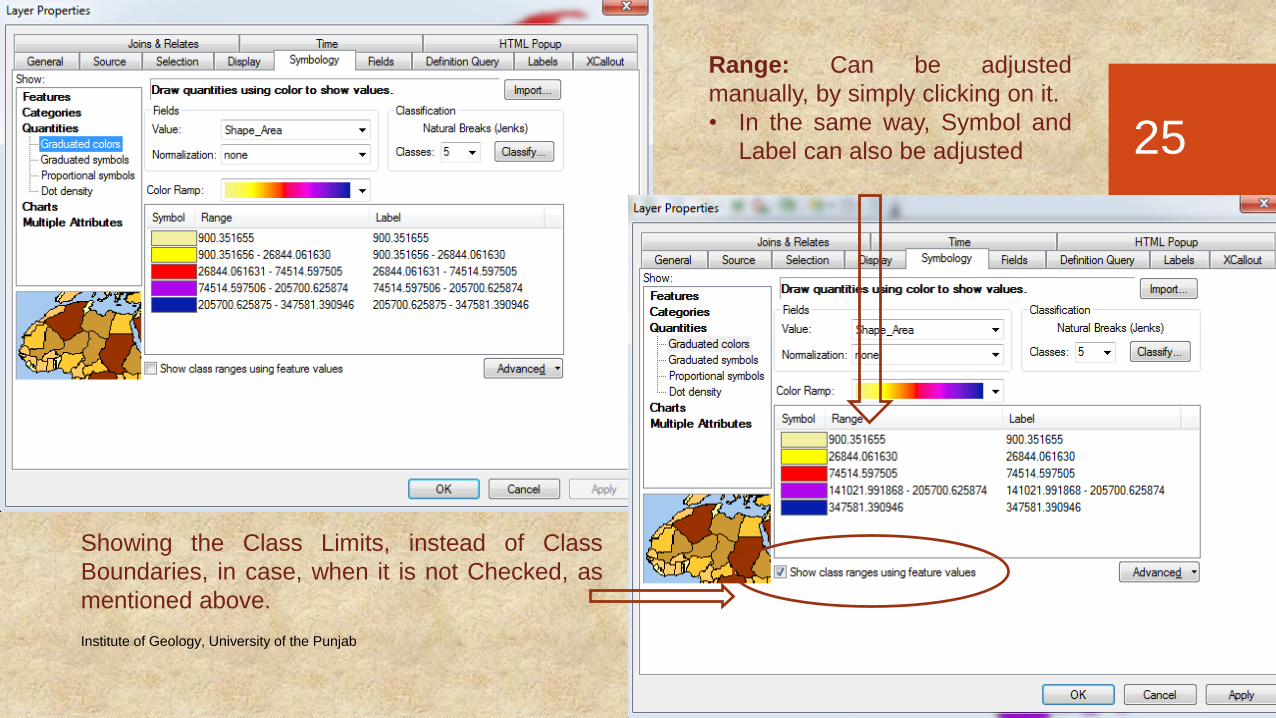
Range: Can be adjusted
manually, by simply clicking on it.
• In the same way, Symbol and
Label can also be adjusted
Showing the Class Limits, instead of Class
Boundaries, in case, when it is not Checked, as
mentioned above.
Sunday, December 21, 2014Institute of Geology, University of the Punjab
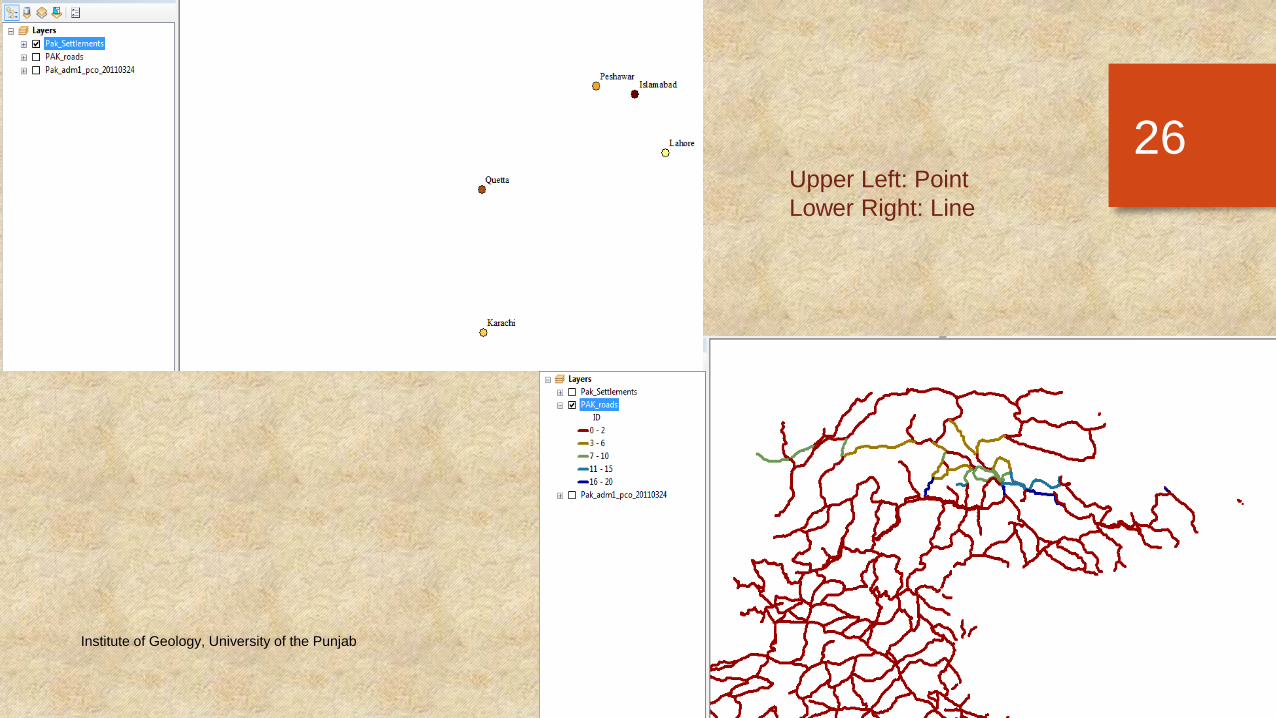
26Upper Left: Point
Lower Right: Line
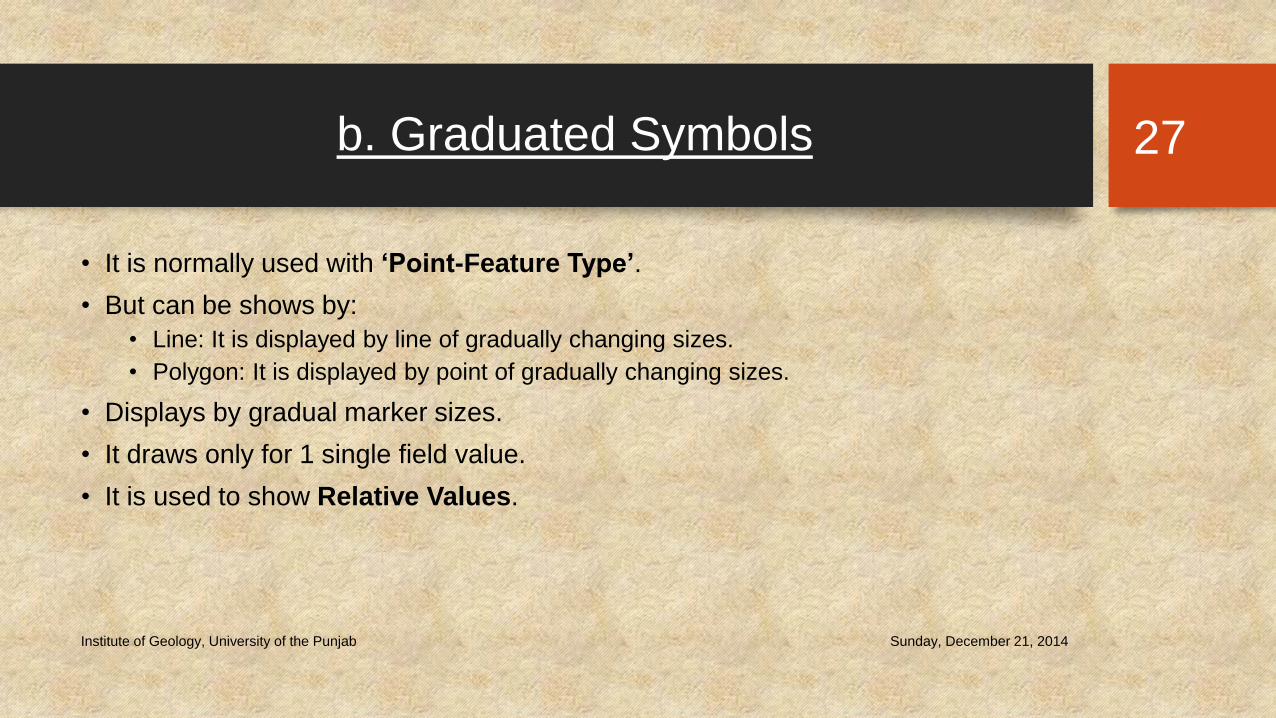
b. Graduated Symbols
• It is normally used with ‘Point-Feature Type’.
• But can be shows by:
• Line: It is displayed by line of gradually changing sizes.
• Polygon: It is displayed by point of gradually changing sizes.
• Displays by gradual marker sizes.
• It draws only for 1 single field value.
• It is used to show Relative Values.
Sunday, December 21, 2014Institute of Geology, University of the Punjab
27
Sunday, December 21, 2014Institute of Geology, University of the Punjab
28
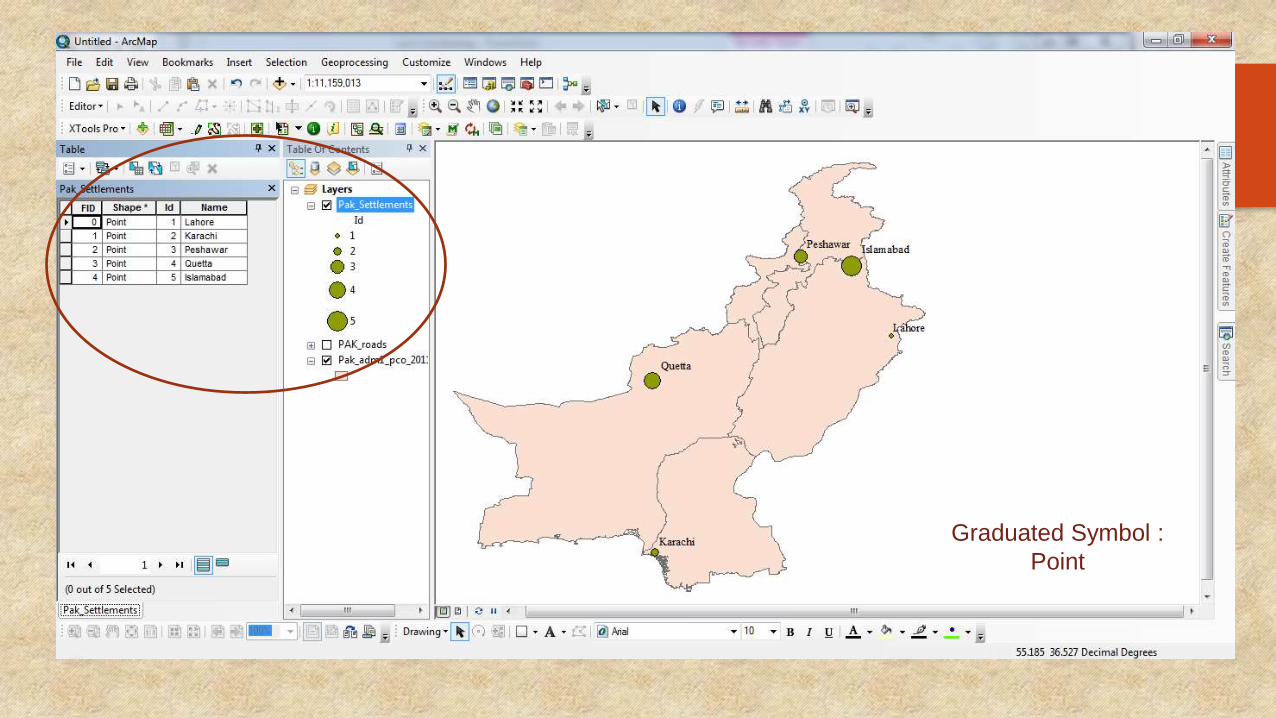
Graduated Symbol :
Point
Sunday, December 21, 2014Institute of Geology, University of the Punjab
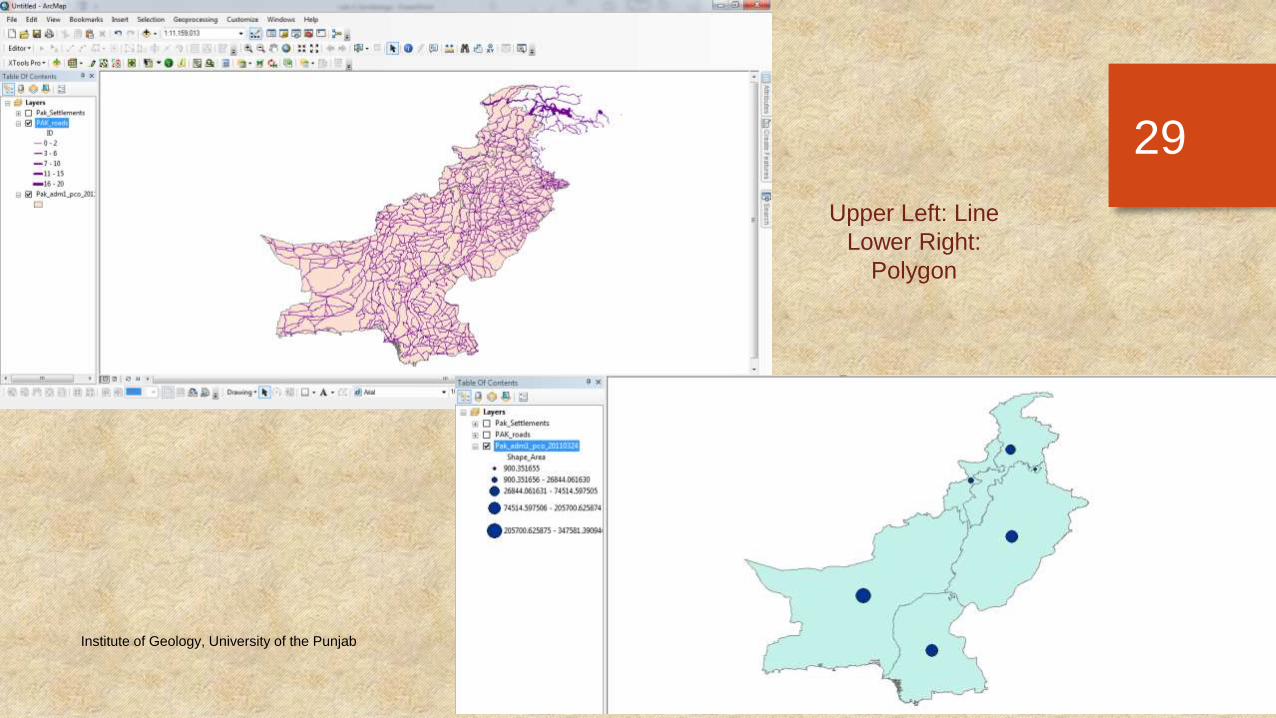
29
Upper Left: Line
Lower Right:
Polygon
Sunday, December 21, 2014Institute of Geology, University of the Punjab
30
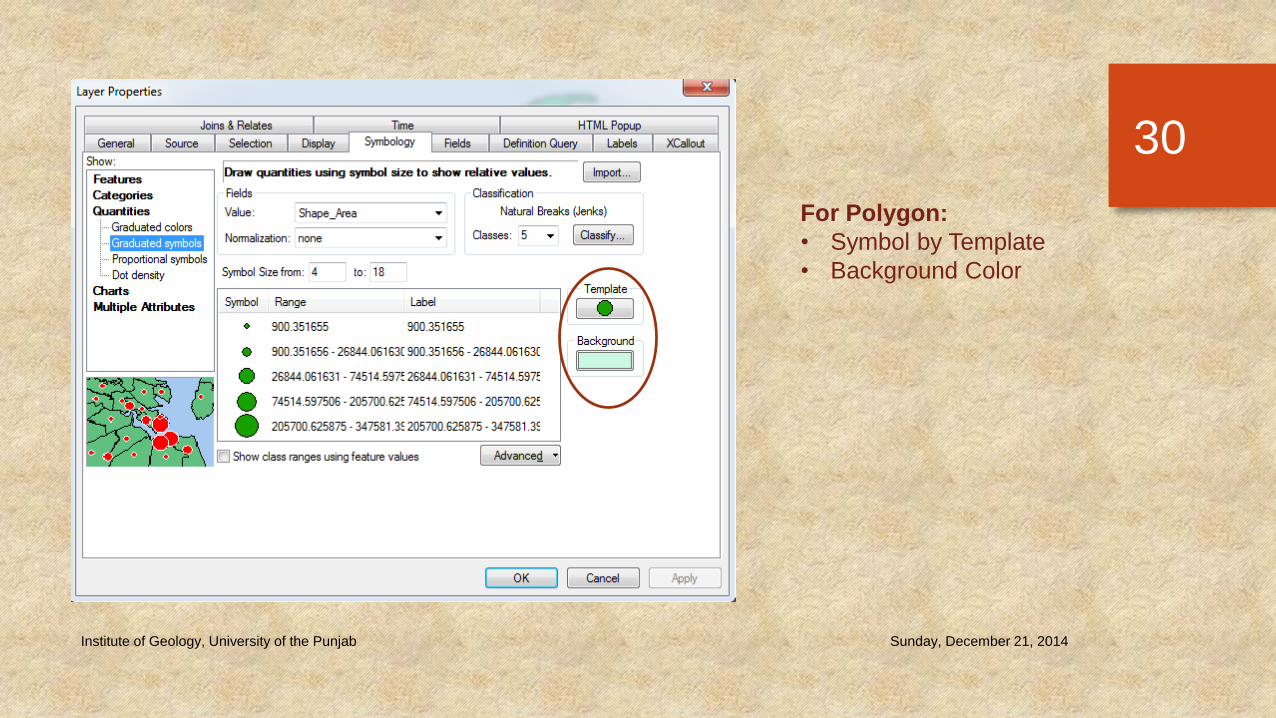
For Polygon:
• Symbol by Template
• Background Color
• It can also be classified.
• It can be normalized on the basis of:
• Percentage
• Log
• One can change the symbol type, through the option of ‘Template’.
• Its size can also be varies, from lower to upper (min - max), through the option of‘Symbol Size’.
Sunday, December 21, 2014Institute of Geology, University of the Punjab
31
Sunday, December 21, 2014Institute of Geology, University of the Punjab
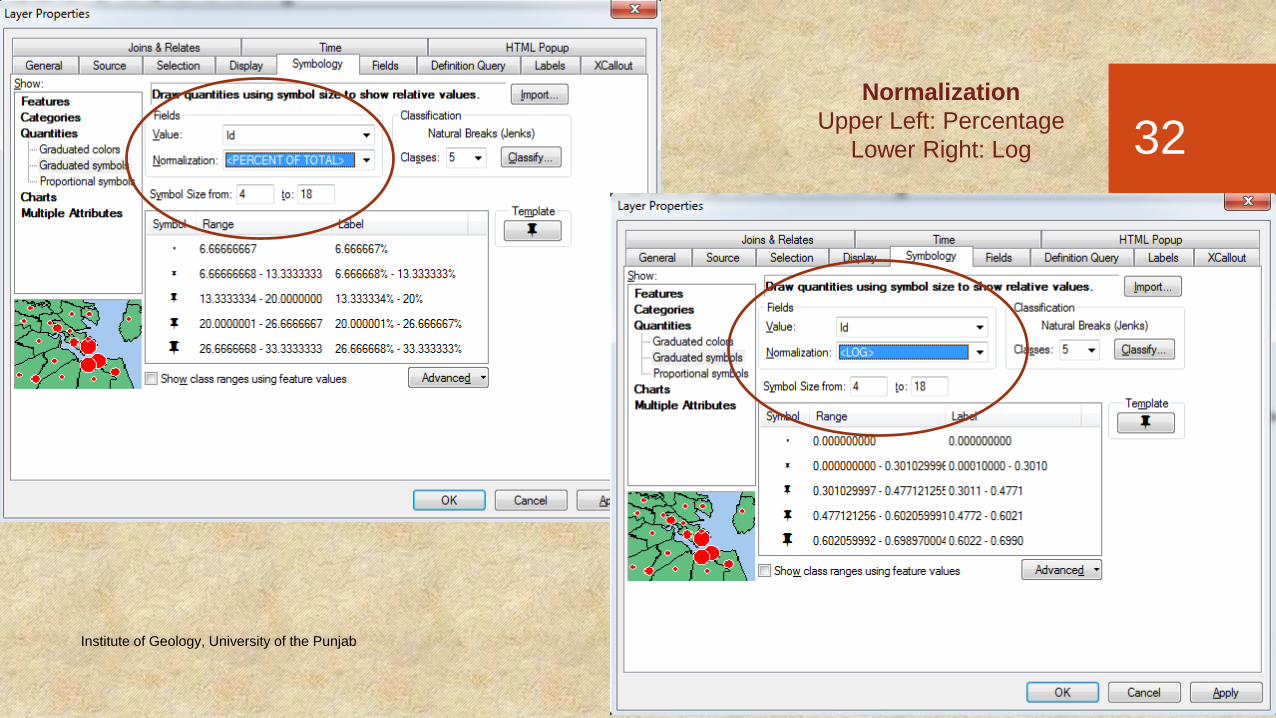
32Normalization
Upper Left: Percentage
Lower Right: Log
c. Proportional Symbols
• It varies proportionally with the normalized field.
• It goes with all feature type of shapefile.
• It displays best when the field values are not to wide.
• It is used to show Exact Values.
• As it displays the symbols on right and larger differences.
• In case of narrow wide range of values, it is tough to adjust the symbols, as itbecomes too crowded to display on screen.
• There is a fixed relationship between proportional symbols and attributes.
Sunday, December 21, 2014Institute of Geology, University of the Punjab
33
Sunday, December 21, 2014Institute of Geology, University of the Punjab
34
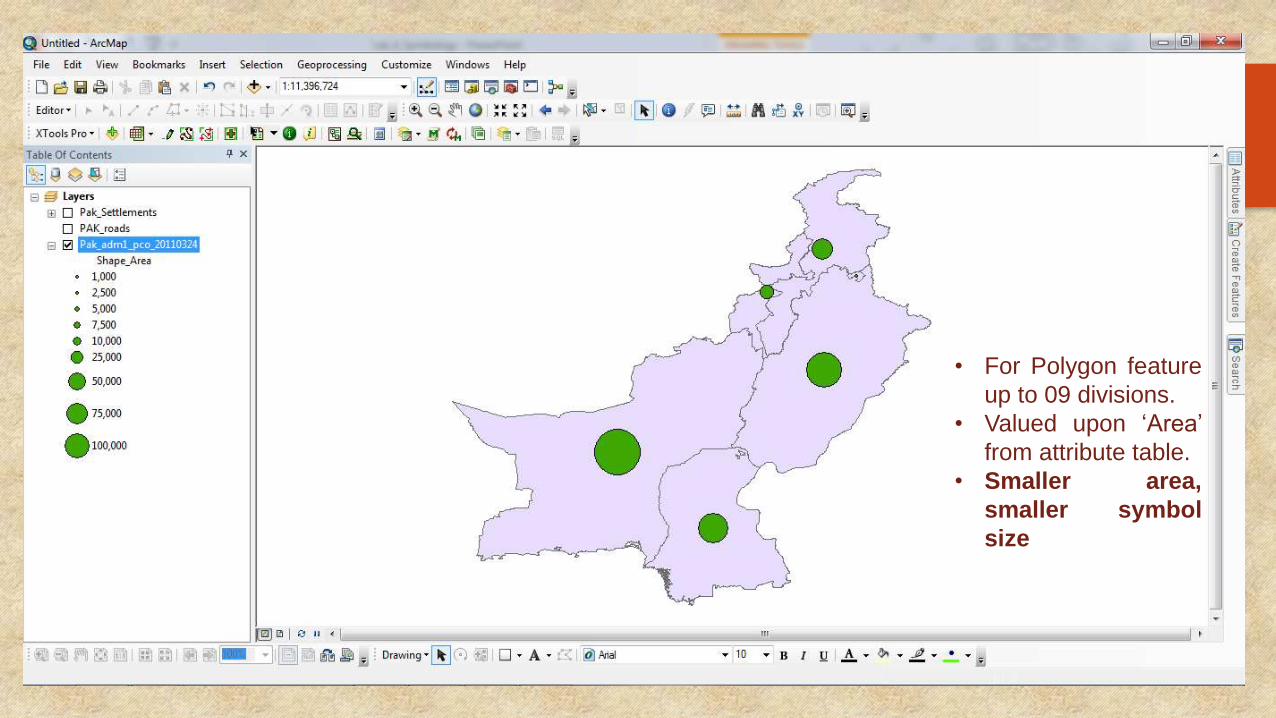
• For Polygon feature
up to 09 divisions.
• Valued upon ‘Area’
from attribute table.
• Smaller area,
smaller symbol
size
Sunday, December 21, 2014Institute of Geology, University of the Punjab
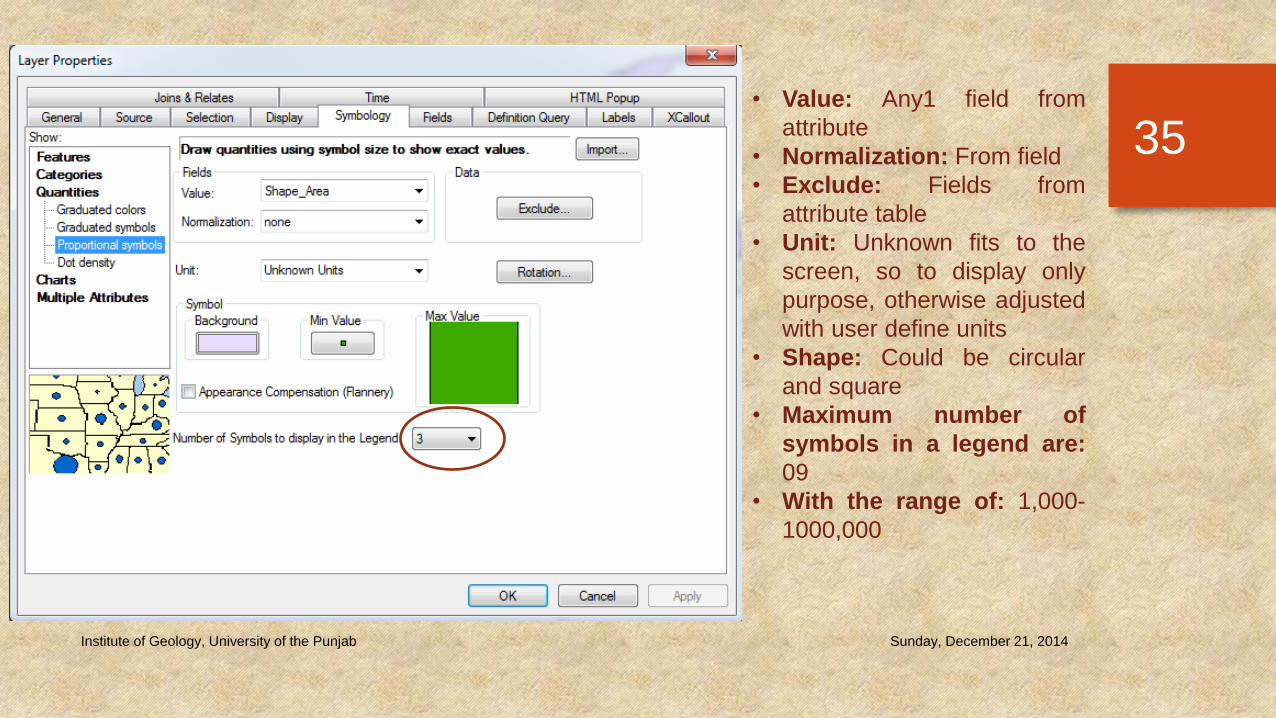
35• Value: Any1 field from
attribute
• Normalization: From field
• Exclude: Fields from
attribute table
• Unit: Unknown fits to the
screen, so to display only
purpose, otherwise adjusted
with user define units
• Shape: Could be circular
and square
• Maximum number of
symbols in a legend are:
09
• With the range of: 1,000-
1000,000
• It can be arranged on the basis of any filed selected from the attribute table.
• The lowest value from the filed gets the smallest size of symbol.
• Shape: Could be circular and square.
• Maximum number of symbols in a legend are: 09. (01-09)
• Default is: 03
• Must with the range of: 1,000 - 1000,000
• When ‘Units’ are not specified, one can adjust the symbol size by Min Value.
• In case it is define, it actually multiplies the filed value by map units.
Sunday, December 21, 2014Institute of Geology, University of the Punjab
36
Sunday, December 21, 2014Institute of Geology, University of the Punjab
37
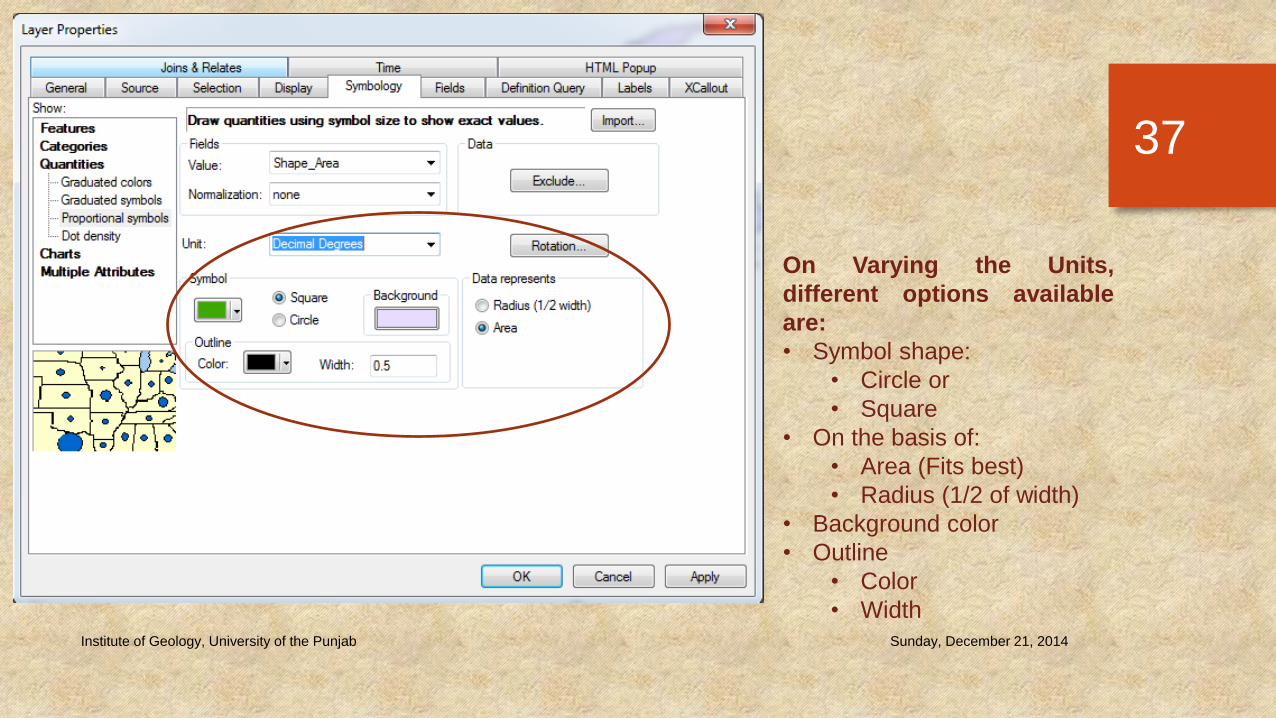
On Varying the Units,
different options available
are:
• Symbol shape:
• Circle or
• Square
• On the basis of:
• Area (Fits best)
• Radius (1/2 of width)
• Background color
• Outline
• Color
• Width
Sunday, December 21, 2014Institute of Geology, University of the Punjab
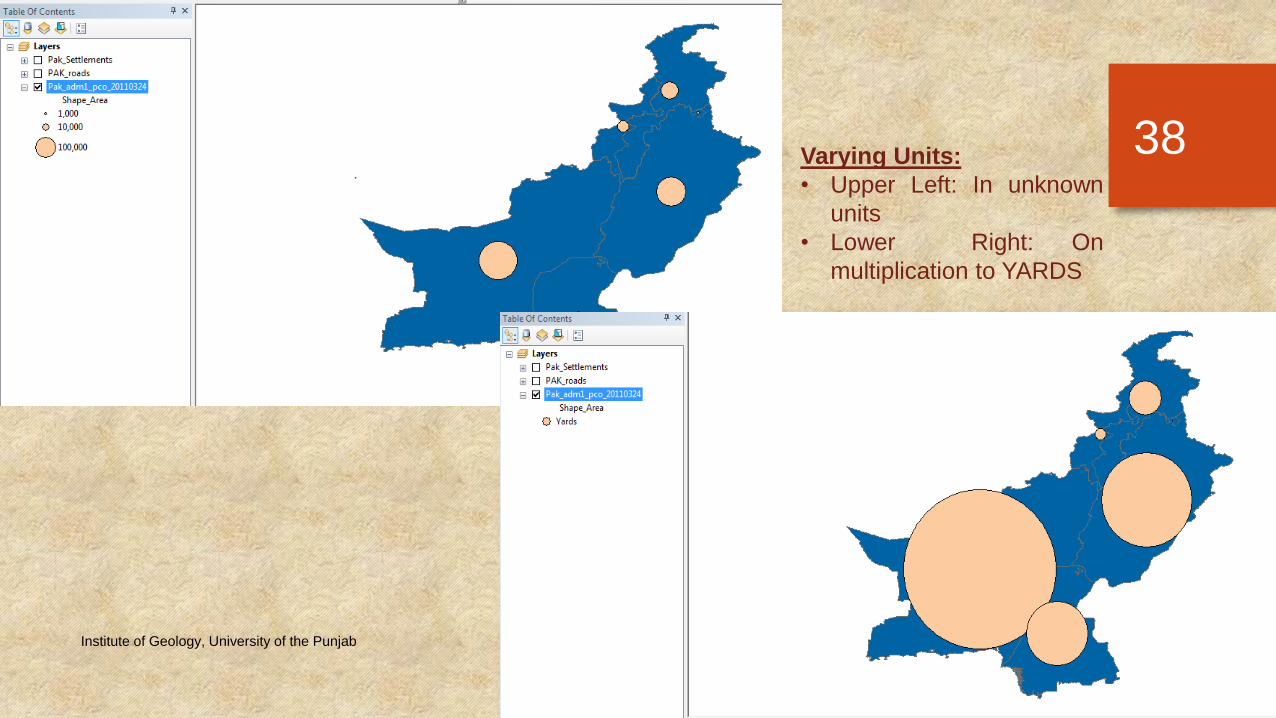
38Varying Units:
• Upper Left: In unknown
units
• Lower Right: On
multiplication to YARDS
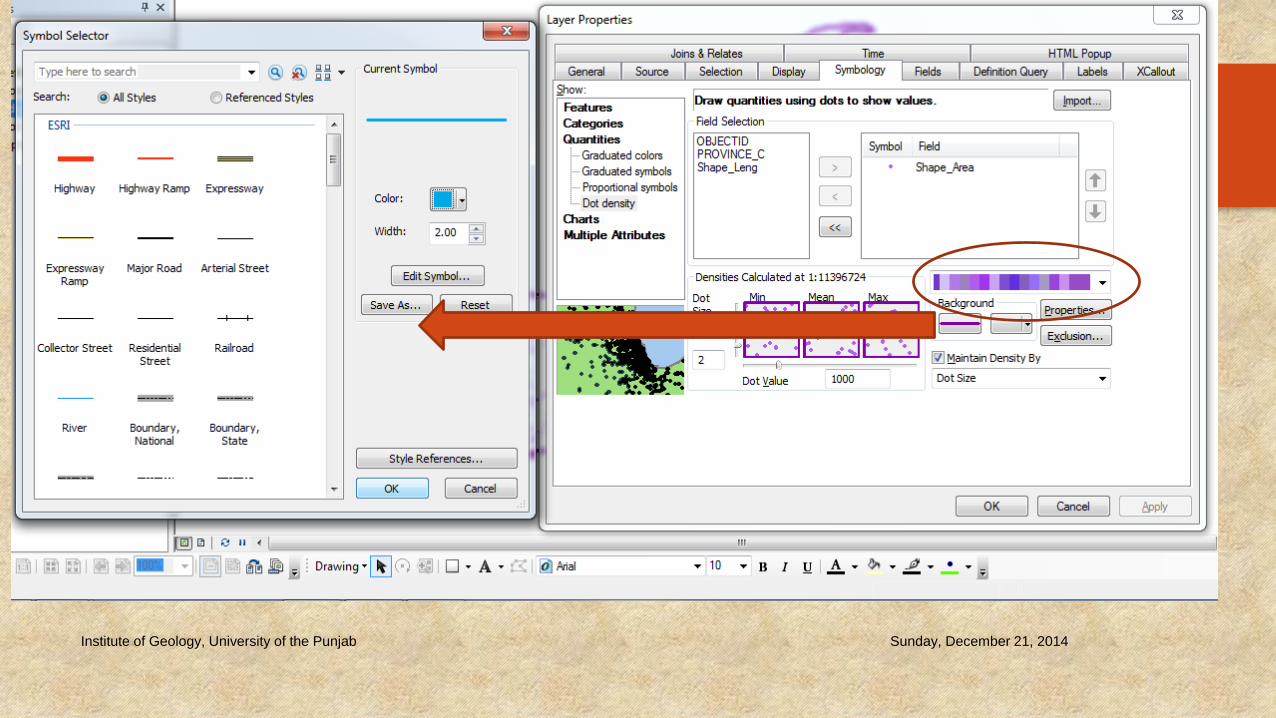
d. Dot Density
• Only for Polygon layer.
• The greater the values, the greater the number of dots or density, within theboundary layer of polygon.
• It displays randomly.
• There is a fixed relationship between number of dots and attributes.
• But it may differs from the actual attribute values.
• For Example:
• 1 dot = 1,000 (in our example)
Sunday, December 21, 2014Institute of Geology, University of the Punjab
39
Sunday, December 21, 2014Institute of Geology, University of the Punjab
40
Sunday, December 21, 2014Institute of Geology, University of the Punjab
41
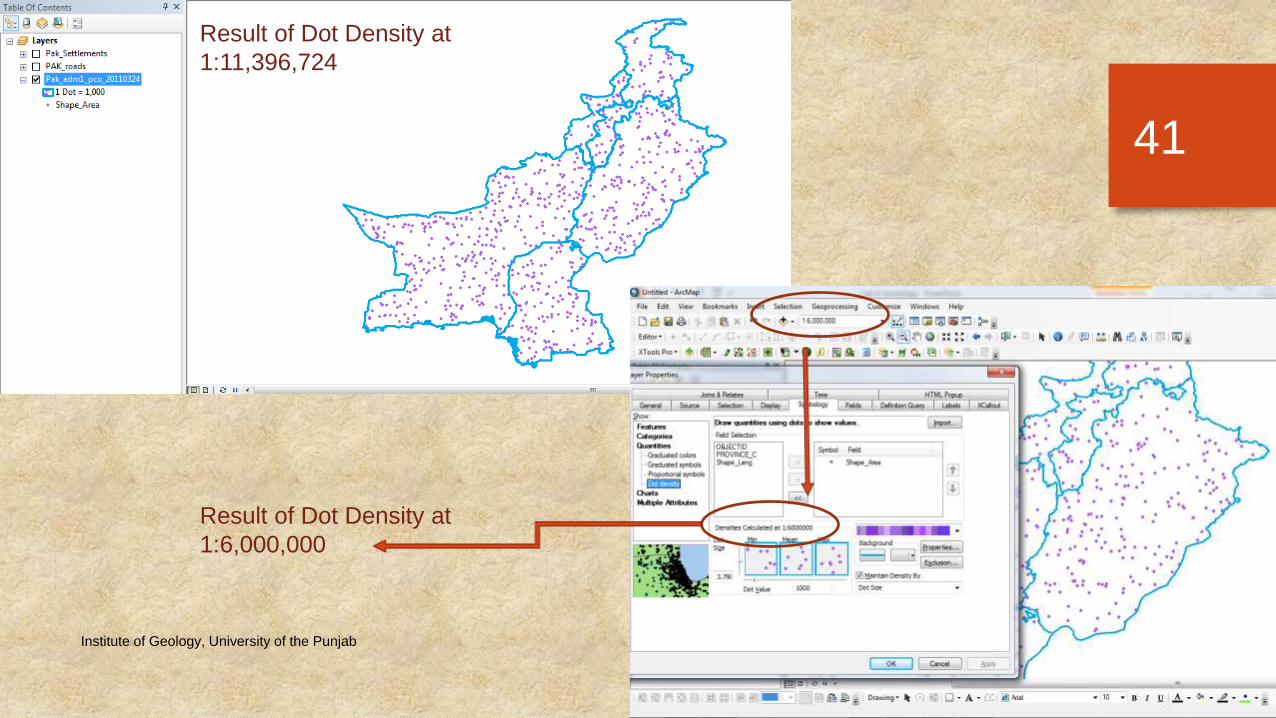
Result of Dot Density at
1:11,396,724
Result of Dot Density at
1:6,000,000
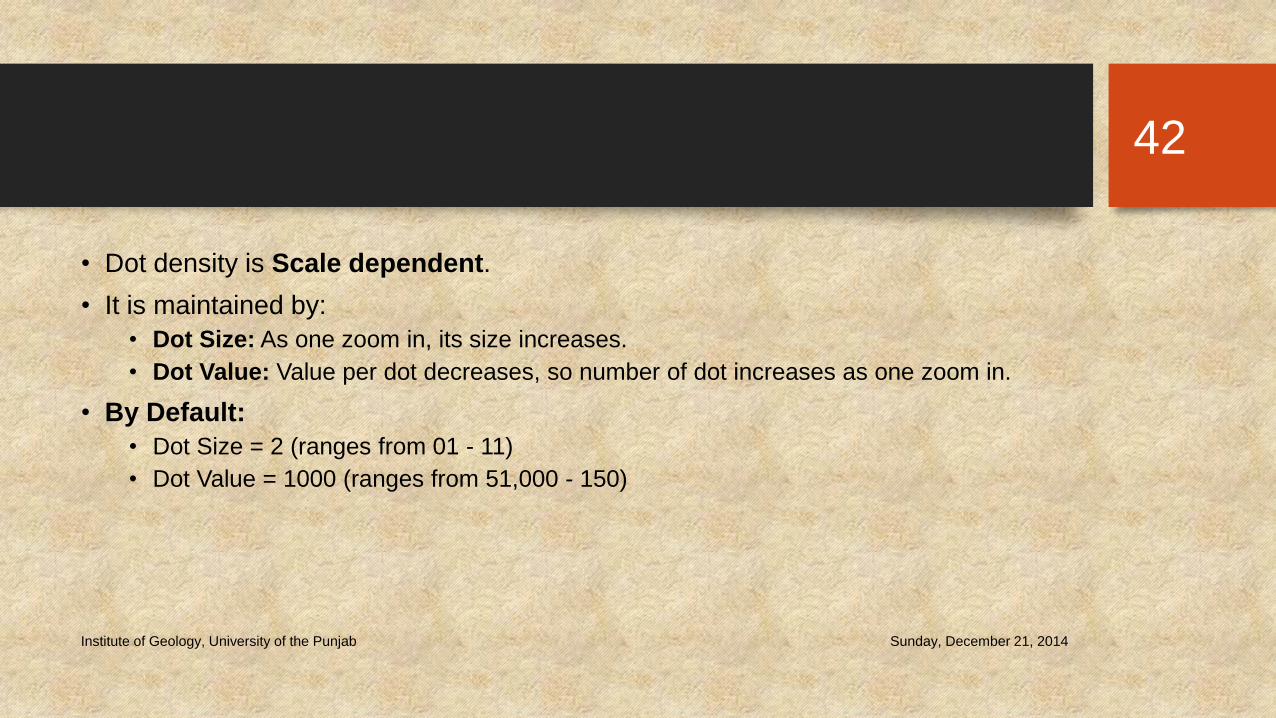
• Dot density is Scale dependent.
• It is maintained by:
• Dot Size: As one zoom in, its size increases.
• Dot Value: Value per dot decreases, so number of dot increases as one zoom in.
• By Default:
• Dot Size = 2 (ranges from 01 - 11)
• Dot Value = 1000 (ranges from 51,000 - 150)
Sunday, December 21, 2014Institute of Geology, University of the Punjab
42
Sunday, December 21, 2014Institute of Geology, University of the Punjab
43
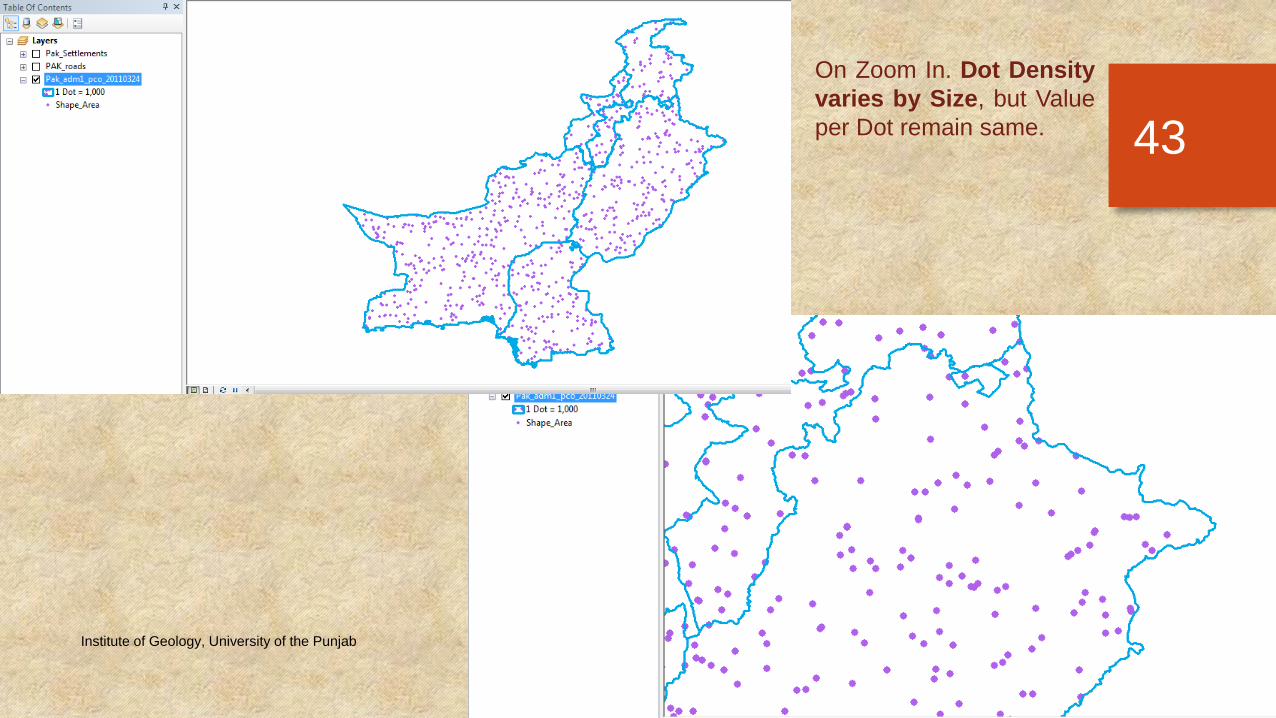
On Zoom In. Dot Density
varies by Size, but Value
per Dot remain same.
Sunday, December 21, 2014Institute of Geology, University of the Punjab
44
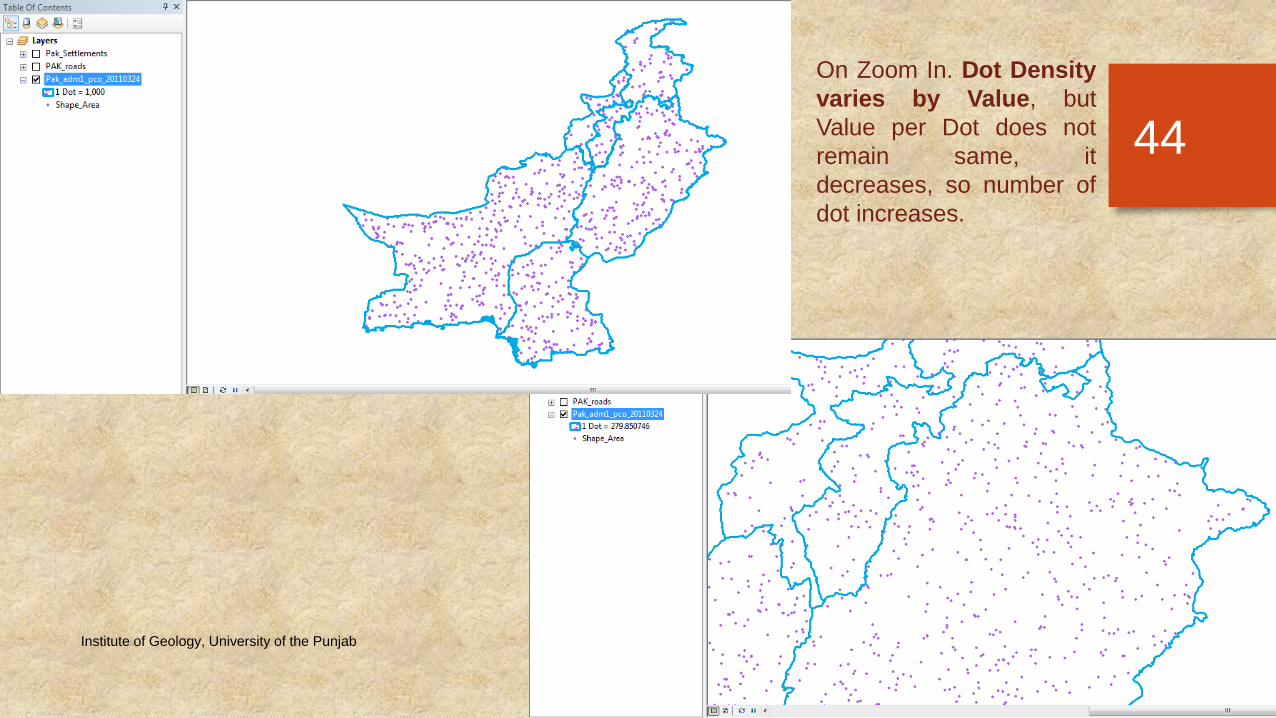
On Zoom In. Dot Density
varies by Value, but
Value per Dot does not
remain same, it
decreases, so number of
dot increases.
Sunday, December 21, 2014Institute of Geology, University of the Punjab
45
Related Documents


