Matlab

Lab on implementing a circuit and finding a B-H curve using Matlab
Dec 31, 2015
implementing a circuit and finding a B-H curve using Matlab.....
Welcome message from author
This document is posted to help you gain knowledge. Please leave a comment to let me know what you think about it! Share it to your friends and learn new things together.
Transcript


LAB 2
Title:implementing a circuit and finding a B-H curve using Matlab.
Aim:Step vise analysis of the circuit using Matlab& B-H curve.
Circuit:
Procedure:
The procedure is taken out in steps.
Step1:
In this step we open the “Simulink library” icon in the matlab.
Step 2:

After opening Simulink library here we will find
In electric sources pick up AC voltage source by right clicking it and adding it to the new model.
Step 3:
Simspace Sim Power System
Electric sources

In this pick 3 elements
I. Linear transformerII. RLC branchIII. Ground.
Step 4:
Simspace Sim Power System
Elements

After this we move up to measurement block and pick two voltage measurement elements to untitled.
Step 5:

Click “SimPowerSystems” and select Power Gui
Step 6:
From Simulink library
Add two scopes to untitled.
Set one scope to input and one to output.
Simspace Sinks
Scope

Scope settings:By double clicking on scope the following window will appear, by clicking the arrow pointing in left screen, the right screen will appear. Uncheck the arrow pointing option.
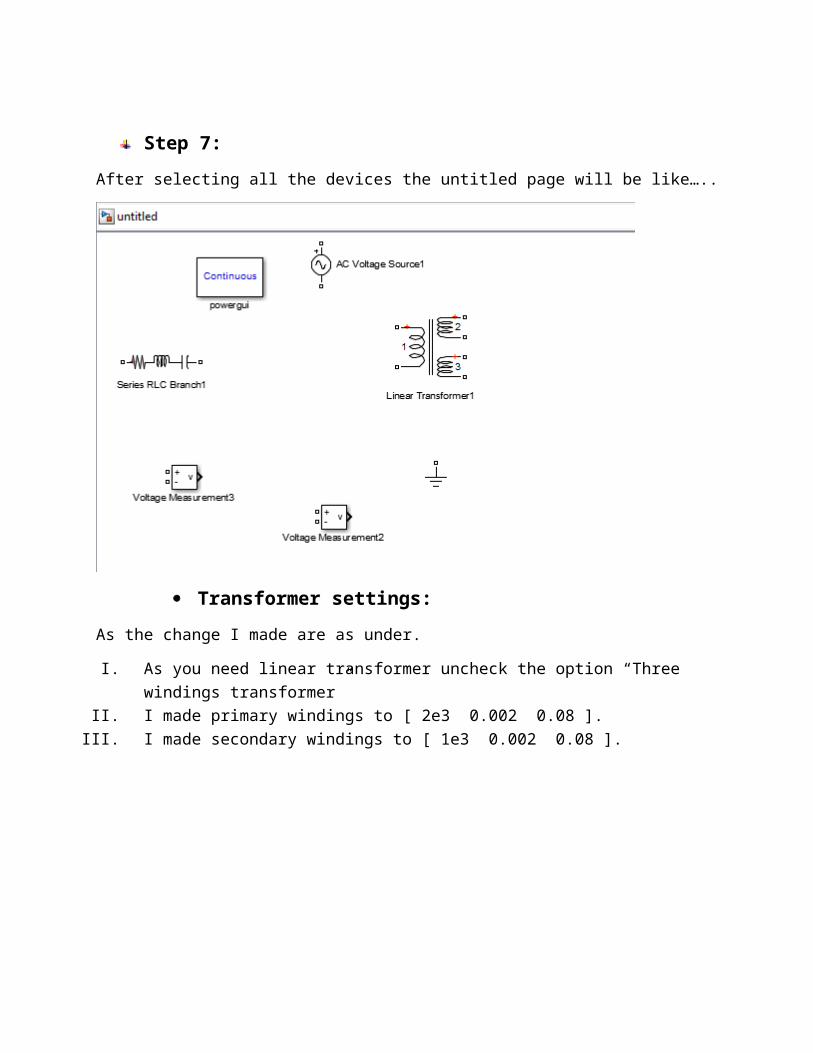
Step 7:
After selecting all the devices the untitled page will be like…..
Transformer settings:
As the change I made are as under.
I. As you need linear transformer uncheck the option “Three windings transformer”
II. I made primary windings to [ 2e3 0.002 0.08 ].III. I made secondary windings to [ 1e3 0.002 0.08 ].

AC voltage settings:I. Change peak amplitude to “rno*sqrt (2).II. Frequency to 50 hz.

Step 9:After this connect the components by attaching them through the wires.
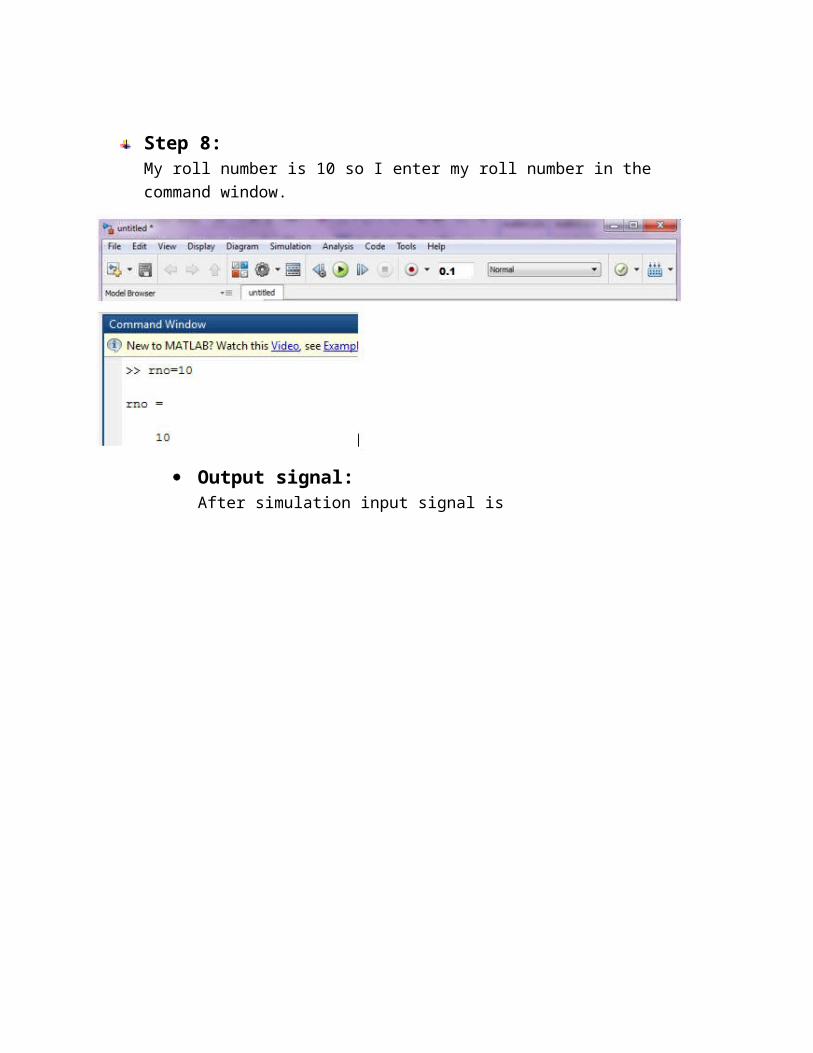
Step 8:My roll number is 10 so I enter my roll number in the command window.
Output signal:After simulation input signal is

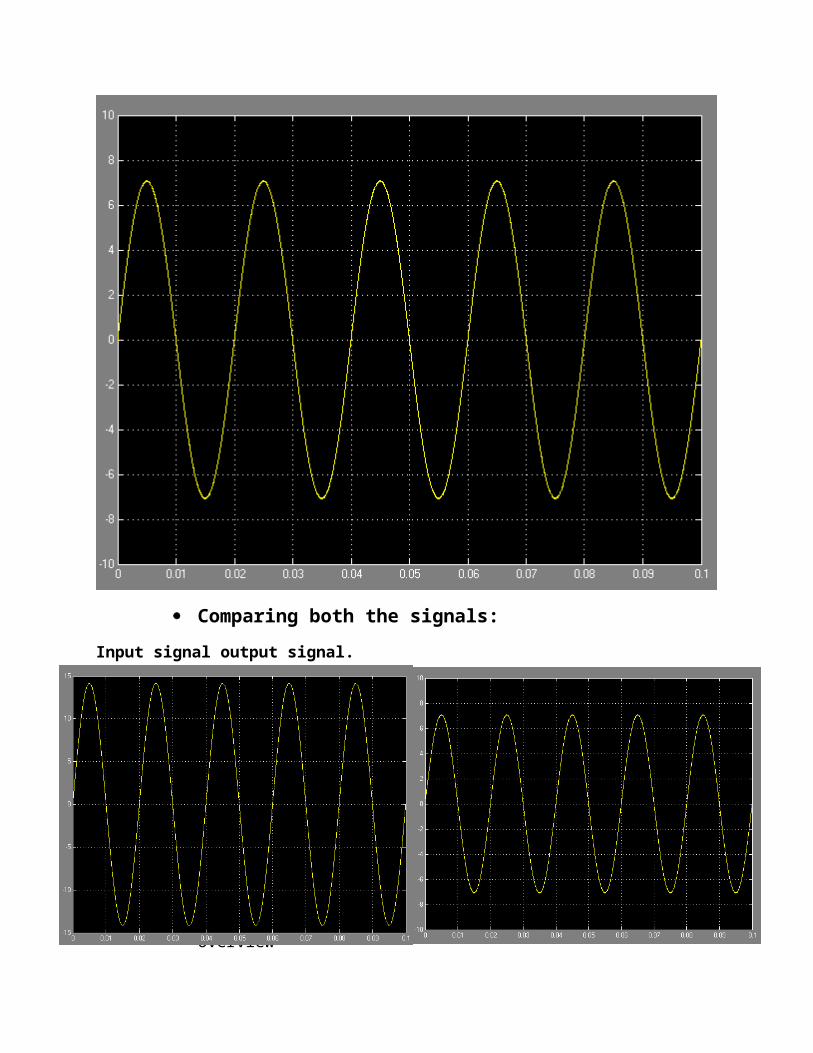
Output signal is
Comparing both the signals:
Input signal output signal.
Explanation:As per above output and input signal, let’s have an overview
I. As my roll number is 10 so in input voltage signal
Vpeak = 10 * sqrt (2)Vpeak = 14.14 volts
II. If we see the input signal the peak value is 14.14 which corresponds the theoretical value.
III. As from transformer the turn ratio I set was 2:1 means the output will be exactly the half of input voltage.
IV.VpVs
=N 1N 2
Vs = (14.14 * 1)/2Vs = 7.07 volts
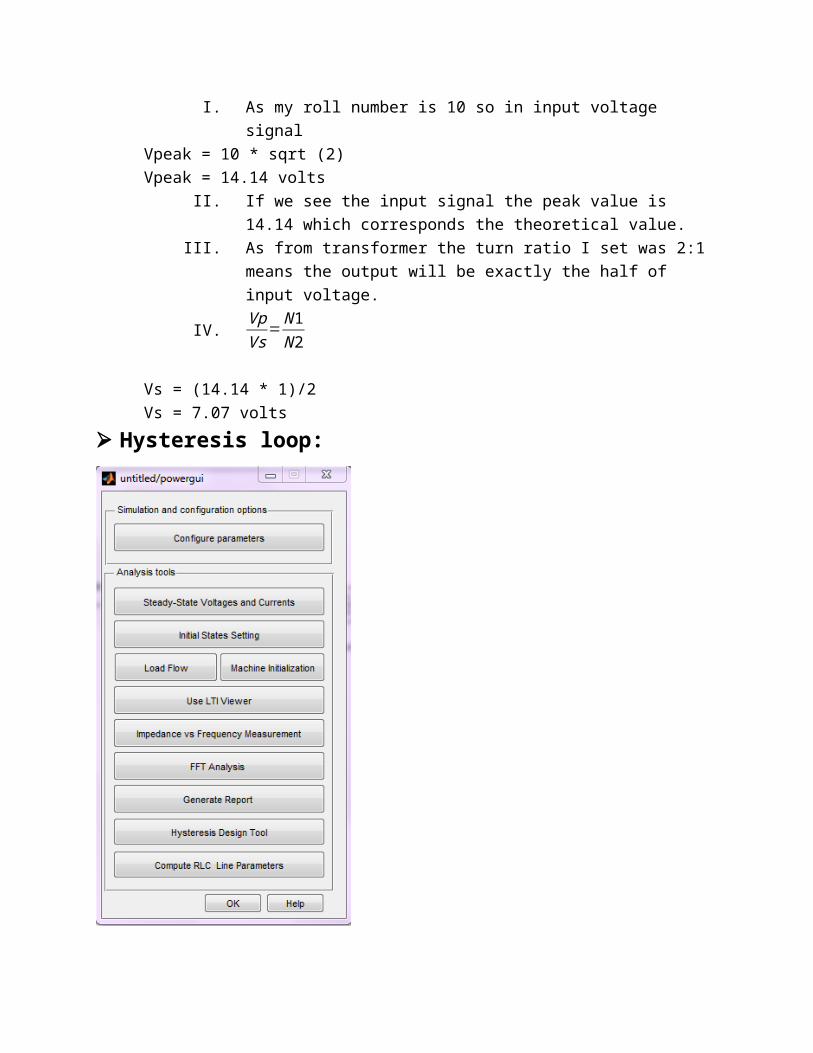
Hysteresis loop:
For hysteresis loop click “hysteresis loop design”
.
Related Documents