Economy Overview La Crosse County, WI Emsi Q4 2017 Data Set | www.economicmodeling.com Emsi Q4 2017 Data Set | www.economicmodeling.com

Welcome message from author
This document is posted to help you gain knowledge. Please leave a comment to let me know what you think about it! Share it to your friends and learn new things together.
Transcript
Economy Overview
La Crosse County, WI
Emsi Q4 2017 Data Set | www.economicmodeling.com
Economy Overview
Emsi Q4 2017 Data Set | www.economicmodeling.com

. . . . . . . . . . . . . . . . . . . . . . . . . . . . . . . . . . . . . . . . . . . . . . . . . . . . . . . . . . . . . . . . . . . . . . . . . . . . . . . . . . . . . . . . . . . . . . . . . . . . . . . . . . . . . . . . . . . . . . . . . . . . . . . . . . . . . . . . . . . . . . . . . . . . . . . . . . . . . . . . . . . . . .1. . . . . . . . . . . . . . . . . . . . . . . . . . . . . . . . . . . . . . . . . . . . . . . . . . . . . . . . . . . . . . . . . . . . . . . . . . . . . . . . . . . . . . . . . . . . . . . . . . . . . . . . . . . . . . . . . . . . . . . . . . . . . . . . . . . . . . . . . . . . . . . . . . . . . . . . . . . . . . . . . . . . . .4. . . . . . . . . . . . . . . . . . . . . . . . . . . . . . . . . . . . . . . . . . . . . . . . . . . . . . . . . . . . . . . . . . . . . . . . . . . . . . . . . . . . . . . . . . . . . . . . . . . . . . . . . . . . . . . . . . . . . . . . . . . . . . . . . . . . . . . . . . . . . . . . . . . . . . . . . . . . . . . . . . . . . .8. . . . . . . . . . . . . . . . . . . . . . . . . . . . . . . . . . . . . . . . . . . . . . . . . . . . . . . . . . . . . . . . . . . . . . . . . . . . . . . . . . . . . . . . . . . . . . . . . . . . . . . . . . . . . . . . . . . . . . . . . . . . . . . . . . . . . . . . . . . . . . . . . . . . . . . . . . . . . . . . . . . . . .10. . . . . . . . . . . . . . . . . . . . . . . . . . . . . . . . . . . . . . . . . . . . . . . . . . . . . . . . . . . . . . . . . . . . . . . . . . . . . . . . . . . . . . . . . . . . . . . . . . . . . . . . . . . . . . . . . . . . . . . . . . . . . . . . . . . . . . . . . . . . . . . . . . . . . . . . . . . . . . . . . . . . . .12. . . . . . . . . . . . . . . . . . . . . . . . . . . . . . . . . . . . . . . . . . . . . . . . . . . . . . . . . . . . . . . . . . . . . . . . . . . . . . . . . . . . . . . . . . . . . . . . . . . . . . . . . . . . . . . . . . . . . . . . . . . . . . . . . . . . . . . . . . . . . . . . . . . . . . . . . . . . . . . . . . . . . .15
ContentsEconomy OverviewHistoric & Projected TrendsPopula on Characteris csIndustry Characteris csWorkforce Characteris csEduca onal Pipeline
Economy Overview
Emsi Q4 2017 Data Set | www.economicmodeling.com
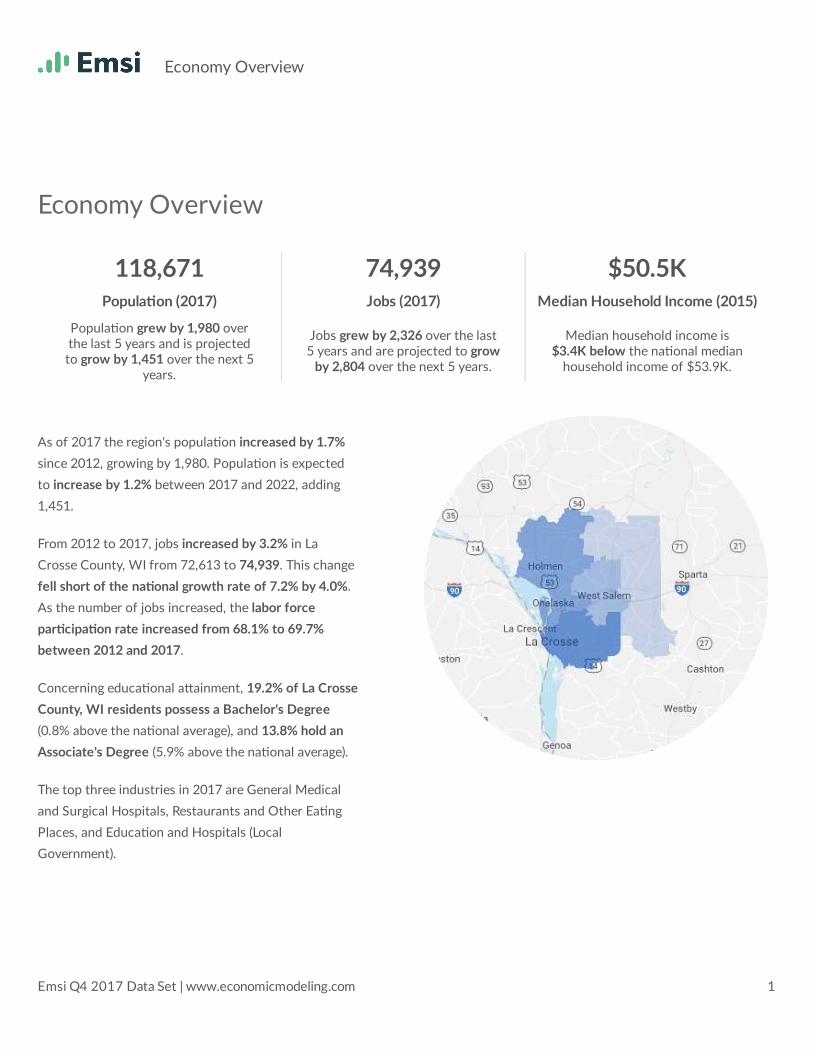
As of 2017 the region's popula on increased by 1.7%since 2012, growing by 1,980. Popula on is expectedto increase by 1.2% between 2017 and 2022, adding1,451.
From 2012 to 2017, jobs increased by 3.2% in LaCrosse County, WI from 72,613 to 74,939. This changefell short of the na onal growth rate of 7.2% by 4.0%.As the number of jobs increased, the labor forcepar cipa on rate increased from 68.1% to 69.7%between 2012 and 2017.
Concerning educa onal a ainment, 19.2% of La CrosseCounty, WI residents possess a Bachelor's Degree(0.8% above the na onal average), and 13.8% hold anAssociate's Degree (5.9% above the na onal average).
The top three industries in 2017 are General Medicaland Surgical Hospitals, Restaurants and Other Ea ngPlaces, and Educa on and Hospitals (LocalGovernment).
Economy Overview118,671 74,939 $50.5K
Popula on (2017) Jobs (2017) Median Household Income (2015)Popula on grew by 1,980 overthe last 5 years and is projectedto grow by 1,451 over the next 5
years.
Jobs grew by 2,326 over the last5 years and are projected to grow
by 2,804 over the next 5 years.Median household income is
$3.4K below the na onal medianhousehold income of $53.9K.
Economy Overview
Emsi Q4 2017 Data Set | www.economicmodeling.com 1
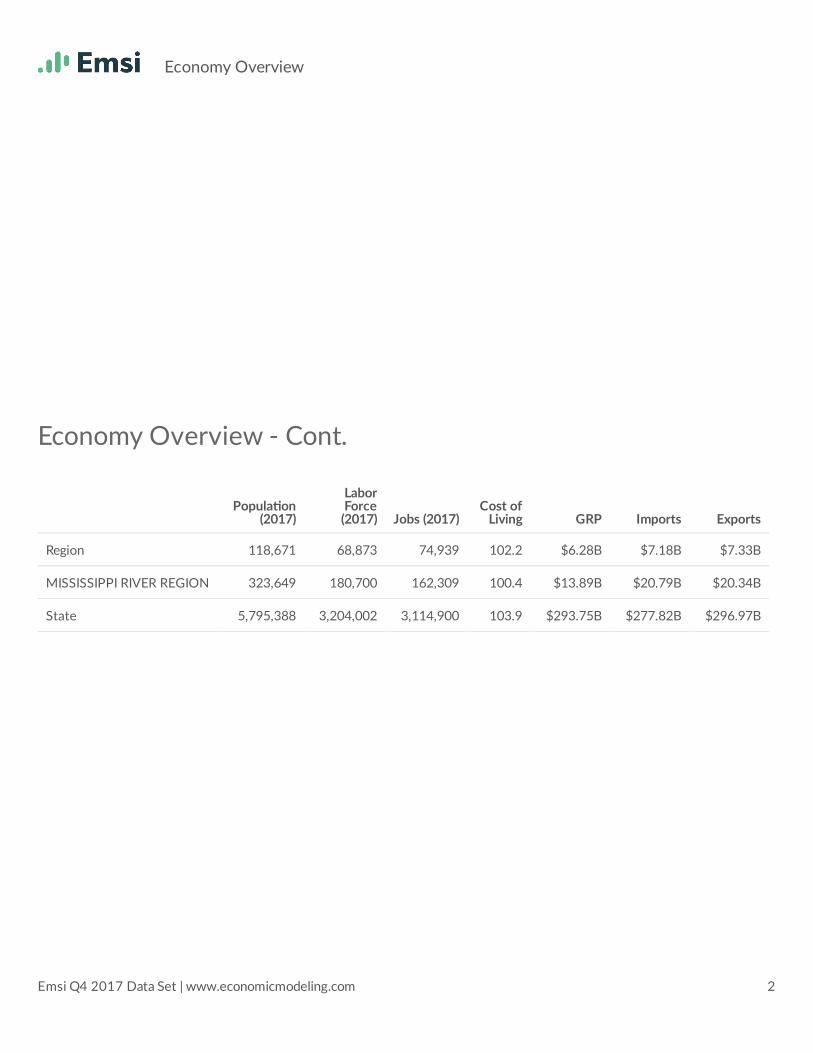
Economy Overview - Cont.Popula on(2017)
LaborForce(2017) Jobs (2017) Cost ofLiving GRP Imports ExportsRegion 118,671 68,873 74,939 102.2 $6.28B $7.18B $7.33BMISSISSIPPI RIVER REGION 323,649 180,700 162,309 100.4 $13.89B $20.79B $20.34BState 5,795,388 3,204,002 3,114,900 103.9 $293.75B $277.82B $296.97B
Economy Overview
Emsi Q4 2017 Data Set | www.economicmodeling.com 2
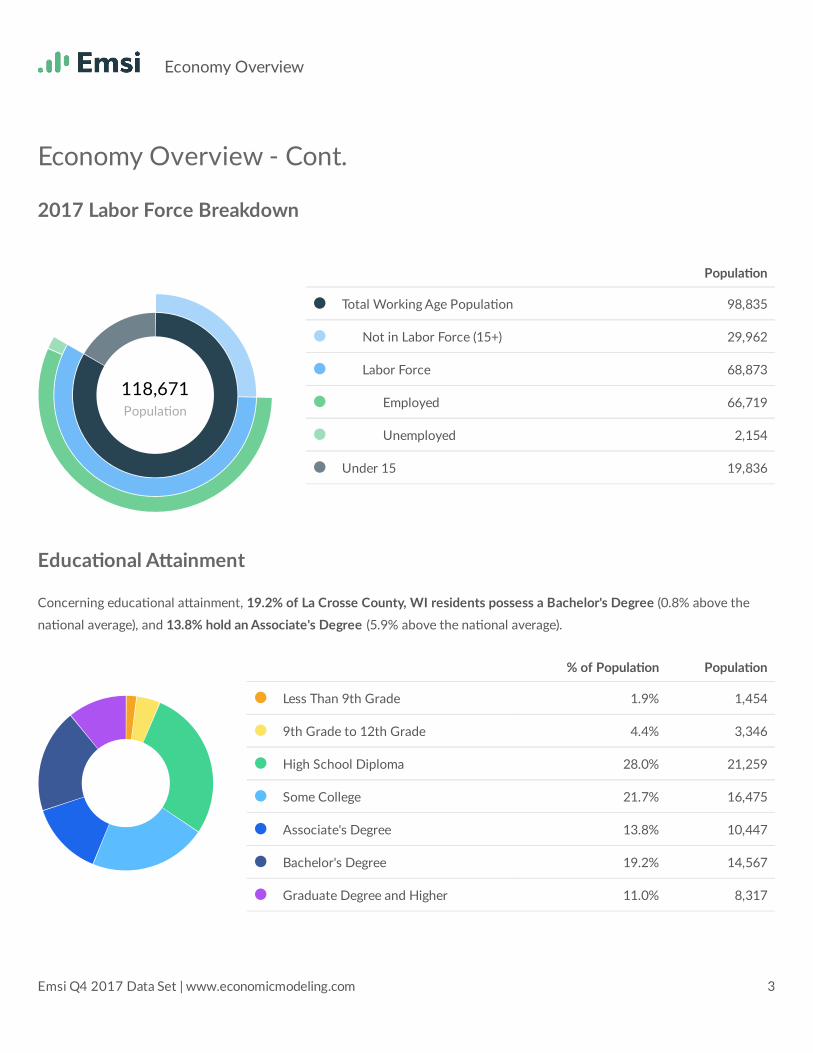
Economy Overview - Cont.2017 Labor Force Breakdown
Popula on118,671
Educa onal A ainmentConcerning educa onal a ainment, 19.2% of La Crosse County, WI residents possess a Bachelor's Degree (0.8% above thena onal average), and 13.8% hold an Associate's Degree (5.9% above the na onal average).
Popula onA Total Working Age Popula on 98,835A Not in Labor Force (15+) 29,962A Labor Force 68,873A Employed 66,719A Unemployed 2,154A Under 15 19,836
% of Popula on Popula onA Less Than 9th Grade 1.9% 1,454A 9th Grade to 12th Grade 4.4% 3,346A High School Diploma 28.0% 21,259A Some College 21.7% 16,475A Associate's Degree 13.8% 10,447A Bachelor's Degree 19.2% 14,567A Graduate Degree and Higher 11.0% 8,317
Economy Overview
Emsi Q4 2017 Data Set | www.economicmodeling.com 3

Historic & Projected TrendsPopula on TrendsAs of 2017 the region's popula on increased by 1.7% since 2012, growing by 1,980. Popula on is expected to increase by1.2% between 2017 and 2022, adding 1,451.
Timeframe Popula on2012 116,6912013 117,0632014 117,7212015 118,0532016 118,1162017 118,6712018 119,0142019 119,3242020 119,6132021 119,8802022 120,122
Economy Overview
Emsi Q4 2017 Data Set | www.economicmodeling.com 4

Historic & Projected Trends - Cont.Job TrendsFrom 2012 to 2017, jobs increased by 3.2% in La Crosse County, WI from 72,613 to 74,939. This change fell short of thena onal growth rate of 7.2% by 4.0%.
Timeframe Jobs2012 72,6132013 73,3822014 73,2972015 73,8432016 74,7072017 74,9392018 75,7632019 76,4322020 76,9932021 77,4762022 77,742
Economy Overview
Emsi Q4 2017 Data Set | www.economicmodeling.com 5
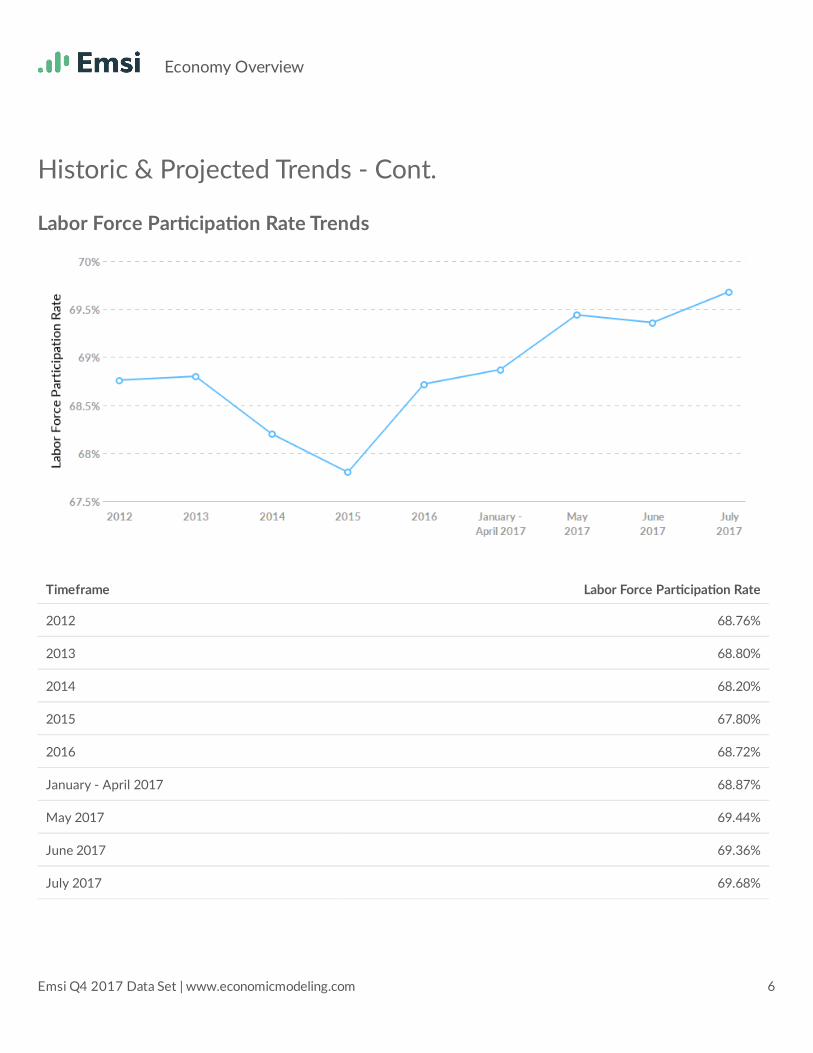
Historic & Projected Trends - Cont.Labor Force Par cipa on Rate Trends
Timeframe Labor Force Par cipa on Rate2012 68.76%2013 68.80%2014 68.20%2015 67.80%2016 68.72%January - April 2017 68.87%May 2017 69.44%June 2017 69.36%July 2017 69.68%
Economy Overview
Emsi Q4 2017 Data Set | www.economicmodeling.com 6
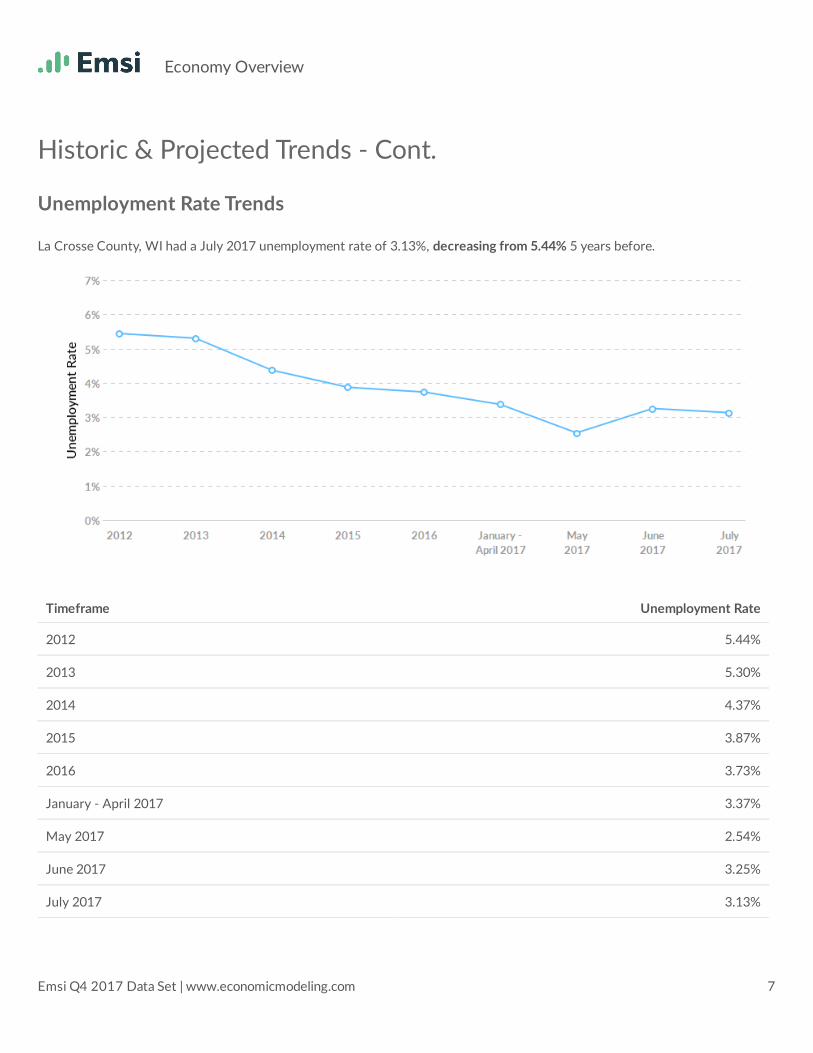
Historic & Projected Trends - Cont.Unemployment Rate TrendsLa Crosse County, WI had a July 2017 unemployment rate of 3.13%, decreasing from 5.44% 5 years before.
Timeframe Unemployment Rate2012 5.44%2013 5.30%2014 4.37%2015 3.87%2016 3.73%January - April 2017 3.37%May 2017 2.54%June 2017 3.25%July 2017 3.13%
Economy Overview
Emsi Q4 2017 Data Set | www.economicmodeling.com 7

La Crosse County, WI has 28,841millennials (ages 20-34). Thena onal average for an area thissize is 24,512.
Re rement risk is about average inLa Crosse County, WI. Thena onal average for an area thissize is 18,001 people 65 or older,while there are 18,452 here.
Racial diversity is low in La CrosseCounty, WI. The na onal averagefor an area this size is 45,750racially diverse people, while thereare 11,646 here.
La Crosse County, WI has 7,912veterans. The na onal average foran area this size is 6,927.
La Crosse County, WI has 1.24violent crimes per 1,000 people.The na onal rate is 3.75 per 1,000people.
La Crosse County, WI has 25.23property crimes per 1,000 people.The na onal rate is 24.22 per1,000 people.
Popula on Characteris cs
28,841Millennials
18,452Re ring Soon
11,646Racial Diversity
7,912Veterans
1.24/1,000
Violent Crime
25.23/1,000
Property Crime
Economy Overview
Emsi Q4 2017 Data Set | www.economicmodeling.com 8

Where Talent Works Where Talent Lives
Popula on Characteris cs - Cont.Place of Work vs Place of ResidenceUnderstanding where talent in La Crosse County, WI currently works compared to where talent lives can help you op mize sitedecisions.
High Inbound Commuters High Outbound Commuters
ZIP Name 2017Employment54601 La Crosse, WI (in La Crosse county)… 38,37054650 Onalaska, WI (in La Crosse county)… 14,76054603 La Crosse, WI (in La Crosse county)… 11,87754669 West Salem, WI (in La Crosse county)… 3,82054636 Holmen, WI (in La Crosse county)… 3,196
ZIP Name 2017Workers54601 La Crosse, WI (in La Crosse county)… 23,83654650 Onalaska, WI (in La Crosse county)… 12,99754603 La Crosse, WI (in La Crosse county)… 8,17654636 Holmen, WI (in La Crosse county)… 7,63154669 West Salem, WI (in La Crosse county)… 4,076
Economy Overview
Emsi Q4 2017 Data Set | www.economicmodeling.com 9

Industry Characteris csLargest Industries
Industry Jobs Na onal Average
0 2,000 4,000 6,000
Agencies, Brokerages, and Other Insurance RelatedAc vi es
Local Government, Excluding Educa on andHospitals
Educa on and Hospitals (Local Government)
Restaurants and Other Ea ng Places
General Medical and Surgical Hospitals
Industry 2012Jobs 2017Jobs Change in Jobs(2012-2017) %Change 2017 EarningsPer WorkerGeneral Medical and Surgical Hospitals 7,627 7,766 139 +2% $84,236Restaurants and Other Ea ng Places 4,773 4,972 199 +4% $15,799Educa on and Hospitals (Local Government) 3,809 3,819 10 +0% $57,847Local Government, Excluding Educa on andHospitals 3,072 2,990 -82 -3% $62,101
Agencies, Brokerages, and Other Insurance RelatedAc vi es 1,537 1,738 201 +13% $59,100
Economy Overview
Emsi Q4 2017 Data Set | www.economicmodeling.com 10

Industry Characteris cs - ContTop Growing Industries
Industry Jobs Change
0 200 400 600 800
Dairy Product Manufacturing
Con nuing Care Re rement Communi es andAssisted Living Facili es for the Elderly
Hardware, and Plumbing and Hea ng Equipment andSupplies Merchant Wholesalers
Machinery, Equipment, and Supplies MerchantWholesalers
Offices of Physicians
Industry 2012Jobs 2017Jobs Change in Jobs(2012-2017) %Change 2017 EarningsPer WorkerOffices of Physicians 673 1,623 950 +141% $74,060Machinery, Equipment, and Supplies MerchantWholesalers 280 573 293 +105% $83,244
Hardware, and Plumbing and Hea ng Equipment andSupplies Merchant Wholesalers 287 558 271 +94% $69,988
Con nuing Care Re rement Communi es and AssistedLiving Facili es for the Elderly 324 569 245 +76% $24,688
Dairy Product Manufacturing 545 778 233 +43% $61,747
Economy Overview
Emsi Q4 2017 Data Set | www.economicmodeling.com 11
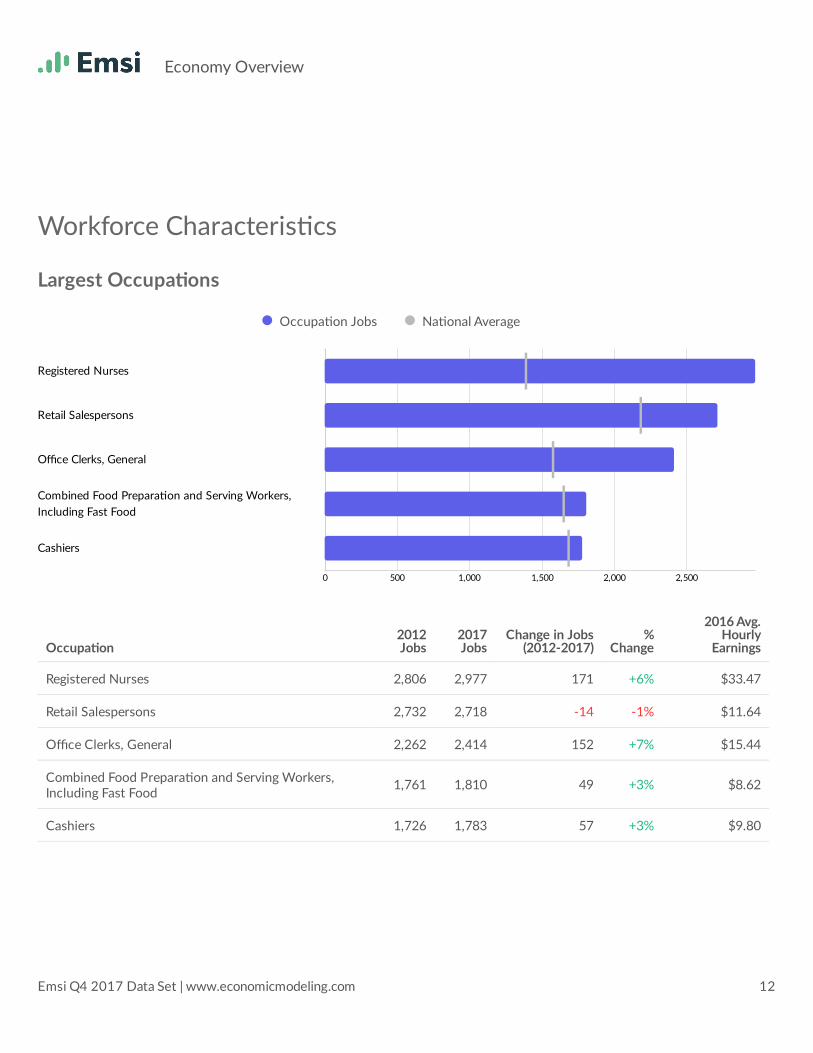
Workforce Characteris csLargest Occupa ons
Occupa on Jobs Na onal Average
0 500 1,000 1,500 2,000 2,500
Cashiers
Combined Food Prepara on and Serving Workers,Including Fast Food
Office Clerks, General
Retail Salespersons
Registered Nurses
Occupa on 2012Jobs 2017Jobs Change in Jobs(2012-2017) %Change2016 Avg.HourlyEarnings
Registered Nurses 2,806 2,977 171 +6% $33.47Retail Salespersons 2,732 2,718 -14 -1% $11.64Office Clerks, General 2,262 2,414 152 +7% $15.44Combined Food Prepara on and Serving Workers,Including Fast Food 1,761 1,810 49 +3% $8.62
Cashiers 1,726 1,783 57 +3% $9.80
Economy Overview
Emsi Q4 2017 Data Set | www.economicmodeling.com 12

Workforce Characteris cs - ContTop Growing Occupa ons
Occupa on Jobs Change
0 50 100 150 200
Insurance Claims and Policy Processing Clerks
Sales Representa ves, Wholesale andManufacturing, Except Technical and Scien ficProducts
Office Clerks, General
Registered Nurses
Heavy and Tractor-Trailer Truck Drivers
Occupa on 2012Jobs 2017Jobs Change in Jobs(2012-2017) %Change2016 Avg.HourlyEarnings
Heavy and Tractor-Trailer Truck Drivers 1,199 1,414 215 +18% $21.64Registered Nurses 2,806 2,977 171 +6% $33.47Office Clerks, General 2,262 2,414 152 +7% $15.44Sales Representa ves, Wholesale and Manufacturing,Except Technical and Scien fic Products 732 877 145 +20% $29.13
Insurance Claims and Policy Processing Clerks 476 615 139 +29% $15.27
Economy Overview
Emsi Q4 2017 Data Set | www.economicmodeling.com 13

Workforce Characteris csTop Posted Occupa ons
Occupa on Jobs Change
0 200 400 600 800 1,000
First-Line Supervisors of Retail Sales Workers
Physicians and Surgeons, All Other
Registered Nurses
Retail Salespersons
Heavy and Tractor-Trailer Truck Drivers
Occupa on Jan 2017Unique Pos ngs Dec 2017Unique Pos ngs Jan 2017 - Dec 2017Avg. Unique 2016 Avg.Hourly EarningsHeavy and Tractor-Trailer Truck Drivers 686 1,170 775 $21.64Retail Salespersons 153 198 194 $11.64Registered Nurses 164 134 147 $33.47Physicians and Surgeons, All Other 62 125 97 $115.55First-Line Supervisors of Retail SalesWorkers 157 117 129 $18.04
Economy Overview
Emsi Q4 2017 Data Set | www.economicmodeling.com 14
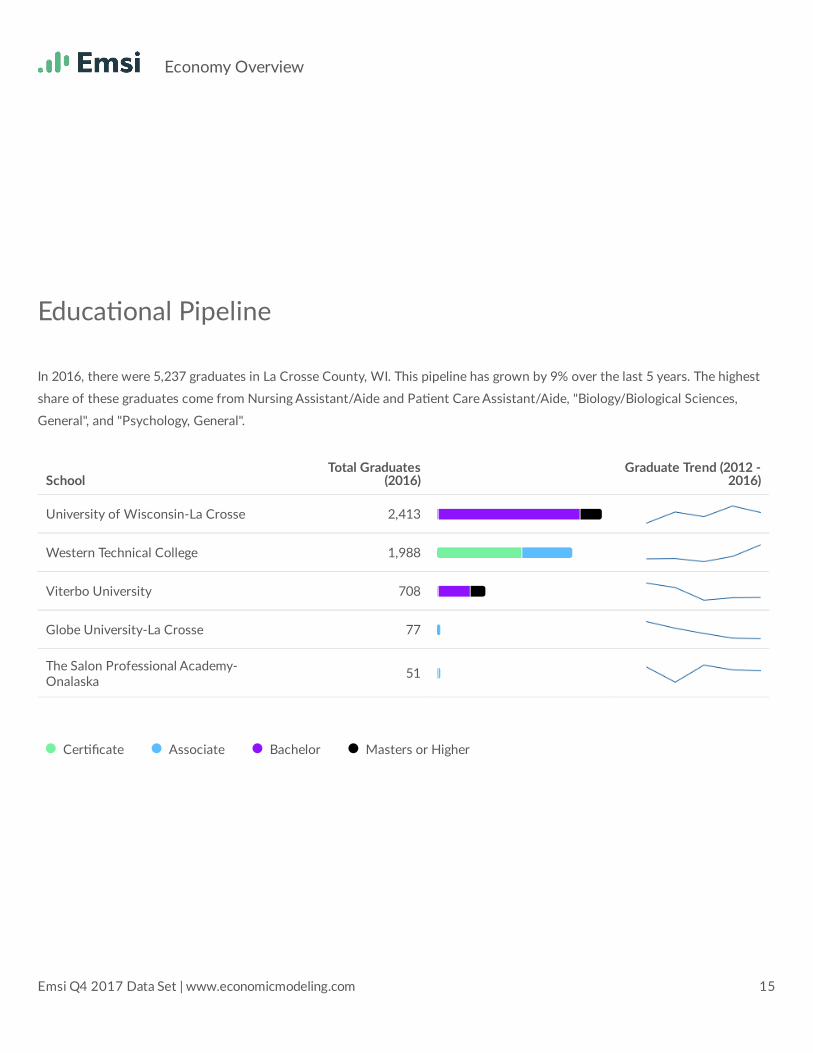
Educa onal PipelineIn 2016, there were 5,237 graduates in La Crosse County, WI. This pipeline has grown by 9% over the last 5 years. The highestshare of these graduates come from Nursing Assistant/Aide and Pa ent Care Assistant/Aide, "Biology/Biological Sciences,General", and "Psychology, General".
Cer ficate Associate Bachelor Masters or Higher
School Total Graduates(2016) Graduate Trend (2012 -2016)University of Wisconsin-La Crosse 2,413
Western Technical College 1,988
Viterbo University 708
Globe University-La Crosse 77
The Salon Professional Academy-Onalaska 51
Economy Overview
Emsi Q4 2017 Data Set | www.economicmodeling.com 15
Related Documents