nutrients Article L-Carnitine Tartrate Downregulates the ACE2 Receptor and Limits SARS-CoV-2 Infection Aouatef Bellamine 1, *, Tram N. Q. Pham 2 , Jaspreet Jain 2 , Jacob Wilson 3 , Kazim Sahin 4 , Frederic Dallaire 2 , Nabil G. Seidah 2 , Shane Durkee 1 , Katarina Radoševi´ c 5 and Éric A. Cohen 2,6, * Citation: Bellamine, A.; Pham, T.N.Q.; Jain, J.; Wilson, J.; Sahin, K.; Dallaire, F.; Seidah, N.G.; Durkee, S.; Radoševi´ c, K.; Cohen, É.A. L-Carnitine Tartrate Downregulates the ACE2 Receptor and Limits SARS-CoV-2 Infection. Nutrients 2021, 13, 1297. https://doi.org/10.3390/ nu13041297 Academic Editor: Carlo Agostoni and Gregorio Paolo Milani Received: 15 March 2021 Accepted: 12 April 2021 Published: 14 April 2021 Publisher’s Note: MDPI stays neutral with regard to jurisdictional claims in published maps and institutional affil- iations. Copyright: © 2021 by the authors. Licensee MDPI, Basel, Switzerland. This article is an open access article distributed under the terms and conditions of the Creative Commons Attribution (CC BY) license (https:// creativecommons.org/licenses/by/ 4.0/). 1 Lonza Consumer Health, Morristown, NJ 07960, USA; [email protected] 2 Institut de Recherche Clinique de Montreal, Montreal, QC H2W1R7, Canada; [email protected] (T.N.Q.P.); [email protected] (J.J.); [email protected] (F.D.); [email protected] (N.G.S.) 3 Applied Science and Performance Institute, Tampa, FL 33607, USA; [email protected] 4 Department of Animal Nutrition, Faculty of Veterinary Medicine, Firat University, Elazig 23119, Turkey; [email protected] 5 Biologics R&D, Lonza Pharma & Biotech, 4057 Basel, Switzerland; [email protected] 6 Department of Microbiology, Infectiology and Immunology, Université de Montréal, Montreal, QC H3T 1J4, Canada * Correspondence: [email protected] (A.B.); [email protected] (É.A.C.) Abstract: Severe acute respiratory syndrome coronavirus 2 (SARS-CoV-2) has been responsible for one of the worst pandemics in modern history. Several prevention and treatment strategies have been designed and evaluated in recent months either through the repurposing of existing treatments or the development of new drugs and vaccines. In this study, we show that L-carnitine tartrate supplementation in humans and rodents led to significant decreases of key host dependency factors, notably angiotensin-converting enzyme 2 (ACE2), transmembrane protease serine 2 (TMPRSS2), and Furin, which are responsible for viral attachment, viral spike S-protein cleavage, and priming for viral fusion and entry. Interestingly, pre-treatment of Calu-3, human lung epithelial cells, with L-carnitine tartrate led to a significant and dose-dependent inhibition of the infection by SARS-CoV-2. Infection inhibition coincided with a significant decrease in ACE2 mRNA expression levels. These data suggest that L-carnitine tartrate should be tested with appropriate trials in humans for the possibility to limit SARS-CoV-2 infection. Keywords: L-carnitine; SARS-CoV-2; COVID-19; exercise; inflammation; ACE-2; Furin; TMPRSS2 1. Introduction Severe acute respiratory syndrome coronavirus (SARS-CoV-1 and SARS-CoV-2) is responsible for the SARS epidemic from 2002 to 2004 and more recently for the coronavirus disease 2019 (COVID-19) pandemic outbreak initially detected in December 2019 in Wuhan China [1]. The rapid spread of the disease has affected more than 120 million people and caused over 2.6 million deaths in 220 countries as per mid-March of 2021 [2]. SARS-CoV-2 is an airborne virus that affects mainly the lungs and the upper respiratory system [2], leading ultimately to lung injury, respiratory distress, and death in severe cases. According to recent data released, there are 237 known vaccine candidates globally, of which 64 are in clinical evaluation and nine are in their phase III clinical stage [3,4]. A few vaccines starting with Pfizer-BioNTech and Moderna’s mRNA-based vaccines and more recently Johnson & Johnson’s single-shot adenovirus vector-based vaccine have been approved for adult use [5]. As a result of the urgency of the situation, accelerated clinical development paths have been followed [3,6] and resulted in decreased vaccine acceptance [6]. In addition to the vaccines, there are a number of other preventive and therapeutic strategies being developed, including antibodies [7,8] and antiviral drugs [9,10]. Nutrients 2021, 13, 1297. https://doi.org/10.3390/nu13041297 https://www.mdpi.com/journal/nutrients

Welcome message from author
This document is posted to help you gain knowledge. Please leave a comment to let me know what you think about it! Share it to your friends and learn new things together.
Transcript

nutrients
Article
L-Carnitine Tartrate Downregulates the ACE2 Receptor andLimits SARS-CoV-2 Infection
Aouatef Bellamine 1,*, Tram N. Q. Pham 2, Jaspreet Jain 2, Jacob Wilson 3, Kazim Sahin 4 , Frederic Dallaire 2,Nabil G. Seidah 2 , Shane Durkee 1, Katarina Radoševic 5 and Éric A. Cohen 2,6,*
�����������������
Citation: Bellamine, A.; Pham,
T.N.Q.; Jain, J.; Wilson, J.; Sahin, K.;
Dallaire, F.; Seidah, N.G.; Durkee, S.;
Radoševic, K.; Cohen, É.A.
L-Carnitine Tartrate Downregulates
the ACE2 Receptor and Limits
SARS-CoV-2 Infection. Nutrients 2021,
13, 1297. https://doi.org/10.3390/
nu13041297
Academic Editor: Carlo Agostoni and
Gregorio Paolo Milani
Received: 15 March 2021
Accepted: 12 April 2021
Published: 14 April 2021
Publisher’s Note: MDPI stays neutral
with regard to jurisdictional claims in
published maps and institutional affil-
iations.
Copyright: © 2021 by the authors.
Licensee MDPI, Basel, Switzerland.
This article is an open access article
distributed under the terms and
conditions of the Creative Commons
Attribution (CC BY) license (https://
creativecommons.org/licenses/by/
4.0/).
1 Lonza Consumer Health, Morristown, NJ 07960, USA; [email protected] Institut de Recherche Clinique de Montreal, Montreal, QC H2W1R7, Canada;
[email protected] (T.N.Q.P.); [email protected] (J.J.); [email protected] (F.D.);[email protected] (N.G.S.)
3 Applied Science and Performance Institute, Tampa, FL 33607, USA; [email protected] Department of Animal Nutrition, Faculty of Veterinary Medicine, Firat University, Elazig 23119, Turkey;
[email protected] Biologics R&D, Lonza Pharma & Biotech, 4057 Basel, Switzerland; [email protected] Department of Microbiology, Infectiology and Immunology, Université de Montréal,
Montreal, QC H3T 1J4, Canada* Correspondence: [email protected] (A.B.); [email protected] (É.A.C.)
Abstract: Severe acute respiratory syndrome coronavirus 2 (SARS-CoV-2) has been responsible forone of the worst pandemics in modern history. Several prevention and treatment strategies havebeen designed and evaluated in recent months either through the repurposing of existing treatmentsor the development of new drugs and vaccines. In this study, we show that L-carnitine tartratesupplementation in humans and rodents led to significant decreases of key host dependency factors,notably angiotensin-converting enzyme 2 (ACE2), transmembrane protease serine 2 (TMPRSS2),and Furin, which are responsible for viral attachment, viral spike S-protein cleavage, and primingfor viral fusion and entry. Interestingly, pre-treatment of Calu-3, human lung epithelial cells, withL-carnitine tartrate led to a significant and dose-dependent inhibition of the infection by SARS-CoV-2.Infection inhibition coincided with a significant decrease in ACE2 mRNA expression levels. Thesedata suggest that L-carnitine tartrate should be tested with appropriate trials in humans for thepossibility to limit SARS-CoV-2 infection.
Keywords: L-carnitine; SARS-CoV-2; COVID-19; exercise; inflammation; ACE-2; Furin; TMPRSS2
1. Introduction
Severe acute respiratory syndrome coronavirus (SARS-CoV-1 and SARS-CoV-2) isresponsible for the SARS epidemic from 2002 to 2004 and more recently for the coronavirusdisease 2019 (COVID-19) pandemic outbreak initially detected in December 2019 in WuhanChina [1]. The rapid spread of the disease has affected more than 120 million people andcaused over 2.6 million deaths in 220 countries as per mid-March of 2021 [2]. SARS-CoV-2is an airborne virus that affects mainly the lungs and the upper respiratory system [2],leading ultimately to lung injury, respiratory distress, and death in severe cases.
According to recent data released, there are 237 known vaccine candidates globally,of which 64 are in clinical evaluation and nine are in their phase III clinical stage [3,4]. Afew vaccines starting with Pfizer-BioNTech and Moderna’s mRNA-based vaccines andmore recently Johnson & Johnson’s single-shot adenovirus vector-based vaccine havebeen approved for adult use [5]. As a result of the urgency of the situation, acceleratedclinical development paths have been followed [3,6] and resulted in decreased vaccineacceptance [6]. In addition to the vaccines, there are a number of other preventive andtherapeutic strategies being developed, including antibodies [7,8] and antiviral drugs [9,10].
Nutrients 2021, 13, 1297. https://doi.org/10.3390/nu13041297 https://www.mdpi.com/journal/nutrients

Nutrients 2021, 13, 1297 2 of 13
The SARS-CoV-2 spike protein, which is the main target for the development ofvaccines and other therapeutics, mediates viral attachment to cells through binding tothe angiotensin-converting enzyme 2 (ACE2) receptor [11,12]. Upon cleavage of a spikeby cellular proteases including Furin and transmembrane protease serine 2 (TMPRSS2),the virus enters via a fusion process and replicates in certain target cells including lungepithelial cells [11,12]. In human airway cells, spike cleavage at the S1/S2 position byFurin and at the S2’ position by Furin and TMPRSS2 prime the viral protein and allowviral fusion and entry to occur [13,14]. These proteases are currently being investigated aspotential targets for a number of SARS-CoV-2 drug therapies [14].
The physiological role of ACE2 is to lower blood pressure and counteract inflammationby converting pro-inflammatory Angiotensin II to anti-inflammatory Angiotensin (1–7) [14].The conversion from Angiotensin I to Angiotensin II is mediated by ACE1. ACE inhibitorsare commonly prescribed and widely used in clinical practice as standard therapy, in monoor polytherapy, for the management of hypertension and heart failure [15]. Increased ACE1or decreased ACE2 may reflect an increased inflammatory state [16]. Therefore, shiftingthe balance toward a lower and hence a more anti-inflammatory ACE1/ACE2 ratio isessential when considering therapies targeting ACE2, particularly since a peaking in theinflammatory response and subsequent cytokine storm have been reported in advanceddiseased COVID-19 patients [17].
L-carnitine is an amino-acid-like molecule used mainly as a nutritional supplementfor a variety of health benefits [18–20]. L-carnitine’s basic role is to transport fatty acids tothe mitochondrial matrix, making them available for beta-oxidation and energy generationthrough the Krebs cycle [21]. It is also a powerful anti-oxidant and anti-inflammatorymediator [22,23]. At the tissue level, L-carnitine accumulates mainly in the muscle, heart,and lung tissues [24]. The elderly and people with chronic diseases (e.g., obesity, diabetes,hypertension, and cardiovascular diseases) exhibit significantly lower levels of L-carnitinein their tissues compared to the healthy population [25]. These compromised populationsare prone to having chronic inflammation, which is a condition that is shown to be mitigatedby L-carnitine supplementation [23]. In addition, L-carnitine has been shown to reduceACE1 levels in a hypertensive rodent model [26], and in the context of viral infections, itdecreases hepatitis C infection through an anti-lipogenic effect. L-carnitine tartrate has amore than 35-year of proven safety record and is even included in infant formula [24].
In this study, we evaluated the effect of L-carnitine on the expression of key hostdependency factors (HDF) in rodent and human tissues and assessed its impact on theSARS-CoV-2 infection. We demonstrate that L-carnitine decreases the levels of ACE2,TMPRSS2, and Furin in rodent tissues and human serum only following exercise-inducedinflammation. In lung epithelial cells, L-carnitine reduces the ACE2 levels and significantlylimits SARS-CoV-2 infection. These results suggest that L-carnitine may have beneficialeffects in mitigating SARS-CoV-2 infection in humans and that L-carnitine supplementa-tion merits further exploration, particularly for vulnerable populations prone to havinginflammation.
2. Materials and Methods2.1. Materials
L-carnitine tartrate under the form of CarnipureTM tartrate was provided by LonzaInc., Morristown, NJ, USA.
2.2. Cells
Cultured human airway epithelial cells (Calu-3) cells were obtained from the AmericanType culture Collection (ATCC) and maintained in 50% Dulbecco’s Modified Eagle Medium(DMEM) + 50% Ham’s F12 media supplemented with 10% Fetal Bovine Serum (FBS) and1% penicillin/streptomycin. Vero E6 cells were maintained in DMEM media supplementedwith 10% FBS and 1% penicillin/streptomycin [27].
Nutrients 2021, 13, 1297 3 of 13
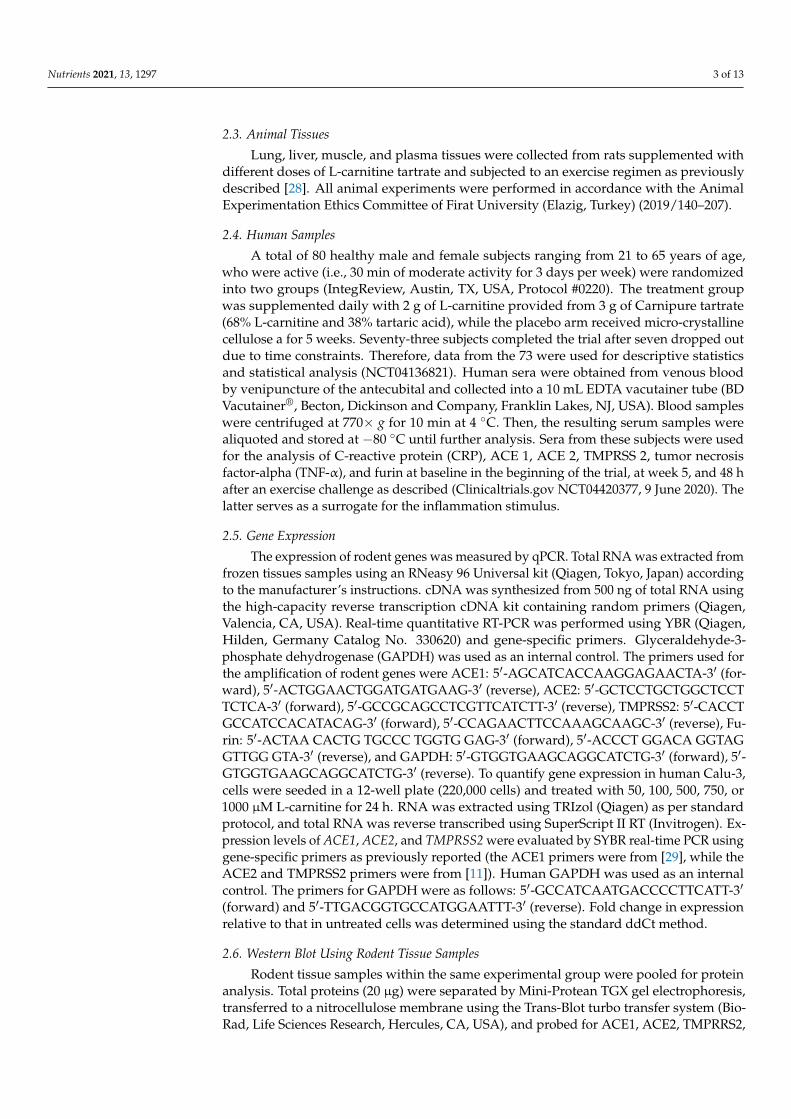
2.3. Animal Tissues
Lung, liver, muscle, and plasma tissues were collected from rats supplemented withdifferent doses of L-carnitine tartrate and subjected to an exercise regimen as previouslydescribed [28]. All animal experiments were performed in accordance with the AnimalExperimentation Ethics Committee of Firat University (Elazig, Turkey) (2019/140–207).
2.4. Human Samples
A total of 80 healthy male and female subjects ranging from 21 to 65 years of age,who were active (i.e., 30 min of moderate activity for 3 days per week) were randomizedinto two groups (IntegReview, Austin, TX, USA, Protocol #0220). The treatment groupwas supplemented daily with 2 g of L-carnitine provided from 3 g of Carnipure tartrate(68% L-carnitine and 38% tartaric acid), while the placebo arm received micro-crystallinecellulose a for 5 weeks. Seventy-three subjects completed the trial after seven dropped outdue to time constraints. Therefore, data from the 73 were used for descriptive statisticsand statistical analysis (NCT04136821). Human sera were obtained from venous bloodby venipuncture of the antecubital and collected into a 10 mL EDTA vacutainer tube (BDVacutainer®, Becton, Dickinson and Company, Franklin Lakes, NJ, USA). Blood sampleswere centrifuged at 770× g for 10 min at 4 ◦C. Then, the resulting serum samples werealiquoted and stored at −80 ◦C until further analysis. Sera from these subjects were usedfor the analysis of C-reactive protein (CRP), ACE 1, ACE 2, TMPRSS 2, tumor necrosisfactor-alpha (TNF-α), and furin at baseline in the beginning of the trial, at week 5, and 48 hafter an exercise challenge as described (Clinicaltrials.gov NCT04420377, 9 June 2020). Thelatter serves as a surrogate for the inflammation stimulus.
2.5. Gene Expression
The expression of rodent genes was measured by qPCR. Total RNA was extracted fromfrozen tissues samples using an RNeasy 96 Universal kit (Qiagen, Tokyo, Japan) accordingto the manufacturer’s instructions. cDNA was synthesized from 500 ng of total RNA usingthe high-capacity reverse transcription cDNA kit containing random primers (Qiagen,Valencia, CA, USA). Real-time quantitative RT-PCR was performed using YBR (Qiagen,Hilden, Germany Catalog No. 330620) and gene-specific primers. Glyceraldehyde-3-phosphate dehydrogenase (GAPDH) was used as an internal control. The primers used forthe amplification of rodent genes were ACE1: 5′-AGCATCACCAAGGAGAACTA-3′ (for-ward), 5′-ACTGGAACTGGATGATGAAG-3′ (reverse), ACE2: 5′-GCTCCTGCTGGCTCCTTCTCA-3′ (forward), 5′-GCCGCAGCCTCGTTCATCTT-3′ (reverse), TMPRSS2: 5′-CACCTGCCATCCACATACAG-3′ (forward), 5′-CCAGAACTTCCAAAGCAAGC-3′ (reverse), Fu-rin: 5′-ACTAA CACTG TGCCC TGGTG GAG-3′ (forward), 5′-ACCCT GGACA GGTAGGTTGG GTA-3′ (reverse), and GAPDH: 5′-GTGGTGAAGCAGGCATCTG-3′ (forward), 5′-GTGGTGAAGCAGGCATCTG-3′ (reverse). To quantify gene expression in human Calu-3,cells were seeded in a 12-well plate (220,000 cells) and treated with 50, 100, 500, 750, or1000 µM L-carnitine for 24 h. RNA was extracted using TRIzol (Qiagen) as per standardprotocol, and total RNA was reverse transcribed using SuperScript II RT (Invitrogen). Ex-pression levels of ACE1, ACE2, and TMPRSS2 were evaluated by SYBR real-time PCR usinggene-specific primers as previously reported (the ACE1 primers were from [29], while theACE2 and TMPRSS2 primers were from [11]). Human GAPDH was used as an internalcontrol. The primers for GAPDH were as follows: 5′-GCCATCAATGACCCCTTCATT-3′
(forward) and 5′-TTGACGGTGCCATGGAATTT-3′ (reverse). Fold change in expressionrelative to that in untreated cells was determined using the standard ddCt method.
2.6. Western Blot Using Rodent Tissue Samples
Rodent tissue samples within the same experimental group were pooled for proteinanalysis. Total proteins (20 µg) were separated by Mini-Protean TGX gel electrophoresis,transferred to a nitrocellulose membrane using the Trans-Blot turbo transfer system (Bio-Rad, Life Sciences Research, Hercules, CA, USA), and probed for ACE1, ACE2, TMPRRS2,

Nutrients 2021, 13, 1297 4 of 13
and Furin using specific primary antibodies (Santa Cruz Biotechnology, Inc., Dallas, TX,USA). Immunoreactive signals were revealed using horseradish peroxidase-conjugatedgoat anti-rabbit (Santa Cruz Biotechnology, Inc., Dallas, TX, USA) or goat anti-mouse(Santa Cruz Biotechnology, Inc., Dallas, TX, USA). β-actin was used as an internal control(Santa Cruz Biotechnology, Inc., Dallas, TX, USA). The levels of serum C-reactive protein(CRP) and interleukin 6 (IL-6) were determined using commercially available enzyme-linked immunosorbent assay (ELISA) kits (Abcam, Cambridge, MA, USA) according tothe manufacturer instructions and microplate reader (Bio-Tek Elx800 Universal, Bio-TekInstruments, Inc., Winooski, VT, USA).
2.7. ELISA for Human Sera and L-Carnitine Analysis
Human ACE1, ACE2, TMPRSS2, and Furin protein levels were assessed in humansera using commercially available ELISA kits, according to the manufacturer’s recom-mendations: ACE1 (R&D Systems Inc., Minneapolis, MN, USA), ACE2 (RayBiotech Inc.,Peachtree Corners, GA, USA), TMPRSS2 (Novus Biologicals, Littleton, CO, USA), CRP(R&D Systems Inc., Minneapolis, MN, USA), TNF-α (Novus Biologicals), and Furin (SigmaAldrich, St. Louis, MO, USA). Total, free, and acetyl-carnitine from serum samples wereanalyzed by HPLC with UV detection according to the manufacturer’s recommendations(Sigma Aldrich, St. Louis, MO, USA).
2.8. Effect of L-Carnitine on Cell Viability
Calu-3 cells seeded in a 96-well plate (30,000 cells) were treated with 50, 100, 250,500, 1000 µM, and 10 mM L-carnitine provided as CarnipureTM tartrate. At 24 h, 48 h,or 72 h post-treatment, media was removed, and cells were subjected to a standard MTTassay according to the manufacturer’s recommendation (Invitrogen; Cat # M6494). Cellstreated with vehicle alone were used as a negative control. Absorbance was read at 595 nmusing a microplate spectrophotometer. CC50 was calculated by non-linear regression usingGraphPad Prism V5.0 software (GraphPad Software, Inc., San Diego, CA, USA).
2.9. SARS-CoV-2
SARS-CoV-2 virus was originally isolated from a COVID-19 patient in Quebec, Canadaand is designated as LSPQ1 variant. The patient virus was amplified and tittered in VeroE6 using plaque assays. All experiments involving infectious SARS-CoV-2 virus wereperformed in the designated areas of the Biosafety level 3 laboratory previously approvedfor SARS-CoV-2 work.
2.10. Plaque Assays in Vero E6
Vero E6 cells (1.2 × 10⁵ cells/well) were seeded in quadruplicates in 24-well tissueculture plates in Dulbecco’s Modified Eagle Medium (DMEM) supplemented with 10% FBS36 h before infection. Cells were infected with up to six ten-fold serial dilutions (10−2–10−6)of viral supernatant containing SARS-CoV-2 for 1 h at 37 ◦C (200 µL infection volume).The plates were manually rocked every 15 min during the 1 h period. Subsequently, thevirus was removed, cells were washed, and overlaying media (containing 0.6% low meltagarose in DMEM with 10% FBS) was added and incubated undisturbed for 60–65 h at37 ◦C. Post incubation, cells were fixed with 4% formaldehyde and stained with 0.25%crystal violet (prepared in 30% methanol). High-quality plaque pictures were taken usinga high-resolution DLSR camera (Nikon model: D80, objective: AF Micro-Nikkor 60 mmf/2.8D). Plaques were counted manually and in parallel, imaged plaque plates wereprocessed, and plaques were enumerated using an automated algorithm-based Matlabsoftware (developed by the Microscopy platform at the IRCM). Virus titer is expressed asplaque-forming units per ml (PFU/mL, number of plaques × dilution factor of the virus× 1000/volume of virus dilution used for infection (in µL). Multiplicity of infection (MOI)is expressed as: MOI = PFU of virus was used for infection/number of cells.

Nutrients 2021, 13, 1297 5 of 13
2.11. Effect of L-Carnitine on Cell Infections with SARS-CoV-2
Calu-3 cells were seeded in duplicates in 12-well plates (2.3 × 10⁵ cells/well) andincubated overnight. Cells were pre-treated with various concentrations (0.05–1 mM) ofL-carnitine, vehicle alone (DMSO) or 1000 U/mL IFNα-2a for up to 24 h. Thereafter, thecells were infected with SARS-CoV-2 virus at MOI 0.01 and 0.1 for 3 h in 350 µL of serum-free DMEM at 37 ◦C with the occasional manual rocking of plates. Cells plus media onlywere used as a control. After incubation, the virus was removed, and the cell monolayerwas washed twice successively with PBS and serum-free DMEM. Fresh media (total 1 mL)containing the aforementioned concentrations of L-carnitine was subsequently added tocells. Cell-free supernatant (250 µL) was removed at 12 h, 24 h, and 48 h post-infection.L-carnitine and IFN-2a were replenished at 24 h post-infection. The virus supernatantswere stored at −80 ◦C until further use. Viral production in the supernatant was quantifiedusing a plaque assay on Vero E6 cells as described above. Virus titers (PFU/mL), quantifiedby the plaque assay done in triplicates, were expressed as mean ± standard deviation.
The percentage of plaques in the presence of L-carnitine was expressed relative tothe virus alone group, which was set at 100%. Data were fit using a non-linear regressionmodel, and the equation log inhibitor vs. variable slope (four parameters) was used todetermine the half-maximal inhibitory concentration (IC50) values in GraphPad Prism V5.0software (GraphPad Software, Inc., San Diego, CA, USA).
2.12. Statistical Analysis
To analyze human serum markers, dependent variables were scrutinized using atwo-way mixed analysis of variance (ANOVA) with the condition as the between-groupfactor (L-carnitine vs. placebo), time as the within-group factor (baseline, week-5 pre- and48 h post-exercise challenge), and subjects as a random factor. Whenever a significantF-value was obtained, post-hoc testing was performed with a Bonferroni correction formultiple comparisons. For ANOVA procedures, homogeneity of variances and covarianceswere confirmed by Levene’s test and Box’s M test, respectively. Additionally, Mauchly’stest of sphericity was used to test the assumption of sphericity for two-way interactions.For all analyses, the alpha level was set a priori at p < 0.05. Data were presented asmean ± standard error unless otherwise stated. ANOVA and Turkey’s post-hoc test wereused to compare the marker changes in the rodent tissue testing. Where appropriate, non-parametric Mann–Whitney’s U-tests (two-tailed) were used to compare ranks between twotreatment groups. Human and Calu-3 experiments were analyzed using GraphPad Prism(Prism, San Diego, CA, USA, Version 5 for Calu-3 and Version 8 for human biomarkers)and rodent data by SPSS statistical program (IBM, SPPS Version 21, Armonk, New York:IBM Corp, Armonk, NY, USA).
3. Results3.1. Expression Levels of ACE1, ACE2, TMPRSS2, and Furin in Rodent Tissues
Rodents subjected to a high level training exercise (which serves as an inflammatorystimulus) were supplemented with different doses of L-carnitine by oral gavage for aperiod of 6 weeks as previously described [28]. The L-carnitine doses used 25, 50, 100, 200and 400 mg/kg correspond to human doses of 250, 500, 1000, 2000 and 4000 mg per day,respectively. mRNA levels of ACE1, ACE2, TMPRSS2 and Furin were evaluated in the lung,muscle, and liver tissues (Figure 1A–D, Supplementary Figure S1). Compared to controlwithout exercise, the exercise control group showed a statistically significant increase inACE2, TMPRSS2, and Furin mRNA levels in all tissues (Figure 1A–D, SupplementaryFigure S1, about 2 to 3-fold for ACE2 and TMPRSS2 and 1.5 to 2-fold for Furin dependingon the tissue). L-carnitine supplementation led to a dose-dependent decrease in ACE2,TMPRSS2 and Furin levels with a maximum effect at the 200 mg/kg dose when comparedto the non-exercise levels. ACE1 significantly decreased with exercise and slightly increasedwith L-carnitine supplementation when combined with exercise and as compared to theexercise control, albeit not reaching the control levels (Figure 1A, Supplementary Figure S1).

Nutrients 2021, 13, 1297 6 of 13
The protein level assessment mimicked the mRNA effects and showed an increase ofACE2, TMPRSS2, and Furin with exercise and a return to close to the baseline controlwith L-carnitine supplementation with a maximum effect at 200 mg/kg (Figure 1F–H,Supplementary Figure S2). ACE1 protein levels showed a similar pattern as the mRNA,with a decrease with exercise and an increase with the L-carnitine in the lung, but alsoin the liver and muscle tissues (Figure 1E, Supplementary Figure S2). In addition, and tocompare to the human biomarker data, we also assessed these markers in the sera. Figure 2shows that L-carnitine supplementation led to 40% to 50% decrease in ACE1, ACE2, andTMPRSS2 proteins when added to an exercise regimen (Figure 2). The serum ACE1/ACE2ratio was significantly decreased with exercise, and L-carnitine supplementation partlyrestored this ratio (Figure 2). ACE2, TMPRSS2, and Furin increased and ACE1 decreasedupon exercise. These changes coincided with an increased inflammation as determined byCRP and IL-6 inflammatory marker measurements by ELISA during exercise, as shown inFigure 2E,F. L-carnitine supplementation decreased the exercise-induced inflammation asshown by a decrease in CRP and IL-6. The decrease in inflammation by L-carnitine wasalso observed even without exercise (Figure 2E,F).
Nutrients 2021, 13, × FOR PEER REVIEW 6 of 13
control without exercise, the exercise control group showed a statistically significant in-
crease in ACE2, TMPRSS2, and Furin mRNA levels in all tissues (Figure 1A–D, Supple-
mentary Figure S1, about 2 to 3-fold for ACE2 and TMPRSS2 and 1.5 to 2-fold for Furin
depending on the tissue). L-carnitine supplementation led to a dose-dependent decrease
in ACE2, TMPRSS2 and Furin levels with a maximum effect at the 200 mg/kg dose when
compared to the non-exercise levels. ACE1 significantly decreased with exercise and
slightly increased with L-carnitine supplementation when combined with exercise and as
compared to the exercise control, albeit not reaching the control levels (Figure 1A, Sup-
plementary Figure S1). The protein level assessment mimicked the mRNA effects and
showed an increase of ACE2, TMPRSS2, and Furin with exercise and a return to close to
the baseline control with L-carnitine supplementation with a maximum effect at 200
mg/kg (Figure 1F–H, Supplementary Figure S2). ACE1 protein levels showed a similar
pattern as the mRNA, with a decrease with exercise and an increase with the L-carnitine
in the lung, but also in the liver and muscle tissues (Figure 1E, Supplementary Figure S2).
In addition, and to compare to the human biomarker data, we also assessed these markers
in the sera. Figure 2 shows that L-carnitine supplementation led to 40% to 50% decrease
in ACE1, ACE2, and TMPRSS2 proteins when added to an exercise regimen (Figure 2).
The serum ACE1/ACE2 ratio was significantly decreased with exercise, and L-carnitine
supplementation partly restored this ratio (Figure 2). ACE2, TMPRSS2, and Furin in-
creased and ACE1 decreased upon exercise. These changes coincided with an increased
inflammation as determined by CRP and IL-6 inflammatory marker measurements by
ELISA during exercise, as shown in Figure 2E,F. L-carnitine supplementation decreased
the exercise-induced inflammation as shown by a decrease in CRP and IL-6. The decrease
in inflammation by L-carnitine was also observed even without exercise (Figure 2E,F).
Figure 1. Effect of L-carnitine on the expression of angiotensin-converting enzyme 1 (ACE1), angi-
otensin-converting enzyme 2 (ACE2), transmembrane protease serine 2 (TMPRSS2), and Furin in
rodent lungs. Fold change in the mRNA and protein levels relative to that in the control group:
ACE1 (A), ACE2 (B), TMPRSS2 (C), and Furin (D) mRNA levels and their respective proteins (E–
H). Protein expression was normalized to that of -actin. Statistical comparisons are indicated with
different superscripts (a–d); in the plots (p < 0.05, ANOVA, and Tukey’s post-hoc test). Different
letters indicate statistical differences. Shown are mean ± SD of three independent analyses. Control
groups: Car: L-carnitine; Ex: Exercise.
Contr
ol
Car
200 Ex
Ex+Car
25
Ex+Car
50
EX+CAR 1
00
Ex+Car
200
Ex+Car
400
0.0
0.5
1.0
1.5
AC
E1, F
old
ch
an
ge a
e
b
cc
de cdde
Cont
rol
Car 2
00 Ex
Ex+Car
25
Ex+Car
50
EX+CAR 1
00
Ex+Car
200
Ex+Car
400
0.0
0.5
1.0
1.5
2.0
2.5
AC
E2, F
old
ch
an
ge a
ab abbc
cd d
e e
Contro
l
Car
200 Ex
Ex+Car
25
Ex+Car
50
EX+CAR
100
Ex+Car
200
Ex+Car
400
0.0
0.5
1.0
1.5
2.0
TM
PR
SS
2, F
old
ch
an
ge
aab
bbc
cdd
ee
Contro
l
Car
200 Ex
Ex+Car
25
Ex+Car
50
EX+CAR
100
Ex+Car
200
Ex+Car
400
0.0
0.5
1.0
1.5
2.0
2.5
Fu
rin
, F
old
ch
an
ge
a a
b
ab
cc
d d
Contro
l
Car 2
00 Ex
Ex+Car
25
Ex+Car
50
EX+CAR 1
00
Ex+Car
200
Ex+Car
400
0
50
100
150
AC
E1
, p
erc
en
t o
f c
on
tro
l
-Actin
ACE1
aab
d
b
c cc
d
Control
Car
200 Ex
Ex+Car
25
Ex+Car
50
EX+CAR
100
Ex+Car
200
Ex+Car
400
0
100
200
300
AC
E2
, p
erc
en
t o
f co
ntr
ol
-Actin
ACE2
a a
d
b
bccd
d
bc
Control
Car
200 Ex
Ex+Car
25
Ex+Car
50
EX+CAR
100
Ex+Car
200
Ex+Car
400
0
50
100
150
200
250
TM
PR
SS
2,
pe
rce
nt
of
co
ntr
ol
-Actin
TMPRSS2
aa
d
bb
cc
d
Con
trol
Car 2
00 Ex
Ex+Car
25
Ex+Car
50
EX+CAR 1
00
Ex+Car
200
Ex+Car
400
0
100
200
300
Fu
rin
, p
erc
en
t o
f c
on
tro
l
-Actin
Furin
a
cd
b
c cc
d d
A B
E F
C
G
D
H
Figure 1. Effect of L-carnitine on the expression of angiotensin-converting enzyme 1 (ACE1), angiotensin-convertingenzyme 2 (ACE2), transmembrane protease serine 2 (TMPRSS2), and Furin in rodent lungs. Fold change in the mRNA andprotein levels relative to that in the control group: ACE1 (A), ACE2 (B), TMPRSS2 (C), and Furin (D) mRNA levels and theirrespective proteins (E–H). Protein expression was normalized to that of β-actin. Statistical comparisons are indicated withdifferent superscripts (a–d); in the plots (p < 0.05, ANOVA, and Tukey’s post-hoc test). Different letters indicate statisticaldifferences. Shown are mean ± SD of three independent analyses. Control groups: Car: L-carnitine; Ex: Exercise.
3.2. Serum ACE1, ACE2, TMPRSS2, Furin, CRP, and TNF-α in Humans
To assess the effects of L-carnitine on different biomarkers, sera from 73 participantsof the human trial were collected at baseline, after 5 weeks of supplementation and 48 hafter exercise challenge. Figure 3A shows that neither exercise nor L-carnitine aloneaffected ACE1 serum levels. On the contrary, the exercise significantly increased thelevels of ACE2, Furin, and TMPRSS2 in placebo-treated participants, while in the L-carnitine-treated participants, protein levels remained comparable to the baseline levelsbefore exercise (Figure 3B–D). Post-hoc analysis confirmed that ACE2, TMPRSS2, andFurin rose at 48 h after the exercise challenge compared to baseline and at week 5 in theplacebo but not in the L-carnitine treated group. The difference between the groups wassignificant (Figure 2B–D). Even though there was a significant increase in ACE2 uponexercise without L-carnitine treatment and no change in ACE1 level, the change in the

Nutrients 2021, 13, 1297 7 of 13
overall ACE1/ACE2 ratio did not reach statistical significance for either group (Figure 3E).The post-hoc analysis revealed that at 5 weeks post-exercise, CRP levels were significantlylower in the L-carnitine-treated group as compared to the placebo-treated group or baselinebefore exercise (Figure 3F). Neither exercise nor L-carnitine supplementation had an impacton TNF-α levels. All the observed effects were correlated to L-carnitine supplementation.Acetyl-free and total serum carnitine levels increased significantly with supplementation(Supplementary Figure S3).
Nutrients 2021, 13, × FOR PEER REVIEW 7 of 13
Contr
ol
Car
200 Ex
Ex+Car
25
Ex+Car
50
EX+CAR 1
00
Ex+Car
200
Ex+Car
400
0
1
2
3
4
5
6
aa
bb
c
cdcdcd
Contr
ol
Car
200 Ex
Ex+Car
25
Ex+Car
50
EX+CAR 1
00
Ex+Car
200
Ex+Car
400
0
2
4
6
8
10
12a
bc
de de
ff
Control
Car
200 Ex
Ex+Car
25
Ex+Car
50
EX+CAR 1
00
Ex+Car
200
Ex+Car
400
0.0
0.2
0.4
0.6
0.8
1.0
1.2
1.4
b
a
cc
d
eee
Cont
rol
Car
200 Ex
Ex+Car
25
Ex+Car
50
EX+CAR 1
00
Ex+Car
200
Ex+Car
400
0
2
4
6
8
10
aab
bccd
de de
e e
Contr
ol
Car
200 Ex
Ex+Car
25
Ex+Car
50
EX+CAR 1
00
Ex+Car
200
Ex+Car
400
20
25
30
35
40
a
ab
c
ab ab
abcbc
c
Control
Car
200 Ex
Ex+Car
25
Ex+Car
50
EX+CAR 100
Ex+Car
200
Ex+Car
400
35
40
45
50
55
a
d
a ab
bc
c
abab
Figure 2. : Serum protein levels of ACE1 (A), ACE2 (B), ACE1/ACE2 ratio (C), TMPRSS2 (D), C-
reactive protein (CRP) (E), and interleukin 6 (IL-6) (F) in rodents. Statistical comparisons are indi-
cated with different superscripts (a–f); in the plots (p < 0.05, ANOVA, and Tukey’s post-hoc test).
Different letters indicate statistical differences. Shown are mean ± SD of three independent anal-
yses. Control groups: Car: L-carnitine; Ex: Exercise.
3.2. Serum ACE1, ACE2, TMPRSS2, Furin, CRP, and TNF-α in Humans
To assess the effects of L-carnitine on different biomarkers, sera from 73 participants
of the human trial were collected at baseline, after 5 weeks of supplementation and 48 h
after exercise challenge. Figure 3A shows that neither exercise nor L-carnitine alone af-
fected ACE1 serum levels. On the contrary, the exercise significantly increased the levels
of ACE2, Furin, and TMPRSS2 in placebo-treated participants, while in the L-carnitine-
treated participants, protein levels remained comparable to the baseline levels before ex-
ercise (Figure 3B–D). Post-hoc analysis confirmed that ACE2, TMPRSS2, and Furin rose at
48 h after the exercise challenge compared to baseline and at week 5 in the placebo but not
in the L-carnitine treated group. The difference between the groups was significant (Fig-
ure 2B–D). Even though there was a significant increase in ACE2 upon exercise without
L-carnitine treatment and no change in ACE1 level, the change in the overall ACE1/ACE2
ratio did not reach statistical significance for either group (Figure 3E). The post-hoc anal-
ysis revealed that at 5 weeks post-exercise, CRP levels were significantly lower in the L-
carnitine-treated group as compared to the placebo-treated group or baseline before exer-
cise (Figure 3F). Neither exercise nor L-carnitine supplementation had an impact on TNF-
α levels. All the observed effects were correlated to L-carnitine supplementation. Acetyl-
free and total serum carnitine levels increased significantly with supplementation (Sup-
plementary Figure S3).
Figure 2. Serum protein levels of ACE1 (A), ACE2 (B), ACE1/ACE2 ratio (C), TMPRSS2 (D), C-reactive protein (CRP) (E), and interleukin 6 (IL-6) (F) in rodents. Statistical comparisons are indicatedwith different superscripts (a–f); in the plots (p < 0.05, ANOVA, and Tukey’s post-hoc test). Differentletters indicate statistical differences. Shown are mean ± SD of three independent analyses. Controlgroups: Car: L-carnitine; Ex: Exercise.
Nutrients 2021, 13, x. https://doi.org/10.3390/xxxxx www.mdpi.com/journal/nutrients
Figure 3. Effect of L-carnitine on serum levels of ACE1, ACE2, TMPRSS2, Furin, CRP, and tumor necrosis factor-alpha (TNF-α) in humans. Serum concentrations of ACE1 (A), ACE2 (B), TMPRSS2 (C), Furin (D), ACE1/ACE2 ratio (E), CRP (F), and TNF-α (G) in L-carnitine supplemented (CAR, black bars) or placebo (PLA, gray bars) group at baseline [30], after 5 weeks of supplementation (Wk5-pre) and 48 h after an ex-ercise challenge (Wk5 Post). A significant difference (p < 0.05) is indicated, a: different than baseline, b: different than pre-exercise, c: different than post-exercise, d: different between groups.
Figure 3. Effect of L-carnitine on serum levels of ACE1, ACE2, TMPRSS2, Furin, CRP, and tumornecrosis factor-alpha (TNF-α) in humans. Serum concentrations of ACE1 (A), ACE2 (B), TMPRSS2 (C),Furin (D), ACE1/ACE2 ratio (E), CRP (F), and TNF-α (G) in L-carnitine supplemented (CAR, blackbars) or placebo (PLA, gray bars) group at baseline [30], after 5 weeks of supplementation (Wk5-pre)and 48 h after an exercise challenge (Wk5 Post). A significant difference (p < 0.05) is indicated,a: different than baseline, b: different than pre-exercise, c: different than post-exercise, d: differentbetween groups.
Nutrients 2021, 13, 1297 8 of 13
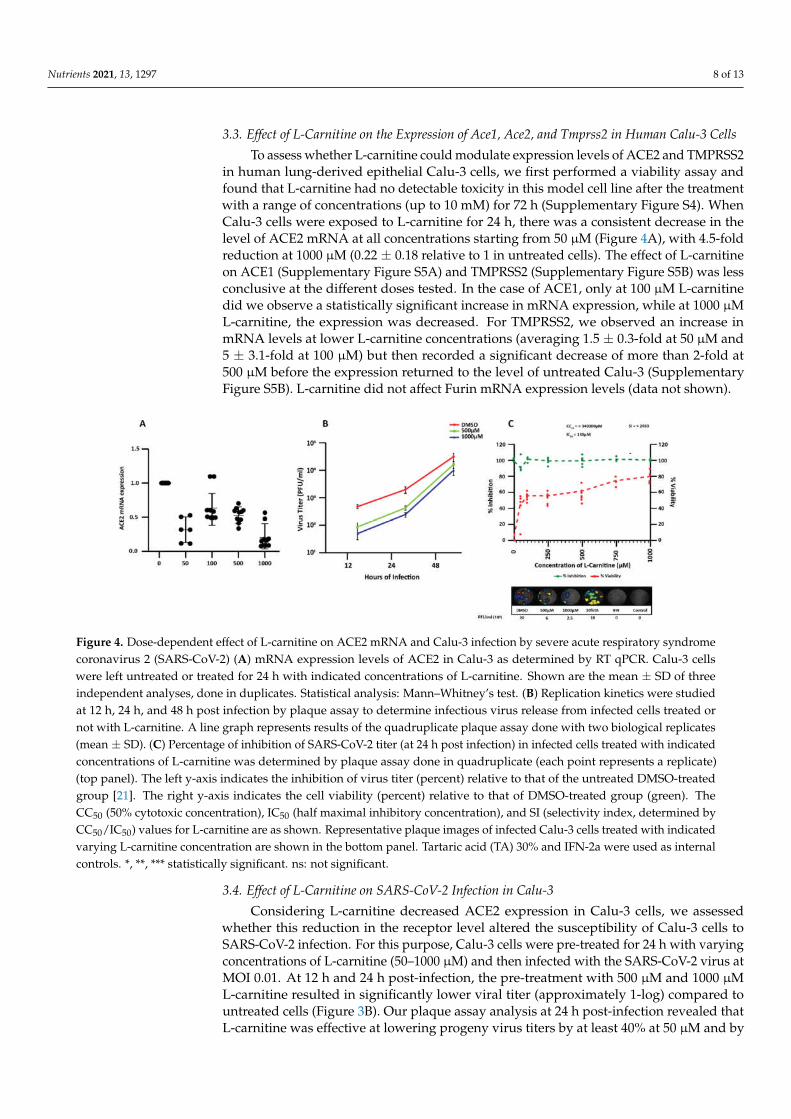
3.3. Effect of L-Carnitine on the Expression of Ace1, Ace2, and Tmprss2 in Human Calu-3 Cells
To assess whether L-carnitine could modulate expression levels of ACE2 and TMPRSS2in human lung-derived epithelial Calu-3 cells, we first performed a viability assay andfound that L-carnitine had no detectable toxicity in this model cell line after the treatmentwith a range of concentrations (up to 10 mM) for 72 h (Supplementary Figure S4). WhenCalu-3 cells were exposed to L-carnitine for 24 h, there was a consistent decrease in thelevel of ACE2 mRNA at all concentrations starting from 50 µM (Figure 4A), with 4.5-foldreduction at 1000 µM (0.22 ± 0.18 relative to 1 in untreated cells). The effect of L-carnitineon ACE1 (Supplementary Figure S5A) and TMPRSS2 (Supplementary Figure S5B) was lessconclusive at the different doses tested. In the case of ACE1, only at 100 µM L-carnitinedid we observe a statistically significant increase in mRNA expression, while at 1000 µML-carnitine, the expression was decreased. For TMPRSS2, we observed an increase inmRNA levels at lower L-carnitine concentrations (averaging 1.5 ± 0.3-fold at 50 µM and5 ± 3.1-fold at 100 µM) but then recorded a significant decrease of more than 2-fold at500 µM before the expression returned to the level of untreated Calu-3 (SupplementaryFigure S5B). L-carnitine did not affect Furin mRNA expression levels (data not shown).
Nutrients 2021, 13, × FOR PEER REVIEW 9 of 13
Figure 4. Dose-dependent effect of L-carnitine on ACE2 mRNA and Calu-3 infection by severe acute respiratory syndrome
coronavirus 2 (SARS-CoV-2) (A) mRNA expression levels of ACE2 in Calu-3 as determined by RT qPCR. Calu-3 cells were
left untreated or treated for 24 h with indicated concentrations of L-carnitine. Shown are the mean ± SD of three independ-
ent analyses, done in duplicates. Statistical analysis: Mann–Whitney’s test. (B) Replication kinetics were studied at 12 h,
24 h, and 48 h post infection by plaque assay to determine infectious virus release from infected cells treated or not with
L-carnitine. A line graph represents results of the quadruplicate plaque assay done with two biological replicates (mean ±
SD). (C) Percentage of inhibition of SARS-CoV-2 titer (at 24 h post infection) in infected cells treated with indicated con-
centrations of L-carnitine was determined by plaque assay done in quadruplicate (each point represents a replicate) (top
panel). The left y-axis indicates the inhibition of virus titer (percent) relative to that of the untreated DMSO-treated group
[21]. The right y-axis indicates the cell viability (percent) relative to that of DMSO-treated group (green). The CC50 (50%
cytotoxic concentration), IC50 (half maximal inhibitory concentration), and SI (selectivity index, determined by CC50/IC50)
values for L-carnitine are as shown. Representative plaque images of infected Calu-3 cells treated with indicated varying
L-carnitine concentration are shown in the bottom panel. Tartaric acid (TA) 30% and IFN-2a were used as internal controls.
*, **, *** statistically significant. ns: not significant.
3.4. Effect of L-Carnitine on SARS-CoV-2 Infection in Calu-3
Considering L-carnitine decreased ACE2 expression in Calu-3 cells, we assessed
whether this reduction in the receptor level altered the susceptibility of Calu-3 cells to
SARS-CoV-2 infection. For this purpose, Calu-3 cells were pre-treated for 24 h with vary-
ing concentrations of L-carnitine (50–1000 µM) and then infected with the SARS-CoV-2
virus at MOI 0.01. At 12 h and 24 h post-infection, the pre-treatment with 500 µM and 1000
µM L-carnitine resulted in significantly lower viral titer (approximately 1-log) compared
to untreated cells (Figure 3B). Our plaque assay analysis at 24 h post-infection revealed
that L-carnitine was effective at lowering progeny virus titers by at least 40% at 50 µM
and by up to about 80% at 1000 µM (Figure 4C) to give IC50 of 138 µM and a selectivity
index (SI) of greater than 2463 [31] (Figure 4C).
Overall, the results demonstrate that L-carnitine treatment significantly impairs the
susceptibility of Calu-3 cells to SARS-CoV-2 infection, which is most likely through de-
creasing the expression of viral receptor ACE2 on the cell surface.
4. Discussion
The purpose of the present study was to investigate the impact of L-carnitine supple-
mentation on levels of host factors critical for viral entry and pathogenesis (ACE2,
TMPRSS2, Furin, ACE1/ACE2 ratio) as well as its effect on SARS-CoV-2 infection in a
Calu-3 cell model. First, we found that ACE2, TMPRSS2, and Furin levels in serum and
tissues were decreased significantly by L-carnitine but only following exercise-induced
inflammation. This decrease coincided with the attenuation of inflammation as shown by
decreased CRP levels in rodent and human serum. Then, we assessed the effects of pre-
treatment with L-carnitine on SARS-CoV-2 infection in Calu-3, which is a human lung-
derived epithelial cell line. We found that L-carnitine pre-treatment decreased Calu-3 sus-
ceptibility to infection by SARS-CoV-2, which is most likely through the decrease of viral
receptor ACE2 expression and diminished viral attachment. However, in Calu-3, pre-
Figure 4. Dose-dependent effect of L-carnitine on ACE2 mRNA and Calu-3 infection by severe acute respiratory syndromecoronavirus 2 (SARS-CoV-2) (A) mRNA expression levels of ACE2 in Calu-3 as determined by RT qPCR. Calu-3 cellswere left untreated or treated for 24 h with indicated concentrations of L-carnitine. Shown are the mean ± SD of threeindependent analyses, done in duplicates. Statistical analysis: Mann–Whitney’s test. (B) Replication kinetics were studiedat 12 h, 24 h, and 48 h post infection by plaque assay to determine infectious virus release from infected cells treated ornot with L-carnitine. A line graph represents results of the quadruplicate plaque assay done with two biological replicates(mean ± SD). (C) Percentage of inhibition of SARS-CoV-2 titer (at 24 h post infection) in infected cells treated with indicatedconcentrations of L-carnitine was determined by plaque assay done in quadruplicate (each point represents a replicate)(top panel). The left y-axis indicates the inhibition of virus titer (percent) relative to that of the untreated DMSO-treatedgroup [21]. The right y-axis indicates the cell viability (percent) relative to that of DMSO-treated group (green). TheCC50 (50% cytotoxic concentration), IC50 (half maximal inhibitory concentration), and SI (selectivity index, determined byCC50/IC50) values for L-carnitine are as shown. Representative plaque images of infected Calu-3 cells treated with indicatedvarying L-carnitine concentration are shown in the bottom panel. Tartaric acid (TA) 30% and IFN-2a were used as internalcontrols. *, **, *** statistically significant. ns: not significant.
3.4. Effect of L-Carnitine on SARS-CoV-2 Infection in Calu-3
Considering L-carnitine decreased ACE2 expression in Calu-3 cells, we assessedwhether this reduction in the receptor level altered the susceptibility of Calu-3 cells toSARS-CoV-2 infection. For this purpose, Calu-3 cells were pre-treated for 24 h with varyingconcentrations of L-carnitine (50–1000 µM) and then infected with the SARS-CoV-2 virus atMOI 0.01. At 12 h and 24 h post-infection, the pre-treatment with 500 µM and 1000 µML-carnitine resulted in significantly lower viral titer (approximately 1-log) compared tountreated cells (Figure 3B). Our plaque assay analysis at 24 h post-infection revealed thatL-carnitine was effective at lowering progeny virus titers by at least 40% at 50 µM and by

Nutrients 2021, 13, 1297 9 of 13
up to about 80% at 1000 µM (Figure 4C) to give IC50 of 138 µM and a selectivity index (SI)of greater than 2463 [31] (Figure 4C).
Overall, the results demonstrate that L-carnitine treatment significantly impairs thesusceptibility of Calu-3 cells to SARS-CoV-2 infection, which is most likely through de-creasing the expression of viral receptor ACE2 on the cell surface.
4. Discussion
The purpose of the present study was to investigate the impact of L-carnitine sup-plementation on levels of host factors critical for viral entry and pathogenesis (ACE2,TMPRSS2, Furin, ACE1/ACE2 ratio) as well as its effect on SARS-CoV-2 infection in aCalu-3 cell model. First, we found that ACE2, TMPRSS2, and Furin levels in serum andtissues were decreased significantly by L-carnitine but only following exercise-inducedinflammation. This decrease coincided with the attenuation of inflammation as shownby decreased CRP levels in rodent and human serum. Then, we assessed the effects ofpre-treatment with L-carnitine on SARS-CoV-2 infection in Calu-3, which is a humanlung-derived epithelial cell line. We found that L-carnitine pre-treatment decreased Calu-3susceptibility to infection by SARS-CoV-2, which is most likely through the decrease ofviral receptor ACE2 expression and diminished viral attachment. However, in Calu-3,pre-treatment with L-carnitine did not decrease TMPRSS2 and Furin levels. It is possiblethat these differences observed between the rodent and human biomarkers on the onehand and the Calu-3 cell-based assay may be explained by the lack of inclusion of aninflammatory stimulus in Calu-3 [32]. It is also possible that an additional mechanism ofaction drove the observed in vivo results beyond inflammation. The L-carnitine’s physio-logical role is to transport fatty acid through the cellular and mitochondrial membranesleading to their usage as a source of energy by the Krebs cycle in the mitochondria [21].This enhanced mitochondrial activity was indicated by a decrease in the lactate levels inthe rodent serum [28]. It has been recently reported that L-carnitine can physically bind thenuclear receptor HNF4-α and increase its levels [33]. HNF4-α has been shown to decreaseACE2 levels [32,34], providing a potential mechanism for the downregulation of ACE-2by L-carnitine.
ACE2 levels have been shown to be particularly elevated in alveolar cells, whichmay account for the viral specificity of lung infections [34]. In addition, inflammatorydisease states such as type II diabetes [17], hypertension [2], obesity [35], and general agingand frailty [36,37] are known to be major risk factors for SARS-CoV-2 induced mortalitymost likely through increased inflammation. It is known that ACE2 levels in lungs andplasma are higher under inflammatory conditions [34], thus increasing the susceptibilityof cells from the population suffering from the above conditions to SARS-CoV-2 infection.L-carnitine has been reported to play a regulatory role in inflammatory processes [22,23,38],and L-carnitine supplementation has beneficial effects in populations with relatively lowL-carnitine levels, such as that which occurs in the elderly and in a variety of inflammatorydisease states [25].
Both exhaustive aerobic and resistance exercises have been shown to transiently (<96 h)increase the oxidative stress and mechanical damage in muscles [39], thereby enhancinginflammation [40]. Exercise-induced inflammation can augment ACE2 levels [41], leadingto reduced inflammation through generating the anti-inflammatory Angiotensin-(1–7) [14].Indeed, CRP concentration elevates to 168% above the baseline as a result of exercise [42],peaking at 253% 2 days after [42]. In our studies, the exercise-induced inflammationalso resulted in an increase in ACE2 and CRP serum levels, which was mitigated byL-carnitine supplementation. Interestingly, athletes have been reported to be at highrisk of complications from SARS-CoV-2 infection, leading ultimately to lung and cardiacinjuries [43]. It is plausible that this increased susceptibility of athletes to SARS-CoV-2complications is linked to the exercise-linked increased levels of the ACE2 receptor inlung and muscle cells. Future studies may explore if a potential additional benefit of

Nutrients 2021, 13, 1297 10 of 13
L-carnitine supplementation exists that lowers the susceptibility of this population toSARS-CoV-2 infection.
The physiological role of ACE2 is to lower blood pressure and counteract inflammationby converting pro-inflammatory Angiotensin II to anti-inflammatory Angiotensin (1–7) [5].The conversion from Angiotensin I to Angiotensin II is mediated by ACE1. Increases inACE1, or a decrease in ACE2, may reflect an increased inflammatory state characteristic ofadvanced diseased COVID-19 patients who experience the deleterious cytokine storm [36].Indeed, it has been reported that patients with hypertension and treated with ACE1 orangiotensin receptor blocker (ARB) medications, targeting the Renin-Angiotensin System(RAS), may have the ACE1/ACE2 ratio elevated, leading potentially to a worsening ofSARS-CoV-2 infection [44]. Therefore, therapies attempting to depress ACE2 should bedone in a way that either lowers or does not elevate the ACE1/ACE2 ratio [36]. We foundthat L-carnitine shifted the ACE1/ACE2 ratio in lungs and muscle tissue to a more anti-inflammatory state while keeping the same ratio in humans. These data raise the possibilitythat L-carnitine may potentially alleviate inflammation-induced muscle weakness and lunginjuries seen in humans. Finally, our data show that L-carnitine pre-treatment decreasesACE2 expression and inhibits the production of infectious viral particles in Calu-3 lungepithelial cells.
5. Conclusions
The present study provides evidence that L-carnitine supplementation reduces theexpression of SARS-CoV-2 receptor ACE2 and proteases required for viral entry (TMPRSS2and Furin) following exercise-induced inflammation in rodents and humans. L-carnitinesupplementation also significantly decreases the susceptibility of human lung–epithelialcells to the infection by SARS-CoV-2. Considering L-carnitine has an excellent safety recordover 35 years of use [24], future investigations of potentially beneficial effects of L-carnitinein preventing SARS-CoV-2 infection and complications in humans are warranted. However,some of the limitations of the current study include the lack of effects on TMPRSS2 andFurin in Calu-3 cells despite the observed decrease in human and rodent tissues. Thispoints to the limitation of translating the cell-based assays to the rodent and humanfindings. While L-carnitine treatment reduced the susceptibility of human lung epithelialcells to SARS-CoV-2 infection in vitro, whether this effect is solely the result of ACE2downregulation or also an impairment of viral entry remains to be determined.
Supplementary Materials: The following are available online at https://www.mdpi.com/article/10.3390/nu13041297/s1, Figure S1: Effect of L-carnitine on mRNA of ACE1, ACE2, TMPRSS2 and Furinin rodent muscle and liver tissues. Figure S2: Effect of L-carnitine on of ACE1, ACE2, TMPRSS2,and Furin in rodent muscle and liver tissues. Figure S3: Effect of L-carnitine supplementation onacetyl-, free and total carnitine levels in human serum. Figure S4: Effect of L-carnitine on Calu-3 cellviability. Figure S5: Dose-dependent effect of L-carnitine on the expression of ACE1 and TMPRSS2 inCalu-3 cells.
Author Contributions: A.B. and É.A.C. contributed to conceptualization, formal analysis, writing,review, editing, and supervision of projects. É.A.C. also supervised in vitro experiments in Calu-3.F.D. provided technical assistance related to the experiments in Calu-3. K.R. contributed to concep-tualization, formal analysis, writing, review and editing. K.S. contributed to data curation, formalanalysis, methodology, and supervision of the rodent biomarkers. N.G.S. contributed to investi-gations related to Furin, writing, review, and editing. J.W. contributed to the writing, reviewing,and editing the manuscript and supervision of human biomarkers. T.N.Q.P. and J.J. performed theexperiments in Calu-3 cells and analyzed the data. S.D. contributed to conceptualization, writing,review, and editing. All authors have read and agreed to the published version of the manuscript.
Funding: Lonza Consumer Health Inc. (Morristown, NJ, USA) supported this project. The biosafetylevel 3 (BSL3) laboratory used to perform the infection experiments is supported by a CanadaFoundation for Innovation (CFI) John-R.-Evans Leader Fund to EAC. CIHR Foundation grant #148363 in support to NGS.

Nutrients 2021, 13, 1297 11 of 13
Institutional Review Board Statement: The studies were conducted according to the guidelines ofthe Declaration of Helsinki and approved by the Institutional Review Board (or Ethics Committee) ofINTEGREVIEW IRB (protocol code 0220, dated 2-26-20). All animal experiments were performedin accordance the Animal Experimentation Ethics Committee of Firat University (Elazig, Turkey)(2019/140–207)
Informed Consent Statement: Informed consent was obtained from all subjects involved in the study.
Data Availability Statement: Data are contained within this article and supplementary material.
Acknowledgments: The authors would like to thank. Donninger and Saiyed for their advice andcritical review of the manuscript.
Conflicts of Interest: A.B., K.R. and S.D. are employees of Lonza. Other authors have no otherrelevant affiliations or financial involvement with any organization or entity with a financial interestin or financial conflict with the subject matter or materials discussed in the manuscript.
References1. Huang, X.; Wei, F.; Hu, L.; Wen, L.; Chen, K. Epidemiology and Clinical Characteristics of COVID-19. Arch. Iran. Med. 2020, 23,
268–271. [CrossRef] [PubMed]2. Mehra, M.R.; Ruschitzka, F. COVID-19 Illness and Heart Failure: A Missing Link? JACC Heart Fail. 2020, 8, 512–514. [CrossRef]3. Sewell, H.F.; Agius, R.M.; Kendrick, D.; Stewart, M. Covid-19 vaccines: Delivering protective immunity. BMJ 2020, 371, m4838.
[CrossRef]4. WHO. The COVID-19 Candidate Vaccine Landscape 25 January 2021, 5th ed.; World Health Organization: Geneva, Switzerland, 2021.5. Ita, K. Coronavirus Disease (COVID-19): Current Status and Prospects for Drug and Vaccine Development. Arch. Med. Res.
2021, 52. [CrossRef] [PubMed]6. Lazarus, J.V.; Ratzan, S.C.; Palayew, A.; Gostin, L.O.; Larson, H.J.; Rabin, K.; Kimball, S.; El-Mohandes, A. A global survey of
potential acceptance of a COVID-19 vaccine. Nat. Med. 2020, 27, 225–228. [CrossRef] [PubMed]7. Cohen, M.S. Monoclonal Antibodies to Disrupt Progression of Early Covid-19 Infection. N. Engl. J. Med. 2021, 384, 289–291.
[CrossRef]8. Zhang, J.; Wu, Q.; Liu, Z.; Wang, Q.; Wu, J.; Hu, Y.; Bai, T.; Xie, T.; Huang, M.; Wu, T.; et al. Spike-specific circulating T follicular
helper cell and cross-neutralizing antibody responses in COVID-19-convalescent individuals. Nat. Microbiol. 2021, 6, 51–58.[CrossRef]
9. Gaibani, P.; Tonetti, T.; Bartoletti, M.; Re, M.C.; Viale, P.; Ranieri, V.M. Antiviral activity of interferon-based combi-nation therapyin critically ill patients with Covid-19: Preliminary observations. J. Glob. Antimicrob. Resist. 2021, 24, 124–126. [CrossRef]
10. Yousefifard, M.; Zali, A.; Ali, K.M.; Neishaboori, A.M.; Zarghi, A.; Hosseini, M.; Safari, S. Antiviral therapy in management ofCOVID-19: A systematic review on current evidence. Arch. Acad. Emerg. Med. 2020, 8, e45.
11. Ma, D.; Chen, C.-B.; Jhanji, V.; Xu, C.; Yuan, X.-L.; Liang, J.-J.; Huang, Y.; Cen, L.-P.; Ng, T.K. Expression of SARS-CoV-2 receptorACE2 and TMPRSS2 in human primary conjunctival and pterygium cell lines and in mouse cornea. Eye 2020, 34, 1212–1219.[CrossRef]
12. Piccoli, L.; Park, Y.-J.; Tortorici, M.A.; Czudnochowski, N.; Walls, A.C.; Beltramello, M.; Silacci-Fregni, C.; Pinto, D.; Rosen,L.E.; Bowen, J.E. Mapping neutralizing and immunodominant sites on the SARS-CoV-2 spike receptor-binding domain bystructure-guided high-resolution serology. Cell 2020, 183, 1024–1042. [CrossRef] [PubMed]
13. Essalmani, R.; Jain, J.; Susan-Resiga, D.; Andréo, U.; Evagelidis, A.; Derbali, R.M.; Huynh, D.N.; Dallaire, F.; Laporte, M.; Delpal,A.; et al. Furin cleaves SARS-CoV-2 spike-glycoprotein at S1/S2 and S2’ for viral fusion/entry: Indirect role of TMPRSS2. bioRxiv2020, 12, 12–18.
14. Bestle, D.; Heindl, M.R.; Limburg, H.; Pilgram, O.; Moulton, H.; Stein, D.A.; Hardes, K.; Eickmann, M.; Dolnik, O.; Rohde, C.TMPRSS2 and furin are both essential for proteolytic activation of SARS-CoV-2 in human airway cells. Life Sci. All. 2020, 3, 9–11.[CrossRef]
15. Palleria, C.; Bennardo, L.; Dastoli, S.; Iannone, L.F.; Silvestri, M.; Manti, A.; Nisticò, S.P.; Russo, E.; De Sarro, G. Angiotensin-converting-enzyme inhibitors and angiotensin II receptor blockers induced pemphigus: A case series and lit-erature review.Dermatol. Ther. 2019, 32, e12748. [CrossRef]
16. Sriram, K.; Insel, P.A. A hypothesis for pathobiology and treatment of COVID-19: The centrality of ACE1/ACE2 imbalance. Br. J.Pharmacol. 2020, 177, 4825–4844. [CrossRef]
17. Apicella, M.; Campopiano, M.C.; Mantuano, M.; Mazoni, L.; Coppelli, A.; Del Prato, S. COVID-19 in people with diabetes:Understanding the reasons for worse outcomes. Lancet Diabetes Endocrinol. 2020, 8, 782–792. [CrossRef]
18. Askarpour, M.; Hadi, A.; Symonds, M.E.; Miraghajani, M.; Omid, S.; Sheikhi, A.; Ghaedi, E. Efficacy of l-carnitine supplementationfor management of blood lipids: A systematic review and dose-response meta-analysis of randomized con-trolled trials. Nutr.Metab. Cardiovasc. Dis. 2019, 29, 1151–1167. [CrossRef]
19. Pooyandjoo, M.; Nouhi, M.; Shab-Bidar, S.; Djafarian, K.; Olyaeemanesh, A. The effect of (L-)carnitine on weight loss in adults: Asystematic review and meta-analysis of randomized controlled trials. Obes. Rev. 2016, 17, 970–976. [CrossRef]

Nutrients 2021, 13, 1297 12 of 13
20. Fielding, R.; Riede, L.; Lugo, J.P.; Bellamine, A. l-Carnitine Supplementation in Recovery after Exercise. Nutrients 2018, 10, 349.[CrossRef]
21. de Moraes, M.S.; Guerreiro, G.; Sitta, A.; Coelho, D.D.M.; Manfredini, V.; Wajner, M.; Vargas, C.R. Oxidative damage inmitochondrial fatty acids oxidation disorders patients and the in vitro effect of l-carnitine on DNA damage induced by theaccumulated metabolites. Arch. Biochem. Biophys. 2020, 679. [CrossRef]
22. Kalhori, Z.; Mehranjani, M.S.; Azadbakht, M.; Shariatzadeh, M.A. L-Carnitine improves endocrine function and folliculogenesisby reducing inflammation, oxidative stress and apoptosis in mice following induction of polycystic ovary syndrome. Reprod.Fertil. Dev. 2019, 31, 282–293. [CrossRef] [PubMed]
23. Fathizadeh, H.; Milajerdi, A.; Reiner, Ž.; Amirani, E.; Asemi, Z.; Mansournia, M.A.; Hallajzadeh, J. The effects of L-carnitinesupplementation on indicators of inflammation and oxidative stress: A systematic review and meta-analysis of randomizedcontrolled trials. J. Diabetes Metab. Disord. 2020, 19, 1879–1894. [CrossRef]
24. Adeva-Andany, M.M.; Calvo-Castro, I.; Fernandez-Fernandez, C.; Donapetry-Garcia, C.; Pedre-Pineiro, A.M. Signifi-cance ofl-carnitine for human health. IUBMB Life 2017, 69, 578–594. [CrossRef] [PubMed]
25. Bruls, Y.M.; De Ligt, M.; Lindeboom, L.; Phielix, E.; Havekes, B.; Schaart, G.; Kornips, E.; Wildberger, J.E.; Hesselink, M.K.; Muoio,D.; et al. Carnitine supplementation improves metabolic flexibility and skeletal muscle acetylcarnitine formation in volunteerswith impaired glucose tolerance: A randomised controlled trial. EBioMedicine 2019, 49, 318–330. [CrossRef]
26. Tsukuda, Y.; Suda, G.; Tsunematsu, S.; Ito, J.; Sato, F.; Terashita, K.; Nakai, M.; Sho, T.; Maehara, O.; Shimazaki, T.; et al.Anti-adipogenic and antiviral effects of l-carnitine on hepatitis C virus infection. J. Med. Virol. 2017, 89, 857–866. [CrossRef]
27. Hoffmann, M.; Mösbauer, K.; Hofmann-Winkler, H.; Kaul, A.; Kleine-Weber, H.; Krüger, N.; Gassen, N.C.; Müller, M.A.; Drosten,C.; Pöhlmann, S. Chloroquine does not inhibit infection of human lung cells with SARS-CoV. Nature 2020, 585, 588–590. [CrossRef]
28. Sahin, K.; Orhan, C.; Kucuk, O.; Sahin, N.; Tuzcu, M.; Er, B.; Durkee, S.; Bellamine, A. A Dose-Dependent Effect ofCarnipure®Tartrate Supplementation on Endurance Capacity, Recovery, and Body Composition in an Exercise Rat Model.Nutrients 2020, 12, 1519. [CrossRef]
29. He, Q.; Fan, C.; Yu, M.; Wallar, G.; Zhang, Z.-F.; Wang, L.; Zhang, X.; Hu, R. Associations of ACE Gene Insertion/DeletionPolymorphism, ACE Activity, and ACE mRNA Expression with Hypertension in a Chinese Population. PLoS ONE 2013, 8, e75870.[CrossRef]
30. Sumithran, P.; Prendergast, L.A.; Delbridge, E.; Purcell, K.; Shulkes, A.; Kriketos, A.; Proietto, J. Ketosis and appe-tite-mediatingnutrients and hormones after weight loss. Euro. J. Clin. Nutr. 2013, 67, 759–764. [CrossRef]
31. Cheng, Y.-W.; Chao, T.-L.; Li, C.-L.; Chiu, M.-F.; Kao, H.-C.; Wang, S.-H.; Pang, Y.-H.; Lin, C.-H.; Tsai, Y.-M.; Lee, W.-H. Furininhibitors block SARS-CoV-2 spike protein cleavage to suppress virus production and cytopathic effects. Cell Reports 2020, 33,108–120. [CrossRef]
32. Tomasoni, D.; Italia, L.; Adamo, M.; Inciardi, R.M.; Lombardi, C.M.; Solomon, S.D.; Metra, M. COVID- 19 and heart failure: Frominfection to inflammation and angiotensin II stimulation. Searching for evidence from a new disease. Eur. J. Hear. Fail. 2020, 22,957–966. [CrossRef]
33. Förster, L.; Indra, D.; Rosenberger, K.; Zver, L.; Hofbauer, R. L-carnitine exerts a nutrigenomic effect via direct modulation ofnuclear receptor signaling in adipocytes, hepatocytes and SKMC, demonstrating its nutritional impact. Nutr. Res. 2021, 85, 84–98.[CrossRef] [PubMed]
34. Rao, S.; Lau, A.; So, H.C. Exploring Diseases/Traits and Blood Proteins Causally Related to Expression of ACE2, the PutativeReceptor of SARS-CoV-2: A Mendelian Randomization Analysis Highlights Tentative Relevance of Diabetes-Related Traits.Diabetes Care 2020, 43, 1416–1426. [CrossRef]
35. Pettit, N.N.; MacKenzie, E.L.; Ridgway, J.P.; Pursell, K.; Ash, D.; Patel, B.; Pho, M.T. Obesity is Associated with Increased Risk forMortality Among Hospitalized Patients with COVID. Obesity 2020, 28, 1806–1810. [CrossRef] [PubMed]
36. Chinnadurai, R.; Ogedengbe, O.; Agarwal, P.; Money-Coomes, S.; Abdurrahman, A.Z.; Mohammed, S.; Kalra, P.A.; Rothwell, N.;Pradhan, S. Older age and frailty are the chief predictors of mortality in COVID-19 patients admitted to an acute medical unit in asecondary care setting- a cohort study. BMC Geriatr. 2020, 20, 1–11. [CrossRef]
37. Hewitt, J.; Carter, B.; Vilches-Moraga, A.; Quinn, T.J.; Braude, P.; Verduri, A.; Pearce, L.; Stechman, M.; Short, R.; Price, A.; et al.The effect of frailty on survival in patients with COVID-19 (COPE): A multicentre, European, observational cohort study. LancetPub. Health 2020, 5, e444–e451. [CrossRef]
38. Khalatbari-Soltani, S.; Tabibi, H. Inflammation and l-carnitine therapy in hemodialysis patients: A review. Clin. Exp. Nephrol.2014, 19, 331–335. [CrossRef]
39. Suzuki, K.; Tominaga, T.; Ruhee, R.T.; Ma, S. Characterization and Modulation of Systemic Inflammatory Response to ExhaustiveExercise in Relation to Oxidative Stress. Antioxidants 2020, 9, 401. [CrossRef] [PubMed]
40. Kanda, K.; Sugama, K.; Hayashida, H.; Sakuma, J.; Kawakami, Y.; Miura, S.; Yoshioka, H.; Mori, Y.; Suzuki, K. Eccentricexercise-induced delayed-onset muscle soreness and changes in markers of muscle damage and inflammation. Exerc. Immunol.Rev. 2013, 19, 72–85.
41. Nunes-Silva, A.; Rocha, G.C.; Magalhaes, D.M.; Vaz, L.N.; De Faria, M.H.S.; Silva, A.C.S.E. Physical Exercise and ACE2-Angiotensin-(1-7)-Mas Receptor Axis of the Renin Angiotensin System. Protein Pept. Lett. 2017, 24, 809–816. [CrossRef][PubMed]

Nutrients 2021, 13, 1297 13 of 13
42. Paulsen, G.; Benestad, H.B.; Strøm-Gundersen, I.; Mørkrid, L.; Lappegård, K.T.; Raastad, T. Delayed Leukocytosis and CytokineResponse to High-Force Eccentric Exercise. Med. Sci. Sports Exerc. 2005, 37, 1877–1883. [CrossRef] [PubMed]
43. Hull, J.H.; Loosemore, M.; Schwellnus, M. Respiratory health in athletes: Facing the COVID-19 challenge. Lancet Respir. Med.2020, 8, 557–558. [CrossRef]
44. South, A.M.; Tomlinson, L.; Edmonston, D.; Hiremath, S.; Sparks, M.A. Controversies of renin–angiotensin system inhibitionduring the COVID-19 pandemic. Nat. Rev. Nephrol. 2020, 16, 305–307. [CrossRef] [PubMed]
Related Documents