Glasgow Theses Service http://theses.gla.ac.uk/ [email protected] Kurkiewicz, Teresa (2011) New NMR methods for studying dynamics in solids. PhD thesis. http://theses.gla.ac.uk/2613/ Copyright and moral rights for this thesis are retained by the author A copy can be downloaded for personal non-commercial research or study, without prior permission or charge This thesis cannot be reproduced or quoted extensively from without first obtaining permission in writing from the Author The content must not be changed in any way or sold commercially in any format or medium without the formal permission of the Author When referring to this work, full bibliographic details including the author, title, awarding institution and date of the thesis must be given

Welcome message from author
This document is posted to help you gain knowledge. Please leave a comment to let me know what you think about it! Share it to your friends and learn new things together.
Transcript

Glasgow Theses Service http://theses.gla.ac.uk/
Kurkiewicz, Teresa (2011) New NMR methods for studying dynamics in solids. PhD thesis. http://theses.gla.ac.uk/2613/ Copyright and moral rights for this thesis are retained by the author A copy can be downloaded for personal non-commercial research or study, without prior permission or charge This thesis cannot be reproduced or quoted extensively from without first obtaining permission in writing from the Author The content must not be changed in any way or sold commercially in any format or medium without the formal permission of the Author When referring to this work, full bibliographic details including the author, title, awarding institution and date of the thesis must be given

New NMR methods for studying dynamics in
solids
Submitted in partial fulfilment of the requirements
for the degree of Doctor of Philosophy
Teresa Kurkiewicz
University of Glasgow
Department of Chemistry
January 2010
2
Abstract
There is currently much interest in the investigation of dynamics in solids and the primary goal of this thesis is to present well-known and new NMR methods used for studying motion on Larmor and spectral timescale.
The quadrupolar interaction usually dominates solid-state NMR spectra of quadrupolar nuclei. When the magnitude of quadrupolar interaction is large then the second-order correction to the dominant Zeeman Hamiltonian must be considered. Owing to this second-order quadrupolar effect, NMR peaks can be displaced from their chemical shift positions by a second-order shift. When considering motional averaging of the second-order shift, the critical frequency is
the Larmor frequency, 0. In the case of motion that is faster than the Larmor precession, the isotropic quadrupolar shift is affected. This analogous phenomenon in solution-state NMR is known as the "dynamic shift".
In Chapter 4, it will be shown that multiple-quantum NMR measurements of
isotropic second-order quadrupolar shifts are a simple way to probe nanosecond timescale motions in solids. An analysis of one- and two-dimensional 11B MAS NMR spectra of three isomers of the closo-carboranes gives the results that provide the first evidence for the presence of solid-state dynamic shifts.
There are several experiments that provide a sensitive test for the presence of dynamics on spectral timescale. One piece of evidence for dynamics on the spectral timescale is a motional broadening of quadrupolar satellite-transition spinning sidebands. Therefore, it is possible to investigate the influence of dynamic reorientation on satellite-transitions MAS spectra by recording variable-temperature one-dimensional spectra with wide spectral width or by comparing two-dimensional STMAS spectra with MQMAS spectra. These methods can be extended to 2H NMR spectroscopy as the sidebands observed in the magic angle spinning (MAS) NMR spectrum of a spin I = 1 2H nucleus may be very strongly broadened due to interference between the line-narrowing effects of MAS and the dynamics-driven reorientation of the 2H quadrupole tensor, if motion is present in the solid.
In the last chapter, the 27Al, 31P and 2H NMR study of AlPO-34 type materials
with the topology of chabazite are undertaken and the use of the full range of NMR methods to develop a structure and dynamic behaviour of these materials is presented. In addition, the NMR calculations are performed in order to combine DFT calculations with experimental data. Finally, GaPO-34 samples were investigated to extract information about the effects of Ga substitution in AlPO-34 on dynamical behaviour.

3
Declaration
This thesis is available for library use on the understanding that it is
copyright material and that no quotation from the thesis may be published
without proper acknowledgement.
I certify that all material in this thesis that is not my own work has been
identified and that no material has previously been submitted and approved for
the award of a degree by this or any other university.
……………………………………….
Teresa Kurkiewicz
January 2010

4
Acknowledgment
I would like to express my appreciation to the following people:
My supervisor, Prof. Stephen Wimperis, for his supervision, guidance and
knowledge.
Dr Sharon Ashbrook, for her advices on the AlPO project.
Dr Michael Thrippleton, for his help on my first project and my first publication,
his assistance and patience.
Dr John Griffin for his help on my projects and my PhD thesis and for his
company in Glasgow and in St. Andrews.
The Wimperis Group (Dr Alan Gregorovic, Dr Marica Dowell and Dr Tom Ball)
for their help with NMR and all discussions.
My parents for their love and support.
My siblings, the closest relatives and friends, for their love, care, support and
encouragement. I cannot imagine becoming a doctor without you.

5
Contents
Abstract................................................................................................................2
Declaration..........................................................................................................3
Acknowledgment...............................................................................................4
Contents...............................................................................................................5
1. Introduction.........................................................................................................9
1.1. The key NMR developments.................................................................9
1.2. Thesis overview.....................................................................................15
1.3. General experimental details...............................................................17
2. Fundamentals....................................................................................................20
2.1. Zeeman interactions..............................................................................20
2.2. The vector model...................................................................................25
2.3. Fourier transform NMR........................................................................29
2.4. NMR Hamiltonians...............................................................................31
2.4.1. Dipolar interactions...................................................................32
2.4.2. J-coupling interactions..............................................................35
2.4.3. Chemical shift interactions.......................................................36
2.4.4. Quadrupolar interactions.........................................................39

6
3. High-resolution techniques and the other methods..................................48
3.1. Magic angle spinning............................................................................48
3.1.1. The MAS technique...................................................................48
3.1.2. Spinning sidebands...................................................................49
3.2. Multiple-quantum MAS NMR............................................................51
3.2.1. Basic sequence............................................................................52
3.2.2. Amplitude-modulated experiments.......................................56
3.2.3. Shifted-echo experiments.........................................................58
3.2.4. Split-t1 experiments...................................................................58
3.3. Satellite-transitions MAS NMR...........................................................61
3.4. Cross-polarization experiment............................................................66
3.5. Insensitive nuclei enhance by polarization transfer (INEPT)
experiment..............................................................................................67
3.5.1. Double insensitive nuclei enhance by polarization
transfer........................................................................................69
3.6. Spin-lattice relaxation time measurements........................................71
4. Second-order quadrupolar shifts as an NMR probe of fast molecular-
scale dynamics...................................................................................................74
4.1. Dynamics in solids................................................................................74
4.1.1. Introduction................................................................................74
4.1.2. Slow-timescale motion – the two-dimensional exchange

7
experiment..................................................................................75
4.1.3. Intermediate-timescale motion – lineshape analysis............79
4.1.4. Fast-timescale motion – spin-lattice relaxation time and
second-order quadrupolar shift..............................................85
4.2. Closo-carboranes.....................................................................................89
4.2.1. Introduction................................................................................89
4.2.2. Results and discussion..............................................................90
4.2.3. Conclusion................................................................................107
5. Dynamic behaviour of microporous solids...............................................110
5.1. Introduction..........................................................................................110
5.2. AlPO-34: Results and discussion.......................................................118
5.2.1. As-made AlPO-34....................................................................118
5.2.2. Deuterated AlPO-34................................................................132
5.2.3. Calcined AlPO-34....................................................................143
5.3. CASTEP calculations...........................................................................149
5.4. GaPO-34 – gallium phosphate materials..........................................155
5.5. Conclusion............................................................................................162
Appendices..................................................................................................................165
A Preparation of 9,12-diiodo-ortho-carborane and as-made AlPO-34.........165

8
B Coefficients of zero-, second- and fourth-rank terms in Eqn. (3.8) for half-
integer spin nuclei...........................................................................................167
C Reduced rotation matrix elements................................................................168
D MQMAS ratios (A4 (I,mI)/A4 (I,1/2)) for half-integer spin nuclei..........170
E STMAS ratios for half-integer spin nuclei....................................................171
References....................................................................................................................172

9
Chapter 1: Introduction
1.1. The key NMR developments
Nuclear magnetic resonance (NMR) is a powerful technique that has been
around for more than 60 years. The versatility of NMR has made it a
widespread scientific tool. The NMR phenomenon has proven an essential tool
in physics and it has revolutionised chemistry and biochemistry. It has also
made significant contributions to medicine and is now making an impact in
geochemistry, chemical engineering and food technology.
The developments in liquid- and solid-state NMR have a long and
successful history. It all started with the independent discoveries by the groups
of Bloch and Purcell. In 1946 Purcell, Torrey and Pound [1.1] brought protons 1H
in solid paraffin wax to resonance and at that time Bloch, Hansen and Packard
[1.2] did the same with liquid water.
Soon afterwards, in 1949, the chemical shift was discovered and two
years later Arnold, Dharmatti and Packard observed that the chemical shift due
to the –OH proton in ethanol varied with temperature, showing three separate

10
resonances for each proton [1.3].
In liquid-state NMR spectra peaks are narrow and well-resolved due to
rapid rotation of molecules in liquids. However, in solid-state NMR spectra line
broadening is observed because rapid molecular motion in powdered solids are
absent. These anisotropically broadened lineshapes can be MHz wide and
difficult to interpret. Therefore, new development of methods in solid-state
NMR and new instrumentation has focussed on ways of obtaining high-
resolution isotropic spectra in which all anisotropic line broadening has been
removed.
The first technique for improving the resolution of solid-state NMR
spectra of powdered samples is magic angle spinning (MAS) method,
developed by the groups of Andrew in 1958 [1.4,1.5] and independently by the
group of Lowe in 1959 [1.6]. MAS technique involves a rapid rotation of a
sample about an axis at 54.74º with respect to the magnetic field. Andrew used
magic angle spinning to narrow the 23Na line in NaCl, whereas Lowe used this
technique to narrow the dipolar broadened 19F resonances in CaF2 and Teflon.
Currently, MAS is used to remove the effect of chemical shift anisotropy, to
assist in the removal of heteronuclear dipolar coupling effects, and to narrow
NMR peaks of quadrupolar nuclei. MAS may be used on its own, and may also
be successfully combined with other, more recently discovered, techniques.

11
The methodological development of NMR entailed instrumental
evolution and, later in the 1950s, the first commercial spectrometers appeared.
These were based on conventional electromagnets and permanent magnets.
However, by the 1960s the superconducting magnet had already come to be
largely adopted.
Meanwhile, one of the most widely employed methods, in NMR of
solids, the Hartmann-Hahn cross-polarization technique, used to increase the
sensitivity when observing low- spins in solids, was developed. In this
experiment, the enhancement of the magnetization of the low- nucleus
(e.g., 13C) is achieved by cross-polarization from an abundant high- nucleus
(e.g., 1H) [1.7].
Soon after this, in 1966, the chemists Ernst and Anderson demonstrated
Fourier transform nuclear magnetic resonance (FT NMR), in which short, high-
power pulses excite all transitions in the spectrum simultaneously [1.8]. This
procedure quickly replaced the older scanning techniques.
In 1971, Belgian physicist Jeener conceived of a new way of applying
pulse sequences and displaying the results in terms of two separate frequency
scales [1.9]. The concept was soon developed into the very important method of
two-dimensional NMR particularly in the laboratory of Ernst (who received the

12
Nobel Prize in Chemistry in 1991 for his major contributions to FT NMR in both
one and two frequency dimensions) and the laboratory of Freeman.
Another approach to achieve line narrowing for an abundant spin
system, such as protons, in solids was introduced by Ostroff and Waugh [1.10]
and Mansfield and Ware [1.11]. They imposed artificial motion on the solid by
making the spin operators time-dependent, i.e., by introducing motion in the so-
called spin space. This was realized by means of a special radiofrequency (rf)
pulse sequence, which eliminates the decay due to the dipolar interaction almost
completely while the decay due to the chemical shift is only partially eliminated.
Hence, after Fourier transform, a spectrum is obtained that contains chemical
shift information only. Improved rf sequences have been developed to remove
the dipolar broadening even more completely. However, the proton spectra still
often lack resolution, due to the remaining chemical shift anisotropy. Therefore,
these multiple-pulse sequences have been combined with magic angle spinning,
yielding the so-called CRAMPS (combined rotation and multiple-pulse
spectroscopy) technique. With this technique, spectra are obtained with narrow
lines determined by the isotropic chemical shift.
During the period 1980-2000 a number of clever methods were developed
for obtaining high-resolution NMR spectra of half-integer quadrupolar nuclei,
because MAS cannot completely average the quadrupolar interaction, leaving

13
residual (usually significant) line broadening in MAS spectra. Four major
technical solutions have been developed to achieve enhanced resolution in the
spectra of quadrupolar nuclei. These are double rotation (DOR) [1.12-1.14],
dynamic angle spinning (DAS) [1.12,1.15], multiple-quantum magic angle
spinning (MQMAS) [1.16-1.19] and satellite-transition magic angle spinning
(STMAS) [1.20].
In the DOR technique the sample is spun simultaneously at two angles, at
an angle of 54.7 ° relative to the direction of the static magnetic field (the magic
angle) and an inner rotor containing a sample, placed in the outer rotor, is
rotated around the axis at an angle of 30.6° or 70.1° relative to the first one. As
might be imagined, this method, in which one rotor is spun within another, is
experimentally challenging, but has been used successfully.
In DAS, the experiment involves spinning the sample at two different
angles sequentially over different time periods, in order to refocus the signal. In
this way a two-dimensional spectrum is obtained, with isotropic signals
(quadrupolar broadening removed) in one dimension and quadrupolar
broadened anisotropic patterns in the other. The two-dimensional spectrum
therefore permits improved resolution in one dimension, free from quadrupolar,
chemical shift anisotropy and dipolar effect.

14
One of the major developments is the MQMAS method, proposed in 1995
by Frydman and Harwood. This is a two-dimensional technique involving the
correlation of multiple- and single-quantum coherences under MAS conditions.
More details and an application of the MQMAS technique to both crystalline
and amorphous materials will be discussed in later chapters of this thesis.
In the STMAS experiment, single-quantum (satellite, i.e.,
mI = 3/2 1/2 and mI = –1/2 –3/2, transition) coherences are correlated
with single-quantum (central, mI = 1/2 –1/2, transition) coherences. Both,
central and satellite transitions are affected by second-order quadrupolar
interaction and the ratio of the second-order quadrupolar broadening of the
satellite and central transitions is known as the STMAS ratio. Since the
magnitudes of these broadenings are related by a simple numerical factor, the
correlation of the two transitions in two-dimensional experiment will allow the
removal of the second-order broadening. This experiment has been used to
study dynamics and it might be useful for the study of low- nuclei.
One advantage of the transition-correlated MAS experiments over the
other methods is that they are easier techniques to implement experimentally in
terms of the physical procedure, because they only involve magic angle
spinning and therefore can be performed with most commercial MAS probes.

15
The importance of solid-state NMR has increased dramatically over the
last 20 years and solid-state NMR spectroscopy has the potential of becoming
one of the key methods to provide the structural and dynamic information.
Many other techniques such as three-dimensional, 2H double-quantum magic
angle spinning or satellite-transition acquired in real time by magic angle
spinning (STARTMAS) methods have recently been developed or are under
development and that show great potential for future investigations. Detailed
descriptions of some of the above techniques and their applications will be
discussed in Chapter 3.
Nuclear magnetic resonance, first discovered in 1946, has evolved into
one of the premier techniques for molecular identification and the development
of NMR methods is far from being complete. Furthermore, the next generation
of high-field spectrometers in the range of a gigahertz will enable NMR to
handle considerably more complex materials than has been possible before.
1.2. Thesis overview
This thesis is mainly concerned with the description of two classes of
compounds that have important application in chemistry, physics, biology,
medicine and other branches. The first class of these materials is closo-
carboranes and they are used here as a model for studying dynamic shift effects

16
in solids, explaining also what the dynamic shift is and how NMR methods may
be used to investigate this effect. The second class of compounds of interest in
my study are the aluminophosphates (AlPOs). I will concentrate on AlPO
samples made with different template molecules and also their derivatives such
as gallium phosphate materials. The dynamic behavior of AlPO will be also
shown but using different NMR methods, described in the theoretical chapters
of this thesis, than in the case of carboranes.
The first chapter talks about the new discoveries that have been made
during the last 60 years and briefly describes NMR methods concentrating on
the techniques used for solid-state NMR.
Chapter 2 presents a discussion of the fundamental principles for NMR
starting with Zeeman interactions, the vector model and the Fourier transform
and then describing NMR Hamiltonians for every interactions that is a source of
inhomogeneous broadening in NMR spectra, such as dipolar, scalar and
chemical shift interactions. However, in particular, the focus is placed on
quadrupolar interactions as they present the dominant interaction for
quadrupolar nuclei and the investigations of quadrupolar nuclei are described
in the experimental sections of this thesis.
Various high-resolution techniques are described in Chapter 3. This

17
chapter presents the way in which these techniques can be used to remove
broadening from NMR spectra, especially for quadrupolar nuclei. The resulting
high-resolution spectra, for example two-dimensional MQMAS or STMAS
spectra provide, in turn, important information about structure and dynamics.
In Chapter 4, new method to probe nanosecond timescale motions in
plastic solids is introduced. This chapter shows that measurements of isotropic
quadrupolar shifts using multiple-quantum MAS spectroscopy give information
on molecular reorientation and the carboranes are good examples for studying
reorientation in solids. Their molecules, arranged within a lattice, are still free to
reorientate on the nanosecond timescale and can therefore have a measureable
influence on the centre-of-gravity shifts of quadrupolar nuclei.
Chapter 5 applies the most of the methods described in Chapter 3 and
additionally ab initio methods [1.21], that can be used to calculate a wide range
of physical properties of materials, to investigate structure and dynamic
behaviour of aluminophosphates and their derivatives. The results of these
experiments and calculations are discussed.
1.3. General experimental details
The experiments presented in this thesis were performed using a Bruker

18
Avance NMR spectrometer equipped with a widebore 9.4, 14.1 or 20.0 T magnet
and 2.5-mm and 4-mm broadband MAS probes. All experiments employed
magic angle spinning (MAS) and used rotation speeds of 10–33 kHz. All
radiofrequency field strengths were calibrated independently on a variety of the
samples and the values quoted are approximate only. Chemical shifts are
reported in ppm relative to BF3OEt2 (l) for 11B, 1 M Al(NO3)3 (aq) for 27Al, 1 M
Ga(NO3)3 (aq) for 71Ga, TMS-d12 for 2H and TMS for 1H.
Low-temperature measurements were carried out by passing the rotor
bearing gas through a liquid nitrogen-cooled heat exchanger. As a consequence
of frictional sample heating due to MAS, the temperatures quoted in this article
are likely to underestimate the true sample temperature by approximately 5 K.
Some of the samples were obtained from commercial suppliers and used
without further purification. The aluminium and gallium phosphate materials
(and their deuterated equivalents) were synthesized by Dr R. I. Walton
(University of Warwick). The sample of 1,3-dimethylimidazolium-AlPO-34 was
synthesized by a project student Lucy Clark of the University of St. Andrews.
The samples of meta- and para-carborane were provided by Professor A. J. Welch
(Heriot Watt University). The 9,12-diiodo-ortho-carborane was synthesized by a
project student Darryn Mark. The preparation of some of the sample is
presented in Appendix A.

19
First-principles calculations of NMR parameters of aluminium phosphate
materials, meaning density functional theory calculations with plane waves and
pseudopotentials, were performed using NMR CASTEP code. The CASTEP
program originally was developed by Payne and co-workers in late 1980s and
early 1990s [1.21]. CASTEP permits geometry optimisation, as well as
calculation of the electronic properties of all manner of materials and molecules.
This program can also give information about total energies and forces on an
atomic system and perform molecular dynamic simulations.
Full experimental parameters are given in figure captions.

20
Chapter 2: Fundamentals
2.1. Zeeman interaction
Nuclei that can be observed in nuclear magnetic spectroscopy are
magnetic nuclei, those with non-zero spin quantum number, I. The spin
quantum number arises from the number of protons and neutrons in the
nucleus and can be equal to 0, 1/2, 1, 3/2, 2,…,. In the case of even number of
protons and neutrons, I = 0, the nucleus is not observable in NMR spectrum.
However, most elements have at least one NMR-active isotope.
The most important nuclei for structural studies in liquid-state NMR,
especially in organic chemistry, are nuclei with I = 1/2, such as 1H, 13C, 15N, 19F
or 31P. On the other hand, in solid-state NMR, the quadrupolar nuclei, those
with I 1/2, are mainly of interest to NMR spectroscopists.
All of the magnetic nuclei are charged particles possessing an intrinsic
angular momentum (spin). As the angular momentum is a vector quantity, it
has the magnitude and direction. For the nucleus, the square of the magnitude
of the intrinsic angular momentum, I, is a fundamental property of the state of

21
the nucleus. Its value is:
22)1I(II (2.1)
where
h
2 and h is the Planck constant.
The spin state is also characterized by the projection of the angular
momentum along any one of the axes (usually it is the z-axis of the coordinate
system in which the system is described):
Iz m I (2.2)
where mI is referred to as the magnetic quantum number and this quantum
number takes one of the 2I + 1 integer values (m I I, I 1, ..., I) .
In the absence of an external field, each of the 2I + 1 spin states has the
same energy. However, as one of the characteristic features of the magnetic
nuclei is also their possession of a magnetic dipole moment, , given by:
I (2.3)

22
where is a gyromagnetic ratio characteristic for every nucleus, in the presence
of an external magnetic field, the z-component of magnetic dipole moment
interacts with the applied magnetic field and energies of each of 2I + 1 states are
slightly modified. This change of energies of the spin states due to the
interaction of the z-component of magnetic dipole moment with the applied
magnetic field is known as the Zeeman interaction. The energy of this
interaction is given by:
E zB0 (2.4)
if B0 is along the z axis.
It can be deduced from Eqns. (2.2), (2.3) and (2.4) that the states of
different angular momentum projection along the field have energies that
depend on the projection quantum number, magnetic field and the
gyromagnetic ratio according to the equation below:
EmIm I B0 (2.5)
The gyromagnetic ratio, , may have either sign, depending on whether
the magnetic dipole moment is aligned parallel or antiparallel to the field. For
particles with a positive value of (the majority of atomic nuclei), the z-

23
component of magnetic dipole moment, , is parallel to the field, B0, and the
energy of the state of the angular momentum projection along the field is the
lowest.
The particles can undergo a transition between the two energy states.
However, allowed energy transitions are between adjacent energy levels
( m I 1). The energy difference between two adjacent states is given by:
0BE (2.6)
At thermal equilibrium, the ratio of nuclei between two adjacent levels in
accordance with the Boltzmann distribution can be represented by:
kT
E
lower
uppere
n
n (2.7)
where k is the Boltzmann constant (k = 1.3805 · 10 23 J/Kelvin) and T is the
temperature in Kelvin. It is generally found that the number of spins in the
lower energy level is slightly higher (by about one in every 105) than the number
of spins in the higher energy level.
When the energy of the absorbed photon (E = h ) matches the energy

24
difference in Eqn. (2.6) a transition occurs. This may be expressed in terms of the
frequency 0 (in units of Hz), called Larmor frequency, as:
2
B00 (2.8)
or in angular frequency units (rad s 1) as:
00 B (2.9)
As the frequency applied to a sample, which correspond to the energy
gap, E, correspond to the radiofrequency (rf) band of the electromagnetic
spectrum, the rf radiation is used in NMR spectroscopy.
The displacement of the energy levels due to Zeeman interaction can be
presented graphically and the Figure 2.1 illustrates the effect of the Zeeman
interaction on the energy levels of spins I = 1 and I = 3/2 nuclei.
However, the interactions that are really of interest to NMR
spectroscopists are not the Zeeman interactions but the chemical shift (or
chemical shift anisotropy), the scalar interaction (J-coupling interaction), the
dipolar interaction and, for spins I 1/2, the quadrupolar interaction. All of

25
Figure 2.1. The effect of the Zeeman interaction on the energy levels of (a) a spin I = 1 nucleus and (b) a spin I = 3/2 nucleus.
these will be described in later sections.
2.2. The vector model
The vector model is a simple way to visualize rf pulses and free
precession intervals in NMR without using the quantum mechanics needed to
describe the behaviour of an ensemble of spins in macroscopic samples. The
vector model was first proposed by Bloch in 1946 [2.1].
As described in previous section, in the presence of the external magnetic
field and at thermal equilibrium, nuclei in a sample will populate the adjacent
energy levels according to the Boltzman distribution. This results in alignment
of the z-components of magnetic moments along the field direction, so the
sample has a net magnetisation vector along the arbitrary z-axis. If there is a
collection of a large number of nuclear spins, then the aligned nuclear magnetic

26
Figure 2.2. Vector model presentation of the magnetic fields present in the rotating frame.
moments lead to a bulk magnetization of the spins in a sample, M.
If an rf pulse is applied to B0 with its oscillation frequency rf (the
transmitter frequency) very close to the Larmor frequency, 0, the bulk
magnetization vector tilts away from the z-axis and begins to precess around z-
axis for the duration of the pulse length.
Because it is difficult to visualize this effect in the static laboratory frame,
it turns out to be much easier to work out this in a rotating frame, in which the
Cartesian axes rotating in the xy-plane (around the z-axis) at the
frequency of the rf pulse, rf. The rf pulse in the rotating frame can be thought
of as a temporarily applied static magnetic field, B1, applied orthogonally to B0.
If the pulse is off-resonance, the main static field B0 is replaced by a reduced

27
(offset) field, B, given by:
B (2.10)
where the offset is the frequency of precession in the rotating frame and is
given by:
0 rf (2.11)
The associated flip angle, which is the angle by which the bulk magnetization
vector nutates from the z-axis is:
1 p (2.12)
where p is the pulse length and 1 is the strength of the rotating field
( 1 B1).
The offset field and the B1 field added vectrorially give an effective field
Beff, as shown in Figure 2.2 and, in the rotating frame, the bulk magnetization
vector precesses around this effective field, just as in the laboratory frame the

28
Larmor precession takes place around the B0 field. However, if the pulse is on-
resonance ( rf = 0), the offset is zero and, referring to Fig. 2.2, the effective
field lies along x-axis and is of size 1.
After the rf field is turned off, the bulk magnetization vector starts to
precess around z-axis, together with the xy plane. As well as the precession,
there is a relaxation of the vector to bring it back along the z-axis.
The relaxation process has two components, the magnetization along the
z-axis relaxes towards its equilibrium value and the transverse components (x
and y) relax towards zero. As the bulk magnetization vector is composed of the
magnetic moments of many individual spins, some of them may precess faster
and some of them slower than the rotating axes. As a result, the magnetic
moments spread out and the x- and y-components of the individual nuclear
magnetic moments may cancel one another out reducing the length of the bulk
magnetization vector. Therefore, the transverse components relax at a faster
rate than the z component does in its return to equilibrium and two time
constants are required to fully describe spin relaxation. These two relaxation
times are called the spin-lattice (longitudinal) relaxation time, T1, and the spin-
spin (transverse) relaxation time, T2. Transverse relaxation causes the x and y-
components of the nuclear magnetization to decay towards zero, whilst
29
longitudinal relaxation returns the z-magnetization vector to its equilibrium
value.
The rotation of the magnetization about the z-axis gives rise to a current
in the rf coil located in the transverse plane and, after various manipulations,
this current results in a signal called the free induction decay (FID) that is
detected in an NMR experiment.
2.3. Fourier Transform NMR
Fourier transformation [2.2-2.4] is a mathematical operation that
translates the time-domain function (FID) into the frequency-domain function
(the spectrum). The free induction decay is the sum of many oscillating waves
of differing frequencies, amplitudes and phases. It is detected using two
detectors orthogonal to each other in the rotating frame. This method is known
as quadrature detection [2.5]. For each resonance in the spectrum, the x and y
components are detected simultaneously, corresponding to cosine and sine
functions of the offset frequency, , respectively. The x component is used as
the real input and the y component as the imaginary input to a complex Fourier
transform. As mentioned before the transverse magnetization decays
exponentially with a rate constant 1/T2 and the signal then becomes:

30
}T
texp{}tiexp{)t(f
2
(2.13)
for values of t ≥ 0.
This complex time-domain signal can be converted into the frequency-
domain function or into the spectrum by Fourier transformation:
F( ) f(t) exp{ i t}dt A( ) iD( ) (2.14)
where:
222
2
)()T/1(
T/1)(A (2.15)
is an absorptive Lorentzian function and
222 )()T/1(
)(D (2.16)
is a dispersive Lorentzian function. Both functions utilize the offset frequency
variable, .

31
(a) (b)
Figure 2.3. The 11B MAS NMR (a) absorption (real) and (b) dispersion (imaginary) Lorentzian experimental lineshapes of solid borane triphenylphosphine (BH3PPh3).
This absorption lineshape has a width at half of its maximum height of
1/( T2 ). The dispersion lineshape is broader than the absorption mode and it
has positive and negative parts. Figure 2.3 shows both functions (recorded
experimentally).
2.4. NMR Hamiltonians
The operator which represents the observable quantity energy is called
the Hamiltonian operator and is commonly represented using the symbol H.
The energy associated with each spin state can be obtained by solving the time-

32
independent Schrödinger equation:
H E (2.17)
where is a spin wavefunction and E is the energy.
For example, for a single nuclear spin in a magnetic field of strength B0
applied along the z-axis in the laboratory frame, the Hamiltonian, which
describes the change in the energy levels due to the Zeeman interaction, is
given by:
HZ 0Iz (2.18)
As the Zeeman interactions are due to the external magnetic fields, the
other interactions (dipolar, chemical shift or quadrupolar interactions) originate
from the presence of internal magnetic field and each of them can be also
represented by Hamiltonian.
2.4.1. Dipolar interactions
In this interaction the local magnetic fields are due to the nuclear

33
magnetic moments of other, nearby, spins. These local fields depend on the
distance between the two spins, r, the gyromagnetic ratios of the spins, I and S,
and the angle between the vector joining the two spins and the external
magnetic field, .
The secular form of the homonuclear dipolar Hamiltonian between two
spins I and S is given by [2.6]:
H D
ISD[2IzSz IxSx IySy ] (2.19)
where D is the dipolar coupling parameter, given by:
D
DPAS
2(3 cos2 1) (2.20)
with the dipolar coupling constant in the principal axis system equal to:
DPAS 0 I S
4 rIS3
(2.21)
In the solution state, the presence of molecular motion averages the
dipolar coupling to zero. For solids, however, dipolar couplings among the

34
spins of a sample can have a major effect on an NMR spectrum, particularly for
spin I = 1/2 nuclei. Because, in solid-state NMR, magic angle spinning (MAS)
plays a similar role to the rapid isotropic rotation of molecules in liquids the
MAS technique can be use to remove the effect of homonuclear dipolar
coupling from an NMR spectrum, providing the rate of spinning is fast relative
to the homonuclear dipolar linewidth. This technique involves rapid rotation of
the sample around an axis that is at the "magic angle" (54.74 ) with respect to
the magnetic field. It can be observed from Eqn. (2.20) that if we spin the sample
about an angle of 54.74 ( is set to 54.74 ), then (3cos2 1) 0 and the dipolar
Hamiltonian is also equal to zero.
In the case of two spin I and S heteronuclei, on the other hand, the
secular form of the heteronuclear dipolar Hamiltonian between two spins I and
S is given by:
H DIS 2 DIzSz (2.22)
This heteronuclear coupling [2.7] may be removed from solid-state NMR
spectra and high-power decoupling is the simplest technique, in addition to
MAS. This method consists of applying continuous irradiation of very high
power at the frequency of the I spin resonance (e.g., 1H). The required pulse

35
sequence for the S spin (e.g., 13C) is afterwards applied and the FID of the spin S
measured while continuing the I-spin irradiation.
2.4.2. J-coupling interactions
In addition to the direct coupling of nuclei via the dipolar coupling,
nuclei can also experience a coupling, known as the J coupling or indirect spin-
spin coupling. The origin of this effect is an interaction between two nuclear
spins due to the influence of bonding electrons on the magnetic field running
between the two nuclei. This through-bond interaction in the heteronuclear case
can be described by the following Hamiltonian [2.8]:
H J 2 JISIzSz (2.23)
where JIS is the heteronuclear J coupling constant between spins I and S.
The J coupling contributes only slightly to the total NMR Hamiltonian in
terms of energy but it provides the spin-spin splittings that can be prominent in
high-resolution spectra.
In solid-state NMR spectra of quadrupolar nuclei, the scalar coupling

36
interactions are small compared to other broadening mechanisms, such as the
quadrupolar interactions, and they can therefore often be neglected.
2.4.3. Chemical shift interaction
When an atom is placed in a magnetic field, its electrons circulate about
the direction of the applied magnetic field. This circulation causes a small
magnetic field at the nucleus, which opposes the externally applied field. As a
result of this, the magnetic field at the nucleus (the effective field), which is less
than the applied field, is given by:
B B0 (1 ) (2.24)
and the frequency of precession of the spin changes to:
0' B0 (1 ) (2.25)
where is a shielding parameter.
In terms of the Hamiltonian, the shielding for a single spin, with B0
defined to be along the z axis, is given by:

37
HCS z,zB0Iz (2.26)
where z,z is the component of the shielding tensor that shields Iz from B0 and
is composed of isotropic and anisotropic (orientation dependent) components:
z,z iso
1
3(3 cos2 1) i,i
i 1
3
(2.27)
where is the angle that defines the orientation of the B0 field in the principal
axis system of the shielding tensor. This means that the chemical shift is a tensor
quantity and the observed quantity depends on the relative orientation of the
molecule with respect to the axis of the applied magnetic field.
In a powder sample a broad signal is observed which shows chemical
shifts that correspond to all the possible orientations. This powder pattern has
singularities that correspond to the three principal components of the shielding
tensor ( 11, 22, 33). To remove anisotropic contribution to chemical shifts in
solids the magic angle spinning technique [2.9] has been widely used.
In an isotropic liquids the molecules are freely tumbling, the anisotropic
shielding is averaged and the shielding is equal to its isotropic value (average of

38
the 11, 22, 33 components):
iso
11 22 33
3 (2.28)
where 11 , 22 , 33 are the principal tensor components.
The chemical shift of a nucleus is defined in terms of a difference
between the resonance frequency of the nucleus and a standard, relative to a
standard [2.10]. This frequency is reported in ppm:
( ref )
ref
106 (2.29)
In 1H NMR spectroscopy this standard is usually tetramethylsilane, Si(CH3)4
(TMS).
The chemical shift can be related to the shielding by:
106 ref
1 ref
106 ( ref ) (2.30)
where ref << 1 has been assumed. The chemical shift is, therefore, a

39
deshielding parameter, as increase in shielding leads to a decrease in chemical
shift.
2.4.4. Quadrupolar interactions
The quadrupolar Hamiltonian
Quadrupolar nuclei (those with spin quantum number I > 1/2) possess an
electric quadrupole moment in addition to the magnetic dipole moment that all
NMR-active nuclei must have. Interactions of the nuclear quadrupole moment,
eQ, with the electric field gradient (EFG) present at the nucleus are usually
dominant in solid-state NMR spectra of quadrupolar nuclei [2.11,2.12]. This
interaction affects the nuclear spin energy levels in addition to the other
magnetic interactions already described. The nuclear electric quadrupole
moment/electric field gradient interaction can be rather large, causing powder
patterns of megahertz in width for solid samples consisting of large numbers of
randomly oriented crystallites (i.e., powders).
The electric field gradient (EFG) is a three-dimensional entity, described
by the three principal values of the EFG tensor, VX,X , VY,Y , VZ ,Z associated with
X, Y and Z principal axis system (PAS) axes, respectively, that satisfy the

40
condition:
VX,X VY,Y VZ,Z 0 (2.31)
A measure of the deviation of the EFG from axial symmetry is the asymmetry
parameter, , defined as:
VX,X VY,Y
VZ ,Z
(2.32)
while the magnitude of EFG tensor is given by eq = VZ,Z.
The quadrupolar coupling constant, CQ, describes the magnitude of the
quadrupolar interaction [2.13] and in units of Hz is written:
CQ
e2qQ
h (2.33)
where eq is the magnitude of EFG tensor and eQ is the nuclear quadrupole
moment.
For a quadrupolar nucleus, the total Hamiltonian, neglecting the
contribution from smaller interactions described in previous subsections, may

41
Figure 2.4. Schematic spin I = 3/2 energy level diagrams showing the effect of the Zeeman, first- and
second-order quadrupolar interactions.
be expressed as the sum of the individual Hamiltonians for the Zeeman and
quadrupolar interactions:
H HZ HQ (2.34)
where the Hamiltonian HZ describes the effect of Zeeman interaction and HQ is
the effect of the quadrupolar interactions and in the PAS is given by [2.14]:
HQ QPAS[IZ
2 (1/ 3)I(I 1) ( / 3)(IX2 IY
2 )] (2.35)
where QPAS is the quadrupolar splitting parameter in the principal axis system

42
(PAS) and is given, in units of rad s 1, by:
QPAS 3 CQ
2I(2I 1) (2.36)
First-order effects of the quadrupolar Hamiltonian
The quadrupolar interactions are strong and contribute to the energy
levels. However, as they are smaller than Zeeman interaction, they can be
described using perturbation theory of Zeeman energy levels [2.15]. Figure 2.4
shows the effect of the quadrupolar interaction on the energy levels for spin
I = 3/2 nucleus. If the quadrupolar interaction is much smaller than the Zeeman
interaction, the first-order quadrupolar contribution to the energy levels is
sufficient to describe the spectrum. For spin I = 3/2 the Zeeman interaction
results in two distinct types of single-quantum transition, the central transition
(CT) with mI = +1/2 1/2 and the satellite transition, ST with mI = ±1/2 ±3/2
[2.11]. Figure 2.4 shows that the central transition of spin I = 3/2 nuclei is
unaffected by the quadrupolar interaction to the first-order approximation,
remaining at the Larmor frequency. The satellite transitions, on the other hand,
are affected by the quadrupolar interaction to a first-order approximation
resulting in the CT and ST transitions being spaced by , as 2 Q

43
E1/ 2
(1) E 1/ 2(1)
Q and E3 / 2
(1) E 3 / 2(1)
Q , where the quadrupolar splitting
parameter, , is given by:
Q
1
2QPAS[3 cos2 1 sin 2 cos 2 ) (2.37)
The angles and in Eqn. (2.37) define the orientation of the PAS of the EFG
with respect to the external magnetic field and the quadrupolar splitting
parameter, QPAS , is given in Eqn. (2.36).
As the system presented in Fig. 2.4 contains also multiple-quantum
transitions, it can be observed that the triple-quantum transition is not
broadened to first-order and has a frequency equal to three times the single-
quantum central transition frequency.
More generally, all symmetric, odd-quantum transitions in half-integer (I
= 3/2, 5/2, etc.) spin systems remain unaffected by this first-order quadrupolar
interaction. However, in the case of integer spins, single-quantum transitions
exhibit a perturbation by the quadrupolar interaction to a first-order
approximation, whilst all symmetric, even-quantum transitions remain
unaffected.
Q

44
The method, which can be used to remove the first-order quadrupolar
interaction from the spectrum, is magic angle spinning. As the quadrupolar
interactions are large, therefore fast MAS rates are required to fully remove the
interaction. However, if the MAS rate is too slow the spectrum will be broken
up into a series of spinning sidebands and then magic angle spinning combined
with rotor synchronization [2.16] is necessary in order to observe the isotropic
lines.
Second-order effects of the quadrupolar Hamiltonian
When the magnitude of quadrupolar interaction is large compared to the
Zeeman interactions, then the second-order terms become important to describe
the perturbation of the Zeeman energy levels by the quadrupolar interactions.
The effect of the second-order quadrupolar interaction upon the energy levels
of a spin I = 3/2 is, that both single-quantum (CT and ST) transitions and triple-
quantum transition are perturbed, as shown in Fig. 2.4.
The results of a full calculation of the perturbation to the energy levels
have been published previously [2.13,2.17]. In this calculation the quadrupolar
Hamiltonian is transformed from the PAS of the EFG into the laboratory frame
and this rotation can be described by Wigner rotation matrix elements,
45
D
m,m ,l ( , , ), where , and are the Euler angles [2.18] relating the two
frames of references. The general expression for the second-order quadrupolar
contribution to the energy levels, for the nucleus with spin quantum number I,
is given by:
Em I
(2 ) ( QPAS )2
2 0
{A0 (I, m I)Q( ) A2 (I, m I)Q2 ( , , , )
A4 (I, m I )Q4 ( , , , )
(2.38)
where Al (I, mI) are the spin and energy level dependent coefficients of the
zeroth-, second- and fourth-rank contributions (l = 0, 2 and 4, respectively) and
can be found in Appendix B, while Ql, are the zeroth-, second- and fourth-rank
orientationally-dependent functions, although the l = 0 rank term is purely
isotropic, given by:
Q0 ( ) (1
2
3)
(2.39)
Q2 ( , , , ) (12
3)D0 ,0
2 ( , , )2
3{D0 ,2
2 ( , , )
D0 , 22 ( , , )}
(2.40)

46
Q4 ( , , , ) (12
18)D0 ,0
4 ( , , )10
6{D0 ,2
4 ( , , )
D0 , 24 ( , , )}
35
18 70
2 {D0 ,44 ( , , ) D0 , 4
4 ( , , )}
(2.41)
where D
m,m ,l ( , , ) are Wigner rotation matrix elements. Each Wigner rotation
matrix element, D
m,m ,l ( , , ) , is defined as [2.19]:
D
m,m ,l ( , , ) d
m,m ,l ( ) exp{ i( m m ,)} (2.42)
where d
m,m ,l are the reduced rotation elements [2.20] and are given in
Appendix C.
The second-order quadrupolar contribution to the energy levels consists
of an isotropic quadrupolar shift (proportional to Q0 ( )) and anisotropic
quadrupolar broadening (from Q2( , , , ) and Q
4( , , , ) ). Therefore, in a
powder sample, the effect of the second-order quadrupolar interaction has the
result that NMR peaks are no longer sharp and narrow but they are broadened
and displaced from their chemical shift positions. The position of the NMR
resonance for a quadrupolar nucleus is the sum of the isotropic chemical shift
and the isotropic quadrupolar shift.

47
The method used to remove quadrupolar interaction from the spectrum
can be multiple-quantum MAS which will be described in the following
chapter.

48
Chapter 3: High-resolution techniques and other
methods
3.1. Magic angle spinning
3.1.1. The MAS technique
As discussed in the previous chapter, all NMR interactions have an
anisotropic contribution, which is clearly manifested in solid-state NMR
spectra. In solid-state NMR, experiments are usually performed on powders
comprising a large number of randomly oriented crystallites. The resulting
NMR spectrum is then a superposition of the spectra from all crystallites. This
gives powder spectra with NMR resonances spread over a large range of
frequencies. In order to obtain high-resolution NMR spectra from powders,
experimental manipulations of the sample or spins are often required, such as
the magic angle spinning (MAS) technique.
The MAS technique involves rapid spinning of the sample about an axis
inclined at an angle of 54.74 to the external magnetic field, B0. The rapid
rotation about this particular axis removes most broadening interactions from

49
the NMR spectrum. In the case of spin I = 1/2, if the sample rotation is fast
enough, the anisotropic interactions are averaged out completely. In the case of
quadrupolar nuclei, on the other hand, the magic angle technique is employed
to remove a quadrupolar interaction to a first-order approximation and also
partly removes the effect of the second-order quadrupolar interaction. As
discussed in Chapter 2, Eqn. (2.37) shows that the first-order quadrupolar
coupling has an orientation dependence of (3 cos2 1), therefore when
54.7 , this term gives zero and quadrupolar interactions to a first-order
approximation are averaged to their isotropic values. However, as shown in
Eqns. (2.38) – (2.42), magic angle spinning will also have an averaging effect on
the fourth-rank term in the second-order contribution to the transition
frequency but the resultant average will not be zero. This means that the
second-order quadrupolar interaction cannot be removed completely by MAS.
If the quadrupolar interaction is large, MAS assists resolution but does not
completely remove anisotropic broadening. This technique may be used on its
own, but may also be successfully combined with other line-narrowing
techniques. For example, MAS has been used in combination with multiple-
quantum NMR spectroscopy.
3.1.2. Spinning sidebands

50
Magic angle spinning has now become a routine technique for obtaining
high-resolution NMR spectra of powder samples. However, a powdered solid
consists of a number of crystallites and each of them changes its orientation
with respect to the external magnetic field during this rotation. When the
magnetization vectors from individual crystallites come back into phase,
rotational echoes are formed. As a consequence of this train of rotational spin
echoes, a central peak in the NMR spectrum is flanked on both high and low
frequency by sidebands spaced at the spinning frequency.
For inhomogeneous [3.1,3.2] nuclear spin interactions (e.g., chemical
shift, heteronuclear dipolar coupling, and first-order quadrupolar coupling), the
sidebands are sharp, and thus sidebands patterns from different chemical sites
are relatively easily resolved. Under slow-speed spinning, when the spinning
frequency R is less than the width of static powder pattern, the envelope of
spinning sidebands imitates closely the shape of the static powder pattern. If
the MAS rate, on the other hand, is greater than the width of static pattern, a
centreband at the isotropic frequency (in the case of non-quadrupolar nuclei) is
observed [3.3-3.4].
However, the intensities of the observed spinning sidebands can also be
affected by line broadening due to any motional processes that may be present

51
in the sample. The dynamics to which spinning sideband pattern are sensitive
are those on a time scale of the order of the inverse of width of the sideband
pattern. A dynamic-induced jump in the frequency during the rotor period
resulting from, e.g., the change in quadrupolar splitting for a 2H nucleus due to
a 180° ‗flip‘ of a D2O molecule, results in decreased intensity of each subsequent
rotational echo and a broadening of the spinning sidebands is observed in the
NMR spectrum.
The effect of motional broadening/narrowing of spinning sidebands will
be described in more detail in Chapter 4.
3.2. Multiple-quantum MAS NMR
In 1995, Frydman and Harwood proposed a new method for obtaining
high-resolution NMR spectra of half-integer quadrupolar nuclei, known as
multiple-quantum magic angle spinning (MQMAS). Multiple-quantum NMR
spectroscopy of solids is these days a powerful tool for providing important
structural information about different materials. This method must be
employed in addition to MAS to fully average the effect of the fourth-rank term
in the second-order contribution to the transition frequency.

52
3.2.1. Basic sequence
MQMAS is a two-dimensional technique involving the correlation of
multiple- and single-quantum coherences under MAS conditions.
By this correlation, it is possible to refocus the fourth-rank broadening, whilst
retaining the isotropic shifts.
From Eqn. (2.38) in Chapter 2, it can be seen that the second-order
correction to the frequency of the central transition of a spin I = 3/2 nucleus
under MAS conditions is equal to:
E| 1/ 2
(2) E| 1/ 2
(2) ( QPAS )2
0
{2
5Q0 ( )
54
35d 0,0
4 (54.7 )Q4 ( , , , )} (3.7)
and the frequency of the triple-quantum transition in the same spin system is:
E| 3 / 2
(2) E| 3 / 2
(2) ( QPAS )2
0
{6
5Q0 ( )
6
5d 0,0
4 (54.7 )Q4 ( , , , )} (3.8)
where the zeroth- and fourth-rank orientationally-dependent functions are
given in Eqns. (2.39) and (2.41). The sample rotation about the magic angle
averages the second-rank anisotropic term from Eqn. (2.38) to zero.

53
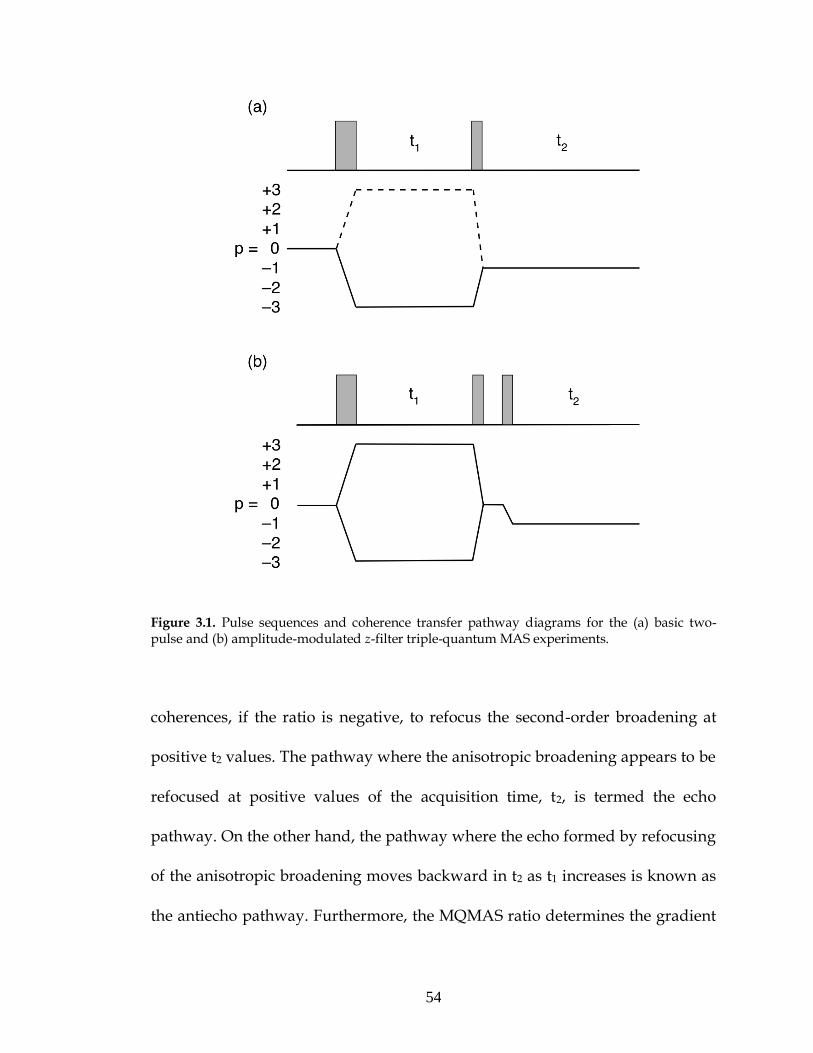
Figure 3.1a shows the basic two-pulse triple-quantum (for spin I = 3/2)
MAS pulse sequence and two possible coherence transfer pathways. In this
experiment, either p = 3 or p = +3 coherence is created first and allowed to
evolve for a time period t1. This coherence is then transformed into observable
single-quantum central-transition coherence (p = 1) by a further pulse. Phase
cycling is used to select a pathway, which is phase-modulated with respect to t1.
It can be seen from Eqn. (3.7) that the time-domain signal for such an
experiment, using the solid coherence transfer pathway and assuming only
quadrupolar interactions, is given by:
s (t1 , t2 ) exp{ i( Q
PAS )2
0
[6
5Q0 ( )
6
5d 0 ,0
4 (54.7 )Q4 ( , , , )] t1}
exp{ i( Q
PAS )2
0
[2
5Q0 ( )
54
35d 0,0
4 (54.7 )Q4 ( , , , )] t2 }
(3.9)
The ratio of the rank l = 4 anisotropic broadening between triple- and single-
quantum coherence is referred to as the MQMAS ratio. The MQMAS ratios for
all available odd-order coherences for half-integer spins are given in Appendix
D. The sign of the MQMAS ratio is very important since it determines the
coherence selection in the MQMAS experiments. The correlation must be the
+|p| and 1 coherence, if the MQMAS ratio is positive, and | p| and 1
54
Figure 3.1. Pulse sequences and coherence transfer pathway diagrams for the (a) basic two-pulse and (b) amplitude-modulated z-filter triple-quantum MAS experiments.
coherences, if the ratio is negative, to refocus the second-order broadening at
positive t2 values. The pathway where the anisotropic broadening appears to be
refocused at positive values of the acquisition time, t2, is termed the echo
pathway. On the other hand, the pathway where the echo formed by refocusing
of the anisotropic broadening moves backward in t2 as t1 increases is known as
the antiecho pathway. Furthermore, the MQMAS ratio determines the gradient

55
Figure 3.2. Pulse sequence and coherence transfer pathway diagrams for the phase-modulated (a) shifted-echo (solid line) and shifted-antiecho (dotted line) and (b) split-t1 triple-quantum MAS experiments (for spin I = 3/2). Phase cycling is used to select the desired coherence transfer pathway.
along which the ridge lineshape lies in the two-dimensional MQMAS spectrum.
The result after appropriate processing of the data in Eqn. (3.9) yields a
spectrum in which one (F1) dimension contains an isotropic spectrum and the
other dimension (F2) contains an anisotropically broadened ridge lineshape
[3.5].

56
Because the signal yielded from this two-pulse MQMAS experiment in
Fig. 3.1a (for the phase-modulated experiment) results in a lineshape that is a
superposition of two-dimensional absorptive and dispersive lineshapes, such
an experiment has not been widely used and different pulse sequences are
currently used to obtain high-resolution pure-absorption lineshapes [3.6].
There exist a number of extensions of the basic MQMAS experiments
including the amplitude-modulated, shifted-echo (whole-echo) or split-t1
experiments.
3.2.2. Amplitude-modulated experiments
In 1996, Fernandez and Amoureux [3.7] described an amplitude-
modulated MQMAS experiment, which allows achieving a purely absorptive
two-dimensional lineshapes. In this method, both echo and antiecho pathways
are selected, as shown in Figure 3.1a. A simultaneous evolution of p = +3 and p
= 3 coherence during t1 period leads to an increase in signal intensity with
respect to the phase-modulated experiment performed by Frydman and
Harwood. It also results in the loss of sign-discrimination in multiple-quantum
coherence evolution period but this can be restored by using the time-
proportional phase incrementation (TPPI) [3.8] or States-Haberkorn-Ruben [3.9]

57
methods. Phase-modulated experiments result if either of the echo or antiecho
pathway is selected and amplitude-modulated experiments result if both
pathways are retained and have equal amplitudes. However, as for spin I = 3/2
nucleus, the equal amplitudes of both pathways can be achieved by the use of a
conversion pulse with a flip angle of 90 , for spin I 3/2, on the other hand,
there is no flip angle which combines both pathways equally for all crystallites
found in a powder sample.
Amoureux et al. [3.10] suggested a modification to the amplitude-
modulated experiment. They proposed a method, known as a z-filter [3.11,3.12],
which allows combining both echo and antiecho pathways with equal
amplitude for systems with spin I 3/2. In this method, a conversion to
observable single-quantum coherence was performed by using two pulses that
proceed via a population state (p = 0). Figure 3.1b shows the pulse sequence
and coherence transfer pathway for the amplitude-modulated z-filter
experiment. The first pulse of the z-filter converts the p = ±3 coherences to
populations with p = 0, while the final pulse generates the desired p = 1
coherence. A projection orthogonal to the ridges in the two-dimensional
spectrum of a z-filtered experiment is normally achieved by first applying a
shearing transformation [3.13-3.14].

58
3.2.3. Shifted-echo experiments
An alternative approach invented by Massiot et al. [3.15] to obtain pure-
phase lineshapes was the "shifted-echo" or "whole-echo" experiment. Figure
3.2a presents the pulse sequence and coherence transfer pathway diagram for
this experiment. This pulse sequence differs from the one in Fig. 3.1a only in the
insertion of a spin echo into the pulse sequence and the echo interval, , by
which the echo is shifted forward in t2, if the echo pathway is selected. Owing
to the shifting of the echo in t2, a whole echo is formed for every value of t1,
rather than the half echo when t1 0 with original phase-modulated experiment.
In the shifted-echo experiment, when the inhomogeneous broadening
dominates the homogeneous broadening [3.15], then the Fourier transform of
the time-domain signal of whole echoes containing a real component that is
symmetric and an imaginary component which is antisymmetric, yielding a
spectrum in which the real part is purely absorptive and the imaginary part is
zero. But if the inhomogeneous broadening is not dominant over the
homogeneous broadening, the symmetry of the echo is lost and the imaginary
part of the lineshape contains dispersive contributions.
3.2.4. Split-t1 experiments

59
Figure 3.3. Pulse sequence and coherence transfer pathway diagrams for the (a) basic two-pulse, and (b) amplitude-modulated z-filter STMAS experiments. ST designates satellite-transition
coherence and CT central-transition coherence.
In the MQMAS experiments described so far, a shearing transformation
must be performed to yield a spectrum where the ridges are parallel to the F2
axis. However, Brown et al. [3.12,3.14] proposed a further modification to the
MQMAS experiment, which allows obtaining a spectrum in which the ridge
lineshapes lie parallel to the F2 axis after the Fourier transformation. Figure 3.2b
presents the pulse sequence and coherence pathway for this approach, for spin I
= 3/2, known as a "split-t1" experiment.

60
Figure 3.4. Pulse sequence and coherence transfer pathway diagrams for the (a) shifted-echo
with the selection of either p = +1 (solid line) or p = 1 (dotted line) and (b) phase-modulated split-t1 shifted-echo STMAS experiments. The coherence pathway is selected in t1 by phase cycling.
The total t1 period is split into periods of multiple-quantum and central-
transition evolution in the ratio of the MQMAS ratio. In such an experiment, all
fourth-rank anisotropic broadening are refocussed at the end of the t1 period
resulting in the appearance of the echo at the same position in t2, irrespective of
the duration of the t1 evolution period, resulting in an MQMAS spectrum with
ridges lying parallel to F2.
Many workers have attempted to improve the efficiency of triple- to

61
single-quantum conversion, with fast-amplitude modulation (FAM) pulses
[3.16] or soft-pulse added mixing (SPAM) [3.17] being two of the more
promising approaches [3.18].
A large number of applications of the MQMAS technique have appeared
in the literature as it is a useful tool for determining structural information. A
number of articles have described MQMAS experiments and their applications
in more detail [3.19-3.22].
3.3. Satellite-transition MAS NMR
Another technique, in which second-order quadrupolar interactions are
removed, is the satellite-transition magic angle spinning (STMAS) experiment,
which has also been used for studying dynamics in solids. The STMAS
experiment makes use of the fact that, although both the central and satellite
transitions are broadened to second order by the quadrupolar interactions, the
magnitudes of these broadenings are related by a simple numerical factor.
Hence, a correlation of the two transitions in a two-dimensional experiment will
allow the removal of the second-order broadening.
The characteristic feature of the STMAS experiment is a requirement of

62
Figure 3.5. Pulse sequence and coherence transfer pathway diagram for a rotor-synchronized double-quantum filtered shifted-echo STMAS (DQF-STMAS) experiment. The second and fourth pulses are selective-inversion pulses for the central transition and hence are applied with low radiofrequency field strength.
very accurate rotor synchronization during the t1 period as this removes the
effects of any second-rank interaction, such as the first-order quadrupolar
interaction, and makes all spinning sidebands overlap on top of each other
[3.23]. Furthermore, the spinning angle must be also accurately (within 0.003 )
adjusted to the magic angle (54.736 ) to fully remove the anisotropic first-order
quadrupolar interaction [3.24].
Figure 3.3a shows the simplest pulse sequence and coherence pathway
diagram for the correlation of satellite and central transitions. Satellite transition
coherences (ST) are excited with a single pulse and evolve in a rotor-
synchronized evolution period t1. Then a second pulse converts them into
central-transition coherence (CT), which is detected in an acquisition period t2.

63
Spectra that result from the experiment shown in Figure 3.3a contain
two-dimensional lineshapes that are "phase twisted", as in the case of the basic
two-pulse phase-modulated MQMAS experiment. The typical way to achieve a
pure-absorption lineshapes in a two-dimensional STMAS spectrum is to
perform amplitude-modulated z-filter experiment, in which echo and antiecho
signals are combined with equal amplitude. Figure 3.3b shows a pulse sequence
and coherence transfer pathway for this experiment. The last pulse is applied
with low radiofrequency field strength, ensuring it is a selective excitation pulse
for the central transition [3.10]. The problem with the loss of sign discrimination
in the t1 period may be solved by use of TPPI or the States-Haberkorn-Ruben
method.
Another approach to the acquisition of pure-absorption lineshapes is a
shifted-echo STMAS experiment, shown in Figure 3.4a. Once again, as in the
MQMAS experiment, the interval is inserted after the second pulse and a
whole echo signal is recorded even when t1 = 0. The interval is chosen to be a
few milliseconds long. The acquisition of the echo or antiecho signal depends
on the selection of the pathway, for example, for spin I = 3/2 nuclei the p = 1
pathway represents the echo signal and then the fourth-rank anisotropic terms
are refocused when t2 = τ + 8/9t1.

64
A modification of the shifted-echo STMAS experiment can be made as
previously in the MQMAS experiment in order to obtain two-dimensional
spectra with ridges lying parallel to the F2 axis without the need for a shearing
transformation. Figure 3.4b presents the pulse sequence and coherence pathway
diagram for a rotor-synchronized split-t1 shifted-echo experiment. This split-t1
approach has the same advantage over the z-filter method as in the case of the
MQMAS experiment. The t1 period is split to include evolution of both satellite
and central transitions. The relative duration of the t1 evolution periods is
determined by the magnitude of the STMAS ratio, given in Appendix E. The
positioning of the second part of the t1 evolution period, either before or after
the last pulse, depends upon the sign of the STMAS ratio [3.24]. When the
STMAS ratio is negative, the second evolution period must be placed before the
last pulse (k" = 0), whilst if this ratio is positive, the second part of the t1
evolution period must be placed after the final pulse (k' = 0), in order to select
the echo pathway. It should be also noted that only the kt1 period must be set
equal to an integral number of rotor periods in order for the satellite-transition
evolution period to remain rotor synchronized.
For nuclei with half-integer spin quantum numbers I 3/2, there exist
more than one pair of satellite transitions available for correlation with the
central transition in an STMAS experiment. For example, for a spin I = 5/2

65
nucleus, there are two distinct sets of satellite transitions (mI = 1/2 ↔ 3/2
and mI = 3/2 ↔ 5/2), denoted ST1 and ST2, respectively. Therefore, in
addition to the diagonal CT CT autocorrelation peak, a
ST1 CT and a ST2 CT ridges should be also observed. A double-quantum
filtered (DQF-STMAS) method can be used to avoid the appearance of
unwanted signals and to simplify the spectrum. Figure 3.5 shows a pulse
sequence and coherence transfer pathway for a double-quantum filtered
shifted-echo STMAS experiment. In this approach, an additional central-
transition selective inversion pulse is employed at the end of the t1 duration,
which effects conversion of inner satellite-transition (ST1) coherence to double-
quantum coherence. As a result, the double-quantum filtered STMAS spectra
are free of diagonal and outer satellite-transition peaks and this has benefits
when the satellite-transition signal decays rapidly due to motional effects or
there is the presence of a distribution of NMR parameters.
It is also possible to refocus fourth-rank anisotropic quadrupolar
broadening using transitions other than the single-quantum satellite transition.
Double-quantum (mI = 1/2 3/2) satellite transitions may be useful in
achieving this refocusing. For example, Kwak and Gan [3.25] described
amplitude-modulated z-filtered DQ-STMAS experiment.

66
Figure 3.6. Pulse sequence for a conventional cross-polarization experiment.
STMAS experiments are in general subject to first-order broadening and
broadening due to motion. Furthermore Dowell et al. [3.26] showed that the
STMAS approach is able to deliver the same resolution afforded by MQMAS
while offering a substantial sensitivity advantage over the MQMAS in the case
of low- quadrupolar nuclei.
3.4. The cross-polarization experiment
Cross-polarization (CP) is a method used to enhance the magnetization
of a low- nucleus, such as 13C, by transfering polarization from an abundant
high- nucleus, such as 1H or 19F. In this experiment, an initial pulse (90°) on the
nucleus I (1H or 19F) creates transverse I-spin magnetization in the rotating
frame, which is then spin-locked by a long period of continuous irradiation
applied along the x axis. Simultaneously, a long pulse is also applied to the S

67
nuclei (eg., 13C), which, in turn, spin-locks the emerging cross-polarized S-spin
magnetization. The acquisition of the S-spin free induction decay follows, often
with decoupling of the I-spin nuclei, as shown in Figure 3.6.
Cross-polarization from I = 1/2 nuclei to quadrupolar nuclei, such as 2H,
11B or 27Al is more complex but has been also demonstrated. One of the variants
of the CP experiment is the combination of the cross-polarization technique and
the MQMAS experiment [3.27,3.28].
3.5. Insensitive Nuclei Enhanced by Polarization Transfer (INEPT)
experiment
One of the most popular pulse sequences for achieving a signal
enhancement of low- nuclei is called Insensitive Nuclei Enhanced by
Polarization Transfer (INEPT). Figure 3.7 shows the basic INEPT pulse
sequence introduced by Morris and Freeman in 1979 for solution-state NMR
[3.29]. Broadly speaking, the first part of the pulse sequence is a spin-echo
sandwich. The spin echo retains evolution under the J coupling, JIS, and spin
magnetization I evolves into a purely anti-phase state. The last 90 pulses
transfer the anti-phase state from I to S. As a result, a spectrum with anti-phase
multiplets is observed. Furthermore, a maximum signal intensity for two

68
Figure 3.7. Pulse sequence for INEPT experiment. The narrow rectangles represent 90° pulses, while the broad rectangles represent 180° pulses.
coupled spin I = 1/2 nuclei is obtained when is chosen to be equal to 1/4JIS.
However, if broadband decoupling on spin I is employed immediately after the
90 pulse, cancellation of the anti-phase multiplets occurs and no signal is
observed [3.30].
Experiments can also be carried out with the refocused INEPT (RINEPT)
pulse sequence [3.31]. The RINEPT pulse sequence is identical to that of the
basic INEPT experiment, apart from the addition of an echo sequence after the
transfer pulses and before the acquisition [3.32]. This allows refocusing of the
anti-phase multiplets and, hence, acquisition of a decoupled S-spin spectrum.
Figure 3.8 shows the RINEPT pulse sequence.
In solid-state NMR spectroscopy, the INEPT technique was first

69
Figure 3.8. Pulse sequence for refocused INEPT (RINEPT) experiment. The narrow rectangles represent 90° pulses, while the broad rectangles represent 180° pulses.
introduced under MAS for through-bond transfers between weakly coupled
nuclei in inorganic materials [3.33]. One of the variant of the INEPT-based pulse
sequences is the double-INEPT pulse sequence, described below.
3.5.1. Double-INEPT
An alternative approach to the INEPT experiment, which was used in
this work in the case of carboranes to excite triple-quantum coherence, is an
approach based on the methods of Yen and Weitekamp [3.34] and Müller [3.35].
Figure 3.9 presents the pulse sequence, which is identical to that of the
heteronuclear single-quantum correlation (HSQC) [3.36] experiment widely
used in solution-state NMR spectroscopy but with a different coherence transfer

70
Figure 3.9. Pulse sequence and coherence transfer pathway diagram for a double-INEPT experiment. The narrow rectangles represent 90° pulses, while the broad rectangles represent 180° pulses.
pathway. Although the HSQC term suggests an experiment with excitation of
only a single-quantum coherence, Kemp-Harper et al. [3.37] discuss its
application to a coupled I = 1/2, S = 3/2 system to excite S-spin multiple-
quantum coherences in solution. The experiment name used in this work is the
double-INEPT suggested in Ref. 41, as two INEPT pulse sequence elements are
used. In the first step, I-spin anti-phase magnetization is created, which is then
transferred to the heteronucleus, S. The magnetization of spin S is left to evolve
during the time period t1. The I-spin coupling and chemical shift effects are
removed by a 180° pulse applied midway through t1. A 90° pulse is then
applied simultaneously to both nuclei at the beginning of the second INEPT
step. This transfers the anti-phase magnetization back to the spin I, which is

71
then refocused over the second time period . The I-spin in-phase
magnetization is then detected during t2 in the presence of spin decoupling.
3.6. Spin-lattice relaxation time measurements
Relaxation is the process by which, over time, the bulk magnetization
returns to its equilibrium position. The process by which the z-magnetization is
returned to its equilibrium value is called longitudinal (spin-lattice) relaxation
(T1). In other words, the spin-lattice relaxation time characterizes the rate at
which the longitudinal Mz component of the bulk magnetization vector
recovers to its equilibrium state (the Boltzmann distribution). The process by
which transverse magnetization decays away to its equilibrium value of zero is
called transverse relaxation (T2). In this thesis only spin-lattice relaxation will be
discussed.
The T1 (spin-lattice) relaxation time is normally measured using the
inversion recovery method. Figure 3.10 shows the inversion recovery pulse
sequence, the behaviour of the magnetization vector M after the first pulse and
during a time interval, , and a graph of the intensities I plotted against
showing how relaxation drives the z-magnetization to its equilibrium. This
experiment consists of two non-selective radiofrequency pulses and a variable

72
time interval, , during which the inverted magnetization vector M recovers
Figure 3.10. Pulse sequence for an inversion recovery experiment, behaviour of magnetization
vector M, and schematic graph of the intensities I plotted against . The red arrows represent
the magnetization vector M. The narrow rectangle represents a 90° pulse, while the broad rectangle represents a 180° pulse.
back to equilibrium. Application of a 180 pulse aligns the magnetization vector
along the (negative) z-axis. After the 180 pulse the magnetization vector will
gradually decay along the +z axis with increasing due to spin-lattice
relaxation. The 90 pulse then rotates M into the xy-plane. Once in the xy-plane,
M precesses about the z-axis, yielding a free induction decay, which is recorded
and Fourier transformed to give an NMR spectrum with peaks of intensity I
proportional to Mz. In this example, the T1 relaxation is an exponential process:

73
Mz( ) M0(1 2exp( / T1)) (3.7)
Therefore if we plot ln(I I ) against then a straight line of slope T1 may be
obtained and the T1 value extracted.
It is important to know that an interval of five times the magnitude of the
spin-lattice relaxation time of the material is usually used to ensure that the
spins have enough time to reach thermal equilibrium before the next 180 pulse
for variable . Typical dipolar T1 values for protons can be between 0.1 and 10
seconds, whereas for solids T1 can be of the order of minutes.

74
Chapter 4: Second-order quadrupolar shifts as an
NMR probe of fast molecular-scale dynamics in
solids
4.1. Dynamics in solids
4.1.1. Introduction
There is currently much interest in the investigation of molecular motion
in solids. NMR spectroscopy is an excellent and well established technique for
studying the dynamics in liquids and solids. In recent years, dynamic NMR
methods have been applied successfully in liquids as well as in solid materials
and a huge advantage of these NMR methods is the large range of dynamic
timescales that can be covered.
Three basic timescale ranges can be distinguished, as presented in Fig.
4.1, which depend on the particular system and magnetic interaction: the slow
molecular motion range with correlation times C > 10–3 s; the intermediate
molecular motion range with 10–9 s < C < 10–3 s; and the fast molecular motion

75
Figure 4.1. Motional timescales and the associated NMR methods for studying dynamics.
range with correlation times of the order of a nanosecond or less, where the
correlation time, C, is defined as the average time it takes for a molecule to end
up at an orientation about one radian from its starting position.
The three ranges can be referred to as the relaxation, spectral and Larmor
timescales, respectively, and may be studied via various types of NMR methods
and experiments. Two-dimensional exchange and spin-spin relaxation time
experiments can be used to study relatively slow motional processes. Motions
with inverse correlation times of the order of the nuclear spin interaction
anisotropy can be assessed via lineshape analysis. Spin-lattice relaxation time
measurements are the usual method to investigate fast molecular reorientation
but in this chapter I will show that multiple-quantum NMR measurements of
isotropic quadrupolar shifts are also a simple way to probe nanosecond
timescale motions in solids.
4.1.2. Slow-timescale motion – the two-dimensional exchange experiment

76
Two-dimensional exchange spectroscopy is invaluable for studying slow
dynamic processes. There is a considerable literature about exchange
experiments [4.1-4.3]. Figure 4.2 shows the basic pulse sequence for this
method. After an initial non-selective 90º pulse, magnetization is created and, in
the case of symmetrical two-site chemical exchange between two species A and
B of equal concentrations and assuming equal spin-lattice relaxation rates and
equal transverse relaxation, the transverse magnetization components during
the t1 (evolution) period are given by:
MA(t1) MA0 exp( i At1 t1 / T2) (4.1)
MB(t1) MB0 exp( i Bt1 t1 / T2) (4.2)
where MA0 and MB0 are equilibrium magnetizations.
When a second pulse with the same phase as the first one is applied, the
longitudinal magnetization stored along z (the direction of the applied
magnetic field) at m = 0 is created:
MzA(t1) MA0 cos At1 exp( t1 / T2) (4.3)

77
MzB(t1) MB0 cos Bt1 exp( t1 / T2) (4.4)
The z components migrate from one site to another due to chemical exchange
for a period m, the mixing time. Spin-lattice relaxation attenuates the
magnetization at the same time. The magnetization at the end of the mixing
period is given by:
M zA ( m ) M zA (t1)1
2[1 exp( 2k m )]exp( m / T1)
M zB(t1)1
2[1 exp( 2k m )]exp( m / T1)
(4.5)
M zB( m ) M zA (t1)1
2[1 exp( 2k m )]exp( m / T1)
M zB(t1)1
2[1 exp( 2k m )]exp( m / T1)
(4.6)
where k is an exchange rate (k = kAB = kBA).
The final 90º pulse converts these longitudinal components into
observable magnetization. After two-dimensional Fourier transformation the
resulting two-dimensional spectrum is observed, correlating the characteristic
frequency the spin had during t1 period with that which it subsequently had in
t2.

78
Figure 4.2. The basic pulse sequence for two-dimensional exchange experiment to study motion.
If there is no exchange during the m period, only diagonal peaks appear
in the spectrum. The existence of cross-peaks corresponds to chemically
exchanging species because it means that the offset frequency after m is
different from the initial one. This is sufficient proof that a dynamic exchange
process is taking place in the sample. Furthermore the cross-peak amplitudes
are dependent on the length of the mixing time and can provide a quantitative
estimate of the exchange rate.
Jeener et al. [4.3] demonstrated the use of two-dimensional NMR
spectroscopy as a method for the investigation of chemical and magnetic rate
processes in solution- and solid-state NMR and they described in detail how
this two-dimensional exchange experiment is applicable to slow motions. Cahill
et al. [4.4] investigated lithium dynamics in monoclinic Li3V2(PO4)3 through
variable-temperature 7Li magic-angle spinning (MAS) NMR spectra and
exchange-based solid-state NMR studies. Two-dimensional exchange NMR

79
spectroscopy has also been used to probe mobility in fluoride-ion conductors
such as α-PbF2 and BaSn-F4.[4.5,4.6]. Recent studies have demonstrated the use
of 17O and 6Li 2D EXSY to study ion motion in conductors Bi2WO6 and Li7MnN4,
respectively.[4.7,4.8]
4.1.3. Intermediate-timescale motion – lineshape analysis
In the case of intermediate molecular motion (on the spectral timescale),
NMR spectra may exhibit characteristic lineshape effects. A powder pattern can
be considered as being made up of an infinite number of overlapping sharp
lines, arising from each different molecular orientation present in the sample.
Therefore, any motion that changes the orientation of a molecule influences
each resonance line and causes a distortion of the powder pattern which
depends on the correlation time, the geometry of the molecule and, in the case
of MAS NMR spectra, on the spinning rate. By simulating these effects and
fitting the corresponding spectra it is possible to obtain detailed information
about the mechanism of molecular motion.
As mentioned previously, the intermediate molecular motion regime
includes processes with a correlation time C being between 1 ms and 1 ns.
Because of the wide range on the timescale, we can distinguish between two

80
Figure 4.3. Spectra for two-site exchange, in intermediate (slow and fast) exchange regime.
different sub-regimes. There is a slow intermediate regime where the rate
constant is slower than half of the width of the powder pattern (in other words
half of the frequency difference between the two peaks) and where motional
broadening is observed. The second sub-regime is the fast intermediate regime
where the correlation time is much greater than the nuclear spin anisotropy,
corresponding to a rate constant faster than half of the width of the powder
pattern, and where motional narrowing takes place. In the slow intermediate
range, if the rate constant increases, the decay of the FID is faster, leading to
broader NMR peaks until a "coalescence point" is reached. At that point the rate
constant is approximately equal to half of the frequency difference between two
lines. On the other hand, in the fast intermediate regime, the decay of the total
transverse magnetization gets slower as the rate of molecular reorientation
increases, reducing the NMR peak width. The effect described above, using the
example of symmetric two-site exchange, is shown graphically in Figure 4.3.

81
Since NMR has long played an important role in the study of molecular
motion in the solid state, there are a lot of published studies, with the earliest
dating from the 1950s [4.9,4.10]. The first studies of dynamics in the solid state
relied, in general, on the analysis of powder lineshapes obtained from static
samples, presenting low-resolution spectra. Further discoveries in solid-state
NMR, such as the MAS experiment, described in Chapter 3, have made
available high-resolution spectra and thus allow the possibility for much more
detailed analysis of molecular motion in solids on the spectral timescale. The
effect of molecular reorientation on the lineshape in MAS spectra was first
discussed quantitatively by Maricq and Waugh [4.11]. They explained how the
MAS technique fails in the presence of dynamic reorientation and this in turn
causes an increase in the linewidth.
One piece of evidence for dynamics is a motional broadening of
quadrupolar satellite-transition spinning sidebands. As pointed out in Chapter
3, the intensities of spinning sidebands are dependent on the motional process
in the sample. The important point is that spinning sidebands patterns are
sensitive only to motions on the order of the width of the spinning sideband
patterns (i.e., on the s timescale)and they are dependent on the spinning rate
and nuclear spin anisotropy. The effect of molecular reorientation on rotational
echoes is shown in Figure 4.4. Ashbrook et al. [4.12] presented the influence of

82
Figure 4.4. The effect of dynamics on rotational echoes in a MAS experiment. Rotational echoes form when magnetization vectors from individual crystallites come back into phase. Molecular reorientation results in decreased intensity of successive rotational echoes.
dynamic reorientation on STMAS spectra by comparing them with MQMAS
spectra in 17O (I = 5/2) NMR spectroscopy of two materials, chondrodite
(2Mg2SiO4 Mg(OH)2) and clinohumite (4Mg2SiO4 Mg(OH)2). Antonijevic et al.
have used this method later for investigation of dynamics on the s timescale in
the aluminophosphate material AlPO-14 [4.13]. Furthermore, these authors
have introduced a simple model to illustrate and quantify the effect of
dynamics on linewidths in MAS NMR spectra and, in 2008, Thrippleton et al.
presented its wider application and fully justified the use of this model [4.14].
The most detailed investigations of molecular motion have involved 2H
NMR experiments. Some papers have discussed both theoretically as well as

83
experimentally a number of examples of how molecular motion may influence
the 2H NMR lineshape [4.15,4.16]. The methodology has been developed for
both non-rotating and rotating samples and the simulations may involve
different models of molecular motion.
There are several advantages of using deuterium. The low natural
abundance makes selective enrichment possible in many molecular systems.
The deuteron is a spin I = 1 nucleus that usually has a relatively small
quadrupolar coupling and thus experiments are feasible for most systems,
while the 2H line broadening is sensitive to motion on the microsecond
timescale. Because the 2H quadrupolar interaction is determined by the local
electron distribution, the spectra are often readily interpretable in terms of the
geometry of the molecular system.
The 2H lineshape can be obtained using the quadrupolar-echo
experiment [4.17] as discussed by Davis et al. [4.18] in their investigation of
phospholipid hydrocarbon chains. Powder NMR spectra of static samples
consist of doublet patterns, the doublet arising from the two possible spin
transitions (spin I = 1, mI = 1 0). These spectra are often called Pake patterns
with the splittings between the perpendicular edges of the powder patterns
equal to (3/4)CQ, where CQ is the deuterium quadrupole coupling constant

84
defined in Eqn. (2.34). Jelinski et al. [4.14] have used 2H NMR spectroscopy to
elucidate two distinct motional regions in copolymers of selectively deuterated
poly(butylene terephthalate) (PBT) and poly(tetramethyleneoxy terephthalate)
(PTMT). Specifically, the PBT hard segments are characterized by a broad line
pattern that arises as a result of limited molecular motion. However, the PTMT
amorphous phase undergoes more extensive motion, as was indicated by an
extreme narrowing of the deuterium spectrum.
2H NMR spectroscopy has become one of the most useful methods in
studying intermediate-timescale motion and is described in more detail by
Duer et al. [4.20]. Cutajar et al. [4.21] used 2H double-quantum MAS NMR
experiment as a potential technique to probe molecular motion in the
intermediate motional regime for investigations of oxalic acid dihydrate-d6,
sodium tetrathionate dihydrate-d6 and poly(methyl methacrylate-d8) (PMMA).
Solid-state 2H NMR spectroscopy has been also used to probe the dynamic
disorder of hydroxyl deuterons in a synthetic sample of deuterated hydroxyl-
clinohumite (4Mg2SiO4·Mg(OD)2). [4.22]
Other applications of 2H NMR spectroscopy, not only in studies of
dynamics, are discussed in Ref. 4.23-4.26.

85
4.1.4. Fast-timescale motion – spin-lattice relaxation time and second-order
quadrupolar shift
Spin-lattice relaxation time measurements
Measurement of spin-lattice relaxation rates can provide information on
faster motions, which are inaccessible through quadrupolar-echo lineshapes.
Longitudinal relaxation was explained in Chapter 3 and here it will be shown
that the spin-lattice relaxation time, T1, is a useful source of information on
molecular dynamics and is sensitive to motions with rates near the Larmor
frequency.
The motion of a molecule can be characterized by a correlation time, C,
defined previously. Small molecules tumble very rapidly and therefore have
short C, while large molecules tumble slowly and therefore have long C. It
means that the correlation times for solutions, where rapid tumbling is present,
are often very short and the condition 0 c 1 is satisfied. This condition is
known as extreme narrowing limit. On the other hand, in solids, where there is a
high degree of restricted motion, the correlation times are much longer than for
liquids and the condition, known as the slow motion limit, where 0 c 1, is
satisfied. When the motion has a correlation time about equal to about 1/ 0 the

86
spin-lattice relaxation is most efficient.
In summary, spin-lattice relaxation times are a sensitive probe of
molecular motion within a molecule. Analysis of relaxation times can tell us
whether a given chemical environment is in a rigid portion of the molecule or in
a flexible part of the molecule.
Because the motional frequency can range from ten to hundreds of MHz,
spin-lattice relaxation experiments can be used to provide dynamic, structural
and morphological information about many types of systems. T1 values are
particularly sensitive to high-frequency side-chain motion, as was found by
Edzes and Veeman in their studies of the effects of plasticizers on the spin
lattice relaxation of carbon nuclei in solid poly(methyl methacrylate) (PMMA)
[4.27]. Koening et al. [4.28] have used T1 spin-lattice times to characterize the
motional difference between and phases of poly(buteleneterephthalate).
Schaefer et al. [4.29], in turn, have shown that T1 values can be used to study the
effect of thermal history on molecular motion in solid polymers. Measurement
of this spin-lattice relaxation rate anisotropy has been also used in the case of 2H
NMR in model membrane systems [4.30,4.31].
These and other examples represent important applications of spin-

87
lattice relaxation experiments in the investigation of dynamic behaviour in a
variety of systems.
Second-order quadrupolar shift
The coupling between the nuclear quadrupole moment and the electric
field gradient across the nucleus results in an anisotropic interaction of spatial
rank two, conventionally parameterised by a coupling constant CQ and an
asymmetry . In high-field NMR, this quadrupolar interaction can be treated
using average Hamiltonian theory. The second-order correction to the
dominant Zeeman Hamiltonian can be decomposed into three terms, with
spatial ranks zero, two and four as shown in Eqn. (2.38). The second- and
fourth-rank terms result in an inhomogeneous line-broadening, while the rank
zero term causes the well known isotropic quadrupolar shift as shown in
Section 2.4 [4.32,4.33].
Since the average Hamiltonian is obtained by averaging over the Larmor
period, the effect of molecular-scale dynamics on the quadrupolar shift depends
on the timescale of any motion compared with the Larmor period. In the case of
motion that is much slower than the Larmor frequency 0, the average
Hamiltonian expansion remains valid and the spectrum can be determined by

88
calculating the time-averaged second-order Hamiltonian. Thus, if the motional
rate constant is significantly larger than the second-order parameter 2 CQ2/ 0
(but still much smaller than 2 0), the second- and fourth-rank terms are
averaged and, in the case of isotropic motion, are reduced to zero. The zeroth-
rank term, however, is orientation independent and unaffected by motion on
this timescale; the isotropic quadrupolar shift is therefore unaffected [4.34].
In the opposite case, where motion is much faster than the Larmor
precession, the effect of orientational averaging must be assessed before the
average Hamiltonian is calculated. This means that both the second-order
broadening and the isotropic quadrupolar shift are affected and, since the full
quadrupolar Hamiltonian is second rank, rapid isotropic motion averages both
to zero. Molecular-scale tumbling on the nanosecond timescale or faster can
therefore have a measureable influence on the centre-of-gravity shifts of
quadrupolar nuclei. This effect has been extensively studied in solution, where
it is commonly referred to as the "dynamic shift" [4.35-4.38]. As pointed out by
Werbelow and London [4.38], however, the phenomenon is better described as
a quenching of the isotropic second-order quadrupolar shift by rapid tumbling.
In solids, in contrast, this quenching effect is less well known, although
temperature-dependent isotropic quadrupolar shifts have been observed,
especially in single-crystal and static-powder NMR studies of ionic conductors
89
[4.39-4.41].
4.2. Closo – carboranes
4.2.1. Introduction
The closo-carborane molecules C2B10H12 and their derivatives have
attracted widespread interest because of their chemical properties. They form
so-called ―plastic crystals‖. In plastic crystals, molecules are arranged within a
lattice, but are free to re-orientate. The closo-carborane molecules C2B10H12
approximate regular icosahedra of CH and BH units and exist as three
structural isomers. The isomers (shown in Fig. 4.5) are the ortho (OCA), meta
(MCA) and para (PCA) isomers. The carbon atoms in OCA, MCA and PCA are
separated by one, two and three bonds respectively. The highest temperature
phase occurs above 275 K for OCA, 285 K for MCA and 300 K for PCA; X-ray
diffraction studies of OCA and MCA reveal a face-centred cubic lattice for this
phase. This is a plastic-crystalline phase, in which the molecular reorientation is
rapid and isotropic and the NMR spectra are narrow and liquid-like. Below this
temperature, there is a phase where the symmetry of the lattice is reduced,
probably to orthorhombic symmetry for OCA and MCA. Rapid molecular
reorientation continues but is thought to be anisotropic. At even lower

90
temperatures (below 160-200 K for OCA, 170 K for MCA and 238 K for PCA)
less well characterized phases exist in which the motion of the molecules is
reduced [4.42,4.43]. Following the literature, this chapter will refer to the high,
medium and low temperature phases as I, II and III, respectively.
The carboranes are ideal models for studying reorientation in solids. The
carboranes contain boron atoms, which may be conveniently studied by 11B
NMR. 11B has spin I = 3/2 and hence is sensitive to electric field gradients.
Although a number of NMR studies exist in the literature, many of these are
over 20 years old and therefore do not exploit modern NMR methods, such as
magic angle spinnning (MAS) and multiple-quantum MAS (MQMAS). This
chapter will show that these and other techniques provide a clear window on
the structure and dynamics of the carboranes.
4.2.2. Results and discussion
Since the reorientation is thought to be isotropic at high temperature and
anisotropic at low temperatures, the first step of the investigation was to record
one-dimensional 11B MAS NMR spectra at a variety of temperatures to observe
how the lineshapes and shifts change with temperature.

91
Figure 4.5. Chemical structure of the (a) ortho, (b) meta and (c) para isomers of the closo-carborane molecules C2B10H12. The boron (white circles) and carbon atoms (black circles) form an icosahedron. Hydrogen atoms have been omitted.
Figures 4.6, 4.7 and 4.8 show 11B MAS spectra of the three carborane
isomers, recorded as a function of temperature. The number of peaks observed
is equal to the number of unique boron environments for each isomer, and the
peaks in one-dimensional 11B MAS spectra have been assigned by comparison
with solution-state NMR data [4.44]. 11B MAS spectra of none of the
investigated carboranes exhibit second-order quadrupolar powder patterns.
The high-temperature carborane spectra resemble liquid-state NMR spectra and
are thus consistent with the assumption of molecules undergoing rapid
isotropic reorientation.
The 11B linewidth increases with decreasing temperature for all three
isomers and, below the I–II phase transition, the spectra of all three isomers
exhibit significantly broader lines (OCA: ~600 Hz, MCA: 500–1000 Hz, PCA:

92
Figure 4.6. (a) Variable-temperature 1H-decoupled 11B MAS NMR spectra of OCA and (b) 1H-decoupled 11B MAS NMR spectra of the low temperature phase of OCA recorded using a wide spectral width. The 11B radiofrequency field strength was between 145 and 165 kHz (90° pulse
duration of 1.5–1.75 s), while 1H decoupling was applied with a field strength of ~50 kHz. The recycle interval (in the range 1–4 s) was optimised to ensure that the samples were fully relaxed prior to excitation. Spectra are the result of averaging 8 transients.
~1200 Hz). This is consistent with the transition to a more solid-like phase,
where molecular reorientation is anisotropic and/or slower, so that the
broadening interactions are not fully averaged. Temperature also affects the
frequencies of the peaks. For OCA, a shift of the four main peaks to low
frequency is observed, which increases as the sample is cooled to lower

93
temperatures at the I–II transition, while for MCA and PCA the change occurs
more gradually below the phase transition. The frequency changes are likely to
be due to ―dynamic shift‖ effects, rather than changes in the chemical shift as
will be proved later.
Figures 4.6b, 4.7b and 4.8b show that for all three isomers, very little
spinning sideband intensity is apparent in phase I and the few sidebands
observed are likely to result from shimming imperfections or susceptibility
effects. This is consistent with rapid isotropic motion, which averages out the
quadrupolar interaction and causes the satellite-transition signal to be
concentrated in the centreband. Below the I-II phase transition temperature,
many more spinning sidebands appear, spanning approximately 300 kHz for
OCA and MCA and 80 kHz for PCA, consistent with more anisotropic motion,
resulting in incomplete averaging of the quadrupolar interaction. It is
interesting to note that the spinning sidebands pattern for PCA is significantly
narrower than for the other two isomers. This observation is consistent with
rapid anisotropic reorientation about the C5 symmetry axis, which would
average the quadrupolar coupling constant to a small fraction of its instrinsic
value; alternatively, the reorientation may simply be more isotropic in PCA.
A further point to note in Figs. 4.6b, 4.7b and 4.8b is that the spinning

94
Figure 4.7. (a) Variable-temperature 1H-decoupled 11B MAS NMR spectra of MCA and (b) 1H-decoupled 11B MAS NMR spectra of the low temperature phase of MCA recorded using a wide
spectral width. The 11B radiofrequency field strength was 165 kHz (90° pulse duration of 1.5 s), while 1H decoupling was applied with a field strength of ~50 kHz. The recycle interval (in the range 1– 4 s) was optimised to ensure that the sample was fully relaxed prior to excitation. Spectra are the result of averaging 8 transients.
sidebands increase in width as the temperature is reduced, until they disappear
into the baseline. A motional broadening of quadrupolar satellite-transition
spinning sidebands was explained in one of the previous subsections and this is
likely to be the result of motional broadening, which causes the linewidths to
increase as the rate of reorientation approaches the size of the quadrupolar

95
Figure 4.8. (a) Variable-temperature 1H-decoupled 11B MAS NMR spectra of PCA and (b) 1H-decoupled 11B MAS NMR spectra of the low temperature phase of PCA recorded using a wide spectral width. The 11B radiofrequency field strength was between 145 and 155 kHz (90° pulse
duration of 1.6–1.75 s), while 1H decoupling was applied with a field strength of ~50 kHz. The recycle interval (in the range 1– 3 s) was optimised to ensure that the samples were fully relaxed prior to excitation. Spectra are the result of averaging 8 transients.
coupling interaction. This implies that molecular reorientation remains faster
than ~ 1 MHz immediately below the I–II phase transition.
It is not possible to determine from one-dimensional 11B MAS spectra
whether the observed shifts include isotropic quadrupolar shifts, or whether

96
Figure 4.9. Variable-temperature 1H-decoupled 11B MQMAS NMR spectra of the OCA obtained using the pulse sequence in ref 34. The +3 diagonal is shown as a dotted line in each spectrum.
The States–Haberkorn–Ruben method of 1 sign discrimination was used and pure-absorption two-dimensional lineshapes by means of a hypercomplex Fourier transform were obtained. The
triple-quantum excitation period, ex, was optimised at each temperature in the range 10–40 s. 24 transients were averaged for each t1 value, with a maximum t1 of 1.5 ms and z-filter delay of
5 s. A 11B radiofrequency field strength of 140 kHz and a 1H decoupling field strength of ~50 kHz were used.
they are entirely accounted for by a temperature dependence of the isotropic
chemical shifts. This problem may be solved by measuring the frequencies of
two different transitions at the same magnetic field, as suggested by Eliav et al.
for measuring dynamic shifts in solution-state NMR [4.45]. Convenient choices
for a spin I = 3/2 nucleus are the triple-quantum (mI = 3/2 –3/2) and single-
quantum central (mI = 1/2 –1/2) transitions, since they can be measured
simultaneously using the well known MQMAS technique in the solid state of
Frydman and Harwood [4.46].

97
Figure 4.10. Variable-temperature 1H-decoupled 11B MQMAS NMR spectra of MCA obtained using the pulse sequence in ref 34. The +3 diagonal is shown as a dotted line in each spectrum.
The States–Haberkorn–Ruben method of 1 sign discrimination was used and pure-absorption
two-dimensional lineshapes by means of a hypercomplex Fourier transform were obtained. The
triple-quantum excitation period, ex, was optimised at each temperature in the range 10–20 s.
24 transients were averaged for each t1 value, with a maximum t1 of 2.5 ms and z-filter delay of 5
s. A 11B radiofrequency field strength of 140 kHz and a 1H decoupling field strength of ~50
kHz were used.
The total isotropic shift is the sum of the isotropic chemical shift and the
isotropic second-order quadrupolar shift. It can be observed from Eqns. (2.38)
and (2.39) that the isotropic quadrupolar shift is proportional to
A0 (I, m I )( Q
PAS )2
2 0
(12
3) where Q
PAS is given in Eqn. (2.36). Therefore, in the

98
absence of motion and for spin I = 3/2 nuclei, the isotropic frequencies of the
triple-quantum ( TQ) and single-quantum central transitions ( SQ), in units of
Hz, can be written relative to a reference frequency as a function of the
quadrupolar product:
CT CS 0 1
40 0
PQ
2 (4.7)
TQ 3 CS 0 3
40 0
PQ
2 (4.8)
where CS is the isotropic chemical shift and PQ is the quadrupolar product and
is equal to:
PQ CQ (1 2 / 3)1 2 (4.9)
In the absence of the quadrupolar shift, the isotropic shifts for the triple-
quantum transitions should be exactly three times larger than the isotropic
shifts for the single-quantum transitions and the peaks will lie on the line
1 3 2 in the MQMAS spectrum. Peaks with an isotropic quadrupolar shift
are shifted to low frequency in the single-quantum 2 dimension and to high
frequency in the triple-quantum 1 dimension, displacing the peaks "below" the
1 3 2 line in the conventional representation.

99
Figure 4.11. Variable-temperature 1H-decoupled 11B MQMAS NMR spectra of PCA obtained using the pulse sequence in ref 34. The +3 diagonal is shown as a dotted line in each spectrum.
The States–Haberkorn–Ruben method of 1 sign discrimination was used. The triple-quantum
excitation period, ex, was optimised at each temperature in the range 10–25 s. 24 transients
were averaged for each t1 value, with a maximum t1 of 3.8 ms and z-filter delay of 5 s. A 11B
radiofrequency field strength of 160 kHz and a 1H decoupling field strength of ~50 kHz were
used. The 11B MQMAS NMR spectrum of PCA recorded at 223 K was obtained using the same pulse sequence but with one pulse instead three pulses to excite triple-quantum coherence. 24
transients were averaged for each of 32 t1 values, with an increment of 25 s. All pulses used
were non-selective, with the exception of the final 90° pulse, which was selective for the central transition.

100
MQMAS spectra of OCA, MCA and PCA recorded over the specified
temperature range are shown in Figures 4.9, 4.10 and 4.11. Triple-quantum
coherences were excited using a three-pulse
90
ex / 2 18090
ex / 2 90
90 excitation "sandwich" [4.47] as only
small quadrupolar splittings were expected. It can be observed that the peaks
do not lie on the line 1 3 2 and so do exhibit dynamic shifts. These increase
as the temperature is reduced, although the magnitude and temperature
dependence varies from site to site. The quadrupolar product PQ can be
calculated using Eqs. (4.7) and (4.8) by measuring the 1 and 2 frequencies of a
peak. In the presence of motion, however, the value of PQ measured by this
approach is modified and therefore it is labelled PQeff , as described in reference
[4.48]. This can range from zero, if the quadrupolar interaction is averaged by
rapid isotropic motion, to the intrinsic PQ observed in the absence of dynamics.
Intermediate PQeff values should be observed when the motion occurs on a
timescale comparable to the Larmor period or when the motion is anisotropic.
Figure 4.12 shows the variation of PQeffas a function of temperature for each
resolved MQMAS peak.
For OCA, intermediate values of PQeff, which increase with decreasing
temperature, are observed, implying that the rate of motion in phase II is of the

101
(a) (b)
(c)
Figure 4.12. Variation of PQeff
as a function of temperature in the specified range for the
chemically-distinct 11B environments of (a) OCA, (b) MCA and (c) PCA. Note that the peaks representing the 3,6 and 4,5,7,11 environments of OCA overlap in the low-temperature phase and are indistinguishable in the MQMAS spectra. Dashed lines are the intrinsic PQ values predicted by an ab initio calculation [4.49].
same order of magnitude as the Larmor frequency. At the lowest used
temperature, 223 K, PQeff for the 9,12 environment (boron 9 and 12 as shown in
Figs. 4.5 and 4.6) remains significantly lower than the calculated intrinsic PQ ,
indicating that motion is not fully quenched at the lowest temperature
observed.
For MCA, the PQeff values remain closer together than for OCA, are near-

102
(a) (b)
(c)
Figure 4.13. Triple-quantum (11B) – single-quantum (1H) correlation MAS spectrum of (a) OCA
(293 K), (b) MCA (293 K) and (c) PCA (303 K). An excitation interval of 2 ms and a recycle
intervals in the range 1–2 s were used. 48 transients were averaged for each t1 value with a
maximum t1 of 6.4 ms. The 11B radiofrequency field strength was between 140 and 166 kHz during the RF pulses and 50 kHz during 11B decoupling.
zero at high temperature, and are closer to the calculated intrinsic PQ values at
low temperature. These observations suggest that molecular reorientation is
more isotropic than for OCA at high temperatures, and is slower at low
temperature.
For PCA, PQeff falls steadily almost to zero as the temperature is increased.
This could suggest that reorientation is fast and relatively isotropic just below

103
(a) (b)
(c)
Figure 4.14 11B spin-lattice relaxation times (T1) as a function of T for three isomers of carborane, (a) OCA (b) MCA and (c) PCA. The 11B radiofrequency field strength of ~150 kHz
was used, corresponding to a 90° pulse length of ~1.6 s. The recovery intervals used were
optimised for each temperature and isomer, within a range of 3 s – 5 s.
the I–II phase transition, which is consistent with the suggestion of Beckman
and Leffler [4.43] that the absence of an electrostatic dipole moment in PCA
leads to reduced intermolecular interactions and less anisotropic reorientation
compared with the other isomers.
Because the use of a three-pulse excitation "sandwich" to excite triple-
quantum coherence did not yield any signal at high temperature due to
averaging of the quadrupolar interactions to nearly zero, therefore an

104
alternative approach (double-INEPT) can be employed in this regime (the
method described in Chapter 3).
Figure 4.13 shows triple-quantum (11B) – single-quantum (1H) correlation
MAS spectra of OCA, MCA and PCA recorded using the double-INEPT pulse
sequence shown in Fig. 3.9, together with the 11B triple- and single-quantum
frequencies (the latter in parentheses). The single-quantum frequencies were
extracted from the one-dimensional spectra in Figs. 4.6, 4.7 and 4.8. For each of
the isomers, the triple-quantum frequency was found to be three times the
single-quantum frequency, indicating a PQeff of zero, and implying isotropic
motion at a rate faster than the Larmor frequency.
The spin-lattice relaxation time, T1, is sensitive to fast-timescale motion,
as mentioned in subsection 4.1.4 of this chapter and, therefore, the temperature
dependence of the 11B spin-lattice relaxation time, T1, was also investigated in
OCA and MCA between 223 and 293 K and in PCA between 223 and 333 K,
employing the inversion-recovery technique described in Chapter 3. The
temperature dependence of T1 for the three isomers is shown in Fig. 4.14. The
OCA and MCA undergo a single phase transition in the temperature range
studied whereas the PCA undergoes two transitions. As the temperature is
reduced in phase I, T1 decreases, suggesting that the reorientation rate exceeds

105
the 11B Larmor frequency (128.4 MHz) [4.50].
Below the I–II phase transition, longitudinal relaxation is more rapid but
T1 increases as the temperature is reduced, implying molecular reorientation at
a rate below the Larmor frequency. Phase III of PCA has a much longer T1 than
the higher temperature phases, consistent with significantly retarded
reorientation. The experimental results are in good agreement with the data
reported for OCA, MCA and PCA previously [4.43,4.51-4.54].
Since 11B MAS spectra of none of the investigated carboranes exhibit
second-order quadrupolar powder patterns, we were interested in comparing
these with a carborane where there were no dynamics and a second-order
lineshape could be observed. Therefore, the OCA derivative 9,12-diiodo-
orthocarborane was synthesized and the two heavy iodine atoms that destroy
the near-icosahedral symmetry of the molecule were expected to restrict
molecular reorientation.
The one-dimensional 11B MAS spectra of solid 9,12-diiodo-
orthocarborane in Figure 4.15 do not exhibit a second-order quadrupolar
powder pattern and bear little resemblance to those of the unsubstituted
carboranes, with no site-resolution and a much greater linewidth of ~ 3 kHz.

106
Figure 4.15. (a) Structure and (b) variable-temperature 1H-decoupled 11B MAS NMR spectra of 9,12-diiodo-ortho-carborane. The 11B radiofrequency field strength was 175 kHz (90° pulse
duration of 1.0 s), while 1H decoupling was applied with a field strength of ~50 kHz. The recycle interval of 60 s was used. Spectra are the result of averaging 4 transients.
Furthermore, the spectra show no temperature dependence, suggesting

107
an absence of motion on the ms – ns timescale.
This two-dimensional 11B MQMAS spectrum was recorded at room
temperature using the standard MQMAS pulse sequence. Figure 4.16 presents
the two-dimensional MQMAS spectrum of 9,12-diiodo-ortho-carborane. The
spectrum shows single broad peak and it can be observed that this peak does
not lie on the line 1 3 2 suggesting the possibility of existence of the
quadrupolar shift as was found for all three isomers of carborane at low
temperatures but further investigations would be necessary to explain it in
more detail.
4.2.3. Conclusion
The results presented here show that multiple-quantum NMR
measurements of isotropic quadrupolar shifts are a simple way to probe
nanosecond timescale motions in plastic solids. The molecular reorientation can
be easily and semi-quantitatively probed by using both high-resolution MAS
and multiple-quantum MAS NMR spectroscopy.
In this work, the one-dimensional 11B MAS NMR spectra at variety of
temperatures were recorded and, even if the second-order quadrupolar powder

108
Figure 4.16. 1H-decoupled 11B MQMAS NMR spectrum of 9,12-diiodo-ortho-carborane. 96
transients were averaged for each of 64 t1 values, with a t1 increment of 50 s and with a recycle interval of 60s. A 11B radiofrequency field strength of 150 kHz and a 1H decoupling field strength of ~50 kHz were used.
patterns were observed for none of the investigated carboranes, the lineshapes
and the frequencies of the peaks were affected. The 11B linewidth changes
within the specified temperature range for each isomer and the spectra have
significantly broader lines in the low temperature phase. It means that at high
temperatures, molecules undergo rapid isotropic reorientation while, in the low
temperature phase, a more solid-like phase, where molecular reorientation is
slower and anisotropic, is present.
The effect of the motion on the spinning sidebands intensities was also
described and it was shown that, at high temperature, the rapid isotropic
motion averages out the quadrupolar interaction and causes the satellite-

109
transition signal to be concentrated in the centre band. On the other hand, at
low temperature, many more spinning sidebands appeared, consistent with
more anisotropic motion, resulting in incomplete averaging of the quadrupolar
interaction.
In order to confirm a presence of the dynamic shift, the MQMAS spectra
of OCA, MCA and PCA were recorded. The peaks in the variable-temperature
MQMAS spectra of the three isomers do not lie on the line 1 3 2 and, hence,
do exhibit dynamic shifts. As at high temperature the quadrupolar interactions
are averaged to nearly zero and it was not possible to record MQMAS spectra
in this regime, using any of the MQMAS pulse sequence described in Chapter 3,
therefore a double-INEPT approach was employed. In each double-INEPT
spectrum, the triple-quantum frequency was found to be three times the single-
quantum frequency, indicating a PQeff of zero and showing no dynamic-shift
effect.
The temperature dependence of the 11B spin-lattice relaxation time, T1,
shown in Fig. 4.14, reveals a single phase transition for OCA and MCA and two
transitions for PCA in the temperature range studied. Furthermore, the
investigations of T1 show that the reorientation rate exceeds the 11B Larmor
frequency in phase I while molecular reorientation at a rate below the Larmor

110
frequency is suggested below the I–II phase transition.
Additionally, the one-dimensional 11B MAS and two-dimensional 11B
MQMAS spectra of solid 9,12-diiodo-orthocarborane were recorded in order to
find a sample that shows the effect of dynamic shift and the spectrum with
second-order broadened lineshape. It was observed that the one-dimensional
spectrum does not exhibit a second-order quadrupolar powder pattern.
However, the two-dimensional MQMAS spectrum of 9,12-diiodo-ortho-
carborane shows a single broad peak which does not lie on the line 1 3 2
suggesting the existence of the quadrupolar shift.
In summary, the quadrupolar shifts are a good probe of motion even if
we are not able to observe a second-order quadrupolar lineshape. In contrast to
methods relying on the measurement of T1, T1r or T2 relaxation parameters, the
data can be quickly interpreted by visual inspection of two-dimensional NMR
spectra.

111
Chapter 5: Dynamic behaviour of microporous
solids
5.1. Introduction
Solids can exhibit porosity and the porous solids are particularly
interesting materials when the size of the pores is comparable to the size of
molecules. Therefore, the synthesis of such structures with different size and
topology of pores gives unlimited possibilities for designing and modifying
such materials. Many studies have been undertaken in the area of synthesis and
characterization and a variety of applications have been explored including
adsorption ability, ion exchange and use as catalysts and molecular sieves.
Porous materials may be classified as microporous, mesoporous or
macroporous on account of the size of the pores, with pores with diameter
smaller than 2 nm, between 2 and 50 nm and greater than 50 nm, respectively.
One well-known class of microporous solids is the zeolites. Zeolites are
microporous aluminosilicate minerals known also as "molecular sieves",
referring to this particular property. They can be classified according to the

112
Si/Al ratio, with the ratio between 1 and, in the case of silicates, ∞, when Si
atoms and not Al are present. The fundamental building unit of zeolites is a
tetrahedron (SiO4 or AlO4) and the SiO4 units are linked to AlO4 or one to
another by oxygen atoms. The unit cell formula for zeolites, including SiO4 or
AlO4 tetrahedra, metal cations for electroneutrality (because the zeolites have a
charged framework owing to the different oxidation states of Al3+ and Si4+) and
water molecules is:
M2/ nO Al 2O3 xSiO2 yH 2O (5.1)
where n is the valence of the metal, x is the SiO2/Al2O3 ratio (x ≥ 2) and y is the
number of water molecules. The structure of the zeolite framework can be
thought to be constructed of a system of cages (with empty spaces) and
channels. In terms of the channel system, zeolites can be classified as a one-,
two- or three-dimensional network of channels, where molecules can migrate in
one direction, in the xy plane, or in any place within a crystal, respectively.
In 1982, Flanigen and co-workers [5.1,5.2] discovered a novel class of
crystalline microporous aluminophosphates (AlPOs), with many of them
derived from zeolite structures by substitution of Si atoms for P atoms. The
difference between zeolites and aluminophosphates is that the former have

113
charged frameworks while the latter can have neutral or anionic frameworks. In
the case of neutral open-framework aluminophosphates, the AlPO-n
frameworks, where n is an integer denoting the structure-type, these are
composed of alternating AlO4 and PO4 tetrahedra with Al/P = 1. Because
aluminophosphates are prepared by using a hydrothermal method in the
presence of templates or structure-directing agents, which are typically positive
charged organic amines, F (from HF) or OH (from water) anions are present to
balance the positively charged amines. On the other hand, the anionic
framework AlPOs (those with Al/P ratio less than unity) are made up of
alternate Al-centred polyhedra (AlO4, AlO5, AlO6) and P-centred tetrahedra and
they have negatively charged frameworks owing to the terminal P-O bonds. In
this case, the negative charge of the framework is neutralised with a positively
charged organic template or metal cation. However, as the anionic frameworks
of aluminophosphates are unstable upon removal of the occluded protonated
template molecules by calcination, they are not discussed here.
Since the discovery of microporous aluminophosphates, they have
attracted considerable attention owing to their many applications. More than
200 structure-types of open-framework aluminophosphates have been
identified to date. A structure database containing detailed structural
information on open-framework AlPOs is reported in the literature [5.3].

114
One of the more interesting AlPOs, owing to its ability to catalyse highly
shape-selective production of light olefins from methanol [5.4-5.6] and the
direct oxidation of the terminal carbon of a linear alkane molecule [5.7,5.8], is
AlPO-34, which has the topology of chabazite (code: CHA) [5.9]. The CHA-type
structure is named after the mineral chabazite, an aluminosilicate that contains
a variety of occluded alkali and alkali earth metal cations along with water in its
natural form, and for which the thermal behavior above room temperature of a
natural specimen has recently been reported [5.10].
It is well known that an aluminophosphate with the triclinic form of the
chabazite topology (as-made AlPO-34) can be synthesized from a fluoride
medium using morpholine or piperidine as structure-directing agents [5.11-
5.15]. In AlPO-34, two fluoride ions bridge between two Al atoms in 4-rings
connecting double-6-rings and thus distort the rhombohedral symmetry of
chabazite. After thermal treatment the template- and fluoride-free material
(calcined-dehydrated AlPO-34) adopts the rhombohedral symmetry of the
chabazite topology. Figure 5.1 show the crystal structure of calcined-
dehydrated AlPO-34. The framework structure of this phase transforms back to
the triclinic symmetry of chabazite in the presence of water (calcined-
rehydrated AlPO-34).

115
(a)
(b)
Figure 5.1. (a) Crystal structure of calcined-dehydrated AlPO-34 with aluminium shown in purple, phosphorus in yellow and oxygen in red (b) The unit cell of morph-AlPO-34 showing atom numbering.
Templates that have been identified for the synthesis of heteroatom-
substituted AlPO-34 include isopropylamine [5.16,5.17], morpholine [5.18-5.20],
piperidine [5.21] and triethylamine [5.22]. Also, the addition of HF in the
synthesis gel has been widely reported [5.23-5.25].
As described previously, a large variety of organic templates that occupy
the pore and cages play an important role in directing the formation of a
specific structure. As a consequence, it is important to understand the
templating effect, the nature of the organic template molecule including any
dynamic behaviour, and also the structures of the as-made materials and their
stability upon removal of the structure-directing organic template. However, it
is often difficult to study template or adsorbed guest molecules in porous solids

116
Figure 5.2. Chemical structure of (a) piperidine (b) morpholine (c) 1,3-dimethylimidazolium (d) pyridine and (e) 1-methylimidazolium cations present within the framework of AlPO and GaPO samples.
using standard diffraction techniques, owing to the considerable positional
and/or dynamic disorder of the guest species. It is therefore necessary to use
methods, such as solid-state MAS NMR spectroscopy, that directly probe the
local environments of individual atom types and are sensitive to dynamic
behaviour. NMR is a very powerful technique for structural determination,
particularly with regards to the coordination states of aluminium, and is a
sensitive probe of the dynamics in microporous materials.
The aim of this work is investigating structure, motion and dynamic
behaviour in AlPO-34 type materials using the full range of NMR methods,
such as MAS, multiple-quantum MAS (MQMAS), satellite-transition MAS

117
(STMAS) and also first-principles calculations. Furthermore, the first results of
NMR experiments of GaPO-34 samples are presented here.
The samples discussed here are:
1. As-made (templated) AlPO-34:
a. pip-AlPO-34 – prepared using piperidine (C5H10NH) in the
synthesis as the structure-directing agent
b. morph-AlPO-34 – prepared using morpholine (C4H9NO) in the
synthesis as the structure-directing agent
c. dmi-AlPO-34 (or SIZ-4) – prepared using the ionic liquid 1-butyl-
3-methylimidazolium bromide in the synthesis as the structure-
directing agent (1-butyl-3-methylimidazolium bromide was used
in the synthesis in order to have only the 1,3-
dimethylimidazolium cation within the pores)
2. Calcined AlPO-34:
a. dehydrated
b. rehydrated
3. Deuterated:
a. morph-AlPO-34 – synthesized using deuterated morpholine,
water and phosphoric (V) acid

118
b. pip-AlPO-34 – synthesized using deuterated piperidine, water
and phosphoric (V) acid
c. Hpip-AlPO-34 – synthesized using protonated piperidine,
deuterated water and phosphoric (V) acid
The samples of gallium phosphate materials that have been investigated here
are two forms of as-made GaPO-34, one prepared with 1-methylimidazolium
salt as the template molecule (mim-GaPO-34) and one with pyridine as the
template molecule (py-GaPO-34). Figure 5.2 shows chemical structures of the
template molecules (cations) in AlPO-34 and GaPO-34.
5.2. AlPO-34: Results and discussion
5.2.1. As-made AlPO-34
As-made AlPO-34 was prepared using a variety of organic template
molecules, employing specific synthesis conditions (preparation of pip- and
dmi-AlPO-34 in Appendix A). The first investigated as-made AlPO-34 was pip-
AlPO-34. The asymmetric unit of the framework of pip-AlPO-34 is composed
of one octahedrally coordinated Al atom coordinated to four O and two F
atoms, two tetrahedrally coordinated Al atoms and three tetrahedral P atoms

119
[5.26] and was expected to be the same as AlPO-34 synthesized with pyridine as
a template, as reported previously [5.27]. The X-ray powder diffraction pattern
of the as-made triclinic pip-AlPO-34 can be found in the literature [5.28].
27Al and 31P MAS NMR experiments, which have been widely used to
study microporous frameworks, were obtained in order to confirm a presence
of 4- and 6-coordinated Al atoms and 4-coordinated P atoms. Figure 5.3 shows
the one-dimensional 27Al, 31P and 13C MAS NMR spectra of pip-AlPO-34.
Many previous researchers have shown that 27Al NMR chemical shifts
can be correlated with the coordination number of aluminum in
aluminophosphate compounds [5.29-5.34]. 27Al MAS NMR spectrum of pip-
AlPO-34 shows two lines at 40.2 and 6.5 ppm and it can be therefore deduced
that they correspond to the 4- and 6-coordinated species, respectively. The first
peak is more intense than that of the octahedral species, indicating that this
peak probably contains the resonances from the two tetrahedral sites found by
the structure analysis. The 31P spectrum consists of three peaks in agreement
with the published structure [5.28]. The 13C MAS NMR spectrum was also
recorded in order to confirm the presence of the particular template within the
structure as chemical shifts in the 13C solid-state NMR spectrum can be

120
compared with chemical shifts in the 13C liquid-state NMR spectrum found in
literature. This spectrum was obtained using the CP method to enhance the
magnetization of the low- nucleus, 13C, as described in Chapter 3. The 13C
spectrum consists of two broad peaks. The peak at 23 ppm is more intense than
the one at 47 ppm, suggesting the presence of the two carbons at similar
chemical shifts. These results are consistent with the literature [5.35], as the
solution 13C NMR spectrum of piperidine shows three peaks at 47.6, 27.3 and
25.3 ppm. It means that the two inequivalent carbon sites at 27.3 and 25.3 ppm
are observed as a single broad line in the solid-state NMR spectrum. Therefore,
the chemical shifts of two lines at 47.3 and 22.5 ppm in the 13C MAS NMR
spectrum correspond to the two carbons bonded to the nitrogen atom and all
the other carbons from the ring, respectively.
A high-resolution 27Al MQMAS spectrum of pip-AlPO-34 was recorded,
using the pulse sequence in Fig. 3.1b in order to increase significantly the
resolution of the spectrum and to separate the contributions of the two Al
tetrahedral species. Figure 5.4a shows the two-dimensional 27Al MQMAS
(triple-quantum) spectrum of pip-AlPO-34. It can be observed that only two
from the three peaks expected from the structure analysis are visible in Fig.
5.4a.
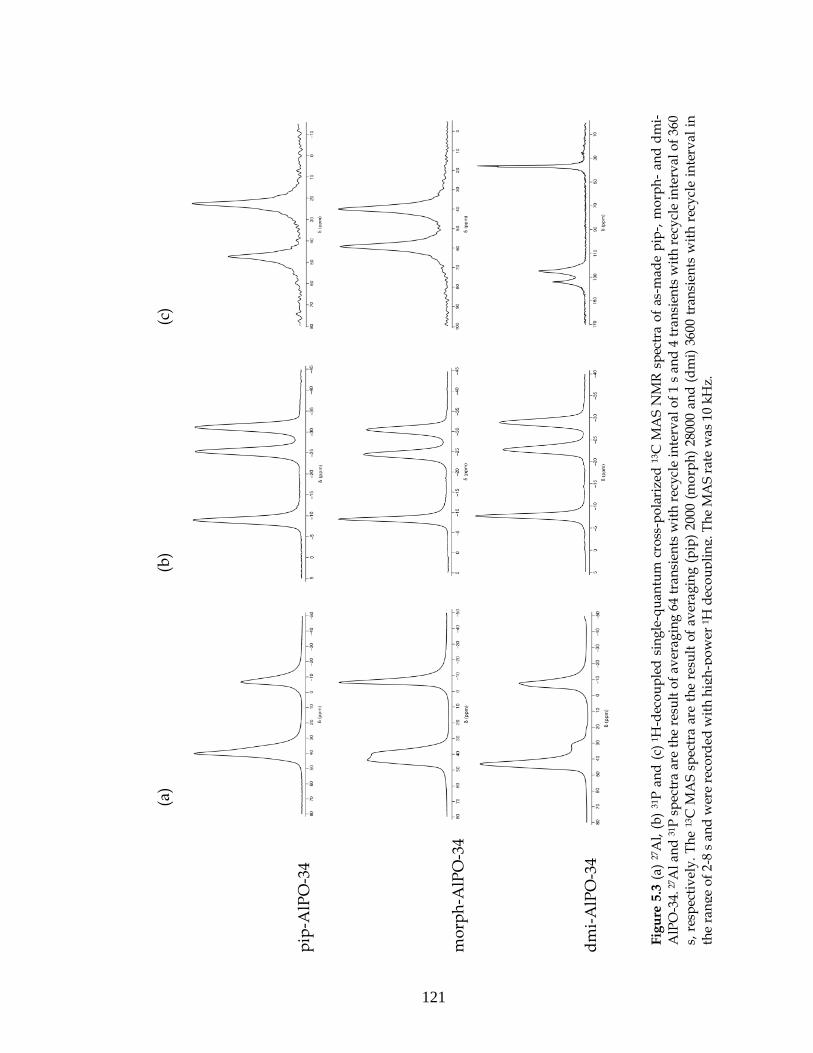
121
pip
-AlP
O-3
4
mo
rph
-AlP
O-3
4
dm
i-A
lPO
-34
Fig
ure
5.3
(a)
27A
l, (
b)
31P
an
d (
c) 1
H-d
eco
up
led
sin
gle
-qu
antu
m c
ross
-po
lari
zed
13C
MA
S N
MR
sp
ectr
a o
f as
-mad
e p
ip-,
mo
rph
- an
d d
mi-
AlP
O-3
4. 2
7A
l an
d 3
1P
sp
ectr
a ar
e th
e re
sult
of
aver
agin
g 6
4 tr
ansi
ents
wit
h r
ecy
cle
inte
rval
of
1 s
and
4 t
ran
sien
ts w
ith
rec
ycl
e in
terv
al o
f 36
0
s, r
esp
ecti
vel
y.
Th
e 13
C M
AS
sp
ectr
a ar
e th
e re
sult
of
aver
agin
g (
pip
) 20
00 (
mo
rph
) 28
000
and
(d
mi)
360
0 tr
ansi
ents
wit
h r
ecy
cle
inte
rval
in
the
ran
ge
of
2-8
s a
nd
wer
e re
cord
ed w
ith
hig
h-p
ow
er 1
H d
eco
up
lin
g. T
he
MA
S r
ate
was
10
kH
z.
(a)
(b
)
(c)

122
As mentioned in Chapter 4, the evidence for dynamics on the s
timescale is a motional broadening of quadrupolar satellite-transition spinning
sidebands because the intensities of spinning sidebands are dependent on the
motional process in the sample and thus on the temperature. Therefore, a
further investigation of as-made pip-AlPO-34 was to record one-dimensional
27Al MAS NMR spectra with a wide spectral width at two different
temperatures. Figure 5.5a shows 27Al MAS NMR spectra recorded at 293 and
333 K. A wide spectral width has been used and the spinning angle accurately
set to the magic angle, so that the spinning sidebands of the satellite transitions
can be observed. Reduced spinning sideband intensity is observed at 293 K.
Therefore, it can be assumed that the motional frequency within pip-AlPO-34 is
high compared with the size of the quadrupolar coupling. However, even at 333
K, each satellite sideband is still broad overall, suggesting that the sidebands
are probably strongly motionally broadened at both temperatures.
Since motional broadening was observed in variable-temperature NMR
spectra, a STMAS experiment was performed in order to investigate this
dynamic behaviour in detail. A correlation of the two transitions in a two-
dimensional STMAS experiment allows the removal of the second-order
broadening, as discussed in Chapters 3 and 4, therefore the STMAS spectrum of
pip-AlPO-34 was recorded. The STMAS NMR experiment was performed using

123
(a) (b)
(c)
Figure 5.4 Two-dimensional 27Al MQMAS (triple-quantum) spectrum of (a) pip-AlPO-34, (b)
morph-AlPO-34 and (c) dmi-ALPO-34. 96 transients were averaged for each 256 t1 values, with
a t1 increment of 12.5 s with a recycle interval of 1s; z-filter intervals of (a) 95.25 s, (b) 98.50
s and (c) 98.45 s were used. The time-proportional phase incrementation (TPPI) method of 1
sign discrimination was used and pure-absorption two-dimensional lineshapes were obtained
by means of a hypercomplex Fourier transform. The concept is of acquisition of an echo or
shifted echo FID in t2 and the use of a z-filter when acquiring data in the hypercomplex manner,
both of which require straightforward additions to the simple pulse sequence in Fig. 3.1b and
have been reviewed in much more detail. [5.36-5.38]
the pulse sequence shown in Fig. 3.3b and the spinning angle was accurately

124
adjusted to the magic angle (54.736 ) using the 87Rb (I = 3/2) STMAS signal
from RbNO3. Figure 5.6 presents the STMAS spectrum of pip-AlPO-34. As pip-
AlPO-34 possesses three distinguishable Al sites, three ridge lineshapes are
expected to be observed. However, only the two 27Al peaks lie on the CT CT
diagonal (+1) and none of the ST CT ridges are observed. This observation
may be explained by very strong dynamic broadening, as was observed in 27Al
MAS NMR spectra with a wide spectral width.
A second as-made material, morph-AlPO-34, prepared in the same way as pip-
AlPO-34 but using morpholine as the organic template molecule seems to be an
interesting material for the comparison of the motions in those two samples.
The structure was determined using synchrotron radiation [5.24]. Two fluorine
atoms were found to bridge two aluminium atoms of a 4-membered ring, which
connects two double-6-rings of the chabazite type structure as in the case of pip-
AlPO-34. The additional F atoms are compensated by two morpholinium
cations located in each chabazite cage. The unit cell formula is
(AlPO4)6(C4H10NO)2F2 and the unit cell of morph-AlPO-34 is presented in Fig.
5.1b. There are three crystallographic sites for Al: one Al is 6-coordinated to 4
oxygens and 2 fluorine atoms, and two Al atoms are 4-coordinated.
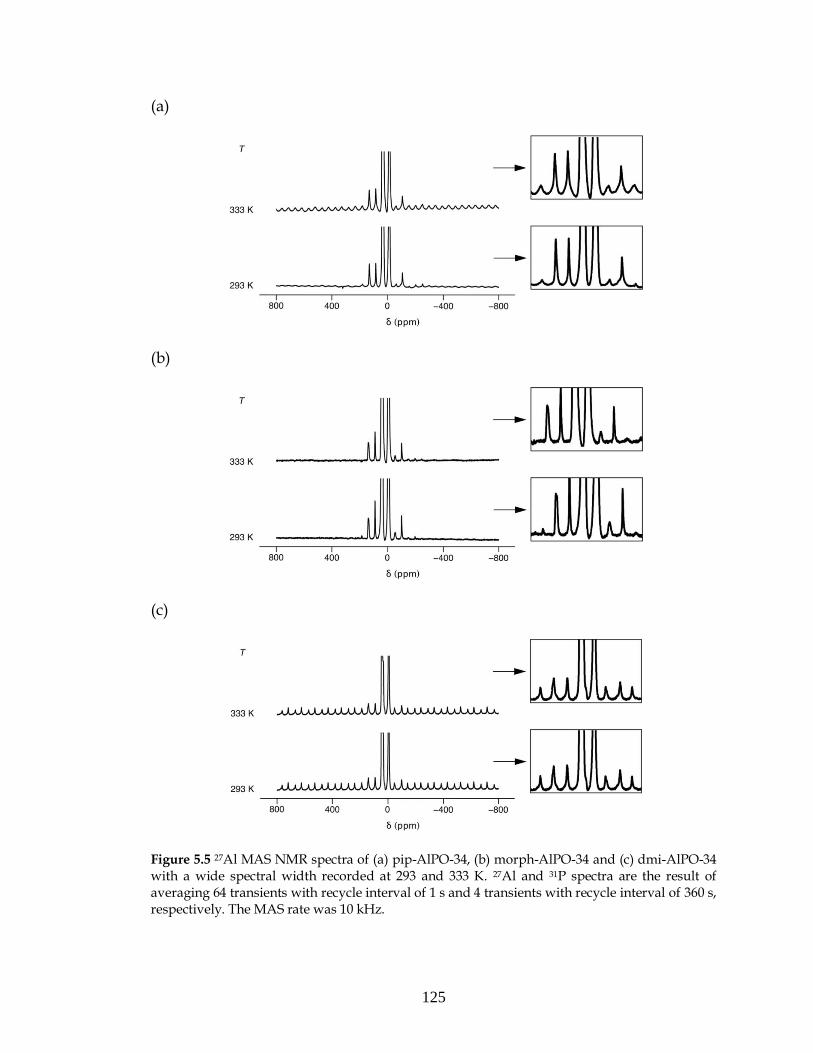
125
(a)
(b)
(c)
Figure 5.5 27Al MAS NMR spectra of (a) pip-AlPO-34, (b) morph-AlPO-34 and (c) dmi-AlPO-34 with a wide spectral width recorded at 293 and 333 K. 27Al and 31P spectra are the result of averaging 64 transients with recycle interval of 1 s and 4 transients with recycle interval of 360 s, respectively. The MAS rate was 10 kHz.

126
The 27Al, 31P and 13C MAS NMR spectra of morph-AlPO-34 look very
similar to those of the piperidine templated AlPO-34 and are displayed in Fig.
5.3. The 13C spectrum of morph-AlPO-34 consists of two broad peaks the same
as in the spectrum of pip-AlPO-34. The chemical shifts of these two lines are
46.1 and 65.4 ppm corresponding to carbons bonded to the nitrogen atom and
those bonded to the oxygen atom, respectively. These values are in good
agreement with previous liquid-state NMR studies that showed signals at 46.6
and 68.2 ppm [5.39]. The 31P NMR MAS spectra show lines in the chemical shift
range 35 to 5 ppm consistent with tetrahedrally coordinated phosphorus (as
PO4) in the framework of the materials. The 27Al spectrum of morph-AlPO-34
resembles pip-AlPO-34. This spectrum shows two lines at 40.2 and 6.3 ppm
with the first two peaks overlapping. This result shows that the structure of
both as-made samples is the same. The 27Al MQMAS spectrum was also
recorded in order to observe all crystallographically distinct Al sites and it is
presented in Fig. 5.4b. It can be immediately observed that the three expected
lines are clearly visible in that spectrum. It means that the 4-coordinated Al sites
have been fully resolved by the MQMAS experiment and it can be deduced that
the 27Al MAS NMR spectrum contains two tetrahedral sites and one octahedral
site.
Once again, as in the case of pip-AlPO-34, 27Al MAS NMR spectra with a

127
Figure 5.6 Two-dimensional 27Al STMAS spectrum of pip-AlPO-34 recorded using the amplitude-modulated z-filtered pulse sequence. The spectrum is the result of averaging 64
transients for each 138 t1 values, with a t1 increment of 50 s. A recycle interval of 1 s and the a
z-filter interval of 2 ms were used. The States-Haberkorn-Ruben (States) method of 1 sign
discrimination was used.
wide spectral width shown in Fig. 5.5b were recorded at 293 and 333 K to
compare motions in those two samples. They did not show any spinning
sidebands of the satellite transitions, even upon raising the temperature. This
suggests that the spinning sidebands in this AlPO are so strongly motionally
broadened that it is not possible to observe them. This suggests that motion is
slower than in pip-AlPO-34. For comparison, in the piperidine they have been
observed in the conventional MAS NMR spectrum recorded at 333 K (very
broad) but not in the STMAS spectrum.
Morris and co-workers [5.40,5.41] have also used ionic liquids as both the
solvent and template for the preparation of SIZ-n type AlPO materials. This
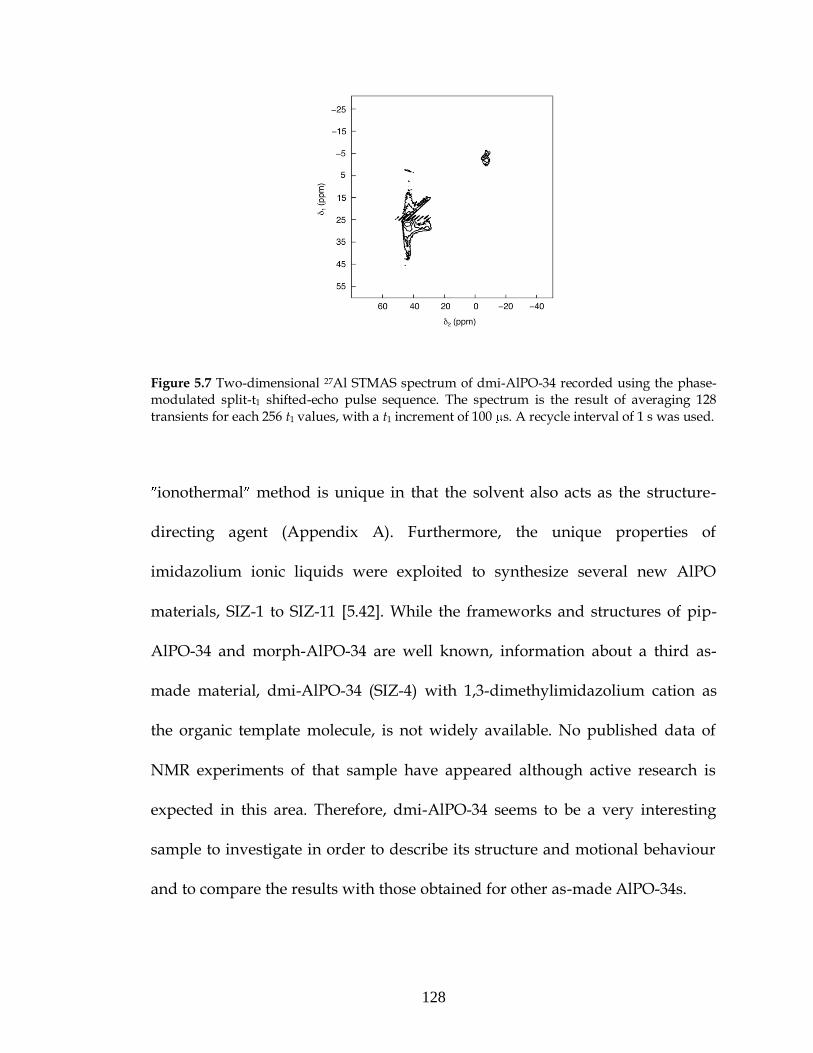
128
Figure 5.7 Two-dimensional 27Al STMAS spectrum of dmi-AlPO-34 recorded using the phase-modulated split-t1 shifted-echo pulse sequence. The spectrum is the result of averaging 128
transients for each 256 t1 values, with a t1 increment of 100 s. A recycle interval of 1 s was used.
ionothermal method is unique in that the solvent also acts as the structure-
directing agent (Appendix A). Furthermore, the unique properties of
imidazolium ionic liquids were exploited to synthesize several new AlPO
materials, SIZ-1 to SIZ-11 [5.42]. While the frameworks and structures of pip-
AlPO-34 and morph-AlPO-34 are well known, information about a third as-
made material, dmi-AlPO-34 (SIZ-4) with 1,3-dimethylimidazolium cation as
the organic template molecule, is not widely available. No published data of
NMR experiments of that sample have appeared although active research is
expected in this area. Therefore, dmi-AlPO-34 seems to be a very interesting
sample to investigate in order to describe its structure and motional behaviour
and to compare the results with those obtained for other as-made AlPO-34s.

129
Figure 5.8 Two-dimensional 27Al DQF-STMAS spectra of dmi-AlPO-34 recorded at 293, 303,
313, 323 and 333 K using pulse sequence shown in Fig. 3.5 and cross-sections parallel to the 1 dimensions that correspond to peak at 40 ppm extracted from 27Al DQF-STMAS spectra. Spectra
are the result of averaging 1024 transients for each of 16 t1 values, with a t1 increment of 100 s
and with a recycle interval of 1 s. The intervals, 1 and 2, were 3 s and 5 ms, respectively.
Yu and co-workers [5.43] described the synthesis of anionic SIZ-4 and its
crystal structure analysis using single-crystal X-ray diffraction. Their structural
T = 293 K T = 303 K
T = 313 K T = 323 K
T = 333 K

130
analysis indicates that SIZ-4 has the unit cell formula of
[Al3P4O16][C5N2H9]2[NH4]. They have proposed the two-dimensional network
that is constructed from some one-dimensional chains composed of alternating
AlO4 and PO4 units. The asymmetric unit contains three distinct tetrahedral
AlO4 units and four distinct tetrahedral P atoms.
As in the case of the two other as-made AlPO-34 one-dimensional spectra
were first recorded in order to confirm the presence of the triclinic form of the
chabazite topology and compare results with those found for AlPO samples
prepared with piperidine and morpholine. The 27Al, 31P and 13C MAS NMR
spectra of dmi-AlPO-34 are displayed in Fig. 5.3. The 31P MAS NMR spectrum
of dmi-AlPO-34 looks identical to the morpholine templated AlPO-34 and is
composed of three resonances between 35 and 5 ppm. The 13C spectrum of
dmi-AlPO-34 in Fig. 5.3c shows three peaks. The chemical shifts of these three
lines are at 134.0, 125.4 and 37.2 ppm and correspond to the carbons bonded to
both nitrogen atoms, the other carbons from the ring linked to each other
through the double bond, and carbons from the methyl groups, respectively,
consistent with the literature in reference to liquid-state NMR of the template
[5.39]. The 13C NMR spectrum of SIZ-4 shows narrower peaks compared to the
13C NMR spectra of pip- and morph-AlPO-34. However, the 27Al MAS NMR
spectrum of dmi-AlPO-34 looks very similar to the morpholine and piperidine

131
templated AlPO-34 but with different relative intensities. It shows signals at
40.1 ppm (4-coordinate) and 12.2 ppm (6-coordinate). As the 40 ppm peak is
more intense than the other peak, indicating that this peak probably contains
the resonances from the two or more 4-coordinated Al sites, the MQMAS
spectrum was recorded and is presented in Fig. 5.4c. Compared with the MAS
spectrum, peaks in two-dimensional MQMAS spectrum are better resolved and
two 4-coordinated and one 6-coordinated Al sites are visible.
The 27Al MAS NMR spectrum with a wide spectral width at 333 K was
also recorded and compared with the same spectrum recorded at 293 K to
investigate whether there is a motional broadening effect of the spinning
sidebands. This spectrum did not show any difference in the linewidth of the
spinning sidebands of the satellite transitions compared to the spectrum
recorded at 293 K. Therefore, it can be deduced that this sample presents no
motion on µs timescale. However, because of the high intensity of the spinning
sidebands observed in Fig. 5.5c, the STMAS spectrum of dmi-AlPO-34
presented in Figure 5.7 has been recorded using the pulse sequence shown in
Fig. 3.4b. This is the first as-made sample of AlPO-34 investigated here for
which it was possible to obtain an STMAS spectrum with observable satellite
transitions. In other samples, the satellite transitions appeared to be too broad
for this to be possible, probably as a result of strong dynamic broadening.

132
Because of the overlapping different types of transitions such as the CT and ST1
in the 27Al STMAS NMR spectrum, a double-quantum filtered method, with the
pulse sequence shown in Fig. 3.5, has been employed in the rotor-synchronized
t1 dimension of the STMAS experiment to simplify the spectrum as described in
Ref. 3.25. The 27Al DQF-STMAS spectra recorded as a function of temperature
in the range 293 – 333 K and also cross-sections parallel to the 1 dimension that
correspond to the peak at 40.1 ppm extracted from each DQF-STMAS spectrum
of dmi-AlPO-34 are displayed in Fig. 5.8. It can be observed that the linewidth
does not change in the isotropic dimension. However, small changes in peaks
intensities are observed but they are difficult to rationalise. Therefore, further
studies have still to be performed in order to give a definitive explanation for
this observation.
5.2.2. Deuterated AlPO-34
One interesting avenue for investigation of aluminophosphates is to show
if the deuteration of the sample affects the motional behaviour. It can be
investigated by checking if the 27Al and 31P spectra differ from those recorded
for the 1H form of the samples and by using 2H NMR spectroscopy, since
molecular motion can influence the 2H NMR lineshape. The samples of
aluminophosphate materials synthesized using deuterated organic templates

133
(a) (b)
morph-AlPO-34
pip-AlPO-34
Hpip-AlPO-34
Figure 5.9 (a) 27Al and (b) 31P MAS NMR spectra of deuterated morph-AlPO-34, pip-AlPO-34 and Hpip-AlPO-34.
were deuterated morph-AlPO-34 and pip-AlPO-34. Additionally, results for
pip-AlPO-34 deuterated using D2O, D3PO4 and protonated instead of
deuterated piperidine (Hpip-AlPO-34) are discussed here. Therefore, in the case
of Hpip-AlPO-34 only the presence of the deuterons arising from D2O and/or
OD, not from deuterated organic template as for the two other materials, is
expected.

134
(a) (b)
(c)
Figure 5.10 Two-dimensional 27Al triple-quantum MAS NMR spectrum of deuterated (a) morph-AlPO-34, (b) pip-AlPO-34 and (c) Hpip-AlPO-34.
The first step of this investigation was to record 27Al and 31P one-
dimensional spectra. Figure 5.9 shows the 27Al and 31P MAS spectra of
deuterated samples. The parameters used to record all 27Al and 31P MAS spectra
of deuterated samples are the same as for the 1H forms.

135
The 27Al MAS spectra are essentially identical to the 1H form of all three
samples while the 31P MAS spectrum had the same shifts but the intensities are
rather different in the case of deuterated morph- and pip-AlPO-34. It could be
due to changes in relaxation or dipolar coupling behaviour following
deuteration. However, the 31P MAS spectrum of Hpip-AlPO34 shows two
additional peaks between 15 and 25 ppm probably arising from an impurity.
High-resolution 27Al MQMAS spectra of the deuterated samples were recorded
for the purpose of averaging out the second-order quadrupolar interaction and
to separate the contributions of the two tetrahedral species observed unresolved
in the one-dimensional 27Al MAS spectra, as in the case of as-made AlPO-34
materials. Figure 5.10 displays the two-dimensional 27Al MQMAS (triple-
quantum) spectra. It can be observed that the two tetrahedral Al peaks are
resolved in Fig. 5.10a and 5.10b but only two of the three expected peaks are
visible in Fig. 5.10c. Furthermore, in the case of deuterated morph-AlPO-34 and
Hpip-AlPO-34, in the δ2 dimension broad peaks from an impurity are also
observed between 5 and 22 ppm. It will be shown in the following subsection
that the starting material (Al2O3) used to synthesize the AlPO-34 samples
contains an impurity and some of the spectra show additional peaks origin
probably from this impurity. Furthermore, this explanation of the presence of
the additional peaks in NMR spectra was confirmed by X-ray diffraction
pattern of AlPO-34 samples recorded by Dr R. I. Walton‘s group.

136
(a)
(b)
(c)
Figure 5.11 27Al MAS NMR spectra with a wide spectral width recorded at room temperature and at 333 K of deuterated (a) morph-AlPO-34, (b) pip-AlPO-34 and (c) Hpip-AlPO-34.

137
In addition, one-dimensional 27Al MAS NMR spectra with a wide
spectral width were recorded at variable temperature to check if the spinning
sidebands of the satellite transitions are observed and depend on the
temperature. Figure 5.11 shows 27Al MAS NMR spectra of the deuterated
samples recorded at room temperature and at 333 K both recorded with a wide
spectral width.
The spectra of deuterated morph-AlPO-34 show spinning sidebands of
the satellite transitions with very low intensities. These spectra were analysed in
more detail, with the frequency difference between the central transition and
the spinning sidebands being measured. This indicated that the spinning
sidebands probably originate from the impurity; this was confirmed by the
results of the MQMAS experiment. However, the two-dimensional STMAS
spectrum of deuterated morph-AlPO-34 was also recorded. The two-
dimensional 27Al STMAS split-t1 spectrum is displayed in Fig. 5.12. The 27Al
STMAS spectrum consists of central transition (CT) peaks. Peaks at 2 = –10
ppm and 2 = 10 ppm are also observed, which confirms the observation made
with respect to the one-dimensional 27Al MAS spectrum with the wide spectral
width and the MQMAS spectrum that there is an impurity present in the
deuterated morph-AlPO-34.

138
Figure 5.12 Two-dimensional 27Al STMAS spectrum of deuterated morph-AlPO-34 recorded using the split-t1 pulse sequence.
The variable-temperature 27Al MAS NMR spectra of deuterated pip- and
Hpip-AlPO-34 show a slight narrowing of the spinning sidebands as the
temperature increases. It can be assumed that in deuterated pip- and H-pip-
AlPO-34 some motions are present but it was not possible to record the STMAS
spectrum of either sample to investigate this problem in more detail, probably
due to strong dynamic broadening.
As 2H spectroscopy is widely used in motional studies (on the s
timescale), primarily via lineshape analysis, 2H MAS NMR experiments were
performed in order to give an explanation of the effect of narrowing spinning
sidebands with increasing temperature in the case of pip- and Hpip-AlPO-34.
The purpose of the 2H MAS NMR experiments was also to study dynamics

139
concentrating on the intensities or linewidths of the spinning sidebands that
exhibit a strong motional broadening if a dynamic reorientation of the 2H
quadrupole tensor is occurring on the s timescale.
2H MAS NMR spectra with and without rotor-synchronization and with
a wide spectral width were recorded to observe the intensities of the spinning
sidebands. The 2H MAS spectra of deuterated morph-, pip- and Hpip-AlPO-34
are displayed in Figure 5.13. In the case of deuterated morph-AlPO-34, the 2H
MAS spectrum shows a single narrow peak at ~7 ppm, probably corresponding
to deuterons from deuterated morpholine molecules, and rotor-synchronization
does not change the spectrum. However, the 2H MAS spectrum of deuterated
pip-AlPO-34 shows a single peak at 5.5 ppm which is narrow probably due to
rapid tumbling of deuterated piperidine, while a broad component at 3.6 ppm
appears during rotor-synchronization. This peak originates probably from
deuterated water. The 2H MAS spectrum of the third deuterated sample shows
one narrow peak at 6.8 ppm with high intensity and three additional peaks at
8.2, 7.5 and 5.40 ppm. Peaks at 6.8, 7.5 and 8.2 ppm can originate from
piperidine (6H arising from CH2 groups, 1H from the NH group and 4H from
N(CH2)2 groups, respectively) while the peak at 5.4 ppm can originate from
deuterated water. However, as protonated instead of deuterated piperidine was
used to synthesis piperidine within the sample. The 2H MAS spectrum

140
Fig
ure
5.1
3 O
ne-
dim
ensi
on
al 2
H M
AS
NM
R s
pec
tra
reco
rded
usi
ng
(a)
co
nv
enti
on
al,
(b)
roto
r-sy
nch
ron
ized
acq
uis
itio
n a
nd
(c)
rec
ord
ed w
ith
wid
e sp
ectr
al w
idth
of
deu
tera
ted
AlP
O-3
4 sa
mp
les.
Sp
ectr
a ar
e th
e re
sult
of
aver
agin
g 1
28 (
mo
rph
) an
d 2
56 (
pip
an
d H
pip
) tr
ansi
ents
. R
ecy
cle
inte
rval
s o
f 5
s (m
orp
h)
and
1s
(pip
an
d H
pip
) w
ere
use
d. T
he
MA
S r
ate
was
10
kH
z.
mo
rph
-AlP
O-3
4
pip
-AlP
O-3
4
Hp
ip-A
lPO
-34 (a
)
(b
)
(c)

141
of morph-AlPO-34 with a wide spectral width, presented in Fig. 5.13, shows a
typical I = 1 Pake doublet split up into MAS sidebands. The width of this
pattern is ~370 kHz. The 2H MAS spectra of deuterated pip-AlPO-34 and Hpip-
AlPO-34 with a wide spectral width also exhibit characteristic Pake doublet
patterns but with lower intensity of the MAS sidebands than in the case of
deuterated morph-AlPO-34. It can be assumed that this observation can be a
result of the fast dynamic in deuterated morph-AlPO-34.
Since 2H double-quantum NMR is a very useful technique to obtain
information about dynamics, as mentioned previously, two-dimensional 2H
double-quantum (DQ) MAS NMR spectra were recorded in order to provide a
very sensitive test for the presence of dynamics. The comparison of single- and
double-quantum resonances is greatly facilitated if the two-dimensional
experiment is performed in a rotor-synchronized manner in both the t1 and t2
time-domains, as explained in Chapter 3.
Figure 5.14 shows the two-dimensional 2H DQMAS spectra of three
deuterated samples. The spectrum in Fig. 5.14a reveals essentially the same
linewidth in the single-quantum and double-quantum dimensions. This
DQMAS spectrum might indicate very fast dynamics that are not detected
using this experiment. However, one broad peak is seen in the single-quantum

142
(a) (b)
(c)
Figure 5.14 Two-dimensional 2H double-quantum MAS NMR spectra (and 1 and 2 projections) of (a) morph-AlPO-34, (b) pip-AlPO-34 and (c) Hpip-AlPO034 recorded using rotor-synchronization in the t1 and t2 period. 32 transients were acquired for each of 200 t1
increment of 100 s. Recycle intervals the same as in one-dimensional 2H MAS NMR spectra were used.
dimension of the two-dimensional 2H DQMAS spectrum of deuterated pip-
AlPO-34. This single peak observed in the single-quantum dimension is
resolved in the double-quantum dimension indicating motion on the µs

143
timescale as was expected analysing 2H one-dimensional spectrum which
shows a broad peak for D2O. The two-dimensional 2H DQMAS spectrum of
deuterated Hpip-AlPO-34 shows also only one broad peak in the single-
quantum dimension, while three distinct motionally broadened peaks are
observed in the double-quantum dimension. This result can confirm the
presence of dynamic on the µs timescale from the dynamic reorientation of
deuterated water molecules by 180 ‘flips’ about the C2 axis.
5.2.3. Calcined AlPO-34
Calcination of either the pip- or morph-AlPO-34 materials results in
removal of all template and water molecules to form calcined-dehydrated
AlPO-34 and is achieved by heating the as-made material to a temperature of
500 – 600 C. Full dehydration in turn is achieved by heating the calcined
material for 2 h at 200 C.
The unit cell of the calcined-dehydrated form has composition Al6P6O24,
with one crystallographically unique four-coordinated Al and P site. By
calcination at about 500 °C, the organic species and HF are removed and the
rhombohedral chabazite structure of AlPO-34 is formed [5.44]. Figure 5.1(a)
shows the crystal structure of calcined-dehydrated AlPO-34.The sample

144
described here is calcined AlPO-34 from piperidine.
The one-dimensional 27Al and 31P MAS NMR spectra of calcined-
dehydrated AlPO-34 are shown in Fig. 5.15. The 31P spectrum of calcined
dehydrated AlPO-34 shows one resonance at 31.1 ppm and it is consistent with
the presence of one crystallographic site in that structure. However, although
the 27Al spectrum consists of one main peak, another component to the
lineshape is also observed, which seems to look rather like an impurity. As it is
not possible to assign the origin of the additional peak in the 27Al MAS NMR
spectrum by a simple lineshape analysis, a high-resolution 27Al MQMAS
spectrum of calcined-dehydrated AlPO-34 was recorded. Figure 5.16a displays
the two-dimensional 27Al MQMAS spectrum of calcined-dehydrated AlPO-34
recorded using phase-modulated split-t1 pulse sequence. Only a single Al site
with CQ = 3 MHz and = 0.9 is observed. It means that there is also only one
crystalographic Al site within the structure of calcined-dehydrated AlPO-34
and this additional peak observed in one-dimensional spectrum originates from
an impurity.
Figure 5.17 shows the 27Al MAS NMR spectrum, along with the best fit to
the second-order quadrupolar broadening lineshape, forcing one Al site to
have CQ = 3 MHz and = 0.9 (as determined from the cross-section from

145
(a) (b)
dehydrated
rehydrated
Figure 5.15 (a) 27Al and (b) 31P MAS NMR spectra of calcined dehydrated and rehydrated AlPO-34. 27Al and 31P spectra are the result of averaging 16 transients with recycle interval of 1 s and 4 transients with a recycle interval of 90 s, respectively.
MQMAS spectrum). The fitting uncovers a second Al population with 17% of
the total intensity and small CQ (which is probably the reason for the absence of
this peak in the MQMAS spectrum). Therefore, this additional peak in the 27Al
MAS spectrum is assumed to be an impurity peak.
Since structural changes occurring upon hydration of an
aluminophosphate framework are not well understood and their knowledge
could have a practical impact because they usually modify the pore size and
can have consequences for experimental techniques, further investigations on
calcined AlPO-34 have been made. To ensure that the sample was fully

146
(a) (b)
Figure 5.16 Two-dimensional 27Al MQMAS (triple-quantum) spectrum of (a) calcined-dehydrated and (b) calcined-rehydrated AlPO-34. 96 transients were averaged for each of 256 t1
values, with a t1 increment of (a) 50 s and (b) 12.5 s and with a recycle interval of 1s. In (b) the
time-proportional phase incrementation (TPPI) method of 1 sign discrimination and z-filter
interval of 98.5 s were used. The MAS rate was 10 kHz.
rehydrated, the open rotor was kept for three days because when the calcined
material is contacted with air at room temperature, water molecules are
absorbed.
The aim of recording the one-dimensional 27Al and 31P NMR spectra of
calcined-rehydrated AlPO-34 shown in Fig. 5.15 was to observe how the sample
behaves upon hydration and if the presence of water induces a motional
broadening effect in these NMR spectra and change the local surroundings of
the Al and P species. The 27Al and 31P spectra of the sample have been
published previously [5.28].

147
Figure 5.17 27Al MAS NMR spectrum of calcined dehydrated AlPO-34 fitted with the sum of two second-order quadrupolar broadening lineshapes.
The 31P spectrum is composed of at least a few resonances between 20
and 30 ppm. This suggests the presence of at least four different environments
for the P atoms in the unit cell. The 27Al MAS NMR spectrum of fully
rehydrated compound shows signals around 40 (4-coordinate), 16 (5-
coordinate) and 12 ppm (6-coordinate). The first peak is more intense than the
other peaks, indicating that this peak probably contains the resonances from
two or more 4-coordinated Al sites. Therefore, the MQMAS spectrum was
recorded once again to separate the contributions of the overlapping Al sites.
The two-dimensional 27Al MQMAS (triple-quantum) spectrum of calcined-
rehydrated AlPO-34 recorded using an amplitude-modulated z-filter pulse
sequence is displayed in Figure 5.16b. It can be observed that only four from six
expected (from published data) [5.28] peaks are visible. Tuel et. al [5.28]
recorded both 31P and 27Al NMR spectra and this 31P MAS NMR spectrum is
-1001020304050607080

148
(a) (b)
Figure 5.18 (a) 27Al and (b) 31P MAS NMR spectra of calcined-rehydrated AlPO-34 recorded at 14.1 T in the temperature range of 293 – 333 K. MAS rate was 10 kHz. 27Al and 31P spectra are the result of averaging 128 transients with recycle interval of 1 s and 8 transients with a recycle interval of 90 s, respectively.
composed of five lines between -22 and -28 ppm while in δ1 dimension of 27Al
5QMAS spectrum six resolved peaks is observed corresponding to three 4-
coordinated, one 5-coordinated and two 6-coordinated Al species. Furthermore,
they performed variable-temperature 27Al and 31P MAS experiments (between
20 C and 50 C) and did not observe any significant changes in the NMR
spectra.
Therefore, the variable-temperature 27Al and 31P MAS NMR spectra were
also recorded in the temperature range 293 – 333 K and they are presented in

149
Figure 5.18. It can be observed that the 27Al linewidth increases with increasing
temperature for all three Al sites and also the 31P spectrum changes over the
temperature range. The change between 293 and 303 K is probably due to a
phase transition as found previously using X-ray powder diffraction [5.28].
However, the further change may be the effect of dynamic behaviour.
5.3. CASTEP calculations
Since the 1990s, ab initio computational tools have been used to study
AlPO materials. First-principles calculations of NMR parameters of three as-
made and calcined-dehydrated AlPO-34 were performed here using the NMR
CASTEP code to combine DFT calculations with experimental data. The
CASTEP program is a first-principles quantum-mechanical code for performing
electronic structure calculations and it can be used to simulate a wide range of
materials including amorphous materials.
CASTEP was used to calculate the isotropic chemical shifts of 27Al, 31P
and 13C within pip-, morph-, dmi-AlPO-34 and calcined-dehydrated AlPO-34,
along with the quadrupolar NMR parameters CQ and of 27Al.
As CASTEP does not calculate the chemical shift of a nucleus directly,

150
but its absolute shielding calsample , it is necessary to calculate the shielding of a
reference material ( ref ) first in order to then convert the shielding of the
sample into isotropic chemical shifts ( iso ) according to the equation:
samplecalrefiso σσδ (5.2)
where the reference shielding is given by:
refcal
refisoref (5.3)
and isoref and cal
ref are isotropic chemical shift and calculated shielding for the
reference material, respectively. The mineral berlinite was used as a reference
material for 27Al and 31P and benzene was used as a reference material for 13C.
The structural parameters (the unit cell and all atomic positions) for
morph-AlPO-34 were obtained from the published crystal structure [5.24]. In
the absence of a crystal structure for pip-AlPO, the conformation of the
template in the pore was assumed to be the same as for morph-AlPO and a
structure was generated by substituting an oxygen atom for a carbon atom. The
CASTEP calculations for the third as-made AlPO-34 were performed by a

151
Table 5.1
Experimental and calculated 27Al and 31P isotropic chemical shifts ( iso) in ppm,
quadrupolar coupling constants (CQ) in MHz, asymmetry parameters ( ) for
three as-made AlPO-34 samples.
pip-AlPO-34 morph-AlPO-34 dmi-AlPO-34
iso
(ppm) CQ/MHz
iso
(ppm) CQ/MHz
iso
(ppm) CQ/MHz
Experimental
Al1 43.0 2.23 0.56 47.5 2.35 0.50 46.48 2.33 0.56
Al2 38.8 2.63 0.30 43.1 2.40 0.30 40.90 3.55 0.25
Al3 5.02 1.76 0.80 4.09 1.91 0.40 4.95 1.91 0.80
P1 9.03 8.1 7.73
P2 25.3 24.1 22.8
P3 31.2 30.2 28.9
C1 47.3 65.4 134.1
C2 22.6 46.1 125.2
C3 — — 36.9
Calculated (no full geometry optimization)
Al1 — — — 53.8 5.40 0.89 52.80 4.19 0.15
Al2 — — — 51.9 2.36 0.62 53.43 2.20 0.61
Al3 — — — 1.50 2.01 0.27 4.11 1.70 0.72
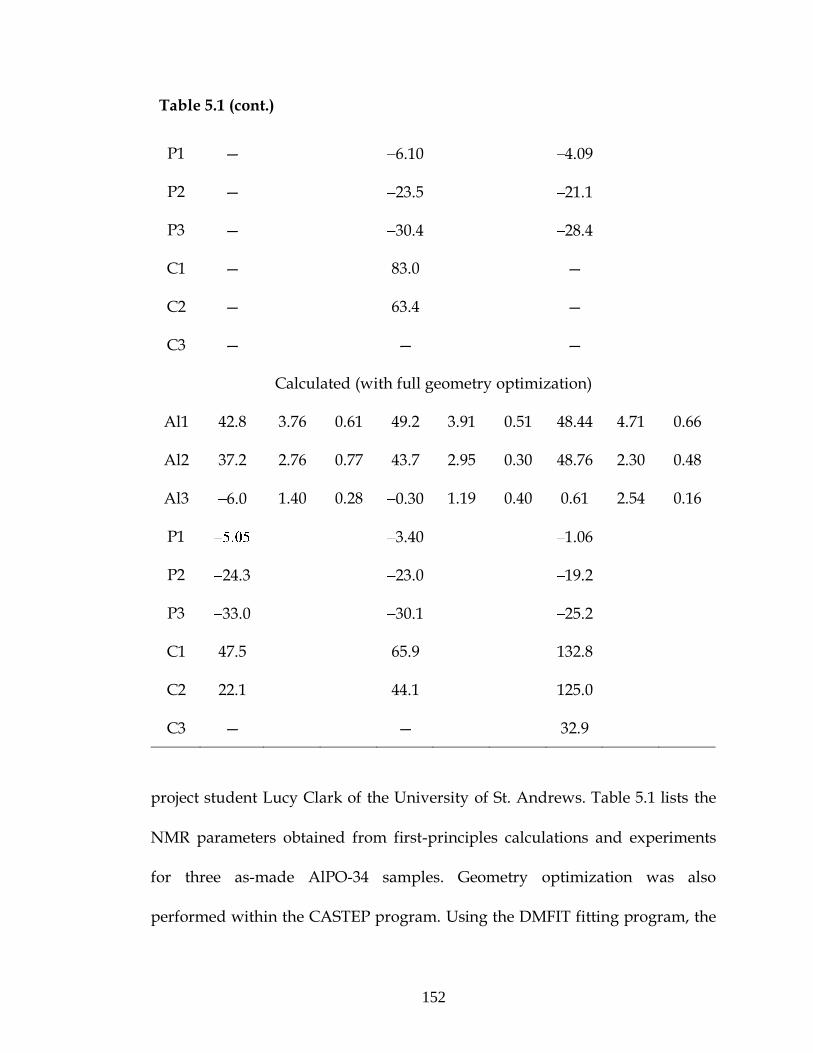
152
Table 5.1 (cont.)
P1 — 6.10 4.09
P2 — 23.5 21.1
P3 — 30.4 28.4
C1 — 83.0 —
C2 — 63.4 —
C3 — — —
Calculated (with full geometry optimization)
Al1 42.8 3.76 0.61 49.2 3.91 0.51 48.44 4.71 0.66
Al2 37.2 2.76 0.77 43.7 2.95 0.30 48.76 2.30 0.48
Al3 6.0 1.40 0.28 0.30 1.19 0.40 0.61 2.54 0.16
P1 3.40 1.06
P2 24.3 23.0 19.2
P3 33.0 30.1 25.2
C1 47.5 65.9 132.8
C2 22.1 44.1 125.0
C3 — — 32.9
project student Lucy Clark of the University of St. Andrews. Table 5.1 lists the
NMR parameters obtained from first-principles calculations and experiments
for three as-made AlPO-34 samples. Geometry optimization was also
performed within the CASTEP program. Using the DMFIT fitting program, the

153
lineshapes acquired were analysed so that experimental parameters could be
extracted. From every one-dimensional spectrum fitting, the values of the
asymmetry parameter, , the quadrupolar coupling constant, CQ, and the
isotropic chemical shift, iso, were obtained.
The resulting calculated parameters for as-made AlPO-34 were expected
to agree with the experimental parameters and satisfactory agreement with the
experimental values was achieved, especially if the structure geometry was
optimized first.
Additionally, DFT calculations were combined with experimental data
also for calcined-dehydrated AlPO-34 to study the structure modifications
occurring during calcination of AlPO-34, for which a reasonably large ensemble
of experimental information is known. Structural parameters (the unit cell and
all atomics positions) of calcined-dehydrated AlPO-34 were obtained from
published crystal structure [5.44]. Geometry optimization was also performed
within the CASTEP program. Table 5.2 lists the NMR parameters obtained from
first-principles calculation and experiment for calcined-dehydrated AlPO-34.
The resulting calculated parameters agree with the experimental values
extracted from the 27Al MQMAS experiment, even without prior geometry

154
Table 5.2
Experimental and calculated 27Al and 31P isotropic chemical shifts ( iso),
quadrupolar coupling constants (CQ), asymmetry parameters ( ) for calcined-
dehydrated AlPO-34.
iso (ppm) CQ / MHz
Experimental
Al 39.6 3.0 0.90
P 31.0
Calculated (no optimization)
Al 39.6 3.10 0.85
P 28.9
Calculated (geometry optimization)
Al 40.3 3.10 0.87
P 30.3
optimization.
It is clear that in the case of the as-made AlPO-34 the geometry
optimisation of the crystal structure is important in order to achieve more
accurate results. It is typical to geometry optimise a crystal structure before

155
performing further DFT calculations since structural data obtained by
diffraction often have high energies within the calculation and so geometry
optimisation allows a unit cell to ‚relax‛, reducing the forces acting on the
atoms within the cell. However, when the templates have been removed from
the pores, the calculated parameters agree with the experimental values
without prior geometry optimization and therefore, the calculated parameters
are expected to be more reliable. This is likely to be due to the fact that the
structure of templated AlPO-34 samples is more complex than the structure of
calcined-dehydrated AlPO-34. This observation is consistent with X-ray and
NMR data.
5.4. GaPO-34 - gallium phosphate materials
Solid-state NMR of quadrupolar Ga nuclei (two isotopes of gallium are
known, 69Ga and 71Ga; both isotopes have spin I = 3/2, their natural abundances
are 60.11% and 39.89%, and their Larmor frequencies at B0 = 9.4 T) are 95.99 and
121.97 MHz, respectively) is a growing subject of interest for several reasons
[5.45-5.48]. Quantitative measurements of quadrupolar nuclei are of great
importance in the structural investigation of materials with a wide range of
applications. In zeolitic materials or molecular sieves, Al/Ga substitution is

156
(a) (b)
Figure 5.19 71Ga MAS NMR spectra of (a) mim-GaPO-34 and (b) py-GaPO-34. The spectra were recorded at 20.0 T using a 2.5-mm broadband MAS probe. Spectra are the result of averaging 512 transients. A recycle interval of 0.5 s was used.
used to tune or enhance application properties, typically as catalysts or
microporous materials [5.49]. There is little known on Ga solid-state NMR,
although there is a well established and confirmed correlation that links gallium
and aluminium chemical shifts for four- and six-fold coordination in silicate,
phosphates, zeolites and organic complexes [5.45,5.50]. The aim of this work
was to identify the local surroundings of the different Ga species and to extract
information about the effects of Ga substitution in AlPO-34 on dynamic
behaviour. The 71Ga MAS NMR spectra of py-GaPO-34 and mim-GaPO-34 have
not yet been reported by other workers and this is the first investigation of
GaPO-34 materials using NMR spectroscopy.
As 71Ga and 69Ga NMR experiments require special conditions to obtain
interpretable spectra with fully resolved peaks, the experiments were acquired

157
(a) (b)
Figure 5.20 Two-dimensional 71Ga MQMAS (triple-quantum) spectrum of (a) mim-GaPO-34 and (b) py-GaPO-34. MAS rate was 33 kHz. The spectrum were recorded at 20.0 T using 2.5-mm broadband MAS probe. 480 transients were averaged for each 300 t1 values, with a t1 increment
of 50 s with a relaxation interval of 0.5 s. The State-Haberkorn-Ruben (States) method of 1 sign discrimination was used.
at high magnetic field and at fast spinning rates. Figure 5.19 presents one-
dimensional 71Ga MAS NMR spectra of both gallium phosphate samples
recorded at 20.0 T.
The spectrum in Figure 5.19a shows two broad peaks at 95.5 and 45.3
ppm and they correspond to the 4- and 6-coordinated Ga species, respectively.
The first peak is more intense than the peak at 45.3 ppm, indicating that this
peak may contain the resonances from the two tetrahedral sites. Therefore a
high-resolution 71Ga MQMAS spectrum of mim-GaPO-34 was recorded in order
to increase significantly the resolution of the spectrum. Figure 5.20a shows the

158
(a) (b)
Figure 5.21 69Ga MAS NMR spectra of (a) mim-GaPO-34 and (b) py-GaPO-34. The spectra were recorded at 20.0 T using 1.3-mm broadband MAS probe. Spectra are the result of averaging 7200 transients. A recycle intervals of 0.5 s was used.
two-dimensional MQMAS spectrum of mim-GaPO-34. It can be observed that
three peaks appear in the MQMAS spectrum corresponding to two 4-
coordinated and one 6-coordinated gallium species. The 71Ga MAS NMR
spectrum of py-GaPO-34 shown in Fig. 5.19(b) also displays two broad lines at
105.2 and 34.1 ppm. However, the resonance at 34.1 ppm does not exhibit a
lineshape characteristic of second-order quadrupolar broadening, as seen in Fig.
5.19a, but it shows slightly asymmetric lineshape. Once again the two-
dimensional MQMAS spectrum of py-GaPO-34 was recorded to resolve
overlapping peaks and it is presented in Fig. 5.20b. This spectrum shows two 4-
and one 6-coordinated Ga species, as in the case of the first as-made GaPO-34.
As the gallium quadrupolar couplings are large, which gives rise to
severe second-order broadening of the powder spectrum of its central transition

159
Table 5.3
71Ga isotropic chemical shifts ( iso), quadrupolar coupling constants (CQ) and
asymmetry parameters ( ) for mim- and py-GaPO-34.
iso (ppm) CQ / MHz
mim-GaPO-34
Ga1 116.5 15.7 0.71
Ga2 107.8 14.0 0.83
Ga3 29.76 13.3 0.30
py-GaPO-34
Ga1 121.9 12.7 0.40
Ga2 110.8 12.0 0.70
Ga3 26.38 9.02 0.90
as observed in one-dimensional spectra, therefore the cross-sections from
MQMAS spectra were analysed, using the DMFIT fitting program, so that
quadrupolar parameters could be extracted. In the case of 6-coordinated Ga
species the one-dimensional spectra instead of cross-sections were analysed
using DMFIT program. From each lineshape fitting, the values of the
asymmetry parameter, , the quadrupolar coupling constant CQ and the
isotropic chemical shift, iso were obtained and results are presented in Table

160
Figure 5.22 13C MAS NMR spectra of mim-GaPO-34 (black line) and py-GaPO-34 (red line). The MAS rate was 12.5 kHz. The spectra were recorded at 14.1 T using 2.5-mm broadband MAS probe. Spinning sidebands are denoted with asterisks. Spectra are the result of averaging 576 (mim-GaPO-34) and 384 (py-GaPO-34 ) transients with a recycle interval of 5 s and CP contact
time of 1 ms (mim-GaPO-34) and 2 ms (py-GaPO-34 ). 1H decoupling (TPPM-15, rf = 100 kHz) was applied during acquisition.
5.3. As the signal-to-noise ratio is low in the MQMAS spectra, larger errors are
expected for those values. The quadrupolar coupling constants of all Ga sites
are stronger for mim-GaPO-34. These results are consistent with the line
broadening observed in 71Ga MAS NMR spectra, especially in the case of 6-
coordinated Ga site as the difference in these two linewidths is evident.
Furthermore, the one-dimensional 69Ga MAS NMR spectra of mim-
GaPO-34 and py-GaPO-34 were recorded and are displayed in Figure 5.21. Both
spectra also show two broad peaks owing to the strong quadrupolar coupling.
The spectrum in Fig. 5.21a exhibits second-order quadrupolar broadening
lineshape while the spectrum in Fig. 5.21b shows asymmetric lineshapes of 4-

161
coordinated and 6-coordinated Ga species, similar to the 71Ga MAS NMR
spectra.
Figures 5.22 shows the one-dimensional 13C MAS NMR spectra of mim-
GaPO-34 and py-GaPO-34. The 13C CPMAS NMR spectrum of mim-GaPO-34
contains three resonances at 134.2, 124.1, 122.8 corresponding to the carbons
bonded to both nitrogen atoms and the other carbons from the ring linked to
the NH group and those linked to the N(CH3) group, respectively, and one peak
at 36.7 ppm assigned to methyl groups, as found in the literature [5.39]. The 13C
CPMAS NMR spectrum of py-GaPO-34 shows three resonances at 148.7, 141.5
and 128.7 ppm with linewidth of each of the peaks around 200 Hz. The
chemical shifts of these three lines in the 13C MAS NMR spectrum correspond to
the two carbons bonded to the nitrogen atom, the other carbons located across
from the nitrogen atom and all the other carbons in the ring, respectively [5.39].
Furthermore, the one-dimensional 31P MAS NMR spectra of GaPO-34
samples were recorded and are presented in Fig. 5.23. The 31P MAS NMR
spectrum of both samples contains three resonances at 0.9, 12.0 and 20.2
ppm for mim-GaPO-34 and at 0.8, 13.8 and 20.5 ppm for py-GaPO-34
corresponding to tetrahedral P sites in the GaPO framework. The chemical
shifts are very close to those of AlPO-34 suggesting the same structure of AlPO

162
Figure 5.23 31P MAS NMR spectra of mim-GaPO-34 (black line) and py-GaPO-34 (red line). The MAS rate was 25 kHz. The spectra were recorded at 14.1 T. Spectra are the result of averaging 8 transients with a recycle interval of 60 s.
and GaPO frameworks.
5.5. Conclusion
Three as-made AlPO-34 samples have similar structure as they show the
same number of crystalographically distinct Al and P sites in 27Al and 31P MAS
NMR spectra. It means that template does not influence the AlPO framework.
In the case of pip-, morph- and dmi-AlPO-34 the framework is composed of
three Al sites (one 6-coordinated and two 4-coordinated) and three P sites (all 4-
coordinated). These results are consistent with the literature and X-ray powder
diffraction data.
It has been shown that the combination of MQMAS, STMAS and some

163
variable-temperature experiments permit useful interpretation of dynamic
behaviour of the all samples.
The effect of calcination and on AlPO-34 materials has been also
investigated and the first 27Al, 31P and 2H MAS NMR spectra of deuterated pip-
and morph-AlPO-34 are presented and interpreted here. 27Al and 31P MAS
NMR spectra of calcined-dehydrated AlPO-34 show a single narrow peak
(omitting an impurity) consistent with the structural determination. Previous
publications confirm the presence of one Al and P sites within the sample.
However, as the NMR spectra of calcined-dehydrated AlPO-34 are clear
and easy to interpret, the results of calcined-rehydrated material are difficult to
explain. The changes occurring during the rehydratation over specific
temperature range can be interpreted as due to phase transition as found by
Tuel et. al or due to dynamics. This is the first observation of this effect because
the same NMR experiments have been performed previously but they did not
indicate the presence of any phase transition or motion.
Since 2H NMR spectroscopy became a simple way to probe motion on µs
timescale, AlPO samples were also deuterated and 2H NMR experiments were
performed in order to observe dynamic behaviour of those samples. It has been

164
demonstrated here that in the case of deuterated morph-AlPO-34 motion are
absent or faster than Larmor frequency so it is not possible to observe the effect
of motional broadening or narrowing using described methods. On the other
hand, in the case of either pip- or Hpip-AlPO-34 narrowing of the spinning
sidebands in 27Al MAS NMR spectra recorded with wide spectral width is
present. Furthermore, 2H DQMAS spectra of both materials indicate motion on
µs timescale, probably due to D2O or guest dynamic in framework solid.
However, these results are complex and further work will have to be carried
out to interpret the work presented here in more detail.
The first NMR results for GaPO-34 synthesized with pyridine and
methylimidazole as the templates are also demonstrated here. Two-dimensional
71Ga MQMAS NMR spectra of py- and mim-GaPO-34 show two tetrahedral and
one octahedral Ga species. One-dimensional 31P spectra show three tetrahedral
P sites as in the case of as-made AlPO-34 samples. Interpretation of dynamic
behaviour in GaPO materials is more difficult due to a very strong Ga
quadrupolar coupling. Therefore, further experiments will have to be
performed to extract more information about motion within GaPO-34 samples.
Additionally, CASTEP calculations presented here turned out to be very
helpful in analysis of the experimental data.

165
Appendix A
Preparation of 9,12-diiodo-ortho-carborane
A stirred solution of ortho-carborane (0.291 g, 2.02 mmol) and iodine (0.513 g,
2.02 mmol) in glacial acetic acid (8 ml) was heated to 353 K and treated slowly
with a mixture of conc. HNO3 and conc. H2SO4 (1:1 v/v 5 ml). The solution
produced a brown vapour and after 1 hr turned pale orange. The mixture was
poured into distilled water (60 ml) and the precipitate was washed with water
and then dissolved in ether. The ether was then evaporated from the solution.
The product was then recrystallized using hexane to give 187 mg (23.4% yield)
of 9,12-diiodo-ortho-carborane (C2H10B10I2).
Preparation of pip-AlPO-34
The reactants used to synthesize pip-AlPO-34 were piperidine, phosphoric acid,
hydrofluoric acid, and aluminum isopropoxide. The relative molar composition
of the reaction mixture used in the preparation of pip-AlPO4-34 was
Al2O3:P2O5: HF: 2 piperidine: 100 H2O. The mixture was prepared by successive
addition of phosphoric acid, hydrofluoric acid, and piperidine to a suspension
of aluminum isopropoxide in water with constant stirring. The crystallization

166
was performed at 190°C for 4 days under static conditions. The products were
recovered, washed with deionized water, filtered and dried at 70°C in air
overnight.
Preparation of dim-AlPO-34 (SIZ-4)
A sample of SIZ-4 was prepared by adding a 1-butyl-3methylimidazolium
bromide ionic liquid along with aluminium isoproproxide, phosphoric acid and
hydrofluoric acid to a Teflon-lined steel autoclave. The autoclave was then
heated in an oven to the necessary temperature for the required time. Once the
reaction was complete, the autoclave was removed from the oven and allowed
to cool to room temperature. The product was filtered and washed with water
and acetone.

167
Appendix B
Coefficients of zero-, second- and fourth-rank terms in Eqn. (3.8) for half-
integer spin nuclei
mI A0 (I, mI) A2 (I, mI) A4 (I, mI)
I = 3/2 1/2 – 2/5 – 8/7 54/35
3/2 6/5 0 – 6/5
I = 5/2
1/2 – 16/15 – 64/21 144/35
3/2 – 4/5 – 40/7 228/35
5/2 20/3 40/21 – 60/7
I = 7/2
1/2 – 30/15 – 120/21 270/35
3/2 – 54/15 – 96/7 606/35
5/2 30/15 – 240/21 330/35
7/2 294/15 168/21 – 966/35
I = 9/2
1/2 – 48/15 – 192/21 432/35
3/2 – 108/15 – 168/7 1092/35
5/2 – 60/15 – 600/21 1140/35
7/2 168/15 – 336/21 168/35
9/2 648/15 432/21 – 2332/35

168
Appendix C
Reduced Rotation Matrix Elements
l = 1
d1, 11 ( ) d 1,1
1 ( )1
2(1 cos )
d1,11 ( ) d 1, 1
1 ( )1
2(1 cos )
d0,11 ( ) d 1,0
1 ( ) d0, 11 ( ) d1,0
1 ( )1
2sin
d0,01 ( ) cos
l = 2
d2,22 ( ) d 2, 2
2 ( ) cos4 ( / 2)
d2,12 ( ) d1,2
2 ( ) d 2, 12 ( ) d 1, 2
2 ( )1
2sin (1 cos )
d2,02 ( ) d0,2
2 ( ) d 2,02 ( ) d0, 2
2 ( )3
8sin2

169
d2, 12 ( ) d1, 2
2 ( ) d 2,12 ( ) d 1,2
2 ( )1
2sin (1 cos )
d2, 22 ( ) d 2,2
2 ( ) sin4 ( / 2)
d1,12 ( ) d 1, 1
2 ( )1
2(1 2 cos )(1 cos )
d1, 12 ( ) d 1,1
2 ( )1
2(1 2 cos )(1 cos )
d1,02 ( ) d0, 1
2 ( ) d0,12 ( ) d 1,0
2 ( )3
2sin cos
d0,02 ( )
1
2(3cos2 1)
l = 4
d0,04 ( )
1
8(35cos4 30cos2 3)
d0,24 ( ) d2,0
4 ( )10
128(14 cos4 8 cos2 6)
d0,44 ( ) d4,0
4 ( )70
128(cos4 4 cos2 3)

170
Appendix D
MQMAS ratios (A4 (I,mI)/A4 (I,1/2)) for half-integer spin nuclei.
Spin I Three-
quantum Five-
quantum Seven-
quantum Nine-
quantum
3/2 – 7/9
5/2 19/12 – 25/12
7/2 101/45 11/9 – 161/45
9/2 91/36 95/36 7/18 – 31/6

171
Appendix E
STMAS ratios R(I,q), for mI = (q 1) q single-quantum transitions.
I q R(I,q)
3/2 3/2 – 8/9
5/2 3/2 7/24
5/2 – 11/6
7/2
3/2 28/45
5/2 –23/45
7/2 –12/5
9/2
3/2 55/72
5/2 1/18
7/2 –9/8
9/2 –25/9

172
References
[1.1] E. M. Purcell, H. C. Torrey, R. V. Pound, Phys. Rev. 69, 37 (1946).
[1.2] F. Bloch, W. W. Hansen, M. Packard, Phys. Rev. 70, 474 (1946).
[1.3] J. T. Arnold, S. S. Dharmatti, M. E. Packard, J. Chem. Phys. 19, 507
(1951).
[1.4] E. R. Andrew, A. Bradbury, R. G. Eades, Nature 182, 1659 (1958).
[1.5] E. R. Andrew, A. Bradbury, R. G. Eades, Nature 183, 1802 (1959).
[1.6] I. J. Lowe, Phys. Rev. Lett. 2, 258 (1959).
[1.7] S. R. Hartmann, E. L. Hahn, Phys. Rev. 128, 2042 (1962).
[1.8] R. R. Ernst, W. A. Anderson, Rev. Sci. Instr. 37, 93 (1966).
[1.9] J. Jeener, Ampere International Summer School, Basko Polje,
Yugoslavia, (1971).
[1.10] E. D. Ostroff, J. S. Waugh, Phys. Rev. Lett. 16, 1097 (1966).
[1.11] P. Mansfield, D. Ware, Phys. Letters 22, 133 (1966).
[1.12] A. Llor, J. Virlet, Chem. Phys. Lett. 152, 248 (1988).
[1.13] A. Samoson, A. Lippmaa, A. Pines, Mol. Phys. 65, 1013 (1988).
[1.14] A. Samoson, A. Lippmaa, J. Magn. Reson. 84, 410 (1989).
[1.15] K. T. Mueller, B. Q. Sun, G. C. Chingas, J. W. Zwanziger, T. Terao, A.
Pines, J. Magn. Reson. 86, 248 (1990).
[1.16] L. Frydman, J. S. Harwood, J. Am. Chem. Soc. 117, 5367 (1995).
[1.17] P. R. Bodart, J. Parmentier, R. K. Harris, D. P. Thompson J. Phys.
Chem.Solids 60, 223 (1999).
[1.18] H. Kraus, R. Prins, A. P. M. Kentgens, S. Wimperis, J. Phys. Chem. 100,
16336 (1996).
[1.19] L. Marinelli, L. Frydman, Chem. Phys. Lett. 275, 188 (1997).
[1.20] Z. Gan, J. Am. Chem. Soc. 122, 3242 (2000).

173
[1.21] M. C. Payne, M. P. Teter, D. C. Allan, T. A. Arias, J. D.
Joannopoulos, Rev. Mod. Phys. 64, 1045 (1992).
[2.1] F. Bloch, Phys. Rev. 70, 460 (1946).
[2.2] R. R. Ernst, W. A. Anderson, Rev. Sci. Instr. 37, 93 (1966).
[2.3] A. E. Derome, in "Modern NMR Techniques for Chemistry Research",
p. 13, Pergamon Press, Oxford, 1991.
[2.4] A. Abragam, in "Principles of Nuclear Magnetism", p. 33, Oxford,
Science Publications, 1961.
[2.5] A. E. Derome, in "Modern NMR Techniques for Chemistry Research",
p. 77, Pergamon Press, Oxford, 1991.
[2.6] M. J. Duer,in "Introduction to Solid-State NMR Spectroscopy",
Chapter 4 , Blackwell Publishing, Oxford, 2004.
[2.7] M. Mehring, A. Pines, W. K. Rhim, J. S. Waugh, J. Chem. Phys. 54, 3239
(1971).
[2.8] A. Abragam, in "Principles of Nuclear Magnetism", p. 480-495,
Oxford, Science Publications, 1961.
[2.9] E. R. Andrew, in "Encyclopedia of Nuclear Magnetic Resonance" (D.
M. Grant and R. K. Harris, Eds.), Vol. 5, p. 2891, Wiley, Chichester,
1996.
[2.10] P. J. Hore, in "Nuclear Magnetic Resonance", p. 9, Oxford University
Press, Oxford, 1995.
[2.11] A. J. Vega, in "Encyclopedia of Nuclear Magnetic Resonance" (D. M.
Grant and R. K. Harris, Eds.), Vol. 6, p. 3869, Wiley, Chichester, 1996.
[2.12] P. P. Man, in "Encyclopedia of Nuclear Magnetic Resonance" (D. M.
Grant and R. K. Harris, Eds.), Vol. 6, p. 3838, Wiley, Chichester, 1996.
[2.13] J. P. Amoureux, Solid State Nucl. Magn. Reson. 2, 83 (1993).
[2.14] A. Abragam, in "Principles of Nuclear Magnetism", p. 232, Oxford,

174
Science Publications, 1961.
[2.15] P. W. Atkins, R. S. Friedman, in "Molecular Quantum Mechanics",
Chap. 6, Oxford University Press, Oxford, 1997.
[2.16] S. E. Ashbrook, S. Wimperis, J. Magn. Reson. 177, 44 (2005).
[2.17] S. Samoson, E. Lippmaa, J. Magn. Reson. 84, 410 (1989).
[2.18] R. N. Zare, in "Angular Momentum", Chap. 5, Wiley, Chichester,
1996.
[2.19] H. A. Buckmaster, Can. J. Phys. 42, 386 (1964).
[2.20] R. N. Zare, in "Angular Momentum", Chap. 2, Wiley, Chichester,
1987.
[3.1] J. Keeler, in "Understanding NMR Spectroscopy", Chap. 9, Wiley,
Chichester, 2005.
[3.2] S. P. Brown, S. Wimperis, Chem. Phys. Lett. 237, 509 (1995).
[3.3] E. R. Andrew, in "Encyclopedia of Nuclear Magnetic Resonance" (D.
M. Grant and R. K. Harris, Eds.), Vol. 5, p. 2891, Wiley, Chichester,
1996.
[3.4] A. Abragam, in "Principles of Nuclear Magnetism", p. 480-495,
Oxford Science Publications, 1961.
[3.5] S. E. Ashbrook, M. J. Duer, Concepts Magn. Reson. A 28, 183 (2006).
[3.6] R. R. Ernst, G. Bodenhausen, and A. Wokaun, in "Principles of
Nuclear Magnetic Resonance in One and Two Dimensions", Chap. 6,
Clarendon Press, Oxford, 1987.
[3.7] C. Fernandez, J. P. Amoureux, Solid State NMR 5, 315 (1996).
[3.8] D. Marion, K. Wüthrich, Biochem. Biophys. Res. Commun. 113, 967
(1983).
[3.9] D. J. States, R. A. Haberkorn, D. J. Ruben, J. Magn. Reson. 48, 286

175
(1982).
[3.10] J. P. Amoureux, C. Fernandez, J. Steuernagel, J. Magn. Reson. A 123,
(1996).
[3.11] O. W. Sørensen, M. Rance, R. R. Ernst, J. Magn. Reson. 56, 527 (1984).
[3.12] S. P. Brown, S. J. Heyes, S. Wimperis, J. Magn. Reson. A119, 280 (1996).
[3.13] P. J. Grandinetti, J. H. Baltisberger, J. Stebbins, U. Werner, M. A.
Eastman, A. Pines, Mol. Phys. 81, 1109 (1994).
[3.14] S. P. Brown, S. Wimperis, J. Magn. Reson. 128, 42 (1997).
[3.15] D. Massiot, B. Touzo, D. Trumeau, J. P. Coutures, J. Virlet, P. Florian,
P. J. Grandinetti, Solid State NMR 6, 73 (1996).
[3.16] P. K. Madhu, A. Goldburt, L. Frydman, S. Vega, Chem. Phys. Lett. 307,
41 (1999).
[3.17] Z. Gan, H. T. Kwak, Solid State NMR 20, 87 (2001).
[3.18] T. J. Ball, S. Wimperis, J. Magn. Reson. 187, 343 (2007).
[3.19] P. R. Bodart, J. Parmentier, R. K. Harris, D. P. Thompson J. Phys.
Chem. Solids 60, 223 (1999).
[3.20] H. Kraus, R. Prins, A. P. M. Kentgens, J. Phys. Chem. 100, 16336 (1996).
[3.21] G. Wu, S. Kroeker, R. E. Wasylishen, R. G. Griffin, J. Magn. Reson. 128,
237 (1997).
[3.22] L. Marinelli, L. Frydman, Chem. Phys. Lett. 275, 188 (1997).
[3.23] R. Freeman, in "A Handbook of Nuclear Magnetic Resonance", 2nd
ed., p. 88, Longman, Harlow, 1997.
[3.24] S. E. Ashbrook, S. Wimperis, Prog. Nucl. Magn. Reson. Spectrosc. 45, 53
(2004).
[3.25] H. T. Kwak, Z. Gan, J. Magn. Reson. 164, 369 (2003).
[3.26] N. G. Dowell, S. E. Ashbrook, S. Wimperis, J. Phys. Chem. B 108, 13292
(2004).
[3.27] C. Fernandez, L. Delevoye, J. P. Amoureux, D. P. Lang, M. Pruski,

176
J. Am. Chem. Soc. 119, 6858 (1997).
[3.28] M. Pruski, D. P. Lang, C. Fernandez, J. P. Amoureux, Solid State Nucl.
Magn. Reson. 7, 327 (1997).
[3.29] G. A. Morris, R. J. Freeman, J. Am. Chem. Soc. 101, 760 (1979).
[3.30] D. T. Pegg, D. M. Doddrell, W. M. Brooks, M. R. J. Bendall, J. Magn.
Reson. 44, 32 (1981).
[3.31] J. P. Amoureux, J. Trebosc, J. Wiench, M. Pruski, J. Magn. Reson. 184, 1
(2007).
[3.32] J. Keeler, in "Understanding NMR Spectroscopy", Chap. 7, Wiley,
Chichester, 2005.
[3.33] C. A. Fyfe, K. C. Wongmoon, Y. Huang, H. Grondey, J. Am. Chem. Soc.
117, 10397 (1995).
[3.34] Y. S. Yen, D. P. Weitekamp, J. Magn. Reson. 47, 476 (1982).
[3.35] L. Müller, Chem. Phys. Lett. 91, 303 (1982).
[3.36] A. Lesage, L. Emsley, J. Magn. Reson. 148, 449 (2001).
[3.37] R. Kemp-Harper, D. J. Philp, P. W. Kuchel, J. Chem. Phys. 115, 2908
(2001).
[4.1] M. J. Duer, in "Introduction to Solid-State NMR Spectroscopy",
Chapter 6 , Blackwell Publishing, Oxford, 2004.
[4.2] R. R. Ernst, G. Bodenhausen and A. Wokaun, in "Principles of
Nuclear Magnetic Resonance in One and Two Dimensions",
Clarendon, Oxford, 1987.
[4.3] J. Jeener, B. H. Meier, P. Bachmann, R. R. Ernst, J. Chem. Phys. 71, 4546
(1979).
[4.4] L. S. Cahill, R. P. Chapman, J. F. Britten, G. R. Goward, J. Phys. Chem.
B110, 7171 (2006).

177
[4.5] F. Wang, G. P. Grey, J. Am. Chem. Soc. 120, 970 (1998).
[4.6] S. Chaudhuri, F. Wang, C. P. Grey, J. Am. Chem. Soc. 124, 11746 (2002).
[4.7] N. Kim, R. N. Vannier, C. P. Grey, Chem. Mater. 17, 1952 (2005)
[4.8] J. Cabana, N. Dupre, G. Rousse, C. P. Grey, M. R. Palacin, Solid State
Ionics 176, 2205 (2005).
[4.9] H. S. Gutowsky, G. E. Pake, J. Chem. Phys. 18, 162 (1950).
[4.10] E. R. Andrew, J. Chem. Phys. 18, 607 (1950).
[4.11] M. M. Maricq, J. S. Waugh, J. Chem. Phys. 70, 3300 (1979).
[4.12] S. E. Ashbrook, S. Antonijevic, A. J. Berry, S. Wimperis, Chem. Phys.
Lett. 364, 634 (2002).
[4.13] S. Antonijevic, S. E. Ashbrook, S. Biedasek, R. I. Walton, S. Wimperis,
H. Yang, J. Am. Chem. Soc. 128, 8054 (2006).
[4.14] M. J. Thrippleton, M. Cutajar, S. Wimperis, Chem. Phys. Lett. 452, 233
(2008).
[4.15] J. H. Kristensen, G. L Hoatson, R. L. Vold Solid State NMR 13, 1 (1998).
[4.16] M. Hologne, J. Hirschinger Solid State NMR 26, 1 (2004).
[4.17] B. C. Gerstein, in "Encyclopaedia of Nuclear Magnetic Resonance" (D.
M. Grant and R. K. Harris, Eds.), p. 1835, Wiley, Chichester, 1996.
[4.18] J. H. Davis, K. R. Jeffrey, M. Bloom, M. I. Valic, T. P. Higgs, Chem.
Phys. Lett. 42, 390 (1976).
[4.19] L. W. Jelinski, J. J Dumais, A. K. Engel, Macromolecules 16, 492 (1983).
[4.20] M. J. Duer, C. Stourton, J. Magn. Reson. 129, 44 (1997).
[4.21] M. Cutajar, S. E. Ashbrook, S. Wimperis, Chem. Phys. Lett. 423, 276
(2006).
[4.22] J. M. Griffin, A. J. Miller, A. J. Berry, S. Wimperis, S. E. Ashbrook
Phys. Chem. Chem. Phys. 12, 2989 (2010).
[4.23] T. Bräuniger, R. Poupko, H. Zimmermann, Z. Luz J. Chem. Soc. 2,

178
1255 (1997).
[4.24] G. H. Penner, J. M. Polson, J. Chem. Soc., Dalton Trans. 803 (1993).
[4.25] T. Chang, Ch. P. Cheng, Ch. Yeh , J. Chem. Soc. 90, 1157 (1994).
[4.26] Ch. F. Lee, L. K. Myers, K. G. Valentine, M. E. Thompson J. Chem.
Soc., Chem. Commun. 201 (1992).
[4.27] H. T. Edzes, W. S. Veeman, Polymer Bulletin 5, 255 (1981).
[4.28] B. C. Perry, J. L. Koenig, J. B. Lando, Macromolecules 20, 422 (1987).
[4.29] J. R. Garbow, J. Schaefer, Macromolecules 20, 819 (1987).
[4.30] J. Bonmatin, I. C. P. Smith, H. C. Jarrell, D. J. Siminovitch, J. Am.
Chem. Soc. 110, 8693 (1988).
[4.31] D. J. Siminovitch, M. J. Ruocco, E. T. Olejniczak, S. K. Das Gupta, R.
G. Griffin, Biophys. J. 54, 373 (1988).
[4.32] P. P. Man, in "Encyclopedia of Nuclear Magnetic Resonance" (D. M.
Grant and R. K. Harris, Eds.), p. 3838, Wiley, Chichester, 1996.
[4.33] M. J. Duer,in "Introduction to Solid-State NMR Spectroscopy",
Chapter 5 , Blackwell Publishing, Oxford, 2004.
[4.34] U. Eliav, G. Navon, J. Chem. Phys. 95, 7114 (1991).
[4.35] R. Poupko, A. Baram, Z. Luz, Mol. Phys. 27, 1345 (1974).
[4.36] L. G. Werbelow, J. Chem. Phys. 70, 5381 (1979).
[4.37] P. O. Westlund, H. Wennerström, J. Magn. Reson. 50, 451 (1982).
[4.38] L. Werbelow, R. E. London, Concepts in Magn. Reson. 8, 325 (1996).
[4.39] J. L. Bjorkstam, P. Ferloni, M. Villa, J. Chem. Phys. 73, 2932 (1980).
[4.40] D. Brinkmann, M. Mali, J. Roos, R. Messer, H. Birli, Phys. Rev. B 26,
4810 (1982).
[4.41] M. Witschas, H. Eckert, J. Phys. Chem. A 103, 10764 (1999).
[4.42] E. C. Reynhardt, S. Froneman, Mol. Phys. 74, 61 (1991).
[4.43] P. Beckmann, A. J. Leffler, J. Chem. Phys. 72, 4600 (1980).
[4.44] R. K. Harris, J. Bowles, I. R. Stephenson, E. H. Wong, Spectrochimica

179
Acta A 44, 273 (1988).
[4.45] U. Eliav, H. Shinar, G. Navon, J. Magn. Reson. 94, 439 (1991).
[4.46] L. Frydman, J. S. Harwood, J. Am. Chem. Soc. 117, 5367 (1995).
[4.47] S. Wimperis, J. Magn. Reson. A 102, 302 (1993).
[4.48] T. Kurkiewicz, M. J. Thrippleton, S. Wimperis, Chem. Phys. Lett. 467,
412 (2009).
[4.49] M. C. Payne, M. P. Teter, D. C. Allan, T. A. Arias, J. D. Joannopoulos,
Rev. Mod. Phys. 64, 1045 (1992).
[4.50] J. Keeler, in "Understanding NMR Spectroscopy", Chap. 9, Wiley,
Chichester, 2005.
[4.51] A. J. Leffler, J. Chem. Phys. 63, 3971 (1975).
[4.52] M. Winterlich, R. Böhmer, J. Chem. Phys. 123, 094504 (2005).
[4.53] L. A. Leites, Chem. Rev. 92, 279 (1992).
[4.54] H. P. Diogo, N. T. Correia, J. J. M. Ramos, J. Phys. Chem. Solids 66, 832
(2005).
[5.1] S. T. Wilson, B. M. Lok, C. A. Messina, T. R. Cannan, E. M. Flanigen, J.
Am. Chem. Soc. 104, 1146 (1971).
[5.2] S. T. Wilson, B. M. Lok, C. A. Messina, T. R. Cannan, E. M. Flanigen, ACS
Symp. Ser. 218, 79 (1983).
[5.3] Y. Li, J. Yu, R. Xu, http://mezeopor.jlu.edu.cn/alpo and references
therein.
[5.4] J. M. Thomas, Y. Xu, C. R. A. Catlow, J. W. Couves, Chem. Mater. 3, 667
(1991).
[5.5] Y. Xu, C. P. Grey, J. M. Thomas, A. K. Cheetham, Catal. Lett. 4, 251 (1990).
[5.6] M. Stocker, Microporous Mesoporous Mater. 29, 3 (1999).
[5.7] J. M. Thomas, R. Raja, G. Sankar, R. G. Bell, Nature 398, 227 (1999).
[5.8] J. M. Thomas, R. Raja, G. Sankar, R. G. Bell, Acc. Chem. Res. 34, 191 (2001).

180
[5.9] http://izasc.ethz.ch/fmi/xsl/iza-sc/ftc_fw.xsl?-db=Atlas_main&-
lay=fw&STC=CHA&-find
[5.10] M. Zema, S. C. Tarantino, G. Montagna, Chem. Mater. 20, 5876 (2008).
[5.11] H. Kessler, in Synthesis, Characterization and Novel Applications of
Molecular Sieve Materials (R. L. Bedard et al., Eds), p. 47, Materials
Research Society, Pittsburg, PA, 1991.
[5.12] F. Rey, G. Sankar, J. M. Thomas, P. A. Barrett, D. W. Lewis, C. R. A.
Catlow, S. M. Clark, G. N. Greaves, Chem. Mater. 7, 1435 (1995).
[5.13] G. Muncaster, A. T. Davies, G. Sankar, C. R. A. Catlow, J. M. Thomas, S.
L. Colston, P. Barnes, R. I. Walton, D. O‘Hare, Phys. Chem. Chem. Phys. 2,
3523 (2000).
[5.14] D. W. Lewis, C. R. A. Catlow, J. M. Thomas, Faraday Discuss. 451 (1997).
[5.15] D. W. Lewis, C. R. A Catlow, J. M. Thomas, Chem. Mater. 8, 1112 (1996).
[5.16] N. Rajic, D. Stojakovic, S. Hocevar, V. Kaucic, Zeolites 13, 384 (1993).
[5.17] G. Nardin, L. Randaccio, V. Kaucic, N. Rajic, Zeolites 11, 192 (1991).
[5.18] A. M. Prakash, S. Unnikrishnan, J. Chem. Soc.—Faraday Trans. 90, 2291
(1994).
[5.19] S. Ashtekar, S. V. V. Chilukuri, A. M. Prakash, D. K. Chakrabarty, J. Phys.
Chem. 100, 3665 (1996).
[5.20] S. Ashtekar, S. V. V. Chilukuri, A. M. Prakash, C. S. Harendranath, D. K.
Chakrabarty, J. Phys. Chem. 99, 6937 (1995).
[5.21] E. Dumitriu, A. Azzouz, V. Hulea, D. Lutic, H. Kessler, Microporous
Mater. 10, 1 (1997).
[5.22] C. U. Denavarro, F. Machado, M. Lopez, D. Maspero, J. Perezpariente,
Zeolites 15, 157 (1995).
[5.23] Y. Xu, P. J. Maddox, J. W. Couves, J. Chem. Soc.—Faraday Trans. 86, 425
(1990).
[5.24] M. M. Harding, B. M. Kariuki, Acta Crystallogr. Sect. CCryst. Struct.

181
Commun. 50, 852 (1994).
[5.25] N. Rajic, A. Ristic, A. Tuel, V. Kaucic, Zeolites 18, 115 (1997).
[5.26] H. Kessler, J. Patarin, C. Schott-Darie, Stud. Surf. Sci. Catal. 85, 85 (1994).
[5.27] C. Fernandez, J. P. Amoureux, L. Delmotte, H. Kessler, Microporous
Materials 6, 125 (1996).
[5.28] A. Tuel, S. Caldarelli, A. Meden, L. B. McCusker, Ch. Baerlocher, A.
Ristić, N. Rajić, G. Mali, V. Kaučič, J. Phys. Chem. B 104, 5697 (2000).
[5.29] D. Muller, W. Gessner, A. R. Z. Grimmer, Chem. 17, 453 (1977).
[5.30] D. Muller, W. Gessner, H. J. Behrens, G. Scheler, Chem. Phys. Lett. 79, 59
(1981).
[5.31] V. M. Mastikhin, O. P. Krivorochko, B. P. Zolotovski, R. A. Buyanov,
React. Kinet. Catal. Lett. 18, 117 (1981).
[5.32] D. Freude, H. J. Behrens, Cryst. Res. Technol. 16, K36 (1981).
[5.33] F. V. Lampe, D. Muller, W. Gessner, A. R. Grimmer, G. Z. Scheler, Anorg.
Allg. Chem. 489, 16 (1982).
[5.34] B. H. W. S. de Jong, C. M. Schramm, V. E. Parziale, Cosmochim. Acta 47,
1223 (1983).
[5.35] E. L. Eliel, D. Kandansamy, C. Y. Yen, D.D. Hargrave. J. Am. Chem. Soc.
102, 3698 (1980).
[5.36] D. Massiot, B. Touzo, D. Trumeau, et al., Solid State Nucl. Magn. Reson. 6,
73 (1996).
[5.37] O. W. Sorensen, M. Rance, R. R. Ernst, J. Magn. Reson. 56, 527 (1984).
[5.38] J. P. Amoureux, C. Fernandez, S. Steuernagel, J. Magn. Reson. A123, 116
(1996).
[5.39] http://riodb01.ibase.aist.go.jp/sdbs/cgi-bin/cre_index.cgi
[5.40] E. R. Cooper, C. D. Andrews, P. S. Wheatley, P. B. Webb, P. Wormald, R.
E. Morris, Nature 430, 1012 (2004).
[5.41] E. R. Parnham, P. S. Wheatley, R. E. Morris, Chem. Commun. 380, (2006).

182
[5.42] E. R. Parnham, R. E. Morris, Accounts of Chemical Research 40 (10), 1005
(2007).
[5.43] J. Yu, J. Li, K. Sugiyama, N. Togashi, O. Terasaki, K. Hiraga, B. Zhou, S.
Qiu, R. Xu, Chem. Mater. 11, 1727 (1999).
[5.44] C. Schott-Darie, H. Kessler, E. Benazzi, Stud. Surf. Sci. Catal. 83, 3 (1994).
[5.45] D. Massiot, I. Farnan, N. Gautier, D. Trameau, A. Trokiner et. al, Solid
State Nucl. Magn. Reson. 4, 241 (1995).
[5.46] D. Massiot, I. Farnan, N. Gautier, D. Trameau, P. Florian et. al, J. Chem.
Phys. 92, 1847 (1995).
[5.47] T. Vosegaard, D. Massiot, N. Gautier, H. Jakobsen, Inorg. Chem. 36, 2446
(1997).
[5.48] T. Vosegaard, I. P. Byriel, L. Binet, D. Massiot, H. Jakobsen, J. Am. Chem.
Soc. 120, 8184 (1998).
[5.49] D. Massiot, T. Vosegaard et. al, Solid State Nucl. Magn. Reson. 15, 159
(1999).
[5.50] S. M. Bradley, R. F. Howe, R. A. Kydd, Magn. Reson. Chem. 31, 883 (1993).
Related Documents