Statistics in Statistics in Perspective Perspective

kuliah10_stattistics
Dec 05, 2015
kuliah10_stattistics
Welcome message from author
This document is posted to help you gain knowledge. Please leave a comment to let me know what you think about it! Share it to your friends and learn new things together.
Transcript

Statistics in PerspectiveStatistics in Perspective

Statistics in PerspectiveStatistics in PerspectiveChapter TwelveChapter Twelve

Approaches to ResearchApproaches to Research
Educational Research is performed in one Educational Research is performed in one of two ways:of two ways:
1)1) Two or more groups are compared Two or more groups are compared
2)2) Variables within one group are relatedVariables within one group are related The data in a study may be either The data in a study may be either
quantitative or categorical.quantitative or categorical. Four different combinations of research Four different combinations of research
are possible. (see Figure 12.1)are possible. (see Figure 12.1)
All groups are made up of individual units

Combinations of Data and Combinations of Data and Approaches Approaches (Figure 12.1)(Figure 12.1)

A Difference that Doesn’t Make a A Difference that Doesn’t Make a Difference Difference (Figure 12.2)(Figure 12.2)

Comparing Groups: Comparing Groups: Quantitative DataQuantitative Data
When comparing two or more groups using When comparing two or more groups using quantitative data, researchers can compare them quantitative data, researchers can compare them through the following:through the following: Frequency polygonsFrequency polygons Calculation of averagesCalculation of averages Calculations of spreadsCalculations of spreads
Recommendations are made to perform the Recommendations are made to perform the following:following:
Prepare a frequency polygon of each group’s scorePrepare a frequency polygon of each group’s score Use these polygons to decide which measure of central Use these polygons to decide which measure of central
tendency is appropriate to calculatetendency is appropriate to calculate
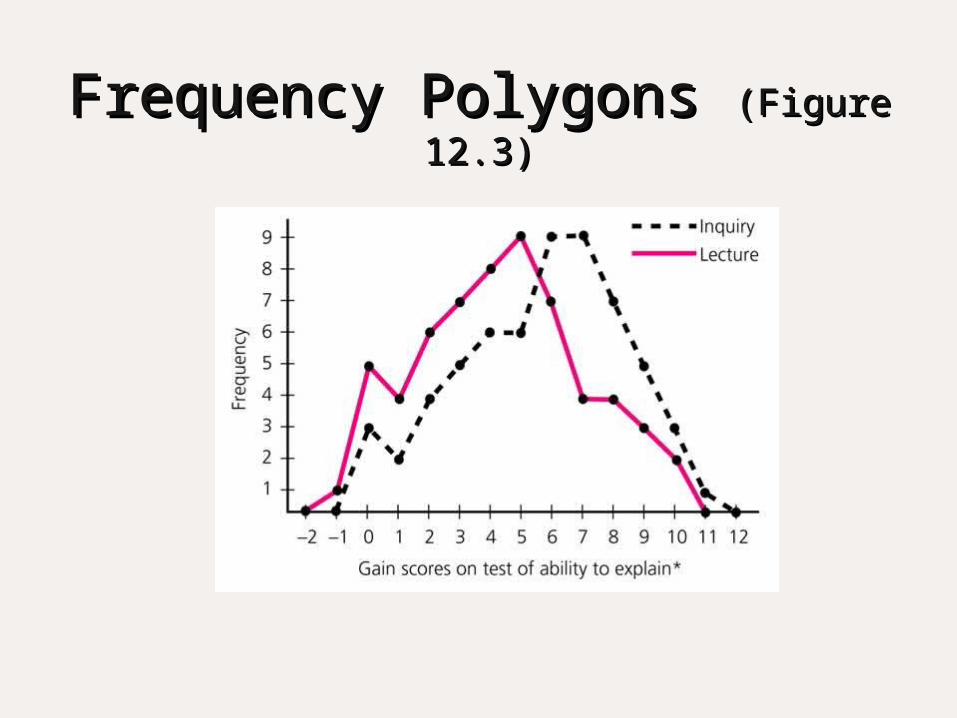
Frequency Polygons Frequency Polygons (Figure 12.3)(Figure 12.3)

90% Confidence Interval 90% Confidence Interval (Figure 12.4)(Figure 12.4)

Comparing Groups: Comparing Groups: Quantitative Data (cont.)Quantitative Data (cont.)
Once the descriptive statistics have been Once the descriptive statistics have been calculated, interpretations must follow.calculated, interpretations must follow.
Considerations of the following can assist Considerations of the following can assist with interpreting data more clearly:with interpreting data more clearly:
Information based on known groupsInformation based on known groups Calculate the effect size of the groupsCalculate the effect size of the groups Use inferential statistics e.g. t-tests, ANOVA, etc.Use inferential statistics e.g. t-tests, ANOVA, etc.

Interpretation of Correlation when Interpretation of Correlation when Testing Research Hypotheses Testing Research Hypotheses
(Table 12.1)(Table 12.1)
Magnitude of r Interpretation
.00 to .40 Of little practical importance except inunusual circumstances; perhapsof theoretical value.a
.41 to .60 Large enough to be of practical as well astheoretical use.
.61 to .80 Very important, but rarely obtained ineducational research.
.81 to above Possibly an error in calculation; if not, a very sizable relationship.
aWhen selecting a very few people from a large group, even correlationsthis small may have a predictive value.

Scatterplots with a Pearson Scatterplots with a Pearson rr of .5 of .5 (Figure 12.5)(Figure 12.5)

Comparing Groups: Categorical DataComparing Groups: Categorical Data
When using categorical data, groups may be When using categorical data, groups may be compared through the following methods:compared through the following methods:
Percentages/ProportionsPercentages/Proportions FrequenciesFrequencies Crossbreak TablesCrossbreak Tables
A limitation of categorical data is that such A limitation of categorical data is that such evaluations are even harder than with evaluations are even harder than with quantitative data.quantitative data.
The use of the summary statistic known as The use of the summary statistic known as contingency coefficientcontingency coefficient is recommended but data is recommended but data must be presented in crossbreak tables.must be presented in crossbreak tables.

Recap of RecommendationsRecap of Recommendations Use graphic techniques Use graphic techniques
before calculating numerical before calculating numerical summary indicessummary indices
Use both graphs and Use both graphs and summary indices to interpret summary indices to interpret results of a studyresults of a study
Make use of external criteria Make use of external criteria to assess the magnitude of a to assess the magnitude of a relationshiprelationship
Use professional consensus Use professional consensus when evaluating magnitude when evaluating magnitude of effect sizeof effect size
Consider using inferential Consider using inferential statisticsstatistics
Use tests of statistical Use tests of statistical significance only to evaluate significance only to evaluate generalizabilitygeneralizability
When random sampling has When random sampling has not occurred, treat not occurred, treat probabilities as probabilities as approximations or crude approximations or crude indices vs. precise valuesindices vs. precise values
Report confidence intervals Report confidence intervals rather than significance rather than significance levels if possiblelevels if possible
Use both parametric and Use both parametric and non-parametric techniques non-parametric techniques to analyze data rather than to analyze data rather than either one aloneeither one alone