1 THE REPUBLIC OF GHANA MINISTRY OF LOCAL GOVERNMENT AND RURAL DEVELOPMENT KWAHU SOUTH DISTRICT ASSEMBLY MPRAESO THE DISTRICT MONITORING & EVALUATION PLAN (2014-2017) Designed By; Abdul Razak Mohammed, DPCU January, 2014

KSDA M&E PLAN -2014-2017-
Aug 16, 2015
Welcome message from author
This document is posted to help you gain knowledge. Please leave a comment to let me know what you think about it! Share it to your friends and learn new things together.
Transcript
1
THE REPUBLIC OF GHANA
MINISTRY OF LOCAL GOVERNMENT AND
RURAL DEVELOPMENT
KWAHU SOUTH DISTRICT ASSEMBLY
MPRAESO
THE DISTRICT MONITORING &
EVALUATION PLAN
(2014-2017)
Designed By;
Abdul Razak Mohammed, DPCU
January, 2014

2
i
Table of Contents
ACRONYMS ........................................................................................................................................................ II
LIST OF TABLES............................................................................................................................................... III
EXECUTIVE SUMMARY .................................................................................................................................. IV
CHAPTER ONE: ................................................................................................................................................. 1
GENERAL INTRODUCTION ............................................................................................................................ 1
1.0 BACKGROUND...................................................................................................................................................... 1 1.1 GOALS AND OBJECTIVES OF DMTDP (2014-2017) ............................................................................................. 1 1.2 PURPOSE OF THE M & E PLAN ............................................................................................................................. 3 1.3 PROCESSES OF DEVELOPING THE M&E PLAN ...................................................................................................... 4
CHAPTER TWO: ................................................................................................................................................ 6
M & E ACTIVITIES ............................................................................................................................................ 6
2.0 INTRODUCTION .................................................................................................................................................... 6 2.1 M&E STAKEHOLDER IDENTIFICATION AND ANALYSIS ........................................................................................ 6 2.2 MONITORING & EVALUATION CAPACITIES AND CONDITIONS ............................................................................ 10 2.3 M & E TARGET INDICATORS .............................................................................................................................. 12 2.4 M&E MATRIX ................................................................................................................................................... 23
2.4.1 M&E Data Collection Sheets .................................................................................................................... 44 2.5 M & E WORK PLAN AND CALENDAR ................................................................................................................. 51 2.6 M&E BUDGET ................................................................................................................................................... 60 2.7 DATA COLLECTION, COLLATION AND ANALYSES .............................................................................................. 65
2.7.1 Reporting and Information Dissemination .............................................................................................. 65 2.8 DEVELOPMENT EVALUATION............................................................................................................................. 66
IN ALL THESE, THE ESSENCE WILL BE: ................................................................................................... 66
STAKEHOLDERS TO BE INVOLVED IN CONDUCT OF DEVELOPMENT EVALUATION WILL
INCLUDE, BUT NOT LIMITED TO: .............................................................................................................. 67
2.9 PARTICIPATORY MONITORING AND EVALUATION ............................................................................................. 67
CHAPTER THREE: .......................................................................................................................................... 68
ASSUMPTIONS, RISKS AND RISK MANAGMEENT ................................................................................... 68
3.0 INTRODUCTION .............................................................................................................................................. 68 3.1 ASSUMPTIONS .................................................................................................................................................... 68 3.2 RISKS AND RISK MANAGEMENT ........................................................................................................................ 68 3.3 CONCLUSION AND RECOMMENDATION .......................................................................................................... 69
ii
ACRONYMS
DMTDP - District Medium Term Development Plan
NDPC - National Development Planning Commission
DPCU - District Planning Coordinating Unit
GES - Ghana Education Service
NFEU - Non- Formal Education Unit
M&E - Monitoring and Evaluation
MOFA - Ministry of Food and Agricuture
GSS - Ghana Statistical Service
DWST - District Water and Sanitation Team
DA - District Assembly
NYEP - National Youth Employment Programme
HIV - Human Immune-deficiency Virus
AIDS - Acquired Immune-deficiency Syndrome
IGF - Internally Generated Fund
DHMT - District Health Management Team
DANIDA - Danish International Development Agency
NHIS - National Health Insurance Scheme
LPG - Liquidated petroleum Gas
EDIF - Export Development & Investment Fund
WATSAN - Water and Sanitation
CHPS - Community Health Planning and Services
DACF - District Assembly Common Fund
SEA - Strategic Environmental Assessment
GSGDAII - Ghana Shared Growth and Development Agenda

iii
LIST OF TABLES
TABLE 2.1: STAKEHOLDER ANALYSIS ...................................................................................................................................... 8 TABLE2.2( A) M&E CAPACITY INDEX ................................................................................................................................... 10 TABLE 2.2(B) M& E NEEDS AND CONDITIONS ....................................................................................................................... 11 TABLE 2.4: M&E MATRIX: ............................................................................................................................................... 23 TABLE 2.5A : MONITORING AND EVALUATION WORK PLAN (2014-2017) ................................................................................. 52 TABLE 2.5 (B1): M&E CALENDAR FOR 2014 FISCAL YEAR ........................................................................................................ 54 TABLE 2.5(B2): M&E CALENDAR FOR 2015 FISCAL YEAR ........................................................................................................ 55 TABLE 2.5(B3): M&E CALENDAR FOR 2016 FISCAL YEAR ........................................................................................................ 57 TABLE 2.5(B4): M&E CALENDAR FOR 2017 FISCAL YEAR ........................................................................................................ 58 TABLE 2.6: THE M&E BUDGET STIMATES .............................................................................................................................. 61 TABLE 3.2: RISKS AND RISK MANAGEMENT RESPONSE ............................................................................................................ 68
iv
EXECUTIVE SUMMARY
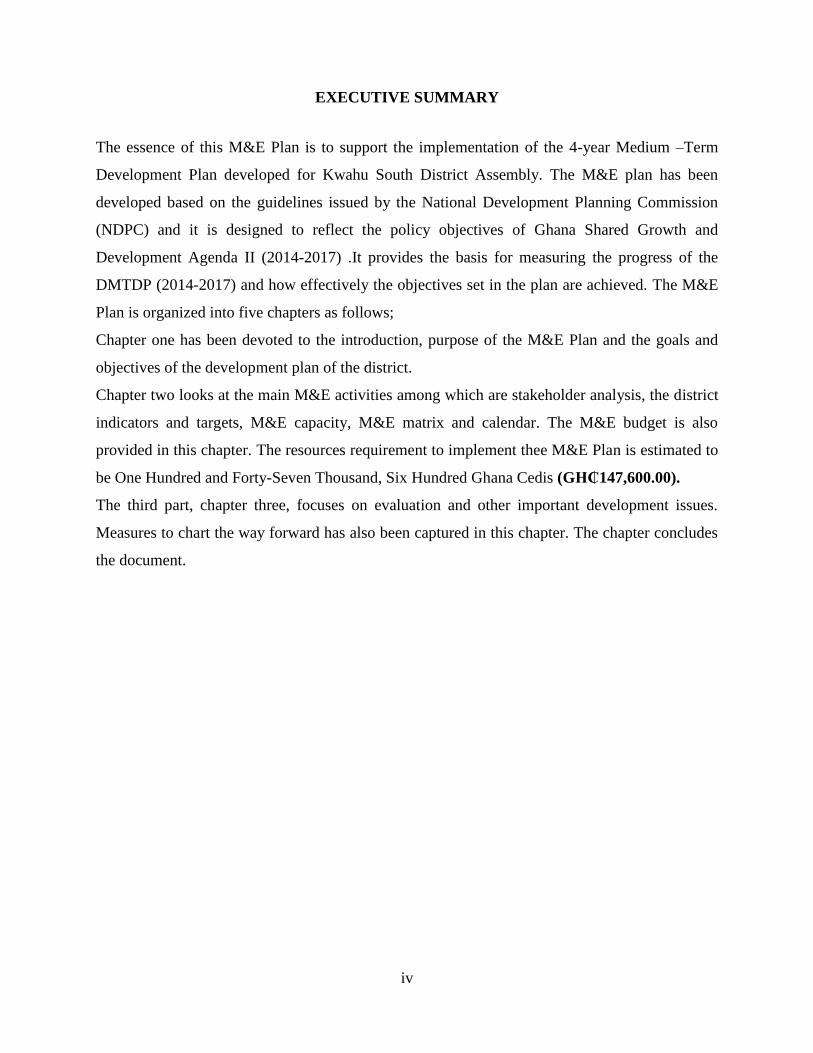
The essence of this M&E Plan is to support the implementation of the 4-year Medium –Term
Development Plan developed for Kwahu South District Assembly. The M&E plan has been
developed based on the guidelines issued by the National Development Planning Commission
(NDPC) and it is designed to reflect the policy objectives of Ghana Shared Growth and
Development Agenda II (2014-2017) .It provides the basis for measuring the progress of the
DMTDP (2014-2017) and how effectively the objectives set in the plan are achieved. The M&E
Plan is organized into five chapters as follows;
Chapter one has been devoted to the introduction, purpose of the M&E Plan and the goals and
objectives of the development plan of the district.
Chapter two looks at the main M&E activities among which are stakeholder analysis, the district
indicators and targets, M&E capacity, M&E matrix and calendar. The M&E budget is also
provided in this chapter. The resources requirement to implement thee M&E Plan is estimated to
be One Hundred and Forty-Seven Thousand, Six Hundred Ghana Cedis (GH₵147,600.00).
The third part, chapter three, focuses on evaluation and other important development issues.
Measures to chart the way forward has also been captured in this chapter. The chapter concludes
the document.

1
CHAPTER ONE:
GENERAL INTRODUCTION
1.0 Background
In line with the Government of Ghana’s Commitment to ensure effective public service delivery,
strengthening government accountability to its citizens, ensuring that policy formulation and
decision-making are based on evidence and that results are achieved in relation to its growth and
development targets, District Assemblies are expected to commit significant resources to the
development of interventions designed to improve the welfare of all people living in their
jurisdiction.
M & E Plan is the main instrument for assessing the extent to which the District has achieved its
goals and objectives designed in the DMTDP.
1.1 Goals and Objectives of DMTDP (2014-2017)
Overall Development Focus
The overriding development focus for the 2014 - 2017 planning period is the enlargement of
income levels and distribution, improvement of the quality of human capital and promotion of
private sector –led growth, effective decision- making in an environment of increased social
mobilization and participation in governance as well efficient societal transformation.
District Goal
Kwahu South District aims at improving the wellbeing of the people through effective
mobilization and judicious utilization of resource and collaboration with the civil society and the
private sectors in the provision of socio-economic infrastructure and improving service delivery
by 2017.
District Development Objectives
THEMATIC AREA: Enhancing Competitiveness in Ghana’s Private Sector
Policy Objectives:
1. To Diversify and expand the tourism industry for economic development
2. To Promote an effective enabling environment for good corporate governance
2
3. Improve efficiency and competitiveness of MSMEs
THEMATIC AREA: Accelerated Agricultural Modernization and Sustainable Natural
Resource Management
Policy Objectives:
1. To Enhance capacity to mitigate and reduce the impact of natural disasters, risks and
vulnerability
2. To Maintain and enhance ecological integrity of protected forest areas
3. To Promote Agriculture Mechanization in the district
4. To Increase access to extension services by 50% and re-orientation of agriculture
education by 2017
THEMATIC AREA: Infrastructure and Human Settlements Development
Policy Objectives
1. To Accelerate the provision of adequate, safe and affordable water
2. To Strengthen the human and institutional capacities for effective land use planning
3. To Increase the use of ICT in all sectors of the local economy
4. To Accelerate the provision of improved environmental sanitation facilities
5. To Provide adequate, reliable and affordable energy to meet the district needs
6. To Create and sustain an efficient and effective transport system that meets user needs
THEMATIC AREA: Human Development, Productivity And Employment
Policy Objectives:
1. To Create opportunities for accelerated job creation across all sectors
2. To Increase inclusive and equitable access to, and participation in education at all levels
3. To Improve quality of teaching and learning
4. To Intensify prevention and control of non-communicable and other communicable
diseases
5. To Protect children against violence, abuse and exploitation
6. To scale up access to CHPS Centre from 9 to 16 by 2017
THEMATIC AREA : Transparency and Accountable Governance
Policy Objectives:
1. To expand and sustain opportunities for effective citizen’s engagement
2. To ensure effective implementation of the decentralization policy and programmes
3. To Ensure effective and efficient resource mobilization, internal revenue generation and
resource management
4. To Enhance Peace and Security
5. To enhance efficiency and effectiveness of the district M&E system.
6. To Mainstream Local Economic Development (LED) for growth and local employment
creation
3
1.2 Purpose of the M & E Plan
Monitoring and Evaluation is crucial to sound resource management and achievement of
development results and must therefore be seen as an integral part of the planning and
implementation process of programmes and projects.
For every DMTDP, the key challenges are in threefold. The first one is the “means’; establishing
the resource cost for developing and delivering interventions to target groups. The second one is
the “process”; establishing the degree to which interventions are reaching and have been adopted
by the target group; and the third one is the “benefits” indicating the extent to which continuous
adoption and use of interventions delivered is stimulating benefits among the target groups.
These three issues are clearly captured in the DMTDP and that once they are implemented in
accordance with the agreed targets, schedules and procedures, change in terms of improvement
in people’s lives must occur. Regrettably, despite the huge sums of money spent on development
at the district and sub-district levels, there is still very little known about the actual impact of
projects on the poor. The emerging issues regarding the formulation and implementation of
development projects in the district have been that: ‘are the interventions producing the intended
benefits and what was the overall impact on the population?’, ‘could the programmes and
projects be better designed to achieve the intended outcomes?’, ‘are resources being spent
efficiently?’. These are types of questions that can only be answered through an efficient Impact
Monitoring and Evaluation which will seek to measure the outcomes of programme
interventions.
The Monitoring and Evaluation Plan will serve as a system to assess the extent of progress made
towards the implementation of Ghana Shared Growth and Development Agenda (GSGDA,2014-
2017) and will specifically serve the following purposes;
1. To assess whether DMTDP development targets are being met
This M&E Plan provides the basis and data for the analysis of the relationships between inputs
and outputs and achieved results as against targets set in the DMTDP (2014 – 2017).
2. To identify Challenges and Document Achievements
Identify achievements, constraints and failures so that improvements can be made to the DMTDP
and projects designs to achieve better impact
4
3. To provide a means for Learning
Provide district authorities, the government, development partners, community project
management teams and the general public with better means for learning frompast experience
4. To Ensure transparency, accountability and prudent use of resource
This entails gathering and using information and knowledge in order to improve efficiency and
enhance the attainment of objectives. This cannot be successfully achieved unless explicit and
sustained efforts are made at all levels of projects/programmes implementation process.
5. To provide early warning system
M&E provides essential and valuable feedback to all stakeholders and this helps to identify any
deviations for corrections in the implementation process. By this the District can avoid
unplanned expenditure and wastage.
6. To establish reporting system
This M&E will set the framework for annual and quarterly progress report that will keep
stakeholders abreast with the current developmental status of the district and thereby promoting
transparency.
1.3 Processes of developing the M&E Plan
The DPCU adapted a participatory process in the preparation of this M&E plan. The process
began with the completion of DMTDP (2014-2017) preparation. The DPCU met and selected a
seven member committee to facilitate the preparation of this document. Series of meetings and
workshops were organized between DPCU and other key stakeholders to promote broader
participation. The DPCU held two separate meetings to prepare the budget, conduct stakeholder
analysis and to assess the M&E needs and conditions in the District.
A two – day workshop was organized for the heads of departments of the District Assembly to
identify the District core indicators and to discuss and come out with key issues involved in the
plan preparation.
The planning committee then collated all the inputs and prepared the first M&E draft plan. The
DPCU, DCE and PM met to review the first draft to come out with the second M&E draft plan.
The second M&E draft plan was then taken through various discussions with wide range of
stakeholders and public hearing for validation.
The final M&E draft was presented for further review at a 2-Day Monitoring and Evaluation
Workshop at the regional capital, Koforidua.
5
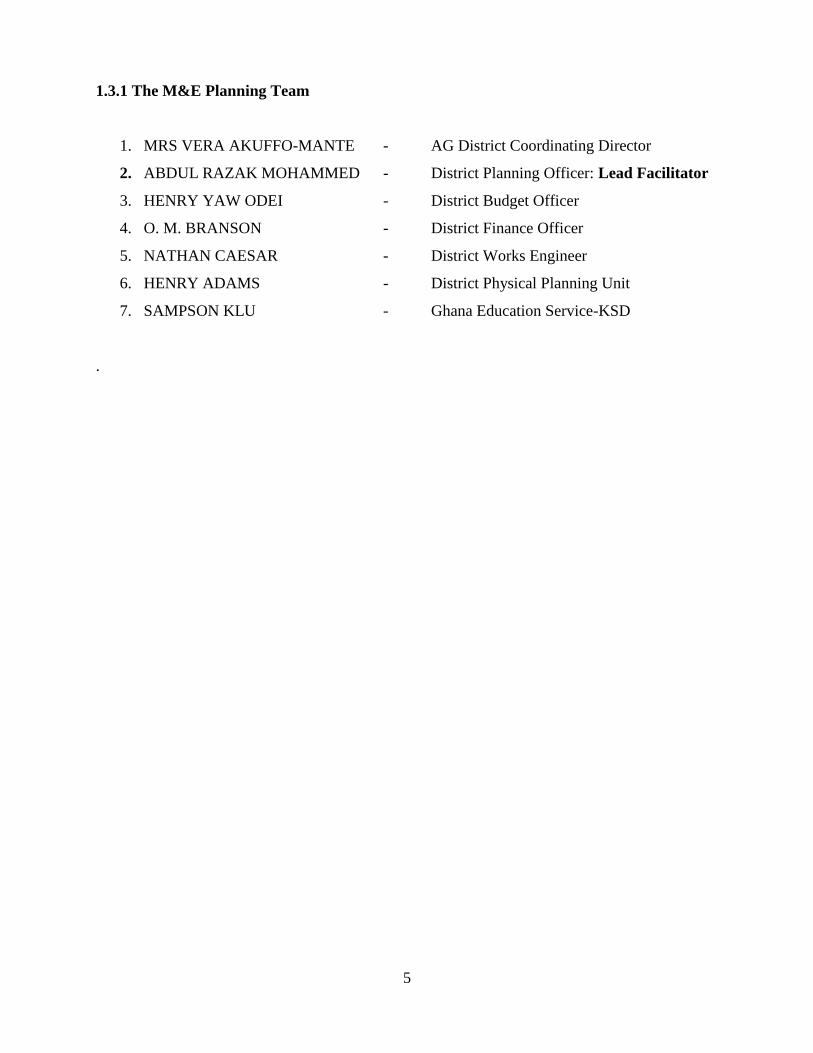
1.3.1 The M&E Planning Team
1. MRS VERA AKUFFO-MANTE - AG District Coordinating Director
2. ABDUL RAZAK MOHAMMED - District Planning Officer: Lead Facilitator
3. HENRY YAW ODEI - District Budget Officer
4. O. M. BRANSON - District Finance Officer
5. NATHAN CAESAR - District Works Engineer
6. HENRY ADAMS - District Physical Planning Unit
7. SAMPSON KLU - Ghana Education Service-KSD
.

6
CHAPTER TWO:
M & E ACTIVITIES
2.0 Introduction
This chapter covers the processes and procedures that were employed in the
development of the document including stakeholder identification and analysis.
2.1 M&E Stakeholder Identification and Analysis
Implementation of DMTDP affects individuals, groups of people, institutions and/or
organizations and that the social and institutional benefits of the programmes and
projects must be maximized whilst at the same time negative impacts are minimized.
In all societies, there are differences in the roles and responsibilities of women and
men and their access to and control over resources and their participation in decision
making exist. Women and men have inequitable access to services (e.g. transport,
health, education) and to opportunities in economic, social and political life. Gender
inequality hinder growth and harm development and so any failure to adequately
address gender issues can damage the effectiveness and sustainability of programmes
and projects. Therefore, the DM&EP analyses the gender disparities and take them
into account the interventions, its objectives, strategies and resource allocation. The
key stakeholders in the M&E exercises of the DMTDP are classified as follows:
i. National and District Policy formulators and Decision-makers
National and district policy formulators and decision makers play significant roles in
programme/project implementation. These stakeholders include Members of
Parliament, District Assembly and decentralised departments. The Media also play
crucial roles both at the national, district and local levels.
ii. Sub-district-level Institutions
Sub-district level institutions and groups represent the carriers and movers of local
development issues. These include Assembly members, Area Council and Unit
Committee members.
7
iii. Civil Society and Advocacy Groups
CSOs including NGOs, FBOs etc have key interest in interventions that bring about
change in peoples lives. Their major roles include public education, sensitisation,
advocacy and they exhibit potential for sensitivity to and respect for cross-cutting
issues of environment, gender equality etc.
iv. Local Development Actors
Local Development actors are particularly interested in the extent to which
programmes/projects impact on the poor and the vulnerable, how resources are
disbursed to achieve positive results and mainstreaming poverty reduction initiatives
and to mitigate their impacts.
Stakeholder Analysis have been done with the participation of the broader stakeholder
groups of the UMKDA. This has been organised in participatory planning sessions
and people views on the problems, nature, needs and eventual solutions have been
incorporated.
A wide range of resource persons and institutions including the DPCU, District
Assembly Sub-structures, Decentralized/Sector departments, central and local
government agencies, NGOs, CBOs Civil Society Organizations(CSOs), Religious
bodies, the Private Sector, Vulnerable Groups in the socirty and other development
partners will be involved in the monitoring and evaluation processes. This strategy
aims at ensuring effective and participatory monitoring and evaluation process.
The following categories of stakeholders are identified and classified:
a) Programmes and projects beneficiaries at the community level
b) Collaborative Organisation such as NGOs, CBOs, CSOs, among others
c) Donor agencies and the provate sector and
d) Government institutions and structures at all levels

8
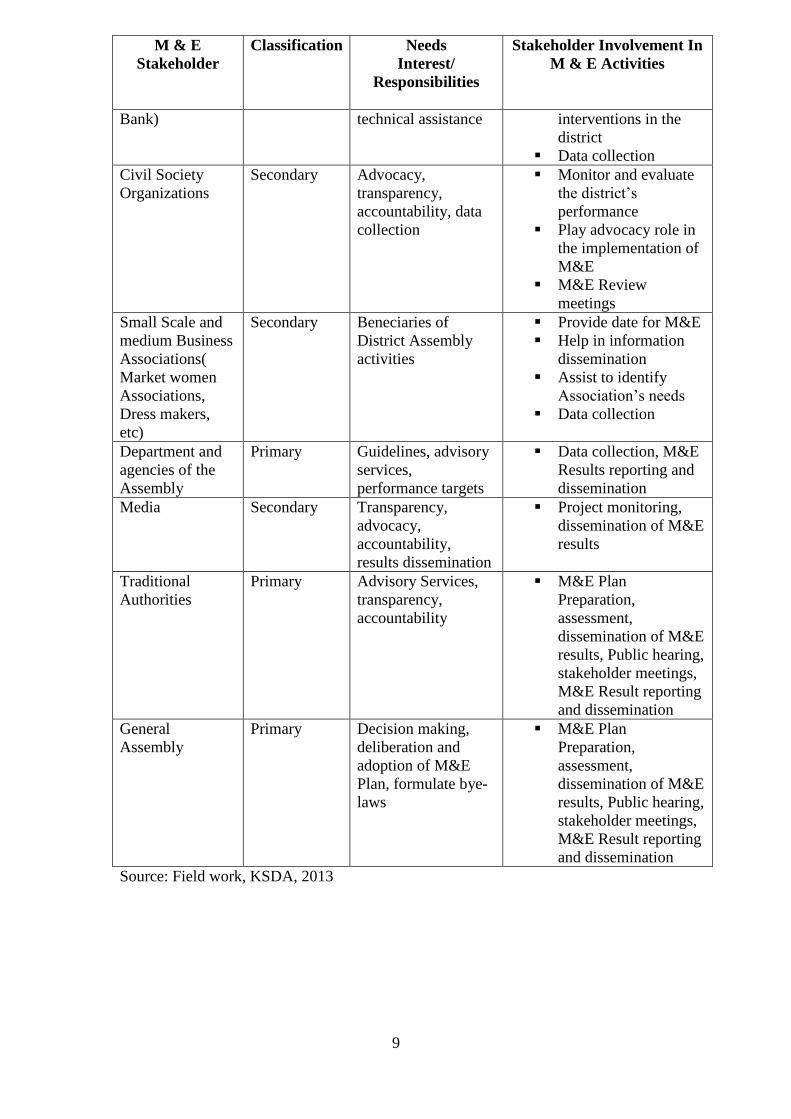
Table 2.1 shows the identified stakeholders and their interest and level of involvement
in the M&E process.
Table 2.1: Stakeholder Analysis
M & E
Stakeholder
Classification Needs
Interest/
Responsibilities
Stakeholder Involvement In
M & E Activities
NDPC Primary Policy direction,
guidelines, capacity
building
M&E Plan Preparation,
assessment, dissemination of
M&E results
DPCU Primary M&E Plan
Preparation
Assess the needs of
the people in the
district
Collect, collate and
analyze data for M&E
Prepare and co-
ordinate DMTDP and
M&E Plan
Implement M&E Plan
Disseminate
Information on M&E
DA Sub-
structures(
ACs,TCs, Unit
committees)
Primary Project beneficiaries,
capacity building
Assist in data
collection
Monitor on-going
projects in their areas
Help disseminate
information
RCC Primary Technical Services,
Advisory Services,
capacity building
Assist identification of
community aspirations
and needs
Assist in data
collection
Monitor on-going
projects in their
communities
Local
Government
Service/ MLGRD
Primary Technical assistance,
job analysis, policy
direction, guidelines,
performance targets,
advisory services
M&E Plan Seminars,
assessment,
supersions,
dissemination of M&E
results, Public hearing,
stakeholder meetings,
M&E Result reporting
and dissemination
Development
Partners
( E U, DANIDA,
JICA, World
Secondary Transparency,
accountability,
financial and
materials resources,
Capacity building
Support in research
Fund some
development
9
M & E
Stakeholder
Classification Needs
Interest/
Responsibilities
Stakeholder Involvement In
M & E Activities
Bank) technical assistance interventions in the
district
Data collection
Civil Society
Organizations
Secondary Advocacy,
transparency,
accountability, data
collection
Monitor and evaluate
the district’s
performance
Play advocacy role in
the implementation of
M&E
M&E Review
meetings
Small Scale and
medium Business
Associations(
Market women
Associations,
Dress makers,
etc)
Secondary Beneciaries of
District Assembly
activities
Provide date for M&E
Help in information
dissemination
Assist to identify
Association’s needs
Data collection
Department and
agencies of the
Assembly
Primary Guidelines, advisory
services,
performance targets
Data collection, M&E
Results reporting and
dissemination
Media Secondary Transparency,
advocacy,
accountability,
results dissemination
Project monitoring,
dissemination of M&E
results
Traditional
Authorities
Primary Advisory Services,
transparency,
accountability
M&E Plan
Preparation,
assessment,
dissemination of M&E
results, Public hearing,
stakeholder meetings,
M&E Result reporting
and dissemination
General
Assembly
Primary Decision making,
deliberation and
adoption of M&E
Plan, formulate bye-
laws
M&E Plan
Preparation,
assessment,
dissemination of M&E
results, Public hearing,
stakeholder meetings,
M&E Result reporting
and dissemination
Source: Field work, KSDA, 2013

10
2.2 Monitoring & Evaluation Capacities and conditions
An assessment of the capacities of the District Planning Coordinating Unit and
existing conditions in the district indicated that resources including financial, human,
physical and materials required to undertake effective M&E activity are readily
available but not adequate.
Area of assessment included indicators such as Qualification of personnel, Skills and
knowledge, motivation/ incentives, staff positions, Availability and utilization of
funds, office space and status of equipments and facilities as shown in table 2.2(a).
Each of the indicators had been assessed with a scoring scale of 1 – 10 ( a score of 1
represent a perception of lowest and a score of 10 represents a perception of the
highest score).
Eventually, the capacity index of the total average scores was computed and
interpreted as low performance (1-4), average performance (5-7) and high
performance (8-10).
The M&E Capacity Index of 5.05 as shown in table 2.2(a) implies that the District
Assembly has average capacity and management performance with respect to its
readiness for an effective M&E system.
Table2.2( a) M&E Capacity Index
NO Management Capacity Indicator Average Score
1 Qualification of Personnel 5
2 Staff Compliment 8
3 Skill & Knowledge 5
4 Availability of funds 5
5 Utilization of funds 3
6 Timely access to funds 3
7 Leadership 6
8 Management 7.5
9 Work load 5
10 Motivation & Incentives 5
11 Equipment/ facilities 3
Total Average Scores( A) 55.50
Capacity Index( A/No of Indicators) 5.05

11
The conditions available in the District Assembly necessary to prepare and implement
an efficient M&E Plan are discussed in table 2.2(b).
Table 2.2(b) M& E Needs and Conditions
STRENGHTS CONSTRAINTS SUGGESTED
SOLUTION
RESOURCE
REQUIREMENT
REQUIRED
TRAINING
Available
DMTDP(2014-
2017)
Lack of M&E plans Comprehensive
M&E plan be
prepared
Qualified personnel
stationery, Allowance
M&E skills
Available office
space
Inadequate funds
for M&E activities
Make budgetary
provision for all
M&E activities
Funds Proposal
writing on
how to raise
funds
Strong management
support
Lack of
appreciation for
Stakeholders
responsibilities
Sensitize
Stakeholders on
their responsibility
on M&E
Funds,
Stationery
M&E skills
Inadequate skills
and knowledge in
M&E
Train staff in M&E
skills
Funds,
Stationery
M&E skills,
Research
methods
Inadequate logistics
for M&E
Provide logistics
for M&E activities
Vehicle, Stationery,
Fuel, funds
Proposal
writing,
12
2.3 M & E Target Indicators
The DPCU, with the assistance of Heads of decentralized departments and other
development partners, has selected a number of core indicators to be employed to
assess change/development in the district during the plan’s implementation time span.
The selection of these indicators was based on the following criteria.
a) Efficiency
b) Timeliness in data collection
c) Validity and Reliability of variables
d) Simplicity in measuring indicators
The selected core indicators are classified under the seven thematic area of the
national policy document, Ghana Shared Growth and Development Agenda
(GSGDAII) as shown in the subsequent tables.
13
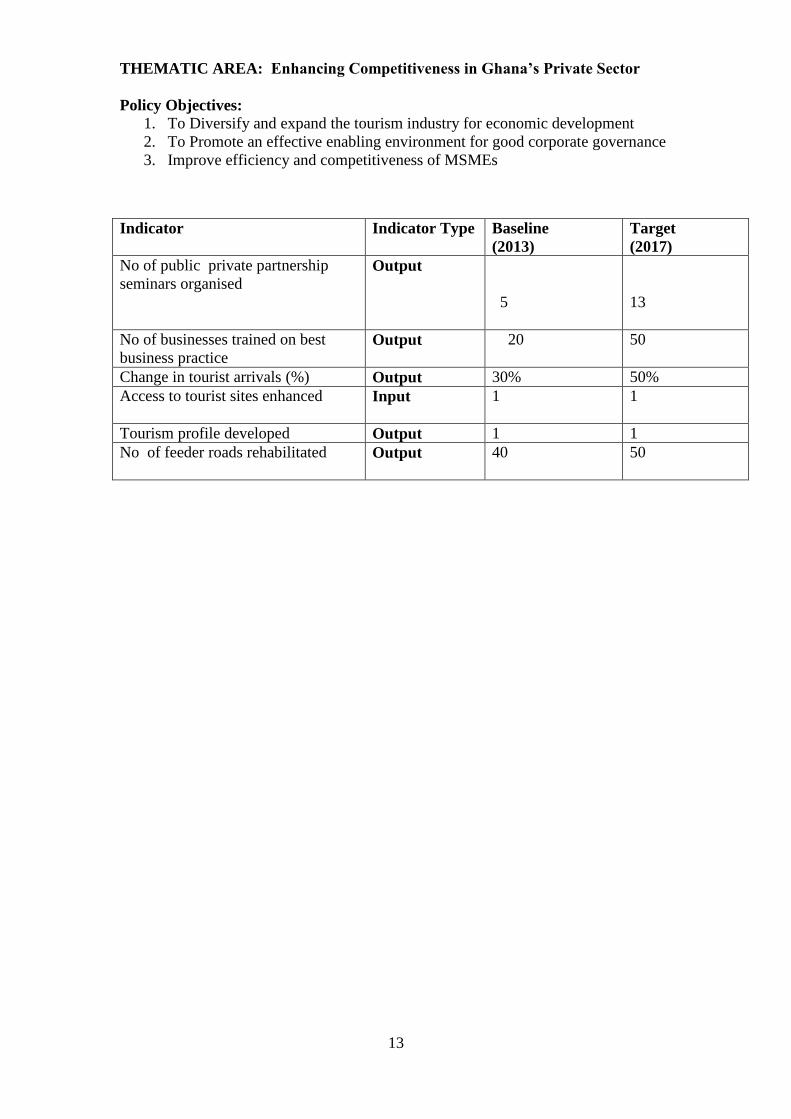
THEMATIC AREA: Enhancing Competitiveness in Ghana’s Private Sector
Policy Objectives:
1. To Diversify and expand the tourism industry for economic development
2. To Promote an effective enabling environment for good corporate governance
3. Improve efficiency and competitiveness of MSMEs
Indicator Indicator Type Baseline
(2013)
Target
(2017)
No of public private partnership
seminars organised
Output
5
13
No of businesses trained on best
business practice Output 20 50
Change in tourist arrivals (%) Output 30% 50%
Access to tourist sites enhanced
Input 1 1
Tourism profile developed Output 1 1
No of feeder roads rehabilitated
Output 40 50

14
THEMATIC AREA: Accelerated Agricultural Modernization and Sustainable
Natural Resource Management
Policy Objectives:
5. To Enhance capacity to mitigate and reduce the impact of natural disasters,
risks and vulnerability
6. To Maintain and enhance ecological integrity of protected forest areas
7. To Promote Agriculture Mechanization in the district
8. To Increase access to extension services by 50% and re-orientation of
agriculture education by 2017
Indicator Indicator Type Baseline
(2013)
Target
(2017)
No of farmer-Based Organisations trained
in enterpreneuriaship Output 4 49
No of agro- forestry and afforestation
programmes implemented Output 1 4
No of storage facilities increased Output 2 5
No of youth engaged in agriculture
increased Output
31
100
Farmers’ Day celebration organized Output 1 4
No of fishermen trained in cage culture and
having access to the cages
Output
23
33
Number of hectors under cultivation of
various crops:
i. Cassava
ii. Maize
Iii Plantain
6229ha
8442ha

15
Indicator Indicator Type Baseline
(2013)
Target
(2017)
iv Onion
V Rice
4412 ha
4440ha
2100ha
900ha
7347ha
6229ha
3100ha
1200ha
Extension Officer to Farmer Ratio
Input 1: 3242 1:2000
No of stakeholder workshop on Climate
change organized
output 1 6
Climate change issues mainstreamed in
project implementation
output 1
1
Percentage increase in yield of selected
crops:
I Cassava
II Maize
III Plantain
IV Onion
V Rice
output
21%
18%
16%
29%
11%
65%
51%
33%
72%
42%
16
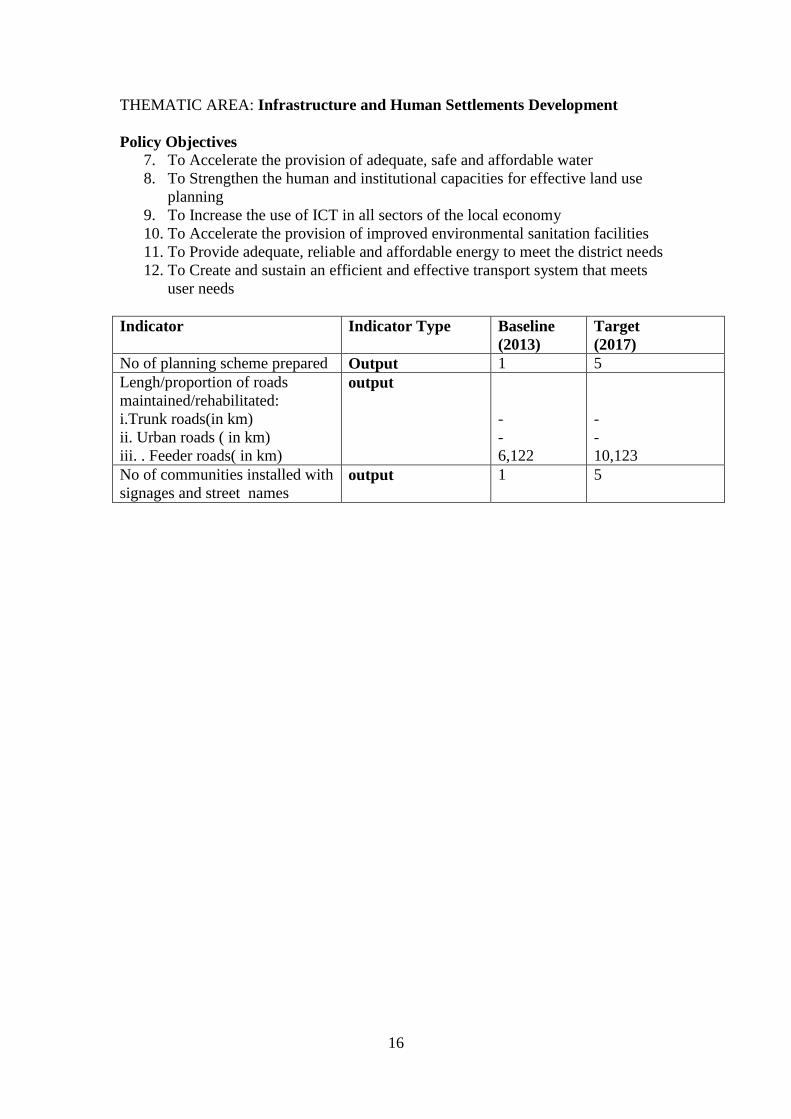
THEMATIC AREA: Infrastructure and Human Settlements Development
Policy Objectives
7. To Accelerate the provision of adequate, safe and affordable water
8. To Strengthen the human and institutional capacities for effective land use
planning
9. To Increase the use of ICT in all sectors of the local economy
10. To Accelerate the provision of improved environmental sanitation facilities
11. To Provide adequate, reliable and affordable energy to meet the district needs
12. To Create and sustain an efficient and effective transport system that meets
user needs
Indicator Indicator Type Baseline
(2013)
Target
(2017)
No of planning scheme prepared Output 1 5
Lengh/proportion of roads
maintained/rehabilitated:
i.Trunk roads(in km)
ii. Urban roads ( in km)
iii. . Feeder roads( in km)
output
-
-
6,122
-
-
10,123
No of communities installed with
signages and street names output 1 5

17
Indicator Indicator Type Baseline
(2013)
Target
(2017)
Street lights provided to the
major towns in the district Output 25 55
change in number of households
with access to electricity output 7000 14000
No ICT Centre established
Output 1 2
No of schools supported with
ICT Teaching & learning
logistics
Output - 8
No of community centres
constructed Output - 5
proportion of population with
sustainable access to improved
sanitation( WC, KVIP)
Output - 1
No of boreholes drilled Output 25 75
proportion of population with
sustainable access to safe water
sources
Output 50% 80%
No of WATSAN Committees
trained Output 25 75
Water & Sanitation Plan Output - 1
No of household toilets
constructed Output - 1,200
No of refuse dumps evacuated Output 2 4
No of PPP projects in waste
management undertaken Output - 3

18
THEMATIC AREA: Human Development, Productivity And Employment
Policy Objectives:
1. To Create opportunities for accelerated job creation across all sectors
2. To Increase inclusive and equitable access to, and participation in education at
all levels
3. To Improve quality of teaching and learning
4. To Intensify prevention and control of non-communicable and other
communicable diseases
5. To Protect children against violence, abuse and exploitation
6. To scale up access to CHPS Centre from 9 to 16 by 2017
Indicator Indicator Type Baseline
(2013)
Target
(2017)
Per centage increase in youth
employment Outcome 25% 50%
No of women groups trained Output 10 40
No of trained youth having
access to credit Outcome - 500
No of youth trained Output - 500
No of small scale businesses
trained Output - 90
Indicator Indicator Type Baseline
(2013)
Target
(2017)
No of Teacher Quarters
constructed Output
3
6
Gross enrolment rate( GER):
Primary
JHS
SHS
outcome
106.6
81.5
100
100
100
100
No of school blocks Output 4 8

19
Indicator Indicator Type Baseline
(2013)
Target
(2017)
rehabilitated
Percentage of qualified
teachers provided to schools
i. KG
ii. Primary
iii. JHS
iv. SHS
Output
40.7%
72.5%
77%
95.5
95%
95%
95%
99
Percentage of Adult graduated
from non-formal education unit Output 6% 15%
Number of KG Classroom
Blocks constructed Output 3 12
Percentage of basic schools
provided with TLMs Input 65% 90%
Number of schools constructed
i. Primary
ii. JHS
Output
10
9
Number of teachers on district
sponsorship training
programme (DSTP
Output 5 30
Improve in Pupil – Teacher
Ratio
i. KG
ii. Primary
iii. JHS
iv. SHS
Output
1:32
1:27
1:16
1:29
1:25
1:35
1:30
1:30
Percentage of candidates that
Outcome
20
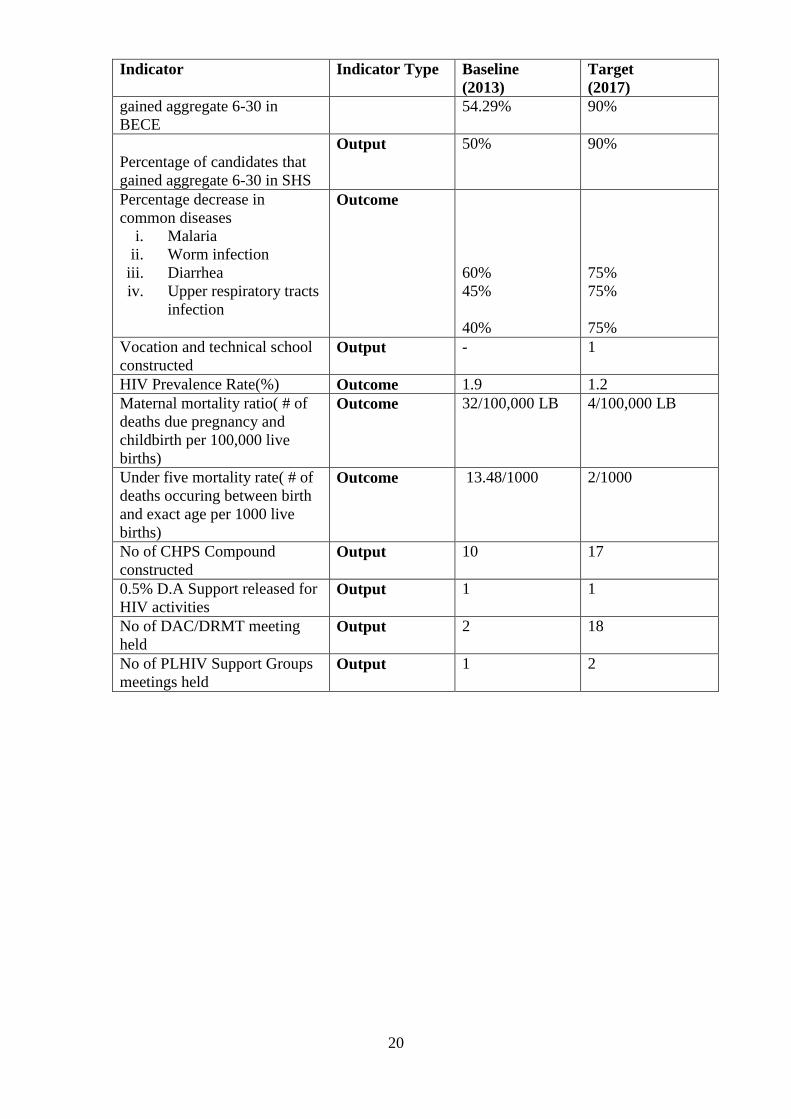
Indicator Indicator Type Baseline
(2013)
Target
(2017)
gained aggregate 6-30 in
BECE
54.29% 90%
Percentage of candidates that
gained aggregate 6-30 in SHS
Output 50% 90%
Percentage decrease in
common diseases
i. Malaria
ii. Worm infection
iii. Diarrhea
iv. Upper respiratory tracts
infection
Outcome
60%
45%
40%
75%
75%
75%
Vocation and technical school
constructed Output - 1
HIV Prevalence Rate(%) Outcome 1.9 1.2
Maternal mortality ratio( # of
deaths due pregnancy and
childbirth per 100,000 live
births)
Outcome 32/100,000 LB 4/100,000 LB
Under five mortality rate( # of
deaths occuring between birth
and exact age per 1000 live
births)
Outcome 13.48/1000 2/1000
No of CHPS Compound
constructed Output 10 17
0.5% D.A Support released for
HIV activities Output 1 1
No of DAC/DRMT meeting
held Output 2 18
No of PLHIV Support Groups
meetings held Output 1 2
21
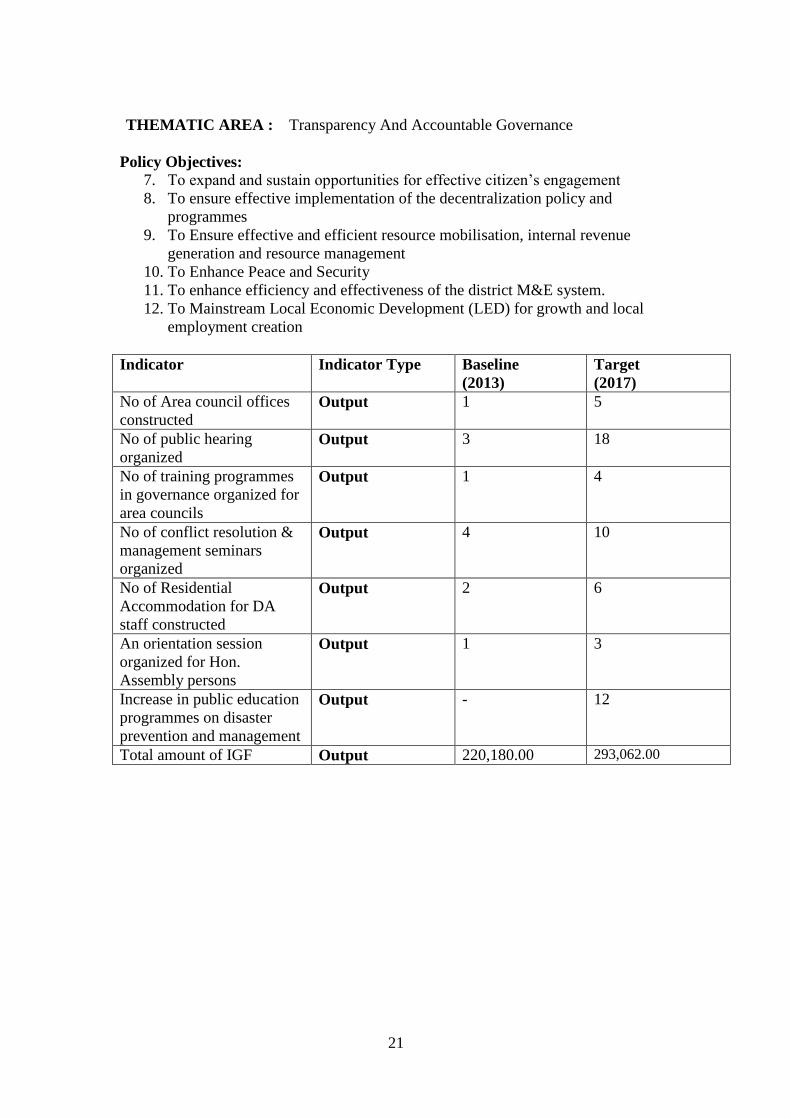
THEMATIC AREA : Transparency And Accountable Governance
Policy Objectives:
7. To expand and sustain opportunities for effective citizen’s engagement
8. To ensure effective implementation of the decentralization policy and
programmes
9. To Ensure effective and efficient resource mobilisation, internal revenue
generation and resource management
10. To Enhance Peace and Security
11. To enhance efficiency and effectiveness of the district M&E system.
12. To Mainstream Local Economic Development (LED) for growth and local
employment creation
Indicator Indicator Type Baseline
(2013)
Target
(2017)
No of Area council offices
constructed Output 1 5
No of public hearing
organized Output 3 18
No of training programmes
in governance organized for
area councils
Output 1 4
No of conflict resolution &
management seminars
organized
Output 4 10
No of Residential
Accommodation for DA
staff constructed
Output 2 6
An orientation session
organized for Hon.
Assembly persons
Output 1 3
Increase in public education
programmes on disaster
prevention and management
Output - 12
Total amount of IGF Output 220,180.00 293,062.00
22
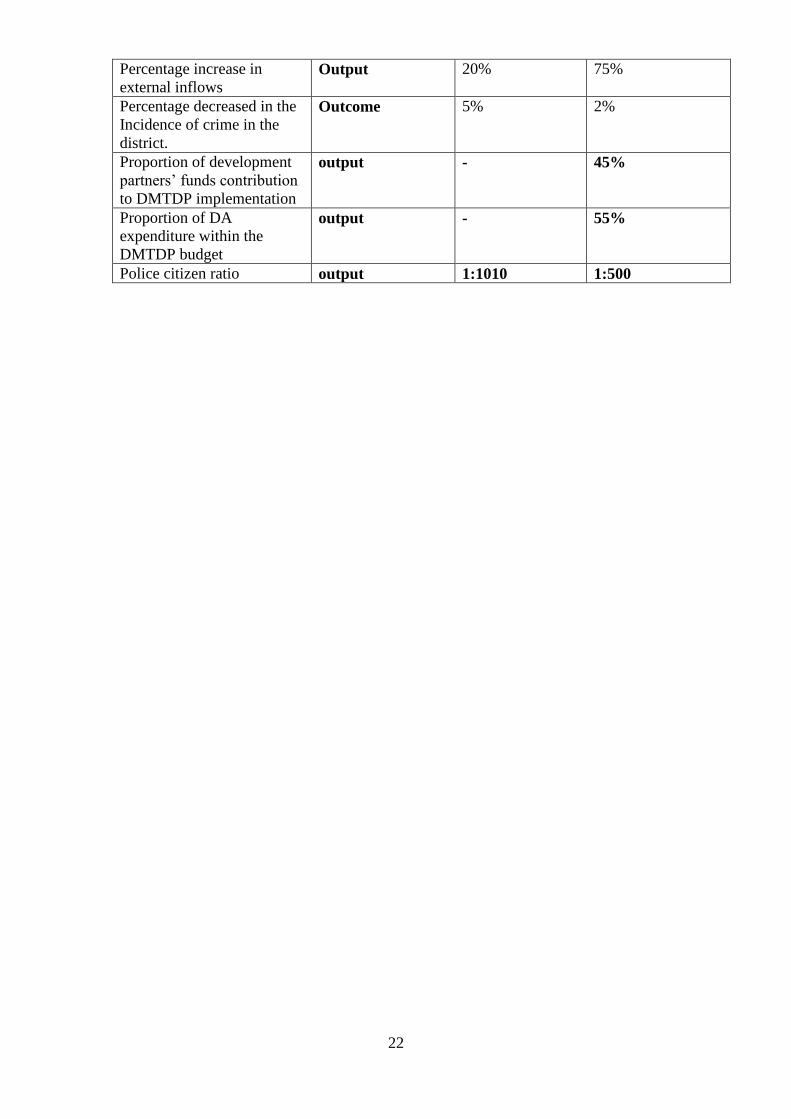
Percentage increase in
external inflows Output 20% 75%
Percentage decreased in the
Incidence of crime in the
district.
Outcome 5% 2%
Proportion of development
partners’ funds contribution
to DMTDP implementation
output - 45%
Proportion of DA
expenditure within the
DMTDP budget
output - 55%
Police citizen ratio output 1:1010 1:500
23
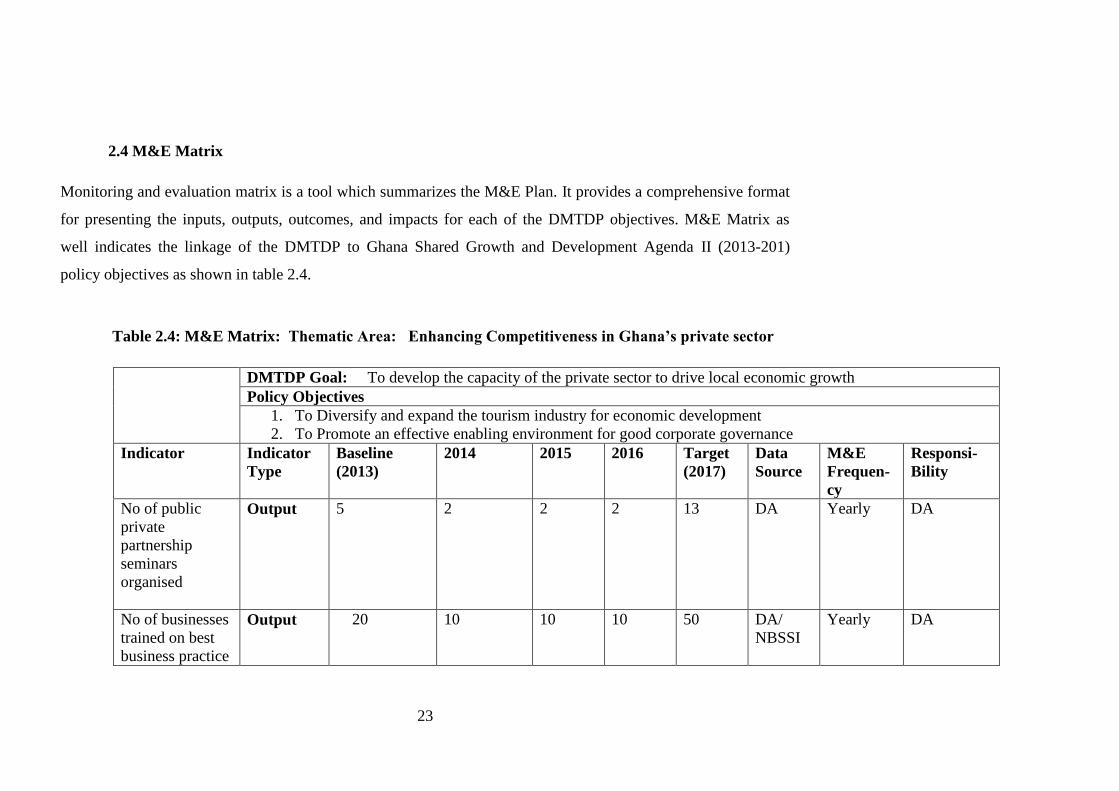
2.4 M&E Matrix
Monitoring and evaluation matrix is a tool which summarizes the M&E Plan. It provides a comprehensive format
for presenting the inputs, outputs, outcomes, and impacts for each of the DMTDP objectives. M&E Matrix as
well indicates the linkage of the DMTDP to Ghana Shared Growth and Development Agenda II (2013-201)
policy objectives as shown in table 2.4.
Table 2.4: M&E Matrix: Thematic Area: Enhancing Competitiveness in Ghana’s private sector
DMTDP Goal: To develop the capacity of the private sector to drive local economic growth
Policy Objectives
1. To Diversify and expand the tourism industry for economic development
2. To Promote an effective enabling environment for good corporate governance
Indicator Indicator
Type
Baseline
(2013)
2014 2015 2016 Target
(2017)
Data
Source
M&E
Frequen-
cy
Responsi-
Bility
No of public
private
partnership
seminars
organised
Output 5 2 2 2 13
DA Yearly DA
No of businesses
trained on best
business practice
Output 20 10 10 10 50
DA/
NBSSI
Yearly DA
24
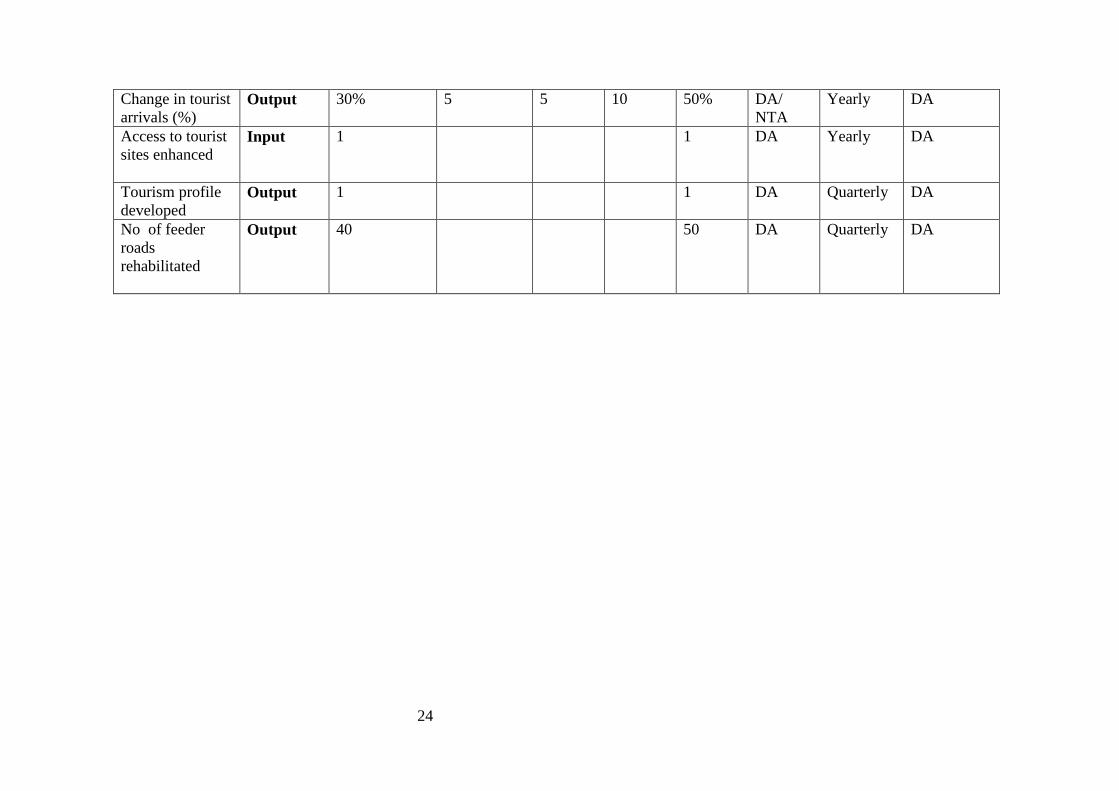
Change in tourist
arrivals (%) Output 30% 5 5 10 50% DA/
NTA
Yearly DA
Access to tourist
sites enhanced
Input 1 1 DA Yearly DA
Tourism profile
developed Output 1 1 DA Quarterly DA
No of feeder
roads
rehabilitated
Output 40 50 DA Quarterly DA
25
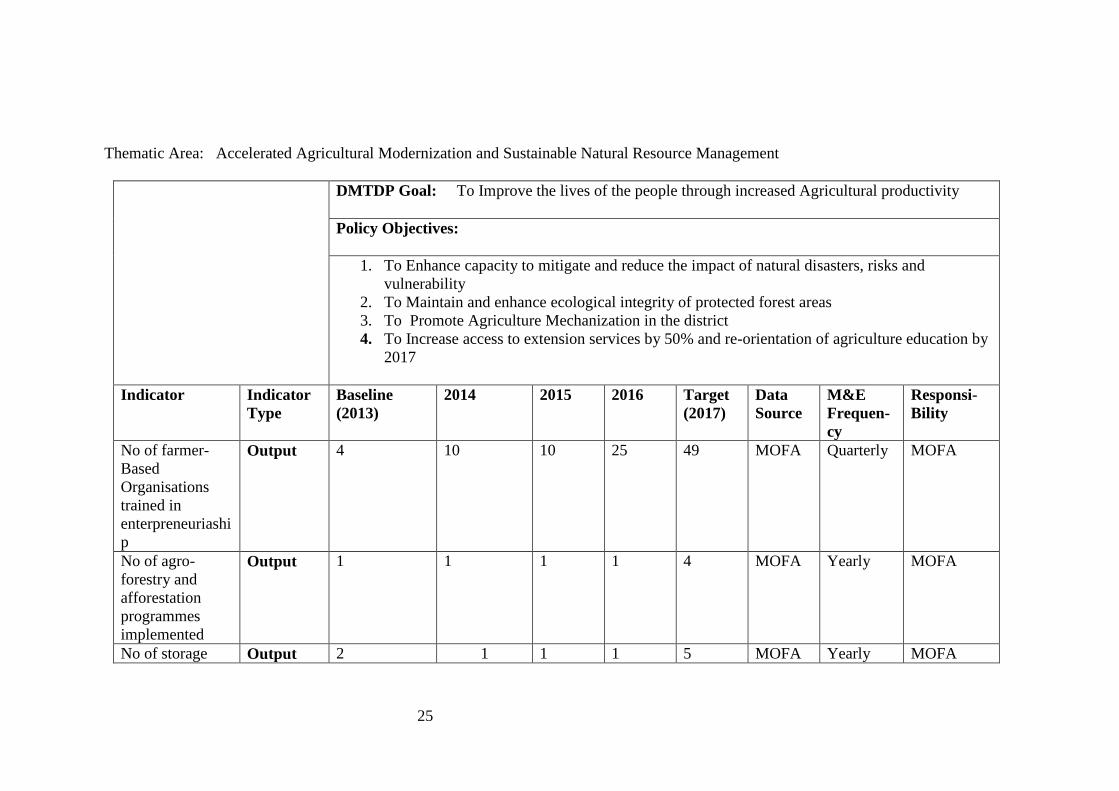
Thematic Area: Accelerated Agricultural Modernization and Sustainable Natural Resource Management
DMTDP Goal: To Improve the lives of the people through increased Agricultural productivity
Policy Objectives:
1. To Enhance capacity to mitigate and reduce the impact of natural disasters, risks and
vulnerability
2. To Maintain and enhance ecological integrity of protected forest areas
3. To Promote Agriculture Mechanization in the district
4. To Increase access to extension services by 50% and re-orientation of agriculture education by
2017
Indicator Indicator
Type
Baseline
(2013)
2014 2015 2016 Target
(2017)
Data
Source
M&E
Frequen-
cy
Responsi-
Bility
No of farmer-
Based
Organisations
trained in
enterpreneuriashi
p
Output 4 10 10 25 49 MOFA Quarterly MOFA
No of agro-
forestry and
afforestation
programmes
implemented
Output 1 1 1 1 4 MOFA Yearly MOFA
No of storage Output 2 1 1 1 5 MOFA Yearly MOFA
26
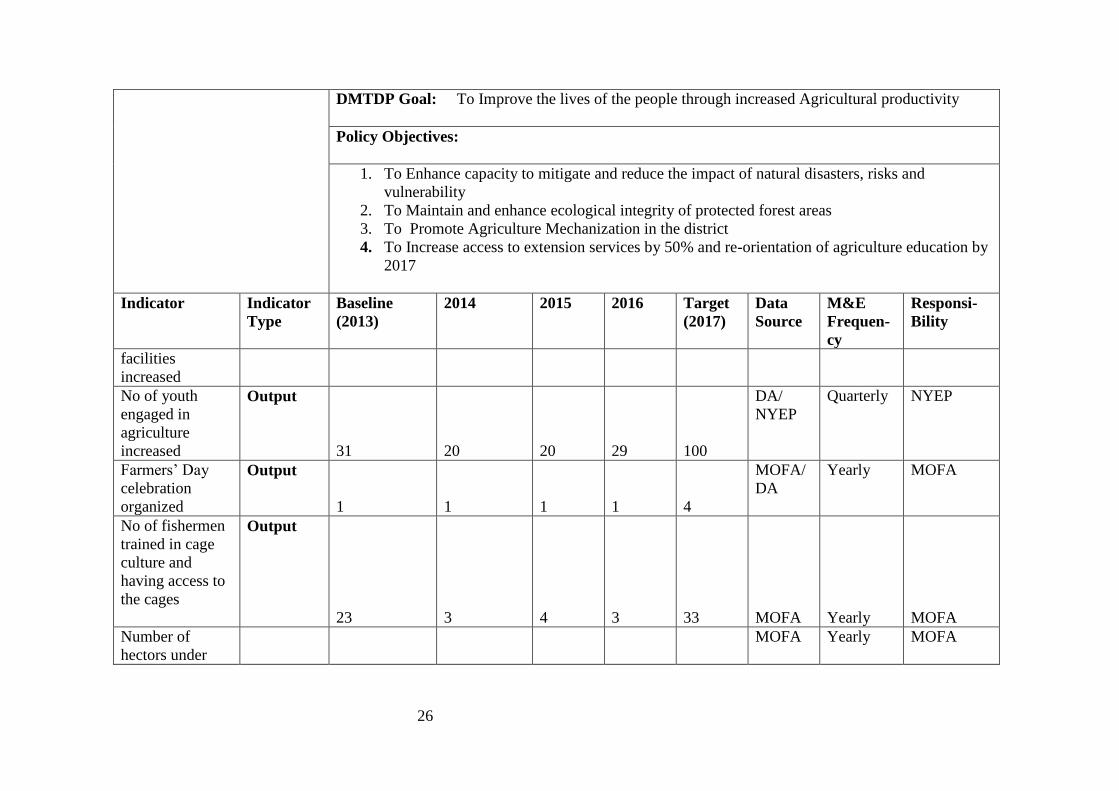
DMTDP Goal: To Improve the lives of the people through increased Agricultural productivity
Policy Objectives:
1. To Enhance capacity to mitigate and reduce the impact of natural disasters, risks and
vulnerability
2. To Maintain and enhance ecological integrity of protected forest areas
3. To Promote Agriculture Mechanization in the district
4. To Increase access to extension services by 50% and re-orientation of agriculture education by
2017
Indicator Indicator
Type
Baseline
(2013)
2014 2015 2016 Target
(2017)
Data
Source
M&E
Frequen-
cy
Responsi-
Bility
facilities
increased
No of youth
engaged in
agriculture
increased
Output
31
20
20
29
100
DA/
NYEP
Quarterly NYEP
Farmers’ Day
celebration
organized
Output
1
1
1
1
4
MOFA/
DA
Yearly MOFA
No of fishermen
trained in cage
culture and
having access to
the cages
Output
23
3
4
3
33
MOFA
Yearly
MOFA
Number of
hectors under
MOFA Yearly MOFA
27
DMTDP Goal: To Improve the lives of the people through increased Agricultural productivity
Policy Objectives:
1. To Enhance capacity to mitigate and reduce the impact of natural disasters, risks and
vulnerability
2. To Maintain and enhance ecological integrity of protected forest areas
3. To Promote Agriculture Mechanization in the district
4. To Increase access to extension services by 50% and re-orientation of agriculture education by
2017
Indicator Indicator
Type
Baseline
(2013)
2014 2015 2016 Target
(2017)
Data
Source
M&E
Frequen-
cy
Responsi-
Bility
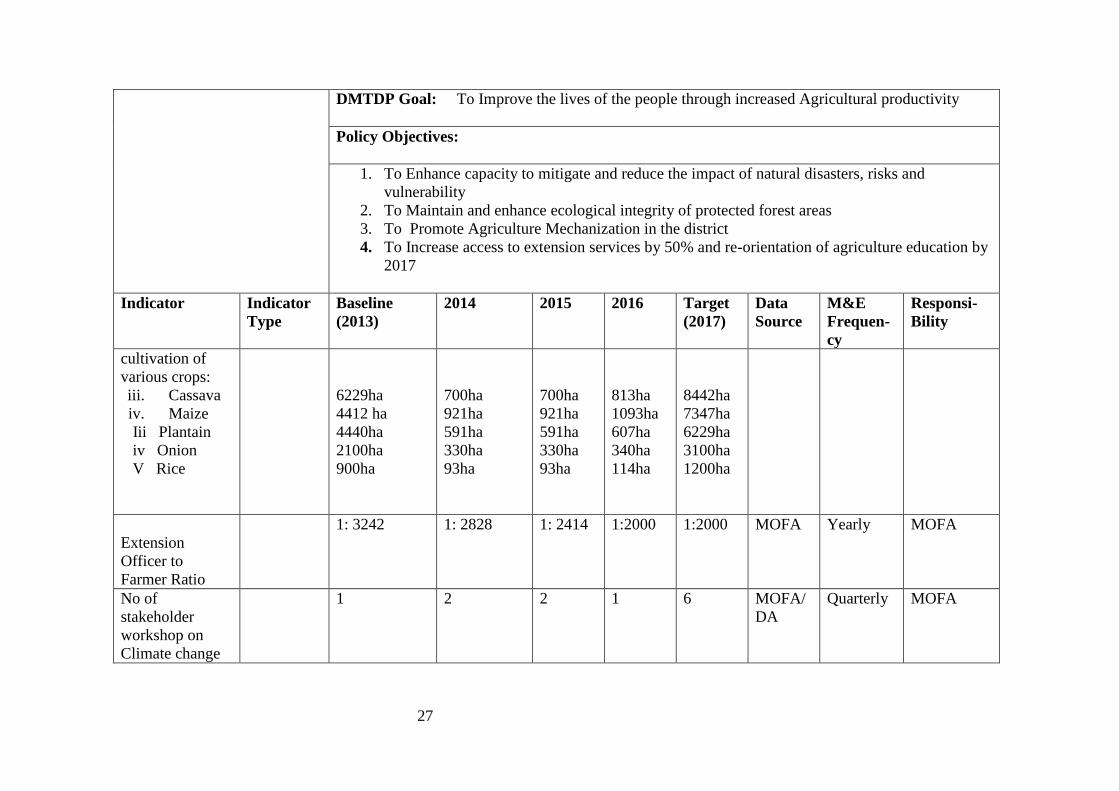
cultivation of
various crops:
iii. Cassava
iv. Maize
Iii Plantain
iv Onion
V Rice
6229ha
4412 ha
4440ha
2100ha
900ha
700ha
921ha
591ha
330ha
93ha
700ha
921ha
591ha
330ha
93ha
813ha
1093ha
607ha
340ha
114ha
8442ha
7347ha
6229ha
3100ha
1200ha
Extension
Officer to
Farmer Ratio
1: 3242 1: 2828 1: 2414 1:2000 1:2000 MOFA Yearly MOFA
No of
stakeholder
workshop on
Climate change
1 2
2 1 6 MOFA/
DA
Quarterly MOFA

28
DMTDP Goal: To Improve the lives of the people through increased Agricultural productivity
Policy Objectives:
1. To Enhance capacity to mitigate and reduce the impact of natural disasters, risks and
vulnerability
2. To Maintain and enhance ecological integrity of protected forest areas
3. To Promote Agriculture Mechanization in the district
4. To Increase access to extension services by 50% and re-orientation of agriculture education by
2017
Indicator Indicator
Type
Baseline
(2013)
2014 2015 2016 Target
(2017)
Data
Source
M&E
Frequen-
cy
Responsi-
Bility
organized
Climate change
issues
mainstreamed in
project
implementation
1
1 - - 1
MOFA/
DA
Quarterly MOFA
Percentage
increase in yield
of selected crops:
I Cassava
II Maize
III Plantain
21%
18%
16%
14%
10%
5%
15%
11%
6%
15%
12%
6%
65%
51%
33%
MOFA
Quarterly
MOFA

29
DMTDP Goal: To Improve the lives of the people through increased Agricultural productivity
Policy Objectives:
1. To Enhance capacity to mitigate and reduce the impact of natural disasters, risks and
vulnerability
2. To Maintain and enhance ecological integrity of protected forest areas
3. To Promote Agriculture Mechanization in the district
4. To Increase access to extension services by 50% and re-orientation of agriculture education by
2017
Indicator Indicator
Type
Baseline
(2013)
2014 2015 2016 Target
(2017)
Data
Source
M&E
Frequen-
cy
Responsi-
Bility
IV Onion
V Rice
29%
11%
13%
9%
15%
10%
15%
12
72%
42%
30
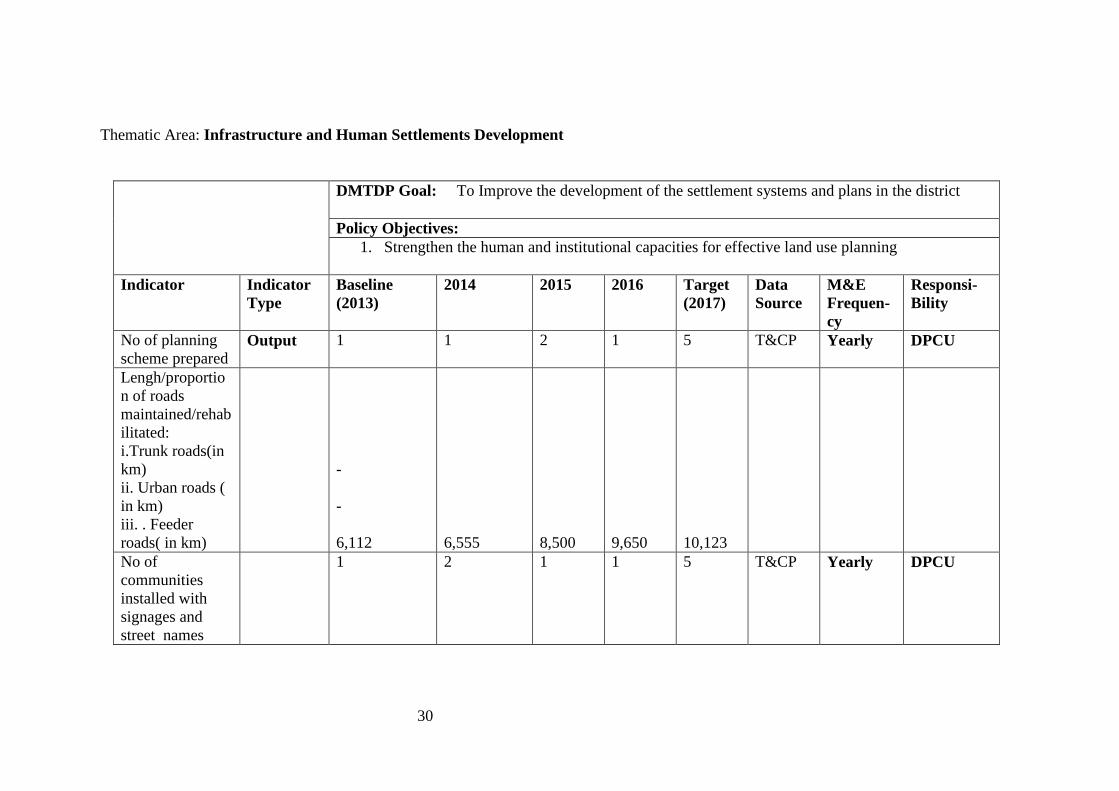
Thematic Area: Infrastructure and Human Settlements Development
DMTDP Goal: To Improve the development of the settlement systems and plans in the district
Policy Objectives:
1. Strengthen the human and institutional capacities for effective land use planning
Indicator Indicator
Type
Baseline
(2013)
2014 2015 2016 Target
(2017)
Data
Source
M&E
Frequen-
cy
Responsi-
Bility
No of planning
scheme prepared Output 1 1 2 1 5 T&CP Yearly DPCU
Lengh/proportio
n of roads
maintained/rehab
ilitated:
i.Trunk roads(in
km)
ii. Urban roads (
in km)
iii. . Feeder
roads( in km)
-
-
6,112
6,555
8,500
9,650
10,123
No of
communities
installed with
signages and
street names
1 2 1 1 5 T&CP Yearly DPCU

31
Thematic Area: Infrastructure and Human Settlements Development
DMTDP Goal: To enhancing the access of the people, especially the rural folk to potable and safe
drinking water, sanitation, electricity and ICT
Policy Objectives:
1. To Increase the use of ICT in all sectors of the local economy
2. To Accelerate the provision of improved environmental sanitation facilities
3. To Accelerate the provision of adequate, safe and affordable water
Indicator Indicator
Type
Baseline
(2013)
2014 2015 2016 Target
(2017)
Data
Source
M&E
Frequen-
cy
Responsi-
Bility
Street lights
provided to the
major towns in
the district
Output 25 10 10 10 55 DA/
ECG
Yearly ECG
change in
number of
households with
access to
electricity
Output 7000 2300 2300 2400 14000 DA Yearly DA
No ICT Centre
established
Output 1 - 1 - 2 DA Yearly DPCU
No of schools
supported with
ICT Teaching &
Output - 2 4 2 8 DA Yearly DPCU

32
DMTDP Goal: To enhancing the access of the people, especially the rural folk to potable and safe
drinking water, sanitation, electricity and ICT
Policy Objectives:
1. To Increase the use of ICT in all sectors of the local economy
2. To Accelerate the provision of improved environmental sanitation facilities
3. To Accelerate the provision of adequate, safe and affordable water
Indicator Indicator
Type
Baseline
(2013)
2014 2015 2016 Target
(2017)
Data
Source
M&E
Frequen-
cy
Responsi-
Bility
learning logistics
No of
community
centres
constructed
Output - 2 2 1 5 DA Yearly DPCU
proportion of
population with
sustainable
access to
improved
sanitation( WC,
KVIP)
Output - 10000 10000 10000 30000 DA Yearly DPCU
No of boreholes
drilled Output 25 15 15 20 75 DA Yearly DPCU
proportion of
population with
sustainable
access to safe
water sources
Output 50% 10% 10% 10% 80% DA/
DWST
Quarterly DWST
No of WATSAN Output 25 15 15 20 75 DA/ Yearly DWST

33
DMTDP Goal: To enhancing the access of the people, especially the rural folk to potable and safe
drinking water, sanitation, electricity and ICT
Policy Objectives:
1. To Increase the use of ICT in all sectors of the local economy
2. To Accelerate the provision of improved environmental sanitation facilities
3. To Accelerate the provision of adequate, safe and affordable water
Indicator Indicator
Type
Baseline
(2013)
2014 2015 2016 Target
(2017)
Data
Source
M&E
Frequen-
cy
Responsi-
Bility
Committees
trained
DWST
Water &
Sanitation Plan Output - 1 - - 1 DA/
DWST
Once DWST
No of household
toilets
constructed
Output - 400 400 400 1,200 DA/
DWST
Yearly DWST
No of refuse
dumps evacuated Output 2 1 - 1 4 DA/
DWST
Yearly DWST
No of PPP
projects in waste
management
undertaken
Output - 1 1 1 3 DA Yearly DPCU
34
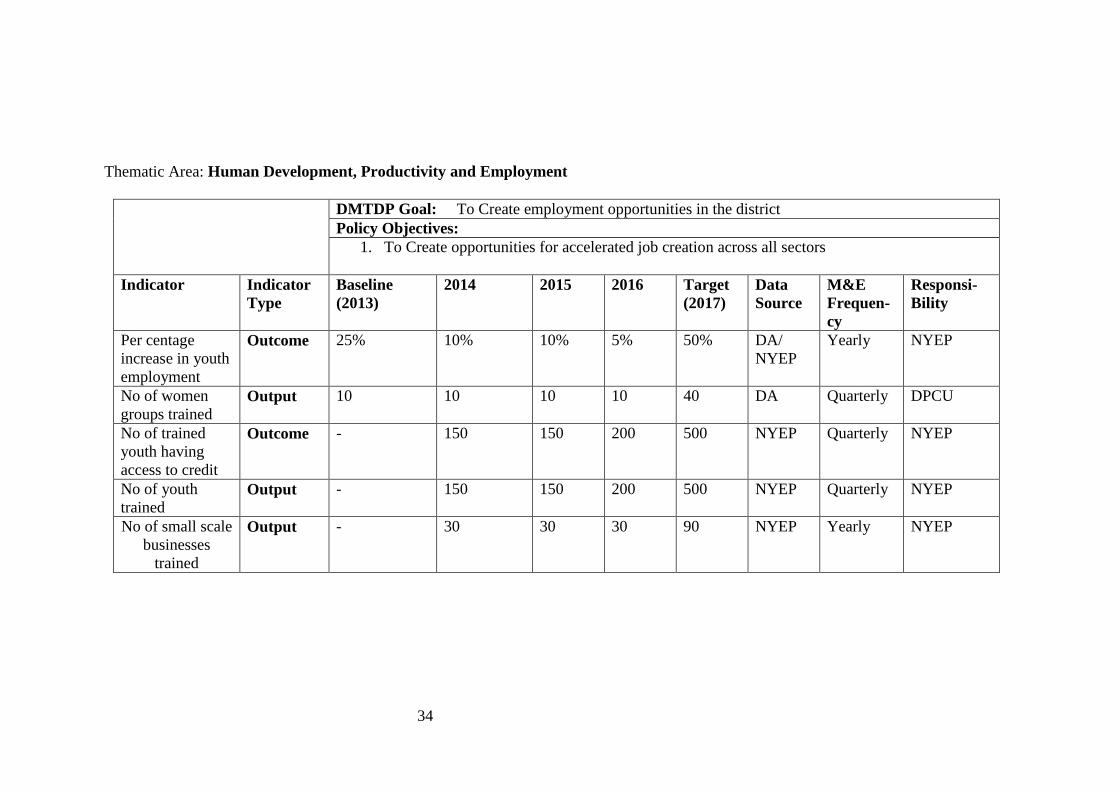
Thematic Area: Human Development, Productivity and Employment
DMTDP Goal: To Create employment opportunities in the district
Policy Objectives:
1. To Create opportunities for accelerated job creation across all sectors
Indicator Indicator
Type
Baseline
(2013)
2014 2015 2016 Target
(2017)
Data
Source
M&E
Frequen-
cy
Responsi-
Bility
Per centage
increase in youth
employment
Outcome 25% 10% 10% 5% 50% DA/
NYEP
Yearly NYEP
No of women
groups trained
Output 10 10 10 10 40 DA Quarterly DPCU
No of trained
youth having
access to credit
Outcome - 150 150 200 500 NYEP Quarterly NYEP
No of youth
trained Output - 150 150 200 500 NYEP Quarterly NYEP
No of small scale
businesses
trained
Output - 30 30 30 90 NYEP Yearly NYEP
35
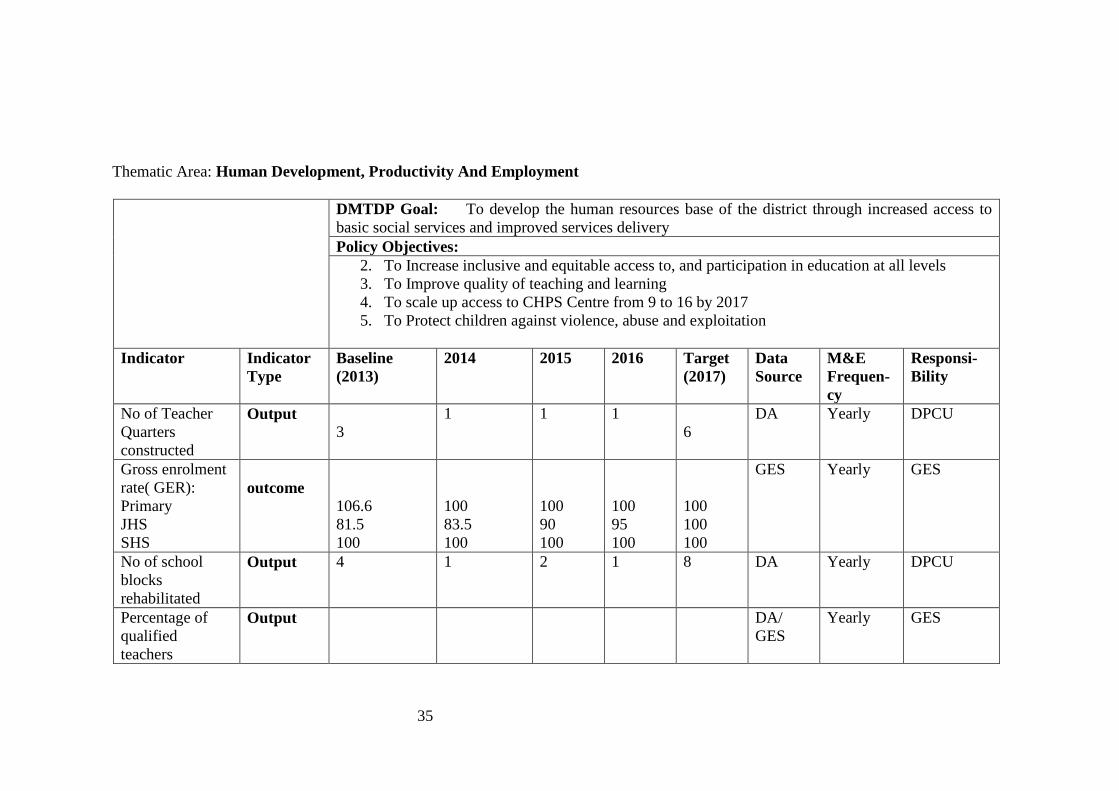
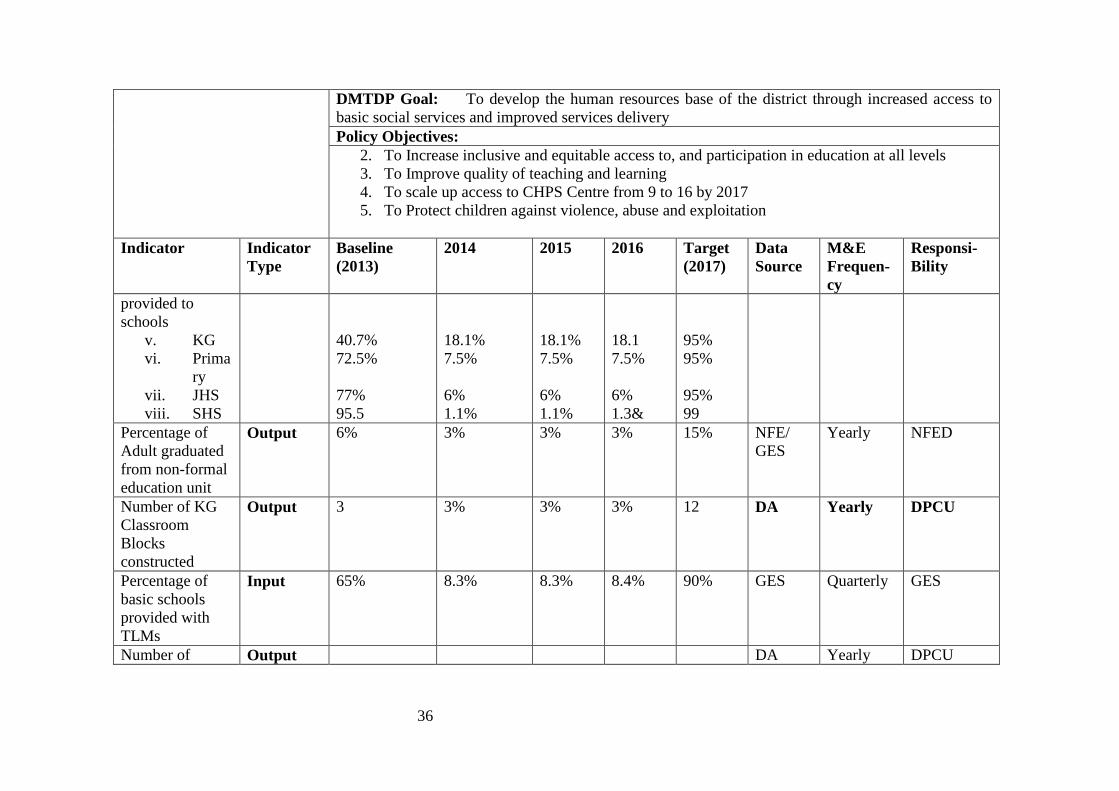
Thematic Area: Human Development, Productivity And Employment
DMTDP Goal: To develop the human resources base of the district through increased access to
basic social services and improved services delivery
Policy Objectives:
2. To Increase inclusive and equitable access to, and participation in education at all levels
3. To Improve quality of teaching and learning
4. To scale up access to CHPS Centre from 9 to 16 by 2017
5. To Protect children against violence, abuse and exploitation
Indicator Indicator
Type
Baseline
(2013)
2014 2015 2016 Target
(2017)
Data
Source
M&E
Frequen-
cy
Responsi-
Bility
No of Teacher
Quarters
constructed
Output
3
1 1 1
6
DA Yearly DPCU
Gross enrolment
rate( GER):
Primary
JHS
SHS
outcome
106.6
81.5
100
100
83.5
100
100
90
100
100
95
100
100
100
100
GES Yearly GES
No of school
blocks
rehabilitated
Output 4 1 2 1 8 DA Yearly DPCU
Percentage of
qualified
teachers
Output
DA/
GES
Yearly GES
36
DMTDP Goal: To develop the human resources base of the district through increased access to
basic social services and improved services delivery
Policy Objectives:
2. To Increase inclusive and equitable access to, and participation in education at all levels
3. To Improve quality of teaching and learning
4. To scale up access to CHPS Centre from 9 to 16 by 2017
5. To Protect children against violence, abuse and exploitation
Indicator Indicator
Type
Baseline
(2013)
2014 2015 2016 Target
(2017)
Data
Source
M&E
Frequen-
cy
Responsi-
Bility
provided to
schools
v. KG
vi. Prima
ry
vii. JHS
viii. SHS
40.7%
72.5%
77%
95.5
18.1%
7.5%
6%
1.1%
18.1%
7.5%
6%
1.1%
18.1
7.5%
6%
1.3&
95%
95%
95%
99
Percentage of
Adult graduated
from non-formal
education unit
Output 6% 3% 3% 3% 15% NFE/
GES
Yearly NFED
Number of KG
Classroom
Blocks
constructed
Output 3 3% 3% 3% 12 DA Yearly DPCU
Percentage of
basic schools
provided with
TLMs
Input 65% 8.3% 8.3% 8.4% 90% GES Quarterly GES
Number of Output DA Yearly DPCU
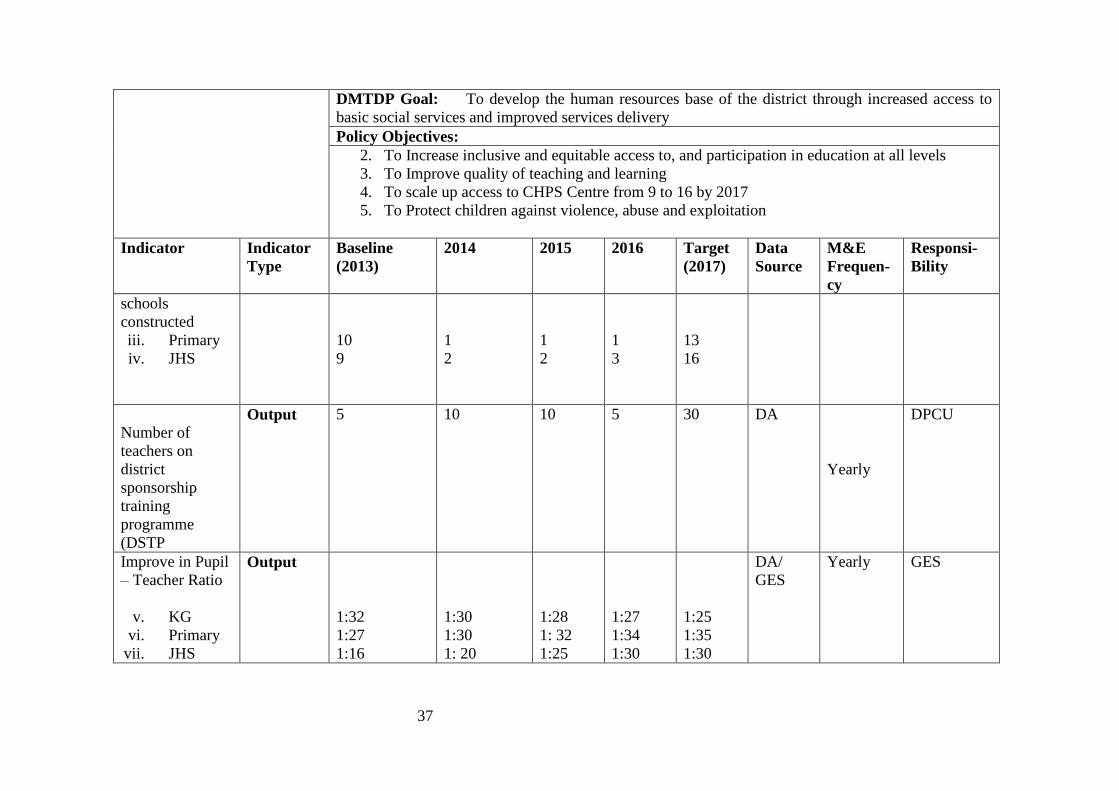
37
DMTDP Goal: To develop the human resources base of the district through increased access to
basic social services and improved services delivery
Policy Objectives:
2. To Increase inclusive and equitable access to, and participation in education at all levels
3. To Improve quality of teaching and learning
4. To scale up access to CHPS Centre from 9 to 16 by 2017
5. To Protect children against violence, abuse and exploitation
Indicator Indicator
Type
Baseline
(2013)
2014 2015 2016 Target
(2017)
Data
Source
M&E
Frequen-
cy
Responsi-
Bility
schools
constructed
iii. Primary
iv. JHS
10
9
1
2
1
2
1
3
13
16
Number of
teachers on
district
sponsorship
training
programme
(DSTP
Output 5 10 10 5
30 DA
Yearly
DPCU
Improve in Pupil
– Teacher Ratio
v. KG
vi. Primary
vii. JHS
Output
1:32
1:27
1:16
1:30
1:30
1: 20
1:28
1: 32
1:25
1:27
1:34
1:30
1:25
1:35
1:30
DA/
GES
Yearly GES

38
DMTDP Goal: To develop the human resources base of the district through increased access to
basic social services and improved services delivery
Policy Objectives:
2. To Increase inclusive and equitable access to, and participation in education at all levels
3. To Improve quality of teaching and learning
4. To scale up access to CHPS Centre from 9 to 16 by 2017
5. To Protect children against violence, abuse and exploitation
Indicator Indicator
Type
Baseline
(2013)
2014 2015 2016 Target
(2017)
Data
Source
M&E
Frequen-
cy
Responsi-
Bility
viii. SHS
1:29 1:29 1:30 1:30 1:30
Percentage of
candidates that
gained aggregate
6-30 in BECE
Outcome
54.29% 72% 80% 88% 90%
GES
Yearly
GES
Percentage of
candidates that
gained aggregate
6-30 in SHS
Output 50% 60% 70% 80% 90% GES Yearly GES
Percentage
decrease in
common
diseases
v. Malaria
vi. Worm
infection
Outcome
60%
45%
5%
10%
5%
5%
5%
5%
45%
25%
DHS Quarterly DHS
39
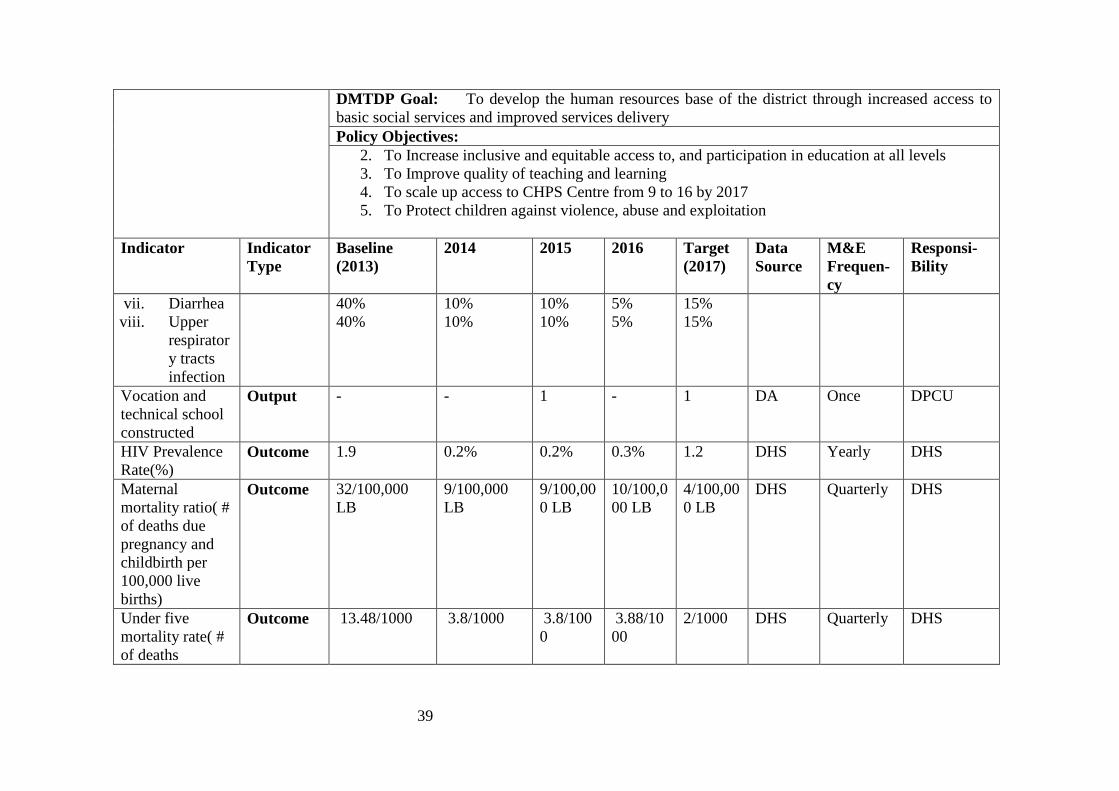
DMTDP Goal: To develop the human resources base of the district through increased access to
basic social services and improved services delivery
Policy Objectives:
2. To Increase inclusive and equitable access to, and participation in education at all levels
3. To Improve quality of teaching and learning
4. To scale up access to CHPS Centre from 9 to 16 by 2017
5. To Protect children against violence, abuse and exploitation
Indicator Indicator
Type
Baseline
(2013)
2014 2015 2016 Target
(2017)
Data
Source
M&E
Frequen-
cy
Responsi-
Bility
vii. Diarrhea
viii. Upper
respirator
y tracts
infection
40%
40%
10%
10%
10%
10%
5%
5%
15%
15%
Vocation and
technical school
constructed
Output - - 1 - 1 DA Once DPCU
HIV Prevalence
Rate(%) Outcome 1.9 0.2% 0.2% 0.3% 1.2 DHS Yearly DHS
Maternal
mortality ratio( #
of deaths due
pregnancy and
childbirth per
100,000 live
births)
Outcome 32/100,000
LB
9/100,000
LB
9/100,00
0 LB
10/100,0
00 LB
4/100,00
0 LB
DHS Quarterly DHS
Under five
mortality rate( #
of deaths
Outcome 13.48/1000 3.8/1000 3.8/100
0
3.88/10
00
2/1000 DHS Quarterly DHS

40
DMTDP Goal: To develop the human resources base of the district through increased access to
basic social services and improved services delivery
Policy Objectives:
2. To Increase inclusive and equitable access to, and participation in education at all levels
3. To Improve quality of teaching and learning
4. To scale up access to CHPS Centre from 9 to 16 by 2017
5. To Protect children against violence, abuse and exploitation
Indicator Indicator
Type
Baseline
(2013)
2014 2015 2016 Target
(2017)
Data
Source
M&E
Frequen-
cy
Responsi-
Bility
occuring
between birth
and exact age per
1000 live births)
No of CHPS
Compound
constructed
Output 10 1 3 3 17 DHS Quarterly DA
0.5% D.A
Support released
for HIV
activities
Output 1 - - - 1 DAC Quarterly DA
No of
DAC/DRMT
meeting held
Output 2 5 6 5 18 DAC Quarterly DAC
No of PLHIV
Support Groups
meetings held
Output 1 1 - - 2 DAC Quarterly DAC
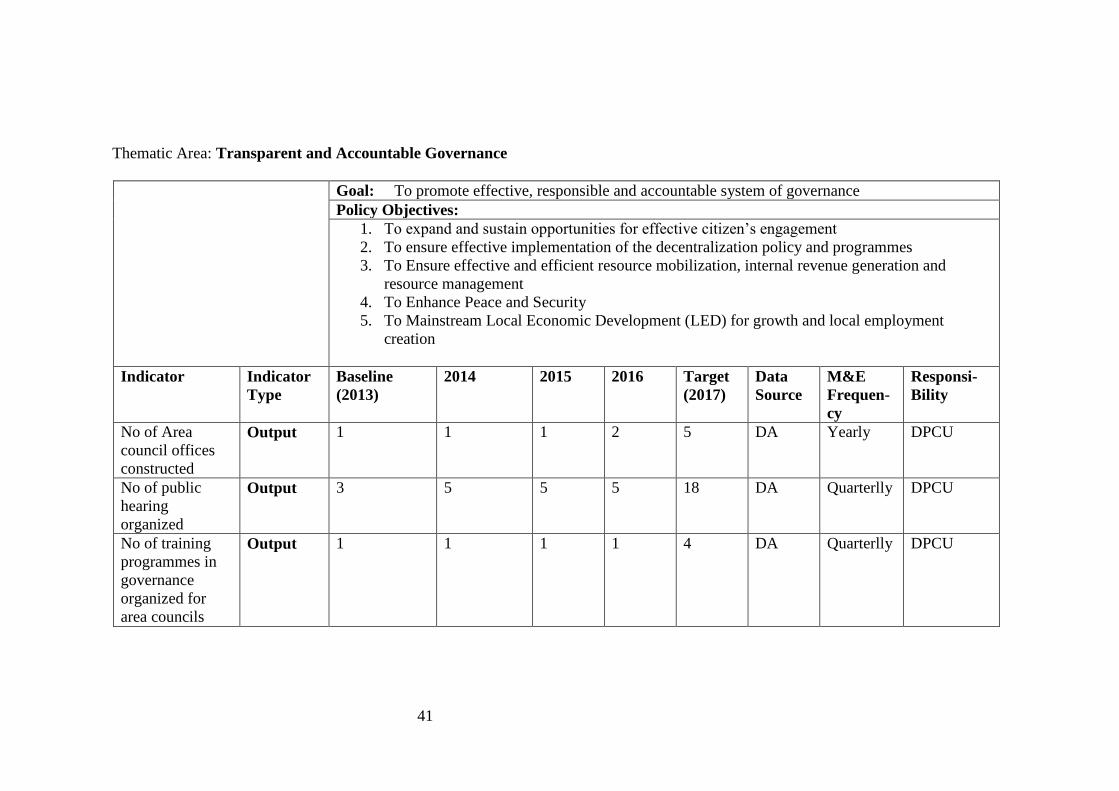
41
Thematic Area: Transparent and Accountable Governance
Goal: To promote effective, responsible and accountable system of governance
Policy Objectives:
1. To expand and sustain opportunities for effective citizen’s engagement
2. To ensure effective implementation of the decentralization policy and programmes
3. To Ensure effective and efficient resource mobilization, internal revenue generation and
resource management
4. To Enhance Peace and Security
5. To Mainstream Local Economic Development (LED) for growth and local employment
creation
Indicator Indicator
Type
Baseline
(2013)
2014 2015 2016 Target
(2017)
Data
Source
M&E
Frequen-
cy
Responsi-
Bility
No of Area
council offices
constructed
Output 1 1 1 2 5 DA Yearly DPCU
No of public
hearing
organized
Output 3 5 5 5 18 DA Quarterlly DPCU
No of training
programmes in
governance
organized for
area councils
Output 1 1 1 1 4 DA Quarterlly DPCU
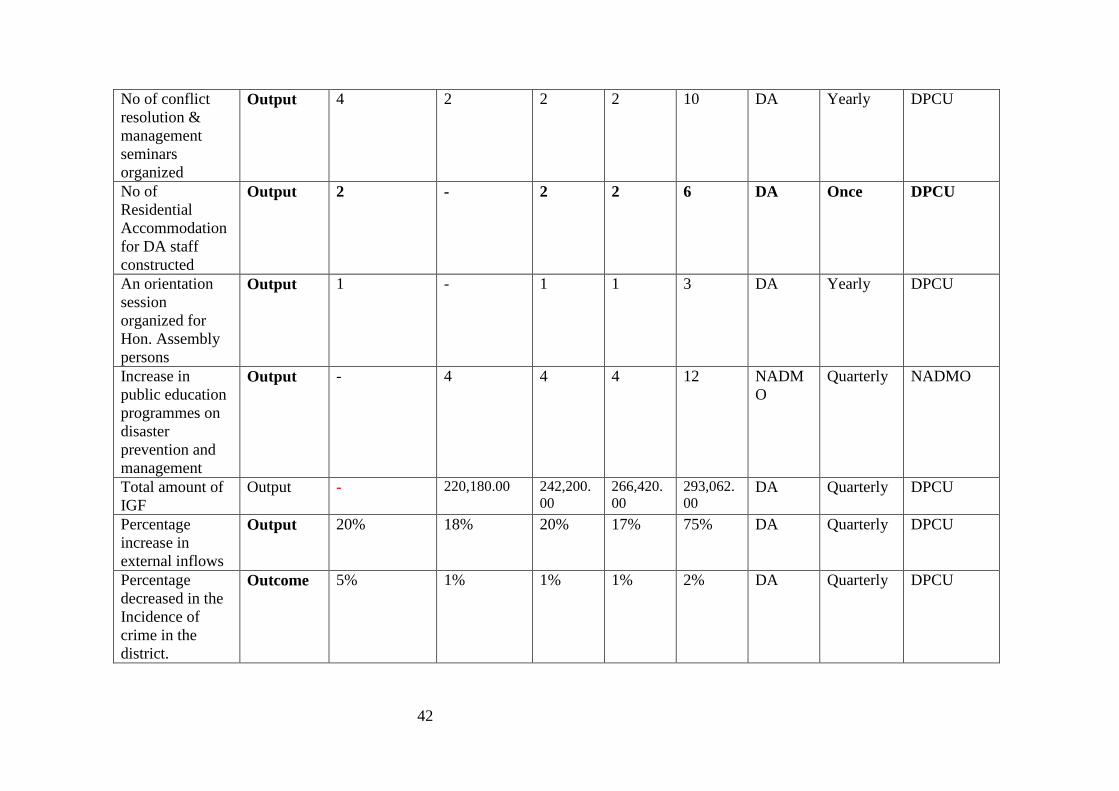
42
No of conflict
resolution &
management
seminars
organized
Output 4 2 2 2 10 DA Yearly DPCU
No of
Residential
Accommodation
for DA staff
constructed
Output 2 - 2 2 6 DA Once DPCU
An orientation
session
organized for
Hon. Assembly
persons
Output 1 - 1 1 3 DA Yearly DPCU
Increase in
public education
programmes on
disaster
prevention and
management
Output - 4 4 4 12 NADM
O
Quarterly NADMO
Total amount of
IGF
Output - 220,180.00 242,200.
00
266,420.
00
293,062.
00 DA Quarterly DPCU
Percentage
increase in
external inflows
Output 20% 18% 20% 17% 75% DA Quarterly DPCU
Percentage
decreased in the
Incidence of
crime in the
district.
Outcome 5% 1% 1% 1% 2% DA Quarterly DPCU
43
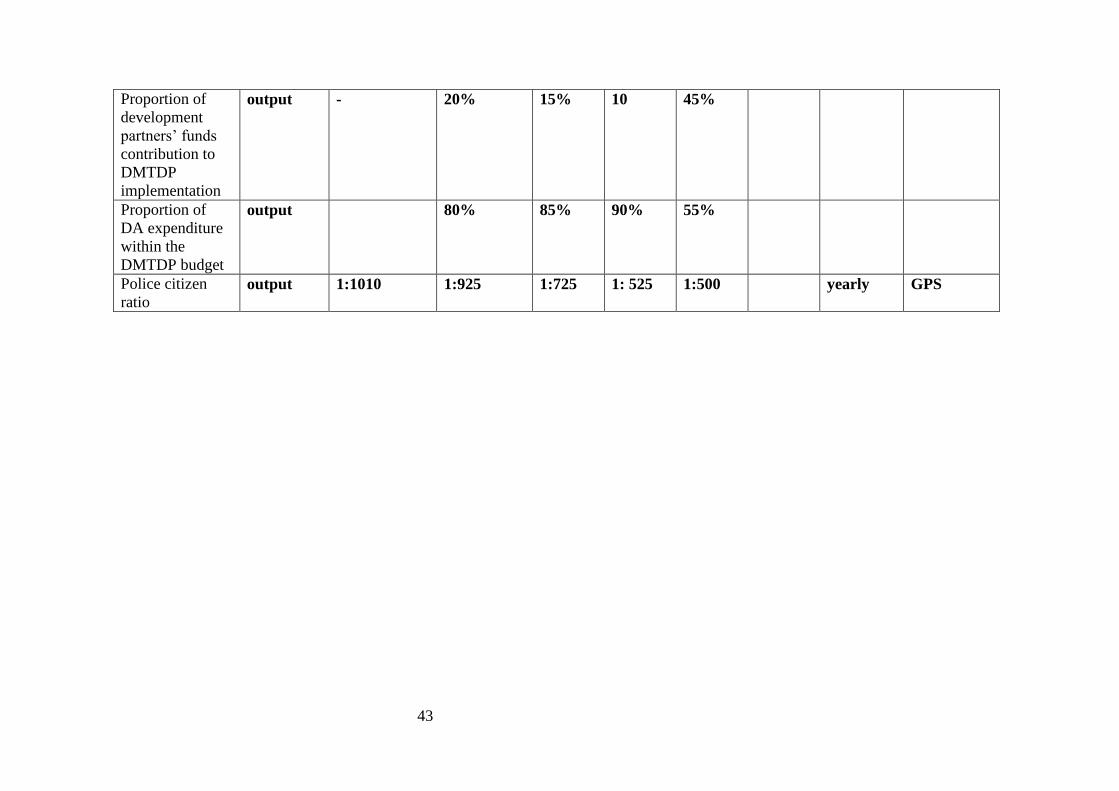
Proportion of
development
partners’ funds
contribution to
DMTDP
implementation
output - 20% 15% 10 45%
Proportion of
DA expenditure
within the
DMTDP budget
output 80% 85% 90% 55%
Police citizen
ratio output 1:1010 1:925 1:725 1: 525 1:500 yearly GPS

44
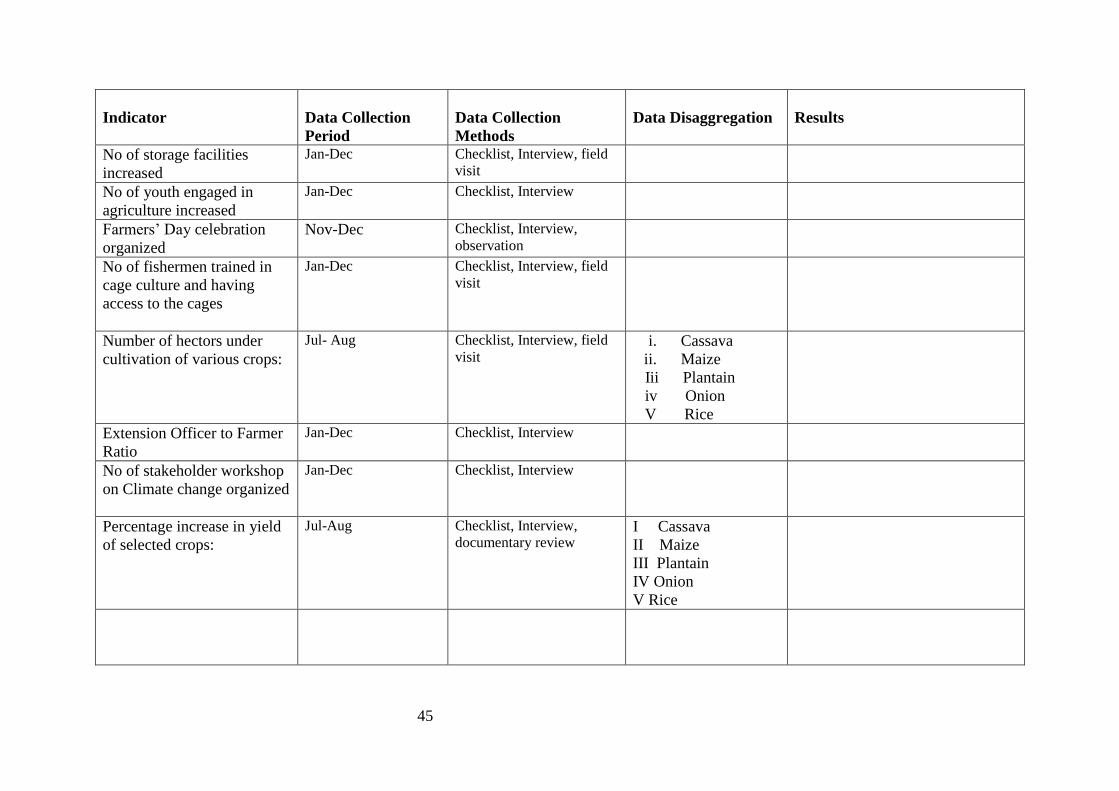
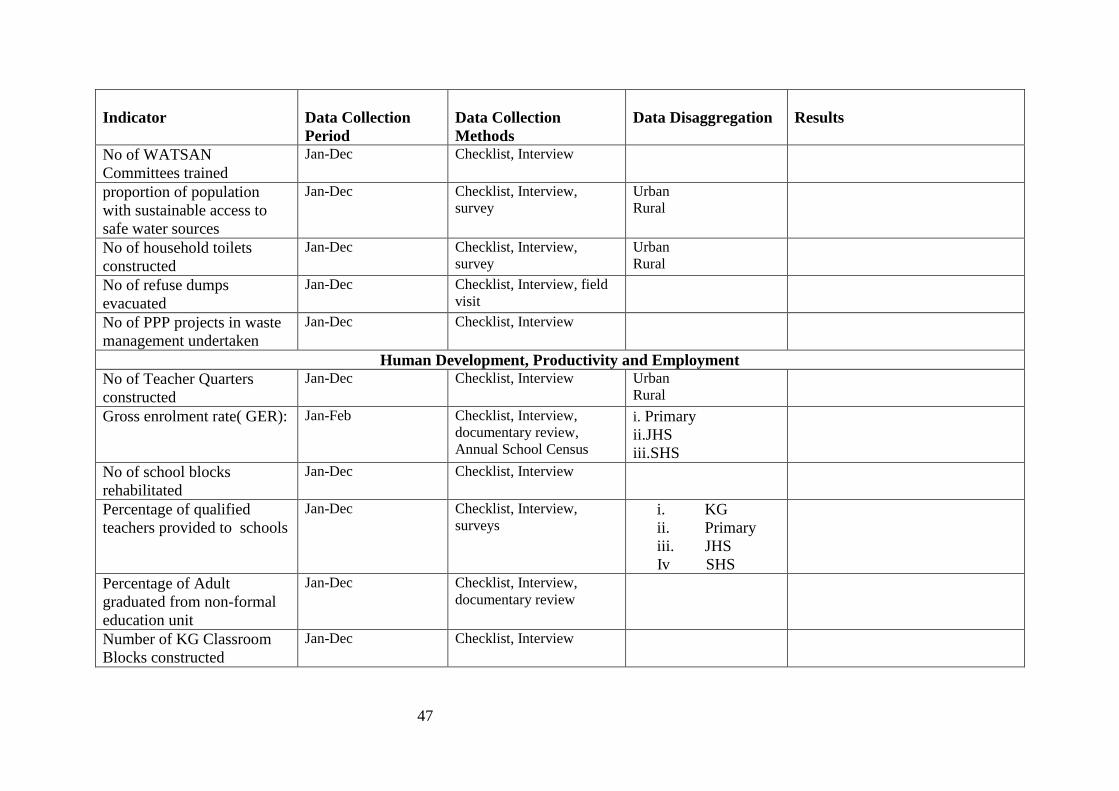
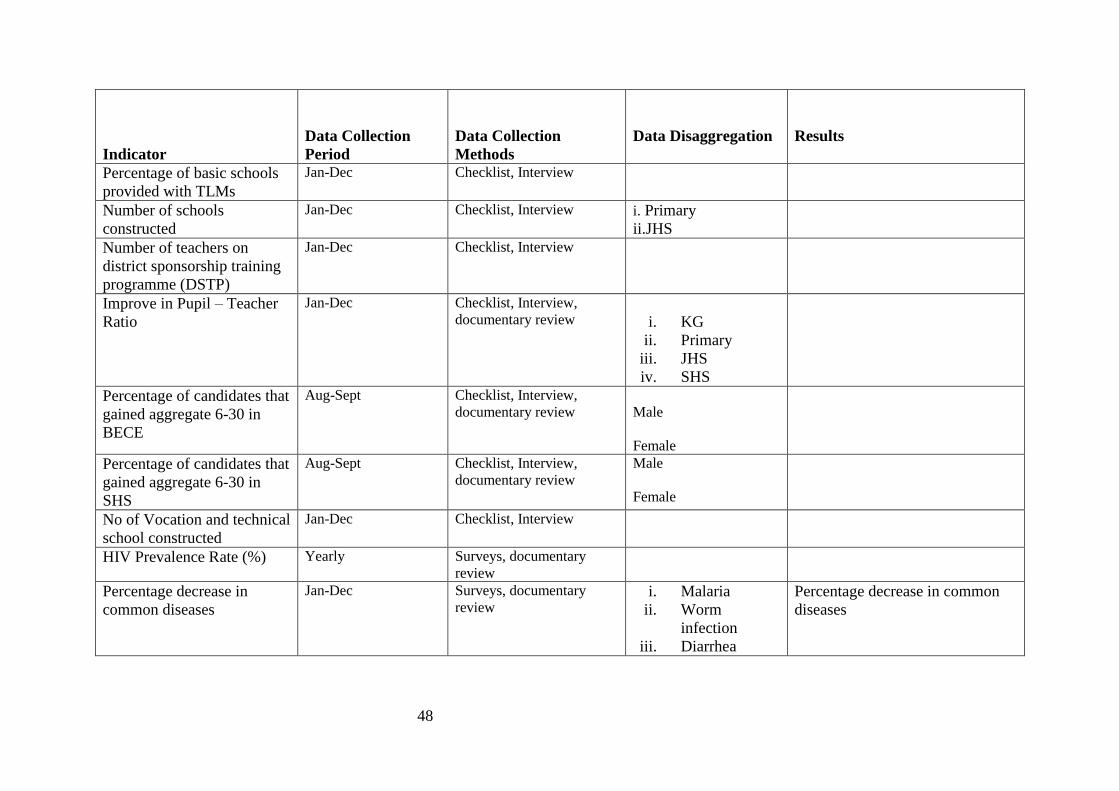
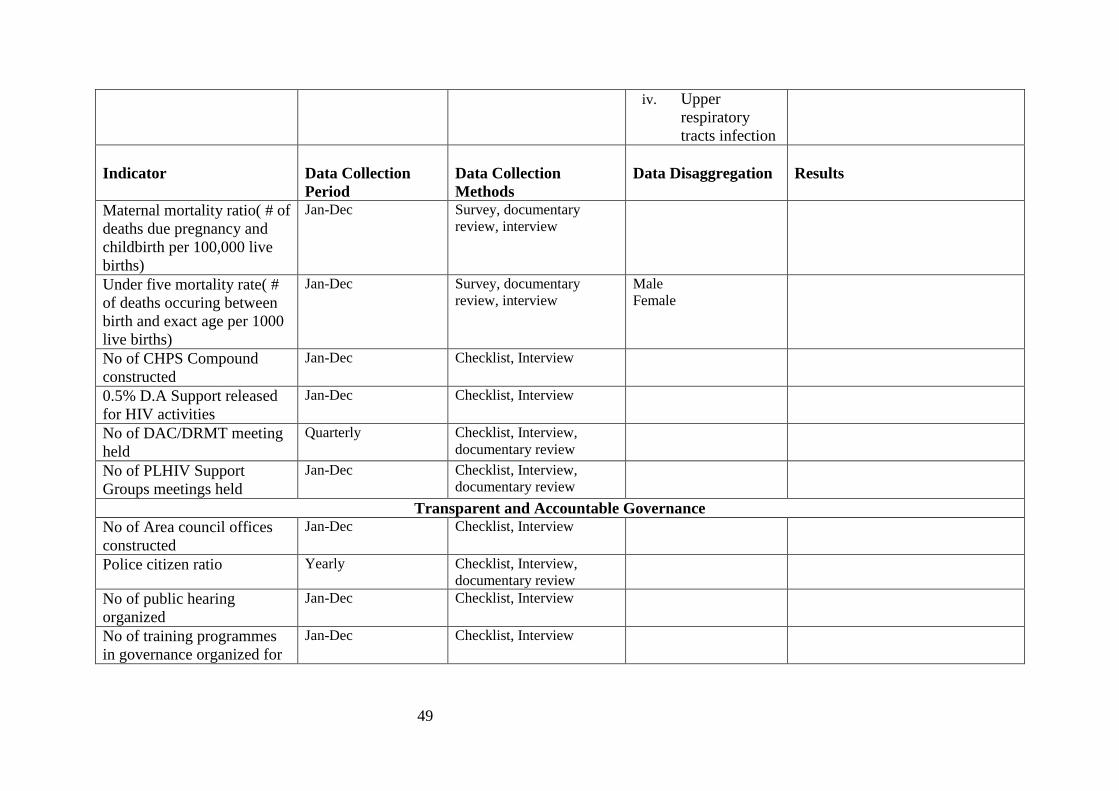
2.4.1 M&E Data Collection Sheets
The data collection sheets are developed to enable M&E staff and stakeholder collect data on annual basis as
presented in the subsequent tables.
M&E Data Collection Sheet- Annual Basis
Indicator Data Collection
Period
Data Collection
Methods
Data Disaggregation Results
Enhancing Competitiveness in Ghana’s private sector
No of public private
partnership seminars
organized
Jan-Dec Checklist, Interview
No of businesses trained on
best business practice
Jan-Dec Checklist, Interview
Change in tourist arrivals
(%)
April-May Documentary review,
Observation
Foreign
Locals
Access to tourist sites
enhanced
Jan-Dec Checklist, Interview, field
visit
No of feeder roads
rehabilitated
Jan-Dec Checklist, Interview, field
visit
Accelerated Agricultural Modernization and Sustainable Natural Resource Management
No of farmer-Based
Organisations trained in
entrepreneurship
Jan-Dec Checklist, Interview, field
visit
No of agro- forestry and
afforestation programmes
implemented
Jan-Dec Checklist, Interview, field
visit
45
Indicator
Data Collection
Period
Data Collection
Methods
Data Disaggregation
Results
No of storage facilities
increased
Jan-Dec Checklist, Interview, field
visit
No of youth engaged in
agriculture increased
Jan-Dec Checklist, Interview
Farmers’ Day celebration
organized
Nov-Dec Checklist, Interview,
observation
No of fishermen trained in
cage culture and having
access to the cages
Jan-Dec Checklist, Interview, field
visit
Number of hectors under
cultivation of various crops:
Jul- Aug Checklist, Interview, field
visit i. Cassava
ii. Maize
Iii Plantain
iv Onion
V Rice
Extension Officer to Farmer
Ratio
Jan-Dec Checklist, Interview
No of stakeholder workshop
on Climate change organized
Jan-Dec Checklist, Interview
Percentage increase in yield
of selected crops:
Jul-Aug Checklist, Interview,
documentary review I Cassava
II Maize
III Plantain
IV Onion
V Rice
46
Indicator Data Collection
Period
Data Collection
Methods
Data Disaggregation Results
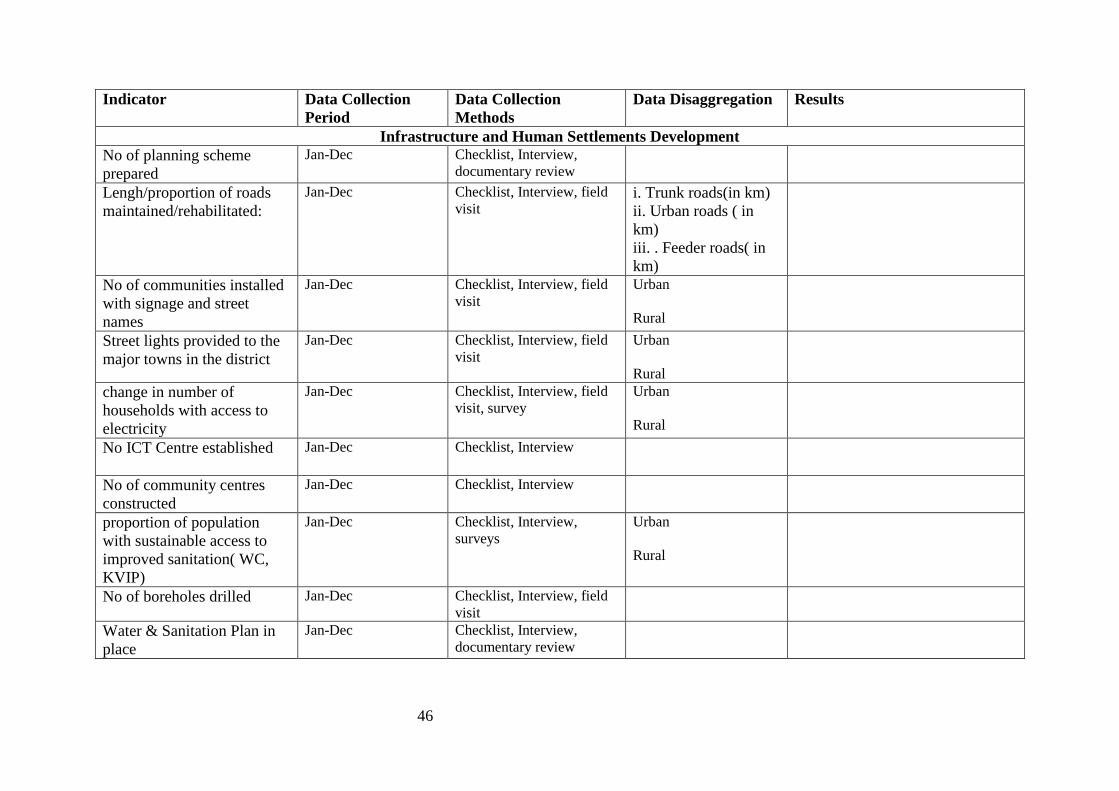
Infrastructure and Human Settlements Development
No of planning scheme
prepared
Jan-Dec Checklist, Interview,
documentary review
Lengh/proportion of roads
maintained/rehabilitated:
Jan-Dec Checklist, Interview, field
visit i. Trunk roads(in km)
ii. Urban roads ( in
km)
iii. . Feeder roads( in
km)
No of communities installed
with signage and street
names
Jan-Dec Checklist, Interview, field
visit
Urban
Rural
Street lights provided to the
major towns in the district
Jan-Dec Checklist, Interview, field
visit
Urban
Rural
change in number of
households with access to
electricity
Jan-Dec Checklist, Interview, field
visit, survey
Urban
Rural
No ICT Centre established
Jan-Dec Checklist, Interview
No of community centres
constructed
Jan-Dec Checklist, Interview
proportion of population
with sustainable access to
improved sanitation( WC,
KVIP)
Jan-Dec Checklist, Interview,
surveys
Urban
Rural
No of boreholes drilled Jan-Dec Checklist, Interview, field
visit
Water & Sanitation Plan in
place
Jan-Dec Checklist, Interview,
documentary review
47
Indicator
Data Collection
Period
Data Collection
Methods
Data Disaggregation
Results
No of WATSAN
Committees trained
Jan-Dec Checklist, Interview
proportion of population
with sustainable access to
safe water sources
Jan-Dec Checklist, Interview,
survey
Urban
Rural
No of household toilets
constructed
Jan-Dec Checklist, Interview,
survey
Urban
Rural
No of refuse dumps
evacuated
Jan-Dec Checklist, Interview, field
visit
No of PPP projects in waste
management undertaken
Jan-Dec Checklist, Interview
Human Development, Productivity and Employment
No of Teacher Quarters
constructed
Jan-Dec Checklist, Interview Urban
Rural
Gross enrolment rate( GER): Jan-Feb Checklist, Interview,
documentary review,
Annual School Census
i. Primary
ii.JHS
iii.SHS
No of school blocks
rehabilitated
Jan-Dec Checklist, Interview
Percentage of qualified
teachers provided to schools
Jan-Dec Checklist, Interview,
surveys i. KG
ii. Primary
iii. JHS
Iv SHS
Percentage of Adult
graduated from non-formal
education unit
Jan-Dec Checklist, Interview,
documentary review
Number of KG Classroom
Blocks constructed
Jan-Dec Checklist, Interview
48
Indicator
Data Collection
Period
Data Collection
Methods
Data Disaggregation
Results
Percentage of basic schools
provided with TLMs
Jan-Dec Checklist, Interview
Number of schools
constructed
Jan-Dec Checklist, Interview i. Primary
ii.JHS
Number of teachers on
district sponsorship training
programme (DSTP)
Jan-Dec Checklist, Interview
Improve in Pupil – Teacher
Ratio
Jan-Dec Checklist, Interview,
documentary review
i. KG
ii. Primary
iii. JHS
iv. SHS
Percentage of candidates that
gained aggregate 6-30 in
BECE
Aug-Sept Checklist, Interview,
documentary review
Male
Female
Percentage of candidates that
gained aggregate 6-30 in
SHS
Aug-Sept Checklist, Interview,
documentary review
Male
Female
No of Vocation and technical
school constructed
Jan-Dec Checklist, Interview
HIV Prevalence Rate (%) Yearly Surveys, documentary
review
Percentage decrease in
common diseases
Jan-Dec Surveys, documentary
review i. Malaria
ii. Worm
infection
iii. Diarrhea
Percentage decrease in common
diseases
49
iv. Upper
respiratory
tracts infection
Indicator
Data Collection
Period
Data Collection
Methods
Data Disaggregation
Results
Maternal mortality ratio( # of
deaths due pregnancy and
childbirth per 100,000 live
births)
Jan-Dec Survey, documentary
review, interview
Under five mortality rate( #
of deaths occuring between
birth and exact age per 1000
live births)
Jan-Dec Survey, documentary
review, interview
Male
Female
No of CHPS Compound
constructed
Jan-Dec Checklist, Interview
0.5% D.A Support released
for HIV activities
Jan-Dec Checklist, Interview
No of DAC/DRMT meeting
held
Quarterly Checklist, Interview,
documentary review
No of PLHIV Support
Groups meetings held
Jan-Dec Checklist, Interview,
documentary review
Transparent and Accountable Governance
No of Area council offices
constructed
Jan-Dec Checklist, Interview
Police citizen ratio Yearly Checklist, Interview,
documentary review
No of public hearing
organized
Jan-Dec Checklist, Interview
No of training programmes
in governance organized for
Jan-Dec Checklist, Interview

50
area councils
Indicator Data Collection
Period
Data Collection
Methods
Data Disaggregation Results
No of conflict resolution and
management seminars
organized
Jan-Dec
No of Residential
Accommodation for DA
staff constructed
Jan-Dec Checklist, Interview
No of orientation session
organized for Hon.
Assembly persons
Jan-Dec Checklist, Interview
Increase in public education
programmes on disaster
prevention and management
Jan-Dec Checklist, Interview
Increase in total amount of
IGF
Quarterly Checklist, Interview,
documentary review
Percentage increase in
external inflows
Quarterly Checklist, Interview,
documentary review
Percentage decreased in the
Incidence of crime in the
district.
Yearly Survey, Interview,
documentary review
Proportion of development
partners’ funds contribution
to DMTDP implementation
Jan-Dec Checklist, Interview,
documentary review
Proportion of DA
expenditure within the
DMTDP budget
Jan-Dec Checklist, Interview,
documentary review
51
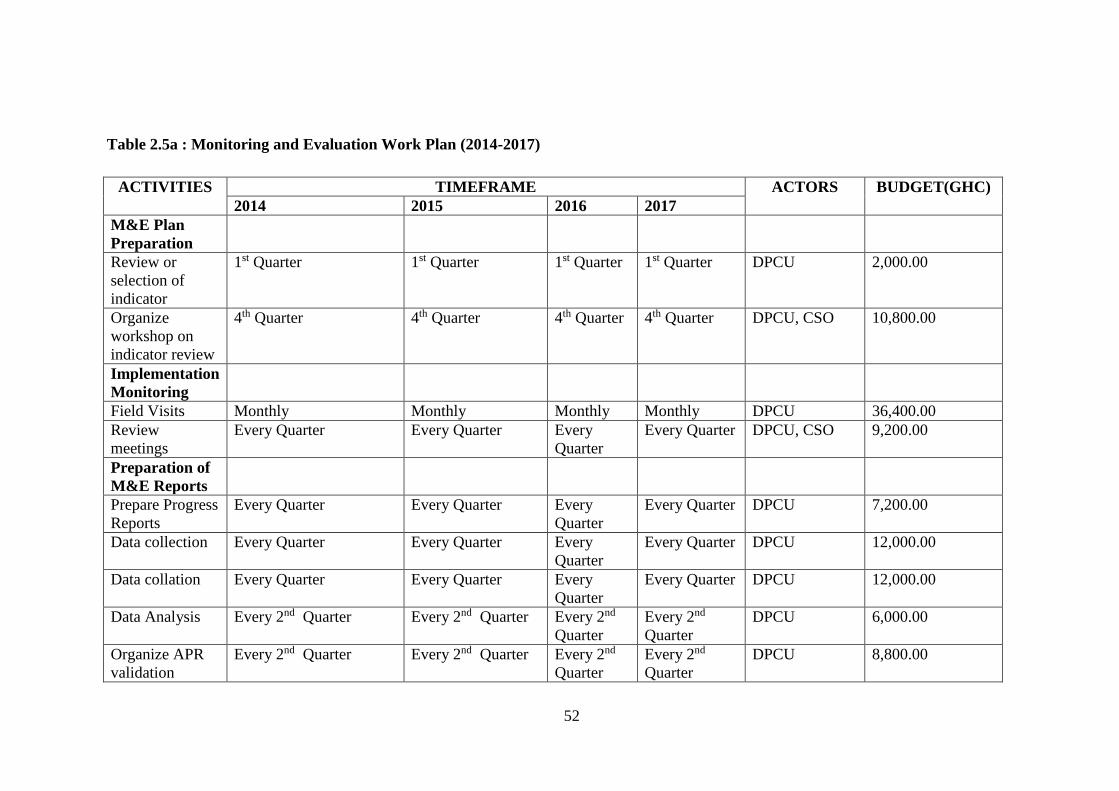
2.5 M & E Work Plan and Calendar
The Tables 2.5(a) and 2.5 (b) shows the details of M&E Work Plan and M&E Calendar
respectively. The major activities include monthly monitoring visits by the DPCU, review
meetings, quarterly field visits, mid-term evaluation of programmes, preparation of
monthly and quarterly reports, annual and information dissemination.
52
Table 2.5a : Monitoring and Evaluation Work Plan (2014-2017)
ACTIVITIES TIMEFRAME ACTORS BUDGET(GHC)
2014 2015 2016 2017
M&E Plan
Preparation
Review or
selection of
indicator
1st Quarter 1st Quarter 1st Quarter 1st Quarter DPCU 2,000.00
Organize
workshop on
indicator review
4th Quarter 4th Quarter 4th Quarter 4th Quarter DPCU, CSO 10,800.00
Implementation
Monitoring
Field Visits Monthly Monthly Monthly Monthly DPCU 36,400.00
Review
meetings
Every Quarter Every Quarter Every
Quarter
Every Quarter DPCU, CSO 9,200.00
Preparation of
M&E Reports
Prepare Progress
Reports
Every Quarter Every Quarter Every
Quarter
Every Quarter DPCU 7,200.00
Data collection Every Quarter Every Quarter Every
Quarter
Every Quarter DPCU 12,000.00
Data collation Every Quarter Every Quarter Every
Quarter
Every Quarter DPCU 12,000.00
Data Analysis Every 2nd Quarter Every 2nd Quarter Every 2nd
Quarter
Every 2nd
Quarter
DPCU 6,000.00
Organize APR
validation
Every 2nd Quarter Every 2nd Quarter Every 2nd
Quarter
Every 2nd
Quarter
DPCU 8,800.00

53
workshop
Internal review
of draft APR
Every 4th Quarter Every 4th Quarter Every 4th
Quarter
Every 4th
Quarter
DPCU 2,000.00
ACTITIES TIMEFRAME ACTORS BUDGET(GHC)
2014 2015 2016 2017
Print APR 2nd Quarter 2nd Quarter 2nd Quarter 2nd Quarter DPCU 2,000.00
Dissemination and
communication of
M&E Results
Organize APR
Dissemination
Workshop
4th Quarter 4th Quarter 4th Quarter 4th Quarter DPCU 10,000.00
Distribute APR to
relevant stakeholders
4th Quarter 4th Quarter 4th Quarter 4th Quarter DPCU, CSO,
RCC
2,000.00
Engage stakeholders on
APR
1st Quarter of
ensuing year
1st Quarter of
ensuing year
1st Quarter of
ensuing year
1st Quarter of
ensuing year
DPCU -
PM&E
Prepare for PM&E with
stakeholders
1st Quarter 1st Quarter 1st Quarter 1st Quarter DPCU 1,200.00
Train personnel to
conduct field work
1st Quarter 1st Quarter 1st Quarter 1st Quarter DPCU 8,000.00
Conduct PM&E Quarterly Quarterly Quarterly Quarterly DPCU 4,000.00
Evaluation
Mid Term Evaluation of
DMTDP
1st Quarter DPCU,CSO,
RCC
6,000.00
Terminal Evaluation 4th Quarter DPCU,CSO,
RCC
8,000.00
TOTAL 147,600.00
54
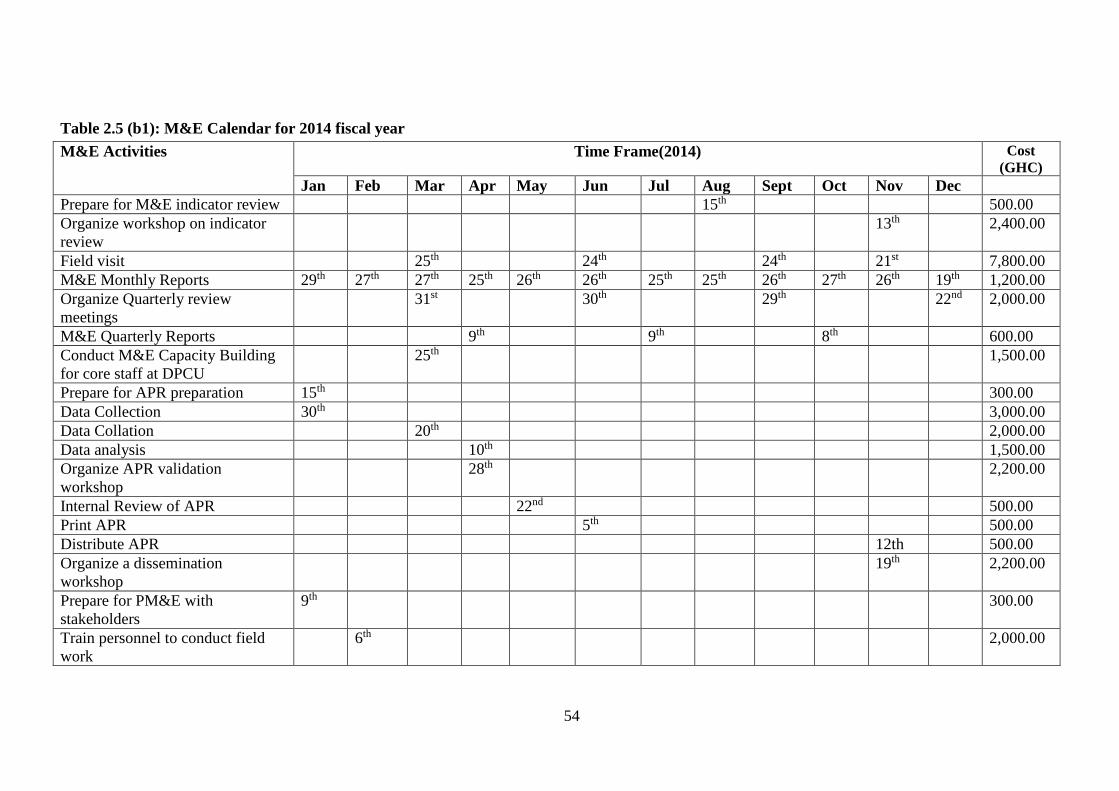
Table 2.5 (b1): M&E Calendar for 2014 fiscal year
M&E Activities Time Frame(2014) Cost
(GHC)
Jan Feb Mar Apr May Jun Jul Aug Sept Oct Nov Dec
Prepare for M&E indicator review 15th 500.00
Organize workshop on indicator
review
13th 2,400.00
Field visit 25th 24th 24th 21st 7,800.00
M&E Monthly Reports 29th 27th 27th 25th 26th 26th 25th 25th 26th 27th 26th 19th 1,200.00
Organize Quarterly review
meetings
31st 30th 29th 22nd 2,000.00
M&E Quarterly Reports 9th 9th 8th 600.00
Conduct M&E Capacity Building
for core staff at DPCU
25th 1,500.00
Prepare for APR preparation 15th 300.00
Data Collection 30th 3,000.00
Data Collation 20th 2,000.00
Data analysis 10th 1,500.00
Organize APR validation
workshop
28th 2,200.00
Internal Review of APR 22nd 500.00
Print APR 5th 500.00
Distribute APR 12th 500.00
Organize a dissemination
workshop
19th 2,200.00
Prepare for PM&E with
stakeholders
9th 300.00
Train personnel to conduct field
work
6th 2,000.00
55
M&E Activities Time Frame(2014) Cost
(GHC)
Jan Feb Mar Apr May Jun Jul Aug Sept Oct Nov Dec
Conduct PM&E 6th 1,000.00
TOTAL 32,000.00
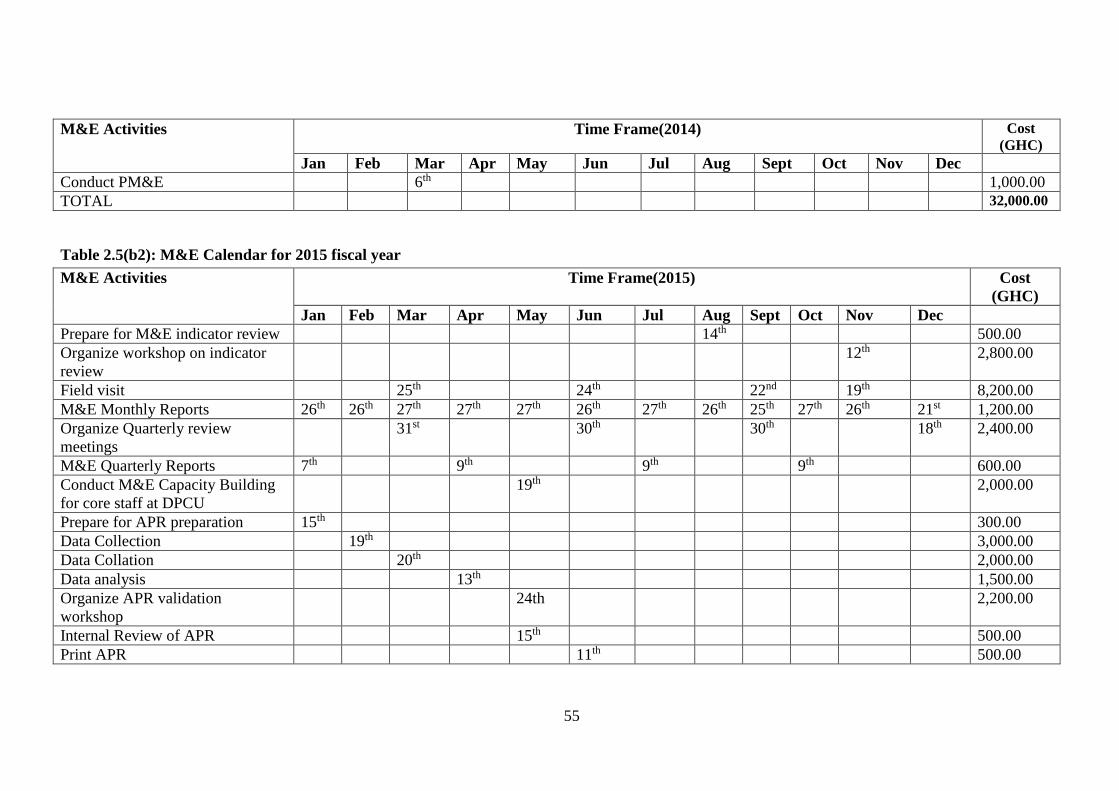
Table 2.5(b2): M&E Calendar for 2015 fiscal year
M&E Activities Time Frame(2015) Cost
(GHC)
Jan Feb Mar Apr May Jun Jul Aug Sept Oct Nov Dec
Prepare for M&E indicator review 14th 500.00
Organize workshop on indicator
review
12th 2,800.00
Field visit 25th 24th 22nd 19th 8,200.00
M&E Monthly Reports 26th 26th 27th 27th 27th 26th 27th 26th 25th 27th 26th 21st 1,200.00
Organize Quarterly review
meetings
31st 30th 30th 18th 2,400.00
M&E Quarterly Reports 7th 9th 9th 9th 600.00
Conduct M&E Capacity Building
for core staff at DPCU
19th 2,000.00
Prepare for APR preparation 15th 300.00
Data Collection 19th 3,000.00
Data Collation 20th 2,000.00
Data analysis 13th 1,500.00
Organize APR validation
workshop
24th 2,200.00
Internal Review of APR 15th 500.00
Print APR 11th 500.00
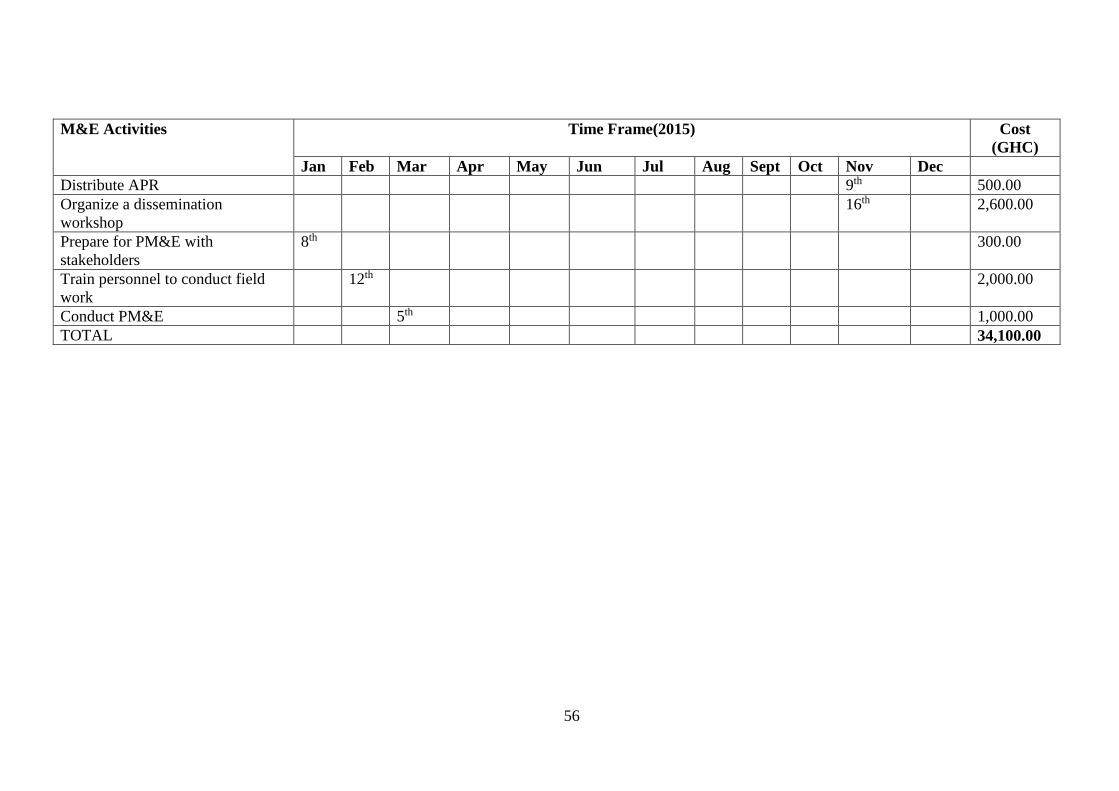
56
M&E Activities Time Frame(2015) Cost
(GHC)
Jan Feb Mar Apr May Jun Jul Aug Sept Oct Nov Dec
Distribute APR 9th 500.00
Organize a dissemination
workshop
16th 2,600.00
Prepare for PM&E with
stakeholders
8th 300.00
Train personnel to conduct field
work
12th 2,000.00
Conduct PM&E 5th 1,000.00
TOTAL 34,100.00

57
Table 2.5(b3): M&E Calendar for 2016 fiscal year
M&E Activities Time Frame(2016) Cost
(GHC)
Jan Feb Mar Apr May Jun Jul Aug Sept Oct Nov Dec
Prepare for M&E indicator review 15th 500.00
Organize workshop on indicator
review
10th 2,800.00
Field visit 24th 24th 23rd 19th 8,200.00
M&E Monthly Reports 28th 26th 28th 27th 27th 27th 27th 26th 27th 27th 28th 21st 1,200.00
Organize Quarterly review
meetings
31st 30th 30th 22nd 2,400.00
M&E Quarterly Reports 6th 7th 9th 10th 600.00
Conduct M&E Capacity Building
for core staff at DPCU
15th 2,000.00
Prepare for APR preparation 12th 300.00
Data Collection 16th 3,000.00
Data Collation 21st 2,000.00
Data analysis 11th 1,500.00
Organize APR validation
workshop
25th 2,200.00
Internal Review of APR 16th 500.00
Print APR 6th 500.00
Distribute APR 7th 500.00
Organize a dissemination
workshop
28th 2,600.00
Prepare for PM&E with
stakeholders
7th 300.00
Train personnel to conduct field
work
15th 2,000.00

58
M&E Activities Time Frame(2016) Cost
(GHC)
Jan Feb Mar Apr May Jun Jul Aug Sept Oct Nov Dec
Conduct PM&E 10th 1,000.00
Mid Term Evaluation of DMTDP 29th 6,000.00
TOTAL 40,100.00
Table 2.5(b4): M&E Calendar for 2017 fiscal year
M&E Activities Time Frame(2017) Cost
(GHC)
Jan Feb Mar Apr May Jun Jul Aug Sept Oct Nov Dec
Prepare for M&E indicator
review
10th 500.00
Organize workshop on
indicator review
15th 2,800.00
Field visit 23rd 23rd 25th 18th 7,500.00
M&E Monthly Reports 27th 24th 27th 26th 26th 26th 27th 28th 27th 26th 27th 20th 1,200.00
Organize Quarterly review
meetings
30th 30th 29th 21st 2,400.00
M&E Quarterly Reports 6th 600.00
Conduct M&E Capacity
Building for core staff at
DPCU
15th 2,000.00
Prepare for APR preparation 16th 300.00
Data Collection 15th 3,000.00
Data Collation 13th 2,000.00
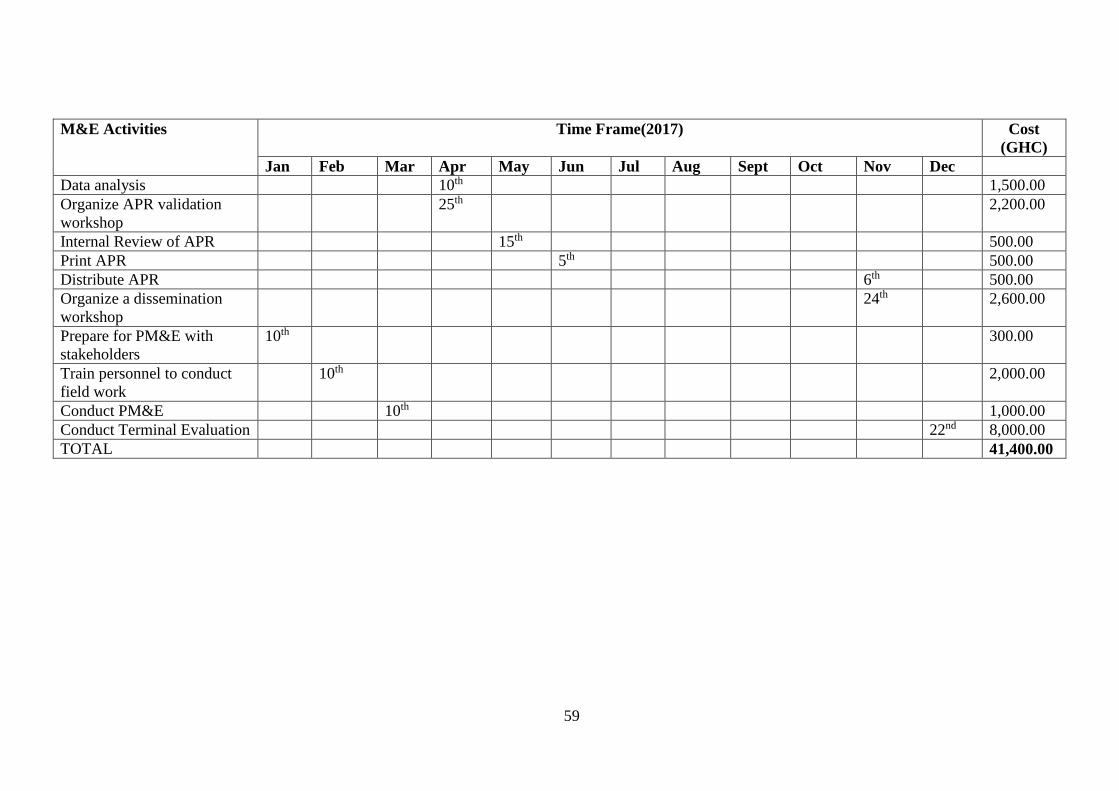
59
M&E Activities Time Frame(2017) Cost
(GHC)
Jan Feb Mar Apr May Jun Jul Aug Sept Oct Nov Dec
Data analysis 10th 1,500.00
Organize APR validation
workshop
25th 2,200.00
Internal Review of APR 15th 500.00
Print APR 5th 500.00
Distribute APR 6th 500.00
Organize a dissemination
workshop
24th 2,600.00
Prepare for PM&E with
stakeholders
10th 300.00
Train personnel to conduct
field work
10th 2,000.00
Conduct PM&E 10th 1,000.00
Conduct Terminal Evaluation 22nd 8,000.00
TOTAL 41,400.00

60
2.6 M&E Budget
The Budget as shown table 2.6 indicates the resource requirement of the DPCU in
undertaking M&E activities yearly. The budget covers the procurement of logistics
like computer accessories, payment of allowances on field visit, data collection, and
desk work activities, per diem, payment for recruitment of consultants for purposes,
cost of training material among others. The cost of servicing of meetings with
stakeholders and development partners and holding of public hearing forum and other
related activities are also captured in the budget. The total M&E budget is estimated
to cost One Hundred and forty-seven Thousand, Six Hundred Ghana Cedis
(GH₵147,600.00).
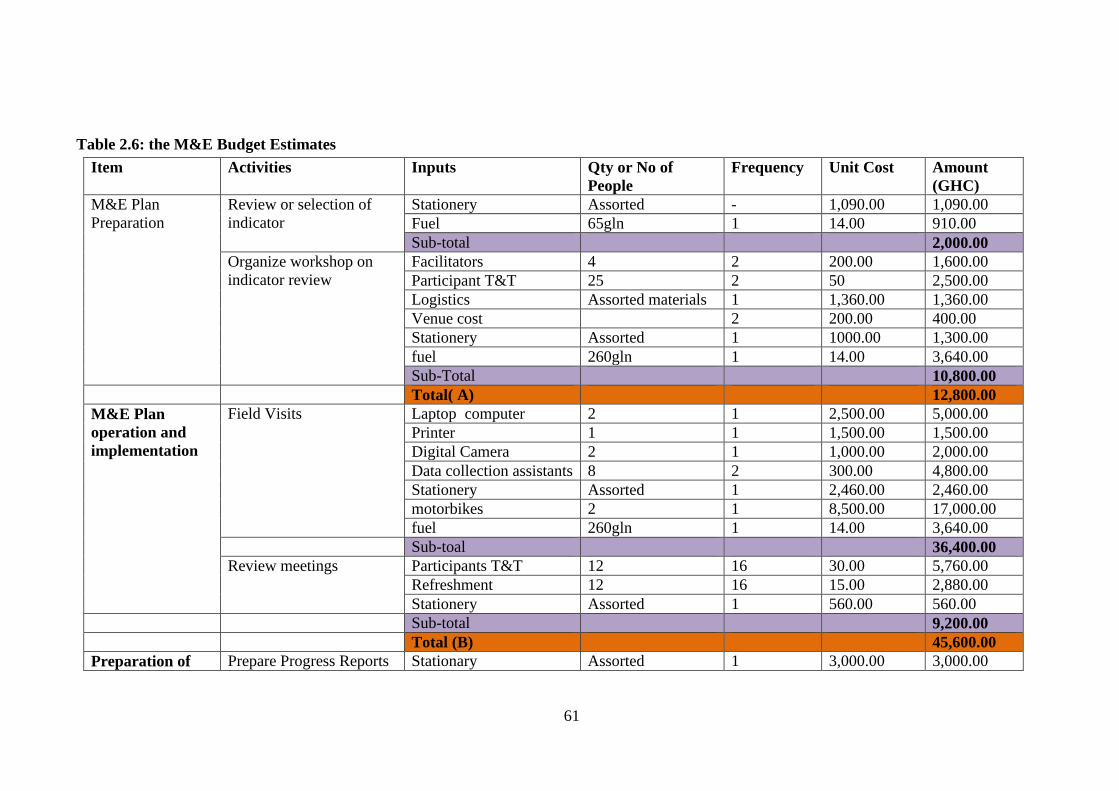
61
Table 2.6: the M&E Budget Estimates
Item Activities Inputs Qty or No of
People
Frequency Unit Cost Amount
(GHC)
M&E Plan
Preparation
Review or selection of
indicator
Stationery Assorted - 1,090.00 1,090.00
Fuel 65gln 1 14.00 910.00
Sub-total 2,000.00
Organize workshop on
indicator review
Facilitators 4 2 200.00 1,600.00
Participant T&T 25 2 50 2,500.00
Logistics Assorted materials 1 1,360.00 1,360.00
Venue cost 2 200.00 400.00
Stationery Assorted 1 1000.00 1,300.00
fuel 260gln 1 14.00 3,640.00
Sub-Total 10,800.00
Total( A) 12,800.00
M&E Plan
operation and
implementation
Field Visits Laptop computer 2 1 2,500.00 5,000.00
Printer 1 1 1,500.00 1,500.00
Digital Camera 2 1 1,000.00 2,000.00
Data collection assistants 8 2 300.00 4,800.00
Stationery Assorted 1 2,460.00 2,460.00
motorbikes 2 1 8,500.00 17,000.00
fuel 260gln 1 14.00 3,640.00
Sub-toal 36,400.00
Review meetings Participants T&T 12 16 30.00 5,760.00
Refreshment 12 16 15.00 2,880.00
Stationery Assorted 1 560.00 560.00
Sub-total 9,200.00
Total (B) 45,600.00
Preparation of Prepare Progress Reports Stationary Assorted 1 3,000.00 3,000.00

62
Item Activities Inputs Qty or No of
People
Frequency Unit Cost Amount
(GHC)
M&E Reports Review & editorial cost 1 1 2,000.00 2,000.00
Secretariat services 1 1 2,200.00 2,200.00
Sub-total 7,200.00
Data collection, collation
and analysis
Data entry cost 1 1 3,800.00 3,800.00
Data cleaning & coding 1 1 3,800.00 3,800.00
Data validation 1 1 3,800.00 3,800.00
Data analysis 1 1 4,050.00 4,050.00
fuel 325gln 1 14.00 4,550.00
Stationery Assorted 1 10,000.00 10,000.00
Sub-total 30,000.00
Annual progress
Report(APR)
Stationery Assorted 1 5,000.00 5,000.00
Logistics Assorted materials 1 4,600.00 4,600.00
Facilitator 4 4 200.00 3,200.00
Sub-total 12,800.00
Total (C) 50,000.00
Dissemination
and
communication
of M&E Results
Organize APR
Dissemination Workshop
Facilitators 4 4 200.00 3,200.00
Participant T&T 25 4 50.00 5,000.00
Logistics Assorted materials 1 500.00 500.00
Stationery Assorted 1 390.00 390.00
fuel 65gln 1 14.00 910.00
Sub-total 10,000.00
Distribute APR to
relevant stakeholders
Fuel 65gln 1 14.00 910.00
T&T 1 4 100.00 400.00
Stationery Assorted 1 690.00 690.00
Sub-total 2,000.00
Total (D) 12,000.00
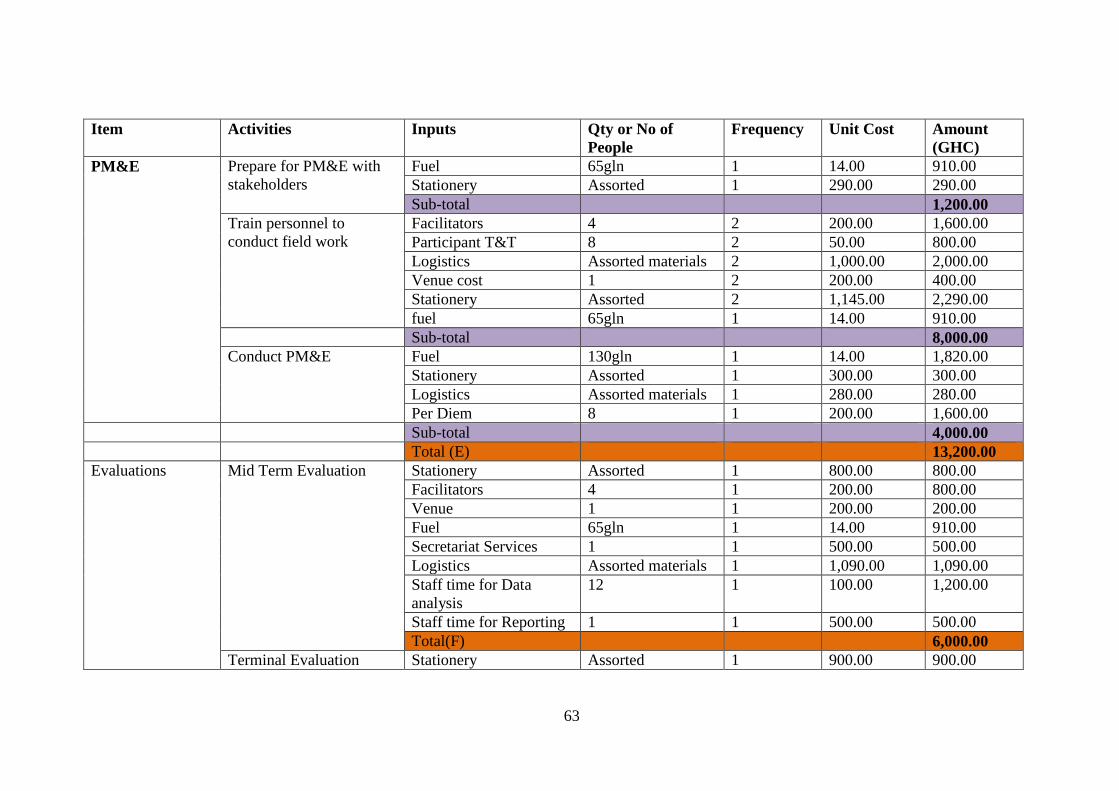
63
Item Activities Inputs Qty or No of
People
Frequency Unit Cost Amount
(GHC)
PM&E Prepare for PM&E with
stakeholders
Fuel 65gln 1 14.00 910.00
Stationery Assorted 1 290.00 290.00
Sub-total 1,200.00
Train personnel to
conduct field work
Facilitators 4 2 200.00 1,600.00
Participant T&T 8 2 50.00 800.00
Logistics Assorted materials 2 1,000.00 2,000.00
Venue cost 1 2 200.00 400.00
Stationery Assorted 2 1,145.00 2,290.00
fuel 65gln 1 14.00 910.00
Sub-total 8,000.00
Conduct PM&E Fuel 130gln 1 14.00 1,820.00
Stationery Assorted 1 300.00 300.00
Logistics Assorted materials 1 280.00 280.00
Per Diem 8 1 200.00 1,600.00
Sub-total 4,000.00
Total (E) 13,200.00
Evaluations Mid Term Evaluation Stationery Assorted 1 800.00 800.00
Facilitators 4 1 200.00 800.00
Venue 1 1 200.00 200.00
Fuel 65gln 1 14.00 910.00
Secretariat Services 1 1 500.00 500.00
Logistics Assorted materials 1 1,090.00 1,090.00
Staff time for Data
analysis
12 1 100.00 1,200.00
Staff time for Reporting 1 1 500.00 500.00
Total(F) 6,000.00
Terminal Evaluation Stationery Assorted 1 900.00 900.00
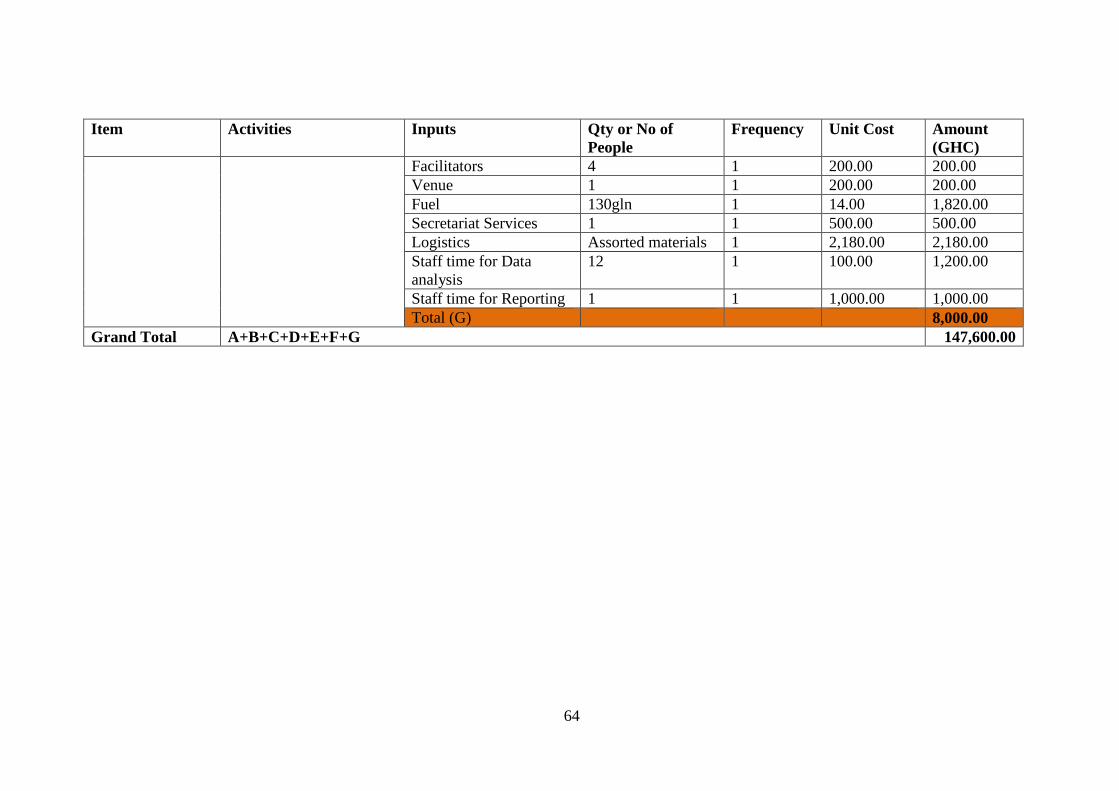
64
Item Activities Inputs Qty or No of
People
Frequency Unit Cost Amount
(GHC)
Facilitators 4 1 200.00 200.00
Venue 1 1 200.00 200.00
Fuel 130gln 1 14.00 1,820.00
Secretariat Services 1 1 500.00 500.00
Logistics Assorted materials 1 2,180.00 2,180.00
Staff time for Data
analysis
12 1 100.00 1,200.00
Staff time for Reporting 1 1 1,000.00 1,000.00
Total (G) 8,000.00
Grand Total A+B+C+D+E+F+G 147,600.00

65
2.7 Data Collection, Collation and Analyses
Data gathering is the basis for planning and M&E process. As such, base line
information on the district potentials, development problems and challenges, social
infrastructure, economic, population, and needs assessment and among others would
therefore serve as useful basis for projections in the future.
The DPCU will collect, collate and analyze data from field visits, sector departments
and other relevant sources to generate quarterly and annual reports for dissemination
to the relevant stakeholders.
The DPCU will prepare and administer questionnaires, checklist and interview guides
in collaboration with Area/Town Councils and Unit committees and Assembly
members to collect primary data. The DPCU will do this through community
meetings, observations and interviews.
Secondary data and other category of data will be generated from periodic reports and
publications of sector departments, government agencies, NGOs and other civic
unions/Associations.
2.7.1 Reporting and Information Dissemination
Information generated from data analyzed-- from primary and secondary data and
periodic reports from sector departments will be made available to the relevant
stakeholders during, after monitoring and after plan period.
Reports so generated are to be presented to Management and District Assembly at
their periodic sittings and at public hearings. Findings and recommendations,
thereafter, are to be presented to the appropriate departments, agencies and
institutions for the necessary actions.
At the upstream level, the DPCU must forward copies of all quarterly and APR
reports to the RPCU for onward submission to the NDPC and other MDAs.
At the downstream level, dissemination of M&E reports is meant to increase
accountability and transparency of the DA as well as displaying commitment to
development and poverty reduction. The DPCU is aware that a significant number of
stakeholders and beneficiaries are semi-illiterate or illiterate and has therefore

66
proposed simple dissemination strategies which have far-reaching effects on its
audiences. These strategies include the following;
1. Use of information vans and FM stations or information centres to announce,
discuss and broadcast content of M&E reports using largely local languages
2. Organization of public hearings, holding of community meetings/durbars/fora
at central locations throughout the District to disseminate M&E information
3. Meeting with traditional authorities, community opinion leaders, Area
Councils, Unit Committees so that they can in turn send the messages to their
communities
2.8 Development Evaluation
Development Evaluation is the analysis of observations made in the course of
monitoring the impact and performance of a development project, and the extent to
which they fulfill set objectives. It is the periodic assessment and review of the extent
to which the goal and objectives of an activity have been accomplished.
The DPCU will conduct the three key types of development evaluation namely:
Ex-ante Evaluation: evaluation conducted prior to commencement of
development programme/project implementation and will aim at reviewing the
intended plan (goals and objectives) of the programme/project
Mid-term/Interim Evaluation: evaluation undertaken at periodic intervals
during the implementation stage
Ex-Poste/Terminal Evaluation: evaluation carried out after development
programme/project implementation.
In all these, the essence will be:
To judge the worth of on-going programs and to estimate the usefulness of
attempts to improve them.
To assess the utility of new programs and initiatives.
To increase the effectiveness of program management and administration.
To satisfy the accountability requirements of program sponsors.
To document lessons learnt for future reference.
67
Stakeholders to be involved in conduct of development evaluation will include, but
not limited to:
Internal evaluators (e.g. community leaders and members)
External evaluators (e.g. DA staff, heads of decentralised departments,
development partners and consultants, RCC)
Project Beneficiaries
In addition to the above, the DPCU will consider with urgency to carry out and/or
commission other studies such as district poverty profiling and mapping, beneficiary
assessment, social infrastructure audit of development projects, strategic evaluation,
impact assessment and thematic evaluation studies.
2.9 Participatory Monitoring and Evaluation
Participatory M&E is a bottom-up approach involving the beneficiaries and relevant
stakeholders actively in the M&E planning processes and activities. By taking part in
the M&E processes and activities, community level participants gain a deeper
understanding of programme/project progress, strengths so that they contribute more
to the success of the programme / project and thus own their work and eventually
have positive impact on their lives.
The DPCU, in ensuring Participatory M&E will adhere to the following requirements.
1. Plan the M&E exercise with community representatives
- Agree on goals, objectives and expected outputs of the M&E exercise
- Agree on methodology to adopt and who should be involved
- Identify who should be involved in the M&E exercise and bring them
together on time
- Agree on duration for conduct of monitoring or evaluation (start and finish
dates)
- Agree on utilization of the information collected
2. Involve representatives in resource mobilization (funds, inputs, other
logistics
3. Involve participants/community representatives in Field data collection
and inspections
4. Circulate M&E reports, decide on actions etc with community
representatives
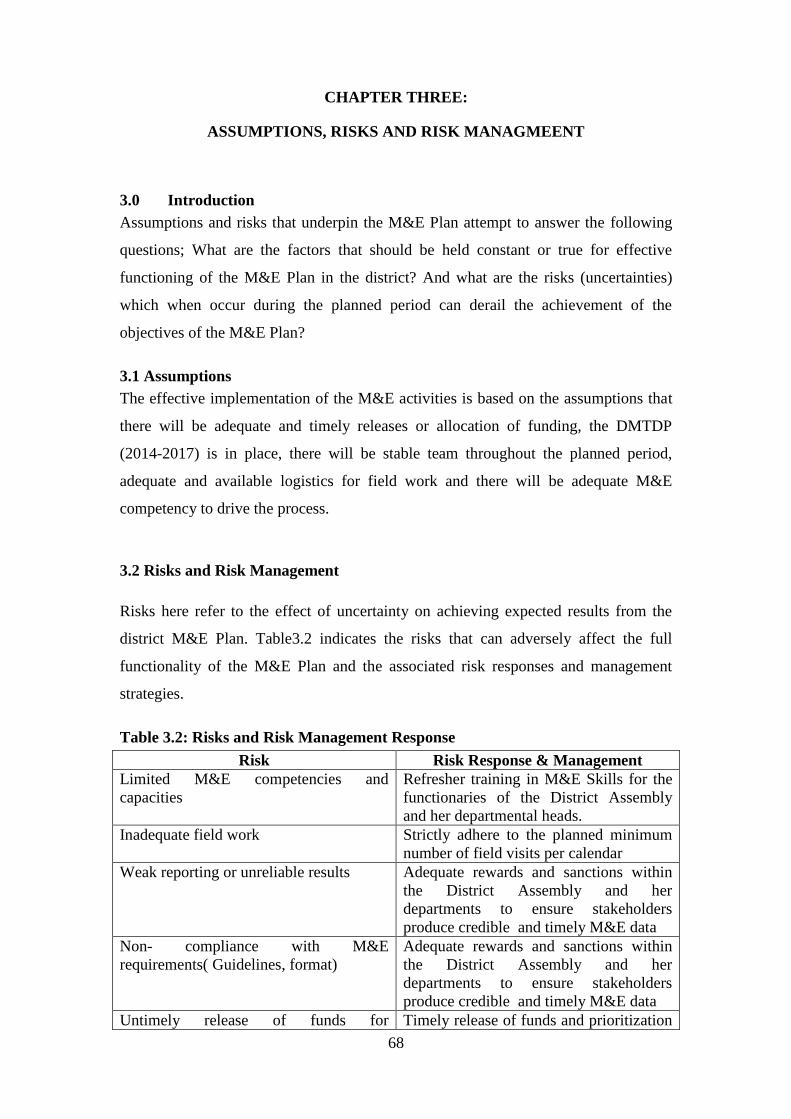
68
CHAPTER THREE:
ASSUMPTIONS, RISKS AND RISK MANAGMEENT
3.0 Introduction
Assumptions and risks that underpin the M&E Plan attempt to answer the following
questions; What are the factors that should be held constant or true for effective
functioning of the M&E Plan in the district? And what are the risks (uncertainties)
which when occur during the planned period can derail the achievement of the
objectives of the M&E Plan?
3.1 Assumptions
The effective implementation of the M&E activities is based on the assumptions that
there will be adequate and timely releases or allocation of funding, the DMTDP
(2014-2017) is in place, there will be stable team throughout the planned period,
adequate and available logistics for field work and there will be adequate M&E
competency to drive the process.
3.2 Risks and Risk Management
Risks here refer to the effect of uncertainty on achieving expected results from the
district M&E Plan. Table3.2 indicates the risks that can adversely affect the full
functionality of the M&E Plan and the associated risk responses and management
strategies.
Table 3.2: Risks and Risk Management Response
Risk Risk Response & Management
Limited M&E competencies and
capacities
Refresher training in M&E Skills for the
functionaries of the District Assembly
and her departmental heads.
Inadequate field work Strictly adhere to the planned minimum
number of field visits per calendar
Weak reporting or unreliable results Adequate rewards and sanctions within
the District Assembly and her
departments to ensure stakeholders
produce credible and timely M&E data
Non- compliance with M&E
requirements( Guidelines, format)
Adequate rewards and sanctions within
the District Assembly and her
departments to ensure stakeholders
produce credible and timely M&E data
Untimely release of funds for Timely release of funds and prioritization
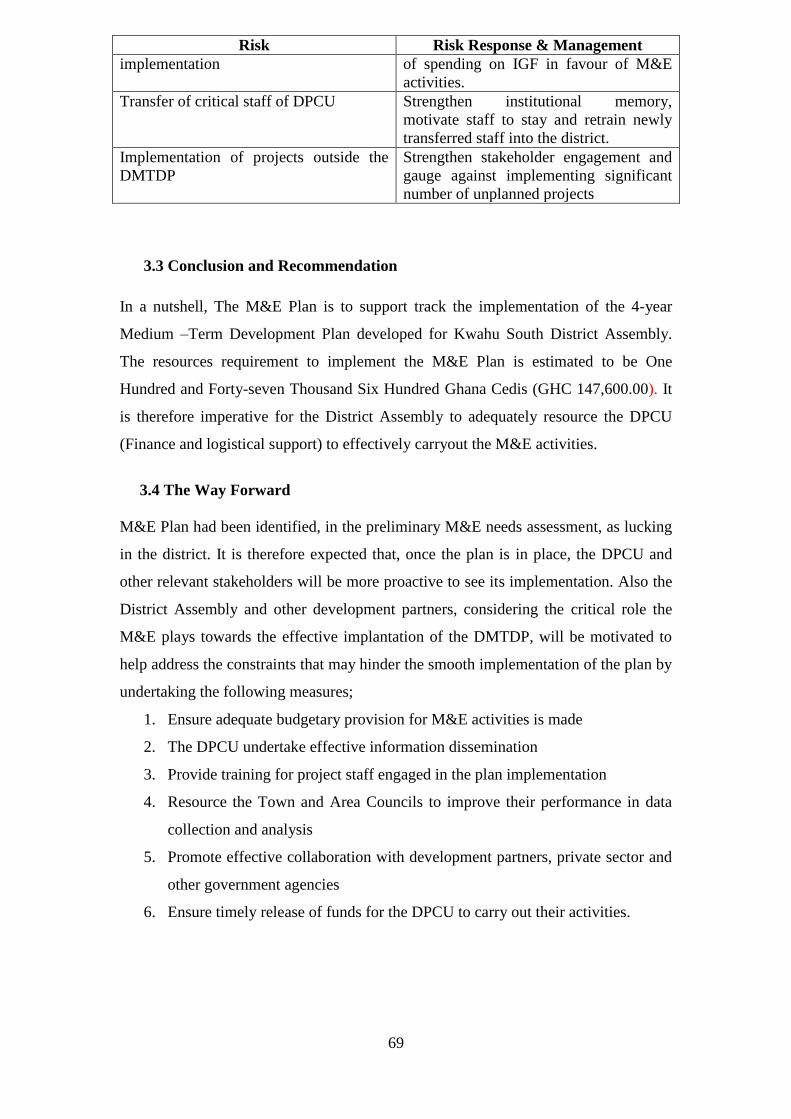
69
Risk Risk Response & Management
implementation of spending on IGF in favour of M&E
activities.
Transfer of critical staff of DPCU Strengthen institutional memory,
motivate staff to stay and retrain newly
transferred staff into the district.
Implementation of projects outside the
DMTDP
Strengthen stakeholder engagement and
gauge against implementing significant
number of unplanned projects
3.3 Conclusion and Recommendation
In a nutshell, The M&E Plan is to support track the implementation of the 4-year
Medium –Term Development Plan developed for Kwahu South District Assembly.
The resources requirement to implement the M&E Plan is estimated to be One
Hundred and Forty-seven Thousand Six Hundred Ghana Cedis (GHC 147,600.00). It
is therefore imperative for the District Assembly to adequately resource the DPCU
(Finance and logistical support) to effectively carryout the M&E activities.
3.4 The Way Forward
M&E Plan had been identified, in the preliminary M&E needs assessment, as lucking
in the district. It is therefore expected that, once the plan is in place, the DPCU and
other relevant stakeholders will be more proactive to see its implementation. Also the
District Assembly and other development partners, considering the critical role the
M&E plays towards the effective implantation of the DMTDP, will be motivated to
help address the constraints that may hinder the smooth implementation of the plan by
undertaking the following measures;
1. Ensure adequate budgetary provision for M&E activities is made
2. The DPCU undertake effective information dissemination
3. Provide training for project staff engaged in the plan implementation
4. Resource the Town and Area Councils to improve their performance in data
collection and analysis
5. Promote effective collaboration with development partners, private sector and
other government agencies
6. Ensure timely release of funds for the DPCU to carry out their activities.

70
Related Documents