24/10/2013 Extract KS1 Analysis 2013 v4 Final Report [email protected] KS1 Results 2013 Analysis Example Primary School Contact us on: 0844 963 2242 (Office number) 07917 080201 (Andrew Best) For the latest schools data information follow us: on the web: www.forschoolseducation.co.uk on twitter: @infoforschools [www.twitter.com/infoforschools] Join our data email newsgroup by emailing: 1

Welcome message from author
This document is posted to help you gain knowledge. Please leave a comment to let me know what you think about it! Share it to your friends and learn new things together.
Transcript

24/10/2013 Extract KS1 Analysis 2013 v4 Final Report
KS1 Results 2013 Analysis
ExamplePrimary School
Contact us on:0844 963 2242 (Office number)07917 080201 (Andrew Best)
For the latest schools data information follow us:
on the web: www.forschoolseducation.co.ukon twitter: @infoforschools [www.twitter.com/infoforschools]
Join our data email newsgroup by emailing:
1
24/10/2013 Extract KS1 Analysis 2013 v4 Final Report
Grade:
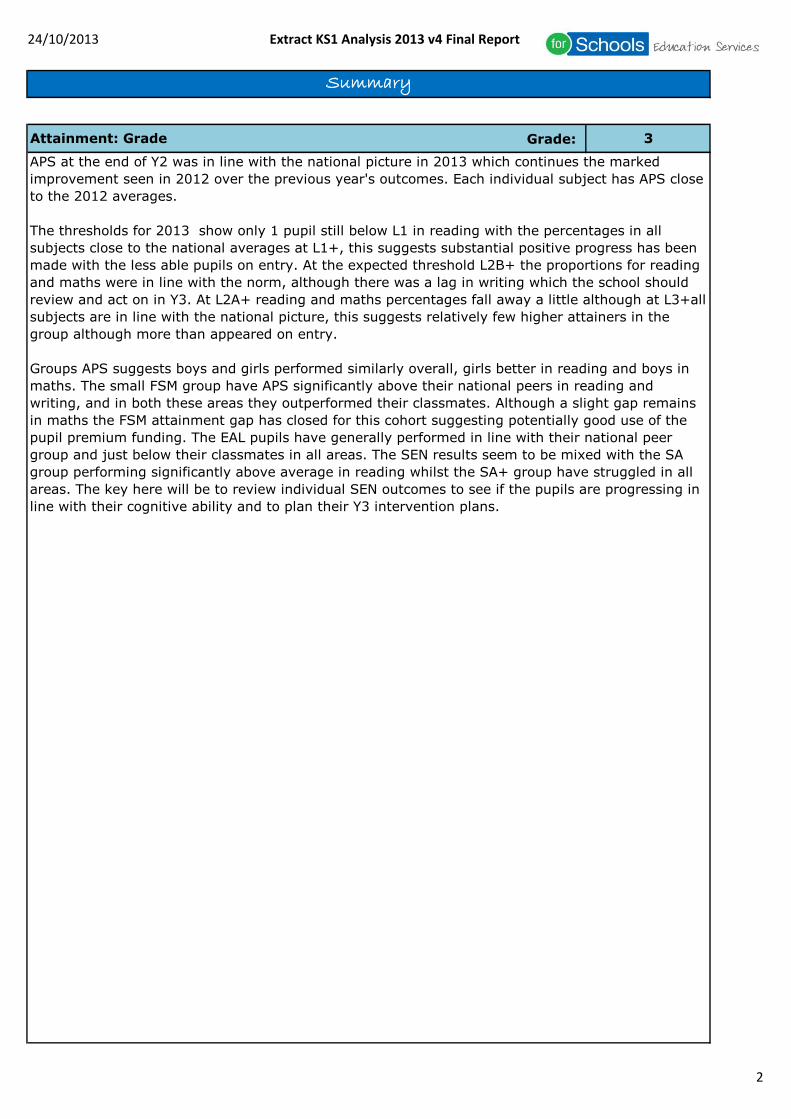
Summary
3Attainment: Grade
APS at the end of Y2 was in line with the national picture in 2013 which continues the marked
improvement seen in 2012 over the previous year's outcomes. Each individual subject has APS close
to the 2012 averages.
The thresholds for 2013 show only 1 pupil still below L1 in reading with the percentages in all
subjects close to the national averages at L1+, this suggests substantial positive progress has been
made with the less able pupils on entry. At the expected threshold L2B+ the proportions for reading
and maths were in line with the norm, although there was a lag in writing which the school should
review and act on in Y3. At L2A+ reading and maths percentages fall away a little although at L3+all
subjects are in line with the national picture, this suggests relatively few higher attainers in the
group although more than appeared on entry.
Groups APS suggests boys and girls performed similarly overall, girls better in reading and boys in
maths. The small FSM group have APS significantly above their national peers in reading and
writing, and in both these areas they outperformed their classmates. Although a slight gap remains
in maths the FSM attainment gap has closed for this cohort suggesting potentially good use of the
pupil premium funding. The EAL pupils have generally performed in line with their national peer
group and just below their classmates in all areas. The SEN results seem to be mixed with the SA
group performing significantly above average in reading whilst the SA+ group have struggled in all
areas. The key here will be to review individual SEN outcomes to see if the pupils are progressing in
line with their cognitive ability and to plan their Y3 intervention plans.
2

24/10/2013 Extract KS1 Analysis 2013 v4 Final Report
Grade:Progress 2
The progress made in KS1 by the 2013 cohort appears strong with all subjects showing above
average points progress from the Y1 baselines for the 27 pupils who were with the school from the
beginning of Y1. On average the group seem to have made a terms more progress in KS1 than is
expected. The proportions making expected progress are stronger in reading and maths than in
writing reflecting the fact that the groups writing levels on exit from Reception and on entry into
KS1 seemed unusually strong compared to their reading and maths levels.
The EYFSP to end KS1 transition tables suggest strong progress as been made by the group since
Reception in reading and maths with more than half the cohort making more than expected
progress. The writing proportions are slightly weaker although the EYFSP starting points for writing
seem high when compared to the other scales. All 4 FSM pupils made expected progress in maths
and they also did well in reading but progress in this group in writing was more of a concern. The
same can be said for the SEN pupils although only 1 out of 7 pupils made expected progress in
writing their progress in reading and maths was better. The EAL pupils seem to have shown good
progress in all subjects from the end of Reception.
Progress measured from Y1 baselines shown in the transition tables supports the progress seen from
EY and highlights that it is mainly the lower ability (mainly SEN) pupils who have struggled to make
expected progress. Very few SEN pupils made more than expected progress in any subject. The 4
FSM pupils had average progress in reading and maths and weaker progress in writing. The EAL
again demonstrated good progress in all subjects.
The group analysis of pupils making 8 or more points progress from the Y1 baseline assessments
supports a view of good progress. Boys have shown proportionally more progress than girls in both
reading and writing. Only 2 of the 4 FSM pupils have shown this level of progress, whilst 5 of the 6
EAL pupils have. The SEN pupils have made weaker progress by this measure in writing than
reading. In maths again more boys than girls showed 8+ points progress. Also only half the FSM
pupils made this progress whilst 5 of the 6 EAL pupils did. The SEN pupil progress was mixed with
just over half making the 8+ points progress.
3
24/10/2013 Extract KS1 Analysis 2013 v4 Final Report
Grade:
Grade guidance throughout this report:
1 - Outstanding
2 - Good
3 - Requires Improvement
4 - Inadequate/Weak
In some cases individual measures (or groups of measures) may be shown to be on the border of 2
judgements e.g. 2 or 3, or to be predominantly one grade with aspects of another - e.g. 3 (2).
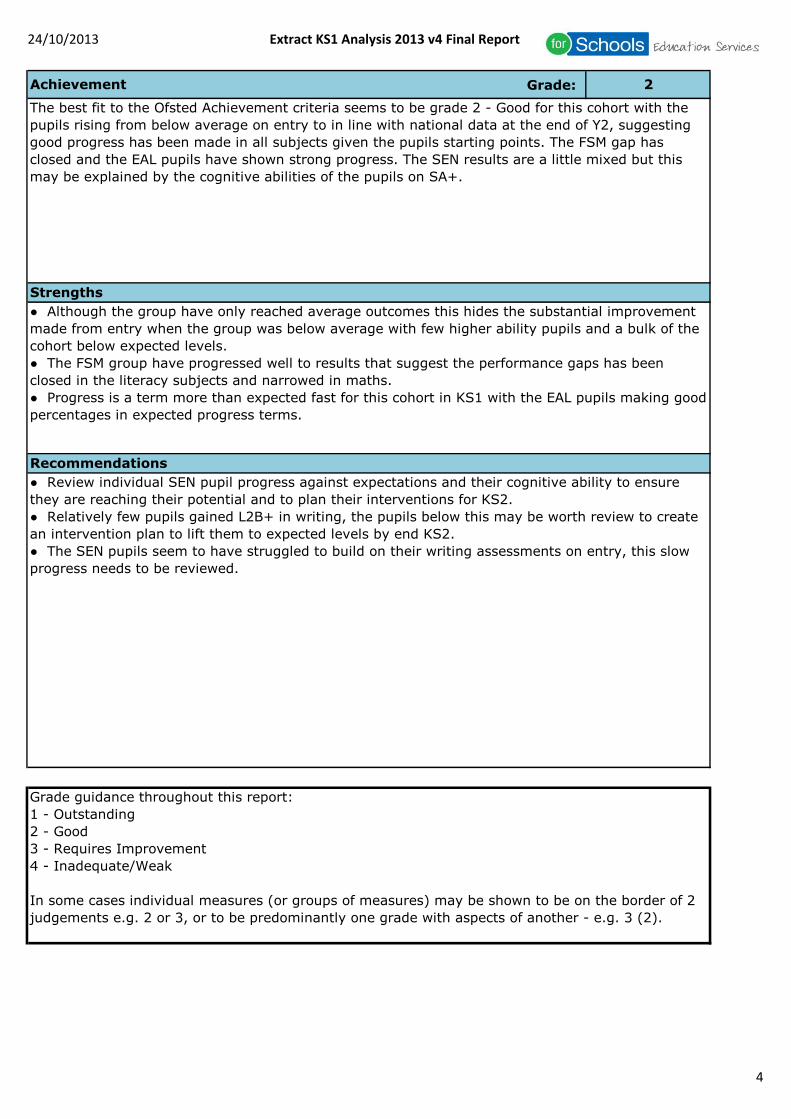
● Although the group have only reached average outcomes this hides the substantial improvement
made from entry when the group was below average with few higher ability pupils and a bulk of the
cohort below expected levels.
● The FSM group have progressed well to results that suggest the performance gaps has been
closed in the literacy subjects and narrowed in maths.
● Progress is a term more than expected fast for this cohort in KS1 with the EAL pupils making good
percentages in expected progress terms.
Recommendations
● Review individual SEN pupil progress against expectations and their cognitive ability to ensure
they are reaching their potential and to plan their interventions for KS2.
● Relatively few pupils gained L2B+ in writing, the pupils below this may be worth review to create
an intervention plan to lift them to expected levels by end KS2.
● The SEN pupils seem to have struggled to build on their writing assessments on entry, this slow
progress needs to be reviewed.
Strengths
Achievement 2
The best fit to the Ofsted Achievement criteria seems to be grade 2 - Good for this cohort with the
pupils rising from below average on entry to in line with national data at the end of Y2, suggesting
good progress has been made in all subjects given the pupils starting points. The FSM gap has
closed and the EAL pupils have shown strong progress. The SEN results are a little mixed but this
may be explained by the cognitive abilities of the pupils on SA+.
4

24/10/2013 Extract KS1 Analysis 2013 v4 Final Report
X
X
X
N/A
X
N/A
√
N/A
√
√
N/A
√
N/A
Good
(2)
Taking account of their different starting points, the proportions of pupils making and
exceeding expected progress compare favourably with national figures.
Where the proportion making expected progress overall is lower than that found
nationally, it is improving over a sustained period.
Progress across year groups in a wide range of subjects is consistently strong and
evidence in pupils’ work indicates that they achieve well.
The learning and progress of groups of pupils, particularly those who are disabled,
those who have special educational needs, and those for whom the pupil premium
provides support, are good.
Performance will exceed floor standards .
The standards of attainment of the large majority of groups of pupils are likely to be
at least in line with national averages .
Where attainment, including attainment in reading in primary schools, is low overall, it
is improving at a faster rate than nationally, over a sustained period.
Achievement Criteria Evaluation
In making their judgements about Achievement, Inspectors are required to weigh up the evidence and to consider it
against the descriptors for outstanding, good, requires improvement or inadequate before making a professional
judgement. Inspectors must consider which descriptor best fits the evidence available. When evidence indicates that any
of the bullet points in the descriptor for inadequate applies, then Achievement is likely to be judged inadequate. The
descriptors used here to evaluate Achievement align to the September 2012 Ofsted grade descriptors but For Schools
has added the descriptors in italics to aid evaluation. Please note only those Ofsted descriptors relating specifically to
data are included here.
The descriptors in the following table have been separated and then colour coded where possible to show the similar
descriptors at each grade.
Outstanding
(1)
Taking account of their different starting points, the proportions of pupils making and
exceeding expected progress are high compared with national figures.
Pupils make rapid and sustained progress throughout year groups across many
subjects, including English and mathematics, and learn exceptionally well.
The learning, quality of work and progress of groups of pupils, particularly those who
are disabled, those who have special educational needs and those for whom the pupil
premium provides support, show that they achieve exceptionally well.
Performance will exceed floor standards .
The standards of attainment of almost all groups of pupils are likely to be at least in
line with national averages with many pupils attaining above this.
In exceptional circumstances, an outstanding grade can be awarded where standards of
attainment of any group of pupils are below those of all pupils nationally, but the gap
is closing rapidly, as shown by trends in a range of attainment indicators. This may
include attainment in reading.
5

24/10/2013 Extract KS1 Analysis 2013 v4 Final Report
√+
√+
√+
N/A
√
√+
X
X
X
X
X
Inadequate
(4)
Achievement is likely to be inadequate if any of the following apply:
Pupils overall, or particular groups of pupils, are consistently making less than
expected progress given their starting points.
Pupils’ learning and progress in any key subject or key stage, including the sixth form
or the Early Years Foundation Stage, indicate they are underachieving.
Disabled pupils and/or those who have special educational needs and/or those for
whom the pupil premium provides support, are underachieving.
Attainment is consistently below floor standards or is in decline and shows little,
fragile or inconsistent improvement.
There are wide gaps in the attainment and/or the learning and progress of different
groups.
Achievement Criteria Evaluation
Requires
Improvement
(3)
Taking account of their different starting points , the proportions of pupils making and
exceeding expected progress are broadly in line with national figures .
Progress across year groups in a wide range of subjects is similar to that seen
nationally .
The learning and progress of groups of pupils, particularly those who are disabled ,
those who have special educational needs , and those for whom the pupil premium
provides support, is in line with that seen nationally .
Performance is usually at least in line with floor standards .
The standards of attainment of the majority of groups of pupils are likely to be in
line with national averages .
There remain some gaps in the attainment and/or the learning and progress of
different groups , despite some closing of the gap.
6
24/10/2013 Extract KS1 Analysis 2013 v4 Final Report
Year 2
School
Figure
Mean Mean Median
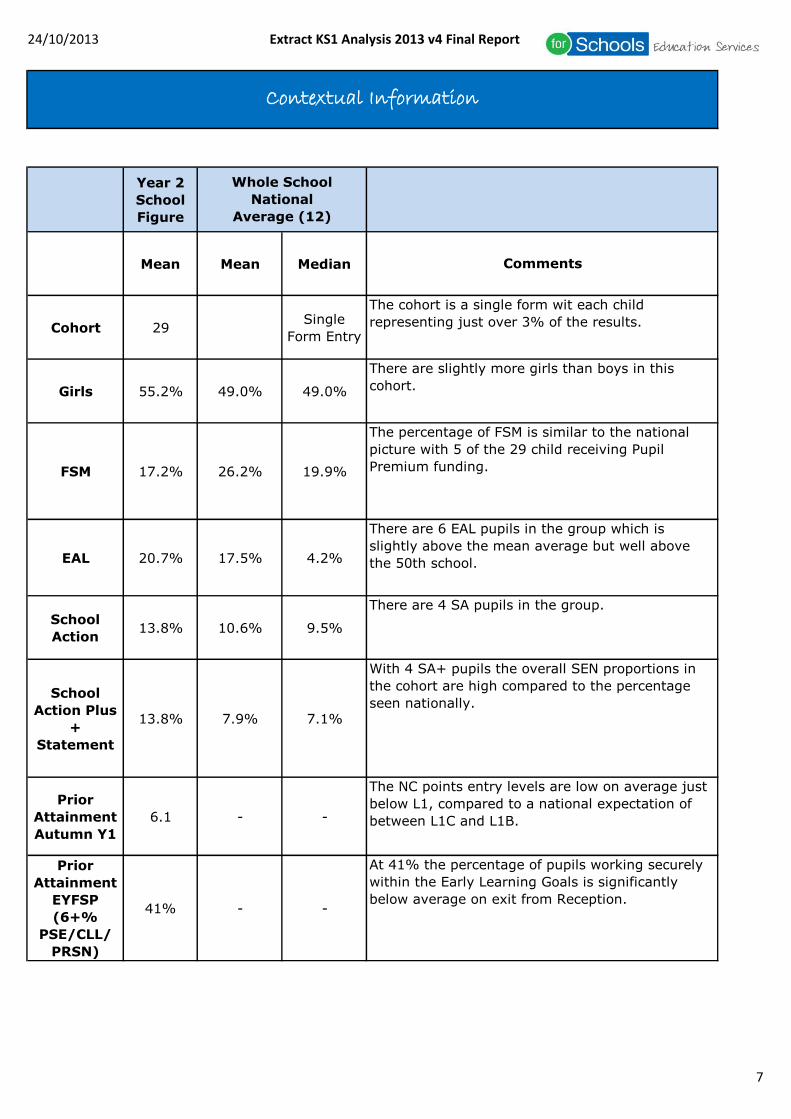
Cohort 29Single
Form Entry
Girls 55.2% 49.0% 49.0%
FSM 17.2% 26.2% 19.9%
EAL 20.7% 17.5% 4.2%
School
Action13.8% 10.6% 9.5%
School
Action Plus
+
Statement
13.8% 7.9% 7.1%
Prior
Attainment
Autumn Y1
6.1 - -
Prior
Attainment
EYFSP
(6+%
PSE/CLL/
PRSN)
41% - -
Whole School
National
Average (12)
Contextual Information
There are 4 SA pupils in the group.
With 4 SA+ pupils the overall SEN proportions in
the cohort are high compared to the percentage
seen nationally.
At 41% the percentage of pupils working securely
within the Early Learning Goals is significantly
below average on exit from Reception.
The NC points entry levels are low on average just
below L1, compared to a national expectation of
between L1C and L1B.
Comments
The cohort is a single form wit each child
representing just over 3% of the results.
There are slightly more girls than boys in this
cohort.
The percentage of FSM is similar to the national
picture with 5 of the 29 child receiving Pupil
Premium funding.
There are 6 EAL pupils in the group which is
slightly above the mean average but well above
the 50th school.
7

Table Description: Key:
- School proportion below national figure
- School proportion above national figure
0 1-3 4-8 9 6+ 0 1-3 4-8 9 6+ 0 1-3 4-8 9 6+
Girls PSE: DA 0 0 93 7 93 14 0 1 85 14 94 0 -1 8 -7 -1
PSE: SD 0 0 100 0 86 0 1 87 11 91 0 -1 13 -11 -5
PSE: ED 0 0 100 0 93 0 2 87 11 88 0 -2 13 -11 5
CLL: LCT 0 0 100 0 86 0 2 87 10 90 0 -2 13 -10 -4
CLL: LSL 0 7 93 0 64 0 5 81 14 84 0 2 12 -14 -20
CLL: R 0 0 93 7 57 0 3 88 9 82 0 -3 5 -2 -25
CLL: W 0 21 79 0 64 0 6 87 7 77 0 15 -8 -7 -13
PSRN: NLC 0 7 93 0 71 0 2 83 15 92 0 5 10 -15 -21
PSRN: C 0 0 100 0 57 0 5 89 5 80 0 -5 11 -5 -23
PSRN: SSM 0 0 100 0 64 0 3 91 6 87 0 -3 9 -6 -23
KUW: KUW 0 0 100 0 57 0 3 94 3 86 0 -3 6 -3 -29
PD: PD 0 0 100 0 93 0 1 91 8 95 0 -1 9 -8 -2
CD: CD 0 0 100 0 71 0 1 94 5 90 0 -1 6 -5 -19
Boys PSE: DA 0 0 100 0 85 13 0 1 89 10 89 0 -1 11 -10 -4
PSE: SD 0 0 100 0 69 0 3 89 7 83 0 -3 11 -7 -14
PSE: ED 0 0 100 0 69 0 5 88 7 78 0 -5 12 -7 -9
CLL: LCT 0 0 100 0 46 0 4 88 7 82 0 -4 12 -7 -36
CLL: LSL 0 8 92 0 62 1 8 82 9 74 -1 0 10 -9 -12
CLL: R 0 0 100 0 46 0 6 87 6 71 0 -6 13 -6 -25
CLL: W 0 15 85 0 54 1 14 82 3 58 -1 1 3 -3 -4
PSRN: NLC 0 0 100 0 77 0 3 82 15 88 0 -3 18 -15 -11
PSRN: C 0 0 100 0 54 1 8 85 7 75 -1 -8 15 -7 -21
PSRN: SSM 0 0 100 0 62 0 5 88 7 82 0 -5 12 -7 -20
KUW: KUW 0 0 100 0 85 0 4 92 3 82 0 -4 8 -3 3
PD: PD 0 0 100 0 77 0 3 92 5 88 0 -3 8 -5 -11
CD: CD 0 0 100 0 85 0 3 95 2 77 0 -3 5 -2 8
ALL PSE: DA 0 0 96 4 89 27 0 1 87 12 91 0 -1 9 -8 -2
PSE: SD 0 0 100 0 78 0 2 88 9 87 0 -2 12 -9 -9
PSE: ED 0 0 100 0 81 0 4 87 9 83 0 -4 13 -9 -2
CLL: LCT 0 0 100 0 67 0 3 88 9 86 0 -3 12 -9 -19
CLL: LSL 0 7 93 0 63 0 7 82 11 79 0 0 11 -11 -16
CLL: R 0 0 96 4 52 0 5 87 7 76 0 -5 9 -3 -24
CLL: W 0 19 81 0 59 0 10 85 5 67 0 9 -4 -5 -8
PSRN: NLC 0 4 96 0 74 0 2 82 15 90 0 2 14 -15 -16
PSRN: C 0 0 100 0 56 1 7 87 6 78 -1 -7 13 -6 -22
PSRN: SSM 0 0 100 0 63 0 4 89 7 85 0 -4 11 -7 -22
KUW: KUW 0 0 100 0 70 0 3 93 3 84 0 -3 7 -3 -14
PD: PD 0 0 100 0 85 0 2 92 6 91 0 -2 8 -6 -6
CD: CD 0 0 100 0 78 0 2 94 3 83 0 -2 6 -3 -5
The table below summarises the schools EYFSP data for all children at the school at the end of the Reception Year by each of the 13
scales. Banding the results for children with 0, 1-3 - working towards the Early Learning Goals, 4-8 working in the Early Learning Goals or
9 working beyond the Early Learning Goals. The table also considers the proportion of the cohort working at 6+ the expected level at the
end of Reception Year. The table also shows the National equivalent figures for comparison purposes.
Prior Attainment - Comparison of the school EYFSP to the national data (end of Reception Year)
School National (2011) Comparison

Comments:
KEY:
PSE: DA Personal, social and emotional development: Dispositions and attitudes
PSE: SD Personal, social and emotional development: Social development
PSE: ED Personal, social and emotional development: Emotional development
CLL: LCT Communication, language and literacy: Language for communication and thinking
CLL: LSL Communication, language and literacy: Linking sounds and letters
CLL: R Communication, language and literacy: Reading
CLL: W Communication, language and literacy: Writing
PSRN: NLC Problem Solving, reasoning and numeracy: Numbers as labels and for counting
PSRN: C Problem Solving, reasoning and numeracy: Calculating
PSRN: SSM Problem Solving, reasoning and numeracy: Shape, space and measures
KUW Knowledge and understanding of the world
PD Physical development
CD Creative development
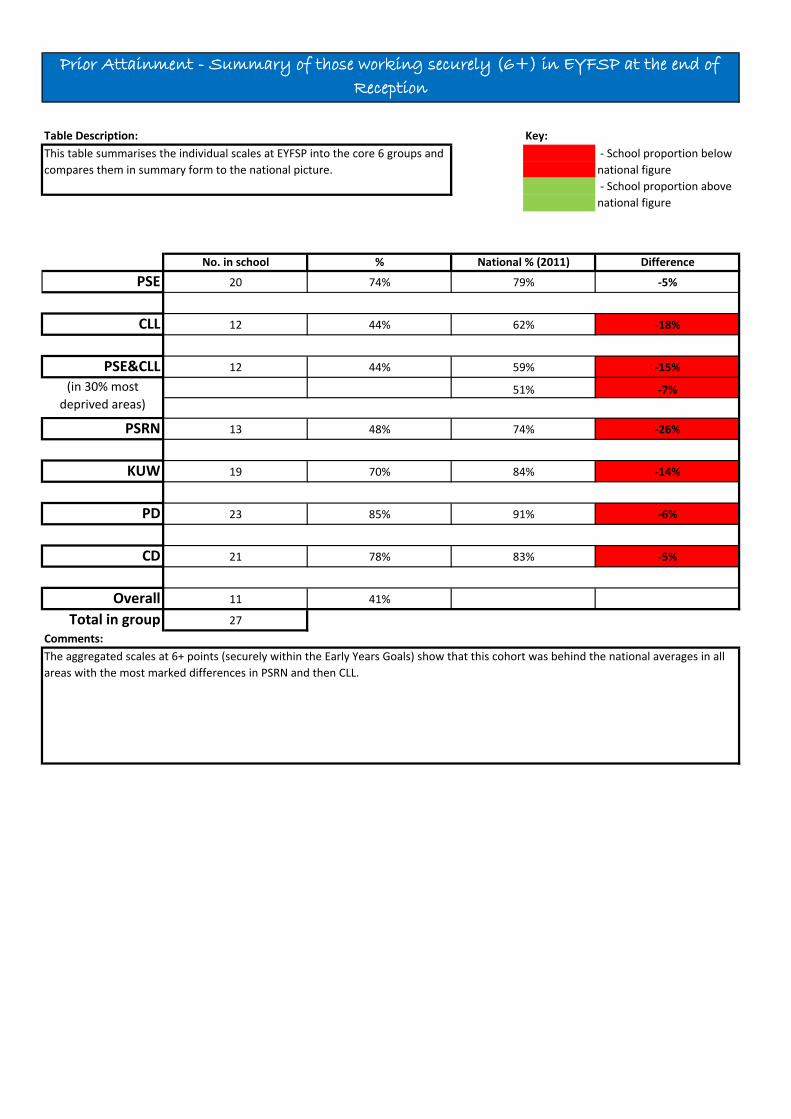
At the end of reception very few pupils were working below ELG in any scales although writing was the exception with 6 pupils below 4 points on the scale. However there were also very few pupils working
beyond the ELG on any of the scales (1 in Disposition and Attitude and 1 in reading) suggesting a lack of higher attainers in the group at this stage. Therefore on most scales the bulk of the cohort were
working within the ELG but the percentages working securely (6+ points) was below the national picture on all scales. The largest gaps to the national picture were in the CLL, PSRN and KUW scales. These
weaknesses were similar in both the boys and girls.
Prior Attainment - Comparison of the school EYFSP to the national data (end of Reception Year)
Key:
PSE
CLL
PSE&CLL
PSRN
KUW
PD
CD
Overall
Total in groupComments:
Difference
-26%
-14%
-6%
-5%
-7%
59%
62%
79% -5%
-18%
-15%
83%
91%
84%
23
21
11
27
(in 30% most
deprived areas)
74%
44%
44%
48%
70%
85%
78%
41%
13
19
51%
Table Description:
Prior Attainment - Summary of those working securely (6+) in EYFSP at the end of
Reception
The aggregated scales at 6+ points (securely within the Early Years Goals) show that this cohort was behind the national averages in all
areas with the most marked differences in PSRN and then CLL.
This table summarises the individual scales at EYFSP into the core 6 groups and
compares them in summary form to the national picture.
No. in school
- School proportion below
national figure
- School proportion above
national figure
20
12
12
National % (2011)%
74%

Table Description:
All L1C+ L1B+ L1A+ L2+Reading Cohort 27 27 13 9 3 0
School 5.8 100% 48% 33% 11% 0%
Writing Cohort 27 27 12 7 5 1
School 5.7 100% 44% 26% 19% 4%
Maths Cohort 27 27 19 12 0 0
School 6.7 100% 70% 44% 0% 0%
<1 L1C L1B L1A L2+Reading Cohort 27 14 4 6 3 0 27
School 5.8 52% 15% 22% 11% 0%
Writing Cohort 27 15 5 2 4 1 27
School 5.7 56% 19% 7% 15% 4%
Maths Cohort 27 8 7 12 0 0 27
School 6.7 30% 26% 44% 0% 0%
Comments:
Prior Attainment - Summary of Autumn (yr1) assessments
The first baseline assessments against the NC levels suggest that over half the cohort were working below L1 on entry into KS1 in
the literacy areas. There were no pupils working above L1B in maths which is consistent with the picture from the EYFSP with only
3 and 5 respectively doing so in reading and writing. The overall picture on entry to Y1 is of a below average cohort with a lack of
more able pupils.
Y1 Autumn
APSCumulative
Proportion at levelY1 Autumn
APS
This table shows the Average Points Score (APS) of the pupils who were in
Reception and remained through to the end of y2. Then it summarises, by
subject area, the proportion of pupils reaching each sub-level on a cumulative
and individual level basis.

24/10/2013 Extract KS1 Analysis 2013 v4 Final Report
Year 2009 2010 2011 2012 2013*
All Subjects Cohort 30 26 30 30 29School 14.7 14.3 13.1 15.4 15.4
National 15.2 15.2 15.3 15.5 15.5
Difference -0.5 -0.9 -2.2 -0.1 -0.1
Reading Cohort 30 26 30 30 29School 14.8 14.8 12.6 15.7 15.6
National 15.7 15.7 15.8 16.0 16.0
Difference -0.9 -0.9 -3.2 -0.3 -0.4
Writing Cohort 30 26 30 30 29School 14.0 13.7 12.7 14.6 14.9
National 14.3 14.4 14.4 14.7 14.7
Difference -0.3 -0.7 -1.7 -0.1 0.2
Mathematics Cohort 30 26 30 30 29School 15.2 14.4 14.1 16.0 15.9
National 15.8 15.7 15.7 15.9 15.9
Difference -0.6 -1.3 -1.6 0.1 0.0
Significantly above the national average *2013 national figures are those from 2012Significantly below the national average
Key: Reading - RE; Writing - WR; Maths - MA
Cohort
base APS
KS1 APS - All Subjects, Reading, Writing & Maths
The table below shows the Average Point Scores by subjects for the last five years. Average Points
Scores are calculated on whole levels, as calculated in RAISEonline.
Below, but not significantly
different to, averageALL, RE, WR ALL, RE
2011 2012 2013
Above, but not significantly
different to, averageMA WR, MA
APS at the end of Y2 was in line with the national picture in 2013 which continues the marked improvement
seen in 2012 over the previous years outcomes. Each individual subject has APS close to the 2012 averages.
Significantly above average
(SIG+)
APS Judgement: 3
Significantly below average
(SIG-)ALL, RE, WR, MA
12
24/10/2013 Extract KS1 Analysis 2013 v4 Final Report
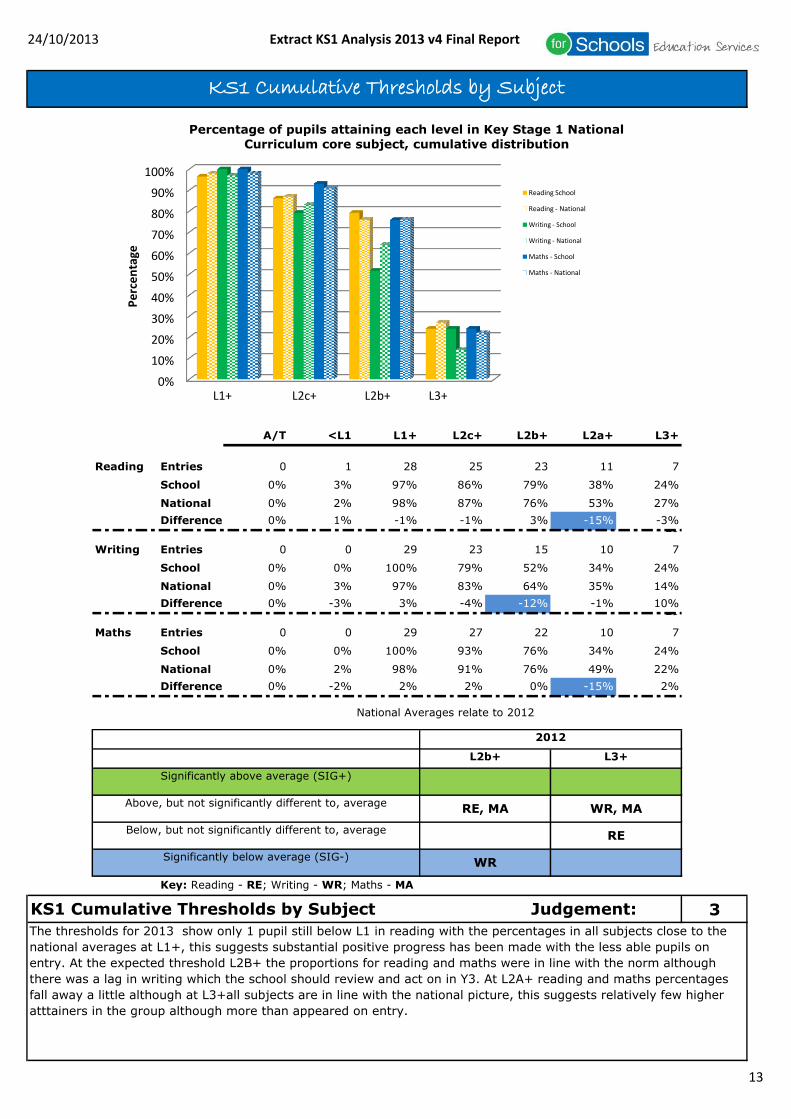
A/T <L1 L1+ L2c+ L2b+ L2a+ L3+Cohort 29 29 29 29 29 29 29
Reading Entries 0 1 28 25 23 11 7
School 0% 3% 97% 86% 79% 38% 24%
National 0% 2% 98% 87% 76% 53% 27%
Difference 0% 1% -1% -1% 3% -15% -3%Cohort 29 29 29 29 29 29 29
Writing Entries 0 0 29 23 15 10 7
School 0% 0% 100% 79% 52% 34% 24%
National 0% 3% 97% 83% 64% 35% 14%
Difference 0% -3% 3% -4% -12% -1% 10%Cohort 29 29 29 29 29 29 29
Maths Entries 0 0 29 27 22 10 7
School 0% 0% 100% 93% 76% 34% 24%
National 0% 2% 98% 91% 76% 49% 22%
Difference 0% -2% 2% 2% 0% -15% 2%
National Averages relate to 2012
Key: Reading - RE; Writing - WR; Maths - MA
3
KS1 Cumulative Thresholds by Subject
2012
L3+L2b+
KS1 Cumulative Thresholds by Subject Judgement:
The thresholds for 2013 show only 1 pupil still below L1 in reading with the percentages in all subjects close to the
national averages at L1+, this suggests substantial positive progress has been made with the less able pupils on
entry. At the expected threshold L2B+ the proportions for reading and maths were in line with the norm although
there was a lag in writing which the school should review and act on in Y3. At L2A+ reading and maths percentages
fall away a little although at L3+all subjects are in line with the national picture, this suggests relatively few higher
atttainers in the group although more than appeared on entry.
Significantly above average (SIG+)
Above, but not significantly different to, average
Below, but not significantly different to, average
Significantly below average (SIG-)
WR, MA
RE
WR
RE, MA
0%
10%
20%
30%
40%
50%
60%
70%
80%
90%
100%
Pe
rce
nta
ge
L1+ L2c+ L2b+ L3+ L6
Percentage of pupils attaining each level in Key Stage 1 National
Curriculum core subject, cumulative distribution
Reading School
Reading - National
Writing - School
Writing - National
Maths - School
Maths - National
13

24/10/2013 Extract KS1 Analysis 2013 v4 Final Report
National National National National
Cohort APS APS Cohort APS APS Cohort APS APS Cohort APS APS
All Pupils 29 15.4 15.5 29 15.6 16.0 29 14.9 14.7 29 15.9 15.9
Gender
Male 13 15.6 15.1 13 15.3 15.5 13 14.8 14.0 13 16.5 15.9
Female 16 15.3 16.0 16 15.8 16.6 16 14.9 15.4 16 15.4 15.9
Free School Meals
FSM 5 15.7 14.1 5 16.2 14.4 5 15.8 13.2 5 15.0 14.6
Non FSM 24 15.4 16.1 24 15.4 16.6 24 14.7 15.2 24 16.1 16.4
English as a First
Language
English or believed to
be English23 15.6 15.7 23 15.7 16.2 23 15.1 14.8 23 16.0 16.0
Other than English or
believed to be other6 14.8 15.0 6 15.0 15.3 6 14.0 14.2 6 15.3 15.4
Unclassified 0 0.0 12.1 0 0.0 12.2 0 0.0 11.2 0 0.0 13.1
Special Educational
Needs
No Identified SEN 21 16.9 16.5 21 16.7 17.1 21 16.7 15.7 21 17.2 16.8
SEN without a
statement 8 11.7 12.0 8 12.5 12.2 8 10.0 11.0 8 12.5 12.9
School Action 4 13.2 12.4 4 14.5 12.5 4 11.0 11.4 4 14.0 13.2
School Action plus 4 10.2 11.4 4 10.5 11.6 4 9.0 10.3 4 11.0 12.3
SEN with a statement 0 0.0 7.2 0 0.0 7.5 0 0.0 6.5 0 0.0 7.7
National Averages relate to 2012
Below national figure
SA+
KS1 APS by Characteristic
All NC Core Subjects Reading Writing Mathematics
More than 1.1 points below the national figure
More than 1.1 points above the national figure
School School School School
More than 1.1 points away from the national
figuresAbove national figure
FSMSizeable/key groups (All subjects)
Sizeable/key groups (Reading)
Groups APS suggests boys and girls performed similarly overall, girls better in reading and boys in maths. The small
FSM group have APS significantly above their national peers in reading and writing, and in both these areas they
outperformed their classmates. Although a slight gap remains in maths the FSM attainment gap has closed for this
cohort suggesting potentially good use of the pupil premium funding. The EAL pupils have generally performed in line
with their national peer group and just below their classmates in all areas. The SEN results seem to be mixed with the
SA group performing significantly above average in reading whilst the SA+ group have struggled in all areas. The key
here will be to review individual SEN outcomes to see if the pupils are progressing in line with their cognitive ability
and to plan their Y3 intervention plans.
APS by Characteristic Judgement: 3
Sizeable/key groups (Writing)
Sizeable/key groups (Maths)
FSM, SA
FSMSA+
SA+
14

Progress

24/10/2013 Extract KS1 Analysis 2013 v4 Final Report
Year
All Subjects Cohort 27 27
School 15.4 6.1 9.3
National Expected 15.0 7.0 8.0
Difference 0.4 -0.9 1.3
Reading Cohort 27 27
School 15.1 5.8 9.3 From Aut Y1
National Expected 15.0 7.0 8.0 From EY- Reading
Difference 0.1 -1.2 1.3
Writing Cohort 27 27
School 14.4 5.7 8.7 From Aut Y1
National Expected 15.0 7.0 8.0 From EY - Writing
Difference -0.6 -1.3 0.7
Mathematics Cohort 27 27
School 15.5 6.7 8.8 From Aut Y1
National Expected 15.0 7.0 8.0 From EY - PSRN
Difference 0.5 -0.3 0.8
* These are the combined results for child in the cohort with both Y1 Autumn Term and end of KS1 Assessments.
2
74%
The progress made in KS1 by the 2013 cohort appears strong with all subjects showing above average points progress from the Y1 baselines
for the 27 pupils who were with the school from the beginning of Y1. On average the group seem to have made a terms more progress in
KS1 than is expected. The proportions making expected progress are stronger in reading and maths than in writing reflecting the fact that
the groups writing levels on exit from Reception and on entry into KS1 seemed unusually strong compared to their reading and maths levels.
78%
81%
70%
63%
Progress by Subject Judgement
93%
Progress by Subject
The table below shows the average points progress by subjects. Points progress is calculated by subtracting the average
Autumn term Y1 score from the average End of KS1 scores. Average Points Scores are calculated on sub-level basis.
Points
Progress based
on sublevels
Proportions
making
expected
progress from
Y1 Aut/ EYFSP
End of KS1
Assessments
Autumn Y1
Assessments
16

Table Description: Key:
- Possibly inadequate progress
Expected Expected
<1 1 2c 2b 2a 3+ <1 1 2c 2b 2a 3+
Low 0-5 0 3 1 7 2 0 77% 69% Low 0-5 0 6 4 1 0 0 45% 9%
Expected 6-7 1 0 1 4 1 4 82% 45% Expected 6-7 0 0 3 3 2 2 70% 40%
High 8+ 0 0 0 0 0 3 100% 100% High 8+ 0 0 0 1 1 4 83% 67%
22 27 81% 63% 17 27 63% 33%
PSE/CLL to Writing
Expected Expected
<1 1 2c 2b 2a 3+ <1 1 2c 2b 2a 3+
Low 0-5 0 3 1 9 2 0 80% 73% Low 0-5 0 6 6 2 1 0 60% 20%
Expected 6-7 1 0 1 2 1 7 83% 67% Expected 6-7 0 0 1 3 2 6 92% 67%
High 8+ 0 0 0 0 0 0 0% 0% High 8+ 0 0 0 0 0 0 0% 0%
22 27 81% 70% 20 27 74% 41%
Expected
<1 1 2c 2b 2a 3+
Low 0-5 0 2 5 5 2 0 86% 50%
Expected 6-7 0 0 0 5 1 7 100% 62%
High 8+ 0 0 0 0 0 0 0% 0%
25 27 93% 56%
Low High% making
Expected Prog
% making more
than Expected
Prog
PSRN to Maths
% making more
than Expected
Prog
Progress - EYFSP to end of KS1 transition tables
Writing to WritingReading to Reading
PSE/CLL to Reading
% making more
than Expected
Prog
The tables below show the number of children who have moved from an EYFSP scale point (where a group of scales is
used this means each individual scale within that group was at least at this points level) to a NC level at the end of KS1.
The tables are colour coded to suggest where good or better progress has been made (green) and possibly inadequate
progress (red).
- Good or better progress
% making more
than Expected
Prog
Low High% making
Expected Prog
Low High% making
Expected Prog
Low High% making
Expected Prog
Low High% making
Expected Prog
% making more
than Expected
Prog EYFSP points evaluation is based on
children achieving the stated points in
each individual scales within the scale
groups
Comments (including on group transition tables that are on following pages):
Progress - EYFSP to end of KS1 transition tables
The EYFSP to end KS1 transition tables suggest strong progress as been made by the group since Reception in reading and maths with more than half the cohort making
more than expected progress. The writing proportions are slightly weaker although the EYFSP starting points for writing seem high when compared to the other scales. All
4 FSM pupils made expected progress in maths and they also did well in reading but progress in this group in writing was more of a concern. The same can be said for the
SEN pupils although only 1 out of 7 pupils made expected progress in writing their progress in reading and writing was better. The EAL pupils seem to have shown good
progress in all subjects from the end of Reception.

Table Description: Key:
- Possibly inadequate progress
Expected Expected
FSM<1 1 2c 2b 2a 3+
FSM<1 1 2c 2b 2a 3+
Low 0-5 0 0 0 0 0 0 0% 0% Low 0-5 0 1 0 0 0 0 0% 0%
Expected 6-7 0 0 1 2 0 0 67% 0% Expected 6-7 0 0 1 0 0 0 0% 0%
High 8+ 0 0 0 0 0 1 100% 100% High 8+ 0 0 0 1 0 1 50% 50%
3 4 75% 25% 1 4 25% 25%
PSE/CLL to Writing
Expected Expected
FSM<1 1 2c 2b 2a 3+
FSM<1 1 2c 2b 2a 3+
Low 0-5 0 0 0 1 0 0 100% 100% Low 0-5 0 1 0 0 0 0 0% 0%
Expected 6-7 0 0 1 1 0 1 67% 33% Expected 6-7 0 0 1 1 0 1 67% 33%
High 8+ 0 0 0 0 0 0 0% 0% High 8+ 0 0 0 0 0 0 0% 0%
3 4 75% 50% 2 4 50% 25%
Expected
FSM<1 1 2c 2b 2a 3+
Low 0-5 0 0 1 0 0 0 100% 0%
Expected 6-7 0 0 0 2 1 0 100% 33%
High 8+ 0 0 0 0 0 0 0% 0%
4 4 100% 25%
EYFSP points evaluation is based on
children achieving the stated points in
each individual scales within the scale
groups
PSE/CLL to Reading
High
High% making
Expected Prog
PSRN to Maths
Low High% making
Expected Prog
% making more
than Expected
Prog
% making more
than Expected
Prog
Low High% making
Expected Prog
% making more
than Expected
Prog
Low
Low High% making
Expected Prog
% making more
than Expected
Prog
Low% making
Expected Prog
% making more
than Expected
Prog
Progress - EYFSP to end of KS1 transition tables (FSM)
The tables below show the number of children who have moved from an EYFSP scale point (where a group of scales is
used this means each individual scale within that group was at least at this points level) to a NC level at the end of KS1.
The tables are colour coded to suggest where good or better progress has been made (green) and possibly inadequate
progress (red).
- Good or better progress
Reading to Reading Writing to Writing

Table Description: Key:
- Possibly inadequate progress
Expected Expected
EAL<1 1 2c 2b 2a 3+
EAL<1 1 2c 2b 2a 3+
Low 0-5 0 1 1 2 1 0 80% 60% Low 0-5 0 2 1 1 0 0 50% 25%
Expected 6-7 0 0 0 0 0 1 100% 100% Expected 6-7 0 0 0 0 1 1 100% 100%
High 8+ 0 0 0 0 0 0 0% 0% High 8+ 0 0 0 0 0 0 0% 0%
5 6 83% 67% 4 6 67% 50%
PSE/CLL to Writing
Expected Expected
EAL<1 1 2c 2b 2a 3+
EAL<1 1 2c 2b 2a 3+
Low 0-5 0 1 1 2 1 0 80% 60% Low 0-5 0 2 1 1 1 0 60% 40%
Expected 6-7 0 0 0 0 0 1 100% 100% Expected 6-7 0 0 0 0 0 1 100% 100%
High 8+ 0 0 0 0 0 0 0% 0% High 8+ 0 0 0 0 0 0 0% 0%
5 6 83% 67% 4 6 67% 50%
Expected
EAL<1 1 2c 2b 2a 3+
Low 0-5 0 1 1 1 2 0 80% 60%
Expected 6-7 0 0 0 0 0 1 100% 100%
High 8+ 0 0 0 0 0 0 0% 0%
5 6 83% 67%
PSRN to Maths
Low High% making
Expected Prog
% making more
than Expected
Prog EYFSP points evaluation is based on
children achieving the stated points in
each individual scales within the scale
groups
Low High% making
Expected Prog
% making more
than Expected
Prog
Low
PSE/CLL to Reading
High% making
Expected Prog
% making more
than Expected
Prog
Low High% making
Expected Prog
Progress - EYFSP to end of KS1 transition tables (EAL)
The tables below show the number of children who have moved from an EYFSP scale point (where a group of scales is
used this means each individual scale within that group was at least at this points level) to a NC level at the end of KS1.
The tables are colour coded to suggest where good or better progress has been made (green) and possibly inadequate
progress (red).
- Good or better progress
Reading to Reading Writing to Writing
% making more
than Expected
Prog
Low High% making
Expected Prog
% making more
than Expected
Prog

Table Description: Key:
- Possibly inadequate progress
Expected Expected
SEN<1 1 2c 2b 2a 3+
SEN<1 1 2c 2b 2a 3+
Low 0-5 0 3 1 1 0 0 40% 20% Low 0-5 0 6 1 0 0 0 14% 0%
Expected 6-7 0 0 0 2 0 0 100% 0% Expected 6-7 0 0 0 0 0 0 0% 0%
High 8+ 0 0 0 0 0 0 0% 0% High 8+ 0 0 0 0 0 0 0% 0%
4 7 57% 14% 1 7 14% 0%
PSE/CLL to Writing
Expected Expected
SEN<1 1 2c 2b 2a 3+
SEN<1 1 2c 2b 2a 3+
Low 0-5 0 3 1 3 0 0 57% 43% Low 0-5 0 6 1 0 0 0 14% 0%
Expected 6-7 0 0 0 0 0 0 0% 0% Expected 6-7 0 0 0 0 0 0 0% 0%
High 8+ 0 0 0 0 0 0 0% 0% High 8+ 0 0 0 0 0 0 0% 0%
4 7 57% 43% 1 7 14% 0%
Expected
SEN<1 1 2c 2b 2a 3+
Low 0-5 0 2 4 1 0 0 71% 14%
Expected 6-7 0 0 0 0 0 0 0% 0%
High 8+ 0 0 0 0 0 0 0% 0%
5 7 71% 14%
EYFSP points evaluation is based on
children achieving the stated points in
each individual scales within the scale
groups
PSE/CLL to Reading
High
High% making
Expected Prog
PSRN to Maths
Low High% making
Expected Prog
% making more
than Expected
Prog
% making more
than Expected
Prog
Low High% making
Expected Prog
% making more
than Expected
Prog
Low
Low High% making
Expected Prog
% making more
than Expected
Prog
Low% making
Expected Prog
% making more
than Expected
Prog
Progress - EYFSP to end of KS1 transition tables (SEN)
The tables below show the number of children who have moved from an EYFSP scale point (where a group of scales is
used this means each individual scale within that group was at least at this points level) to a NC level at the end of KS1.
The tables are colour coded to suggest where good or better progress has been made (green) and possibly inadequate
progress (red).
- Good or better progress
Reading to Reading Writing to Writing

Table Description: Key:
- Possibly inadequate progress
Expected Expected
<1 1 2c 2b 2a 3+ <1 1 2c 2b 2a 3+
Low <1 0 3 1 8 2 0 79% 71% Low <1 0 6 6 2 1 0 60% 20%
Expected 1c 0 0 1 2 0 1 75% 25% Expected 1c 0 0 0 2 2 1 100% 60%
1b 1 0 0 1 1 3 67% 50% 1b 0 0 0 0 0 2 100% 100%
1a 0 0 0 0 0 3 100% 0% 1a 0 0 1 1 0 2 50% 0%
2+ 0 0 0 0 0 0 0% 0% 2+ 0 0 0 0 0 1 100% 0%
21 27 78% 52% 19 27 70% 30%
Maths
Expected
<1 1 2c 2b 2a 3+
Low <1 0 2 3 3 0 0 75% 38%
Expected 1c 0 0 2 4 0 1 71% 14%
1b 0 0 0 3 3 6 75% 50%
1a 0 0 0 0 0 0 0% 0%
2+ 0 0 0 0 0 0 0% 0%
20 27 74% 37%
Comments (including group transition tables on the following pages):
High
Progress measured from Y1 baselines shown in the transition tables supports the progress from EY and highlights that it is mainly the lower ability (mainly SEN) pupils who
have struggled to make expected progress. Very few SEN pupils made more than expected progress in any subject. The 4 FSM pupils had average progress in reading and
maths and weaker progress in writing. The EAL again demonstrated good progress in all subjects.
% making
Expected Prog
High High
% making more
than Expected
Prog
Low High
High% making
Expected Prog
% making more
than Expected
Prog
Low High% making
Expected Prog
% making more
than Expected
Prog
Low
Progress - Autumn Y1 Assessments to KS1 transition tables
The tables below show the number of children who have moved NC levels between the Y1 Autumn Assessment and the
end of KS1. The tables are colour coded to suggest where good or better progress has been made (Green) and possibly
inadequate progress (red).
- Good or better progress
Reading Writing
24/10/2013 Extract KS1 Analysis 2013 v4 Final Report
Cohort No. % Cohort No. %
All pupils 27 23 85.2% 27 21 77.8%
Gender
Male 13 12 92.3% 13 11 84.6%
Female 14 11 78.6% 14 10 71.4%
Free School Meals
FSM 4 2 50.0% 4 2 50.0%
Non FSM 23 21 91.3% 23 19 82.6%
Special Educational Needs
No identified SEN 20 17 85.0% 20 17 85.0%
SEN without a statement7 6 85.7% 7 4 57.1%
School Action 3 3 100.0% 3 2 66.7%
School Action Plus 4 3 75.0% 4 2 50.0%
Statemented 0 0 0.0% 0 0 0.0%
English as a First Language
English or believed to be English21 18 85.7% 21 16 76.2%
Other than English or believed to be
other
6 5 83.3% 6 5 83.3%
Unclassified 0 0 0.0% 0 0 0.0%
2
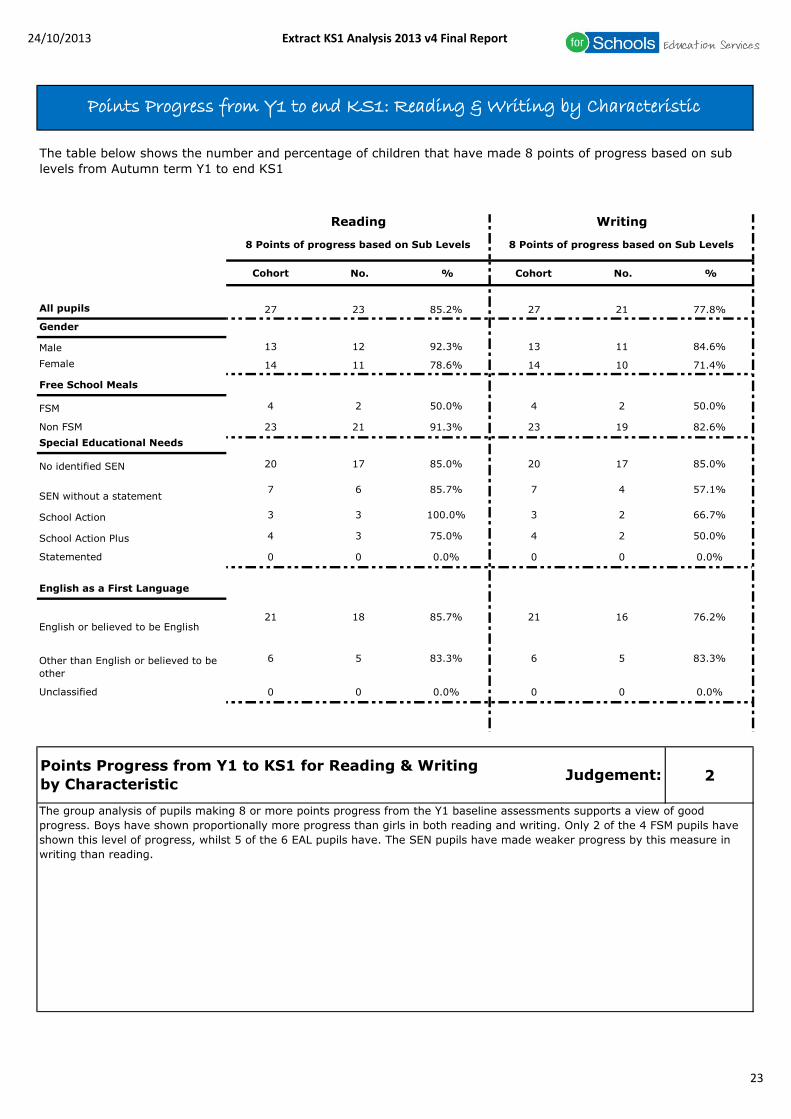
8 Points of progress based on Sub Levels
Points Progress from Y1 to KS1 for Reading & Writing
by CharacteristicJudgement:
The group analysis of pupils making 8 or more points progress from the Y1 baseline assessments supports a view of good
progress. Boys have shown proportionally more progress than girls in both reading and writing. Only 2 of the 4 FSM pupils have
shown this level of progress, whilst 5 of the 6 EAL pupils have. The SEN pupils have made weaker progress by this measure in
writing than reading.
Points Progress from Y1 to end KS1: Reading & Writing by Characteristic
The table below shows the number and percentage of children that have made 8 points of progress based on sub
levels from Autumn term Y1 to end KS1
Reading Writing
8 Points of progress based on Sub Levels
23

24/10/2013 Extract KS1 Analysis 2013 v4 Final Report
Raw Scores - Reading
Achieves or exceeds expected progress e.g. 8+ points from Y1
Achieves less than expected progress e.g. Less than 8 points progress
Pupil Gen
der
SE
N
FS
M
EA
L
Read
ing
EY
FS
P
Read
ing
Au
tum
n Y
1 L
evel
Read
ing
En
d K
S1
Level
Pro
gress f
ro
m E
YFS
P t
o E
nd
KS
1
Pro
gress f
ro
m Y
1 t
o E
nd
KS
1
Pupil 1 Girl School Action Plus Yes No 6 W 2b 12
Pupil 2 Girl NA No No 7 1b 2a 8
Pupil 3 Girl School Action No No 0 2b 0
Pupil 4 Girl School Action Plus No No 5 W 1a 8
Pupil 5 Girl NA No No 4 W 2b 12
Pupil 6 Girl NA Yes No 7 1c 2c 6
Pupil 7 Boy NA No No 7 1b W -6
Pupil 8 Boy School Action Plus No No 4 W 1a 8
Pupil 9 Boy School Action No No 6 1c 2b 8
Pupil 10 Girl NA Yes No 0 2a 0
Pupil 11 Girl NA No No 5 W 2b 12
Pupil 12 Girl NA No No 7 1b 3c 10
Pupil 13 Girl School Action Plus No Yes 4 W 1c 4
Pupil 14 Boy NA No Yes 5 W 2a 14
Pupil 15 Boy NA No Yes 5 W 2b 12
Pupil 16 Boy NA No No 7 1b 3c 10
Pupil 17 Girl School Action No Yes 4 W 2c 10
Pupil 18 Boy NA No No 6 W 2b 12
Pupil 19 Boy NA No No 6 1c 3c 12
Pupil 20 Boy NA No No 8 1b 3c 10
Pupil 21 Girl NA No Yes 7 1a 3c 8
Pupil 22 Boy School Action No No 5 1c 2b 8
Pupil 23 Boy NA No Yes 5 W 2b 12
Pupil 24 Boy NA No No 5 W 2b 12
Pupil 25 Girl NA Yes No 7 1b 2b 6
Pupil 26 Boy NA No No 5 W 2a 14
Pupil 27 Girl NA No No 9 1a 3b 10
Pupil 28 Girl NA Yes No 8 1a 3c 8
Pupil 29 Girl NA No No 5 W 2b 12
24
Related Documents