KPN Q1 2020 RESULTS 30 April 2020

Welcome message from author
This document is posted to help you gain knowledge. Please leave a comment to let me know what you think about it! Share it to your friends and learn new things together.
Transcript
KPN Q1 2020RESULTS30 April 2020
2
Safe harbor
Alternative performance measures and management estimatesThis financial report contains a number of alternative performance measures (non-GAAP figures) to provide readers with additional financial information that is regularly reviewed by management, such as EBITDA and Free Cash Flow (‘FCF’). These non-GAAP figures should not be viewed as a substitute for KPN’s GAAP figures and are not uniformly defined by all companies including KPN’s peers. Numerical reconciliations are included in KPN’s quarterly factsheets and in the Integrated Annual Report 2019. KPN’s management considers these non-GAAP figures, combined with GAAP performance measures and in conjunction with each other, most appropriate to measure the performance of the Group and its segments. The non-GAAP figures are used by management for planning, reporting (internal and external) and incentive purposes. KPN’s main alternative performance measures are listed below. The figures shown in this financial report are based on continuing operations and were rounded in accordance with standard business principles. As a result, totals indicated may not be equal to the precise sum of the individual figures.
Financial information is based on KPN’s interpretation of IFRS as adopted by the European Union as disclosed in the Integrated Annual Report 2019 and do not take into account the impact of future IFRS standards or interpretations. Note that certain definitions used by KPN in this report deviate from the literal definition thereof and should not be considered in isolation or as a substitute for analyses of the results as reported under IFRS as adopted by the European Union. KPN defines revenues as the total of revenues and other income. Adjusted revenues are derived from revenues (including other income) and are adjusted for the impact of incidentals. KPN defines EBITDA as operating result before depreciation (including impairments) of PP&E and amortization (including impairments) of intangible assets. Adjusted EBITDA after leases (‘adjusted EBITDA AL’) is derived from EBITDA and is adjusted for the impact of restructuring costs and incidentals (‘adjusted’) and for lease costs, including depreciation of right-of-use assets and interest on lease liabilities (‘after leases’ or ‘AL’). KPN defines Gross Debt as the nominal value of interest-bearing financial liabilities representing the net repayment obligations in Euro, excluding derivatives, related collateral, and leases, taking into account50% of the nominal value of the hybrid capital instruments. In its Leverage Ratio, KPN defines Net Debt as Gross Debt less net cash and short-term investments, divided by 12 month rolling adjusted EBITDA AL excluding major changes in the composition of the Group (acquisitions and disposals). The Lease adjusted leverage ratio is calculated as Net Debt including lease liabilities divided by 12 month rolling adjusted EBITDA excluding major changes in the composition of the Group (acquisitions and disposals). Operational free cash flow is defined as adjusted EBITDA AL minus capital expenditures (Capex) being expenditures on PP&E and software. Free Cash Flow (‘FCF’) is defined as cash flow from continuing operating activities plus proceeds from real estate, minus Capex.
All market share information in this financial report is based on management estimates based on externally available information, unless indicated otherwise. For a full overview on KPN’s non-financial information, reference is made to KPN’s quarterly factsheets available on ir.kpn.com.
Forward-looking statementsCertain statements contained in this financial report constitute forward-looking statements. These statements may include, without limitation, statements concerning future results of operations, the impact of regulatory initiatives on KPN’s operations, KPN’s and its joint ventures' share of new and existing markets, general industry and macro-economic trends and KPN’s performance relative thereto and statements preceded by, followed by or including the words “believes”, “expects”, “anticipates”, “will”, “may”, “could”, “should”, “intends”, “estimate”, “plan”, “goal”, “target”, “aim” or similar expressions. These forward-looking statements rely on a number of assumptions concerning future events and are subject to uncertainties and other factors, many of which are outside KPN’s control that could cause actual results to differ materially from such statements. A number of these factors are described (not exhaustively) in the Integrated Annual Report 2019. All forward-looking statements and ambitions stated in this financial report that refer to a growth or decline, refer to such growth or decline relative to the situation per 31 December 2019, unless stated otherwise.
Additional information regarding impact of divestments on Q1 2019 financial figuresKPN’s Q1 2020 Press Release and Q1 2020 Analyst Presentation include additional information regarding impact of divestments on the Q1 2019 comparative financial figures, as KPN’s Board of Management deems it important to provide readers with additional information on the financial impact of the following divestments: NLDC, International Network Services and Argeweb. The impact of divestments as mentioned represents the estimated financial impact (transfer of revenues, addition of COGS and transfer of indirect costs) of the combined completed divestments as if the actual transfer of shares (closing) had taken place 12 months earlier. This information has been included for comparison reasons only and is not considered to be an alternative performance measure. Please note that the financial impact of divestments is based on management estimates, which have not and will not be audited.

3
1. HIGHLIGHTS
2. BUSINESS PERFORMANCE UPDATE
3. FINANCIAL RESULTS

4
Key highlights
Q1 marks a solid start of the year– Solid performance, strong cost savings compensating (slowing) revenue decline– Well on track to deliver ~€ 350m indirect opex savings by end 2021 (€ 180m realized)
Solid operational performance– Continued accelerated fiber roll-out: +58k households, half of 2019 production in one quarter– Executing brand strategy in Consumer, strong competition continued, impacting our customer base– On track with strategic actions in Business, sale of KPN Consulting closed per 1 April– Growing broadband portfolio in Wholesale; fixed regulation annulled
Impact of COVID-19 limited in Q1 2020: premature to say what impact will be for the remainder of 2020 – KPN’s balance sheet and liquidity position remains strong, liquidity sufficient to cover debt maturities
for the next three years
5
Adj. revenues
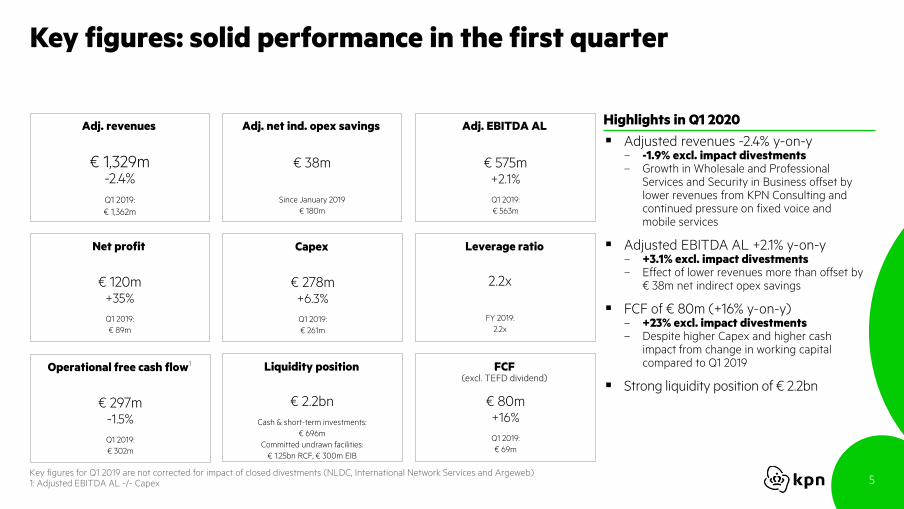
Key figures: solid performance in the first quarter
FCF (excl. TEFD dividend)
Net profit
Adj. net ind. opex savings Adj. EBITDA AL
Capex
Liquidity positionOperational free cash flow1
Leverage ratio
Highlights in Q1 2020
Adjusted revenues -2.4% y-on-y– -1.9% excl. impact divestments– Growth in Wholesale and Professional
Services and Security in Business offset by lower revenues from KPN Consulting and continued pressure on fixed voice and mobile services
Adjusted EBITDA AL +2.1% y-on-y– +3.1% excl. impact divestments– Effect of lower revenues more than offset by
€ 38m net indirect opex savings
FCF of € 80m (+16% y-on-y)– +23% excl. impact divestments– Despite higher Capex and higher cash
impact from change in working capital compared to Q1 2019
Strong liquidity position of € 2.2bn
€ 1,329m-2.4%
Q1 2019:
€ 1,362m
€ 120m+35%
Q1 2019:
€ 89m
€ 278m+6.3%
Q1 2019:
€ 261m
€ 2.2bn
Cash & short-term investments:
€ 696m
Committed undrawn facilities:
€ 1.25bn RCF, € 300m EIB
€ 38m
Since January 2019
€ 180m
€ 575m+2.1%
Q1 2019:
€ 563m
€ 297m-1.5%
Q1 2019:
€ 302m
€ 80m+16%
Q1 2019:
€ 69m
2.2x
FY 2019:
2.2x
Key figures for Q1 2019 are not corrected for impact of closed divestments (NLDC, International Network Services and Argeweb)1: Adjusted EBITDA AL -/- Capex

6
Solid Q1 2020 results; strong balance sheet and liquidity; relatively resilient business; on track
with the execution of our strategy
However, risks to our 2020 outlook increased due to the COVID-19 situation
Combination of our good start to the year and our lack of visibility into the remainder of 2020 means it
would be premature to confirm whether our 2020 outlook need to be updated
Expect to have a better visibility on potential operational and financial impact at the end Q2 2020
Therefore, we expect to be able to clarify our position at the end of the second quarter
Meanwhile, we remain committed to our strategy and it is our ambition to reach our 2020 outlook as
provided in January 2020, which as a reminder is as follows:
Adjusted EBITDA AL: Stable to slightly growing compared to 20191
Capex: € 1.1bn
FCF (excl. TEFD dividend): at least mid-single digit percentage growth compared to 20192
Regular DPS: € 13.0 cents
1: FY 2019 Adjusted EBITDA AL of € 2,287m, corrected for divestments. This is € 30m lower compared to € 2,317m as reported for FY 20192: FY 2019 FCF (excl. TEFD dividend) of € 718m, corrected for divestments. This is € 8m lower compared to € 726m as reported for FY 2019
Premature to say what the total impact of COVID-19 measures will be for KPN for the remainder of the year
7
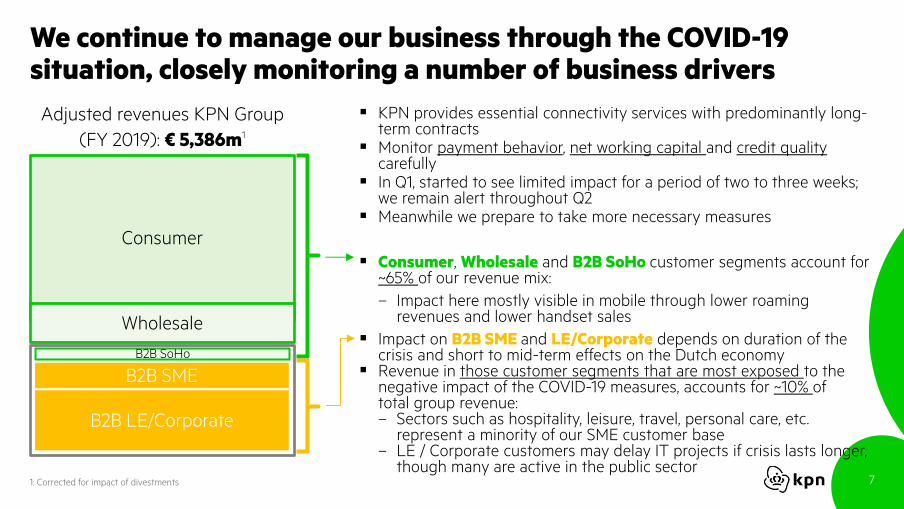
We continue to manage our business through the COVID-19 situation, closely monitoring a number of business drivers
Consumer
Adjusted revenues KPN Group
(FY 2019): € 5,386m1
Wholesale
KPN provides essential connectivity services with predominantly long-term contracts
Monitor payment behavior, net working capital and credit quality carefully
In Q1, started to see limited impact for a period of two to three weeks; we remain alert throughout Q2
Meanwhile we prepare to take more necessary measures
Consumer, Wholesale and B2B SoHo customer segments account for ~65% of our revenue mix:
– Impact here mostly visible in mobile through lower roaming revenues and lower handset sales
Impact on B2B SME and LE/Corporate depends on duration of the crisis and short to mid-term effects on the Dutch economy
Revenue in those customer segments that are most exposed to the negative impact of the COVID-19 measures, accounts for ~10% of total group revenue:– Sectors such as hospitality, leisure, travel, personal care, etc.
represent a minority of our SME customer base – LE / Corporate customers may delay IT projects if crisis lasts longer,
though many are active in the public sector
B2B SoHo
B2B SME
B2B LE/Corporate
1: Corrected for impact of divestments

8
Additional workplaces and network capacity to make health emergency locations digitally operational
As hospital networks come under more pressure, we have ramped-up incident monitoring
Fees waived for cyber security support for hospitals Free connectivity provided to general practitioners
Free WIFI for less fortunate children that need to be home schooled
We are working with our main contractors to protect the 3,000 jobs involved in our fiber roll-out and maintain the expertise around network build-out in the Netherlands
KPN’s accelerated fiber roll-out will further strengthen Dutch digital infrastructure to support sectors such as healthcare and education in the future
COVID-19: KPN measures for employees, customers, Dutch society
and shareholders
Additional free TV content for IPTV customers until 1 June 2020 Free conference numbers until end of April 2020 Free anti-virus scanners using Trend Micro for six months No out-of-bundle costs for Corporate and KPN EEN customers
until end of April 2020 Payment of bill to SME suppliers within 30 days
All office personnel working from home To minimize physical contact we closed all shops on 18 March
– Reopened 16 XL shops on 20 March with safety precautions InHome mechanics and activities of field engineers restrained No physical sales meetings Delay of new reorganization requests until 1 June 2020 Extra leave hours for all employees until 1 June 2020 Wide range of vitality programs
Health sector Digital infrastructure
CustomersEmployees
We paid the final dividend over 2019 of € 348m in April 2020
Shareholders

9
COVID-19: ensuring connectivity in challenging times
~100% increase in mobile voice traffic vs. pre 16 March
~25% increase in broadband traffic vs. pre 16 March
~25% increase in streaming activity vs. pre 16 March
Strong shift from office-use to home-use
Coping well with increased demand
Broadband usage KPN network in March 2020Equipped for peak levels
+25%
Social distancing measures announced

10
1. HIGHLIGHTS
2. BUSINESS PERFORMANCE UPDATE
3. FINANCIAL RESULTS

11
Strategic progress in the first quarter
Net indirect opex savings of € 38m in Q1, € 180m since start in 2019
Further scaled down in FTEs Sale of KPN Consulting closed on 1 April 2020
2. Focus on profitable growth segments
Focus on high-value KPN brand, integrated Telfort mobile Continued good progress at planned customer migrations in
Business Solid growth Wholesale broadband portfolio (WBA/VULA)
Further expand leading NL fiber activities 58k FttH added in Q1, almost half of entire 2019 177k since start in 2019
Full mobile network modernization ~290 mobile network sites upgraded in Q1 ~930 since September 2019
3. Acceleration of simplification and digitalization
1. The best converged smart infrastructure

12
KPN has the largest fiber footprint in the Netherlands: >2.5m homes
Strong fiber coverage in both urban and rural areas (Q1 2020) Accelerating fiber roll-out at fastest pace possible– Ambition to reach +1m households FttH end 2021 vs. end 2018– Investing in fast and reliable internet for Dutch society– Committed to digital infrastructure enhancement
Significantly improving access speeds for our customers– 1Gbps proposition commercially available since March 20201
– Ensuring local access with ODF deals on third party networks Able to self-fund large scale fiber roll-out
Moving towards >40% fiber coverage per end 2021 (x 1,000 HP)KPN aims to significantly improve average access speeds to households2
1: For designated FttH areas2: Technically possible speeds
3: 50Mbps is measured excluding 4G/DSL hybrid solution4: ODF access via third party fiber networks
~70%
>50Mbps3 >100Mbps >150Mbps
~70%~75%
>1Gbps1>200Mbps
~90% ~95%~85%
~75%~60%
~30%~45%
Q1 2020 End 2021 (ambition)
~30% FttH (~2.5m households)
~55% FttC (~4.4m households)
~87% FttS (~4,400 mobile sites)
~51
Total
Q1 2020
KPN owned
Q1 2020
3rd party4 Ambition
end 2021
Remaining
ambition
>3,300
~2,523 ~2,574
13
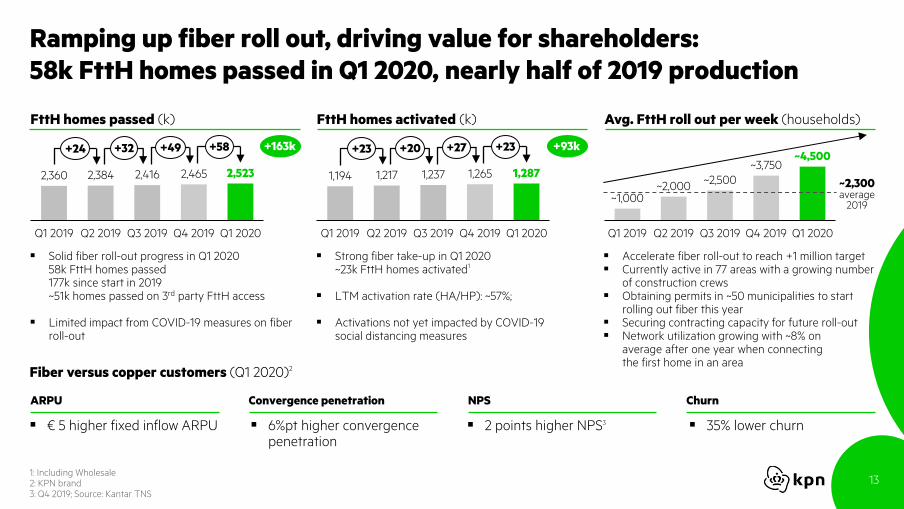
Ramping up fiber roll out, driving value for shareholders:
58k FttH homes passed in Q1 2020, nearly half of 2019 production
Avg. FttH roll out per week (households)FttH homes passed (k) FttH homes activated (k)
1: Including Wholesale2: KPN brand3: Q4 2019; Source: Kantar TNS
Q4 2019Q3 2019Q2 2019Q1 2019 Q1 2020
2,360 2,384 2,416 2,465 2,523
+24 +32 +49 +58 +93k+163k
Q1 2020Q1 2019 Q2 2019 Q3 2019
~2,500~2,000
Q4 2019
~1,000
~3,750~4,500
ARPU Convergence penetration NPS Churn
€ 5 higher fixed inflow ARPU 6%pt higher convergence penetration
2 points higher NPS3 35% lower churn
Fiber versus copper customers (Q1 2020)2
Solid fiber roll-out progress in Q1 202058k FttH homes passed177k since start in 2019~51k homes passed on 3rd party FttH access
Limited impact from COVID-19 measures on fiber roll-out
Accelerate fiber roll-out to reach +1 million target Currently active in 77 areas with a growing number
of construction crews Obtaining permits in ~50 municipalities to start
rolling out fiber this year Securing contracting capacity for future roll-out Network utilization growing with ~8% on
average after one year when connecting the first home in an area
Strong fiber take-up in Q1 2020~23k FttH homes activated1
LTM activation rate (HA/HP): ~57%;
Activations not yet impacted by COVID-19 social distancing measures
Q4 2019Q1 2019 Q2 2019
1,287
Q3 2019 Q1 2020
1,194 1,217 1,237 1,265
+23 +20 +27 +23
~2,300average
2019
14
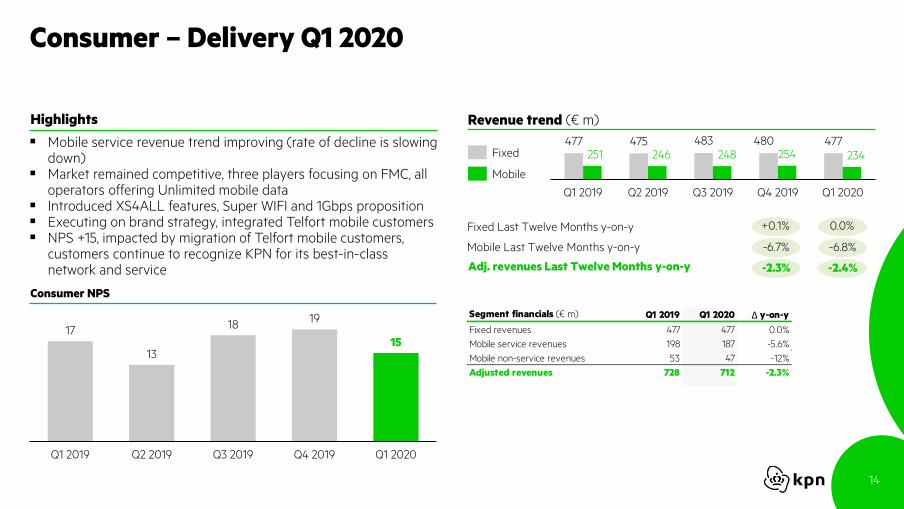
Consumer – Delivery Q1 2020
Mobile service revenue trend improving (rate of decline is slowing down)
Market remained competitive, three players focusing on FMC, all operators offering Unlimited mobile data
Introduced XS4ALL features, Super WIFI and 1Gbps proposition Executing on brand strategy, integrated Telfort mobile customers NPS +15, impacted by migration of Telfort mobile customers,
customers continue to recognize KPN for its best-in-class network and service
Consumer NPS
Highlights
17
13
1819
15
Q1 2019 Q4 2019Q2 2019 Q3 2019 Q1 2020
477 475 483 480 477251 246 248 254 234
Q1 2019 Q3 2019Q2 2019 Q1 2020Q4 2019
Revenue trend (€ m)
Fixed Last Twelve Months y-on-y
Adj. revenues Last Twelve Months y-on-y
Segment financials (€ m) Q1 2019 Q1 2020 Δ y-on-y
Fixed revenues 477 477 0.0%
Mobile service revenues 198 187 -5.6%
Mobile non-service revenues 53 47 -12%
Adjusted revenues 728 712 -2.3%
0.0%
-2.4%
-6.8%Mobile Last Twelve Months y-on-y
Fixed
Mobile
+0.1%
-2.3%
-6.7%

15
Consumer – KPIs Q1 2020
Mobile postpaid base (k)Converged households (k) Broadband base (k)
Converged household base declined 18k, driven by brand strategy and increased competition, penetration at 49% of broadband base
Converged postpaid net adds of -21k, driven by Telfort, 62% penetration of postpaid base
Broadband base declined 25k, driven by brand strategy and increased competition
Fixed ARPU increased 5.4% y-on-y to € 48, driven by price adjustments, higher inflow ARPU and declining base for PSTN and Digitenne services
Full focus on KPN brand resulted in+24k postpaid net adds KPN brand
Total postpaid base -13k, driven by ongoing dynamics in no-frills market
Postpaid ARPU remained stable at € 17 for the fifth consecutive quarter
Converged postpaid customers (k) Fixed ARPU (€) Postpaid ARPU (€)
46% 48% 49% 49% 49%
Q3 2019Q1 2019 Q2 2019
1,384
Q4 2019 Q1 2020
1,358 1,399 1,404 1,402
+41 +5 -2 -18
Q2 2019
2,896
Q1 2019 Q3 2019 Q4 2019 Q1 2020
2,927 2,871 2,848 2,823
-31 -24 -24 -25
Q3 2019Q2 2019Q1 2019 Q1 2020Q4 2019
3,606 3,5883,605 3,602 3,575
0 -3 -14 -13
59% 62% 62% 63% 62%
Q2 2019Q1 2019 Q3 2019 Q4 2019 Q1 2020
2,126 2,230 2,246 2,254 2,233
+104+15 +9 -21 17 17 17 17 17
Q3 2019Q1 2019 Q2 2019 Q4 2019 Q1 2020
46 4648 48 48
Q1 2020Q1 2019 Q3 2019Q2 2019 Q4 2019
+27k
+107k
-104k -31k
+5.4%y-on-y
-2.4%y-on-y
+17 +36 +28+105k
KPN brand
+24

16
Business – Delivery Q1 2020
Adjusted revenue trend corrected for impact of divestments gradually improving
Strategic actions considerably impacted revenue trend; Last twelve months revenue trend excl. impact M&A improving
Business NPS +1, sequential improvement mainly due to an increase at self-employed/Soho and Large Enterprise customers
Divestment of KPN Consulting closed on 1 April 2020
Business NPS
Highlights
1: Excluding the impact of NLDC, International Network Service and Argeweb, including KPN Consulting
3
1
-1
-4
1
Q3 2019Q2 2019Q1 2019 Q4 2019 Q1 2020
506 507 502 528 478498 498 494 518 478
Q4 2019Q1 2019 Q2 2019 Q3 2019 Q1 2020
Revenue trend (€ m)
-4.6%
-4.1%
Adj. revenues Last Twelve Months y-on-y
Adj. revenues Last Twelve Months y-on-y (excl. M&A1 )
Segment financials (€ m) Q1 2019 Q1 2020 Δ y-on-y Δ y-on-y
(excl. impact M &A1 )
Communication Services 326 288 -12% -9.5%
IT Services 67 67 0.6% 2.9%
Professional Services 93 105 13%
KPN Consulting 20 17 -16%
Other 0 1 n.m.
Adjusted revenues 506 478 -5.5% -4.0%
-4.4%
-4.5%
Adj. revenues
Adj. revenues(excl. M&A)

17
Business – KPIs Q1 2020
1: Migrated from traditional fixed voice and legacy broadband services
LE/Corporate customer migrations1SME customer migrations1
Q4 2019
50%
Q1 2019
59%
82%
Q2 2019
74%68%
Q3 2019 Q1 2020
25%
Q1 2019
33%
Q2 2019
45%
Q3 2019
53%
Q4 2019
62%
Q1 2020
82% of SME customers eligible for migration have migrated
KPN EEN platform offering opportunities for up and cross-sell
– Introduced: extra safe internet, new SLA (getting customer back
online within 8 hours, 24/7), managed workspace based on MS 365
62% of LE customers eligible for migration have migrated
Continuing to add services to Smart Combinations / Smart Integration
propositions
– Smart Combinations: introduced Secure Networking (SD-WAN,
SD-LAN & Security), Cloud Communications (VoIP, UC & Mobile)
– Smart Integration: introduced Fundamental, a modular service
proposition focused on service integration
18
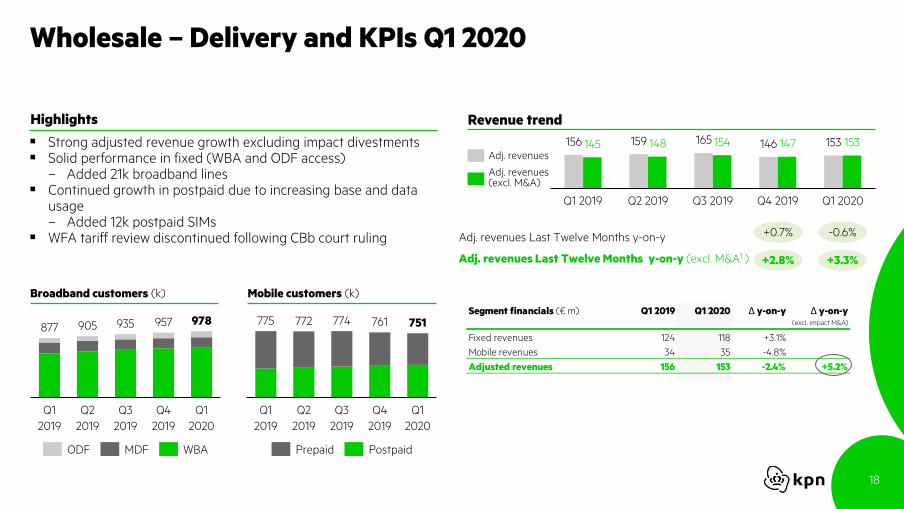
Wholesale – Delivery and KPIs Q1 2020
Strong adjusted revenue growth excluding impact divestments Solid performance in fixed (WBA and ODF access)
– Added 21k broadband lines Continued growth in postpaid due to increasing base and data
usage– Added 12k postpaid SIMs
WFA tariff review discontinued following CBb court ruling
Broadband customers (k)
Highlights
Mobile customers (k)
772
Q4
2019
Q3
2019
Q1
2019
Q2
2019
Q1
2020
774775 761 751
Q1
2020
Q1
2019
905
Q2
2019
Q3
2019
Q4
2019
877 935 957 978
Prepaid PostpaidODF MDF WBA
156 159 165 146 153145 148 154 147 153
Q1 2019 Q1 2020Q2 2019 Q3 2019 Q4 2019
Revenue trend
Segment financials (€ m) Q1 2019 Q1 2020 Δ y-on-y Δ y-on-y (excl. impact M&A)
Fixed revenues 124 118 +3.1%
Mobile revenues 34 35 -4.8%
Adjusted revenues 156 153 -2.4% +5.2%
-0.6%
+3.3%
+0.7%
+2.8%
Adj. revenues Last Twelve Months y-on-y
Adj. revenues Last Twelve Months y-on-y (excl. M&A1 )
Adj. revenues
Adj. revenues(excl. M&A)
19
1. HIGHLIGHTS & PROGRESS AGAINST STRATEGY
2. BUSINESS PERFORMANCE UPDATE
3. FINANCIAL RESULTS

20
Group financials
Adjusted revenues Q1 2020 excl. impact divestments
712
478
153
Consumer
Business
Wholesale
Other -14
KPN Group 1,329
(€ m) Q1 2019 Q1 2020 Δ y-on-y Δ y-on-yexcl. impact M&A
Service revenues 1,265 1,234 -2.5% -1.9%
Non-service & other 96 95 -1.4% -1.4%
Adjusted revenues 1,362 1,329 -2.4% -1.9%
Total adjusted opex 756 715 -5.4% -5.6%
Lease related expenses 43 39 -8.6% -1.3%
Total adjusted indirect opex after leases 489 439 -10% -8.1%
Adjusted EBITDA after leases 563 575 +2.1% +3.1%
As % of adj. revenues 41.4% 43.3%
As % of adj. revenues Last Twelve Months 40.9% 42.7%
Operating profit (EBIT) 189 216 +14%
Net profit 89 120 +35%
Capex 261 278 +6.3%
As % of adj. revenues 19.2% 20.9%
Operational free cash flow 302 297 -1.5% 0.0%
As % of adj. revenues 22.2% 22.4%
As % of adj. revenues Last Twelve Months 20.7% 22.0%
Free cash flow (excl. TEFD div) 69 80 +16% +23%
As % of adj. revenues 5.1% 6.0%
Δ y-on-y
-2.3%
-4.0%
+5.2%
-21%
-1.9%
Adjusted EBITDA AL margin improved 180bps over the last twelve months
Operational free cash flow solid; margin improved 130bps over the last twelve months

21
Strong and disciplined cost control
1: Net indirect opex savings are corrected for the impact of divestments
Net indirect opex savings (€ m) € 180m net indirect opex savings realized since start in 20191
Reduction driven by personnel and IT/TI expenses
~€ 170m net indirect opex savings to be realized of the target
Confident to reach our target of ~€ 350m by the end of 2021
14118038
Remaining
target
Q1 2020FY 2019 Total end
Q1 2020
Ambition
2019-2021
~170 ~350
FTE development (#)
Q3 2019Q4 2018
11,620
Q1 2020Q4 2019Q1 2019 Q2 2019
12,431 12,263 11,955 11,248 11,117
-168 -308 -335 -372 -131

22
Strong underlying cash generation
(€m) Q1 2019 Q1 2020 Δ y-on-y
Adjusted EBITDA after leases 563 575 +2.1%
As % of adj. revenues 41.4% 43.3%
Capex -261 -278 +6.3%
Operational free cash flow 302 297 -1.5%
As % of adj. revenues 22.2% 22.4%
Cash restructuring -29 -21 -25%
Incidentals - - n.m.
Change in provisions excl. restructuring -4 -15 >100%
Interest received/(paid) excl. lease interest -118 -84 -29%
Taxes received/(paid) - - n.m.
Change in working capital -62 -86 +38%
Other movements -21 -11 -48%
Free cash flow (excl. TEFD dividend) 69 80 +16%
As % of adj. revenues 5.1% 6.0%
TEFD dividend received - - n.m.
Acquisitions & disposals 85 9 -89%
Change in short-term investments 50 - n.m.
Other investing cash flow -1 1 n.m.
Dividends paid - - n.m.
Other financing cash flow -462 -431 -6.6%
Change in cash & cash equicalents -220 -343 +56%
Cash & cash equicalents at end of period 392 424 +7.6%
Bank overdrafts - - n.m.
Cash classified as held for sale - -2 n.m.
Short-term investments - 275 n.m.
Cash & short-term investments (balance sheet) 392 696 +78%
Strong operational free cash flow driven by
– Growing adj. EBITDA AL due to disciplined cost control
– Offset by higher Capex due to intra-year phasing
– Operational free cash flow flat y-on-y excl. impact
divestments
Free cash flow of € 11m higher y-on-y despite increase in Capex,
a negative change in working capital and negative change in
provisions
– Growing adj. EBITDA AL due to disciplined cost control
– Lower cash restructuring due to COVID-19 driven delay of
new reorganization requests until 1 June
– Lower cash interest paid due to bond redemptions in 2019
Strong cash position at the end of the first quarter
Highlights
23
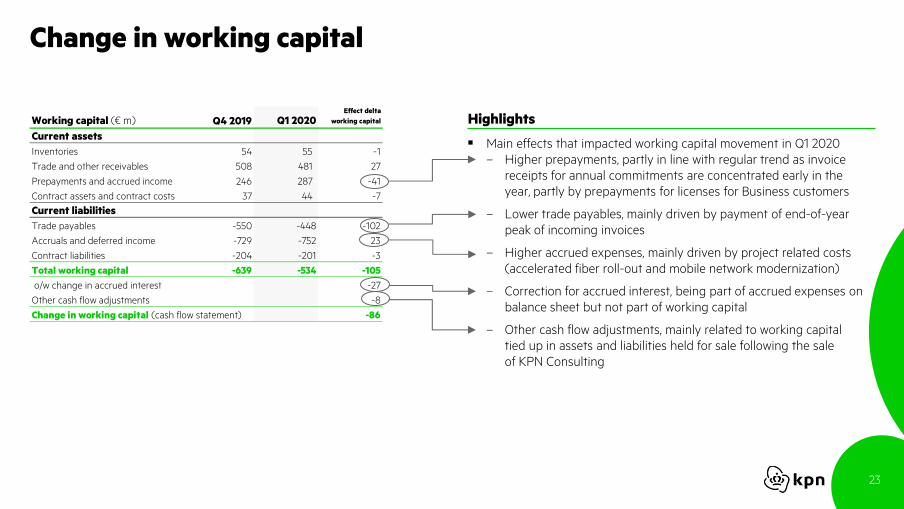
Working capital (€ m) Q4 2019 Q1 2020Effect delta
working capital
Current assets
Inventories 54 55 -1
Trade and other receivables 508 481 27
Prepayments and accrued income 246 287 -41
Contract assets and contract costs 37 44 -7
Current liabilities
Trade payables -550 -448 -102
Accruals and deferred income -729 -752 23
Contract liabilities -204 -201 -3
Total working capital -639 -534 -105
o/w change in accrued interest -27
Other cash flow adjustments -8
Change in working capital (cash flow statement) -86
Change in working capital
Main effects that impacted working capital movement in Q1 2020
– Higher prepayments, partly in line with regular trend as invoice
receipts for annual commitments are concentrated early in the
year, partly by prepayments for licenses for Business customers
– Lower trade payables, mainly driven by payment of end-of-year
peak of incoming invoices
– Higher accrued expenses, mainly driven by project related costs
(accelerated fiber roll-out and mobile network modernization)
– Correction for accrued interest, being part of accrued expenses on
balance sheet but not part of working capital
– Other cash flow adjustments, mainly related to working capital
tied up in assets and liabilities held for sale following the sale
of KPN Consulting
Highlights

24
Liquidity position
1: Deferred payment subject to statutory interest (2.0% per annum)2: EIB facility was fully drawn on 2 April 2020
Total committed liquidity of € 2.2bn – € 696m in cash & short-term investments at hand – € 1.55bn of committed unused credit lines (€ 1.25bn RCF and
€ 300m EIB facility2)
Liquidity is sufficient to cover debt maturities until the end of 2022
GBP hybrid (€ 460m) with 6.875% coupon redeemed on 14 March– Refinanced with € 500m (2.0% coupon) perpetual hybrid bond
issuance in November 2019
Final dividend payment (€ 8.3 cents per share, total € 348m) paid on 22 April
Multiband spectrum auction in June (700, 1400, 2100MHz)– Spectrum cash out cannot be estimated at this point– Auction rules specify that 50% of the auction price must be paid
within 2 weeks after the auction whereas the payment of the remaining 50% may be deferred with a maximum of one year1
Liquidity considerations Liquidity schedule (€ m)
422275
300
Cash &
cash
equivalents
Short-term
investments
RCF Total
liquidity
Liquidity
after
dividend
EIB facility Final
dividend
2019
1,250
-348
2,2471,899
461
613
616 1,690
Debt maturities
2020
Total debt
maturities
2020-2022
Debt maturities
2021
Debt maturities
2022
Debt maturity schedule (€ m)
25
Financial position
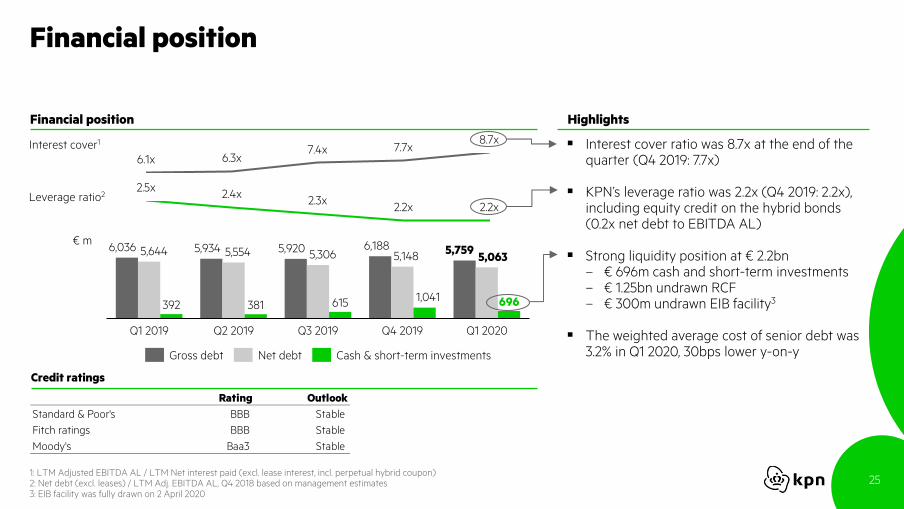
Interest cover ratio was 8.7x at the end of the quarter (Q4 2019: 7.7x)
KPN’s leverage ratio was 2.2x (Q4 2019: 2.2x), including equity credit on the hybrid bonds (0.2x net debt to EBITDA AL)
Strong liquidity position at € 2.2bn– € 696m cash and short-term investments– € 1.25bn undrawn RCF– € 300m undrawn EIB facility3
The weighted average cost of senior debt was 3.2% in Q1 2020, 30bps lower y-on-y
Rating Outlook
Standard & Poor's BBB Stable
Fitch ratings BBB Stable
Moody's Baa3 Stable
Interest cover1
392 381 615 696
Q1 2019
6,036
Q2 2019
5,934 5,554
Q3 2019 Q1 2020Q4 2019
5,3065,644 5,920 6,1885,148
1,041
5,7595,063
2.2x
2.5x2.4x
2.2x2.3xLeverage ratio2
Gross debt Net debt Cash & short-term investments
6.1x 6.3x7.4x
8.7x7.7x
Financial position
Credit ratings
€ m
1: LTM Adjusted EBITDA AL / LTM Net interest paid (excl. lease interest, incl. perpetual hybrid coupon)2: Net debt (excl. leases) / LTM Adj. EBITDA AL, Q4 2018 based on management estimates3: EIB facility was fully drawn on 2 April 2020
Highlights

26
Disclosure agenda going forward: committed to continuously improving
New revenue breakdown to reflect focus on convergence– Fixed-mobile service revenues– Fixed-only broadband service revenues– Mobile-only postpaid service revenues– Legacy / non-service revenues
New KPIs to reflect focus on households rather than individuals– # households replacing # RGUs– Average Revenue Per Address (ARPA) accompanying
Average Revenue Per User (ARPU)
Consumer Business
Reflect KPN’s focus on converged portfolio for different customer segments, by providing further detail on revenue breakdown per customer segment, accompanying current product segmentation
Disclose end-to-end Adjusted EBITDA after leases
ROCE and segment Adjusted EBITDA after leases– Published with H1 and FY results
Other
More insight and additional KPIs in fiber activities Operational free cash flow Detailed insight in drivers of net cash position Working capital details
Delivered this quarter

27
Closing remarks
Q1 marks a solid start of the year– Solid performance, strong cost savings compensating (slowing) revenue decline– Well on track to deliver ~€ 350m indirect opex savings by end 2021 (€ 180m realized)
Solid operational performance– Continued accelerated fiber roll-out: +58k households, half of 2019 production in one quarter– Executing brand strategy in Consumer, strong competition continued, impacting our customer base– On track with strategic actions in Business, sale of KPN Consulting closed per 1 April– Growing broadband portfolio in Wholesale; fixed regulation annulled
Impact of COVID-19 limited in Q1 2020: premature to say what impact will be for the remainder of 2020 – KPN’s balance sheet and liquidity position remains strong, liquidity sufficient to cover debt maturities
for the next three years


29
Appendices
I: Q1 2019 financials corrected for impact of divestments
II: Tax
III: Debt portfolio
IV: Treatment of hybrid bonds
V: Fixed infrastructure
VI: Mobile infrastructure
VII: Spectrum
30
I: Q1 2019 financials corrected for impact of divestments
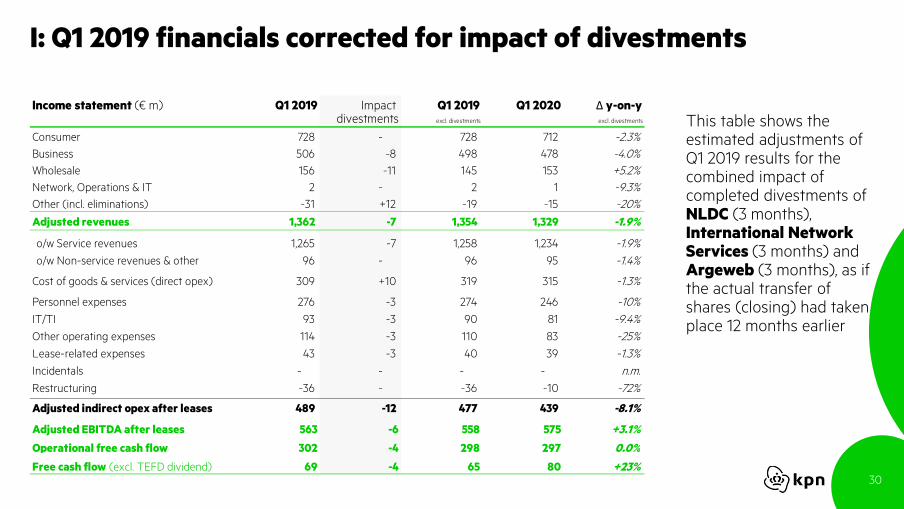
Income statement (€ m) Q1 2019 Impact Q1 2019 Q1 2020 Δ y-on-ydivestments excl. divestments excl. divestments
Consumer 728 - 728 712 -2.3%
Business 506 -8 498 478 -4.0%
Wholesale 156 -11 145 153 +5.2%
Network, Operations & IT 2 - 2 1 -9.3%
Other (incl. eliminations) -31 +12 -19 -15 -20%
Adjusted revenues 1,362 -7 1,354 1,329 -1.9%
o/w Service revenues 1,265 -7 1,258 1,234 -1.9%
o/w Non-service revenues & other 96 - 96 95 -1.4%
Cost of goods & services (direct opex) 309 +10 319 315 -1.3%
Personnel expenses 276 -3 274 246 -10%
IT/TI 93 -3 90 81 -9.4%
Other operating expenses 114 -3 110 83 -25%
Lease-related expenses 43 -3 40 39 -1.3%
Incidentals - - - - n.m.
Restructuring -36 - -36 -10 -72%
Adjusted indirect opex after leases 489 -12 477 439 -8.1%
Adjusted EBITDA after leases 563 -6 558 575 +3.1%
Operational free cash flow 302 -4 298 297 0.0%
Free cash flow (excl. TEFD dividend) 69 -4 65 80 +23%
This table shows the estimated adjustments of Q1 2019 results for the combined impact of completed divestments of NLDC (3 months), International Network Services (3 months) and Argeweb (3 months), as if the actual transfer of shares (closing) had taken place 12 months earlier

31
II: Tax Q1 FY 2020
The effective tax rate for Q1 2020 was mainly influenced by the participation exemption and the Innovation Box facility– Without one-off effects1 the effective tax rate would have been ~22% in Q1 2020
For the 2020, the effective tax rate is expected to be ~22% excluding one-off effects1
1: Among others, tax law changes, settlements with tax authorities, impairments, revaluations
Regions (€ m) Q1 2019 Q1 2020 Q1 2019 Q1 2020
The Netherlands -24 -30 - -
Other - - - -
Total reported tax -24 -30 - -
Of which discontinued operations - - - -
Reported tax from continuing operations -24 -30 - -
Effective tax rate continuing operations 21,4% 21,1%
Cash flowP&L
32
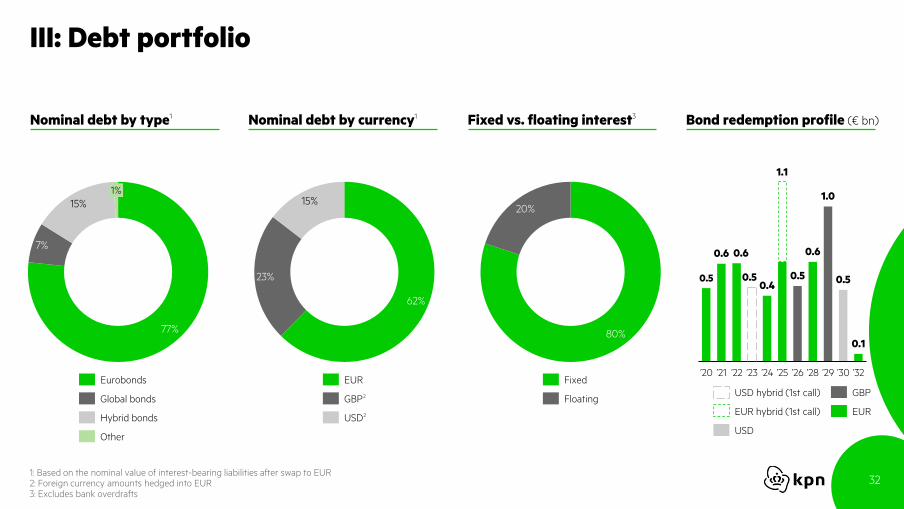
III: Debt portfolio
1: Based on the nominal value of interest-bearing liabilities after swap to EUR2: Foreign currency amounts hedged into EUR3: Excludes bank overdrafts
77%
7%
15%
1%
Eurobonds
Global bonds
Hybrid bonds
Other
62%
23%
15%
GBP2
EUR
USD2
80%
20%
Fixed
Floating
0.5
0.6 0.6
0.50.4
0.5
0.6
1.0
0.5
0.1
’30’20 ’22’21 ’24
1.1
’23 ’25 ’26 ’28 ’29 ’32
GBP
EUR
USD hybrid (1st call)
EUR hybrid (1st call)
USD
Nominal debt by type1 Nominal debt by currency1 Fixed vs. floating interest3 Bond redemption profile (€ bn)

33
IV: Treatment of hybrid bonds
1: Cash flow item ‘Paid coupon perpetual hybrid bonds’2: Rates after swaps. USD tranche has semi-annual coupon payments (March / September);
EUR tranche has short first coupon in Feb 2020 (0.25 years) thereafter annual coupons in February
Tranche Nominal KPN net debt Maturity Rates2
IFRS principal IFRS coupon
USD 0.6bn 7.000% € 465m € 233m 60 years (1st-call Mar-2023) 6.344% Liability Interest paid (incl. in FCF)
EUR 0.5bn 2.000% € 500m € 250m Perpetual (1st-call Feb 2025) 2.000% Equity Financing cash flows
(not incl. in FCF)
Total € 965m € 483m
KPN & credit rating agencies IFRS
EUR tranche is a perpetual instrument, accounted for as equity Coupon payments treated as equity distribution (dividend), hence not expensed through P&L, not included in FCF, but in financing cash flow1
USD tranche have 60 years specified maturity, accounted for as financial liability– Coupon payments treated as regular bond coupon, hence
expensed through P&L, included in FCF
Hybrid bonds are recognized as 50% equity and 50% debt by the rating agencies
Definition of KPN net debt includes: ‘[…], taking into account50% of the nominal value of any hybrid capital instrument’– Hybrid bonds are part of KPN’s bond portfolio– Independent of IFRS classification– In line with treatment by credit rating agencies

34
V: Fixed infrastructure
Bonded vectoring
Bonded VPlus
FttH – G-PON
Vectoring
VDSL2 pair bonding
VDSL2CO
CO
SC
SC
SC
~50Mbps
~100Mbps
~120Mbps
~240Mbps
~400Mbps
~1Gbps
Fiber Copper
Active in
network
Download
speed
CO
FttH – P2PPoP ~1Gbps
Passive
split
FttH – XGS-PONUp to 10GbpsCO
Passive
split

35
VI: Mobile infrastructure
Modernizing sites with the latest technologies, 5G ready Upcoming spectrum auctions in NL
2020: Multi band auction (220 MHz in total)
700MHz: 6 blocks of 2x5MHz (new spectrum) 1400MHz: 8 blocks of 1x5 MHz (new spectrum) 2100MHz: 12 blocks of 2x5MHz (already in use by all operators) Duration of licenses is 20 years Spectrum caps of 40% of sub-1GHz and total spectrum
2022: 3.5GHz band (300MHz is expected to become available)
Typical current site Typical modernized site
4 frequency bands 6-8 frequency bands
2x2 MIMO 4x4 or higher order MIMO
1 Gbps backhaul 10 Gbps backhaul
2 antennas 1 antenna
Not 5G ready 5G ready
~150 site configurations 3 site configurations
~80% FttS ~95% FttS

36
VII: Spectrum in the Netherlands
800MHz
(Paired)
T-Mob VodZig KPN2*30
2*10 2*10 2*10
900MHz
(Paired)
VodZig KPN T-Mob2*35
2*10 2*10 2*15
1.8GHz
(Paired)
KPN VodZig T-Mob2*70
2*20 2*20 2*30
2.1GHz
(Paired)
VodZig KPN T-Mob KPN VodZig T-Mob2*59.4
2*14.6 2*14.8 2*10 2*5 2*5 2*10
2.6GHz
(Unpaired)
T-Mob KPN T-Mob1*60
25 30 5
2.6GHz
(Paired)
VodZig T-Mob KPN T-Mob2*65
2*30 2*5 2*10 2*20
TotalKPN VodZig T-Mob
578.8MHz169.6MHz 179.2MHz 230MHz

KPN Investor Relations
ir.kpn.com
Related Documents